UNITED STATES
SECURITIES AND EXCHANGE COMMISSION
Washington, D.C. 20549
FORM N-CSR
CERTIFIED SHAREHOLDER REPORT OF REGISTERED MANAGEMENT INVESTMENT COMPANIES
Investment Company Act file number 811-21852
Columbia Funds Series Trust II
(Exact name of registrant as specified in charter)
290 Congress Street
Boston, MA 02210
(Address of principal executive offices) (Zip code)
Daniel J. Beckman
c/o Columbia Management Investment Advisers, LLC
290 Congress Street
Boston, MA 02210
Ryan C. Larrenaga, Esq.
c/o Columbia Management Investment Advisers, LLC
290 Congress Street
Boston, MA 02210
(Name and address of agent for service)
Registrant's telephone number, including area code: (800) 345-6611
Date of fiscal year end: May 31
Date of reporting period: May 31, 2023
Form N-CSR is to be used by management investment companies to file reports with the Commission not later than 10 days after the transmission to stockholders of any report that is required to be transmitted to stockholders under Rule 30e-1 under the Investment Company Act of 1940 (17 CFR 270.30e-1). The Commission may use the information provided on Form N-CSR in its regulatory, disclosure review, inspection, and policymaking roles.
A registrant is required to disclose the information specified by Form N-CSR, and the Commission will make this information public. A registrant is not required to respond to the collection of information contained in Form N-CSR unless the Form displays a currently valid Office of Management and Budget ("OMB") control number. Please direct comments concerning the accuracy of the information collection burden estimate and any suggestions for reducing the burden to Secretary, Securities and Exchange Commission, 100 F Street, NE, Washington, DC 20549. The OMB has reviewed this collection of information under the clearance requirements of 44 U.S.C. § 3507.
Item 1. Reports to Stockholders.

May 31, 2023

| 3 | |
| 5 | |
| 8 | |
| 9 | |
| 13 | |
| 14 | |
| 15 | |
| 18 | |
| 22 | |
| 31 | |
| 32 | |
| 32 | |
| 38 |
(Unaudited)
| Average annual total returns (%) (for the period ended May 31, 2023) | |||||
| Inception | 1 Year | 5 Years | 10 Years | ||
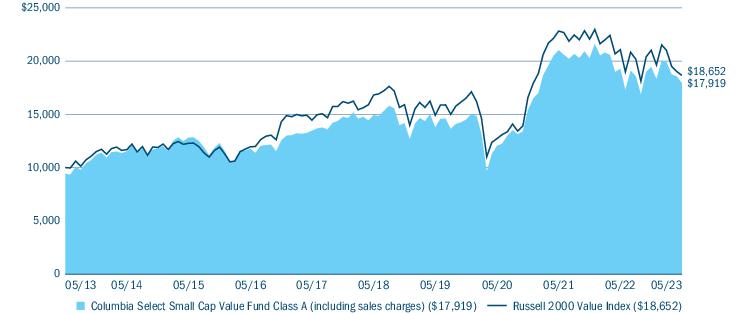
| Class A | Excluding sales charges | 04/25/97 | -7.04 | 3.71 | 6.64 |
| Including sales charges | -12.40 | 2.50 | 6.01 | ||
| Advisor Class | 11/08/12 | -6.79 | 3.98 | 6.91 | |
| Class C | Excluding sales charges | 05/27/99 | -7.65 | 2.96 | 5.84 |
| Including sales charges | -8.52 | 2.96 | 5.84 | ||
| Institutional Class | 09/27/10 | -6.75 | 3.99 | 6.91 | |
| Institutional 2 Class | 11/30/01 | -6.75 | 4.05 | 7.01 | |
| Institutional 3 Class* | 10/01/14 | -6.69 | 4.10 | 6.99 | |
| Class R | 04/30/03 | -7.20 | 3.56 | 6.42 | |
| Russell 2000 Value Index | -11.50 | 2.09 | 6.43 | ||
| * | The returns shown for periods prior to the share class inception date (including returns for the Life of the Fund, if shown, which are since Fund inception) include the returns of the Fund’s oldest share class. These returns are adjusted to reflect any higher class-related operating expenses of the newer share classes, as applicable. Please visit columbiathreadneedleus.com/investor/investment-products/mutual-funds/appended-performance for more information. |
| Columbia Select Small Cap Value Fund | Annual Report 2023 | 3 |
(Unaudited)
| Portfolio breakdown (%) (at May 31, 2023) | |
| Common Stocks | 99.7 |
| Money Market Funds | 0.3 |
| Rights | 0.0(a) |
| Total | 100.0 |
| (a) | Rounds to zero. |
| Equity sector breakdown (%) (at May 31, 2023) | |
| Communication Services | 0.3 |
| Consumer Discretionary | 12.5 |
| Consumer Staples | 2.2 |
| Energy | 3.6 |
| Financials | 23.1 |
| Health Care | 9.3 |
| Industrials | 16.3 |
| Information Technology | 10.4 |
| Materials | 11.3 |
| Real Estate | 8.0 |
| Utilities | 3.0 |
| Total | 100.0 |
| 4 | Columbia Select Small Cap Value Fund | Annual Report 2023 |
(Unaudited)
| Columbia Select Small Cap Value Fund | Annual Report 2023 | 5 |
(Unaudited)
| • | Strong broad-based stock selection was the largest source of the Fund’s outperformance, particularly within the materials, consumer discretionary and information technology sectors. |
| • | Overall sector allocation also helped relative results. Overweights to information technology and industrials were especially beneficial, as was an underweight to financials. A modest cash allocation throughout the period also helped. |
| • | Top individual contributors during the period included Extreme Networks, Inc., Texas Roadhouse, Inc., O-I Glass, Inc., Radian Group, Inc. and ATI, Inc. |
| • | Extreme Networks provides software-driven networking solutions. Shares of the company rose on strong sales growth and increasing backlogs driven by strong and persistent demand, even in the face of an uncertain macro environment, as the company continues to move to cloud-delivered products and expand distribution. |
| • | Restaurant chain Texas Roadhouse was a strong performer despite ongoing labor and food inflation weighing on margins, factors that were offset by strong demand that helped the company gain share in the casual dining category. |
| • | Glass packaging maker O-I Glass rose on strong results and favorable guidance driven by increased pricing power and progress the company has made in divesting noncore assets and continuing to deleverage. |
| • | Specialty insurer Radian Group rebounded from worries over a potential slowdown in new business and rose as investors focused on strong results amid an environment of low defaults and high credit quality. |
| • | As was the case in the previous reporting period, specialty metals company ATI was a notable outperformer. The company, formerly known as Allegheny Technologies, reported strong results that beat consensus expectations and authorized a new share repurchase program as investors additionally focused on opportunities in global defense, medical, and energy applications. |
| • | Stock selection within the energy and communication services sectors detracted from relative performance during the period, as did an underweight within the utilities sector. |
| • | Top individual detractors from relative performance during the period included Pacific Premier Bancorp, Inc., iHeartMedia, Inc., Devon Energy Corp., Patterson-UTI Energy, Inc. and Lincoln National Corp. |
| • | While the portfolio is underweight regional banks, the bank failures that rocked the industry in the latter part of the period brought the group sharply lower, including California-based Pacific Premier Bancorp. |
| • | Mass media company iHeartMedia, which was a detractor in the previous period, continued to see pressure from a challenging ad market. |
| • | Two top performers from the previous period – exploration and production company Devon Energy and equipment and services provider Patterson-UTI Energy – fell in concert as the energy complex struggled with the decline in oil prices. |
| • | Insurer Lincoln National dropped after reporting a loss owing to a significant charge associated with their annual actuarial assumption review. |
| 6 | Columbia Select Small Cap Value Fund | Annual Report 2023 |
(Unaudited)
| Columbia Select Small Cap Value Fund | Annual Report 2023 | 7 |
(Unaudited)
| December 1, 2022 — May 31, 2023 | |||||||
| Account value at the beginning of the period ($) | Account value at the end of the period ($) | Expenses paid during the period ($) | Fund’s annualized expense ratio (%) | ||||
| Actual | Hypothetical | Actual | Hypothetical | Actual | Hypothetical | Actual | |
| Class A | 1,000.00 | 1,000.00 | 921.10 | 1,018.55 | 6.13 | 6.44 | 1.28 |
| Advisor Class | 1,000.00 | 1,000.00 | 922.20 | 1,019.80 | 4.94 | 5.19 | 1.03 |
| Class C | 1,000.00 | 1,000.00 | 917.60 | 1,014.81 | 9.71 | 10.20 | 2.03 |
| Institutional Class | 1,000.00 | 1,000.00 | 922.10 | 1,019.80 | 4.94 | 5.19 | 1.03 |
| Institutional 2 Class | 1,000.00 | 1,000.00 | 922.20 | 1,020.14 | 4.60 | 4.84 | 0.96 |
| Institutional 3 Class | 1,000.00 | 1,000.00 | 922.40 | 1,020.39 | 4.36 | 4.58 | 0.91 |
| Class R | 1,000.00 | 1,000.00 | 919.80 | 1,017.40 | 7.23 | 7.59 | 1.51 |
| 8 | Columbia Select Small Cap Value Fund | Annual Report 2023 |
May 31, 2023
| Common Stocks 99.6% | ||
| Issuer | Shares | Value ($) |
| Communication Services 0.3% | ||
| Media 0.3% | ||
| iHeartMedia, Inc., Class A(a) | 530,000 | 1,256,100 |
| Total Communication Services | 1,256,100 | |
| Consumer Discretionary 12.5% | ||
| Auto Components 4.2% | ||
| Atmus Filtration Technologies, Inc.(a) | 247,440 | 5,131,906 |
| Visteon Corp.(a) | 100,000 | 13,358,000 |
| Total | 18,489,906 | |
| Hotels, Restaurants & Leisure 4.6% | ||
| Penn Entertainment, Inc.(a) | 44,535 | 1,115,156 |
| Six Flags Entertainment Corp.(a) | 393,383 | 10,050,936 |
| Texas Roadhouse, Inc. | 83,699 | 9,031,122 |
| Total | 20,197,214 | |
| Household Durables 1.9% | ||
| KB Home | 196,665 | 8,521,495 |
| Textiles, Apparel & Luxury Goods 1.8% | ||
| Kontoor Brands, Inc. | 195,977 | 7,674,459 |
| Total Consumer Discretionary | 54,883,074 | |
| Consumer Staples 2.1% | ||
| Food Products 2.1% | ||
| Nomad Foods Ltd.(a) | 551,731 | 9,407,014 |
| Total Consumer Staples | 9,407,014 | |
| Energy 3.6% | ||
| Energy Equipment & Services 1.7% | ||
| Patterson-UTI Energy, Inc. | 764,515 | 7,446,376 |
| Oil, Gas & Consumable Fuels 1.9% | ||
| Devon Energy Corp. | 179,397 | 8,270,202 |
| Total Energy | 15,716,578 | |
| Financials 23.0% | ||
| Banks 11.8% | ||
| Axos Financial, Inc.(a) | 371,820 | 14,062,232 |
| First Hawaiian, Inc. | 388,838 | 6,411,939 |
| OceanFirst Financial Corp. | 450,000 | 6,390,000 |
| Pacific Premier Bancorp, Inc. | 428,623 | 8,070,971 |
| Common Stocks (continued) | ||
| Issuer | Shares | Value ($) |
| Popular, Inc. | 161,254 | 9,220,504 |
| Stock Yards Bancorp, Inc. | 188,776 | 7,909,714 |
| Total | 52,065,360 | |
| Consumer Finance 1.4% | ||
| PROG Holdings, Inc.(a) | 182,821 | 5,965,449 |
| Financial Services 3.6% | ||
| Radian Group, Inc. | 621,310 | 15,868,258 |
| Insurance 6.2% | ||
| CNO Financial Group, Inc. | 400,308 | 8,690,687 |
| Hanover Insurance Group, Inc. (The) | 92,753 | 10,338,249 |
| Kemper Corp. | 190,000 | 8,223,200 |
| Total | 27,252,136 | |
| Total Financials | 101,151,203 | |
| Health Care 9.2% | ||
| Biotechnology —% | ||
| OmniAb, Inc.(a),(b),(c),(d) | 9,220 | 0 |
| OmniAb, Inc.(a),(b),(c),(d) | 9,220 | 0 |
| Total | 0 | |
| Health Care Equipment & Supplies 4.4% | ||
| CONMED Corp. | 101,129 | 12,266,948 |
| LivaNova PLC(a) | 165,362 | 7,322,229 |
| Total | 19,589,177 | |
| Health Care Providers & Services 2.5% | ||
| Tenet Healthcare Corp.(a) | 154,894 | 11,028,453 |
| Life Sciences Tools & Services 1.9% | ||
| Syneos Health, Inc.(a) | 198,163 | 8,243,581 |
| Pharmaceuticals 0.4% | ||
| Ligand Pharmaceuticals, Inc.(a) | 24,316 | 1,704,065 |
| Total Health Care | 40,565,276 | |
| Industrials 16.3% | ||
| Aerospace & Defense 2.6% | ||
| Curtiss-Wright Corp. | 72,696 | 11,490,330 |
| Building Products 2.3% | ||
| Zurn Elkay Water Solutions Corp. | 453,877 | 10,216,771 |
| Columbia Select Small Cap Value Fund | Annual Report 2023 | 9 |
May 31, 2023
| Common Stocks (continued) | ||
| Issuer | Shares | Value ($) |
| Commercial Services & Supplies 1.6% | ||
| Waste Connections, Inc. | 51,511 | 7,038,978 |
| Construction & Engineering 1.9% | ||
| Primoris Services Corp. | 305,421 | 8,185,283 |
| Electrical Equipment 2.3% | ||
| Bloom Energy Corp., Class A(a) | 226,774 | 3,111,339 |
| Regal Rexnord Corp. | 54,495 | 7,078,356 |
| Total | 10,189,695 | |
| Ground Transportation 2.7% | ||
| Knight-Swift Transportation Holdings, Inc. | 210,443 | 11,572,260 |
| Passenger Airlines 0.8% | ||
| American Airlines Group, Inc.(a) | 532 | 7,863 |
| Spirit Airlines, Inc. | 235,938 | 3,588,617 |
| Total | 3,596,480 | |
| Professional Services 2.1% | ||
| CACI International, Inc., Class A(a) | 31,046 | 9,289,584 |
| Total Industrials | 71,579,381 | |
| Information Technology 10.4% | ||
| Communications Equipment 6.2% | ||
| Extreme Networks, Inc.(a) | 733,246 | 15,104,867 |
| Viavi Solutions, Inc.(a) | 1,253,020 | 12,329,717 |
| Total | 27,434,584 | |
| Semiconductors & Semiconductor Equipment 4.2% | ||
| Kulicke & Soffa Industries, Inc. | 163,457 | 8,643,606 |
| MACOM Technology Solutions Holdings, Inc.(a) | 161,679 | 9,673,255 |
| Total | 18,316,861 | |
| Total Information Technology | 45,751,445 | |
| Materials 11.2% | ||
| Chemicals 1.7% | ||
| Minerals Technologies, Inc. | 135,521 | 7,536,323 |
| Construction Materials 2.6% | ||
| Summit Materials, Inc., Class A(a) | 362,332 | 11,460,561 |
| Containers & Packaging 3.8% | ||
| O-I Glass, Inc.(a) | 815,491 | 16,896,973 |
| Metals & Mining 3.1% | ||
| ATI, Inc.(a) | 392,586 | 13,575,624 |
| Total Materials | 49,469,481 | |
| Common Stocks (continued) | ||
| Issuer | Shares | Value ($) |
| Real Estate 8.0% | ||
| Health Care REITs 1.5% | ||
| Physicians Realty Trust | 474,453 | 6,481,028 |
| Hotel & Resort REITs 2.3% | ||
| Apple Hospitality REIT, Inc. | 700,000 | 10,171,000 |
| Industrial REITs 1.1% | ||
| First Industrial Realty Trust, Inc. | 92,636 | 4,815,219 |
| Specialized REITs 3.1% | ||
| Gaming and Leisure Properties, Inc. | 139,629 | 6,721,740 |
| Outfront Media, Inc. | 490,000 | 7,016,800 |
| Total | 13,738,540 | |
| Total Real Estate | 35,205,787 | |
| Utilities 3.0% | ||
| Electric Utilities 3.0% | ||
| Portland General Electric Co. | 266,927 | 13,007,353 |
| Total Utilities | 13,007,353 | |
| Total Common Stocks (Cost $343,737,504) | 437,992,692 | |
| Rights —% | ||
| Industrials —% | ||
| Passenger Airlines —% | ||
| American Airlines Escrow(a),(b),(d) | 52,560 | 0 |
| Total Industrials | 0 | |
| Total Rights (Cost $—) | 0 | |
| Money Market Funds 0.3% | ||
| Shares | Value ($) | |
| Columbia Short-Term Cash Fund, 5.241%(e),(f) | 1,265,868 | 1,265,235 |
| Total Money Market Funds (Cost $1,265,081) | 1,265,235 | |
| Total Investments in Securities (Cost: $345,002,585) | 439,257,927 | |
| Other Assets & Liabilities, Net | 306,906 | |
| Net Assets | 439,564,833 | |
| 10 | Columbia Select Small Cap Value Fund | Annual Report 2023 |
May 31, 2023
| (a) | Non-income producing investment. |
| (b) | Represents fair value as determined in good faith under procedures approved by the Board of Trustees. At May 31, 2023, the total value of these securities amounted to $0, which represents less than 0.01% of total net assets. |
| (c) | Denotes a restricted security, which is subject to legal or contractual restrictions on resale under federal securities laws. Disposal of a restricted investment may involve time-consuming negotiations and expenses, and prompt sale at an acceptable price may be difficult to achieve. Private placement securities are generally considered to be restricted, although certain of those securities may be traded between qualified institutional investors under the provisions of Section 4(a)(2) and Rule 144A. The Fund will not incur any registration costs upon such a trade. These securities are valued at fair value determined in good faith under consistently applied procedures approved by the Fund’s Board of Trustees. At May 31, 2023, the total market value of these securities amounted to $0, which represents less than 0.01% of total net assets. Additional information on these securities is as follows: |
| Security | Acquisition Dates | Shares | Cost ($) | Value ($) |
| OmniAb, Inc. | 02/13/2015-02/27/2015 | 9,220 | — | — |
| OmniAb, Inc. | 02/13/2015-02/27/2015 | 9,220 | — | — |
| — | — |
| (d) | Valuation based on significant unobservable inputs. |
| (e) | The rate shown is the seven-day current annualized yield at May 31, 2023. |
| (f) | As defined in the Investment Company Act of 1940, as amended, an affiliated company is one in which the Fund owns 5% or more of the company’s outstanding voting securities, or a company which is under common ownership or control with the Fund. The value of the holdings and transactions in these affiliated companies during the year ended May 31, 2023 are as follows: |
| Affiliated issuers | Beginning of period($) | Purchases($) | Sales($) | Net change in unrealized appreciation (depreciation)($) | End of period($) | Realized gain (loss)($) | Dividends($) | End of period shares |
| Columbia Short-Term Cash Fund, 5.241% | ||||||||
| 7,014,016 | 57,763,304 | (63,512,239) | 154 | 1,265,235 | (2,109) | 207,495 | 1,265,868 | |
| ■ | Level 1 — Valuations based on quoted prices for investments in active markets that the Fund has the ability to access at the measurement date. Valuation adjustments are not applied to Level 1 investments. |
| ■ | Level 2 — Valuations based on other significant observable inputs (including quoted prices for similar securities, interest rates, prepayment speeds, credit risks, etc.). |
| ■ | Level 3 — Valuations based on significant unobservable inputs (including the Fund’s own assumptions and judgment in determining the fair value of investments). |
| Columbia Select Small Cap Value Fund | Annual Report 2023 | 11 |
May 31, 2023
in default; and the effectiveness of third party pricing vendors, including periodic reviews of vendors. The Committee meets more frequently, as needed, to discuss additional valuation matters, which may include the need to review back-testing results, review time-sensitive information or approve related valuation actions. Representatives of Columbia Management Investment Advisers, LLC report to the Board at each of its regularly scheduled meetings to discuss valuation matters and actions during the period, similar to those described earlier.
| Level 1 ($) | Level 2 ($) | Level 3 ($) | Total ($) | |
| Investments in Securities | ||||
| Common Stocks | ||||
| Communication Services | 1,256,100 | — | — | 1,256,100 |
| Consumer Discretionary | 54,883,074 | — | — | 54,883,074 |
| Consumer Staples | 9,407,014 | — | — | 9,407,014 |
| Energy | 15,716,578 | — | — | 15,716,578 |
| Financials | 101,151,203 | — | — | 101,151,203 |
| Health Care | 40,565,276 | — | 0* | 40,565,276 |
| Industrials | 71,579,381 | — | — | 71,579,381 |
| Information Technology | 45,751,445 | — | — | 45,751,445 |
| Materials | 49,469,481 | — | — | 49,469,481 |
| Real Estate | 35,205,787 | — | — | 35,205,787 |
| Utilities | 13,007,353 | — | — | 13,007,353 |
| Total Common Stocks | 437,992,692 | — | 0* | 437,992,692 |
| Rights | ||||
| Industrials | — | — | 0* | 0* |
| Total Rights | — | — | 0* | 0* |
| Money Market Funds | 1,265,235 | — | — | 1,265,235 |
| Total Investments in Securities | 439,257,927 | — | 0* | 439,257,927 |
| * | Rounds to zero. |
| 12 | Columbia Select Small Cap Value Fund | Annual Report 2023 |
May 31, 2023
| Assets | |
| Investments in securities, at value | |
| Unaffiliated issuers (cost $343,737,504) | $437,992,692 |
| Affiliated issuers (cost $1,265,081) | 1,265,235 |
| Receivable for: | |
| Capital shares sold | 204,498 |
| Dividends | 501,413 |
| Expense reimbursement due from Investment Manager | 350 |
| Prepaid expenses | 5,787 |
| Total assets | 439,969,975 |
| Liabilities | |
| Payable for: | |
| Capital shares purchased | 211,192 |
| Management services fees | 10,610 |
| Distribution and/or service fees | 2,170 |
| Transfer agent fees | 41,099 |
| Compensation of board members | 108,902 |
| Other expenses | 31,169 |
| Total liabilities | 405,142 |
| Net assets applicable to outstanding capital stock | $439,564,833 |
| Represented by | |
| Paid in capital | 326,594,387 |
| Total distributable earnings (loss) | 112,970,446 |
| Total - representing net assets applicable to outstanding capital stock | $439,564,833 |
| Class A | |
| Net assets | $299,209,016 |
| Shares outstanding | 17,272,676 |
| Net asset value per share | $17.32 |
| Maximum sales charge | 5.75% |
| Maximum offering price per share (calculated by dividing the net asset value per share by 1.0 minus the maximum sales charge for Class A shares) | $18.38 |
| Advisor Class | |
| Net assets | $2,657,817 |
| Shares outstanding | 126,687 |
| Net asset value per share | $20.98 |
| Class C | |
| Net assets | $2,487,553 |
| Shares outstanding | 228,517 |
| Net asset value per share | $10.89 |
| Institutional Class | |
| Net assets | $46,061,853 |
| Shares outstanding | 2,238,644 |
| Net asset value per share | $20.58 |
| Institutional 2 Class | |
| Net assets | $2,398,477 |
| Shares outstanding | 114,583 |
| Net asset value per share | $20.93 |
| Institutional 3 Class | |
| Net assets | $84,977,931 |
| Shares outstanding | 3,897,364 |
| Net asset value per share | $21.80 |
| Class R | |
| Net assets | $1,772,186 |
| Shares outstanding | 112,101 |
| Net asset value per share | $15.81 |
| Columbia Select Small Cap Value Fund | Annual Report 2023 | 13 |
Year Ended May 31, 2023
| Net investment income | |
| Income: | |
| Dividends — unaffiliated issuers | $10,266,997 |
| Dividends — affiliated issuers | 207,495 |
| Foreign taxes withheld | (53,660) |
| Total income | 10,420,832 |
| Expenses: | |
| Management services fees | 4,199,119 |
| Distribution and/or service fees | |
| Class A | 820,654 |
| Class C | 33,624 |
| Class R | 8,796 |
| Transfer agent fees | |
| Class A | 422,013 |
| Advisor Class | 4,710 |
| Class C | 4,321 |
| Institutional Class | 61,268 |
| Institutional 2 Class | 2,089 |
| Institutional 3 Class | 6,035 |
| Class R | 2,359 |
| Compensation of board members | 22,625 |
| Custodian fees | 6,117 |
| Printing and postage fees | 54,526 |
| Registration fees | 129,900 |
| Accounting services fees | 30,090 |
| Legal fees | 18,824 |
| Compensation of chief compliance officer | 93 |
| Other | 18,743 |
| Total expenses | 5,845,906 |
| Fees waived or expenses reimbursed by Investment Manager and its affiliates | (130,337) |
| Expense reduction | (500) |
| Total net expenses | 5,715,069 |
| Net investment income | 4,705,763 |
| Realized and unrealized gain (loss) — net | |
| Net realized gain (loss) on: | |
| Investments — unaffiliated issuers | 33,669,817 |
| Investments — affiliated issuers | (2,109) |
| Net realized gain | 33,667,708 |
| Net change in unrealized appreciation (depreciation) on: | |
| Investments — unaffiliated issuers | (73,025,441) |
| Investments — affiliated issuers | 154 |
| Net change in unrealized appreciation (depreciation) | (73,025,287) |
| Net realized and unrealized loss | (39,357,579) |
| Net decrease in net assets resulting from operations | $(34,651,816) |
| 14 | Columbia Select Small Cap Value Fund | Annual Report 2023 |
| Year Ended May 31, 2023 | Year Ended May 31, 2022 | |
| Operations | ||
| Net investment income | $4,705,763 | $1,208,520 |
| Net realized gain | 33,667,708 | 13,916,690 |
| Net change in unrealized appreciation (depreciation) | (73,025,287) | (63,613,565) |
| Net decrease in net assets resulting from operations | (34,651,816) | (48,488,355) |
| Distributions to shareholders | ||
| Net investment income and net realized gains | ||
| Class A | (14,237,839) | (25,903,890) |
| Advisor Class | (129,440) | (200,508) |
| Class C | (188,057) | (451,603) |
| Institutional Class | (1,903,491) | (2,351,228) |
| Institutional 2 Class | (178,392) | (189,237) |
| Institutional 3 Class | (3,539,160) | (6,407,644) |
| Class R | (78,461) | (216,248) |
| Total distributions to shareholders | (20,254,840) | (35,720,358) |
| Increase (decrease) in net assets from capital stock activity | (30,370,772) | 8,016,141 |
| Total decrease in net assets | (85,277,428) | (76,192,572) |
| Net assets at beginning of year | 524,842,261 | 601,034,833 |
| Net assets at end of year | $439,564,833 | $524,842,261 |
| Columbia Select Small Cap Value Fund | Annual Report 2023 | 15 |
| Year Ended | Year Ended | |||
| May 31, 2023 | May 31, 2022 | |||
| Shares | Dollars ($) | Shares | Dollars ($) | |
| Capital stock activity | ||||
| Class A | ||||
| Subscriptions | 321,236 | 5,887,121 | 507,534 | 10,965,300 |
| Distributions reinvested | 770,489 | 13,984,370 | 1,178,095 | 25,423,289 |
| Redemptions | (2,139,697) | (39,208,743) | (1,910,302) | (40,878,780) |
| Net decrease | (1,047,972) | (19,337,252) | (224,673) | (4,490,191) |
| Advisor Class | ||||
| Subscriptions | 130,036 | 2,926,104 | 49,707 | 1,274,991 |
| Distributions reinvested | 5,717 | 125,532 | 7,565 | 195,996 |
| Redemptions | (155,651) | (3,413,211) | (65,444) | (1,694,723) |
| Net decrease | (19,898) | (361,575) | (8,172) | (223,736) |
| Class C | ||||
| Subscriptions | 25,729 | 301,660 | 78,662 | 1,121,908 |
| Distributions reinvested | 16,416 | 187,963 | 32,495 | 451,353 |
| Redemptions | (130,156) | (1,494,263) | (122,722) | (1,718,346) |
| Net decrease | (88,011) | (1,004,640) | (11,565) | (145,085) |
| Institutional Class | ||||
| Subscriptions | 874,526 | 19,159,499 | 1,067,433 | 26,463,504 |
| Distributions reinvested | 87,951 | 1,894,466 | 91,784 | 2,334,077 |
| Redemptions | (872,278) | (18,872,412) | (707,649) | (17,698,937) |
| Net increase | 90,199 | 2,181,553 | 451,568 | 11,098,644 |
| Institutional 2 Class | ||||
| Subscriptions | 129,707 | 2,795,414 | 63,596 | 1,652,752 |
| Distributions reinvested | 8,141 | 178,294 | 7,314 | 189,068 |
| Redemptions | (140,134) | (3,028,356) | (112,688) | (2,872,408) |
| Net decrease | (2,286) | (54,648) | (41,778) | (1,030,588) |
| Institutional 3 Class | ||||
| Subscriptions | 71,790 | 1,630,473 | 447,140 | 12,070,432 |
| Distributions reinvested | 144,097 | 3,286,854 | 217,810 | 5,852,565 |
| Redemptions | (698,740) | (16,349,545) | (537,418) | (14,359,466) |
| Net increase (decrease) | (482,853) | (11,432,218) | 127,532 | 3,563,531 |
| Class R | ||||
| Subscriptions | 28,516 | 472,538 | 34,423 | 686,829 |
| Distributions reinvested | 3,963 | 65,710 | 8,864 | 175,508 |
| Redemptions | (54,230) | (900,240) | (81,587) | (1,618,771) |
| Net decrease | (21,751) | (361,992) | (38,300) | (756,434) |
| Total net increase (decrease) | (1,572,572) | (30,370,772) | 254,612 | 8,016,141 |
| 16 | Columbia Select Small Cap Value Fund | Annual Report 2023 |
| Net asset value, beginning of period | Net investment income (loss) | Net realized and unrealized gain (loss) | Total from investment operations | Distributions from net investment income | Distributions from net realized gains | Total distributions to shareholders | |
| Class A | |||||||
| Year Ended 5/31/2023 | $19.47 | 0.16 | (1.49) | (1.33) | (0.15) | (0.67) | (0.82) |
| Year Ended 5/31/2022 | $22.67 | 0.03 | (1.78) | (1.75) | (0.01) | (1.44) | (1.45) |
| Year Ended 5/31/2021 | $13.83 | 0.01 | 9.98 | 9.99 | (0.01) | (1.14) | (1.15) |
| Year Ended 5/31/2020 | $15.83 | 0.01 | (1.99) | (1.98) | (0.02) | (0.00)(d) | (0.02) |
| Year Ended 5/31/2019 | $18.40 | 0.01 | (1.47) | (1.46) | (0.02) | (1.09) | (1.11) |
| Advisor Class | |||||||
| Year Ended 5/31/2023 | $23.40 | 0.25 | (1.80) | (1.55) | (0.20) | (0.67) | (0.87) |
| Year Ended 5/31/2022 | $26.94 | 0.10 | (2.14) | (2.04) | (0.06) | (1.44) | (1.50) |
| Year Ended 5/31/2021 | $16.27 | 0.07 | 11.79 | 11.86 | (0.05) | (1.14) | (1.19) |
| Year Ended 5/31/2020 | $18.62 | 0.06 | (2.34) | (2.28) | (0.07) | (0.00)(d) | (0.07) |
| Year Ended 5/31/2019 | $21.38 | 0.05 | (1.69) | (1.64) | (0.03) | (1.09) | (1.12) |
| Class C | |||||||
| Year Ended 5/31/2023 | $12.48 | 0.02 | (0.94) | (0.92) | — | (0.67) | (0.67) |
| Year Ended 5/31/2022 | $15.15 | (0.09) | (1.14) | (1.23) | — | (1.44) | (1.44) |
| Year Ended 5/31/2021 | $9.59 | (0.08) | 6.78 | 6.70 | — | (1.14) | (1.14) |
| Year Ended 5/31/2020 | $11.05 | (0.07) | (1.39) | (1.46) | — | (0.00)(d) | (0.00)(d) |
| Year Ended 5/31/2019 | $13.29 | (0.09) | (1.06) | (1.15) | — | (1.09) | (1.09) |
| Institutional Class | |||||||
| Year Ended 5/31/2023 | $22.96 | 0.24 | (1.75) | (1.51) | (0.20) | (0.67) | (0.87) |
| Year Ended 5/31/2022 | $26.47 | 0.09 | (2.10) | (2.01) | (0.06) | (1.44) | (1.50) |
| Year Ended 5/31/2021 | $16.00 | 0.07 | 11.59 | 11.66 | (0.05) | (1.14) | (1.19) |
| Year Ended 5/31/2020 | $18.31 | 0.06 | (2.30) | (2.24) | (0.07) | (0.00)(d) | (0.07) |
| Year Ended 5/31/2019 | $21.05 | 0.05 | (1.67) | (1.62) | (0.03) | (1.09) | (1.12) |
| Institutional 2 Class | |||||||
| Year Ended 5/31/2023 | $23.35 | 0.27 | (1.81) | (1.54) | (0.21) | (0.67) | (0.88) |
| Year Ended 5/31/2022 | $26.89 | 0.12 | (2.15) | (2.03) | (0.07) | (1.44) | (1.51) |
| Year Ended 5/31/2021 | $16.24 | 0.08 | 11.77 | 11.85 | (0.06) | (1.14) | (1.20) |
| Year Ended 5/31/2020 | $18.58 | 0.07 | (2.33) | (2.26) | (0.08) | (0.00)(d) | (0.08) |
| Year Ended 5/31/2019 | $21.33 | 0.08 | (1.70) | (1.62) | (0.04) | (1.09) | (1.13) |
| 18 | Columbia Select Small Cap Value Fund | Annual Report 2023 |
| Net asset value, end of period | Total return | Total gross expense ratio to average net assets(a) | Total net expense ratio to average net assets(a),(b) | Net investment income (loss) ratio to average net assets | Portfolio turnover | Net assets, end of period (000’s) | |
| Class A | |||||||
| Year Ended 5/31/2023 | $17.32 | (7.04%) | 1.31% | 1.28%(c) | 0.88% | 11% | $299,209 |
| Year Ended 5/31/2022 | $19.47 | (8.35%) | 1.28% | 1.26%(c) | 0.12% | 7% | $356,657 |
| Year Ended 5/31/2021 | $22.67 | 74.66% | 1.32% | 1.28%(c) | 0.08% | 30% | $420,471 |
| Year Ended 5/31/2020 | $13.83 | (12.52%) | 1.31% | 1.31%(c) | 0.07% | 17% | $281,259 |
| Year Ended 5/31/2019 | $15.83 | (7.80%) | 1.30% | 1.30%(c) | 0.08% | 17% | $379,113 |
| Advisor Class | |||||||
| Year Ended 5/31/2023 | $20.98 | (6.79%) | 1.06% | 1.03%(c) | 1.11% | 11% | $2,658 |
| Year Ended 5/31/2022 | $23.40 | (8.13%) | 1.03% | 1.01%(c) | 0.37% | 7% | $3,430 |
| Year Ended 5/31/2021 | $26.94 | 75.04% | 1.07% | 1.03%(c) | 0.33% | 30% | $4,169 |
| Year Ended 5/31/2020 | $16.27 | (12.32%) | 1.06% | 1.06%(c) | 0.33% | 17% | $2,898 |
| Year Ended 5/31/2019 | $18.62 | (7.50%) | 1.04% | 1.04%(c) | 0.26% | 17% | $3,219 |
| Class C | |||||||
| Year Ended 5/31/2023 | $10.89 | (7.65%) | 2.06% | 2.03%(c) | 0.15% | 11% | $2,488 |
| Year Ended 5/31/2022 | $12.48 | (9.08%) | 2.03% | 2.01%(c) | (0.62%) | 7% | $3,951 |
| Year Ended 5/31/2021 | $15.15 | 73.36% | 2.07% | 2.03%(c) | (0.66%) | 30% | $4,971 |
| Year Ended 5/31/2020 | $9.59 | (13.18%) | 2.06% | 2.06%(c) | (0.67%) | 17% | $5,402 |
| Year Ended 5/31/2019 | $11.05 | (8.46%) | 2.04% | 2.04%(c) | (0.68%) | 17% | $9,187 |
| Institutional Class | |||||||
| Year Ended 5/31/2023 | $20.58 | (6.75%) | 1.06% | 1.03%(c) | 1.12% | 11% | $46,062 |
| Year Ended 5/31/2022 | $22.96 | (8.15%) | 1.03% | 1.01%(c) | 0.37% | 7% | $49,338 |
| Year Ended 5/31/2021 | $26.47 | 75.06% | 1.07% | 1.02%(c) | 0.33% | 30% | $44,918 |
| Year Ended 5/31/2020 | $16.00 | (12.31%) | 1.06% | 1.06%(c) | 0.32% | 17% | $29,670 |
| Year Ended 5/31/2019 | $18.31 | (7.53%) | 1.04% | 1.04%(c) | 0.25% | 17% | $73,967 |
| Institutional 2 Class | |||||||
| Year Ended 5/31/2023 | $20.93 | (6.75%) | 0.99% | 0.96% | 1.23% | 11% | $2,398 |
| Year Ended 5/31/2022 | $23.35 | (8.10%) | 0.97% | 0.95% | 0.46% | 7% | $2,729 |
| Year Ended 5/31/2021 | $26.89 | 75.16% | 0.99% | 0.96% | 0.39% | 30% | $4,265 |
| Year Ended 5/31/2020 | $16.24 | (12.24%) | 0.98% | 0.98% | 0.36% | 17% | $2,841 |
| Year Ended 5/31/2019 | $18.58 | (7.44%) | 0.97% | 0.97% | 0.40% | 17% | $9,678 |
| Columbia Select Small Cap Value Fund | Annual Report 2023 | 19 |
| Net asset value, beginning of period | Net investment income (loss) | Net realized and unrealized gain (loss) | Total from investment operations | Distributions from net investment income | Distributions from net realized gains | Total distributions to shareholders | |
| Institutional 3 Class | |||||||
| Year Ended 5/31/2023 | $24.28 | 0.29 | (1.88) | (1.59) | (0.22) | (0.67) | (0.89) |
| Year Ended 5/31/2022 | $27.90 | 0.13 | (2.23) | (2.10) | (0.08) | (1.44) | (1.52) |
| Year Ended 5/31/2021 | $16.81 | 0.10 | 12.20 | 12.30 | (0.07) | (1.14) | (1.21) |
| Year Ended 5/31/2020 | $19.23 | 0.09 | (2.42) | (2.33) | (0.09) | (0.00)(d) | (0.09) |
| Year Ended 5/31/2019 | $22.03 | 0.10 | (1.77) | (1.67) | (0.04) | (1.09) | (1.13) |
| Class R | |||||||
| Year Ended 5/31/2023 | $17.84 | 0.11 | (1.36) | (1.25) | (0.11) | (0.67) | (0.78) |
| Year Ended 5/31/2022 | $20.94 | 0.00(d) | (1.64) | (1.64) | (0.02) | (1.44) | (1.46) |
| Year Ended 5/31/2021 | $12.83 | 0.02 | 9.23 | 9.25 | — | (1.14) | (1.14) |
| Year Ended 5/31/2020 | $14.71 | (0.03) | (1.85) | (1.88) | — | (0.00)(d) | (0.00)(d) |
| Year Ended 5/31/2019 | $17.20 | (0.03) | (1.37) | (1.40) | — | (1.09) | (1.09) |
| Notes to Financial Highlights | |
| (a) | In addition to the fees and expenses that the Fund bears directly, the Fund indirectly bears a pro rata share of the fees and expenses of any other funds in which it invests. Such indirect expenses are not included in the Fund’s reported expense ratios. |
| (b) | Total net expenses include the impact of certain fee waivers/expense reimbursements made by the Investment Manager and certain of its affiliates, if applicable. |
| (c) | The benefits derived from expense reductions had an impact of less than 0.01%. |
| (d) | Rounds to zero. |
| 20 | Columbia Select Small Cap Value Fund | Annual Report 2023 |
| Net asset value, end of period | Total return | Total gross expense ratio to average net assets(a) | Total net expense ratio to average net assets(a),(b) | Net investment income (loss) ratio to average net assets | Portfolio turnover | Net assets, end of period (000’s) | |
| Institutional 3 Class | |||||||
| Year Ended 5/31/2023 | $21.80 | (6.69%) | 0.93% | 0.91% | 1.25% | 11% | $84,978 |
| Year Ended 5/31/2022 | $24.28 | (8.05%) | 0.92% | 0.90% | 0.48% | 7% | $106,349 |
| Year Ended 5/31/2021 | $27.90 | 75.30% | 0.94% | 0.89% | 0.44% | 30% | $118,636 |
| Year Ended 5/31/2020 | $16.81 | (12.20%) | 0.93% | 0.93% | 0.46% | 17% | $11,355 |
| Year Ended 5/31/2019 | $19.23 | (7.41%) | 0.92% | 0.92% | 0.47% | 17% | $13,299 |
| Class R | |||||||
| Year Ended 5/31/2023 | $15.81 | (7.20%) | 1.54% | 1.51%(c) | 0.66% | 11% | $1,772 |
| Year Ended 5/31/2022 | $17.84 | (8.52%) | 1.39% | 1.38%(c) | 0.02% | 7% | $2,388 |
| Year Ended 5/31/2021 | $20.94 | 74.76% | 1.26% | 1.22%(c) | 0.12% | 30% | $3,604 |
| Year Ended 5/31/2020 | $12.83 | (12.76%) | 1.56% | 1.56%(c) | (0.19%) | 17% | $2,579 |
| Year Ended 5/31/2019 | $14.71 | (7.97%) | 1.54% | 1.54%(c) | (0.21%) | 17% | $5,720 |
| Columbia Select Small Cap Value Fund | Annual Report 2023 | 21 |
May 31, 2023
| 22 | Columbia Select Small Cap Value Fund | Annual Report 2023 |
May 31, 2023
| Columbia Select Small Cap Value Fund | Annual Report 2023 | 23 |
May 31, 2023
| 24 | Columbia Select Small Cap Value Fund | Annual Report 2023 |
May 31, 2023
| Effective rate (%) | |
| Class A | 0.13 |
| Advisor Class | 0.13 |
| Class C | 0.13 |
| Institutional Class | 0.13 |
| Institutional 2 Class | 0.06 |
| Institutional 3 Class | 0.01 |
| Class R | 0.13 |
| Columbia Select Small Cap Value Fund | Annual Report 2023 | 25 |
May 31, 2023
| Front End (%) | CDSC (%) | Amount ($) | |
| Class A | 5.75 | 0.50 - 1.00(a) | 56,695 |
| Class C | — | 1.00(b) | 278 |
| (a) | This charge is imposed on certain investments of between $1 million and $50 million redeemed within 18 months after purchase, as follows: 1.00% if redeemed within 12 months after purchase, and 0.50% if redeemed more than 12, but less than 18, months after purchase, with certain limited exceptions. |
| (b) | This charge applies to redemptions within 12 months after purchase, with certain limited exceptions. |
| October 1, 2022 through September 30, 2023 | Prior to October 1, 2022 | |
| Class A | 1.28% | 1.28% |
| Advisor Class | 1.03 | 1.03 |
| Class C | 2.03 | 2.03 |
| Institutional Class | 1.03 | 1.03 |
| Institutional 2 Class | 0.96 | 0.97 |
| Institutional 3 Class | 0.91 | 0.92 |
| Class R | 1.53 | 1.53 |
| 26 | Columbia Select Small Cap Value Fund | Annual Report 2023 |
May 31, 2023
| Year Ended May 31, 2023 | Year Ended May 31, 2022 | ||||
| Ordinary income ($) | Long-term capital gains ($) | Total ($) | Ordinary income ($) | Long-term capital gains ($) | Total ($) |
| 4,567,914 | 15,686,926 | 20,254,840 | 1,977,965 | 33,742,393 | 35,720,358 |
| Undistributed ordinary income ($) | Undistributed long-term capital gains ($) | Capital loss carryforwards ($) | Net unrealized appreciation ($) |
| 3,058,416 | 15,869,279 | — | 94,149,438 |
| Federal tax cost ($) | Gross unrealized appreciation ($) | Gross unrealized (depreciation) ($) | Net unrealized appreciation ($) |
| 345,108,489 | 133,795,599 | (39,646,161) | 94,149,438 |
| Columbia Select Small Cap Value Fund | Annual Report 2023 | 27 |
May 31, 2023
| 28 | Columbia Select Small Cap Value Fund | Annual Report 2023 |
May 31, 2023
| Columbia Select Small Cap Value Fund | Annual Report 2023 | 29 |
May 31, 2023
| 30 | Columbia Select Small Cap Value Fund | Annual Report 2023 |
| Columbia Select Small Cap Value Fund | Annual Report 2023 | 31 |
| Qualified dividend income | Dividends received deduction | Capital gain dividend |
| 100.00% | 100.00% | $33,134,015 |
| Name, address, year of birth | Position held with the Columbia Funds and length of service | Principal occupation(s) during past five years and other relevant professional experience | Number of Funds in the Columbia Funds Complex* overseen | Other directorships held by Trustee during the past five years and other relevant Board experience |
| George S. Batejan c/o Columbia Management Investment Advisers, LLC 290 Congress Street Boston, MA 02210 1954 | Trustee since 2017 | Executive Vice President, Global Head of Technology and Operations, Janus Capital Group, Inc., 2010-2016 | 174 | Former Chairman of the Board, NICSA (National Investment Company Services Association) (Executive Committee, Nominating Committee and Governance Committee), 2014-2016; former Director, Intech Investment Management, 2011-2016; former Board Member, Metro Denver Chamber of Commerce, 2015-2016; former Advisory Board Member, University of Colorado Business School, 2015-2018; former Board Member, Chase Bank International, 1993-1994 |
| 32 | Columbia Select Small Cap Value Fund | Annual Report 2023 |
(Unaudited)
Independent trustees (continued)
| Name, address, year of birth | Position held with the Columbia Funds and length of service | Principal occupation(s) during past five years and other relevant professional experience | Number of Funds in the Columbia Funds Complex* overseen | Other directorships held by Trustee during the past five years and other relevant Board experience |
| Kathleen Blatz c/o Columbia Management Investment Advisers, LLC 290 Congress Street Boston, MA 02210 1954 | Trustee since 2006 | Attorney, specializing in arbitration and mediation; Chief Justice, Minnesota Supreme Court, 1998-2006; Associate Justice, Minnesota Supreme Court, 1996-1998; Fourth Judicial District Court Judge, Hennepin County, 1994-1996; Attorney in private practice and public service, 1984-1993; State Representative, Minnesota House of Representatives, 1979-1993, which included service on the Tax and Financial Institutions and Insurance Committees; Member and Interim Chair, Minnesota Sports Facilities Authority, January-July 2017; Interim President and Chief Executive Officer, Blue Cross and Blue Shield of Minnesota (health care insurance), February-July 2018, April-October 2021 | 174 | Former Trustee, Blue Cross and Blue Shield of Minnesota, 2009-2021 (Chair of the Business Development Committee, 2014-2017; Chair of the Governance Committee, 2017-2019); former Member and Chair of the Board, Minnesota Sports Facilities Authority, January 2017-July 2017; former Director, Robina Foundation, 2009-2020 (Chair, 2014-2020); Director, Richard M. Schulze Family Foundation, since 2021 |
| Pamela G. Carlton c/o Columbia Management Investment Advisers, LLC 290 Congress Street Boston, MA 02210 1954 | Chair since 2023; Trustee since 2007 | President, Springboard — Partners in Cross Cultural Leadership (consulting company), since 2003; Managing Director of US Equity Research, JP Morgan Chase, 1999-2003; Director of US Equity Research, Chase Asset Management, 1996-1999; Co-Director Latin America Research, 1993-1996, COO Global Research, 1992-1996, Co-Director of US Research, 1991-1992, Investment Banker, 1982-1991, Morgan Stanley; Attorney, Cleary Gottlieb Steen & Hamilton LLP, 1980-1982 | 174 | Trustee, New York Presbyterian Hospital Board, since 1996; Director, DR Bank (Audit Committee) since 2017; Director, Evercore Inc. (Audit Committee, Nominating and Governance Committee), since 2019; Director, Apollo Commercial Real Estate Finance, Inc. (Chair, Nominating and Governance Committee) (financial services), since 2021; the Governing Council of the Independent Directors Council (IDC), since 2021 |
| Janet Langford Carrig c/o Columbia Management Investment Advisers, LLC 290 Congress Street Boston, MA 02210 1957 | Trustee since 1996 | Senior Vice President, General Counsel and Corporate Secretary, ConocoPhillips (independent energy company), September 2007-October 2018 | 174 | Director, EQT Corporation (natural gas producer), since 2019; former Director, Whiting Petroleum Corporation (independent oil and gas company), 2020-2022 |
| J. Kevin Connaughton c/o Columbia Management Investment Advisers, LLC 290 Congress Street Boston, MA 02210 1964 | Trustee since 2020 | CEO and President, RhodeWay Financial (non-profit financial planning firm), since December 2022; Member, FINRA National Adjudicatory Council, since January 2020; Adjunct Professor of Finance, Bentley University since January 2018; Consultant to Independent Trustees of CFVIT and CFST I from March 2016 to June 2020 with respect to CFVIT and to December 2020 with respect to CFST I; Managing Director and General Manager of Mutual Fund Products, Columbia Management Investment Advisers, LLC, May 2010-February 2015; President, Columbia Funds, 2008-2015; and senior officer of Columbia Funds and affiliated funds, 2003-2015 | 172 | Former Director, The Autism Project, March 2015-December 2021; former Member of the Investment Committee, St. Michael’s College, November 2015-February 2020; former Trustee, St. Michael’s College, June 2017-September 2019; former Trustee, New Century Portfolios (former mutual fund complex), January 2015-December 2017 |
| Columbia Select Small Cap Value Fund | Annual Report 2023 | 33 |
(Unaudited)
Independent trustees (continued)
| Name, address, year of birth | Position held with the Columbia Funds and length of service | Principal occupation(s) during past five years and other relevant professional experience | Number of Funds in the Columbia Funds Complex* overseen | Other directorships held by Trustee during the past five years and other relevant Board experience |
| Olive M. Darragh c/o Columbia Management Investment Advisers, LLC 290 Congress Street Boston, MA 02210 1962 | Trustee since 2020 | Managing Director of Darragh Inc. (strategy and talent management consulting firm), since 2010; Founder and CEO, Zolio, Inc. (investment management talent identification platform), since 2004; Consultant to Independent Trustees of CFVIT and CFST I from June 2019 to June 2020 with respect to CFVIT and to December 2020 with respect to CFST I; Partner, Tudor Investments, 2004-2010; Senior Partner, McKinsey & Company (consulting), 1990-2004; Touche Ross CPA, 1985-1988 | 172 | Treasurer, Edinburgh University US Trust Board, since January 2023; Member, HBS Community Action Partners Board, since September 2022; former Director, University of Edinburgh Business School (Member of US Board), 2004-2019; former Director, Boston Public Library Foundation, 2008-2017 |
| Patricia M. Flynn c/o Columbia Management Investment Advisers, LLC 290 Congress Street Boston, MA 02210 1950 | Trustee since 2004 | Professor of Economics and Management, Bentley University, since 2002; Dean, McCallum Graduate School of Business, Bentley University, 1992-2002 | 174 | Former Trustee, MA Taxpayers Foundation, 1997-2022; former Director, The MA Business Roundtable, 2003-2019; former Chairperson, Innovation Index Advisory Committee, MA Technology Collaborative, 1997-2020 |
| Brian J. Gallagher c/o Columbia Management Investment Advisers, LLC 290 Congress Street Boston, MA 02210 1954 | Trustee since 2017 | Retired; Partner with Deloitte & Touche LLP and its predecessors, 1977-2016 | 174 | Trustee, Catholic Schools Foundation, since 2004 |
| Douglas A. Hacker c/o Columbia Management Investment Advisers, LLC 290 Congress Street Boston, MA 02210 1955 | Trustee since 1996 | Independent business executive, since May 2006; Executive Vice President – Strategy of United Airlines, December 2002 - May 2006; President of UAL Loyalty Services (airline marketing company), September 2001-December 2002; Executive Vice President and Chief Financial Officer of United Airlines, July 1999-September 2001 | 174 | Director, SpartanNash Company since November 2013 (Chair of the Board, since May 2021) (food distributor); Director, Aircastle Limited (Chair of Audit Committee) (aircraft leasing), since August 2006; former Director, Nash Finch Company (food distributor), 2005-2013; former Director, SeaCube Container Leasing Ltd. (container leasing), 2010-2013; and former Director, Travelport Worldwide Limited (travel information technology), 2014-2019 |
| Nancy T. Lukitsh c/o Columbia Management Investment Advisers, LLC 290 Congress Street Boston, MA 02210 1956 | Trustee since 2011 | Senior Vice President, Partner and Director of Marketing, Wellington Management Company, LLP (investment adviser), 1997-2010; Chair, Wellington Management Portfolios (commingled non-U.S. investment pools), 2007-2010; Director, Wellington Trust Company, NA and other Wellington affiliates, 1997-2010 | 172 | None |
| 34 | Columbia Select Small Cap Value Fund | Annual Report 2023 |
(Unaudited)
Independent trustees (continued)
| Name, address, year of birth | Position held with the Columbia Funds and length of service | Principal occupation(s) during past five years and other relevant professional experience | Number of Funds in the Columbia Funds Complex* overseen | Other directorships held by Trustee during the past five years and other relevant Board experience |
| David M. Moffett c/o Columbia Management Investment Advisers, LLC 290 Congress Street Boston, MA 02210 1952 | Trustee since 2011 | Retired; former Chief Executive Officer of Freddie Mac and Chief Financial Officer of U.S. Bank | 172 | Director, CSX Corporation (transportation suppliers); Director, PayPal Holdings Inc. (payment and data processing services); Trustee, University of Oklahoma Foundation; former Director, eBay Inc. (online trading community), 2007-2015; and former Director, CIT Bank, CIT Group Inc. (commercial and consumer finance), 2010-2016; former Senior Adviser to The Carlyle Group (financial services), March 2008-September 2008; former Governance Consultant to Bridgewater Associates, January 2013-December 2015 |
| Catherine James Paglia c/o Columbia Management Investment Advisers, LLC 290 Congress Street Boston, MA 02210 1952 | Trustee since 2004 | Director, Enterprise Asset Management, Inc. (private real estate and asset management company), since September 1998; Managing Director and Partner, Interlaken Capital, Inc., 1989-1997; Vice President, 1982-1985, Principal, 1985-1987, Managing Director, 1987-1989, Morgan Stanley; Vice President, Investment Banking, 1980-1982, Associate, Investment Banking, 1976-1980, Dean Witter Reynolds, Inc. | 174 | Director, Valmont Industries, Inc. (irrigation systems manufacturer), since 2012; Trustee, Carleton College (on the Investment Committee), since 1987; Trustee, Carnegie Endowment for International Peace (on the Investment Committee), since 2009 |
| Natalie A. Trunow c/o Columbia Management Investment Advisers, LLC 290 Congress Street Boston, MA 02210 1967 | Trustee since 2020 | Chief Executive Officer, Millennial Portfolio Solutions LLC (asset management and consulting services), January 2016-January 2021; Non-executive Member of the Investment Committee and Valuation Committee, Sarona Asset Management Inc. (private equity firm) since September 2019; Advisor, Horizon Investments (asset management and consulting services), August 2018-January 2022; Advisor, Paradigm Asset Management, November 2016-January 2022; Consultant to Independent Trustees of CFVIT and CFST I from September 2016 to June 2020 with respect to CFVIT and to December 2020 with respect to CFST I; Director of Investments/Consultant, Casey Family Programs, April 2016-November 2016; Senior Vice President and Chief Investment Officer, Calvert Investments, August 2008-January 2016; Section Head and Portfolio Manager, General Motors Asset Management, June 1997-August 2008 | 172 | Independent Director, Investment Committee, Health Services for Children with Special Needs, Inc., 2010-2021; Independent Director, (Executive Committee and Chair, Audit Committee), Consumer Credit Counseling Services (formerly Guidewell Financial Solutions), since 2016; Independent Director, (Investment Committee), Sarona Asset Management, since 2019 |
| Columbia Select Small Cap Value Fund | Annual Report 2023 | 35 |
(Unaudited)
Independent trustees (continued)
| Name, address, year of birth | Position held with the Columbia Funds and length of service | Principal occupation(s) during past five years and other relevant professional experience | Number of Funds in the Columbia Funds Complex* overseen | Other directorships held by Trustee during the past five years and other relevant Board experience |
| Sandra L. Yeager c/o Columbia Management Investment Advisers, LLC 290 Congress Street Boston, MA 02210 1964 | Trustee since 2017 | Retired; President and founder, Hanoverian Capital, LLC (SEC registered investment advisor firm), 2008-2016; Managing Director, DuPont Capital, 2006-2008; Managing Director, Morgan Stanley Investment Management, 2004-2006; Senior Vice President, Alliance Bernstein, 1990-2004 | 174 | Former Director, NAPE (National Alliance for Partnerships in Equity) Education Foundation, October 2016-October 2020; Advisory Board, Jennersville YMCA, since 2022 |
| Name, address, year of birth | Position held with the Columbia Funds and length of service | Principal occupation(s) during the past five years and other relevant professional experience | Number of Funds in the Columbia Funds Complex overseen | Other directorships held by Trustee during the past five years and other relevant Board experience |
| Daniel J. Beckman c/o Columbia Management Investment Advisers, LLC 290 Congress Street Boston, MA 02210 1962 | Trustee since November 2021 and President since June 2021 | Vice President – Head of North America Product, Columbia Management Investment Advisers, LLC, since April 2015; President and Principal Executive Officer of the Columbia Funds, since June 2021; officer of Columbia Funds and affiliated funds, 2020-2021 | 174 | Director, Ameriprise Trust Company, since October 2016; Director, Columbia Management Investment Distributors, Inc. since November 2018; Board of Governors, Columbia Wanger Asset Management, LLC since, January 2022; Director, Columbia Threadneedle Canada, Inc., since December 2022 |
| * | The term “Columbia Funds Complex” as used herein includes Columbia Seligman Premium Technology Growth Fund, Tri-Continental Corporation and each series of Columbia Funds Series Trust (CFST), Columbia Funds Series Trust I (CFST I), Columbia Funds Series Trust II (CFST II), Columbia ETF Trust I (CET I), Columbia ETF Trust II (CET II), Columbia Funds Variable Insurance Trust (CFVIT) and Columbia Funds Variable Series Trust II (CFVST II). Messrs. Batejan, Beckman, Gallagher and Hacker and Mses. Blatz, Carlton, Carrig, Flynn, Paglia, and Yeager serve as directors of Columbia Seligman Premium Technology Growth Fund and Tri-Continental Corporation. |
| ** | Interested person (as defined under the 1940 Act) by reason of being an officer, director, security holder and/or employee of the Investment Manager or Ameriprise Financial. |
| 36 | Columbia Select Small Cap Value Fund | Annual Report 2023 |
(Unaudited)
The Board has appointed officers who are responsible for day-to-day business decisions based on policies it has established. The officers serve at the pleasure of the Board. The following table provides basic information about the Officers of the Fund as of the printing of this report, including principal occupations during the past five years, although their specific titles may have varied over the period. In addition to Mr. Beckman, who is President and Principal Executive Officer, the Fund’s other officers are:
| Name, address and year of birth | Position and year first appointed to position for any Fund in the Columbia Funds Complex or a predecessor thereof | Principal occupation(s) during past five years |
| Michael G. Clarke 290 Congress Street Boston, MA 02210 1969 | Chief Financial Officer and Principal Financial Officer (2009) and Senior Vice President (2019) | Senior Vice President and North America Head of Operations & Investor Services, Columbia Management Investment Advisers, LLC, since June 2023 (previously Senior Vice President and Head of Global Operations, March 2022 – June 2023, Vice President, Head of North America Operations, and Co-Head of Global Operations, June 2019 - February 2022 and Vice President – Accounting and Tax, May 2010 - May 2019); senior officer of Columbia Funds and affiliated funds, since 2002. Director, Ameriprise Trust Company, since June 2023. |
| Joseph Beranek 5890 Ameriprise Financial Center Minneapolis, MN 55474 1965 | Treasurer and Chief Accounting Officer (Principal Accounting Officer) (2019) and Principal Financial Officer (2020), CFST, CFST I, CFST II, CFVIT and CFVST II; Assistant Treasurer, CET I and CET II | Vice President – Mutual Fund Accounting and Financial Reporting, Columbia Management Investment Advisers, LLC, since December 2018 and March 2017, respectively. |
| Marybeth Pilat 290 Congress Street Boston, MA 02210 1968 | Treasurer and Chief Accounting Officer (Principal Accounting Officer) and Principal Financial Officer (2020) for CET I and CET II; Assistant Treasurer, CFST, CFST I, CFST II, CFVIT and CFVST II | Vice President – Product Pricing and Administration, Columbia Management Investment Advisers, LLC, since May 2017. |
| William F. Truscott 290 Congress Street Boston, MA 02210 1960 | Senior Vice President (2001) | Formerly, Trustee/Director of Columbia Funds Complex or legacy funds, November 2001 - January 1, 2021; Chief Executive Officer, Global Asset Management, Ameriprise Financial, Inc., since September 2012; Chairman of the Board and President, Columbia Management Investment Advisers, LLC, since July 2004 and February 2012, respectively; Chairman of the Board and Chief Executive Officer, Columbia Management Investment Distributors, Inc., since November 2008 and February 2012, respectively;Chairman of the Board and Director, Threadneedle Asset Management Holdings, Sàrl, since March 2013 and December 2008, respectively; senior executive of various entities affiliated with Columbia Threadneedle. |
| Christopher O. Petersen 5228 Ameriprise Financial Center Minneapolis, MN 55474 1970 | Senior Vice President and Assistant Secretary (2021) | Formerly, Trustee/Director of funds within the Columbia Funds Complex, July 1, 2020 - November 22, 2021; Senior Vice President and Assistant General Counsel, Ameriprise Financial, Inc., since September 2021 (previously Vice President and Lead Chief Counsel, January 2015 - September 2021); formerly, President and Principal Executive Officer of the Columbia Funds, 2015 - 2021; officer of Columbia Funds and affiliated funds, since 2007. |
| Thomas P. McGuire 290 Congress Street Boston, MA 02210 1972 | Senior Vice President and Chief Compliance Officer (2012) | Vice President – Asset Management Compliance, Ameriprise Financial, Inc., since May 2010; Chief Compliance Officer, Columbia Acorn/Wanger Funds, since December 2015; formerly, Chief Compliance Officer, Ameriprise Certificate Company, September 2010 – September 2020. |
| Ryan C. Larrenaga 290 Congress Street Boston, MA 02210 1970 | Senior Vice President (2017), Chief Legal Officer (2017), and Secretary (2015) | Vice President and Chief Counsel, Ameriprise Financial, Inc., since August 2018 (previously Vice President and Group Counsel, August 2011 - August 2018); Chief Legal Officer, Columbia Acorn/Wanger Funds, since September 2020; officer of Columbia Funds and affiliated funds, since 2005. |
| Columbia Select Small Cap Value Fund | Annual Report 2023 | 37 |
(Unaudited)
Fund officers (continued)
| Name, address and year of birth | Position and year first appointed to position for any Fund in the Columbia Funds Complex or a predecessor thereof | Principal occupation(s) during past five years |
| Michael E. DeFao 290 Congress Street Boston, MA 02210 1968 | Vice President (2011) and Assistant Secretary (2010) | Vice President and Chief Counsel, Ameriprise Financial, Inc., since May 2010; Vice President, Chief Legal Officer and Assistant Secretary, Columbia Management Investment Advisers, LLC, since October 2021 (previously Vice President and Assistant Secretary, May 2010 – September 2021). |
| Lyn Kephart-Strong 5903 Ameriprise Financial Center Minneapolis, MN 55474 1960 | Vice President (2015) | Vice President, Global Investment Operations Services, Columbia Management Investment Advisers, LLC, since 2010; Director (since January 2007) and President (since October 2014), Columbia Management Investment Services Corp.; Director (since December 2017) and President (since January 2017), Ameriprise Trust Company. |
| • | the Fund had sufficient liquidity to both meet redemptions and operate effectively on behalf of shareholders; |
| • | there were no material changes to the Program during the period; |
| • | the implementation of the Program was effective to manage the Fund’s liquidity risk; and |
| • | the Program operated adequately during the period. |
| 38 | Columbia Select Small Cap Value Fund | Annual Report 2023 |
columbiathreadneedleus.com/investor/. The Fund is distributed by Columbia Management Investment Distributors, Inc., member FINRA, and managed by Columbia Management Investment Advisers, LLC.

May 31, 2023

| 3 | |
| 5 | |
| 7 | |
| 8 | |
| 11 | |
| 13 | |
| 14 | |
| 16 | |
| 20 | |
| 28 | |
| 29 | |
| 29 | |
| 35 |
(Unaudited)

| Average annual total returns (%) (for the period ended May 31, 2023) | |||||
| Inception | 1 Year | 5 Years | 10 Years | ||
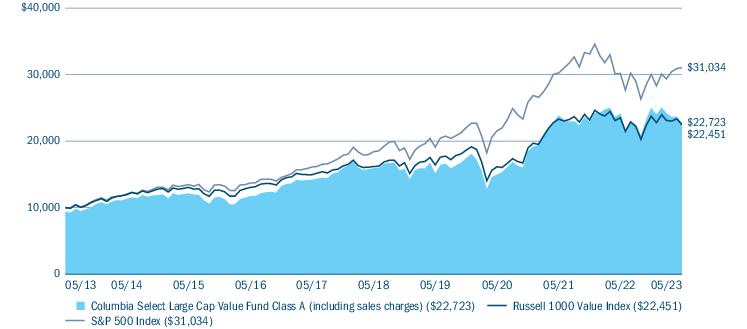
| Class A | Excluding sales charges | 04/25/97 | -5.98 | 7.36 | 9.20 |
| Including sales charges | -11.40 | 6.09 | 8.55 | ||
| Advisor Class | 11/08/12 | -5.76 | 7.62 | 9.47 | |
| Class C | Excluding sales charges | 05/27/99 | -6.68 | 6.56 | 8.38 |
| Including sales charges | -7.61 | 6.56 | 8.38 | ||
| Institutional Class | 09/27/10 | -5.73 | 7.63 | 9.47 | |
| Institutional 2 Class | 11/30/01 | -5.67 | 7.69 | 9.55 | |
| Institutional 3 Class* | 10/01/14 | -5.61 | 7.75 | 9.56 | |
| Class R | 04/30/03 | -6.22 | 7.10 | 8.93 | |
| Russell 1000 Value Index | -4.55 | 6.78 | 8.42 | ||
| S&P 500 Index | 2.92 | 11.01 | 11.99 | ||
| * | The returns shown for periods prior to the share class inception date (including returns for the Life of the Fund, if shown, which are since Fund inception) include the returns of the Fund’s oldest share class. These returns are adjusted to reflect any higher class-related operating expenses of the newer share classes, as applicable. Please visit columbiathreadneedleus.com/investor/investment-products/mutual-funds/appended-performance for more information. |
| Columbia Select Large Cap Value Fund | Annual Report 2023 | 3 |
(Unaudited)
| Portfolio breakdown (%) (at May 31, 2023) | |
| Common Stocks | 96.7 |
| Money Market Funds | 3.2 |
| Preferred Stocks | 0.1 |
| Total | 100.0 |
| Equity sector breakdown (%) (at May 31, 2023) | |
| Communication Services | 6.9 |
| Consumer Discretionary | 3.5 |
| Consumer Staples | 3.1 |
| Energy | 9.8 |
| Financials | 16.4 |
| Health Care | 13.4 |
| Industrials | 9.8 |
| Information Technology | 16.0 |
| Materials | 10.7 |
| Utilities | 10.4 |
| Total | 100.0 |
| 4 | Columbia Select Large Cap Value Fund | Annual Report 2023 |
(Unaudited)
| Columbia Select Large Cap Value Fund | Annual Report 2023 | 5 |
(Unaudited)
| • | The Fund’s underperformance of its benchmark during the period was driven primarily by overall stock selection, particularly within the industrials, health care and communication services sectors. These results more than offset strong stock selection within the utilities and energy sectors. |
| • | Significant individual detractors included telecom provider Verizon Communications, Inc., which fell primarily on competitive pressure; Southwest Airlines Co., which was beset by technology problems with its scheduling systems; and medical supplies provider Baxter International, Inc., which was hurt by cost and supply-chain pressures. |
| • | Overall sector allocation was a positive for relative results, particularly the Fund’s longstanding overweight to the information technology sector as well as underweights to the real estate and financials sectors. Please note that sector variances are a byproduct of the portfolio’s longstanding bottom-up security selection process. |
| • | Top individual contributors included California electric utility PG&E Corp., which continued to execute and become a better company while delivering strong earnings growth (another milestone, in our view, came when the stock was added to the S&P 500 Index); subsea oil equipment and services provider TechnipFMC PLC, which rose on strong contract wins despite the general slowdown in energy; and data analytics provider Teradata Corp., which rose as investors appreciated its solid results in transitioning to a cloud-based platform despite an uneven macro environment. |
| 6 | Columbia Select Large Cap Value Fund | Annual Report 2023 |
(Unaudited)
| December 1, 2022 — May 31, 2023 | |||||||
| Account value at the beginning of the period ($) | Account value at the end of the period ($) | Expenses paid during the period ($) | Fund’s annualized expense ratio (%) | ||||
| Actual | Hypothetical | Actual | Hypothetical | Actual | Hypothetical | Actual | |
| Class A | 1,000.00 | 1,000.00 | 908.50 | 1,020.99 | 3.76 | 3.98 | 0.79 |
| Advisor Class | 1,000.00 | 1,000.00 | 909.60 | 1,022.24 | 2.57 | 2.72 | 0.54 |
| Class C | 1,000.00 | 1,000.00 | 905.00 | 1,017.25 | 7.31 | 7.75 | 1.54 |
| Institutional Class | 1,000.00 | 1,000.00 | 909.60 | 1,022.24 | 2.57 | 2.72 | 0.54 |
| Institutional 2 Class | 1,000.00 | 1,000.00 | 909.90 | 1,022.59 | 2.24 | 2.37 | 0.47 |
| Institutional 3 Class | 1,000.00 | 1,000.00 | 910.30 | 1,022.84 | 2.00 | 2.12 | 0.42 |
| Class R | 1,000.00 | 1,000.00 | 907.30 | 1,019.75 | 4.95 | 5.24 | 1.04 |
| Columbia Select Large Cap Value Fund | Annual Report 2023 | 7 |
May 31, 2023
| Common Stocks 97.3% | ||
| Issuer | Shares | Value ($) |
| Communication Services 6.7% | ||
| Diversified Telecommunication Services 3.9% | ||
| Verizon Communications, Inc. | 2,566,857 | 91,457,115 |
| Interactive Media & Services 2.8% | ||
| Alphabet, Inc., Class A(a) | 526,407 | 64,679,628 |
| Total Communication Services | 156,136,743 | |
| Consumer Discretionary 3.3% | ||
| Broadline Retail 0.1% | ||
| Qurate Retail, Inc.(a) | 2,950,380 | 2,449,110 |
| Specialty Retail 3.2% | ||
| Lowe’s Companies, Inc. | 364,997 | 73,411,847 |
| Total Consumer Discretionary | 75,860,957 | |
| Consumer Staples 3.0% | ||
| Tobacco 3.0% | ||
| Philip Morris International, Inc. | 785,098 | 70,666,671 |
| Total Consumer Staples | 70,666,671 | |
| Energy 9.5% | ||
| Energy Equipment & Services 2.8% | ||
| TechnipFMC PLC(a) | 4,826,863 | 63,424,980 |
| Oil, Gas & Consumable Fuels 6.7% | ||
| Chevron Corp. | 295,698 | 44,538,033 |
| Marathon Petroleum Corp. | 476,372 | 49,976,186 |
| Williams Companies, Inc. (The) | 2,137,710 | 61,266,769 |
| Total | 155,780,988 | |
| Total Energy | 219,205,968 | |
| Financials 16.0% | ||
| Banks 9.8% | ||
| Bank of America Corp. | 1,778,666 | 49,429,128 |
| Citigroup, Inc. | 985,553 | 43,679,709 |
| JPMorgan Chase & Co. | 410,901 | 55,763,375 |
| Wells Fargo & Co. | 1,959,678 | 78,014,781 |
| Total | 226,886,993 | |
| Capital Markets 1.9% | ||
| Morgan Stanley | 527,052 | 43,091,772 |
| Common Stocks (continued) | ||
| Issuer | Shares | Value ($) |
| Insurance 4.3% | ||
| American International Group, Inc. | 988,009 | 52,196,515 |
| MetLife, Inc. | 951,829 | 47,163,127 |
| Total | 99,359,642 | |
| Total Financials | 369,338,407 | |
| Health Care 13.1% | ||
| Health Care Equipment & Supplies 1.9% | ||
| Baxter International, Inc. | 1,081,653 | 44,044,910 |
| Health Care Providers & Services 8.6% | ||
| Centene Corp.(a) | 809,413 | 50,515,465 |
| Cigna Group (The) | 313,080 | 77,459,123 |
| Humana, Inc. | 142,243 | 71,387,494 |
| Total | 199,362,082 | |
| Pharmaceuticals 2.6% | ||
| Bristol-Myers Squibb Co. | 913,445 | 58,862,396 |
| Total Health Care | 302,269,388 | |
| Industrials 9.5% | ||
| Aerospace & Defense 2.9% | ||
| Raytheon Technologies Corp. | 717,240 | 66,086,494 |
| Ground Transportation 2.6% | ||
| CSX Corp. | 1,217,970 | 37,355,140 |
| Union Pacific Corp. | 120,980 | 23,291,069 |
| Total | 60,646,209 | |
| Machinery 1.4% | ||
| Caterpillar, Inc. | 160,793 | 33,083,160 |
| Passenger Airlines 2.6% | ||
| Southwest Airlines Co. | 2,003,095 | 59,832,448 |
| Total Industrials | 219,648,311 | |
| Information Technology 15.6% | ||
| Communications Equipment 4.1% | ||
| Cisco Systems, Inc. | 1,926,495 | 95,689,007 |
| Electronic Equipment, Instruments & Components 2.6% | ||
| Corning, Inc. | 1,935,837 | 59,643,138 |
| 8 | Columbia Select Large Cap Value Fund | Annual Report 2023 |
May 31, 2023
| Common Stocks (continued) | ||
| Issuer | Shares | Value ($) |
| Semiconductors & Semiconductor Equipment 5.8% | ||
| Applied Materials, Inc. | 537,219 | 71,611,293 |
| QUALCOMM, Inc. | 544,056 | 61,701,391 |
| Total | 133,312,684 | |
| Software 3.1% | ||
| Teradata Corp.(a) | 1,516,304 | 71,054,005 |
| Total Information Technology | 359,698,834 | |
| Materials 10.4% | ||
| Chemicals 3.8% | ||
| FMC Corp. | 841,852 | 87,619,956 |
| Metals & Mining 6.6% | ||
| Barrick Gold Corp. | 4,765,938 | 80,449,033 |
| Freeport-McMoRan, Inc. | 2,124,143 | 72,943,071 |
| Total | 153,392,104 | |
| Total Materials | 241,012,060 | |
| Utilities 10.2% | ||
| Electric Utilities 8.4% | ||
| FirstEnergy Corp. | 2,355,455 | 88,070,462 |
| PG&E Corp.(a) | 6,284,585 | 106,460,870 |
| Total | 194,531,332 | |
| Independent Power and Renewable Electricity Producers 1.8% | ||
| AES Corp. (The) | 2,036,739 | 40,205,228 |
| Total Utilities | 234,736,560 | |
| Total Common Stocks (Cost $1,785,392,315) | 2,248,573,899 | |
| Preferred Stocks 0.1% | |||
| Issuer | Shares | Value ($) | |
| Consumer Discretionary 0.1% | |||
| Broadline Retail 0.1% | |||
| Qurate Retail, Inc. | 8.000% | 61,680 | 2,008,918 |
| Total Consumer Discretionary | 2,008,918 | ||
| Total Preferred Stocks (Cost $11,959,555) | 2,008,918 | ||
| Money Market Funds 3.2% | ||
| Shares | Value ($) | |
| Columbia Short-Term Cash Fund, 5.241%(b),(c) | 73,611,449 | 73,574,643 |
| Total Money Market Funds (Cost $73,565,140) | 73,574,643 | |
| Total Investments in Securities (Cost: $1,870,917,010) | 2,324,157,460 | |
| Other Assets & Liabilities, Net | (14,498,585) | |
| Net Assets | 2,309,658,875 | |
| (a) | Non-income producing investment. |
| (b) | The rate shown is the seven-day current annualized yield at May 31, 2023. |
| (c) | As defined in the Investment Company Act of 1940, as amended, an affiliated company is one in which the Fund owns 5% or more of the company’s outstanding voting securities, or a company which is under common ownership or control with the Fund. The value of the holdings and transactions in these affiliated companies during the year ended May 31, 2023 are as follows: |
| Affiliated issuers | Beginning of period($) | Purchases($) | Sales($) | Net change in unrealized appreciation (depreciation)($) | End of period($) | Realized gain (loss)($) | Dividends($) | End of period shares |
| Columbia Short-Term Cash Fund, 5.241% | ||||||||
| 68,145,830 | 456,626,021 | (451,206,711) | 9,503 | 73,574,643 | (15,956) | 3,073,421 | 73,611,449 | |
| Columbia Select Large Cap Value Fund | Annual Report 2023 | 9 |
May 31, 2023
| ■ | Level 1 — Valuations based on quoted prices for investments in active markets that the Fund has the ability to access at the measurement date. Valuation adjustments are not applied to Level 1 investments. |
| ■ | Level 2 — Valuations based on other significant observable inputs (including quoted prices for similar securities, interest rates, prepayment speeds, credit risks, etc.). |
| ■ | Level 3 — Valuations based on significant unobservable inputs (including the Fund’s own assumptions and judgment in determining the fair value of investments). |
| Level 1 ($) | Level 2 ($) | Level 3 ($) | Total ($) | |
| Investments in Securities | ||||
| Common Stocks | ||||
| Communication Services | 156,136,743 | — | — | 156,136,743 |
| Consumer Discretionary | 75,860,957 | — | — | 75,860,957 |
| Consumer Staples | 70,666,671 | — | — | 70,666,671 |
| Energy | 219,205,968 | — | — | 219,205,968 |
| Financials | 369,338,407 | — | — | 369,338,407 |
| Health Care | 302,269,388 | — | — | 302,269,388 |
| Industrials | 219,648,311 | — | — | 219,648,311 |
| Information Technology | 359,698,834 | — | — | 359,698,834 |
| Materials | 241,012,060 | — | — | 241,012,060 |
| Utilities | 234,736,560 | — | — | 234,736,560 |
| Total Common Stocks | 2,248,573,899 | — | — | 2,248,573,899 |
| Preferred Stocks | ||||
| Consumer Discretionary | 2,008,918 | — | — | 2,008,918 |
| Total Preferred Stocks | 2,008,918 | — | — | 2,008,918 |
| Money Market Funds | 73,574,643 | — | — | 73,574,643 |
| Total Investments in Securities | 2,324,157,460 | — | — | 2,324,157,460 |
| 10 | Columbia Select Large Cap Value Fund | Annual Report 2023 |
May 31, 2023
| Assets | |
| Investments in securities, at value | |
| Unaffiliated issuers (cost $1,797,351,870) | $2,250,582,817 |
| Affiliated issuers (cost $73,565,140) | 73,574,643 |
| Receivable for: | |
| Capital shares sold | 2,018,336 |
| Dividends | 5,455,121 |
| Foreign tax reclaims | 47,659 |
| Expense reimbursement due from Investment Manager | 17,859 |
| Prepaid expenses | 8,916 |
| Total assets | 2,331,705,351 |
| Liabilities | |
| Payable for: | |
| Investments purchased | 13,982,588 |
| Capital shares purchased | 7,542,668 |
| Management services fees | 42,747 |
| Distribution and/or service fees | 4,012 |
| Transfer agent fees | 317,576 |
| Compensation of board members | 102,634 |
| Other expenses | 54,251 |
| Total liabilities | 22,046,476 |
| Net assets applicable to outstanding capital stock | $2,309,658,875 |
| Represented by | |
| Paid in capital | 1,853,790,823 |
| Total distributable earnings (loss) | 455,868,052 |
| Total - representing net assets applicable to outstanding capital stock | $2,309,658,875 |
| Columbia Select Large Cap Value Fund | Annual Report 2023 | 11 |
May 31, 2023
| Class A | |
| Net assets | $316,268,538 |
| Shares outstanding | 11,204,057 |
| Net asset value per share | $28.23 |
| Maximum sales charge | 5.75% |
| Maximum offering price per share (calculated by dividing the net asset value per share by 1.0 minus the maximum sales charge for Class A shares) | $29.95 |
| Advisor Class | |
| Net assets | $277,251,854 |
| Shares outstanding | 9,203,830 |
| Net asset value per share | $30.12 |
| Class C | |
| Net assets | $47,988,043 |
| Shares outstanding | 1,899,610 |
| Net asset value per share | $25.26 |
| Institutional Class | |
| Net assets | $1,270,104,139 |
| Shares outstanding | 42,866,286 |
| Net asset value per share | $29.63 |
| Institutional 2 Class | |
| Net assets | $218,820,333 |
| Shares outstanding | 7,381,892 |
| Net asset value per share | $29.64 |
| Institutional 3 Class | |
| Net assets | $142,580,155 |
| Shares outstanding | 4,715,400 |
| Net asset value per share | $30.24 |
| Class R | |
| Net assets | $36,645,813 |
| Shares outstanding | 1,325,662 |
| Net asset value per share | $27.64 |
| 12 | Columbia Select Large Cap Value Fund | Annual Report 2023 |
Year Ended May 31, 2023
| Net investment income | |
| Income: | |
| Dividends — unaffiliated issuers | $54,439,423 |
| Dividends — affiliated issuers | 3,073,421 |
| Interfund lending | 1,062 |
| Foreign taxes withheld | (402,661) |
| Total income | 57,111,245 |
| Expenses: | |
| Management services fees | 15,527,963 |
| Distribution and/or service fees | |
| Class A | 828,781 |
| Class C | 527,104 |
| Class R | 188,596 |
| Transfer agent fees | |
| Class A | 450,203 |
| Advisor Class | 378,405 |
| Class C | 71,570 |
| Institutional Class | 1,744,230 |
| Institutional 2 Class | 113,116 |
| Institutional 3 Class | 8,711 |
| Class R | 51,185 |
| Compensation of board members | 52,403 |
| Custodian fees | 13,335 |
| Printing and postage fees | 121,456 |
| Registration fees | 260,623 |
| Accounting services fees | 30,090 |
| Legal fees | 43,165 |
| Compensation of chief compliance officer | 472 |
| Other | 42,696 |
| Total expenses | 20,454,104 |
| Fees waived or expenses reimbursed by Investment Manager and its affiliates | (6,557,512) |
| Fees waived by transfer agent | |
| Institutional 2 Class | (3,250) |
| Institutional 3 Class | (2,637) |
| Expense reduction | (440) |
| Total net expenses | 13,890,265 |
| Net investment income | 43,220,980 |
| Realized and unrealized gain (loss) — net | |
| Net realized gain (loss) on: | |
| Investments — unaffiliated issuers | 8,926,302 |
| Investments — affiliated issuers | (15,956) |
| Net realized gain | 8,910,346 |
| Net change in unrealized appreciation (depreciation) on: | |
| Investments — unaffiliated issuers | (192,762,928) |
| Investments — affiliated issuers | 9,503 |
| Net change in unrealized appreciation (depreciation) | (192,753,425) |
| Net realized and unrealized loss | (183,843,079) |
| Net decrease in net assets resulting from operations | $(140,622,099) |
| Columbia Select Large Cap Value Fund | Annual Report 2023 | 13 |
| Year Ended May 31, 2023 | Year Ended May 31, 2022 | |
| Operations | ||
| Net investment income | $43,220,980 | $33,584,637 |
| Net realized gain | 8,910,346 | 38,600,950 |
| Net change in unrealized appreciation (depreciation) | (192,753,425) | (38,442,095) |
| Net increase (decrease) in net assets resulting from operations | (140,622,099) | 33,743,492 |
| Distributions to shareholders | ||
| Net investment income and net realized gains | ||
| Class A | (4,641,037) | (18,325,995) |
| Advisor Class | (4,490,415) | (13,300,264) |
| Class C | (370,119) | (2,497,797) |
| Institutional Class | (20,431,294) | (62,299,783) |
| Institutional 2 Class | (4,021,634) | (7,212,872) |
| Institutional 3 Class | (2,072,441) | (9,507,787) |
| Class R | (442,836) | (1,705,831) |
| Total distributions to shareholders | (36,469,776) | (114,850,329) |
| Increase in net assets from capital stock activity | 189,465,036 | 649,934,837 |
| Total increase in net assets | 12,373,161 | 568,828,000 |
| Net assets at beginning of year | 2,297,285,714 | 1,728,457,714 |
| Net assets at end of year | $2,309,658,875 | $2,297,285,714 |
| 14 | Columbia Select Large Cap Value Fund | Annual Report 2023 |
| Year Ended | Year Ended | |||
| May 31, 2023 | May 31, 2022 | |||
| Shares | Dollars ($) | Shares | Dollars ($) | |
| Capital stock activity | ||||
| Class A | ||||
| Subscriptions | 2,992,659 | 87,767,333 | 4,354,921 | 134,050,372 |
| Distributions reinvested | 100,921 | 3,020,565 | 390,889 | 11,679,757 |
| Redemptions | (3,118,453) | (91,693,443) | (2,161,879) | (66,685,107) |
| Net increase (decrease) | (24,873) | (905,545) | 2,583,931 | 79,045,022 |
| Advisor Class | ||||
| Subscriptions | 4,570,708 | 139,173,791 | 3,219,450 | 105,349,538 |
| Distributions reinvested | 136,558 | 4,356,204 | 398,853 | 12,687,523 |
| Redemptions | (2,854,693) | (88,937,384) | (2,242,707) | (73,676,416) |
| Net increase | 1,852,573 | 54,592,611 | 1,375,596 | 44,360,645 |
| Class C | ||||
| Subscriptions | 562,217 | 14,753,016 | 878,514 | 24,361,547 |
| Distributions reinvested | 10,957 | 294,512 | 73,467 | 1,971,851 |
| Redemptions | (748,697) | (19,596,336) | (314,442) | (8,677,966) |
| Net increase (decrease) | (175,523) | (4,548,808) | 637,539 | 17,655,432 |
| Institutional Class | ||||
| Subscriptions | 15,704,346 | 482,407,414 | 24,485,149 | 788,186,172 |
| Distributions reinvested | 496,801 | 15,589,619 | 1,499,157 | 46,923,619 |
| Redemptions | (14,716,124) | (449,490,720) | (12,153,756) | (389,305,336) |
| Net increase | 1,485,023 | 48,506,313 | 13,830,550 | 445,804,455 |
| Institutional 2 Class | ||||
| Subscriptions | 5,115,620 | 160,628,992 | 3,082,044 | 100,264,921 |
| Distributions reinvested | 128,009 | 4,016,933 | 230,277 | 7,207,675 |
| Redemptions | (3,412,112) | (103,272,932) | (1,796,410) | (58,036,116) |
| Net increase | 1,831,517 | 61,372,993 | 1,515,911 | 49,436,480 |
| Institutional 3 Class | ||||
| Subscriptions | 2,250,603 | 70,456,330 | 3,000,498 | 99,180,752 |
| Distributions reinvested | 39,952 | 1,278,860 | 203,825 | 6,504,042 |
| Redemptions | (1,353,118) | (41,972,593) | (3,322,737) | (107,238,483) |
| Net increase (decrease) | 937,437 | 29,762,597 | (118,414) | (1,553,689) |
| Class R | ||||
| Subscriptions | 375,167 | 10,788,779 | 736,352 | 22,388,901 |
| Distributions reinvested | 15,078 | 442,542 | 56,698 | 1,661,253 |
| Redemptions | (376,408) | (10,546,446) | (294,132) | (8,863,662) |
| Net increase | 13,837 | 684,875 | 498,918 | 15,186,492 |
| Total net increase | 5,919,991 | 189,465,036 | 20,324,031 | 649,934,837 |
| Columbia Select Large Cap Value Fund | Annual Report 2023 | 15 |
| Net asset value, beginning of period | Net investment income | Net realized and unrealized gain (loss) | Total from investment operations | Distributions from net investment income | Distributions from net realized gains | Total distributions to shareholders | |
| Class A | |||||||
| Year Ended 5/31/2023 | $30.44 | 0.49 | (2.29) | (1.80) | (0.38) | (0.03) | (0.41) |
| Year Ended 5/31/2022 | $31.85 | 0.45 | (0.05) | 0.40 | (0.56) | (1.25) | (1.81) |
| Year Ended 5/31/2021 | $21.50 | 0.71(d) | 11.57 | 12.28 | (0.60) | (1.33) | (1.93) |
| Year Ended 5/31/2020 | $23.28 | 0.41 | (0.38) | 0.03 | (0.46) | (1.35) | (1.81) |
| Year Ended 5/31/2019 | $25.66 | 0.41 | (1.73) | (1.32) | (0.36) | (0.70) | (1.06) |
| Advisor Class | |||||||
| Year Ended 5/31/2023 | $32.45 | 0.60 | (2.44) | (1.84) | (0.46) | (0.03) | (0.49) |
| Year Ended 5/31/2022 | $33.83 | 0.57 | (0.07) | 0.50 | (0.63) | (1.25) | (1.88) |
| Year Ended 5/31/2021 | $22.74 | 0.82(d) | 12.25 | 13.07 | (0.65) | (1.33) | (1.98) |
| Year Ended 5/31/2020 | $24.52 | 0.49 | (0.40) | 0.09 | (0.52) | (1.35) | (1.87) |
| Year Ended 5/31/2019 | $26.98 | 0.50 | (1.83) | (1.33) | (0.43) | (0.70) | (1.13) |
| Class C | |||||||
| Year Ended 5/31/2023 | $27.25 | 0.24 | (2.05) | (1.81) | (0.15) | (0.03) | (0.18) |
| Year Ended 5/31/2022 | $28.68 | 0.19 | (0.05) | 0.14 | (0.32) | (1.25) | (1.57) |
| Year Ended 5/31/2021 | $19.52 | 0.46(d) | 10.45 | 10.91 | (0.42) | (1.33) | (1.75) |
| Year Ended 5/31/2020 | $21.26 | 0.21 | (0.34) | (0.13) | (0.26) | (1.35) | (1.61) |
| Year Ended 5/31/2019 | $23.49 | 0.20 | (1.57) | (1.37) | (0.16) | (0.70) | (0.86) |
| Institutional Class | |||||||
| Year Ended 5/31/2023 | $31.92 | 0.59 | (2.39) | (1.80) | (0.46) | (0.03) | (0.49) |
| Year Ended 5/31/2022 | $33.31 | 0.55 | (0.06) | 0.49 | (0.63) | (1.25) | (1.88) |
| Year Ended 5/31/2021 | $22.41 | 0.84(d) | 12.04 | 12.88 | (0.65) | (1.33) | (1.98) |
| Year Ended 5/31/2020 | $24.19 | 0.49 | (0.40) | 0.09 | (0.52) | (1.35) | (1.87) |
| Year Ended 5/31/2019 | $26.63 | 0.49 | (1.80) | (1.31) | (0.43) | (0.70) | (1.13) |
| Institutional 2 Class | |||||||
| Year Ended 5/31/2023 | $31.93 | 0.61 | (2.39) | (1.78) | (0.48) | (0.03) | (0.51) |
| Year Ended 5/31/2022 | $33.32 | 0.56 | (0.05) | 0.51 | (0.65) | (1.25) | (1.90) |
| Year Ended 5/31/2021 | $22.42 | 0.91(d) | 11.99 | 12.90 | (0.67) | (1.33) | (2.00) |
| Year Ended 5/31/2020 | $24.20 | 0.50 | (0.40) | 0.10 | (0.53) | (1.35) | (1.88) |
| Year Ended 5/31/2019 | $26.64 | 0.50 | (1.79) | (1.29) | (0.45) | (0.70) | (1.15) |
| 16 | Columbia Select Large Cap Value Fund | Annual Report 2023 |
| Net asset value, end of period | Total return | Total gross expense ratio to average net assets(a) | Total net expense ratio to average net assets(a),(b) | Net investment income ratio to average net assets | Portfolio turnover | Net assets, end of period (000’s) | |
| Class A | |||||||
| Year Ended 5/31/2023 | $28.23 | (5.98%) | 1.08% | 0.80%(c) | 1.67% | 7% | $316,269 |
| Year Ended 5/31/2022 | $30.44 | 1.35% | 1.08% | 0.79%(c) | 1.46% | 8% | $341,762 |
| Year Ended 5/31/2021 | $31.85 | 59.28% | 1.12% | 0.79%(c) | 2.74% | 29% | $275,301 |
| Year Ended 5/31/2020 | $21.50 | (0.98%) | 1.14%(e) | 0.80%(c),(e) | 1.70% | 18% | $187,746 |
| Year Ended 5/31/2019 | $23.28 | (5.09%) | 1.13% | 0.80%(c) | 1.64% | 21% | $218,458 |
| Advisor Class | |||||||
| Year Ended 5/31/2023 | $30.12 | (5.76%) | 0.83% | 0.55%(c) | 1.93% | 7% | $277,252 |
| Year Ended 5/31/2022 | $32.45 | 1.60% | 0.83% | 0.54%(c) | 1.71% | 8% | $238,530 |
| Year Ended 5/31/2021 | $33.83 | 59.64% | 0.87% | 0.54%(c) | 2.99% | 29% | $202,134 |
| Year Ended 5/31/2020 | $22.74 | (0.70%) | 0.89%(e) | 0.55%(c),(e) | 1.96% | 18% | $133,966 |
| Year Ended 5/31/2019 | $24.52 | (4.87%) | 0.88% | 0.55%(c) | 1.89% | 21% | $148,935 |
| Class C | |||||||
| Year Ended 5/31/2023 | $25.26 | (6.68%) | 1.83% | 1.55%(c) | 0.91% | 7% | $47,988 |
| Year Ended 5/31/2022 | $27.25 | 0.59% | 1.83% | 1.54%(c) | 0.70% | 8% | $56,553 |
| Year Ended 5/31/2021 | $28.68 | 58.03% | 1.87% | 1.54%(c) | 1.97% | 29% | $41,236 |
| Year Ended 5/31/2020 | $19.52 | (1.68%) | 1.89%(e) | 1.55%(c),(e) | 0.94% | 18% | $32,781 |
| Year Ended 5/31/2019 | $21.26 | (5.80%) | 1.88% | 1.55%(c) | 0.87% | 21% | $48,824 |
| Institutional Class | |||||||
| Year Ended 5/31/2023 | $29.63 | (5.73%) | 0.83% | 0.55%(c) | 1.92% | 7% | $1,270,104 |
| Year Ended 5/31/2022 | $31.92 | 1.59% | 0.83% | 0.54%(c) | 1.70% | 8% | $1,321,063 |
| Year Ended 5/31/2021 | $33.31 | 59.67% | 0.87% | 0.54%(c) | 3.06% | 29% | $917,729 |
| Year Ended 5/31/2020 | $22.41 | (0.71%) | 0.89%(e) | 0.55%(c),(e) | 1.97% | 18% | $441,521 |
| Year Ended 5/31/2019 | $24.19 | (4.86%) | 0.88% | 0.55%(c) | 1.89% | 21% | $428,080 |
| Institutional 2 Class | |||||||
| Year Ended 5/31/2023 | $29.64 | (5.67%) | 0.75% | 0.47% | 1.99% | 7% | $218,820 |
| Year Ended 5/31/2022 | $31.93 | 1.65% | 0.75% | 0.49% | 1.73% | 8% | $177,246 |
| Year Ended 5/31/2021 | $33.32 | 59.74% | 0.81% | 0.48% | 3.23% | 29% | $134,430 |
| Year Ended 5/31/2020 | $22.42 | (0.66%) | 0.82%(e) | 0.50%(e) | 1.98% | 18% | $28,742 |
| Year Ended 5/31/2019 | $24.20 | (4.80%) | 0.82% | 0.51% | 1.92% | 21% | $39,688 |
| Columbia Select Large Cap Value Fund | Annual Report 2023 | 17 |
| Net asset value, beginning of period | Net investment income | Net realized and unrealized gain (loss) | Total from investment operations | Distributions from net investment income | Distributions from net realized gains | Total distributions to shareholders | |
| Institutional 3 Class | |||||||
| Year Ended 5/31/2023 | $32.56 | 0.64 | (2.44) | (1.80) | (0.49) | (0.03) | (0.52) |
| Year Ended 5/31/2022 | $33.94 | 0.60 | (0.06) | 0.54 | (0.67) | (1.25) | (1.92) |
| Year Ended 5/31/2021 | $22.81 | 0.88(d) | 12.26 | 13.14 | (0.68) | (1.33) | (2.01) |
| Year Ended 5/31/2020 | $24.59 | 0.52 | (0.40) | 0.12 | (0.55) | (1.35) | (1.90) |
| Year Ended 5/31/2019 | $27.05 | 0.53 | (1.83) | (1.30) | (0.46) | (0.70) | (1.16) |
| Class R | |||||||
| Year Ended 5/31/2023 | $29.81 | 0.40 | (2.24) | (1.84) | (0.30) | (0.03) | (0.33) |
| Year Ended 5/31/2022 | $31.24 | 0.37 | (0.05) | 0.32 | (0.50) | (1.25) | (1.75) |
| Year Ended 5/31/2021 | $21.12 | 0.67(d) | 11.33 | 12.00 | (0.55) | (1.33) | (1.88) |
| Year Ended 5/31/2020 | $22.90 | 0.34 | (0.38) | (0.04) | (0.39) | (1.35) | (1.74) |
| Year Ended 5/31/2019 | $25.25 | 0.34 | (1.69) | (1.35) | (0.30) | (0.70) | (1.00) |
| Notes to Financial Highlights | |
| (a) | In addition to the fees and expenses that the Fund bears directly, the Fund indirectly bears a pro rata share of the fees and expenses of any other funds in which it invests. Such indirect expenses are not included in the Fund’s reported expense ratios. |
| (b) | Total net expenses include the impact of certain fee waivers/expense reimbursements made by the Investment Manager and certain of its affiliates, if applicable. |
| (c) | The benefits derived from expense reductions had an impact of less than 0.01%. |
| (d) | Net investment income per share includes special dividends. The per share effect of these dividends amounted to: |
| Year Ended | Class A | Advisor Class | Class C | Institutional Class | Institutional 2 Class | Institutional 3 Class | Class R |
| 05/31/2021 | $0.19 | $0.21 | $0.17 | $0.19 | $0.17 | $0.25 | $0.19 |
| (e) | Ratios include interfund lending expense which is less than 0.01%. |
| 18 | Columbia Select Large Cap Value Fund | Annual Report 2023 |
| Net asset value, end of period | Total return | Total gross expense ratio to average net assets(a) | Total net expense ratio to average net assets(a),(b) | Net investment income ratio to average net assets | Portfolio turnover | Net assets, end of period (000’s) | |
| Institutional 3 Class | |||||||
| Year Ended 5/31/2023 | $30.24 | (5.61%) | 0.70% | 0.42% | 2.05% | 7% | $142,580 |
| Year Ended 5/31/2022 | $32.56 | 1.70% | 0.70% | 0.44% | 1.81% | 8% | $123,025 |
| Year Ended 5/31/2021 | $33.94 | 59.79% | 0.76% | 0.43% | 3.22% | 29% | $132,235 |
| Year Ended 5/31/2020 | $22.81 | (0.60%) | 0.77%(e) | 0.45%(e) | 2.06% | 18% | $87,839 |
| Year Ended 5/31/2019 | $24.59 | (4.76%) | 0.77% | 0.46% | 1.98% | 21% | $149,956 |
| Class R | |||||||
| Year Ended 5/31/2023 | $27.64 | (6.22%) | 1.33% | 1.05%(c) | 1.41% | 7% | $36,646 |
| Year Ended 5/31/2022 | $29.81 | 1.11% | 1.31% | 1.02%(c) | 1.23% | 8% | $39,107 |
| Year Ended 5/31/2021 | $31.24 | 58.97% | 1.32% | 0.99%(c) | 2.62% | 29% | $25,393 |
| Year Ended 5/31/2020 | $21.12 | (1.24%) | 1.39%(e) | 1.05%(c),(e) | 1.43% | 18% | $15,554 |
| Year Ended 5/31/2019 | $22.90 | (5.32%) | 1.38% | 1.05%(c) | 1.39% | 21% | $24,725 |
| Columbia Select Large Cap Value Fund | Annual Report 2023 | 19 |
May 31, 2023
| 20 | Columbia Select Large Cap Value Fund | Annual Report 2023 |
May 31, 2023
| Columbia Select Large Cap Value Fund | Annual Report 2023 | 21 |
May 31, 2023
| 22 | Columbia Select Large Cap Value Fund | Annual Report 2023 |
May 31, 2023
| Effective rate (%) | |
| Class A | 0.14 |
| Advisor Class | 0.14 |
| Class C | 0.14 |
| Institutional Class | 0.14 |
| Institutional 2 Class | 0.05 |
| Institutional 3 Class | 0.00 |
| Class R | 0.14 |
| Columbia Select Large Cap Value Fund | Annual Report 2023 | 23 |
May 31, 2023
| Front End (%) | CDSC (%) | Amount ($) | |
| Class A | 5.75 | 0.50 - 1.00(a) | 373,691 |
| Class C | — | 1.00(b) | 19,107 |
| (a) | This charge is imposed on certain investments of between $1 million and $50 million redeemed within 18 months after purchase, as follows: 1.00% if redeemed within 12 months after purchase, and 0.50% if redeemed more than 12, but less than 18, months after purchase, with certain limited exceptions. |
| (b) | This charge applies to redemptions within 12 months after purchase, with certain limited exceptions. |
| October 1, 2022 through September 30, 2023 | Prior to October 1, 2022 | |
| Class A | 0.80% | 0.80% |
| Advisor Class | 0.55 | 0.55 |
| Class C | 1.55 | 1.55 |
| Institutional Class | 0.55 | 0.55 |
| Institutional 2 Class | 0.47 | 0.49 |
| Institutional 3 Class | 0.42 | 0.44 |
| Class R | 1.05 | 1.05 |
| 24 | Columbia Select Large Cap Value Fund | Annual Report 2023 |
May 31, 2023
| Undistributed net investment income ($) | Accumulated net realized (loss) ($) | Paid in capital ($) |
| (1,806,658) | (1,136,342) | 2,943,000 |
| Year Ended May 31, 2023 | Year Ended May 31, 2022 | ||||
| Ordinary income ($) | Long-term capital gains ($) | Total ($) | Ordinary income ($) | Long-term capital gains ($) | Total ($) |
| 33,865,020 | 2,604,756 | 36,469,776 | 43,115,087 | 71,735,242 | 114,850,329 |
| Undistributed ordinary income ($) | Undistributed long-term capital gains ($) | Capital loss carryforwards ($) | Net unrealized appreciation ($) |
| 18,328,233 | 11,527,996 | — | 426,110,984 |
| Federal tax cost ($) | Gross unrealized appreciation ($) | Gross unrealized (depreciation) ($) | Net unrealized appreciation ($) |
| 1,898,046,476 | 540,609,230 | (114,498,246) | 426,110,984 |
| Columbia Select Large Cap Value Fund | Annual Report 2023 | 25 |
May 31, 2023
| Borrower or lender | Average loan balance ($) | Weighted average interest rate (%) | Number of days with outstanding loans |
| Lender | 1,850,000 | 4.17 | 6 |
| 26 | Columbia Select Large Cap Value Fund | Annual Report 2023 |
May 31, 2023
| Columbia Select Large Cap Value Fund | Annual Report 2023 | 27 |
| 28 | Columbia Select Large Cap Value Fund | Annual Report 2023 |
| Qualified dividend income | Dividends received deduction | Capital gain dividend |
| 100.00% | 100.00% | $13,298,598 |
| Name, address, year of birth | Position held with the Columbia Funds and length of service | Principal occupation(s) during past five years and other relevant professional experience | Number of Funds in the Columbia Funds Complex* overseen | Other directorships held by Trustee during the past five years and other relevant Board experience |
| George S. Batejan c/o Columbia Management Investment Advisers, LLC 290 Congress Street Boston, MA 02210 1954 | Trustee since 2017 | Executive Vice President, Global Head of Technology and Operations, Janus Capital Group, Inc., 2010-2016 | 174 | Former Chairman of the Board, NICSA (National Investment Company Services Association) (Executive Committee, Nominating Committee and Governance Committee), 2014-2016; former Director, Intech Investment Management, 2011-2016; former Board Member, Metro Denver Chamber of Commerce, 2015-2016; former Advisory Board Member, University of Colorado Business School, 2015-2018; former Board Member, Chase Bank International, 1993-1994 |
| Columbia Select Large Cap Value Fund | Annual Report 2023 | 29 |
(Unaudited)
Independent trustees (continued)
| Name, address, year of birth | Position held with the Columbia Funds and length of service | Principal occupation(s) during past five years and other relevant professional experience | Number of Funds in the Columbia Funds Complex* overseen | Other directorships held by Trustee during the past five years and other relevant Board experience |
| Kathleen Blatz c/o Columbia Management Investment Advisers, LLC 290 Congress Street Boston, MA 02210 1954 | Trustee since 2006 | Attorney, specializing in arbitration and mediation; Chief Justice, Minnesota Supreme Court, 1998-2006; Associate Justice, Minnesota Supreme Court, 1996-1998; Fourth Judicial District Court Judge, Hennepin County, 1994-1996; Attorney in private practice and public service, 1984-1993; State Representative, Minnesota House of Representatives, 1979-1993, which included service on the Tax and Financial Institutions and Insurance Committees; Member and Interim Chair, Minnesota Sports Facilities Authority, January-July 2017; Interim President and Chief Executive Officer, Blue Cross and Blue Shield of Minnesota (health care insurance), February-July 2018, April-October 2021 | 174 | Former Trustee, Blue Cross and Blue Shield of Minnesota, 2009-2021 (Chair of the Business Development Committee, 2014-2017; Chair of the Governance Committee, 2017-2019); former Member and Chair of the Board, Minnesota Sports Facilities Authority, January 2017-July 2017; former Director, Robina Foundation, 2009-2020 (Chair, 2014-2020); Director, Richard M. Schulze Family Foundation, since 2021 |
| Pamela G. Carlton c/o Columbia Management Investment Advisers, LLC 290 Congress Street Boston, MA 02210 1954 | Chair since 2023; Trustee since 2007 | President, Springboard — Partners in Cross Cultural Leadership (consulting company), since 2003; Managing Director of US Equity Research, JP Morgan Chase, 1999-2003; Director of US Equity Research, Chase Asset Management, 1996-1999; Co-Director Latin America Research, 1993-1996, COO Global Research, 1992-1996, Co-Director of US Research, 1991-1992, Investment Banker, 1982-1991, Morgan Stanley; Attorney, Cleary Gottlieb Steen & Hamilton LLP, 1980-1982 | 174 | Trustee, New York Presbyterian Hospital Board, since 1996; Director, DR Bank (Audit Committee) since 2017; Director, Evercore Inc. (Audit Committee, Nominating and Governance Committee), since 2019; Director, Apollo Commercial Real Estate Finance, Inc. (Chair, Nominating and Governance Committee) (financial services), since 2021; the Governing Council of the Independent Directors Council (IDC), since 2021 |
| Janet Langford Carrig c/o Columbia Management Investment Advisers, LLC 290 Congress Street Boston, MA 02210 1957 | Trustee since 1996 | Senior Vice President, General Counsel and Corporate Secretary, ConocoPhillips (independent energy company), September 2007-October 2018 | 174 | Director, EQT Corporation (natural gas producer), since 2019; former Director, Whiting Petroleum Corporation (independent oil and gas company), 2020-2022 |
| J. Kevin Connaughton c/o Columbia Management Investment Advisers, LLC 290 Congress Street Boston, MA 02210 1964 | Trustee since 2020 | CEO and President, RhodeWay Financial (non-profit financial planning firm), since December 2022; Member, FINRA National Adjudicatory Council, since January 2020; Adjunct Professor of Finance, Bentley University since January 2018; Consultant to Independent Trustees of CFVIT and CFST I from March 2016 to June 2020 with respect to CFVIT and to December 2020 with respect to CFST I; Managing Director and General Manager of Mutual Fund Products, Columbia Management Investment Advisers, LLC, May 2010-February 2015; President, Columbia Funds, 2008-2015; and senior officer of Columbia Funds and affiliated funds, 2003-2015 | 172 | Former Director, The Autism Project, March 2015-December 2021; former Member of the Investment Committee, St. Michael’s College, November 2015-February 2020; former Trustee, St. Michael’s College, June 2017-September 2019; former Trustee, New Century Portfolios (former mutual fund complex), January 2015-December 2017 |
| 30 | Columbia Select Large Cap Value Fund | Annual Report 2023 |
(Unaudited)
Independent trustees (continued)
| Name, address, year of birth | Position held with the Columbia Funds and length of service | Principal occupation(s) during past five years and other relevant professional experience | Number of Funds in the Columbia Funds Complex* overseen | Other directorships held by Trustee during the past five years and other relevant Board experience |
| Olive M. Darragh c/o Columbia Management Investment Advisers, LLC 290 Congress Street Boston, MA 02210 1962 | Trustee since 2020 | Managing Director of Darragh Inc. (strategy and talent management consulting firm), since 2010; Founder and CEO, Zolio, Inc. (investment management talent identification platform), since 2004; Consultant to Independent Trustees of CFVIT and CFST I from June 2019 to June 2020 with respect to CFVIT and to December 2020 with respect to CFST I; Partner, Tudor Investments, 2004-2010; Senior Partner, McKinsey & Company (consulting), 1990-2004; Touche Ross CPA, 1985-1988 | 172 | Treasurer, Edinburgh University US Trust Board, since January 2023; Member, HBS Community Action Partners Board, since September 2022; former Director, University of Edinburgh Business School (Member of US Board), 2004-2019; former Director, Boston Public Library Foundation, 2008-2017 |
| Patricia M. Flynn c/o Columbia Management Investment Advisers, LLC 290 Congress Street Boston, MA 02210 1950 | Trustee since 2004 | Professor of Economics and Management, Bentley University, since 2002; Dean, McCallum Graduate School of Business, Bentley University, 1992-2002 | 174 | Former Trustee, MA Taxpayers Foundation, 1997-2022; former Director, The MA Business Roundtable, 2003-2019; former Chairperson, Innovation Index Advisory Committee, MA Technology Collaborative, 1997-2020 |
| Brian J. Gallagher c/o Columbia Management Investment Advisers, LLC 290 Congress Street Boston, MA 02210 1954 | Trustee since 2017 | Retired; Partner with Deloitte & Touche LLP and its predecessors, 1977-2016 | 174 | Trustee, Catholic Schools Foundation, since 2004 |
| Douglas A. Hacker c/o Columbia Management Investment Advisers, LLC 290 Congress Street Boston, MA 02210 1955 | Trustee since 1996 | Independent business executive, since May 2006; Executive Vice President – Strategy of United Airlines, December 2002 - May 2006; President of UAL Loyalty Services (airline marketing company), September 2001-December 2002; Executive Vice President and Chief Financial Officer of United Airlines, July 1999-September 2001 | 174 | Director, SpartanNash Company since November 2013 (Chair of the Board, since May 2021) (food distributor); Director, Aircastle Limited (Chair of Audit Committee) (aircraft leasing), since August 2006; former Director, Nash Finch Company (food distributor), 2005-2013; former Director, SeaCube Container Leasing Ltd. (container leasing), 2010-2013; and former Director, Travelport Worldwide Limited (travel information technology), 2014-2019 |
| Nancy T. Lukitsh c/o Columbia Management Investment Advisers, LLC 290 Congress Street Boston, MA 02210 1956 | Trustee since 2011 | Senior Vice President, Partner and Director of Marketing, Wellington Management Company, LLP (investment adviser), 1997-2010; Chair, Wellington Management Portfolios (commingled non-U.S. investment pools), 2007-2010; Director, Wellington Trust Company, NA and other Wellington affiliates, 1997-2010 | 172 | None |
| Columbia Select Large Cap Value Fund | Annual Report 2023 | 31 |
(Unaudited)
Independent trustees (continued)
| Name, address, year of birth | Position held with the Columbia Funds and length of service | Principal occupation(s) during past five years and other relevant professional experience | Number of Funds in the Columbia Funds Complex* overseen | Other directorships held by Trustee during the past five years and other relevant Board experience |
| David M. Moffett c/o Columbia Management Investment Advisers, LLC 290 Congress Street Boston, MA 02210 1952 | Trustee since 2011 | Retired; former Chief Executive Officer of Freddie Mac and Chief Financial Officer of U.S. Bank | 172 | Director, CSX Corporation (transportation suppliers); Director, PayPal Holdings Inc. (payment and data processing services); Trustee, University of Oklahoma Foundation; former Director, eBay Inc. (online trading community), 2007-2015; and former Director, CIT Bank, CIT Group Inc. (commercial and consumer finance), 2010-2016; former Senior Adviser to The Carlyle Group (financial services), March 2008-September 2008; former Governance Consultant to Bridgewater Associates, January 2013-December 2015 |
| Catherine James Paglia c/o Columbia Management Investment Advisers, LLC 290 Congress Street Boston, MA 02210 1952 | Trustee since 2004 | Director, Enterprise Asset Management, Inc. (private real estate and asset management company), since September 1998; Managing Director and Partner, Interlaken Capital, Inc., 1989-1997; Vice President, 1982-1985, Principal, 1985-1987, Managing Director, 1987-1989, Morgan Stanley; Vice President, Investment Banking, 1980-1982, Associate, Investment Banking, 1976-1980, Dean Witter Reynolds, Inc. | 174 | Director, Valmont Industries, Inc. (irrigation systems manufacturer), since 2012; Trustee, Carleton College (on the Investment Committee), since 1987; Trustee, Carnegie Endowment for International Peace (on the Investment Committee), since 2009 |
| Natalie A. Trunow c/o Columbia Management Investment Advisers, LLC 290 Congress Street Boston, MA 02210 1967 | Trustee since 2020 | Chief Executive Officer, Millennial Portfolio Solutions LLC (asset management and consulting services), January 2016-January 2021; Non-executive Member of the Investment Committee and Valuation Committee, Sarona Asset Management Inc. (private equity firm) since September 2019; Advisor, Horizon Investments (asset management and consulting services), August 2018-January 2022; Advisor, Paradigm Asset Management, November 2016-January 2022; Consultant to Independent Trustees of CFVIT and CFST I from September 2016 to June 2020 with respect to CFVIT and to December 2020 with respect to CFST I; Director of Investments/Consultant, Casey Family Programs, April 2016-November 2016; Senior Vice President and Chief Investment Officer, Calvert Investments, August 2008-January 2016; Section Head and Portfolio Manager, General Motors Asset Management, June 1997-August 2008 | 172 | Independent Director, Investment Committee, Health Services for Children with Special Needs, Inc., 2010-2021; Independent Director, (Executive Committee and Chair, Audit Committee), Consumer Credit Counseling Services (formerly Guidewell Financial Solutions), since 2016; Independent Director, (Investment Committee), Sarona Asset Management, since 2019 |
| 32 | Columbia Select Large Cap Value Fund | Annual Report 2023 |
(Unaudited)
Independent trustees (continued)
| Name, address, year of birth | Position held with the Columbia Funds and length of service | Principal occupation(s) during past five years and other relevant professional experience | Number of Funds in the Columbia Funds Complex* overseen | Other directorships held by Trustee during the past five years and other relevant Board experience |
| Sandra L. Yeager c/o Columbia Management Investment Advisers, LLC 290 Congress Street Boston, MA 02210 1964 | Trustee since 2017 | Retired; President and founder, Hanoverian Capital, LLC (SEC registered investment advisor firm), 2008-2016; Managing Director, DuPont Capital, 2006-2008; Managing Director, Morgan Stanley Investment Management, 2004-2006; Senior Vice President, Alliance Bernstein, 1990-2004 | 174 | Former Director, NAPE (National Alliance for Partnerships in Equity) Education Foundation, October 2016-October 2020; Advisory Board, Jennersville YMCA, since 2022 |
| Name, address, year of birth | Position held with the Columbia Funds and length of service | Principal occupation(s) during the past five years and other relevant professional experience | Number of Funds in the Columbia Funds Complex overseen | Other directorships held by Trustee during the past five years and other relevant Board experience |
| Daniel J. Beckman c/o Columbia Management Investment Advisers, LLC 290 Congress Street Boston, MA 02210 1962 | Trustee since November 2021 and President since June 2021 | Vice President – Head of North America Product, Columbia Management Investment Advisers, LLC, since April 2015; President and Principal Executive Officer of the Columbia Funds, since June 2021; officer of Columbia Funds and affiliated funds, 2020-2021 | 174 | Director, Ameriprise Trust Company, since October 2016; Director, Columbia Management Investment Distributors, Inc. since November 2018; Board of Governors, Columbia Wanger Asset Management, LLC since, January 2022; Director, Columbia Threadneedle Canada, Inc., since December 2022 |
| * | The term “Columbia Funds Complex” as used herein includes Columbia Seligman Premium Technology Growth Fund, Tri-Continental Corporation and each series of Columbia Funds Series Trust (CFST), Columbia Funds Series Trust I (CFST I), Columbia Funds Series Trust II (CFST II), Columbia ETF Trust I (CET I), Columbia ETF Trust II (CET II), Columbia Funds Variable Insurance Trust (CFVIT) and Columbia Funds Variable Series Trust II (CFVST II). Messrs. Batejan, Beckman, Gallagher and Hacker and Mses. Blatz, Carlton, Carrig, Flynn, Paglia, and Yeager serve as directors of Columbia Seligman Premium Technology Growth Fund and Tri-Continental Corporation. |
| ** | Interested person (as defined under the 1940 Act) by reason of being an officer, director, security holder and/or employee of the Investment Manager or Ameriprise Financial. |
| Columbia Select Large Cap Value Fund | Annual Report 2023 | 33 |
(Unaudited)
The Board has appointed officers who are responsible for day-to-day business decisions based on policies it has established. The officers serve at the pleasure of the Board. The following table provides basic information about the Officers of the Fund as of the printing of this report, including principal occupations during the past five years, although their specific titles may have varied over the period. In addition to Mr. Beckman, who is President and Principal Executive Officer, the Fund’s other officers are:
| Name, address and year of birth | Position and year first appointed to position for any Fund in the Columbia Funds Complex or a predecessor thereof | Principal occupation(s) during past five years |
| Michael G. Clarke 290 Congress Street Boston, MA 02210 1969 | Chief Financial Officer and Principal Financial Officer (2009) and Senior Vice President (2019) | Senior Vice President and North America Head of Operations & Investor Services, Columbia Management Investment Advisers, LLC, since June 2023 (previously Senior Vice President and Head of Global Operations, March 2022 – June 2023, Vice President, Head of North America Operations, and Co-Head of Global Operations, June 2019 - February 2022 and Vice President – Accounting and Tax, May 2010 - May 2019); senior officer of Columbia Funds and affiliated funds, since 2002. Director, Ameriprise Trust Company, since June 2023. |
| Joseph Beranek 5890 Ameriprise Financial Center Minneapolis, MN 55474 1965 | Treasurer and Chief Accounting Officer (Principal Accounting Officer) (2019) and Principal Financial Officer (2020), CFST, CFST I, CFST II, CFVIT and CFVST II; Assistant Treasurer, CET I and CET II | Vice President – Mutual Fund Accounting and Financial Reporting, Columbia Management Investment Advisers, LLC, since December 2018 and March 2017, respectively. |
| Marybeth Pilat 290 Congress Street Boston, MA 02210 1968 | Treasurer and Chief Accounting Officer (Principal Accounting Officer) and Principal Financial Officer (2020) for CET I and CET II; Assistant Treasurer, CFST, CFST I, CFST II, CFVIT and CFVST II | Vice President – Product Pricing and Administration, Columbia Management Investment Advisers, LLC, since May 2017. |
| William F. Truscott 290 Congress Street Boston, MA 02210 1960 | Senior Vice President (2001) | Formerly, Trustee/Director of Columbia Funds Complex or legacy funds, November 2001 - January 1, 2021; Chief Executive Officer, Global Asset Management, Ameriprise Financial, Inc., since September 2012; Chairman of the Board and President, Columbia Management Investment Advisers, LLC, since July 2004 and February 2012, respectively; Chairman of the Board and Chief Executive Officer, Columbia Management Investment Distributors, Inc., since November 2008 and February 2012, respectively;Chairman of the Board and Director, Threadneedle Asset Management Holdings, Sàrl, since March 2013 and December 2008, respectively; senior executive of various entities affiliated with Columbia Threadneedle. |
| Christopher O. Petersen 5228 Ameriprise Financial Center Minneapolis, MN 55474 1970 | Senior Vice President and Assistant Secretary (2021) | Formerly, Trustee/Director of funds within the Columbia Funds Complex, July 1, 2020 - November 22, 2021; Senior Vice President and Assistant General Counsel, Ameriprise Financial, Inc., since September 2021 (previously Vice President and Lead Chief Counsel, January 2015 - September 2021); formerly, President and Principal Executive Officer of the Columbia Funds, 2015 - 2021; officer of Columbia Funds and affiliated funds, since 2007. |
| Thomas P. McGuire 290 Congress Street Boston, MA 02210 1972 | Senior Vice President and Chief Compliance Officer (2012) | Vice President – Asset Management Compliance, Ameriprise Financial, Inc., since May 2010; Chief Compliance Officer, Columbia Acorn/Wanger Funds, since December 2015; formerly, Chief Compliance Officer, Ameriprise Certificate Company, September 2010 – September 2020. |
| Ryan C. Larrenaga 290 Congress Street Boston, MA 02210 1970 | Senior Vice President (2017), Chief Legal Officer (2017), and Secretary (2015) | Vice President and Chief Counsel, Ameriprise Financial, Inc., since August 2018 (previously Vice President and Group Counsel, August 2011 - August 2018); Chief Legal Officer, Columbia Acorn/Wanger Funds, since September 2020; officer of Columbia Funds and affiliated funds, since 2005. |
| 34 | Columbia Select Large Cap Value Fund | Annual Report 2023 |
(Unaudited)
Fund officers (continued)
| Name, address and year of birth | Position and year first appointed to position for any Fund in the Columbia Funds Complex or a predecessor thereof | Principal occupation(s) during past five years |
| Michael E. DeFao 290 Congress Street Boston, MA 02210 1968 | Vice President (2011) and Assistant Secretary (2010) | Vice President and Chief Counsel, Ameriprise Financial, Inc., since May 2010; Vice President, Chief Legal Officer and Assistant Secretary, Columbia Management Investment Advisers, LLC, since October 2021 (previously Vice President and Assistant Secretary, May 2010 – September 2021). |
| Lyn Kephart-Strong 5903 Ameriprise Financial Center Minneapolis, MN 55474 1960 | Vice President (2015) | Vice President, Global Investment Operations Services, Columbia Management Investment Advisers, LLC, since 2010; Director (since January 2007) and President (since October 2014), Columbia Management Investment Services Corp.; Director (since December 2017) and President (since January 2017), Ameriprise Trust Company. |
| • | the Fund had sufficient liquidity to both meet redemptions and operate effectively on behalf of shareholders; |
| • | there were no material changes to the Program during the period; |
| • | the implementation of the Program was effective to manage the Fund’s liquidity risk; and |
| • | the Program operated adequately during the period. |
| Columbia Select Large Cap Value Fund | Annual Report 2023 | 35 |
columbiathreadneedleus.com/investor/. The Fund is distributed by Columbia Management Investment Distributors, Inc., member FINRA, and managed by Columbia Management Investment Advisers, LLC.

May 31, 2023

| 3 | |
| 5 | |
| 7 | |
| 8 | |
| 21 | |
| 23 | |
| 24 | |
| 26 | |
| 30 | |
| 47 | |
| 48 | |
| 48 | |
| 54 |
(Unaudited)
| Average annual total returns (%) (for the period ended May 31, 2023) | |||||
| Inception | 1 Year | 5 Years | 10 Years | ||
| Class A | Excluding sales charges | 02/14/02 | -7.78 | -0.73 | 0.64 |
| Including sales charges | -10.55 | -1.35 | 0.34 | ||
| Advisor Class | 11/08/12 | -7.56 | -0.49 | 0.89 | |
| Class C | Excluding sales charges | 02/14/02 | -8.45 | -1.48 | -0.11 |
| Including sales charges | -9.35 | -1.48 | -0.11 | ||
| Institutional Class | 09/27/10 | -7.56 | -0.45 | 0.89 | |
| Institutional 2 Class | 11/08/12 | -7.47 | -0.40 | 0.98 | |
| Institutional 3 Class* | 10/01/14 | -7.42 | -0.32 | 0.99 | |
| Class R* | 03/01/16 | -8.02 | -0.95 | 0.37 | |
| Bloomberg U.S. Mortgage-Backed Securities Index | -2.68 | 0.12 | 1.08 | ||
| * | The returns shown for periods prior to the share class inception date (including returns for the Life of the Fund, if shown, which are since Fund inception) include the returns of the Fund’s oldest share class. Since the Fund launched more than one share class at its inception, Class A shares were used. These returns are adjusted to reflect any higher class-related operating expenses of the newer share classes, as applicable. Please visit columbiathreadneedleus.com/investor/investment-products/mutual-funds/appended-performance for more information. |
| Columbia Quality Income Fund | Annual Report 2023 | 3 |
(Unaudited)
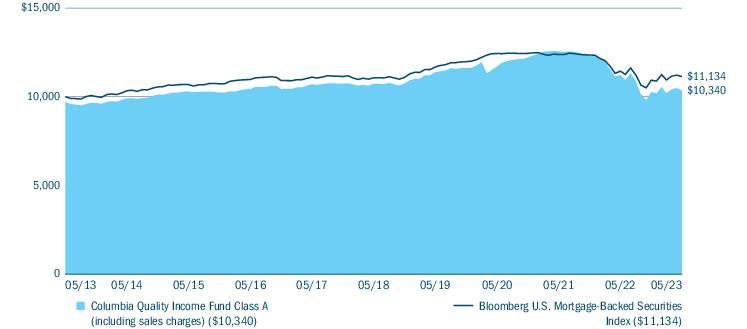
| Portfolio breakdown (%) (at May 31, 2023) | |
| Asset-Backed Securities — Non-Agency | 10.9 |
| Call Option Contracts Purchased | 0.7 |
| Commercial Mortgage-Backed Securities - Agency | 2.2 |
| Commercial Mortgage-Backed Securities - Non-Agency | 5.5 |
| Money Market Funds | 2.0 |
| Put Option Contracts Purchased | 0.1 |
| Residential Mortgage-Backed Securities - Agency | 64.2 |
| Residential Mortgage-Backed Securities - Non-Agency | 14.4 |
| Total | 100.0 |
| Quality breakdown (%) (at May 31, 2023) | |
| AAA rating | 69.2 |
| AA rating | 4.4 |
| A rating | 7.8 |
| BBB rating | 9.4 |
| BB rating | 2.5 |
| B rating | 1.6 |
| CCC rating | 0.4 |
| Not rated | 4.7 |
| Total | 100.0 |
| 4 | Columbia Quality Income Fund | Annual Report 2023 |
(Unaudited)
| • | The Fund’s positioning over the period with respect to overall portfolio duration and corresponding interest rate sensitivity was, by a wide margin, the leading detractor from performance relative to the benchmark. Specifically, the Fund’s above-benchmark duration stance constrained returns as Treasury yields finished the period higher. |
| • | The Fund’s allocation to commercial MBS weighed on performance, as higher borrowing costs negatively impacted commercial real estate profitability and pressured spreads wider for the sector, most notably with respect to office properties. |
| • | The Fund’s positioning within non-agency MBS contributed positively to performance versus the benchmark. Fundamentals for the sector held up better than for most other credit-oriented areas of the market, supported by continued relative strength in the housing market despite higher borrowing costs given the rise in Treasury yields. |
| Columbia Quality Income Fund | Annual Report 2023 | 5 |
(Unaudited)
| • | The Fund’s positioning within pass-through agency MBS contributed positively to performance versus the benchmark. In terms of selection, the Fund was underweight the current, lower-coupon mortgage pools that were most negatively impacted as the Fed moved to end its bond purchase program. The Fund increased its allocation to the agency MBS sector as valuations became notably attractive relative to historical levels. |
| • | Within asset-backed securities, a focus on the higher end of the capital structure allowed the Fund to earn attractive income while benefiting from relative price stability as investors valued a degree of protection against a potential recession. |
| 6 | Columbia Quality Income Fund | Annual Report 2023 |
(Unaudited)
| December 1, 2022 — May 31, 2023 | |||||||
| Account value at the beginning of the period ($) | Account value at the end of the period ($) | Expenses paid during the period ($) | Fund’s annualized expense ratio (%) | ||||
| Actual | Hypothetical | Actual | Hypothetical | Actual | Hypothetical | Actual | |
| Class A | 1,000.00 | 1,000.00 | 1,007.40 | 1,020.24 | 4.70 | 4.73 | 0.94 |
| Advisor Class | 1,000.00 | 1,000.00 | 1,008.60 | 1,021.49 | 3.46 | 3.48 | 0.69 |
| Class C | 1,000.00 | 1,000.00 | 1,003.60 | 1,016.50 | 8.44 | 8.50 | 1.69 |
| Institutional Class | 1,000.00 | 1,000.00 | 1,008.60 | 1,021.49 | 3.46 | 3.48 | 0.69 |
| Institutional 2 Class | 1,000.00 | 1,000.00 | 1,009.10 | 1,021.94 | 3.01 | 3.02 | 0.60 |
| Institutional 3 Class | 1,000.00 | 1,000.00 | 1,009.30 | 1,022.19 | 2.76 | 2.77 | 0.55 |
| Class R | 1,000.00 | 1,000.00 | 1,006.10 | 1,019.00 | 5.95 | 5.99 | 1.19 |
| Columbia Quality Income Fund | Annual Report 2023 | 7 |
May 31, 2023
| Asset-Backed Securities — Non-Agency 15.1% | ||||
| Issuer | Coupon Rate | Principal Amount ($) | Value ($) | |
| Affirm Asset Securitization Trust(a) | ||||
| Series 2023-A Class 1A | ||||
| 01/18/2028 | 6.610% | 11,000,000 | 10,991,461 | |
| Apidos CLO XXVIII(a),(b) | ||||
| Series 2017-28A Class B | ||||
| 3-month USD LIBOR + 1.700% Floor 1.700% 01/20/2031 | 6.950% | 8,000,000 | 7,585,656 | |
| Carlyle Global Market Strategies CLO Ltd.(a),(b) | ||||
| Series 2013-3A Class BR | ||||
| 3-month USD LIBOR + 1.700% Floor 1.700% 10/15/2030 | 6.960% | 6,750,000 | 6,378,892 | |
| Series 2013-4A Class BRR | ||||
| 3-month USD LIBOR + 1.420% Floor 1.420% 01/15/2031 | 6.680% | 14,725,000 | 14,106,300 | |
| Lendingpoint Asset Securitization Trust(a) | ||||
| Series 2022-C Class A | ||||
| 02/15/2030 | 6.560% | 5,391,815 | 5,382,415 | |
| LendingPoint Asset Securitization Trust(a) | ||||
| Subordinated Series 2021-A Class B | ||||
| 12/15/2028 | 1.460% | 459,741 | 458,526 | |
| LL ABS Trust(a) | ||||
| Series 2021-1A Class A | ||||
| 05/15/2029 | 1.070% | 2,178,438 | 2,123,114 | |
| Madison Park Funding XVIII Ltd.(a),(b) | ||||
| Series 2015-18A Class CRR | ||||
| 3-month USD LIBOR + 1.900% Floor 1.900% 10/21/2030 | 7.161% | 17,075,000 | 16,240,101 | |
| Marlette Funding Trust(a) | ||||
| Series 2023-2A Class A | ||||
| 06/15/2033 | 6.040% | 3,700,000 | 3,691,513 | |
| Subordinated Series 2022-3A Class B | ||||
| 11/15/2032 | 5.950% | 2,000,000 | 1,984,561 | |
| Netcredit Combined Receivables LLC(a),(c) | ||||
| Series 2023-A Class A | ||||
| 12/20/2027 | 7.780% | 2,983,825 | 2,953,987 | |
| OZLM Funding IV Ltd.(a),(b) | ||||
| Series 2013-4A Class D2R | ||||
| 3-month USD LIBOR + 7.250% Floor 7.250% 10/22/2030 | 12.523% | 2,750,000 | 2,222,404 | |
| OZLM XI Ltd.(a),(b) | ||||
| Series 2015-11A Class A2R | ||||
| 3-month USD LIBOR + 1.750% 10/30/2030 | 7.049% | 7,000,000 | 6,793,913 | |
| Asset-Backed Securities — Non-Agency (continued) | ||||
| Issuer | Coupon Rate | Principal Amount ($) | Value ($) | |
| Pagaya AI Debt Selection Trust(a) | ||||
| Series 2021-1 Class A | ||||
| 11/15/2027 | 1.180% | 352,230 | 350,508 | |
| Series 2021-1 Class B | ||||
| 11/15/2027 | 2.130% | 8,846,353 | 8,622,914 | |
| Series 2021-2 Class NOTE | ||||
| 01/25/2029 | 3.000% | 3,215,785 | 3,035,948 | |
| Series 2021-5 Class A | ||||
| 08/15/2029 | 1.530% | 2,845,331 | 2,786,137 | |
| Subordinated Series 2021-3 Class B | ||||
| 05/15/2029 | 1.740% | 4,549,752 | 4,261,327 | |
| Pagaya AI Debt Trust(a) | ||||
| Series 2022-5 Class A | ||||
| 06/17/2030 | 8.096% | 7,372,958 | 7,448,415 | |
| Series 2023-3 Class A | ||||
| 12/16/2030 | 7.600% | 5,900,000 | 5,917,600 | |
| Subordinated Series 2022-1 Class B | ||||
| 10/15/2029 | 3.344% | 9,998,678 | 9,277,170 | |
| Subordinated Series 2022-3 Class B | ||||
| 03/14/2030 | 8.050% | 4,999,515 | 5,003,019 | |
| Subordinated Series 2023-1 Class B | ||||
| 07/15/2030 | 9.435% | 4,000,000 | 3,967,883 | |
| Palmer Square Loan Funding Ltd.(a),(b) | ||||
| Series 2020-4A Class D | ||||
| 3-month USD LIBOR + 7.050% Floor 7.050% 11/25/2028 | 12.446% | 3,000,000 | 2,879,022 | |
| Series 2021-4A Class B | ||||
| 3-month USD LIBOR + 1.750% Floor 1.750% 10/15/2029 | 7.010% | 12,000,000 | 11,338,884 | |
| Research-Driven Pagaya Motor Asset Trust IV(a) | ||||
| Series 2021-2A Class A | ||||
| 03/25/2030 | 2.650% | 4,674,678 | 4,133,397 | |
| RR 1 LLC(a),(b) | ||||
| Series 2017-1A Class A2B | ||||
| 3-month USD LIBOR + 1.600% Floor 1.600% 07/15/2035 | 6.860% | 7,800,000 | 7,483,203 | |
| RR 3 Ltd.(a),(b) | ||||
| Series 2014-14A Class A2R2 | ||||
| 3-month USD LIBOR + 1.400% Floor 1.400% 01/15/2030 | 6.660% | 6,500,000 | 6,345,254 | |
| 8 | Columbia Quality Income Fund | Annual Report 2023 |
May 31, 2023
| Asset-Backed Securities — Non-Agency (continued) | ||||
| Issuer | Coupon Rate | Principal Amount ($) | Value ($) | |
| Sound Point IV-R CLO Ltd.(a),(b) | ||||
| Series 2013-3RA Class B | ||||
| 3-month USD LIBOR + 1.750% Floor 1.750% 04/18/2031 | 7.012% | 10,000,000 | 9,557,970 | |
| Theorem Funding Trust(a) | ||||
| Series 2022-3A Class A | ||||
| 04/15/2029 | 7.600% | 3,678,921 | 3,700,452 | |
| Series 2023-1A Class A | ||||
| 04/15/2029 | 7.580% | 7,210,390 | 7,224,566 | |
| Subordinated Series 2021-1A Class B | ||||
| 12/15/2027 | 1.840% | 4,000,000 | 3,814,060 | |
| Subordinated Series 2022-1A Class B | ||||
| 02/15/2028 | 3.100% | 9,670,000 | 9,099,540 | |
| Upstart Pass-Through Trust(a) | ||||
| Series 2021-ST1 Class A | ||||
| 02/20/2027 | 2.750% | 1,512,096 | 1,459,597 | |
| Series 2021-ST8 Class A | ||||
| 10/20/2029 | 1.750% | 3,650,181 | 3,449,379 | |
| Series 2021-ST9 Class A | ||||
| 11/20/2029 | 1.700% | 2,842,533 | 2,729,678 | |
| Upstart Securitization Trust(a) | ||||
| Series 2023-1 Class A | ||||
| 02/20/2033 | 6.590% | 2,969,716 | 2,946,551 | |
| Subordinated Series 2021-2 Class B | ||||
| 06/20/2031 | 1.750% | 4,000,000 | 3,878,875 | |
| Total Asset-Backed Securities — Non-Agency (Cost $219,117,394) | 211,624,192 | |||
| Commercial Mortgage-Backed Securities - Agency 3.0% | ||||
| Federal National Mortgage Association(d) | ||||
| Series 2017-M15 Class ATS2 | ||||
| 11/25/2027 | 3.154% | 12,812,739 | 12,166,799 | |
| Federal National Mortgage Association | ||||
| Series 2017-T1 Class A | ||||
| 06/25/2027 | 2.898% | 17,873,935 | 16,741,337 | |
| FRESB Mortgage Trust(d) | ||||
| Series 2018-SB45 Class A10F (FHLMC) | ||||
| 11/25/2027 | 3.160% | 6,433,141 | 6,132,293 | |
| Government National Mortgage Association(d),(e) | ||||
| Series 2019-102 Class IB | ||||
| 03/16/2060 | 0.834% | 12,932,566 | 734,964 | |
| Series 2019-109 Class IO | ||||
| 04/16/2060 | 0.803% | 24,303,866 | 1,338,229 | |
| Series 2019-118 Class IO | ||||
| 06/16/2061 | 0.811% | 19,643,929 | 947,841 | |
| Series 2019-131 Class IO | ||||
| 07/16/2061 | 0.802% | 25,258,055 | 1,371,518 | |
| Commercial Mortgage-Backed Securities - Agency (continued) | ||||
| Issuer | Coupon Rate | Principal Amount ($) | Value ($) | |
| Series 2019-134 Class IO | ||||
| 08/16/2061 | 0.652% | 17,295,206 | 751,918 | |
| Series 2019-139 Class IO | ||||
| 11/16/2061 | 0.636% | 19,576,884 | 856,598 | |
| Series 2020-19 Class IO | ||||
| 12/16/2061 | 0.694% | 19,405,531 | 1,013,842 | |
| Series 2020-3 Class IO | ||||
| 02/16/2062 | 0.615% | 19,234,053 | 887,982 | |
| Total Commercial Mortgage-Backed Securities - Agency (Cost $59,788,824) | 42,943,321 | |||
| Commercial Mortgage-Backed Securities - Non-Agency 7.6% | ||||
| BX Trust(a),(b) | ||||
| Series 2018-GW Class D | ||||
| 1-month USD LIBOR + 1.770% Floor 1.770% 05/15/2037 | 6.877% | 3,830,000 | 3,754,060 | |
| Credit Suisse Mortgage Capital Certificates OA LLC(a) | ||||
| Subordinated Series 2014-USA Class E | ||||
| 09/15/2037 | 4.373% | 10,400,000 | 5,503,263 | |
| Subordinated Series 2014-USA Class F | ||||
| 09/15/2037 | 4.373% | 4,050,000 | 1,584,630 | |
| Extended Stay America Trust(a),(b) | ||||
| Series 2021-ESH Class D | ||||
| 1-month USD LIBOR + 2.250% Floor 2.250% 07/15/2038 | 7.357% | 5,842,620 | 5,667,357 | |
| Hilton USA Trust(a),(d) | ||||
| Series 2016-HHV Class D | ||||
| 11/05/2038 | 4.194% | 8,395,000 | 7,730,542 | |
| Series 2016-HHV Class F | ||||
| 11/05/2038 | 4.194% | 15,500,000 | 13,821,840 | |
| Hilton USA Trust(a) | ||||
| Subordinated Series 2016-SFP Class D | ||||
| 11/05/2035 | 4.927% | 5,000,000 | 3,804,728 | |
| Subordinated Series 2016-SFP Class F | ||||
| 11/05/2035 | 6.155% | 8,700,000 | 5,754,238 | |
| Home Partners of America Trust(a) | ||||
| Subordinated Series 2021-2 Class B | ||||
| 12/17/2026 | 2.302% | 19,312,786 | 17,146,651 | |
| JPMorgan Chase Commercial Mortgage Securities Trust(a),(b) | ||||
| Subordinated Series 2021-HTL5 Class D | ||||
| 1-month USD LIBOR + 2.515% Floor 2.515% 11/15/2038 | 7.622% | 6,990,000 | 6,736,605 | |
| Morgan Stanley Capital I Trust(a),(d) | ||||
| Series 2019-MEAD Class D | ||||
| 11/10/2036 | 3.283% | 5,500,000 | 4,848,292 | |
| Columbia Quality Income Fund | Annual Report 2023 | 9 |
May 31, 2023
| Commercial Mortgage-Backed Securities - Non-Agency (continued) | ||||
| Issuer | Coupon Rate | Principal Amount ($) | Value ($) | |
| Progress Residential Trust(a) | ||||
| Series 2019-SFR4 Class E | ||||
| 10/17/2036 | 3.435% | 11,000,000 | 10,332,848 | |
| Series 2020-SFR1 Class E | ||||
| 04/17/2037 | 3.032% | 8,000,000 | 7,428,988 | |
| Subordinated Series 2019-SFR3 Class E | ||||
| 09/17/2036 | 3.369% | 5,000,000 | 4,756,154 | |
| Subordinated Series 2019-SFR3 Class F | ||||
| 09/17/2036 | 3.867% | 2,604,000 | 2,483,226 | |
| Wells Fargo Commercial Mortgage Trust(a),(b) | ||||
| Series 2021-FCMT Class D | ||||
| 1-month USD LIBOR + 3.500% Floor 3.500% 05/15/2031 | 8.607% | 6,225,000 | 5,540,408 | |
| Total Commercial Mortgage-Backed Securities - Non-Agency (Cost $120,907,311) | 106,893,830 | |||
| Residential Mortgage-Backed Securities - Agency 88.3% | ||||
| Fannie Mae REMICS | ||||
| CMO Series 2018-7 Class CD | ||||
| 02/25/2048 | 3.000% | 17,191,442 | 15,630,227 | |
| Federal Home Loan Mortgage Corp. | ||||
| 10/01/2024- 06/01/2039 | 5.000% | 2,303,507 | 2,327,123 | |
| 06/01/2030 | 5.500% | 1,336,318 | 1,336,877 | |
| 05/01/2036 | 2.000% | 5,980,845 | 5,361,408 | |
| 03/01/2042- 11/01/2046 | 3.500% | 33,819,153 | 31,797,961 | |
| 11/01/2043- 08/01/2052 | 3.000% | 39,442,041 | 35,568,917 | |
| 08/01/2044- 11/01/2048 | 4.000% | 20,489,455 | 19,723,973 | |
| 02/01/2051 | 2.500% | 22,773,381 | 19,707,230 | |
| Federal Home Loan Mortgage Corp.(f) | ||||
| 08/01/2041 | 4.500% | 1,776,355 | 1,768,650 | |
| 07/01/2052 | 4.000% | 18,992,241 | 18,078,335 | |
| Federal Home Loan Mortgage Corp.(b),(e) | ||||
| CMO Series 264 Class S1 | ||||
| -1.0 x 1-month USD LIBOR + 5.950% Cap 5.950% 07/15/2042 | 0.843% | 3,272,262 | 320,577 | |
| CMO Series 318 Class S1 | ||||
| -1.0 x 1-month USD LIBOR + 5.950% Cap 5.950% 11/15/2043 | 0.843% | 4,714,556 | 506,144 | |
| CMO Series 4286 Class NS | ||||
| -1.0 x 1-month USD LIBOR + 5.900% Cap 5.900% 12/15/2043 | 0.793% | 2,055,402 | 276,212 | |
| Residential Mortgage-Backed Securities - Agency (continued) | ||||
| Issuer | Coupon Rate | Principal Amount ($) | Value ($) | |
| CMO Series 4594 Class SA | ||||
| -1.0 x 1-month USD LIBOR + 5.950% Cap 5.950% 06/15/2046 | 0.843% | 4,243,470 | 503,536 | |
| CMO Series 4620 Class AS | ||||
| -1.0 x 1-month USD LIBOR + 0.440% 11/15/2042 | 0.000% | 3,828,372 | 193,508 | |
| CMO Series 4935 Class JS | ||||
| -1.0 x 1-month USD LIBOR + 6.050% Cap 6.050% 12/25/2049 | 0.912% | 7,653,319 | 1,002,919 | |
| CMO Series 4965 Class KS | ||||
| -1.0 x 1-month USD LIBOR + 5.850% Cap 5.850% 04/25/2050 | 0.712% | 5,625,421 | 568,957 | |
| CMO Series 4987 Class KS | ||||
| -1.0 x 1-month USD LIBOR + 6.080% Cap 6.080% 06/24/2050 | 0.942% | 12,229,166 | 1,829,074 | |
| CMO Series 4993 Class MS | ||||
| -1.0 x 1-month USD LIBOR + 6.050% Cap 6.050% 07/25/2050 | 0.912% | 15,819,143 | 2,464,940 | |
| CMO STRIPS Series 309 Class S4 | ||||
| -1.0 x 1-month USD LIBOR + 5.970% Cap 5.970% 08/15/2043 | 0.863% | 4,526,684 | 464,708 | |
| CMO STRIPS Series 326 Class S1 | ||||
| -1.0 x 1-month USD LIBOR + 6.000% Cap 6.000% 03/15/2044 | 0.893% | 1,619,741 | 172,340 | |
| Federal Home Loan Mortgage Corp.(e) | ||||
| CMO Series 304 Class C69 | ||||
| 12/15/2042 | 4.000% | 1,291,633 | 246,448 | |
| CMO Series 4139 Class CI | ||||
| 05/15/2042 | 3.500% | 1,916,491 | 170,359 | |
| CMO Series 4147 Class CI | ||||
| 01/15/2041 | 3.500% | 967,517 | 37,926 | |
| CMO Series 4177 Class IY | ||||
| 03/15/2043 | 4.000% | 3,622,796 | 571,693 | |
| CMO Series 4215 Class IL | ||||
| 07/15/2041 | 3.500% | 335,004 | 14,239 | |
| 10 | Columbia Quality Income Fund | Annual Report 2023 |
May 31, 2023
| Residential Mortgage-Backed Securities - Agency (continued) | ||||
| Issuer | Coupon Rate | Principal Amount ($) | Value ($) | |
| Federal Home Loan Mortgage Corp.(d),(e) | ||||
| CMO Series 4068 Class GI | ||||
| 09/15/2036 | 0.000% | 2,631,969 | 146,452 | |
| CMO Series 4107 Class KS | ||||
| 06/15/2038 | 0.000% | 2,354,229 | 97,417 | |
| Federal Home Loan Mortgage Corp. REMICS(b),(e) | ||||
| CMO Series 4983 Class SY | ||||
| -1.0 x 1-month USD LIBOR + 6.100% Cap 6.100% 05/25/2050 | 0.962% | 13,750,546 | 1,600,031 | |
| Federal Home Loan Mortgage Corp. REMICS(e) | ||||
| CMO Series 5105 Class ID | ||||
| 05/25/2051 | 3.000% | 20,645,842 | 3,769,431 | |
| Federal National Mortgage Association | ||||
| 07/01/2023 | 6.000% | 914 | 912 | |
| 11/01/2034- 05/01/2052 | 3.500% | 61,118,197 | 57,338,024 | |
| 02/01/2035- 12/01/2040 | 5.000% | 9,820,898 | 9,910,289 | |
| 03/01/2036- 08/01/2041 | 4.500% | 8,278,489 | 8,226,071 | |
| 06/01/2036- 05/01/2051 | 2.000% | 106,400,092 | 88,801,865 | |
| 09/01/2036 | 6.500% | 1,244,173 | 1,296,557 | |
| 02/01/2041- 08/01/2052 | 4.000% | 47,776,213 | 45,717,684 | |
| 11/01/2046- 08/01/2050 | 3.000% | 80,256,222 | 72,533,314 | |
| 12/01/2050- 05/01/2051 | 2.500% | 42,249,762 | 36,781,956 | |
| CMO Series 2017-72 Class B | ||||
| 09/25/2047 | 3.000% | 5,010,708 | 4,614,741 | |
| Federal National Mortgage Association(b),(e) | ||||
| CMO Series 2005-74 Class NI | ||||
| -1.0 x 1-month USD LIBOR + 6.080% Cap 6.080% 05/25/2035 | 0.942% | 5,264,390 | 213,402 | |
| CMO Series 2007-54 Class DI | ||||
| -1.0 x 1-month USD LIBOR + 6.100% Cap 6.100% 06/25/2037 | 0.962% | 4,369,163 | 371,205 | |
| CMO Series 2013-97 Class SB | ||||
| -1.0 x 1-month USD LIBOR + 6.100% Cap 6.100% 06/25/2032 | 1.080% | 944,082 | 12,977 | |
| Residential Mortgage-Backed Securities - Agency (continued) | ||||
| Issuer | Coupon Rate | Principal Amount ($) | Value ($) | |
| CMO Series 2014-93 Class ES | ||||
| -1.0 x 1-month USD LIBOR + 6.150% Cap 6.150% 01/25/2045 | 1.012% | 7,095,972 | 852,472 | |
| CMO Series 2016-101 Class SK | ||||
| -1.0 x 1-month USD LIBOR + 5.950% Cap 5.950% 01/25/2047 | 0.812% | 14,903,641 | 1,777,346 | |
| CMO Series 2016-37 Class SA | ||||
| -1.0 x 1-month USD LIBOR + 5.850% Cap 5.850% 06/25/2046 | 0.712% | 9,114,581 | 1,150,195 | |
| CMO Series 2016-42 Class SB | ||||
| -1.0 x 1-month USD LIBOR + 6.000% Cap 6.000% 07/25/2046 | 0.862% | 12,948,527 | 1,531,219 | |
| CMO Series 2017-3 Class SA | ||||
| -1.0 x 1-month USD LIBOR + 6.000% Cap 6.000% 02/25/2047 | 0.862% | 11,026,893 | 1,226,367 | |
| CMO Series 2017-51 Class SC | ||||
| -1.0 x 1-month USD LIBOR + 6.150% Cap 6.150% 07/25/2047 | 1.012% | 8,848,541 | 1,066,231 | |
| CMO Series 2017-72 Class S | ||||
| -1.0 x 1-month USD LIBOR + 3.950% Cap 2.750% 09/25/2047 | 0.000% | 28,590,055 | 1,237,915 | |
| CMO Series 2017-90 Class SP | ||||
| -1.0 x 1-month USD LIBOR + 6.150% Cap 6.150% 11/25/2047 | 1.012% | 6,596,413 | 762,150 | |
| CMO Series 2019-33 Class SB | ||||
| -1.0 x 1-month USD LIBOR + 6.050% Cap 6.050% 07/25/2049 | 0.912% | 18,440,579 | 2,121,004 | |
| CMO Series 2019-57 Class AS | ||||
| -1.0 x 1-month USD LIBOR + 6.050% Cap 6.050% 10/25/2049 | 0.912% | 11,402,248 | 1,208,942 | |
| Columbia Quality Income Fund | Annual Report 2023 | 11 |
May 31, 2023
| Residential Mortgage-Backed Securities - Agency (continued) | ||||
| Issuer | Coupon Rate | Principal Amount ($) | Value ($) | |
| CMO Series 2019-77 Class SP | ||||
| -1.0 x 1-month USD LIBOR + 5.950% Cap 5.950% 01/25/2050 | 0.812% | 14,661,382 | 1,894,872 | |
| CMO Series 2020-40 Class LS | ||||
| -1.0 x 1-month USD LIBOR + 6.080% Cap 6.080% 06/25/2050 | 0.942% | 16,963,246 | 2,677,450 | |
| Federal National Mortgage Association(d),(e) | ||||
| CMO Series 2006-5 Class N1 | ||||
| 08/25/2034 | 0.000% | 2,681,221 | 27 | |
| Federal National Mortgage Association(e) | ||||
| CMO Series 2012-129 Class IC | ||||
| 01/25/2041 | 3.500% | 1,297,424 | 56,230 | |
| CMO Series 2012-133 Class EI | ||||
| 07/25/2031 | 3.500% | 254,251 | 3,379 | |
| CMO Series 2012-134 Class AI | ||||
| 07/25/2040 | 3.500% | 322,101 | 2,572 | |
| CMO Series 2012-144 Class HI | ||||
| 07/25/2042 | 3.500% | 1,780,098 | 181,356 | |
| CMO Series 2013-1 Class AI | ||||
| 02/25/2043 | 3.500% | 1,661,185 | 227,158 | |
| CMO Series 2013-16 | ||||
| 01/25/2040 | 3.500% | 1,239,990 | 35,294 | |
| CMO Series 2020-55 Class MI | ||||
| 08/25/2050 | 2.500% | 19,783,333 | 3,089,650 | |
| CMO Series 2021-3 Class TI | ||||
| 02/25/2051 | 2.500% | 26,556,859 | 4,271,291 | |
| CMO Series 417 Class C4 | ||||
| 02/25/2043 | 3.500% | 6,532,128 | 1,278,885 | |
| Federal National Mortgage Association REMICS(e) | ||||
| CMO Series 2021-13 Class IO | ||||
| 03/25/2051 | 3.000% | 15,207,546 | 2,715,348 | |
| CMO Series 2021-54 Class LI | ||||
| 04/25/2049 | 2.500% | 21,479,395 | 2,882,415 | |
| Freddie Mac REMICS | ||||
| CMO Series 4633 Class ZM | ||||
| 11/15/2046 | 3.000% | 6,603,608 | 5,908,675 | |
| CMO Series 5104 Class LH | ||||
| 06/25/2049 | 2.000% | 5,279,817 | 4,473,673 | |
| Government National Mortgage Association | ||||
| 12/15/2031- 02/15/2032 | 6.500% | 134,935 | 138,284 | |
| 01/15/2039- 08/20/2040 | 5.000% | 4,615,992 | 4,703,861 | |
| 04/20/2051- 05/20/2051 | 2.500% | 77,394,916 | 65,401,573 | |
| Residential Mortgage-Backed Securities - Agency (continued) | ||||
| Issuer | Coupon Rate | Principal Amount ($) | Value ($) | |
| Government National Mortgage Association(f) | ||||
| 04/20/2048 | 4.500% | 7,156,404 | 7,052,537 | |
| Government National Mortgage Association(e) | ||||
| CMO Series 2012-121 Class PI | ||||
| 09/16/2042 | 4.500% | 2,777,122 | 417,584 | |
| CMO Series 2012-129 Class AI | ||||
| 08/20/2037 | 3.000% | 472,067 | 2,885 | |
| CMO Series 2014-131 Class EI | ||||
| 09/16/2039 | 4.000% | 4,839,280 | 408,976 | |
| CMO Series 2015-175 Class AI | ||||
| 10/16/2038 | 3.500% | 11,252,969 | 1,043,071 | |
| CMO Series 2020-129 Class YI | ||||
| 09/20/2050 | 2.500% | 23,811,036 | 3,117,212 | |
| CMO Series 2020-138 Class IN | ||||
| 09/20/2050 | 2.500% | 13,169,451 | 1,888,673 | |
| CMO Series 2020-138 Class JI | ||||
| 09/20/2050 | 2.500% | 28,542,670 | 4,021,157 | |
| CMO Series 2020-142 Class GI | ||||
| 09/20/2050 | 3.000% | 8,559,942 | 1,170,994 | |
| CMO Series 2020-175 Class KI | ||||
| 11/20/2050 | 2.500% | 20,297,371 | 2,794,725 | |
| CMO Series 2020-191 Class TI | ||||
| 12/20/2050 | 2.500% | 9,994,164 | 1,214,939 | |
| CMO Series 2020-191 Class UC | ||||
| 12/20/2050 | 4.000% | 18,198,212 | 3,106,482 | |
| CMO Series 2021-1 Class IB | ||||
| 01/20/2051 | 2.500% | 20,982,080 | 2,762,163 | |
| CMO Series 2021-111 Class AI | ||||
| 06/20/2051 | 2.500% | 19,025,943 | 2,409,200 | |
| CMO Series 2021-119 Class LI | ||||
| 07/20/2051 | 3.000% | 21,522,266 | 3,253,446 | |
| CMO Series 2021-122 Class HI | ||||
| 11/20/2050 | 2.500% | 18,227,909 | 2,380,115 | |
| CMO Series 2021-142 Class IX | ||||
| 08/20/2051 | 2.500% | 24,627,815 | 3,463,508 | |
| CMO Series 2021-146 Class IK | ||||
| 08/20/2051 | 3.500% | 22,573,560 | 3,840,925 | |
| CMO Series 2021-158 Class VI | ||||
| 09/20/2051 | 3.000% | 18,349,239 | 2,936,858 | |
| CMO Series 2021-159 Class IP | ||||
| 09/20/2051 | 3.000% | 14,100,576 | 2,029,500 | |
| CMO Series 2021-175 Class IJ | ||||
| 10/20/2051 | 3.000% | 24,260,093 | 3,707,008 | |
| CMO Series 2021-27 Class IN | ||||
| 02/20/2051 | 2.500% | 12,935,331 | 1,698,604 | |
| 12 | Columbia Quality Income Fund | Annual Report 2023 |
May 31, 2023
| Residential Mortgage-Backed Securities - Agency (continued) | ||||
| Issuer | Coupon Rate | Principal Amount ($) | Value ($) | |
| CMO Series 2021-67 Class GI | ||||
| 04/20/2051 | 3.000% | 20,792,203 | 3,010,093 | |
| CMO Series 2021-8 Class BI | ||||
| 01/20/2051 | 2.500% | 18,903,161 | 2,887,552 | |
| CMO Series 2021-8 Class IO | ||||
| 01/20/2051 | 3.000% | 37,415,621 | 5,777,492 | |
| Government National Mortgage Association(b),(e) | ||||
| CMO Series 2014-131 Class BS | ||||
| -1.0 x 1-month USD LIBOR + 6.200% Cap 6.200% 09/16/2044 | 1.095% | 9,853,593 | 1,269,222 | |
| CMO Series 2017-170 Class QS | ||||
| -1.0 x 1-month USD LIBOR + 6.200% Cap 6.200% 11/20/2047 | 1.052% | 6,457,284 | 641,876 | |
| CMO Series 2018-1 Class SA | ||||
| -1.0 x 1-month USD LIBOR + 6.200% Cap 6.200% 01/20/2048 | 1.052% | 7,936,040 | 799,739 | |
| CMO Series 2018-105 Class SA | ||||
| -1.0 x 1-month USD LIBOR + 6.200% Cap 6.200% 08/20/2048 | 1.052% | 6,046,568 | 517,586 | |
| CMO Series 2018-139 Class KS | ||||
| -1.0 x 1-month USD LIBOR + 6.150% Cap 6.150% 10/20/2048 | 1.002% | 3,847,083 | 352,780 | |
| CMO Series 2018-147 Class SA | ||||
| -1.0 x 1-month USD LIBOR + 6.200% Cap 6.200% 10/20/2048 | 1.052% | 10,048,674 | 982,952 | |
| CMO Series 2018-155 Class LS | ||||
| -1.0 x 1-month USD LIBOR + 6.150% Cap 6.150% 11/20/2048 | 1.002% | 7,912,284 | 835,585 | |
| CMO Series 2018-21 Class WS | ||||
| -1.0 x 1-month USD LIBOR + 6.200% Cap 6.200% 02/20/2048 | 1.052% | 7,244,091 | 851,231 | |
| CMO Series 2018-40 Class SC | ||||
| -1.0 x 1-month USD LIBOR + 6.200% Cap 6.200% 03/20/2048 | 1.052% | 4,649,881 | 428,720 | |
| Residential Mortgage-Backed Securities - Agency (continued) | ||||
| Issuer | Coupon Rate | Principal Amount ($) | Value ($) | |
| CMO Series 2018-63 Class HS | ||||
| -1.0 x 1-month USD LIBOR + 6.200% Cap 6.200% 04/20/2048 | 1.052% | 5,290,154 | 487,323 | |
| CMO Series 2018-94 Class SA | ||||
| -1.0 x 1-month USD LIBOR + 6.200% Cap 6.200% 05/20/2048 | 1.052% | 7,136,375 | 832,108 | |
| CMO Series 2018-97 Class MS | ||||
| -1.0 x 1-month USD LIBOR + 6.200% Cap 6.200% 07/20/2048 | 1.052% | 6,246,870 | 549,394 | |
| CMO Series 2019-117 Class SA | ||||
| -1.0 x 1-month USD LIBOR + 6.100% Cap 6.100% 09/20/2049 | 0.952% | 13,803,465 | 1,538,258 | |
| CMO Series 2019-119 Class GS | ||||
| -1.0 x 1-month USD LIBOR + 6.100% Floor 0.400%, Cap 6.100% 09/20/2049 | 0.952% | 7,746,636 | 647,509 | |
| CMO Series 2019-21 Class SH | ||||
| -1.0 x 1-month USD LIBOR + 6.050% Cap 6.050% 02/20/2049 | 0.902% | 6,804,136 | 550,942 | |
| CMO Series 2019-23 Class SQ | ||||
| -1.0 x 1-month USD LIBOR + 6.050% Cap 6.050% 02/20/2049 | 0.902% | 6,877,676 | 977,409 | |
| CMO Series 2019-43 Class SE | ||||
| -1.0 x 1-month USD LIBOR + 6.100% Cap 6.100% 04/20/2049 | 0.952% | 12,940,857 | 1,371,522 | |
| CMO Series 2019-52 Class AS | ||||
| -1.0 x 1-month USD LIBOR + 6.050% Cap 6.050% 04/16/2049 | 0.945% | 15,639,104 | 2,886,226 | |
| CMO Series 2019-92 Class SD | ||||
| -1.0 x 1-month USD LIBOR + 6.100% Cap 6.100% 07/20/2049 | 0.952% | 16,978,957 | 1,992,739 | |
| Columbia Quality Income Fund | Annual Report 2023 | 13 |
May 31, 2023
| Residential Mortgage-Backed Securities - Agency (continued) | ||||
| Issuer | Coupon Rate | Principal Amount ($) | Value ($) | |
| CMO Series 2020-104 Class SA | ||||
| -1.0 x 1-month USD LIBOR + 6.200% Cap 6.200% 07/20/2050 | 1.052% | 12,535,396 | 1,499,122 | |
| CMO Series 2020-125 Class AS | ||||
| -1.0 x 1-month USD LIBOR + 6.250% Cap 6.250% 08/20/2050 | 1.102% | 19,592,234 | 2,230,772 | |
| CMO Series 2020-125 Class SD | ||||
| -1.0 x 1-month USD LIBOR + 6.250% Cap 6.250% 08/20/2050 | 1.102% | 13,790,627 | 1,610,460 | |
| CMO Series 2020-140 Class SG | ||||
| -1.0 x 1-month USD LIBOR + 6.350% Cap 6.350% 09/20/2050 | 1.202% | 29,314,811 | 3,828,174 | |
| CMO Series 2020-79 Class S | ||||
| -1.0 x 1-month USD LIBOR + 6.100% Cap 6.100% 06/20/2050 | 0.952% | 11,978,743 | 1,459,252 | |
| CMO Series 2021-161 Class SM | ||||
| -1.0 x 1-month USD LIBOR + 6.300% Cap 6.300% 09/20/2051 | 1.152% | 21,735,457 | 2,646,757 | |
| CMO Series 2021-193 Class ES | ||||
| 30-day Average SOFR + 1.700% 11/20/2051 | 0.000% | 157,676,456 | 939,121 | |
| CMO Series 2021-46 Class SE | ||||
| -1.0 x 1-month USD LIBOR + 6.300% Cap 6.300% 03/20/2051 | 1.152% | 24,120,392 | 2,785,568 | |
| Government National Mortgage Association TBA(g) | ||||
| 06/20/2053 | 3.000% | 17,000,000 | 15,299,668 | |
| 06/20/2053 | 4.500% | 65,000,000 | 63,160,449 | |
| Uniform Mortgage-Backed Security TBA(g) | ||||
| 06/15/2038 | 2.500% | 20,000,000 | 18,405,469 | |
| 06/15/2038- 06/13/2053 | 3.000% | 138,000,000 | 124,470,129 | |
| 06/13/2053 | 2.000% | 65,000,000 | 53,435,379 | |
| 06/13/2053 | 3.500% | 99,500,000 | 91,411,738 | |
| 06/13/2053 | 4.500% | 115,000,000 | 111,386,035 | |
| 06/13/2053 | 5.000% | 57,000,000 | 56,148,340 | |
| Total Residential Mortgage-Backed Securities - Agency (Cost $1,357,095,004) | 1,240,577,696 | |||
| Residential Mortgage-Backed Securities - Non-Agency 19.8% | ||||
| Issuer | Coupon Rate | Principal Amount ($) | Value ($) | |
| Ajax Mortgage Loan Trust(a),(d) | ||||
| CMO Series 2021-B Class A | ||||
| 06/25/2066 | 2.239% | 5,017,222 | 4,704,625 | |
| Arroyo Mortgage Trust(a),(d) | ||||
| CMO Series 2019-3 Class M1 | ||||
| 10/25/2048 | 4.204% | 2,900,000 | 2,458,273 | |
| Bellemeade Re Ltd.(a),(b) | ||||
| CMO Series 2019-3A Class M1C | ||||
| 1-month USD LIBOR + 1.950% Floor 1.950% 07/25/2029 | 7.088% | 5,200,443 | 5,206,458 | |
| CMO Series 2019-4A Class M1C | ||||
| 1-month USD LIBOR + 2.500% Floor 2.500% 10/25/2029 | 7.638% | 3,313,720 | 3,322,710 | |
| BVRT Financing Trust(a),(b),(c) | ||||
| CMO Series 2021-3F Class M2 | ||||
| 30-day Average SOFR + 2.900% Floor 2.900% 07/12/2033 | 4.187% | 10,000,000 | 10,000,000 | |
| CMO Series 2021-CRT1 Class M3 | ||||
| 1-month USD LIBOR + 2.750% Floor 3.000% 01/10/2033 | 3.000% | 2,363,264 | 2,270,742 | |
| CHNGE Mortgage Trust(a),(d) | ||||
| CMO Series 2022-2 Class A1 | ||||
| 03/25/2067 | 3.757% | 7,440,325 | 6,848,013 | |
| CMO Series 2023-1 Class M1 | ||||
| 03/25/2058 | 8.413% | 6,144,000 | 6,084,764 | |
| CIM Trust(a),(d) | ||||
| CMO Series 2021-NR1 Class A1 | ||||
| 07/25/2055 | 2.569% | 3,222,701 | 3,083,229 | |
| CMO Series 2021-NR4 Class A1 | ||||
| 10/25/2061 | 2.816% | 3,167,559 | 2,952,544 | |
| Citigroup Mortgage Loan Trust, Inc.(a),(d) | ||||
| CMO Series 2009-11 Class 1A2 | ||||
| 02/25/2037 | 4.425% | 165,955 | 157,144 | |
| CMO Series 2014-A Class B2 | ||||
| 01/25/2035 | 5.484% | 739,227 | 721,671 | |
| Citigroup Mortgage Loan Trust, Inc.(a) | ||||
| CMO Series 2015-RP2 Class B2 | ||||
| 01/25/2053 | 4.250% | 3,059,257 | 2,889,321 | |
| Connecticut Avenue Securities Trust(a),(b) | ||||
| CMO Series 2020-R01 Class 1M2 | ||||
| 1-month USD LIBOR + 2.050% 01/25/2040 | 7.188% | 2,280,880 | 2,291,282 | |
| CMO Series 2022-R02 Class 2M2 | ||||
| 30-day Average SOFR + 3.000% 01/25/2042 | 7.973% | 10,000,000 | 9,751,304 | |
| 14 | Columbia Quality Income Fund | Annual Report 2023 |
May 31, 2023
| Residential Mortgage-Backed Securities - Non-Agency (continued) | ||||
| Issuer | Coupon Rate | Principal Amount ($) | Value ($) | |
| Subordinated CMO Series 2019-R01 Class 2B1 | ||||
| 1-month USD LIBOR + 4.350% 07/25/2031 | 9.488% | 11,290,000 | 11,869,745 | |
| Subordinated CMO Series 2022-R01 Class 1B2 | ||||
| 30-day Average SOFR + 6.000% 12/25/2041 | 10.973% | 7,000,000 | 6,549,384 | |
| CSMC Trust(a),(d) | ||||
| CMO Series 2021-JR2 Class A1 | ||||
| 11/25/2061 | 2.215% | 2,728,929 | 2,596,663 | |
| CMO Series 2022-NQM1 Class A3 | ||||
| 11/25/2066 | 2.675% | 5,397,209 | 4,418,987 | |
| Freddie Mac STACR(b) | ||||
| CMO Series 2020-CS01 Class M3 | ||||
| 1-month USD LIBOR + 0.000% 04/25/2033 | 4.000% | 3,793,017 | 3,638,094 | |
| CMO Series 2020-CS02 Class M4 | ||||
| 1-month USD LIBOR + 0.000% 06/25/2033 | 4.617% | 7,300,000 | 6,929,611 | |
| Freddie Mac STACR REMIC Trust(a),(b) | ||||
| Subordinated CMO Series 2021-DNA5 Class B2 | ||||
| 30-day Average SOFR + 5.500% 01/25/2034 | 10.473% | 7,000,000 | 6,094,410 | |
| Freddie Mac Structured Agency Credit Risk Debt Notes(a),(b),(c),(h) | ||||
| CMO Series 2019-CS02 Class M2 | ||||
| 1-month USD LIBOR + 0.000% 02/25/2032 | 4.506% | 14,000,000 | 13,378,750 | |
| Freddie Mac Structured Agency Credit Risk Debt Notes(a),(b) | ||||
| CMO Series 2020-HQA5 Class M2 | ||||
| 30-day Average SOFR + 2.600% 11/25/2050 | 7.573% | 6,631,131 | 6,665,572 | |
| Subordinated CMO Series 2022-DNA2 Class B1 | ||||
| 30-day Average SOFR + 4.750% 02/25/2042 | 9.723% | 4,500,000 | 4,366,178 | |
| GCAT LLC(a),(d) | ||||
| CMO Series 2021-CM1 Class A1 | ||||
| 04/25/2065 | 1.469% | 2,325,165 | 2,116,449 | |
| Glebe Funding Trust (The)(a),(c) | ||||
| CMO Series 2021-1 Class PT | ||||
| 10/27/2023 | 3.000% | 5,538,764 | 5,137,204 | |
| Imperial Fund Mortgage Trust(a),(d) | ||||
| CMO Series 2021-NQM4 Class A3 | ||||
| 01/25/2057 | 2.450% | 8,115,776 | 6,672,573 | |
| Legacy Mortgage Asset Trust(a),(d) | ||||
| CMO Series 2021-GS1 Class A1 | ||||
| 10/25/2066 | 1.892% | 4,210,041 | 3,875,077 | |
| Mortgage Acquisition Trust I LLC(a),(c) | ||||
| CMO Series 2021-1 Class PT | ||||
| 11/29/2023 | 3.500% | 4,319,492 | 3,909,140 | |
| Residential Mortgage-Backed Securities - Non-Agency (continued) | ||||
| Issuer | Coupon Rate | Principal Amount ($) | Value ($) | |
| New Residential Mortgage Loan Trust(a),(d),(e) | ||||
| CMO Series 2014-1A Class AIO | ||||
| 01/25/2054 | 2.278% | 8,816,125 | 413,913 | |
| New Residential Mortgage Loan Trust(a),(d) | ||||
| CMO Series 2022-NQM2 Class A2 | ||||
| 03/27/2062 | 3.699% | 4,420,000 | 3,430,616 | |
| NRZ Excess Spread-Collateralized Notes(a) | ||||
| CMO Series 2021-GNT1 Class A | ||||
| 11/25/2026 | 3.474% | 4,870,798 | 4,416,068 | |
| OBX Trust(a),(d) | ||||
| CMO Series 2022-NQM3 Class A2 | ||||
| 01/25/2062 | 3.833% | 5,264,000 | 3,970,359 | |
| PMT Credit Risk Transfer Trust(a),(b) | ||||
| Series 2019-2R Class A | ||||
| 1-month USD LIBOR + 2.750% Floor 2.750% 05/25/2025 | 8.910% | 1,872,762 | 1,857,598 | |
| PNMAC GMSR Issuer Trust(a),(b) | ||||
| CMO Series 2018-GT1 Class A | ||||
| 1-month USD LIBOR + 2.850% Floor 2.850% 02/25/2025 | 7.988% | 26,500,000 | 26,402,944 | |
| CMO Series 2018-GT2 Class A | ||||
| 1-month USD LIBOR + 2.650% 08/25/2025 | 7.788% | 26,500,000 | 26,146,744 | |
| Point Securitization Trust(a),(d) | ||||
| CMO Series 2021-1 Class A1 | ||||
| 02/25/2052 | 3.228% | 6,973,590 | 6,579,444 | |
| Preston Ridge Partners Mortgage Trust(a),(d) | ||||
| CMO Series 2021-1 Class A1 | ||||
| 01/25/2026 | 2.115% | 7,803,752 | 7,479,279 | |
| CMO Series 2021-3 Class A1 | ||||
| 04/25/2026 | 1.867% | 4,990,987 | 4,640,130 | |
| CMO Series 2022-NQM1 Class M1 | ||||
| 08/25/2067 | 5.488% | 6,000,000 | 5,347,317 | |
| Pretium Mortgage Credit Partners(a),(d) | ||||
| CMO Series 2022-NPL1 Class A1 | ||||
| 01/25/2052 | 2.981% | 3,672,373 | 3,424,407 | |
| Radnor Re Ltd.(a),(b) | ||||
| Subordinated CMO Series 2021-2 Class M1A | ||||
| 30-day Average SOFR + 1.850% Floor 1.850% 11/25/2031 | 6.823% | 1,785,907 | 1,779,932 | |
| Saluda Grade Alternative Mortgage Trust(a) | ||||
| CMO Series 2020-FIG1 Class A1 | ||||
| 09/25/2050 | 3.568% | 1,815,096 | 1,785,552 | |
| SG Residential Mortgage Trust(a),(d) | ||||
| CMO Series 2019-3 Class M1 | ||||
| 09/25/2059 | 3.526% | 4,224,000 | 3,882,827 | |
| Columbia Quality Income Fund | Annual Report 2023 | 15 |
May 31, 2023
| Residential Mortgage-Backed Securities - Non-Agency (continued) | ||||
| Issuer | Coupon Rate | Principal Amount ($) | Value ($) | |
| Stanwich Mortgage Loan Co. LLC(a),(d) | ||||
| CMO Series 2021-NPB1 Class A1 | ||||
| 10/16/2026 | 2.735% | 6,476,357 | 5,909,980 | |
| Stonnington Mortgage Trust(a),(c),(d) | ||||
| CMO Series 2020-1 Class A | ||||
| 07/28/2024 | 3.500% | 877,971 | 864,801 | |
| Triangle Re Ltd.(a),(b) | ||||
| CMO Series 2021-2 Class M1B | ||||
| 1-month USD LIBOR + 2.600% Floor 2.600% 10/25/2033 | 7.738% | 6,317,062 | 6,346,153 | |
| Vendee Mortgage Trust(d),(e) | ||||
| CMO Series 1998-1 Class 2IO | ||||
| 03/15/2028 | 0.000% | 371,115 | 0 | |
| CMO Series 1998-3 Class IO | ||||
| 03/15/2029 | 0.000% | 435,018 | 0 | |
| Verus Securitization Trust(a),(d) | ||||
| CMO Series 2020-1 Class M1 | ||||
| 01/25/2060 | 3.021% | 6,700,000 | 5,434,819 | |
| CMO Series 2023-INV1 Class M1 | ||||
| 02/25/2068 | 7.653% | 4,200,000 | 4,168,560 | |
| Visio Trust(a) | ||||
| CMO Series 2021-1R Class A3 | ||||
| 05/25/2056 | 1.688% | 2,634,929 | 2,379,260 | |
| Total Residential Mortgage-Backed Securities - Non-Agency (Cost $285,012,430) | 277,620,620 | |||
| Call Option Contracts Purchased 1.0% | ||||
| Value ($) | ||||
| (Cost $23,834,439) | 13,814,158 | |||
| Put Option Contracts Purchased 0.1% | ||||
| (Cost $1,540,000) | 983,920 | |||
| Money Market Funds 2.8% | ||
| Shares | Value ($) | |
| Columbia Short-Term Cash Fund, 5.241%(i),(j) | 39,006,141 | 38,986,638 |
| Total Money Market Funds (Cost $38,988,697) | 38,986,638 | |
| Total Investments in Securities (Cost: $2,106,284,099) | 1,933,444,375 | |
| Other Assets & Liabilities, Net | (528,916,105) | |
| Net Assets | 1,404,528,270 | |
| Long futures contracts | ||||||
| Description | Number of contracts | Expiration date | Trading currency | Notional amount | Value/Unrealized appreciation ($) | Value/Unrealized depreciation ($) |
| U.S. Treasury 2-Year Note | 1,825 | 09/2023 | USD | 375,636,330 | — | (591,914) |
| U.S. Treasury 5-Year Note | 1,500 | 09/2023 | USD | 163,617,188 | 677,362 | — |
| U.S. Treasury 5-Year Note | 824 | 09/2023 | USD | 89,880,375 | — | (170,511) |
| U.S. Treasury Ultra Bond | 186 | 09/2023 | USD | 25,458,750 | 352,766 | — |
| Total | 1,030,128 | (762,425) | ||||
| Short futures contracts | ||||||
| Description | Number of contracts | Expiration date | Trading currency | Notional amount | Value/Unrealized appreciation ($) | Value/Unrealized depreciation ($) |
| U.S. Long Bond | (16) | 09/2023 | USD | (2,053,500) | — | (18,281) |
| U.S. Treasury 10-Year Note | (4,895) | 09/2023 | USD | (560,324,531) | — | (1,966,778) |
| Total | — | (1,985,059) | ||||
| 16 | Columbia Quality Income Fund | Annual Report 2023 |
May 31, 2023
| Call option contracts purchased | ||||||||
| Description | Counterparty | Trading currency | Notional amount | Number of contracts | Exercise price/Rate | Expiration date | Cost ($) | Value ($) |
| 10-Year OTC interest rate swap with Citi to receive exercise rate and pay SOFR | Citi | USD | 90,000,000 | 90,000,000 | 2.75 | 06/26/2023 | 2,922,749 | 52,830 |
| 10-Year OTC interest rate swap with Citi to receive exercise rate and pay SOFR | Citi | USD | 33,990,000 | 33,990,000 | 2.75 | 07/11/2023 | 1,189,650 | 47,304 |
| 10-Year OTC interest rate swap with Citi to receive exercise rate and pay SOFR | Citi | USD | 150,000,000 | 150,000,000 | 2.00 | 08/03/2023 | 2,527,500 | 47,670 |
| 10-Year OTC interest rate swap with Citi to receive exercise rate and pay SOFR | Citi | USD | 50,000,000 | 50,000,000 | 3.50 | 10/27/2023 | 1,900,000 | 1,682,260 |
| 10-Year OTC interest rate swap with Citi to receive exercise rate and pay SOFR | Citi | USD | 40,000,000 | 40,000,000 | 3.50 | 10/27/2023 | 1,420,000 | 1,345,808 |
| 10-Year OTC interest rate swap with Citi to receive exercise rate and pay SOFR | Citi | USD | 68,970,000 | 68,970,000 | 3.30 | 11/14/2023 | 2,207,040 | 1,800,124 |
| 10-Year OTC interest rate swap with Citi to receive exercise rate and pay SOFR | Citi | USD | 185,000,000 | 185,000,000 | 3.30 | 11/30/2023 | 4,902,500 | 5,107,091 |
| 10-Year OTC interest rate swap with Citi to receive exercise rate and pay SOFR | Citi | USD | 75,000,000 | 75,000,000 | 3.00 | 11/30/2023 | 2,306,250 | 1,288,597 |
| 10-Year OTC interest rate swap with Citi to receive exercise rate and pay SOFR | Citi | USD | 55,000,000 | 55,000,000 | 3.00 | 12/01/2023 | 1,897,500 | 950,274 |
| 10-Year OTC interest rate swap with Morgan Stanley to receive exercise rate and pay SOFR | Morgan Stanley | USD | 75,000,000 | 75,000,000 | 3.00 | 01/10/2024 | 2,561,250 | 1,492,200 |
| Total | 23,834,439 | 13,814,158 | ||||||
| Put option contracts purchased | ||||||||
| Description | Counterparty | Trading currency | Notional amount | Number of contracts | Exercise price/Rate | Expiration date | Cost ($) | Value ($) |
| 5-Year OTC interest rate swap with Morgan Stanley to receive SOFR and pay exercise rate | Morgan Stanley | USD | 140,000,000 | 140,000,000 | 3.75 | 08/25/2023 | 1,540,000 | 983,920 |
| Call option contracts written | ||||||||
| Description | Counterparty | Trading currency | Notional amount | Number of contracts | Exercise price/Rate | Expiration date | Premium received ($) | Value ($) |
| 10-Year OTC interest rate swap with Citi to receive SOFR and pay exercise rate | Citi | USD | (155,000,000) | (155,000,000) | 2.90 | 6/05/2023 | (930,000) | (651) |
| 10-Year OTC interest rate swap with Morgan Stanley to receive SOFR and pay exercise rate | Morgan Stanley | USD | (100,000,000) | (100,000,000) | 2.90 | 6/05/2023 | (750,000) | (420) |
| Total | (1,680,000) | (1,071) | ||||||
| Put option contracts written | ||||||||
| Description | Counterparty | Trading currency | Notional amount | Number of contracts | Exercise price/Rate | Expiration date | Premium received ($) | Value ($) |
| 10-Year OTC interest rate swap with Citi to receive exercise rate and pay SOFR | Citi | USD | (52,500,000) | (52,500,000) | 3.30 | 06/15/2023 | (359,625) | (677,513) |
| 10-Year OTC interest rate swap with JPMorgan to receive exercise rate and pay SOFR | JPMorgan | USD | (50,000,000) | (50,000,000) | 3.30 | 06/15/2023 | (350,000) | (645,250) |
| 10-Year OTC interest rate swap with Morgan Stanley to receive exercise rate and pay SOFR | Morgan Stanley | USD | (90,000,000) | (90,000,000) | 3.25 | 06/12/2023 | (675,000) | (1,339,875) |
| 5-Year OTC interest rate swap with Morgan Stanley to receive exercise rate and pay SOFR | Morgan Stanley | USD | (115,000,000) | (115,000,000) | 3.45 | 06/01/2023 | (540,500) | (564,328) |
| Total | (1,925,125) | (3,226,966) | ||||||
| Columbia Quality Income Fund | Annual Report 2023 | 17 |
May 31, 2023
| Credit default swap contracts - sell protection | |||||||||||||
| Reference entity | Counterparty | Maturity date | Receive fixed rate (%) | Payment frequency | Implied credit spread (%)* | Notional currency | Notional amount | Value ($) | Periodic payments receivable (payable) ($) | Upfront payments ($) | Upfront receipts ($) | Unrealized appreciation ($) | Unrealized depreciation ($) |
| Markit CMBX North America Index, Series 10 BBB- | Citi | 11/17/2059 | 3.000 | Monthly | 16.577 | USD | 10,000,000 | (3,277,607) | 5,833 | — | (1,183,578) | — | (2,088,196) |
| Markit CMBX North America Index, Series 10 BBB- | JPMorgan | 11/17/2059 | 3.000 | Monthly | 16.577 | USD | 10,000,000 | (3,277,606) | 5,833 | — | (1,673,234) | — | (1,598,539) |
| Markit CMBX North America Index, Series 10 BBB- | Morgan Stanley | 11/17/2059 | 3.000 | Monthly | 16.577 | USD | 10,000,000 | (3,277,607) | 5,833 | — | (1,539,866) | — | (1,731,908) |
| Markit CMBX North America Index, Series 10 BBB- | Morgan Stanley | 11/17/2059 | 3.000 | Monthly | 16.577 | USD | 20,000,000 | (6,555,214) | 11,667 | — | (3,659,968) | — | (2,883,579) |
| Markit CMBX North America Index, Series 7 BBB- | Morgan Stanley | 01/17/2047 | 3.000 | Monthly | 70.861 | USD | 5,000,000 | (1,066,084) | 2,917 | — | (262,653) | — | (800,514) |
| Total | (17,454,118) | 32,083 | — | (8,319,299) | — | (9,102,736) | |||||||
| (a) | Represents privately placed and other securities and instruments exempt from Securities and Exchange Commission registration (collectively, private placements), such as Section 4(a)(2) and Rule 144A eligible securities, which are often sold only to qualified institutional buyers. At May 31, 2023, the total value of these securities amounted to $585,570,937, which represents 41.69% of total net assets. |
| (b) | Variable rate security. The interest rate shown was the current rate as of May 31, 2023. |
| (c) | Valuation based on significant unobservable inputs. |
| (d) | Variable or floating rate security, the interest rate of which adjusts periodically based on changes in current interest rates and prepayments on the underlying pool of assets. The interest rate shown was the current rate as of May 31, 2023. |
| (e) | Represents interest only securities which have the right to receive the monthly interest payments on an underlying pool of mortgage loans. |
| (f) | This security or a portion of this security has been pledged as collateral in connection with derivative contracts. |
| (g) | Represents a security purchased on a when-issued basis. |
| (h) | Represents fair value as determined in good faith under procedures approved by the Board of Trustees. At May 31, 2023, the total value of these securities amounted to $13,378,750, which represents 0.95% of total net assets. |
| (i) | The rate shown is the seven-day current annualized yield at May 31, 2023. |
| (j) | As defined in the Investment Company Act of 1940, as amended, an affiliated company is one in which the Fund owns 5% or more of the company’s outstanding voting securities, or a company which is under common ownership or control with the Fund. The value of the holdings and transactions in these affiliated companies during the year ended May 31, 2023 are as follows: |
| Affiliated issuers | Beginning of period($) | Purchases($) | Sales($) | Net change in unrealized appreciation (depreciation)($) | End of period($) | Realized gain (loss)($) | Dividends($) | End of period shares |
| Columbia Short-Term Cash Fund, 5.241% | ||||||||
| 50,324,422 | 865,114,736 | (876,450,461) | (2,059) | 38,986,638 | 16,716 | 2,264,224 | 39,006,141 | |
| 18 | Columbia Quality Income Fund | Annual Report 2023 |
May 31, 2023
| CMO | Collateralized Mortgage Obligation |
| FHLMC | Federal Home Loan Mortgage Corporation |
| LIBOR | London Interbank Offered Rate |
| SOFR | Secured Overnight Financing Rate |
| STRIPS | Separate Trading of Registered Interest and Principal Securities |
| TBA | To Be Announced |
| USD | US Dollar |
| ■ | Level 1 — Valuations based on quoted prices for investments in active markets that the Fund has the ability to access at the measurement date. Valuation adjustments are not applied to Level 1 investments. |
| ■ | Level 2 — Valuations based on other significant observable inputs (including quoted prices for similar securities, interest rates, prepayment speeds, credit risks, etc.). |
| ■ | Level 3 — Valuations based on significant unobservable inputs (including the Fund’s own assumptions and judgment in determining the fair value of investments). |
| Level 1 ($) | Level 2 ($) | Level 3 ($) | Total ($) | |
| Investments in Securities | ||||
| Asset-Backed Securities — Non-Agency | — | 208,670,205 | 2,953,987 | 211,624,192 |
| Commercial Mortgage-Backed Securities - Agency | — | 42,943,321 | — | 42,943,321 |
| Commercial Mortgage-Backed Securities - Non-Agency | — | 106,893,830 | — | 106,893,830 |
| Residential Mortgage-Backed Securities - Agency | — | 1,240,577,696 | — | 1,240,577,696 |
| Residential Mortgage-Backed Securities - Non-Agency | — | 242,059,983 | 35,560,637 | 277,620,620 |
| Call Option Contracts Purchased | — | 13,814,158 | — | 13,814,158 |
| Put Option Contracts Purchased | — | 983,920 | — | 983,920 |
| Money Market Funds | 38,986,638 | — | — | 38,986,638 |
| Total Investments in Securities | 38,986,638 | 1,855,943,113 | 38,514,624 | 1,933,444,375 |
| Columbia Quality Income Fund | Annual Report 2023 | 19 |
May 31, 2023
| Level 1 ($) | Level 2 ($) | Level 3 ($) | Total ($) | |
| Investments in Derivatives | ||||
| Asset | ||||
| Futures Contracts | 1,030,128 | — | — | 1,030,128 |
| Liability | ||||
| Futures Contracts | (2,747,484) | — | — | (2,747,484) |
| Call Option Contracts Written | — | (1,071) | — | (1,071) |
| Put Option Contracts Written | — | (3,226,966) | — | (3,226,966) |
| Swap Contracts | — | (9,102,736) | — | (9,102,736) |
| Total | 37,269,282 | 1,843,612,340 | 38,514,624 | 1,919,396,246 |
| Balance as of 05/31/2022 ($) | Increase (decrease) in accrued discounts/ premiums ($) | Realized gain (loss) ($) | Change in unrealized appreciation (depreciation)(a) ($) | Purchases ($) | Sales ($) | Transfers into Level 3 ($) | Transfers out of Level 3 ($) | Balance as of 05/31/2023 ($) | |
| Asset-Backed Securities — Non-Agency | 2,468,000 | (740,792) | 1,712,581 | (1,609,347) | 3,464,720 | (2,341,175) | - | - | 2,953,987 |
| Residential Mortgage-Backed Securities — Non-Agency | 68,153,339 | 78,569 | 84,427 | (197,478) | 13,181,875 | (45,740,095) | - | - | 35,560,637 |
| Total | 70,621,339 | (662,223) | 1,797,008 | (1,806,825) | 16,646,595 | (48,081,270) | - | - | 38,514,624 |
| 20 | Columbia Quality Income Fund | Annual Report 2023 |
May 31, 2023
| Assets | |
| Investments in securities, at value | |
| Unaffiliated issuers (cost $2,041,920,963) | $1,879,659,659 |
| Affiliated issuers (cost $38,988,697) | 38,986,638 |
| Option contracts purchased (cost $25,374,439) | 14,798,078 |
| Cash collateral held at broker for: | |
| Swap contracts | 6,296,000 |
| Option contracts written | 1,190,000 |
| TBA | 15,921,000 |
| Other(a) | 13,180,000 |
| Receivable for: | |
| Investments sold | 1,904 |
| Capital shares sold | 4,251,946 |
| Dividends | 194,856 |
| Interest | 6,055,732 |
| Variation margin for futures contracts | 1,592,698 |
| Expense reimbursement due from Investment Manager | 565 |
| Prepaid expenses | 11,127 |
| Total assets | 1,982,140,203 |
| Liabilities | |
| Option contracts written, at value (premiums received $3,605,125) | 3,228,037 |
| Due to custodian | 38,769 |
| Unrealized depreciation on swap contracts | 9,102,736 |
| Upfront receipts on swap contracts | 8,319,299 |
| Payable for: | |
| Investments purchased | 4,902,500 |
| Investments purchased on a delayed delivery basis | 543,154,895 |
| Capital shares purchased | 2,314,368 |
| Distributions to shareholders | 4,049,127 |
| Variation margin for futures contracts | 2,154,562 |
| Management services fees | 18,798 |
| Distribution and/or service fees | 1,924 |
| Transfer agent fees | 84,026 |
| Compensation of board members | 183,642 |
| Other expenses | 59,250 |
| Total liabilities | 577,611,933 |
| Net assets applicable to outstanding capital stock | $1,404,528,270 |
| Represented by | |
| Paid in capital | 1,811,930,883 |
| Total distributable earnings (loss) | (407,402,613) |
| Total - representing net assets applicable to outstanding capital stock | $1,404,528,270 |
| Columbia Quality Income Fund | Annual Report 2023 | 21 |
May 31, 2023
| Class A | |
| Net assets | $252,442,081 |
| Shares outstanding | 14,109,754 |
| Net asset value per share | $17.89 |
| Maximum sales charge | 3.00% |
| Maximum offering price per share (calculated by dividing the net asset value per share by 1.0 minus the maximum sales charge for Class A shares) | $18.44 |
| Advisor Class | |
| Net assets | $20,432,226 |
| Shares outstanding | 1,142,655 |
| Net asset value per share | $17.88 |
| Class C | |
| Net assets | $6,736,517 |
| Shares outstanding | 375,897 |
| Net asset value per share | $17.92 |
| Institutional Class | |
| Net assets | $291,133,912 |
| Shares outstanding | 16,282,443 |
| Net asset value per share | $17.88 |
| Institutional 2 Class | |
| Net assets | $18,400,461 |
| Shares outstanding | 1,029,102 |
| Net asset value per share | $17.88 |
| Institutional 3 Class | |
| Net assets | $813,449,064 |
| Shares outstanding | 45,676,117 |
| Net asset value per share | $17.81 |
| Class R | |
| Net assets | $1,934,009 |
| Shares outstanding | 108,179 |
| Net asset value per share | $17.88 |
| (a) | Includes collateral related to option contracts written and swap contracts. |
| 22 | Columbia Quality Income Fund | Annual Report 2023 |
Year Ended May 31, 2023
| Net investment income | |
| Income: | |
| Dividends — affiliated issuers | $2,264,224 |
| Interest | 59,059,220 |
| Interfund lending | 2,597 |
| Total income | 61,326,041 |
| Expenses: | |
| Management services fees | 7,391,344 |
| Distribution and/or service fees | |
| Class A | 698,976 |
| Class C | 90,060 |
| Class R | 11,222 |
| Transfer agent fees | |
| Class A | 447,751 |
| Advisor Class | 40,636 |
| Class C | 14,345 |
| Institutional Class | 445,162 |
| Institutional 2 Class | 12,049 |
| Institutional 3 Class | 54,135 |
| Class R | 3,585 |
| Compensation of board members | 39,177 |
| Custodian fees | 33,488 |
| Printing and postage fees | 62,042 |
| Registration fees | 129,733 |
| Accounting services fees | 50,490 |
| Legal fees | 32,493 |
| Interest on collateral | 308,958 |
| Compensation of chief compliance officer | 288 |
| Other | 35,155 |
| Total expenses | 9,901,089 |
| Fees waived or expenses reimbursed by Investment Manager and its affiliates | (150,409) |
| Fees waived by transfer agent | |
| Institutional 2 Class | (573) |
| Expense reduction | (3,838) |
| Total net expenses | 9,746,269 |
| Net investment income | 51,579,772 |
| Realized and unrealized gain (loss) — net | |
| Net realized gain (loss) on: | |
| Investments — unaffiliated issuers | (45,519,429) |
| Investments — affiliated issuers | 16,716 |
| Futures contracts | (53,097,921) |
| Option contracts purchased | 1,405,305 |
| Option contracts written | (11,922,830) |
| Swap contracts | 1,203,575 |
| Net realized loss | (107,914,584) |
| Net change in unrealized appreciation (depreciation) on: | |
| Investments — unaffiliated issuers | (46,291,418) |
| Investments — affiliated issuers | (2,059) |
| Futures contracts | (2,086,032) |
| Option contracts purchased | (20,548,159) |
| Option contracts written | 13,348,848 |
| Swap contracts | (11,011,999) |
| Net change in unrealized appreciation (depreciation) | (66,590,819) |
| Net realized and unrealized loss | (174,505,403) |
| Net decrease in net assets resulting from operations | $(122,925,631) |
| Columbia Quality Income Fund | Annual Report 2023 | 23 |
| Year Ended May 31, 2023 | Year Ended May 31, 2022 | |
| Operations | ||
| Net investment income | $51,579,772 | $50,609,909 |
| Net realized loss | (107,914,584) | (97,561,435) |
| Net change in unrealized appreciation (depreciation) | (66,590,819) | (180,617,511) |
| Net decrease in net assets resulting from operations | (122,925,631) | (227,569,037) |
| Distributions to shareholders | ||
| Net investment income and net realized gains | ||
| Class A | (9,074,287) | (6,748,034) |
| Advisor Class | (880,873) | (1,139,219) |
| Class C | (219,813) | (167,123) |
| Institutional Class | (9,686,621) | (9,277,490) |
| Institutional 2 Class | (748,007) | (732,645) |
| Institutional 3 Class | (32,489,042) | (25,074,485) |
| Class R | (66,598) | (68,666) |
| Total distributions to shareholders | (53,165,241) | (43,207,662) |
| Decrease in net assets from capital stock activity | (137,560,068) | (284,593,108) |
| Total decrease in net assets | (313,650,940) | (555,369,807) |
| Net assets at beginning of year | 1,718,179,210 | 2,273,549,017 |
| Net assets at end of year | $1,404,528,270 | $1,718,179,210 |
| 24 | Columbia Quality Income Fund | Annual Report 2023 |
| Year Ended | Year Ended | |||
| May 31, 2023 | May 31, 2022 | |||
| Shares | Dollars ($) | Shares | Dollars ($) | |
| Capital stock activity | ||||
| Class A | ||||
| Subscriptions | 1,237,581 | 22,888,404 | 1,984,813 | 43,861,129 |
| Distributions reinvested | 377,554 | 6,899,532 | 237,245 | 5,181,270 |
| Redemptions | (3,656,607) | (67,159,893) | (4,849,505) | (106,035,059) |
| Net decrease | (2,041,472) | (37,371,957) | (2,627,447) | (56,992,660) |
| Advisor Class | ||||
| Subscriptions | 172,987 | 3,219,521 | 1,072,876 | 24,027,547 |
| Distributions reinvested | 44,442 | 813,510 | 48,850 | 1,069,711 |
| Redemptions | (756,211) | (14,014,640) | (2,179,374) | (46,789,753) |
| Net decrease | (538,782) | (9,981,609) | (1,057,648) | (21,692,495) |
| Class C | ||||
| Subscriptions | 39,114 | 699,440 | 193,529 | 4,361,303 |
| Distributions reinvested | 10,502 | 192,292 | 6,913 | 151,525 |
| Redemptions | (316,090) | (5,841,171) | (337,886) | (7,365,751) |
| Net decrease | (266,474) | (4,949,439) | (137,444) | (2,852,923) |
| Institutional Class | ||||
| Subscriptions | 8,082,005 | 145,972,237 | 4,371,659 | 97,210,740 |
| Distributions reinvested | 487,810 | 8,896,781 | 323,956 | 7,078,900 |
| Redemptions | (8,867,877) | (165,802,392) | (10,864,871) | (234,639,662) |
| Net decrease | (298,062) | (10,933,374) | (6,169,256) | (130,350,022) |
| Institutional 2 Class | ||||
| Subscriptions | 325,675 | 6,196,472 | 520,816 | 11,500,378 |
| Distributions reinvested | 40,916 | 746,854 | 33,348 | 731,318 |
| Redemptions | (570,581) | (10,584,594) | (1,119,144) | (24,603,407) |
| Net decrease | (203,990) | (3,641,268) | (564,980) | (12,371,711) |
| Institutional 3 Class | ||||
| Subscriptions | 13,451,351 | 246,359,545 | 7,256,559 | 159,522,579 |
| Distributions reinvested | 1,726,527 | 31,403,957 | 1,097,694 | 23,824,955 |
| Redemptions | (19,004,495) | (347,832,471) | (11,505,626) | (241,592,634) |
| Net decrease | (3,826,617) | (70,068,969) | (3,151,373) | (58,245,100) |
| Class R | ||||
| Subscriptions | 4,998 | 90,915 | 14,878 | 331,816 |
| Distributions reinvested | 3,621 | 66,162 | 3,134 | 68,664 |
| Redemptions | (41,610) | (770,529) | (116,899) | (2,488,677) |
| Net decrease | (32,991) | (613,452) | (98,887) | (2,088,197) |
| Total net decrease | (7,208,388) | (137,560,068) | (13,807,035) | (284,593,108) |
| Columbia Quality Income Fund | Annual Report 2023 | 25 |
| Net asset value, beginning of period | Net investment income | Net realized and unrealized gain (loss) | Total from investment operations | Distributions from net investment income | Distributions from net realized gains | Total distributions to shareholders | |
| Class A | |||||||
| Year Ended 5/31/2023 | $20.05 | 0.58 | (2.14) | (1.56) | (0.60) | — | (0.60) |
| Year Ended 5/31/2022 | $22.86 | 0.46 | (2.89) | (2.43) | (0.38) | — | (0.38) |
| Year Ended 5/31/2021(e) | $22.20 | 0.61 | 1.00 | 1.61 | (0.68) | (0.27) | (0.95) |
| Year Ended 5/31/2020(e) | $22.10 | 0.56 | 0.06 | 0.62 | (0.52) | — | (0.52) |
| Year Ended 5/31/2019(e) | $21.35 | 0.64 | 0.63 | 1.27 | (0.52) | — | (0.52) |
| Advisor Class | |||||||
| Year Ended 5/31/2023 | $20.04 | 0.63 | (2.14) | (1.51) | (0.65) | — | (0.65) |
| Year Ended 5/31/2022 | $22.84 | 0.51 | (2.87) | (2.36) | (0.44) | — | (0.44) |
| Year Ended 5/31/2021(e) | $22.19 | 0.67 | 0.99 | 1.66 | (0.74) | (0.27) | (1.01) |
| Year Ended 5/31/2020(e) | $22.09 | 0.64 | 0.06 | 0.70 | (0.60) | — | (0.60) |
| Year Ended 5/31/2019(e) | $21.34 | 0.68 | 0.67 | 1.35 | (0.60) | — | (0.60) |
| Class C | |||||||
| Year Ended 5/31/2023 | $20.08 | 0.44 | (2.13) | (1.69) | (0.47) | — | (0.47) |
| Year Ended 5/31/2022 | $22.90 | 0.29 | (2.89) | (2.60) | (0.22) | — | (0.22) |
| Year Ended 5/31/2021(e) | $22.24 | 0.44 | 1.00 | 1.44 | (0.51) | (0.27) | (0.78) |
| Year Ended 5/31/2020(e) | $22.14 | 0.40 | 0.06 | 0.46 | (0.36) | — | (0.36) |
| Year Ended 5/31/2019(e) | $21.39 | 0.48 | 0.63 | 1.11 | (0.36) | — | (0.36) |
| Institutional Class | |||||||
| Year Ended 5/31/2023 | $20.04 | 0.63 | (2.14) | (1.51) | (0.65) | — | (0.65) |
| Year Ended 5/31/2022 | $22.84 | 0.51 | (2.87) | (2.36) | (0.44) | — | (0.44) |
| Year Ended 5/31/2021(e) | $22.19 | 0.66 | 1.00 | 1.66 | (0.74) | (0.27) | (1.01) |
| Year Ended 5/31/2020(e) | $22.09 | 0.64 | 0.06 | 0.70 | (0.60) | — | (0.60) |
| Year Ended 5/31/2019(e) | $21.34 | 0.68 | 0.67 | 1.35 | (0.60) | — | (0.60) |
| Institutional 2 Class | |||||||
| Year Ended 5/31/2023 | $20.04 | 0.64 | (2.13) | (1.49) | (0.67) | — | (0.67) |
| Year Ended 5/31/2022 | $22.84 | 0.53 | (2.88) | (2.35) | (0.45) | — | (0.45) |
| Year Ended 5/31/2021(e) | $22.19 | 0.68 | 1.00 | 1.68 | (0.76) | (0.27) | (1.03) |
| Year Ended 5/31/2020(e) | $22.09 | 0.64 | 0.06 | 0.70 | (0.60) | — | (0.60) |
| Year Ended 5/31/2019(e) | $21.35 | 0.72 | 0.62 | 1.34 | (0.60) | — | (0.60) |
| 26 | Columbia Quality Income Fund | Annual Report 2023 |
| Net asset value, end of period | Total return | Total gross expense ratio to average net assets(a) | Total net expense ratio to average net assets(a),(b) | Net investment income ratio to average net assets | Portfolio turnover | Net assets, end of period (000’s) | |
| Class A | |||||||
| Year Ended 5/31/2023 | $17.89 | (7.78%) | 0.95%(c) | 0.93%(c),(d) | 3.14% | 341% | $252,442 |
| Year Ended 5/31/2022 | $20.05 | (10.74%) | 0.89%(c) | 0.89%(c),(d) | 2.06% | 207% | $323,845 |
| Year Ended 5/31/2021(e) | $22.86 | 7.36% | 0.91%(c) | 0.90%(c),(d) | 2.69% | 319% | $429,196 |
| Year Ended 5/31/2020(e) | $22.20 | 2.81% | 0.92%(c) | 0.90%(c),(d) | 2.61% | 326% | $421,105 |
| Year Ended 5/31/2019(e) | $22.10 | 6.12% | 0.93%(c) | 0.92%(c),(d) | 2.96% | 302% | $453,821 |
| Advisor Class | |||||||
| Year Ended 5/31/2023 | $17.88 | (7.56%) | 0.70%(c) | 0.68%(c),(d) | 3.37% | 341% | $20,432 |
| Year Ended 5/31/2022 | $20.04 | (10.49%) | 0.64%(c) | 0.64%(c),(d) | 2.30% | 207% | $33,695 |
| Year Ended 5/31/2021(e) | $22.84 | 7.53% | 0.66%(c) | 0.65%(c),(d) | 2.94% | 319% | $62,560 |
| Year Ended 5/31/2020(e) | $22.19 | 3.25% | 0.67%(c) | 0.65%(c),(d) | 2.87% | 326% | $99,749 |
| Year Ended 5/31/2019(e) | $22.09 | 6.21% | 0.68%(c) | 0.67%(c),(d) | 3.22% | 302% | $90,690 |
| Class C | |||||||
| Year Ended 5/31/2023 | $17.92 | (8.45%) | 1.69%(c) | 1.68%(c),(d) | 2.36% | 341% | $6,737 |
| Year Ended 5/31/2022 | $20.08 | (11.44%) | 1.64%(c) | 1.64%(c),(d) | 1.31% | 207% | $12,902 |
| Year Ended 5/31/2021(e) | $22.90 | 6.54% | 1.66%(c) | 1.65%(c),(d) | 1.94% | 319% | $17,854 |
| Year Ended 5/31/2020(e) | $22.24 | 2.23% | 1.67%(c) | 1.66%(c),(d) | 1.86% | 326% | $21,452 |
| Year Ended 5/31/2019(e) | $22.14 | 5.14% | 1.68%(c) | 1.67%(c),(d) | 2.20% | 302% | $22,792 |
| Institutional Class | |||||||
| Year Ended 5/31/2023 | $17.88 | (7.56%) | 0.70%(c) | 0.68%(c),(d) | 3.40% | 341% | $291,134 |
| Year Ended 5/31/2022 | $20.04 | (10.49%) | 0.64%(c) | 0.64%(c),(d) | 2.30% | 207% | $332,225 |
| Year Ended 5/31/2021(e) | $22.84 | 7.53% | 0.66%(c) | 0.65%(c),(d) | 2.93% | 319% | $519,577 |
| Year Ended 5/31/2020(e) | $22.19 | 3.25% | 0.67%(c) | 0.65%(c),(d) | 2.86% | 326% | $522,050 |
| Year Ended 5/31/2019(e) | $22.09 | 6.41% | 0.68%(c) | 0.67%(c),(d) | 3.23% | 302% | $603,089 |
| Institutional 2 Class | |||||||
| Year Ended 5/31/2023 | $17.88 | (7.47%) | 0.60%(c) | 0.59%(c) | 3.49% | 341% | $18,400 |
| Year Ended 5/31/2022 | $20.04 | (10.41%) | 0.56%(c) | 0.56%(c) | 2.37% | 207% | $24,711 |
| Year Ended 5/31/2021(e) | $22.84 | 7.62% | 0.57%(c) | 0.56%(c) | 2.99% | 319% | $41,073 |
| Year Ended 5/31/2020(e) | $22.19 | 3.35% | 0.58%(c) | 0.56%(c) | 2.96% | 326% | $30,795 |
| Year Ended 5/31/2019(e) | $22.09 | 6.32% | 0.58%(c) | 0.56%(c) | 3.34% | 302% | $37,589 |
| Columbia Quality Income Fund | Annual Report 2023 | 27 |
| Net asset value, beginning of period | Net investment income | Net realized and unrealized gain (loss) | Total from investment operations | Distributions from net investment income | Distributions from net realized gains | Total distributions to shareholders | |
| Institutional 3 Class | |||||||
| Year Ended 5/31/2023 | $19.96 | 0.65 | (2.13) | (1.48) | (0.67) | — | (0.67) |
| Year Ended 5/31/2022 | $22.75 | 0.54 | (2.87) | (2.33) | (0.46) | — | (0.46) |
| Year Ended 5/31/2021(e) | $22.10 | 0.69 | 0.99 | 1.68 | (0.76) | (0.27) | (1.03) |
| Year Ended 5/31/2020(e) | $22.00 | 0.68 | 0.06 | 0.74 | (0.64) | — | (0.64) |
| Year Ended 5/31/2019(e) | $21.25 | 0.72 | 0.63 | 1.35 | (0.60) | — | (0.60) |
| Class R | |||||||
| Year Ended 5/31/2023 | $20.04 | 0.53 | (2.13) | (1.60) | (0.56) | — | (0.56) |
| Year Ended 5/31/2022 | $22.84 | 0.40 | (2.87) | (2.47) | (0.33) | — | (0.33) |
| Year Ended 5/31/2021(e) | $22.18 | 0.54 | 1.01 | 1.55 | (0.62) | (0.27) | (0.89) |
| Year Ended 5/31/2020(e) | $22.08 | 0.52 | 0.06 | 0.58 | (0.48) | — | (0.48) |
| Year Ended 5/31/2019(e) | $21.33 | 0.60 | 0.63 | 1.23 | (0.48) | — | (0.48) |
| Notes to Financial Highlights | |
| (a) | In addition to the fees and expenses that the Fund bears directly, the Fund indirectly bears a pro rata share of the fees and expenses of any other funds in which it invests. Such indirect expenses are not included in the Fund’s reported expense ratios. |
| (b) | Total net expenses include the impact of certain fee waivers/expense reimbursements made by the Investment Manager and certain of its affiliates, if applicable. |
| (c) | Ratios include interest on collateral expense. For the periods indicated below, if interest on collateral expense had been excluded, expenses would have been lower by: |
| Class | 5/31/2023 | 5/31/2022 | 5/31/2021 | 5/31/2020 | 5/31/2019 |
| Class A | 0.02% | less than 0.01% | less than 0.01% | 0.01% | less than 0.01% |
| Advisor Class | 0.02% | less than 0.01% | less than 0.01% | 0.01% | less than 0.01% |
| Class C | 0.02% | less than 0.01% | less than 0.01% | 0.01% | less than 0.01% |
| Institutional Class | 0.02% | less than 0.01% | less than 0.01% | 0.01% | less than 0.01% |
| Institutional 2 Class | 0.02% | less than 0.01% | less than 0.01% | 0.01% | less than 0.01% |
| Institutional 3 Class | 0.02% | less than 0.01% | less than 0.01% | 0.01% | less than 0.01% |
| Class R | 0.02% | less than 0.01% | less than 0.01% | 0.01% | less than 0.01% |
| (d) | The benefits derived from expense reductions had an impact of less than 0.01%. |
| (e) | Per share amounts have been adjusted on a retroactive basis to reflect a 4 to 1 reverse stock split completed after the close of business on September 11, 2020. |
| 28 | Columbia Quality Income Fund | Annual Report 2023 |
| Net asset value, end of period | Total return | Total gross expense ratio to average net assets(a) | Total net expense ratio to average net assets(a),(b) | Net investment income ratio to average net assets | Portfolio turnover | Net assets, end of period (000’s) | |
| Institutional 3 Class | |||||||
| Year Ended 5/31/2023 | $17.81 | (7.42%) | 0.54%(c) | 0.54%(c) | 3.54% | 341% | $813,449 |
| Year Ended 5/31/2022 | $19.96 | (10.38%) | 0.51%(c) | 0.51%(c) | 2.45% | 207% | $987,973 |
| Year Ended 5/31/2021(e) | $22.75 | 7.64% | 0.52%(c) | 0.52%(c) | 3.05% | 319% | $1,197,807 |
| Year Ended 5/31/2020(e) | $22.10 | 3.40% | 0.53%(c) | 0.51%(c) | 3.01% | 326% | $729,991 |
| Year Ended 5/31/2019(e) | $22.00 | 6.58% | 0.52%(c) | 0.51%(c) | 3.37% | 302% | $692,552 |
| Class R | |||||||
| Year Ended 5/31/2023 | $17.88 | (8.02%) | 1.20%(c) | 1.18%(c),(d) | 2.88% | 341% | $1,934 |
| Year Ended 5/31/2022 | $20.04 | (10.94%) | 1.14%(c) | 1.14%(c),(d) | 1.79% | 207% | $2,828 |
| Year Ended 5/31/2021(e) | $22.84 | 7.00% | 1.16%(c) | 1.15%(c),(d) | 2.40% | 319% | $5,482 |
| Year Ended 5/31/2020(e) | $22.18 | 2.74% | 1.17%(c) | 1.15%(c),(d) | 2.36% | 326% | $2,711 |
| Year Ended 5/31/2019(e) | $22.08 | 5.87% | 1.19%(c) | 1.17%(c),(d) | 2.76% | 302% | $1,454 |
| Columbia Quality Income Fund | Annual Report 2023 | 29 |
May 31, 2023
| 30 | Columbia Quality Income Fund | Annual Report 2023 |
May 31, 2023
| Columbia Quality Income Fund | Annual Report 2023 | 31 |
May 31, 2023
| 32 | Columbia Quality Income Fund | Annual Report 2023 |
May 31, 2023
| Columbia Quality Income Fund | Annual Report 2023 | 33 |
May 31, 2023
| 34 | Columbia Quality Income Fund | Annual Report 2023 |
May 31, 2023
| Asset derivatives | ||
| Risk exposure category | Statement of assets and liabilities location | Fair value ($) |
| Interest rate risk | Component of total distributable earnings (loss) — unrealized appreciation on futures contracts | 1,030,128* |
| Interest rate risk | Investments, at value — Option contracts purchased | 14,798,078 |
| Total | 15,828,206 |
| Liability derivatives | ||
| Risk exposure category | Statement of assets and liabilities location | Fair value ($) |
| Credit risk | Component of total distributable earnings (loss) — unrealized depreciation on swap contracts | 9,102,736* |
| Credit risk | Upfront receipts on swap contracts | 8,319,299 |
| Interest rate risk | Component of total distributable earnings (loss) — unrealized depreciation on futures contracts | 2,747,484* |
| Interest rate risk | Option contracts written, at value | 3,228,037 |
| Total | 23,397,556 |
| * | Includes cumulative appreciation (depreciation) as reported in the tables following the Portfolio of Investments. Only the current day’s variation margin for futures and centrally cleared swaps, if any, is reported in receivables or payables in the Statement of Assets and Liabilities. |
| Amount of realized gain (loss) on derivatives recognized in income | |||||
| Risk exposure category | Futures contracts ($) | Option contracts purchased ($) | Option contracts written ($) | Swap contracts ($) | Total ($) |
| Credit risk | — | — | — | 1,203,575 | 1,203,575 |
| Interest rate risk | (53,097,921) | 1,405,305 | (11,922,830) | — | (63,615,446) |
| Total | (53,097,921) | 1,405,305 | (11,922,830) | 1,203,575 | (62,411,871) |
| Change in unrealized appreciation (depreciation) on derivatives recognized in income | |||||
| Risk exposure category | Futures contracts ($) | Option contracts purchased ($) | Option contracts written ($) | Swap contracts ($) | Total ($) |
| Credit risk | — | — | — | (11,011,999) | (11,011,999) |
| Interest rate risk | (2,086,032) | (20,548,159) | 13,348,848 | — | (9,285,343) |
| Total | (2,086,032) | (20,548,159) | 13,348,848 | (11,011,999) | (20,297,342) |
| Columbia Quality Income Fund | Annual Report 2023 | 35 |
May 31, 2023
| Derivative instrument | Average notional amounts ($)* |
| Futures contracts — long | 331,992,134 |
| Futures contracts — short | 316,267,127 |
| Credit default swap contracts — sell protection | 67,875,000 |
| Derivative instrument | Average value ($)* |
| Option contracts purchased | 15,945,622 |
| Option contracts written | (4,350,547) |
| * | Based on the ending quarterly outstanding amounts for the year ended May 31, 2023. |
| 36 | Columbia Quality Income Fund | Annual Report 2023 |
May 31, 2023
| Citi ($) (a) | Citi ($) (a) | JPMorgan ($) (a) | JPMorgan ($) (a) | Morgan Stanley ($) | Total ($) | |
| Assets | ||||||
| Call option contracts purchased | 12,321,958 | - | - | - | 1,492,200 | 13,814,158 |
| Put option contracts purchased | - | - | - | - | 983,920 | 983,920 |
| Total assets | 12,321,958 | - | - | - | 2,476,120 | 14,798,078 |
| Liabilities | ||||||
| Call option contracts written | 651 | - | - | - | 420 | 1,071 |
| Put option contracts written | 677,513 | - | 645,250 | - | 1,904,203 | 3,226,966 |
| OTC credit default swap contracts (b) | - | 3,271,774 | - | 3,271,773 | 10,878,488 | 17,422,035 |
| Total liabilities | 678,164 | 3,271,774 | 645,250 | 3,271,773 | 12,783,111 | 20,650,072 |
| Total financial and derivative net assets | 11,643,794 | (3,271,774) | (645,250) | (3,271,773) | (10,306,991) | (5,851,994) |
| Total collateral received (pledged) (c) | 5,976,000 | (3,146,000) | (645,250) | (3,150,000) | (10,306,991) | (11,272,241) |
| Net amount (d) | 5,667,794 | (125,774) | - | (121,773) | - | 5,420,247 |
| (a) | Exposure can only be netted across transactions governed under the same master agreement with the same legal entity. |
| (b) | Over-the-Counter (OTC) swap contracts are presented at market value plus periodic payments receivable (payable), which is comprised of unrealized appreciation, unrealized depreciation, upfront payments and upfront receipts. |
| (c) | In some instances, the actual collateral received and/or pledged may be more than the amount shown due to overcollateralization. |
| (d) | Represents the net amount due from/(to) counterparties in the event of default. |
| Columbia Quality Income Fund | Annual Report 2023 | 37 |
May 31, 2023
| 38 | Columbia Quality Income Fund | Annual Report 2023 |
May 31, 2023
| Columbia Quality Income Fund | Annual Report 2023 | 39 |
May 31, 2023
| Effective rate (%) | |
| Class A | 0.16 |
| Advisor Class | 0.16 |
| Class C | 0.16 |
| Institutional Class | 0.16 |
| Institutional 2 Class | 0.06 |
| Institutional 3 Class | 0.01 |
| Class R | 0.16 |
| Front End (%) | CDSC (%) | Amount ($) | |
| Class A | 3.00 | 0.50 - 1.00(a) | 24,016 |
| Class C | — | 1.00(b) | 2,249 |
| (a) | This charge is imposed on certain investments of between $1 million and $50 million redeemed within 18 months after purchase, as follows: 1.00% if redeemed within 12 months after purchase, and 0.50% if redeemed more than 12, but less than 18, months after purchase, with certain limited exceptions. |
| (b) | This charge applies to redemptions within 12 months after purchase, with certain limited exceptions. |
| 40 | Columbia Quality Income Fund | Annual Report 2023 |
May 31, 2023
| October 1, 2022 through September 30, 2023 | Prior to October 1, 2022 | |
| Class A | 0.91% | 0.91% |
| Advisor Class | 0.66 | 0.66 |
| Class C | 1.66 | 1.66 |
| Institutional Class | 0.66 | 0.66 |
| Institutional 2 Class | 0.57 | 0.57 |
| Institutional 3 Class | 0.52 | 0.53 |
| Class R | 1.16 | 1.16 |
| Undistributed net investment income ($) | Accumulated net realized (loss) ($) | Paid in capital ($) |
| 14,160 | (14,160) | — |
| Columbia Quality Income Fund | Annual Report 2023 | 41 |
May 31, 2023
| Year Ended May 31, 2023 | Year Ended May 31, 2022 | ||||
| Ordinary income ($) | Long-term capital gains ($) | Total ($) | Ordinary income ($) | Long-term capital gains ($) | Total ($) |
| 53,165,241 | — | 53,165,241 | 43,207,662 | — | 43,207,662 |
| Undistributed ordinary income ($) | Undistributed long-term capital gains ($) | Capital loss carryforwards ($) | Net unrealized (depreciation) ($) |
| 5,071,314 | — | (218,139,017) | (190,104,988) |
| Federal tax cost ($) | Gross unrealized appreciation ($) | Gross unrealized (depreciation) ($) | Net unrealized (depreciation) ($) |
| 2,101,181,935 | 8,811,879 | (198,916,867) | (190,104,988) |
| No expiration short-term ($) | No expiration long-term ($) | Total ($) | Utilized ($) |
| (127,608,531) | (90,530,486) | (218,139,017) | — |
| 42 | Columbia Quality Income Fund | Annual Report 2023 |
May 31, 2023
| Borrower or lender | Average loan balance ($) | Weighted average interest rate (%) | Number of days with outstanding loans |
| Lender | 6,350,000 | 4.28 | 4 |
| Columbia Quality Income Fund | Annual Report 2023 | 43 |
May 31, 2023
| 44 | Columbia Quality Income Fund | Annual Report 2023 |
May 31, 2023
| Columbia Quality Income Fund | Annual Report 2023 | 45 |
May 31, 2023
| 46 | Columbia Quality Income Fund | Annual Report 2023 |
| Columbia Quality Income Fund | Annual Report 2023 | 47 |
| Section 163(j) Interest Dividends | |
| 99.01% |
| Name, address, year of birth | Position held with the Columbia Funds and length of service | Principal occupation(s) during past five years and other relevant professional experience | Number of Funds in the Columbia Funds Complex* overseen | Other directorships held by Trustee during the past five years and other relevant Board experience |
| George S. Batejan c/o Columbia Management Investment Advisers, LLC 290 Congress Street Boston, MA 02210 1954 | Trustee since 2017 | Executive Vice President, Global Head of Technology and Operations, Janus Capital Group, Inc., 2010-2016 | 174 | Former Chairman of the Board, NICSA (National Investment Company Services Association) (Executive Committee, Nominating Committee and Governance Committee), 2014-2016; former Director, Intech Investment Management, 2011-2016; former Board Member, Metro Denver Chamber of Commerce, 2015-2016; former Advisory Board Member, University of Colorado Business School, 2015-2018; former Board Member, Chase Bank International, 1993-1994 |
| 48 | Columbia Quality Income Fund | Annual Report 2023 |
(Unaudited)
Independent trustees (continued)
| Name, address, year of birth | Position held with the Columbia Funds and length of service | Principal occupation(s) during past five years and other relevant professional experience | Number of Funds in the Columbia Funds Complex* overseen | Other directorships held by Trustee during the past five years and other relevant Board experience |
| Kathleen Blatz c/o Columbia Management Investment Advisers, LLC 290 Congress Street Boston, MA 02210 1954 | Trustee since 2006 | Attorney, specializing in arbitration and mediation; Chief Justice, Minnesota Supreme Court, 1998-2006; Associate Justice, Minnesota Supreme Court, 1996-1998; Fourth Judicial District Court Judge, Hennepin County, 1994-1996; Attorney in private practice and public service, 1984-1993; State Representative, Minnesota House of Representatives, 1979-1993, which included service on the Tax and Financial Institutions and Insurance Committees; Member and Interim Chair, Minnesota Sports Facilities Authority, January-July 2017; Interim President and Chief Executive Officer, Blue Cross and Blue Shield of Minnesota (health care insurance), February-July 2018, April-October 2021 | 174 | Former Trustee, Blue Cross and Blue Shield of Minnesota, 2009-2021 (Chair of the Business Development Committee, 2014-2017; Chair of the Governance Committee, 2017-2019); former Member and Chair of the Board, Minnesota Sports Facilities Authority, January 2017-July 2017; former Director, Robina Foundation, 2009-2020 (Chair, 2014-2020); Director, Richard M. Schulze Family Foundation, since 2021 |
| Pamela G. Carlton c/o Columbia Management Investment Advisers, LLC 290 Congress Street Boston, MA 02210 1954 | Chair since 2023; Trustee since 2007 | President, Springboard — Partners in Cross Cultural Leadership (consulting company), since 2003; Managing Director of US Equity Research, JP Morgan Chase, 1999-2003; Director of US Equity Research, Chase Asset Management, 1996-1999; Co-Director Latin America Research, 1993-1996, COO Global Research, 1992-1996, Co-Director of US Research, 1991-1992, Investment Banker, 1982-1991, Morgan Stanley; Attorney, Cleary Gottlieb Steen & Hamilton LLP, 1980-1982 | 174 | Trustee, New York Presbyterian Hospital Board, since 1996; Director, DR Bank (Audit Committee) since 2017; Director, Evercore Inc. (Audit Committee, Nominating and Governance Committee), since 2019; Director, Apollo Commercial Real Estate Finance, Inc. (Chair, Nominating and Governance Committee) (financial services), since 2021; the Governing Council of the Independent Directors Council (IDC), since 2021 |
| Janet Langford Carrig c/o Columbia Management Investment Advisers, LLC 290 Congress Street Boston, MA 02210 1957 | Trustee since 1996 | Senior Vice President, General Counsel and Corporate Secretary, ConocoPhillips (independent energy company), September 2007-October 2018 | 174 | Director, EQT Corporation (natural gas producer), since 2019; former Director, Whiting Petroleum Corporation (independent oil and gas company), 2020-2022 |
| J. Kevin Connaughton c/o Columbia Management Investment Advisers, LLC 290 Congress Street Boston, MA 02210 1964 | Trustee since 2020 | CEO and President, RhodeWay Financial (non-profit financial planning firm), since December 2022; Member, FINRA National Adjudicatory Council, since January 2020; Adjunct Professor of Finance, Bentley University since January 2018; Consultant to Independent Trustees of CFVIT and CFST I from March 2016 to June 2020 with respect to CFVIT and to December 2020 with respect to CFST I; Managing Director and General Manager of Mutual Fund Products, Columbia Management Investment Advisers, LLC, May 2010-February 2015; President, Columbia Funds, 2008-2015; and senior officer of Columbia Funds and affiliated funds, 2003-2015 | 172 | Former Director, The Autism Project, March 2015-December 2021; former Member of the Investment Committee, St. Michael’s College, November 2015-February 2020; former Trustee, St. Michael’s College, June 2017-September 2019; former Trustee, New Century Portfolios (former mutual fund complex), January 2015-December 2017 |
| Columbia Quality Income Fund | Annual Report 2023 | 49 |
(Unaudited)
Independent trustees (continued)
| Name, address, year of birth | Position held with the Columbia Funds and length of service | Principal occupation(s) during past five years and other relevant professional experience | Number of Funds in the Columbia Funds Complex* overseen | Other directorships held by Trustee during the past five years and other relevant Board experience |
| Olive M. Darragh c/o Columbia Management Investment Advisers, LLC 290 Congress Street Boston, MA 02210 1962 | Trustee since 2020 | Managing Director of Darragh Inc. (strategy and talent management consulting firm), since 2010; Founder and CEO, Zolio, Inc. (investment management talent identification platform), since 2004; Consultant to Independent Trustees of CFVIT and CFST I from June 2019 to June 2020 with respect to CFVIT and to December 2020 with respect to CFST I; Partner, Tudor Investments, 2004-2010; Senior Partner, McKinsey & Company (consulting), 1990-2004; Touche Ross CPA, 1985-1988 | 172 | Treasurer, Edinburgh University US Trust Board, since January 2023; Member, HBS Community Action Partners Board, since September 2022; former Director, University of Edinburgh Business School (Member of US Board), 2004-2019; former Director, Boston Public Library Foundation, 2008-2017 |
| Patricia M. Flynn c/o Columbia Management Investment Advisers, LLC 290 Congress Street Boston, MA 02210 1950 | Trustee since 2004 | Professor of Economics and Management, Bentley University, since 2002; Dean, McCallum Graduate School of Business, Bentley University, 1992-2002 | 174 | Former Trustee, MA Taxpayers Foundation, 1997-2022; former Director, The MA Business Roundtable, 2003-2019; former Chairperson, Innovation Index Advisory Committee, MA Technology Collaborative, 1997-2020 |
| Brian J. Gallagher c/o Columbia Management Investment Advisers, LLC 290 Congress Street Boston, MA 02210 1954 | Trustee since 2017 | Retired; Partner with Deloitte & Touche LLP and its predecessors, 1977-2016 | 174 | Trustee, Catholic Schools Foundation, since 2004 |
| Douglas A. Hacker c/o Columbia Management Investment Advisers, LLC 290 Congress Street Boston, MA 02210 1955 | Trustee since 1996 | Independent business executive, since May 2006; Executive Vice President – Strategy of United Airlines, December 2002 - May 2006; President of UAL Loyalty Services (airline marketing company), September 2001-December 2002; Executive Vice President and Chief Financial Officer of United Airlines, July 1999-September 2001 | 174 | Director, SpartanNash Company since November 2013 (Chair of the Board, since May 2021) (food distributor); Director, Aircastle Limited (Chair of Audit Committee) (aircraft leasing), since August 2006; former Director, Nash Finch Company (food distributor), 2005-2013; former Director, SeaCube Container Leasing Ltd. (container leasing), 2010-2013; and former Director, Travelport Worldwide Limited (travel information technology), 2014-2019 |
| Nancy T. Lukitsh c/o Columbia Management Investment Advisers, LLC 290 Congress Street Boston, MA 02210 1956 | Trustee since 2011 | Senior Vice President, Partner and Director of Marketing, Wellington Management Company, LLP (investment adviser), 1997-2010; Chair, Wellington Management Portfolios (commingled non-U.S. investment pools), 2007-2010; Director, Wellington Trust Company, NA and other Wellington affiliates, 1997-2010 | 172 | None |
| 50 | Columbia Quality Income Fund | Annual Report 2023 |
(Unaudited)
Independent trustees (continued)
| Name, address, year of birth | Position held with the Columbia Funds and length of service | Principal occupation(s) during past five years and other relevant professional experience | Number of Funds in the Columbia Funds Complex* overseen | Other directorships held by Trustee during the past five years and other relevant Board experience |
| David M. Moffett c/o Columbia Management Investment Advisers, LLC 290 Congress Street Boston, MA 02210 1952 | Trustee since 2011 | Retired; former Chief Executive Officer of Freddie Mac and Chief Financial Officer of U.S. Bank | 172 | Director, CSX Corporation (transportation suppliers); Director, PayPal Holdings Inc. (payment and data processing services); Trustee, University of Oklahoma Foundation; former Director, eBay Inc. (online trading community), 2007-2015; and former Director, CIT Bank, CIT Group Inc. (commercial and consumer finance), 2010-2016; former Senior Adviser to The Carlyle Group (financial services), March 2008-September 2008; former Governance Consultant to Bridgewater Associates, January 2013-December 2015 |
| Catherine James Paglia c/o Columbia Management Investment Advisers, LLC 290 Congress Street Boston, MA 02210 1952 | Trustee since 2004 | Director, Enterprise Asset Management, Inc. (private real estate and asset management company), since September 1998; Managing Director and Partner, Interlaken Capital, Inc., 1989-1997; Vice President, 1982-1985, Principal, 1985-1987, Managing Director, 1987-1989, Morgan Stanley; Vice President, Investment Banking, 1980-1982, Associate, Investment Banking, 1976-1980, Dean Witter Reynolds, Inc. | 174 | Director, Valmont Industries, Inc. (irrigation systems manufacturer), since 2012; Trustee, Carleton College (on the Investment Committee), since 1987; Trustee, Carnegie Endowment for International Peace (on the Investment Committee), since 2009 |
| Natalie A. Trunow c/o Columbia Management Investment Advisers, LLC 290 Congress Street Boston, MA 02210 1967 | Trustee since 2020 | Chief Executive Officer, Millennial Portfolio Solutions LLC (asset management and consulting services), January 2016-January 2021; Non-executive Member of the Investment Committee and Valuation Committee, Sarona Asset Management Inc. (private equity firm) since September 2019; Advisor, Horizon Investments (asset management and consulting services), August 2018-January 2022; Advisor, Paradigm Asset Management, November 2016-January 2022; Consultant to Independent Trustees of CFVIT and CFST I from September 2016 to June 2020 with respect to CFVIT and to December 2020 with respect to CFST I; Director of Investments/Consultant, Casey Family Programs, April 2016-November 2016; Senior Vice President and Chief Investment Officer, Calvert Investments, August 2008-January 2016; Section Head and Portfolio Manager, General Motors Asset Management, June 1997-August 2008 | 172 | Independent Director, Investment Committee, Health Services for Children with Special Needs, Inc., 2010-2021; Independent Director, (Executive Committee and Chair, Audit Committee), Consumer Credit Counseling Services (formerly Guidewell Financial Solutions), since 2016; Independent Director, (Investment Committee), Sarona Asset Management, since 2019 |
| Columbia Quality Income Fund | Annual Report 2023 | 51 |
(Unaudited)
Independent trustees (continued)
| Name, address, year of birth | Position held with the Columbia Funds and length of service | Principal occupation(s) during past five years and other relevant professional experience | Number of Funds in the Columbia Funds Complex* overseen | Other directorships held by Trustee during the past five years and other relevant Board experience |
| Sandra L. Yeager c/o Columbia Management Investment Advisers, LLC 290 Congress Street Boston, MA 02210 1964 | Trustee since 2017 | Retired; President and founder, Hanoverian Capital, LLC (SEC registered investment advisor firm), 2008-2016; Managing Director, DuPont Capital, 2006-2008; Managing Director, Morgan Stanley Investment Management, 2004-2006; Senior Vice President, Alliance Bernstein, 1990-2004 | 174 | Former Director, NAPE (National Alliance for Partnerships in Equity) Education Foundation, October 2016-October 2020; Advisory Board, Jennersville YMCA, since 2022 |
| Name, address, year of birth | Position held with the Columbia Funds and length of service | Principal occupation(s) during the past five years and other relevant professional experience | Number of Funds in the Columbia Funds Complex overseen | Other directorships held by Trustee during the past five years and other relevant Board experience |
| Daniel J. Beckman c/o Columbia Management Investment Advisers, LLC 290 Congress Street Boston, MA 02210 1962 | Trustee since November 2021 and President since June 2021 | Vice President – Head of North America Product, Columbia Management Investment Advisers, LLC, since April 2015; President and Principal Executive Officer of the Columbia Funds, since June 2021; officer of Columbia Funds and affiliated funds, 2020-2021 | 174 | Director, Ameriprise Trust Company, since October 2016; Director, Columbia Management Investment Distributors, Inc. since November 2018; Board of Governors, Columbia Wanger Asset Management, LLC since, January 2022; Director, Columbia Threadneedle Canada, Inc., since December 2022 |
| * | The term “Columbia Funds Complex” as used herein includes Columbia Seligman Premium Technology Growth Fund, Tri-Continental Corporation and each series of Columbia Funds Series Trust (CFST), Columbia Funds Series Trust I (CFST I), Columbia Funds Series Trust II (CFST II), Columbia ETF Trust I (CET I), Columbia ETF Trust II (CET II), Columbia Funds Variable Insurance Trust (CFVIT) and Columbia Funds Variable Series Trust II (CFVST II). Messrs. Batejan, Beckman, Gallagher and Hacker and Mses. Blatz, Carlton, Carrig, Flynn, Paglia, and Yeager serve as directors of Columbia Seligman Premium Technology Growth Fund and Tri-Continental Corporation. |
| ** | Interested person (as defined under the 1940 Act) by reason of being an officer, director, security holder and/or employee of the Investment Manager or Ameriprise Financial. |
| 52 | Columbia Quality Income Fund | Annual Report 2023 |
(Unaudited)
The Board has appointed officers who are responsible for day-to-day business decisions based on policies it has established. The officers serve at the pleasure of the Board. The following table provides basic information about the Officers of the Fund as of the printing of this report, including principal occupations during the past five years, although their specific titles may have varied over the period. In addition to Mr. Beckman, who is President and Principal Executive Officer, the Fund’s other officers are:
| Name, address and year of birth | Position and year first appointed to position for any Fund in the Columbia Funds Complex or a predecessor thereof | Principal occupation(s) during past five years |
| Michael G. Clarke 290 Congress Street Boston, MA 02210 1969 | Chief Financial Officer and Principal Financial Officer (2009) and Senior Vice President (2019) | Senior Vice President and North America Head of Operations & Investor Services, Columbia Management Investment Advisers, LLC, since June 2023 (previously Senior Vice President and Head of Global Operations, March 2022 – June 2023, Vice President, Head of North America Operations, and Co-Head of Global Operations, June 2019 - February 2022 and Vice President – Accounting and Tax, May 2010 - May 2019); senior officer of Columbia Funds and affiliated funds, since 2002. Director, Ameriprise Trust Company, since June 2023. |
| Joseph Beranek 5890 Ameriprise Financial Center Minneapolis, MN 55474 1965 | Treasurer and Chief Accounting Officer (Principal Accounting Officer) (2019) and Principal Financial Officer (2020), CFST, CFST I, CFST II, CFVIT and CFVST II; Assistant Treasurer, CET I and CET II | Vice President – Mutual Fund Accounting and Financial Reporting, Columbia Management Investment Advisers, LLC, since December 2018 and March 2017, respectively. |
| Marybeth Pilat 290 Congress Street Boston, MA 02210 1968 | Treasurer and Chief Accounting Officer (Principal Accounting Officer) and Principal Financial Officer (2020) for CET I and CET II; Assistant Treasurer, CFST, CFST I, CFST II, CFVIT and CFVST II | Vice President – Product Pricing and Administration, Columbia Management Investment Advisers, LLC, since May 2017. |
| William F. Truscott 290 Congress Street Boston, MA 02210 1960 | Senior Vice President (2001) | Formerly, Trustee/Director of Columbia Funds Complex or legacy funds, November 2001 - January 1, 2021; Chief Executive Officer, Global Asset Management, Ameriprise Financial, Inc., since September 2012; Chairman of the Board and President, Columbia Management Investment Advisers, LLC, since July 2004 and February 2012, respectively; Chairman of the Board and Chief Executive Officer, Columbia Management Investment Distributors, Inc., since November 2008 and February 2012, respectively;Chairman of the Board and Director, Threadneedle Asset Management Holdings, Sàrl, since March 2013 and December 2008, respectively; senior executive of various entities affiliated with Columbia Threadneedle. |
| Christopher O. Petersen 5228 Ameriprise Financial Center Minneapolis, MN 55474 1970 | Senior Vice President and Assistant Secretary (2021) | Formerly, Trustee/Director of funds within the Columbia Funds Complex, July 1, 2020 - November 22, 2021; Senior Vice President and Assistant General Counsel, Ameriprise Financial, Inc., since September 2021 (previously Vice President and Lead Chief Counsel, January 2015 - September 2021); formerly, President and Principal Executive Officer of the Columbia Funds, 2015 - 2021; officer of Columbia Funds and affiliated funds, since 2007. |
| Thomas P. McGuire 290 Congress Street Boston, MA 02210 1972 | Senior Vice President and Chief Compliance Officer (2012) | Vice President – Asset Management Compliance, Ameriprise Financial, Inc., since May 2010; Chief Compliance Officer, Columbia Acorn/Wanger Funds, since December 2015; formerly, Chief Compliance Officer, Ameriprise Certificate Company, September 2010 – September 2020. |
| Ryan C. Larrenaga 290 Congress Street Boston, MA 02210 1970 | Senior Vice President (2017), Chief Legal Officer (2017), and Secretary (2015) | Vice President and Chief Counsel, Ameriprise Financial, Inc., since August 2018 (previously Vice President and Group Counsel, August 2011 - August 2018); Chief Legal Officer, Columbia Acorn/Wanger Funds, since September 2020; officer of Columbia Funds and affiliated funds, since 2005. |
| Columbia Quality Income Fund | Annual Report 2023 | 53 |
(Unaudited)
Fund officers (continued)
| Name, address and year of birth | Position and year first appointed to position for any Fund in the Columbia Funds Complex or a predecessor thereof | Principal occupation(s) during past five years |
| Michael E. DeFao 290 Congress Street Boston, MA 02210 1968 | Vice President (2011) and Assistant Secretary (2010) | Vice President and Chief Counsel, Ameriprise Financial, Inc., since May 2010; Vice President, Chief Legal Officer and Assistant Secretary, Columbia Management Investment Advisers, LLC, since October 2021 (previously Vice President and Assistant Secretary, May 2010 – September 2021). |
| Lyn Kephart-Strong 5903 Ameriprise Financial Center Minneapolis, MN 55474 1960 | Vice President (2015) | Vice President, Global Investment Operations Services, Columbia Management Investment Advisers, LLC, since 2010; Director (since January 2007) and President (since October 2014), Columbia Management Investment Services Corp.; Director (since December 2017) and President (since January 2017), Ameriprise Trust Company. |
| • | the Fund had sufficient liquidity to both meet redemptions and operate effectively on behalf of shareholders; |
| • | there were no material changes to the Program during the period; |
| • | the implementation of the Program was effective to manage the Fund’s liquidity risk; and |
| • | the Program operated adequately during the period. |
| 54 | Columbia Quality Income Fund | Annual Report 2023 |
columbiathreadneedleus.com/investor/. The Fund is distributed by Columbia Management Investment Distributors, Inc., member FINRA, and managed by Columbia Management Investment Advisers, LLC.

May 31, 2023

| 3 | |
| 5 | |
| 7 | |
| 8 | |
| 19 | |
| 21 | |
| 22 | |
| 24 | |
| 28 | |
| 38 | |
| 39 | |
| 39 | |
| 45 |
(Unaudited)
| Average annual total returns (%) (for the period ended May 31, 2023) | |||||
| Inception | 1 Year | 5 Years | 10 Years | ||
| Class A | Excluding sales charges | 12/08/83 | -0.68 | 2.87 | 3.36 |
| Including sales charges | -5.43 | 1.89 | 2.86 | ||
| Advisor Class | 12/11/06 | -0.40 | 3.11 | 3.61 | |
| Class C | Excluding sales charges | 06/26/00 | -1.37 | 2.13 | 2.62 |
| Including sales charges | -2.31 | 2.13 | 2.62 | ||
| Institutional Class | 09/27/10 | -0.34 | 3.13 | 3.62 | |
| Institutional 2 Class | 12/11/06 | -0.29 | 3.22 | 3.68 | |
| Institutional 3 Class | 11/08/12 | -0.23 | 3.31 | 3.78 | |
| Class R | 12/11/06 | -0.82 | 2.62 | 3.11 | |
| ICE BofA U.S. Cash Pay High Yield Constrained Index | -0.14 | 2.91 | 3.88 | ||
| Columbia High Yield Bond Fund | Annual Report 2023 | 3 |
(Unaudited)

| Portfolio breakdown (%) (at May 31, 2023) | |
| Convertible Bonds | 0.8 |
| Corporate Bonds & Notes | 93.5 |
| Foreign Government Obligations | 0.5 |
| Money Market Funds | 2.0 |
| Senior Loans | 3.2 |
| Total | 100.0 |
| Quality breakdown (%) | |
| BBB rating | 2.7 |
| BB rating | 42.1 |
| B rating | 43.0 |
| CCC rating | 12.2 |
| Total | 100.0 |
| 4 | Columbia High Yield Bond Fund | Annual Report 2023 |
(Unaudited)
| • | Selection in the cable and satellite TV sector, primarily an overweight in an issuer that underperformed due to company-specific factors, was the largest detractor to Fund performance during the period. |
| • | Selections within packaging detracted as well. The shortfall was driven by a mix of overweight allocations to underperforming issuers, as well as the robust performance for issuers in which the Fund was underweight or held no position. |
| • | An underweight in the recreation and travel sector, which outperformed due to strong demand trends, also hurt results. |
| • | Security selection in the support-services sector was the largest contributor. With support-services being somewhat of a collection of companies that do not fit within other sectors, there was no underlying theme to the contribution. Instead, the strong fundamental performance of several overweight positions was the key driver of results. |
| Columbia High Yield Bond Fund | Annual Report 2023 | 5 |
(Unaudited)
| • | An underweight in media content was also positive, as was selection in the category thanks to zero weightings in a number of individual securities that lagged. The sector, which continued to face secular headwinds from declining linear television viewership, was among the worst performing areas in high yield during the period. |
| • | Selection in specialty retail was positive and primarily driven by zero weightings in underperforming issuers. |
| • | The Fund’s lack of a position in the banking sector further aided results. |
| 6 | Columbia High Yield Bond Fund | Annual Report 2023 |
(Unaudited)
| December 1, 2022 — May 31, 2023 | |||||||
| Account value at the beginning of the period ($) | Account value at the end of the period ($) | Expenses paid during the period ($) | Fund’s annualized expense ratio (%) | ||||
| Actual | Hypothetical | Actual | Hypothetical | Actual | Hypothetical | Actual | |
| Class A | 1,000.00 | 1,000.00 | 1,021.00 | 1,019.95 | 5.04 | 5.04 | 1.00 |
| Advisor Class | 1,000.00 | 1,000.00 | 1,022.30 | 1,021.19 | 3.78 | 3.78 | 0.75 |
| Class C | 1,000.00 | 1,000.00 | 1,018.10 | 1,016.21 | 8.80 | 8.80 | 1.75 |
| Institutional Class | 1,000.00 | 1,000.00 | 1,023.20 | 1,021.19 | 3.78 | 3.78 | 0.75 |
| Institutional 2 Class | 1,000.00 | 1,000.00 | 1,023.60 | 1,021.54 | 3.43 | 3.43 | 0.68 |
| Institutional 3 Class | 1,000.00 | 1,000.00 | 1,023.90 | 1,021.79 | 3.18 | 3.18 | 0.63 |
| Class R | 1,000.00 | 1,000.00 | 1,020.70 | 1,018.70 | 6.30 | 6.29 | 1.25 |
| Columbia High Yield Bond Fund | Annual Report 2023 | 7 |
May 31, 2023
| Convertible Bonds 0.8% | ||||
| Issuer | Coupon Rate | Principal Amount ($) | Value ($) | |
| Cable and Satellite 0.8% | ||||
| DISH Network Corp. | ||||
| Subordinated | ||||
| 08/15/2026 | 3.375% | 23,608,000 | 10,595,271 | |
| Total Convertible Bonds (Cost $19,868,050) | 10,595,271 | |||
| Corporate Bonds & Notes 92.0% | ||||
| Aerospace & Defense 1.8% | ||||
| Bombardier, Inc.(a) | ||||
| 04/15/2027 | 7.875% | 2,723,000 | 2,690,077 | |
| Spirit AeroSystems, Inc.(a) | ||||
| 11/30/2029 | 9.375% | 1,529,000 | 1,628,326 | |
| TransDigm UK Holdings PLC | ||||
| 05/15/2026 | 6.875% | 1,017,000 | 1,010,057 | |
| TransDigm, Inc.(a) | ||||
| 03/15/2026 | 6.250% | 13,968,000 | 13,872,580 | |
| 08/15/2028 | 6.750% | 3,208,000 | 3,213,366 | |
| Total | 22,414,406 | |||
| Airlines 2.6% | ||||
| Air Canada(a) | ||||
| 08/15/2026 | 3.875% | 3,955,000 | 3,672,704 | |
| American Airlines, Inc./AAdvantage Loyalty IP Ltd.(a) | ||||
| 04/20/2026 | 5.500% | 14,097,486 | 13,836,238 | |
| 04/20/2029 | 5.750% | 5,103,691 | 4,896,379 | |
| Hawaiian Brand Intellectual Property Ltd./Miles Loyalty Ltd.(a) | ||||
| 01/20/2026 | 5.750% | 5,696,446 | 5,312,193 | |
| Mileage Plus Holdings LLC/Intellectual Property Assets Ltd.(a) | ||||
| 06/20/2027 | 6.500% | 5,954,491 | 5,944,522 | |
| Total | 33,662,036 | |||
| Automotive 3.3% | ||||
| American Axle & Manufacturing, Inc. | ||||
| 03/15/2026 | 6.250% | 1,716,000 | 1,651,784 | |
| 04/01/2027 | 6.500% | 203,000 | 188,630 | |
| Clarios Global LP(a) | ||||
| 05/15/2025 | 6.750% | 2,270,000 | 2,275,906 | |
| Ford Motor Co. | ||||
| 02/12/2032 | 3.250% | 3,108,000 | 2,362,276 | |
| 01/15/2043 | 4.750% | 1,697,000 | 1,252,125 | |
| Ford Motor Credit Co. LLC | ||||
| 03/18/2024 | 5.584% | 4,661,000 | 4,635,157 | |
| 11/01/2024 | 4.063% | 1,261,000 | 1,221,264 | |
| 06/16/2025 | 5.125% | 1,781,000 | 1,724,677 | |
| 11/13/2025 | 3.375% | 4,360,000 | 4,020,310 | |
| Corporate Bonds & Notes (continued) | ||||
| Issuer | Coupon Rate | Principal Amount ($) | Value ($) | |
| 01/08/2026 | 4.389% | 2,745,000 | 2,580,054 | |
| 05/28/2027 | 4.950% | 1,375,000 | 1,289,865 | |
| 08/17/2027 | 4.125% | 5,119,000 | 4,626,035 | |
| 11/04/2027 | 7.350% | 2,400,000 | 2,430,595 | |
| 02/16/2028 | 2.900% | 2,325,000 | 1,967,901 | |
| 11/13/2030 | 4.000% | 3,180,000 | 2,666,803 | |
| IHO Verwaltungs GmbH(a),(b) | ||||
| 09/15/2026 | 4.750% | 770,000 | 697,262 | |
| Panther BF Aggregator 2 LP/Finance Co., Inc.(a) | ||||
| 05/15/2027 | 8.500% | 4,347,000 | 4,359,218 | |
| ZF North America Capital, Inc.(a) | ||||
| 04/14/2030 | 7.125% | 1,718,000 | 1,732,369 | |
| Total | 41,682,231 | |||
| Banking 0.2% | ||||
| Ally Financial, Inc. | ||||
| 05/21/2024 | 3.875% | 1,021,000 | 989,559 | |
| Subordinated | ||||
| 11/20/2025 | 5.750% | 1,799,000 | 1,745,819 | |
| Total | 2,735,378 | |||
| Brokerage/Asset Managers/Exchanges 1.9% | ||||
| AG Issuer LLC(a) | ||||
| 03/01/2028 | 6.250% | 117,000 | 108,019 | |
| AG TTMT Escrow Issuer LLC(a) | ||||
| 09/30/2027 | 8.625% | 5,036,000 | 5,102,166 | |
| Hightower Holding LLC(a) | ||||
| 04/15/2029 | 6.750% | 4,062,000 | 3,505,978 | |
| NFP Corp.(a) | ||||
| 08/15/2028 | 4.875% | 4,122,000 | 3,680,866 | |
| 08/15/2028 | 6.875% | 10,440,000 | 8,655,585 | |
| 10/01/2030 | 7.500% | 3,974,000 | 3,831,600 | |
| Total | 24,884,214 | |||
| Building Materials 1.4% | ||||
| American Builders & Contractors Supply Co., Inc.(a) | ||||
| 01/15/2028 | 4.000% | 6,043,000 | 5,506,572 | |
| Beacon Roofing Supply, Inc.(a) | ||||
| 11/15/2026 | 4.500% | 2,198,000 | 2,083,395 | |
| Interface, Inc.(a) | ||||
| 12/01/2028 | 5.500% | 551,000 | 429,847 | |
| SRS Distribution, Inc.(a) | ||||
| 07/01/2028 | 4.625% | 5,453,000 | 4,831,143 | |
| 12/01/2029 | 6.000% | 3,708,000 | 3,064,231 | |
| 8 | Columbia High Yield Bond Fund | Annual Report 2023 |
May 31, 2023
| Corporate Bonds & Notes (continued) | ||||
| Issuer | Coupon Rate | Principal Amount ($) | Value ($) | |
| White Cap Buyer LLC(a) | ||||
| 10/15/2028 | 6.875% | 1,687,000 | 1,465,184 | |
| Total | 17,380,372 | |||
| Cable and Satellite 6.2% | ||||
| CCO Holdings LLC/Capital Corp.(a) | ||||
| 06/01/2029 | 5.375% | 6,200,000 | 5,571,608 | |
| 03/01/2030 | 4.750% | 11,138,000 | 9,398,597 | |
| 08/15/2030 | 4.500% | 4,484,000 | 3,693,306 | |
| 02/01/2032 | 4.750% | 4,106,000 | 3,295,509 | |
| CSC Holdings LLC(a) | ||||
| 01/15/2030 | 5.750% | 2,571,000 | 1,128,756 | |
| 12/01/2030 | 4.625% | 4,665,000 | 2,008,851 | |
| 02/15/2031 | 3.375% | 14,476,000 | 9,894,908 | |
| DISH DBS Corp. | ||||
| 06/01/2029 | 5.125% | 9,530,000 | 4,310,553 | |
| DISH Network Corp.(a) | ||||
| 11/15/2027 | 11.750% | 660,000 | 634,612 | |
| Radiate Holdco LLC/Finance, Inc.(a) | ||||
| 09/15/2026 | 4.500% | 8,112,000 | 6,248,654 | |
| 09/15/2028 | 6.500% | 4,338,000 | 2,183,749 | |
| Sirius XM Radio, Inc.(a) | ||||
| 09/01/2026 | 3.125% | 3,338,000 | 2,943,142 | |
| 07/15/2028 | 4.000% | 2,140,000 | 1,792,913 | |
| 07/01/2030 | 4.125% | 6,167,000 | 4,826,065 | |
| Videotron Ltd.(a) | ||||
| 06/15/2029 | 3.625% | 3,504,000 | 3,011,659 | |
| Virgin Media Finance PLC(a) | ||||
| 07/15/2030 | 5.000% | 7,349,000 | 5,807,272 | |
| VZ Secured Financing BV(a) | ||||
| 01/15/2032 | 5.000% | 7,667,000 | 6,111,231 | |
| Ziggo BV(a) | ||||
| 01/15/2030 | 4.875% | 7,741,000 | 6,445,921 | |
| Total | 79,307,306 | |||
| Chemicals 4.2% | ||||
| Avient Corp.(a) | ||||
| 08/01/2030 | 7.125% | 2,706,000 | 2,731,891 | |
| Axalta Coating Systems LLC(a) | ||||
| 02/15/2029 | 3.375% | 2,346,000 | 2,010,919 | |
| Axalta Coating Systems LLC/Dutch Holding B BV(a) | ||||
| 06/15/2027 | 4.750% | 2,767,000 | 2,619,528 | |
| Cheever Escrow Issuer LLC(a) | ||||
| 10/01/2027 | 7.125% | 3,594,000 | 3,365,194 | |
| Element Solutions, Inc.(a) | ||||
| 09/01/2028 | 3.875% | 5,917,000 | 5,171,260 | |
| HB Fuller Co. | ||||
| 10/15/2028 | 4.250% | 3,105,000 | 2,787,773 | |
| Corporate Bonds & Notes (continued) | ||||
| Issuer | Coupon Rate | Principal Amount ($) | Value ($) | |
| Herens Holdco Sarl(a) | ||||
| 05/15/2028 | 4.750% | 4,046,000 | 3,220,032 | |
| Illuminate Buyer LLC/Holdings IV, Inc.(a) | ||||
| 07/01/2028 | 9.000% | 1,609,000 | 1,402,466 | |
| INEOS Quattro Finance 2 Plc(a) | ||||
| 01/15/2026 | 3.375% | 814,000 | 747,231 | |
| Ingevity Corp.(a) | ||||
| 11/01/2028 | 3.875% | 4,009,000 | 3,308,204 | |
| Innophos Holdings, Inc.(a) | ||||
| 02/15/2028 | 9.375% | 3,244,000 | 3,261,333 | |
| Iris Holdings, Inc.(a),(b) | ||||
| 02/15/2026 | 8.750% | 2,366,000 | 2,215,914 | |
| Olympus Water US Holding Corp.(a) | ||||
| 10/01/2028 | 4.250% | 4,186,000 | 3,361,941 | |
| Olympus Water US Holding Corp.(a),(c) | ||||
| 11/15/2028 | 9.750% | 5,221,000 | 5,157,033 | |
| SPCM SA(a) | ||||
| 03/15/2027 | 3.125% | 1,661,000 | 1,520,682 | |
| Unifrax Escrow Issuer Corp.(a) | ||||
| 09/30/2028 | 5.250% | 1,671,000 | 1,259,067 | |
| 09/30/2029 | 7.500% | 939,000 | 649,417 | |
| WR Grace Holdings LLC(a) | ||||
| 06/15/2027 | 4.875% | 5,928,000 | 5,500,106 | |
| 08/15/2029 | 5.625% | 2,721,000 | 2,257,137 | |
| 03/01/2031 | 7.375% | 832,000 | 815,628 | |
| Total | 53,362,756 | |||
| Construction Machinery 1.0% | ||||
| H&E Equipment Services, Inc.(a) | ||||
| 12/15/2028 | 3.875% | 10,696,000 | 9,183,008 | |
| Herc Holdings, Inc.(a) | ||||
| 07/15/2027 | 5.500% | 2,032,000 | 1,929,683 | |
| Ritchie Bros Holdings, Inc.(a) | ||||
| 03/15/2028 | 6.750% | 695,000 | 703,108 | |
| 03/15/2031 | 7.750% | 824,000 | 858,949 | |
| Total | 12,674,748 | |||
| Consumer Cyclical Services 3.0% | ||||
| APX Group, Inc.(a) | ||||
| 02/15/2027 | 6.750% | 2,620,000 | 2,583,530 | |
| Arches Buyer, Inc.(a) | ||||
| 06/01/2028 | 4.250% | 5,763,000 | 4,894,152 | |
| 12/01/2028 | 6.125% | 3,435,000 | 2,971,484 | |
| Match Group, Inc.(a) | ||||
| 12/15/2027 | 5.000% | 1,031,000 | 973,120 | |
| 06/01/2028 | 4.625% | 2,144,000 | 1,956,895 | |
| 02/15/2029 | 5.625% | 1,076,000 | 1,013,045 | |
| Columbia High Yield Bond Fund | Annual Report 2023 | 9 |
May 31, 2023
| Corporate Bonds & Notes (continued) | ||||
| Issuer | Coupon Rate | Principal Amount ($) | Value ($) | |
| Staples, Inc.(a) | ||||
| 04/15/2026 | 7.500% | 2,462,000 | 2,024,176 | |
| Uber Technologies, Inc.(a) | ||||
| 05/15/2025 | 7.500% | 10,010,000 | 10,136,033 | |
| 08/15/2029 | 4.500% | 12,548,000 | 11,456,657 | |
| Total | 38,009,092 | |||
| Consumer Products 1.2% | ||||
| CD&R Smokey Buyer, Inc.(a) | ||||
| 07/15/2025 | 6.750% | 6,030,000 | 5,325,072 | |
| Mattel, Inc.(a) | ||||
| 12/15/2027 | 5.875% | 2,735,000 | 2,664,916 | |
| Newell Brands, Inc. | ||||
| 09/15/2027 | 6.375% | 1,112,000 | 1,057,429 | |
| 09/15/2029 | 6.625% | 1,572,000 | 1,490,699 | |
| Prestige Brands, Inc.(a) | ||||
| 01/15/2028 | 5.125% | 1,428,000 | 1,365,155 | |
| Spectrum Brands, Inc.(a) | ||||
| 10/01/2029 | 5.000% | 3,461,000 | 3,086,934 | |
| 07/15/2030 | 5.500% | 240,000 | 219,794 | |
| Total | 15,209,999 | |||
| Diversified Manufacturing 1.7% | ||||
| Chart Industries, Inc.(a) | ||||
| 01/01/2030 | 7.500% | 1,820,000 | 1,838,805 | |
| 01/01/2031 | 9.500% | 624,000 | 652,556 | |
| Emerald Debt Merger Sub LLC(a) | ||||
| 12/15/2030 | 6.625% | 2,626,000 | 2,605,000 | |
| Madison IAQ LLC(a) | ||||
| 06/30/2028 | 4.125% | 3,229,000 | 2,795,995 | |
| 06/30/2029 | 5.875% | 2,861,000 | 2,178,171 | |
| Resideo Funding, Inc.(a) | ||||
| 09/01/2029 | 4.000% | 3,127,000 | 2,639,346 | |
| Vertical Holdco GmbH(a) | ||||
| 07/15/2028 | 7.625% | 566,000 | 495,676 | |
| Vertical US Newco, Inc.(a) | ||||
| 07/15/2027 | 5.250% | 1,123,000 | 1,035,148 | |
| WESCO Distribution, Inc.(a) | ||||
| 06/15/2025 | 7.125% | 3,201,000 | 3,223,642 | |
| 06/15/2028 | 7.250% | 4,147,000 | 4,232,307 | |
| Total | 21,696,646 | |||
| Electric 5.2% | ||||
| Clearway Energy Operating LLC(a) | ||||
| 03/15/2028 | 4.750% | 4,159,000 | 3,875,122 | |
| 02/15/2031 | 3.750% | 11,861,000 | 9,978,765 | |
| 01/15/2032 | 3.750% | 5,451,000 | 4,483,448 | |
| Leeward Renewable Energy Operations LLC(a) | ||||
| 07/01/2029 | 4.250% | 5,183,000 | 4,583,958 | |
| Corporate Bonds & Notes (continued) | ||||
| Issuer | Coupon Rate | Principal Amount ($) | Value ($) | |
| NextEra Energy Operating Partners LP(a) | ||||
| 09/15/2027 | 4.500% | 15,240,000 | 14,250,375 | |
| NRG Energy, Inc.(a) | ||||
| 06/15/2029 | 5.250% | 9,490,000 | 8,562,875 | |
| 02/15/2031 | 3.625% | 2,553,000 | 2,007,537 | |
| Pattern Energy Operations LP/Inc.(a) | ||||
| 08/15/2028 | 4.500% | 2,180,000 | 1,983,912 | |
| PG&E Corp. | ||||
| 07/01/2028 | 5.000% | 1,985,000 | 1,826,738 | |
| TerraForm Power Operating LLC(a) | ||||
| 01/31/2028 | 5.000% | 5,584,000 | 5,238,752 | |
| 01/15/2030 | 4.750% | 4,435,000 | 3,985,967 | |
| Vistra Operations Co. LLC(a) | ||||
| 09/01/2026 | 5.500% | 1,147,000 | 1,114,906 | |
| 02/15/2027 | 5.625% | 2,638,000 | 2,539,018 | |
| 07/31/2027 | 5.000% | 1,538,000 | 1,445,448 | |
| Total | 65,876,821 | |||
| Environmental 1.2% | ||||
| Clean Harbors, Inc.(a) | ||||
| 02/01/2031 | 6.375% | 513,000 | 514,136 | |
| GFL Environmental, Inc.(a) | ||||
| 06/01/2025 | 4.250% | 2,474,000 | 2,382,432 | |
| 08/01/2025 | 3.750% | 2,894,000 | 2,747,956 | |
| 12/15/2026 | 5.125% | 3,627,000 | 3,497,043 | |
| Waste Pro USA, Inc.(a) | ||||
| 02/15/2026 | 5.500% | 7,108,000 | 6,541,117 | |
| Total | 15,682,684 | |||
| Finance Companies 1.9% | ||||
| Navient Corp. | ||||
| 06/25/2025 | 6.750% | 4,810,000 | 4,679,701 | |
| OneMain Finance Corp. | ||||
| 09/15/2030 | 4.000% | 2,692,000 | 1,986,625 | |
| Provident Funding Associates LP/Finance Corp.(a) | ||||
| 06/15/2025 | 6.375% | 4,497,000 | 3,933,687 | |
| Quicken Loans LLC/Co-Issuer, Inc.(a) | ||||
| 03/01/2029 | 3.625% | 2,146,000 | 1,776,439 | |
| 03/01/2031 | 3.875% | 4,163,000 | 3,274,262 | |
| Rocket Mortgage LLC/Co-Issuer, Inc.(a) | ||||
| 10/15/2033 | 4.000% | 10,010,000 | 7,535,980 | |
| Springleaf Finance Corp. | ||||
| 03/15/2024 | 6.125% | 1,490,000 | 1,454,793 | |
| 11/15/2029 | 5.375% | 294,000 | 240,422 | |
| Total | 24,881,909 | |||
| 10 | Columbia High Yield Bond Fund | Annual Report 2023 |
May 31, 2023
| Corporate Bonds & Notes (continued) | ||||
| Issuer | Coupon Rate | Principal Amount ($) | Value ($) | |
| Food and Beverage 2.5% | ||||
| Darling Ingredients, Inc.(a) | ||||
| 04/15/2027 | 5.250% | 3,562,000 | 3,462,715 | |
| 06/15/2030 | 6.000% | 2,566,000 | 2,524,724 | |
| FAGE International SA/USA Dairy Industry, Inc.(a) | ||||
| 08/15/2026 | 5.625% | 11,764,000 | 11,122,619 | |
| Post Holdings, Inc.(a) | ||||
| 03/01/2027 | 5.750% | 2,444,000 | 2,398,489 | |
| 01/15/2028 | 5.625% | 1,020,000 | 981,406 | |
| 04/15/2030 | 4.625% | 2,626,000 | 2,298,620 | |
| Primo Water Holdings, Inc.(a) | ||||
| 04/30/2029 | 4.375% | 2,749,000 | 2,364,349 | |
| Simmons Foods, Inc./Prepared Foods, Inc./Pet Food, Inc./Feed(a) | ||||
| 03/01/2029 | 4.625% | 5,132,000 | 4,176,490 | |
| Triton Water Holdings, Inc.(a) | ||||
| 04/01/2029 | 6.250% | 2,480,000 | 2,101,222 | |
| Total | 31,430,634 | |||
| Gaming 3.7% | ||||
| Boyd Gaming Corp. | ||||
| 12/01/2027 | 4.750% | 1,892,000 | 1,791,926 | |
| Boyd Gaming Corp.(a) | ||||
| 06/15/2031 | 4.750% | 857,000 | 762,025 | |
| Caesars Entertainment, Inc.(a) | ||||
| 02/15/2030 | 7.000% | 5,158,000 | 5,175,345 | |
| Churchill Downs, Inc.(a) | ||||
| 05/01/2031 | 6.750% | 1,529,000 | 1,508,326 | |
| Colt Merger Sub, Inc.(a) | ||||
| 07/01/2025 | 5.750% | 5,993,000 | 6,032,659 | |
| 07/01/2025 | 6.250% | 5,031,000 | 5,019,603 | |
| 07/01/2027 | 8.125% | 8,191,000 | 8,348,870 | |
| International Game Technology PLC(a) | ||||
| 02/15/2025 | 6.500% | 751,000 | 756,760 | |
| 04/15/2026 | 4.125% | 1,892,000 | 1,797,176 | |
| Midwest Gaming Borrower LLC(a) | ||||
| 05/01/2029 | 4.875% | 5,237,000 | 4,616,433 | |
| Scientific Games Holdings LP/US FinCo, Inc.(a) | ||||
| 03/01/2030 | 6.625% | 4,558,000 | 3,999,942 | |
| Scientific Games International, Inc.(a) | ||||
| 05/15/2028 | 7.000% | 2,215,000 | 2,190,497 | |
| VICI Properties LP/Note Co., Inc.(a) | ||||
| 06/15/2025 | 4.625% | 3,784,000 | 3,651,740 | |
| Wynn Las Vegas LLC/Capital Corp.(a) | ||||
| 03/01/2025 | 5.500% | 1,427,000 | 1,399,105 | |
| Total | 47,050,407 | |||
| Corporate Bonds & Notes (continued) | ||||
| Issuer | Coupon Rate | Principal Amount ($) | Value ($) | |
| Health Care 5.6% | ||||
| 180 Medical, Inc.(a) | ||||
| 10/15/2029 | 3.875% | 1,050,000 | 923,756 | |
| Acadia Healthcare Co., Inc.(a) | ||||
| 07/01/2028 | 5.500% | 601,000 | 571,416 | |
| 04/15/2029 | 5.000% | 3,719,000 | 3,423,218 | |
| AdaptHealth LLC(a) | ||||
| 03/01/2030 | 5.125% | 5,378,000 | 4,183,427 | |
| Avantor Funding, Inc.(a) | ||||
| 07/15/2028 | 4.625% | 3,369,000 | 3,120,507 | |
| 11/01/2029 | 3.875% | 7,225,000 | 6,314,273 | |
| Catalent Pharma Solutions, Inc.(a) | ||||
| 04/01/2030 | 3.500% | 4,085,000 | 3,319,116 | |
| Charles River Laboratories International, Inc.(a) | ||||
| 05/01/2028 | 4.250% | 1,072,000 | 977,007 | |
| 03/15/2029 | 3.750% | 1,397,000 | 1,228,026 | |
| 03/15/2031 | 4.000% | 1,596,000 | 1,385,581 | |
| CHS/Community Health Systems, Inc.(a) | ||||
| 04/15/2029 | 6.875% | 3,434,000 | 1,938,871 | |
| 05/15/2030 | 5.250% | 7,800,000 | 5,859,546 | |
| 02/15/2031 | 4.750% | 922,000 | 662,286 | |
| Indigo Merger Sub, Inc.(a) | ||||
| 07/15/2026 | 2.875% | 1,595,000 | 1,461,939 | |
| IQVIA, Inc.(a) | ||||
| 05/15/2030 | 6.500% | 1,268,000 | 1,283,760 | |
| Mozart Debt Merger Sub, Inc.(a) | ||||
| 10/01/2029 | 5.250% | 5,217,000 | 4,482,335 | |
| Select Medical Corp.(a) | ||||
| 08/15/2026 | 6.250% | 5,661,000 | 5,509,173 | |
| Surgery Center Holdings, Inc.(a) | ||||
| 07/01/2025 | 6.750% | 228,000 | 227,266 | |
| 04/15/2027 | 10.000% | 1,756,000 | 1,804,551 | |
| Teleflex, Inc. | ||||
| 11/15/2027 | 4.625% | 3,130,000 | 2,961,629 | |
| Teleflex, Inc.(a) | ||||
| 06/01/2028 | 4.250% | 946,000 | 873,889 | |
| Tenet Healthcare Corp. | ||||
| 02/01/2027 | 6.250% | 3,553,000 | 3,500,071 | |
| 11/01/2027 | 5.125% | 7,256,000 | 6,928,959 | |
| 10/01/2028 | 6.125% | 3,445,000 | 3,265,400 | |
| Tenet Healthcare Corp.(a) | ||||
| 06/15/2030 | 6.125% | 2,352,000 | 2,275,835 | |
| US Acute Care Solutions LLC(a) | ||||
| 03/01/2026 | 6.375% | 4,101,000 | 3,476,648 | |
| Total | 71,958,485 | |||
| Columbia High Yield Bond Fund | Annual Report 2023 | 11 |
May 31, 2023
| Corporate Bonds & Notes (continued) | ||||
| Issuer | Coupon Rate | Principal Amount ($) | Value ($) | |
| Home Construction 0.5% | ||||
| Meritage Homes Corp.(a) | ||||
| 04/15/2029 | 3.875% | 1,930,000 | 1,696,811 | |
| Shea Homes LP/Funding Corp. | ||||
| 02/15/2028 | 4.750% | 1,843,000 | 1,626,294 | |
| 04/01/2029 | 4.750% | 513,000 | 448,372 | |
| Taylor Morrison Communities, Inc./Holdings II(a) | ||||
| 03/01/2024 | 5.625% | 2,745,000 | 2,737,938 | |
| Total | 6,509,415 | |||
| Independent Energy 4.9% | ||||
| Apache Corp. | ||||
| 04/15/2043 | 4.750% | 2,937,000 | 2,234,498 | |
| Baytex Energy Corp.(a) | ||||
| 04/30/2030 | 8.500% | 2,520,000 | 2,464,833 | |
| Callon Petroleum Co.(a) | ||||
| 08/01/2028 | 8.000% | 1,453,000 | 1,419,632 | |
| 06/15/2030 | 7.500% | 1,504,000 | 1,395,617 | |
| Centennial Resource Production LLC(a) | ||||
| 04/01/2027 | 6.875% | 689,000 | 672,815 | |
| CNX Resources Corp.(a) | ||||
| 01/15/2029 | 6.000% | 2,593,000 | 2,396,506 | |
| Colgate Energy Partners III LLC(a) | ||||
| 07/01/2029 | 5.875% | 10,478,000 | 9,810,201 | |
| CrownRock LP/Finance, Inc.(a) | ||||
| 05/01/2029 | 5.000% | 1,378,000 | 1,292,285 | |
| Hilcorp Energy I LP/Finance Co.(a) | ||||
| 11/01/2028 | 6.250% | 8,929,000 | 8,377,300 | |
| Matador Resources Co. | ||||
| 09/15/2026 | 5.875% | 5,949,000 | 5,752,989 | |
| Matador Resources Co.(a) | ||||
| 04/15/2028 | 6.875% | 1,625,000 | 1,610,871 | |
| Occidental Petroleum Corp. | ||||
| 09/01/2030 | 6.625% | 1,815,000 | 1,891,768 | |
| 01/01/2031 | 6.125% | 3,697,000 | 3,756,850 | |
| 09/15/2036 | 6.450% | 6,998,000 | 7,106,867 | |
| 03/15/2046 | 6.600% | 175,000 | 178,515 | |
| SM Energy Co. | ||||
| 07/15/2028 | 6.500% | 2,757,000 | 2,586,891 | |
| Southwestern Energy Co. | ||||
| 02/01/2032 | 4.750% | 10,396,000 | 8,995,638 | |
| Total | 61,944,076 | |||
| Leisure 2.9% | ||||
| Carnival Corp.(a) | ||||
| 03/01/2026 | 7.625% | 1,763,000 | 1,669,417 | |
| 03/01/2027 | 5.750% | 5,805,000 | 4,970,778 | |
| Corporate Bonds & Notes (continued) | ||||
| Issuer | Coupon Rate | Principal Amount ($) | Value ($) | |
| Carnival Holdings Bermuda Ltd.(a) | ||||
| 05/01/2028 | 10.375% | 4,140,000 | 4,481,935 | |
| Cedar Fair LP/Canada’s Wonderland Co./Magnum Management Corp./Millennium Operations LLC(a) | ||||
| 05/01/2025 | 5.500% | 4,476,000 | 4,443,906 | |
| Cinemark USA, Inc.(a) | ||||
| 03/15/2026 | 5.875% | 4,053,000 | 3,850,625 | |
| 07/15/2028 | 5.250% | 80,000 | 70,358 | |
| Live Nation Entertainment, Inc.(a) | ||||
| 10/15/2027 | 4.750% | 1,629,000 | 1,511,494 | |
| NCL Corp., Ltd.(a) | ||||
| 02/15/2027 | 5.875% | 2,178,000 | 2,073,855 | |
| Royal Caribbean Cruises Ltd.(a) | ||||
| 08/31/2026 | 5.500% | 1,819,000 | 1,711,152 | |
| 07/15/2027 | 5.375% | 1,048,000 | 969,236 | |
| 01/15/2029 | 9.250% | 700,000 | 744,645 | |
| 01/15/2030 | 7.250% | 7,113,000 | 7,178,227 | |
| Six Flags Entertainment Corp.(a) | ||||
| 05/15/2031 | 7.250% | 2,955,000 | 2,839,525 | |
| Total | 36,515,153 | |||
| Lodging 0.2% | ||||
| Hilton Domestic Operating Co., Inc.(a) | ||||
| 05/01/2025 | 5.375% | 1,328,000 | 1,319,446 | |
| 05/01/2028 | 5.750% | 1,440,000 | 1,422,234 | |
| Total | 2,741,680 | |||
| Media and Entertainment 3.2% | ||||
| Clear Channel International BV(a) | ||||
| 08/01/2025 | 6.625% | 4,173,000 | 4,121,219 | |
| Clear Channel Outdoor Holdings, Inc.(a) | ||||
| 04/15/2028 | 7.750% | 4,149,000 | 3,085,587 | |
| 06/01/2029 | 7.500% | 1,861,000 | 1,317,321 | |
| Clear Channel Worldwide Holdings, Inc.(a) | ||||
| 08/15/2027 | 5.125% | 4,457,000 | 3,927,383 | |
| iHeartCommunications, Inc. | ||||
| 05/01/2026 | 6.375% | 1,978,788 | 1,502,451 | |
| 05/01/2027 | 8.375% | 2,275,000 | 1,279,820 | |
| iHeartCommunications, Inc.(a) | ||||
| 08/15/2027 | 5.250% | 8,480,000 | 5,958,358 | |
| Outfront Media Capital LLC/Corp.(a) | ||||
| 08/15/2027 | 5.000% | 1,896,000 | 1,703,273 | |
| 01/15/2029 | 4.250% | 1,468,000 | 1,200,215 | |
| 03/15/2030 | 4.625% | 4,828,000 | 3,941,208 | |
| Playtika Holding Corp.(a) | ||||
| 03/15/2029 | 4.250% | 6,648,000 | 5,632,932 | |
| Roblox Corp.(a) | ||||
| 05/01/2030 | 3.875% | 4,511,000 | 3,862,540 | |
| 12 | Columbia High Yield Bond Fund | Annual Report 2023 |
May 31, 2023
| Corporate Bonds & Notes (continued) | ||||
| Issuer | Coupon Rate | Principal Amount ($) | Value ($) | |
| Univision Communications, Inc.(a) | ||||
| 06/30/2030 | 7.375% | 2,936,000 | 2,730,523 | |
| Total | 40,262,830 | |||
| Metals and Mining 3.4% | ||||
| Allegheny Technologies, Inc. | ||||
| 10/01/2029 | 4.875% | 1,139,000 | 1,014,854 | |
| 10/01/2031 | 5.125% | 4,832,000 | 4,256,255 | |
| Constellium SE(a) | ||||
| 06/15/2028 | 5.625% | 2,534,000 | 2,412,909 | |
| 04/15/2029 | 3.750% | 14,087,000 | 12,123,524 | |
| Hudbay Minerals, Inc.(a) | ||||
| 04/01/2026 | 4.500% | 5,530,000 | 5,064,785 | |
| 04/01/2029 | 6.125% | 13,088,000 | 11,848,423 | |
| Kaiser Aluminum Corp.(a) | ||||
| 06/01/2031 | 4.500% | 1,576,000 | 1,240,287 | |
| Novelis Corp.(a) | ||||
| 11/15/2026 | 3.250% | 2,802,000 | 2,530,106 | |
| 01/30/2030 | 4.750% | 2,560,000 | 2,272,030 | |
| 08/15/2031 | 3.875% | 1,421,000 | 1,164,808 | |
| Total | 43,927,981 | |||
| Midstream 4.9% | ||||
| CNX Midstream Partners LP(a) | ||||
| 04/15/2030 | 4.750% | 3,589,000 | 2,985,934 | |
| Delek Logistics Partners LP/Finance Corp. | ||||
| 05/15/2025 | 6.750% | 4,005,000 | 3,934,286 | |
| EQM Midstream Partners LP(a) | ||||
| 07/01/2025 | 6.000% | 4,666,000 | 4,620,054 | |
| 06/01/2027 | 7.500% | 1,178,000 | 1,183,714 | |
| 07/01/2027 | 6.500% | 2,315,000 | 2,266,323 | |
| 01/15/2029 | 4.500% | 2,593,000 | 2,269,605 | |
| EQM Midstream Partners LP | ||||
| 07/15/2028 | 5.500% | 3,305,000 | 3,100,008 | |
| 07/15/2048 | 6.500% | 5,911,000 | 4,849,056 | |
| Holly Energy Partners LP/Finance Corp.(a) | ||||
| 04/15/2027 | 6.375% | 1,769,000 | 1,750,528 | |
| 02/01/2028 | 5.000% | 4,181,000 | 3,866,847 | |
| NuStar Logistics LP | ||||
| 10/01/2025 | 5.750% | 2,328,000 | 2,275,798 | |
| 06/01/2026 | 6.000% | 2,535,000 | 2,462,622 | |
| 04/28/2027 | 5.625% | 6,524,000 | 6,240,687 | |
| TransMontaigne Partners LP/TLP Finance Corp. | ||||
| 02/15/2026 | 6.125% | 5,843,000 | 5,089,897 | |
| Venture Global Calcasieu Pass LLC(a) | ||||
| 08/15/2029 | 3.875% | 4,898,000 | 4,272,890 | |
| 08/15/2031 | 4.125% | 7,668,000 | 6,599,700 | |
| 11/01/2033 | 3.875% | 6,127,000 | 5,021,185 | |
| Total | 62,789,134 | |||
| Corporate Bonds & Notes (continued) | ||||
| Issuer | Coupon Rate | Principal Amount ($) | Value ($) | |
| Oil Field Services 0.9% | ||||
| Nabors Industries Ltd.(a) | ||||
| 01/15/2026 | 7.250% | 1,226,000 | 1,124,488 | |
| 01/15/2028 | 7.500% | 2,318,000 | 2,005,367 | |
| Nabors Industries, Inc.(a) | ||||
| 05/15/2027 | 7.375% | 1,532,000 | 1,438,703 | |
| Transocean Titan Financing Ltd.(a) | ||||
| 02/01/2028 | 8.375% | 3,955,000 | 4,004,726 | |
| Venture Global LNG, Inc.(a) | ||||
| 06/01/2028 | 8.125% | 1,827,000 | 1,835,261 | |
| 06/01/2031 | 8.375% | 1,329,000 | 1,336,373 | |
| Total | 11,744,918 | |||
| Other REIT 1.7% | ||||
| Blackstone Mortgage Trust, Inc.(a) | ||||
| 01/15/2027 | 3.750% | 4,756,000 | 4,013,468 | |
| Ladder Capital Finance Holdings LLLP/Corp.(a) | ||||
| 10/01/2025 | 5.250% | 1,550,000 | 1,454,971 | |
| 02/01/2027 | 4.250% | 8,519,000 | 7,215,131 | |
| 06/15/2029 | 4.750% | 2,706,000 | 2,115,547 | |
| Park Intermediate Holdings LLC/Domestic Property/Finance Co-Issuer(a) | ||||
| 10/01/2028 | 5.875% | 1,957,000 | 1,789,130 | |
| Park Intermediate Holdings LLC/PK Domestic Property LLC/Finance Co-Issuer(a) | ||||
| 05/15/2029 | 4.875% | 1,286,000 | 1,112,011 | |
| RLJ Lodging Trust LP(a) | ||||
| 07/01/2026 | 3.750% | 1,903,000 | 1,741,085 | |
| Service Properties Trust | ||||
| 03/15/2024 | 4.650% | 1,517,000 | 1,493,074 | |
| 10/01/2024 | 4.350% | 704,000 | 675,820 | |
| Total | 21,610,237 | |||
| Packaging 1.5% | ||||
| Ardagh Metal Packaging Finance USA LLC/PLC(a) | ||||
| 06/15/2027 | 6.000% | 1,311,000 | 1,287,557 | |
| 09/01/2029 | 4.000% | 7,374,000 | 5,791,403 | |
| Ardagh Packaging Finance PLC/Holdings USA, Inc.(a) | ||||
| 04/30/2025 | 5.250% | 2,283,000 | 2,237,639 | |
| 08/15/2026 | 4.125% | 2,762,000 | 2,585,793 | |
| Canpack SA/US LLC(a) | ||||
| 11/15/2029 | 3.875% | 4,661,000 | 3,749,157 | |
| Trivium Packaging Finance BV(a) | ||||
| 08/15/2026 | 5.500% | 3,440,000 | 3,264,056 | |
| Total | 18,915,605 | |||
| Pharmaceuticals 1.3% | ||||
| 1375209 BC Ltd.(a) | ||||
| 01/30/2028 | 9.000% | 240,000 | 240,034 | |
| Columbia High Yield Bond Fund | Annual Report 2023 | 13 |
May 31, 2023
| Corporate Bonds & Notes (continued) | ||||
| Issuer | Coupon Rate | Principal Amount ($) | Value ($) | |
| Bausch Health Companies, Inc.(a) | ||||
| 02/01/2027 | 6.125% | 3,105,000 | 2,018,986 | |
| 06/01/2028 | 4.875% | 4,466,000 | 2,699,586 | |
| 09/30/2028 | 11.000% | 428,000 | 323,576 | |
| 10/15/2030 | 14.000% | 85,000 | 53,699 | |
| Endo Dac/Finance LLC/Finco, Inc.(a),(d) | ||||
| 06/30/2028 | 0.000% | 1,684,000 | 98,102 | |
| Grifols Escrow Issuer SA(a) | ||||
| 10/15/2028 | 4.750% | 2,601,000 | 2,205,213 | |
| Jazz Securities DAC(a) | ||||
| 01/15/2029 | 4.375% | 1,990,000 | 1,779,832 | |
| Organon Finance 1 LLC(a) | ||||
| 04/30/2028 | 4.125% | 1,483,000 | 1,320,894 | |
| 04/30/2031 | 5.125% | 6,662,000 | 5,652,413 | |
| Total | 16,392,335 | |||
| Property & Casualty 3.1% | ||||
| Alliant Holdings Intermediate LLC/Co-Issuer(a) | ||||
| 10/15/2027 | 4.250% | 2,588,000 | 2,326,974 | |
| 10/15/2027 | 6.750% | 6,770,000 | 6,321,208 | |
| 04/15/2028 | 6.750% | 6,013,000 | 5,901,967 | |
| 11/01/2029 | 5.875% | 2,548,000 | 2,189,160 | |
| AssuredPartners, Inc.(a) | ||||
| 08/15/2025 | 7.000% | 3,791,000 | 3,738,216 | |
| 01/15/2029 | 5.625% | 3,448,000 | 2,981,620 | |
| BroadStreet Partners, Inc.(a) | ||||
| 04/15/2029 | 5.875% | 6,070,000 | 5,239,654 | |
| GTCR AP Finance, Inc.(a) | ||||
| 05/15/2027 | 8.000% | 1,239,000 | 1,205,435 | |
| HUB International Ltd.(a) | ||||
| 05/01/2026 | 7.000% | 1,215,000 | 1,197,078 | |
| 12/01/2029 | 5.625% | 2,230,000 | 2,000,828 | |
| MGIC Investment Corp. | ||||
| 08/15/2028 | 5.250% | 460,000 | 436,040 | |
| Radian Group, Inc. | ||||
| 03/15/2025 | 6.625% | 179,000 | 179,202 | |
| 03/15/2027 | 4.875% | 1,061,000 | 1,013,547 | |
| USI, Inc.(a) | ||||
| 05/01/2025 | 6.875% | 4,898,000 | 4,817,222 | |
| Total | 39,548,151 | |||
| Restaurants 0.8% | ||||
| 1011778 BC ULC/New Red Finance, Inc.(a) | ||||
| 04/15/2025 | 5.750% | 2,265,000 | 2,263,249 | |
| Fertitta Entertainment LLC/Finance Co., Inc.(a) | ||||
| 01/15/2029 | 4.625% | 1,120,000 | 973,545 | |
| 01/15/2030 | 6.750% | 786,000 | 637,842 | |
| IRB Holding Corp.(a) | ||||
| 06/15/2025 | 7.000% | 2,830,000 | 2,839,609 | |
| Corporate Bonds & Notes (continued) | ||||
| Issuer | Coupon Rate | Principal Amount ($) | Value ($) | |
| Yum! Brands, Inc. | ||||
| 04/01/2032 | 5.375% | 3,550,000 | 3,364,294 | |
| Total | 10,078,539 | |||
| Retailers 1.9% | ||||
| Asbury Automotive Group, Inc.(a) | ||||
| 11/15/2029 | 4.625% | 1,088,000 | 960,304 | |
| 02/15/2032 | 5.000% | 1,087,000 | 933,050 | |
| Group 1 Automotive, Inc.(a) | ||||
| 08/15/2028 | 4.000% | 2,345,000 | 2,057,024 | |
| Hanesbrands, Inc.(a) | ||||
| 05/15/2026 | 4.875% | 526,000 | 489,993 | |
| 02/15/2031 | 9.000% | 1,419,000 | 1,419,914 | |
| L Brands, Inc.(a) | ||||
| 07/01/2025 | 9.375% | 745,000 | 792,962 | |
| 10/01/2030 | 6.625% | 3,925,000 | 3,744,517 | |
| L Brands, Inc. | ||||
| 06/15/2029 | 7.500% | 735,000 | 743,364 | |
| LCM Investments Holdings II LLC(a) | ||||
| 05/01/2029 | 4.875% | 4,393,000 | 3,682,151 | |
| Lithia Motors, Inc.(a) | ||||
| 01/15/2031 | 4.375% | 1,665,000 | 1,421,062 | |
| Penske Automotive Group, Inc. | ||||
| 09/01/2025 | 3.500% | 859,000 | 816,288 | |
| PetSmart, Inc./Finance Corp.(a) | ||||
| 02/15/2028 | 4.750% | 6,903,000 | 6,381,066 | |
| Wolverine World Wide, Inc.(a) | ||||
| 08/15/2029 | 4.000% | 1,783,000 | 1,421,453 | |
| Total | 24,863,148 | |||
| Supermarkets 0.1% | ||||
| SEG Holding LLC/Finance Corp.(a) | ||||
| 10/15/2028 | 5.625% | 759,000 | 719,155 | |
| Technology 8.3% | ||||
| Black Knight InfoServ LLC(a) | ||||
| 09/01/2028 | 3.625% | 7,212,000 | 6,480,100 | |
| Boxer Parent Co., Inc.(a) | ||||
| 10/02/2025 | 7.125% | 897,000 | 899,533 | |
| 03/01/2026 | 9.125% | 546,000 | 537,038 | |
| Camelot Finance SA(a) | ||||
| 11/01/2026 | 4.500% | 2,158,000 | 2,026,401 | |
| Clarivate Science Holdings Corp.(a) | ||||
| 07/01/2028 | 3.875% | 4,129,000 | 3,644,087 | |
| 07/01/2029 | 4.875% | 5,282,000 | 4,536,264 | |
| Cloud Software Group, Inc.(a) | ||||
| 09/30/2029 | 9.000% | 4,416,000 | 3,752,983 | |
| 14 | Columbia High Yield Bond Fund | Annual Report 2023 |
May 31, 2023
| Corporate Bonds & Notes (continued) | ||||
| Issuer | Coupon Rate | Principal Amount ($) | Value ($) | |
| Condor Merger Sub, Inc.(a) | ||||
| 02/15/2030 | 7.375% | 3,106,000 | 2,610,996 | |
| Entegris Escrow Corp.(a) | ||||
| 04/15/2029 | 4.750% | 3,522,000 | 3,292,066 | |
| 06/15/2030 | 5.950% | 4,088,000 | 3,938,294 | |
| Gartner, Inc.(a) | ||||
| 06/15/2029 | 3.625% | 1,678,000 | 1,491,960 | |
| HealthEquity, Inc.(a) | ||||
| 10/01/2029 | 4.500% | 4,486,000 | 3,994,540 | |
| Helios Software Holdings, Inc.(a) | ||||
| 05/01/2028 | 4.625% | 4,210,000 | 3,606,764 | |
| ION Trading Technologies Sarl(a) | ||||
| 05/15/2028 | 5.750% | 4,281,000 | 3,608,890 | |
| Iron Mountain, Inc.(a) | ||||
| 09/15/2027 | 4.875% | 3,207,000 | 3,001,741 | |
| Logan Merger Sub, Inc.(a) | ||||
| 09/01/2027 | 5.500% | 8,896,000 | 5,105,938 | |
| Minerva Merger Sub, Inc.(a) | ||||
| 02/15/2030 | 6.500% | 6,639,000 | 5,463,875 | |
| NCR Corp.(a) | ||||
| 10/01/2028 | 5.000% | 3,605,000 | 3,183,672 | |
| 04/15/2029 | 5.125% | 8,158,000 | 7,117,478 | |
| 10/01/2030 | 5.250% | 232,000 | 198,703 | |
| Neptune Bidco US, Inc.(a) | ||||
| 04/15/2029 | 9.290% | 4,706,000 | 4,316,765 | |
| Picard Midco, Inc.(a) | ||||
| 03/31/2029 | 6.500% | 7,159,000 | 6,335,812 | |
| PTC, Inc.(a) | ||||
| 02/15/2025 | 3.625% | 723,000 | 694,899 | |
| 02/15/2028 | 4.000% | 1,043,000 | 971,376 | |
| Seagate HDD Cayman(a) | ||||
| 12/15/2029 | 8.250% | 1,495,000 | 1,532,470 | |
| 07/15/2031 | 8.500% | 1,661,000 | 1,701,270 | |
| Shift4 Payments LLC/Finance Sub, Inc.(a) | ||||
| 11/01/2026 | 4.625% | 6,350,000 | 5,948,225 | |
| Synaptics, Inc.(a) | ||||
| 06/15/2029 | 4.000% | 3,175,000 | 2,658,302 | |
| Tempo Acquisition LLC/Finance Corp.(a) | ||||
| 06/01/2025 | 5.750% | 1,447,000 | 1,442,998 | |
| Verscend Escrow Corp.(a) | ||||
| 08/15/2026 | 9.750% | 4,487,000 | 4,493,924 | |
| ZoomInfo Technologies LLC/Finance Corp.(a) | ||||
| 02/01/2029 | 3.875% | 8,250,000 | 7,149,098 | |
| Total | 105,736,462 | |||
| Wireless 2.2% | ||||
| Altice France Holding SA(a) | ||||
| 02/15/2028 | 6.000% | 4,642,000 | 2,315,786 | |
| Corporate Bonds & Notes (continued) | ||||
| Issuer | Coupon Rate | Principal Amount ($) | Value ($) | |
| Altice France SA(a) | ||||
| 07/15/2029 | 5.125% | 10,389,000 | 7,395,806 | |
| 10/15/2029 | 5.500% | 1,785,000 | 1,280,465 | |
| Sprint Capital Corp. | ||||
| 11/15/2028 | 6.875% | 6,471,000 | 6,928,275 | |
| Vmed O2 UK Financing I PLC(a) | ||||
| 01/31/2031 | 4.250% | 5,525,000 | 4,429,525 | |
| 07/15/2031 | 4.750% | 6,483,000 | 5,334,710 | |
| Total | 27,684,567 | |||
| Wirelines 1.6% | ||||
| Frontier Communications Holdings LLC(a) | ||||
| 05/15/2030 | 8.750% | 3,053,000 | 2,854,656 | |
| 03/15/2031 | 8.625% | 3,005,000 | 2,772,861 | |
| Iliad Holding SAS(a) | ||||
| 10/15/2026 | 6.500% | 9,821,000 | 9,233,825 | |
| 10/15/2028 | 7.000% | 6,316,000 | 5,899,338 | |
| Total | 20,760,680 | |||
| Total Corporate Bonds & Notes (Cost $1,299,859,798) | 1,172,644,190 | |||
| Foreign Government Obligations(e) 0.4% | ||||
| Canada 0.4% | ||||
| NOVA Chemicals Corp.(a) | ||||
| 06/01/2027 | 5.250% | 6,476,000 | 5,844,590 | |
| Total Foreign Government Obligations (Cost $6,469,972) | 5,844,590 | |||
| Senior Loans 3.2% | ||||
| Borrower | Coupon Rate | Principal Amount ($) | Value ($) | |
| Consumer Cyclical Services 0.6% | ||||
| 8th Avenue Food & Provisions, Inc.(f),(g) | ||||
| 1st Lien Term Loan | ||||
| 1-month Term SOFR + 3.750% 10/01/2025 | 9.018% | 5,815,893 | 5,133,979 | |
| 2nd Lien Term Loan | ||||
| 1-month USD LIBOR + 7.750% 10/01/2026 | 13.018% | 3,441,442 | 2,234,081 | |
| Total | 7,368,060 | |||
| Health Care 0.2% | ||||
| Surgery Center Holdings, Inc.(f),(g) | ||||
| Term Loan | ||||
| 1-month USD LIBOR + 3.750% Floor 0.750% 08/31/2026 | 8.858% | 2,641,829 | 2,621,117 | |
| Columbia High Yield Bond Fund | Annual Report 2023 | 15 |
May 31, 2023
| Senior Loans (continued) | ||||
| Borrower | Coupon Rate | Principal Amount ($) | Value ($) | |
| Media and Entertainment 1.2% | ||||
| Cengage Learning, Inc.(f),(g) | ||||
| Tranche B 1st Lien Term Loan | ||||
| 3-month USD LIBOR + 4.750% Floor 1.000% 07/14/2026 | 9.880% | 15,719,092 | 14,809,428 | |
| Technology 1.2% | ||||
| Applied Systems, Inc.(f),(g) | ||||
| 1st Lien Term Loan | ||||
| 1-month Term SOFR + 4.500% Floor 0.500% 09/18/2026 | 9.398% | 1,747,800 | 1,744,742 | |
| Ascend Learning LLC(f),(g) | ||||
| 1st Lien Term Loan | ||||
| 1-month Term SOFR + 3.500% Floor 0.500% 12/11/2028 | 8.753% | 3,131,363 | 2,805,012 | |
| 2nd Lien Term Loan | ||||
| 1-month Term SOFR + 5.750% Floor 0.500% 12/10/2029 | 11.003% | 1,886,000 | 1,609,380 | |
| DCert Buyer, Inc.(f),(g) | ||||
| 2nd Lien Term Loan | ||||
| 1-month USD LIBOR + 7.000% 02/19/2029 | 12.264% | 2,702,000 | 2,473,303 | |
| UKG, Inc.(f),(g) | ||||
| 1st Lien Term Loan | ||||
| 3-month Term SOFR + 3.250% Floor 0.500% 05/04/2026 | 8.271% | 1,879,062 | 1,802,434 | |
| 3-month USD LIBOR + 3.750% 05/04/2026 | 8.895% | 1,825,780 | 1,759,833 | |
| Senior Loans (continued) | ||||
| Borrower | Coupon Rate | Principal Amount ($) | Value ($) | |
| 2nd Lien Term Loan | ||||
| 3-month Term SOFR + 5.250% Floor 0.500% 05/03/2027 | 10.271% | 3,669,000 | 3,445,191 | |
| Total | 15,639,895 | |||
| Total Senior Loans (Cost $43,631,170) | 40,438,500 | |||
| Money Market Funds 2.0% | ||
| Shares | Value ($) | |
| Columbia Short-Term Cash Fund, 5.241%(h),(i) | 25,223,839 | 25,211,227 |
| Total Money Market Funds (Cost $25,222,812) | 25,211,227 | |
| Total Investments in Securities (Cost: $1,395,051,802) | 1,254,733,778 | |
| Other Assets & Liabilities, Net | 20,104,758 | |
| Net Assets | 1,274,838,536 | |
| (a) | Represents privately placed and other securities and instruments exempt from Securities and Exchange Commission registration (collectively, private placements), such as Section 4(a)(2) and Rule 144A eligible securities, which are often sold only to qualified institutional buyers. At May 31, 2023, the total value of these securities amounted to $1,017,608,831, which represents 79.82% of total net assets. |
| (b) | Payment-in-kind security. Interest can be paid by issuing additional par of the security or in cash. |
| (c) | Represents a security purchased on a when-issued basis. |
| (d) | Represents a security in default. |
| (e) | Principal and interest may not be guaranteed by a governmental entity. |
| (f) | The stated interest rate represents the weighted average interest rate at May 31, 2023 of contracts within the senior loan facility. Interest rates on contracts are primarily determined either weekly, monthly or quarterly by reference to the indicated base lending rate and spread and the reset period. These base lending rates are primarily the LIBOR and other short-term rates. Base lending rates may be subject to a floor or minimum rate. The interest rate for senior loans purchased on a when-issued or delayed delivery basis will be determined upon settlement, therefore no interest rate is disclosed. Senior loans often require prepayments from excess cash flows or permit the borrowers to repay at their election. The degree to which borrowers repay cannot be predicted with accuracy. As a result, remaining maturities of senior loans may be less than the stated maturities. Generally, the Fund is contractually obligated to receive approval from the agent bank and/or borrower prior to the disposition of a senior loan. |
| (g) | Variable rate security. The interest rate shown was the current rate as of May 31, 2023. |
| (h) | The rate shown is the seven-day current annualized yield at May 31, 2023. |
| 16 | Columbia High Yield Bond Fund | Annual Report 2023 |
May 31, 2023
| (i) | As defined in the Investment Company Act of 1940, as amended, an affiliated company is one in which the Fund owns 5% or more of the company’s outstanding voting securities, or a company which is under common ownership or control with the Fund. The value of the holdings and transactions in these affiliated companies during the year ended May 31, 2023 are as follows: |
| Affiliated issuers | Beginning of period($) | Purchases($) | Sales($) | Net change in unrealized appreciation (depreciation)($) | End of period($) | Realized gain (loss)($) | Dividends($) | End of period shares |
| Columbia Short-Term Cash Fund, 5.241% | ||||||||
| 58,145,865 | 360,684,994 | (393,616,618) | (3,014) | 25,211,227 | (7,330) | 1,331,123 | 25,223,839 | |
| LIBOR | London Interbank Offered Rate |
| SOFR | Secured Overnight Financing Rate |
| ■ | Level 1 — Valuations based on quoted prices for investments in active markets that the Fund has the ability to access at the measurement date. Valuation adjustments are not applied to Level 1 investments. |
| ■ | Level 2 — Valuations based on other significant observable inputs (including quoted prices for similar securities, interest rates, prepayment speeds, credit risks, etc.). |
| ■ | Level 3 — Valuations based on significant unobservable inputs (including the Fund’s own assumptions and judgment in determining the fair value of investments). |
| Level 1 ($) | Level 2 ($) | Level 3 ($) | Total ($) | |
| Investments in Securities | ||||
| Convertible Bonds | — | 10,595,271 | — | 10,595,271 |
| Corporate Bonds & Notes | — | 1,172,644,190 | — | 1,172,644,190 |
| Foreign Government Obligations | — | 5,844,590 | — | 5,844,590 |
| Columbia High Yield Bond Fund | Annual Report 2023 | 17 |
May 31, 2023
| Level 1 ($) | Level 2 ($) | Level 3 ($) | Total ($) | |
| Senior Loans | — | 40,438,500 | — | 40,438,500 |
| Money Market Funds | 25,211,227 | — | — | 25,211,227 |
| Total Investments in Securities | 25,211,227 | 1,229,522,551 | — | 1,254,733,778 |
| 18 | Columbia High Yield Bond Fund | Annual Report 2023 |
May 31, 2023
| Assets | |
| Investments in securities, at value | |
| Unaffiliated issuers (cost $1,369,828,990) | $1,229,522,551 |
| Affiliated issuers (cost $25,222,812) | 25,211,227 |
| Cash | 43,362 |
| Receivable for: | |
| Investments sold | 8,285,253 |
| Capital shares sold | 6,159,214 |
| Dividends | 133,730 |
| Interest | 18,884,322 |
| Foreign tax reclaims | 12,326 |
| Expense reimbursement due from Investment Manager | 1,695 |
| Prepaid expenses | 10,401 |
| Total assets | 1,288,264,081 |
| Liabilities | |
| Payable for: | |
| Investments purchased on a delayed delivery basis | 5,221,000 |
| Capital shares purchased | 1,773,731 |
| Distributions to shareholders | 6,064,107 |
| Management services fees | 22,118 |
| Distribution and/or service fees | 3,550 |
| Transfer agent fees | 103,795 |
| Compensation of board members | 185,617 |
| Other expenses | 51,627 |
| Total liabilities | 13,425,545 |
| Net assets applicable to outstanding capital stock | $1,274,838,536 |
| Represented by | |
| Paid in capital | 1,480,314,374 |
| Total distributable earnings (loss) | (205,475,838) |
| Total - representing net assets applicable to outstanding capital stock | $1,274,838,536 |
| Columbia High Yield Bond Fund | Annual Report 2023 | 19 |
May 31, 2023
| Class A | |
| Net assets | $454,105,783 |
| Shares outstanding | 43,983,167 |
| Net asset value per share | $10.32 |
| Maximum sales charge | 4.75% |
| Maximum offering price per share (calculated by dividing the net asset value per share by 1.0 minus the maximum sales charge for Class A shares) | $10.83 |
| Advisor Class | |
| Net assets | $90,530,757 |
| Shares outstanding | 8,718,111 |
| Net asset value per share | $10.38 |
| Class C | |
| Net assets | $10,072,133 |
| Shares outstanding | 981,602 |
| Net asset value per share | $10.26 |
| Institutional Class | |
| Net assets | $135,506,856 |
| Shares outstanding | 13,135,248 |
| Net asset value per share | $10.32 |
| Institutional 2 Class | |
| Net assets | $37,596,124 |
| Shares outstanding | 3,654,150 |
| Net asset value per share | $10.29 |
| Institutional 3 Class | |
| Net assets | $534,874,496 |
| Shares outstanding | 51,897,544 |
| Net asset value per share | $10.31 |
| Class R | |
| Net assets | $12,152,387 |
| Shares outstanding | 1,173,481 |
| Net asset value per share | $10.36 |
| 20 | Columbia High Yield Bond Fund | Annual Report 2023 |
Year Ended May 31, 2023
| Net investment income | |
| Income: | |
| Dividends — unaffiliated issuers | $143,507 |
| Dividends — affiliated issuers | 1,331,123 |
| Interest | 81,985,689 |
| Interfund lending | 3,429 |
| Total income | 83,463,748 |
| Expenses: | |
| Management services fees | 8,611,302 |
| Distribution and/or service fees | |
| Class A | 1,204,318 |
| Class C | 119,621 |
| Class R | 65,514 |
| Transfer agent fees | |
| Class A | 668,204 |
| Advisor Class | 126,927 |
| Class C | 16,567 |
| Institutional Class | 201,072 |
| Institutional 2 Class | 22,180 |
| Institutional 3 Class | 36,903 |
| Class R | 18,175 |
| Compensation of board members | 36,933 |
| Custodian fees | 20,301 |
| Printing and postage fees | 77,051 |
| Registration fees | 130,549 |
| Accounting services fees | 40,290 |
| Legal fees | 30,637 |
| Compensation of chief compliance officer | 260 |
| Other | 32,366 |
| Total expenses | 11,459,170 |
| Fees waived or expenses reimbursed by Investment Manager and its affiliates | (573,353) |
| Fees waived by transfer agent | |
| Institutional 3 Class | (13,204) |
| Expense reduction | (1,520) |
| Total net expenses | 10,871,093 |
| Net investment income | 72,592,655 |
| Realized and unrealized gain (loss) — net | |
| Net realized gain (loss) on: | |
| Investments — unaffiliated issuers | (60,314,831) |
| Investments — affiliated issuers | (7,330) |
| Net realized loss | (60,322,161) |
| Net change in unrealized appreciation (depreciation) on: | |
| Investments — unaffiliated issuers | (26,341,453) |
| Investments — affiliated issuers | (3,014) |
| Net change in unrealized appreciation (depreciation) | (26,344,467) |
| Net realized and unrealized loss | (86,666,628) |
| Net decrease in net assets resulting from operations | $(14,073,973) |
| Columbia High Yield Bond Fund | Annual Report 2023 | 21 |
| Year Ended May 31, 2023 | Year Ended May 31, 2022 | |
| Operations | ||
| Net investment income | $72,592,655 | $74,484,263 |
| Net realized gain (loss) | (60,322,161) | 18,622,436 |
| Net change in unrealized appreciation (depreciation) | (26,344,467) | (170,625,643) |
| Net decrease in net assets resulting from operations | (14,073,973) | (77,518,944) |
| Distributions to shareholders | ||
| Net investment income and net realized gains | ||
| Class A | (25,156,486) | (26,900,181) |
| Advisor Class | (5,005,852) | (4,891,897) |
| Class C | (533,331) | (630,748) |
| Institutional Class | (7,920,009) | (9,121,949) |
| Institutional 2 Class | (2,083,113) | (3,075,117) |
| Institutional 3 Class | (32,349,800) | (36,819,268) |
| Class R | (651,113) | (665,906) |
| Total distributions to shareholders | (73,699,704) | (82,105,066) |
| Decrease in net assets from capital stock activity | (179,067,192) | (115,305,465) |
| Total decrease in net assets | (266,840,869) | (274,929,475) |
| Net assets at beginning of year | 1,541,679,405 | 1,816,608,880 |
| Net assets at end of year | $1,274,838,536 | $1,541,679,405 |
| 22 | Columbia High Yield Bond Fund | Annual Report 2023 |
| Year Ended | Year Ended | |||
| May 31, 2023 | May 31, 2022 | |||
| Shares | Dollars ($) | Shares | Dollars ($) | |
| Capital stock activity | ||||
| Class A | ||||
| Subscriptions | 10,120,058 | 104,911,041 | 10,827,069 | 128,054,269 |
| Distributions reinvested | 2,346,188 | 24,278,141 | 2,204,155 | 25,955,268 |
| Redemptions | (16,974,689) | (176,159,377) | (16,690,545) | (196,638,272) |
| Net decrease | (4,508,443) | (46,970,195) | (3,659,321) | (42,628,735) |
| Advisor Class | ||||
| Subscriptions | 1,505,296 | 15,708,991 | 1,828,617 | 21,812,220 |
| Distributions reinvested | 475,039 | 4,945,830 | 408,710 | 4,833,407 |
| Redemptions | (2,061,542) | (21,531,589) | (1,869,692) | (22,072,873) |
| Net increase (decrease) | (81,207) | (876,768) | 367,635 | 4,572,754 |
| Class C | ||||
| Subscriptions | 126,217 | 1,302,566 | 198,211 | 2,338,402 |
| Distributions reinvested | 50,490 | 519,167 | 52,647 | 616,414 |
| Redemptions | (503,624) | (5,190,192) | (445,364) | (5,183,343) |
| Net decrease | (326,917) | (3,368,459) | (194,506) | (2,228,527) |
| Institutional Class | ||||
| Subscriptions | 3,313,174 | 34,471,305 | 5,608,078 | 65,644,478 |
| Distributions reinvested | 708,035 | 7,321,819 | 733,909 | 8,626,894 |
| Redemptions | (7,108,124) | (73,555,820) | (6,061,963) | (70,700,133) |
| Net increase (decrease) | (3,086,915) | (31,762,696) | 280,024 | 3,571,239 |
| Institutional 2 Class | ||||
| Subscriptions | 2,053,283 | 21,497,765 | 1,833,656 | 21,408,900 |
| Distributions reinvested | 201,065 | 2,073,252 | 256,601 | 3,030,537 |
| Redemptions | (2,002,323) | (20,389,129) | (5,554,423) | (64,914,775) |
| Net increase (decrease) | 252,025 | 3,181,888 | (3,464,166) | (40,475,338) |
| Institutional 3 Class | ||||
| Subscriptions | 2,675,967 | 27,935,680 | 5,482,439 | 63,837,305 |
| Distributions reinvested | 3,029,583 | 31,301,260 | 3,022,342 | 35,510,537 |
| Redemptions | (15,180,244) | (157,017,568) | (12,051,510) | (137,909,489) |
| Net decrease | (9,474,694) | (97,780,628) | (3,546,729) | (38,561,647) |
| Class R | ||||
| Subscriptions | 166,229 | 1,730,267 | 568,721 | 6,746,419 |
| Distributions reinvested | 62,322 | 646,985 | 55,393 | 653,095 |
| Redemptions | (371,081) | (3,867,586) | (592,042) | (6,954,725) |
| Net increase (decrease) | (142,530) | (1,490,334) | 32,072 | 444,789 |
| Total net decrease | (17,368,681) | (179,067,192) | (10,184,991) | (115,305,465) |
| Columbia High Yield Bond Fund | Annual Report 2023 | 23 |
| Net asset value, beginning of period | Net investment income | Net realized and unrealized gain (loss) | Total from investment operations | Distributions from net investment income | Distributions from net realized gains | Total distributions to shareholders | |
| Class A | |||||||
| Year Ended 5/31/2023 | $10.95 | 0.53 | (0.62) | (0.09) | (0.54) | — | (0.54) |
| Year Ended 5/31/2022 | $12.03 | 0.48 | (1.03) | (0.55) | (0.49) | (0.04) | (0.53) |
| Year Ended 5/31/2021(d) | $11.19 | 0.52 | 0.85 | 1.37 | (0.53) | — | (0.53) |
| Year Ended 5/31/2020(d) | $11.44 | 0.56 | (0.25) | 0.31 | (0.56) | — | (0.56) |
| Year Ended 5/31/2019(d) | $11.39 | 0.56 | 0.05 | 0.61 | (0.56) | — | (0.56) |
| Advisor Class | |||||||
| Year Ended 5/31/2023 | $11.01 | 0.56 | (0.62) | (0.06) | (0.57) | — | (0.57) |
| Year Ended 5/31/2022 | $12.10 | 0.51 | (1.04) | (0.53) | (0.52) | (0.04) | (0.56) |
| Year Ended 5/31/2021(d) | $11.26 | 0.55 | 0.85 | 1.40 | (0.56) | — | (0.56) |
| Year Ended 5/31/2020(d) | $11.50 | 0.60 | (0.24) | 0.36 | (0.60) | — | (0.60) |
| Year Ended 5/31/2019(d) | $11.46 | 0.60 | 0.04 | 0.64 | (0.60) | — | (0.60) |
| Class C | |||||||
| Year Ended 5/31/2023 | $10.88 | 0.45 | (0.61) | (0.16) | (0.46) | — | (0.46) |
| Year Ended 5/31/2022 | $11.96 | 0.39 | (1.03) | (0.64) | (0.40) | (0.04) | (0.44) |
| Year Ended 5/31/2021(d) | $11.13 | 0.43 | 0.84 | 1.27 | (0.44) | — | (0.44) |
| Year Ended 5/31/2020(d) | $11.36 | 0.48 | (0.23) | 0.25 | (0.48) | — | (0.48) |
| Year Ended 5/31/2019(d) | $11.32 | 0.48 | 0.04 | 0.52 | (0.48) | — | (0.48) |
| Institutional Class | |||||||
| Year Ended 5/31/2023 | $10.94 | 0.56 | (0.61) | (0.05) | (0.57) | — | (0.57) |
| Year Ended 5/31/2022 | $12.02 | 0.51 | (1.03) | (0.52) | (0.52) | (0.04) | (0.56) |
| Year Ended 5/31/2021(d) | $11.19 | 0.54 | 0.85 | 1.39 | (0.56) | — | (0.56) |
| Year Ended 5/31/2020(d) | $11.43 | 0.60 | (0.24) | 0.36 | (0.60) | — | (0.60) |
| Year Ended 5/31/2019(d) | $11.38 | 0.60 | 0.05 | 0.65 | (0.60) | — | (0.60) |
| Institutional 2 Class | |||||||
| Year Ended 5/31/2023 | $10.91 | 0.57 | (0.62) | (0.05) | (0.57) | — | (0.57) |
| Year Ended 5/31/2022 | $11.99 | 0.52 | (1.03) | (0.51) | (0.53) | (0.04) | (0.57) |
| Year Ended 5/31/2021(d) | $11.16 | 0.55 | 0.85 | 1.40 | (0.57) | — | (0.57) |
| Year Ended 5/31/2020(d) | $11.39 | 0.60 | (0.23) | 0.37 | (0.60) | — | (0.60) |
| Year Ended 5/31/2019(d) | $11.35 | 0.60 | 0.04 | 0.64 | (0.60) | — | (0.60) |
| 24 | Columbia High Yield Bond Fund | Annual Report 2023 |
| Net asset value, end of period | Total return | Total gross expense ratio to average net assets(a) | Total net expense ratio to average net assets(a),(b) | Net investment income ratio to average net assets | Portfolio turnover | Net assets, end of period (000’s) | |
| Class A | |||||||
| Year Ended 5/31/2023 | $10.32 | (0.68%) | 1.05% | 1.00%(c) | 5.14% | 30% | $454,106 |
| Year Ended 5/31/2022 | $10.95 | (4.78%) | 1.02% | 1.00%(c) | 4.03% | 47% | $530,844 |
| Year Ended 5/31/2021(d) | $12.03 | 12.35% | 1.03% | 1.01%(c) | 4.39% | 58% | $627,451 |
| Year Ended 5/31/2020(d) | $11.19 | 2.82% | 1.04% | 1.03%(c) | 4.86% | 59% | $617,031 |
| Year Ended 5/31/2019(d) | $11.44 | 5.47% | 1.04% | 1.04%(c) | 4.93% | 41% | $692,138 |
| Advisor Class | |||||||
| Year Ended 5/31/2023 | $10.38 | (0.40%) | 0.80% | 0.75%(c) | 5.40% | 30% | $90,531 |
| Year Ended 5/31/2022 | $11.01 | (4.58%) | 0.77% | 0.75%(c) | 4.29% | 47% | $96,886 |
| Year Ended 5/31/2021(d) | $12.10 | 12.89% | 0.78% | 0.76%(c) | 4.63% | 58% | $102,028 |
| Year Ended 5/31/2020(d) | $11.26 | 3.08% | 0.79% | 0.78%(c) | 5.11% | 59% | $98,512 |
| Year Ended 5/31/2019(d) | $11.50 | 5.36% | 0.79% | 0.79%(c) | 5.17% | 41% | $88,582 |
| Class C | |||||||
| Year Ended 5/31/2023 | $10.26 | (1.37%) | 1.80% | 1.75%(c) | 4.37% | 30% | $10,072 |
| Year Ended 5/31/2022 | $10.88 | (5.54%) | 1.77% | 1.75%(c) | 3.28% | 47% | $14,237 |
| Year Ended 5/31/2021(d) | $11.96 | 11.66% | 1.78% | 1.76%(c) | 3.65% | 58% | $17,974 |
| Year Ended 5/31/2020(d) | $11.13 | 2.03% | 1.79% | 1.78%(c) | 4.12% | 59% | $26,532 |
| Year Ended 5/31/2019(d) | $11.36 | 4.68% | 1.79% | 1.79%(c) | 4.17% | 41% | $34,097 |
| Institutional Class | |||||||
| Year Ended 5/31/2023 | $10.32 | (0.34%) | 0.80% | 0.75%(c) | 5.38% | 30% | $135,507 |
| Year Ended 5/31/2022 | $10.94 | (4.55%) | 0.77% | 0.75%(c) | 4.28% | 47% | $177,452 |
| Year Ended 5/31/2021(d) | $12.02 | 12.54% | 0.78% | 0.76%(c) | 4.63% | 58% | $191,648 |
| Year Ended 5/31/2020(d) | $11.19 | 3.07% | 0.79% | 0.78%(c) | 5.11% | 59% | $171,521 |
| Year Ended 5/31/2019(d) | $11.43 | 5.73% | 0.79% | 0.79%(c) | 5.17% | 41% | $174,135 |
| Institutional 2 Class | |||||||
| Year Ended 5/31/2023 | $10.29 | (0.29%) | 0.72% | 0.68% | 5.46% | 30% | $37,596 |
| Year Ended 5/31/2022 | $10.91 | (4.51%) | 0.70% | 0.68% | 4.30% | 47% | $37,114 |
| Year Ended 5/31/2021(d) | $11.99 | 12.74% | 0.71% | 0.69% | 4.70% | 58% | $82,319 |
| Year Ended 5/31/2020(d) | $11.16 | 3.14% | 0.72% | 0.71% | 5.15% | 59% | $95,933 |
| Year Ended 5/31/2019(d) | $11.39 | 5.82% | 0.71% | 0.71% | 5.23% | 41% | $77,805 |
| Columbia High Yield Bond Fund | Annual Report 2023 | 25 |
| Net asset value, beginning of period | Net investment income | Net realized and unrealized gain (loss) | Total from investment operations | Distributions from net investment income | Distributions from net realized gains | Total distributions to shareholders | |
| Institutional 3 Class | |||||||
| Year Ended 5/31/2023 | $10.93 | 0.57 | (0.61) | (0.04) | (0.58) | — | (0.58) |
| Year Ended 5/31/2022 | $12.01 | 0.52 | (1.03) | (0.51) | (0.53) | (0.04) | (0.57) |
| Year Ended 5/31/2021(d) | $11.17 | 0.55 | 0.86 | 1.41 | (0.57) | — | (0.57) |
| Year Ended 5/31/2020(d) | $11.41 | 0.60 | (0.24) | 0.36 | (0.60) | — | (0.60) |
| Year Ended 5/31/2019(d) | $11.37 | 0.60 | 0.04 | 0.64 | (0.60) | — | (0.60) |
| Class R | |||||||
| Year Ended 5/31/2023 | $10.98 | 0.51 | (0.61) | (0.10) | (0.52) | — | (0.52) |
| Year Ended 5/31/2022 | $12.07 | 0.45 | (1.04) | (0.59) | (0.46) | (0.04) | (0.50) |
| Year Ended 5/31/2021(d) | $11.23 | 0.49 | 0.85 | 1.34 | (0.50) | — | (0.50) |
| Year Ended 5/31/2020(d) | $11.47 | 0.52 | (0.24) | 0.28 | (0.52) | — | (0.52) |
| Year Ended 5/31/2019(d) | $11.43 | 0.52 | 0.04 | 0.56 | (0.52) | — | (0.52) |
| Notes to Financial Highlights | |
| (a) | In addition to the fees and expenses that the Fund bears directly, the Fund indirectly bears a pro rata share of the fees and expenses of any other funds in which it invests. Such indirect expenses are not included in the Fund’s reported expense ratios. |
| (b) | Total net expenses include the impact of certain fee waivers/expense reimbursements made by the Investment Manager and certain of its affiliates, if applicable. |
| (c) | The benefits derived from expense reductions had an impact of less than 0.01%. |
| (d) | Per share amounts have been adjusted on a retroactive basis to reflect a 4 to 1 reverse stock split completed after the close of business on September 11, 2020. |
| 26 | Columbia High Yield Bond Fund | Annual Report 2023 |
| Net asset value, end of period | Total return | Total gross expense ratio to average net assets(a) | Total net expense ratio to average net assets(a),(b) | Net investment income ratio to average net assets | Portfolio turnover | Net assets, end of period (000’s) | |
| Institutional 3 Class | |||||||
| Year Ended 5/31/2023 | $10.31 | (0.23%) | 0.67% | 0.63% | 5.50% | 30% | $534,874 |
| Year Ended 5/31/2022 | $10.93 | (4.44%) | 0.65% | 0.63% | 4.40% | 47% | $670,696 |
| Year Ended 5/31/2021(d) | $12.01 | 12.99% | 0.67% | 0.64% | 4.70% | 58% | $779,695 |
| Year Ended 5/31/2020(d) | $11.17 | 3.19% | 0.66% | 0.66% | 5.23% | 59% | $323,763 |
| Year Ended 5/31/2019(d) | $11.41 | 5.87% | 0.66% | 0.66% | 5.29% | 41% | $385,410 |
| Class R | |||||||
| Year Ended 5/31/2023 | $10.36 | (0.82%) | 1.30% | 1.25%(c) | 4.89% | 30% | $12,152 |
| Year Ended 5/31/2022 | $10.98 | (5.07%) | 1.27% | 1.25%(c) | 3.79% | 47% | $14,451 |
| Year Ended 5/31/2021(d) | $12.07 | 12.05% | 1.28% | 1.26%(c) | 4.13% | 58% | $15,494 |
| Year Ended 5/31/2020(d) | $11.23 | 2.57% | 1.29% | 1.28%(c) | 4.61% | 59% | $13,930 |
| Year Ended 5/31/2019(d) | $11.47 | 5.21% | 1.29% | 1.29%(c) | 4.68% | 41% | $19,019 |
| Columbia High Yield Bond Fund | Annual Report 2023 | 27 |
May 31, 2023
| 28 | Columbia High Yield Bond Fund | Annual Report 2023 |
May 31, 2023
| Columbia High Yield Bond Fund | Annual Report 2023 | 29 |
May 31, 2023
| 30 | Columbia High Yield Bond Fund | Annual Report 2023 |
May 31, 2023
| Columbia High Yield Bond Fund | Annual Report 2023 | 31 |
May 31, 2023
| Effective rate (%) | |
| Class A | 0.14 |
| Advisor Class | 0.14 |
| Class C | 0.14 |
| Institutional Class | 0.14 |
| Institutional 2 Class | 0.06 |
| Institutional 3 Class | 0.00 |
| Class R | 0.14 |
| 32 | Columbia High Yield Bond Fund | Annual Report 2023 |
May 31, 2023
| Front End (%) | CDSC (%) | Amount ($) | |
| Class A | 4.75 | 0.50 - 1.00(a) | 94,163 |
| Class C | — | 1.00(b) | 1,749 |
| (a) | This charge is imposed on certain investments of between $1 million and $50 million redeemed within 18 months after purchase, as follows: 1.00% if redeemed within 12 months after purchase, and 0.50% if redeemed more than 12, but less than 18, months after purchase, with certain limited exceptions. |
| (b) | This charge applies to redemptions within 12 months after purchase, with certain limited exceptions. |
| Fee rate(s) contractual through September 30, 2023 | |
| Class A | 1.00% |
| Advisor Class | 0.75 |
| Class C | 1.75 |
| Institutional Class | 0.75 |
| Institutional 2 Class | 0.68 |
| Institutional 3 Class | 0.63 |
| Class R | 1.25 |
| Columbia High Yield Bond Fund | Annual Report 2023 | 33 |
May 31, 2023
| Undistributed net investment income ($) | Accumulated net realized (loss) ($) | Paid in capital ($) |
| 835,005 | (835,005) | — |
| Year Ended May 31, 2023 | Year Ended May 31, 2022 | ||||
| Ordinary income ($) | Long-term capital gains ($) | Total ($) | Ordinary income ($) | Long-term capital gains ($) | Total ($) |
| 73,699,704 | — | 73,699,704 | 82,105,066 | — | 82,105,066 |
| Undistributed ordinary income ($) | Undistributed long-term capital gains ($) | Capital loss carryforwards ($) | Net unrealized (depreciation) ($) |
| 6,845,892 | — | (64,053,128) | (142,021,628) |
| Federal tax cost ($) | Gross unrealized appreciation ($) | Gross unrealized (depreciation) ($) | Net unrealized (depreciation) ($) |
| 1,396,755,406 | 2,778,184 | (144,799,812) | (142,021,628) |
| No expiration short-term ($) | No expiration long-term ($) | Total ($) | Utilized ($) |
| (19,383,845) | (44,669,283) | (64,053,128) | — |
| 34 | Columbia High Yield Bond Fund | Annual Report 2023 |
May 31, 2023
| Borrower or lender | Average loan balance ($) | Weighted average interest rate (%) | Number of days with outstanding loans |
| Lender | 2,977,778 | 4.34 | 9 |
| Columbia High Yield Bond Fund | Annual Report 2023 | 35 |
May 31, 2023
| 36 | Columbia High Yield Bond Fund | Annual Report 2023 |
May 31, 2023
| Columbia High Yield Bond Fund | Annual Report 2023 | 37 |
| 38 | Columbia High Yield Bond Fund | Annual Report 2023 |
| Section 163(j) Interest Dividends | |
| 99.90% |
| Name, address, year of birth | Position held with the Columbia Funds and length of service | Principal occupation(s) during past five years and other relevant professional experience | Number of Funds in the Columbia Funds Complex* overseen | Other directorships held by Trustee during the past five years and other relevant Board experience |
| George S. Batejan c/o Columbia Management Investment Advisers, LLC 290 Congress Street Boston, MA 02210 1954 | Trustee since 2017 | Executive Vice President, Global Head of Technology and Operations, Janus Capital Group, Inc., 2010-2016 | 174 | Former Chairman of the Board, NICSA (National Investment Company Services Association) (Executive Committee, Nominating Committee and Governance Committee), 2014-2016; former Director, Intech Investment Management, 2011-2016; former Board Member, Metro Denver Chamber of Commerce, 2015-2016; former Advisory Board Member, University of Colorado Business School, 2015-2018; former Board Member, Chase Bank International, 1993-1994 |
| Columbia High Yield Bond Fund | Annual Report 2023 | 39 |
(Unaudited)
Independent trustees (continued)
| Name, address, year of birth | Position held with the Columbia Funds and length of service | Principal occupation(s) during past five years and other relevant professional experience | Number of Funds in the Columbia Funds Complex* overseen | Other directorships held by Trustee during the past five years and other relevant Board experience |
| Kathleen Blatz c/o Columbia Management Investment Advisers, LLC 290 Congress Street Boston, MA 02210 1954 | Trustee since 2006 | Attorney, specializing in arbitration and mediation; Chief Justice, Minnesota Supreme Court, 1998-2006; Associate Justice, Minnesota Supreme Court, 1996-1998; Fourth Judicial District Court Judge, Hennepin County, 1994-1996; Attorney in private practice and public service, 1984-1993; State Representative, Minnesota House of Representatives, 1979-1993, which included service on the Tax and Financial Institutions and Insurance Committees; Member and Interim Chair, Minnesota Sports Facilities Authority, January-July 2017; Interim President and Chief Executive Officer, Blue Cross and Blue Shield of Minnesota (health care insurance), February-July 2018, April-October 2021 | 174 | Former Trustee, Blue Cross and Blue Shield of Minnesota, 2009-2021 (Chair of the Business Development Committee, 2014-2017; Chair of the Governance Committee, 2017-2019); former Member and Chair of the Board, Minnesota Sports Facilities Authority, January 2017-July 2017; former Director, Robina Foundation, 2009-2020 (Chair, 2014-2020); Director, Richard M. Schulze Family Foundation, since 2021 |
| Pamela G. Carlton c/o Columbia Management Investment Advisers, LLC 290 Congress Street Boston, MA 02210 1954 | Chair since 2023; Trustee since 2007 | President, Springboard — Partners in Cross Cultural Leadership (consulting company), since 2003; Managing Director of US Equity Research, JP Morgan Chase, 1999-2003; Director of US Equity Research, Chase Asset Management, 1996-1999; Co-Director Latin America Research, 1993-1996, COO Global Research, 1992-1996, Co-Director of US Research, 1991-1992, Investment Banker, 1982-1991, Morgan Stanley; Attorney, Cleary Gottlieb Steen & Hamilton LLP, 1980-1982 | 174 | Trustee, New York Presbyterian Hospital Board, since 1996; Director, DR Bank (Audit Committee) since 2017; Director, Evercore Inc. (Audit Committee, Nominating and Governance Committee), since 2019; Director, Apollo Commercial Real Estate Finance, Inc. (Chair, Nominating and Governance Committee) (financial services), since 2021; the Governing Council of the Independent Directors Council (IDC), since 2021 |
| Janet Langford Carrig c/o Columbia Management Investment Advisers, LLC 290 Congress Street Boston, MA 02210 1957 | Trustee since 1996 | Senior Vice President, General Counsel and Corporate Secretary, ConocoPhillips (independent energy company), September 2007-October 2018 | 174 | Director, EQT Corporation (natural gas producer), since 2019; former Director, Whiting Petroleum Corporation (independent oil and gas company), 2020-2022 |
| J. Kevin Connaughton c/o Columbia Management Investment Advisers, LLC 290 Congress Street Boston, MA 02210 1964 | Trustee since 2020 | CEO and President, RhodeWay Financial (non-profit financial planning firm), since December 2022; Member, FINRA National Adjudicatory Council, since January 2020; Adjunct Professor of Finance, Bentley University since January 2018; Consultant to Independent Trustees of CFVIT and CFST I from March 2016 to June 2020 with respect to CFVIT and to December 2020 with respect to CFST I; Managing Director and General Manager of Mutual Fund Products, Columbia Management Investment Advisers, LLC, May 2010-February 2015; President, Columbia Funds, 2008-2015; and senior officer of Columbia Funds and affiliated funds, 2003-2015 | 172 | Former Director, The Autism Project, March 2015-December 2021; former Member of the Investment Committee, St. Michael’s College, November 2015-February 2020; former Trustee, St. Michael’s College, June 2017-September 2019; former Trustee, New Century Portfolios (former mutual fund complex), January 2015-December 2017 |
| 40 | Columbia High Yield Bond Fund | Annual Report 2023 |
(Unaudited)
Independent trustees (continued)
| Name, address, year of birth | Position held with the Columbia Funds and length of service | Principal occupation(s) during past five years and other relevant professional experience | Number of Funds in the Columbia Funds Complex* overseen | Other directorships held by Trustee during the past five years and other relevant Board experience |
| Olive M. Darragh c/o Columbia Management Investment Advisers, LLC 290 Congress Street Boston, MA 02210 1962 | Trustee since 2020 | Managing Director of Darragh Inc. (strategy and talent management consulting firm), since 2010; Founder and CEO, Zolio, Inc. (investment management talent identification platform), since 2004; Consultant to Independent Trustees of CFVIT and CFST I from June 2019 to June 2020 with respect to CFVIT and to December 2020 with respect to CFST I; Partner, Tudor Investments, 2004-2010; Senior Partner, McKinsey & Company (consulting), 1990-2004; Touche Ross CPA, 1985-1988 | 172 | Treasurer, Edinburgh University US Trust Board, since January 2023; Member, HBS Community Action Partners Board, since September 2022; former Director, University of Edinburgh Business School (Member of US Board), 2004-2019; former Director, Boston Public Library Foundation, 2008-2017 |
| Patricia M. Flynn c/o Columbia Management Investment Advisers, LLC 290 Congress Street Boston, MA 02210 1950 | Trustee since 2004 | Professor of Economics and Management, Bentley University, since 2002; Dean, McCallum Graduate School of Business, Bentley University, 1992-2002 | 174 | Former Trustee, MA Taxpayers Foundation, 1997-2022; former Director, The MA Business Roundtable, 2003-2019; former Chairperson, Innovation Index Advisory Committee, MA Technology Collaborative, 1997-2020 |
| Brian J. Gallagher c/o Columbia Management Investment Advisers, LLC 290 Congress Street Boston, MA 02210 1954 | Trustee since 2017 | Retired; Partner with Deloitte & Touche LLP and its predecessors, 1977-2016 | 174 | Trustee, Catholic Schools Foundation, since 2004 |
| Douglas A. Hacker c/o Columbia Management Investment Advisers, LLC 290 Congress Street Boston, MA 02210 1955 | Trustee since 1996 | Independent business executive, since May 2006; Executive Vice President – Strategy of United Airlines, December 2002 - May 2006; President of UAL Loyalty Services (airline marketing company), September 2001-December 2002; Executive Vice President and Chief Financial Officer of United Airlines, July 1999-September 2001 | 174 | Director, SpartanNash Company since November 2013 (Chair of the Board, since May 2021) (food distributor); Director, Aircastle Limited (Chair of Audit Committee) (aircraft leasing), since August 2006; former Director, Nash Finch Company (food distributor), 2005-2013; former Director, SeaCube Container Leasing Ltd. (container leasing), 2010-2013; and former Director, Travelport Worldwide Limited (travel information technology), 2014-2019 |
| Nancy T. Lukitsh c/o Columbia Management Investment Advisers, LLC 290 Congress Street Boston, MA 02210 1956 | Trustee since 2011 | Senior Vice President, Partner and Director of Marketing, Wellington Management Company, LLP (investment adviser), 1997-2010; Chair, Wellington Management Portfolios (commingled non-U.S. investment pools), 2007-2010; Director, Wellington Trust Company, NA and other Wellington affiliates, 1997-2010 | 172 | None |
| Columbia High Yield Bond Fund | Annual Report 2023 | 41 |
(Unaudited)
Independent trustees (continued)
| Name, address, year of birth | Position held with the Columbia Funds and length of service | Principal occupation(s) during past five years and other relevant professional experience | Number of Funds in the Columbia Funds Complex* overseen | Other directorships held by Trustee during the past five years and other relevant Board experience |
| David M. Moffett c/o Columbia Management Investment Advisers, LLC 290 Congress Street Boston, MA 02210 1952 | Trustee since 2011 | Retired; former Chief Executive Officer of Freddie Mac and Chief Financial Officer of U.S. Bank | 172 | Director, CSX Corporation (transportation suppliers); Director, PayPal Holdings Inc. (payment and data processing services); Trustee, University of Oklahoma Foundation; former Director, eBay Inc. (online trading community), 2007-2015; and former Director, CIT Bank, CIT Group Inc. (commercial and consumer finance), 2010-2016; former Senior Adviser to The Carlyle Group (financial services), March 2008-September 2008; former Governance Consultant to Bridgewater Associates, January 2013-December 2015 |
| Catherine James Paglia c/o Columbia Management Investment Advisers, LLC 290 Congress Street Boston, MA 02210 1952 | Trustee since 2004 | Director, Enterprise Asset Management, Inc. (private real estate and asset management company), since September 1998; Managing Director and Partner, Interlaken Capital, Inc., 1989-1997; Vice President, 1982-1985, Principal, 1985-1987, Managing Director, 1987-1989, Morgan Stanley; Vice President, Investment Banking, 1980-1982, Associate, Investment Banking, 1976-1980, Dean Witter Reynolds, Inc. | 174 | Director, Valmont Industries, Inc. (irrigation systems manufacturer), since 2012; Trustee, Carleton College (on the Investment Committee), since 1987; Trustee, Carnegie Endowment for International Peace (on the Investment Committee), since 2009 |
| Natalie A. Trunow c/o Columbia Management Investment Advisers, LLC 290 Congress Street Boston, MA 02210 1967 | Trustee since 2020 | Chief Executive Officer, Millennial Portfolio Solutions LLC (asset management and consulting services), January 2016-January 2021; Non-executive Member of the Investment Committee and Valuation Committee, Sarona Asset Management Inc. (private equity firm) since September 2019; Advisor, Horizon Investments (asset management and consulting services), August 2018-January 2022; Advisor, Paradigm Asset Management, November 2016-January 2022; Consultant to Independent Trustees of CFVIT and CFST I from September 2016 to June 2020 with respect to CFVIT and to December 2020 with respect to CFST I; Director of Investments/Consultant, Casey Family Programs, April 2016-November 2016; Senior Vice President and Chief Investment Officer, Calvert Investments, August 2008-January 2016; Section Head and Portfolio Manager, General Motors Asset Management, June 1997-August 2008 | 172 | Independent Director, Investment Committee, Health Services for Children with Special Needs, Inc., 2010-2021; Independent Director, (Executive Committee and Chair, Audit Committee), Consumer Credit Counseling Services (formerly Guidewell Financial Solutions), since 2016; Independent Director, (Investment Committee), Sarona Asset Management, since 2019 |
| 42 | Columbia High Yield Bond Fund | Annual Report 2023 |
(Unaudited)
Independent trustees (continued)
| Name, address, year of birth | Position held with the Columbia Funds and length of service | Principal occupation(s) during past five years and other relevant professional experience | Number of Funds in the Columbia Funds Complex* overseen | Other directorships held by Trustee during the past five years and other relevant Board experience |
| Sandra L. Yeager c/o Columbia Management Investment Advisers, LLC 290 Congress Street Boston, MA 02210 1964 | Trustee since 2017 | Retired; President and founder, Hanoverian Capital, LLC (SEC registered investment advisor firm), 2008-2016; Managing Director, DuPont Capital, 2006-2008; Managing Director, Morgan Stanley Investment Management, 2004-2006; Senior Vice President, Alliance Bernstein, 1990-2004 | 174 | Former Director, NAPE (National Alliance for Partnerships in Equity) Education Foundation, October 2016-October 2020; Advisory Board, Jennersville YMCA, since 2022 |
| Name, address, year of birth | Position held with the Columbia Funds and length of service | Principal occupation(s) during the past five years and other relevant professional experience | Number of Funds in the Columbia Funds Complex overseen | Other directorships held by Trustee during the past five years and other relevant Board experience |
| Daniel J. Beckman c/o Columbia Management Investment Advisers, LLC 290 Congress Street Boston, MA 02210 1962 | Trustee since November 2021 and President since June 2021 | Vice President – Head of North America Product, Columbia Management Investment Advisers, LLC, since April 2015; President and Principal Executive Officer of the Columbia Funds, since June 2021; officer of Columbia Funds and affiliated funds, 2020-2021 | 174 | Director, Ameriprise Trust Company, since October 2016; Director, Columbia Management Investment Distributors, Inc. since November 2018; Board of Governors, Columbia Wanger Asset Management, LLC since, January 2022; Director, Columbia Threadneedle Canada, Inc., since December 2022 |
| * | The term “Columbia Funds Complex” as used herein includes Columbia Seligman Premium Technology Growth Fund, Tri-Continental Corporation and each series of Columbia Funds Series Trust (CFST), Columbia Funds Series Trust I (CFST I), Columbia Funds Series Trust II (CFST II), Columbia ETF Trust I (CET I), Columbia ETF Trust II (CET II), Columbia Funds Variable Insurance Trust (CFVIT) and Columbia Funds Variable Series Trust II (CFVST II). Messrs. Batejan, Beckman, Gallagher and Hacker and Mses. Blatz, Carlton, Carrig, Flynn, Paglia, and Yeager serve as directors of Columbia Seligman Premium Technology Growth Fund and Tri-Continental Corporation. |
| ** | Interested person (as defined under the 1940 Act) by reason of being an officer, director, security holder and/or employee of the Investment Manager or Ameriprise Financial. |
| Columbia High Yield Bond Fund | Annual Report 2023 | 43 |
(Unaudited)
The Board has appointed officers who are responsible for day-to-day business decisions based on policies it has established. The officers serve at the pleasure of the Board. The following table provides basic information about the Officers of the Fund as of the printing of this report, including principal occupations during the past five years, although their specific titles may have varied over the period. In addition to Mr. Beckman, who is President and Principal Executive Officer, the Fund’s other officers are:
| Name, address and year of birth | Position and year first appointed to position for any Fund in the Columbia Funds Complex or a predecessor thereof | Principal occupation(s) during past five years |
| Michael G. Clarke 290 Congress Street Boston, MA 02210 1969 | Chief Financial Officer and Principal Financial Officer (2009) and Senior Vice President (2019) | Senior Vice President and North America Head of Operations & Investor Services, Columbia Management Investment Advisers, LLC, since June 2023 (previously Senior Vice President and Head of Global Operations, March 2022 – June 2023, Vice President, Head of North America Operations, and Co-Head of Global Operations, June 2019 - February 2022 and Vice President – Accounting and Tax, May 2010 - May 2019); senior officer of Columbia Funds and affiliated funds, since 2002. Director, Ameriprise Trust Company, since June 2023. |
| Joseph Beranek 5890 Ameriprise Financial Center Minneapolis, MN 55474 1965 | Treasurer and Chief Accounting Officer (Principal Accounting Officer) (2019) and Principal Financial Officer (2020), CFST, CFST I, CFST II, CFVIT and CFVST II; Assistant Treasurer, CET I and CET II | Vice President – Mutual Fund Accounting and Financial Reporting, Columbia Management Investment Advisers, LLC, since December 2018 and March 2017, respectively. |
| Marybeth Pilat 290 Congress Street Boston, MA 02210 1968 | Treasurer and Chief Accounting Officer (Principal Accounting Officer) and Principal Financial Officer (2020) for CET I and CET II; Assistant Treasurer, CFST, CFST I, CFST II, CFVIT and CFVST II | Vice President – Product Pricing and Administration, Columbia Management Investment Advisers, LLC, since May 2017. |
| William F. Truscott 290 Congress Street Boston, MA 02210 1960 | Senior Vice President (2001) | Formerly, Trustee/Director of Columbia Funds Complex or legacy funds, November 2001 - January 1, 2021; Chief Executive Officer, Global Asset Management, Ameriprise Financial, Inc., since September 2012; Chairman of the Board and President, Columbia Management Investment Advisers, LLC, since July 2004 and February 2012, respectively; Chairman of the Board and Chief Executive Officer, Columbia Management Investment Distributors, Inc., since November 2008 and February 2012, respectively;Chairman of the Board and Director, Threadneedle Asset Management Holdings, Sàrl, since March 2013 and December 2008, respectively; senior executive of various entities affiliated with Columbia Threadneedle. |
| Christopher O. Petersen 5228 Ameriprise Financial Center Minneapolis, MN 55474 1970 | Senior Vice President and Assistant Secretary (2021) | Formerly, Trustee/Director of funds within the Columbia Funds Complex, July 1, 2020 - November 22, 2021; Senior Vice President and Assistant General Counsel, Ameriprise Financial, Inc., since September 2021 (previously Vice President and Lead Chief Counsel, January 2015 - September 2021); formerly, President and Principal Executive Officer of the Columbia Funds, 2015 - 2021; officer of Columbia Funds and affiliated funds, since 2007. |
| Thomas P. McGuire 290 Congress Street Boston, MA 02210 1972 | Senior Vice President and Chief Compliance Officer (2012) | Vice President – Asset Management Compliance, Ameriprise Financial, Inc., since May 2010; Chief Compliance Officer, Columbia Acorn/Wanger Funds, since December 2015; formerly, Chief Compliance Officer, Ameriprise Certificate Company, September 2010 – September 2020. |
| Ryan C. Larrenaga 290 Congress Street Boston, MA 02210 1970 | Senior Vice President (2017), Chief Legal Officer (2017), and Secretary (2015) | Vice President and Chief Counsel, Ameriprise Financial, Inc., since August 2018 (previously Vice President and Group Counsel, August 2011 - August 2018); Chief Legal Officer, Columbia Acorn/Wanger Funds, since September 2020; officer of Columbia Funds and affiliated funds, since 2005. |
| 44 | Columbia High Yield Bond Fund | Annual Report 2023 |
(Unaudited)
Fund officers (continued)
| Name, address and year of birth | Position and year first appointed to position for any Fund in the Columbia Funds Complex or a predecessor thereof | Principal occupation(s) during past five years |
| Michael E. DeFao 290 Congress Street Boston, MA 02210 1968 | Vice President (2011) and Assistant Secretary (2010) | Vice President and Chief Counsel, Ameriprise Financial, Inc., since May 2010; Vice President, Chief Legal Officer and Assistant Secretary, Columbia Management Investment Advisers, LLC, since October 2021 (previously Vice President and Assistant Secretary, May 2010 – September 2021). |
| Lyn Kephart-Strong 5903 Ameriprise Financial Center Minneapolis, MN 55474 1960 | Vice President (2015) | Vice President, Global Investment Operations Services, Columbia Management Investment Advisers, LLC, since 2010; Director (since January 2007) and President (since October 2014), Columbia Management Investment Services Corp.; Director (since December 2017) and President (since January 2017), Ameriprise Trust Company. |
| • | the Fund had sufficient liquidity to both meet redemptions and operate effectively on behalf of shareholders; |
| • | there were no material changes to the Program during the period; |
| • | the implementation of the Program was effective to manage the Fund’s liquidity risk; and |
| • | the Program operated adequately during the period. |
| Columbia High Yield Bond Fund | Annual Report 2023 | 45 |
columbiathreadneedleus.com/investor/. The Fund is distributed by Columbia Management Investment Distributors, Inc., member FINRA, and managed by Columbia Management Investment Advisers, LLC.

May 31, 2023

| 3 | |
| 5 | |
| 7 | |
| 8 | |
| 12 | |
| 14 | |
| 15 | |
| 18 | |
| 22 | |
| 31 | |
| 32 | |
| 32 | |
| 38 |
(Unaudited)

| Average annual total returns (%) (for the period ended May 31, 2023) | |||||
| Inception | 1 Year | 5 Years | 10 Years | ||
| Class A | Excluding sales charges | 08/01/88 | -7.70 | 6.83 | 7.84 |
| Including sales charges | -13.02 | 5.58 | 7.20 | ||
| Advisor Class | 11/08/12 | -7.49 | 7.11 | 8.10 | |
| Class C | Excluding sales charges | 06/26/00 | -8.41 | 6.04 | 7.03 |
| Including sales charges | -9.27 | 6.04 | 7.03 | ||
| Institutional Class | 09/27/10 | -7.48 | 7.11 | 8.10 | |
| Institutional 2 Class | 08/01/08 | -7.44 | 7.16 | 8.18 | |
| Institutional 3 Class | 11/08/12 | -7.41 | 7.20 | 8.23 | |
| Class R | 08/01/08 | -7.93 | 6.57 | 7.56 | |
| MSCI USA High Dividend Yield Index (Net) | -6.46 | 5.69 | 8.27 | ||
| Russell 1000 Value Index | -4.55 | 6.78 | 8.42 | ||
| Columbia Dividend Opportunity Fund | Annual Report 2023 | 3 |
(Unaudited)

| Portfolio breakdown (%) (at May 31, 2023) | |
| Common Stocks | 97.7 |
| Convertible Preferred Stocks | 2.3 |
| Money Market Funds | 0.0(a) |
| Total | 100.0 |
| (a) | Rounds to zero. |
| Equity sector breakdown (%) (at May 31, 2023) | |
| Communication Services | 4.2 |
| Consumer Discretionary | 4.5 |
| Consumer Staples | 14.4 |
| Energy | 10.9 |
| Financials | 18.1 |
| Health Care | 15.9 |
| Industrials | 5.9 |
| Information Technology | 9.5 |
| Materials | 1.9 |
| Real Estate | 7.2 |
| Utilities | 7.5 |
| Total | 100.0 |
| 4 | Columbia Dividend Opportunity Fund | Annual Report 2023 |
(Unaudited)
| • | The Fund’s underperformance of its benchmark was driven primarily by sector allocations during the period, most notably overweighted allocations to the financials and energy sectors and an allocation to the real estate sector. |
| • | Selections within the materials and consumer discretionary sectors also weighed on results versus the benchmark. |
| Columbia Dividend Opportunity Fund | Annual Report 2023 | 5 |
(Unaudited)
| • | Individual securities that detracted most from the Fund’s performance relative to the benchmark included Bank of America Corp., real estate investment trusts Crown Castle, Inc. and Medical Properties Trust, Inc., consumer and commercial products manufacturer Newell Brands, Inc. and Canadian fertilizer company Nutrien Ltd. |
| • | The Fund sold its positions in Crown Castle, Medical Properties Trust and Newell Brands during the period. |
| • | Strong broad-based security selections contributed to Fund performance versus the benchmark, particularly within the financials, energy, health care and information technology sectors. |
| • | Underweighted allocations to the communication services and health care sectors, both of which returned negative performance for the benchmark, also contributed to relative results. |
| • | Individual Fund holdings that contributed most to Fund performance versus the benchmark during the period included energy giant Exxon Mobil Corp., healthcare company CVS Health Corp., financial services company JPMorgan Chase & Co., semiconductor company Intel Corp. and medical device company Medtronic PLC. |
| • | The Fund sold its position in Intel during the period. |
| 6 | Columbia Dividend Opportunity Fund | Annual Report 2023 |
(Unaudited)
| December 1, 2022 — May 31, 2023 | |||||||
| Account value at the beginning of the period ($) | Account value at the end of the period ($) | Expenses paid during the period ($) | Fund’s annualized expense ratio (%) | ||||
| Actual | Hypothetical | Actual | Hypothetical | Actual | Hypothetical | Actual | |
| Class A | 1,000.00 | 1,000.00 | 914.70 | 1,019.95 | 4.77 | 5.04 | 1.00 |
| Advisor Class | 1,000.00 | 1,000.00 | 915.80 | 1,021.19 | 3.58 | 3.78 | 0.75 |
| Class C | 1,000.00 | 1,000.00 | 911.30 | 1,016.21 | 8.34 | 8.80 | 1.75 |
| Institutional Class | 1,000.00 | 1,000.00 | 915.90 | 1,021.19 | 3.58 | 3.78 | 0.75 |
| Institutional 2 Class | 1,000.00 | 1,000.00 | 915.90 | 1,021.39 | 3.39 | 3.58 | 0.71 |
| Institutional 3 Class | 1,000.00 | 1,000.00 | 916.10 | 1,021.64 | 3.15 | 3.33 | 0.66 |
| Class R | 1,000.00 | 1,000.00 | 913.80 | 1,018.70 | 5.96 | 6.29 | 1.25 |
| Columbia Dividend Opportunity Fund | Annual Report 2023 | 7 |
May 31, 2023
| Common Stocks 97.0% | ||
| Issuer | Shares | Value ($) |
| Communication Services 4.2% | ||
| Diversified Telecommunication Services 2.2% | ||
| AT&T, Inc. | 2,050,000 | 32,246,500 |
| Verizon Communications, Inc. | 465,000 | 16,567,950 |
| Total | 48,814,450 | |
| Media 2.0% | ||
| Comcast Corp., Class A | 1,150,000 | 45,252,500 |
| Total Communication Services | 94,066,950 | |
| Consumer Discretionary 4.5% | ||
| Automobiles 0.5% | ||
| Ford Motor Co. | 950,000 | 11,400,000 |
| Broadline Retail 0.4% | ||
| Macy’s, Inc. | 600,000 | 8,154,000 |
| Hotels, Restaurants & Leisure 1.1% | ||
| Darden Restaurants, Inc. | 80,000 | 12,681,600 |
| Restaurant Brands International, Inc. | 160,000 | 11,665,600 |
| Total | 24,347,200 | |
| Specialty Retail 2.0% | ||
| Home Depot, Inc. (The) | 160,000 | 45,352,000 |
| Textiles, Apparel & Luxury Goods 0.5% | ||
| Tapestry, Inc. | 300,000 | 12,006,000 |
| Total Consumer Discretionary | 101,259,200 | |
| Consumer Staples 14.3% | ||
| Beverages 5.3% | ||
| Coca-Cola Co. (The) | 1,050,000 | 62,643,000 |
| PepsiCo, Inc. | 315,000 | 57,440,250 |
| Total | 120,083,250 | |
| Consumer Staples Distribution & Retail 0.5% | ||
| Target Corp. | 75,000 | 9,819,750 |
| Food Products 2.0% | ||
| Bunge Ltd. | 127,500 | 11,811,600 |
| JM Smucker Co. (The) | 75,000 | 10,994,250 |
| Kraft Heinz Co. (The) | 600,000 | 22,932,000 |
| Total | 45,737,850 | |
| Common Stocks (continued) | ||
| Issuer | Shares | Value ($) |
| Household Products 3.5% | ||
| Procter & Gamble Co. (The) | 550,000 | 78,375,000 |
| Personal Care Products 0.3% | ||
| Kenvue, Inc.(a) | 283,725 | 7,118,660 |
| Tobacco 2.7% | ||
| Altria Group, Inc. | 525,000 | 23,320,500 |
| Philip Morris International, Inc. | 425,000 | 38,254,250 |
| Total | 61,574,750 | |
| Total Consumer Staples | 322,709,260 | |
| Energy 10.8% | ||
| Oil, Gas & Consumable Fuels 10.8% | ||
| Chesapeake Energy Corp. | 150,000 | 11,287,500 |
| Chevron Corp. | 375,000 | 56,482,500 |
| ConocoPhillips Co. | 235,000 | 23,335,500 |
| EOG Resources, Inc. | 105,000 | 11,265,450 |
| Exxon Mobil Corp. | 1,050,000 | 107,289,000 |
| Valero Energy Corp. | 157,500 | 16,858,800 |
| Williams Companies, Inc. (The) | 600,000 | 17,196,000 |
| Total | 243,714,750 | |
| Total Energy | 243,714,750 | |
| Financials 18.0% | ||
| Banks 10.3% | ||
| Bank of America Corp. | 1,600,000 | 44,464,000 |
| JPMorgan Chase & Co. | 650,000 | 88,211,500 |
| M&T Bank Corp. | 185,000 | 22,044,600 |
| New York Community Bancorp, Inc. | 1,200,000 | 12,336,000 |
| PNC Financial Services Group, Inc. (The) | 145,000 | 16,795,350 |
| Wells Fargo & Co. | 1,225,000 | 48,767,250 |
| Total | 232,618,700 | |
| Capital Markets 6.2% | ||
| Ares Capital Corp. | 675,000 | 12,649,500 |
| BlackRock, Inc. | 36,500 | 24,000,575 |
| Blackstone, Inc. | 275,000 | 23,551,000 |
| Carlyle Group, Inc. (The) | 450,000 | 12,334,500 |
| CME Group, Inc. | 65,000 | 11,618,750 |
| 8 | Columbia Dividend Opportunity Fund | Annual Report 2023 |
May 31, 2023
| Common Stocks (continued) | ||
| Issuer | Shares | Value ($) |
| Morgan Stanley | 475,000 | 38,836,000 |
| State Street Corp. | 250,000 | 17,005,000 |
| Total | 139,995,325 | |
| Insurance 1.0% | ||
| MetLife, Inc. | 435,000 | 21,554,250 |
| Mortgage Real Estate Investment Trusts (REITS) 0.5% | ||
| Starwood Property Trust, Inc. | 700,000 | 12,285,000 |
| Total Financials | 406,453,275 | |
| Health Care 15.8% | ||
| Biotechnology 4.0% | ||
| AbbVie, Inc. | 450,000 | 62,082,000 |
| Amgen, Inc. | 125,000 | 27,581,250 |
| Total | 89,663,250 | |
| Health Care Equipment & Supplies 1.8% | ||
| Medtronic PLC | 475,000 | 39,311,000 |
| Health Care Providers & Services 0.5% | ||
| CVS Health Corp. | 170,000 | 11,565,100 |
| Pharmaceuticals 9.5% | ||
| Bristol-Myers Squibb Co. | 615,000 | 39,630,600 |
| Johnson & Johnson | 440,000 | 68,226,400 |
| Merck & Co., Inc. | 650,000 | 71,766,500 |
| Pfizer, Inc. | 925,000 | 35,168,500 |
| Total | 214,792,000 | |
| Total Health Care | 355,331,350 | |
| Industrials 5.3% | ||
| Aerospace & Defense 0.8% | ||
| Raytheon Technologies Corp. | 185,000 | 17,045,900 |
| Air Freight & Logistics 1.5% | ||
| United Parcel Service, Inc., Class B | 210,000 | 35,070,000 |
| Building Products 0.5% | ||
| Johnson Controls International PLC | 185,000 | 11,044,500 |
| Electrical Equipment 0.7% | ||
| Emerson Electric Co. | 215,000 | 16,701,200 |
| Ground Transportation 0.5% | ||
| Union Pacific Corp. | 60,000 | 11,551,200 |
| Machinery 1.3% | ||
| Common Stocks (continued) | ||
| Issuer | Shares | Value ($) |
| AGCO Corp. | 100,000 | 11,028,000 |
| Stanley Black & Decker, Inc. | 240,000 | 17,992,800 |
| Total | 29,020,800 | |
| Total Industrials | 120,433,600 | |
| Information Technology 9.4% | ||
| Communications Equipment 2.0% | ||
| Cisco Systems, Inc. | 900,000 | 44,703,000 |
| Electronic Equipment, Instruments & Components 0.5% | ||
| Corning, Inc. | 350,000 | 10,783,500 |
| IT Services 1.3% | ||
| International Business Machines Corp. | 222,500 | 28,611,275 |
| Semiconductors & Semiconductor Equipment 5.1% | ||
| Broadcom, Inc. | 100,000 | 80,796,000 |
| QUALCOMM, Inc. | 100,000 | 11,341,000 |
| Texas Instruments, Inc. | 135,000 | 23,473,800 |
| Total | 115,610,800 | |
| Technology Hardware, Storage & Peripherals 0.5% | ||
| HP, Inc. | 425,000 | 12,350,500 |
| Total Information Technology | 212,059,075 | |
| Materials 1.8% | ||
| Chemicals 1.3% | ||
| Dow, Inc. | 450,000 | 21,951,000 |
| Nutrien Ltd. | 165,000 | 8,695,500 |
| Total | 30,646,500 | |
| Metals & Mining 0.5% | ||
| Newmont Corp. | 275,000 | 11,151,250 |
| Total Materials | 41,797,750 | |
| Real Estate 7.2% | ||
| Health Care REITs 0.5% | ||
| Welltower, Inc. | 150,000 | 11,191,500 |
| Industrial REITs 1.6% | ||
| Prologis, Inc. | 300,000 | 37,365,000 |
| Residential REITs 1.3% | ||
| AvalonBay Communities, Inc. | 65,000 | 11,308,700 |
| Invitation Homes, Inc. | 525,000 | 17,787,000 |
| Total | 29,095,700 | |
| Columbia Dividend Opportunity Fund | Annual Report 2023 | 9 |
May 31, 2023
| Common Stocks (continued) | ||
| Issuer | Shares | Value ($) |
| Retail REITs 0.8% | ||
| Simon Property Group, Inc. | 165,000 | 17,349,750 |
| Specialized REITs 3.0% | ||
| American Tower Corp. | 175,000 | 32,277,000 |
| Life Storage, Inc. | 135,000 | 17,197,650 |
| VICI Properties, Inc. | 575,000 | 17,784,750 |
| Total | 67,259,400 | |
| Total Real Estate | 162,261,350 | |
| Utilities 5.7% | ||
| Electric Utilities 4.7% | ||
| American Electric Power Co., Inc. | 260,000 | 21,611,200 |
| Duke Energy Corp. | 240,000 | 21,429,600 |
| Entergy Corp. | 225,000 | 22,095,000 |
| FirstEnergy Corp. | 600,000 | 22,434,000 |
| NextEra Energy, Inc. | 235,000 | 17,263,100 |
| Total | 104,832,900 | |
| Multi-Utilities 1.0% | ||
| DTE Energy Co. | 215,000 | 23,134,000 |
| Total Utilities | 127,966,900 | |
| Total Common Stocks (Cost $1,889,537,062) | 2,188,053,460 | |
| Convertible Preferred Stocks 2.3% | |||
| Issuer | Shares | Value ($) | |
| Industrials 0.5% | |||
| Professional Services 0.5% | |||
| Clarivate PLC | 5.250% | 325,000 | 11,318,251 |
| Total Industrials | 11,318,251 | ||
| Utilities 1.8% | |||
| Electric Utilities 0.8% | |||
| NextEra Energy, Inc. | 6.926% | 375,000 | 17,017,500 |
| Multi-Utilities 1.0% | |||
| NiSource, Inc. | 7.750% | 235,000 | 23,718,550 |
| Total Utilities | 40,736,050 | ||
| Total Convertible Preferred Stocks (Cost $57,473,220) | 52,054,301 | ||
| Money Market Funds 0.0% | ||
| Shares | Value ($) | |
| Columbia Short-Term Cash Fund, 5.241%(b),(c) | 310,214 | 310,059 |
| Total Money Market Funds (Cost $310,055) | 310,059 | |
| Total Investments in Securities (Cost: $1,947,320,337) | 2,240,417,820 | |
| Other Assets & Liabilities, Net | 14,929,126 | |
| Net Assets | 2,255,346,946 | |
| (a) | Non-income producing investment. |
| (b) | The rate shown is the seven-day current annualized yield at May 31, 2023. |
| (c) | As defined in the Investment Company Act of 1940, as amended, an affiliated company is one in which the Fund owns 5% or more of the company’s outstanding voting securities, or a company which is under common ownership or control with the Fund. The value of the holdings and transactions in these affiliated companies during the year ended May 31, 2023 are as follows: |
| Affiliated issuers | Beginning of period($) | Purchases($) | Sales($) | Net change in unrealized appreciation (depreciation)($) | End of period($) | Realized gain (loss)($) | Dividends($) | End of period shares |
| Columbia Short-Term Cash Fund, 5.241% | ||||||||
| 3,121,726 | 582,042,590 | (584,854,261) | 4 | 310,059 | 2,978 | 616,052 | 310,214 | |
| 10 | Columbia Dividend Opportunity Fund | Annual Report 2023 |
May 31, 2023
| ■ | Level 1 — Valuations based on quoted prices for investments in active markets that the Fund has the ability to access at the measurement date. Valuation adjustments are not applied to Level 1 investments. |
| ■ | Level 2 — Valuations based on other significant observable inputs (including quoted prices for similar securities, interest rates, prepayment speeds, credit risks, etc.). |
| ■ | Level 3 — Valuations based on significant unobservable inputs (including the Fund’s own assumptions and judgment in determining the fair value of investments). |
| Level 1 ($) | Level 2 ($) | Level 3 ($) | Total ($) | |
| Investments in Securities | ||||
| Common Stocks | ||||
| Communication Services | 94,066,950 | — | — | 94,066,950 |
| Consumer Discretionary | 101,259,200 | — | — | 101,259,200 |
| Consumer Staples | 322,709,260 | — | — | 322,709,260 |
| Energy | 243,714,750 | — | — | 243,714,750 |
| Financials | 406,453,275 | — | — | 406,453,275 |
| Health Care | 355,331,350 | — | — | 355,331,350 |
| Industrials | 120,433,600 | — | — | 120,433,600 |
| Information Technology | 212,059,075 | — | — | 212,059,075 |
| Materials | 41,797,750 | — | — | 41,797,750 |
| Real Estate | 162,261,350 | — | — | 162,261,350 |
| Utilities | 127,966,900 | — | — | 127,966,900 |
| Total Common Stocks | 2,188,053,460 | — | — | 2,188,053,460 |
| Convertible Preferred Stocks | ||||
| Industrials | — | 11,318,251 | — | 11,318,251 |
| Utilities | — | 40,736,050 | — | 40,736,050 |
| Total Convertible Preferred Stocks | — | 52,054,301 | — | 52,054,301 |
| Money Market Funds | 310,059 | — | — | 310,059 |
| Total Investments in Securities | 2,188,363,519 | 52,054,301 | — | 2,240,417,820 |
| Columbia Dividend Opportunity Fund | Annual Report 2023 | 11 |
May 31, 2023
| Assets | |
| Investments in securities, at value | |
| Unaffiliated issuers (cost $1,947,010,282) | $2,240,107,761 |
| Affiliated issuers (cost $310,055) | 310,059 |
| Receivable for: | |
| Investments sold | 21,075,557 |
| Capital shares sold | 596,509 |
| Dividends | 9,815,872 |
| Foreign tax reclaims | 1,465,990 |
| Prepaid expenses | 12,649 |
| Total assets | 2,273,384,397 |
| Liabilities | |
| Payable for: | |
| Investments purchased | 15,049,957 |
| Capital shares purchased | 2,380,757 |
| Management services fees | 39,564 |
| Distribution and/or service fees | 10,869 |
| Transfer agent fees | 212,636 |
| Compensation of board members | 286,204 |
| Other expenses | 57,464 |
| Total liabilities | 18,037,451 |
| Net assets applicable to outstanding capital stock | $2,255,346,946 |
| Represented by | |
| Paid in capital | 1,946,218,111 |
| Total distributable earnings (loss) | 309,128,835 |
| Total - representing net assets applicable to outstanding capital stock | $2,255,346,946 |
| 12 | Columbia Dividend Opportunity Fund | Annual Report 2023 |
May 31, 2023
| Class A | |
| Net assets | $1,179,047,058 |
| Shares outstanding | 36,006,467 |
| Net asset value per share | $32.75 |
| Maximum sales charge | 5.75% |
| Maximum offering price per share (calculated by dividing the net asset value per share by 1.0 minus the maximum sales charge for Class A shares) | $34.75 |
| Advisor Class | |
| Net assets | $94,217,507 |
| Shares outstanding | 2,794,806 |
| Net asset value per share | $33.71 |
| Class C | |
| Net assets | $80,831,775 |
| Shares outstanding | 2,554,734 |
| Net asset value per share | $31.64 |
| Institutional Class | |
| Net assets | $588,309,784 |
| Shares outstanding | 17,838,338 |
| Net asset value per share | $32.98 |
| Institutional 2 Class | |
| Net assets | $117,286,372 |
| Shares outstanding | 3,543,989 |
| Net asset value per share | $33.09 |
| Institutional 3 Class | |
| Net assets | $158,594,897 |
| Shares outstanding | 4,685,035 |
| Net asset value per share | $33.85 |
| Class R | |
| Net assets | $37,059,553 |
| Shares outstanding | 1,132,439 |
| Net asset value per share | $32.73 |
| Columbia Dividend Opportunity Fund | Annual Report 2023 | 13 |
Year Ended May 31, 2023
| Net investment income | |
| Income: | |
| Dividends — unaffiliated issuers | $94,374,121 |
| Dividends — affiliated issuers | 616,052 |
| Interfund lending | 700 |
| European Union tax reclaim | 294,366 |
| Foreign taxes withheld | (78,112) |
| Total income | 95,207,127 |
| Expenses: | |
| Management services fees | 15,253,316 |
| Distribution and/or service fees | |
| Class A | 3,212,006 |
| Class C | 897,614 |
| Class R | 195,560 |
| Transfer agent fees | |
| Class A | 1,200,838 |
| Advisor Class | 96,995 |
| Class C | 83,902 |
| Institutional Class | 572,672 |
| Institutional 2 Class | 64,545 |
| Institutional 3 Class | 11,906 |
| Class R | 36,564 |
| Compensation of board members | 53,222 |
| Custodian fees | 18,429 |
| Printing and postage fees | 117,216 |
| Registration fees | 145,256 |
| Accounting services fees | 63,630 |
| Legal fees | 44,631 |
| Interest on interfund lending | 330 |
| Compensation of chief compliance officer | 481 |
| Other | 48,014 |
| Total expenses | 22,117,127 |
| Fees waived by transfer agent | |
| Institutional 2 Class | (6,292) |
| Institutional 3 Class | (3,340) |
| Expense reduction | (120) |
| Total net expenses | 22,107,375 |
| Net investment income | 73,099,752 |
| Realized and unrealized gain (loss) — net | |
| Net realized gain (loss) on: | |
| Investments — unaffiliated issuers | 6,411,096 |
| Investments — affiliated issuers | 2,978 |
| Foreign currency translations | (1,667) |
| Net realized gain | 6,412,407 |
| Net change in unrealized appreciation (depreciation) on: | |
| Investments — unaffiliated issuers | (267,213,969) |
| Investments — affiliated issuers | 4 |
| Foreign currency translations | (6,378) |
| Net change in unrealized appreciation (depreciation) | (267,220,343) |
| Net realized and unrealized loss | (260,807,936) |
| Net decrease in net assets resulting from operations | $(187,708,184) |
| 14 | Columbia Dividend Opportunity Fund | Annual Report 2023 |
| Year Ended May 31, 2023 | Year Ended May 31, 2022 | |
| Operations | ||
| Net investment income | $73,099,752 | $67,399,988 |
| Net realized gain | 6,412,407 | 203,391,886 |
| Net change in unrealized appreciation (depreciation) | (267,220,343) | (55,878,231) |
| Net increase (decrease) in net assets resulting from operations | (187,708,184) | 214,913,643 |
| Distributions to shareholders | ||
| Net investment income and net realized gains | ||
| Class A | (97,484,621) | (164,397,027) |
| Advisor Class | (7,839,120) | (12,767,220) |
| Class C | (6,374,852) | (11,089,843) |
| Institutional Class | (47,955,816) | (69,373,878) |
| Institutional 2 Class | (8,679,446) | (16,037,196) |
| Institutional 3 Class | (13,987,462) | (18,019,787) |
| Class R | (2,851,861) | (4,652,665) |
| Total distributions to shareholders | (185,173,178) | (296,337,616) |
| Increase in net assets from capital stock activity | 121,884,398 | 107,105,162 |
| Total increase (decrease) in net assets | (250,996,964) | 25,681,189 |
| Net assets at beginning of year | 2,506,343,910 | 2,480,662,721 |
| Net assets at end of year | $2,255,346,946 | $2,506,343,910 |
| Columbia Dividend Opportunity Fund | Annual Report 2023 | 15 |
| Year Ended | Year Ended | |||
| May 31, 2023 | May 31, 2022 | |||
| Shares | Dollars ($) | Shares | Dollars ($) | |
| Capital stock activity | ||||
| Class A | ||||
| Subscriptions | 2,602,188 | 91,965,188 | 2,227,538 | 85,824,916 |
| Distributions reinvested | 2,717,498 | 95,309,534 | 4,319,885 | 160,563,998 |
| Redemptions | (5,660,192) | (198,426,011) | (4,740,677) | (184,402,807) |
| Net increase (decrease) | (340,506) | (11,151,289) | 1,806,746 | 61,986,107 |
| Advisor Class | ||||
| Subscriptions | 723,968 | 26,284,348 | 660,642 | 26,112,531 |
| Distributions reinvested | 216,769 | 7,810,840 | 333,065 | 12,711,577 |
| Redemptions | (1,036,445) | (37,023,294) | (774,394) | (31,055,700) |
| Net increase (decrease) | (95,708) | (2,928,106) | 219,313 | 7,768,408 |
| Class C | ||||
| Subscriptions | 661,727 | 22,773,103 | 605,451 | 22,724,414 |
| Distributions reinvested | 185,546 | 6,314,487 | 301,735 | 10,863,141 |
| Redemptions | (845,993) | (28,656,405) | (1,050,865) | (39,545,239) |
| Net increase (decrease) | 1,280 | 431,185 | (143,679) | (5,957,684) |
| Institutional Class | ||||
| Subscriptions | 5,208,749 | 185,738,456 | 3,536,655 | 137,420,967 |
| Distributions reinvested | 1,281,313 | 45,197,406 | 1,733,429 | 64,857,694 |
| Redemptions | (4,151,743) | (145,777,039) | (4,048,659) | (159,221,847) |
| Net increase | 2,338,319 | 85,158,823 | 1,221,425 | 43,056,814 |
| Institutional 2 Class | ||||
| Subscriptions | 1,143,181 | 40,246,582 | 581,309 | 22,838,793 |
| Distributions reinvested | 210,381 | 7,444,413 | 365,385 | 13,710,246 |
| Redemptions | (995,202) | (35,390,328) | (1,115,634) | (43,565,011) |
| Net increase (decrease) | 358,360 | 12,300,667 | (168,940) | (7,015,972) |
| Institutional 3 Class | ||||
| Subscriptions | 2,720,494 | 97,575,046 | 996,555 | 39,704,663 |
| Distributions reinvested | 363,220 | 13,158,018 | 438,620 | 16,801,049 |
| Redemptions | (2,102,212) | (75,719,910) | (1,280,795) | (50,753,698) |
| Net increase | 981,502 | 35,013,154 | 154,380 | 5,752,014 |
| Class R | ||||
| Subscriptions | 209,357 | 7,394,455 | 109,885 | 4,223,855 |
| Distributions reinvested | 81,046 | 2,843,366 | 124,613 | 4,628,174 |
| Redemptions | (206,025) | (7,177,857) | (189,210) | (7,336,554) |
| Net increase | 84,378 | 3,059,964 | 45,288 | 1,515,475 |
| Total net increase | 3,327,625 | 121,884,398 | 3,134,533 | 107,105,162 |
| 16 | Columbia Dividend Opportunity Fund | Annual Report 2023 |
| Net asset value, beginning of period | Net investment income | Net realized and unrealized gain (loss) | Total from investment operations | Distributions from net investment income | Distributions from net realized gains | Total distributions to shareholders | |
| Class A | |||||||
| Year Ended 5/31/2023 | $38.28 | 1.04(c) | (3.86) | (2.82) | (1.02) | (1.69) | (2.71) |
| Year Ended 5/31/2022 | $39.82 | 1.04 | 2.32 | 3.36 | (1.05) | (3.85) | (4.90) |
| Year Ended 5/31/2021(f) | $30.78 | 1.01 | 9.43 | 10.44 | (1.12) | (0.28) | (1.40) |
| Year Ended 5/31/2020(f) | $35.23 | 1.20 | (1.17) | 0.03 | (1.12) | (3.36) | (4.48) |
| Year Ended 5/31/2019(f) | $38.24 | 1.08 | 0.15 | 1.23 | (1.24) | (3.00) | (4.24) |
| Advisor Class | |||||||
| Year Ended 5/31/2023 | $39.33 | 1.16(c) | (3.97) | (2.81) | (1.12) | (1.69) | (2.81) |
| Year Ended 5/31/2022 | $40.78 | 1.17 | 2.38 | 3.55 | (1.15) | (3.85) | (5.00) |
| Year Ended 5/31/2021(f) | $31.49 | 1.12 | 9.65 | 10.77 | (1.20) | (0.28) | (1.48) |
| Year Ended 5/31/2020(f) | $35.96 | 1.32 | (1.23) | 0.09 | (1.20) | (3.36) | (4.56) |
| Year Ended 5/31/2019(f) | $38.94 | 1.20 | 0.14 | 1.34 | (1.32) | (3.00) | (4.32) |
| Class C | |||||||
| Year Ended 5/31/2023 | $37.06 | 0.75(c) | (3.73) | (2.98) | (0.75) | (1.69) | (2.44) |
| Year Ended 5/31/2022 | $38.69 | 0.72 | 2.25 | 2.97 | (0.75) | (3.85) | (4.60) |
| Year Ended 5/31/2021(f) | $29.93 | 0.74 | 9.18 | 9.92 | (0.88) | (0.28) | (1.16) |
| Year Ended 5/31/2020(f) | $34.34 | 0.92 | (1.13) | (0.21) | (0.84) | (3.36) | (4.20) |
| Year Ended 5/31/2019(f) | $37.37 | 0.80 | 0.13 | 0.93 | (0.96) | (3.00) | (3.96) |
| Institutional Class | |||||||
| Year Ended 5/31/2023 | $38.54 | 1.13(c) | (3.88) | (2.75) | (1.12) | (1.69) | (2.81) |
| Year Ended 5/31/2022 | $40.06 | 1.15 | 2.33 | 3.48 | (1.15) | (3.85) | (5.00) |
| Year Ended 5/31/2021(f) | $30.95 | 1.10 | 9.49 | 10.59 | (1.20) | (0.28) | (1.48) |
| Year Ended 5/31/2020(f) | $35.42 | 1.28 | (1.19) | 0.09 | (1.20) | (3.36) | (4.56) |
| Year Ended 5/31/2019(f) | $38.42 | 1.20 | 0.12 | 1.32 | (1.32) | (3.00) | (4.32) |
| Institutional 2 Class | |||||||
| Year Ended 5/31/2023 | $38.66 | 1.15(c) | (3.90) | (2.75) | (1.13) | (1.69) | (2.82) |
| Year Ended 5/31/2022 | $40.18 | 1.17 | 2.33 | 3.50 | (1.17) | (3.85) | (5.02) |
| Year Ended 5/31/2021(f) | $31.04 | 1.12 | 9.52 | 10.64 | (1.22) | (0.28) | (1.50) |
| Year Ended 5/31/2020(f) | $35.50 | 1.32 | (1.18) | 0.14 | (1.24) | (3.36) | (4.60) |
| Year Ended 5/31/2019(f) | $38.49 | 1.20 | 0.17 | 1.37 | (1.36) | (3.00) | (4.36) |
| 18 | Columbia Dividend Opportunity Fund | Annual Report 2023 |
| Net asset value, end of period | Total return | Total gross expense ratio to average net assets(a) | Total net expense ratio to average net assets(a),(b) | Net investment income ratio to average net assets | Portfolio turnover | Net assets, end of period (000’s) | |
| Class A | |||||||
| Year Ended 5/31/2023 | $32.75 | (7.70%) | 1.00%(d) | 1.00%(d),(e) | 2.95%(c) | 52% | $1,179,047 |
| Year Ended 5/31/2022 | $38.28 | 9.04% | 0.99%(d) | 0.99%(d),(e) | 2.64% | 41% | $1,391,270 |
| Year Ended 5/31/2021(f) | $39.82 | 34.85% | 1.01% | 1.01%(e) | 2.98% | 51% | $1,375,445 |
| Year Ended 5/31/2020(f) | $30.78 | (0.90%) | 1.00% | 1.00%(e) | 3.44% | 47% | $1,179,625 |
| Year Ended 5/31/2019(f) | $35.23 | 3.47% | 0.99% | 0.99%(e) | 2.92% | 66% | $1,424,224 |
| Advisor Class | |||||||
| Year Ended 5/31/2023 | $33.71 | (7.49%) | 0.75%(d) | 0.75%(d),(e) | 3.20%(c) | 52% | $94,218 |
| Year Ended 5/31/2022 | $39.33 | 9.32% | 0.74%(d) | 0.74%(d),(e) | 2.89% | 41% | $113,675 |
| Year Ended 5/31/2021(f) | $40.78 | 35.31% | 0.76% | 0.76%(e) | 3.23% | 51% | $108,945 |
| Year Ended 5/31/2020(f) | $31.49 | (0.74%) | 0.75% | 0.75%(e) | 3.72% | 47% | $79,477 |
| Year Ended 5/31/2019(f) | $35.96 | 3.77% | 0.74% | 0.74%(e) | 3.18% | 66% | $82,497 |
| Class C | |||||||
| Year Ended 5/31/2023 | $31.64 | (8.41%) | 1.75%(d) | 1.75%(d),(e) | 2.20%(c) | 52% | $80,832 |
| Year Ended 5/31/2022 | $37.06 | 8.21% | 1.74%(d) | 1.74%(d),(e) | 1.89% | 41% | $94,620 |
| Year Ended 5/31/2021(f) | $38.69 | 34.05% | 1.76% | 1.76%(e) | 2.26% | 51% | $104,339 |
| Year Ended 5/31/2020(f) | $29.93 | (1.67%) | 1.75% | 1.75%(e) | 2.68% | 47% | $163,439 |
| Year Ended 5/31/2019(f) | $34.34 | 2.64% | 1.74% | 1.74%(e) | 2.18% | 66% | $219,222 |
| Institutional Class | |||||||
| Year Ended 5/31/2023 | $32.98 | (7.48%) | 0.75%(d) | 0.75%(d),(e) | 3.20%(c) | 52% | $588,310 |
| Year Ended 5/31/2022 | $38.54 | 9.32% | 0.74%(d) | 0.74%(d),(e) | 2.89% | 41% | $597,311 |
| Year Ended 5/31/2021(f) | $40.06 | 35.26% | 0.76% | 0.76%(e) | 3.23% | 51% | $572,007 |
| Year Ended 5/31/2020(f) | $30.95 | (0.63%) | 0.75% | 0.75%(e) | 3.68% | 47% | $510,928 |
| Year Ended 5/31/2019(f) | $35.42 | 3.71% | 0.74% | 0.74%(e) | 3.18% | 66% | $647,702 |
| Institutional 2 Class | |||||||
| Year Ended 5/31/2023 | $33.09 | (7.44%) | 0.71%(d) | 0.70%(d) | 3.24%(c) | 52% | $117,286 |
| Year Ended 5/31/2022 | $38.66 | 9.35% | 0.70%(d) | 0.69%(d) | 2.94% | 41% | $123,165 |
| Year Ended 5/31/2021(f) | $40.18 | 35.37% | 0.72% | 0.71% | 3.29% | 51% | $134,775 |
| Year Ended 5/31/2020(f) | $31.04 | (0.69%) | 0.71% | 0.70% | 3.76% | 47% | $112,602 |
| Year Ended 5/31/2019(f) | $35.50 | 3.87% | 0.70% | 0.69% | 3.22% | 66% | $116,907 |
| Columbia Dividend Opportunity Fund | Annual Report 2023 | 19 |
| Net asset value, beginning of period | Net investment income | Net realized and unrealized gain (loss) | Total from investment operations | Distributions from net investment income | Distributions from net realized gains | Total distributions to shareholders | |
| Institutional 3 Class | |||||||
| Year Ended 5/31/2023 | $39.48 | 1.20(c) | (3.99) | (2.79) | (1.15) | (1.69) | (2.84) |
| Year Ended 5/31/2022 | $40.92 | 1.21 | 2.39 | 3.60 | (1.19) | (3.85) | (5.04) |
| Year Ended 5/31/2021(f) | $31.59 | 1.16 | 9.68 | 10.84 | (1.23) | (0.28) | (1.51) |
| Year Ended 5/31/2020(f) | $36.06 | 1.36 | (1.23) | 0.13 | (1.24) | (3.36) | (4.60) |
| Year Ended 5/31/2019(f) | $39.03 | 1.24 | 0.15 | 1.39 | (1.36) | (3.00) | (4.36) |
| Class R | |||||||
| Year Ended 5/31/2023 | $38.25 | 0.95(c) | (3.85) | (2.90) | (0.93) | (1.69) | (2.62) |
| Year Ended 5/31/2022 | $39.79 | 0.94 | 2.32 | 3.26 | (0.95) | (3.85) | (4.80) |
| Year Ended 5/31/2021(f) | $30.76 | 0.92 | 9.43 | 10.35 | (1.04) | (0.28) | (1.32) |
| Year Ended 5/31/2020(f) | $35.20 | 1.12 | (1.16) | (0.04) | (1.04) | (3.36) | (4.40) |
| Year Ended 5/31/2019(f) | $38.20 | 1.00 | 0.12 | 1.12 | (1.12) | (3.00) | (4.12) |
| Notes to Financial Highlights | |
| (a) | In addition to the fees and expenses that the Fund bears directly, the Fund indirectly bears a pro rata share of the fees and expenses of any other funds in which it invests. Such indirect expenses are not included in the Fund’s reported expense ratios. |
| (b) | Total net expenses include the impact of certain fee waivers/expense reimbursements made by the Investment Manager and certain of its affiliates, if applicable. |
| (c) | Net investment income per share includes European Union tax reclaims which amounted to less than $0.01 per share. Excluding this amount, the ratio of net investment income to average net assets would have been lower by 0.01%. |
| (d) | Ratios include interfund lending expense which is less than 0.01%. |
| (e) | The benefits derived from expense reductions had an impact of less than 0.01%. |
| (f) | Per share amounts have been adjusted on a retroactive basis to reflect a 4 to 1 reverse stock split completed after the close of business on September 11, 2020. |
| 20 | Columbia Dividend Opportunity Fund | Annual Report 2023 |
| Net asset value, end of period | Total return | Total gross expense ratio to average net assets(a) | Total net expense ratio to average net assets(a),(b) | Net investment income ratio to average net assets | Portfolio turnover | Net assets, end of period (000’s) | |
| Institutional 3 Class | |||||||
| Year Ended 5/31/2023 | $33.85 | (7.41%) | 0.66%(d) | 0.66%(d) | 3.30%(c) | 52% | $158,595 |
| Year Ended 5/31/2022 | $39.48 | 9.42% | 0.65%(d) | 0.65%(d) | 2.97% | 41% | $146,214 |
| Year Ended 5/31/2021(f) | $40.92 | 35.36% | 0.67% | 0.66% | 3.33% | 51% | $145,247 |
| Year Ended 5/31/2020(f) | $31.59 | (0.63%) | 0.66% | 0.65% | 3.83% | 47% | $112,370 |
| Year Ended 5/31/2019(f) | $36.06 | 3.87% | 0.65% | 0.64% | 3.28% | 66% | $112,951 |
| Class R | |||||||
| Year Ended 5/31/2023 | $32.73 | (7.93%) | 1.25%(d) | 1.25%(d),(e) | 2.70%(c) | 52% | $37,060 |
| Year Ended 5/31/2022 | $38.25 | 8.76% | 1.24%(d) | 1.24%(d),(e) | 2.39% | 41% | $40,089 |
| Year Ended 5/31/2021(f) | $39.79 | 34.60% | 1.26% | 1.26%(e) | 2.73% | 51% | $39,905 |
| Year Ended 5/31/2020(f) | $30.76 | (1.19%) | 1.25% | 1.25%(e) | 3.21% | 47% | $33,516 |
| Year Ended 5/31/2019(f) | $35.20 | 3.21% | 1.24% | 1.24%(e) | 2.67% | 66% | $38,093 |
| Columbia Dividend Opportunity Fund | Annual Report 2023 | 21 |
May 31, 2023
| 22 | Columbia Dividend Opportunity Fund | Annual Report 2023 |
May 31, 2023
| Columbia Dividend Opportunity Fund | Annual Report 2023 | 23 |
May 31, 2023
| 24 | Columbia Dividend Opportunity Fund | Annual Report 2023 |
May 31, 2023
| Columbia Dividend Opportunity Fund | Annual Report 2023 | 25 |
May 31, 2023
| Effective rate (%) | |
| Class A | 0.09 |
| Advisor Class | 0.09 |
| Class C | 0.09 |
| Institutional Class | 0.09 |
| Institutional 2 Class | 0.05 |
| Institutional 3 Class | 0.01 |
| Class R | 0.09 |
| Front End (%) | CDSC (%) | Amount ($) | |
| Class A | 5.75 | 0.50 - 1.00(a) | 771,588 |
| Class C | — | 1.00(b) | 7,020 |
| (a) | This charge is imposed on certain investments of between $1 million and $50 million redeemed within 18 months after purchase, as follows: 1.00% if redeemed within 12 months after purchase, and 0.50% if redeemed more than 12, but less than 18, months after purchase, with certain limited exceptions. |
| (b) | This charge applies to redemptions within 12 months after purchase, with certain limited exceptions. |
| 26 | Columbia Dividend Opportunity Fund | Annual Report 2023 |
May 31, 2023
| October 1, 2022 through September 30, 2023 | Prior to October 1, 2022 | |
| Class A | 1.06% | 1.06% |
| Advisor Class | 0.81 | 0.81 |
| Class C | 1.81 | 1.81 |
| Institutional Class | 0.81 | 0.81 |
| Institutional 2 Class | 0.78 | 0.76 |
| Institutional 3 Class | 0.73 | 0.72 |
| Class R | 1.31 | 1.31 |
| Undistributed net investment income ($) | Accumulated net realized gain ($) | Paid in capital ($) |
| 10,154 | 58,445 | (68,599) |
| Columbia Dividend Opportunity Fund | Annual Report 2023 | 27 |
May 31, 2023
| Year Ended May 31, 2023 | Year Ended May 31, 2022 | ||||
| Ordinary income ($) | Long-term capital gains ($) | Total ($) | Ordinary income ($) | Long-term capital gains ($) | Total ($) |
| 71,050,612 | 114,122,566 | 185,173,178 | 66,305,482 | 230,032,134 | 296,337,616 |
| Undistributed ordinary income ($) | Undistributed long-term capital gains ($) | Capital loss carryforwards ($) | Net unrealized appreciation ($) |
| 12,703,759 | 10,733,285 | — | 286,068,891 |
| Federal tax cost ($) | Gross unrealized appreciation ($) | Gross unrealized (depreciation) ($) | Net unrealized appreciation ($) |
| 1,954,348,929 | 408,342,518 | (122,273,627) | 286,068,891 |
| 28 | Columbia Dividend Opportunity Fund | Annual Report 2023 |
May 31, 2023
| Borrower or lender | Average loan balance ($) | Weighted average interest rate (%) | Number of days with outstanding loans |
| Borrower | 480,000 | 4.71 | 5 |
| Lender | 3,500,000 | 3.60 | 2 |
| Columbia Dividend Opportunity Fund | Annual Report 2023 | 29 |
May 31, 2023
| 30 | Columbia Dividend Opportunity Fund | Annual Report 2023 |
| Columbia Dividend Opportunity Fund | Annual Report 2023 | 31 |
| Qualified dividend income | Dividends received deduction | Capital gain dividend |
| 100.00% | 100.00% | $11,460,465 |
| Name, address, year of birth | Position held with the Columbia Funds and length of service | Principal occupation(s) during past five years and other relevant professional experience | Number of Funds in the Columbia Funds Complex* overseen | Other directorships held by Trustee during the past five years and other relevant Board experience |
| George S. Batejan c/o Columbia Management Investment Advisers, LLC 290 Congress Street Boston, MA 02210 1954 | Trustee since 2017 | Executive Vice President, Global Head of Technology and Operations, Janus Capital Group, Inc., 2010-2016 | 174 | Former Chairman of the Board, NICSA (National Investment Company Services Association) (Executive Committee, Nominating Committee and Governance Committee), 2014-2016; former Director, Intech Investment Management, 2011-2016; former Board Member, Metro Denver Chamber of Commerce, 2015-2016; former Advisory Board Member, University of Colorado Business School, 2015-2018; former Board Member, Chase Bank International, 1993-1994 |
| 32 | Columbia Dividend Opportunity Fund | Annual Report 2023 |
(Unaudited)
Independent trustees (continued)
| Name, address, year of birth | Position held with the Columbia Funds and length of service | Principal occupation(s) during past five years and other relevant professional experience | Number of Funds in the Columbia Funds Complex* overseen | Other directorships held by Trustee during the past five years and other relevant Board experience |
| Kathleen Blatz c/o Columbia Management Investment Advisers, LLC 290 Congress Street Boston, MA 02210 1954 | Trustee since 2006 | Attorney, specializing in arbitration and mediation; Chief Justice, Minnesota Supreme Court, 1998-2006; Associate Justice, Minnesota Supreme Court, 1996-1998; Fourth Judicial District Court Judge, Hennepin County, 1994-1996; Attorney in private practice and public service, 1984-1993; State Representative, Minnesota House of Representatives, 1979-1993, which included service on the Tax and Financial Institutions and Insurance Committees; Member and Interim Chair, Minnesota Sports Facilities Authority, January-July 2017; Interim President and Chief Executive Officer, Blue Cross and Blue Shield of Minnesota (health care insurance), February-July 2018, April-October 2021 | 174 | Former Trustee, Blue Cross and Blue Shield of Minnesota, 2009-2021 (Chair of the Business Development Committee, 2014-2017; Chair of the Governance Committee, 2017-2019); former Member and Chair of the Board, Minnesota Sports Facilities Authority, January 2017-July 2017; former Director, Robina Foundation, 2009-2020 (Chair, 2014-2020); Director, Richard M. Schulze Family Foundation, since 2021 |
| Pamela G. Carlton c/o Columbia Management Investment Advisers, LLC 290 Congress Street Boston, MA 02210 1954 | Chair since 2023; Trustee since 2007 | President, Springboard — Partners in Cross Cultural Leadership (consulting company), since 2003; Managing Director of US Equity Research, JP Morgan Chase, 1999-2003; Director of US Equity Research, Chase Asset Management, 1996-1999; Co-Director Latin America Research, 1993-1996, COO Global Research, 1992-1996, Co-Director of US Research, 1991-1992, Investment Banker, 1982-1991, Morgan Stanley; Attorney, Cleary Gottlieb Steen & Hamilton LLP, 1980-1982 | 174 | Trustee, New York Presbyterian Hospital Board, since 1996; Director, DR Bank (Audit Committee) since 2017; Director, Evercore Inc. (Audit Committee, Nominating and Governance Committee), since 2019; Director, Apollo Commercial Real Estate Finance, Inc. (Chair, Nominating and Governance Committee) (financial services), since 2021; the Governing Council of the Independent Directors Council (IDC), since 2021 |
| Janet Langford Carrig c/o Columbia Management Investment Advisers, LLC 290 Congress Street Boston, MA 02210 1957 | Trustee since 1996 | Senior Vice President, General Counsel and Corporate Secretary, ConocoPhillips (independent energy company), September 2007-October 2018 | 174 | Director, EQT Corporation (natural gas producer), since 2019; former Director, Whiting Petroleum Corporation (independent oil and gas company), 2020-2022 |
| J. Kevin Connaughton c/o Columbia Management Investment Advisers, LLC 290 Congress Street Boston, MA 02210 1964 | Trustee since 2020 | CEO and President, RhodeWay Financial (non-profit financial planning firm), since December 2022; Member, FINRA National Adjudicatory Council, since January 2020; Adjunct Professor of Finance, Bentley University since January 2018; Consultant to Independent Trustees of CFVIT and CFST I from March 2016 to June 2020 with respect to CFVIT and to December 2020 with respect to CFST I; Managing Director and General Manager of Mutual Fund Products, Columbia Management Investment Advisers, LLC, May 2010-February 2015; President, Columbia Funds, 2008-2015; and senior officer of Columbia Funds and affiliated funds, 2003-2015 | 172 | Former Director, The Autism Project, March 2015-December 2021; former Member of the Investment Committee, St. Michael’s College, November 2015-February 2020; former Trustee, St. Michael’s College, June 2017-September 2019; former Trustee, New Century Portfolios (former mutual fund complex), January 2015-December 2017 |
| Columbia Dividend Opportunity Fund | Annual Report 2023 | 33 |
(Unaudited)
Independent trustees (continued)
| Name, address, year of birth | Position held with the Columbia Funds and length of service | Principal occupation(s) during past five years and other relevant professional experience | Number of Funds in the Columbia Funds Complex* overseen | Other directorships held by Trustee during the past five years and other relevant Board experience |
| Olive M. Darragh c/o Columbia Management Investment Advisers, LLC 290 Congress Street Boston, MA 02210 1962 | Trustee since 2020 | Managing Director of Darragh Inc. (strategy and talent management consulting firm), since 2010; Founder and CEO, Zolio, Inc. (investment management talent identification platform), since 2004; Consultant to Independent Trustees of CFVIT and CFST I from June 2019 to June 2020 with respect to CFVIT and to December 2020 with respect to CFST I; Partner, Tudor Investments, 2004-2010; Senior Partner, McKinsey & Company (consulting), 1990-2004; Touche Ross CPA, 1985-1988 | 172 | Treasurer, Edinburgh University US Trust Board, since January 2023; Member, HBS Community Action Partners Board, since September 2022; former Director, University of Edinburgh Business School (Member of US Board), 2004-2019; former Director, Boston Public Library Foundation, 2008-2017 |
| Patricia M. Flynn c/o Columbia Management Investment Advisers, LLC 290 Congress Street Boston, MA 02210 1950 | Trustee since 2004 | Professor of Economics and Management, Bentley University, since 2002; Dean, McCallum Graduate School of Business, Bentley University, 1992-2002 | 174 | Former Trustee, MA Taxpayers Foundation, 1997-2022; former Director, The MA Business Roundtable, 2003-2019; former Chairperson, Innovation Index Advisory Committee, MA Technology Collaborative, 1997-2020 |
| Brian J. Gallagher c/o Columbia Management Investment Advisers, LLC 290 Congress Street Boston, MA 02210 1954 | Trustee since 2017 | Retired; Partner with Deloitte & Touche LLP and its predecessors, 1977-2016 | 174 | Trustee, Catholic Schools Foundation, since 2004 |
| Douglas A. Hacker c/o Columbia Management Investment Advisers, LLC 290 Congress Street Boston, MA 02210 1955 | Trustee since 1996 | Independent business executive, since May 2006; Executive Vice President – Strategy of United Airlines, December 2002 - May 2006; President of UAL Loyalty Services (airline marketing company), September 2001-December 2002; Executive Vice President and Chief Financial Officer of United Airlines, July 1999-September 2001 | 174 | Director, SpartanNash Company since November 2013 (Chair of the Board, since May 2021) (food distributor); Director, Aircastle Limited (Chair of Audit Committee) (aircraft leasing), since August 2006; former Director, Nash Finch Company (food distributor), 2005-2013; former Director, SeaCube Container Leasing Ltd. (container leasing), 2010-2013; and former Director, Travelport Worldwide Limited (travel information technology), 2014-2019 |
| Nancy T. Lukitsh c/o Columbia Management Investment Advisers, LLC 290 Congress Street Boston, MA 02210 1956 | Trustee since 2011 | Senior Vice President, Partner and Director of Marketing, Wellington Management Company, LLP (investment adviser), 1997-2010; Chair, Wellington Management Portfolios (commingled non-U.S. investment pools), 2007-2010; Director, Wellington Trust Company, NA and other Wellington affiliates, 1997-2010 | 172 | None |
| 34 | Columbia Dividend Opportunity Fund | Annual Report 2023 |
(Unaudited)
Independent trustees (continued)
| Name, address, year of birth | Position held with the Columbia Funds and length of service | Principal occupation(s) during past five years and other relevant professional experience | Number of Funds in the Columbia Funds Complex* overseen | Other directorships held by Trustee during the past five years and other relevant Board experience |
| David M. Moffett c/o Columbia Management Investment Advisers, LLC 290 Congress Street Boston, MA 02210 1952 | Trustee since 2011 | Retired; former Chief Executive Officer of Freddie Mac and Chief Financial Officer of U.S. Bank | 172 | Director, CSX Corporation (transportation suppliers); Director, PayPal Holdings Inc. (payment and data processing services); Trustee, University of Oklahoma Foundation; former Director, eBay Inc. (online trading community), 2007-2015; and former Director, CIT Bank, CIT Group Inc. (commercial and consumer finance), 2010-2016; former Senior Adviser to The Carlyle Group (financial services), March 2008-September 2008; former Governance Consultant to Bridgewater Associates, January 2013-December 2015 |
| Catherine James Paglia c/o Columbia Management Investment Advisers, LLC 290 Congress Street Boston, MA 02210 1952 | Trustee since 2004 | Director, Enterprise Asset Management, Inc. (private real estate and asset management company), since September 1998; Managing Director and Partner, Interlaken Capital, Inc., 1989-1997; Vice President, 1982-1985, Principal, 1985-1987, Managing Director, 1987-1989, Morgan Stanley; Vice President, Investment Banking, 1980-1982, Associate, Investment Banking, 1976-1980, Dean Witter Reynolds, Inc. | 174 | Director, Valmont Industries, Inc. (irrigation systems manufacturer), since 2012; Trustee, Carleton College (on the Investment Committee), since 1987; Trustee, Carnegie Endowment for International Peace (on the Investment Committee), since 2009 |
| Natalie A. Trunow c/o Columbia Management Investment Advisers, LLC 290 Congress Street Boston, MA 02210 1967 | Trustee since 2020 | Chief Executive Officer, Millennial Portfolio Solutions LLC (asset management and consulting services), January 2016-January 2021; Non-executive Member of the Investment Committee and Valuation Committee, Sarona Asset Management Inc. (private equity firm) since September 2019; Advisor, Horizon Investments (asset management and consulting services), August 2018-January 2022; Advisor, Paradigm Asset Management, November 2016-January 2022; Consultant to Independent Trustees of CFVIT and CFST I from September 2016 to June 2020 with respect to CFVIT and to December 2020 with respect to CFST I; Director of Investments/Consultant, Casey Family Programs, April 2016-November 2016; Senior Vice President and Chief Investment Officer, Calvert Investments, August 2008-January 2016; Section Head and Portfolio Manager, General Motors Asset Management, June 1997-August 2008 | 172 | Independent Director, Investment Committee, Health Services for Children with Special Needs, Inc., 2010-2021; Independent Director, (Executive Committee and Chair, Audit Committee), Consumer Credit Counseling Services (formerly Guidewell Financial Solutions), since 2016; Independent Director, (Investment Committee), Sarona Asset Management, since 2019 |
| Columbia Dividend Opportunity Fund | Annual Report 2023 | 35 |
(Unaudited)
Independent trustees (continued)
| Name, address, year of birth | Position held with the Columbia Funds and length of service | Principal occupation(s) during past five years and other relevant professional experience | Number of Funds in the Columbia Funds Complex* overseen | Other directorships held by Trustee during the past five years and other relevant Board experience |
| Sandra L. Yeager c/o Columbia Management Investment Advisers, LLC 290 Congress Street Boston, MA 02210 1964 | Trustee since 2017 | Retired; President and founder, Hanoverian Capital, LLC (SEC registered investment advisor firm), 2008-2016; Managing Director, DuPont Capital, 2006-2008; Managing Director, Morgan Stanley Investment Management, 2004-2006; Senior Vice President, Alliance Bernstein, 1990-2004 | 174 | Former Director, NAPE (National Alliance for Partnerships in Equity) Education Foundation, October 2016-October 2020; Advisory Board, Jennersville YMCA, since 2022 |
| Name, address, year of birth | Position held with the Columbia Funds and length of service | Principal occupation(s) during the past five years and other relevant professional experience | Number of Funds in the Columbia Funds Complex overseen | Other directorships held by Trustee during the past five years and other relevant Board experience |
| Daniel J. Beckman c/o Columbia Management Investment Advisers, LLC 290 Congress Street Boston, MA 02210 1962 | Trustee since November 2021 and President since June 2021 | Vice President – Head of North America Product, Columbia Management Investment Advisers, LLC, since April 2015; President and Principal Executive Officer of the Columbia Funds, since June 2021; officer of Columbia Funds and affiliated funds, 2020-2021 | 174 | Director, Ameriprise Trust Company, since October 2016; Director, Columbia Management Investment Distributors, Inc. since November 2018; Board of Governors, Columbia Wanger Asset Management, LLC since, January 2022; Director, Columbia Threadneedle Canada, Inc., since December 2022 |
| * | The term “Columbia Funds Complex” as used herein includes Columbia Seligman Premium Technology Growth Fund, Tri-Continental Corporation and each series of Columbia Funds Series Trust (CFST), Columbia Funds Series Trust I (CFST I), Columbia Funds Series Trust II (CFST II), Columbia ETF Trust I (CET I), Columbia ETF Trust II (CET II), Columbia Funds Variable Insurance Trust (CFVIT) and Columbia Funds Variable Series Trust II (CFVST II). Messrs. Batejan, Beckman, Gallagher and Hacker and Mses. Blatz, Carlton, Carrig, Flynn, Paglia, and Yeager serve as directors of Columbia Seligman Premium Technology Growth Fund and Tri-Continental Corporation. |
| ** | Interested person (as defined under the 1940 Act) by reason of being an officer, director, security holder and/or employee of the Investment Manager or Ameriprise Financial. |
| 36 | Columbia Dividend Opportunity Fund | Annual Report 2023 |
(Unaudited)
The Board has appointed officers who are responsible for day-to-day business decisions based on policies it has established. The officers serve at the pleasure of the Board. The following table provides basic information about the Officers of the Fund as of the printing of this report, including principal occupations during the past five years, although their specific titles may have varied over the period. In addition to Mr. Beckman, who is President and Principal Executive Officer, the Fund’s other officers are:
| Name, address and year of birth | Position and year first appointed to position for any Fund in the Columbia Funds Complex or a predecessor thereof | Principal occupation(s) during past five years |
| Michael G. Clarke 290 Congress Street Boston, MA 02210 1969 | Chief Financial Officer and Principal Financial Officer (2009) and Senior Vice President (2019) | Senior Vice President and North America Head of Operations & Investor Services, Columbia Management Investment Advisers, LLC, since June 2023 (previously Senior Vice President and Head of Global Operations, March 2022 – June 2023, Vice President, Head of North America Operations, and Co-Head of Global Operations, June 2019 - February 2022 and Vice President – Accounting and Tax, May 2010 - May 2019); senior officer of Columbia Funds and affiliated funds, since 2002. Director, Ameriprise Trust Company, since June 2023. |
| Joseph Beranek 5890 Ameriprise Financial Center Minneapolis, MN 55474 1965 | Treasurer and Chief Accounting Officer (Principal Accounting Officer) (2019) and Principal Financial Officer (2020), CFST, CFST I, CFST II, CFVIT and CFVST II; Assistant Treasurer, CET I and CET II | Vice President – Mutual Fund Accounting and Financial Reporting, Columbia Management Investment Advisers, LLC, since December 2018 and March 2017, respectively. |
| Marybeth Pilat 290 Congress Street Boston, MA 02210 1968 | Treasurer and Chief Accounting Officer (Principal Accounting Officer) and Principal Financial Officer (2020) for CET I and CET II; Assistant Treasurer, CFST, CFST I, CFST II, CFVIT and CFVST II | Vice President – Product Pricing and Administration, Columbia Management Investment Advisers, LLC, since May 2017. |
| William F. Truscott 290 Congress Street Boston, MA 02210 1960 | Senior Vice President (2001) | Formerly, Trustee/Director of Columbia Funds Complex or legacy funds, November 2001 - January 1, 2021; Chief Executive Officer, Global Asset Management, Ameriprise Financial, Inc., since September 2012; Chairman of the Board and President, Columbia Management Investment Advisers, LLC, since July 2004 and February 2012, respectively; Chairman of the Board and Chief Executive Officer, Columbia Management Investment Distributors, Inc., since November 2008 and February 2012, respectively;Chairman of the Board and Director, Threadneedle Asset Management Holdings, Sàrl, since March 2013 and December 2008, respectively; senior executive of various entities affiliated with Columbia Threadneedle. |
| Christopher O. Petersen 5228 Ameriprise Financial Center Minneapolis, MN 55474 1970 | Senior Vice President and Assistant Secretary (2021) | Formerly, Trustee/Director of funds within the Columbia Funds Complex, July 1, 2020 - November 22, 2021; Senior Vice President and Assistant General Counsel, Ameriprise Financial, Inc., since September 2021 (previously Vice President and Lead Chief Counsel, January 2015 - September 2021); formerly, President and Principal Executive Officer of the Columbia Funds, 2015 - 2021; officer of Columbia Funds and affiliated funds, since 2007. |
| Thomas P. McGuire 290 Congress Street Boston, MA 02210 1972 | Senior Vice President and Chief Compliance Officer (2012) | Vice President – Asset Management Compliance, Ameriprise Financial, Inc., since May 2010; Chief Compliance Officer, Columbia Acorn/Wanger Funds, since December 2015; formerly, Chief Compliance Officer, Ameriprise Certificate Company, September 2010 – September 2020. |
| Ryan C. Larrenaga 290 Congress Street Boston, MA 02210 1970 | Senior Vice President (2017), Chief Legal Officer (2017), and Secretary (2015) | Vice President and Chief Counsel, Ameriprise Financial, Inc., since August 2018 (previously Vice President and Group Counsel, August 2011 - August 2018); Chief Legal Officer, Columbia Acorn/Wanger Funds, since September 2020; officer of Columbia Funds and affiliated funds, since 2005. |
| Columbia Dividend Opportunity Fund | Annual Report 2023 | 37 |
(Unaudited)
Fund officers (continued)
| Name, address and year of birth | Position and year first appointed to position for any Fund in the Columbia Funds Complex or a predecessor thereof | Principal occupation(s) during past five years |
| Michael E. DeFao 290 Congress Street Boston, MA 02210 1968 | Vice President (2011) and Assistant Secretary (2010) | Vice President and Chief Counsel, Ameriprise Financial, Inc., since May 2010; Vice President, Chief Legal Officer and Assistant Secretary, Columbia Management Investment Advisers, LLC, since October 2021 (previously Vice President and Assistant Secretary, May 2010 – September 2021). |
| Lyn Kephart-Strong 5903 Ameriprise Financial Center Minneapolis, MN 55474 1960 | Vice President (2015) | Vice President, Global Investment Operations Services, Columbia Management Investment Advisers, LLC, since 2010; Director (since January 2007) and President (since October 2014), Columbia Management Investment Services Corp.; Director (since December 2017) and President (since January 2017), Ameriprise Trust Company. |
| • | the Fund had sufficient liquidity to both meet redemptions and operate effectively on behalf of shareholders; |
| • | there were no material changes to the Program during the period; |
| • | the implementation of the Program was effective to manage the Fund’s liquidity risk; and |
| • | the Program operated adequately during the period. |
| 38 | Columbia Dividend Opportunity Fund | Annual Report 2023 |
columbiathreadneedleus.com/investor/. The Fund is distributed by Columbia Management Investment Distributors, Inc., member FINRA, and managed by Columbia Management Investment Advisers, LLC.

May 31, 2023

| 3 | |
| 5 | |
| 7 | |
| 8 | |
| 13 | |
| 15 | |
| 16 | |
| 18 | |
| 22 | |
| 35 | |
| 36 | |
| 36 | |
| 42 |
(Unaudited)

| Average annual total returns (%) (for the period ended May 31, 2023) | |||||
| Inception | 1 Year | 5 Years | 10 Years | ||
| Class A | Excluding sales charges | 06/23/83 | 3.29 | 17.05 | 19.04 |
| Including sales charges | -2.65 | 15.68 | 18.34 | ||
| Advisor Class | 08/03/09 | 3.55 | 17.35 | 19.34 | |
| Class C | Excluding sales charges | 05/27/99 | 2.52 | 16.18 | 18.15 |
| Including sales charges | 1.66 | 16.18 | 18.15 | ||
| Institutional Class | 09/27/10 | 3.57 | 17.35 | 19.34 | |
| Institutional 2 Class | 11/30/01 | 3.58 | 17.40 | 19.43 | |
| Institutional 3 Class* | 03/01/17 | 3.64 | 17.46 | 19.30 | |
| Class R | 04/30/03 | 3.04 | 16.76 | 18.74 | |
| S&P North American Technology Sector Index | 14.21 | 15.15 | 18.49 | ||
| * | The returns shown for periods prior to the share class inception date (including returns for the Life of the Fund, if shown, which are since Fund inception) include the returns of the Fund’s oldest share class. These returns are adjusted to reflect any higher class-related operating expenses of the newer share classes, as applicable. Please visit columbiathreadneedleus.com/investor/investment-products/mutual-funds/appended-performance for more information. |
| Columbia Seligman Technology and Information Fund | Annual Report 2023 | 3 |
(Unaudited)

| Portfolio breakdown (%) (at May 31, 2023) | |
| Common Stocks | 98.5 |
| Convertible Bonds | 0.0(a) |
| Exchange-Traded Equity Funds | 0.1 |
| Money Market Funds | 1.4 |
| Preferred Stocks | 0.0(a) |
| Total | 100.0 |
| (a) | Rounds to zero. |
| Equity sector breakdown (%) (at May 31, 2023) | |
| Communication Services | 11.1 |
| Consumer Discretionary | 1.8 |
| Financials | 4.4 |
| Health Care | 0.3 |
| Industrials | 2.1 |
| Information Technology | 80.3 |
| Total | 100.0 |
| Equity sub-industry breakdown (%) (at May 31, 2023) | |
| Information Technology | |
| Application Software | 8.7 |
| Communications Equipment | 3.7 |
| Electronic Equipment & Instruments | 1.6 |
| Internet Services & Infrastructure | 2.2 |
| IT Consulting & Other Services | 0.5 |
| Semiconductor Materials & Equipment | 14.7 |
| Semiconductors | 23.7 |
| Systems Software | 14.9 |
| Technology Hardware, Storage & Peripherals | 10.3 |
| Total | 80.3 |
| 4 | Columbia Seligman Technology and Information Fund | Annual Report 2023 |
(Unaudited)
| Columbia Seligman Technology and Information Fund | Annual Report 2023 | 5 |
(Unaudited)
| • | The Fund’s underperformance, relative to the benchmark, was due to stock selection, particularly within semiconductors, technology hardware and communications equipment. |
| • | Selections within the communication services sector also weighed on performance. |
| • | Individual securities that detracted most from relative performance during the period included semiconductor companies NVIDIA Corp., Synaptics, Inc. and Teradyne, Inc., technology hardware company Western Digital Corp. and fuel cell technology company Bloom Energy Corp. |
| • | The Fund did not own NVIDIA for much of the period on valuation concerns and missed out on the company’s significant rise in stock price. |
| • | Not owning Meta Platforms, Inc. hurt relative performance. |
| • | Allocations were positive, relative to the benchmark, during the period. An overweighted allocation to semiconductors and an underweighted allocation to the financials and consumer discretionary sectors were most beneficial during the 12-month period. |
| • | Selections within the electronic equipment and software industries contributed, relative to the benchmark. |
| • | Top individual contributors included application software company Synopsis, Inc. and semiconductor companies Rambus, Inc., Broadcom, Inc. and Renesas Electronics Corp. |
| • | Not owning Amazon.com contributed, as did relative underweights in the poorly performing chip companies Intel Corp. and QUALCOMM. Inc. The Fund sold its positions in Intel and QUALCOMM. |
| 6 | Columbia Seligman Technology and Information Fund | Annual Report 2023 |
(Unaudited)
| December 1, 2022 — May 31, 2023 | |||||||
| Account value at the beginning of the period ($) | Account value at the end of the period ($) | Expenses paid during the period ($) | Fund’s annualized expense ratio (%) | ||||
| Actual | Hypothetical | Actual | Hypothetical | Actual | Hypothetical | Actual | |
| Class A | 1,000.00 | 1,000.00 | 1,116.20 | 1,019.00 | 6.28 | 5.99 | 1.19 |
| Advisor Class | 1,000.00 | 1,000.00 | 1,117.60 | 1,020.19 | 5.02 | 4.78 | 0.95 |
| Class C | 1,000.00 | 1,000.00 | 1,111.90 | 1,015.26 | 10.21 | 9.75 | 1.94 |
| Institutional Class | 1,000.00 | 1,000.00 | 1,117.70 | 1,020.19 | 5.02 | 4.78 | 0.95 |
| Institutional 2 Class | 1,000.00 | 1,000.00 | 1,117.70 | 1,020.39 | 4.80 | 4.58 | 0.91 |
| Institutional 3 Class | 1,000.00 | 1,000.00 | 1,118.20 | 1,020.64 | 4.54 | 4.33 | 0.86 |
| Class R | 1,000.00 | 1,000.00 | 1,114.90 | 1,017.75 | 7.59 | 7.24 | 1.44 |
| Columbia Seligman Technology and Information Fund | Annual Report 2023 | 7 |
May 31, 2023
| Common Stocks 98.0% | ||
| Issuer | Shares | Value ($) |
| Communication Services 10.9% | ||
| Broadcasting 1.3% | ||
| Fox Corp., Class A | 3,906,180 | 121,872,816 |
| Total Broadcasting | 121,872,816 | |
| Cable & Satellite 0.5% | ||
| Comcast Corp., Class A(a) | 1,238,625 | 48,739,894 |
| Total Cable & Satellite | 48,739,894 | |
| Interactive Home Entertainment 1.5% | ||
| Activision Blizzard, Inc.(b) | 1,852,581 | 148,576,996 |
| Total Interactive Home Entertainment | 148,576,996 | |
| Interactive Media & Services 6.6% | ||
| Alphabet, Inc., Class A(b) | 2,955,380 | 363,127,541 |
| Alphabet, Inc., Class C(b) | 1,843,360 | 227,415,323 |
| Match Group, Inc.(b) | 1,107,700 | 38,215,650 |
| Total Interactive Media & Services | 628,758,514 | |
| Movies & Entertainment 0.5% | ||
| Warner Bros Discovery, Inc.(b) | 4,206,206 | 47,446,003 |
| Total Movies & Entertainment | 47,446,003 | |
| Wireless Telecommunication Services 0.5% | ||
| T-Mobile US, Inc.(b) | 349,300 | 47,941,425 |
| Total Wireless Telecommunication Services | 47,941,425 | |
| Total Communication Services | 1,043,335,648 | |
| Consumer Discretionary 1.7% | ||
| Broadline Retail 1.7% | ||
| eBay, Inc. | 3,893,624 | 165,634,765 |
| total Broadline Retail | 165,634,765 | |
| Total Consumer Discretionary | 165,634,765 | |
| Financials 4.4% | ||
| Consumer Finance 0.0% | ||
| CommonBond, Class A(b),(c),(d),(e) | 1,505,550 | 2 |
| Total Consumer Finance | 2 | |
| Transaction & Payment Processing Services 4.4% | ||
| Fidelity National Information Services, Inc. | 1,113,700 | 60,774,609 |
| Fiserv, Inc.(b) | 830,944 | 93,223,607 |
| Visa, Inc., Class A | 1,192,425 | 263,561,698 |
| Total Transaction & Payment Processing Services | 417,559,914 | |
| Total Financials | 417,559,916 | |
| Common Stocks (continued) | ||
| Issuer | Shares | Value ($) |
| Health Care 0.3% | ||
| Biotechnology 0.3% | ||
| Apnimed, Inc.(b),(c),(d),(e) | 1,127,586 | 12,517,332 |
| Apnimed, Inc.(b),(c),(d),(e) | 675,613 | 7,499,980 |
| Apnimed, Inc.(b),(c),(d),(e) | 360,327 | 3,999,990 |
| Apnimed, Inc.(b),(c),(d),(e) | 450,409 | 4,999,990 |
| Eiger BioPharmaceuticals, Inc.(b),(f) | 2,319,150 | 2,597,448 |
| Total Biotechnology | 31,614,740 | |
| Total Health Care | 31,614,740 | |
| Industrials 2.0% | ||
| Heavy Electrical Equipment 1.8% | ||
| Bloom Energy Corp., Class A(b),(f) | 12,967,348 | 177,912,015 |
| Total Heavy Electrical Equipment | 177,912,015 | |
| Human Resource & Employment Services 0.2% | ||
| HireRight Holdings Corp.(b) | 1,528,235 | 15,633,844 |
| Total Human Resource & Employment Services | 15,633,844 | |
| Total Industrials | 193,545,859 | |
| Information Technology 78.7% | ||
| Application Software 8.6% | ||
| Cerence, Inc.(b) | 1,831,524 | 52,235,065 |
| Dropbox, Inc., Class A(b) | 10,994,209 | 253,086,691 |
| RingCentral, Inc., Class A(b) | 192,508 | 6,680,028 |
| Salesforce, Inc.(b) | 313,251 | 69,974,008 |
| Splunk, Inc.(b) | 783,600 | 77,803,644 |
| Synopsys, Inc.(b) | 790,065 | 359,447,972 |
| Total Application Software | 819,227,408 | |
| Communications Equipment 3.6% | ||
| Arista Networks, Inc.(b) | 769,653 | 128,024,080 |
| F5, Inc.(b) | 855,300 | 126,225,174 |
| Lumentum Holdings, Inc.(b) | 1,714,670 | 90,706,043 |
| Total Communications Equipment | 344,955,297 | |
| Electronic Equipment & Instruments 1.6% | ||
| Advanced Energy Industries, Inc. | 1,575,763 | 154,661,139 |
| Total Electronic Equipment & Instruments | 154,661,139 | |
| Internet Services & Infrastructure 2.1% | ||
| GoDaddy, Inc., Class A(b) | 2,800,930 | 205,532,243 |
| Total Internet Services & Infrastructure | 205,532,243 | |
| 8 | Columbia Seligman Technology and Information Fund | Annual Report 2023 |
May 31, 2023
| Common Stocks (continued) | ||
| Issuer | Shares | Value ($) |
| IT Consulting & Other Services 0.5% | ||
| DXC Technology Co.(b) | 1,888,800 | 47,276,664 |
| Total IT Consulting & Other Services | 47,276,664 | |
| Semiconductor Materials & Equipment 14.4% | ||
| Applied Materials, Inc. | 2,687,631 | 358,261,212 |
| Lam Research Corp. | 1,146,668 | 707,150,156 |
| Teradyne, Inc. | 3,172,822 | 317,885,036 |
| Total Semiconductor Materials & Equipment | 1,383,296,404 | |
| Semiconductors 23.2% | ||
| Analog Devices, Inc. | 1,608,402 | 285,796,951 |
| Broadcom, Inc. | 617,187 | 498,662,409 |
| indie Semiconductor, Inc., Class A(b) | 2,000,000 | 19,000,000 |
| Marvell Technology, Inc. | 4,579,353 | 267,846,357 |
| Microchip Technology, Inc. | 2,151,550 | 161,925,653 |
| Movella, Inc.(b) | 6,015,834 | 7,038,525 |
| NVIDIA Corp. | 232,100 | 87,812,714 |
| NXP Semiconductors NV | 711,000 | 127,340,100 |
| ON Semiconductor Corp.(b) | 857,175 | 71,659,830 |
| Qorvo, Inc.(b) | 1,089,250 | 105,940,455 |
| Rambus, Inc.(b) | 1,313,200 | 83,992,272 |
| Renesas Electronics Corp.(b) | 11,464,600 | 185,556,851 |
| Semtech Corp.(b) | 745,000 | 16,196,300 |
| Skyworks Solutions, Inc. | 251,600 | 26,043,116 |
| SMART Global Holdings, Inc.(b),(f) | 3,151,596 | 71,163,038 |
| Synaptics, Inc.(b),(f) | 2,309,845 | 198,739,064 |
| Transphorm, Inc.(b),(f) | 2,987,500 | 11,740,875 |
| Total Semiconductors | 2,226,454,510 | |
| Systems Software 14.6% | ||
| Adeia, Inc.(f) | 7,076,541 | 69,420,867 |
| Fortinet, Inc.(b) | 2,626,163 | 179,445,718 |
| Gen Digital, Inc. | 7,599,508 | 133,295,370 |
| Microsoft Corp. | 1,282,250 | 421,078,078 |
| Oracle Corp. | 2,230,600 | 236,309,764 |
| Palo Alto Networks, Inc.(b) | 1,033,410 | 220,519,360 |
| Tenable Holdings, Inc.(b) | 999,294 | 40,961,061 |
| VMware, Inc., Class A(b) | 695,969 | 94,853,615 |
| Total Systems Software | 1,395,883,833 | |
| Common Stocks (continued) | ||
| Issuer | Shares | Value ($) |
| Technology Hardware, Storage & Peripherals 10.1% | ||
| Apple, Inc.(a) | 3,130,700 | 554,916,575 |
| Dell Technologies, Inc. | 2,798,936 | 125,420,322 |
| NetApp, Inc. | 2,717,706 | 180,319,793 |
| Western Digital Corp.(b) | 2,801,592 | 108,505,658 |
| Total Technology Hardware, Storage & Peripherals | 969,162,348 | |
| Total Information Technology | 7,546,449,846 | |
| Total Common Stocks (Cost: $4,985,971,315) | 9,398,140,774 | |
| Convertible Bonds 0.0% | |||
| Issuer | Coupon Rate | Principal Amount | Value ($) |
| Technology 0.0% | |||
| Movella, Inc.(c),(d),(e) | |||
| 09/01/2023 | 6.000% | 3,000,000 | 772,500 |
| Total Convertible Bonds (Cost: $3,000,000) | 772,500 | ||
| Exchange-Traded Equity Funds 0.1% | ||
| Issuer | Shares | Value ($) |
| Financials 0.1% | ||
| Diversified Capital Markets 0.1% | ||
| Columbia Seligman Semiconductor and Technology ETF(f) | 540,600 | 10,466,935 |
| Total Diversified Capital Markets | 10,466,935 | |
| Total Financials | 10,466,935 | |
| Total Exchange-Traded Equity Funds (Cost: $8,811,780) | 10,466,935 | |
| Preferred Stocks 0.0% | |||
| Issuer | Shares | Value ($) | |
| Financials 0.0% | |||
| Consumer Finance 0.0% | |||
| CommonBond LLC(c),(d),(e),(g) | 1.000% | 686,561 | 1 |
| Total Financials | 1 | ||
| Total Preferred Stocks (Cost: $295,734) | 1 | ||
| Columbia Seligman Technology and Information Fund | Annual Report 2023 | 9 |
May 31, 2023
| Money Market Funds 1.5% | ||
| Shares | Value ($) | |
| Columbia Short-Term Cash Fund, 5.241%(f),(h) | 137,095,672 | 137,027,124 |
| Total Money Market Funds (Cost: $137,024,883) | 137,027,124 | |
| Total Investments in Securities (Cost $5,135,103,712) | 9,546,407,334 | |
| Other Assets & Liabilities, Net | 40,721,035 | |
| Net Assets | $9,587,128,369 | |
| Call option contracts written | ||||||||
| Description | Counterparty | Trading currency | Notional amount | Number of contracts | Exercise price/Rate | Expiration date | Premium received ($) | Value ($) |
| Apple, Inc. | Morgan Stanley | USD | (116,630,500) | (6,580) | 180.00 | 9/15/2023 | (3,637,826) | (5,938,450) |
| Comcast Corp | Morgan Stanley | USD | (39,881,225) | (10,135) | 45.00 | 1/19/2024 | (979,550) | (1,236,470) |
| Total | (4,617,376) | (7,174,920) | ||||||
| (a) | This security or a portion of this security has been pledged as collateral in connection with derivative contracts. |
| (b) | Non-income producing investment. |
| (c) | Represents fair value as determined in good faith under procedures approved by the Board of Trustees. At May 31, 2023, the total value of these securities amounted to $29,789,795, which represents 0.31% of total net assets. |
| (d) | Denotes a restricted security, which is subject to legal or contractual restrictions on resale under federal securities laws. Disposal of a restricted investment may involve time-consuming negotiations and expenses, and prompt sale at an acceptable price may be difficult to achieve. Private placement securities are generally considered to be restricted, although certain of those securities may be traded between qualified institutional investors under the provisions of Section 4(a)(2) and Rule 144A. The Fund will not incur any registration costs upon such a trade. These securities are valued at fair value determined in good faith under consistently applied procedures approved by the Fund’s Board of Trustees. At May 31, 2023, the total market value of these securities amounted to $29,789,795, which represents 0.31% of total net assets. Additional information on these securities is as follows: |
| Security | Acquisition Dates | Shares | Cost ($) | Value ($) |
| Apnimed, Inc. | 04/28/2022 | 360,327 | 4,002,965 | 3,999,990 |
| Apnimed, Inc. | 12/22/2022 | 450,409 | 5,005,765 | 4,999,990 |
| Apnimed, Inc. | 04/28/2022 | 675,613 | 5,999,993 | 7,499,980 |
| Apnimed, Inc. | 03/12/2021 | 1,127,586 | 9,999,997 | 12,517,332 |
| CommonBond LLC | 10/15/2020-12/31/2021 | 686,561 | 295,734 | 1 |
| CommonBond, Class A | 03/19/2018-12/31/2021 | 1,505,550 | 10,292,674 | 2 |
| Movella, Inc. | 03/08/2022 | 3,000,000 | 3,000,000 | 772,500 |
| 38,597,128 | 29,789,795 |
| 10 | Columbia Seligman Technology and Information Fund | Annual Report 2023 |
May 31, 2023
| (e) | Valuation based on significant unobservable inputs. |
| (f) | As defined in the Investment Company Act of 1940, as amended, an affiliated company is one in which the Fund owns 5% or more of the company’s outstanding voting securities, or a company which is under common ownership or control with the Fund. The value of the holdings and transactions in these affiliated companies during the year ended May 31, 2023 are as follows: |
| Affiliated issuers | Beginning of period($) | Purchases($) | Sales($) | Net change in unrealized appreciation (depreciation)($) | End of period($) | Realized gain (loss)($) | Dividends($) | End of period shares |
| Adeia, Inc. | ||||||||
| — | 90,406,308* | — | (20,985,441) | 69,420,867 | — | 1,061,481 | 7,076,541 | |
| Bloom Energy Corp., Class A | ||||||||
| 177,998,785 | 46,806,008 | — | (46,892,778) | 177,912,015 | — | — | 12,967,348 | |
| Columbia Seligman Semiconductor and Technology ETF | ||||||||
| — | 8,811,780 | — | 1,655,155 | 10,466,935 | — | 56,184 | 540,600 | |
| Columbia Short-Term Cash Fund, 5.241% | ||||||||
| 4,554,197 | 1,257,298,530 | (1,124,827,844) | 2,241 | 137,027,124 | (22,376) | 4,640,236 | 137,095,672 | |
| Eiger BioPharmaceuticals, Inc. | ||||||||
| 16,094,901 | — | — | (13,497,453) | 2,597,448 | — | — | 2,319,150 | |
| SMART Global Holdings, Inc. | ||||||||
| 70,486,576 | 4,759,736 | — | (4,083,274) | 71,163,038 | — | — | 3,151,596 | |
| Synaptics, Inc. | ||||||||
| 307,422,319 | 25,010,838 | — | (133,694,093) | 198,739,064 | — | — | 2,309,845 | |
| Transphorm, Inc. | ||||||||
| 17,954,875 | — | — | (6,214,000) | 11,740,875 | — | — | 2,987,500 | |
| Xperi Holding Corp. | ||||||||
| 116,479,865 | — | (185,733,819)* | 69,253,954 | — | — | 353,827 | — | |
| Xperi, Inc.† | ||||||||
| — | 95,327,511* | (95,327,511) | — | — | (65,388,814) | — | — | |
| Total | 710,991,518 | (154,455,689) | 679,067,366 | (65,411,190) | 6,111,728 | |||
| * | Includes the effects of a corporate action. |
| † | Issuer was not an affiliate at the end of period. |
| (g) | Perpetual security with no specified maturity date. |
| (h) | The rate shown is the seven-day current annualized yield at May 31, 2023. |
| USD | US Dollar |
| ■ | Level 1 — Valuations based on quoted prices for investments in active markets that the Fund has the ability to access at the measurement date. Valuation adjustments are not applied to Level 1 investments. |
| ■ | Level 2 — Valuations based on other significant observable inputs (including quoted prices for similar securities, interest rates, prepayment speeds, credit risks, etc.). |
| ■ | Level 3 — Valuations based on significant unobservable inputs (including the Fund’s own assumptions and judgment in determining the fair value of investments). |
| Columbia Seligman Technology and Information Fund | Annual Report 2023 | 11 |
May 31, 2023
Inputs that are used in determining fair value of an investment may include price information, credit data, volatility statistics, and other factors. These inputs can be either observable or unobservable. The availability of observable inputs can vary between investments, and is affected by various factors such as the type of investment, and the volume and level of activity for that investment or similar investments in the marketplace. The inputs will be considered by the Investment Manager, along with any other relevant factors in the calculation of an investment’s fair value. The Fund uses prices and inputs that are current as of the measurement date, which may include periods of market dislocations. During these periods, the availability of prices and inputs may be reduced for many investments. This condition could cause an investment to be reclassified between the various levels within the hierarchy.
| Level 1 ($) | Level 2 ($) | Level 3 ($) | Total ($) | |
| Investments in Securities | ||||
| Common Stocks | ||||
| Communication Services | 1,043,335,648 | — | — | 1,043,335,648 |
| Consumer Discretionary | 165,634,765 | — | — | 165,634,765 |
| Financials | 417,559,914 | — | 2 | 417,559,916 |
| Health Care | 2,597,448 | — | 29,017,292 | 31,614,740 |
| Industrials | 193,545,859 | — | — | 193,545,859 |
| Information Technology | 7,360,892,995 | 185,556,851 | — | 7,546,449,846 |
| Total Common Stocks | 9,183,566,629 | 185,556,851 | 29,017,294 | 9,398,140,774 |
| Convertible Bonds | — | — | 772,500 | 772,500 |
| Exchange-Traded Equity Funds | 10,466,935 | — | — | 10,466,935 |
| Preferred Stocks | ||||
| Financials | — | — | 1 | 1 |
| Total Preferred Stocks | — | — | 1 | 1 |
| Money Market Funds | 137,027,124 | — | — | 137,027,124 |
| Total Investments in Securities | 9,331,060,688 | 185,556,851 | 29,789,795 | 9,546,407,334 |
| Investments in Derivatives | ||||
| Liability | ||||
| Call Option Contracts Written | (7,174,920) | — | — | (7,174,920) |
| Total | 9,323,885,768 | 185,556,851 | 29,789,795 | 9,539,232,414 |
| 12 | Columbia Seligman Technology and Information Fund | Annual Report 2023 |
May 31, 2023
| Assets | |
| Investments in securities, at value | |
| Unaffiliated issuers (cost $4,501,549,727) | $8,867,339,968 |
| Affiliated issuers (cost $633,553,985) | 679,067,366 |
| Cash | 157,920 |
| Receivable for: | |
| Investments sold | 34,866,494 |
| Capital shares sold | 18,414,115 |
| Dividends | 7,009,595 |
| Interest | 221,500 |
| Foreign tax reclaims | 133,051 |
| Expense reimbursement due from Investment Manager | 219 |
| Prepaid expenses | 41,616 |
| Total assets | 9,607,251,844 |
| Liabilities | |
| Option contracts written, at value (premiums received $4,617,376) | 7,174,920 |
| Payable for: | |
| Investments purchased | 2,950,349 |
| Capital shares purchased | 8,409,586 |
| Management services fees | 220,163 |
| Distribution and/or service fees | 51,736 |
| Transfer agent fees | 802,259 |
| Compensation of board members | 373,961 |
| Other expenses | 140,501 |
| Total liabilities | 20,123,475 |
| Net assets applicable to outstanding capital stock | $9,587,128,369 |
| Represented by | |
| Paid in capital | 4,977,461,733 |
| Total distributable earnings (loss) | 4,609,666,636 |
| Total - representing net assets applicable to outstanding capital stock | $9,587,128,369 |
| Columbia Seligman Technology and Information Fund | Annual Report 2023 | 13 |
May 31, 2023
| Class A | |
| Net assets | $6,081,864,940 |
| Shares outstanding | 61,086,682 |
| Net asset value per share | $99.56 |
| Maximum sales charge | 5.75% |
| Maximum offering price per share (calculated by dividing the net asset value per share by 1.0 minus the maximum sales charge for Class A shares) | $105.63 |
| Advisor Class | |
| Net assets | $352,599,425 |
| Shares outstanding | 3,706,494 |
| Net asset value per share | $95.13 |
| Class C | |
| Net assets | $312,209,850 |
| Shares outstanding | 6,619,834 |
| Net asset value per share | $47.16 |
| Institutional Class | |
| Net assets | $2,139,513,406 |
| Shares outstanding | 18,545,369 |
| Net asset value per share | $115.37 |
| Institutional 2 Class | |
| Net assets | $453,797,484 |
| Shares outstanding | 3,902,871 |
| Net asset value per share | $116.27 |
| Institutional 3 Class | |
| Net assets | $178,005,165 |
| Shares outstanding | 1,548,815 |
| Net asset value per share | $114.93 |
| Class R | |
| Net assets | $69,138,099 |
| Shares outstanding | 760,577 |
| Net asset value per share | $90.90 |
| 14 | Columbia Seligman Technology and Information Fund | Annual Report 2023 |
Year Ended May 31, 2023
| Net investment income | |
| Income: | |
| Dividends — unaffiliated issuers | $73,214,393 |
| Dividends — affiliated issuers | 6,111,728 |
| Interest | 180,000 |
| Interfund lending | 771 |
| Foreign taxes withheld | (667,374) |
| Total income | 78,839,518 |
| Expenses: | |
| Management services fees | 72,142,701 |
| Distribution and/or service fees | |
| Class A | 14,113,967 |
| Class C | 3,018,228 |
| Class R | 321,630 |
| Transfer agent fees | |
| Class A | 5,304,348 |
| Advisor Class | 287,477 |
| Class C | 283,512 |
| Institutional Class | 1,697,612 |
| Institutional 2 Class | 197,159 |
| Institutional 3 Class | 9,146 |
| Class R | 60,423 |
| Compensation of board members | 155,402 |
| Custodian fees | 50,695 |
| Printing and postage fees | 284,080 |
| Registration fees | 236,319 |
| Accounting services fees | 31,491 |
| Legal fees | 131,023 |
| Compensation of chief compliance officer | 1,571 |
| Other | 342,167 |
| Total expenses | 98,668,951 |
| Fees waived or expenses reimbursed by Investment Manager and its affiliates | (63,070) |
| Expense reduction | (4,852) |
| Total net expenses | 98,601,029 |
| Net investment loss | (19,761,511) |
| Realized and unrealized gain (loss) — net | |
| Net realized gain (loss) on: | |
| Investments — unaffiliated issuers | 288,535,231 |
| Investments — affiliated issuers | (65,411,190) |
| Foreign currency translations | (162,916) |
| Option contracts written | 1,853,869 |
| Net realized gain | 224,814,994 |
| Net change in unrealized appreciation (depreciation) on: | |
| Investments — unaffiliated issuers | 219,213,928 |
| Investments — affiliated issuers | (154,455,689) |
| Foreign currency translations | (579) |
| Option contracts written | (2,625,118) |
| Net change in unrealized appreciation (depreciation) | 62,132,542 |
| Net realized and unrealized gain | 286,947,536 |
| Net increase in net assets resulting from operations | $267,186,025 |
| Columbia Seligman Technology and Information Fund | Annual Report 2023 | 15 |
| Year Ended May 31, 2023 | Year Ended May 31, 2022 | |
| Operations | ||
| Net investment loss | $(19,761,511) | $(37,890,200) |
| Net realized gain | 224,814,994 | 1,086,869,313 |
| Net change in unrealized appreciation (depreciation) | 62,132,542 | (1,347,230,669) |
| Net increase (decrease) in net assets resulting from operations | 267,186,025 | (298,251,556) |
| Distributions to shareholders | ||
| Net investment income and net realized gains | ||
| Class A | (453,179,179) | (866,441,965) |
| Advisor Class | (25,065,096) | (43,557,391) |
| Class C | (46,498,959) | (83,396,546) |
| Institutional Class | (124,458,388) | (230,885,422) |
| Institutional 2 Class | (23,370,655) | (37,204,174) |
| Institutional 3 Class | (9,307,487) | (14,971,365) |
| Class R | (5,573,671) | (11,285,269) |
| Total distributions to shareholders | (687,453,435) | (1,287,742,132) |
| Increase in net assets from capital stock activity | 459,731,892 | 763,941,568 |
| Total increase (decrease) in net assets | 39,464,482 | (822,052,120) |
| Net assets at beginning of year | 9,547,663,887 | 10,369,716,007 |
| Net assets at end of year | $9,587,128,369 | $9,547,663,887 |
| 16 | Columbia Seligman Technology and Information Fund | Annual Report 2023 |
| Year Ended | Year Ended | |||
| May 31, 2023 | May 31, 2022 | |||
| Shares | Dollars ($) | Shares | Dollars ($) | |
| Capital stock activity | ||||
| Class A | ||||
| Subscriptions | 2,436,833 | 223,788,050 | 2,724,048 | 333,312,923 |
| Distributions reinvested | 4,798,848 | 413,372,766 | 6,190,765 | 789,879,698 |
| Redemptions | (6,844,105) | (625,242,591) | (6,441,394) | (777,124,975) |
| Net increase | 391,576 | 11,918,225 | 2,473,419 | 346,067,646 |
| Advisor Class | ||||
| Subscriptions | 1,117,877 | 98,976,421 | 1,049,902 | 122,233,718 |
| Distributions reinvested | 261,031 | 21,456,743 | 302,755 | 36,917,944 |
| Redemptions | (970,841) | (84,711,434) | (774,015) | (88,067,650) |
| Net increase | 408,067 | 35,721,730 | 578,642 | 71,084,012 |
| Class C | ||||
| Subscriptions | 927,383 | 41,731,245 | 699,676 | 46,253,388 |
| Distributions reinvested | 1,096,979 | 44,921,299 | 1,201,664 | 80,090,877 |
| Redemptions | (1,975,128) | (88,415,455) | (1,346,988) | (86,867,002) |
| Net increase (decrease) | 49,234 | (1,762,911) | 554,352 | 39,477,263 |
| Institutional Class | ||||
| Subscriptions | 5,016,960 | 532,801,222 | 2,802,246 | 388,214,158 |
| Distributions reinvested | 1,072,702 | 106,937,677 | 1,358,568 | 197,875,363 |
| Redemptions | (3,560,660) | (373,908,846) | (2,938,574) | (400,842,921) |
| Net increase | 2,529,002 | 265,830,053 | 1,222,240 | 185,246,600 |
| Institutional 2 Class | ||||
| Subscriptions | 1,676,583 | 179,430,642 | 940,648 | 130,422,369 |
| Distributions reinvested | 231,633 | 23,269,887 | 252,690 | 37,054,467 |
| Redemptions | (915,061) | (95,793,053) | (609,010) | (82,835,539) |
| Net increase | 993,155 | 106,907,476 | 584,328 | 84,641,297 |
| Institutional 3 Class | ||||
| Subscriptions | 609,711 | 64,108,609 | 479,084 | 67,810,180 |
| Distributions reinvested | 84,793 | 8,417,390 | 92,198 | 13,365,074 |
| Redemptions | (282,124) | (30,322,778) | (278,716) | (37,504,702) |
| Net increase | 412,380 | 42,203,221 | 292,566 | 43,670,552 |
| Class R | ||||
| Subscriptions | 116,210 | 9,864,917 | 141,187 | 16,209,102 |
| Distributions reinvested | 70,497 | 5,550,945 | 94,447 | 11,127,750 |
| Redemptions | (194,536) | (16,501,764) | (293,092) | (33,582,654) |
| Net decrease | (7,829) | (1,085,902) | (57,458) | (6,245,802) |
| Total net increase | 4,775,585 | 459,731,892 | 5,648,089 | 763,941,568 |
| Columbia Seligman Technology and Information Fund | Annual Report 2023 | 17 |
| Net asset value, beginning of period | Net investment income (loss) | Net realized and unrealized gain (loss) | Total from investment operations | Distributions from net investment income | Distributions from net realized gains | Total distributions to shareholders | |
| Class A | |||||||
| Year Ended 5/31/2023 | $105.00 | (0.26) | 2.52 | 2.26 | — | (7.70) | (7.70) |
| Year Ended 5/31/2022 | $121.58 | (0.48) | (0.88) | (1.36) | — | (15.22) | (15.22) |
| Year Ended 5/31/2021 | $79.11 | (0.19) | 53.51 | 53.32 | (0.44) | (10.41) | (10.85) |
| Year Ended 5/31/2020 | $67.52 | 0.41(e) | 20.34 | 20.75 | — | (9.16) | (9.16) |
| Year Ended 5/31/2019 | $76.76 | (0.03) | (2.02) | (2.05) | — | (7.19) | (7.19) |
| Advisor Class | |||||||
| Year Ended 5/31/2023 | $100.47 | (0.03) | 2.39 | 2.36 | — | (7.70) | (7.70) |
| Year Ended 5/31/2022 | $116.88 | (0.17) | (0.72) | (0.89) | — | (15.52) | (15.52) |
| Year Ended 5/31/2021 | $76.31 | 0.06 | 51.57 | 51.63 | (0.52) | (10.54) | (11.06) |
| Year Ended 5/31/2020 | $65.38 | 0.58(e) | 19.69 | 20.27 | — | (9.34) | (9.34) |
| Year Ended 5/31/2019 | $74.50 | 0.14 | (2.00) | (1.86) | — | (7.26) | (7.26) |
| Class C | |||||||
| Year Ended 5/31/2023 | $54.65 | (0.47) | 0.68 | 0.21 | — | (7.70) | (7.70) |
| Year Ended 5/31/2022 | $69.20 | (0.76) | 0.51(g) | (0.25) | — | (14.30) | (14.30) |
| Year Ended 5/31/2021 | $48.21 | (0.57) | 31.78 | 31.21 | (0.20) | (10.02) | (10.22) |
| Year Ended 5/31/2020 | $43.98 | (0.10)(e) | 13.09 | 12.99 | — | (8.76) | (8.76) |
| Year Ended 5/31/2019 | $52.96 | (0.37) | (1.65) | (2.02) | — | (6.96) | (6.96) |
| Institutional Class | |||||||
| Year Ended 5/31/2023 | $120.01 | (0.03) | 3.09 | 3.06 | — | (7.70) | (7.70) |
| Year Ended 5/31/2022 | $137.04 | (0.20) | (1.31) | (1.51) | — | (15.52) | (15.52) |
| Year Ended 5/31/2021 | $88.14 | 0.07 | 59.89 | 59.96 | (0.52) | (10.54) | (11.06) |
| Year Ended 5/31/2020 | $74.36 | 0.67(e) | 22.45 | 23.12 | — | (9.34) | (9.34) |
| Year Ended 5/31/2019 | $83.59 | 0.16 | (2.13) | (1.97) | — | (7.26) | (7.26) |
| Institutional 2 Class | |||||||
| Year Ended 5/31/2023 | $120.85 | 0.01 | 3.11 | 3.12 | — | (7.70) | (7.70) |
| Year Ended 5/31/2022 | $137.89 | (0.16) | (1.31) | (1.47) | — | (15.57) | (15.57) |
| Year Ended 5/31/2021 | $88.63 | 0.11 | 60.24 | 60.35 | (0.53) | (10.56) | (11.09) |
| Year Ended 5/31/2020 | $74.73 | 0.71(e) | 22.57 | 23.28 | — | (9.38) | (9.38) |
| Year Ended 5/31/2019 | $83.94 | 0.20 | (2.13) | (1.93) | — | (7.28) | (7.28) |
| 18 | Columbia Seligman Technology and Information Fund | Annual Report 2023 |
| Net asset value, end of period | Total return | Total gross expense ratio to average net assets(a) | Total net expense ratio to average net assets(a),(b) | Net investment income (loss) ratio to average net assets | Portfolio turnover | Net assets, end of period (000’s) | |
| Class A | |||||||
| Year Ended 5/31/2023 | $99.56 | 3.29% | 1.20% | 1.20%(c) | (0.28%) | 13% | $6,081,865 |
| Year Ended 5/31/2022 | $105.00 | (3.34%) | 1.17%(d) | 1.17%(c),(d) | (0.39%) | 16% | $6,373,137 |
| Year Ended 5/31/2021 | $121.58 | 70.10% | 1.20%(d) | 1.20%(c),(d) | (0.19%) | 32% | $7,078,794 |
| Year Ended 5/31/2020 | $79.11 | 31.36% | 1.23%(d),(f) | 1.23%(c),(d),(f) | 0.54% | 37% | $4,506,828 |
| Year Ended 5/31/2019 | $67.52 | (1.50%) | 1.25%(d) | 1.24%(c),(d) | (0.05%) | 37% | $3,759,214 |
| Advisor Class | |||||||
| Year Ended 5/31/2023 | $95.13 | 3.55% | 0.95% | 0.95%(c) | (0.03%) | 13% | $352,599 |
| Year Ended 5/31/2022 | $100.47 | (3.10%) | 0.93%(d) | 0.93%(c),(d) | (0.14%) | 16% | $331,400 |
| Year Ended 5/31/2021 | $116.88 | 70.53% | 0.95%(d) | 0.95%(c),(d) | 0.06% | 32% | $317,883 |
| Year Ended 5/31/2020 | $76.31 | 31.69% | 0.98%(d),(f) | 0.98%(c),(d),(f) | 0.79% | 37% | $190,471 |
| Year Ended 5/31/2019 | $65.38 | (1.26%) | 0.99%(d) | 0.99%(c),(d) | 0.21% | 37% | $143,228 |
| Class C | |||||||
| Year Ended 5/31/2023 | $47.16 | 2.52% | 1.95% | 1.95%(c) | (1.03%) | 13% | $312,210 |
| Year Ended 5/31/2022 | $54.65 | (4.08%) | 1.92%(d) | 1.92%(c),(d) | (1.14%) | 16% | $359,106 |
| Year Ended 5/31/2021 | $69.20 | 68.85% | 1.94%(d) | 1.94%(c),(d) | (0.96%) | 32% | $416,301 |
| Year Ended 5/31/2020 | $48.21 | 30.39% | 1.98%(d),(f) | 1.98%(c),(d),(f) | (0.22%) | 37% | $339,268 |
| Year Ended 5/31/2019 | $43.98 | (2.23%) | 1.99%(d) | 1.99%(c),(d) | (0.75%) | 37% | $344,977 |
| Institutional Class | |||||||
| Year Ended 5/31/2023 | $115.37 | 3.57% | 0.95% | 0.95%(c) | (0.03%) | 13% | $2,139,513 |
| Year Ended 5/31/2022 | $120.01 | (3.09%) | 0.92%(d) | 0.92%(c),(d) | (0.14%) | 16% | $1,922,182 |
| Year Ended 5/31/2021 | $137.04 | 70.53% | 0.95%(d) | 0.95%(c),(d) | 0.06% | 32% | $2,027,453 |
| Year Ended 5/31/2020 | $88.14 | 31.70% | 0.98%(d),(f) | 0.98%(c),(d),(f) | 0.80% | 37% | $1,292,741 |
| Year Ended 5/31/2019 | $74.36 | (1.25%) | 0.99%(d) | 0.99%(c),(d) | 0.21% | 37% | $1,030,165 |
| Institutional 2 Class | |||||||
| Year Ended 5/31/2023 | $116.27 | 3.58% | 0.91% | 0.91% | 0.01% | 13% | $453,797 |
| Year Ended 5/31/2022 | $120.85 | (3.05%) | 0.89%(d) | 0.89%(d) | (0.11%) | 16% | $351,625 |
| Year Ended 5/31/2021 | $137.89 | 70.60% | 0.91%(d) | 0.91%(d) | 0.09% | 32% | $320,652 |
| Year Ended 5/31/2020 | $88.63 | 31.76% | 0.94%(d),(f) | 0.94%(d),(f) | 0.83% | 37% | $223,964 |
| Year Ended 5/31/2019 | $74.73 | (1.20%) | 0.95%(d) | 0.95%(d) | 0.25% | 37% | $178,417 |
| Columbia Seligman Technology and Information Fund | Annual Report 2023 | 19 |
| Net asset value, beginning of period | Net investment income (loss) | Net realized and unrealized gain (loss) | Total from investment operations | Distributions from net investment income | Distributions from net realized gains | Total distributions to shareholders | |
| Institutional 3 Class | |||||||
| Year Ended 5/31/2023 | $119.49 | 0.06 | 3.08 | 3.14 | — | (7.70) | (7.70) |
| Year Ended 5/31/2022 | $136.48 | (0.09) | (1.27) | (1.36) | — | (15.63) | (15.63) |
| Year Ended 5/31/2021 | $87.79 | 0.19 | 59.63 | 59.82 | (0.54) | (10.59) | (11.13) |
| Year Ended 5/31/2020 | $74.09 | 0.78(e) | 22.33 | 23.11 | — | (9.41) | (9.41) |
| Year Ended 5/31/2019 | $83.26 | 0.24 | (2.12) | (1.88) | — | (7.29) | (7.29) |
| Class R | |||||||
| Year Ended 5/31/2023 | $96.85 | (0.45) | 2.20 | 1.75 | — | (7.70) | (7.70) |
| Year Ended 5/31/2022 | $113.17 | (0.73) | (0.67) | (1.40) | — | (14.92) | (14.92) |
| Year Ended 5/31/2021 | $74.19 | (0.42) | 50.04 | 49.62 | (0.36) | (10.28) | (10.64) |
| Year Ended 5/31/2020 | $63.78 | 0.19(e) | 19.20 | 19.39 | — | (8.98) | (8.98) |
| Year Ended 5/31/2019 | $73.05 | (0.20) | (1.96) | (2.16) | — | (7.11) | (7.11) |
| Notes to Financial Highlights | |
| (a) | In addition to the fees and expenses that the Fund bears directly, the Fund indirectly bears a pro rata share of the fees and expenses of any other funds in which it invests. Such indirect expenses are not included in the Fund’s reported expense ratios. |
| (b) | Total net expenses include the impact of certain fee waivers/expense reimbursements made by the Investment Manager and certain of its affiliates, if applicable. |
| (c) | The benefits derived from expense reductions had an impact of less than 0.01%. |
| (d) | Ratios include interfund lending expense which is less than 0.01%. |
| (e) | Net investment income per share includes special dividends. The per share effect of these dividends amounted to: |
| Year Ended | Class A | Advisor Class | Class C | Institutional Class | Institutional 2 Class | Institutional 3 Class | Class R |
| 05/31/2020 | $0.52 | $0.50 | $0.32 | $0.58 | $0.58 | $0.58 | $0.49 |
| (f) | Ratios include line of credit interest expense which is less than 0.01%. |
| (g) | Calculation of the net gain (loss) per share (both realized and unrealized) does not correlate to the aggregate realized and unrealized gain (loss) presented in the Statement of Operations due to the timing of subscriptions and redemptions of Fund shares in relation to fluctuations in the market value of the portfolio. |
| 20 | Columbia Seligman Technology and Information Fund | Annual Report 2023 |
| Net asset value, end of period | Total return | Total gross expense ratio to average net assets(a) | Total net expense ratio to average net assets(a),(b) | Net investment income (loss) ratio to average net assets | Portfolio turnover | Net assets, end of period (000’s) | |
| Institutional 3 Class | |||||||
| Year Ended 5/31/2023 | $114.93 | 3.64% | 0.86% | 0.86% | 0.06% | 13% | $178,005 |
| Year Ended 5/31/2022 | $119.49 | (3.01%) | 0.84%(d) | 0.84%(d) | (0.07%) | 16% | $135,794 |
| Year Ended 5/31/2021 | $136.48 | 70.67% | 0.86%(d) | 0.86%(d) | 0.17% | 32% | $115,173 |
| Year Ended 5/31/2020 | $87.79 | 31.81% | 0.89%(d),(f) | 0.89%(d),(f) | 0.93% | 37% | $49,333 |
| Year Ended 5/31/2019 | $74.09 | (1.14%) | 0.90%(d) | 0.90%(d) | 0.31% | 37% | $32,058 |
| Class R | |||||||
| Year Ended 5/31/2023 | $90.90 | 3.04% | 1.45% | 1.45%(c) | (0.53%) | 13% | $69,138 |
| Year Ended 5/31/2022 | $96.85 | (3.59%) | 1.42%(d) | 1.42%(c),(d) | (0.64%) | 16% | $74,421 |
| Year Ended 5/31/2021 | $113.17 | 69.70% | 1.44%(d) | 1.44%(c),(d) | (0.44%) | 32% | $93,459 |
| Year Ended 5/31/2020 | $74.19 | 31.03% | 1.48%(d),(f) | 1.48%(c),(d),(f) | 0.27% | 37% | $64,178 |
| Year Ended 5/31/2019 | $63.78 | (1.75%) | 1.49%(d) | 1.49%(c),(d) | (0.29%) | 37% | $64,874 |
| Columbia Seligman Technology and Information Fund | Annual Report 2023 | 21 |
May 31, 2023
| 22 | Columbia Seligman Technology and Information Fund | Annual Report 2023 |
May 31, 2023
| Columbia Seligman Technology and Information Fund | Annual Report 2023 | 23 |
May 31, 2023
| 24 | Columbia Seligman Technology and Information Fund | Annual Report 2023 |
May 31, 2023
| Liability derivatives | ||
| Risk exposure category | Statement of assets and liabilities location | Fair value ($) |
| Equity risk | Option contracts written, at value | 7,174,920 |
| Amount of realized gain (loss) on derivatives recognized in income | |
| Risk exposure category | Option contracts written ($) |
| Equity risk | 1,853,869 |
| Change in unrealized appreciation (depreciation) on derivatives recognized in income | |
| Risk exposure category | Option contracts written ($) |
| Equity risk | (2,625,118) |
| Columbia Seligman Technology and Information Fund | Annual Report 2023 | 25 |
May 31, 2023
| Derivative instrument | Average value ($)* |
| Option contracts written | (3,504,257) |
| * | Based on the ending quarterly outstanding amounts for the year ended May 31, 2023. |
| Morgan Stanley ($) | |
| Liabilities | |
| Call option contracts written | 7,174,920 |
| Total financial and derivative net assets | (7,174,920) |
| Total collateral received (pledged) (a) | (7,174,920) |
| Net amount (b) | - |
| (a) | In some instances, the actual collateral received and/or pledged may be more than the amount shown due to overcollateralization. |
| (b) | Represents the net amount due from/(to) counterparties in the event of default. |
| 26 | Columbia Seligman Technology and Information Fund | Annual Report 2023 |
May 31, 2023
| Columbia Seligman Technology and Information Fund | Annual Report 2023 | 27 |
May 31, 2023
| 28 | Columbia Seligman Technology and Information Fund | Annual Report 2023 |
May 31, 2023
| Effective rate (%) | |
| Class A | 0.09 |
| Advisor Class | 0.09 |
| Class C | 0.09 |
| Institutional Class | 0.09 |
| Institutional 2 Class | 0.06 |
| Institutional 3 Class | 0.01 |
| Class R | 0.09 |
| Front End (%) | CDSC (%) | Amount ($) | |
| Class A | 5.75 | 0.50 - 1.00(a) | 1,711,431 |
| Class C | — | 1.00(b) | 15,124 |
| (a) | This charge is imposed on certain investments of between $1 million and $50 million redeemed within 18 months after purchase, as follows: 1.00% if redeemed within 12 months after purchase, and 0.50% if redeemed more than 12, but less than 18, months after purchase, with certain limited exceptions. |
| (b) | This charge applies to redemptions within 12 months after purchase, with certain limited exceptions. |
| Columbia Seligman Technology and Information Fund | Annual Report 2023 | 29 |
May 31, 2023
| October 1, 2022 through September 30, 2023 | Prior to October 1, 2022 | |
| Class A | 1.33% | 1.34% |
| Advisor Class | 1.08 | 1.09 |
| Class C | 2.08 | 2.09 |
| Institutional Class | 1.08 | 1.09 |
| Institutional 2 Class | 1.05 | 1.06 |
| Institutional 3 Class | 1.00 | 1.01 |
| Class R | 1.58 | 1.59 |
| Excess of distributions over net investment income ($) | Accumulated net realized gain ($) | Paid in capital ($) |
| 16,590,210 | 162,916 | (16,753,126) |
| 30 | Columbia Seligman Technology and Information Fund | Annual Report 2023 |
May 31, 2023
| Year Ended May 31, 2023 | Year Ended May 31, 2022 | ||||
| Ordinary income ($) | Long-term capital gains ($) | Total ($) | Ordinary income ($) | Long-term capital gains ($) | Total ($) |
| — | 687,453,435 | 687,453,435 | 223,351,754 | 1,064,390,378 | 1,287,742,132 |
| Undistributed ordinary income ($) | Undistributed long-term capital gains ($) | Capital loss carryforwards ($) | Net unrealized appreciation ($) |
| — | 222,975,438 | — | 4,396,127,402 |
| Federal tax cost ($) | Gross unrealized appreciation ($) | Gross unrealized (depreciation) ($) | Net unrealized appreciation ($) |
| 5,143,105,012 | 4,846,852,888 | (450,725,486) | 4,396,127,402 |
| Late year ordinary losses ($) | Post-October capital losses ($) |
| 9,067,402 | — |
| Columbia Seligman Technology and Information Fund | Annual Report 2023 | 31 |
May 31, 2023
| Borrower or lender | Average loan balance ($) | Weighted average interest rate (%) | Number of days with outstanding loans |
| Lender | 2,350,000 | 3.47 | 4 |
| 32 | Columbia Seligman Technology and Information Fund | Annual Report 2023 |
May 31, 2023
| Columbia Seligman Technology and Information Fund | Annual Report 2023 | 33 |
May 31, 2023
| 34 | Columbia Seligman Technology and Information Fund | Annual Report 2023 |
| Columbia Seligman Technology and Information Fund | Annual Report 2023 | 35 |
| Capital gain dividend | |
| $234,479,618 |
| Name, address, year of birth | Position held with the Columbia Funds and length of service | Principal occupation(s) during past five years and other relevant professional experience | Number of Funds in the Columbia Funds Complex* overseen | Other directorships held by Trustee during the past five years and other relevant Board experience |
| George S. Batejan c/o Columbia Management Investment Advisers, LLC 290 Congress Street Boston, MA 02210 1954 | Trustee since 2017 | Executive Vice President, Global Head of Technology and Operations, Janus Capital Group, Inc., 2010-2016 | 174 | Former Chairman of the Board, NICSA (National Investment Company Services Association) (Executive Committee, Nominating Committee and Governance Committee), 2014-2016; former Director, Intech Investment Management, 2011-2016; former Board Member, Metro Denver Chamber of Commerce, 2015-2016; former Advisory Board Member, University of Colorado Business School, 2015-2018; former Board Member, Chase Bank International, 1993-1994 |
| 36 | Columbia Seligman Technology and Information Fund | Annual Report 2023 |
(Unaudited)
Independent trustees (continued)
| Name, address, year of birth | Position held with the Columbia Funds and length of service | Principal occupation(s) during past five years and other relevant professional experience | Number of Funds in the Columbia Funds Complex* overseen | Other directorships held by Trustee during the past five years and other relevant Board experience |
| Kathleen Blatz c/o Columbia Management Investment Advisers, LLC 290 Congress Street Boston, MA 02210 1954 | Trustee since 2006 | Attorney, specializing in arbitration and mediation; Chief Justice, Minnesota Supreme Court, 1998-2006; Associate Justice, Minnesota Supreme Court, 1996-1998; Fourth Judicial District Court Judge, Hennepin County, 1994-1996; Attorney in private practice and public service, 1984-1993; State Representative, Minnesota House of Representatives, 1979-1993, which included service on the Tax and Financial Institutions and Insurance Committees; Member and Interim Chair, Minnesota Sports Facilities Authority, January-July 2017; Interim President and Chief Executive Officer, Blue Cross and Blue Shield of Minnesota (health care insurance), February-July 2018, April-October 2021 | 174 | Former Trustee, Blue Cross and Blue Shield of Minnesota, 2009-2021 (Chair of the Business Development Committee, 2014-2017; Chair of the Governance Committee, 2017-2019); former Member and Chair of the Board, Minnesota Sports Facilities Authority, January 2017-July 2017; former Director, Robina Foundation, 2009-2020 (Chair, 2014-2020); Director, Richard M. Schulze Family Foundation, since 2021 |
| Pamela G. Carlton c/o Columbia Management Investment Advisers, LLC 290 Congress Street Boston, MA 02210 1954 | Chair since 2023; Trustee since 2007 | President, Springboard — Partners in Cross Cultural Leadership (consulting company), since 2003; Managing Director of US Equity Research, JP Morgan Chase, 1999-2003; Director of US Equity Research, Chase Asset Management, 1996-1999; Co-Director Latin America Research, 1993-1996, COO Global Research, 1992-1996, Co-Director of US Research, 1991-1992, Investment Banker, 1982-1991, Morgan Stanley; Attorney, Cleary Gottlieb Steen & Hamilton LLP, 1980-1982 | 174 | Trustee, New York Presbyterian Hospital Board, since 1996; Director, DR Bank (Audit Committee) since 2017; Director, Evercore Inc. (Audit Committee, Nominating and Governance Committee), since 2019; Director, Apollo Commercial Real Estate Finance, Inc. (Chair, Nominating and Governance Committee) (financial services), since 2021; the Governing Council of the Independent Directors Council (IDC), since 2021 |
| Janet Langford Carrig c/o Columbia Management Investment Advisers, LLC 290 Congress Street Boston, MA 02210 1957 | Trustee since 1996 | Senior Vice President, General Counsel and Corporate Secretary, ConocoPhillips (independent energy company), September 2007-October 2018 | 174 | Director, EQT Corporation (natural gas producer), since 2019; former Director, Whiting Petroleum Corporation (independent oil and gas company), 2020-2022 |
| J. Kevin Connaughton c/o Columbia Management Investment Advisers, LLC 290 Congress Street Boston, MA 02210 1964 | Trustee since 2020 | CEO and President, RhodeWay Financial (non-profit financial planning firm), since December 2022; Member, FINRA National Adjudicatory Council, since January 2020; Adjunct Professor of Finance, Bentley University since January 2018; Consultant to Independent Trustees of CFVIT and CFST I from March 2016 to June 2020 with respect to CFVIT and to December 2020 with respect to CFST I; Managing Director and General Manager of Mutual Fund Products, Columbia Management Investment Advisers, LLC, May 2010-February 2015; President, Columbia Funds, 2008-2015; and senior officer of Columbia Funds and affiliated funds, 2003-2015 | 172 | Former Director, The Autism Project, March 2015-December 2021; former Member of the Investment Committee, St. Michael’s College, November 2015-February 2020; former Trustee, St. Michael’s College, June 2017-September 2019; former Trustee, New Century Portfolios (former mutual fund complex), January 2015-December 2017 |
| Columbia Seligman Technology and Information Fund | Annual Report 2023 | 37 |
(Unaudited)
Independent trustees (continued)
| Name, address, year of birth | Position held with the Columbia Funds and length of service | Principal occupation(s) during past five years and other relevant professional experience | Number of Funds in the Columbia Funds Complex* overseen | Other directorships held by Trustee during the past five years and other relevant Board experience |
| Olive M. Darragh c/o Columbia Management Investment Advisers, LLC 290 Congress Street Boston, MA 02210 1962 | Trustee since 2020 | Managing Director of Darragh Inc. (strategy and talent management consulting firm), since 2010; Founder and CEO, Zolio, Inc. (investment management talent identification platform), since 2004; Consultant to Independent Trustees of CFVIT and CFST I from June 2019 to June 2020 with respect to CFVIT and to December 2020 with respect to CFST I; Partner, Tudor Investments, 2004-2010; Senior Partner, McKinsey & Company (consulting), 1990-2004; Touche Ross CPA, 1985-1988 | 172 | Treasurer, Edinburgh University US Trust Board, since January 2023; Member, HBS Community Action Partners Board, since September 2022; former Director, University of Edinburgh Business School (Member of US Board), 2004-2019; former Director, Boston Public Library Foundation, 2008-2017 |
| Patricia M. Flynn c/o Columbia Management Investment Advisers, LLC 290 Congress Street Boston, MA 02210 1950 | Trustee since 2004 | Professor of Economics and Management, Bentley University, since 2002; Dean, McCallum Graduate School of Business, Bentley University, 1992-2002 | 174 | Former Trustee, MA Taxpayers Foundation, 1997-2022; former Director, The MA Business Roundtable, 2003-2019; former Chairperson, Innovation Index Advisory Committee, MA Technology Collaborative, 1997-2020 |
| Brian J. Gallagher c/o Columbia Management Investment Advisers, LLC 290 Congress Street Boston, MA 02210 1954 | Trustee since 2017 | Retired; Partner with Deloitte & Touche LLP and its predecessors, 1977-2016 | 174 | Trustee, Catholic Schools Foundation, since 2004 |
| Douglas A. Hacker c/o Columbia Management Investment Advisers, LLC 290 Congress Street Boston, MA 02210 1955 | Trustee since 1996 | Independent business executive, since May 2006; Executive Vice President – Strategy of United Airlines, December 2002 - May 2006; President of UAL Loyalty Services (airline marketing company), September 2001-December 2002; Executive Vice President and Chief Financial Officer of United Airlines, July 1999-September 2001 | 174 | Director, SpartanNash Company since November 2013 (Chair of the Board, since May 2021) (food distributor); Director, Aircastle Limited (Chair of Audit Committee) (aircraft leasing), since August 2006; former Director, Nash Finch Company (food distributor), 2005-2013; former Director, SeaCube Container Leasing Ltd. (container leasing), 2010-2013; and former Director, Travelport Worldwide Limited (travel information technology), 2014-2019 |
| Nancy T. Lukitsh c/o Columbia Management Investment Advisers, LLC 290 Congress Street Boston, MA 02210 1956 | Trustee since 2011 | Senior Vice President, Partner and Director of Marketing, Wellington Management Company, LLP (investment adviser), 1997-2010; Chair, Wellington Management Portfolios (commingled non-U.S. investment pools), 2007-2010; Director, Wellington Trust Company, NA and other Wellington affiliates, 1997-2010 | 172 | None |
| 38 | Columbia Seligman Technology and Information Fund | Annual Report 2023 |
(Unaudited)
Independent trustees (continued)
| Name, address, year of birth | Position held with the Columbia Funds and length of service | Principal occupation(s) during past five years and other relevant professional experience | Number of Funds in the Columbia Funds Complex* overseen | Other directorships held by Trustee during the past five years and other relevant Board experience |
| David M. Moffett c/o Columbia Management Investment Advisers, LLC 290 Congress Street Boston, MA 02210 1952 | Trustee since 2011 | Retired; former Chief Executive Officer of Freddie Mac and Chief Financial Officer of U.S. Bank | 172 | Director, CSX Corporation (transportation suppliers); Director, PayPal Holdings Inc. (payment and data processing services); Trustee, University of Oklahoma Foundation; former Director, eBay Inc. (online trading community), 2007-2015; and former Director, CIT Bank, CIT Group Inc. (commercial and consumer finance), 2010-2016; former Senior Adviser to The Carlyle Group (financial services), March 2008-September 2008; former Governance Consultant to Bridgewater Associates, January 2013-December 2015 |
| Catherine James Paglia c/o Columbia Management Investment Advisers, LLC 290 Congress Street Boston, MA 02210 1952 | Trustee since 2004 | Director, Enterprise Asset Management, Inc. (private real estate and asset management company), since September 1998; Managing Director and Partner, Interlaken Capital, Inc., 1989-1997; Vice President, 1982-1985, Principal, 1985-1987, Managing Director, 1987-1989, Morgan Stanley; Vice President, Investment Banking, 1980-1982, Associate, Investment Banking, 1976-1980, Dean Witter Reynolds, Inc. | 174 | Director, Valmont Industries, Inc. (irrigation systems manufacturer), since 2012; Trustee, Carleton College (on the Investment Committee), since 1987; Trustee, Carnegie Endowment for International Peace (on the Investment Committee), since 2009 |
| Natalie A. Trunow c/o Columbia Management Investment Advisers, LLC 290 Congress Street Boston, MA 02210 1967 | Trustee since 2020 | Chief Executive Officer, Millennial Portfolio Solutions LLC (asset management and consulting services), January 2016-January 2021; Non-executive Member of the Investment Committee and Valuation Committee, Sarona Asset Management Inc. (private equity firm) since September 2019; Advisor, Horizon Investments (asset management and consulting services), August 2018-January 2022; Advisor, Paradigm Asset Management, November 2016-January 2022; Consultant to Independent Trustees of CFVIT and CFST I from September 2016 to June 2020 with respect to CFVIT and to December 2020 with respect to CFST I; Director of Investments/Consultant, Casey Family Programs, April 2016-November 2016; Senior Vice President and Chief Investment Officer, Calvert Investments, August 2008-January 2016; Section Head and Portfolio Manager, General Motors Asset Management, June 1997-August 2008 | 172 | Independent Director, Investment Committee, Health Services for Children with Special Needs, Inc., 2010-2021; Independent Director, (Executive Committee and Chair, Audit Committee), Consumer Credit Counseling Services (formerly Guidewell Financial Solutions), since 2016; Independent Director, (Investment Committee), Sarona Asset Management, since 2019 |
| Columbia Seligman Technology and Information Fund | Annual Report 2023 | 39 |
(Unaudited)
Independent trustees (continued)
| Name, address, year of birth | Position held with the Columbia Funds and length of service | Principal occupation(s) during past five years and other relevant professional experience | Number of Funds in the Columbia Funds Complex* overseen | Other directorships held by Trustee during the past five years and other relevant Board experience |
| Sandra L. Yeager c/o Columbia Management Investment Advisers, LLC 290 Congress Street Boston, MA 02210 1964 | Trustee since 2017 | Retired; President and founder, Hanoverian Capital, LLC (SEC registered investment advisor firm), 2008-2016; Managing Director, DuPont Capital, 2006-2008; Managing Director, Morgan Stanley Investment Management, 2004-2006; Senior Vice President, Alliance Bernstein, 1990-2004 | 174 | Former Director, NAPE (National Alliance for Partnerships in Equity) Education Foundation, October 2016-October 2020; Advisory Board, Jennersville YMCA, since 2022 |
| Name, address, year of birth | Position held with the Columbia Funds and length of service | Principal occupation(s) during the past five years and other relevant professional experience | Number of Funds in the Columbia Funds Complex overseen | Other directorships held by Trustee during the past five years and other relevant Board experience |
| Daniel J. Beckman c/o Columbia Management Investment Advisers, LLC 290 Congress Street Boston, MA 02210 1962 | Trustee since November 2021 and President since June 2021 | Vice President – Head of North America Product, Columbia Management Investment Advisers, LLC, since April 2015; President and Principal Executive Officer of the Columbia Funds, since June 2021; officer of Columbia Funds and affiliated funds, 2020-2021 | 174 | Director, Ameriprise Trust Company, since October 2016; Director, Columbia Management Investment Distributors, Inc. since November 2018; Board of Governors, Columbia Wanger Asset Management, LLC since, January 2022; Director, Columbia Threadneedle Canada, Inc., since December 2022 |
| * | The term “Columbia Funds Complex” as used herein includes Columbia Seligman Premium Technology Growth Fund, Tri-Continental Corporation and each series of Columbia Funds Series Trust (CFST), Columbia Funds Series Trust I (CFST I), Columbia Funds Series Trust II (CFST II), Columbia ETF Trust I (CET I), Columbia ETF Trust II (CET II), Columbia Funds Variable Insurance Trust (CFVIT) and Columbia Funds Variable Series Trust II (CFVST II). Messrs. Batejan, Beckman, Gallagher and Hacker and Mses. Blatz, Carlton, Carrig, Flynn, Paglia, and Yeager serve as directors of Columbia Seligman Premium Technology Growth Fund and Tri-Continental Corporation. |
| ** | Interested person (as defined under the 1940 Act) by reason of being an officer, director, security holder and/or employee of the Investment Manager or Ameriprise Financial. |
| 40 | Columbia Seligman Technology and Information Fund | Annual Report 2023 |
(Unaudited)
The Board has appointed officers who are responsible for day-to-day business decisions based on policies it has established. The officers serve at the pleasure of the Board. The following table provides basic information about the Officers of the Fund as of the printing of this report, including principal occupations during the past five years, although their specific titles may have varied over the period. In addition to Mr. Beckman, who is President and Principal Executive Officer, the Fund’s other officers are:
| Name, address and year of birth | Position and year first appointed to position for any Fund in the Columbia Funds Complex or a predecessor thereof | Principal occupation(s) during past five years |
| Michael G. Clarke 290 Congress Street Boston, MA 02210 1969 | Chief Financial Officer and Principal Financial Officer (2009) and Senior Vice President (2019) | Senior Vice President and North America Head of Operations & Investor Services, Columbia Management Investment Advisers, LLC, since June 2023 (previously Senior Vice President and Head of Global Operations, March 2022 – June 2023, Vice President, Head of North America Operations, and Co-Head of Global Operations, June 2019 - February 2022 and Vice President – Accounting and Tax, May 2010 - May 2019); senior officer of Columbia Funds and affiliated funds, since 2002. Director, Ameriprise Trust Company, since June 2023. |
| Joseph Beranek 5890 Ameriprise Financial Center Minneapolis, MN 55474 1965 | Treasurer and Chief Accounting Officer (Principal Accounting Officer) (2019) and Principal Financial Officer (2020), CFST, CFST I, CFST II, CFVIT and CFVST II; Assistant Treasurer, CET I and CET II | Vice President – Mutual Fund Accounting and Financial Reporting, Columbia Management Investment Advisers, LLC, since December 2018 and March 2017, respectively. |
| Marybeth Pilat 290 Congress Street Boston, MA 02210 1968 | Treasurer and Chief Accounting Officer (Principal Accounting Officer) and Principal Financial Officer (2020) for CET I and CET II; Assistant Treasurer, CFST, CFST I, CFST II, CFVIT and CFVST II | Vice President – Product Pricing and Administration, Columbia Management Investment Advisers, LLC, since May 2017. |
| William F. Truscott 290 Congress Street Boston, MA 02210 1960 | Senior Vice President (2001) | Formerly, Trustee/Director of Columbia Funds Complex or legacy funds, November 2001 - January 1, 2021; Chief Executive Officer, Global Asset Management, Ameriprise Financial, Inc., since September 2012; Chairman of the Board and President, Columbia Management Investment Advisers, LLC, since July 2004 and February 2012, respectively; Chairman of the Board and Chief Executive Officer, Columbia Management Investment Distributors, Inc., since November 2008 and February 2012, respectively;Chairman of the Board and Director, Threadneedle Asset Management Holdings, Sàrl, since March 2013 and December 2008, respectively; senior executive of various entities affiliated with Columbia Threadneedle. |
| Christopher O. Petersen 5228 Ameriprise Financial Center Minneapolis, MN 55474 1970 | Senior Vice President and Assistant Secretary (2021) | Formerly, Trustee/Director of funds within the Columbia Funds Complex, July 1, 2020 - November 22, 2021; Senior Vice President and Assistant General Counsel, Ameriprise Financial, Inc., since September 2021 (previously Vice President and Lead Chief Counsel, January 2015 - September 2021); formerly, President and Principal Executive Officer of the Columbia Funds, 2015 - 2021; officer of Columbia Funds and affiliated funds, since 2007. |
| Thomas P. McGuire 290 Congress Street Boston, MA 02210 1972 | Senior Vice President and Chief Compliance Officer (2012) | Vice President – Asset Management Compliance, Ameriprise Financial, Inc., since May 2010; Chief Compliance Officer, Columbia Acorn/Wanger Funds, since December 2015; formerly, Chief Compliance Officer, Ameriprise Certificate Company, September 2010 – September 2020. |
| Ryan C. Larrenaga 290 Congress Street Boston, MA 02210 1970 | Senior Vice President (2017), Chief Legal Officer (2017), and Secretary (2015) | Vice President and Chief Counsel, Ameriprise Financial, Inc., since August 2018 (previously Vice President and Group Counsel, August 2011 - August 2018); Chief Legal Officer, Columbia Acorn/Wanger Funds, since September 2020; officer of Columbia Funds and affiliated funds, since 2005. |
| Columbia Seligman Technology and Information Fund | Annual Report 2023 | 41 |
(Unaudited)
Fund officers (continued)
| Name, address and year of birth | Position and year first appointed to position for any Fund in the Columbia Funds Complex or a predecessor thereof | Principal occupation(s) during past five years |
| Michael E. DeFao 290 Congress Street Boston, MA 02210 1968 | Vice President (2011) and Assistant Secretary (2010) | Vice President and Chief Counsel, Ameriprise Financial, Inc., since May 2010; Vice President, Chief Legal Officer and Assistant Secretary, Columbia Management Investment Advisers, LLC, since October 2021 (previously Vice President and Assistant Secretary, May 2010 – September 2021). |
| Lyn Kephart-Strong 5903 Ameriprise Financial Center Minneapolis, MN 55474 1960 | Vice President (2015) | Vice President, Global Investment Operations Services, Columbia Management Investment Advisers, LLC, since 2010; Director (since January 2007) and President (since October 2014), Columbia Management Investment Services Corp.; Director (since December 2017) and President (since January 2017), Ameriprise Trust Company. |
| • | the Fund had sufficient liquidity to both meet redemptions and operate effectively on behalf of shareholders; |
| • | there were no material changes to the Program during the period; |
| • | the implementation of the Program was effective to manage the Fund’s liquidity risk; and |
| • | the Program operated adequately during the period. |
| 42 | Columbia Seligman Technology and Information Fund | Annual Report 2023 |
columbiathreadneedleus.com/investor/. The Fund is distributed by Columbia Management Investment Distributors, Inc., member FINRA, and managed by Columbia Management Investment Advisers, LLC.

May 31, 2023

| 3 | |
| 5 | |
| 7 | |
| 8 | |
| 12 | |
| 13 | |
| 14 | |
| 16 | |
| 20 | |
| 29 | |
| 30 | |
| 30 | |
| 36 |
(Unaudited)
| Average annual total returns (%) (for the period ended May 31, 2023) | |||||
| Inception | 1 Year | 5 Years | 10 Years | ||
| Class A | Excluding sales charges | 10/15/90 | -6.20 | 7.23 | 8.45 |
| Including sales charges | -11.59 | 5.96 | 7.81 | ||
| Advisor Class | 12/11/06 | -5.95 | 7.51 | 8.72 | |
| Class C | Excluding sales charges | 06/26/00 | -6.90 | 6.43 | 7.63 |
| Including sales charges | -7.76 | 6.43 | 7.63 | ||
| Institutional Class | 09/27/10 | -5.95 | 7.50 | 8.72 | |
| Institutional 2 Class | 12/11/06 | -5.97 | 7.55 | 8.79 | |
| Institutional 3 Class | 11/08/12 | -5.85 | 7.59 | 8.84 | |
| Class R | 12/11/06 | -6.43 | 6.96 | 8.18 | |
| Russell 1000 Value Index | -4.55 | 6.78 | 8.42 | ||
| Columbia Large Cap Value Fund | Annual Report 2023 | 3 |
(Unaudited)

| Portfolio breakdown (%) (at May 31, 2023) | |
| Common Stocks | 98.2 |
| Convertible Bonds | 1.1 |
| Money Market Funds | 0.7 |
| Total | 100.0 |
| Equity sector breakdown (%) (at May 31, 2023) | |
| Communication Services | 7.5 |
| Consumer Discretionary | 5.7 |
| Consumer Staples | 8.0 |
| Energy | 7.9 |
| Financials | 21.3 |
| Health Care | 16.3 |
| Industrials | 9.7 |
| Information Technology | 9.2 |
| Materials | 5.5 |
| Real Estate | 4.7 |
| Utilities | 4.2 |
| Total | 100.0 |
| 4 | Columbia Large Cap Value Fund | Annual Report 2023 |
(Unaudited)
| • | Selection within communication services, industrials and energy weighed most heavily on the Fund’s relative performance. |
| • | In terms of individual companies, positioning with respect to Facebook curator Meta Platforms, Inc. was, by a wide margin, the largest detractor from relative performance. We exited Meta at a loss on concerns that the company was investing too heavily on development related to distant virtual reality products even as a sharp dip in advertising spending by recession-wary customers was already weighing on earnings. However, Meta posted results for the fourth quarter of 2023 that reflected an abrupt course correction with respect to capital expenditures, leading the stock to surge higher. |
| • | While overall selection within financials contributed positively, a pair of regional banks, PNC Financial Services Group, Inc. and Trust Financial Corp., were leading laggards within the portfolio as the March run on bank deposits experienced some West Coast banks weighed broadly on the segment. We exited the position in Trust Financial in favor of another bank we viewed as more favorably positioned. |
| • | Finally, exposure to the convertible bond of Dish Network Corp. proved detrimental. With the bond maturing in approximately two-and-a-half years, some investors viewed the direct-broadcast satellite company as subject to liquidity risk. In our view, the viability of Dish is not threatened, and we added to the position on weakness based on an extremely attractive yield. |
| Columbia Large Cap Value Fund | Annual Report 2023 | 5 |
(Unaudited)
| • | The Fund’s stock selection was strongest within the consumer discretionary, information technology, and financials sectors. |
| • | In terms of individual holdings, leading contributors to relative performance included casino operator Las Vegas Sands Corp. Having exited the United States market, the company does business principally in Singapore and, most notably, the Chinese special administrative region of Macau, which before the pandemic was the largest center of gambling globally by a wide margin. Sentiment with respect to the stock was boosted by China’s unexpectedly abrupt reversal of its zero-COVID-19 policy, and we viewed Las Vegas Sands as poised to post several years of strong results. |
| • | Semiconductor company Broadcom, Inc. has strong market share across all of its products. Along with those of several other chipmakers, the stock was a prime beneficiary of headlines as 2023 progressed around the wide array of potential industrial applications of artificial intelligence. |
| • | Biotechnology company Vertex Pharmaceuticals, Inc. has, at times in the past, been viewed as something of a “one-trick pony” built on the dominant position of its cystic fibrosis franchise. However, in recent quarters, investors have begun to recognize Vertex’s promising drug pipeline. During the period, the company reported strong progress with respect to its non-opioid pain and sickle cell treatments. |
| • | Darden Restaurants, Inc. encompasses a number of well-known restaurant brands, such as Olive Garden. The company continued to post strong results despite investor worries over the impact of historically high inflation on discretionary consumer spending. |
| 6 | Columbia Large Cap Value Fund | Annual Report 2023 |
(Unaudited)
| December 1, 2022 — May 31, 2023 | |||||||
| Account value at the beginning of the period ($) | Account value at the end of the period ($) | Expenses paid during the period ($) | Fund’s annualized expense ratio (%) | ||||
| Actual | Hypothetical | Actual | Hypothetical | Actual | Hypothetical | Actual | |
| Class A | 1,000.00 | 1,000.00 | 923.70 | 1,020.00 | 4.75 | 4.99 | 0.99 |
| Advisor Class | 1,000.00 | 1,000.00 | 924.80 | 1,021.24 | 3.55 | 3.73 | 0.74 |
| Class C | 1,000.00 | 1,000.00 | 919.90 | 1,016.26 | 8.33 | 8.75 | 1.74 |
| Institutional Class | 1,000.00 | 1,000.00 | 924.70 | 1,021.24 | 3.55 | 3.73 | 0.74 |
| Institutional 2 Class | 1,000.00 | 1,000.00 | 924.40 | 1,021.39 | 3.41 | 3.58 | 0.71 |
| Institutional 3 Class | 1,000.00 | 1,000.00 | 925.10 | 1,021.64 | 3.17 | 3.33 | 0.66 |
| Class R | 1,000.00 | 1,000.00 | 922.50 | 1,018.75 | 5.94 | 6.24 | 1.24 |
| Columbia Large Cap Value Fund | Annual Report 2023 | 7 |
May 31, 2023
| Common Stocks 98.1% | ||
| Issuer | Shares | Value ($) |
| Communication Services 7.4% | ||
| Diversified Telecommunication Services 1.1% | ||
| AT&T, Inc. | 1,561,900 | 24,568,687 |
| Interactive Media & Services 2.3% | ||
| Alphabet, Inc., Class A(a) | 410,200 | 50,401,274 |
| Media 2.3% | ||
| Comcast Corp., Class A | 1,238,700 | 48,742,845 |
| Wireless Telecommunication Services 1.7% | ||
| T-Mobile US, Inc.(a) | 270,300 | 37,098,675 |
| Total Communication Services | 160,811,481 | |
| Consumer Discretionary 5.6% | ||
| Hotels, Restaurants & Leisure 3.3% | ||
| Darden Restaurants, Inc. | 215,100 | 34,097,652 |
| Las Vegas Sands Corp.(a) | 666,300 | 36,733,119 |
| Total | 70,830,771 | |
| Specialty Retail 1.4% | ||
| Gap, Inc. (The) | 1,734,180 | 13,908,124 |
| Home Depot, Inc. (The) | 61,750 | 17,503,037 |
| Total | 31,411,161 | |
| Textiles, Apparel & Luxury Goods 0.9% | ||
| Levi Strauss & Co., Class A | 1,460,716 | 19,325,273 |
| Total Consumer Discretionary | 121,567,205 | |
| Consumer Staples 7.9% | ||
| Beverages 1.5% | ||
| Coca-Cola Co. (The) | 540,400 | 32,240,264 |
| Consumer Staples Distribution & Retail 2.4% | ||
| Walmart, Inc. | 351,213 | 51,582,653 |
| Household Products 2.2% | ||
| Procter & Gamble Co. (The) | 333,900 | 47,580,750 |
| Tobacco 1.8% | ||
| Philip Morris International, Inc. | 447,178 | 40,250,492 |
| Total Consumer Staples | 171,654,159 | |
| Common Stocks (continued) | ||
| Issuer | Shares | Value ($) |
| Energy 7.8% | ||
| Oil, Gas & Consumable Fuels 7.8% | ||
| Chevron Corp. | 255,300 | 38,453,286 |
| ConocoPhillips Co. | 493,900 | 49,044,270 |
| EOG Resources, Inc. | 396,329 | 42,522,138 |
| Valero Energy Corp. | 369,100 | 39,508,464 |
| Total | 169,528,158 | |
| Total Energy | 169,528,158 | |
| Financials 20.9% | ||
| Banks 7.8% | ||
| Bank of America Corp. | 1,495,243 | 41,552,803 |
| JPMorgan Chase & Co. | 537,100 | 72,889,841 |
| M&T Bank Corp. | 233,700 | 27,847,692 |
| PNC Financial Services Group, Inc. (The) | 245,001 | 28,378,466 |
| Total | 170,668,802 | |
| Capital Markets 5.9% | ||
| Bank of New York Mellon Corp. (The) | 669,200 | 26,901,840 |
| Goldman Sachs Group, Inc. (The) | 108,000 | 34,981,200 |
| Intercontinental Exchange, Inc. | 280,200 | 29,687,190 |
| Morgan Stanley | 441,438 | 36,091,971 |
| Total | 127,662,201 | |
| Financial Services 3.9% | ||
| Berkshire Hathaway, Inc., Class B(a) | 189,838 | 60,953,185 |
| MasterCard, Inc., Class A | 68,500 | 25,003,870 |
| Total | 85,957,055 | |
| Insurance 3.3% | ||
| Chubb Ltd. | 217,500 | 40,411,500 |
| Marsh & McLennan Companies, Inc. | 178,400 | 30,895,312 |
| Total | 71,306,812 | |
| Total Financials | 455,594,870 | |
| Health Care 15.9% | ||
| Biotechnology 2.9% | ||
| BioMarin Pharmaceutical, Inc.(a) | 119,500 | 10,389,330 |
| Vertex Pharmaceuticals, Inc.(a) | 162,300 | 52,515,411 |
| Total | 62,904,741 | |
| 8 | Columbia Large Cap Value Fund | Annual Report 2023 |
May 31, 2023
| Common Stocks (continued) | ||
| Issuer | Shares | Value ($) |
| Health Care Equipment & Supplies 2.5% | ||
| Baxter International, Inc. | 610,200 | 24,847,344 |
| Becton Dickinson & Co. | 123,000 | 29,736,480 |
| Total | 54,583,824 | |
| Health Care Providers & Services 4.1% | ||
| Cigna Group (The) | 168,800 | 41,762,808 |
| CVS Health Corp. | 398,166 | 27,087,233 |
| Elevance Health, Inc. | 45,100 | 20,196,682 |
| Total | 89,046,723 | |
| Pharmaceuticals 6.4% | ||
| Bristol-Myers Squibb Co. | 564,000 | 36,344,160 |
| Johnson & Johnson | 428,900 | 66,505,234 |
| Merck & Co., Inc. | 345,300 | 38,124,573 |
| Total | 140,973,967 | |
| Total Health Care | 347,509,255 | |
| Industrials 9.5% | ||
| Aerospace & Defense 1.6% | ||
| Northrop Grumman Corp. | 79,300 | 34,534,357 |
| Air Freight & Logistics 1.5% | ||
| FedEx Corp. | 149,845 | 32,663,213 |
| Building Products 1.0% | ||
| Trane Technologies PLC | 136,500 | 22,280,895 |
| Ground Transportation 1.4% | ||
| Norfolk Southern Corp. | 145,166 | 30,220,658 |
| Industrial Conglomerates 0.7% | ||
| 3M Co. | 165,000 | 15,396,150 |
| Machinery 3.3% | ||
| AGCO Corp. | 212,100 | 23,390,388 |
| Ingersoll Rand, Inc. | 408,063 | 23,120,850 |
| Stanley Black & Decker, Inc. | 344,400 | 25,819,668 |
| Total | 72,330,906 | |
| Total Industrials | 207,426,179 | |
| Information Technology 9.0% | ||
| Communications Equipment 2.4% | ||
| Cisco Systems, Inc. | 1,055,200 | 52,411,784 |
| Common Stocks (continued) | ||
| Issuer | Shares | Value ($) |
| Semiconductors & Semiconductor Equipment 4.6% | ||
| Broadcom, Inc. | 44,637 | 36,064,910 |
| GlobalFoundries, Inc.(a) | 476,403 | 27,788,587 |
| Lam Research Corp. | 60,100 | 37,063,670 |
| Total | 100,917,167 | |
| Software 1.3% | ||
| Microsoft Corp. | 89,200 | 29,292,388 |
| Technology Hardware, Storage & Peripherals 0.7% | ||
| Western Digital Corp.(a) | 364,000 | 14,097,720 |
| Total Information Technology | 196,719,059 | |
| Materials 5.4% | ||
| Chemicals 4.2% | ||
| Eastman Chemical Co. | 324,500 | 25,015,705 |
| FMC Corp. | 238,300 | 24,802,264 |
| Linde PLC | 116,500 | 41,201,390 |
| Total | 91,019,359 | |
| Metals & Mining 1.2% | ||
| Freeport-McMoRan, Inc. | 774,562 | 26,598,459 |
| Total Materials | 117,617,818 | |
| Real Estate 4.6% | ||
| Health Care REITs 1.2% | ||
| Welltower, Inc. | 349,686 | 26,090,072 |
| Industrial REITs 1.6% | ||
| Prologis, Inc. | 279,963 | 34,869,392 |
| Residential REITs 0.5% | ||
| Invitation Homes, Inc. | 333,300 | 11,292,204 |
| Specialized REITs 1.3% | ||
| American Tower Corp. | 148,016 | 27,300,071 |
| Total Real Estate | 99,551,739 | |
| Utilities 4.1% | ||
| Electric Utilities 1.4% | ||
| Xcel Energy, Inc. | 464,908 | 30,353,843 |
| Columbia Large Cap Value Fund | Annual Report 2023 | 9 |
May 31, 2023
| Common Stocks (continued) | ||
| Issuer | Shares | Value ($) |
| Multi-Utilities 2.7% | ||
| Ameren Corp. | 363,881 | 29,499,833 |
| DTE Energy Co. | 274,400 | 29,525,440 |
| Total | 59,025,273 | |
| Total Utilities | 89,379,116 | |
| Total Common Stocks (Cost $1,495,028,999) | 2,137,359,039 | |
| Convertible Bonds 1.1% | ||||
| Issuer | Coupon Rate | Principal Amount ($) | Value ($) | |
| Cable and Satellite 1.1% | ||||
| DISH Network Corp.(b) | ||||
| 12/15/2025 | 0.000% | 51,879,000 | 23,734,643 | |
| Total Convertible Bonds (Cost $39,861,654) | 23,734,643 | |||
| Money Market Funds 0.7% | ||
| Shares | Value ($) | |
| Columbia Short-Term Cash Fund, 5.241%(c),(d) | 15,416,472 | 15,408,764 |
| Total Money Market Funds (Cost $15,406,529) | 15,408,764 | |
| Total Investments in Securities (Cost: $1,550,297,182) | 2,176,502,446 | |
| Other Assets & Liabilities, Net | 3,010,973 | |
| Net Assets | 2,179,513,419 | |
| (a) | Non-income producing investment. |
| (b) | Zero coupon bond. |
| (c) | The rate shown is the seven-day current annualized yield at May 31, 2023. |
| (d) | As defined in the Investment Company Act of 1940, as amended, an affiliated company is one in which the Fund owns 5% or more of the company’s outstanding voting securities, or a company which is under common ownership or control with the Fund. The value of the holdings and transactions in these affiliated companies during the year ended May 31, 2023 are as follows: |
| Affiliated issuers | Beginning of period($) | Purchases($) | Sales($) | Net change in unrealized appreciation (depreciation)($) | End of period($) | Realized gain (loss)($) | Dividends($) | End of period shares |
| Columbia Short-Term Cash Fund, 5.241% | ||||||||
| 38,639,026 | 250,156,576 | (273,389,073) | 2,235 | 15,408,764 | (10,242) | 801,337 | 15,416,472 | |
| ■ | Level 1 — Valuations based on quoted prices for investments in active markets that the Fund has the ability to access at the measurement date. Valuation adjustments are not applied to Level 1 investments. |
| ■ | Level 2 — Valuations based on other significant observable inputs (including quoted prices for similar securities, interest rates, prepayment speeds, credit risks, etc.). |
| ■ | Level 3 — Valuations based on significant unobservable inputs (including the Fund’s own assumptions and judgment in determining the fair value of investments). |
| 10 | Columbia Large Cap Value Fund | Annual Report 2023 |
May 31, 2023
Investments falling into the Level 3 category are primarily supported by quoted prices from brokers and dealers participating in the market for those investments. However, these may be classified as Level 3 investments due to lack of market transparency and corroboration to support these quoted prices. Additionally, valuation models may be used as the pricing source for any remaining investments classified as Level 3. These models may rely on one or more significant unobservable inputs and/or significant assumptions by the Investment Manager. Inputs used in valuations may include, but are not limited to, financial statement analysis, capital account balances, discount rates and estimated cash flows, and comparable company data.
| Level 1 ($) | Level 2 ($) | Level 3 ($) | Total ($) | |
| Investments in Securities | ||||
| Common Stocks | ||||
| Communication Services | 160,811,481 | — | — | 160,811,481 |
| Consumer Discretionary | 121,567,205 | — | — | 121,567,205 |
| Consumer Staples | 171,654,159 | — | — | 171,654,159 |
| Energy | 169,528,158 | — | — | 169,528,158 |
| Financials | 455,594,870 | — | — | 455,594,870 |
| Health Care | 347,509,255 | — | — | 347,509,255 |
| Industrials | 207,426,179 | — | — | 207,426,179 |
| Information Technology | 196,719,059 | — | — | 196,719,059 |
| Materials | 117,617,818 | — | — | 117,617,818 |
| Real Estate | 99,551,739 | — | — | 99,551,739 |
| Utilities | 89,379,116 | — | — | 89,379,116 |
| Total Common Stocks | 2,137,359,039 | — | — | 2,137,359,039 |
| Convertible Bonds | — | 23,734,643 | — | 23,734,643 |
| Money Market Funds | 15,408,764 | — | — | 15,408,764 |
| Total Investments in Securities | 2,152,767,803 | 23,734,643 | — | 2,176,502,446 |
| Columbia Large Cap Value Fund | Annual Report 2023 | 11 |
May 31, 2023
| Assets | |
| Investments in securities, at value | |
| Unaffiliated issuers (cost $1,534,890,653) | $2,161,093,682 |
| Affiliated issuers (cost $15,406,529) | 15,408,764 |
| Receivable for: | |
| Capital shares sold | 372,715 |
| Dividends | 4,229,482 |
| Prepaid expenses | 13,460 |
| Total assets | 2,181,118,103 |
| Liabilities | |
| Payable for: | |
| Capital shares purchased | 1,041,670 |
| Management services fees | 38,404 |
| Distribution and/or service fees | 10,439 |
| Transfer agent fees | 146,159 |
| Compensation of board members | 310,458 |
| Other expenses | 57,554 |
| Total liabilities | 1,604,684 |
| Net assets applicable to outstanding capital stock | $2,179,513,419 |
| Represented by | |
| Paid in capital | 1,516,924,240 |
| Total distributable earnings (loss) | 662,589,179 |
| Total - representing net assets applicable to outstanding capital stock | $2,179,513,419 |
| Class A | |
| Net assets | $1,466,080,142 |
| Shares outstanding | 102,883,806 |
| Net asset value per share | $14.25 |
| Maximum sales charge | 5.75% |
| Maximum offering price per share (calculated by dividing the net asset value per share by 1.0 minus the maximum sales charge for Class A shares) | $15.12 |
| Advisor Class | |
| Net assets | $35,051,960 |
| Shares outstanding | 2,462,004 |
| Net asset value per share | $14.24 |
| Class C | |
| Net assets | $10,247,565 |
| Shares outstanding | 721,511 |
| Net asset value per share | $14.20 |
| Institutional Class | |
| Net assets | $218,833,735 |
| Shares outstanding | 15,389,190 |
| Net asset value per share | $14.22 |
| Institutional 2 Class | |
| Net assets | $37,876,998 |
| Shares outstanding | 2,659,056 |
| Net asset value per share | $14.24 |
| Institutional 3 Class | |
| Net assets | $408,730,925 |
| Shares outstanding | 28,275,735 |
| Net asset value per share | $14.46 |
| Class R | |
| Net assets | $2,692,094 |
| Shares outstanding | 190,579 |
| Net asset value per share | $14.13 |
| 12 | Columbia Large Cap Value Fund | Annual Report 2023 |
Year Ended May 31, 2023
| Net investment income | |
| Income: | |
| Dividends — unaffiliated issuers | $58,860,874 |
| Dividends — affiliated issuers | 801,337 |
| Interest | 338,313 |
| Total income | 60,000,524 |
| Expenses: | |
| Management services fees | 14,872,802 |
| Distribution and/or service fees | |
| Class A | 3,943,260 |
| Class C | 109,998 |
| Class R | 15,162 |
| Transfer agent fees | |
| Class A | 1,324,438 |
| Advisor Class | 32,596 |
| Class C | 9,234 |
| Institutional Class | 179,995 |
| Institutional 2 Class | 15,741 |
| Institutional 3 Class | 28,913 |
| Class R | 2,547 |
| Compensation of board members | 52,615 |
| Custodian fees | 11,692 |
| Printing and postage fees | 117,370 |
| Registration fees | 148,904 |
| Accounting services fees | 30,090 |
| Legal fees | 43,758 |
| Compensation of chief compliance officer | 458 |
| Other | 46,931 |
| Total expenses | 20,986,504 |
| Expense reduction | (120) |
| Total net expenses | 20,986,384 |
| Net investment income | 39,014,140 |
| Realized and unrealized gain (loss) — net | |
| Net realized gain (loss) on: | |
| Investments — unaffiliated issuers | 30,954,034 |
| Investments — affiliated issuers | (10,242) |
| Net realized gain | 30,943,792 |
| Net change in unrealized appreciation (depreciation) on: | |
| Investments — unaffiliated issuers | (226,246,007) |
| Investments — affiliated issuers | 2,235 |
| Net change in unrealized appreciation (depreciation) | (226,243,772) |
| Net realized and unrealized loss | (195,299,980) |
| Net decrease in net assets resulting from operations | $(156,285,840) |
| Columbia Large Cap Value Fund | Annual Report 2023 | 13 |
| Year Ended May 31, 2023 | Year Ended May 31, 2022 | |
| Operations | ||
| Net investment income | $39,014,140 | $33,361,363 |
| Net realized gain | 30,943,792 | 256,699,425 |
| Net change in unrealized appreciation (depreciation) | (226,243,772) | (243,833,224) |
| Net increase (decrease) in net assets resulting from operations | (156,285,840) | 46,227,564 |
| Distributions to shareholders | ||
| Net investment income and net realized gains | ||
| Class A | (135,804,759) | (113,587,179) |
| Advisor Class | (3,557,660) | (2,780,127) |
| Class C | (865,912) | (717,638) |
| Institutional Class | (18,916,605) | (15,102,047) |
| Institutional 2 Class | (2,755,492) | (2,079,822) |
| Institutional 3 Class | (40,719,461) | (42,237,274) |
| Class R | (260,172) | (187,147) |
| Total distributions to shareholders | (202,880,061) | (176,691,234) |
| Decrease in net assets from capital stock activity | (99,459,291) | (41,502,157) |
| Total decrease in net assets | (458,625,192) | (171,965,827) |
| Net assets at beginning of year | 2,638,138,611 | 2,810,104,438 |
| Net assets at end of year | $2,179,513,419 | $2,638,138,611 |
| 14 | Columbia Large Cap Value Fund | Annual Report 2023 |
| Year Ended | Year Ended | |||
| May 31, 2023 | May 31, 2022 | |||
| Shares | Dollars ($) | Shares | Dollars ($) | |
| Capital stock activity | ||||
| Class A | ||||
| Subscriptions | 2,403,115 | 36,552,779 | 2,963,699 | 50,087,908 |
| Distributions reinvested | 8,915,017 | 135,135,823 | 6,817,584 | 112,802,091 |
| Redemptions | (12,347,635) | (187,300,022) | (12,222,236) | (207,037,967) |
| Net decrease | (1,029,503) | (15,611,420) | (2,440,953) | (44,147,968) |
| Advisor Class | ||||
| Subscriptions | 566,765 | 8,648,908 | 421,130 | 7,144,146 |
| Distributions reinvested | 233,939 | 3,539,945 | 166,836 | 2,757,667 |
| Redemptions | (860,094) | (13,072,413) | (535,180) | (9,083,558) |
| Net increase (decrease) | (59,390) | (883,560) | 52,786 | 818,255 |
| Class C | ||||
| Subscriptions | 203,519 | 3,089,901 | 156,071 | 2,632,408 |
| Distributions reinvested | 57,115 | 865,911 | 43,390 | 716,183 |
| Redemptions | (268,829) | (4,039,174) | (240,502) | (4,048,461) |
| Net decrease | (8,195) | (83,362) | (41,041) | (699,870) |
| Institutional Class | ||||
| Subscriptions | 4,793,964 | 72,204,041 | 2,868,888 | 48,516,464 |
| Distributions reinvested | 1,247,988 | 18,857,576 | 911,766 | 15,052,963 |
| Redemptions | (4,767,873) | (72,257,040) | (2,596,972) | (43,925,831) |
| Net increase | 1,274,079 | 18,804,577 | 1,183,682 | 19,643,596 |
| Institutional 2 Class | ||||
| Subscriptions | 936,232 | 14,289,264 | 506,749 | 8,655,079 |
| Distributions reinvested | 182,212 | 2,754,214 | 125,751 | 2,079,822 |
| Redemptions | (375,011) | (5,668,726) | (345,494) | (5,836,984) |
| Net increase | 743,433 | 11,374,752 | 287,006 | 4,897,917 |
| Institutional 3 Class | ||||
| Subscriptions | 427,307 | 6,489,868 | 2,910,332 | 50,994,692 |
| Distributions reinvested | 2,651,987 | 40,717,028 | 2,520,100 | 42,233,098 |
| Redemptions | (10,268,131) | (160,123,754) | (6,769,335) | (115,518,413) |
| Net decrease | (7,188,837) | (112,916,858) | (1,338,903) | (22,290,623) |
| Class R | ||||
| Subscriptions | 25,486 | 386,610 | 49,538 | 830,890 |
| Distributions reinvested | 17,296 | 260,172 | 11,402 | 187,147 |
| Redemptions | (52,540) | (790,202) | (43,781) | (741,501) |
| Net increase (decrease) | (9,758) | (143,420) | 17,159 | 276,536 |
| Total net decrease | (6,278,171) | (99,459,291) | (2,280,264) | (41,502,157) |
| Columbia Large Cap Value Fund | Annual Report 2023 | 15 |
| Net asset value, beginning of period | Net investment income | Net realized and unrealized gain (loss) | Total from investment operations | Distributions from net investment income | Distributions from net realized gains | Total distributions to shareholders | |
| Class A | |||||||
| Year Ended 5/31/2023 | $16.56 | 0.24 | (1.20) | (0.96) | (0.23) | (1.12) | (1.35) |
| Year Ended 5/31/2022 | $17.39 | 0.19 | 0.09 | 0.28 | (0.19) | (0.92) | (1.11) |
| Year Ended 5/31/2021 | $12.02 | 0.18 | 5.38 | 5.56 | (0.19) | — | (0.19) |
| Year Ended 5/31/2020 | $12.66 | 0.22 | (0.05) | 0.17 | (0.21) | (0.60) | (0.81) |
| Year Ended 5/31/2019 | $14.04 | 0.20 | (0.16) | 0.04 | (0.19) | (1.23) | (1.42) |
| Advisor Class | |||||||
| Year Ended 5/31/2023 | $16.55 | 0.28 | (1.20) | (0.92) | (0.27) | (1.12) | (1.39) |
| Year Ended 5/31/2022 | $17.38 | 0.23 | 0.09 | 0.32 | (0.23) | (0.92) | (1.15) |
| Year Ended 5/31/2021 | $12.02 | 0.21 | 5.37 | 5.58 | (0.22) | — | (0.22) |
| Year Ended 5/31/2020 | $12.66 | 0.25 | (0.05) | 0.20 | (0.24) | (0.60) | (0.84) |
| Year Ended 5/31/2019 | $14.03 | 0.24 | (0.15) | 0.09 | (0.23) | (1.23) | (1.46) |
| Class C | |||||||
| Year Ended 5/31/2023 | $16.50 | 0.12 | (1.19) | (1.07) | (0.11) | (1.12) | (1.23) |
| Year Ended 5/31/2022 | $17.33 | 0.06 | 0.09 | 0.15 | (0.06) | (0.92) | (0.98) |
| Year Ended 5/31/2021 | $11.99 | 0.07 | 5.36 | 5.43 | (0.09) | — | (0.09) |
| Year Ended 5/31/2020 | $12.62 | 0.12 | (0.05) | 0.07 | (0.10) | (0.60) | (0.70) |
| Year Ended 5/31/2019 | $13.99 | 0.10 | (0.15) | (0.05) | (0.09) | (1.23) | (1.32) |
| Institutional Class | |||||||
| Year Ended 5/31/2023 | $16.53 | 0.28 | (1.20) | (0.92) | (0.27) | (1.12) | (1.39) |
| Year Ended 5/31/2022 | $17.36 | 0.23 | 0.09 | 0.32 | (0.23) | (0.92) | (1.15) |
| Year Ended 5/31/2021 | $12.00 | 0.21 | 5.37 | 5.58 | (0.22) | — | (0.22) |
| Year Ended 5/31/2020 | $12.65 | 0.25 | (0.06) | 0.19 | (0.24) | (0.60) | (0.84) |
| Year Ended 5/31/2019 | $14.02 | 0.24 | (0.15) | 0.09 | (0.23) | (1.23) | (1.46) |
| Institutional 2 Class | |||||||
| Year Ended 5/31/2023 | $16.56 | 0.28 | (1.20) | (0.92) | (0.28) | (1.12) | (1.40) |
| Year Ended 5/31/2022 | $17.39 | 0.24 | 0.09 | 0.33 | (0.24) | (0.92) | (1.16) |
| Year Ended 5/31/2021 | $12.03 | 0.22 | 5.37 | 5.59 | (0.23) | — | (0.23) |
| Year Ended 5/31/2020 | $12.67 | 0.25 | (0.04) | 0.21 | (0.25) | (0.60) | (0.85) |
| Year Ended 5/31/2019 | $14.04 | 0.25 | (0.15) | 0.10 | (0.24) | (1.23) | (1.47) |
| 16 | Columbia Large Cap Value Fund | Annual Report 2023 |
| Net asset value, end of period | Total return | Total gross expense ratio to average net assets(a) | Total net expense ratio to average net assets(a),(b) | Net investment income ratio to average net assets | Portfolio turnover | Net assets, end of period (000’s) | |
| Class A | |||||||
| Year Ended 5/31/2023 | $14.25 | (6.20%) | 0.99% | 0.99%(c) | 1.57% | 12% | $1,466,080 |
| Year Ended 5/31/2022 | $16.56 | 1.64% | 0.97% | 0.97%(c) | 1.11% | 21% | $1,720,873 |
| Year Ended 5/31/2021 | $17.39 | 46.70% | 1.01% | 1.01%(c) | 1.25% | 27% | $1,849,691 |
| Year Ended 5/31/2020 | $12.02 | 0.73% | 1.02% | 1.02%(c) | 1.64% | 15% | $1,429,986 |
| Year Ended 5/31/2019 | $12.66 | 0.62% | 1.02% | 1.02%(c) | 1.49% | 23% | $1,621,964 |
| Advisor Class | |||||||
| Year Ended 5/31/2023 | $14.24 | (5.95%) | 0.74% | 0.74%(c) | 1.82% | 12% | $35,052 |
| Year Ended 5/31/2022 | $16.55 | 1.91% | 0.72% | 0.72%(c) | 1.36% | 21% | $41,728 |
| Year Ended 5/31/2021 | $17.38 | 46.97% | 0.76% | 0.76%(c) | 1.50% | 27% | $42,909 |
| Year Ended 5/31/2020 | $12.02 | 1.01% | 0.77% | 0.77%(c) | 1.89% | 15% | $30,446 |
| Year Ended 5/31/2019 | $12.66 | 0.95% | 0.77% | 0.77%(c) | 1.74% | 23% | $33,903 |
| Class C | |||||||
| Year Ended 5/31/2023 | $14.20 | (6.90%) | 1.74% | 1.74%(c) | 0.82% | 12% | $10,248 |
| Year Ended 5/31/2022 | $16.50 | 0.86% | 1.72% | 1.72%(c) | 0.36% | 21% | $12,043 |
| Year Ended 5/31/2021 | $17.33 | 45.52% | 1.76% | 1.76%(c) | 0.52% | 27% | $13,359 |
| Year Ended 5/31/2020 | $11.99 | (0.03%) | 1.77% | 1.77%(c) | 0.89% | 15% | $18,031 |
| Year Ended 5/31/2019 | $12.62 | (0.06%) | 1.76% | 1.76%(c) | 0.74% | 23% | $23,646 |
| Institutional Class | |||||||
| Year Ended 5/31/2023 | $14.22 | (5.95%) | 0.74% | 0.74%(c) | 1.82% | 12% | $218,834 |
| Year Ended 5/31/2022 | $16.53 | 1.91% | 0.72% | 0.72%(c) | 1.36% | 21% | $233,329 |
| Year Ended 5/31/2021 | $17.36 | 47.04% | 0.76% | 0.76%(c) | 1.49% | 27% | $224,531 |
| Year Ended 5/31/2020 | $12.00 | 0.93% | 0.77% | 0.77%(c) | 1.89% | 15% | $134,233 |
| Year Ended 5/31/2019 | $12.65 | 0.96% | 0.77% | 0.77%(c) | 1.74% | 23% | $159,448 |
| Institutional 2 Class | |||||||
| Year Ended 5/31/2023 | $14.24 | (5.97%) | 0.70% | 0.70% | 1.86% | 12% | $37,877 |
| Year Ended 5/31/2022 | $16.56 | 1.95% | 0.68% | 0.68% | 1.39% | 21% | $31,720 |
| Year Ended 5/31/2021 | $17.39 | 47.01% | 0.71% | 0.71% | 1.54% | 27% | $28,324 |
| Year Ended 5/31/2020 | $12.03 | 1.08% | 0.71% | 0.71% | 1.95% | 15% | $18,546 |
| Year Ended 5/31/2019 | $12.67 | 1.02% | 0.70% | 0.70% | 1.82% | 23% | $16,474 |
| Columbia Large Cap Value Fund | Annual Report 2023 | 17 |
| Net asset value, beginning of period | Net investment income | Net realized and unrealized gain (loss) | Total from investment operations | Distributions from net investment income | Distributions from net realized gains | Total distributions to shareholders | |
| Institutional 3 Class | |||||||
| Year Ended 5/31/2023 | $16.78 | 0.29 | (1.21) | (0.92) | (0.28) | (1.12) | (1.40) |
| Year Ended 5/31/2022 | $17.61 | 0.25 | 0.08 | 0.33 | (0.24) | (0.92) | (1.16) |
| Year Ended 5/31/2021 | $12.17 | 0.24 | 5.43 | 5.67 | (0.23) | — | (0.23) |
| Year Ended 5/31/2020 | $12.82 | 0.26 | (0.06) | 0.20 | (0.25) | (0.60) | (0.85) |
| Year Ended 5/31/2019 | $14.19 | 0.25 | (0.15) | 0.10 | (0.24) | (1.23) | (1.47) |
| Class R | |||||||
| Year Ended 5/31/2023 | $16.43 | 0.20 | (1.19) | (0.99) | (0.19) | (1.12) | (1.31) |
| Year Ended 5/31/2022 | $17.26 | 0.15 | 0.08 | 0.23 | (0.14) | (0.92) | (1.06) |
| Year Ended 5/31/2021 | $11.93 | 0.14 | 5.35 | 5.49 | (0.16) | — | (0.16) |
| Year Ended 5/31/2020 | $12.57 | 0.18 | (0.05) | 0.13 | (0.17) | (0.60) | (0.77) |
| Year Ended 5/31/2019 | $13.95 | 0.17 | (0.16) | 0.01 | (0.16) | (1.23) | (1.39) |
| Notes to Financial Highlights | |
| (a) | In addition to the fees and expenses that the Fund bears directly, the Fund indirectly bears a pro rata share of the fees and expenses of any other funds in which it invests. Such indirect expenses are not included in the Fund’s reported expense ratios. |
| (b) | Total net expenses include the impact of certain fee waivers/expense reimbursements made by the Investment Manager and certain of its affiliates, if applicable. |
| (c) | The benefits derived from expense reductions had an impact of less than 0.01%. |
| 18 | Columbia Large Cap Value Fund | Annual Report 2023 |
| Net asset value, end of period | Total return | Total gross expense ratio to average net assets(a) | Total net expense ratio to average net assets(a),(b) | Net investment income ratio to average net assets | Portfolio turnover | Net assets, end of period (000’s) | |
| Institutional 3 Class | |||||||
| Year Ended 5/31/2023 | $14.46 | (5.85%) | 0.66% | 0.66% | 1.91% | 12% | $408,731 |
| Year Ended 5/31/2022 | $16.78 | 1.96% | 0.64% | 0.64% | 1.43% | 21% | $595,155 |
| Year Ended 5/31/2021 | $17.61 | 47.16% | 0.66% | 0.66% | 1.54% | 27% | $648,129 |
| Year Ended 5/31/2020 | $12.17 | 1.01% | 0.69% | 0.69% | 1.97% | 15% | $3,344 |
| Year Ended 5/31/2019 | $12.82 | 1.03% | 0.69% | 0.69% | 1.82% | 23% | $2,746 |
| Class R | |||||||
| Year Ended 5/31/2023 | $14.13 | (6.43%) | 1.24% | 1.24%(c) | 1.32% | 12% | $2,692 |
| Year Ended 5/31/2022 | $16.43 | 1.39% | 1.22% | 1.22%(c) | 0.86% | 21% | $3,291 |
| Year Ended 5/31/2021 | $17.26 | 46.37% | 1.26% | 1.26%(c) | 1.00% | 27% | $3,161 |
| Year Ended 5/31/2020 | $11.93 | 0.45% | 1.27% | 1.27%(c) | 1.38% | 15% | $2,371 |
| Year Ended 5/31/2019 | $12.57 | 0.37% | 1.27% | 1.27%(c) | 1.24% | 23% | $3,574 |
| Columbia Large Cap Value Fund | Annual Report 2023 | 19 |
May 31, 2023
| 20 | Columbia Large Cap Value Fund | Annual Report 2023 |
May 31, 2023
| Columbia Large Cap Value Fund | Annual Report 2023 | 21 |
May 31, 2023
| 22 | Columbia Large Cap Value Fund | Annual Report 2023 |
May 31, 2023
| Effective rate (%) | |
| Class A | 0.08 |
| Advisor Class | 0.08 |
| Class C | 0.08 |
| Institutional Class | 0.08 |
| Institutional 2 Class | 0.05 |
| Institutional 3 Class | 0.01 |
| Class R | 0.08 |
| Columbia Large Cap Value Fund | Annual Report 2023 | 23 |
May 31, 2023
| Front End (%) | CDSC (%) | Amount ($) | |
| Class A | 5.75 | 0.50 - 1.00(a) | 293,388 |
| Class C | — | 1.00(b) | 1,257 |
| (a) | This charge is imposed on certain investments of between $1 million and $50 million redeemed within 18 months after purchase, as follows: 1.00% if redeemed within 12 months after purchase, and 0.50% if redeemed more than 12, but less than 18, months after purchase, with certain limited exceptions. |
| (b) | This charge applies to redemptions within 12 months after purchase, with certain limited exceptions. |
| October 1, 2022 through September 30, 2023 | Prior to October 1, 2022 | |
| Class A | 1.08% | 1.08% |
| Advisor Class | 0.83 | 0.83 |
| Class C | 1.83 | 1.83 |
| Institutional Class | 0.83 | 0.83 |
| Institutional 2 Class | 0.80 | 0.79 |
| Institutional 3 Class | 0.76 | 0.76 |
| Class R | 1.33 | 1.33 |
| 24 | Columbia Large Cap Value Fund | Annual Report 2023 |
May 31, 2023
| Undistributed net investment income ($) | Accumulated net realized gain ($) | Paid in capital ($) |
| (7,226) | 7,226 | — |
| Year Ended May 31, 2023 | Year Ended May 31, 2022 | ||||
| Ordinary income ($) | Long-term capital gains ($) | Total ($) | Ordinary income ($) | Long-term capital gains ($) | Total ($) |
| 46,715,413 | 156,164,648 | 202,880,061 | 53,349,820 | 123,341,414 | 176,691,234 |
| Undistributed ordinary income ($) | Undistributed long-term capital gains ($) | Capital loss carryforwards ($) | Net unrealized appreciation ($) |
| 6,799,556 | 31,059,050 | — | 625,037,681 |
| Federal tax cost ($) | Gross unrealized appreciation ($) | Gross unrealized (depreciation) ($) | Net unrealized appreciation ($) |
| 1,551,464,764 | 739,407,209 | (114,369,528) | 625,037,681 |
| Columbia Large Cap Value Fund | Annual Report 2023 | 25 |
May 31, 2023
| 26 | Columbia Large Cap Value Fund | Annual Report 2023 |
May 31, 2023
| Columbia Large Cap Value Fund | Annual Report 2023 | 27 |
May 31, 2023
| 28 | Columbia Large Cap Value Fund | Annual Report 2023 |
| Columbia Large Cap Value Fund | Annual Report 2023 | 29 |
| Qualified dividend income | Dividends received deduction | Section 199A dividends | Capital gain dividend |
| 98.79% | 97.16% | 1.21% | $32,642,964 |
| 30 | Columbia Large Cap Value Fund | Annual Report 2023 |
(Unaudited)
Independent trustees
| Name, address, year of birth | Position held with the Columbia Funds and length of service | Principal occupation(s) during past five years and other relevant professional experience | Number of Funds in the Columbia Funds Complex* overseen | Other directorships held by Trustee during the past five years and other relevant Board experience |
| George S. Batejan c/o Columbia Management Investment Advisers, LLC 290 Congress Street Boston, MA 02210 1954 | Trustee since 2017 | Executive Vice President, Global Head of Technology and Operations, Janus Capital Group, Inc., 2010-2016 | 174 | Former Chairman of the Board, NICSA (National Investment Company Services Association) (Executive Committee, Nominating Committee and Governance Committee), 2014-2016; former Director, Intech Investment Management, 2011-2016; former Board Member, Metro Denver Chamber of Commerce, 2015-2016; former Advisory Board Member, University of Colorado Business School, 2015-2018; former Board Member, Chase Bank International, 1993-1994 |
| Kathleen Blatz c/o Columbia Management Investment Advisers, LLC 290 Congress Street Boston, MA 02210 1954 | Trustee since 2006 | Attorney, specializing in arbitration and mediation; Chief Justice, Minnesota Supreme Court, 1998-2006; Associate Justice, Minnesota Supreme Court, 1996-1998; Fourth Judicial District Court Judge, Hennepin County, 1994-1996; Attorney in private practice and public service, 1984-1993; State Representative, Minnesota House of Representatives, 1979-1993, which included service on the Tax and Financial Institutions and Insurance Committees; Member and Interim Chair, Minnesota Sports Facilities Authority, January-July 2017; Interim President and Chief Executive Officer, Blue Cross and Blue Shield of Minnesota (health care insurance), February-July 2018, April-October 2021 | 174 | Former Trustee, Blue Cross and Blue Shield of Minnesota, 2009-2021 (Chair of the Business Development Committee, 2014-2017; Chair of the Governance Committee, 2017-2019); former Member and Chair of the Board, Minnesota Sports Facilities Authority, January 2017-July 2017; former Director, Robina Foundation, 2009-2020 (Chair, 2014-2020); Director, Richard M. Schulze Family Foundation, since 2021 |
| Pamela G. Carlton c/o Columbia Management Investment Advisers, LLC 290 Congress Street Boston, MA 02210 1954 | Chair since 2023; Trustee since 2007 | President, Springboard — Partners in Cross Cultural Leadership (consulting company), since 2003; Managing Director of US Equity Research, JP Morgan Chase, 1999-2003; Director of US Equity Research, Chase Asset Management, 1996-1999; Co-Director Latin America Research, 1993-1996, COO Global Research, 1992-1996, Co-Director of US Research, 1991-1992, Investment Banker, 1982-1991, Morgan Stanley; Attorney, Cleary Gottlieb Steen & Hamilton LLP, 1980-1982 | 174 | Trustee, New York Presbyterian Hospital Board, since 1996; Director, DR Bank (Audit Committee) since 2017; Director, Evercore Inc. (Audit Committee, Nominating and Governance Committee), since 2019; Director, Apollo Commercial Real Estate Finance, Inc. (Chair, Nominating and Governance Committee) (financial services), since 2021; the Governing Council of the Independent Directors Council (IDC), since 2021 |
| Columbia Large Cap Value Fund | Annual Report 2023 | 31 |
(Unaudited)
Independent trustees (continued)
| Name, address, year of birth | Position held with the Columbia Funds and length of service | Principal occupation(s) during past five years and other relevant professional experience | Number of Funds in the Columbia Funds Complex* overseen | Other directorships held by Trustee during the past five years and other relevant Board experience |
| Janet Langford Carrig c/o Columbia Management Investment Advisers, LLC 290 Congress Street Boston, MA 02210 1957 | Trustee since 1996 | Senior Vice President, General Counsel and Corporate Secretary, ConocoPhillips (independent energy company), September 2007-October 2018 | 174 | Director, EQT Corporation (natural gas producer), since 2019; former Director, Whiting Petroleum Corporation (independent oil and gas company), 2020-2022 |
| J. Kevin Connaughton c/o Columbia Management Investment Advisers, LLC 290 Congress Street Boston, MA 02210 1964 | Trustee since 2020 | CEO and President, RhodeWay Financial (non-profit financial planning firm), since December 2022; Member, FINRA National Adjudicatory Council, since January 2020; Adjunct Professor of Finance, Bentley University since January 2018; Consultant to Independent Trustees of CFVIT and CFST I from March 2016 to June 2020 with respect to CFVIT and to December 2020 with respect to CFST I; Managing Director and General Manager of Mutual Fund Products, Columbia Management Investment Advisers, LLC, May 2010-February 2015; President, Columbia Funds, 2008-2015; and senior officer of Columbia Funds and affiliated funds, 2003-2015 | 172 | Former Director, The Autism Project, March 2015-December 2021; former Member of the Investment Committee, St. Michael’s College, November 2015-February 2020; former Trustee, St. Michael’s College, June 2017-September 2019; former Trustee, New Century Portfolios (former mutual fund complex), January 2015-December 2017 |
| Olive M. Darragh c/o Columbia Management Investment Advisers, LLC 290 Congress Street Boston, MA 02210 1962 | Trustee since 2020 | Managing Director of Darragh Inc. (strategy and talent management consulting firm), since 2010; Founder and CEO, Zolio, Inc. (investment management talent identification platform), since 2004; Consultant to Independent Trustees of CFVIT and CFST I from June 2019 to June 2020 with respect to CFVIT and to December 2020 with respect to CFST I; Partner, Tudor Investments, 2004-2010; Senior Partner, McKinsey & Company (consulting), 1990-2004; Touche Ross CPA, 1985-1988 | 172 | Treasurer, Edinburgh University US Trust Board, since January 2023; Member, HBS Community Action Partners Board, since September 2022; former Director, University of Edinburgh Business School (Member of US Board), 2004-2019; former Director, Boston Public Library Foundation, 2008-2017 |
| Patricia M. Flynn c/o Columbia Management Investment Advisers, LLC 290 Congress Street Boston, MA 02210 1950 | Trustee since 2004 | Professor of Economics and Management, Bentley University, since 2002; Dean, McCallum Graduate School of Business, Bentley University, 1992-2002 | 174 | Former Trustee, MA Taxpayers Foundation, 1997-2022; former Director, The MA Business Roundtable, 2003-2019; former Chairperson, Innovation Index Advisory Committee, MA Technology Collaborative, 1997-2020 |
| Brian J. Gallagher c/o Columbia Management Investment Advisers, LLC 290 Congress Street Boston, MA 02210 1954 | Trustee since 2017 | Retired; Partner with Deloitte & Touche LLP and its predecessors, 1977-2016 | 174 | Trustee, Catholic Schools Foundation, since 2004 |
| 32 | Columbia Large Cap Value Fund | Annual Report 2023 |
(Unaudited)
Independent trustees (continued)
| Name, address, year of birth | Position held with the Columbia Funds and length of service | Principal occupation(s) during past five years and other relevant professional experience | Number of Funds in the Columbia Funds Complex* overseen | Other directorships held by Trustee during the past five years and other relevant Board experience |
| Douglas A. Hacker c/o Columbia Management Investment Advisers, LLC 290 Congress Street Boston, MA 02210 1955 | Trustee since 1996 | Independent business executive, since May 2006; Executive Vice President – Strategy of United Airlines, December 2002 - May 2006; President of UAL Loyalty Services (airline marketing company), September 2001-December 2002; Executive Vice President and Chief Financial Officer of United Airlines, July 1999-September 2001 | 174 | Director, SpartanNash Company since November 2013 (Chair of the Board, since May 2021) (food distributor); Director, Aircastle Limited (Chair of Audit Committee) (aircraft leasing), since August 2006; former Director, Nash Finch Company (food distributor), 2005-2013; former Director, SeaCube Container Leasing Ltd. (container leasing), 2010-2013; and former Director, Travelport Worldwide Limited (travel information technology), 2014-2019 |
| Nancy T. Lukitsh c/o Columbia Management Investment Advisers, LLC 290 Congress Street Boston, MA 02210 1956 | Trustee since 2011 | Senior Vice President, Partner and Director of Marketing, Wellington Management Company, LLP (investment adviser), 1997-2010; Chair, Wellington Management Portfolios (commingled non-U.S. investment pools), 2007-2010; Director, Wellington Trust Company, NA and other Wellington affiliates, 1997-2010 | 172 | None |
| David M. Moffett c/o Columbia Management Investment Advisers, LLC 290 Congress Street Boston, MA 02210 1952 | Trustee since 2011 | Retired; former Chief Executive Officer of Freddie Mac and Chief Financial Officer of U.S. Bank | 172 | Director, CSX Corporation (transportation suppliers); Director, PayPal Holdings Inc. (payment and data processing services); Trustee, University of Oklahoma Foundation; former Director, eBay Inc. (online trading community), 2007-2015; and former Director, CIT Bank, CIT Group Inc. (commercial and consumer finance), 2010-2016; former Senior Adviser to The Carlyle Group (financial services), March 2008-September 2008; former Governance Consultant to Bridgewater Associates, January 2013-December 2015 |
| Catherine James Paglia c/o Columbia Management Investment Advisers, LLC 290 Congress Street Boston, MA 02210 1952 | Trustee since 2004 | Director, Enterprise Asset Management, Inc. (private real estate and asset management company), since September 1998; Managing Director and Partner, Interlaken Capital, Inc., 1989-1997; Vice President, 1982-1985, Principal, 1985-1987, Managing Director, 1987-1989, Morgan Stanley; Vice President, Investment Banking, 1980-1982, Associate, Investment Banking, 1976-1980, Dean Witter Reynolds, Inc. | 174 | Director, Valmont Industries, Inc. (irrigation systems manufacturer), since 2012; Trustee, Carleton College (on the Investment Committee), since 1987; Trustee, Carnegie Endowment for International Peace (on the Investment Committee), since 2009 |
| Columbia Large Cap Value Fund | Annual Report 2023 | 33 |
(Unaudited)
Independent trustees (continued)
| Name, address, year of birth | Position held with the Columbia Funds and length of service | Principal occupation(s) during past five years and other relevant professional experience | Number of Funds in the Columbia Funds Complex* overseen | Other directorships held by Trustee during the past five years and other relevant Board experience |
| Natalie A. Trunow c/o Columbia Management Investment Advisers, LLC 290 Congress Street Boston, MA 02210 1967 | Trustee since 2020 | Chief Executive Officer, Millennial Portfolio Solutions LLC (asset management and consulting services), January 2016-January 2021; Non-executive Member of the Investment Committee and Valuation Committee, Sarona Asset Management Inc. (private equity firm) since September 2019; Advisor, Horizon Investments (asset management and consulting services), August 2018-January 2022; Advisor, Paradigm Asset Management, November 2016-January 2022; Consultant to Independent Trustees of CFVIT and CFST I from September 2016 to June 2020 with respect to CFVIT and to December 2020 with respect to CFST I; Director of Investments/Consultant, Casey Family Programs, April 2016-November 2016; Senior Vice President and Chief Investment Officer, Calvert Investments, August 2008-January 2016; Section Head and Portfolio Manager, General Motors Asset Management, June 1997-August 2008 | 172 | Independent Director, Investment Committee, Health Services for Children with Special Needs, Inc., 2010-2021; Independent Director, (Executive Committee and Chair, Audit Committee), Consumer Credit Counseling Services (formerly Guidewell Financial Solutions), since 2016; Independent Director, (Investment Committee), Sarona Asset Management, since 2019 |
| Sandra L. Yeager c/o Columbia Management Investment Advisers, LLC 290 Congress Street Boston, MA 02210 1964 | Trustee since 2017 | Retired; President and founder, Hanoverian Capital, LLC (SEC registered investment advisor firm), 2008-2016; Managing Director, DuPont Capital, 2006-2008; Managing Director, Morgan Stanley Investment Management, 2004-2006; Senior Vice President, Alliance Bernstein, 1990-2004 | 174 | Former Director, NAPE (National Alliance for Partnerships in Equity) Education Foundation, October 2016-October 2020; Advisory Board, Jennersville YMCA, since 2022 |
| Name, address, year of birth | Position held with the Columbia Funds and length of service | Principal occupation(s) during the past five years and other relevant professional experience | Number of Funds in the Columbia Funds Complex overseen | Other directorships held by Trustee during the past five years and other relevant Board experience |
| Daniel J. Beckman c/o Columbia Management Investment Advisers, LLC 290 Congress Street Boston, MA 02210 1962 | Trustee since November 2021 and President since June 2021 | Vice President – Head of North America Product, Columbia Management Investment Advisers, LLC, since April 2015; President and Principal Executive Officer of the Columbia Funds, since June 2021; officer of Columbia Funds and affiliated funds, 2020-2021 | 174 | Director, Ameriprise Trust Company, since October 2016; Director, Columbia Management Investment Distributors, Inc. since November 2018; Board of Governors, Columbia Wanger Asset Management, LLC since, January 2022; Director, Columbia Threadneedle Canada, Inc., since December 2022 |
| 34 | Columbia Large Cap Value Fund | Annual Report 2023 |
(Unaudited)
| * | The term “Columbia Funds Complex” as used herein includes Columbia Seligman Premium Technology Growth Fund, Tri-Continental Corporation and each series of Columbia Funds Series Trust (CFST), Columbia Funds Series Trust I (CFST I), Columbia Funds Series Trust II (CFST II), Columbia ETF Trust I (CET I), Columbia ETF Trust II (CET II), Columbia Funds Variable Insurance Trust (CFVIT) and Columbia Funds Variable Series Trust II (CFVST II). Messrs. Batejan, Beckman, Gallagher and Hacker and Mses. Blatz, Carlton, Carrig, Flynn, Paglia, and Yeager serve as directors of Columbia Seligman Premium Technology Growth Fund and Tri-Continental Corporation. |
| ** | Interested person (as defined under the 1940 Act) by reason of being an officer, director, security holder and/or employee of the Investment Manager or Ameriprise Financial. |
| Name, address and year of birth | Position and year first appointed to position for any Fund in the Columbia Funds Complex or a predecessor thereof | Principal occupation(s) during past five years |
| Michael G. Clarke 290 Congress Street Boston, MA 02210 1969 | Chief Financial Officer and Principal Financial Officer (2009) and Senior Vice President (2019) | Senior Vice President and North America Head of Operations & Investor Services, Columbia Management Investment Advisers, LLC, since June 2023 (previously Senior Vice President and Head of Global Operations, March 2022 – June 2023, Vice President, Head of North America Operations, and Co-Head of Global Operations, June 2019 - February 2022 and Vice President – Accounting and Tax, May 2010 - May 2019); senior officer of Columbia Funds and affiliated funds, since 2002. Director, Ameriprise Trust Company, since June 2023. |
| Joseph Beranek 5890 Ameriprise Financial Center Minneapolis, MN 55474 1965 | Treasurer and Chief Accounting Officer (Principal Accounting Officer) (2019) and Principal Financial Officer (2020), CFST, CFST I, CFST II, CFVIT and CFVST II; Assistant Treasurer, CET I and CET II | Vice President – Mutual Fund Accounting and Financial Reporting, Columbia Management Investment Advisers, LLC, since December 2018 and March 2017, respectively. |
| Marybeth Pilat 290 Congress Street Boston, MA 02210 1968 | Treasurer and Chief Accounting Officer (Principal Accounting Officer) and Principal Financial Officer (2020) for CET I and CET II; Assistant Treasurer, CFST, CFST I, CFST II, CFVIT and CFVST II | Vice President – Product Pricing and Administration, Columbia Management Investment Advisers, LLC, since May 2017. |
| William F. Truscott 290 Congress Street Boston, MA 02210 1960 | Senior Vice President (2001) | Formerly, Trustee/Director of Columbia Funds Complex or legacy funds, November 2001 - January 1, 2021; Chief Executive Officer, Global Asset Management, Ameriprise Financial, Inc., since September 2012; Chairman of the Board and President, Columbia Management Investment Advisers, LLC, since July 2004 and February 2012, respectively; Chairman of the Board and Chief Executive Officer, Columbia Management Investment Distributors, Inc., since November 2008 and February 2012, respectively;Chairman of the Board and Director, Threadneedle Asset Management Holdings, Sàrl, since March 2013 and December 2008, respectively; senior executive of various entities affiliated with Columbia Threadneedle. |
| Christopher O. Petersen 5228 Ameriprise Financial Center Minneapolis, MN 55474 1970 | Senior Vice President and Assistant Secretary (2021) | Formerly, Trustee/Director of funds within the Columbia Funds Complex, July 1, 2020 - November 22, 2021; Senior Vice President and Assistant General Counsel, Ameriprise Financial, Inc., since September 2021 (previously Vice President and Lead Chief Counsel, January 2015 - September 2021); formerly, President and Principal Executive Officer of the Columbia Funds, 2015 - 2021; officer of Columbia Funds and affiliated funds, since 2007. |
| Columbia Large Cap Value Fund | Annual Report 2023 | 35 |
(Unaudited)
Fund officers (continued)
| Name, address and year of birth | Position and year first appointed to position for any Fund in the Columbia Funds Complex or a predecessor thereof | Principal occupation(s) during past five years |
| Thomas P. McGuire 290 Congress Street Boston, MA 02210 1972 | Senior Vice President and Chief Compliance Officer (2012) | Vice President – Asset Management Compliance, Ameriprise Financial, Inc., since May 2010; Chief Compliance Officer, Columbia Acorn/Wanger Funds, since December 2015; formerly, Chief Compliance Officer, Ameriprise Certificate Company, September 2010 – September 2020. |
| Ryan C. Larrenaga 290 Congress Street Boston, MA 02210 1970 | Senior Vice President (2017), Chief Legal Officer (2017), and Secretary (2015) | Vice President and Chief Counsel, Ameriprise Financial, Inc., since August 2018 (previously Vice President and Group Counsel, August 2011 - August 2018); Chief Legal Officer, Columbia Acorn/Wanger Funds, since September 2020; officer of Columbia Funds and affiliated funds, since 2005. |
| Michael E. DeFao 290 Congress Street Boston, MA 02210 1968 | Vice President (2011) and Assistant Secretary (2010) | Vice President and Chief Counsel, Ameriprise Financial, Inc., since May 2010; Vice President, Chief Legal Officer and Assistant Secretary, Columbia Management Investment Advisers, LLC, since October 2021 (previously Vice President and Assistant Secretary, May 2010 – September 2021). |
| Lyn Kephart-Strong 5903 Ameriprise Financial Center Minneapolis, MN 55474 1960 | Vice President (2015) | Vice President, Global Investment Operations Services, Columbia Management Investment Advisers, LLC, since 2010; Director (since January 2007) and President (since October 2014), Columbia Management Investment Services Corp.; Director (since December 2017) and President (since January 2017), Ameriprise Trust Company. |
| • | the Fund had sufficient liquidity to both meet redemptions and operate effectively on behalf of shareholders; |
| • | there were no material changes to the Program during the period; |
| • | the implementation of the Program was effective to manage the Fund’s liquidity risk; and |
| • | the Program operated adequately during the period. |
| 36 | Columbia Large Cap Value Fund | Annual Report 2023 |
columbiathreadneedleus.com/investor/. The Fund is distributed by Columbia Management Investment Distributors, Inc., member FINRA, and managed by Columbia Management Investment Advisers, LLC.

May 31, 2023

| 3 | |
| 5 | |
| 9 | |
| 10 | |
| 19 | |
| 20 | |
| 21 | |
| 22 | |
| 24 | |
| 34 | |
| 35 | |
| 35 | |
| 41 |
(Unaudited)

| Average annual total returns (%) (for the period ended May 31, 2023) | |||||
| Inception | 1 Year | 5 Years | 10 Years | ||
| Institutional Class* | 01/03/17 | -5.54 | 7.35 | 8.68 | |
| Institutional 3 Class* | 12/18/19 | -5.42 | 7.42 | 8.72 | |
| Russell 1000 Value Index | -4.55 | 6.78 | 8.42 | ||
| * | Returns shown for periods prior to the inception date of the Fund’s Institutional Class and Institutional 3 Class shares through January 2, 2017 include the returns of the Fund’s Class A shares and the returns shown for the Fund’s Institutional 3 Class shares also include the returns of the Fund’s Institutional Class shares from January 3, 2017 through December 17, 2019. Class A shares were offered prior to the Fund’s Institutional Class shares but have since been merged into the Fund’s Institutional Class shares. These returns are adjusted to reflect any higher class-related operating expenses of the newer share classes, as applicable. Please visit columbiathreadneedleus.com/investor/investment-products/mutual-funds/appended-performance for more information. |
| Multi-Manager Value Strategies Fund | Annual Report 2023 | 3 |
(Unaudited)

| Portfolio breakdown (%) (at May 31, 2023) | |
| Common Stocks | 98.1 |
| Money Market Funds | 1.9 |
| Total | 100.0 |
| Equity sector breakdown (%) (at May 31, 2023) | |
| Communication Services | 6.8 |
| Consumer Discretionary | 8.3 |
| Consumer Staples | 5.8 |
| Energy | 9.8 |
| Financials | 19.9 |
| Health Care | 15.8 |
| Industrials | 15.2 |
| Information Technology | 10.2 |
| Materials | 5.2 |
| Real Estate | 0.8 |
| Utilities | 2.2 |
| Total | 100.0 |
| 4 | Multi-Manager Value Strategies Fund | Annual Report 2023 |
(Unaudited)
| Multi-Manager Value Strategies Fund | Annual Report 2023 | 5 |
(Unaudited)
| • | Stock selection was the primary driver of relative underperformance during the 12-month period. Sector allocations were a secondary source of detraction versus the benchmark. |
| • | Selections within the information technology, communication services and financials sector weighed most on relative performance. |
| • | An underweight to the strong-performing information technology sector detracted, as did a relative overweight to the utilities sector, which returned negatively for the benchmark during the period. |
| • | Fund holdings that detracted most relative to the benchmark included an underweight to software company Microsoft Corp. and exposure to financial companies Bank of America Corp., PNC Financial Services Group, Inc., U.S. Bancorp and Northern Trust Corp. |
| • | Not owning NVIDIA, Apple and Meta Platforms also detracted. |
| • | Stock selection within the materials and energy sector contributed to relative performance during the period. |
| • | Underweighted allocations to the consumer discretionary and real estate sectors, relative to the benchmark, also aided performance during the period. |
| • | Individual fund holdings that contributed most to relative performance during the period included semiconductor companies Broadcom, Inc., KLA Corp. and Lam Research Corp., pharmaceutical giant Merck & Co., Inc. and electrical equipment company Eaton Corp. PLC. |
| • | Not owning Tesla and Pfizer during the period also contributed. |
| • | Underperformance in our portion of the Fund relative to the benchmark was primarily driven by security selection and an overweight position within the financials sector. |
| • | Our holdings in the financial sector came under intense pressure as the failures of SVB Bank and Signature Bank took place, starting on March 10th. While we did not hold either of those stocks in our portfolio at the time, we did hold First Republic Bank. We fully exited our position in First Republic Bank on March 14th, as we believed the risks of continuing to hold the stock outweighed the benefits. |
| • | Both security selection and the Fund’s underweight position within the communication services sector detracted from relative returns. |
| • | Security selection within the industrials sector detracted from the Fund’s relative return. |
| • | Individual securities that detracted most during the period included financial services companies Truist Financial Corp., First Republic Bank and SVB Financial Group. We exited our position in SVB Financial Group shares during the fourth quarter of 2022, before the bank’s failure. As noted above, we exited our position in First Republic Bank on March 14, 2023. |
| 6 | Multi-Manager Value Strategies Fund | Annual Report 2023 |
(Unaudited)
| • | Security selection within the health care, consumer staples and materials sectors contributed to relative returns in our portion of the Fund during the period. |
| • | An overweighted allocation to the industrials sector contributed. |
| • | Individual securities that contributed most to relative performance during the period included healthcare facilities operator HCA Healthcare, Inc., homebuilder NVR, Inc. and medical device manufacturer Stryker Corp. |
| • | The primary driver of underperformance in our portion of the Fund was a greater emphasis on mid-cap and value stocks during a period when larger cap stocks outperformed small and mid-cap stocks and the growth style outperformed the value style. |
| • | Security selection within the communication services, health care and information technology sectors detracted from relative results during the period. |
| • | An overweighted allocation to the communications services sector also weighed on relative results. |
| • | Individual securities that detracted most from our portion of the Fund on a relative basis were pharmaceutical company Pfizer, Inc., semiconductor company Intel Corp. and streaming services provider Netflix, Inc. |
| ○ | The Fund’s overweighting in Pfizer and Intel, both of which underperformed the benchmark during the period had a negative impact on performance versus the benchmark. |
| ○ | Not owning Netflix, which outperformed the benchmark considerably during the period weighed on our portion of the Fund relative to the benchmark. |
| • | An underweighted allocation in our portion of the Fund in real estate investment trusts (REITs) contributed to performance versus the benchmark during the period. The sector delivered negative performance for the benchmark during the period. Our strategy generally excludes REITs from purchase. |
| • | Our underweighted allocation to the utilities sector relative to the Russell 1000 Value Index also contributed to performance in our portion of the Fund relative to the benchmark. The sector returned negatively for both the benchmark and our portion of the Fund during the period. Our strategy generally excludes highly regulated utilities from purchase because while they tend to have low relative prices, their expected returns tend to be lower than those of value stocks. |
| • | The industrials sector was another area of contribution for our portion of the Fund. The sector was one of the stronger performing sectors of the benchmark during the period and our portion of the Fund outperformed the benchmark due to our overweighted allocation and security selection. |
| • | Individual securities that contributed most to performance in our portion of the Fund included home construction company D.R. Horton, Inc., energy giant Exxon Mobil Corp. and healthcare company Johnson & Johnson. |
| ○ | We held a larger weighting of both D.R. Horton and Exxon Mobil than the benchmark and the stock of both companies delivered strong gains during the period. |
| ○ | Not holding Johnson & Johnson in our portion of the Fund contributed. The stock, which is a constituent of the benchmark, delivered disappointing results during the period. |
| Multi-Manager Value Strategies Fund | Annual Report 2023 | 7 |
(Unaudited)
| 8 | Multi-Manager Value Strategies Fund | Annual Report 2023 |
(Unaudited)
| December 1, 2022 — May 31, 2023 | |||||||
| Account value at the beginning of the period ($) | Account value at the end of the period ($) | Expenses paid during the period ($) | Fund’s annualized expense ratio (%) | ||||
| Actual | Hypothetical | Actual | Hypothetical | Actual | Hypothetical | Actual | |
| Institutional Class | 1,000.00 | 1,000.00 | 935.20 | 1,021.34 | 3.47 | 3.63 | 0.72 |
| Institutional 3 Class | 1,000.00 | 1,000.00 | 935.90 | 1,021.89 | 2.94 | 3.07 | 0.61 |
| Multi-Manager Value Strategies Fund | Annual Report 2023 | 9 |
May 31, 2023
| Common Stocks 97.9% | ||
| Issuer | Shares | Value ($) |
| Communication Services 6.6% | ||
| Diversified Telecommunication Services 1.8% | ||
| AT&T, Inc. | 1,143,673 | 17,989,976 |
| GCI Liberty, Inc. Escrow(a),(b),(c) | 8,656 | 0 |
| Lumen Technologies, Inc. | 379,310 | 751,034 |
| Verizon Communications, Inc. | 1,572,880 | 56,041,715 |
| Total | 74,782,725 | |
| Entertainment 1.2% | ||
| Activision Blizzard, Inc.(b) | 72,433 | 5,809,126 |
| Electronic Arts, Inc. | 50,349 | 6,444,672 |
| Liberty Media Group LLC, Class A(b) | 2,700 | 170,505 |
| Liberty Media Group LLC, Class C(b) | 20,074 | 1,413,210 |
| Madison Square Garden Entertainment Corp.(b) | 476 | 16,703 |
| Sphere Entertainment Co.(b) | 476 | 11,362 |
| Take-Two Interactive Software, Inc.(b) | 1,889 | 260,172 |
| Walt Disney Co. (The)(b) | 358,909 | 31,569,636 |
| Warner Bros Discovery, Inc.(b) | 298,230 | 3,364,034 |
| Total | 49,059,420 | |
| Interactive Media & Services 1.5% | ||
| Alphabet, Inc., Class A(b) | 247,924 | 30,462,422 |
| Meta Platforms, Inc., Class A(b) | 130,352 | 34,506,781 |
| Total | 64,969,203 | |
| Media 1.8% | ||
| Charter Communications, Inc., Class A(b) | 46 | 15,003 |
| Comcast Corp., Class A | 1,527,550 | 60,109,092 |
| Fox Corp., Class A | 80,559 | 2,513,441 |
| Fox Corp., Class B | 64,046 | 1,870,784 |
| Interpublic Group of Companies, Inc. (The) | 128,172 | 4,766,717 |
| Liberty Broadband Corp., Class A(b) | 2,117 | 156,383 |
| Liberty Broadband Corp., Class C(b) | 15,540 | 1,151,514 |
| Liberty SiriusXM Group, Class A(b) | 12,333 | 345,077 |
| Liberty SiriusXM Group, Class C(b) | 27,937 | 781,118 |
| News Corp., Class A | 39,613 | 725,314 |
| News Corp., Class B | 21,231 | 392,349 |
| Omnicom Group, Inc. | 86 | 7,584 |
| Common Stocks (continued) | ||
| Issuer | Shares | Value ($) |
| Paramount Global, Class A | 3,915 | 68,787 |
| Paramount Global, Class B | 91,237 | 1,387,715 |
| Total | 74,290,878 | |
| Wireless Telecommunication Services 0.3% | ||
| T-Mobile US, Inc.(b) | 100,741 | 13,826,702 |
| Total Communication Services | 276,928,928 | |
| Consumer Discretionary 8.1% | ||
| Auto Components 1.1% | ||
| Aptiv PLC(b) | 19,638 | 1,729,715 |
| Autoliv, Inc. | 16,495 | 1,344,343 |
| BorgWarner, Inc. | 475,455 | 21,076,920 |
| Gentex Corp. | 35,624 | 935,486 |
| Lear Corp. | 166,735 | 20,451,715 |
| Total | 45,538,179 | |
| Automobiles 1.2% | ||
| Ford Motor Co. | 569,256 | 6,831,072 |
| General Motors Co. | 1,371,165 | 44,439,458 |
| Total | 51,270,530 | |
| Broadline Retail 0.9% | ||
| Amazon.com, Inc.(b) | 290,857 | 35,071,537 |
| eBay, Inc. | 1,039 | 44,199 |
| Total | 35,115,736 | |
| Distributors 0.1% | ||
| LKQ Corp. | 104,488 | 5,511,742 |
| Hotels, Restaurants & Leisure 0.7% | ||
| Aramark | 45,023 | 1,777,508 |
| Caesars Entertainment, Inc.(b) | 11,460 | 469,975 |
| Carnival Corp.(b) | 122,961 | 1,380,852 |
| Hyatt Hotels Corp., Class A | 5,864 | 630,263 |
| McDonald’s Corp. | 72,590 | 20,696,135 |
| MGM Resorts International | 82,729 | 3,250,422 |
| Royal Caribbean Cruises Ltd.(b) | 27,421 | 2,220,278 |
| Total | 30,425,433 | |
| 10 | Multi-Manager Value Strategies Fund | Annual Report 2023 |
May 31, 2023
| Common Stocks (continued) | ||
| Issuer | Shares | Value ($) |
| Household Durables 1.7% | ||
| D.R. Horton, Inc. | 126,147 | 13,477,545 |
| Garmin Ltd. | 36,640 | 3,779,416 |
| Lennar Corp., Class A | 89,215 | 9,556,711 |
| Lennar Corp., Class B | 6,679 | 631,499 |
| Mohawk Industries, Inc.(b) | 19,145 | 1,762,106 |
| NVR, Inc.(b) | 6,335 | 35,185,984 |
| PulteGroup, Inc. | 82,663 | 5,462,371 |
| Toll Brothers, Inc. | 1,937 | 131,135 |
| Whirlpool Corp. | 20,193 | 2,610,753 |
| Total | 72,597,520 | |
| Leisure Products 0.0% | ||
| Hasbro, Inc. | 3,197 | 189,742 |
| Specialty Retail 2.2% | ||
| Advance Auto Parts, Inc. | 15,667 | 1,141,967 |
| CarMax, Inc.(b) | 451,442 | 32,598,627 |
| Dick’s Sporting Goods, Inc. | 1,132 | 144,341 |
| Home Depot, Inc. (The) | 193,434 | 54,828,867 |
| Lithia Motors, Inc., Class A | 3,067 | 715,470 |
| Penske Automotive Group, Inc. | 8,726 | 1,206,108 |
| Total | 90,635,380 | |
| Textiles, Apparel & Luxury Goods 0.2% | ||
| Capri Holdings Ltd.(b) | 1,180 | 41,418 |
| NIKE, Inc., Class B | 45,516 | 4,791,014 |
| Ralph Lauren Corp. | 6,915 | 735,134 |
| Tapestry, Inc. | 23,496 | 940,310 |
| Total | 6,507,876 | |
| Total Consumer Discretionary | 337,792,138 | |
| Consumer Staples 5.7% | ||
| Beverages 1.9% | ||
| Coca-Cola Co. (The) | 297,668 | 17,758,873 |
| Constellation Brands, Inc., Class A | 15,365 | 3,733,234 |
| Keurig Dr. Pepper, Inc. | 44,191 | 1,375,224 |
| Molson Coors Beverage Co., Class B | 26,873 | 1,662,095 |
| PepsiCo, Inc. | 306,032 | 55,804,935 |
| Total | 80,334,361 | |
| Common Stocks (continued) | ||
| Issuer | Shares | Value ($) |
| Consumer Staples Distribution & Retail 1.3% | ||
| Casey’s General Stores, Inc. | 2,046 | 461,680 |
| Dollar Tree, Inc.(b) | 42,615 | 5,747,911 |
| Kroger Co. (The) | 230,112 | 10,430,977 |
| Performance Food Group, Inc.(b) | 7,104 | 392,780 |
| Target Corp. | 59,411 | 7,778,682 |
| U.S. Foods Holding Corp.(b) | 40,272 | 1,602,020 |
| Walgreens Boots Alliance, Inc. | 57,994 | 1,761,278 |
| Walmart, Inc. | 165,733 | 24,341,206 |
| Total | 52,516,534 | |
| Food Products 1.4% | ||
| Archer-Daniels-Midland Co. | 68,787 | 4,859,802 |
| Bunge Ltd. | 46,998 | 4,353,895 |
| Campbell Soup Co. | 7,258 | 366,892 |
| ConAgra Foods, Inc. | 67,427 | 2,351,179 |
| Darling Ingredients, Inc.(b) | 26,581 | 1,684,704 |
| General Mills, Inc. | 122,697 | 10,326,180 |
| Hormel Foods Corp. | 17,274 | 660,730 |
| Ingredion, Inc. | 349 | 36,505 |
| JM Smucker Co. (The) | 29,856 | 4,376,591 |
| Kraft Heinz Co. (The) | 43,388 | 1,658,289 |
| McCormick & Co., Inc. | 2,137 | 183,205 |
| Mondelez International, Inc., Class A | 318,857 | 23,407,292 |
| Pilgrim’s Pride Corp.(b) | 284 | 6,305 |
| Post Holdings, Inc.(b) | 1,436 | 122,003 |
| Tyson Foods, Inc., Class A | 93,436 | 4,731,599 |
| Total | 59,125,171 | |
| Household Products 0.7% | ||
| Procter & Gamble Co. (The) | 193,811 | 27,618,068 |
| Personal Care Products 0.0% | ||
| BellRing Brands, Inc.(b) | 8,344 | 305,557 |
| Coty, Inc., Class A(b) | 9,303 | 100,845 |
| Total | 406,402 | |
| Tobacco 0.4% | ||
| Philip Morris International, Inc. | 186,117 | 16,752,391 |
| Total Consumer Staples | 236,752,927 | |
| Multi-Manager Value Strategies Fund | Annual Report 2023 | 11 |
May 31, 2023
| Common Stocks (continued) | ||
| Issuer | Shares | Value ($) |
| Energy 9.6% | ||
| Energy Equipment & Services 0.3% | ||
| Baker Hughes Co. | 150,571 | 4,103,060 |
| Schlumberger NV | 116,178 | 4,975,904 |
| TechnipFMC PLC(b) | 48,738 | 640,417 |
| Total | 9,719,381 | |
| Oil, Gas & Consumable Fuels 9.3% | ||
| Chevron Corp. | 701,459 | 105,653,755 |
| ConocoPhillips Co. | 857,885 | 85,187,981 |
| Coterra Energy, Inc. | 71,228 | 1,656,051 |
| Devon Energy Corp. | 37,754 | 1,740,459 |
| Diamondback Energy, Inc. | 36,642 | 4,659,030 |
| EOG Resources, Inc. | 269,137 | 28,875,709 |
| Exxon Mobil Corp. | 978,535 | 99,986,706 |
| Hess Corp. | 30,975 | 3,923,603 |
| Kinder Morgan, Inc. | 245,204 | 3,950,236 |
| Marathon Oil Corp. | 145,822 | 3,231,416 |
| Marathon Petroleum Corp. | 81,850 | 8,586,884 |
| Occidental Petroleum Corp. | 77,029 | 4,441,492 |
| ONEOK, Inc. | 25,515 | 1,445,680 |
| Ovintiv, Inc. | 40,031 | 1,323,825 |
| Phillips 66 | 43,453 | 3,980,729 |
| Pioneer Natural Resources Co. | 29,886 | 5,960,464 |
| Targa Resources Corp. | 15,003 | 1,020,954 |
| Valero Energy Corp. | 160,591 | 17,189,661 |
| Vitesse Energy, Inc. | 1,560 | 36,020 |
| Williams Companies, Inc. (The) | 218,287 | 6,256,105 |
| Total | 389,106,760 | |
| Total Energy | 398,826,141 | |
| Financials 19.5% | ||
| Banks 7.3% | ||
| Bank of America Corp. | 2,684,250 | 74,595,308 |
| Citigroup, Inc. | 167,532 | 7,425,018 |
| Citizens Financial Group, Inc. | 56,240 | 1,449,867 |
| Comerica, Inc. | 17,390 | 627,779 |
| East West Bancorp, Inc. | 6,605 | 316,049 |
| Fifth Third Bancorp | 149,775 | 3,635,039 |
| First Citizens BancShares Inc., Class A | 558 | 695,938 |
| Common Stocks (continued) | ||
| Issuer | Shares | Value ($) |
| First Horizon Corp. | 7,895 | 81,397 |
| Huntington Bancshares, Inc. | 215,680 | 2,223,661 |
| JPMorgan Chase & Co. | 637,628 | 86,532,496 |
| KeyCorp | 232,694 | 2,173,362 |
| M&T Bank Corp. | 11,504 | 1,370,817 |
| PNC Financial Services Group, Inc. (The) | 139,081 | 16,109,752 |
| Prosperity Bancshares, Inc. | 622 | 35,566 |
| Regions Financial Corp. | 250,269 | 4,322,146 |
| Truist Financial Corp. | 1,397,991 | 42,596,786 |
| U.S. Bancorp | 161,929 | 4,841,677 |
| Webster Financial Corp. | 7,806 | 277,503 |
| Wells Fargo & Co. | 1,380,585 | 54,961,089 |
| Western Alliance Bancorp | 2,707 | 91,767 |
| Zions Bancorp | 31,400 | 856,906 |
| Total | 305,219,923 | |
| Capital Markets 3.9% | ||
| Bank of New York Mellon Corp. (The) | 163,162 | 6,559,112 |
| BlackRock, Inc. | 21,560 | 14,176,778 |
| Blackstone, Inc. | 48,982 | 4,194,819 |
| Carlyle Group, Inc. (The) | 18,356 | 503,138 |
| CME Group, Inc. | 77,521 | 13,856,879 |
| Franklin Resources, Inc. | 79,126 | 1,899,815 |
| Goldman Sachs Group, Inc. (The) | 43,469 | 14,079,609 |
| Intercontinental Exchange, Inc. | 4,801 | 508,666 |
| Invesco Ltd. | 14,455 | 207,863 |
| Jefferies Financial Group, Inc. | 13,256 | 398,608 |
| KKR & Co., Inc., Class A | 808,561 | 41,632,806 |
| Morgan Stanley | 335,657 | 27,443,316 |
| Nasdaq, Inc. | 467,010 | 25,849,004 |
| Northern Trust Corp. | 98,997 | 7,119,864 |
| State Street Corp. | 57,672 | 3,922,849 |
| Total | 162,353,126 | |
| Consumer Finance 0.4% | ||
| Ally Financial, Inc. | 104,256 | 2,780,507 |
| Capital One Financial Corp. | 83,614 | 8,713,415 |
| Discover Financial Services | 26,915 | 2,765,247 |
| Synchrony Financial | 118,486 | 3,668,327 |
| Total | 17,927,496 | |
| 12 | Multi-Manager Value Strategies Fund | Annual Report 2023 |
May 31, 2023
| Common Stocks (continued) | ||
| Issuer | Shares | Value ($) |
| Financial Services 2.7% | ||
| Apollo Global Management, Inc. | 5,640 | 377,034 |
| Berkshire Hathaway, Inc., Class B(b) | 181,578 | 58,301,064 |
| Block, Inc., Class A(b) | 7,474 | 451,355 |
| Equitable Holdings, Inc. | 219 | 5,374 |
| Fidelity National Information Services, Inc. | 74,366 | 4,058,153 |
| Fiserv, Inc.(b) | 47,012 | 5,274,276 |
| Global Payments, Inc. | 16,158 | 1,578,475 |
| PayPal Holdings, Inc.(b) | 8,120 | 503,359 |
| Visa, Inc., Class A | 178,551 | 39,465,128 |
| Total | 110,014,218 | |
| Insurance 5.2% | ||
| Aflac, Inc. | 93,752 | 6,019,815 |
| Allstate Corp. (The) | 277,986 | 30,147,582 |
| American Financial Group, Inc. | 1,243 | 139,552 |
| American International Group, Inc. | 1,346,745 | 71,148,538 |
| Arch Capital Group Ltd.(b) | 51,657 | 3,600,493 |
| Assurant, Inc. | 6,544 | 785,215 |
| Axis Capital Holdings Ltd. | 98 | 5,086 |
| Chubb Ltd. | 119,913 | 22,279,835 |
| CNA Financial Corp. | 3,492 | 128,715 |
| Everest Re Group Ltd. | 4,525 | 1,538,590 |
| F&G Annuities & Life, Inc. | 5,189 | 107,309 |
| Fidelity National Financial, Inc. | 76,310 | 2,605,223 |
| Globe Life, Inc. | 18,240 | 1,882,003 |
| Hartford Financial Services Group, Inc. (The) | 320,737 | 21,976,899 |
| Loews Corp. | 31,217 | 1,748,152 |
| Markel Group, Inc.(b) | 666 | 875,610 |
| Marsh & McLennan Companies, Inc. | 226,026 | 39,143,183 |
| MetLife, Inc. | 22,116 | 1,095,848 |
| Old Republic International Corp. | 28,849 | 706,512 |
| Principal Financial Group, Inc. | 54,334 | 3,556,704 |
| Prudential Financial, Inc. | 34,372 | 2,704,733 |
| Travelers Companies, Inc. (The) | 30,664 | 5,189,575 |
| Unum Group | 4,025 | 174,886 |
| WR Berkley Corp. | 6,168 | 343,434 |
| Total | 217,903,492 | |
| Total Financials | 813,418,255 | |
| Common Stocks (continued) | ||
| Issuer | Shares | Value ($) |
| Health Care 15.4% | ||
| Biotechnology 1.9% | ||
| AbbVie, Inc. | 307,625 | 42,439,945 |
| Biogen, Inc.(b) | 36,348 | 10,773,911 |
| Gilead Sciences, Inc. | 140,789 | 10,832,305 |
| Incyte Corp.(b) | 1,345 | 82,785 |
| Moderna, Inc.(b) | 46,165 | 5,895,732 |
| Regeneron Pharmaceuticals, Inc.(b) | 10,678 | 7,854,310 |
| United Therapeutics Corp.(b) | 5,345 | 1,121,060 |
| Vertex Pharmaceuticals, Inc.(b) | 1,230 | 397,991 |
| Total | 79,398,039 | |
| Health Care Equipment & Supplies 4.7% | ||
| Abbott Laboratories | 544,582 | 55,547,364 |
| Baxter International, Inc. | 60,715 | 2,472,315 |
| Becton Dickinson & Co. | 195,154 | 47,180,431 |
| Boston Scientific Corp.(b) | 10,897 | 560,978 |
| Cooper Companies, Inc. (The) | 1,616 | 600,392 |
| GE HealthCare Technologies, Inc. | 24,045 | 1,911,818 |
| Hologic, Inc.(b) | 34,009 | 2,682,970 |
| Medtronic PLC | 627,850 | 51,960,866 |
| STERIS PLC | 12,626 | 2,524,821 |
| Stryker Corp. | 97,911 | 26,982,313 |
| Teleflex, Inc. | 2,191 | 514,337 |
| Zimmer Biomet Holdings, Inc. | 25,473 | 3,243,732 |
| Total | 196,182,337 | |
| Health Care Providers & Services 4.4% | ||
| Centene Corp.(b) | 45,816 | 2,859,377 |
| Cigna Group (The) | 85,007 | 21,031,582 |
| CVS Health Corp. | 219,446 | 14,928,911 |
| Elevance Health, Inc. | 72,978 | 32,681,008 |
| HCA Healthcare, Inc. | 124,995 | 33,022,429 |
| Henry Schein, Inc.(b) | 38,024 | 2,809,974 |
| Humana, Inc. | 74,518 | 37,398,349 |
| Laboratory Corp. of America Holdings | 34,080 | 7,243,022 |
| McKesson Corp. | 5,309 | 2,074,970 |
| Quest Diagnostics, Inc. | 43,722 | 5,799,723 |
| Multi-Manager Value Strategies Fund | Annual Report 2023 | 13 |
May 31, 2023
| Common Stocks (continued) | ||
| Issuer | Shares | Value ($) |
| UnitedHealth Group, Inc. | 39,164 | 19,082,267 |
| Universal Health Services, Inc., Class B | 26,871 | 3,550,465 |
| Total | 182,482,077 | |
| Life Sciences Tools & Services 0.8% | ||
| Avantor, Inc.(b) | 12,892 | 257,067 |
| Bio-Rad Laboratories, Inc., Class A(b) | 2,694 | 1,005,805 |
| Charles River Laboratories International, Inc.(b) | 3,159 | 610,887 |
| Danaher Corp. | 73,479 | 16,872,248 |
| Revvity, Inc. | 15,737 | 1,814,791 |
| Thermo Fisher Scientific, Inc. | 29,539 | 15,019,400 |
| Total | 35,580,198 | |
| Pharmaceuticals 3.6% | ||
| Bristol-Myers Squibb Co. | 360,556 | 23,234,229 |
| Catalent, Inc.(b) | 6,266 | 233,283 |
| Eli Lilly & Co. | 9,628 | 4,134,841 |
| Jazz Pharmaceuticals PLC(b) | 12,786 | 1,638,654 |
| Johnson & Johnson | 194,056 | 30,090,323 |
| Merck & Co., Inc. | 221,661 | 24,473,591 |
| Pfizer, Inc. | 1,705,380 | 64,838,548 |
| Viatris, Inc. | 203,802 | 1,864,788 |
| Total | 150,508,257 | |
| Total Health Care | 644,150,908 | |
| Industrials 14.9% | ||
| Aerospace & Defense 2.0% | ||
| General Dynamics Corp. | 28,674 | 5,854,657 |
| Howmet Aerospace, Inc. | 60,241 | 2,575,303 |
| Huntington Ingalls Industries, Inc. | 5,304 | 1,068,119 |
| L3Harris Technologies, Inc. | 136,476 | 24,008,858 |
| Lockheed Martin Corp. | 31,495 | 13,984,095 |
| Northrop Grumman Corp. | 47,375 | 20,631,339 |
| Raytheon Technologies Corp. | 109,638 | 10,102,045 |
| Textron, Inc. | 54,703 | 3,384,475 |
| Total | 81,608,891 | |
| Air Freight & Logistics 0.8% | ||
| FedEx Corp. | 42,255 | 9,210,745 |
| GXO Logistics, Inc.(b) | 6,109 | 341,615 |
| United Parcel Service, Inc., Class B | 134,910 | 22,529,970 |
| Total | 32,082,330 | |
| Common Stocks (continued) | ||
| Issuer | Shares | Value ($) |
| Building Products 1.1% | ||
| Builders FirstSource, Inc.(b) | 47,462 | 5,503,219 |
| Carlisle Companies, Inc. | 8,175 | 1,736,697 |
| Carrier Global Corp. | 425,252 | 17,392,807 |
| Fortune Brands Innovations, Inc. | 29,167 | 1,763,145 |
| Johnson Controls International PLC | 93,788 | 5,599,143 |
| MasterBrand, Inc.(b) | 29,167 | 302,753 |
| Owens Corning | 26,387 | 2,805,730 |
| Trane Technologies PLC | 60,542 | 9,882,271 |
| Total | 44,985,765 | |
| Commercial Services & Supplies 1.2% | ||
| Republic Services, Inc. | 98,941 | 14,013,014 |
| Waste Management, Inc. | 216,866 | 35,114,943 |
| Total | 49,127,957 | |
| Construction & Engineering 0.2% | ||
| AECOM | 28,741 | 2,243,235 |
| Arcosa, Inc. | 165 | 10,834 |
| Quanta Services, Inc. | 40,721 | 7,231,235 |
| Total | 9,485,304 | |
| Electrical Equipment 1.1% | ||
| Acuity Brands, Inc. | 34 | 5,123 |
| AMETEK, Inc. | 12,783 | 1,854,430 |
| Eaton Corp. PLC | 133,871 | 23,547,909 |
| Emerson Electric Co. | 62 | 4,816 |
| Hubbell, Inc. | 644 | 181,904 |
| Regal Rexnord Corp. | 142,054 | 18,451,394 |
| Sensata Technologies Holding | 40,917 | 1,698,874 |
| Total | 45,744,450 | |
| Ground Transportation 1.5% | ||
| CSX Corp. | 206 | 6,318 |
| Knight-Swift Transportation Holdings, Inc. | 7,444 | 409,346 |
| Norfolk Southern Corp. | 40,737 | 8,480,629 |
| U-Haul Holding Co. | 5,483 | 289,338 |
| U-Haul Holding Co. | 48,155 | 2,229,095 |
| Union Pacific Corp. | 263,101 | 50,652,204 |
| Total | 62,066,930 | |
| 14 | Multi-Manager Value Strategies Fund | Annual Report 2023 |
May 31, 2023
| Common Stocks (continued) | ||
| Issuer | Shares | Value ($) |
| Industrial Conglomerates 1.2% | ||
| 3M Co. | 38,386 | 3,581,798 |
| General Electric Co. | 72,136 | 7,323,968 |
| Honeywell International, Inc. | 212,100 | 40,638,360 |
| Total | 51,544,126 | |
| Machinery 3.9% | ||
| AGCO Corp. | 21,789 | 2,402,891 |
| Caterpillar, Inc. | 165,384 | 34,027,758 |
| Cummins, Inc. | 81,122 | 16,582,148 |
| Deere & Co. | 70,650 | 24,443,487 |
| Dover Corp. | 13,860 | 1,847,954 |
| Fortive Corp. | 42,114 | 2,742,043 |
| Ingersoll Rand, Inc. | 48,131 | 2,727,102 |
| Middleby Corp. (The)(b) | 3,685 | 486,420 |
| Otis Worldwide Corp. | 54,838 | 4,360,169 |
| PACCAR, Inc. | 143,380 | 9,861,676 |
| Parker-Hannifin Corp. | 165,394 | 52,998,853 |
| Pentair PLC | 46,342 | 2,570,591 |
| Snap-On, Inc. | 18,739 | 4,663,388 |
| Stanley Black & Decker, Inc. | 19,711 | 1,477,734 |
| Westinghouse Air Brake Technologies Corp. | 22,138 | 2,050,643 |
| Total | 163,242,857 | |
| Passenger Airlines 0.2% | ||
| Delta Air Lines, Inc.(b) | 92,259 | 3,351,770 |
| Southwest Airlines Co. | 101,267 | 3,024,845 |
| United Airlines Holdings, Inc.(b) | 43,849 | 2,081,293 |
| Total | 8,457,908 | |
| Professional Services 1.3% | ||
| Automatic Data Processing, Inc. | 48,789 | 10,196,413 |
| Booz Allen Hamilton Holding Corp. | 51,779 | 5,207,932 |
| Concentrix Corp. | 5,159 | 452,444 |
| Jacobs Solutions, Inc. | 17,527 | 1,920,959 |
| Leidos Holdings, Inc. | 42,400 | 3,309,744 |
| SS&C Technologies Holdings, Inc. | 596,187 | 32,766,438 |
| TransUnion | 800 | 57,584 |
| Total | 53,911,514 | |
| Common Stocks (continued) | ||
| Issuer | Shares | Value ($) |
| Trading Companies & Distributors 0.4% | ||
| Ferguson PLC | 72,621 | 10,523,509 |
| United Rentals, Inc. | 18,295 | 6,106,688 |
| WESCO International, Inc. | 3,671 | 504,322 |
| Total | 17,134,519 | |
| Total Industrials | 619,392,551 | |
| Information Technology 10.0% | ||
| Communications Equipment 0.8% | ||
| Ciena Corp.(b) | 4,225 | 197,477 |
| Cisco Systems, Inc. | 606,316 | 30,115,716 |
| F5, Inc.(b) | 668 | 98,583 |
| Juniper Networks, Inc. | 44,440 | 1,349,643 |
| Total | 31,761,419 | |
| Electronic Equipment, Instruments & Components 0.5% | ||
| Arrow Electronics, Inc.(b) | 16,208 | 2,052,581 |
| Avnet, Inc. | 268 | 11,749 |
| Corning, Inc. | 255,656 | 7,876,761 |
| Flex Ltd.(b) | 81,764 | 2,075,988 |
| IPG Photonics Corp.(b) | 223 | 24,635 |
| Jabil, Inc. | 18,328 | 1,640,722 |
| TD SYNNEX Corp. | 5,786 | 517,153 |
| TE Connectivity Ltd. | 50,358 | 6,167,848 |
| Teledyne Technologies, Inc.(b) | 2,904 | 1,128,640 |
| Total | 21,496,077 | |
| IT Services 1.0% | ||
| Accenture PLC, Class A | 45,958 | 14,059,471 |
| Akamai Technologies, Inc.(b) | 15,026 | 1,384,195 |
| Amdocs Ltd. | 31,789 | 2,993,570 |
| Cognizant Technology Solutions Corp., Class A | 130,283 | 8,141,385 |
| DXC Technology Co.(b) | 12,300 | 307,869 |
| International Business Machines Corp. | 129,736 | 16,682,752 |
| Kyndryl Holdings, Inc.(b) | 3,420 | 42,955 |
| Twilio, Inc., Class A(b) | 1,217 | 84,728 |
| Total | 43,696,925 | |
| Multi-Manager Value Strategies Fund | Annual Report 2023 | 15 |
May 31, 2023
| Common Stocks (continued) | ||
| Issuer | Shares | Value ($) |
| Semiconductors & Semiconductor Equipment 5.5% | ||
| Advanced Micro Devices, Inc.(b) | 61,368 | 7,254,311 |
| Analog Devices, Inc. | 163,645 | 29,078,080 |
| Broadcom, Inc. | 48,983 | 39,576,305 |
| Intel Corp. | 539,243 | 16,953,800 |
| KLA Corp. | 50,485 | 22,364,350 |
| Lam Research Corp. | 40,913 | 25,231,047 |
| Marvell Technology, Inc. | 61,411 | 3,591,929 |
| Microchip Technology, Inc. | 192,856 | 14,514,343 |
| Micron Technology, Inc. | 197,755 | 13,486,891 |
| ON Semiconductor Corp.(b) | 8,747 | 731,249 |
| Qorvo, Inc.(b) | 33,803 | 3,287,680 |
| Skyworks Solutions, Inc. | 32,797 | 3,394,817 |
| Texas Instruments, Inc. | 281,085 | 48,875,060 |
| Total | 228,339,862 | |
| Software 2.0% | ||
| Black Knight, Inc.(b) | 2,911 | 168,198 |
| Dolby Laboratories, Inc., Class A | 659 | 54,387 |
| Microsoft Corp. | 225,585 | 74,079,858 |
| Roper Technologies, Inc. | 1,320 | 599,571 |
| Salesforce, Inc.(b) | 46,140 | 10,306,753 |
| Total | 85,208,767 | |
| Technology Hardware, Storage & Peripherals 0.2% | ||
| Hewlett Packard Enterprise Co. | 372,558 | 5,372,286 |
| HP, Inc. | 37,320 | 1,084,519 |
| Western Digital Corp.(b) | 56,583 | 2,191,460 |
| Total | 8,648,265 | |
| Total Information Technology | 419,151,315 | |
| Materials 5.1% | ||
| Chemicals 2.4% | ||
| Air Products & Chemicals, Inc. | 20,559 | 5,533,249 |
| Albemarle Corp. | 12,992 | 2,514,342 |
| Celanese Corp., Class A | 4,819 | 501,272 |
| CF Industries Holdings, Inc. | 42,812 | 2,633,366 |
| Corteva, Inc. | 46,966 | 2,512,211 |
| Dow, Inc. | 152,737 | 7,450,511 |
| DuPont de Nemours, Inc. | 47,436 | 3,187,225 |
| Eastman Chemical Co. | 46,835 | 3,610,510 |
| Common Stocks (continued) | ||
| Issuer | Shares | Value ($) |
| International Flavors & Fragrances, Inc. | 23,348 | 1,804,567 |
| Linde PLC | 88,263 | 31,215,093 |
| LyondellBasell Industries NV, Class A | 98,970 | 8,465,894 |
| Mosaic Co. (The) | 78,129 | 2,497,003 |
| PPG Industries, Inc. | 90,924 | 11,937,412 |
| Sherwin-Williams Co. (The) | 66,752 | 15,204,771 |
| Westlake Corp. | 19,870 | 2,065,486 |
| Total | 101,132,912 | |
| Construction Materials 0.6% | ||
| Martin Marietta Materials, Inc. | 52,374 | 20,846,947 |
| Vulcan Materials Co. | 17,470 | 3,415,385 |
| Total | 24,262,332 | |
| Containers & Packaging 0.4% | ||
| Amcor PLC | 82,434 | 794,664 |
| Avery Dennison Corp. | 41,877 | 6,747,641 |
| International Paper Co. | 119,659 | 3,522,761 |
| Packaging Corp. of America | 47,346 | 5,872,324 |
| Sonoco Products Co. | 212 | 12,690 |
| WestRock Co. | 37,102 | 1,039,227 |
| Total | 17,989,307 | |
| Metals & Mining 1.7% | ||
| Alcoa Corp. | 30,120 | 955,406 |
| Arconic Corp.(b) | 1,340 | 38,739 |
| Cleveland-Cliffs, Inc.(b) | 63,354 | 879,354 |
| Freeport-McMoRan, Inc. | 1,005,551 | 34,530,621 |
| Newmont Corp. | 172,553 | 6,997,024 |
| Nucor Corp. | 100,960 | 13,332,778 |
| Reliance Steel & Aluminum Co. | 20,889 | 4,902,231 |
| Royal Gold, Inc. | 389 | 48,174 |
| Steel Dynamics, Inc. | 71,770 | 6,595,663 |
| Total | 68,279,990 | |
| Paper & Forest Products 0.0% | ||
| Sylvamo Corp. | 134 | 5,282 |
| Total Materials | 211,669,823 | |
| 16 | Multi-Manager Value Strategies Fund | Annual Report 2023 |
May 31, 2023
| Common Stocks (continued) | ||
| Issuer | Shares | Value ($) |
| Real Estate 0.8% | ||
| Real Estate Management & Development 0.2% | ||
| CBRE Group, Inc., Class A(b) | 77,682 | 5,819,935 |
| Howard Hughes Corporation(b) | 259 | 19,314 |
| Jones Lang LaSalle, Inc.(b) | 12,564 | 1,763,232 |
| Zillow Group, Inc., Class C(b) | 10,447 | 476,488 |
| Total | 8,078,969 | |
| Residential REITs 0.1% | ||
| AvalonBay Communities, Inc. | 35,929 | 6,250,927 |
| Specialized REITs 0.5% | ||
| Crown Castle, Inc. | 48,740 | 5,517,856 |
| SBA Communications Corp. | 62,871 | 13,943,530 |
| Total | 19,461,386 | |
| Total Real Estate | 33,791,282 | |
| Utilities 2.2% | ||
| Electric Utilities 1.2% | ||
| American Electric Power Co., Inc. | 108,300 | 9,001,896 |
| Entergy Corp. | 81,736 | 8,026,475 |
| Eversource Energy | 77,411 | 5,359,164 |
| NextEra Energy, Inc. | 146,538 | 10,764,681 |
| NRG Energy, Inc. | 42,608 | 1,439,724 |
| Southern Co. (The) | 92,694 | 6,465,407 |
| Xcel Energy, Inc. | 113,751 | 7,426,803 |
| Total | 48,484,150 | |
| Common Stocks (continued) | ||
| Issuer | Shares | Value ($) |
| Independent Power and Renewable Electricity Producers 0.0% | ||
| Vistra Corp. | 63,624 | 1,525,067 |
| Multi-Utilities 1.0% | ||
| Ameren Corp. | 86,082 | 6,978,668 |
| CMS Energy Corp. | 94,225 | 5,463,165 |
| Dominion Energy, Inc. | 322,295 | 16,204,993 |
| DTE Energy Co. | 41,488 | 4,464,109 |
| WEC Energy Group, Inc. | 87,935 | 7,681,122 |
| Total | 40,792,057 | |
| Total Utilities | 90,801,274 | |
| Total Common Stocks (Cost $3,590,627,320) | 4,082,675,542 | |
| Money Market Funds 1.9% | ||
| Shares | Value ($) | |
| Columbia Short-Term Cash Fund, 5.241%(d),(e) | 79,075,422 | 79,035,885 |
| Total Money Market Funds (Cost $79,036,507) | 79,035,885 | |
| Total Investments in Securities (Cost: $3,669,663,827) | 4,161,711,427 | |
| Other Assets & Liabilities, Net | 9,768,077 | |
| Net Assets | 4,171,479,504 | |
| (a) | Represents fair value as determined in good faith under procedures approved by the Board of Trustees. At May 31, 2023, the total value of these securities amounted to $0, which represents less than 0.01% of total net assets. |
| (b) | Non-income producing investment. |
| (c) | Valuation based on significant unobservable inputs. |
| (d) | The rate shown is the seven-day current annualized yield at May 31, 2023. |
| (e) | As defined in the Investment Company Act of 1940, as amended, an affiliated company is one in which the Fund owns 5% or more of the company’s outstanding voting securities, or a company which is under common ownership or control with the Fund. The value of the holdings and transactions in these affiliated companies during the year ended May 31, 2023 are as follows: |
| Affiliated issuers | Beginning of period($) | Purchases($) | Sales($) | Net change in unrealized appreciation (depreciation)($) | End of period($) | Realized gain (loss)($) | Dividends($) | End of period shares |
| Columbia Short-Term Cash Fund, 5.241% | ||||||||
| 41,578,354 | 532,152,794 | (494,694,641) | (622) | 79,035,885 | 6,581 | 2,157,925 | 79,075,422 | |
| Multi-Manager Value Strategies Fund | Annual Report 2023 | 17 |
May 31, 2023
| ■ | Level 1 — Valuations based on quoted prices for investments in active markets that the Fund has the ability to access at the measurement date. Valuation adjustments are not applied to Level 1 investments. |
| ■ | Level 2 — Valuations based on other significant observable inputs (including quoted prices for similar securities, interest rates, prepayment speeds, credit risks, etc.). |
| ■ | Level 3 — Valuations based on significant unobservable inputs (including the Fund’s own assumptions and judgment in determining the fair value of investments). |
| Level 1 ($) | Level 2 ($) | Level 3 ($) | Total ($) | |
| Investments in Securities | ||||
| Common Stocks | ||||
| Communication Services | 276,928,928 | — | 0* | 276,928,928 |
| Consumer Discretionary | 337,792,138 | — | — | 337,792,138 |
| Consumer Staples | 236,752,927 | — | — | 236,752,927 |
| Energy | 398,826,141 | — | — | 398,826,141 |
| Financials | 813,418,255 | — | — | 813,418,255 |
| Health Care | 644,150,908 | — | — | 644,150,908 |
| Industrials | 619,392,551 | — | — | 619,392,551 |
| Information Technology | 419,151,315 | — | — | 419,151,315 |
| Materials | 211,669,823 | — | — | 211,669,823 |
| Real Estate | 33,791,282 | — | — | 33,791,282 |
| Utilities | 90,801,274 | — | — | 90,801,274 |
| Total Common Stocks | 4,082,675,542 | — | 0* | 4,082,675,542 |
| Money Market Funds | 79,035,885 | — | — | 79,035,885 |
| Total Investments in Securities | 4,161,711,427 | — | 0* | 4,161,711,427 |
| * | Rounds to zero. |
| 18 | Multi-Manager Value Strategies Fund | Annual Report 2023 |
May 31, 2023
| Assets | |
| Investments in securities, at value | |
| Unaffiliated issuers (cost $3,590,627,320) | $4,082,675,542 |
| Affiliated issuers (cost $79,036,507) | 79,035,885 |
| Receivable for: | |
| Investments sold | 1,188,587 |
| Capital shares sold | 4,372,690 |
| Dividends | 10,116,628 |
| Foreign tax reclaims | 113,968 |
| Prepaid expenses | 20,793 |
| Total assets | 4,177,524,093 |
| Liabilities | |
| Payable for: | |
| Investments purchased | 1,360,328 |
| Capital shares purchased | 3,937,802 |
| Management services fees | 69,134 |
| Transfer agent fees | 371,554 |
| Compensation of board members | 173,943 |
| Other expenses | 131,828 |
| Total liabilities | 6,044,589 |
| Net assets applicable to outstanding capital stock | $4,171,479,504 |
| Represented by | |
| Paid in capital | 3,537,668,095 |
| Total distributable earnings (loss) | 633,811,409 |
| Total - representing net assets applicable to outstanding capital stock | $4,171,479,504 |
| Institutional Class | |
| Net assets | $4,171,477,089 |
| Shares outstanding | 299,036,806 |
| Net asset value per share | $13.95 |
| Institutional 3 Class | |
| Net assets | $2,415 |
| Shares outstanding | 173 |
| Net asset value per share(a) | $13.98 |
| (a) | Net asset value per share rounds to this amount due to fractional shares outstanding. |
| Multi-Manager Value Strategies Fund | Annual Report 2023 | 19 |
Year Ended May 31, 2023
| Net investment income | |
| Income: | |
| Dividends — unaffiliated issuers | $99,759,095 |
| Dividends — affiliated issuers | 2,157,925 |
| European Union tax reclaim | 133,632 |
| Foreign taxes withheld | (50) |
| Total income | 102,050,602 |
| Expenses: | |
| Management services fees | 25,362,399 |
| Transfer agent fees | |
| Institutional Class | 4,394,377 |
| Institutional 3 Class | 1 |
| Compensation of board members | 85,715 |
| Custodian fees | 38,855 |
| Printing and postage fees | 308,249 |
| Registration fees | 91,562 |
| Accounting services fees | 30,749 |
| Legal fees | 68,789 |
| Interest on interfund lending | 99 |
| Compensation of chief compliance officer | 826 |
| Other | 70,984 |
| Total expenses | 30,452,605 |
| Net investment income | 71,597,997 |
| Realized and unrealized gain (loss) — net | |
| Net realized gain (loss) on: | |
| Investments — unaffiliated issuers | 196,702,211 |
| Investments — affiliated issuers | 6,581 |
| Foreign currency translations | 1,075 |
| Futures contracts | (83,887) |
| Net realized gain | 196,625,980 |
| Net change in unrealized appreciation (depreciation) on: | |
| Investments — unaffiliated issuers | (506,495,432) |
| Investments — affiliated issuers | (622) |
| Foreign currency translations | (495) |
| Net change in unrealized appreciation (depreciation) | (506,496,549) |
| Net realized and unrealized loss | (309,870,569) |
| Net decrease in net assets resulting from operations | $(238,272,572) |
| 20 | Multi-Manager Value Strategies Fund | Annual Report 2023 |
| Year Ended May 31, 2023 | Year Ended May 31, 2022 | |
| Operations | ||
| Net investment income | $71,597,997 | $68,222,560 |
| Net realized gain | 196,625,980 | 476,060,691 |
| Net change in unrealized appreciation (depreciation) | (506,496,549) | (497,624,233) |
| Net increase (decrease) in net assets resulting from operations | (238,272,572) | 46,659,018 |
| Distributions to shareholders | ||
| Net investment income and net realized gains | ||
| Institutional Class | (459,910,497) | (408,044,013) |
| Institutional 3 Class | (297) | (244) |
| Total distributions to shareholders | (459,910,794) | (408,044,257) |
| Increase (decrease) in net assets from capital stock activity | 280,464,948 | (105,137,297) |
| Total decrease in net assets | (417,718,418) | (466,522,536) |
| Net assets at beginning of year | 4,589,197,922 | 5,055,720,458 |
| Net assets at end of year | $4,171,479,504 | $4,589,197,922 |
| Year Ended | Year Ended | |||
| May 31, 2023 | May 31, 2022 | |||
| Shares | Dollars ($) | Shares | Dollars ($) | |
| Capital stock activity | ||||
| Institutional Class | ||||
| Subscriptions | 60,652,201 | 897,414,259 | 54,031,716 | 935,240,677 |
| Distributions reinvested | 31,671,423 | 459,910,497 | 23,954,125 | 408,044,013 |
| Redemptions | (71,142,459) | (1,076,859,808) | (86,176,500) | (1,448,421,987) |
| Net increase (decrease) | 21,181,165 | 280,464,948 | (8,190,659) | (105,137,297) |
| Total net increase (decrease) | 21,181,165 | 280,464,948 | (8,190,659) | (105,137,297) |
| Multi-Manager Value Strategies Fund | Annual Report 2023 | 21 |
| Net asset value, beginning of period | Net investment income | Net realized and unrealized gain (loss) | Total from investment operations | Distributions from net investment income | Distributions from net realized gains | Total distributions to shareholders | |
| Institutional Class | |||||||
| Year Ended 5/31/2023 | $16.52 | 0.25 | (1.12) | (0.87) | (0.25) | (1.45) | (1.70) |
| Year Ended 5/31/2022 | $17.67 | 0.23 | 0.02(d) | 0.25 | (0.22) | (1.18) | (1.40) |
| Year Ended 5/31/2021 | $12.48 | 0.21 | 5.34 | 5.55 | (0.21) | (0.15) | (0.36) |
| Year Ended 5/31/2020 | $12.83 | 0.24 | (0.06)(d) | 0.18 | (0.23) | (0.30) | (0.53) |
| Year Ended 5/31/2019 | $13.64 | 0.21 | (0.02)(d) | 0.19 | (0.20) | (0.80) | (1.00) |
| Institutional 3 Class | |||||||
| Year Ended 5/31/2023 | $16.55 | 0.27 | (1.12) | (0.85) | (0.27) | (1.45) | (1.72) |
| Year Ended 5/31/2022 | $17.69 | 0.24 | 0.03(d) | 0.27 | (0.23) | (1.18) | (1.41) |
| Year Ended 5/31/2021 | $12.50 | 0.22 | 5.34 | 5.56 | (0.22) | (0.15) | (0.37) |
| Year Ended 5/31/2020(e) | $14.47 | 0.11 | (2.02)(d) | (1.91) | (0.06) | — | (0.06) |
| Notes to Financial Highlights | |
| (a) | In addition to the fees and expenses that the Fund bears directly, the Fund indirectly bears a pro rata share of the fees and expenses of any other funds in which it invests. Such indirect expenses are not included in the Fund’s reported expense ratios. |
| (b) | Total net expenses include the impact of certain fee waivers/expense reimbursements made by the Investment Manager and certain of its affiliates, if applicable. |
| (c) | Ratios include interfund lending expense which is less than 0.01%. |
| (d) | Calculation of the net gain (loss) per share (both realized and unrealized) does not correlate to the aggregate realized and unrealized gain (loss) presented in the Statement of Operations due to the timing of subscriptions and redemptions of Fund shares in relation to fluctuations in the market value of the portfolio. |
| (e) | Institutional 3 Class shares commenced operations on December 18, 2019. Per share data and total return reflect activity from that date. |
| 22 | Multi-Manager Value Strategies Fund | Annual Report 2023 |
| Net asset value, end of period | Total return | Total gross expense ratio to average net assets(a) | Total net expense ratio to average net assets(a),(b) | Net investment income ratio to average net assets | Portfolio turnover | Net assets, end of period (000’s) | |
| Institutional Class | |||||||
| Year Ended 5/31/2023 | $13.95 | (5.54%) | 0.72%(c) | 0.72%(c) | 1.69% | 23% | $4,171,477 |
| Year Ended 5/31/2022 | $16.52 | 1.22% | 0.69%(c) | 0.69%(c) | 1.31% | 22% | $4,589,195 |
| Year Ended 5/31/2021 | $17.67 | 45.16% | 0.71%(c) | 0.71%(c) | 1.41% | 29% | $5,055,717 |
| Year Ended 5/31/2020 | $12.48 | 1.07% | 0.76% | 0.74% | 1.78% | 19% | $3,589,152 |
| Year Ended 5/31/2019 | $12.83 | 1.62% | 0.77% | 0.77% | 1.59% | 20% | $2,849,432 |
| Institutional 3 Class | |||||||
| Year Ended 5/31/2023 | $13.98 | (5.42%) | 0.61%(c) | 0.61%(c) | 1.79% | 23% | $2 |
| Year Ended 5/31/2022 | $16.55 | 1.35% | 0.62%(c) | 0.62%(c) | 1.37% | 22% | $3 |
| Year Ended 5/31/2021 | $17.69 | 45.20% | 0.63%(c) | 0.63%(c) | 1.49% | 29% | $3 |
| Year Ended 5/31/2020(e) | $12.50 | (13.14%) | 0.66% | 0.64% | 1.84% | 19% | $2 |
| Multi-Manager Value Strategies Fund | Annual Report 2023 | 23 |
May 31, 2023
| 24 | Multi-Manager Value Strategies Fund | Annual Report 2023 |
May 31, 2023
| Multi-Manager Value Strategies Fund | Annual Report 2023 | 25 |
May 31, 2023
| 26 | Multi-Manager Value Strategies Fund | Annual Report 2023 |
May 31, 2023
| Amount of realized gain (loss) on derivatives recognized in income | |
| Risk exposure category | Futures contracts ($) |
| Equity risk | (83,887) |
| Derivative instrument | Average notional amounts ($)* |
| Futures contracts — long | 507,731 |
| * | Based on the ending daily outstanding amounts for the year ended May 31, 2023. |
| Multi-Manager Value Strategies Fund | Annual Report 2023 | 27 |
May 31, 2023
| 28 | Multi-Manager Value Strategies Fund | Annual Report 2023 |
May 31, 2023
| Multi-Manager Value Strategies Fund | Annual Report 2023 | 29 |
May 31, 2023
| Effective rate (%) | |
| Institutional Class | 0.10 |
| Institutional 3 Class | 0.02 |
| October 1, 2022 through September 30, 2023 | Prior to October 1, 2022 | |
| Institutional Class | 0.74% | 0.74% |
| Institutional 3 Class | 0.67 | 0.68 |
| 30 | Multi-Manager Value Strategies Fund | Annual Report 2023 |
May 31, 2023
| Undistributed net investment income ($) | Accumulated net realized gain ($) | Paid in capital ($) |
| (1,100,443) | (14,063,557) | 15,164,000 |
| Year Ended May 31, 2023 | Year Ended May 31, 2022 | ||||
| Ordinary income ($) | Long-term capital gains ($) | Total ($) | Ordinary income ($) | Long-term capital gains ($) | Total ($) |
| 78,103,251 | 381,807,543 | 459,910,794 | 100,200,562 | 307,843,695 | 408,044,257 |
| Undistributed ordinary income ($) | Undistributed long-term capital gains ($) | Capital loss carryforwards ($) | Net unrealized appreciation ($) |
| 11,729,788 | 151,105,582 | — | 471,149,930 |
| Federal tax cost ($) | Gross unrealized appreciation ($) | Gross unrealized (depreciation) ($) | Net unrealized appreciation ($) |
| 3,690,561,497 | 686,962,703 | (215,812,773) | 471,149,930 |
| Multi-Manager Value Strategies Fund | Annual Report 2023 | 31 |
May 31, 2023
| Borrower or lender | Average loan balance ($) | Weighted average interest rate (%) | Number of days with outstanding loans |
| Borrower | 700,000 | 5.10 | 1 |
| 32 | Multi-Manager Value Strategies Fund | Annual Report 2023 |
May 31, 2023
| Multi-Manager Value Strategies Fund | Annual Report 2023 | 33 |
| 34 | Multi-Manager Value Strategies Fund | Annual Report 2023 |
| Qualified dividend income | Dividends received deduction | Capital gain dividend |
| 100.00% | 100.00% | $216,606,728 |
| Name, address, year of birth | Position held with the Columbia Funds and length of service | Principal occupation(s) during past five years and other relevant professional experience | Number of Funds in the Columbia Funds Complex* overseen | Other directorships held by Trustee during the past five years and other relevant Board experience |
| George S. Batejan c/o Columbia Management Investment Advisers, LLC 290 Congress Street Boston, MA 02210 1954 | Trustee since 2017 | Executive Vice President, Global Head of Technology and Operations, Janus Capital Group, Inc., 2010-2016 | 174 | Former Chairman of the Board, NICSA (National Investment Company Services Association) (Executive Committee, Nominating Committee and Governance Committee), 2014-2016; former Director, Intech Investment Management, 2011-2016; former Board Member, Metro Denver Chamber of Commerce, 2015-2016; former Advisory Board Member, University of Colorado Business School, 2015-2018; former Board Member, Chase Bank International, 1993-1994 |
| Multi-Manager Value Strategies Fund | Annual Report 2023 | 35 |
(Unaudited)
Independent trustees (continued)
| Name, address, year of birth | Position held with the Columbia Funds and length of service | Principal occupation(s) during past five years and other relevant professional experience | Number of Funds in the Columbia Funds Complex* overseen | Other directorships held by Trustee during the past five years and other relevant Board experience |
| Kathleen Blatz c/o Columbia Management Investment Advisers, LLC 290 Congress Street Boston, MA 02210 1954 | Trustee since 2006 | Attorney, specializing in arbitration and mediation; Chief Justice, Minnesota Supreme Court, 1998-2006; Associate Justice, Minnesota Supreme Court, 1996-1998; Fourth Judicial District Court Judge, Hennepin County, 1994-1996; Attorney in private practice and public service, 1984-1993; State Representative, Minnesota House of Representatives, 1979-1993, which included service on the Tax and Financial Institutions and Insurance Committees; Member and Interim Chair, Minnesota Sports Facilities Authority, January-July 2017; Interim President and Chief Executive Officer, Blue Cross and Blue Shield of Minnesota (health care insurance), February-July 2018, April-October 2021 | 174 | Former Trustee, Blue Cross and Blue Shield of Minnesota, 2009-2021 (Chair of the Business Development Committee, 2014-2017; Chair of the Governance Committee, 2017-2019); former Member and Chair of the Board, Minnesota Sports Facilities Authority, January 2017-July 2017; former Director, Robina Foundation, 2009-2020 (Chair, 2014-2020); Director, Richard M. Schulze Family Foundation, since 2021 |
| Pamela G. Carlton c/o Columbia Management Investment Advisers, LLC 290 Congress Street Boston, MA 02210 1954 | Chair since 2023; Trustee since 2007 | President, Springboard — Partners in Cross Cultural Leadership (consulting company), since 2003; Managing Director of US Equity Research, JP Morgan Chase, 1999-2003; Director of US Equity Research, Chase Asset Management, 1996-1999; Co-Director Latin America Research, 1993-1996, COO Global Research, 1992-1996, Co-Director of US Research, 1991-1992, Investment Banker, 1982-1991, Morgan Stanley; Attorney, Cleary Gottlieb Steen & Hamilton LLP, 1980-1982 | 174 | Trustee, New York Presbyterian Hospital Board, since 1996; Director, DR Bank (Audit Committee) since 2017; Director, Evercore Inc. (Audit Committee, Nominating and Governance Committee), since 2019; Director, Apollo Commercial Real Estate Finance, Inc. (Chair, Nominating and Governance Committee) (financial services), since 2021; the Governing Council of the Independent Directors Council (IDC), since 2021 |
| Janet Langford Carrig c/o Columbia Management Investment Advisers, LLC 290 Congress Street Boston, MA 02210 1957 | Trustee since 1996 | Senior Vice President, General Counsel and Corporate Secretary, ConocoPhillips (independent energy company), September 2007-October 2018 | 174 | Director, EQT Corporation (natural gas producer), since 2019; former Director, Whiting Petroleum Corporation (independent oil and gas company), 2020-2022 |
| J. Kevin Connaughton c/o Columbia Management Investment Advisers, LLC 290 Congress Street Boston, MA 02210 1964 | Trustee since 2020 | CEO and President, RhodeWay Financial (non-profit financial planning firm), since December 2022; Member, FINRA National Adjudicatory Council, since January 2020; Adjunct Professor of Finance, Bentley University since January 2018; Consultant to Independent Trustees of CFVIT and CFST I from March 2016 to June 2020 with respect to CFVIT and to December 2020 with respect to CFST I; Managing Director and General Manager of Mutual Fund Products, Columbia Management Investment Advisers, LLC, May 2010-February 2015; President, Columbia Funds, 2008-2015; and senior officer of Columbia Funds and affiliated funds, 2003-2015 | 172 | Former Director, The Autism Project, March 2015-December 2021; former Member of the Investment Committee, St. Michael’s College, November 2015-February 2020; former Trustee, St. Michael’s College, June 2017-September 2019; former Trustee, New Century Portfolios (former mutual fund complex), January 2015-December 2017 |
| 36 | Multi-Manager Value Strategies Fund | Annual Report 2023 |
(Unaudited)
Independent trustees (continued)
| Name, address, year of birth | Position held with the Columbia Funds and length of service | Principal occupation(s) during past five years and other relevant professional experience | Number of Funds in the Columbia Funds Complex* overseen | Other directorships held by Trustee during the past five years and other relevant Board experience |
| Olive M. Darragh c/o Columbia Management Investment Advisers, LLC 290 Congress Street Boston, MA 02210 1962 | Trustee since 2020 | Managing Director of Darragh Inc. (strategy and talent management consulting firm), since 2010; Founder and CEO, Zolio, Inc. (investment management talent identification platform), since 2004; Consultant to Independent Trustees of CFVIT and CFST I from June 2019 to June 2020 with respect to CFVIT and to December 2020 with respect to CFST I; Partner, Tudor Investments, 2004-2010; Senior Partner, McKinsey & Company (consulting), 1990-2004; Touche Ross CPA, 1985-1988 | 172 | Treasurer, Edinburgh University US Trust Board, since January 2023; Member, HBS Community Action Partners Board, since September 2022; former Director, University of Edinburgh Business School (Member of US Board), 2004-2019; former Director, Boston Public Library Foundation, 2008-2017 |
| Patricia M. Flynn c/o Columbia Management Investment Advisers, LLC 290 Congress Street Boston, MA 02210 1950 | Trustee since 2004 | Professor of Economics and Management, Bentley University, since 2002; Dean, McCallum Graduate School of Business, Bentley University, 1992-2002 | 174 | Former Trustee, MA Taxpayers Foundation, 1997-2022; former Director, The MA Business Roundtable, 2003-2019; former Chairperson, Innovation Index Advisory Committee, MA Technology Collaborative, 1997-2020 |
| Brian J. Gallagher c/o Columbia Management Investment Advisers, LLC 290 Congress Street Boston, MA 02210 1954 | Trustee since 2017 | Retired; Partner with Deloitte & Touche LLP and its predecessors, 1977-2016 | 174 | Trustee, Catholic Schools Foundation, since 2004 |
| Douglas A. Hacker c/o Columbia Management Investment Advisers, LLC 290 Congress Street Boston, MA 02210 1955 | Trustee since 1996 | Independent business executive, since May 2006; Executive Vice President – Strategy of United Airlines, December 2002 - May 2006; President of UAL Loyalty Services (airline marketing company), September 2001-December 2002; Executive Vice President and Chief Financial Officer of United Airlines, July 1999-September 2001 | 174 | Director, SpartanNash Company since November 2013 (Chair of the Board, since May 2021) (food distributor); Director, Aircastle Limited (Chair of Audit Committee) (aircraft leasing), since August 2006; former Director, Nash Finch Company (food distributor), 2005-2013; former Director, SeaCube Container Leasing Ltd. (container leasing), 2010-2013; and former Director, Travelport Worldwide Limited (travel information technology), 2014-2019 |
| Nancy T. Lukitsh c/o Columbia Management Investment Advisers, LLC 290 Congress Street Boston, MA 02210 1956 | Trustee since 2011 | Senior Vice President, Partner and Director of Marketing, Wellington Management Company, LLP (investment adviser), 1997-2010; Chair, Wellington Management Portfolios (commingled non-U.S. investment pools), 2007-2010; Director, Wellington Trust Company, NA and other Wellington affiliates, 1997-2010 | 172 | None |
| Multi-Manager Value Strategies Fund | Annual Report 2023 | 37 |
(Unaudited)
Independent trustees (continued)
| Name, address, year of birth | Position held with the Columbia Funds and length of service | Principal occupation(s) during past five years and other relevant professional experience | Number of Funds in the Columbia Funds Complex* overseen | Other directorships held by Trustee during the past five years and other relevant Board experience |
| David M. Moffett c/o Columbia Management Investment Advisers, LLC 290 Congress Street Boston, MA 02210 1952 | Trustee since 2011 | Retired; former Chief Executive Officer of Freddie Mac and Chief Financial Officer of U.S. Bank | 172 | Director, CSX Corporation (transportation suppliers); Director, PayPal Holdings Inc. (payment and data processing services); Trustee, University of Oklahoma Foundation; former Director, eBay Inc. (online trading community), 2007-2015; and former Director, CIT Bank, CIT Group Inc. (commercial and consumer finance), 2010-2016; former Senior Adviser to The Carlyle Group (financial services), March 2008-September 2008; former Governance Consultant to Bridgewater Associates, January 2013-December 2015 |
| Catherine James Paglia c/o Columbia Management Investment Advisers, LLC 290 Congress Street Boston, MA 02210 1952 | Trustee since 2004 | Director, Enterprise Asset Management, Inc. (private real estate and asset management company), since September 1998; Managing Director and Partner, Interlaken Capital, Inc., 1989-1997; Vice President, 1982-1985, Principal, 1985-1987, Managing Director, 1987-1989, Morgan Stanley; Vice President, Investment Banking, 1980-1982, Associate, Investment Banking, 1976-1980, Dean Witter Reynolds, Inc. | 174 | Director, Valmont Industries, Inc. (irrigation systems manufacturer), since 2012; Trustee, Carleton College (on the Investment Committee), since 1987; Trustee, Carnegie Endowment for International Peace (on the Investment Committee), since 2009 |
| Natalie A. Trunow c/o Columbia Management Investment Advisers, LLC 290 Congress Street Boston, MA 02210 1967 | Trustee since 2020 | Chief Executive Officer, Millennial Portfolio Solutions LLC (asset management and consulting services), January 2016-January 2021; Non-executive Member of the Investment Committee and Valuation Committee, Sarona Asset Management Inc. (private equity firm) since September 2019; Advisor, Horizon Investments (asset management and consulting services), August 2018-January 2022; Advisor, Paradigm Asset Management, November 2016-January 2022; Consultant to Independent Trustees of CFVIT and CFST I from September 2016 to June 2020 with respect to CFVIT and to December 2020 with respect to CFST I; Director of Investments/Consultant, Casey Family Programs, April 2016-November 2016; Senior Vice President and Chief Investment Officer, Calvert Investments, August 2008-January 2016; Section Head and Portfolio Manager, General Motors Asset Management, June 1997-August 2008 | 172 | Independent Director, Investment Committee, Health Services for Children with Special Needs, Inc., 2010-2021; Independent Director, (Executive Committee and Chair, Audit Committee), Consumer Credit Counseling Services (formerly Guidewell Financial Solutions), since 2016; Independent Director, (Investment Committee), Sarona Asset Management, since 2019 |
| 38 | Multi-Manager Value Strategies Fund | Annual Report 2023 |
(Unaudited)
Independent trustees (continued)
| Name, address, year of birth | Position held with the Columbia Funds and length of service | Principal occupation(s) during past five years and other relevant professional experience | Number of Funds in the Columbia Funds Complex* overseen | Other directorships held by Trustee during the past five years and other relevant Board experience |
| Sandra L. Yeager c/o Columbia Management Investment Advisers, LLC 290 Congress Street Boston, MA 02210 1964 | Trustee since 2017 | Retired; President and founder, Hanoverian Capital, LLC (SEC registered investment advisor firm), 2008-2016; Managing Director, DuPont Capital, 2006-2008; Managing Director, Morgan Stanley Investment Management, 2004-2006; Senior Vice President, Alliance Bernstein, 1990-2004 | 174 | Former Director, NAPE (National Alliance for Partnerships in Equity) Education Foundation, October 2016-October 2020; Advisory Board, Jennersville YMCA, since 2022 |
| Name, address, year of birth | Position held with the Columbia Funds and length of service | Principal occupation(s) during the past five years and other relevant professional experience | Number of Funds in the Columbia Funds Complex overseen | Other directorships held by Trustee during the past five years and other relevant Board experience |
| Daniel J. Beckman c/o Columbia Management Investment Advisers, LLC 290 Congress Street Boston, MA 02210 1962 | Trustee since November 2021 and President since June 2021 | Vice President – Head of North America Product, Columbia Management Investment Advisers, LLC, since April 2015; President and Principal Executive Officer of the Columbia Funds, since June 2021; officer of Columbia Funds and affiliated funds, 2020-2021 | 174 | Director, Ameriprise Trust Company, since October 2016; Director, Columbia Management Investment Distributors, Inc. since November 2018; Board of Governors, Columbia Wanger Asset Management, LLC since, January 2022; Director, Columbia Threadneedle Canada, Inc., since December 2022 |
| * | The term “Columbia Funds Complex” as used herein includes Columbia Seligman Premium Technology Growth Fund, Tri-Continental Corporation and each series of Columbia Funds Series Trust (CFST), Columbia Funds Series Trust I (CFST I), Columbia Funds Series Trust II (CFST II), Columbia ETF Trust I (CET I), Columbia ETF Trust II (CET II), Columbia Funds Variable Insurance Trust (CFVIT) and Columbia Funds Variable Series Trust II (CFVST II). Messrs. Batejan, Beckman, Gallagher and Hacker and Mses. Blatz, Carlton, Carrig, Flynn, Paglia, and Yeager serve as directors of Columbia Seligman Premium Technology Growth Fund and Tri-Continental Corporation. |
| ** | Interested person (as defined under the 1940 Act) by reason of being an officer, director, security holder and/or employee of the Investment Manager or Ameriprise Financial. |
| Multi-Manager Value Strategies Fund | Annual Report 2023 | 39 |
(Unaudited)
The Board has appointed officers who are responsible for day-to-day business decisions based on policies it has established. The officers serve at the pleasure of the Board. The following table provides basic information about the Officers of the Fund as of the printing of this report, including principal occupations during the past five years, although their specific titles may have varied over the period. In addition to Mr. Beckman, who is President and Principal Executive Officer, the Fund’s other officers are:
| Name, address and year of birth | Position and year first appointed to position for any Fund in the Columbia Funds Complex or a predecessor thereof | Principal occupation(s) during past five years |
| Michael G. Clarke 290 Congress Street Boston, MA 02210 1969 | Chief Financial Officer and Principal Financial Officer (2009) and Senior Vice President (2019) | Senior Vice President and North America Head of Operations & Investor Services, Columbia Management Investment Advisers, LLC, since June 2023 (previously Senior Vice President and Head of Global Operations, March 2022 – June 2023, Vice President, Head of North America Operations, and Co-Head of Global Operations, June 2019 - February 2022 and Vice President – Accounting and Tax, May 2010 - May 2019); senior officer of Columbia Funds and affiliated funds, since 2002. Director, Ameriprise Trust Company, since June 2023. |
| Joseph Beranek 5890 Ameriprise Financial Center Minneapolis, MN 55474 1965 | Treasurer and Chief Accounting Officer (Principal Accounting Officer) (2019) and Principal Financial Officer (2020), CFST, CFST I, CFST II, CFVIT and CFVST II; Assistant Treasurer, CET I and CET II | Vice President – Mutual Fund Accounting and Financial Reporting, Columbia Management Investment Advisers, LLC, since December 2018 and March 2017, respectively. |
| Marybeth Pilat 290 Congress Street Boston, MA 02210 1968 | Treasurer and Chief Accounting Officer (Principal Accounting Officer) and Principal Financial Officer (2020) for CET I and CET II; Assistant Treasurer, CFST, CFST I, CFST II, CFVIT and CFVST II | Vice President – Product Pricing and Administration, Columbia Management Investment Advisers, LLC, since May 2017. |
| William F. Truscott 290 Congress Street Boston, MA 02210 1960 | Senior Vice President (2001) | Formerly, Trustee/Director of Columbia Funds Complex or legacy funds, November 2001 - January 1, 2021; Chief Executive Officer, Global Asset Management, Ameriprise Financial, Inc., since September 2012; Chairman of the Board and President, Columbia Management Investment Advisers, LLC, since July 2004 and February 2012, respectively; Chairman of the Board and Chief Executive Officer, Columbia Management Investment Distributors, Inc., since November 2008 and February 2012, respectively;Chairman of the Board and Director, Threadneedle Asset Management Holdings, Sàrl, since March 2013 and December 2008, respectively; senior executive of various entities affiliated with Columbia Threadneedle. |
| Christopher O. Petersen 5228 Ameriprise Financial Center Minneapolis, MN 55474 1970 | Senior Vice President and Assistant Secretary (2021) | Formerly, Trustee/Director of funds within the Columbia Funds Complex, July 1, 2020 - November 22, 2021; Senior Vice President and Assistant General Counsel, Ameriprise Financial, Inc., since September 2021 (previously Vice President and Lead Chief Counsel, January 2015 - September 2021); formerly, President and Principal Executive Officer of the Columbia Funds, 2015 - 2021; officer of Columbia Funds and affiliated funds, since 2007. |
| Thomas P. McGuire 290 Congress Street Boston, MA 02210 1972 | Senior Vice President and Chief Compliance Officer (2012) | Vice President – Asset Management Compliance, Ameriprise Financial, Inc., since May 2010; Chief Compliance Officer, Columbia Acorn/Wanger Funds, since December 2015; formerly, Chief Compliance Officer, Ameriprise Certificate Company, September 2010 – September 2020. |
| Ryan C. Larrenaga 290 Congress Street Boston, MA 02210 1970 | Senior Vice President (2017), Chief Legal Officer (2017), and Secretary (2015) | Vice President and Chief Counsel, Ameriprise Financial, Inc., since August 2018 (previously Vice President and Group Counsel, August 2011 - August 2018); Chief Legal Officer, Columbia Acorn/Wanger Funds, since September 2020; officer of Columbia Funds and affiliated funds, since 2005. |
| 40 | Multi-Manager Value Strategies Fund | Annual Report 2023 |
(Unaudited)
Fund officers (continued)
| Name, address and year of birth | Position and year first appointed to position for any Fund in the Columbia Funds Complex or a predecessor thereof | Principal occupation(s) during past five years |
| Michael E. DeFao 290 Congress Street Boston, MA 02210 1968 | Vice President (2011) and Assistant Secretary (2010) | Vice President and Chief Counsel, Ameriprise Financial, Inc., since May 2010; Vice President, Chief Legal Officer and Assistant Secretary, Columbia Management Investment Advisers, LLC, since October 2021 (previously Vice President and Assistant Secretary, May 2010 – September 2021). |
| Lyn Kephart-Strong 5903 Ameriprise Financial Center Minneapolis, MN 55474 1960 | Vice President (2015) | Vice President, Global Investment Operations Services, Columbia Management Investment Advisers, LLC, since 2010; Director (since January 2007) and President (since October 2014), Columbia Management Investment Services Corp.; Director (since December 2017) and President (since January 2017), Ameriprise Trust Company. |
| • | the Fund had sufficient liquidity to both meet redemptions and operate effectively on behalf of shareholders; |
| • | there were no material changes to the Program during the period; |
| • | the implementation of the Program was effective to manage the Fund’s liquidity risk; and |
| • | the Program operated adequately during the period. |
| Multi-Manager Value Strategies Fund | Annual Report 2023 | 41 |
columbiathreadneedleus.com/investor/. The Fund is distributed by Columbia Management Investment Distributors, Inc., member FINRA, and managed by Columbia Management Investment Advisers, LLC.

May 31, 2023

| 3 | |
| 5 | |
| 7 | |
| 8 | |
| 19 | |
| 21 | |
| 22 | |
| 24 | |
| 28 | |
| 43 | |
| 44 | |
| 50 |
(Unaudited)
| Average annual total returns (%) (for the period ended May 31, 2023) | |||||
| Inception | 1 Year | 5 Years | 10 Years | ||
| Class A | Excluding sales charges | 06/18/12 | -22.59 | 4.00 | -1.93 |
| Including sales charges | -27.05 | 2.78 | -2.51 | ||
| Advisor Class | 03/19/13 | -22.33 | 4.29 | -1.68 | |
| Class C | Excluding sales charges | 06/18/12 | -23.16 | 3.21 | -2.67 |
| Including sales charges | -23.52 | 3.21 | -2.67 | ||
| Institutional Class | 06/18/12 | -22.43 | 4.28 | -1.70 | |
| Institutional 2 Class* | 01/08/14 | -22.32 | 4.36 | -1.63 | |
| Institutional 3 Class* | 10/01/14 | -22.31 | 4.51 | -1.57 | |
| Class R | 06/18/12 | -22.77 | 3.74 | -2.17 | |
| Bloomberg Commodity Index Total Return | -22.48 | 3.17 | -1.86 | ||
| * | The returns shown for periods prior to the share class inception date (including returns for the Life of the Fund, if shown, which are since Fund inception) include the returns of the Fund’s Class A shares for the period from May 31, 2013 through the inception date of such class (in each case, without applicable sales charges and adjusted to reflect the higher class-related operating expenses of such share class, where applicable). Share classes with expenses that are higher than Class A shares will have performance that is lower than Class A shares (without sales charges). Please visit columbiathreadneedleus.com/investor/investment-products/mutual-funds/appended-performance for more information. |
| Columbia Commodity Strategy Fund | Annual Report 2023 | 3 |
(Unaudited)

| Portfolio breakdown (%) (at May 31, 2023) | |
| Asset-Backed Securities — Non-Agency | 27.9 |
| Commercial Mortgage-Backed Securities - Non-Agency | 3.4 |
| Corporate Bonds & Notes | 33.9 |
| Foreign Government Obligations | 0.7 |
| Money Market Funds(a) | 30.6 |
| Residential Mortgage-Backed Securities - Non-Agency | 2.1 |
| U.S. Government & Agency Obligations | 0.7 |
| U.S. Treasury Obligations | 0.7 |
| Total | 100.0 |
| (a) | Includes investments in Money Market Funds, including investing for the purpose of covering obligations relating to the Fund’s investment in derivatives. For a description of the Fund’s investments in derivatives, see Investments in derivatives following the Consolidated Portfolio of Investments and the derivative instruments discussion in Note 2 to the Notes to Consolidated Financial Statements. |
| Commodities market exposure (%) (at May 31, 2023) | |||
| Commodities contracts(a) | Long | Short | Net |
| Agriculture | 31.2 | — | 31.2 |
| Energy | 29.1 | — | 29.1 |
| Industrial Metals | 14.1 | — | 14.1 |
| Livestock | 5.9 | — | 5.9 |
| Precious Metals | 19.7 | — | 19.7 |
| Total notional market value of commodities contracts | 100.0 | — | 100.0 |
| (a) | Reflects notional market value of commodities contracts. The notional exposure of a financial instrument is the nominal or face amount that is used to calculate payments made on that instrument and/or changes in value for the instrument. The notional exposure is a hypothetical underlying quantity upon which payment obligations are computed. Notional exposures provide a gauge for how the Fund may behave given changes in individual markets. Notional amounts for each commodities contract are shown in the Consolidated Portfolio of Investments. For a description of the Fund’s investments in derivatives, see Investments in derivatives following the Consolidated Portfolio of Investments and Note 2 of the Notes to Consolidated Financial Statements. |
| 4 | Columbia Commodity Strategy Fund | Annual Report 2023 |
(Unaudited)
| • | On a subsector level, grains, softs (commodities that are grown versus mined), livestock and industrial metals were all detractors for the Fund versus its benchmark during the period. |
| • | Within grains, corn, soybean and soybean meal were the largest detracting commodities for the Fund, driven primarily by security selection. |
| • | The Fund was overweight in zinc versus the benchmark, which detracted overall from relative performance. |
| • | Within energy, brent crude oil was the single largest detractor, driven by an overweight relative to the benchmark. |
| • | Both the energy and precious metals subsectors contributed positively to the Fund’s performance relative to the benchmark during the period. |
| • | Within energy, natural gas was the single largest contributing commodity for the Fund, driven primarily by curve positioning as compared to the benchmark. |
| Columbia Commodity Strategy Fund | Annual Report 2023 | 5 |
(Unaudited)
| • | Within precious metals, gold was the highest contributing commodity for the Fund due to strong security selection. |
| • | Within grains, both wheat and soybean oil contributed positively to Fund performance relative to its benchmark. |
| 6 | Columbia Commodity Strategy Fund | Annual Report 2023 |
(Unaudited)
| December 1, 2022 — May 31, 2023 | |||||||
| Account value at the beginning of the period ($) | Account value at the end of the period ($) | Expenses paid during the period ($) | Fund’s annualized expense ratio (%) | ||||
| Actual | Hypothetical | Actual | Hypothetical | Actual | Hypothetical | Actual | |
| Class A | 1,000.00 | 1,000.00 | 861.00 | 1,019.30 | 5.24 | 5.69 | 1.13 |
| Advisor Class | 1,000.00 | 1,000.00 | 862.90 | 1,020.54 | 4.09 | 4.43 | 0.88 |
| Class C | 1,000.00 | 1,000.00 | 858.10 | 1,015.56 | 8.71 | 9.45 | 1.88 |
| Institutional Class | 1,000.00 | 1,000.00 | 861.60 | 1,020.54 | 4.08 | 4.43 | 0.88 |
| Institutional 2 Class | 1,000.00 | 1,000.00 | 862.60 | 1,020.94 | 3.71 | 4.03 | 0.80 |
| Institutional 3 Class | 1,000.00 | 1,000.00 | 862.60 | 1,021.29 | 3.39 | 3.68 | 0.73 |
| Class R | 1,000.00 | 1,000.00 | 859.80 | 1,018.05 | 6.40 | 6.94 | 1.38 |
| Columbia Commodity Strategy Fund | Annual Report 2023 | 7 |
May 31, 2023
| Asset-Backed Securities — Non-Agency 34.5% | ||||
| Issuer | Coupon Rate | Principal Amount ($) | Value ($) | |
| ACC Trust(a) | ||||
| Series 2022-1 Class A | ||||
| 09/20/2024 | 1.190% | 60,450 | 60,182 | |
| American Credit Acceptance Receivables Trust(a) | ||||
| Subordinated Series 2021-3 Class C | ||||
| 11/15/2027 | 0.980% | 2,361,787 | 2,311,709 | |
| Subordinated Series 2022-2 Class C | ||||
| 06/13/2028 | 4.410% | 3,000,000 | 2,947,542 | |
| AmeriCredit Automobile Receivables Trust | ||||
| Series 2021-2 Class A3 | ||||
| 12/18/2026 | 0.340% | 1,923,313 | 1,878,241 | |
| Series 2021-3 Class A3 | ||||
| 08/18/2026 | 0.760% | 2,409,860 | 2,323,321 | |
| Amur Equipment Finance Receivables IX LLC(a) | ||||
| Series 2021-1A Class A2 | ||||
| 11/20/2026 | 0.750% | 214,628 | 208,497 | |
| BMW Vehicle Lease Trust | ||||
| Series 2021-1 Class A4 | ||||
| 07/25/2024 | 0.370% | 517,610 | 514,214 | |
| Subordinated Series 2022-1 Class A3 | ||||
| 03/25/2025 | 1.100% | 2,444,425 | 2,393,798 | |
| CarMax Auto Owner Trust | ||||
| Series 2019-4 Class A3 | ||||
| 11/15/2024 | 2.020% | 233,763 | 232,669 | |
| Series 2021-4 Class A3 | ||||
| 09/15/2026 | 0.560% | 4,338,522 | 4,131,210 | |
| Series 2022-1 Class A2 | ||||
| 02/18/2025 | 0.910% | 557,256 | 553,315 | |
| CCG Receivables Trust(a) | ||||
| Series 2021-2 Class A2 | ||||
| 03/14/2029 | 0.540% | 3,113,905 | 2,985,961 | |
| Dext ABS LLC(a) | ||||
| Series 2023-1 Class A1 | ||||
| 04/15/2024 | 5.680% | 1,193,736 | 1,191,214 | |
| DLL Finance LLC(a) | ||||
| Series 2023-1A Class A1 | ||||
| 02/20/2024 | 5.014% | 233,365 | 232,818 | |
| Drive Auto Receivables Trust | ||||
| Subordinated Series 2020-2 Class C | ||||
| 08/17/2026 | 2.280% | 579,813 | 576,398 | |
| Subordinated Series 2021-1 Class C | ||||
| 06/15/2027 | 1.020% | 1,070,474 | 1,053,047 | |
| DT Auto Owner Trust(a) | ||||
| Series 2020-2A Class C | ||||
| 03/16/2026 | 3.280% | 829,482 | 821,585 | |
| Asset-Backed Securities — Non-Agency (continued) | ||||
| Issuer | Coupon Rate | Principal Amount ($) | Value ($) | |
| Series 2020-2A Class D | ||||
| 03/16/2026 | 4.730% | 3,000,000 | 2,947,804 | |
| Series 2022-1A Class A | ||||
| 04/15/2026 | 1.580% | 1,808,833 | 1,787,236 | |
| Series 2022-3A Class A | ||||
| 10/15/2026 | 6.050% | 1,122,655 | 1,121,652 | |
| Subordinated Series 2019-3A Class E | ||||
| 08/17/2026 | 3.850% | 950,000 | 938,595 | |
| Subordinated Series 2020-1A Class D | ||||
| 11/17/2025 | 2.550% | 760,352 | 743,703 | |
| Enterprise Fleet Financing LLC(a) | ||||
| Series 2023-1 Class A1 | ||||
| 03/20/2024 | 5.330% | 573,447 | 572,461 | |
| Exeter Automobile Receivables Trust | ||||
| Series 2023-1A Class A2 | ||||
| 06/16/2025 | 5.610% | 1,325,000 | 1,323,142 | |
| Subordinated Series 2020-3A Class D | ||||
| 07/15/2026 | 1.730% | 980,000 | 949,210 | |
| Exeter Automobile Receivables Trust(a) | ||||
| Subordinated Series 2020-1A Class D | ||||
| 12/15/2025 | 2.730% | 2,332,219 | 2,278,442 | |
| FHF Trust(a) | ||||
| Series 2021-1A Class A | ||||
| 03/15/2027 | 1.270% | 356,438 | 342,226 | |
| Series 2021-2A Class A | ||||
| 12/15/2026 | 0.830% | 470,162 | 452,920 | |
| Ford Credit Auto Lease Trust | ||||
| Series 2021-B Class A3 | ||||
| 10/15/2024 | 0.370% | 1,914,070 | 1,897,878 | |
| Series 2022-A Class A3 | ||||
| 05/15/2025 | 3.230% | 3,665,000 | 3,608,541 | |
| Ford Credit Auto Owner Trust(a) | ||||
| Series 2019-1 Class A | ||||
| 07/15/2030 | 3.520% | 825,000 | 812,537 | |
| Ford Credit Auto Owner Trust | ||||
| Series 2020-B Class A4 | ||||
| 11/15/2025 | 0.790% | 450,000 | 437,601 | |
| Series 2023-A Class A1 | ||||
| 04/15/2024 | 5.028% | 1,197,586 | 1,196,758 | |
| Ford Credit Floorplan Master Owner Trust | ||||
| Series 2019-2 Class A | ||||
| 04/15/2026 | 3.060% | 3,500,000 | 3,414,089 | |
| Series 2020-1 Class A1 | ||||
| 09/15/2025 | 0.700% | 955,000 | 941,131 | |
| 8 | Columbia Commodity Strategy Fund | Annual Report 2023 |
May 31, 2023
| Asset-Backed Securities — Non-Agency (continued) | ||||
| Issuer | Coupon Rate | Principal Amount ($) | Value ($) | |
| FREED ABS Trust(a) | ||||
| Series 2022-4FP Class A | ||||
| 12/18/2029 | 6.490% | 110,479 | 110,525 | |
| GLS Auto Receivables Issuer Trust(a) | ||||
| Series 2022-2A Class A2 | ||||
| 01/15/2026 | 3.550% | 987,512 | 976,064 | |
| Subordinated Series 2020-3A Class C | ||||
| 05/15/2025 | 1.920% | 584,312 | 581,542 | |
| GM Financial Automobile Leasing Trust | ||||
| Subordinated Series 2021-1 Class C | ||||
| 02/20/2025 | 0.700% | 530,000 | 526,522 | |
| GM Financial Consumer Automobile Receivables Trust | ||||
| Series 2020-1 Class A4 | ||||
| 03/17/2025 | 1.900% | 300,000 | 297,369 | |
| Series 2021-2 Class A3 | ||||
| 04/16/2026 | 0.510% | 1,434,844 | 1,382,950 | |
| GreatAmerica Leasing Receivables(a) | ||||
| Series 2023-1 Class A1 | ||||
| 06/14/2024 | 5.519% | 3,400,000 | 3,399,866 | |
| Harley-Davidson Motorcycle Trust | ||||
| Series 2021-A Class A3 | ||||
| 04/15/2026 | 0.370% | 505,779 | 491,728 | |
| Honda Auto Receivables Owner Trust | ||||
| Series 2020-2 Class A4 | ||||
| 10/15/2026 | 1.090% | 900,000 | 883,955 | |
| JPMorgan Chase Bank NA(a) | ||||
| Subordinated Series 2021-2 Class C | ||||
| 12/26/2028 | 0.969% | 1,358,754 | 1,307,567 | |
| Kubota Credit Owner Trust(a) | ||||
| Series 2023-1A Class A1 | ||||
| 03/15/2024 | 5.292% | 1,870,302 | 1,867,781 | |
| Lendbuzz Securitization Trust(a) | ||||
| Series 2021-1A Class A | ||||
| 06/15/2026 | 1.460% | 165,421 | 158,272 | |
| LendingPoint Asset Securitization Trust(a) | ||||
| Series 2020-REV1 Class A | ||||
| 10/15/2028 | 2.731% | 807,408 | 801,745 | |
| Series 2022-A Class A | ||||
| 06/15/2029 | 1.680% | 47,788 | 47,683 | |
| LL ABS Trust(a) | ||||
| Series 2021-1A Class A | ||||
| 05/15/2029 | 1.070% | 105,052 | 102,384 | |
| Mercedes-Benz Auto Receivables Trust | ||||
| Series 2020-1 Class A4 | ||||
| 10/15/2026 | 0.770% | 250,000 | 239,669 | |
| Nissan Auto Lease Trust | ||||
| Series 2021-A Class A3 | ||||
| 08/15/2024 | 0.520% | 685,359 | 678,820 | |
| Asset-Backed Securities — Non-Agency (continued) | ||||
| Issuer | Coupon Rate | Principal Amount ($) | Value ($) | |
| Oportun Issuance Trust(a) | ||||
| Series 2022-3 Class A | ||||
| 01/08/2030 | 7.451% | 362,109 | 362,775 | |
| Pagaya AI Debt Selection Trust(a) | ||||
| Series 2021-1 Class A | ||||
| 11/15/2027 | 1.180% | 184,339 | 183,438 | |
| Series 2021-5 Class A | ||||
| 08/15/2029 | 1.530% | 139,333 | 136,435 | |
| Santander Drive Auto Receivables Trust | ||||
| Series 2020-2 Class D | ||||
| 09/15/2026 | 2.220% | 2,540,481 | 2,488,451 | |
| Series 2022-2 Class A3 | ||||
| 10/15/2026 | 2.980% | 2,138,500 | 2,113,892 | |
| Series 2022-3 Class A3 | ||||
| 12/15/2026 | 3.400% | 4,024,000 | 3,966,179 | |
| Series 2022-4 Class A2 | ||||
| 07/15/2025 | 4.050% | 225,853 | 225,468 | |
| Subordinated Series 2019-2 Class D | ||||
| 07/15/2025 | 3.220% | 111,501 | 111,103 | |
| Subordinated Series 2020-4 Class C | ||||
| 01/15/2026 | 1.010% | 152,491 | 151,597 | |
| Santander Retail Auto Lease Trust(a) | ||||
| Series 2021-A Class A3 | ||||
| 07/22/2024 | 0.510% | 276,903 | 272,776 | |
| Theorem Funding Trust(a) | ||||
| Series 2021-1A Class A | ||||
| 12/15/2027 | 1.210% | 74,858 | 74,067 | |
| Toyota Auto Loan Extended Note Trust(a) | ||||
| Series 2019-1A Class A | ||||
| 11/25/2031 | 2.560% | 4,075,000 | 3,953,483 | |
| Upstart Pass-Through Trust(a) | ||||
| Series 2021-ST6 Class A | ||||
| 08/20/2027 | 1.850% | 170,488 | 161,717 | |
| Upstart Securitization Trust(a) | ||||
| Series 2021-3 Class A | ||||
| 07/20/2031 | 0.830% | 327,059 | 322,826 | |
| Verizon Master Trust | ||||
| Series 2021-1 Class A | ||||
| 05/20/2027 | 0.500% | 3,500,000 | 3,330,066 | |
| Volkswagen Auto Loan Enhanced Trust | ||||
| Series 2020-1 Class A4 | ||||
| 08/20/2026 | 1.260% | 1,500,000 | 1,463,086 | |
| Westlake Automobile Receivables Trust(a) | ||||
| Series 2022-1A Class A2A | ||||
| 12/16/2024 | 1.970% | 72,630 | 72,240 | |
| Series 2022-3A Class A2 | ||||
| 07/15/2025 | 5.240% | 1,025,000 | 1,021,234 | |
| Columbia Commodity Strategy Fund | Annual Report 2023 | 9 |
May 31, 2023
| Asset-Backed Securities — Non-Agency (continued) | ||||
| Issuer | Coupon Rate | Principal Amount ($) | Value ($) | |
| Series 2023-2A Class A1 | ||||
| 03/15/2024 | 5.266% | 613,222 | 612,695 | |
| Subordinated Series 2019-3A Class D | ||||
| 11/15/2024 | 2.720% | 534,537 | 533,381 | |
| Subordinated Series 2021-2A Class B | ||||
| 07/15/2026 | 0.620% | 2,081,000 | 2,042,792 | |
| World Omni Automobile Lease Securitization Trust | ||||
| Series 2022-A Class A2 | ||||
| 10/15/2024 | 2.630% | 1,018,438 | 1,008,736 | |
| World Omni Select Auto Trust | ||||
| Series 2021-A Class A3 | ||||
| 03/15/2027 | 0.530% | 991,277 | 962,003 | |
| Total Asset-Backed Securities — Non-Agency (Cost $89,686,221) | 89,606,529 | |||
| Commercial Mortgage-Backed Securities - Non-Agency 4.2% | ||||
| Commercial Mortgage Trust | ||||
| Series 2014-CR16 Class A4 | ||||
| 04/10/2047 | 4.051% | 2,850,000 | 2,784,616 | |
| GS Mortgage Securities Corp. Trust(a),(b) | ||||
| Series 2022-SHIP Class A | ||||
| 1-month Term SOFR + 0.731% Floor 0.731% 08/15/2036 | 5.790% | 800,000 | 793,844 | |
| GS Mortgage Securities Trust(c) | ||||
| Series 2013-GC13 Class A5 | ||||
| 07/10/2046 | 3.974% | 1,332,262 | 1,329,210 | |
| GS Mortgage Securities Trust | ||||
| Series 2013-GC14 Class A5 | ||||
| 08/10/2046 | 4.243% | 834,974 | 833,118 | |
| JPMBB Commercial Mortgage Securities Trust | ||||
| Series 2014-C18 Class A5 | ||||
| 02/15/2047 | 4.079% | 1,500,000 | 1,478,040 | |
| JPMorgan Chase Commercial Mortgage Securities Trust | ||||
| Subordinated Series 2013-C16 Class AS | ||||
| 12/14/2046 | 4.517% | 1,425,000 | 1,406,604 | |
| Morgan Stanley Bank of America Merrill Lynch Trust | ||||
| Series 2013-C13 Class A4 | ||||
| 11/15/2046 | 4.039% | 2,165,000 | 2,137,074 | |
| WFRBS Commercial Mortgage Trust | ||||
| Series 2013-C18 Class ASB | ||||
| 12/15/2046 | 3.676% | 109,918 | 109,133 | |
| Total Commercial Mortgage-Backed Securities - Non-Agency (Cost $10,851,471) | 10,871,639 | |||
| Corporate Bonds & Notes 42.0% | ||||
| Aerospace & Defense 1.5% | ||||
| BAE Systems Holdings, Inc.(a) | ||||
| 12/15/2025 | 3.850% | 721,000 | 695,422 | |
| Corporate Bonds & Notes (continued) | ||||
| Issuer | Coupon Rate | Principal Amount ($) | Value ($) | |
| Boeing Co. (The) | ||||
| 05/01/2025 | 4.875% | 1,110,000 | 1,101,367 | |
| Harris Corp. | ||||
| 04/27/2025 | 3.832% | 1,076,000 | 1,046,215 | |
| United Technologies Corp. | ||||
| 08/16/2025 | 3.950% | 1,150,000 | 1,129,134 | |
| Total | 3,972,138 | |||
| Automotive 0.7% | ||||
| Daimler Trucks Finance North America LLC(a),(b) | ||||
| SOFR + 1.000% 04/05/2024 | 6.060% | 1,125,000 | 1,126,543 | |
| Toyota Motor Credit Corp. | ||||
| 06/14/2024 | 0.500% | 625,000 | 593,517 | |
| Total | 1,720,060 | |||
| Banking 13.3% | ||||
| American Express Co.(b) | ||||
| 3-month USD LIBOR + 0.750% 08/03/2023 | 6.052% | 1,215,000 | 1,215,140 | |
| Bank of America Corp.(b) | ||||
| SOFR + 1.100% 04/25/2025 | 6.160% | 1,500,000 | 1,501,930 | |
| Bank of Montreal | ||||
| 12/12/2024 | 5.200% | 1,325,000 | 1,319,135 | |
| Bank of New York Mellon Corp. (The)(b) | ||||
| SOFR + 0.260% 04/26/2024 | 5.320% | 1,307,000 | 1,301,820 | |
| Bank of Nova Scotia (The)(b) | ||||
| SOFR + 0.380% 07/31/2024 | 5.440% | 1,325,000 | 1,318,168 | |
| BBVA USA | ||||
| 08/27/2024 | 2.500% | 1,100,000 | 1,053,987 | |
| Canadian Imperial Bank of Commerce(b) | ||||
| 3-month USD LIBOR + 0.660% 09/13/2023 | 5.814% | 1,300,000 | 1,300,830 | |
| Citigroup, Inc.(d) | ||||
| 04/24/2025 | 3.352% | 1,915,000 | 1,872,956 | |
| Commonwealth Bank of Australia(a),(b) | ||||
| 3-month USD LIBOR + 0.820% 06/04/2024 | 5.806% | 1,115,000 | 1,120,063 | |
| Cooperatieve Rabobank UA(b) | ||||
| SOFR + 0.300% 01/12/2024 | 5.360% | 1,125,000 | 1,123,324 | |
| Credit Suisse AG | ||||
| 08/09/2024 | 4.750% | 1,100,000 | 1,071,322 | |
| Discover Bank | ||||
| 09/12/2024 | 2.450% | 1,000,000 | 945,288 | |
| 10 | Columbia Commodity Strategy Fund | Annual Report 2023 |
May 31, 2023
| Corporate Bonds & Notes (continued) | ||||
| Issuer | Coupon Rate | Principal Amount ($) | Value ($) | |
| Goldman Sachs Group, Inc. (The)(b) | ||||
| 3-month USD LIBOR + 1.600% 11/29/2023 | 7.063% | 2,000,000 | 2,007,247 | |
| HSBC Holdings PLC(d) | ||||
| 08/17/2024 | 0.732% | 1,150,000 | 1,135,985 | |
| JPMorgan Chase & Co.(d) | ||||
| 12/15/2025 | 5.546% | 2,175,000 | 2,177,857 | |
| Morgan Stanley(d) | ||||
| 10/21/2025 | 1.164% | 1,800,000 | 1,681,735 | |
| National Australia Bank Ltd. | ||||
| 11/22/2024 | 5.132% | 1,035,000 | 1,037,181 | |
| Royal Bank of Canada(b) | ||||
| 3-month USD LIBOR + 0.660% 10/05/2023 | 5.883% | 1,120,000 | 1,120,139 | |
| Skandinaviska Enskilda Banken AB(a),(b) | ||||
| 3-month USD LIBOR + 0.320% 09/01/2023 | 5.282% | 1,125,000 | 1,123,738 | |
| State Street Corp.(d) | ||||
| 12/03/2024 | 3.776% | 1,120,000 | 1,110,095 | |
| Svenska Handelsbanken AB(a) | ||||
| 06/10/2025 | 3.650% | 285,000 | 274,921 | |
| Toronto-Dominion Bank (The)(b) | ||||
| SOFR + 0.910% 03/08/2024 | 5.970% | 1,200,000 | 1,201,319 | |
| Truist Bank(b) | ||||
| SOFR + 0.200% 01/17/2024 | 5.260% | 1,200,000 | 1,185,805 | |
| UBS Group AG(a),(d) | ||||
| 08/05/2025 | 4.490% | 1,100,000 | 1,075,372 | |
| US Bancorp | ||||
| 07/30/2024 | 2.400% | 1,165,000 | 1,119,972 | |
| Wells Fargo & Co.(d) | ||||
| 05/19/2025 | 0.805% | 1,925,000 | 1,834,835 | |
| Westpac Banking Corp.(b) | ||||
| 3-month USD LIBOR + 0.770% 02/26/2024 | 6.194% | 1,275,000 | 1,276,168 | |
| Total | 34,506,332 | |||
| Cable and Satellite 0.8% | ||||
| Charter Communications Operating LLC/Capital(b) | ||||
| 3-month USD LIBOR + 1.650% 02/01/2024 | 6.949% | 1,025,000 | 1,027,356 | |
| Comcast Corp. | ||||
| 10/15/2025 | 3.950% | 1,150,000 | 1,130,521 | |
| Total | 2,157,877 | |||
| Corporate Bonds & Notes (continued) | ||||
| Issuer | Coupon Rate | Principal Amount ($) | Value ($) | |
| Chemicals 0.4% | ||||
| DuPont de Nemours, Inc.(b) | ||||
| 3-month USD LIBOR + 1.110% 11/15/2023 | 6.431% | 1,100,000 | 1,102,421 | |
| Construction Machinery 0.9% | ||||
| Caterpillar Financial Services Corp. | ||||
| 05/15/2025 | 1.450% | 1,200,000 | 1,125,627 | |
| John Deere Capital Corp. | ||||
| 03/03/2025 | 5.150% | 1,100,000 | 1,107,244 | |
| Total | 2,232,871 | |||
| Consumer Products 0.4% | ||||
| Kenvue, Inc.(a) | ||||
| 03/22/2025 | 5.500% | 900,000 | 908,771 | |
| Diversified Manufacturing 0.8% | ||||
| Carrier Global Corp. | ||||
| 02/15/2025 | 2.242% | 1,181,000 | 1,119,378 | |
| Siemens Financieringsmaatschappij NV(a) | ||||
| 05/27/2025 | 3.250% | 1,000,000 | 969,118 | |
| Total | 2,088,496 | |||
| Electric 2.5% | ||||
| CenterPoint Energy, Inc.(b) | ||||
| SOFR + 0.650% 05/13/2024 | 5.710% | 629,000 | 626,860 | |
| Consumers Energy Co. | ||||
| 08/15/2023 | 3.375% | 425,000 | 422,929 | |
| DTE Energy Co. | ||||
| 11/01/2024 | 4.220% | 1,125,000 | 1,106,077 | |
| Duke Energy Corp.(b) | ||||
| SOFR + 0.250% 06/10/2023 | 5.310% | 1,025,000 | 1,024,925 | |
| Eversource Energy(b) | ||||
| SOFR + 0.250% 08/15/2023 | 5.310% | 475,000 | 474,585 | |
| Mississippi Power Co.(b) | ||||
| SOFR + 0.300% 06/28/2024 | 5.360% | 450,000 | 445,646 | |
| NextEra Energy Capital Holdings, Inc. | ||||
| 03/01/2025 | 6.051% | 915,000 | 925,506 | |
| Public Service Enterprise Group, Inc. | ||||
| 11/08/2023 | 0.841% | 300,000 | 293,910 | |
| WEC Energy Group, Inc. | ||||
| 09/27/2025 | 5.000% | 1,100,000 | 1,100,884 | |
| Columbia Commodity Strategy Fund | Annual Report 2023 | 11 |
May 31, 2023
| Corporate Bonds & Notes (continued) | ||||
| Issuer | Coupon Rate | Principal Amount ($) | Value ($) | |
| Xcel Energy, Inc. | ||||
| 06/01/2025 | 3.300% | 65,000 | 62,655 | |
| Total | 6,483,977 | |||
| Food and Beverage 1.3% | ||||
| Bacardi Ltd.(a) | ||||
| 05/15/2025 | 4.450% | 1,150,000 | 1,125,796 | |
| Mondelez International, Inc. | ||||
| 05/04/2025 | 1.500% | 1,200,000 | 1,125,880 | |
| Tyson Foods, Inc. | ||||
| 08/15/2024 | 3.950% | 1,100,000 | 1,082,109 | |
| Total | 3,333,785 | |||
| Health Care 2.5% | ||||
| Becton Dickinson and Co. | ||||
| 06/06/2024 | 3.363% | 1,150,000 | 1,125,687 | |
| Cigna Corp. | ||||
| 11/15/2025 | 4.125% | 1,000,000 | 979,370 | |
| CVS Health Corp. | ||||
| 07/20/2025 | 3.875% | 1,150,000 | 1,125,331 | |
| GE Healthcare Holding LLC(a) | ||||
| 11/15/2024 | 5.550% | 1,136,000 | 1,135,456 | |
| HCA, Inc. | ||||
| 02/01/2025 | 5.375% | 1,075,000 | 1,067,825 | |
| Thermo Fisher Scientific, Inc. | ||||
| 10/18/2024 | 1.215% | 1,175,000 | 1,114,445 | |
| Total | 6,548,114 | |||
| Healthcare Insurance 0.9% | ||||
| UnitedHealth Group, Inc. | ||||
| 07/15/2025 | 3.750% | 1,250,000 | 1,225,386 | |
| Wellpoint, Inc. | ||||
| 08/15/2024 | 3.500% | 1,125,000 | 1,099,715 | |
| Total | 2,325,101 | |||
| Independent Energy 0.7% | ||||
| Pioneer Natural Resources Co. | ||||
| 03/29/2026 | 5.100% | 885,000 | 885,048 | |
| Woodside Finance Ltd.(a) | ||||
| 03/05/2025 | 3.650% | 1,000,000 | 968,433 | |
| Total | 1,853,481 | |||
| Integrated Energy 0.7% | ||||
| Chevron USA, Inc.(b) | ||||
| 3-month USD LIBOR + 0.200% 08/11/2023 | 5.539% | 575,000 | 575,190 | |
| Corporate Bonds & Notes (continued) | ||||
| Issuer | Coupon Rate | Principal Amount ($) | Value ($) | |
| Shell International Finance BV(b) | ||||
| 3-month USD LIBOR + 0.400% 11/13/2023 | 5.721% | 1,174,000 | 1,175,146 | |
| Total | 1,750,336 | |||
| Life Insurance 2.0% | ||||
| CoreBridge Financial, Inc.(a) | ||||
| 04/04/2025 | 3.500% | 1,150,000 | 1,097,454 | |
| Five Corners Funding Trust(a) | ||||
| 11/15/2023 | 4.419% | 1,150,000 | 1,141,940 | |
| Metropolitan Life Global Funding I(a) | ||||
| 09/27/2024 | 0.700% | 1,200,000 | 1,126,012 | |
| New York Life Global Funding(a) | ||||
| 04/10/2024 | 2.875% | 1,150,000 | 1,124,800 | |
| Principal Life Global Funding II(a) | ||||
| 06/23/2025 | 1.250% | 817,000 | 749,642 | |
| Total | 5,239,848 | |||
| Media and Entertainment 0.9% | ||||
| Walt Disney Co. (The) | ||||
| 09/15/2024 | 3.700% | 1,125,000 | 1,105,232 | |
| Warnermedia Holdings, Inc.(b) | ||||
| SOFR + 1.780% 03/15/2024 | 6.840% | 1,100,000 | 1,100,237 | |
| Total | 2,205,469 | |||
| Midstream 2.3% | ||||
| Enable Midstream Partners LP | ||||
| 05/15/2024 | 3.900% | 800,000 | 784,971 | |
| Enbridge, Inc. | ||||
| 02/16/2024 | 2.150% | 1,000,000 | 974,002 | |
| Enterprise Products Operating LLC | ||||
| 02/15/2024 | 3.900% | 900,000 | 888,921 | |
| Kinder Morgan Energy Partners LP | ||||
| 02/01/2024 | 4.150% | 890,000 | 879,801 | |
| 05/01/2024 | 4.300% | 250,000 | 246,653 | |
| Plains All American Pipeline LP/Finance Corp. | ||||
| 10/15/2025 | 4.650% | 1,150,000 | 1,130,205 | |
| Williams Companies, Inc. (The) | ||||
| 09/15/2025 | 4.000% | 1,150,000 | 1,117,489 | |
| Total | 6,022,042 | |||
| Natural Gas 0.4% | ||||
| NiSource, Inc. | ||||
| 08/15/2025 | 0.950% | 1,225,000 | 1,116,971 | |
| Pharmaceuticals 2.9% | ||||
| AbbVie, Inc. | ||||
| 03/15/2025 | 3.800% | 1,150,000 | 1,124,585 | |
| 12 | Columbia Commodity Strategy Fund | Annual Report 2023 |
May 31, 2023
| Corporate Bonds & Notes (continued) | ||||
| Issuer | Coupon Rate | Principal Amount ($) | Value ($) | |
| Amgen, Inc. | ||||
| 05/01/2025 | 3.125% | 1,160,000 | 1,119,094 | |
| Astrazeneca Finance LLC | ||||
| 05/28/2024 | 0.700% | 1,175,000 | 1,122,143 | |
| Bristol-Myers Squibb Co. | ||||
| 11/13/2023 | 0.537% | 1,150,000 | 1,125,237 | |
| Gilead Sciences, Inc. | ||||
| 02/01/2025 | 3.500% | 1,100,000 | 1,071,760 | |
| Pfizer Investment Enterprises Pte., Ltd. | ||||
| 05/19/2026 | 4.450% | 1,500,000 | 1,492,447 | |
| Roche Holdings, Inc.(a),(b) | ||||
| SOFR + 0.330% 09/11/2023 | 5.390% | 545,000 | 544,708 | |
| Total | 7,599,974 | |||
| Property & Casualty 0.8% | ||||
| Chubb INA Holdings, Inc. | ||||
| 03/15/2025 | 3.150% | 1,125,000 | 1,092,516 | |
| Loews Corp. | ||||
| 04/01/2026 | 3.750% | 1,050,000 | 1,026,335 | |
| Total | 2,118,851 | |||
| Railroads 0.9% | ||||
| CSX Corp. | ||||
| 11/01/2025 | 3.350% | 1,175,000 | 1,133,087 | |
| Union Pacific Corp. | ||||
| 01/15/2025 | 3.250% | 1,125,000 | 1,094,375 | |
| Total | 2,227,462 | |||
| Retailers 0.5% | ||||
| Lowe’s Companies, Inc. | ||||
| 09/08/2025 | 4.400% | 1,250,000 | 1,237,088 | |
| Technology 2.0% | ||||
| Broadcom, Inc. | ||||
| 11/15/2025 | 3.150% | 1,160,000 | 1,106,357 | |
| International Business Machines Corp. | ||||
| 02/12/2024 | 3.625% | 1,125,000 | 1,110,370 | |
| Microchip Technology, Inc. | ||||
| 02/15/2024 | 0.972% | 1,100,000 | 1,061,914 | |
| NXP BV/Funding LLC/USA, Inc. | ||||
| 05/01/2025 | 2.700% | 851,000 | 808,213 | |
| Oracle Corp. | ||||
| 04/01/2025 | 2.500% | 1,150,000 | 1,096,593 | |
| Total | 5,183,447 | |||
| Corporate Bonds & Notes (continued) | ||||
| Issuer | Coupon Rate | Principal Amount ($) | Value ($) | |
| Transportation Services 0.2% | ||||
| ERAC USA Finance LLC(a) | ||||
| 11/01/2023 | 2.700% | 550,000 | 542,091 | |
| Wireless 0.8% | ||||
| American Tower Corp. | ||||
| 01/15/2025 | 2.950% | 1,100,000 | 1,056,555 | |
| T-Mobile USA, Inc. | ||||
| 04/15/2025 | 3.500% | 1,125,000 | 1,090,929 | |
| Total | 2,147,484 | |||
| Wirelines 0.9% | ||||
| AT&T, Inc.(b) | ||||
| 3-month USD LIBOR + 1.180% 06/12/2024 | 6.334% | 1,190,000 | 1,200,034 | |
| Verizon Communications, Inc.(b) | ||||
| SOFR + 0.500% 03/22/2024 | 5.560% | 1,225,000 | 1,224,022 | |
| Total | 2,424,056 | |||
| Total Corporate Bonds & Notes (Cost $109,637,059) | 109,048,543 | |||
| Foreign Government Obligations(e) 0.8% | ||||
| Canada 0.8% | ||||
| Province of Ontario | ||||
| 01/29/2024 | 3.050% | 1,150,000 | 1,132,519 | |
| Province of Quebec | ||||
| 10/16/2024 | 2.875% | 1,150,000 | 1,118,578 | |
| Total | 2,251,097 | |||
| Total Foreign Government Obligations (Cost $2,262,607) | 2,251,097 | |||
| Residential Mortgage-Backed Securities - Non-Agency 2.6% | ||||
| Bellemeade Re Ltd.(a),(b) | ||||
| CMO Series 2021-3A Class M1A | ||||
| 30-day Average SOFR + 1.000% Floor 1.000% 09/25/2031 | 5.973% | 955,011 | 945,322 | |
| CFMT LLC(a),(c) | ||||
| CMO Series 2021-EBO1 Class A | ||||
| 11/25/2050 | 0.985% | 371,402 | 349,876 | |
| Connecticut Avenue Securities Trust(a),(b) | ||||
| CMO Series 2022-R02 Class 2M1 | ||||
| 30-day Average SOFR + 1.200% 01/25/2042 | 6.173% | 1,786,530 | 1,775,449 | |
| CMO Series 2022-R05 Class 2M1 | ||||
| 30-day Average SOFR + 1.900% 04/25/2042 | 6.873% | 580,185 | 581,396 | |
| Columbia Commodity Strategy Fund | Annual Report 2023 | 13 |
May 31, 2023
| Residential Mortgage-Backed Securities - Non-Agency (continued) | ||||
| Issuer | Coupon Rate | Principal Amount ($) | Value ($) | |
| Pretium Mortgage Credit Partners LLC(a),(c) | ||||
| CMO Series 2021-RN2 Class A1 | ||||
| 07/25/2051 | 1.744% | 528,703 | 480,148 | |
| Towd Point Mortgage Trust(a),(c) | ||||
| CMO Series 2021-SJ2 Class A1A | ||||
| 12/25/2061 | 2.250% | 834,802 | 760,053 | |
| VCAT LLC(a),(c) | ||||
| CMO Series 2021-NPL4 Class A1 | ||||
| 08/25/2051 | 1.868% | 1,291,222 | 1,185,853 | |
| CMO Series 2021-NPL5 Class A1 | ||||
| 08/25/2051 | 1.868% | 734,264 | 668,154 | |
| Total Residential Mortgage-Backed Securities - Non-Agency (Cost $7,082,531) | 6,746,251 | |||
| U.S. Government & Agency Obligations 0.8% | ||||
| Federal Farm Credit Banks Funding Corp.(b) | ||||
| SOFR + 0.040% 02/09/2024 | 5.100% | 1,050,000 | 1,049,158 | |
| Federal Home Loan Banks(b) | ||||
| SOFR + 0.050% 07/24/2023 | 5.110% | 1,200,000 | 1,199,640 | |
| Total U.S. Government & Agency Obligations (Cost $2,249,987) | 2,248,798 | |||
| U.S. Treasury Obligations 0.9% | ||||
| Issuer | Coupon Rate | Principal Amount ($) | Value ($) | |
| U.S. Treasury | ||||
| 10/31/2023 | 0.375% | 2,300,000 | 2,252,922 | |
| Total U.S. Treasury Obligations (Cost $2,255,313) | 2,252,922 | |||
| Money Market Funds 37.9% | ||
| Shares | Value ($) | |
| Columbia Short-Term Cash Fund, 5.241%(f),(g) | 98,474,416 | 98,425,179 |
| Total Money Market Funds (Cost $98,435,310) | 98,425,179 | |
| Total Investments in Securities (Cost: $322,460,499) | 321,450,958 | |
| Other Assets & Liabilities, Net | (61,689,379) | |
| Net Assets | 259,761,579 | |
| Long futures contracts | ||||||
| Description | Number of contracts | Expiration date | Trading currency | Notional amount | Value/Unrealized appreciation ($) | Value/Unrealized depreciation ($) |
| Brent Crude | 100 | 07/2023 | USD | 7,249,000 | — | (357,548) |
| Brent Crude | 55 | 09/2023 | USD | 3,955,600 | — | (450,273) |
| Brent Crude | 111 | 11/2023 | USD | 7,919,850 | — | (963,407) |
| Brent Crude | 56 | 01/2024 | USD | 3,965,920 | — | (172,570) |
| Cocoa | 12 | 09/2023 | USD | 362,280 | 536 | — |
| Coffee | 8 | 07/2023 | USD | 535,950 | — | (20,916) |
| Coffee | 28 | 09/2023 | USD | 1,846,425 | — | (62,100) |
| Coffee | 57 | 12/2023 | USD | 3,710,700 | — | (207,857) |
| Coffee | 29 | 03/2024 | USD | 1,884,094 | — | (85,092) |
| Copper | 19 | 07/2023 | USD | 1,727,575 | — | (57,063) |
| Copper | 30 | 09/2023 | USD | 2,740,125 | — | (312,973) |
| Copper | 61 | 12/2023 | USD | 5,601,325 | — | (487,352) |
| Copper | 30 | 03/2024 | USD | 2,765,625 | — | (123,914) |
| Corn | 176 | 07/2023 | USD | 5,227,200 | — | (100,594) |
| Corn | 114 | 09/2023 | USD | 2,942,625 | — | (325,343) |
| Corn | 225 | 12/2023 | USD | 5,869,688 | — | (239,269) |
| Corn | 103 | 03/2024 | USD | 2,735,938 | 16,653 | — |
| Corn | 7 | 03/2024 | USD | 185,938 | — | (652) |
| Cotton | 23 | 07/2023 | USD | 960,020 | 14,906 | — |
| 14 | Columbia Commodity Strategy Fund | Annual Report 2023 |
May 31, 2023
| Long futures contracts (continued) | ||||||
| Description | Number of contracts | Expiration date | Trading currency | Notional amount | Value/Unrealized appreciation ($) | Value/Unrealized depreciation ($) |
| Cotton | 65 | 12/2023 | USD | 2,582,775 | — | (87,392) |
| Cotton | 21 | 03/2024 | USD | 835,380 | — | (11,933) |
| Feeder Cattle | 10 | 08/2023 | USD | 1,195,875 | 6,846 | — |
| Gas Oil | 27 | 07/2023 | USD | 1,773,225 | — | (169,285) |
| Gas Oil | 19 | 09/2023 | USD | 1,252,100 | — | (205,045) |
| Gas Oil | 19 | 11/2023 | USD | 1,253,525 | — | (106,042) |
| Gas Oil | 39 | 01/2024 | USD | 2,556,450 | — | (118,372) |
| Gold 100 oz. | 46 | 08/2023 | USD | 9,117,660 | — | (62,034) |
| Gold 100 oz. | 100 | 12/2023 | USD | 20,204,000 | 721,287 | — |
| Gold 100 oz. | 32 | 12/2023 | USD | 6,465,280 | — | (109,733) |
| Gold 100 oz. | 43 | 02/2024 | USD | 8,767,270 | — | (296,603) |
| Lead | 77 | 07/2023 | USD | 3,876,950 | — | (152,859) |
| Lead | 10 | 09/2023 | USD | 503,438 | — | (31,327) |
| Lead | 10 | 11/2023 | USD | 504,188 | — | (26,071) |
| Lead | 20 | 01/2024 | USD | 1,010,125 | — | (62,372) |
| Lean Hogs | 62 | 07/2023 | USD | 2,066,460 | — | (69,500) |
| Lean Hogs | 31 | 10/2023 | USD | 932,480 | — | (136,733) |
| Lean Hogs | 63 | 12/2023 | USD | 1,827,630 | — | (135,467) |
| Lean Hogs | 30 | 02/2024 | USD | 930,900 | — | (24,517) |
| Live Cattle | 33 | 08/2023 | USD | 2,213,310 | 93,282 | — |
| Live Cattle | 29 | 10/2023 | USD | 1,992,590 | 82,938 | — |
| Live Cattle | 57 | 12/2023 | USD | 4,000,260 | 92,421 | — |
| Live Cattle | 28 | 02/2024 | USD | 2,009,560 | 61,962 | — |
| Natural Gas | 133 | 06/2023 | USD | 3,013,780 | — | (535,281) |
| Natural Gas | 132 | 08/2023 | USD | 3,112,560 | — | (524,669) |
| Natural Gas | 107 | 10/2023 | USD | 3,130,820 | — | (268,614) |
| Natural Gas | 172 | 12/2023 | USD | 6,298,640 | — | (217,985) |
| Nickel | 3 | 07/2023 | USD | 368,964 | — | (143,184) |
| Nickel | 9 | 09/2023 | USD | 1,114,398 | — | (361,553) |
| Nickel | 9 | 11/2023 | USD | 1,122,552 | — | (175,136) |
| Nickel | 19 | 01/2024 | USD | 2,389,326 | — | (293,355) |
| NY Harbor ULSD Heat Oil | 21 | 06/2023 | USD | 1,985,294 | — | (181,529) |
| NY Harbor ULSD Heat Oil | 10 | 08/2023 | USD | 950,082 | — | (156,402) |
| NY Harbor ULSD Heat Oil | 10 | 10/2023 | USD | 953,736 | — | (79,460) |
| NY Harbor ULSD Heat Oil | 20 | 12/2023 | USD | 1,907,724 | — | (121,918) |
| Primary Aluminum | 21 | 07/2023 | USD | 1,180,463 | — | (96,985) |
| Primary Aluminum | 40 | 09/2023 | USD | 2,254,480 | — | (287,891) |
| Primary Aluminum | 40 | 11/2023 | USD | 2,275,000 | — | (135,758) |
| Primary Aluminum | 79 | 01/2024 | USD | 4,537,523 | — | (121,690) |
| RBOB Gasoline | 29 | 06/2023 | USD | 2,976,548 | 26,849 | — |
| RBOB Gasoline | 15 | 08/2023 | USD | 1,454,292 | — | (96,191) |
| RBOB Gasoline | 17 | 10/2023 | USD | 1,466,270 | — | (97,674) |
| RBOB Gasoline | 34 | 12/2023 | USD | 2,853,572 | — | (140,752) |
| Silver | 2 | 07/2023 | USD | 235,870 | 7,630 | — |
| Silver | 21 | 07/2023 | USD | 2,476,635 | — | (104,821) |
| Silver | 1 | 09/2023 | USD | 119,030 | 3,964 | — |
| Silver | 20 | 09/2023 | USD | 2,380,600 | — | (66,912) |
| Silver | 42 | 12/2023 | USD | 5,068,350 | — | (384,941) |
| Silver | 21 | 03/2024 | USD | 2,566,410 | — | (184,942) |
| Soybean | 95 | 07/2023 | USD | 6,173,813 | — | (524,590) |
| Soybean | 103 | 11/2023 | USD | 5,904,475 | — | (846,095) |
| Soybean | 102 | 01/2024 | USD | 5,900,700 | — | (561,426) |
| Soybean Meal | 155 | 07/2023 | USD | 6,097,700 | — | (370,781) |
| Soybean Meal | 93 | 12/2023 | USD | 3,394,500 | — | (442,730) |
| Soybean Meal | 94 | 01/2024 | USD | 3,412,200 | — | (298,646) |
| Soybean Oil | 72 | 07/2023 | USD | 1,995,840 | — | (270,520) |
| Soybean Oil | 105 | 12/2023 | USD | 2,907,450 | — | (441,488) |
| Soybean Oil | 105 | 01/2024 | USD | 2,907,450 | — | (308,874) |
| Columbia Commodity Strategy Fund | Annual Report 2023 | 15 |
May 31, 2023
| Long futures contracts (continued) | ||||||
| Description | Number of contracts | Expiration date | Trading currency | Notional amount | Value/Unrealized appreciation ($) | Value/Unrealized depreciation ($) |
| Sugar #11 | 91 | 06/2023 | USD | 2,554,115 | 235,968 | — |
| Sugar #11 | 45 | 09/2023 | USD | 1,246,896 | 144,721 | — |
| Sugar #11 | 24 | 09/2023 | USD | 665,011 | — | (30,813) |
| Sugar #11 | 81 | 02/2024 | USD | 2,220,826 | 56,919 | — |
| Sugar #11 | 129 | 02/2024 | USD | 3,536,870 | — | (122,452) |
| Wheat | 43 | 07/2023 | USD | 1,699,575 | — | (121,913) |
| Wheat | 31 | 07/2023 | USD | 921,088 | — | (176,634) |
| Wheat | 10 | 09/2023 | USD | 392,625 | 1,591 | — |
| Wheat | 15 | 09/2023 | USD | 588,938 | — | (57,489) |
| Wheat | 44 | 09/2023 | USD | 1,337,600 | — | (247,643) |
| Wheat | 51 | 12/2023 | USD | 1,991,550 | — | (79,376) |
| Wheat | 86 | 12/2023 | USD | 2,695,025 | — | (253,255) |
| Wheat | 26 | 03/2024 | USD | 1,007,500 | — | (63,759) |
| Wheat | 42 | 03/2024 | USD | 1,348,200 | — | (78,848) |
| WTI Crude | 112 | 06/2023 | USD | 7,626,080 | — | (745,631) |
| WTI Crude | 63 | 08/2023 | USD | 4,292,820 | — | (529,475) |
| WTI Crude | 63 | 10/2023 | USD | 4,261,320 | — | (414,681) |
| WTI Crude | 128 | 12/2023 | USD | 8,581,120 | — | (572,785) |
| Zinc | 34 | 07/2023 | USD | 1,907,188 | — | (328,340) |
| Zinc | 23 | 09/2023 | USD | 1,294,038 | — | (494,509) |
| Zinc | 23 | 11/2023 | USD | 1,295,763 | — | (303,192) |
| Zinc | 45 | 01/2024 | USD | 2,539,688 | — | (454,239) |
| Total | 1,568,473 | (19,690,035) | ||||
| Short futures contracts | ||||||
| Description | Number of contracts | Expiration date | Trading currency | Notional amount | Value/Unrealized appreciation ($) | Value/Unrealized depreciation ($) |
| U.S. Treasury 2-Year Note | (179) | 09/2023 | USD | (36,843,235) | 16,357 | — |
| (a) | Represents privately placed and other securities and instruments exempt from Securities and Exchange Commission registration (collectively, private placements), such as Section 4(a)(2) and Rule 144A eligible securities, which are often sold only to qualified institutional buyers. At May 31, 2023, the total value of these securities amounted to $66,250,747, which represents 25.50% of total net assets. |
| (b) | Variable rate security. The interest rate shown was the current rate as of May 31, 2023. |
| (c) | Variable or floating rate security, the interest rate of which adjusts periodically based on changes in current interest rates and prepayments on the underlying pool of assets. The interest rate shown was the current rate as of May 31, 2023. |
| (d) | Represents a variable rate security with a step coupon where the rate adjusts according to a schedule for a series of periods, typically lower for an initial period and then increasing to a higher coupon rate thereafter. The interest rate shown was the current rate as of May 31, 2023. |
| (e) | Principal and interest may not be guaranteed by a governmental entity. |
| (f) | The rate shown is the seven-day current annualized yield at May 31, 2023. |
| (g) | As defined in the Investment Company Act of 1940, as amended, an affiliated company is one in which the Fund owns 5% or more of the company’s outstanding voting securities, or a company which is under common ownership or control with the Fund. The value of the holdings and transactions in these affiliated companies during the year ended May 31, 2023 are as follows: |
| Affiliated issuers | Beginning of period($) | Purchases($) | Sales($) | Net change in unrealized appreciation (depreciation)($) | End of period($) | Realized gain (loss)($) | Dividends($) | End of period shares |
| Columbia Short-Term Cash Fund, 5.241% | ||||||||
| 230,547,183 | 502,189,834 | (634,302,942) | (8,896) | 98,425,179 | (45,078) | 3,080,315 | 98,474,416 | |
| 16 | Columbia Commodity Strategy Fund | Annual Report 2023 |
May 31, 2023
| CMO | Collateralized Mortgage Obligation |
| LIBOR | London Interbank Offered Rate |
| SOFR | Secured Overnight Financing Rate |
| USD | US Dollar |
| ■ | Level 1 — Valuations based on quoted prices for investments in active markets that the Fund has the ability to access at the measurement date. Valuation adjustments are not applied to Level 1 investments. |
| ■ | Level 2 — Valuations based on other significant observable inputs (including quoted prices for similar securities, interest rates, prepayment speeds, credit risks, etc.). |
| ■ | Level 3 — Valuations based on significant unobservable inputs (including the Fund’s own assumptions and judgment in determining the fair value of investments). |
| Level 1 ($) | Level 2 ($) | Level 3 ($) | Total ($) | |
| Investments in Securities | ||||
| Asset-Backed Securities — Non-Agency | — | 89,606,529 | — | 89,606,529 |
| Commercial Mortgage-Backed Securities - Non-Agency | — | 10,871,639 | — | 10,871,639 |
| Corporate Bonds & Notes | — | 109,048,543 | — | 109,048,543 |
| Foreign Government Obligations | — | 2,251,097 | — | 2,251,097 |
| Residential Mortgage-Backed Securities - Non-Agency | — | 6,746,251 | — | 6,746,251 |
| U.S. Government & Agency Obligations | — | 2,248,798 | — | 2,248,798 |
| U.S. Treasury Obligations | — | 2,252,922 | — | 2,252,922 |
| Money Market Funds | 98,425,179 | — | — | 98,425,179 |
| Total Investments in Securities | 98,425,179 | 223,025,779 | — | 321,450,958 |
| Investments in Derivatives | ||||
| Asset | ||||
| Futures Contracts | 1,584,830 | — | — | 1,584,830 |
| Columbia Commodity Strategy Fund | Annual Report 2023 | 17 |
May 31, 2023
| Level 1 ($) | Level 2 ($) | Level 3 ($) | Total ($) | |
| Liability | ||||
| Futures Contracts | (19,690,035) | — | — | (19,690,035) |
| Total | 80,319,974 | 223,025,779 | — | 303,345,753 |
| 18 | Columbia Commodity Strategy Fund | Annual Report 2023 |
May 31, 2023
| Assets | |
| Investments in securities, at value | |
| Unaffiliated issuers (cost $224,025,189) | $223,025,779 |
| Affiliated issuers (cost $98,435,310) | 98,425,179 |
| Cash | 45,072,517 |
| Margin deposits on: | |
| Futures contracts | 32,387,121 |
| Receivable for: | |
| Investments sold | 187,805 |
| Capital shares sold | 54,706 |
| Dividends | 577,100 |
| Interest | 969,266 |
| Foreign tax reclaims | 11,197 |
| Variation margin for futures contracts | 1,076,116 |
| Prepaid expenses | 5,288 |
| Total assets | 401,792,074 |
| Liabilities | |
| Payable for: | |
| Investments purchased | 2,110,118 |
| Capital shares purchased | 136,396,953 |
| Variation margin for futures contracts | 3,415,160 |
| Management services fees | 6,890 |
| Distribution and/or service fees | 280 |
| Transfer agent fees | 12,951 |
| Compensation of board members | 53,914 |
| Other expenses | 34,229 |
| Total liabilities | 142,030,495 |
| Net assets applicable to outstanding capital stock | $259,761,579 |
| Represented by | |
| Paid in capital | 522,989,812 |
| Total distributable earnings (loss) | (263,228,233) |
| Total - representing net assets applicable to outstanding capital stock | $259,761,579 |
| Columbia Commodity Strategy Fund | Annual Report 2023 | 19 |
May 31, 2023
| Class A | |
| Net assets | $20,036,927 |
| Shares outstanding | 2,365,633 |
| Net asset value per share | $8.47 |
| Maximum sales charge | 5.75% |
| Maximum offering price per share (calculated by dividing the net asset value per share by 1.0 minus the maximum sales charge for Class A shares) | $8.99 |
| Advisor Class | |
| Net assets | $13,225,773 |
| Shares outstanding | 1,455,675 |
| Net asset value per share | $9.09 |
| Class C | |
| Net assets | $4,034,556 |
| Shares outstanding | 566,569 |
| Net asset value per share | $7.12 |
| Institutional Class | |
| Net assets | $18,972,784 |
| Shares outstanding | 2,133,150 |
| Net asset value per share | $8.89 |
| Institutional 2 Class | |
| Net assets | $8,575,564 |
| Shares outstanding | 928,313 |
| Net asset value per share | $9.24 |
| Institutional 3 Class | |
| Net assets | $192,743,858 |
| Shares outstanding | 20,474,585 |
| Net asset value per share | $9.41 |
| Class R | |
| Net assets | $2,172,117 |
| Shares outstanding | 270,474 |
| Net asset value per share | $8.03 |
| 20 | Columbia Commodity Strategy Fund | Annual Report 2023 |
Year Ended May 31, 2023
| Net investment income | |
| Income: | |
| Dividends — affiliated issuers | $3,080,315 |
| Interest | 5,797,110 |
| Interfund lending | 2,743 |
| Foreign taxes withheld | (354) |
| Total income | 8,879,814 |
| Expenses: | |
| Management services fees | 1,998,710 |
| Distribution and/or service fees | |
| Class A | 65,939 |
| Class C | 51,861 |
| Class R | 12,022 |
| Transfer agent fees | |
| Class A | 37,105 |
| Advisor Class | 26,088 |
| Class C | 7,313 |
| Institutional Class | 64,948 |
| Institutional 2 Class | 6,730 |
| Institutional 3 Class | 12,581 |
| Class R | 3,403 |
| Compensation of board members | 20,263 |
| Custodian fees | 21,457 |
| Printing and postage fees | 36,416 |
| Registration fees | 133,627 |
| Accounting services fees | 40,290 |
| Legal fees | 16,659 |
| Compensation of chief compliance officer | 34 |
| Other | 19,554 |
| Total expenses | 2,575,000 |
| Expense reduction | (20) |
| Total net expenses | 2,574,980 |
| Net investment income | 6,304,834 |
| Realized and unrealized gain (loss) — net | |
| Net realized gain (loss) on: | |
| Investments — unaffiliated issuers | (1,381,522) |
| Investments — affiliated issuers | (45,078) |
| Futures contracts | (70,143,141) |
| Swap contracts | 445,812 |
| Net realized loss | (71,123,929) |
| Net change in unrealized appreciation (depreciation) on: | |
| Investments — unaffiliated issuers | 903,200 |
| Investments — affiliated issuers | (8,896) |
| Futures contracts | (42,052,788) |
| Swap contracts | 24,955 |
| Net change in unrealized appreciation (depreciation) | (41,133,529) |
| Net realized and unrealized loss | (112,257,458) |
| Net decrease in net assets resulting from operations | $(105,952,624) |
| Columbia Commodity Strategy Fund | Annual Report 2023 | 21 |
| Year Ended May 31, 2023 | Year Ended May 31, 2022 | |
| Operations | ||
| Net investment income (loss) | $6,304,834 | $(1,447,231) |
| Net realized gain (loss) | (71,123,929) | 194,142,110 |
| Net change in unrealized appreciation (depreciation) | (41,133,529) | (7,499,396) |
| Net increase (decrease) in net assets resulting from operations | (105,952,624) | 185,195,483 |
| Distributions to shareholders | ||
| Net investment income and net realized gains | ||
| Class A | (13,091,140) | (1,367,093) |
| Advisor Class | (6,087,308) | (907,105) |
| Class C | (2,316,643) | (526,987) |
| Institutional Class | (12,482,584) | (3,725,492) |
| Institutional 2 Class | (5,768,737) | (2,514,889) |
| Institutional 3 Class | (43,069,997) | (123,791,658) |
| Class R | (1,311,006) | (244,620) |
| Total distributions to shareholders | (84,127,415) | (133,077,844) |
| Increase (decrease) in net assets from capital stock activity | 16,082,060 | (45,107,803) |
| Total increase (decrease) in net assets | (173,997,979) | 7,009,836 |
| Net assets at beginning of year | 433,759,558 | 426,749,722 |
| Net assets at end of year | $259,761,579 | $433,759,558 |
| 22 | Columbia Commodity Strategy Fund | Annual Report 2023 |
| Year Ended | Year Ended | |||
| May 31, 2023 | May 31, 2022 | |||
| Shares | Dollars ($) | Shares | Dollars ($) | |
| Capital stock activity | ||||
| Class A | ||||
| Subscriptions | 1,190,286 | 19,404,883 | 1,912,684 | 37,475,133 |
| Distributions reinvested | 1,372,544 | 12,984,269 | 86,880 | 1,356,192 |
| Redemptions | (1,672,213) | (24,152,784) | (656,974) | (13,269,279) |
| Net increase | 890,617 | 8,236,368 | 1,342,590 | 25,562,046 |
| Advisor Class | ||||
| Subscriptions | 1,630,630 | 23,492,853 | 1,152,473 | 25,273,477 |
| Distributions reinvested | 594,517 | 6,022,454 | 53,518 | 865,391 |
| Redemptions | (1,986,456) | (31,559,191) | (155,727) | (3,403,112) |
| Net increase (decrease) | 238,691 | (2,043,884) | 1,050,264 | 22,735,756 |
| Class C | ||||
| Subscriptions | 281,127 | 3,325,844 | 239,505 | 4,580,503 |
| Distributions reinvested | 290,217 | 2,315,930 | 36,641 | 526,525 |
| Redemptions | (290,334) | (3,646,121) | (26,158) | (499,293) |
| Net increase | 281,010 | 1,995,653 | 249,988 | 4,607,735 |
| Institutional Class | ||||
| Subscriptions | 3,126,495 | 41,353,583 | 4,641,966 | 91,175,164 |
| Distributions reinvested | 1,243,568 | 12,336,201 | 232,754 | 3,724,071 |
| Redemptions | (6,547,667) | (103,674,723) | (629,517) | (13,227,370) |
| Net increase (decrease) | (2,177,604) | (49,984,939) | 4,245,203 | 81,671,865 |
| Institutional 2 Class | ||||
| Subscriptions | 404,062 | 5,024,414 | 456,720 | 9,921,132 |
| Distributions reinvested | 560,000 | 5,768,006 | 154,164 | 2,514,419 |
| Redemptions | (796,411) | (10,668,390) | (754,802) | (15,768,236) |
| Net increase (decrease) | 167,651 | 124,030 | (143,918) | (3,332,685) |
| Institutional 3 Class | ||||
| Subscriptions | 27,437,309 | 298,268,124 | 33,008,655 | 694,995,472 |
| Distributions reinvested | 4,102,610 | 43,036,376 | 7,516,160 | 123,791,160 |
| Redemptions | (21,922,485) | (285,164,246) | (48,212,582) | (996,632,284) |
| Net increase (decrease) | 9,617,434 | 56,140,254 | (7,687,767) | (177,845,652) |
| Class R | ||||
| Subscriptions | 98,876 | 1,416,624 | 81,715 | 1,583,080 |
| Distributions reinvested | 145,915 | 1,310,314 | 16,054 | 244,173 |
| Redemptions | (90,012) | (1,112,360) | (16,937) | (334,121) |
| Net increase | 154,779 | 1,614,578 | 80,832 | 1,493,132 |
| Total net increase (decrease) | 9,172,578 | 16,082,060 | (862,808) | (45,107,803) |
| Columbia Commodity Strategy Fund | Annual Report 2023 | 23 |
| Net asset value, beginning of period | Net investment income (loss) | Net realized and unrealized gain (loss) | Total from investment operations | Distributions from net investment income | Total distributions to shareholders | |
| Class A | ||||||
| Year Ended 5/31/2023 | $21.90 | 0.21 | (4.16) | (3.95) | (9.48) | (9.48) |
| Year Ended 5/31/2022 | $20.69 | (0.12) | 7.43 | 7.31 | (6.10) | (6.10) |
| Year Ended 5/31/2021(e) | $13.99 | (0.18) | 6.90 | 6.72 | (0.02) | (0.02) |
| Year Ended 5/31/2020(e) | $16.67 | 0.12 | (2.64) | (2.52) | (0.16) | (0.16) |
| Year Ended 5/31/2019(e) | $23.03 | 0.24 | (3.60) | (3.36) | (3.00) | (3.00) |
| Advisor Class | ||||||
| Year Ended 5/31/2023 | $22.71 | 0.25 | (4.34) | (4.09) | (9.53) | (9.53) |
| Year Ended 5/31/2022 | $21.22 | (0.08) | 7.70 | 7.62 | (6.13) | (6.13) |
| Year Ended 5/31/2021(e) | $14.32 | (0.11) | 7.03 | 6.92 | (0.02) | (0.02) |
| Year Ended 5/31/2020(e) | $17.05 | 0.16 | (2.69) | (2.53) | (0.20) | (0.20) |
| Year Ended 5/31/2019(e) | $23.49 | 0.28 | (3.64) | (3.36) | (3.08) | (3.08) |
| Class C | ||||||
| Year Ended 5/31/2023 | $20.09 | 0.10 | (3.75) | (3.65) | (9.32) | (9.32) |
| Year Ended 5/31/2022 | $19.53 | (0.26) | 6.86 | 6.60 | (6.04) | (6.04) |
| Year Ended 5/31/2021(e) | $13.30 | (0.30) | 6.54 | 6.24 | (0.01) | (0.01) |
| Year Ended 5/31/2020(e) | $15.84 | (0.00)(f) | (2.54) | (2.54) | (0.00)(f) | (0.00)(f) |
| Year Ended 5/31/2019(e) | $22.03 | 0.08 | (3.43) | (3.35) | (2.84) | (2.84) |
| Institutional Class | ||||||
| Year Ended 5/31/2023 | $22.47 | 0.24 | (4.29) | (4.05) | (9.53) | (9.53) |
| Year Ended 5/31/2022 | $21.05 | (0.05) | 7.59 | 7.54 | (6.12) | (6.12) |
| Year Ended 5/31/2021(e) | $14.20 | (0.15) | 7.02 | 6.87 | (0.02) | (0.02) |
| Year Ended 5/31/2020(e) | $16.91 | 0.20 | (2.71) | (2.51) | (0.20) | (0.20) |
| Year Ended 5/31/2019(e) | $23.32 | 0.28 | (3.61) | (3.33) | (3.08) | (3.08) |
| Institutional 2 Class | ||||||
| Year Ended 5/31/2023 | $22.92 | 0.27 | (4.40) | (4.13) | (9.55) | (9.55) |
| Year Ended 5/31/2022 | $21.34 | (0.07) | 7.78 | 7.71 | (6.13) | (6.13) |
| Year Ended 5/31/2021(e) | $14.40 | (0.12) | 7.08 | 6.96 | (0.02) | (0.02) |
| Year Ended 5/31/2020(e) | $17.14 | 0.24 | (2.78) | (2.54) | (0.20) | (0.20) |
| Year Ended 5/31/2019(e) | $23.59 | 0.32 | (3.69) | (3.37) | (3.08) | (3.08) |
| Institutional 3 Class | ||||||
| Year Ended 5/31/2023 | $23.15 | 0.29 | (4.47) | (4.18) | (9.56) | (9.56) |
| Year Ended 5/31/2022 | $21.48 | (0.07) | 7.88 | 7.81 | (6.14) | (6.14) |
| Year Ended 5/31/2021(e) | $14.48 | (0.11) | 7.14 | 7.03 | (0.03) | (0.03) |
| Year Ended 5/31/2020(e) | $17.20 | 0.20 | (2.72) | (2.52) | (0.20) | (0.20) |
| Year Ended 5/31/2019(e) | $23.66 | 0.32 | (3.66) | (3.34) | (3.12) | (3.12) |
| 24 | Columbia Commodity Strategy Fund | Annual Report 2023 |
| Net asset value, end of period | Total return | Total gross expense ratio to average net assets(a) | Total net expense ratio to average net assets(a),(b) | Net investment income (loss) ratio to average net assets | Portfolio turnover | Net assets, end of period (000’s) | |
| Class A | |||||||
| Year Ended 5/31/2023 | $8.47 | (22.59%) | 1.13% | 1.13%(c) | 1.62% | 142% | $20,037 |
| Year Ended 5/31/2022 | $21.90 | 47.23% | 1.12%(d) | 1.12%(d) | (0.57%) | 329% | $32,304 |
| Year Ended 5/31/2021(e) | $20.69 | 47.95% | 1.14%(d) | 1.14%(c),(d) | (1.03%) | 0% | $2,739 |
| Year Ended 5/31/2020(e) | $13.99 | (15.35%) | 1.14% | 1.14%(c) | 0.63% | 0% | $1,283 |
| Year Ended 5/31/2019(e) | $16.67 | (14.76%) | 1.11% | 1.11%(c) | 1.18% | 0% | $1,775 |
| Advisor Class | |||||||
| Year Ended 5/31/2023 | $9.09 | (22.33%) | 0.87% | 0.87%(c) | 1.76% | 142% | $13,226 |
| Year Ended 5/31/2022 | $22.71 | 47.57% | 0.89%(d) | 0.89%(d) | (0.36%) | 329% | $27,641 |
| Year Ended 5/31/2021(e) | $21.22 | 48.38% | 0.85%(d) | 0.85%(c),(d) | (0.71%) | 0% | $3,537 |
| Year Ended 5/31/2020(e) | $14.32 | (15.05%) | 0.89% | 0.89%(c) | 0.86% | 0% | $20,335 |
| Year Ended 5/31/2019(e) | $17.05 | (14.62%) | 0.86% | 0.86%(c) | 1.44% | 0% | $23,533 |
| Class C | |||||||
| Year Ended 5/31/2023 | $7.12 | (23.16%) | 1.88% | 1.88%(c) | 0.87% | 142% | $4,035 |
| Year Ended 5/31/2022 | $20.09 | 46.14% | 1.88%(d) | 1.88%(d) | (1.36%) | 329% | $5,738 |
| Year Ended 5/31/2021(e) | $19.53 | 47.13% | 1.87%(d) | 1.87%(c),(d) | (1.78%) | 0% | $695 |
| Year Ended 5/31/2020(e) | $13.30 | (16.08%) | 1.89% | 1.89%(c) | (0.11%) | 0% | $76 |
| Year Ended 5/31/2019(e) | $15.84 | (15.53%) | 1.86% | 1.86%(c) | 0.41% | 0% | $124 |
| Institutional Class | |||||||
| Year Ended 5/31/2023 | $8.89 | (22.43%) | 0.86% | 0.86%(c) | 1.55% | 142% | $18,973 |
| Year Ended 5/31/2022 | $22.47 | 47.60% | 0.86%(d) | 0.86%(d) | (0.26%) | 329% | $96,858 |
| Year Ended 5/31/2021(e) | $21.05 | 48.45% | 0.90%(d) | 0.90%(c),(d) | (0.82%) | 0% | $1,380 |
| Year Ended 5/31/2020(e) | $14.20 | (15.15%) | 0.86% | 0.86%(c) | 1.07% | 0% | $66 |
| Year Ended 5/31/2019(e) | $16.91 | (14.51%) | 0.84% | 0.84%(c) | 1.35% | 0% | $771 |
| Institutional 2 Class | |||||||
| Year Ended 5/31/2023 | $9.24 | (22.32%) | 0.79% | 0.79% | 1.84% | 142% | $8,576 |
| Year Ended 5/31/2022 | $22.92 | 47.79% | 0.77%(d) | 0.77%(d) | (0.34%) | 329% | $17,431 |
| Year Ended 5/31/2021(e) | $21.34 | 48.41% | 0.77%(d) | 0.77%(d) | (0.68%) | 0% | $19,305 |
| Year Ended 5/31/2020(e) | $14.40 | (14.90%) | 0.76% | 0.76% | 1.32% | 0% | $57 |
| Year Ended 5/31/2019(e) | $17.14 | (14.64%) | 0.78% | 0.78% | 1.52% | 0% | $1,404 |
| Institutional 3 Class | |||||||
| Year Ended 5/31/2023 | $9.41 | (22.31%) | 0.72% | 0.72% | 2.20% | 142% | $192,744 |
| Year Ended 5/31/2022 | $23.15 | 47.94% | 0.70%(d) | 0.70%(d) | (0.32%) | 329% | $251,323 |
| Year Ended 5/31/2021(e) | $21.48 | 48.57% | 0.71%(d) | 0.71%(d) | (0.61%) | 0% | $398,386 |
| Year Ended 5/31/2020(e) | $14.48 | (14.77%) | 0.70% | 0.70% | 1.20% | 0% | $159,442 |
| Year Ended 5/31/2019(e) | $17.20 | (14.34%) | 0.70% | 0.70% | 1.56% | 0% | $320,251 |
| Columbia Commodity Strategy Fund | Annual Report 2023 | 25 |
| Net asset value, beginning of period | Net investment income (loss) | Net realized and unrealized gain (loss) | Total from investment operations | Distributions from net investment income | Total distributions to shareholders | |
| Class R | ||||||
| Year Ended 5/31/2023 | $21.31 | 0.18 | (4.04) | (3.86) | (9.42) | (9.42) |
| Year Ended 5/31/2022 | $20.32 | (0.18) | 7.25 | 7.07 | (6.08) | (6.08) |
| Year Ended 5/31/2021(e) | $13.77 | (0.21) | 6.77 | 6.56 | (0.01) | (0.01) |
| Year Ended 5/31/2020(e) | $16.40 | 0.04 | (2.55) | (2.51) | (0.12) | (0.12) |
| Year Ended 5/31/2019(e) | $22.70 | 0.20 | (3.54) | (3.34) | (2.96) | (2.96) |
| Notes to Consolidated Financial Highlights | |
| (a) | In addition to the fees and expenses that the Fund bears directly, the Fund indirectly bears a pro rata share of the fees and expenses of any other funds in which it invests. Such indirect expenses are not included in the Fund’s reported expense ratios. |
| (b) | Total net expenses include the impact of certain fee waivers/expense reimbursements made by the Investment Manager and certain of its affiliates, if applicable. |
| (c) | The benefits derived from expense reductions had an impact of less than 0.01%. |
| (d) | Ratios include interest on collateral expense. For the periods indicated below, if interest on collateral expense had been excluded, expenses would have been lower by: |
| Class | 5/31/2022 | 5/31/2021 |
| Class A | 0.01% | 0.02% |
| Advisor Class | 0.01% | less than 0.01% |
| Class C | 0.01% | 0.05% |
| Institutional Class | 0.01% | 0.02% |
| Institutional 2 Class | 0.01% | 0.02% |
| Institutional 3 Class | 0.01% | 0.01% |
| Class R | 0.01% | 0.01% |
| (e) | Per share amounts have been adjusted on a retroactive basis to reflect a 4 to 1 reverse stock split completed after the close of business on September 11, 2020. |
| (f) | Rounds to zero. |
| 26 | Columbia Commodity Strategy Fund | Annual Report 2023 |
| Net asset value, end of period | Total return | Total gross expense ratio to average net assets(a) | Total net expense ratio to average net assets(a),(b) | Net investment income (loss) ratio to average net assets | Portfolio turnover | Net assets, end of period (000’s) | |
| Class R | |||||||
| Year Ended 5/31/2023 | $8.03 | (22.77%) | 1.38% | 1.38%(c) | 1.46% | 142% | $2,172 |
| Year Ended 5/31/2022 | $21.31 | 46.82% | 1.37%(d) | 1.37%(d) | (0.89%) | 329% | $2,466 |
| Year Ended 5/31/2021(e) | $20.32 | 47.81% | 1.38%(d) | 1.38%(c),(d) | (1.27%) | 0% | $708 |
| Year Ended 5/31/2020(e) | $13.77 | (15.59%) | 1.39% | 1.39%(c) | 0.38% | 0% | $416 |
| Year Ended 5/31/2019(e) | $16.40 | (15.08%) | 1.36% | 1.36%(c) | 0.97% | 0% | $590 |
| Columbia Commodity Strategy Fund | Annual Report 2023 | 27 |
May 31, 2023
| CCSF Offshore Fund, Ltd. | |
| % of consolidated fund net assets | 13.62% |
| Net assets | $35,388,539 |
| Net investment income (loss) | 354,999 |
| Net realized gain (loss) | (70,425,461) |
| Net change in unrealized appreciation (depreciation) | (42,069,145) |
| 28 | Columbia Commodity Strategy Fund | Annual Report 2023 |
May 31, 2023
| Columbia Commodity Strategy Fund | Annual Report 2023 | 29 |
May 31, 2023
| 30 | Columbia Commodity Strategy Fund | Annual Report 2023 |
May 31, 2023
| Columbia Commodity Strategy Fund | Annual Report 2023 | 31 |
May 31, 2023
| Asset derivatives | ||
| Risk exposure category | Consolidated statement of assets and liabilities location | Fair value ($) |
| Interest rate risk | Component of total distributable earnings (loss) — unrealized appreciation on futures contracts | 16,357* |
| Commodity-related investment risk | Component of total distributable earnings (loss) — unrealized appreciation on futures contracts | 1,568,473* |
| Total | 1,584,830 |
| Liability derivatives | ||
| Risk exposure category | Consolidated statement of assets and liabilities location | Fair value ($) |
| Commodity-related investment risk | Component of total distributable earnings (loss) — unrealized depreciation on futures contracts | 19,690,035* |
| * | Includes cumulative appreciation (depreciation) as reported in the tables following the Consolidated Portfolio of Investments. Only the current day’s variation margin for futures and centrally cleared swaps, if any, is reported in receivables or payables in the Consolidated Statement of Assets and Liabilities. |
| Amount of realized gain (loss) on derivatives recognized in income | |||
| Risk exposure category | Futures contracts ($) | Swap contracts ($) | Total ($) |
| Commodity-related investment risk | (70,425,463) | — | (70,425,463) |
| Interest rate risk | 282,322 | 445,812 | 728,134 |
| Total | (70,143,141) | 445,812 | (69,697,329) |
| Change in unrealized appreciation (depreciation) on derivatives recognized in income | |||
| Risk exposure category | Futures contracts ($) | Swap contracts ($) | Total ($) |
| Commodity-related investment risk | (42,069,145) | — | (42,069,145) |
| Interest rate risk | 16,357 | 24,955 | 41,312 |
| Total | (42,052,788) | 24,955 | (42,027,833) |
| Derivative instrument | Average notional amounts ($)* |
| Futures contracts — long | 327,011,674 |
| Futures contracts — short | 22,040,147 |
| 32 | Columbia Commodity Strategy Fund | Annual Report 2023 |
May 31, 2023
| Derivative instrument | Average unrealized appreciation ($)** | Average unrealized depreciation ($)** |
| Interest rate swap contracts | 102,110 | (1,868) |
| * | Based on the ending quarterly outstanding amounts for the year ended May 31, 2023. |
| ** | Based on the ending daily outstanding amounts for the year ended May 31, 2023. |
| Columbia Commodity Strategy Fund | Annual Report 2023 | 33 |
May 31, 2023
| 34 | Columbia Commodity Strategy Fund | Annual Report 2023 |
May 31, 2023
| Effective rate (%) | |
| Class A | 0.14 |
| Advisor Class | 0.14 |
| Class C | 0.14 |
| Institutional Class | 0.14 |
| Institutional 2 Class | 0.06 |
| Institutional 3 Class | 0.01 |
| Class R | 0.14 |
| Columbia Commodity Strategy Fund | Annual Report 2023 | 35 |
May 31, 2023
| Front End (%) | CDSC (%) | Amount ($) | |
| Class A | 5.75 | 0.50 - 1.00(a) | 146,175 |
| Class C | — | 1.00(b) | 2,068 |
| (a) | This charge is imposed on certain investments of between $1 million and $50 million redeemed within 18 months after purchase, as follows: 1.00% if redeemed within 12 months after purchase, and 0.50% if redeemed more than 12, but less than 18, months after purchase, with certain limited exceptions. |
| (b) | This charge applies to redemptions within 12 months after purchase, with certain limited exceptions. |
| October 1, 2022 through September 30, 2023 | Prior to October 1, 2022 | |
| Class A | 1.20% | 1.29% |
| Advisor Class | 0.95 | 1.04 |
| Class C | 1.95 | 2.04 |
| Institutional Class | 0.95 | 1.04 |
| Institutional 2 Class | 0.87 | 0.91 |
| Institutional 3 Class | 0.82 | 0.87 |
| Class R | 1.45 | 1.54 |
| 36 | Columbia Commodity Strategy Fund | Annual Report 2023 |
May 31, 2023
| Excess of distributions over net investment income ($) | Accumulated net realized gain ($) | Paid in capital ($) |
| (70,180,690) | (448,136) | 70,628,826 |
| Year Ended May 31, 2023 | Year Ended May 31, 2022 | ||||
| Ordinary income ($) | Long-term capital gains ($) | Total ($) | Ordinary income ($) | Long-term capital gains ($) | Total ($) |
| 84,127,415 | — | 84,127,415 | 133,077,844 | — | 133,077,844 |
| Undistributed ordinary income ($) | Undistributed long-term capital gains ($) | Capital loss carryforwards ($) | Net unrealized (depreciation) ($) |
| 4,296,065 | — | (2,637,434) | (266,601,234) |
| Federal tax cost ($) | Gross unrealized appreciation ($) | Gross unrealized (depreciation) ($) | Net unrealized (depreciation) ($) |
| 623,457,088 | 16,357 | (266,617,591) | (266,601,234) |
| Columbia Commodity Strategy Fund | Annual Report 2023 | 37 |
May 31, 2023
| No expiration short-term ($) | No expiration long-term ($) | Total ($) | Utilized ($) |
| (1,876,512) | (760,922) | (2,637,434) | — |
| Borrower or lender | Average loan balance ($) | Weighted average interest rate (%) | Number of days with outstanding loans |
| Lender | 2,070,000 | 4.99 | 10 |
| 38 | Columbia Commodity Strategy Fund | Annual Report 2023 |
May 31, 2023
| Columbia Commodity Strategy Fund | Annual Report 2023 | 39 |
May 31, 2023
| 40 | Columbia Commodity Strategy Fund | Annual Report 2023 |
May 31, 2023
| Columbia Commodity Strategy Fund | Annual Report 2023 | 41 |
May 31, 2023
| 42 | Columbia Commodity Strategy Fund | Annual Report 2023 |
| Columbia Commodity Strategy Fund | Annual Report 2023 | 43 |
| Name, address, year of birth | Position held with the Columbia Funds and length of service | Principal occupation(s) during past five years and other relevant professional experience | Number of Funds in the Columbia Funds Complex* overseen | Other directorships held by Trustee during the past five years and other relevant Board experience |
| George S. Batejan c/o Columbia Management Investment Advisers, LLC 290 Congress Street Boston, MA 02210 1954 | Trustee since 2017 | Executive Vice President, Global Head of Technology and Operations, Janus Capital Group, Inc., 2010-2016 | 174 | Former Chairman of the Board, NICSA (National Investment Company Services Association) (Executive Committee, Nominating Committee and Governance Committee), 2014-2016; former Director, Intech Investment Management, 2011-2016; former Board Member, Metro Denver Chamber of Commerce, 2015-2016; former Advisory Board Member, University of Colorado Business School, 2015-2018; former Board Member, Chase Bank International, 1993-1994 |
| Kathleen Blatz c/o Columbia Management Investment Advisers, LLC 290 Congress Street Boston, MA 02210 1954 | Trustee since 2006 | Attorney, specializing in arbitration and mediation; Chief Justice, Minnesota Supreme Court, 1998-2006; Associate Justice, Minnesota Supreme Court, 1996-1998; Fourth Judicial District Court Judge, Hennepin County, 1994-1996; Attorney in private practice and public service, 1984-1993; State Representative, Minnesota House of Representatives, 1979-1993, which included service on the Tax and Financial Institutions and Insurance Committees; Member and Interim Chair, Minnesota Sports Facilities Authority, January-July 2017; Interim President and Chief Executive Officer, Blue Cross and Blue Shield of Minnesota (health care insurance), February-July 2018, April-October 2021 | 174 | Former Trustee, Blue Cross and Blue Shield of Minnesota, 2009-2021 (Chair of the Business Development Committee, 2014-2017; Chair of the Governance Committee, 2017-2019); former Member and Chair of the Board, Minnesota Sports Facilities Authority, January 2017-July 2017; former Director, Robina Foundation, 2009-2020 (Chair, 2014-2020); Director, Richard M. Schulze Family Foundation, since 2021 |
| 44 | Columbia Commodity Strategy Fund | Annual Report 2023 |
(Unaudited)
Independent trustees (continued)
| Name, address, year of birth | Position held with the Columbia Funds and length of service | Principal occupation(s) during past five years and other relevant professional experience | Number of Funds in the Columbia Funds Complex* overseen | Other directorships held by Trustee during the past five years and other relevant Board experience |
| Pamela G. Carlton c/o Columbia Management Investment Advisers, LLC 290 Congress Street Boston, MA 02210 1954 | Chair since 2023; Trustee since 2007 | President, Springboard — Partners in Cross Cultural Leadership (consulting company), since 2003; Managing Director of US Equity Research, JP Morgan Chase, 1999-2003; Director of US Equity Research, Chase Asset Management, 1996-1999; Co-Director Latin America Research, 1993-1996, COO Global Research, 1992-1996, Co-Director of US Research, 1991-1992, Investment Banker, 1982-1991, Morgan Stanley; Attorney, Cleary Gottlieb Steen & Hamilton LLP, 1980-1982 | 174 | Trustee, New York Presbyterian Hospital Board, since 1996; Director, DR Bank (Audit Committee) since 2017; Director, Evercore Inc. (Audit Committee, Nominating and Governance Committee), since 2019; Director, Apollo Commercial Real Estate Finance, Inc. (Chair, Nominating and Governance Committee) (financial services), since 2021; the Governing Council of the Independent Directors Council (IDC), since 2021 |
| Janet Langford Carrig c/o Columbia Management Investment Advisers, LLC 290 Congress Street Boston, MA 02210 1957 | Trustee since 1996 | Senior Vice President, General Counsel and Corporate Secretary, ConocoPhillips (independent energy company), September 2007-October 2018 | 174 | Director, EQT Corporation (natural gas producer), since 2019; former Director, Whiting Petroleum Corporation (independent oil and gas company), 2020-2022 |
| J. Kevin Connaughton c/o Columbia Management Investment Advisers, LLC 290 Congress Street Boston, MA 02210 1964 | Trustee since 2020 | CEO and President, RhodeWay Financial (non-profit financial planning firm), since December 2022; Member, FINRA National Adjudicatory Council, since January 2020; Adjunct Professor of Finance, Bentley University since January 2018; Consultant to Independent Trustees of CFVIT and CFST I from March 2016 to June 2020 with respect to CFVIT and to December 2020 with respect to CFST I; Managing Director and General Manager of Mutual Fund Products, Columbia Management Investment Advisers, LLC, May 2010-February 2015; President, Columbia Funds, 2008-2015; and senior officer of Columbia Funds and affiliated funds, 2003-2015 | 172 | Former Director, The Autism Project, March 2015-December 2021; former Member of the Investment Committee, St. Michael’s College, November 2015-February 2020; former Trustee, St. Michael’s College, June 2017-September 2019; former Trustee, New Century Portfolios (former mutual fund complex), January 2015-December 2017 |
| Olive M. Darragh c/o Columbia Management Investment Advisers, LLC 290 Congress Street Boston, MA 02210 1962 | Trustee since 2020 | Managing Director of Darragh Inc. (strategy and talent management consulting firm), since 2010; Founder and CEO, Zolio, Inc. (investment management talent identification platform), since 2004; Consultant to Independent Trustees of CFVIT and CFST I from June 2019 to June 2020 with respect to CFVIT and to December 2020 with respect to CFST I; Partner, Tudor Investments, 2004-2010; Senior Partner, McKinsey & Company (consulting), 1990-2004; Touche Ross CPA, 1985-1988 | 172 | Treasurer, Edinburgh University US Trust Board, since January 2023; Member, HBS Community Action Partners Board, since September 2022; former Director, University of Edinburgh Business School (Member of US Board), 2004-2019; former Director, Boston Public Library Foundation, 2008-2017 |
| Columbia Commodity Strategy Fund | Annual Report 2023 | 45 |
(Unaudited)
Independent trustees (continued)
| Name, address, year of birth | Position held with the Columbia Funds and length of service | Principal occupation(s) during past five years and other relevant professional experience | Number of Funds in the Columbia Funds Complex* overseen | Other directorships held by Trustee during the past five years and other relevant Board experience |
| Patricia M. Flynn c/o Columbia Management Investment Advisers, LLC 290 Congress Street Boston, MA 02210 1950 | Trustee since 2004 | Professor of Economics and Management, Bentley University, since 2002; Dean, McCallum Graduate School of Business, Bentley University, 1992-2002 | 174 | Former Trustee, MA Taxpayers Foundation, 1997-2022; former Director, The MA Business Roundtable, 2003-2019; former Chairperson, Innovation Index Advisory Committee, MA Technology Collaborative, 1997-2020 |
| Brian J. Gallagher c/o Columbia Management Investment Advisers, LLC 290 Congress Street Boston, MA 02210 1954 | Trustee since 2017 | Retired; Partner with Deloitte & Touche LLP and its predecessors, 1977-2016 | 174 | Trustee, Catholic Schools Foundation, since 2004 |
| Douglas A. Hacker c/o Columbia Management Investment Advisers, LLC 290 Congress Street Boston, MA 02210 1955 | Trustee since 1996 | Independent business executive, since May 2006; Executive Vice President – Strategy of United Airlines, December 2002 - May 2006; President of UAL Loyalty Services (airline marketing company), September 2001-December 2002; Executive Vice President and Chief Financial Officer of United Airlines, July 1999-September 2001 | 174 | Director, SpartanNash Company since November 2013 (Chair of the Board, since May 2021) (food distributor); Director, Aircastle Limited (Chair of Audit Committee) (aircraft leasing), since August 2006; former Director, Nash Finch Company (food distributor), 2005-2013; former Director, SeaCube Container Leasing Ltd. (container leasing), 2010-2013; and former Director, Travelport Worldwide Limited (travel information technology), 2014-2019 |
| Nancy T. Lukitsh c/o Columbia Management Investment Advisers, LLC 290 Congress Street Boston, MA 02210 1956 | Trustee since 2011 | Senior Vice President, Partner and Director of Marketing, Wellington Management Company, LLP (investment adviser), 1997-2010; Chair, Wellington Management Portfolios (commingled non-U.S. investment pools), 2007-2010; Director, Wellington Trust Company, NA and other Wellington affiliates, 1997-2010 | 172 | None |
| 46 | Columbia Commodity Strategy Fund | Annual Report 2023 |
(Unaudited)
Independent trustees (continued)
| Name, address, year of birth | Position held with the Columbia Funds and length of service | Principal occupation(s) during past five years and other relevant professional experience | Number of Funds in the Columbia Funds Complex* overseen | Other directorships held by Trustee during the past five years and other relevant Board experience |
| David M. Moffett c/o Columbia Management Investment Advisers, LLC 290 Congress Street Boston, MA 02210 1952 | Trustee since 2011 | Retired; former Chief Executive Officer of Freddie Mac and Chief Financial Officer of U.S. Bank | 172 | Director, CSX Corporation (transportation suppliers); Director, PayPal Holdings Inc. (payment and data processing services); Trustee, University of Oklahoma Foundation; former Director, eBay Inc. (online trading community), 2007-2015; and former Director, CIT Bank, CIT Group Inc. (commercial and consumer finance), 2010-2016; former Senior Adviser to The Carlyle Group (financial services), March 2008-September 2008; former Governance Consultant to Bridgewater Associates, January 2013-December 2015 |
| Catherine James Paglia c/o Columbia Management Investment Advisers, LLC 290 Congress Street Boston, MA 02210 1952 | Trustee since 2004 | Director, Enterprise Asset Management, Inc. (private real estate and asset management company), since September 1998; Managing Director and Partner, Interlaken Capital, Inc., 1989-1997; Vice President, 1982-1985, Principal, 1985-1987, Managing Director, 1987-1989, Morgan Stanley; Vice President, Investment Banking, 1980-1982, Associate, Investment Banking, 1976-1980, Dean Witter Reynolds, Inc. | 174 | Director, Valmont Industries, Inc. (irrigation systems manufacturer), since 2012; Trustee, Carleton College (on the Investment Committee), since 1987; Trustee, Carnegie Endowment for International Peace (on the Investment Committee), since 2009 |
| Natalie A. Trunow c/o Columbia Management Investment Advisers, LLC 290 Congress Street Boston, MA 02210 1967 | Trustee since 2020 | Chief Executive Officer, Millennial Portfolio Solutions LLC (asset management and consulting services), January 2016-January 2021; Non-executive Member of the Investment Committee and Valuation Committee, Sarona Asset Management Inc. (private equity firm) since September 2019; Advisor, Horizon Investments (asset management and consulting services), August 2018-January 2022; Advisor, Paradigm Asset Management, November 2016-January 2022; Consultant to Independent Trustees of CFVIT and CFST I from September 2016 to June 2020 with respect to CFVIT and to December 2020 with respect to CFST I; Director of Investments/Consultant, Casey Family Programs, April 2016-November 2016; Senior Vice President and Chief Investment Officer, Calvert Investments, August 2008-January 2016; Section Head and Portfolio Manager, General Motors Asset Management, June 1997-August 2008 | 172 | Independent Director, Investment Committee, Health Services for Children with Special Needs, Inc., 2010-2021; Independent Director, (Executive Committee and Chair, Audit Committee), Consumer Credit Counseling Services (formerly Guidewell Financial Solutions), since 2016; Independent Director, (Investment Committee), Sarona Asset Management, since 2019 |
| Columbia Commodity Strategy Fund | Annual Report 2023 | 47 |
(Unaudited)
Independent trustees (continued)
| Name, address, year of birth | Position held with the Columbia Funds and length of service | Principal occupation(s) during past five years and other relevant professional experience | Number of Funds in the Columbia Funds Complex* overseen | Other directorships held by Trustee during the past five years and other relevant Board experience |
| Sandra L. Yeager c/o Columbia Management Investment Advisers, LLC 290 Congress Street Boston, MA 02210 1964 | Trustee since 2017 | Retired; President and founder, Hanoverian Capital, LLC (SEC registered investment advisor firm), 2008-2016; Managing Director, DuPont Capital, 2006-2008; Managing Director, Morgan Stanley Investment Management, 2004-2006; Senior Vice President, Alliance Bernstein, 1990-2004 | 174 | Former Director, NAPE (National Alliance for Partnerships in Equity) Education Foundation, October 2016-October 2020; Advisory Board, Jennersville YMCA, since 2022 |
| Name, address, year of birth | Position held with the Columbia Funds and length of service | Principal occupation(s) during the past five years and other relevant professional experience | Number of Funds in the Columbia Funds Complex overseen | Other directorships held by Trustee during the past five years and other relevant Board experience |
| Daniel J. Beckman c/o Columbia Management Investment Advisers, LLC 290 Congress Street Boston, MA 02210 1962 | Trustee since November 2021 and President since June 2021 | Vice President – Head of North America Product, Columbia Management Investment Advisers, LLC, since April 2015; President and Principal Executive Officer of the Columbia Funds, since June 2021; officer of Columbia Funds and affiliated funds, 2020-2021 | 174 | Director, Ameriprise Trust Company, since October 2016; Director, Columbia Management Investment Distributors, Inc. since November 2018; Board of Governors, Columbia Wanger Asset Management, LLC since, January 2022; Director, Columbia Threadneedle Canada, Inc., since December 2022 |
| * | The term “Columbia Funds Complex” as used herein includes Columbia Seligman Premium Technology Growth Fund, Tri-Continental Corporation and each series of Columbia Funds Series Trust (CFST), Columbia Funds Series Trust I (CFST I), Columbia Funds Series Trust II (CFST II), Columbia ETF Trust I (CET I), Columbia ETF Trust II (CET II), Columbia Funds Variable Insurance Trust (CFVIT) and Columbia Funds Variable Series Trust II (CFVST II). Messrs. Batejan, Beckman, Gallagher and Hacker and Mses. Blatz, Carlton, Carrig, Flynn, Paglia, and Yeager serve as directors of Columbia Seligman Premium Technology Growth Fund and Tri-Continental Corporation. |
| ** | Interested person (as defined under the 1940 Act) by reason of being an officer, director, security holder and/or employee of the Investment Manager or Ameriprise Financial. |
| 48 | Columbia Commodity Strategy Fund | Annual Report 2023 |
(Unaudited)
The Board has appointed officers who are responsible for day-to-day business decisions based on policies it has established. The officers serve at the pleasure of the Board. The following table provides basic information about the Officers of the Fund as of the printing of this report, including principal occupations during the past five years, although their specific titles may have varied over the period. In addition to Mr. Beckman, who is President and Principal Executive Officer, the Fund’s other officers are:
| Name, address and year of birth | Position and year first appointed to position for any Fund in the Columbia Funds Complex or a predecessor thereof | Principal occupation(s) during past five years |
| Michael G. Clarke 290 Congress Street Boston, MA 02210 1969 | Chief Financial Officer and Principal Financial Officer (2009) and Senior Vice President (2019) | Senior Vice President and North America Head of Operations & Investor Services, Columbia Management Investment Advisers, LLC, since June 2023 (previously Senior Vice President and Head of Global Operations, March 2022 – June 2023, Vice President, Head of North America Operations, and Co-Head of Global Operations, June 2019 - February 2022 and Vice President – Accounting and Tax, May 2010 - May 2019); senior officer of Columbia Funds and affiliated funds, since 2002. Director, Ameriprise Trust Company, since June 2023. |
| Joseph Beranek 5890 Ameriprise Financial Center Minneapolis, MN 55474 1965 | Treasurer and Chief Accounting Officer (Principal Accounting Officer) (2019) and Principal Financial Officer (2020), CFST, CFST I, CFST II, CFVIT and CFVST II; Assistant Treasurer, CET I and CET II | Vice President – Mutual Fund Accounting and Financial Reporting, Columbia Management Investment Advisers, LLC, since December 2018 and March 2017, respectively. |
| Marybeth Pilat 290 Congress Street Boston, MA 02210 1968 | Treasurer and Chief Accounting Officer (Principal Accounting Officer) and Principal Financial Officer (2020) for CET I and CET II; Assistant Treasurer, CFST, CFST I, CFST II, CFVIT and CFVST II | Vice President – Product Pricing and Administration, Columbia Management Investment Advisers, LLC, since May 2017. |
| William F. Truscott 290 Congress Street Boston, MA 02210 1960 | Senior Vice President (2001) | Formerly, Trustee/Director of Columbia Funds Complex or legacy funds, November 2001 - January 1, 2021; Chief Executive Officer, Global Asset Management, Ameriprise Financial, Inc., since September 2012; Chairman of the Board and President, Columbia Management Investment Advisers, LLC, since July 2004 and February 2012, respectively; Chairman of the Board and Chief Executive Officer, Columbia Management Investment Distributors, Inc., since November 2008 and February 2012, respectively;Chairman of the Board and Director, Threadneedle Asset Management Holdings, Sàrl, since March 2013 and December 2008, respectively; senior executive of various entities affiliated with Columbia Threadneedle. |
| Christopher O. Petersen 5228 Ameriprise Financial Center Minneapolis, MN 55474 1970 | Senior Vice President and Assistant Secretary (2021) | Formerly, Trustee/Director of funds within the Columbia Funds Complex, July 1, 2020 - November 22, 2021; Senior Vice President and Assistant General Counsel, Ameriprise Financial, Inc., since September 2021 (previously Vice President and Lead Chief Counsel, January 2015 - September 2021); formerly, President and Principal Executive Officer of the Columbia Funds, 2015 - 2021; officer of Columbia Funds and affiliated funds, since 2007. |
| Thomas P. McGuire 290 Congress Street Boston, MA 02210 1972 | Senior Vice President and Chief Compliance Officer (2012) | Vice President – Asset Management Compliance, Ameriprise Financial, Inc., since May 2010; Chief Compliance Officer, Columbia Acorn/Wanger Funds, since December 2015; formerly, Chief Compliance Officer, Ameriprise Certificate Company, September 2010 – September 2020. |
| Ryan C. Larrenaga 290 Congress Street Boston, MA 02210 1970 | Senior Vice President (2017), Chief Legal Officer (2017), and Secretary (2015) | Vice President and Chief Counsel, Ameriprise Financial, Inc., since August 2018 (previously Vice President and Group Counsel, August 2011 - August 2018); Chief Legal Officer, Columbia Acorn/Wanger Funds, since September 2020; officer of Columbia Funds and affiliated funds, since 2005. |
| Columbia Commodity Strategy Fund | Annual Report 2023 | 49 |
(Unaudited)
Fund officers (continued)
| Name, address and year of birth | Position and year first appointed to position for any Fund in the Columbia Funds Complex or a predecessor thereof | Principal occupation(s) during past five years |
| Michael E. DeFao 290 Congress Street Boston, MA 02210 1968 | Vice President (2011) and Assistant Secretary (2010) | Vice President and Chief Counsel, Ameriprise Financial, Inc., since May 2010; Vice President, Chief Legal Officer and Assistant Secretary, Columbia Management Investment Advisers, LLC, since October 2021 (previously Vice President and Assistant Secretary, May 2010 – September 2021). |
| Lyn Kephart-Strong 5903 Ameriprise Financial Center Minneapolis, MN 55474 1960 | Vice President (2015) | Vice President, Global Investment Operations Services, Columbia Management Investment Advisers, LLC, since 2010; Director (since January 2007) and President (since October 2014), Columbia Management Investment Services Corp.; Director (since December 2017) and President (since January 2017), Ameriprise Trust Company. |
| • | the Fund had sufficient liquidity to both meet redemptions and operate effectively on behalf of shareholders; |
| • | there were no material changes to the Program during the period; |
| • | the implementation of the Program was effective to manage the Fund’s liquidity risk; and |
| • | the Program operated adequately during the period. |
| 50 | Columbia Commodity Strategy Fund | Annual Report 2023 |
columbiathreadneedleus.com/investor/. The Fund is distributed by Columbia Management Investment Distributors, Inc., member FINRA, and managed by Columbia Management Investment Advisers, LLC.

May 31, 2023

| 3 | |
| 5 | |
| 7 | |
| 8 | |
| 25 | |
| 27 | |
| 28 | |
| 30 | |
| 34 | |
| 51 | |
| 52 | |
| 58 |
(Unaudited)
| Average annual total returns (%) (for the period ended May 31, 2023) | |||||
| Inception | 1 Year | 5 Years | Life | ||
| Class A | Excluding sales charges | 04/30/14 | -10.26 | 0.85 | 2.74 |
| Including sales charges | -12.98 | 0.23 | 2.40 | ||
| Advisor Class | 04/30/14 | -10.04 | 1.10 | 2.99 | |
| Class C | Excluding sales charges | 04/30/14 | -10.84 | 0.10 | 1.97 |
| Including sales charges | -11.68 | 0.10 | 1.97 | ||
| Institutional Class | 04/30/14 | -10.04 | 1.08 | 2.99 | |
| Institutional 2 Class | 04/30/14 | -10.01 | 1.15 | 3.05 | |
| Institutional 3 Class* | 03/01/17 | -9.95 | 1.20 | 2.99 | |
| FTSE One-Month U.S. Treasury Bill Index | 3.32 | 1.45 | 0.98 | ||
| * | The returns shown for periods prior to the share class inception date (including returns for the Life of the Fund, which are since Fund inception) include the returns of the Fund’s oldest share class. Since the Fund launched more than one share class at its inception, Class A shares were used. These returns are adjusted to reflect any higher class-related operating expenses of the newer share classes, as applicable. Please visit columbiathreadneedleus.com/investor/investment-products/mutual-funds/appended-performance for more information. |
| Columbia Mortgage Opportunities Fund | Annual Report 2023 | 3 |
(Unaudited)
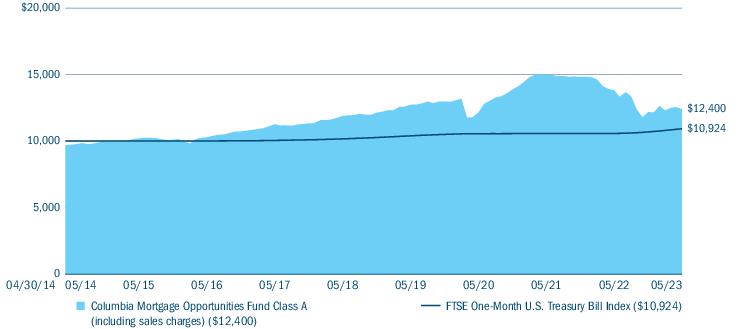
| Portfolio breakdown (%) (at May 31, 2023) | |
| Asset-Backed Securities — Non-Agency | 7.2 |
| Call Option Contracts Purchased | 0.9 |
| Commercial Mortgage-Backed Securities - Agency | 0.1 |
| Commercial Mortgage-Backed Securities - Non-Agency | 2.3 |
| Money Market Funds | 1.3 |
| Put Option Contracts Purchased | 0.1 |
| Residential Mortgage-Backed Securities - Agency | 60.2 |
| Residential Mortgage-Backed Securities - Non-Agency | 27.9 |
| Total | 100.0 |
| Quality breakdown (%) (at May 31, 2023) | |
| AAA rating | 62.2 |
| AA rating | 0.5 |
| A rating | 2.3 |
| BBB rating | 4.2 |
| BB rating | 6.9 |
| B rating | 2.6 |
| CCC rating | 0.5 |
| Not rated | 20.8 |
| Total | 100.0 |
| 4 | Columbia Mortgage Opportunities Fund | Annual Report 2023 |
(Unaudited)
| • | The Fund’s positioning over the period with respect to overall portfolio duration and corresponding interest rate sensitivity was, by a wide margin, the leading detractor from performance relative to the benchmark. Any exposure to interest rate risk proved detrimental relative to cash (as represented by the Fund’s benchmark) as Treasury yields finished the period higher. |
| • | The Fund’s allocation to commercial MBS weighed on performance, as higher borrowing costs negatively impacted profitability for the commercial real estate sector and pressured spreads wider, most notably with respect to issues backed by office properties. |
| • | Within asset-backed securities, holdings within the non-traditional, market-based lending segment performed poorly as delinquencies rose for the less-affluent consumers most impacted by the historically high inflation during the period. |
| • | The Fund’s positioning within non-agency residential MBS contributed positively to performance versus the benchmark. Fundamentals for the sector held up better than for most other credit-oriented areas of the market, supported by continued relative strength in the housing market, despite higher borrowing costs due to the rise in Treasury yields. |
| Columbia Mortgage Opportunities Fund | Annual Report 2023 | 5 |
(Unaudited)
| 6 | Columbia Mortgage Opportunities Fund | Annual Report 2023 |
(Unaudited)
| December 1, 2022 — May 31, 2023 | |||||||
| Account value at the beginning of the period ($) | Account value at the end of the period ($) | Expenses paid during the period ($) | Fund’s annualized expense ratio (%) | ||||
| Actual | Hypothetical | Actual | Hypothetical | Actual | Hypothetical | Actual | |
| Class A | 1,000.00 | 1,000.00 | 1,018.00 | 1,019.70 | 5.28 | 5.29 | 1.05 |
| Advisor Class | 1,000.00 | 1,000.00 | 1,019.30 | 1,020.94 | 4.03 | 4.03 | 0.80 |
| Class C | 1,000.00 | 1,000.00 | 1,015.40 | 1,015.96 | 9.04 | 9.05 | 1.80 |
| Institutional Class | 1,000.00 | 1,000.00 | 1,019.20 | 1,020.94 | 4.03 | 4.03 | 0.80 |
| Institutional 2 Class | 1,000.00 | 1,000.00 | 1,019.50 | 1,021.14 | 3.83 | 3.83 | 0.76 |
| Institutional 3 Class | 1,000.00 | 1,000.00 | 1,019.70 | 1,021.39 | 3.58 | 3.58 | 0.71 |
| Columbia Mortgage Opportunities Fund | Annual Report 2023 | 7 |
May 31, 2023
| Asset-Backed Securities — Non-Agency 13.9% | ||||
| Issuer | Coupon Rate | Principal Amount ($) | Value ($) | |
| ACHV ABS Trust(a) | ||||
| Subordinated Series 2023-1PL Class C | ||||
| 03/18/2030 | 7.420% | 1,750,000 | 1,749,248 | |
| Affirm Asset Securitization Trust(a) | ||||
| Series 2023-A Class 1A | ||||
| 01/18/2028 | 6.610% | 18,750,000 | 18,735,446 | |
| American Credit Acceptance Receivables Trust(a) | ||||
| Series 2021-2 Class F | ||||
| 01/13/2028 | 3.730% | 4,000,000 | 3,732,200 | |
| Subordinated Series 2021-2 Class E | ||||
| 07/13/2027 | 2.540% | 6,000,000 | 5,535,854 | |
| ARES CLO(a),(b) | ||||
| Series 2021-60A Class E | ||||
| 3-month USD LIBOR + 6.250% Floor 6.250% 07/18/2034 | 11.512% | 5,000,000 | 4,452,945 | |
| ARES XLIV CLO Ltd.(a),(b) | ||||
| Series 2017-44A Class DR | ||||
| 3-month USD LIBOR + 6.870% Floor 6.870% 04/15/2034 | 12.130% | 25,975,000 | 23,079,567 | |
| Avant Loans Funding Trust(a) | ||||
| Subordinated Series 2021-REV1 Class C | ||||
| 07/15/2030 | 2.300% | 3,375,000 | 3,125,596 | |
| Bain Capital Credit CLO Ltd.(a),(b) | ||||
| Series 2020-4A Class E | ||||
| 3-month USD LIBOR + 7.950% Floor 7.950% 10/20/2033 | 13.200% | 3,600,000 | 3,462,937 | |
| Carlyle Global Market Strategies CLO Ltd.(a),(b) | ||||
| Series 2013-3A Class BR | ||||
| 3-month USD LIBOR + 1.700% Floor 1.700% 10/15/2030 | 6.960% | 11,000,000 | 10,395,231 | |
| Series 2015-4A Class CR | ||||
| 3-month USD LIBOR + 3.700% 07/20/2032 | 8.950% | 7,500,000 | 7,109,670 | |
| Carvana Auto Receivables Trust(a) | ||||
| Subordinated Series 2021-N1 Class E | ||||
| 01/10/2028 | 2.880% | 11,180,000 | 10,252,887 | |
| Consumer Loan Underlying Bond Credit Trust(a),(c),(d) | ||||
| Subordinated Series 2018-P1 Class CERT | ||||
| 07/15/2025 | 0.000% | 850,000 | 811,750 | |
| Subordinated Series 2018-P2 Class CERT | ||||
| 10/15/2025 | 0.000% | 850,000 | 2,210,000 | |
| Asset-Backed Securities — Non-Agency (continued) | ||||
| Issuer | Coupon Rate | Principal Amount ($) | Value ($) | |
| Dryden CLO Ltd.(a),(b) | ||||
| Series 2018-57A Class B | ||||
| 3-month USD LIBOR + 1.350% Floor 1.350% 05/15/2031 | 6.671% | 1,250,000 | 1,202,733 | |
| GLS Auto Receivables Issuer Trust(a) | ||||
| Subordinated Series 2022-1A-B Class B | ||||
| 05/15/2026 | 2.840% | 5,000,000 | 4,865,522 | |
| LendingClub Receivables Trust(a),(c),(d) | ||||
| Series 2020-2 Class R | ||||
| 02/15/2046 | 0.000% | 865,000 | 1,946,250 | |
| Lendingpoint Asset Securitization Trust(a) | ||||
| Series 2022-C Class A | ||||
| 02/15/2030 | 6.560% | 7,138,763 | 7,126,317 | |
| LendingPoint Asset Securitization Trust(a),(d),(e) | ||||
| Subordinated Series 2021-1 Class D | ||||
| 04/15/2027 | 7.226% | 15,712,000 | 15,633,440 | |
| LP LMS Asset Securitization Trust(a),(d),(e) | ||||
| Subordinated Series 2021-2A Class B | ||||
| 01/15/2029 | 2.330% | 6,882,000 | 6,506,178 | |
| Madison Park Funding XXII Ltd.(a),(b) | ||||
| Series 2016-22A Class DR | ||||
| 3-month USD LIBOR + 3.500% Floor 3.500% 01/15/2033 | 8.760% | 3,700,000 | 3,461,228 | |
| Marlette Funding Trust(a) | ||||
| Series 2021-1A Class D | ||||
| 06/16/2031 | 2.470% | 1,000,000 | 929,490 | |
| Subordinated Series 2022-3A Class B | ||||
| 11/15/2032 | 5.950% | 7,000,000 | 6,945,965 | |
| Netcredit Combined Receivables LLC(a),(d) | ||||
| Series 2023-A Class A | ||||
| 12/20/2027 | 7.780% | 9,261,794 | 9,169,176 | |
| Octagon 54 Ltd.(a),(b) | ||||
| Series 2021-1A Class E | ||||
| 3-month USD LIBOR + 6.250% Floor 6.250% 07/15/2034 | 11.510% | 2,500,000 | 2,160,603 | |
| Octagon Investment Partners 47 Ltd.(a),(b) | ||||
| Series 2020-1A Class ER | ||||
| 3-month USD LIBOR + 6.250% Floor 6.250% 07/20/2034 | 11.500% | 15,250,000 | 13,548,969 | |
| OZLM Funding IV Ltd.(a),(b) | ||||
| Series 2013-4A Class D2R | ||||
| 3-month USD LIBOR + 7.250% Floor 7.250% 10/22/2030 | 12.523% | 2,000,000 | 1,616,294 | |
| 8 | Columbia Mortgage Opportunities Fund | Annual Report 2023 |
May 31, 2023
| Asset-Backed Securities — Non-Agency (continued) | ||||
| Issuer | Coupon Rate | Principal Amount ($) | Value ($) | |
| OZLM XVII Ltd.(a),(b) | ||||
| Series 2017-17A Class D | ||||
| 3-month USD LIBOR + 5.990% Floor 5.990% 07/20/2030 | 11.240% | 3,750,000 | 2,980,204 | |
| Pagaya AI Debt Selection Trust(a),(d) | ||||
| Series 2020-2 Class NOTE | ||||
| 12/15/2027 | 7.500% | 125,827 | 124,883 | |
| Pagaya AI Debt Selection Trust(a),(c),(d) | ||||
| Series 2020-3 Class CERT | ||||
| 05/17/2027 | 0.000% | 23,803,550 | 2,344,650 | |
| Series 2021-1 Class CERT | ||||
| 11/15/2027 | 0.000% | 1,901,904 | 51,351 | |
| Subordinated Series 2021-3 Class | ||||
| 05/15/2029 | 0.000% | 12,925,852 | 937,124 | |
| Subordinated Series 2021-5 Class | ||||
| 08/15/2029 | 0.000% | 12,321,273 | 1,601,766 | |
| Pagaya AI Debt Selection Trust(a) | ||||
| Series 2021-2 Class NOTE | ||||
| 01/25/2029 | 3.000% | 10,579,932 | 9,988,269 | |
| Pagaya AI Debt Trust(a) | ||||
| Series 2022-1 Class A | ||||
| 10/15/2029 | 2.030% | 11,306,815 | 10,946,833 | |
| Series 2022-5 Class A | ||||
| 06/17/2030 | 8.096% | 7,058,073 | 7,130,308 | |
| Series 2023-1 Class A | ||||
| 07/15/2030 | 7.556% | 4,645,020 | 4,626,407 | |
| Series 2023-3 Class A | ||||
| 12/16/2030 | 7.600% | 9,000,000 | 9,026,848 | |
| Subordinated Series 2022-2 Class B | ||||
| 01/15/2030 | 6.630% | 3,602,516 | 3,421,170 | |
| Subordinated Series 2022-3 Class B | ||||
| 03/14/2030 | 8.050% | 11,498,884 | 11,506,943 | |
| Subordinated Series 2022-5 Class B | ||||
| 06/17/2030 | 10.310% | 4,058,065 | 4,079,943 | |
| Subordinated Series 2023-1 Class B | ||||
| 07/15/2030 | 9.435% | 20,370,000 | 20,206,443 | |
| Subordinated Series 2023-3 Class B | ||||
| 12/16/2030 | 9.570% | 5,131,550 | 5,117,476 | |
| Palmer Square Loan Funding Ltd.(a),(b) | ||||
| Series 2020-4A Class D | ||||
| 3-month USD LIBOR + 7.050% Floor 7.050% 11/25/2028 | 12.446% | 7,000,000 | 6,717,718 | |
| Prosper Pass-Through Trust(a),(d) | ||||
| Series 2019-ST2 Class A | ||||
| 11/15/2025 | 3.750% | 41,270 | 41,270 | |
| Asset-Backed Securities — Non-Agency (continued) | ||||
| Issuer | Coupon Rate | Principal Amount ($) | Value ($) | |
| Research-Driven Pagaya Motor Asset Trust IV(a) | ||||
| Series 2021-2A Class A | ||||
| 03/25/2030 | 2.650% | 9,540,159 | 8,435,504 | |
| RR 16 Ltd.(a),(b) | ||||
| Series 2021-16A Class D | ||||
| 3-month USD LIBOR + 6.250% Floor 6.250% 07/15/2036 | 11.510% | 3,733,333 | 3,388,608 | |
| Santander Drive Auto Receivables Trust | ||||
| Series 2023-2 Class A2 | ||||
| 03/16/2026 | 5.870% | 10,500,000 | 10,488,790 | |
| Theorem Funding Trust(a) | ||||
| Series 2022-3A Class A | ||||
| 04/15/2029 | 7.600% | 11,772,548 | 11,841,448 | |
| Series 2023-1A Class A | ||||
| 04/15/2029 | 7.580% | 12,498,009 | 12,522,582 | |
| Subordinated Series 2022-1A Class B | ||||
| 02/15/2028 | 3.100% | 14,000,000 | 13,174,101 | |
| Upstart Pass-Through Trust(a) | ||||
| Series 2021-ST1 Class A | ||||
| 02/20/2027 | 2.750% | 1,642,083 | 1,585,071 | |
| Series 2021-ST7 Class A | ||||
| 09/20/2029 | 1.850% | 1,883,710 | 1,803,474 | |
| Upstart Securitization Trust(a) | ||||
| Subordinated Series 2021-4 Class B | ||||
| 09/20/2031 | 1.840% | 9,200,000 | 8,621,220 | |
| Subordinated Series 2023-1 Class B | ||||
| 02/20/2033 | 8.350% | 4,736,000 | 4,643,096 | |
| US Auto Funding(a) | ||||
| Subordinated Series 2021-1A Class D | ||||
| 03/15/2027 | 4.360% | 2,375,000 | 1,727,676 | |
| Total Asset-Backed Securities — Non-Agency (Cost $388,787,992) | 348,846,672 | |||
| Commercial Mortgage-Backed Securities - Agency 0.1% | ||||
| Government National Mortgage Association(f),(g) | ||||
| Series 2017-30 Class IO | ||||
| 08/16/2058 | 0.587% | 30,026,207 | 791,380 | |
| Series 2019-102 Class IB | ||||
| 03/16/2060 | 0.834% | 12,486,616 | 709,620 | |
| Series 2020-19 Class IO | ||||
| 12/16/2061 | 0.694% | 19,156,742 | 1,000,844 | |
| Series 2020-3 Class IO | ||||
| 02/16/2062 | 0.615% | 18,247,691 | 842,445 | |
| Total Commercial Mortgage-Backed Securities - Agency (Cost $12,054,269) | 3,344,289 | |||
| Columbia Mortgage Opportunities Fund | Annual Report 2023 | 9 |
May 31, 2023
| Commercial Mortgage-Backed Securities - Non-Agency 4.5% | ||||
| Issuer | Coupon Rate | Principal Amount ($) | Value ($) | |
| BAMLL Commercial Mortgage Securities Trust(a),(f) | ||||
| Subordinated Series 2013-WBRK Class E | ||||
| 03/10/2037 | 3.534% | 4,500,000 | 2,953,572 | |
| BFLD Trust(a),(b) | ||||
| Series 2019-DPLO Class G | ||||
| 1-month USD LIBOR + 3.190% Floor 3.190% 10/15/2034 | 8.297% | 6,853,000 | 6,673,401 | |
| BXP Trust(a),(f) | ||||
| Subordinated Series 2021-601L Class E | ||||
| 01/15/2044 | 2.776% | 21,000,000 | 11,258,413 | |
| CLNY Trust(a),(b) | ||||
| Subordinated Series 2019-IKPR Class E | ||||
| 1-month USD LIBOR + 2.721% Floor 2.721% 11/15/2038 | 7.895% | 4,700,000 | 4,244,605 | |
| COMM Mortgage Trust(a),(f) | ||||
| Subordinated Series 2020-CBM Class F | ||||
| 02/10/2037 | 3.633% | 17,650,000 | 15,395,973 | |
| Credit Suisse Mortgage Capital Certificates OA LLC(a) | ||||
| Subordinated Series 2014-USA Class E | ||||
| 09/15/2037 | 4.373% | 24,275,000 | 12,845,357 | |
| Subordinated Series 2014-USA Class F | ||||
| 09/15/2037 | 4.373% | 18,400,000 | 7,199,307 | |
| CSMC Trust(a),(f) | ||||
| Subordinated Series 2019-UVIL Class E | ||||
| 12/15/2041 | 3.283% | 5,200,000 | 3,664,997 | |
| Hilton USA Trust(a) | ||||
| Subordinated Series 2016-SFP Class F | ||||
| 11/05/2035 | 6.155% | 27,400,000 | 18,122,544 | |
| Home Partners of America Trust(a) | ||||
| Series 2019-2 Class F | ||||
| 10/19/2039 | 3.866% | 2,767,082 | 2,330,760 | |
| Morgan Stanley Capital I Trust(a),(f) | ||||
| Series 2019-MEAD Class E | ||||
| 11/10/2036 | 3.177% | 5,500,000 | 4,824,835 | |
| Progress Residential Trust(a) | ||||
| Series 2020-SFR1 Class F | ||||
| 04/17/2037 | 3.431% | 5,975,000 | 5,481,988 | |
| Wells Fargo Commercial Mortgage Trust(a),(b) | ||||
| Series 2021-FCMT Class E | ||||
| 1-month USD LIBOR + 4.500% Floor 4.500% 05/15/2031 | 9.607% | 21,600,000 | 18,468,788 | |
| Total Commercial Mortgage-Backed Securities - Non-Agency (Cost $155,528,193) | 113,464,540 | |||
| Residential Mortgage-Backed Securities - Agency 117.0% | ||||
| Issuer | Coupon Rate | Principal Amount ($) | Value ($) | |
| Fannie Mae REMICS(b),(g) | ||||
| CMO Series 2017-81 Class SM | ||||
| -1.0 x 1-month USD LIBOR + 6.200% Cap 6.200% 10/25/2047 | 1.062% | 29,665,712 | 3,263,184 | |
| Federal Home Loan Mortgage Corp. | ||||
| 03/01/2052 | 2.500% | 112,224,616 | 96,621,733 | |
| 09/01/2052 | 4.500% | 28,999,043 | 28,109,126 | |
| Federal Home Loan Mortgage Corp.(b),(g) | ||||
| CMO Series 2013-101 Class HS | ||||
| -1.0 x 1-month USD LIBOR + 6.500% Cap 6.500% 10/25/2043 | 1.362% | 11,307,795 | 1,394,130 | |
| CMO Series 3922 Class SH | ||||
| -1.0 x 1-month USD LIBOR + 5.900% Cap 5.900% 09/15/2041 | 0.793% | 2,510,431 | 218,134 | |
| CMO Series 4097 Class ST | ||||
| -1.0 x 1-month USD LIBOR + 6.050% Cap 6.050% 08/15/2042 | 0.943% | 856,527 | 89,847 | |
| CMO Series 4286 Class NS | ||||
| -1.0 x 1-month USD LIBOR + 5.900% Cap 5.900% 12/15/2043 | 0.793% | 1,027,701 | 138,106 | |
| CMO Series 4620 Class AS | ||||
| -1.0 x 1-month USD LIBOR + 0.440% 11/15/2042 | 0.000% | 1,276,124 | 64,503 | |
| CMO Series 4704 Class SK | ||||
| -1.0 x 1-month USD LIBOR + 6.150% Cap 6.150% 07/15/2047 | 1.043% | 9,337,957 | 1,083,926 | |
| CMO Series 4826 Class KS | ||||
| -1.0 x 1-month USD LIBOR + 6.200% Cap 6.200% 09/15/2048 | 1.093% | 9,407,873 | 1,141,353 | |
| CMO Series 4926 Class ST | ||||
| -1.0 x 1-month USD LIBOR + 6.080% Cap 6.080% 01/15/2040 | 0.973% | 7,634,163 | 619,592 | |
| 10 | Columbia Mortgage Opportunities Fund | Annual Report 2023 |
May 31, 2023
| Residential Mortgage-Backed Securities - Agency (continued) | ||||
| Issuer | Coupon Rate | Principal Amount ($) | Value ($) | |
| CMO Series 4987 Class KS | ||||
| -1.0 x 1-month USD LIBOR + 6.080% Cap 6.080% 06/24/2050 | 0.942% | 9,870,684 | 1,476,324 | |
| CMO Series 4993 Class MS | ||||
| -1.0 x 1-month USD LIBOR + 6.050% Cap 6.050% 07/25/2050 | 0.912% | 18,855,476 | 2,938,062 | |
| CMO STRIPS Series 309 Class S4 | ||||
| -1.0 x 1-month USD LIBOR + 5.970% Cap 5.970% 08/15/2043 | 0.863% | 1,968,124 | 202,047 | |
| Federal Home Loan Mortgage Corp.(g) | ||||
| CMO Series 390 Class C29 | ||||
| 06/15/2052 | 2.000% | 78,586,431 | 10,101,335 | |
| CMO Series 4215 Class IL | ||||
| 07/15/2041 | 3.500% | 286,416 | 12,174 | |
| CMO Series 5040 Class IH | ||||
| 11/25/2050 | 3.500% | 12,605,050 | 2,344,612 | |
| CMO Series 5083 Class NI | ||||
| 12/25/2040 | 4.500% | 11,140,195 | 2,383,884 | |
| CMO STRIPS Series 304 Class C67 | ||||
| 12/15/2042 | 4.500% | 1,688,032 | 223,776 | |
| Federal Home Loan Mortgage Corp. REMICS(b),(g) | ||||
| CMO Series 4606 Class SL | ||||
| -1.0 x 1-month USD LIBOR + 6.000% Cap 6.000% 12/15/2044 | 0.893% | 48,021,042 | 4,882,842 | |
| CMO Series 5119 Class QS | ||||
| -1.0 x 30-day Average SOFR + 6.300% Cap 6.300% 06/25/2051 | 1.485% | 39,946,491 | 8,594,128 | |
| Federal Home Loan Mortgage Corp. REMICS(g) | ||||
| CMO Series 5105 Class ID | ||||
| 05/25/2051 | 3.000% | 38,765,619 | 7,077,664 | |
| CMO Series 5105 Class JI | ||||
| 03/25/2045 | 3.000% | 25,610,304 | 2,658,639 | |
| CMO Series 5183 Class IO | ||||
| 01/25/2052 | 3.000% | 43,252,077 | 7,136,610 | |
| Federal National Mortgage Association | ||||
| 08/01/2051 | 3.000% | 32,047,000 | 28,697,639 | |
| 08/01/2052 | 4.000% | 41,772,523 | 39,883,576 | |
| Federal National Mortgage Association(g) | ||||
| CMO Series 2012-152 Class EI | ||||
| 07/25/2031 | 3.000% | 1,574,827 | 32,559 | |
| Residential Mortgage-Backed Securities - Agency (continued) | ||||
| Issuer | Coupon Rate | Principal Amount ($) | Value ($) | |
| CMO Series 2021-3 Class TI | ||||
| 02/25/2051 | 2.500% | 48,687,575 | 7,830,700 | |
| Federal National Mortgage Association(b),(g) | ||||
| CMO Series 2013-101 Class CS | ||||
| -1.0 x 1-month USD LIBOR + 5.900% Cap 5.900% 10/25/2043 | 0.762% | 2,108,026 | 226,283 | |
| CMO Series 2013-97 Class SB | ||||
| -1.0 x 1-month USD LIBOR + 6.100% Cap 6.100% 06/25/2032 | 1.080% | 259,282 | 3,564 | |
| CMO Series 2014-93 Class ES | ||||
| -1.0 x 1-month USD LIBOR + 6.150% Cap 6.150% 01/25/2045 | 1.012% | 1,182,662 | 142,079 | |
| CMO Series 2015-27 Class AS | ||||
| -1.0 x 1-month USD LIBOR + 5.650% Cap 5.650% 05/25/2045 | 0.512% | 9,621,496 | 1,095,242 | |
| CMO Series 2016-31 Class VS | ||||
| -1.0 x 1-month USD LIBOR + 6.000% Cap 6.000% 06/25/2046 | 0.862% | 1,329,174 | 135,253 | |
| CMO Series 2017-50 Class SB | ||||
| -1.0 x 1-month USD LIBOR + 6.100% Cap 6.100% 07/25/2047 | 0.962% | 8,141,686 | 1,061,709 | |
| CMO Series 2017-72 Class S | ||||
| -1.0 x 1-month USD LIBOR + 3.950% Cap 2.750% 09/25/2047 | 0.000% | 20,337,013 | 880,568 | |
| CMO Series 2017-90 Class SP | ||||
| -1.0 x 1-month USD LIBOR + 6.150% Cap 6.150% 11/25/2047 | 1.012% | 8,405,953 | 971,224 | |
| CMO Series 2020-38 Class SE | ||||
| -1.0 x 1-month USD LIBOR + 6.050% Cap 6.050% 06/25/2050 | 0.912% | 6,567,064 | 722,753 | |
| Columbia Mortgage Opportunities Fund | Annual Report 2023 | 11 |
May 31, 2023
| Residential Mortgage-Backed Securities - Agency (continued) | ||||
| Issuer | Coupon Rate | Principal Amount ($) | Value ($) | |
| CMO Series 2020-38 Class WS | ||||
| -1.0 x 1-month USD LIBOR + 5.000% Cap 5.000% 06/25/2050 | 0.000% | 22,565,514 | 2,102,551 | |
| Federal National Mortgage Association REMICS(b),(g) | ||||
| CMO Series 2020-34 Class S | ||||
| -1.0 x 1-month USD LIBOR + 6.050% Cap 6.050% 06/25/2050 | 0.912% | 37,480,629 | 4,690,000 | |
| CMO Series 2020-54 Class AS | ||||
| -1.0 x 1-month USD LIBOR + 6.150% Cap 6.150% 08/25/2050 | 1.012% | 24,577,756 | 3,165,610 | |
| Freddie Mac STACR REMIC Trust(a),(b) | ||||
| Subordinated CMO Series 2021-HQA2 Class B2 | ||||
| 30-day Average SOFR + 5.450% 12/25/2033 | 10.423% | 14,350,000 | 12,320,099 | |
| Government National Mortgage Association(g) | ||||
| CMO Series 2014-184 Class CI | ||||
| 11/16/2041 | 3.500% | 5,359,236 | 637,717 | |
| CMO Series 2018-78 Class GI | ||||
| 04/20/2048 | 4.000% | 7,931,128 | 969,930 | |
| CMO Series 2020-104 Class IY | ||||
| 07/20/2050 | 3.000% | 13,931,022 | 2,015,475 | |
| CMO Series 2020-129 Class GI | ||||
| 09/20/2050 | 3.000% | 17,603,566 | 2,703,425 | |
| CMO Series 2020-129 Class YI | ||||
| 09/20/2050 | 2.500% | 21,395,424 | 2,800,973 | |
| CMO Series 2020-160 Class DI | ||||
| 10/20/2050 | 2.500% | 19,410,181 | 2,335,538 | |
| CMO Series 2020-160 Class HI | ||||
| 10/20/2050 | 2.500% | 15,274,151 | 2,094,007 | |
| CMO Series 2020-160 Class ID | ||||
| 10/20/2050 | 2.500% | 14,740,225 | 1,771,872 | |
| CMO Series 2020-162 Class EI | ||||
| 10/20/2050 | 2.500% | 14,777,728 | 1,771,124 | |
| CMO Series 2020-164 Class CI | ||||
| 11/20/2050 | 3.000% | 19,301,374 | 2,863,722 | |
| CMO Series 2020-191 Class UC | ||||
| 12/20/2050 | 4.000% | 22,330,690 | 3,811,907 | |
| CMO Series 2020-191 Class UM | ||||
| 12/20/2050 | 3.500% | 30,197,249 | 5,352,471 | |
| CMO Series 2020-85 Class MI | ||||
| 06/20/2050 | 3.500% | 12,939,134 | 2,852,915 | |
| Residential Mortgage-Backed Securities - Agency (continued) | ||||
| Issuer | Coupon Rate | Principal Amount ($) | Value ($) | |
| CMO Series 2021-158 Class VI | ||||
| 09/20/2051 | 3.000% | 35,619,224 | 5,700,978 | |
| CMO Series 2021-160 Class CI | ||||
| 09/20/2051 | 2.500% | 71,547,421 | 9,545,864 | |
| CMO Series 2021-175 Class IJ | ||||
| 10/20/2051 | 3.000% | 8,120,636 | 1,240,855 | |
| CMO Series 2021-24 Class MI | ||||
| 02/20/2051 | 3.000% | 18,107,858 | 2,736,117 | |
| CMO Series 2021-24 Class PI | ||||
| 01/20/2051 | 2.500% | 21,054,310 | 2,896,980 | |
| CMO Series 2021-29 Class HI | ||||
| 02/20/2051 | 3.500% | 22,625,184 | 3,843,087 | |
| CMO Series 2021-44 Class CI | ||||
| 03/20/2051 | 3.000% | 26,996,273 | 4,062,294 | |
| CMO Series 2021-44 Class MI | ||||
| 03/20/2051 | 3.000% | 17,551,435 | 2,453,949 | |
| CMO Series 2021-49 Class WI | ||||
| 05/20/2048 | 2.500% | 18,862,728 | 1,855,683 | |
| CMO Series 2021-58 Class IA | ||||
| 04/20/2051 | 3.500% | 15,004,725 | 2,413,665 | |
| CMO Series 2021-7 Class IT | ||||
| 01/16/2051 | 3.000% | 30,521,006 | 6,055,010 | |
| Government National Mortgage Association(b),(g) | ||||
| CMO Series 2014-6 Class SJ | ||||
| -1.0 x 1-month USD LIBOR + 6.100% Cap 6.100% 01/20/2044 | 0.952% | 9,764,618 | 1,362,700 | |
| CMO Series 2017-163 Class SD | ||||
| -1.0 x 1-month USD LIBOR + 6.200% Cap 6.200% 11/20/2047 | 1.052% | 10,834,865 | 1,297,681 | |
| CMO Series 2018-124 Class SG | ||||
| -1.0 x 1-month USD LIBOR + 6.200% Cap 6.200% 09/20/2048 | 1.052% | 9,955,087 | 1,192,045 | |
| CMO Series 2018-155 Class LS | ||||
| -1.0 x 1-month USD LIBOR + 6.150% Cap 6.150% 11/20/2048 | 1.002% | 8,600,309 | 908,245 | |
| CMO Series 2018-40 Class SC | ||||
| -1.0 x 1-month USD LIBOR + 6.200% Cap 6.200% 03/20/2048 | 1.052% | 6,642,686 | 612,458 | |
| 12 | Columbia Mortgage Opportunities Fund | Annual Report 2023 |
May 31, 2023
| Residential Mortgage-Backed Securities - Agency (continued) | ||||
| Issuer | Coupon Rate | Principal Amount ($) | Value ($) | |
| CMO Series 2018-63 Class HS | ||||
| -1.0 x 1-month USD LIBOR + 6.200% Cap 6.200% 04/20/2048 | 1.052% | 8,863,877 | 816,530 | |
| CMO Series 2018-63 Class SH | ||||
| -1.0 x 1-month USD LIBOR + 6.200% Cap 6.200% 04/20/2048 | 1.052% | 8,305,249 | 711,710 | |
| CMO Series 2018-78 Class SB | ||||
| -1.0 x 1-month USD LIBOR + 6.200% Cap 6.200% 06/20/2048 | 1.052% | 7,441,836 | 875,042 | |
| CMO Series 2018-94 Class SA | ||||
| -1.0 x 1-month USD LIBOR + 6.200% Cap 6.200% 05/20/2048 | 1.052% | 6,799,699 | 792,852 | |
| CMO Series 2019-103 Class SA | ||||
| -1.0 x 1-month USD LIBOR + 6.050% Cap 6.050% 08/20/2049 | 0.902% | 15,788,381 | 1,758,960 | |
| CMO Series 2019-128 Class YS | ||||
| -1.0 x 1-month USD LIBOR + 2.850% Cap 2.850% 10/20/2049 | 0.000% | 39,544,636 | 507,642 | |
| CMO Series 2019-43 Class NS | ||||
| -1.0 x 1-month USD LIBOR + 3.270% Cap 3.270% 04/20/2049 | 0.000% | 16,265,884 | 355,125 | |
| CMO Series 2020-104 Class SA | ||||
| -1.0 x 1-month USD LIBOR + 6.200% Cap 6.200% 07/20/2050 | 1.052% | 11,137,972 | 1,332,002 | |
| CMO Series 2020-133 Class DS | ||||
| -1.0 x 1-month USD LIBOR + 6.300% Cap 6.300% 09/20/2050 | 1.152% | 69,426,175 | 7,873,143 | |
| CMO Series 2020-148 Class SA | ||||
| -1.0 x 1-month USD LIBOR + 6.300% Cap 6.300% 10/20/2050 | 1.152% | 21,393,695 | 2,503,681 | |
| Residential Mortgage-Backed Securities - Agency (continued) | ||||
| Issuer | Coupon Rate | Principal Amount ($) | Value ($) | |
| CMO Series 2020-160 Class AS | ||||
| -1.0 x 1-month USD LIBOR + 6.300% Cap 6.300% 10/20/2050 | 1.152% | 35,712,911 | 5,060,112 | |
| CMO Series 2020-175 Class NS | ||||
| -1.0 x 1-month USD LIBOR + 6.300% Cap 6.300% 11/20/2050 | 1.152% | 25,847,321 | 3,210,038 | |
| CMO Series 2020-187 Class SE | ||||
| -1.0 x 1-month USD LIBOR + 6.300% Cap 6.300% 12/20/2050 | 1.152% | 19,907,653 | 2,473,245 | |
| CMO Series 2020-34 Class SA | ||||
| -1.0 x 1-month USD LIBOR + 6.050% Cap 6.050% 03/20/2050 | 0.902% | 23,858,589 | 2,823,678 | |
| CMO Series 2020-62 Class SK | ||||
| -1.0 x 1-month USD LIBOR + 6.150% Cap 6.150% 05/20/2050 | 1.002% | 10,445,217 | 1,376,741 | |
| CMO Series 2020-78 Class SD | ||||
| -1.0 x 1-month USD LIBOR + 6.150% Cap 6.150% 06/20/2050 | 1.002% | 27,528,100 | 2,996,401 | |
| CMO Series 2021-117 Class HS | ||||
| -1.0 x 1-month USD LIBOR + 6.300% Cap 6.300% 07/20/2051 | 1.152% | 29,484,353 | 3,543,651 | |
| CMO Series 2021-119 Class SC | ||||
| -1.0 x 1-month USD LIBOR + 6.300% Cap 6.300% 07/20/2051 | 1.152% | 29,848,521 | 3,910,165 | |
| CMO Series 2021-122 Class SB | ||||
| -1.0 x 1-month USD LIBOR + 2.600% Cap 2.600% 07/20/2051 | 0.000% | 65,960,495 | 876,199 | |
| CMO Series 2021-122 Class SG | ||||
| -1.0 x 1-month USD LIBOR + 6.300% Cap 6.300% 07/20/2051 | 1.152% | 68,444,928 | 7,788,294 | |
| Columbia Mortgage Opportunities Fund | Annual Report 2023 | 13 |
May 31, 2023
| Residential Mortgage-Backed Securities - Agency (continued) | ||||
| Issuer | Coupon Rate | Principal Amount ($) | Value ($) | |
| CMO Series 2021-142 Class SL | ||||
| -1.0 x 1-month USD LIBOR + 6.300% Cap 6.300% 08/20/2051 | 1.152% | 68,424,366 | 8,583,563 | |
| CMO Series 2021-155 Class SM | ||||
| -1.0 x 1-month USD LIBOR + 6.300% Cap 6.300% 07/20/2051 | 1.152% | 34,573,054 | 4,155,429 | |
| CMO Series 2021-156 Class SA | ||||
| -1.0 x 1-month USD LIBOR + 6.300% Cap 6.300% 09/20/2051 | 1.152% | 52,375,004 | 7,042,778 | |
| CMO Series 2021-160 Class S | ||||
| -1.0 x 30-day Average SOFR + 2.650% Cap 2.650% 09/20/2051 | 0.000% | 84,848,198 | 1,098,750 | |
| CMO Series 2021-161 Class SL | ||||
| -1.0 x 1-month USD LIBOR + 6.300% Cap 6.300% 09/20/2051 | 1.152% | 42,346,946 | 5,723,266 | |
| CMO Series 2021-193 Class ES | ||||
| 30-day Average SOFR + 1.700% 11/20/2051 | 0.000% | 300,461,246 | 1,789,547 | |
| CMO Series 2021-42 Class SD | ||||
| -1.0 x 1-month USD LIBOR + 6.300% Cap 6.300% 11/20/2050 | 1.152% | 42,496,311 | 5,844,539 | |
| CMO Series 2021-96 Class US | ||||
| -1.0 x 30-day Average SOFR + 3.250% Cap 3.250% 06/20/2051 | 0.000% | 50,204,552 | 700,785 | |
| CMO Series 2021-97 Class CS | ||||
| -1.0 x 1-month USD LIBOR + 6.300% Cap 6.300% 06/20/2051 | 1.152% | 49,974,292 | 6,010,313 | |
| CMO Series 2022-46 Class SE | ||||
| -1.0 x 30-day Average SOFR + 3.450% Cap 3.450% 03/20/2052 | 0.000% | 30,389,505 | 642,094 | |
| Residential Mortgage-Backed Securities - Agency (continued) | ||||
| Issuer | Coupon Rate | Principal Amount ($) | Value ($) | |
| CMO Series 2022-83 Class AS | ||||
| -1.0 x 1-month USD LIBOR + 6.150% Cap 6.150% 06/20/2050 | 1.002% | 27,459,908 | 3,542,386 | |
| Government National Mortgage Association(b) | ||||
| CMO Series 2020-67 Class KS | ||||
| -1.0 x 1-month USD LIBOR + 5.950% Cap 5.950% 05/20/2050 | 0.802% | 20,406,007 | 2,027,847 | |
| Government National Mortgage Association TBA(h) | ||||
| 06/20/2053 | 4.500% | 240,000,000 | 233,207,813 | |
| Uniform Mortgage-Backed Security TBA(h) | ||||
| 06/13/2053 | 3.000% | 372,000,000 | 330,171,795 | |
| 06/13/2053 | 3.500% | 400,000,000 | 367,484,376 | |
| 06/13/2053 | 4.000% | 542,500,000 | 512,492,969 | |
| 06/13/2053 | 4.500% | 745,000,000 | 721,587,794 | |
| 06/13/2053 | 5.000% | 306,000,000 | 301,427,929 | |
| Total Residential Mortgage-Backed Securities - Agency (Cost $3,082,528,075) | 2,932,015,011 | |||
| Residential Mortgage-Backed Securities - Non-Agency 54.3% | ||||
| 510 Asset Backed Trust(a),(f) | ||||
| CMO Series 2021-NPL2 Class A1 | ||||
| 06/25/2061 | 2.116% | 2,880,238 | 2,650,539 | |
| Ajax Mortgage Loan Trust(a),(f) | ||||
| CMO Series 2021-B Class A | ||||
| 06/25/2066 | 2.239% | 9,665,678 | 9,063,460 | |
| CMO Series 2021-C Class A | ||||
| 01/25/2061 | 2.115% | 5,777,773 | 5,437,694 | |
| AlphaFlow Transitional Mortgage Trust(a) | ||||
| CMO Series 2021-WL1 Class A1 | ||||
| 01/25/2026 | 3.280% | 3,701,241 | 3,593,398 | |
| Angel Oak Mortgage Trust(a),(f) | ||||
| CMO Series 2021-5 Class A3 | ||||
| 07/25/2066 | 1.311% | 4,989,275 | 4,129,687 | |
| Angel Oak Mortgage Trust I LLC(a),(f) | ||||
| Subordinated CMO Series 2019-2 Class B2 | ||||
| 03/25/2049 | 6.286% | 4,800,000 | 4,620,367 | |
| Bellemeade Re Ltd.(a),(b) | ||||
| CMO Series 2019-4A Class M1C | ||||
| 1-month USD LIBOR + 2.500% Floor 2.500% 10/25/2029 | 7.638% | 994,116 | 996,813 | |
| CMO Series 2021-1A Class M2 | ||||
| 30-day Average SOFR + 4.850% Floor 4.850% 03/25/2031 | 9.823% | 18,000,000 | 18,526,462 | |
| 14 | Columbia Mortgage Opportunities Fund | Annual Report 2023 |
May 31, 2023
| Residential Mortgage-Backed Securities - Non-Agency (continued) | ||||
| Issuer | Coupon Rate | Principal Amount ($) | Value ($) | |
| CMO Series 2021-2A Class M1C | ||||
| 30-day Average SOFR + 1.850% Floor 1.850% 06/25/2031 | 6.665% | 9,465,000 | 9,229,091 | |
| CMO Series 2021-2A Class M2 | ||||
| 30-day Average SOFR + 2.900% Floor 2.900% 06/25/2031 | 7.715% | 15,250,000 | 14,440,818 | |
| Subordinated CMO Series 2019-4A Class B1 | ||||
| 1-month USD LIBOR + 3.850% Floor 3.850% 10/25/2029 | 8.988% | 17,089,000 | 17,149,623 | |
| Subordinated CMO Series 2020-4A Class B1 | ||||
| 1-month USD LIBOR + 5.000% Floor 5.000% 06/25/2030 | 10.138% | 7,200,000 | 7,380,484 | |
| Subordinated CMO Series 2021-1A Class B1 | ||||
| 30-day Average SOFR + 6.750% Floor 6.750% 03/25/2031 | 11.723% | 3,750,000 | 3,868,601 | |
| Subordinated CMO Series 2021-2A Class B1 | ||||
| 30-day Average SOFR + 4.150% Floor 4.150% 06/25/2031 | 8.965% | 2,800,000 | 2,693,592 | |
| BRAVO Residential Funding Trust(a),(f) | ||||
| CMO Series 2020-NQM1 Class B1 | ||||
| 05/25/2060 | 5.086% | 2,200,000 | 1,972,557 | |
| CMO Series 2020-NQM1 Class B2 | ||||
| 05/25/2060 | 5.762% | 2,800,000 | 2,610,489 | |
| CMO Series 2021-B Class A1 | ||||
| 04/01/2069 | 2.115% | 7,159,652 | 6,777,619 | |
| Subordinated CMO Series 2021-NQM2 Class B1 | ||||
| 03/25/2060 | 3.044% | 2,950,000 | 2,297,913 | |
| Subordinated CMO Series 2021-NQM2 Class B2 | ||||
| 03/25/2060 | 4.099% | 4,100,000 | 3,132,537 | |
| BRAVO Residential Funding Trust(a),(b) | ||||
| CMO Series 2021-HE2 Class B1 | ||||
| 30-day Average SOFR + 2.400% 11/25/2069 | 6.088% | 6,000,000 | 5,695,800 | |
| Subordinated CMO Series 2021-HE1 Class B1 | ||||
| 30-day Average SOFR + 2.500% 01/25/2070 | 7.473% | 6,708,000 | 6,612,163 | |
| Residential Mortgage-Backed Securities - Non-Agency (continued) | ||||
| Issuer | Coupon Rate | Principal Amount ($) | Value ($) | |
| Subordinated CMO Series 2021-HE1 Class B2 | ||||
| 30-day Average SOFR + 3.000% 01/25/2070 | 7.973% | 4,129,000 | 3,976,420 | |
| Subordinated CMO Series 2021-HE2 Class B2 | ||||
| 30-day Average SOFR + 3.400% 11/25/2069 | 8.215% | 6,570,000 | 6,340,861 | |
| BVRT Financing Trust(a),(b),(d) | ||||
| CMO Series 2021-3F Class M2 | ||||
| 30-day Average SOFR + 2.900% Floor 2.900% 07/12/2033 | 4.187% | 40,000,000 | 40,000,000 | |
| CMO Series 2021-CRT1 Class M4 | ||||
| 1-month USD LIBOR + 3.500% Floor 3.500% 07/10/2032 | 3.589% | 16,250,000 | 15,635,263 | |
| CMO Series 2021-CRT3 Class B1 | ||||
| 30-day Average SOFR + 4.300% Floor 4.300% 01/10/2031 | 4.338% | 15,200,000 | 15,200,000 | |
| CMO Series 2021-CRT3 Class M4 | ||||
| 30-day Average SOFR + 3.800% Floor 3.800% 01/10/2031 | 3.838% | 1,494,965 | 1,494,965 | |
| CHNGE Mortgage Trust(a),(f) | ||||
| Subordinated CMO Series 2023-1 Class B1 | ||||
| 03/25/2058 | 8.413% | 2,700,000 | 2,510,728 | |
| Subordinated CMO Series 2023-1 Class B2 | ||||
| 03/25/2058 | 8.413% | 2,765,000 | 2,387,827 | |
| CIM Trust(a),(f) | ||||
| CMO Series 2021-NR1 Class A1 | ||||
| 07/25/2055 | 2.569% | 10,876,615 | 10,405,898 | |
| CMO Series 2021-NR2 Class A1 | ||||
| 07/25/2059 | 2.568% | 20,885,832 | 19,938,781 | |
| CMO Series 2021-NR4 Class A1 | ||||
| 10/25/2061 | 2.816% | 6,335,118 | 5,905,087 | |
| COLT Mortgage Loan Trust(a),(f) | ||||
| CMO Series 2020-2 Class M1 | ||||
| 03/25/2065 | 5.250% | 1,463,000 | 1,410,058 | |
| CMO Series 2021-3 Class A3 | ||||
| 09/27/2066 | 1.419% | 7,658,485 | 6,014,150 | |
| Subordinated CMO Series 2020-2 Class B1 | ||||
| 03/25/2065 | 5.250% | 3,716,000 | 3,436,986 | |
| Subordinated CMO Series 2021-4 Class B1 | ||||
| 10/25/2066 | 3.764% | 5,969,000 | 3,967,714 | |
| Columbia Mortgage Opportunities Fund | Annual Report 2023 | 15 |
May 31, 2023
| Residential Mortgage-Backed Securities - Non-Agency (continued) | ||||
| Issuer | Coupon Rate | Principal Amount ($) | Value ($) | |
| Subordinated Series 2021-3 Class B1 | ||||
| 09/27/2066 | 3.059% | 2,502,000 | 1,352,568 | |
| Connecticut Avenue Securities Trust(a),(b) | ||||
| Subordinated CMO Series 2021-R03 Class 1B2 | ||||
| 30-day Average SOFR + 5.500% Floor 5.500% 12/25/2041 | 10.473% | 13,909,000 | 12,822,323 | |
| Subordinated CMO Series 2022-R01 Class 1B2 | ||||
| 30-day Average SOFR + 6.000% 12/25/2041 | 10.973% | 29,500,000 | 27,600,976 | |
| Subordinated CMO Series 2022-R02 Class 2B2 | ||||
| 30-day Average SOFR + 7.650% 01/25/2042 | 12.623% | 27,000,000 | 25,712,089 | |
| Subordinated CMO Series 2022-R07 Class 1B2 | ||||
| 30-day Average SOFR + 12.000% 06/25/2042 | 16.973% | 7,300,000 | 7,850,444 | |
| Credit Suisse Mortgage Trust(a),(f) | ||||
| CMO Series 2022-JR1 Class A1 | ||||
| 10/25/2066 | 4.267% | 24,371,663 | 23,268,031 | |
| CSMC Trust(a),(f) | ||||
| CMO Series 2021-JR2 Class A1 | ||||
| 11/25/2061 | 2.215% | 5,137,325 | 4,888,329 | |
| CMO Series 2022-RPL3 Class A1 | ||||
| 03/25/2061 | 3.613% | 10,572,599 | 10,135,030 | |
| Eagle Re Ltd.(a),(b) | ||||
| CMO Series 2019-1 Class M2 | ||||
| 1-month USD LIBOR + 3.300% 04/25/2029 | 8.438% | 21,000,000 | 21,232,413 | |
| CMO Series 2021-1 Class M2 | ||||
| 30-day Average SOFR + 4.450% Floor 4.450% 10/25/2033 | 9.265% | 17,000,000 | 17,298,685 | |
| Fannie Mae Connecticut Avenue Securities(a),(b) | ||||
| Subordinated CMO Series 2021-R02 Class 2B2 | ||||
| 30-day Average SOFR + 6.200% 11/25/2041 | 11.173% | 15,900,000 | 15,020,353 | |
| FMC GMSR Issuer Trust(a),(f) | ||||
| CMO Series 2020-GT1 Class A | ||||
| 01/25/2026 | 4.450% | 9,050,000 | 8,169,584 | |
| Freddie Mac STACR(b) | ||||
| CMO Series 2020-CS02 Class M4 | ||||
| 1-month USD LIBOR + 0.000% 06/25/2033 | 4.617% | 28,900,000 | 27,433,666 | |
| Residential Mortgage-Backed Securities - Non-Agency (continued) | ||||
| Issuer | Coupon Rate | Principal Amount ($) | Value ($) | |
| Freddie Mac STACR REMIC Trust(a),(b) | ||||
| CMO Series 2022-HQA1 Class M2 | ||||
| 30-day Average SOFR + 5.250% 03/25/2042 | 10.223% | 11,650,000 | 11,772,591 | |
| CMO Series 2023-HQA1 Class M2 | ||||
| 30-day Average SOFR + 5.500% 05/25/2043 | 10.423% | 3,960,000 | 3,994,650 | |
| Subordinated CMO Series 2020-DNA4 Class B1 | ||||
| 1-month USD LIBOR + 6.000% 08/25/2050 | 11.138% | 10,368,117 | 11,488,016 | |
| Subordinated CMO Series 2020-DNA5 Class B1 | ||||
| 30-day Average SOFR + 4.800% 10/25/2050 | 9.430% | 11,200,000 | 12,011,425 | |
| Subordinated CMO Series 2020-DNA6 Class B2 | ||||
| 30-day Average SOFR + 5.650% 12/25/2050 | 10.623% | 15,500,000 | 14,813,782 | |
| Subordinated CMO Series 2020-HQA1 Class B1 | ||||
| 1-month USD LIBOR + 2.350% 01/25/2050 | 7.488% | 28,457,336 | 27,415,743 | |
| Subordinated CMO Series 2020-HQA3 Class B1 | ||||
| 1-month USD LIBOR + 5.750% 07/25/2050 | 10.888% | 7,457,418 | 8,004,603 | |
| Subordinated CMO Series 2020-HQA4 Class B1 | ||||
| 1-month USD LIBOR + 5.250% 09/25/2050 | 10.388% | 15,843,886 | 16,812,660 | |
| Subordinated CMO Series 2021-DNA1 Class B2 | ||||
| 30-day Average SOFR + 4.750% 01/25/2051 | 9.723% | 18,450,000 | 15,991,895 | |
| Subordinated CMO Series 2021-DNA5 Class B2 | ||||
| 30-day Average SOFR + 5.500% 01/25/2034 | 10.473% | 46,650,000 | 40,614,890 | |
| Subordinated CMO Series 2021-DNA6 Class B2 | ||||
| 30-day Average SOFR + 7.500% 10/25/2041 | 12.473% | 12,600,000 | 11,870,914 | |
| Subordinated CMO Series 2022-DNA1 Class B2 | ||||
| 30-day Average SOFR + 7.100% 01/25/2042 | 12.073% | 23,350,000 | 21,054,326 | |
| Freddie Mac Structured Agency Credit Risk Debt Notes(a),(b),(d),(e) | ||||
| CMO Series 2019-CS02 Class M2 | ||||
| 1-month USD LIBOR + 0.000% 02/25/2032 | 4.506% | 26,169,000 | 25,007,751 | |
| 16 | Columbia Mortgage Opportunities Fund | Annual Report 2023 |
May 31, 2023
| Residential Mortgage-Backed Securities - Non-Agency (continued) | ||||
| Issuer | Coupon Rate | Principal Amount ($) | Value ($) | |
| Freddie Mac Structured Agency Credit Risk Debt Notes(a),(b) | ||||
| Subordinated CMO Series 2020-DNA3 Class B1 | ||||
| 1-month USD LIBOR + 5.100% 06/25/2050 | 10.238% | 7,118,403 | 7,640,191 | |
| Subordinated CMO Series 2020-HQA5 Class B1 | ||||
| 30-day Average SOFR + 4.000% 11/25/2050 | 8.973% | 6,750,000 | 6,883,672 | |
| Subordinated CMO Series 2020-HQA5 Class B2 | ||||
| 30-day Average SOFR + 7.400% 11/25/2050 | 12.373% | 14,200,000 | 14,445,140 | |
| Subordinated CMO Series 2021-DNA7 Class B2 | ||||
| 30-day Average SOFR + 7.800% 11/25/2041 | 12.615% | 31,278,740 | 30,094,624 | |
| GCAT Trust(a),(f) | ||||
| CMO Series 2019-NQM3 Class M1 | ||||
| 11/25/2059 | 3.450% | 5,650,000 | 4,820,741 | |
| Genworth Mortgage Insurance Corp.(a),(b) | ||||
| CMO Series 2021-3 Class M1B | ||||
| 30-day Average SOFR + 2.900% Floor 2.900% 02/25/2034 | 7.715% | 29,500,000 | 29,121,300 | |
| Subordinated CMO Series 2021-3 Class B1 | ||||
| 30-day Average SOFR + 4.950% Floor 4.950% 02/25/2034 | 9.765% | 7,500,000 | 7,073,232 | |
| Glebe Funding Trust (The)(a),(d) | ||||
| CMO Series 2021-1 Class PT | ||||
| 10/27/2023 | 3.000% | 23,078,183 | 21,405,015 | |
| Homeward Opportunities Fund I Trust(a),(f) | ||||
| Subordinated CMO Series 2020-2 Class B1 | ||||
| 05/25/2065 | 5.450% | 3,750,000 | 3,316,870 | |
| Homeward Opportunities Fund Trust(a),(f) | ||||
| CMO Series 2020-BPL1 Class A2 | ||||
| 08/25/2025 | 5.438% | 3,670,478 | 3,575,984 | |
| Imperial Fund Mortgage Trust(a),(f) | ||||
| Subordinated CMO Series 2021-NQM3 Class B1 | ||||
| 11/25/2056 | 4.184% | 7,384,000 | 5,135,636 | |
| loanDepot GMSR Master Trust(a),(b) | ||||
| Series 2018-GT1 Class A | ||||
| 1-month USD LIBOR + 2.800% Floor 2.800% 10/16/2023 | 7.905% | 7,580,000 | 6,337,427 | |
| MFA Trust(a),(f) | ||||
| CMO Series 2020-NQM3 Class M1 | ||||
| 01/26/2065 | 2.654% | 3,500,000 | 2,911,265 | |
| Residential Mortgage-Backed Securities - Non-Agency (continued) | ||||
| Issuer | Coupon Rate | Principal Amount ($) | Value ($) | |
| Subordinated CMO Series 2020-NQM3 Class B1 | ||||
| 01/26/2065 | 3.661% | 6,250,000 | 5,273,853 | |
| Mortgage Acquisition Trust I LLC(a),(d) | ||||
| CMO Series 2021-1 Class PT | ||||
| 11/29/2023 | 3.500% | 16,198,093 | 14,659,274 | |
| New Residential Mortgage Loan Trust(a),(f),(g) | ||||
| CMO Series 2014-1A Class AIO | ||||
| 01/25/2054 | 2.278% | 4,185,698 | 196,516 | |
| New York Mortgage Trust(a),(f) | ||||
| CMO Series 2021-BPL1 Class A1 | ||||
| 05/25/2026 | 2.239% | 12,080,000 | 11,908,831 | |
| CMO Series 2021-BPL1 Class A2 | ||||
| 05/25/2026 | 2.981% | 5,000,000 | 4,916,432 | |
| NRZ Excess Spread-Collateralized Notes(a) | ||||
| Series 2020-PLS1 Class A | ||||
| 12/25/2025 | 3.844% | 3,121,200 | 2,890,155 | |
| Oaktown Re VI Ltd.(a),(b) | ||||
| CMO Series 2021-1A Class B1 | ||||
| 30-day Average SOFR + 5.500% Floor 5.500% 10/25/2033 | 10.473% | 2,373,000 | 2,333,886 | |
| CMO Series 2021-1A Class M2 | ||||
| 30-day Average SOFR + 3.950% Floor 3.950% 10/25/2033 | 8.923% | 6,500,000 | 6,405,340 | |
| OSAT Trust(a),(f) | ||||
| CMO Series 2021-RPL1 Class A2 | ||||
| 05/25/2065 | 3.967% | 5,000,000 | 4,471,870 | |
| PMT Credit Risk Transfer Trust(a),(b) | ||||
| Series 2019-2R Class A | ||||
| 1-month USD LIBOR + 2.750% Floor 2.750% 05/25/2025 | 8.910% | 6,967,127 | 6,910,712 | |
| PNMAC GMSR Issuer Trust(a),(b) | ||||
| CMO Series 2018-FT1 Class A | ||||
| 1-month USD LIBOR + 2.350% 04/25/2025 | 7.488% | 9,500,000 | 9,400,029 | |
| CMO Series 2018-GT1 Class A | ||||
| 1-month USD LIBOR + 2.850% Floor 2.850% 02/25/2025 | 7.988% | 19,379,000 | 19,308,024 | |
| CMO Series 2018-GT2 Class A | ||||
| 1-month USD LIBOR + 2.650% 08/25/2025 | 7.788% | 47,570,000 | 46,935,873 | |
| Point Securitization Trust(a),(f) | ||||
| CMO Series 2021-1 Class A1 | ||||
| 02/25/2052 | 3.228% | 13,091,929 | 12,351,976 | |
| Columbia Mortgage Opportunities Fund | Annual Report 2023 | 17 |
May 31, 2023
| Residential Mortgage-Backed Securities - Non-Agency (continued) | ||||
| Issuer | Coupon Rate | Principal Amount ($) | Value ($) | |
| Preston Ridge Partners Mortgage(a),(f) | ||||
| CMO Series 2021-2 Class A2 | ||||
| 03/25/2026 | 3.770% | 18,598,000 | 16,415,965 | |
| CMO Series 2021-3 Class A2 | ||||
| 04/25/2026 | 3.720% | 7,000,000 | 6,242,588 | |
| CMO Series 2021-4 Class A2 | ||||
| 04/25/2026 | 3.474% | 5,350,000 | 4,532,802 | |
| Preston Ridge Partners Mortgage LLC(a),(f) | ||||
| CMO Series 2020-4 Class A1 | ||||
| 10/25/2025 | 2.610% | 6,507,529 | 6,300,526 | |
| CMO Series 2020-6 Class A2 | ||||
| 11/25/2025 | 4.703% | 2,300,000 | 2,013,073 | |
| Preston Ridge Partners Mortgage Trust(a),(f) | ||||
| CMO Series 2021-1 Class A1 | ||||
| 01/25/2026 | 2.115% | 6,503,127 | 6,232,733 | |
| CMO Series 2021-1 Class A2 | ||||
| 01/25/2026 | 3.720% | 28,254,000 | 24,932,126 | |
| CMO Series 2021-2 Class A1 | ||||
| 03/25/2026 | 2.115% | 5,629,275 | 5,279,558 | |
| CMO Series 2021-5 Class A2 | ||||
| 06/25/2026 | 3.721% | 16,300,000 | 13,224,324 | |
| CMO Series 2021-8 Class A1 | ||||
| 09/25/2026 | 1.743% | 14,765,566 | 13,331,778 | |
| Pretium Mortgage Credit Partners(a),(f) | ||||
| CMO Series 2022-NPL1 Class A1 | ||||
| 01/25/2052 | 2.981% | 18,361,865 | 17,122,033 | |
| Pretium Mortgage Credit Partners I LLC(a),(f) | ||||
| CMO Series 2021-NPL1 Class A1 | ||||
| 09/27/2060 | 2.240% | 5,751,212 | 5,455,031 | |
| Pretium Mortgage Credit Partners LLC(a),(f) | ||||
| CMO Series 2021-NPL6 Class A2 | ||||
| 07/25/2051 | 5.071% | 5,600,000 | 4,989,980 | |
| CMO Series 2021-RN2 Class A1 | ||||
| 07/25/2051 | 1.744% | 6,021,336 | 5,468,352 | |
| PRPM Trust(a),(f) | ||||
| Subordinated CMO Series 2023-NQM1 Class B1 | ||||
| 01/25/2068 | 6.419% | 2,700,000 | 2,373,730 | |
| Radnor Re Ltd.(a),(b) | ||||
| Subordinated CMO Series 2021-1 Class B1 | ||||
| 30-day Average SOFR + 4.000% Floor 4.000% 12/27/2033 | 8.973% | 4,750,000 | 4,331,357 | |
| Radnor RE Ltd.(a),(b) | ||||
| CMO Series 2021-1 Class M1C | ||||
| 30-day Average SOFR + 2.700% Floor 2.700% 12/27/2033 | 7.673% | 20,500,000 | 20,261,390 | |
| Residential Mortgage-Backed Securities - Non-Agency (continued) | ||||
| Issuer | Coupon Rate | Principal Amount ($) | Value ($) | |
| Residential Mortgage Loan Trust(a),(f) | ||||
| CMO Series 2019-3 Class M1 | ||||
| 09/25/2059 | 3.257% | 6,378,000 | 5,985,098 | |
| Subordinated CMO Series 2020-1 Class B1 | ||||
| 01/26/2060 | 3.946% | 3,938,000 | 3,181,762 | |
| Saluda Grade Alternative Mortgage Trust(a) | ||||
| CMO Series 2020-FIG1 Class A3 | ||||
| 09/25/2050 | 5.086% | 3,110,066 | 3,063,644 | |
| Stanwich Mortgage Loan Co. LLC(a),(f) | ||||
| CMO Series 2021-NPB1 Class A1 | ||||
| 10/16/2026 | 2.735% | 22,824,166 | 20,828,124 | |
| Starwood Mortgage Residential Trust(a),(f) | ||||
| CMO Series 2020-3 Class B1 | ||||
| 04/25/2065 | 4.750% | 4,750,000 | 4,129,820 | |
| CMO Series 2021-3 Class A1 | ||||
| 06/25/2056 | 1.127% | 4,931,855 | 4,011,423 | |
| Starwood Mortgage Residential Trust(a) | ||||
| Subordinated CMO Series 2020-INV1 Class B1 | ||||
| 11/25/2055 | 3.257% | 3,200,000 | 2,611,565 | |
| Subordinated CMO Series 2020-INV1 Class B2 | ||||
| 11/25/2055 | 4.261% | 1,400,000 | 1,077,427 | |
| Stonnington Mortgage Trust(a),(d),(f) | ||||
| CMO Series 2020-1 Class A | ||||
| 07/28/2024 | 3.500% | 1,435,659 | 1,414,124 | |
| Toorak Mortgage Corp., Ltd.(a),(f) | ||||
| CMO Series 2021-1 Class A1 | ||||
| 06/25/2024 | 2.240% | 21,000,000 | 20,269,106 | |
| Triangle Re Ltd.(a),(b) | ||||
| CMO Series 2021-2 Class M1C | ||||
| 1-month USD LIBOR + 4.500% Floor 4.500% 10/25/2033 | 9.638% | 5,000,000 | 5,215,367 | |
| CMO Series 2021-2 Class M2 | ||||
| 1-month USD LIBOR + 5.500% Floor 5.500% 10/25/2033 | 10.638% | 10,000,000 | 10,271,442 | |
| Subordinated CMO Series 2021-1 Class B1 | ||||
| 1-month USD LIBOR + 4.500% Floor 4.500% 08/25/2033 | 9.638% | 22,926,000 | 23,188,633 | |
| Subordinated CMO Series 2021-2 Class B1 | ||||
| 1-month USD LIBOR + 7.500% Floor 7.500% 10/25/2033 | 12.638% | 7,100,000 | 7,274,960 | |
| VCAT Asset Securitization LLC(a),(f) | ||||
| CMO Series 2021-NPL3 Class A2 | ||||
| 05/25/2051 | 3.967% | 3,980,000 | 3,366,385 | |
| CMO Series 2021-NPL6 Class A1 | ||||
| 09/25/2051 | 1.917% | 11,913,835 | 10,928,412 | |
| 18 | Columbia Mortgage Opportunities Fund | Annual Report 2023 |
May 31, 2023
| Residential Mortgage-Backed Securities - Non-Agency (continued) | ||||
| Issuer | Coupon Rate | Principal Amount ($) | Value ($) | |
| VCAT LLC(a),(f) | ||||
| CMO Series 2021-NPL2 Class A2 | ||||
| 03/27/2051 | 4.212% | 5,500,000 | 4,795,662 | |
| Vericrest Opportunity Loan Transferee(a),(f) | ||||
| CMO Series 2021-NPL4 Class A1 | ||||
| 03/27/2051 | 2.240% | 7,876,015 | 7,413,012 | |
| Vericrest Opportunity Loan Transferee XCIV LLC(a),(f) | ||||
| CMO Series 2021-NPL3 Class A1 | ||||
| 02/27/2051 | 2.240% | 10,918,526 | 10,392,212 | |
| Vericrest Opportunity Loan Transferee XCVI LLC(a),(f) | ||||
| CMO Series 2021-NPL5 Class A1 | ||||
| 03/27/2051 | 2.116% | 17,824,203 | 16,820,245 | |
| Vericrest Opportunity Loan Transferee XCVII LLC(a),(f) | ||||
| CMO Series 2021-NPL6 Class A1 | ||||
| 04/25/2051 | 2.240% | 15,554,426 | 14,304,593 | |
| Verus Securitization Trust(a) | ||||
| CMO Series 2021-R2 Class M1 | ||||
| 02/25/2064 | 2.244% | 3,781,000 | 3,030,373 | |
| Subordinated CMO Series 2020-INV1 Class B1 | ||||
| 03/25/2060 | 5.750% | 1,050,000 | 967,699 | |
| Subordinated CMO Series 2020-INV1 Class B2 | ||||
| 03/25/2060 | 6.000% | 3,150,000 | 2,903,581 | |
| Verus Securitization Trust(a),(f) | ||||
| Subordinated CMO Series 2019-4 Class B1 | ||||
| 11/25/2059 | 3.860% | 4,150,000 | 3,563,707 | |
| Subordinated CMO Series 2020-1 Class B1 | ||||
| 01/25/2060 | 3.624% | 6,000,000 | 4,714,585 | |
| Subordinated CMO Series 2020-4 Class B2 | ||||
| 05/25/2065 | 5.600% | 2,000,000 | 1,522,944 | |
| Subordinated CMO Series 2023-1 Class B1 | ||||
| 12/25/2067 | 7.005% | 7,000,000 | 6,371,292 | |
| Subordinated CMO Series 2023-INV1 Class B1 | ||||
| 02/25/2068 | 7.653% | 4,198,000 | 3,895,829 | |
| Subordinated Series 2021-5 Class B1 | ||||
| 09/25/2066 | 3.037% | 3,800,000 | 2,280,572 | |
| Residential Mortgage-Backed Securities - Non-Agency (continued) | ||||
| Issuer | Coupon Rate | Principal Amount ($) | Value ($) | |
| Subordinated Series 2021-5 Class B2 | ||||
| 09/25/2066 | 3.941% | 3,500,000 | 2,120,545 | |
| Visio Trust(a),(f) | ||||
| CMO Series 2019-2 Class M1 | ||||
| 11/25/2054 | 3.260% | 1,400,000 | 1,182,156 | |
| Subordinated CMO Series 2019-2 Class B1 | ||||
| 11/25/2054 | 3.910% | 1,200,000 | 1,021,180 | |
| Vista Point Securitization Trust(a),(f) | ||||
| Subordinated CMO Series 2020-1 Class B1 | ||||
| 03/25/2065 | 5.365% | 2,000,000 | 1,924,788 | |
| Total Residential Mortgage-Backed Securities - Non-Agency (Cost $1,428,212,888) | 1,360,415,663 | |||
| Call Option Contracts Purchased 1.7% | ||||
| Value ($) | ||||
| (Cost $70,258,181) | 42,748,991 | |||
| Put Option Contracts Purchased 0.2% | ||||
| (Cost $5,500,000) | 3,514,000 | |||
| Money Market Funds 2.5% | ||
| Shares | Value ($) | |
| Columbia Short-Term Cash Fund, 5.241%(i),(j) | 63,678,486 | 63,646,647 |
| Total Money Market Funds (Cost $63,638,109) | 63,646,647 | |
| Total Investments in Securities (Cost: $5,206,507,707) | 4,867,995,813 | |
| Other Assets & Liabilities, Net | (2,361,300,326) | |
| Net Assets | 2,506,695,487 | |
| Long futures contracts | ||||||
| Description | Number of contracts | Expiration date | Trading currency | Notional amount | Value/Unrealized appreciation ($) | Value/Unrealized depreciation ($) |
| U.S. Treasury 2-Year Note | 9,432 | 09/2023 | USD | 1,941,370,884 | — | (3,138,912) |
| U.S. Treasury Ultra Bond | 1,316 | 09/2023 | USD | 180,127,500 | 2,496,349 | — |
| Total | 2,496,349 | (3,138,912) | ||||
| Columbia Mortgage Opportunities Fund | Annual Report 2023 | 19 |
May 31, 2023
| Short futures contracts | ||||||
| Description | Number of contracts | Expiration date | Trading currency | Notional amount | Value/Unrealized appreciation ($) | Value/Unrealized depreciation ($) |
| U.S. Treasury 10-Year Note | (27,223) | 09/2023 | USD | (3,116,182,781) | — | (9,849,274) |
| U.S. Treasury 5-Year Note | (265) | 09/2023 | USD | (28,905,703) | — | (166,240) |
| Total | — | (10,015,514) | ||||
| Call option contracts purchased | ||||||||
| Description | Counterparty | Trading currency | Notional amount | Number of contracts | Exercise price/Rate | Expiration date | Cost ($) | Value ($) |
| 10-Year OTC interest rate swap with Citi to receive exercise rate and pay SOFR | Citi | USD | 202,000,000 | 202,000,000 | 2.75 | 06/26/2023 | 6,559,951 | 118,574 |
| 10-Year OTC interest rate swap with Citi to receive exercise rate and pay SOFR | Citi | USD | 74,220,000 | 74,220,000 | 2.75 | 07/11/2023 | 2,597,700 | 103,292 |
| 10-Year OTC interest rate swap with Citi to receive exercise rate and pay SOFR | Citi | USD | 325,000,000 | 325,000,000 | 2.00 | 08/03/2023 | 5,476,250 | 103,285 |
| 10-Year OTC interest rate swap with Citi to receive exercise rate and pay SOFR | Citi | USD | 190,000,000 | 190,000,000 | 3.50 | 10/27/2023 | 6,745,000 | 6,392,588 |
| 10-Year OTC interest rate swap with Citi to receive exercise rate and pay SOFR | Citi | USD | 150,000,000 | 150,000,000 | 3.50 | 10/27/2023 | 5,700,000 | 5,046,780 |
| 10-Year OTC interest rate swap with Citi to receive exercise rate and pay SOFR | Citi | USD | 120,290,000 | 120,290,000 | 3.30 | 11/14/2023 | 3,849,280 | 3,139,581 |
| 10-Year OTC interest rate swap with Citi to receive exercise rate and pay SOFR | Citi | USD | 470,000,000 | 470,000,000 | 3.30 | 11/30/2023 | 12,455,000 | 12,974,773 |
| 10-Year OTC interest rate swap with Citi to receive exercise rate and pay SOFR | Citi | USD | 400,000,000 | 400,000,000 | 3.00 | 11/30/2023 | 12,300,000 | 6,872,520 |
| 10-Year OTC interest rate swap with Citi to receive exercise rate and pay SOFR | Citi | USD | 175,000,000 | 175,000,000 | 3.00 | 12/01/2023 | 6,037,500 | 3,023,598 |
| 10-Year OTC interest rate swap with Morgan Stanley to receive exercise rate and pay SOFR | Morgan Stanley | USD | 250,000,000 | 250,000,000 | 3.00 | 01/10/2024 | 8,537,500 | 4,974,000 |
| Total | 70,258,181 | 42,748,991 | ||||||
| Put option contracts purchased | ||||||||
| Description | Counterparty | Trading currency | Notional amount | Number of contracts | Exercise price/Rate | Expiration date | Cost ($) | Value ($) |
| 5-Year OTC interest rate swap with Morgan Stanley to receive SOFR and pay exercise rate | Morgan Stanley | USD | 500,000,000 | 500,000,000 | 3.75 | 08/25/2023 | 5,500,000 | 3,514,000 |
| Call option contracts written | ||||||||
| Description | Counterparty | Trading currency | Notional amount | Number of contracts | Exercise price/Rate | Expiration date | Premium received ($) | Value ($) |
| 10-Year OTC interest rate swap with Citi to receive SOFR and pay exercise rate | Citi | USD | (285,000,000) | (285,000,000) | 2.90 | 6/05/2023 | (1,710,000) | (1,197) |
| 10-Year OTC interest rate swap with Morgan Stanley to receive SOFR and pay exercise rate | Morgan Stanley | USD | (370,000,000) | (370,000,000) | 2.90 | 6/05/2023 | (2,775,000) | (1,554) |
| Total | (4,485,000) | (2,751) | ||||||
| 20 | Columbia Mortgage Opportunities Fund | Annual Report 2023 |
May 31, 2023
| Put option contracts written | ||||||||
| Description | Counterparty | Trading currency | Notional amount | Number of contracts | Exercise price/Rate | Expiration date | Premium received ($) | Value ($) |
| 10-Year OTC interest rate swap with Citi to receive exercise rate and pay SOFR | Citi | USD | (182,500,000) | (182,500,000) | 3.30 | 06/15/2023 | (1,250,126) | (2,355,163) |
| 10-Year OTC interest rate swap with JPMorgan to receive exercise rate and pay SOFR | JPMorgan | USD | (180,000,000) | (180,000,000) | 3.30 | 06/15/2023 | (1,260,000) | (2,322,900) |
| 10-Year OTC interest rate swap with Morgan Stanley to receive exercise rate and pay SOFR | Morgan Stanley | USD | (380,000,000) | (380,000,000) | 3.25 | 06/12/2023 | (2,850,000) | (5,657,250) |
| 5-Year OTC interest rate swap with Morgan Stanley to receive exercise rate and pay SOFR | Morgan Stanley | USD | (330,000,000) | (330,000,000) | 3.45 | 06/01/2023 | (1,551,000) | (1,619,376) |
| Total | (6,911,126) | (11,954,689) | ||||||
| Credit default swap contracts - buy protection | ||||||||||||
| Reference entity | Counterparty | Maturity date | Pay fixed rate (%) | Payment frequency | Notional currency | Notional amount | Value ($) | Periodic payments receivable (payable) ($) | Upfront payments ($) | Upfront receipts ($) | Unrealized appreciation ($) | Unrealized depreciation ($) |
| Markit CMBX North America Index, Series 11 BBB- | Citi | 11/18/2054 | 3.000 | Monthly | USD | 10,000,000 | 2,765,042 | (5,833) | 323,877 | — | 2,435,332 | — |
| Markit CMBX North America Index, Series 11 BBB- | Citi | 11/18/2054 | 3.000 | Monthly | USD | 20,500,000 | 5,668,336 | (11,958) | 5,185,182 | — | 471,196 | — |
| Markit CMBX North America Index, Series 11 BBB- | Citi | 11/18/2054 | 3.000 | Monthly | USD | 50,000,000 | 13,825,209 | (29,166) | 13,493,600 | — | 302,443 | — |
| Markit CMBX North America Index, Series 11 BBB- | Goldman Sachs International | 11/18/2054 | 3.000 | Monthly | USD | 10,000,000 | 2,765,041 | (5,833) | 1,516,969 | — | 1,242,239 | — |
| Total | 25,023,628 | (52,790) | 20,519,628 | — | 4,451,210 | — | ||||||
| Cleared credit default swap contracts - buy protection | |||||||||||
| Reference entity | Counterparty | Maturity date | Pay fixed rate (%) | Payment frequency | Notional currency | Notional amount | Value ($) | Upfront payments ($) | Upfront receipts ($) | Unrealized appreciation ($) | Unrealized depreciation ($) |
| Markit CDX North America High Yield Index, Series 40 | Morgan Stanley | 06/20/2028 | 5.000 | Quarterly | USD | 96,500,000 | (2,162,356) | — | — | — | (2,162,356) |
| Credit default swap contracts - sell protection | |||||||||||||
| Reference entity | Counterparty | Maturity date | Receive fixed rate (%) | Payment frequency | Implied credit spread (%)* | Notional currency | Notional amount | Value ($) | Periodic payments receivable (payable) ($) | Upfront payments ($) | Upfront receipts ($) | Unrealized appreciation ($) | Unrealized depreciation ($) |
| Markit CMBX North America Index, Series 10 BBB- | Citi | 11/17/2059 | 3.000 | Monthly | 16.577 | USD | 10,000,000 | (3,277,606) | 5,833 | — | (2,133,680) | — | (1,138,093) |
| Markit CMBX North America Index, Series 10 BBB- | Citi | 11/17/2059 | 3.000 | Monthly | 16.577 | USD | 40,000,000 | (13,110,428) | 23,333 | — | (4,734,311) | — | (8,352,784) |
| Markit CMBX North America Index, Series 10 BBB- | JPMorgan | 11/17/2059 | 3.000 | Monthly | 16.577 | USD | 10,000,000 | (3,277,607) | 5,833 | — | (1,673,235) | — | (1,598,539) |
| Markit CMBX North America Index, Series 10 BBB- | Morgan Stanley | 11/17/2059 | 3.000 | Monthly | 16.577 | USD | 8,800,000 | (2,884,294) | 5,133 | — | (1,993,545) | — | (885,616) |
| Columbia Mortgage Opportunities Fund | Annual Report 2023 | 21 |
May 31, 2023
| Credit default swap contracts - sell protection (continued) | |||||||||||||
| Reference entity | Counterparty | Maturity date | Receive fixed rate (%) | Payment frequency | Implied credit spread (%)* | Notional currency | Notional amount | Value ($) | Periodic payments receivable (payable) ($) | Upfront payments ($) | Upfront receipts ($) | Unrealized appreciation ($) | Unrealized depreciation ($) |
| Markit CMBX North America Index, Series 10 BBB- | Morgan Stanley | 11/17/2059 | 3.000 | Monthly | 16.577 | USD | 10,000,000 | (3,277,607) | 5,833 | — | (1,876,233) | — | (1,395,541) |
| Markit CMBX North America Index, Series 10 BBB- | Morgan Stanley | 11/17/2059 | 3.000 | Monthly | 16.577 | USD | 16,500,000 | (5,408,051) | 9,625 | — | (3,190,107) | — | (2,208,319) |
| Markit CMBX North America Index, Series 10 BBB- | Morgan Stanley | 11/17/2059 | 3.000 | Monthly | 16.577 | USD | 13,000,000 | (4,260,888) | 7,583 | — | (2,001,825) | — | (2,251,480) |
| Markit CMBX North America Index, Series 10 BBB- | Morgan Stanley | 11/17/2059 | 3.000 | Monthly | 16.577 | USD | 26,500,000 | (8,685,658) | 15,458 | — | (4,849,457) | — | (3,820,743) |
| Markit CMBX North America Index, Series 7 BBB- | Morgan Stanley | 01/17/2047 | 3.000 | Monthly | 70.861 | USD | 2,550,000 | (543,704) | 1,488 | — | (204,041) | — | (338,175) |
| Markit CMBX North America Index, Series 7 BBB- | Morgan Stanley | 01/17/2047 | 3.000 | Monthly | 70.861 | USD | 5,000,000 | (1,066,084) | 2,917 | — | (262,653) | — | (800,514) |
| Markit CMBX North America Index, Series 8 BBB- | Morgan Stanley | 10/17/2057 | 3.000 | Monthly | 22.655 | USD | 2,750,000 | (598,582) | 1,604 | — | (558,984) | — | (37,994) |
| Total | (46,390,509) | 84,640 | — | (23,478,071) | — | (22,827,798) | |||||||
| (a) | Represents privately placed and other securities and instruments exempt from Securities and Exchange Commission registration (collectively, private placements), such as Section 4(a)(2) and Rule 144A eligible securities, which are often sold only to qualified institutional buyers. At May 31, 2023, the total value of these securities amounted to $1,797,124,518, which represents 71.69% of total net assets. |
| (b) | Variable rate security. The interest rate shown was the current rate as of May 31, 2023. |
| (c) | Security represents a pool of loans that generate cash payments generally over fixed periods of time. Such securities entitle the security holders to receive distributions (i.e. principal and interest, net of fees and expenses) that are tied to the payments made by the borrower on the underlying loans. Due to the structure of the security the cash payments received are not known until the time of payment. The interest rate shown is the stated coupon rate as of May 31, 2023 and is not reflective of the cash flow payments. |
| (d) | Valuation based on significant unobservable inputs. |
| (e) | Represents fair value as determined in good faith under procedures approved by the Board of Trustees. At May 31, 2023, the total value of these securities amounted to $47,147,369, which represents 1.88% of total net assets. |
| (f) | Variable or floating rate security, the interest rate of which adjusts periodically based on changes in current interest rates and prepayments on the underlying pool of assets. The interest rate shown was the current rate as of May 31, 2023. |
| (g) | Represents interest only securities which have the right to receive the monthly interest payments on an underlying pool of mortgage loans. |
| (h) | Represents a security purchased on a when-issued basis. |
| (i) | The rate shown is the seven-day current annualized yield at May 31, 2023. |
| 22 | Columbia Mortgage Opportunities Fund | Annual Report 2023 |
May 31, 2023
| (j) | As defined in the Investment Company Act of 1940, as amended, an affiliated company is one in which the Fund owns 5% or more of the company’s outstanding voting securities, or a company which is under common ownership or control with the Fund. The value of the holdings and transactions in these affiliated companies during the year ended May 31, 2023 are as follows: |
| Affiliated issuers | Beginning of period($) | Purchases($) | Sales($) | Net change in unrealized appreciation (depreciation)($) | End of period($) | Realized gain (loss)($) | Dividends($) | End of period shares |
| Columbia Short-Term Cash Fund, 5.241% | ||||||||
| 218,546,293 | 2,047,281,583 | (2,202,189,426) | 8,197 | 63,646,647 | (19,706) | 4,954,100 | 63,678,486 | |
| CMO | Collateralized Mortgage Obligation |
| LIBOR | London Interbank Offered Rate |
| SOFR | Secured Overnight Financing Rate |
| STRIPS | Separate Trading of Registered Interest and Principal Securities |
| TBA | To Be Announced |
| USD | US Dollar |
| ■ | Level 1 — Valuations based on quoted prices for investments in active markets that the Fund has the ability to access at the measurement date. Valuation adjustments are not applied to Level 1 investments. |
| ■ | Level 2 — Valuations based on other significant observable inputs (including quoted prices for similar securities, interest rates, prepayment speeds, credit risks, etc.). |
| ■ | Level 3 — Valuations based on significant unobservable inputs (including the Fund’s own assumptions and judgment in determining the fair value of investments). |
| Columbia Mortgage Opportunities Fund | Annual Report 2023 | 23 |
May 31, 2023
The following table is a summary of the inputs used to value the Fund’s investments at May 31, 2023:
| Level 1 ($) | Level 2 ($) | Level 3 ($) | Total ($) | |
| Investments in Securities | ||||
| Asset-Backed Securities — Non-Agency | — | 307,468,834 | 41,377,838 | 348,846,672 |
| Commercial Mortgage-Backed Securities - Agency | — | 3,344,289 | — | 3,344,289 |
| Commercial Mortgage-Backed Securities - Non-Agency | — | 113,464,540 | — | 113,464,540 |
| Residential Mortgage-Backed Securities - Agency | — | 2,932,015,011 | — | 2,932,015,011 |
| Residential Mortgage-Backed Securities - Non-Agency | — | 1,225,599,271 | 134,816,392 | 1,360,415,663 |
| Call Option Contracts Purchased | — | 42,748,991 | — | 42,748,991 |
| Put Option Contracts Purchased | — | 3,514,000 | — | 3,514,000 |
| Money Market Funds | 63,646,647 | — | — | 63,646,647 |
| Total Investments in Securities | 63,646,647 | 4,628,154,936 | 176,194,230 | 4,867,995,813 |
| Investments in Derivatives | ||||
| Asset | ||||
| Futures Contracts | 2,496,349 | — | — | 2,496,349 |
| Swap Contracts | — | 4,451,210 | — | 4,451,210 |
| Liability | ||||
| Futures Contracts | (13,154,426) | — | — | (13,154,426) |
| Call Option Contracts Written | — | (2,751) | — | (2,751) |
| Put Option Contracts Written | — | (11,954,689) | — | (11,954,689) |
| Swap Contracts | — | (24,990,154) | — | (24,990,154) |
| Total | 52,988,570 | 4,595,658,552 | 176,194,230 | 4,824,841,352 |
| Balance as of 05/31/2022 ($) | Increase (decrease) in accrued discounts/ premiums ($) | Realized gain (loss) ($) | Change in unrealized appreciation (depreciation)(a) ($) | Purchases ($) | Sales ($) | Transfers into Level 3 ($) | Transfers out of Level 3 ($) | Balance as of 05/31/2023 ($) | |
| Asset-Backed Securities — Non-Agency | 154,202,529 | (61,228,496) | (69,518,568) | 56,525,943 | 10,754,490 | (49,358,060) | - | - | 41,377,838 |
| Residential Mortgage-Backed Securities — Non-Agency | 232,604,003 | 217,254 | 35,443 | (2,253,649) | 24,639,749 | (120,426,408) | - | - | 134,816,392 |
| Total | 386,806,532 | (61,011,242) | (69,483,125) | 54,272,294 | 35,394,239 | (169,784,468) | - | - | 176,194,230 |
| 24 | Columbia Mortgage Opportunities Fund | Annual Report 2023 |
May 31, 2023
| Assets | |
| Investments in securities, at value | |
| Unaffiliated issuers (cost $5,067,111,417) | $4,758,086,175 |
| Affiliated issuers (cost $63,638,109) | 63,646,647 |
| Option contracts purchased (cost $75,758,181) | 46,262,991 |
| Cash | 7,543,260 |
| Cash collateral held at broker for: | |
| Swap contracts | 3,150,000 |
| Option contracts written | 4,280,000 |
| TBA | 74,236,016 |
| Other(a) | 36,412,000 |
| Margin deposits on: | |
| Futures contracts | 63,701,715 |
| Swap contracts | 6,177,569 |
| Unrealized appreciation on swap contracts | 4,451,210 |
| Upfront payments on swap contracts | 20,519,628 |
| Receivable for: | |
| Investments sold | 159,046 |
| Capital shares sold | 1,981,963 |
| Dividends | 494,867 |
| Interest | 14,471,587 |
| Variation margin for futures contracts | 4,501,702 |
| Variation margin for swap contracts | 128,526 |
| Prepaid expenses | 13,078 |
| Total assets | 5,110,217,980 |
| Liabilities | |
| Option contracts written, at value (premiums received $11,396,126) | 11,957,440 |
| Unrealized depreciation on swap contracts | 22,827,798 |
| Upfront receipts on swap contracts | 23,478,071 |
| Payable for: | |
| Investments purchased | 14,489,662 |
| Investments purchased on a delayed delivery basis | 2,512,162,371 |
| Capital shares purchased | 6,141,289 |
| Variation margin for futures contracts | 12,001,156 |
| Management services fees | 43,426 |
| Distribution and/or service fees | 3,784 |
| Transfer agent fees | 226,970 |
| Compensation of board members | 93,920 |
| Other expenses | 96,606 |
| Total liabilities | 2,603,522,493 |
| Net assets applicable to outstanding capital stock | $2,506,695,487 |
| Represented by | |
| Paid in capital | 3,489,713,977 |
| Total distributable earnings (loss) | (983,018,490) |
| Total - representing net assets applicable to outstanding capital stock | $2,506,695,487 |
| Columbia Mortgage Opportunities Fund | Annual Report 2023 | 25 |
May 31, 2023
| Class A | |
| Net assets | $351,898,420 |
| Shares outstanding | 43,770,485 |
| Net asset value per share | $8.04 |
| Maximum sales charge | 3.00% |
| Maximum offering price per share (calculated by dividing the net asset value per share by 1.0 minus the maximum sales charge for Class A shares) | $8.29 |
| Advisor Class | |
| Net assets | $148,829,835 |
| Shares outstanding | 18,538,890 |
| Net asset value per share | $8.03 |
| Class C | |
| Net assets | $50,691,036 |
| Shares outstanding | 6,307,947 |
| Net asset value per share | $8.04 |
| Institutional Class | |
| Net assets | $1,342,560,332 |
| Shares outstanding | 167,100,972 |
| Net asset value per share | $8.03 |
| Institutional 2 Class | |
| Net assets | $419,705,892 |
| Shares outstanding | 52,260,333 |
| Net asset value per share | $8.03 |
| Institutional 3 Class | |
| Net assets | $193,009,972 |
| Shares outstanding | 24,011,497 |
| Net asset value per share | $8.04 |
| (a) | Includes collateral related to option contracts purchased, option contracts written and swap contracts. |
| 26 | Columbia Mortgage Opportunities Fund | Annual Report 2023 |
Year Ended May 31, 2023
| Net investment income | |
| Income: | |
| Dividends — unaffiliated issuers | $6,330,344 |
| Dividends — affiliated issuers | 4,954,100 |
| Interest | 209,464,723 |
| Interfund lending | 4,419 |
| Total income | 220,753,586 |
| Expenses: | |
| Management services fees | 18,293,480 |
| Distribution and/or service fees | |
| Class A | 917,143 |
| Class C | 610,999 |
| Transfer agent fees | |
| Class A | 376,764 |
| Advisor Class | 214,829 |
| Class C | 62,730 |
| Institutional Class | 1,595,961 |
| Institutional 2 Class | 253,365 |
| Institutional 3 Class | 15,175 |
| Compensation of board members | 65,631 |
| Custodian fees | 63,986 |
| Printing and postage fees | 187,659 |
| Registration fees | 199,647 |
| Accounting services fees | 50,490 |
| Legal fees | 52,004 |
| Interest on collateral | 724,425 |
| Compensation of chief compliance officer | 501 |
| Other | 55,925 |
| Total expenses | 23,740,714 |
| Fees waived or expenses reimbursed by Investment Manager and its affiliates | (167,103) |
| Expense reduction | (20) |
| Total net expenses | 23,573,591 |
| Net investment income | 197,179,995 |
| Realized and unrealized gain (loss) — net | |
| Net realized gain (loss) on: | |
| Investments — unaffiliated issuers | (156,618,575) |
| Investments — affiliated issuers | (19,706) |
| Futures contracts | (208,796,708) |
| Option contracts purchased | (29,754,494) |
| Option contracts written | (39,361,963) |
| Swap contracts | (53,593,161) |
| Net realized loss | (488,144,607) |
| Net change in unrealized appreciation (depreciation) on: | |
| Investments — unaffiliated issuers | (103,366,644) |
| Investments — affiliated issuers | 8,197 |
| Forward sale commitments | 7,447,265 |
| Futures contracts | (8,869,089) |
| Option contracts purchased | (23,008,970) |
| Option contracts written | 45,596,485 |
| Swap contracts | (3,276,654) |
| Net change in unrealized appreciation (depreciation) | (85,469,410) |
| Net realized and unrealized loss | (573,614,017) |
| Net decrease in net assets resulting from operations | $(376,434,022) |
| Columbia Mortgage Opportunities Fund | Annual Report 2023 | 27 |
| Year Ended May 31, 2023 | Year Ended May 31, 2022 | |
| Operations | ||
| Net investment income | $197,179,995 | $201,714,621 |
| Net realized loss | (488,144,607) | (159,961,741) |
| Net change in unrealized appreciation (depreciation) | (85,469,410) | (391,101,621) |
| Net decrease in net assets resulting from operations | (376,434,022) | (349,348,741) |
| Distributions to shareholders | ||
| Net investment income and net realized gains | ||
| Class A | (24,674,274) | (15,264,078) |
| Advisor Class | (14,075,726) | (18,693,751) |
| Class C | (3,603,885) | (3,049,711) |
| Institutional Class | (106,156,971) | (111,364,858) |
| Institutional 2 Class | (31,267,712) | (31,642,312) |
| Institutional 3 Class | (17,108,035) | (18,896,928) |
| Total distributions to shareholders | (196,886,603) | (198,911,638) |
| Increase (decrease) in net assets from capital stock activity | (829,079,379) | 476,133,368 |
| Total decrease in net assets | (1,402,400,004) | (72,127,011) |
| Net assets at beginning of year | 3,909,095,491 | 3,981,222,502 |
| Net assets at end of year | $2,506,695,487 | $3,909,095,491 |
| 28 | Columbia Mortgage Opportunities Fund | Annual Report 2023 |
| Year Ended | Year Ended | |||
| May 31, 2023 | May 31, 2022 | |||
| Shares | Dollars ($) | Shares | Dollars ($) | |
| Capital stock activity | ||||
| Class A | ||||
| Subscriptions | 20,787,809 | 181,705,951 | 38,999,287 | 406,944,552 |
| Distributions reinvested | 2,940,103 | 24,662,667 | 1,480,236 | 15,255,621 |
| Redemptions | (22,703,765) | (192,945,494) | (15,320,599) | (157,908,941) |
| Net increase | 1,024,147 | 13,423,124 | 25,158,924 | 264,291,232 |
| Advisor Class | ||||
| Subscriptions | 8,214,755 | 70,299,900 | 22,674,673 | 237,290,697 |
| Distributions reinvested | 1,664,639 | 14,055,653 | 1,802,248 | 18,671,922 |
| Redemptions | (25,355,349) | (217,252,053) | (29,584,615) | (304,569,303) |
| Net decrease | (15,475,955) | (132,896,500) | (5,107,694) | (48,606,684) |
| Class C | ||||
| Subscriptions | 920,257 | 7,803,452 | 2,816,093 | 29,802,151 |
| Distributions reinvested | 427,612 | 3,590,282 | 292,117 | 3,022,837 |
| Redemptions | (3,003,946) | (25,446,529) | (1,762,205) | (18,009,594) |
| Net increase (decrease) | (1,656,077) | (14,052,795) | 1,346,005 | 14,815,394 |
| Institutional Class | ||||
| Subscriptions | 94,374,552 | 797,976,808 | 167,893,736 | 1,751,722,439 |
| Distributions reinvested | 12,455,172 | 104,797,230 | 10,682,012 | 110,463,436 |
| Redemptions | (164,127,766) | (1,398,778,903) | (138,750,909) | (1,410,271,854) |
| Net increase (decrease) | (57,298,042) | (496,004,865) | 39,824,839 | 451,914,021 |
| Institutional 2 Class | ||||
| Subscriptions | 28,013,811 | 239,552,014 | 39,473,192 | 410,487,335 |
| Distributions reinvested | 3,715,773 | 31,221,508 | 3,061,126 | 31,617,889 |
| Redemptions | (46,790,133) | (406,914,625) | (48,368,850) | (502,357,562) |
| Net decrease | (15,060,549) | (136,141,103) | (5,834,532) | (60,252,338) |
| Institutional 3 Class | ||||
| Subscriptions | 10,650,344 | 93,263,692 | 13,714,243 | 145,223,510 |
| Distributions reinvested | 2,010,075 | 16,938,515 | 1,803,629 | 18,771,991 |
| Redemptions | (20,145,074) | (173,609,447) | (29,443,098) | (310,023,758) |
| Net decrease | (7,484,655) | (63,407,240) | (13,925,226) | (146,028,257) |
| Total net increase (decrease) | (95,951,131) | (829,079,379) | 41,462,316 | 476,133,368 |
| Columbia Mortgage Opportunities Fund | Annual Report 2023 | 29 |
| Net asset value, beginning of period | Net investment income | Net realized and unrealized gain (loss) | Total from investment operations | Distributions from net investment income | Distributions from net realized gains | Total distributions to shareholders | |
| Class A | |||||||
| Year Ended 5/31/2023 | $9.59 | 0.56 | (1.54) | (0.98) | (0.57) | — | (0.57) |
| Year Ended 5/31/2022 | $10.87 | 0.48 | (1.30) | (0.82) | (0.40) | (0.06) | (0.46) |
| Year Ended 5/31/2021 | $9.35 | 0.47 | 1.66 | 2.13 | (0.43) | (0.18) | (0.61) |
| Year Ended 5/31/2020 | $10.19 | 0.40 | (0.85) | (0.45) | (0.31) | (0.08) | (0.39) |
| Year Ended 5/31/2019 | $9.93 | 0.44 | 0.25 | 0.69 | (0.40) | (0.03) | (0.43) |
| Advisor Class | |||||||
| Year Ended 5/31/2023 | $9.58 | 0.59 | (1.55) | (0.96) | (0.59) | — | (0.59) |
| Year Ended 5/31/2022 | $10.86 | 0.49 | (1.28) | (0.79) | (0.43) | (0.06) | (0.49) |
| Year Ended 5/31/2021 | $9.35 | 0.50 | 1.65 | 2.15 | (0.46) | (0.18) | (0.64) |
| Year Ended 5/31/2020 | $10.18 | 0.42 | (0.83) | (0.41) | (0.34) | (0.08) | (0.42) |
| Year Ended 5/31/2019 | $9.92 | 0.47 | 0.24 | 0.71 | (0.42) | (0.03) | (0.45) |
| Class C | |||||||
| Year Ended 5/31/2023 | $9.58 | 0.50 | (1.53) | (1.03) | (0.51) | — | (0.51) |
| Year Ended 5/31/2022 | $10.87 | 0.39 | (1.30) | (0.91) | (0.32) | (0.06) | (0.38) |
| Year Ended 5/31/2021 | $9.35 | 0.40 | 1.65 | 2.05 | (0.35) | (0.18) | (0.53) |
| Year Ended 5/31/2020 | $10.19 | 0.32 | (0.84) | (0.52) | (0.24) | (0.08) | (0.32) |
| Year Ended 5/31/2019 | $9.93 | 0.37 | 0.24 | 0.61 | (0.32) | (0.03) | (0.35) |
| Institutional Class | |||||||
| Year Ended 5/31/2023 | $9.58 | 0.59 | (1.55) | (0.96) | (0.59) | — | (0.59) |
| Year Ended 5/31/2022 | $10.86 | 0.49 | (1.28) | (0.79) | (0.43) | (0.06) | (0.49) |
| Year Ended 5/31/2021 | $9.35 | 0.50 | 1.65 | 2.15 | (0.46) | (0.18) | (0.64) |
| Year Ended 5/31/2020 | $10.19 | 0.42 | (0.84) | (0.42) | (0.34) | (0.08) | (0.42) |
| Year Ended 5/31/2019 | $9.93 | 0.47 | 0.24 | 0.71 | (0.42) | (0.03) | (0.45) |
| Institutional 2 Class | |||||||
| Year Ended 5/31/2023 | $9.58 | 0.59 | (1.54) | (0.95) | (0.60) | — | (0.60) |
| Year Ended 5/31/2022 | $10.86 | 0.50 | (1.29) | (0.79) | (0.43) | (0.06) | (0.49) |
| Year Ended 5/31/2021 | $9.35 | 0.50 | 1.65 | 2.15 | (0.46) | (0.18) | (0.64) |
| Year Ended 5/31/2020 | $10.18 | 0.42 | (0.83) | (0.41) | (0.34) | (0.08) | (0.42) |
| Year Ended 5/31/2019 | $9.92 | 0.47 | 0.25 | 0.72 | (0.43) | (0.03) | (0.46) |
| 30 | Columbia Mortgage Opportunities Fund | Annual Report 2023 |
| Net asset value, end of period | Total return | Total gross expense ratio to average net assets(a) | Total net expense ratio to average net assets(a),(b) | Net investment income ratio to average net assets | Portfolio turnover | Net assets, end of period (000’s) | |
| Class A | |||||||
| Year Ended 5/31/2023 | $8.04 | (10.26%) | 1.03%(c) | 1.03%(c),(d) | 6.60% | 624% | $351,898 |
| Year Ended 5/31/2022 | $9.59 | (7.79%) | 0.99%(c) | 0.99%(c),(d) | 4.58% | 340% | $409,868 |
| Year Ended 5/31/2021 | $10.87 | 23.28% | 1.01%(c) | 1.00%(c),(d) | 4.56% | 496% | $191,161 |
| Year Ended 5/31/2020 | $9.35 | (4.54%) | 1.04%(c),(e) | 1.01%(c),(e) | 3.97% | 819% | $92,796 |
| Year Ended 5/31/2019 | $10.19 | 7.12% | 1.08%(c) | 1.01%(c) | 4.41% | 528% | $123,926 |
| Advisor Class | |||||||
| Year Ended 5/31/2023 | $8.03 | (10.04%) | 0.78%(c) | 0.77%(c),(d) | 6.86% | 624% | $148,830 |
| Year Ended 5/31/2022 | $9.58 | (7.56%) | 0.74%(c) | 0.74%(c),(d) | 4.65% | 340% | $325,742 |
| Year Ended 5/31/2021 | $10.86 | 23.48% | 0.76%(c) | 0.75%(c),(d) | 4.79% | 496% | $424,803 |
| Year Ended 5/31/2020 | $9.35 | (4.20%) | 0.78%(c),(e) | 0.76%(c),(e) | 4.20% | 819% | $146,447 |
| Year Ended 5/31/2019 | $10.18 | 7.39% | 0.84%(c) | 0.76%(c) | 4.69% | 528% | $196,808 |
| Class C | |||||||
| Year Ended 5/31/2023 | $8.04 | (10.84%) | 1.78%(c) | 1.78%(c),(d) | 5.85% | 624% | $50,691 |
| Year Ended 5/31/2022 | $9.58 | (8.57%) | 1.74%(c) | 1.74%(c),(d) | 3.70% | 340% | $76,327 |
| Year Ended 5/31/2021 | $10.87 | 22.37% | 1.76%(c) | 1.75%(c),(d) | 3.82% | 496% | $71,915 |
| Year Ended 5/31/2020 | $9.35 | (5.26%) | 1.79%(c),(e) | 1.76%(c),(e) | 3.26% | 819% | $40,482 |
| Year Ended 5/31/2019 | $10.19 | 6.32% | 1.84%(c) | 1.76%(c) | 3.69% | 528% | $32,543 |
| Institutional Class | |||||||
| Year Ended 5/31/2023 | $8.03 | (10.04%) | 0.78%(c) | 0.77%(c),(d) | 6.84% | 624% | $1,342,560 |
| Year Ended 5/31/2022 | $9.58 | (7.56%) | 0.74%(c) | 0.74%(c),(d) | 4.72% | 340% | $2,150,404 |
| Year Ended 5/31/2021 | $10.86 | 23.48% | 0.76%(c) | 0.75%(c),(d) | 4.80% | 496% | $2,005,278 |
| Year Ended 5/31/2020 | $9.35 | (4.29%) | 0.78%(c),(e) | 0.76%(c),(e) | 4.23% | 819% | $752,376 |
| Year Ended 5/31/2019 | $10.19 | 7.38% | 0.84%(c) | 0.76%(c) | 4.71% | 528% | $694,646 |
| Institutional 2 Class | |||||||
| Year Ended 5/31/2023 | $8.03 | (10.01%) | 0.74%(c) | 0.74%(c) | 6.87% | 624% | $419,706 |
| Year Ended 5/31/2022 | $9.58 | (7.52%) | 0.70%(c) | 0.70%(c) | 4.76% | 340% | $644,830 |
| Year Ended 5/31/2021 | $10.86 | 23.53% | 0.72%(c) | 0.71%(c) | 4.82% | 496% | $794,473 |
| Year Ended 5/31/2020 | $9.35 | (4.15%) | 0.74%(c),(e) | 0.71%(c),(e) | 4.26% | 819% | $203,390 |
| Year Ended 5/31/2019 | $10.18 | 7.45% | 0.77%(c) | 0.70%(c) | 4.70% | 528% | $150,092 |
| Columbia Mortgage Opportunities Fund | Annual Report 2023 | 31 |
| Net asset value, beginning of period | Net investment income | Net realized and unrealized gain (loss) | Total from investment operations | Distributions from net investment income | Distributions from net realized gains | Total distributions to shareholders | |
| Institutional 3 Class | |||||||
| Year Ended 5/31/2023 | $9.59 | 0.60 | (1.55) | (0.95) | (0.60) | — | (0.60) |
| Year Ended 5/31/2022 | $10.87 | 0.49 | (1.27) | (0.78) | (0.44) | (0.06) | (0.50) |
| Year Ended 5/31/2021 | $9.35 | 0.51 | 1.66 | 2.17 | (0.47) | (0.18) | (0.65) |
| Year Ended 5/31/2020 | $10.19 | 0.43 | (0.84) | (0.41) | (0.35) | (0.08) | (0.43) |
| Year Ended 5/31/2019 | $9.93 | 0.47 | 0.25 | 0.72 | (0.43) | (0.03) | (0.46) |
| Notes to Financial Highlights | |
| (a) | In addition to the fees and expenses that the Fund bears directly, the Fund indirectly bears a pro rata share of the fees and expenses of any other funds in which it invests. Such indirect expenses are not included in the Fund’s reported expense ratios. |
| (b) | Total net expenses include the impact of certain fee waivers/expense reimbursements made by the Investment Manager and certain of its affiliates, if applicable. |
| (c) | Ratios include interest on collateral expense. For the periods indicated below, if interest on collateral expense had been excluded, expenses would have been lower by: |
| Class | 5/31/2023 | 5/31/2022 | 5/31/2021 | 5/31/2020 | 5/31/2019 |
| Class A | 0.03% | less than 0.01% | less than 0.01% | 0.01% | 0.01% |
| Advisor Class | 0.02% | less than 0.01% | less than 0.01% | 0.01% | 0.01% |
| Class C | 0.03% | less than 0.01% | less than 0.01% | 0.01% | 0.01% |
| Institutional Class | 0.02% | less than 0.01% | less than 0.01% | 0.01% | 0.01% |
| Institutional 2 Class | 0.03% | less than 0.01% | less than 0.01% | 0.01% | 0.01% |
| Institutional 3 Class | 0.02% | less than 0.01% | less than 0.01% | 0.01% | 0.01% |
| (d) | The benefits derived from expense reductions had an impact of less than 0.01%. |
| (e) | Ratios include interfund lending expense which is less than 0.01%. |
| 32 | Columbia Mortgage Opportunities Fund | Annual Report 2023 |
| Net asset value, end of period | Total return | Total gross expense ratio to average net assets(a) | Total net expense ratio to average net assets(a),(b) | Net investment income ratio to average net assets | Portfolio turnover | Net assets, end of period (000’s) | |
| Institutional 3 Class | |||||||
| Year Ended 5/31/2023 | $8.04 | (9.95%) | 0.69%(c) | 0.68%(c) | 6.96% | 624% | $193,010 |
| Year Ended 5/31/2022 | $9.59 | (7.47%) | 0.65%(c) | 0.65%(c) | 4.65% | 340% | $301,924 |
| Year Ended 5/31/2021 | $10.87 | 23.71% | 0.67%(c) | 0.66%(c) | 4.92% | 496% | $493,593 |
| Year Ended 5/31/2020 | $9.35 | (4.20%) | 0.69%(c),(e) | 0.66%(c),(e) | 4.36% | 819% | $215,799 |
| Year Ended 5/31/2019 | $10.19 | 7.49% | 0.72%(c) | 0.65%(c) | 4.71% | 528% | $205,730 |
| Columbia Mortgage Opportunities Fund | Annual Report 2023 | 33 |
May 31, 2023
| 34 | Columbia Mortgage Opportunities Fund | Annual Report 2023 |
May 31, 2023
| Columbia Mortgage Opportunities Fund | Annual Report 2023 | 35 |
May 31, 2023
| 36 | Columbia Mortgage Opportunities Fund | Annual Report 2023 |
May 31, 2023
| Columbia Mortgage Opportunities Fund | Annual Report 2023 | 37 |
May 31, 2023
| 38 | Columbia Mortgage Opportunities Fund | Annual Report 2023 |
May 31, 2023
| Asset derivatives | ||
| Risk exposure category | Statement of assets and liabilities location | Fair value ($) |
| Credit risk | Component of total distributable earnings (loss) — unrealized appreciation on swap contracts | 4,451,210* |
| Credit risk | Upfront payments on swap contracts | 20,519,628 |
| Interest rate risk | Component of total distributable earnings (loss) — unrealized appreciation on futures contracts | 2,496,349* |
| Interest rate risk | Investments, at value — Option contracts purchased | 46,262,991 |
| Total | 73,730,178 |
| Liability derivatives | ||
| Risk exposure category | Statement of assets and liabilities location | Fair value ($) |
| Credit risk | Component of total distributable earnings (loss) — unrealized depreciation on swap contracts | 24,990,154* |
| Credit risk | Upfront receipts on swap contracts | 23,478,071 |
| Interest rate risk | Component of total distributable earnings (loss) — unrealized depreciation on futures contracts | 13,154,426* |
| Interest rate risk | Option contracts written, at value | 11,957,440 |
| Total | 73,580,091 |
| * | Includes cumulative appreciation (depreciation) as reported in the tables following the Portfolio of Investments. Only the current day’s variation margin for futures and centrally cleared swaps, if any, is reported in receivables or payables in the Statement of Assets and Liabilities. |
| Amount of realized gain (loss) on derivatives recognized in income | |||||
| Risk exposure category | Futures contracts ($) | Option contracts purchased ($) | Option contracts written ($) | Swap contracts ($) | Total ($) |
| Credit risk | — | — | — | (53,593,161) | (53,593,161) |
| Interest rate risk | (208,796,708) | (29,754,494) | (39,361,963) | — | (277,913,165) |
| Total | (208,796,708) | (29,754,494) | (39,361,963) | (53,593,161) | (331,506,326) |
| Change in unrealized appreciation (depreciation) on derivatives recognized in income | |||||
| Risk exposure category | Futures contracts ($) | Option contracts purchased ($) | Option contracts written ($) | Swap contracts ($) | Total ($) |
| Credit risk | — | — | — | (3,276,654) | (3,276,654) |
| Interest rate risk | (8,869,089) | (23,008,970) | 45,596,485 | — | 13,718,426 |
| Total | (8,869,089) | (23,008,970) | 45,596,485 | (3,276,654) | 10,441,772 |
| Columbia Mortgage Opportunities Fund | Annual Report 2023 | 39 |
May 31, 2023
| Derivative instrument | Average notional amounts ($)* |
| Futures contracts — long | 1,102,240,018 |
| Futures contracts — short | 2,572,345,894 |
| Credit default swap contracts — buy protection | 286,412,500 |
| Credit default swap contracts — sell protection | 267,787,500 |
| Derivative instrument | Average value ($)* |
| Option contracts purchased | 46,160,152 |
| Option contracts written | (12,509,238) |
| * | Based on the ending quarterly outstanding amounts for the year ended May 31, 2023. |
| 40 | Columbia Mortgage Opportunities Fund | Annual Report 2023 |
May 31, 2023
| Citi ($)(a) | Citi ($)(a) | Goldman Sachs International ($) | JPMorgan ($)(a) | JPMorgan ($)(a) | Morgan Stanley ($)(a) | Morgan Stanley ($)(a) | Total ($) | |
| Assets | ||||||||
| Centrally cleared credit default swap contracts (b) | - | - | - | - | - | 128,526 | - | 128,526 |
| Call option contracts purchased | 37,774,991 | - | - | - | - | - | 4,974,000 | 42,748,991 |
| Put option contracts purchased | - | - | - | - | - | - | 3,514,000 | 3,514,000 |
| OTC credit default swap contracts (c) | - | 22,211,630 | 2,759,208 | - | - | - | - | 24,970,838 |
| Total assets | 37,774,991 | 22,211,630 | 2,759,208 | - | - | 128,526 | 8,488,000 | 71,362,355 |
| Liabilities | ||||||||
| Call option contracts written | 1,197 | - | - | - | - | - | 1,554 | 2,751 |
| Put option contracts written | 2,355,163 | - | - | 2,322,900 | - | - | 7,276,626 | 11,954,689 |
| OTC credit default swap contracts (c) | - | 16,358,868 | - | - | 3,271,774 | - | 26,675,227 | 46,305,869 |
| Total liabilities | 2,356,360 | 16,358,868 | - | 2,322,900 | 3,271,774 | - | 33,953,407 | 58,263,309 |
| Total financial and derivative net assets | 35,418,631 | 5,852,762 | 2,759,208 | (2,322,900) | (3,271,774) | 128,526 | (25,465,407) | 13,099,046 |
| Total collateral received (pledged) (d) | 20,315,000 | 5,720,000 | 2,750,000 | (2,322,900) | (3,150,000) | - | (25,465,407) | (2,153,307) |
| Net amount (e) | 15,103,631 | 132,762 | 9,208 | - | (121,774) | 128,526 | - | 15,252,353 |
| Columbia Mortgage Opportunities Fund | Annual Report 2023 | 41 |
May 31, 2023
| (a) | Exposure can only be netted across transactions governed under the same master agreement with the same legal entity. |
| (b) | Centrally cleared swaps are included within payable/receivable for variation margin in the Statement of Assets and Liabilities. |
| (c) | Over-the-Counter (OTC) swap contracts are presented at market value plus periodic payments receivable (payable), which is comprised of unrealized appreciation, unrealized depreciation, upfront payments and upfront receipts. |
| (d) | In some instances, the actual collateral received and/or pledged may be more than the amount shown due to overcollateralization. |
| (e) | Represents the net amount due from/(to) counterparties in the event of default. |
| 42 | Columbia Mortgage Opportunities Fund | Annual Report 2023 |
May 31, 2023
| Columbia Mortgage Opportunities Fund | Annual Report 2023 | 43 |
May 31, 2023
| Effective rate (%) | |
| Class A | 0.10 |
| Advisor Class | 0.10 |
| Class C | 0.10 |
| Institutional Class | 0.10 |
| Institutional 2 Class | 0.06 |
| Institutional 3 Class | 0.01 |
| Front End (%) | CDSC (%) | Amount ($) | |
| Class A | 3.00 | 0.50 - 1.00(a) | 156,360 |
| Class C | — | 1.00(b) | 11,818 |
| 44 | Columbia Mortgage Opportunities Fund | Annual Report 2023 |
May 31, 2023
| (a) | This charge is imposed on certain investments of between $1 million and $50 million redeemed within 18 months after purchase, as follows: 1.00% if redeemed within 12 months after purchase, and 0.50% if redeemed more than 12, but less than 18, months after purchase, with certain limited exceptions. |
| (b) | This charge applies to redemptions within 12 months after purchase, with certain limited exceptions. |
| Fee rate(s) contractual through September 30, 2023 | |
| Class A | 1.00% |
| Advisor Class | 0.75 |
| Class C | 1.75 |
| Institutional Class | 0.75 |
| Institutional 2 Class | 0.71 |
| Institutional 3 Class | 0.66 |
| Undistributed net investment income ($) | Accumulated net realized (loss) ($) | Paid in capital ($) |
| (2,792,887) | 2,792,888 | (1) |
| Columbia Mortgage Opportunities Fund | Annual Report 2023 | 45 |
May 31, 2023
| Year Ended May 31, 2023 | Year Ended May 31, 2022 | ||||
| Ordinary income ($) | Long-term capital gains ($) | Total ($) | Ordinary income ($) | Long-term capital gains ($) | Total ($) |
| 196,886,603 | — | 196,886,603 | 198,911,638 | — | 198,911,638 |
| Undistributed ordinary income ($) | Undistributed long-term capital gains ($) | Capital loss carryforwards ($) | Net unrealized (depreciation) ($) |
| 15,200,807 | — | (615,532,304) | (382,596,663) |
| Federal tax cost ($) | Gross unrealized appreciation ($) | Gross unrealized (depreciation) ($) | Net unrealized (depreciation) ($) |
| 5,204,479,572 | 69,813,292 | (452,409,955) | (382,596,663) |
| No expiration short-term ($) | No expiration long-term ($) | Total ($) | Utilized ($) |
| (347,414,695) | (268,117,609) | (615,532,304) | — |
| 46 | Columbia Mortgage Opportunities Fund | Annual Report 2023 |
May 31, 2023
| Borrower or lender | Average loan balance ($) | Weighted average interest rate (%) | Number of days with outstanding loans |
| Lender | 4,225,000 | 4.51 | 8 |
| Columbia Mortgage Opportunities Fund | Annual Report 2023 | 47 |
May 31, 2023
| 48 | Columbia Mortgage Opportunities Fund | Annual Report 2023 |
May 31, 2023
| Columbia Mortgage Opportunities Fund | Annual Report 2023 | 49 |
May 31, 2023
| 50 | Columbia Mortgage Opportunities Fund | Annual Report 2023 |
| Columbia Mortgage Opportunities Fund | Annual Report 2023 | 51 |
| Name, address, year of birth | Position held with the Columbia Funds and length of service | Principal occupation(s) during past five years and other relevant professional experience | Number of Funds in the Columbia Funds Complex* overseen | Other directorships held by Trustee during the past five years and other relevant Board experience |
| George S. Batejan c/o Columbia Management Investment Advisers, LLC 290 Congress Street Boston, MA 02210 1954 | Trustee since 2017 | Executive Vice President, Global Head of Technology and Operations, Janus Capital Group, Inc., 2010-2016 | 174 | Former Chairman of the Board, NICSA (National Investment Company Services Association) (Executive Committee, Nominating Committee and Governance Committee), 2014-2016; former Director, Intech Investment Management, 2011-2016; former Board Member, Metro Denver Chamber of Commerce, 2015-2016; former Advisory Board Member, University of Colorado Business School, 2015-2018; former Board Member, Chase Bank International, 1993-1994 |
| Kathleen Blatz c/o Columbia Management Investment Advisers, LLC 290 Congress Street Boston, MA 02210 1954 | Trustee since 2006 | Attorney, specializing in arbitration and mediation; Chief Justice, Minnesota Supreme Court, 1998-2006; Associate Justice, Minnesota Supreme Court, 1996-1998; Fourth Judicial District Court Judge, Hennepin County, 1994-1996; Attorney in private practice and public service, 1984-1993; State Representative, Minnesota House of Representatives, 1979-1993, which included service on the Tax and Financial Institutions and Insurance Committees; Member and Interim Chair, Minnesota Sports Facilities Authority, January-July 2017; Interim President and Chief Executive Officer, Blue Cross and Blue Shield of Minnesota (health care insurance), February-July 2018, April-October 2021 | 174 | Former Trustee, Blue Cross and Blue Shield of Minnesota, 2009-2021 (Chair of the Business Development Committee, 2014-2017; Chair of the Governance Committee, 2017-2019); former Member and Chair of the Board, Minnesota Sports Facilities Authority, January 2017-July 2017; former Director, Robina Foundation, 2009-2020 (Chair, 2014-2020); Director, Richard M. Schulze Family Foundation, since 2021 |
| 52 | Columbia Mortgage Opportunities Fund | Annual Report 2023 |
(Unaudited)
Independent trustees (continued)
| Name, address, year of birth | Position held with the Columbia Funds and length of service | Principal occupation(s) during past five years and other relevant professional experience | Number of Funds in the Columbia Funds Complex* overseen | Other directorships held by Trustee during the past five years and other relevant Board experience |
| Pamela G. Carlton c/o Columbia Management Investment Advisers, LLC 290 Congress Street Boston, MA 02210 1954 | Chair since 2023; Trustee since 2007 | President, Springboard — Partners in Cross Cultural Leadership (consulting company), since 2003; Managing Director of US Equity Research, JP Morgan Chase, 1999-2003; Director of US Equity Research, Chase Asset Management, 1996-1999; Co-Director Latin America Research, 1993-1996, COO Global Research, 1992-1996, Co-Director of US Research, 1991-1992, Investment Banker, 1982-1991, Morgan Stanley; Attorney, Cleary Gottlieb Steen & Hamilton LLP, 1980-1982 | 174 | Trustee, New York Presbyterian Hospital Board, since 1996; Director, DR Bank (Audit Committee) since 2017; Director, Evercore Inc. (Audit Committee, Nominating and Governance Committee), since 2019; Director, Apollo Commercial Real Estate Finance, Inc. (Chair, Nominating and Governance Committee) (financial services), since 2021; the Governing Council of the Independent Directors Council (IDC), since 2021 |
| Janet Langford Carrig c/o Columbia Management Investment Advisers, LLC 290 Congress Street Boston, MA 02210 1957 | Trustee since 1996 | Senior Vice President, General Counsel and Corporate Secretary, ConocoPhillips (independent energy company), September 2007-October 2018 | 174 | Director, EQT Corporation (natural gas producer), since 2019; former Director, Whiting Petroleum Corporation (independent oil and gas company), 2020-2022 |
| J. Kevin Connaughton c/o Columbia Management Investment Advisers, LLC 290 Congress Street Boston, MA 02210 1964 | Trustee since 2020 | CEO and President, RhodeWay Financial (non-profit financial planning firm), since December 2022; Member, FINRA National Adjudicatory Council, since January 2020; Adjunct Professor of Finance, Bentley University since January 2018; Consultant to Independent Trustees of CFVIT and CFST I from March 2016 to June 2020 with respect to CFVIT and to December 2020 with respect to CFST I; Managing Director and General Manager of Mutual Fund Products, Columbia Management Investment Advisers, LLC, May 2010-February 2015; President, Columbia Funds, 2008-2015; and senior officer of Columbia Funds and affiliated funds, 2003-2015 | 172 | Former Director, The Autism Project, March 2015-December 2021; former Member of the Investment Committee, St. Michael’s College, November 2015-February 2020; former Trustee, St. Michael’s College, June 2017-September 2019; former Trustee, New Century Portfolios (former mutual fund complex), January 2015-December 2017 |
| Olive M. Darragh c/o Columbia Management Investment Advisers, LLC 290 Congress Street Boston, MA 02210 1962 | Trustee since 2020 | Managing Director of Darragh Inc. (strategy and talent management consulting firm), since 2010; Founder and CEO, Zolio, Inc. (investment management talent identification platform), since 2004; Consultant to Independent Trustees of CFVIT and CFST I from June 2019 to June 2020 with respect to CFVIT and to December 2020 with respect to CFST I; Partner, Tudor Investments, 2004-2010; Senior Partner, McKinsey & Company (consulting), 1990-2004; Touche Ross CPA, 1985-1988 | 172 | Treasurer, Edinburgh University US Trust Board, since January 2023; Member, HBS Community Action Partners Board, since September 2022; former Director, University of Edinburgh Business School (Member of US Board), 2004-2019; former Director, Boston Public Library Foundation, 2008-2017 |
| Columbia Mortgage Opportunities Fund | Annual Report 2023 | 53 |
(Unaudited)
Independent trustees (continued)
| Name, address, year of birth | Position held with the Columbia Funds and length of service | Principal occupation(s) during past five years and other relevant professional experience | Number of Funds in the Columbia Funds Complex* overseen | Other directorships held by Trustee during the past five years and other relevant Board experience |
| Patricia M. Flynn c/o Columbia Management Investment Advisers, LLC 290 Congress Street Boston, MA 02210 1950 | Trustee since 2004 | Professor of Economics and Management, Bentley University, since 2002; Dean, McCallum Graduate School of Business, Bentley University, 1992-2002 | 174 | Former Trustee, MA Taxpayers Foundation, 1997-2022; former Director, The MA Business Roundtable, 2003-2019; former Chairperson, Innovation Index Advisory Committee, MA Technology Collaborative, 1997-2020 |
| Brian J. Gallagher c/o Columbia Management Investment Advisers, LLC 290 Congress Street Boston, MA 02210 1954 | Trustee since 2017 | Retired; Partner with Deloitte & Touche LLP and its predecessors, 1977-2016 | 174 | Trustee, Catholic Schools Foundation, since 2004 |
| Douglas A. Hacker c/o Columbia Management Investment Advisers, LLC 290 Congress Street Boston, MA 02210 1955 | Trustee since 1996 | Independent business executive, since May 2006; Executive Vice President – Strategy of United Airlines, December 2002 - May 2006; President of UAL Loyalty Services (airline marketing company), September 2001-December 2002; Executive Vice President and Chief Financial Officer of United Airlines, July 1999-September 2001 | 174 | Director, SpartanNash Company since November 2013 (Chair of the Board, since May 2021) (food distributor); Director, Aircastle Limited (Chair of Audit Committee) (aircraft leasing), since August 2006; former Director, Nash Finch Company (food distributor), 2005-2013; former Director, SeaCube Container Leasing Ltd. (container leasing), 2010-2013; and former Director, Travelport Worldwide Limited (travel information technology), 2014-2019 |
| Nancy T. Lukitsh c/o Columbia Management Investment Advisers, LLC 290 Congress Street Boston, MA 02210 1956 | Trustee since 2011 | Senior Vice President, Partner and Director of Marketing, Wellington Management Company, LLP (investment adviser), 1997-2010; Chair, Wellington Management Portfolios (commingled non-U.S. investment pools), 2007-2010; Director, Wellington Trust Company, NA and other Wellington affiliates, 1997-2010 | 172 | None |
| 54 | Columbia Mortgage Opportunities Fund | Annual Report 2023 |
(Unaudited)
Independent trustees (continued)
| Name, address, year of birth | Position held with the Columbia Funds and length of service | Principal occupation(s) during past five years and other relevant professional experience | Number of Funds in the Columbia Funds Complex* overseen | Other directorships held by Trustee during the past five years and other relevant Board experience |
| David M. Moffett c/o Columbia Management Investment Advisers, LLC 290 Congress Street Boston, MA 02210 1952 | Trustee since 2011 | Retired; former Chief Executive Officer of Freddie Mac and Chief Financial Officer of U.S. Bank | 172 | Director, CSX Corporation (transportation suppliers); Director, PayPal Holdings Inc. (payment and data processing services); Trustee, University of Oklahoma Foundation; former Director, eBay Inc. (online trading community), 2007-2015; and former Director, CIT Bank, CIT Group Inc. (commercial and consumer finance), 2010-2016; former Senior Adviser to The Carlyle Group (financial services), March 2008-September 2008; former Governance Consultant to Bridgewater Associates, January 2013-December 2015 |
| Catherine James Paglia c/o Columbia Management Investment Advisers, LLC 290 Congress Street Boston, MA 02210 1952 | Trustee since 2004 | Director, Enterprise Asset Management, Inc. (private real estate and asset management company), since September 1998; Managing Director and Partner, Interlaken Capital, Inc., 1989-1997; Vice President, 1982-1985, Principal, 1985-1987, Managing Director, 1987-1989, Morgan Stanley; Vice President, Investment Banking, 1980-1982, Associate, Investment Banking, 1976-1980, Dean Witter Reynolds, Inc. | 174 | Director, Valmont Industries, Inc. (irrigation systems manufacturer), since 2012; Trustee, Carleton College (on the Investment Committee), since 1987; Trustee, Carnegie Endowment for International Peace (on the Investment Committee), since 2009 |
| Natalie A. Trunow c/o Columbia Management Investment Advisers, LLC 290 Congress Street Boston, MA 02210 1967 | Trustee since 2020 | Chief Executive Officer, Millennial Portfolio Solutions LLC (asset management and consulting services), January 2016-January 2021; Non-executive Member of the Investment Committee and Valuation Committee, Sarona Asset Management Inc. (private equity firm) since September 2019; Advisor, Horizon Investments (asset management and consulting services), August 2018-January 2022; Advisor, Paradigm Asset Management, November 2016-January 2022; Consultant to Independent Trustees of CFVIT and CFST I from September 2016 to June 2020 with respect to CFVIT and to December 2020 with respect to CFST I; Director of Investments/Consultant, Casey Family Programs, April 2016-November 2016; Senior Vice President and Chief Investment Officer, Calvert Investments, August 2008-January 2016; Section Head and Portfolio Manager, General Motors Asset Management, June 1997-August 2008 | 172 | Independent Director, Investment Committee, Health Services for Children with Special Needs, Inc., 2010-2021; Independent Director, (Executive Committee and Chair, Audit Committee), Consumer Credit Counseling Services (formerly Guidewell Financial Solutions), since 2016; Independent Director, (Investment Committee), Sarona Asset Management, since 2019 |
| Columbia Mortgage Opportunities Fund | Annual Report 2023 | 55 |
(Unaudited)
Independent trustees (continued)
| Name, address, year of birth | Position held with the Columbia Funds and length of service | Principal occupation(s) during past five years and other relevant professional experience | Number of Funds in the Columbia Funds Complex* overseen | Other directorships held by Trustee during the past five years and other relevant Board experience |
| Sandra L. Yeager c/o Columbia Management Investment Advisers, LLC 290 Congress Street Boston, MA 02210 1964 | Trustee since 2017 | Retired; President and founder, Hanoverian Capital, LLC (SEC registered investment advisor firm), 2008-2016; Managing Director, DuPont Capital, 2006-2008; Managing Director, Morgan Stanley Investment Management, 2004-2006; Senior Vice President, Alliance Bernstein, 1990-2004 | 174 | Former Director, NAPE (National Alliance for Partnerships in Equity) Education Foundation, October 2016-October 2020; Advisory Board, Jennersville YMCA, since 2022 |
| Name, address, year of birth | Position held with the Columbia Funds and length of service | Principal occupation(s) during the past five years and other relevant professional experience | Number of Funds in the Columbia Funds Complex overseen | Other directorships held by Trustee during the past five years and other relevant Board experience |
| Daniel J. Beckman c/o Columbia Management Investment Advisers, LLC 290 Congress Street Boston, MA 02210 1962 | Trustee since November 2021 and President since June 2021 | Vice President – Head of North America Product, Columbia Management Investment Advisers, LLC, since April 2015; President and Principal Executive Officer of the Columbia Funds, since June 2021; officer of Columbia Funds and affiliated funds, 2020-2021 | 174 | Director, Ameriprise Trust Company, since October 2016; Director, Columbia Management Investment Distributors, Inc. since November 2018; Board of Governors, Columbia Wanger Asset Management, LLC since, January 2022; Director, Columbia Threadneedle Canada, Inc., since December 2022 |
| * | The term “Columbia Funds Complex” as used herein includes Columbia Seligman Premium Technology Growth Fund, Tri-Continental Corporation and each series of Columbia Funds Series Trust (CFST), Columbia Funds Series Trust I (CFST I), Columbia Funds Series Trust II (CFST II), Columbia ETF Trust I (CET I), Columbia ETF Trust II (CET II), Columbia Funds Variable Insurance Trust (CFVIT) and Columbia Funds Variable Series Trust II (CFVST II). Messrs. Batejan, Beckman, Gallagher and Hacker and Mses. Blatz, Carlton, Carrig, Flynn, Paglia, and Yeager serve as directors of Columbia Seligman Premium Technology Growth Fund and Tri-Continental Corporation. |
| ** | Interested person (as defined under the 1940 Act) by reason of being an officer, director, security holder and/or employee of the Investment Manager or Ameriprise Financial. |
| 56 | Columbia Mortgage Opportunities Fund | Annual Report 2023 |
(Unaudited)
The Board has appointed officers who are responsible for day-to-day business decisions based on policies it has established. The officers serve at the pleasure of the Board. The following table provides basic information about the Officers of the Fund as of the printing of this report, including principal occupations during the past five years, although their specific titles may have varied over the period. In addition to Mr. Beckman, who is President and Principal Executive Officer, the Fund’s other officers are:
| Name, address and year of birth | Position and year first appointed to position for any Fund in the Columbia Funds Complex or a predecessor thereof | Principal occupation(s) during past five years |
| Michael G. Clarke 290 Congress Street Boston, MA 02210 1969 | Chief Financial Officer and Principal Financial Officer (2009) and Senior Vice President (2019) | Senior Vice President and North America Head of Operations & Investor Services, Columbia Management Investment Advisers, LLC, since June 2023 (previously Senior Vice President and Head of Global Operations, March 2022 – June 2023, Vice President, Head of North America Operations, and Co-Head of Global Operations, June 2019 - February 2022 and Vice President – Accounting and Tax, May 2010 - May 2019); senior officer of Columbia Funds and affiliated funds, since 2002. Director, Ameriprise Trust Company, since June 2023. |
| Joseph Beranek 5890 Ameriprise Financial Center Minneapolis, MN 55474 1965 | Treasurer and Chief Accounting Officer (Principal Accounting Officer) (2019) and Principal Financial Officer (2020), CFST, CFST I, CFST II, CFVIT and CFVST II; Assistant Treasurer, CET I and CET II | Vice President – Mutual Fund Accounting and Financial Reporting, Columbia Management Investment Advisers, LLC, since December 2018 and March 2017, respectively. |
| Marybeth Pilat 290 Congress Street Boston, MA 02210 1968 | Treasurer and Chief Accounting Officer (Principal Accounting Officer) and Principal Financial Officer (2020) for CET I and CET II; Assistant Treasurer, CFST, CFST I, CFST II, CFVIT and CFVST II | Vice President – Product Pricing and Administration, Columbia Management Investment Advisers, LLC, since May 2017. |
| William F. Truscott 290 Congress Street Boston, MA 02210 1960 | Senior Vice President (2001) | Formerly, Trustee/Director of Columbia Funds Complex or legacy funds, November 2001 - January 1, 2021; Chief Executive Officer, Global Asset Management, Ameriprise Financial, Inc., since September 2012; Chairman of the Board and President, Columbia Management Investment Advisers, LLC, since July 2004 and February 2012, respectively; Chairman of the Board and Chief Executive Officer, Columbia Management Investment Distributors, Inc., since November 2008 and February 2012, respectively;Chairman of the Board and Director, Threadneedle Asset Management Holdings, Sàrl, since March 2013 and December 2008, respectively; senior executive of various entities affiliated with Columbia Threadneedle. |
| Christopher O. Petersen 5228 Ameriprise Financial Center Minneapolis, MN 55474 1970 | Senior Vice President and Assistant Secretary (2021) | Formerly, Trustee/Director of funds within the Columbia Funds Complex, July 1, 2020 - November 22, 2021; Senior Vice President and Assistant General Counsel, Ameriprise Financial, Inc., since September 2021 (previously Vice President and Lead Chief Counsel, January 2015 - September 2021); formerly, President and Principal Executive Officer of the Columbia Funds, 2015 - 2021; officer of Columbia Funds and affiliated funds, since 2007. |
| Thomas P. McGuire 290 Congress Street Boston, MA 02210 1972 | Senior Vice President and Chief Compliance Officer (2012) | Vice President – Asset Management Compliance, Ameriprise Financial, Inc., since May 2010; Chief Compliance Officer, Columbia Acorn/Wanger Funds, since December 2015; formerly, Chief Compliance Officer, Ameriprise Certificate Company, September 2010 – September 2020. |
| Ryan C. Larrenaga 290 Congress Street Boston, MA 02210 1970 | Senior Vice President (2017), Chief Legal Officer (2017), and Secretary (2015) | Vice President and Chief Counsel, Ameriprise Financial, Inc., since August 2018 (previously Vice President and Group Counsel, August 2011 - August 2018); Chief Legal Officer, Columbia Acorn/Wanger Funds, since September 2020; officer of Columbia Funds and affiliated funds, since 2005. |
| Columbia Mortgage Opportunities Fund | Annual Report 2023 | 57 |
(Unaudited)
Fund officers (continued)
| Name, address and year of birth | Position and year first appointed to position for any Fund in the Columbia Funds Complex or a predecessor thereof | Principal occupation(s) during past five years |
| Michael E. DeFao 290 Congress Street Boston, MA 02210 1968 | Vice President (2011) and Assistant Secretary (2010) | Vice President and Chief Counsel, Ameriprise Financial, Inc., since May 2010; Vice President, Chief Legal Officer and Assistant Secretary, Columbia Management Investment Advisers, LLC, since October 2021 (previously Vice President and Assistant Secretary, May 2010 – September 2021). |
| Lyn Kephart-Strong 5903 Ameriprise Financial Center Minneapolis, MN 55474 1960 | Vice President (2015) | Vice President, Global Investment Operations Services, Columbia Management Investment Advisers, LLC, since 2010; Director (since January 2007) and President (since October 2014), Columbia Management Investment Services Corp.; Director (since December 2017) and President (since January 2017), Ameriprise Trust Company. |
| • | the Fund had sufficient liquidity to both meet redemptions and operate effectively on behalf of shareholders; |
| • | there were no material changes to the Program during the period; |
| • | the implementation of the Program was effective to manage the Fund’s liquidity risk; and |
| • | the Program operated adequately during the period. |
| 58 | Columbia Mortgage Opportunities Fund | Annual Report 2023 |
columbiathreadneedleus.com/investor/. The Fund is distributed by Columbia Management Investment Distributors, Inc., member FINRA, and managed by Columbia Management Investment Advisers, LLC.

May 31, 2023

| 3 | |
| 5 | |
| 7 | |
| 8 | |
| 16 | |
| 18 | |
| 19 | |
| 22 | |
| 26 | |
| 36 | |
| 37 | |
| 37 | |
| 43 |
(Unaudited)
| Average annual total returns (%) (for the period ended May 31, 2023) | |||||
| Inception | 1 Year | 5 Years | 10 Years | ||
| Class A | Excluding sales charges | 07/28/11 | -8.30 | 5.06 | 6.08 |
| Including sales charges | -13.58 | 3.83 | 5.45 | ||
| Advisor Class | 11/08/12 | -8.11 | 5.33 | 6.35 | |
| Class C | Excluding sales charges | 07/28/11 | -9.01 | 4.28 | 5.29 |
| Including sales charges | -9.86 | 4.28 | 5.29 | ||
| Institutional Class | 07/28/11 | -8.06 | 5.33 | 6.35 | |
| Institutional 2 Class | 11/08/12 | -8.08 | 5.36 | 6.39 | |
| Institutional 3 Class* | 03/01/17 | -7.96 | 5.42 | 6.30 | |
| Class R | 07/28/11 | -8.54 | 4.80 | 5.81 | |
| Blended Benchmark | -2.08 | 5.95 | 6.93 | ||
| Bloomberg U.S. Aggregate Bond Index | -2.14 | 0.81 | 1.39 | ||
| * | The returns shown for periods prior to the share class inception date (including returns for the Life of the Fund, if shown, which are since Fund inception) include the returns of the Fund’s oldest share class. Since the Fund launched more than one share class at its inception, Class A shares were used. These returns are adjusted to reflect any higher class-related operating expenses of the newer share classes, as applicable. Please visit columbiathreadneedleus.com/investor/investment-products/mutual-funds/appended-performance for more information. |
| Columbia Flexible Capital Income Fund | Annual Report 2023 | 3 |
(Unaudited)

| Portfolio breakdown (%) (at May 31, 2023) | |
| Common Stocks | 43.2 |
| Convertible Bonds | 13.0 |
| Convertible Preferred Stocks | 7.5 |
| Corporate Bonds & Notes | 35.7 |
| Money Market Funds | 0.0(a) |
| Preferred Debt | 0.6 |
| Warrants | 0.0(a) |
| Total | 100.0 |
| (a) | Rounds to zero. |
| 4 | Columbia Flexible Capital Income Fund | Annual Report 2023 |
(Unaudited)
| • | The Fund’s equities exposure was the largest area of detraction for the Fund during the period. The Fund’s fixed income and convertible securities holdings also weighed on results. |
| • | The largest detractors within the Fund’s equities holdings included sustainable energy company Enviva, Inc., household durables company Newell Brands, Inc., regional bank M&T Bank Corp. and fertilizer company Nutrien Ltd. The Fund sold its position in Enviva during the period. |
| • | Within fixed income, Fund holding tech hardware company Diebold Nixdorf, Inc. and software company Avaya, Inc. led detractors. The Fund sold its position in Avaya during the period. |
| Columbia Flexible Capital Income Fund | Annual Report 2023 | 5 |
(Unaudited)
| • | Biotechnology company Clovis Oncology, Inc. and media company DISH Network Corp. were the top detractors among the Fund’s convertible securities holdings. |
| • | From an asset class allocation perspective, the Fund’s holdings in preferred securities overall contributed most positively to returns during the period. Holdings that contributed most within the preferred space included medical devices company Boston Scientific Corp. and Citigroup Capital within the banking industry. |
| • | Within the Fund’s equity holdings, notable contributions came from semiconductor company Broadcom, Inc., pharmaceutical company Merck & Co., Inc., energy company Exxon Mobil Corp. and communications equipment company Cisco Systems, Inc. |
| • | Within the Fund’s convertible securities holdings, global cruise company Royal Caribbean Cruises, Ltd., pharmaceutical company Bridgebio Pharma, Inc. and interactive media company fuboTV, Inc. were top contributors. |
| 6 | Columbia Flexible Capital Income Fund | Annual Report 2023 |
(Unaudited)
| December 1, 2022 — May 31, 2023 | |||||||
| Account value at the beginning of the period ($) | Account value at the end of the period ($) | Expenses paid during the period ($) | Fund’s annualized expense ratio (%) | ||||
| Actual | Hypothetical | Actual | Hypothetical | Actual | Hypothetical | Actual | |
| Class A | 1,000.00 | 1,000.00 | 953.20 | 1,020.00 | 4.82 | 4.99 | 0.99 |
| Advisor Class | 1,000.00 | 1,000.00 | 954.80 | 1,021.24 | 3.61 | 3.73 | 0.74 |
| Class C | 1,000.00 | 1,000.00 | 949.90 | 1,016.26 | 8.46 | 8.75 | 1.74 |
| Institutional Class | 1,000.00 | 1,000.00 | 955.10 | 1,021.24 | 3.61 | 3.73 | 0.74 |
| Institutional 2 Class | 1,000.00 | 1,000.00 | 955.00 | 1,021.34 | 3.51 | 3.63 | 0.72 |
| Institutional 3 Class | 1,000.00 | 1,000.00 | 955.30 | 1,021.59 | 3.27 | 3.38 | 0.67 |
| Class R | 1,000.00 | 1,000.00 | 952.60 | 1,018.75 | 6.04 | 6.24 | 1.24 |
| Columbia Flexible Capital Income Fund | Annual Report 2023 | 7 |
May 31, 2023
| Common Stocks 42.4% | ||
| Issuer | Shares | Value ($) |
| Communication Services 2.2% | ||
| Diversified Telecommunication Services 1.6% | ||
| AT&T, Inc. | 750,000 | 11,797,500 |
| Verizon Communications, Inc. | 260,000 | 9,263,800 |
| Total | 21,061,300 | |
| Media 0.6% | ||
| Comcast Corp., Class A | 185,000 | 7,279,750 |
| Total Communication Services | 28,341,050 | |
| Consumer Discretionary 1.8% | ||
| Broadline Retail 0.4% | ||
| Macy’s, Inc. | 375,000 | 5,096,250 |
| Hotels, Restaurants & Leisure 0.5% | ||
| Darden Restaurants, Inc. | 45,000 | 7,133,400 |
| Household Durables 0.4% | ||
| Newell Brands, Inc. | 550,000 | 4,570,500 |
| Specialty Retail 0.5% | ||
| Home Depot, Inc. (The) | 22,500 | 6,377,625 |
| Total Consumer Discretionary | 23,177,775 | |
| Consumer Staples 2.7% | ||
| Food Products 1.4% | ||
| Bunge Ltd. | 75,000 | 6,948,000 |
| Kraft Heinz Co. (The) | 300,000 | 11,466,000 |
| Total | 18,414,000 | |
| Personal Care Products 0.3% | ||
| Kenvue, Inc.(a) | 162,584 | 4,079,232 |
| Tobacco 1.0% | ||
| Philip Morris International, Inc. | 150,000 | 13,501,500 |
| Total Consumer Staples | 35,994,732 | |
| Common Stocks (continued) | ||
| Issuer | Shares | Value ($) |
| Energy 4.5% | ||
| Oil, Gas & Consumable Fuels 4.5% | ||
| Chesapeake Energy Corp. | 90,000 | 6,772,500 |
| Chevron Corp. | 90,000 | 13,555,800 |
| Exxon Mobil Corp. | 190,000 | 19,414,200 |
| Pioneer Natural Resources Co. | 65,000 | 12,963,600 |
| Valero Energy Corp. | 60,000 | 6,422,400 |
| Total | 59,128,500 | |
| Total Energy | 59,128,500 | |
| Financials 9.8% | ||
| Banks 2.6% | ||
| JPMorgan Chase & Co. | 105,000 | 14,249,550 |
| M&T Bank Corp. | 110,000 | 13,107,600 |
| New York Community Bancorp, Inc. | 700,000 | 7,196,000 |
| Total | 34,553,150 | |
| Capital Markets 4.5% | ||
| Ares Capital Corp. | 800,000 | 14,992,000 |
| BlackRock, Inc. | 11,000 | 7,233,050 |
| Blackstone Secured Lending Fund | 400,000 | 10,252,000 |
| Blackstone, Inc. | 77,500 | 6,637,100 |
| Carlyle Group, Inc. (The) | 250,000 | 6,852,500 |
| Morgan Stanley | 160,000 | 13,081,600 |
| Total | 59,048,250 | |
| Insurance 1.0% | ||
| MetLife, Inc. | 260,000 | 12,883,000 |
| Mortgage Real Estate Investment Trusts (REITS) 1.7% | ||
| Blackstone Mortgage Trust, Inc. | 425,000 | 7,730,750 |
| Starwood Property Trust, Inc. | 800,000 | 14,040,000 |
| Total | 21,770,750 | |
| Total Financials | 128,255,150 | |
| Health Care 4.9% | ||
| Biotechnology 1.7% | ||
| AbbVie, Inc. | 90,000 | 12,416,400 |
| Amgen, Inc. | 45,000 | 9,929,250 |
| Total | 22,345,650 | |
| 8 | Columbia Flexible Capital Income Fund | Annual Report 2023 |
May 31, 2023
| Common Stocks (continued) | ||
| Issuer | Shares | Value ($) |
| Health Care Equipment & Supplies 0.6% | ||
| Medtronic PLC | 100,000 | 8,276,000 |
| Pharmaceuticals 2.6% | ||
| Bristol-Myers Squibb Co. | 150,000 | 9,666,000 |
| Merck & Co., Inc. | 125,000 | 13,801,250 |
| Pfizer, Inc. | 275,000 | 10,455,500 |
| Total | 33,922,750 | |
| Total Health Care | 64,544,400 | |
| Industrials 3.1% | ||
| Aerospace & Defense 1.0% | ||
| Raytheon Technologies Corp. | 140,000 | 12,899,600 |
| Air Freight & Logistics 1.1% | ||
| United Parcel Service, Inc., Class B | 82,500 | 13,777,500 |
| Machinery 1.0% | ||
| AGCO Corp. | 60,000 | 6,616,800 |
| Stanley Black & Decker, Inc. | 92,500 | 6,934,725 |
| Total | 13,551,525 | |
| Total Industrials | 40,228,625 | |
| Information Technology 6.5% | ||
| Communications Equipment 1.0% | ||
| Cisco Systems, Inc. | 275,000 | 13,659,250 |
| Electronic Equipment, Instruments & Components 1.0% | ||
| Corning, Inc. | 425,000 | 13,094,250 |
| IT Services 1.1% | ||
| International Business Machines Corp. | 115,000 | 14,787,850 |
| Semiconductors & Semiconductor Equipment 2.8% | ||
| Broadcom, Inc. | 17,500 | 14,139,300 |
| QUALCOMM, Inc. | 62,500 | 7,088,125 |
| Texas Instruments, Inc. | 85,000 | 14,779,800 |
| Total | 36,007,225 | |
| Technology Hardware, Storage & Peripherals 0.6% | ||
| HP, Inc. | 260,000 | 7,555,600 |
| Total Information Technology | 85,104,175 | |
| Common Stocks (continued) | ||
| Issuer | Shares | Value ($) |
| Materials 1.9% | ||
| Chemicals 1.4% | ||
| Dow, Inc. | 275,000 | 13,414,500 |
| Nutrien Ltd. | 100,000 | 5,270,000 |
| Total | 18,684,500 | |
| Metals & Mining 0.5% | ||
| Newmont Corp. | 160,000 | 6,488,000 |
| Total Materials | 25,172,500 | |
| Real Estate 3.0% | ||
| Industrial REITs 0.6% | ||
| Prologis, Inc. | 60,000 | 7,473,000 |
| Real Estate Management & Development 0.0% | ||
| WeWork, Inc., Class A(a) | 1,506,600 | 258,081 |
| Residential REITs 0.6% | ||
| Invitation Homes, Inc. | 250,000 | 8,470,000 |
| Retail REITs 0.5% | ||
| Simon Property Group, Inc. | 62,500 | 6,571,875 |
| Specialized REITs 1.3% | ||
| American Tower Corp. | 35,000 | 6,455,400 |
| VICI Properties, Inc. | 335,000 | 10,361,550 |
| Total | 16,816,950 | |
| Total Real Estate | 39,589,906 | |
| Utilities 2.0% | ||
| Electric Utilities 1.5% | ||
| Duke Energy Corp. | 70,000 | 6,250,300 |
| Entergy Corp. | 65,000 | 6,383,000 |
| FirstEnergy Corp. | 185,000 | 6,917,150 |
| Total | 19,550,450 | |
| Multi-Utilities 0.5% | ||
| DTE Energy Co. | 65,000 | 6,994,000 |
| Total Utilities | 26,544,450 | |
| Total Common Stocks (Cost $534,746,556) | 556,081,263 | |
| Columbia Flexible Capital Income Fund | Annual Report 2023 | 9 |
May 31, 2023
| Convertible Bonds 12.8% | ||||
| Issuer | Coupon Rate | Principal Amount ($) | Value ($) | |
| Airlines 0.6% | ||||
| American Airlines Group, Inc. | ||||
| 07/01/2025 | 6.500% | 6,500,000 | 7,511,068 | |
| Automotive 0.5% | ||||
| Lucid Group, Inc.(b) | ||||
| 12/15/2026 | 1.250% | 5,500,000 | 2,662,000 | |
| Rivian Automotive, Inc.(b) | ||||
| 03/15/2029 | 4.625% | 3,750,000 | 3,774,375 | |
| Total | 6,436,375 | |||
| Cable and Satellite 0.7% | ||||
| DISH Network Corp. | ||||
| Subordinated | ||||
| 08/15/2026 | 3.375% | 20,000,000 | 8,976,000 | |
| Diversified Manufacturing 1.1% | ||||
| Bloom Energy Corp.(b) | ||||
| 06/01/2028 | 3.000% | 6,800,000 | 6,940,080 | |
| Greenbrier Companies, Inc. (The) | ||||
| 04/15/2028 | 2.875% | 8,500,000 | 6,927,500 | |
| Total | 13,867,580 | |||
| Electric 1.1% | ||||
| Duke Energy Corp.(b) | ||||
| 04/15/2026 | 4.125% | 7,200,000 | 7,128,000 | |
| FirstEnergy Corp.(b) | ||||
| 05/01/2026 | 4.000% | 7,000,000 | 6,975,500 | |
| Total | 14,103,500 | |||
| Food and Beverage 0.7% | ||||
| Post Holdings, Inc.(b) | ||||
| 08/15/2027 | 2.500% | 9,500,000 | 9,620,650 | |
| Health Care 0.5% | ||||
| CONMED Corp.(b) | ||||
| 06/15/2027 | 2.250% | 6,500,000 | 6,877,000 | |
| Healthcare REIT 0.5% | ||||
| Welltower OP LLC(b) | ||||
| 05/15/2028 | 2.750% | 6,800,000 | 6,704,800 | |
| Independent Energy 0.0% | ||||
| Chesapeake Energy Escrow | ||||
| 09/15/2026 | 0.000% | 10,500,000 | 183,750 | |
| Leisure 1.1% | ||||
| NCL Corp., Ltd. | ||||
| 02/15/2027 | 2.500% | 9,300,000 | 7,495,800 | |
| Convertible Bonds (continued) | ||||
| Issuer | Coupon Rate | Principal Amount ($) | Value ($) | |
| Royal Caribbean Cruises Ltd.(b) | ||||
| 08/15/2025 | 6.000% | 3,500,000 | 6,252,750 | |
| Total | 13,748,550 | |||
| Media and Entertainment 0.3% | ||||
| fuboTV, Inc. | ||||
| 02/15/2026 | 3.250% | 9,000,000 | 4,496,725 | |
| Other Financial Institutions 0.6% | ||||
| RWT Holdings, Inc. | ||||
| 10/01/2025 | 5.750% | 10,050,000 | 8,443,471 | |
| Other REIT 1.2% | ||||
| PennyMac Corp. | ||||
| 03/15/2026 | 5.500% | 16,500,000 | 14,074,706 | |
| Redwood Trust, Inc.(b) | ||||
| 06/15/2027 | 7.750% | 2,000,000 | 1,637,500 | |
| Total | 15,712,206 | |||
| Pharmaceuticals 2.1% | ||||
| Bridgebio Pharma, Inc. | ||||
| 03/15/2027 | 2.500% | 2,000,000 | 1,406,200 | |
| BridgeBio Pharma, Inc. | ||||
| 02/01/2029 | 2.250% | 15,500,000 | 9,368,200 | |
| Clovis Oncology, Inc.(c) | ||||
| 05/01/2025 | 0.000% | 11,700,000 | 1,374,750 | |
| Cytokinetics, Inc.(b) | ||||
| 07/01/2027 | 3.500% | 6,500,000 | 6,528,438 | |
| Mirum Pharmaceuticals, Inc.(b) | ||||
| 05/01/2029 | 4.000% | 1,240,000 | 1,403,060 | |
| Tilray, Inc. | ||||
| 10/01/2023 | 5.000% | 7,000,000 | 6,861,847 | |
| Total | 26,942,495 | |||
| Retailers 0.9% | ||||
| Farfetch Ltd. | ||||
| 05/01/2027 | 3.750% | 7,500,000 | 5,737,500 | |
| Wayfair, Inc.(b) | ||||
| 09/15/2027 | 3.250% | 6,000,000 | 5,376,000 | |
| Total | 11,113,500 | |||
| Technology 0.9% | ||||
| 2U, Inc. | ||||
| 05/01/2025 | 2.250% | 9,500,000 | 6,273,040 | |
| Infinera Corp.(b) | ||||
| 08/01/2028 | 3.750% | 6,000,000 | 6,114,356 | |
| Total | 12,387,396 | |||
| Total Convertible Bonds (Cost $197,749,226) | 167,125,066 | |||
| 10 | Columbia Flexible Capital Income Fund | Annual Report 2023 |
May 31, 2023
| Convertible Preferred Stocks 7.4% | |||
| Issuer | Shares | Value ($) | |
| Financials 1.4% | |||
| Banks 1.1% | |||
| Bank of America Corp.(d) | 7.250% | 12,500 | 14,500,000 |
| Capital Markets 0.3% | |||
| AMG Capital Trust II | 5.150% | 87,500 | 4,294,500 |
| Total Financials | 18,794,500 | ||
| Health Care 0.8% | |||
| Health Care Equipment & Supplies 0.8% | |||
| Becton Dickinson & Co. | 6.000% | 225,000 | 10,837,861 |
| Total Health Care | 10,837,861 | ||
| Industrials 1.0% | |||
| Machinery 0.5% | |||
| Chart Industries, Inc., ADR | 6.750% | 135,000 | 6,412,500 |
| Professional Services 0.5% | |||
| Clarivate PLC | 5.250% | 190,000 | 6,616,823 |
| Total Industrials | 13,029,323 | ||
| Information Technology 0.6% | |||
| Electronic Equipment, Instruments & Components 0.6% | |||
| Coherent Corp. | 6.000% | 45,000 | 7,425,530 |
| Total Information Technology | 7,425,530 | ||
| Utilities 3.6% | |||
| Electric Utilities 1.0% | |||
| NextEra Energy, Inc. | 6.926% | 300,000 | 13,614,000 |
| Gas Utilities 1.5% | |||
| Spire, Inc. | 7.500% | 210,000 | 9,806,181 |
| UGI Corp. | 7.250% | 150,000 | 9,976,500 |
| Total | 19,782,681 | ||
| Multi-Utilities 1.1% | |||
| NiSource, Inc. | 7.750% | 135,000 | 13,625,550 |
| Total Utilities | 47,022,231 | ||
| Total Convertible Preferred Stocks (Cost $114,562,800) | 97,109,445 | ||
| Corporate Bonds & Notes 35.1% | ||||
| Issuer | Coupon Rate | Principal Amount ($) | Value ($) | |
| Aerospace & Defense 2.1% | ||||
| Bombardier, Inc.(b) | ||||
| 06/15/2026 | 7.125% | 13,500,000 | 13,288,745 | |
| Corporate Bonds & Notes (continued) | ||||
| Issuer | Coupon Rate | Principal Amount ($) | Value ($) | |
| Rolls-Royce PLC(b) | ||||
| 10/15/2027 | 5.750% | 7,020,000 | 6,837,129 | |
| Spirit AeroSystems, Inc.(b) | ||||
| 04/15/2025 | 7.500% | 7,200,000 | 7,113,031 | |
| Total | 27,238,905 | |||
| Airlines 0.6% | ||||
| American Airlines, Inc.(b) | ||||
| 02/15/2028 | 7.250% | 7,500,000 | 7,344,012 | |
| Automotive 0.5% | ||||
| Ford Motor Credit Co. LLC | ||||
| 03/06/2026 | 6.950% | 7,107,000 | 7,120,559 | |
| Cable and Satellite 0.8% | ||||
| Comcast Corp. | ||||
| 08/15/2025 | 3.375% | 7,500,000 | 7,290,390 | |
| Telesat Canada/LLC(b) | ||||
| 10/15/2027 | 6.500% | 7,114,000 | 3,157,111 | |
| Total | 10,447,501 | |||
| Chemicals 1.0% | ||||
| Innophos Holdings, Inc.(b) | ||||
| 02/15/2028 | 9.375% | 7,000,000 | 7,037,402 | |
| Olympus Water US Holding Corp.(b) | ||||
| 10/01/2029 | 6.250% | 9,000,000 | 6,689,443 | |
| Total | 13,726,845 | |||
| Construction Machinery 0.3% | ||||
| PECF USS Intermediate Holding III Corp.(b) | ||||
| 11/15/2029 | 8.000% | 8,350,000 | 4,399,289 | |
| Consumer Cyclical Services 1.0% | ||||
| Staples, Inc.(b) | ||||
| 04/15/2026 | 7.500% | 7,500,000 | 6,166,256 | |
| Uber Technologies, Inc.(b) | ||||
| 09/15/2027 | 7.500% | 2,100,000 | 2,157,303 | |
| 01/15/2028 | 6.250% | 4,695,000 | 4,699,501 | |
| Total | 13,023,060 | |||
| Consumer Products 1.5% | ||||
| Mattel, Inc.(b) | ||||
| 04/01/2029 | 3.750% | 3,500,000 | 3,055,066 | |
| Mattel, Inc. | ||||
| 10/01/2040 | 6.200% | 2,770,000 | 2,441,874 | |
| 11/01/2041 | 5.450% | 1,100,000 | 911,145 | |
| Newell Brands, Inc. | ||||
| 09/15/2027 | 6.375% | 3,664,000 | 3,484,190 | |
| 09/15/2029 | 6.625% | 3,150,000 | 2,987,087 | |
| Columbia Flexible Capital Income Fund | Annual Report 2023 | 11 |
May 31, 2023
| Corporate Bonds & Notes (continued) | ||||
| Issuer | Coupon Rate | Principal Amount ($) | Value ($) | |
| SWF Escrow Issuer Corp.(b) | ||||
| 10/01/2029 | 6.500% | 10,500,000 | 6,264,343 | |
| Total | 19,143,705 | |||
| Electric 0.6% | ||||
| DTE Energy Co. | ||||
| 11/01/2024 | 4.220% | 7,500,000 | 7,373,849 | |
| Food and Beverage 1.6% | ||||
| Triton Water Holdings, Inc.(b) | ||||
| 04/01/2029 | 6.250% | 13,929,000 | 11,801,578 | |
| United Natural Foods, Inc.(b) | ||||
| 10/15/2028 | 6.750% | 10,320,000 | 9,629,061 | |
| Total | 21,430,639 | |||
| Gaming 1.4% | ||||
| Colt Merger Sub, Inc.(b) | ||||
| 07/01/2027 | 8.125% | 6,800,000 | 6,931,061 | |
| Scientific Games Holdings LP/US FinCo, Inc.(b) | ||||
| 03/01/2030 | 6.625% | 12,500,000 | 10,969,564 | |
| Total | 17,900,625 | |||
| Health Care 1.7% | ||||
| Quotient Ltd.(b),(e),(f),(g) | ||||
| 04/15/2030 | 12.000% | 1,596,932 | 1,596,932 | |
| Surgery Center Holdings, Inc.(b) | ||||
| 07/01/2025 | 6.750% | 7,000,000 | 6,977,459 | |
| Tenet Healthcare Corp. | ||||
| 10/01/2028 | 6.125% | 14,000,000 | 13,270,132 | |
| Total | 21,844,523 | |||
| Independent Energy 3.0% | ||||
| Hilcorp Energy I LP/Finance Co.(b) | ||||
| 04/15/2030 | 6.000% | 14,500,000 | 13,101,324 | |
| Occidental Petroleum Corp. | ||||
| 07/15/2044 | 4.500% | 9,800,000 | 7,593,023 | |
| 04/15/2046 | 4.400% | 10,600,000 | 8,031,205 | |
| Southwestern Energy Co. | ||||
| 02/01/2029 | 5.375% | 11,000,000 | 10,239,558 | |
| Total | 38,965,110 | |||
| Leisure 2.6% | ||||
| Carnival Corp.(b) | ||||
| 05/01/2029 | 6.000% | 16,500,000 | 13,704,728 | |
| Cedar Fair LP/Canada’s Wonderland Co./Magnum Management Corp./Millennium Operations LLC | ||||
| 10/01/2028 | 6.500% | 7,300,000 | 7,171,582 | |
| NCL Corp., Ltd.(b) | ||||
| 02/15/2029 | 7.750% | 9,500,000 | 8,564,371 | |
| Corporate Bonds & Notes (continued) | ||||
| Issuer | Coupon Rate | Principal Amount ($) | Value ($) | |
| Royal Caribbean Cruises Ltd.(b) | ||||
| 08/15/2027 | 11.625% | 4,000,000 | 4,347,822 | |
| Total | 33,788,503 | |||
| Media and Entertainment 3.2% | ||||
| Clear Channel Outdoor Holdings, Inc.(b) | ||||
| 04/15/2028 | 7.750% | 18,000,000 | 13,386,496 | |
| Deluxe Corp.(b) | ||||
| 06/01/2029 | 8.000% | 8,000,000 | 6,221,792 | |
| Lions Gate Capital Holdings LLC(b) | ||||
| 04/15/2029 | 5.500% | 20,000,000 | 14,199,060 | |
| Mav Acquisition Corp.(b) | ||||
| 08/01/2029 | 8.000% | 9,000,000 | 7,557,036 | |
| Total | 41,364,384 | |||
| Metals and Mining 0.1% | ||||
| CONSOL Energy, Inc.(b) | ||||
| 11/15/2025 | 11.000% | 1,124,000 | 1,144,816 | |
| Oil Field Services 1.1% | ||||
| Nabors Industries Ltd.(b) | ||||
| 01/15/2026 | 7.250% | 4,568,000 | 4,189,774 | |
| 01/15/2028 | 7.500% | 3,231,000 | 2,795,229 | |
| Transocean Titan Financing Ltd.(b) | ||||
| 02/01/2028 | 8.375% | 7,189,000 | 7,279,387 | |
| Total | 14,264,390 | |||
| Other Financial Institutions 0.0% | ||||
| WeWork Companies, Inc.(b),(f),(g) | ||||
| 08/15/2027 | 12.000% | 6,975,000 | 697,500 | |
| Packaging 1.3% | ||||
| ARD Finance SA(b),(f) | ||||
| 06/30/2027 | 6.500% | 8,754,310 | 6,803,607 | |
| Mauser Packaging Solutions Holding Co.(b) | ||||
| 04/15/2027 | 9.250% | 11,500,000 | 10,496,817 | |
| Total | 17,300,424 | |||
| Pharmaceuticals 1.4% | ||||
| 1375209 BC Ltd.(b) | ||||
| 01/30/2028 | 9.000% | 1,957,000 | 1,957,279 | |
| Amgen, Inc. | ||||
| 03/02/2025 | 5.250% | 7,500,000 | 7,522,420 | |
| Bausch Health Companies, Inc.(b) | ||||
| 09/30/2028 | 11.000% | 3,477,000 | 2,628,674 | |
| 10/15/2030 | 14.000% | 695,000 | 439,071 | |
| Organon Finance 1 LLC(b) | ||||
| 04/30/2031 | 5.125% | 7,523,000 | 6,382,933 | |
| Total | 18,930,377 | |||
| 12 | Columbia Flexible Capital Income Fund | Annual Report 2023 |
May 31, 2023
| Corporate Bonds & Notes (continued) | ||||
| Issuer | Coupon Rate | Principal Amount ($) | Value ($) | |
| Restaurants 1.0% | ||||
| Fertitta Entertainment LLC/Finance Co., Inc.(b) | ||||
| 01/15/2030 | 6.750% | 16,500,000 | 13,389,805 | |
| Retailers 2.0% | ||||
| Academy Ltd.(b) | ||||
| 11/15/2027 | 6.000% | 7,833,000 | 7,616,130 | |
| Hanesbrands, Inc.(b) | ||||
| 02/15/2031 | 9.000% | 7,263,000 | 7,267,680 | |
| L Brands, Inc.(b) | ||||
| 10/01/2030 | 6.625% | 7,500,000 | 7,155,129 | |
| Magic MergeCo, Inc.(b) | ||||
| 05/01/2029 | 7.875% | 6,500,000 | 4,014,982 | |
| Total | 26,053,921 | |||
| Supermarkets 0.5% | ||||
| Safeway, Inc. | ||||
| 02/01/2031 | 7.250% | 6,088,000 | 6,182,387 | |
| Technology 5.3% | ||||
| Cloud Software Group, Inc.(b) | ||||
| 09/30/2029 | 9.000% | 4,400,000 | 3,739,385 | |
| Consensus Cloud Solutions, Inc.(b) | ||||
| 10/15/2026 | 6.000% | 8,000,000 | 7,281,458 | |
| Diebold Nixdorf, Inc.(b) | ||||
| 07/15/2025 | 9.375% | 2,781,000 | 578,563 | |
| Diebold Nixdorf, Inc.(b),(f) | ||||
| 10/15/2026 | 8.500% | 13,227,138 | 276,839 | |
| Minerva Merger Sub, Inc.(b) | ||||
| 02/15/2030 | 6.500% | 13,000,000 | 10,698,957 | |
| Neptune Bidco US, Inc.(b) | ||||
| 04/15/2029 | 9.290% | 12,155,000 | 11,149,656 | |
| NortonLifeLock, Inc.(b) | ||||
| 09/30/2027 | 6.750% | 9,000,000 | 8,987,798 | |
| 09/30/2030 | 7.125% | 5,000,000 | 4,995,758 | |
| Picard Midco, Inc.(b) | ||||
| 03/31/2029 | 6.500% | 8,000,000 | 7,080,109 | |
| Rocket Software, Inc.(b) | ||||
| 02/15/2029 | 6.500% | 14,125,000 | 11,494,237 | |
| Sabre GLBL, Inc.(b) | ||||
| 04/15/2025 | 9.250% | 2,200,000 | 2,101,559 | |
| 09/01/2025 | 7.375% | 1,077,000 | 914,521 | |
| Total | 69,298,840 | |||
| Corporate Bonds & Notes (continued) | ||||
| Issuer | Coupon Rate | Principal Amount ($) | Value ($) | |
| Transportation Services 0.5% | ||||
| XPO, Inc.(b) | ||||
| 06/01/2028 | 6.250% | 7,400,000 | 7,289,023 | |
| Total Corporate Bonds & Notes (Cost $529,143,240) | 459,662,992 | |||
| Preferred Debt 0.6% | ||||
| Issuer | Coupon Rate | Shares | Value ($) | |
| Banking 0.6% | ||||
| Citigroup Capital XIII(h) | ||||
| 10/29/2040 | 11.643% | 250,000 | 7,157,500 | |
| Total Preferred Debt (Cost $6,634,776) | 7,157,500 | |||
| Warrants 0.0% | ||
| Issuer | Shares | Value ($) |
| Health Care 0.0% | ||
| Health Care Equipment & Supplies 0.0% | ||
| Quotient Ltd.(a) | 24,163 | 18 |
| Quotient Ltd.(a) | 111,309 | 112 |
| Total | 130 | |
| Total Health Care | 130 | |
| Total Warrants (Cost $—) | 130 | |
| Money Market Funds 0.0% | ||
| Shares | Value ($) | |
| Columbia Short-Term Cash Fund, 5.241%(i),(j) | 508,745 | 508,491 |
| Total Money Market Funds (Cost $508,390) | 508,491 | |
| Total Investments in Securities (Cost: $1,383,344,988) | 1,287,644,887 | |
| Other Assets & Liabilities, Net | 22,675,703 | |
| Net Assets | 1,310,320,590 | |
| Columbia Flexible Capital Income Fund | Annual Report 2023 | 13 |
May 31, 2023
| (a) | Non-income producing investment. |
| (b) | Represents privately placed and other securities and instruments exempt from Securities and Exchange Commission registration (collectively, private placements), such as Section 4(a)(2) and Rule 144A eligible securities, which are often sold only to qualified institutional buyers. At May 31, 2023, the total value of these securities amounted to $446,038,100, which represents 34.04% of total net assets. |
| (c) | Represents a security in default. |
| (d) | Perpetual security with no specified maturity date. |
| (e) | Represents fair value as determined in good faith under procedures approved by the Board of Trustees. At May 31, 2023, the total value of these securities amounted to $1,596,932, which represents 0.12% of total net assets. |
| (f) | Payment-in-kind security. Interest can be paid by issuing additional par of the security or in cash. |
| (g) | Valuation based on significant unobservable inputs. |
| (h) | Represents a variable rate security with a step coupon where the rate adjusts according to a schedule for a series of periods, typically lower for an initial period and then increasing to a higher coupon rate thereafter. The interest rate shown was the current rate as of May 31, 2023. |
| (i) | The rate shown is the seven-day current annualized yield at May 31, 2023. |
| (j) | As defined in the Investment Company Act of 1940, as amended, an affiliated company is one in which the Fund owns 5% or more of the company’s outstanding voting securities, or a company which is under common ownership or control with the Fund. The value of the holdings and transactions in these affiliated companies during the year ended May 31, 2023 are as follows: |
| Affiliated issuers | Beginning of period($) | Purchases($) | Sales($) | Net change in unrealized appreciation (depreciation)($) | End of period($) | Realized gain (loss)($) | Dividends($) | End of period shares |
| Columbia Short-Term Cash Fund, 5.241% | ||||||||
| 20,206,575 | 382,223,420 | (401,921,605) | 101 | 508,491 | (8,196) | 755,332 | 508,745 | |
| ADR | American Depositary Receipt |
| ■ | Level 1 — Valuations based on quoted prices for investments in active markets that the Fund has the ability to access at the measurement date. Valuation adjustments are not applied to Level 1 investments. |
| ■ | Level 2 — Valuations based on other significant observable inputs (including quoted prices for similar securities, interest rates, prepayment speeds, credit risks, etc.). |
| ■ | Level 3 — Valuations based on significant unobservable inputs (including the Fund’s own assumptions and judgment in determining the fair value of investments). |
| 14 | Columbia Flexible Capital Income Fund | Annual Report 2023 |
May 31, 2023
events that require specific valuation determinations and assessment of fair value techniques; securities with a potential for stale pricing, including those that are illiquid, restricted, or in default; and the effectiveness of third party pricing vendors, including periodic reviews of vendors. The Committee meets more frequently, as needed, to discuss additional valuation matters, which may include the need to review back-testing results, review time-sensitive information or approve related valuation actions. Representatives of Columbia Management Investment Advisers, LLC report to the Board at each of its regularly scheduled meetings to discuss valuation matters and actions during the period, similar to those described earlier.
| Level 1 ($) | Level 2 ($) | Level 3 ($) | Total ($) | |
| Investments in Securities | ||||
| Common Stocks | ||||
| Communication Services | 28,341,050 | — | — | 28,341,050 |
| Consumer Discretionary | 23,177,775 | — | — | 23,177,775 |
| Consumer Staples | 35,994,732 | — | — | 35,994,732 |
| Energy | 59,128,500 | — | — | 59,128,500 |
| Financials | 128,255,150 | — | — | 128,255,150 |
| Health Care | 64,544,400 | — | — | 64,544,400 |
| Industrials | 40,228,625 | — | — | 40,228,625 |
| Information Technology | 85,104,175 | — | — | 85,104,175 |
| Materials | 25,172,500 | — | — | 25,172,500 |
| Real Estate | 39,589,906 | — | — | 39,589,906 |
| Utilities | 26,544,450 | — | — | 26,544,450 |
| Total Common Stocks | 556,081,263 | — | — | 556,081,263 |
| Convertible Bonds | — | 167,125,066 | — | 167,125,066 |
| Convertible Preferred Stocks | ||||
| Financials | — | 18,794,500 | — | 18,794,500 |
| Health Care | — | 10,837,861 | — | 10,837,861 |
| Industrials | — | 13,029,323 | — | 13,029,323 |
| Information Technology | — | 7,425,530 | — | 7,425,530 |
| Utilities | — | 47,022,231 | — | 47,022,231 |
| Total Convertible Preferred Stocks | — | 97,109,445 | — | 97,109,445 |
| Corporate Bonds & Notes | — | 457,368,560 | 2,294,432 | 459,662,992 |
| Preferred Debt | 7,157,500 | — | — | 7,157,500 |
| Warrants | ||||
| Health Care | — | 130 | — | 130 |
| Total Warrants | — | 130 | — | 130 |
| Money Market Funds | 508,491 | — | — | 508,491 |
| Total Investments in Securities | 563,747,254 | 721,603,201 | 2,294,432 | 1,287,644,887 |
| Columbia Flexible Capital Income Fund | Annual Report 2023 | 15 |
May 31, 2023
| Assets | |
| Investments in securities, at value | |
| Unaffiliated issuers (cost $1,382,836,598) | $1,287,136,396 |
| Affiliated issuers (cost $508,390) | 508,491 |
| Receivable for: | |
| Investments sold | 9,728,599 |
| Capital shares sold | 958,189 |
| Dividends | 4,280,258 |
| Interest | 9,757,075 |
| Foreign tax reclaims | 12,480 |
| Prepaid expenses | 8,092 |
| Total assets | 1,312,389,580 |
| Liabilities | |
| Due to custodian | 425 |
| Payable for: | |
| Capital shares purchased | 1,807,553 |
| Management services fees | 22,895 |
| Distribution and/or service fees | 7,707 |
| Transfer agent fees | 107,997 |
| Compensation of board members | 78,565 |
| Other expenses | 43,848 |
| Total liabilities | 2,068,990 |
| Net assets applicable to outstanding capital stock | $1,310,320,590 |
| Represented by | |
| Paid in capital | 1,462,362,944 |
| Total distributable earnings (loss) | (152,042,354) |
| Total - representing net assets applicable to outstanding capital stock | $1,310,320,590 |
| 16 | Columbia Flexible Capital Income Fund | Annual Report 2023 |
May 31, 2023
| Class A | |
| Net assets | $349,965,982 |
| Shares outstanding | 28,312,170 |
| Net asset value per share | $12.36 |
| Maximum sales charge | 5.75% |
| Maximum offering price per share (calculated by dividing the net asset value per share by 1.0 minus the maximum sales charge for Class A shares) | $13.11 |
| Advisor Class | |
| Net assets | $40,614,609 |
| Shares outstanding | 3,251,724 |
| Net asset value per share | $12.49 |
| Class C | |
| Net assets | $191,070,127 |
| Shares outstanding | 15,570,860 |
| Net asset value per share | $12.27 |
| Institutional Class | |
| Net assets | $666,293,909 |
| Shares outstanding | 53,921,554 |
| Net asset value per share | $12.36 |
| Institutional 2 Class | |
| Net assets | $39,047,213 |
| Shares outstanding | 3,123,450 |
| Net asset value per share | $12.50 |
| Institutional 3 Class | |
| Net assets | $22,442,556 |
| Shares outstanding | 1,825,235 |
| Net asset value per share | $12.30 |
| Class R | |
| Net assets | $886,194 |
| Shares outstanding | 71,778 |
| Net asset value per share | $12.35 |
| Columbia Flexible Capital Income Fund | Annual Report 2023 | 17 |
Year Ended May 31, 2023
| Net investment income | |
| Income: | |
| Dividends — unaffiliated issuers | $38,115,075 |
| Dividends — affiliated issuers | 755,332 |
| Interest | 46,649,935 |
| Interfund lending | 113 |
| Foreign taxes withheld | (41,310) |
| Total income | 85,479,145 |
| Expenses: | |
| Management services fees | 8,863,891 |
| Distribution and/or service fees | |
| Class A | 900,302 |
| Class C | 2,146,110 |
| Class R | 4,898 |
| Transfer agent fees | |
| Class A | 292,598 |
| Advisor Class | 42,323 |
| Class C | 174,214 |
| Institutional Class | 568,991 |
| Institutional 2 Class | 29,668 |
| Institutional 3 Class | 1,805 |
| Class R | 796 |
| Compensation of board members | 38,130 |
| Custodian fees | 9,492 |
| Printing and postage fees | 91,439 |
| Registration fees | 157,954 |
| Accounting services fees | 30,090 |
| Legal fees | 31,257 |
| Compensation of chief compliance officer | 270 |
| Other | 35,495 |
| Total expenses | 13,419,723 |
| Expense reduction | (60) |
| Total net expenses | 13,419,663 |
| Net investment income | 72,059,482 |
| Realized and unrealized gain (loss) — net | |
| Net realized gain (loss) on: | |
| Investments — unaffiliated issuers | (64,810,664) |
| Investments — affiliated issuers | (8,196) |
| Net realized loss | (64,818,860) |
| Net change in unrealized appreciation (depreciation) on: | |
| Investments — unaffiliated issuers | (132,064,429) |
| Investments — affiliated issuers | 101 |
| Net change in unrealized appreciation (depreciation) | (132,064,328) |
| Net realized and unrealized loss | (196,883,188) |
| Net decrease in net assets resulting from operations | $(124,823,706) |
| 18 | Columbia Flexible Capital Income Fund | Annual Report 2023 |
| Year Ended May 31, 2023 | Year Ended May 31, 2022 | |
| Operations | ||
| Net investment income | $72,059,482 | $58,163,026 |
| Net realized gain (loss) | (64,818,860) | 57,932,135 |
| Net change in unrealized appreciation (depreciation) | (132,064,328) | (129,244,474) |
| Net decrease in net assets resulting from operations | (124,823,706) | (13,149,313) |
| Distributions to shareholders | ||
| Net investment income and net realized gains | ||
| Class A | (27,400,922) | (28,924,537) |
| Advisor Class | (4,161,116) | (4,896,894) |
| Class C | (14,805,054) | (18,629,219) |
| Institutional Class | (55,111,107) | (53,681,002) |
| Institutional 2 Class | (4,209,195) | (5,504,814) |
| Institutional 3 Class | (1,813,733) | (1,764,705) |
| Class R | (72,445) | (87,902) |
| Total distributions to shareholders | (107,573,572) | (113,489,073) |
| Increase in net assets from capital stock activity | 38,636,588 | 353,304,182 |
| Total increase (decrease) in net assets | (193,760,690) | 226,665,796 |
| Net assets at beginning of year | 1,504,081,280 | 1,277,415,484 |
| Net assets at end of year | $1,310,320,590 | $1,504,081,280 |
| Columbia Flexible Capital Income Fund | Annual Report 2023 | 19 |
| Year Ended | Year Ended | |||
| May 31, 2023 | May 31, 2022 | |||
| Shares | Dollars ($) | Shares | Dollars ($) | |
| Capital stock activity | ||||
| Class A | ||||
| Subscriptions | 6,394,484 | 84,796,868 | 7,695,132 | 118,865,323 |
| Distributions reinvested | 2,070,228 | 26,918,174 | 1,867,061 | 28,276,585 |
| Redemptions | (5,662,836) | (74,275,805) | (4,675,421) | (71,774,812) |
| Net increase | 2,801,876 | 37,439,237 | 4,886,772 | 75,367,096 |
| Advisor Class | ||||
| Subscriptions | 1,060,158 | 14,224,061 | 2,364,105 | 37,097,040 |
| Distributions reinvested | 315,860 | 4,148,386 | 320,200 | 4,893,480 |
| Redemptions | (2,491,937) | (32,924,316) | (1,805,017) | (28,295,014) |
| Net increase (decrease) | (1,115,919) | (14,551,869) | 879,288 | 13,695,506 |
| Class C | ||||
| Subscriptions | 1,798,121 | 23,728,293 | 3,699,449 | 57,160,500 |
| Distributions reinvested | 1,141,051 | 14,766,667 | 1,234,165 | 18,571,698 |
| Redemptions | (4,344,297) | (56,858,147) | (3,319,328) | (50,590,070) |
| Net increase (decrease) | (1,405,125) | (18,363,187) | 1,614,286 | 25,142,128 |
| Institutional Class | ||||
| Subscriptions | 16,836,250 | 222,554,298 | 20,077,936 | 308,144,991 |
| Distributions reinvested | 4,215,522 | 54,775,418 | 3,523,851 | 53,340,988 |
| Redemptions | (17,557,490) | (229,780,514) | (9,254,572) | (141,972,179) |
| Net increase | 3,494,282 | 47,549,202 | 14,347,215 | 219,513,800 |
| Institutional 2 Class | ||||
| Subscriptions | 872,590 | 11,714,330 | 2,903,364 | 44,953,976 |
| Distributions reinvested | 318,083 | 4,183,579 | 358,447 | 5,481,177 |
| Redemptions | (2,452,165) | (32,391,458) | (2,490,769) | (37,822,086) |
| Net increase (decrease) | (1,261,492) | (16,493,549) | 771,042 | 12,613,067 |
| Institutional 3 Class | ||||
| Subscriptions | 556,635 | 7,345,502 | 614,850 | 9,462,948 |
| Distributions reinvested | 140,354 | 1,813,521 | 117,126 | 1,764,444 |
| Redemptions | (459,329) | (6,034,866) | (273,612) | (4,140,660) |
| Net increase | 237,660 | 3,124,157 | 458,364 | 7,086,732 |
| Class R | ||||
| Subscriptions | 19,371 | 251,944 | 23,577 | 358,476 |
| Distributions reinvested | 5,559 | 72,239 | 5,784 | 87,647 |
| Redemptions | (30,271) | (391,586) | (35,885) | (560,270) |
| Net decrease | (5,341) | (67,403) | (6,524) | (114,147) |
| Total net increase | 2,745,941 | 38,636,588 | 22,950,443 | 353,304,182 |
| 20 | Columbia Flexible Capital Income Fund | Annual Report 2023 |
| Net asset value, beginning of period | Net investment income | Net realized and unrealized gain (loss) | Total from investment operations | Distributions from net investment income | Distributions from net realized gains | Total distributions to shareholders | |
| Class A | |||||||
| Year Ended 5/31/2023 | $14.56 | 0.67 | (1.85) | (1.18) | (0.67) | (0.35) | (1.02) |
| Year Ended 5/31/2022 | $15.90 | 0.63 | (0.71) | (0.08) | (0.63) | (0.63) | (1.26) |
| Year Ended 5/31/2021 | $12.06 | 0.58 | 3.90 | 4.48 | (0.64) | — | (0.64) |
| Year Ended 5/31/2020 | $12.56 | 0.62 | (0.53) | 0.09 | (0.59) | — | (0.59) |
| Year Ended 5/31/2019 | $12.98 | 0.55 | (0.44) | 0.11 | (0.53) | — | (0.53) |
| Advisor Class | |||||||
| Year Ended 5/31/2023 | $14.71 | 0.71 | (1.88) | (1.17) | (0.70) | (0.35) | (1.05) |
| Year Ended 5/31/2022 | $16.04 | 0.68 | (0.71) | (0.03) | (0.67) | (0.63) | (1.30) |
| Year Ended 5/31/2021 | $12.16 | 0.63 | 3.93 | 4.56 | (0.68) | — | (0.68) |
| Year Ended 5/31/2020 | $12.66 | 0.66 | (0.54) | 0.12 | (0.62) | — | (0.62) |
| Year Ended 5/31/2019 | $13.08 | 0.58 | (0.44) | 0.14 | (0.56) | — | (0.56) |
| Class C | |||||||
| Year Ended 5/31/2023 | $14.46 | 0.57 | (1.84) | (1.27) | (0.57) | (0.35) | (0.92) |
| Year Ended 5/31/2022 | $15.80 | 0.51 | (0.71) | (0.20) | (0.51) | (0.63) | (1.14) |
| Year Ended 5/31/2021 | $11.99 | 0.47 | 3.89 | 4.36 | (0.55) | — | (0.55) |
| Year Ended 5/31/2020 | $12.48 | 0.53 | (0.53) | 0.00(d) | (0.49) | — | (0.49) |
| Year Ended 5/31/2019 | $12.90 | 0.45 | (0.44) | 0.01 | (0.43) | — | (0.43) |
| Institutional Class | |||||||
| Year Ended 5/31/2023 | $14.56 | 0.71 | (1.86) | (1.15) | (0.70) | (0.35) | (1.05) |
| Year Ended 5/31/2022 | $15.90 | 0.67 | (0.71) | (0.04) | (0.67) | (0.63) | (1.30) |
| Year Ended 5/31/2021 | $12.06 | 0.61 | 3.91 | 4.52 | (0.68) | — | (0.68) |
| Year Ended 5/31/2020 | $12.56 | 0.66 | (0.54) | 0.12 | (0.62) | — | (0.62) |
| Year Ended 5/31/2019 | $12.98 | 0.58 | (0.44) | 0.14 | (0.56) | — | (0.56) |
| Institutional 2 Class | |||||||
| Year Ended 5/31/2023 | $14.72 | 0.71 | (1.87) | (1.16) | (0.71) | (0.35) | (1.06) |
| Year Ended 5/31/2022 | $16.06 | 0.68 | (0.72) | (0.04) | (0.67) | (0.63) | (1.30) |
| Year Ended 5/31/2021 | $12.17 | 0.62 | 3.95 | 4.57 | (0.68) | — | (0.68) |
| Year Ended 5/31/2020 | $12.67 | 0.67 | (0.55) | 0.12 | (0.62) | — | (0.62) |
| Year Ended 5/31/2019 | $13.09 | 0.59 | (0.45) | 0.14 | (0.56) | — | (0.56) |
| 22 | Columbia Flexible Capital Income Fund | Annual Report 2023 |
| Net asset value, end of period | Total return | Total gross expense ratio to average net assets(a) | Total net expense ratio to average net assets(a),(b) | Net investment income ratio to average net assets | Portfolio turnover | Net assets, end of period (000’s) | |
| Class A | |||||||
| Year Ended 5/31/2023 | $12.36 | (8.30%) | 0.99% | 0.99%(c) | 5.11% | 44% | $349,966 |
| Year Ended 5/31/2022 | $14.56 | (0.65%) | 0.98% | 0.98% | 4.06% | 38% | $371,502 |
| Year Ended 5/31/2021 | $15.90 | 38.27% | 1.00% | 1.00% | 4.13% | 58% | $327,938 |
| Year Ended 5/31/2020 | $12.06 | 0.80% | 1.01% | 1.01% | 4.95% | 59% | $218,974 |
| Year Ended 5/31/2019 | $12.56 | 0.82% | 1.02% | 1.02% | 4.31% | 32% | $212,999 |
| Advisor Class | |||||||
| Year Ended 5/31/2023 | $12.49 | (8.11%) | 0.74% | 0.74%(c) | 5.33% | 44% | $40,615 |
| Year Ended 5/31/2022 | $14.71 | (0.32%) | 0.73% | 0.73% | 4.32% | 38% | $64,229 |
| Year Ended 5/31/2021 | $16.04 | 38.61% | 0.75% | 0.75% | 4.42% | 58% | $55,969 |
| Year Ended 5/31/2020 | $12.16 | 1.06% | 0.76% | 0.76% | 5.21% | 59% | $19,454 |
| Year Ended 5/31/2019 | $12.66 | 1.07% | 0.77% | 0.77% | 4.54% | 32% | $24,065 |
| Class C | |||||||
| Year Ended 5/31/2023 | $12.27 | (9.01%) | 1.74% | 1.74%(c) | 4.33% | 44% | $191,070 |
| Year Ended 5/31/2022 | $14.46 | (1.41%) | 1.73% | 1.73% | 3.30% | 38% | $245,459 |
| Year Ended 5/31/2021 | $15.80 | 37.25% | 1.75% | 1.75% | 3.40% | 58% | $242,640 |
| Year Ended 5/31/2020 | $11.99 | 0.06% | 1.76% | 1.76% | 4.20% | 59% | $209,401 |
| Year Ended 5/31/2019 | $12.48 | 0.07% | 1.77% | 1.77% | 3.56% | 32% | $213,342 |
| Institutional Class | |||||||
| Year Ended 5/31/2023 | $12.36 | (8.06%) | 0.74% | 0.74%(c) | 5.35% | 44% | $666,294 |
| Year Ended 5/31/2022 | $14.56 | (0.40%) | 0.73% | 0.73% | 4.33% | 38% | $734,226 |
| Year Ended 5/31/2021 | $15.90 | 38.60% | 0.75% | 0.75% | 4.39% | 58% | $573,637 |
| Year Ended 5/31/2020 | $12.06 | 1.07% | 0.76% | 0.76% | 5.22% | 59% | $426,343 |
| Year Ended 5/31/2019 | $12.56 | 1.08% | 0.77% | 0.77% | 4.56% | 32% | $406,033 |
| Institutional 2 Class | |||||||
| Year Ended 5/31/2023 | $12.50 | (8.08%) | 0.71% | 0.71% | 5.32% | 44% | $39,047 |
| Year Ended 5/31/2022 | $14.72 | (0.37%) | 0.71% | 0.71% | 4.33% | 38% | $64,534 |
| Year Ended 5/31/2021 | $16.06 | 38.70% | 0.73% | 0.73% | 4.41% | 58% | $58,024 |
| Year Ended 5/31/2020 | $12.17 | 1.10% | 0.73% | 0.73% | 5.25% | 59% | $29,105 |
| Year Ended 5/31/2019 | $12.67 | 1.10% | 0.74% | 0.73% | 4.59% | 32% | $18,828 |
| Columbia Flexible Capital Income Fund | Annual Report 2023 | 23 |
| Net asset value, beginning of period | Net investment income | Net realized and unrealized gain (loss) | Total from investment operations | Distributions from net investment income | Distributions from net realized gains | Total distributions to shareholders | |
| Institutional 3 Class | |||||||
| Year Ended 5/31/2023 | $14.49 | 0.71 | (1.84) | (1.13) | (0.71) | (0.35) | (1.06) |
| Year Ended 5/31/2022 | $15.83 | 0.68 | (0.71) | (0.03) | (0.68) | (0.63) | (1.31) |
| Year Ended 5/31/2021 | $12.01 | 0.62 | 3.89 | 4.51 | (0.69) | — | (0.69) |
| Year Ended 5/31/2020 | $12.51 | 0.67 | (0.54) | 0.13 | (0.63) | — | (0.63) |
| Year Ended 5/31/2019 | $12.93 | 0.59 | (0.44) | 0.15 | (0.57) | — | (0.57) |
| Class R | |||||||
| Year Ended 5/31/2023 | $14.55 | 0.64 | (1.86) | (1.22) | (0.63) | (0.35) | (0.98) |
| Year Ended 5/31/2022 | $15.88 | 0.59 | (0.70) | (0.11) | (0.59) | (0.63) | (1.22) |
| Year Ended 5/31/2021 | $12.05 | 0.54 | 3.90 | 4.44 | (0.61) | — | (0.61) |
| Year Ended 5/31/2020 | $12.55 | 0.59 | (0.54) | 0.05 | (0.55) | — | (0.55) |
| Year Ended 5/31/2019 | $12.97 | 0.52 | (0.45) | 0.07 | (0.49) | — | (0.49) |
| Notes to Financial Highlights | |
| (a) | In addition to the fees and expenses that the Fund bears directly, the Fund indirectly bears a pro rata share of the fees and expenses of any other funds in which it invests. Such indirect expenses are not included in the Fund’s reported expense ratios. |
| (b) | Total net expenses include the impact of certain fee waivers/expense reimbursements made by the Investment Manager and certain of its affiliates, if applicable. |
| (c) | The benefits derived from expense reductions had an impact of less than 0.01%. |
| (d) | Rounds to zero. |
| 24 | Columbia Flexible Capital Income Fund | Annual Report 2023 |
| Net asset value, end of period | Total return | Total gross expense ratio to average net assets(a) | Total net expense ratio to average net assets(a),(b) | Net investment income ratio to average net assets | Portfolio turnover | Net assets, end of period (000’s) | |
| Institutional 3 Class | |||||||
| Year Ended 5/31/2023 | $12.30 | (7.96%) | 0.67% | 0.67% | 5.44% | 44% | $22,443 |
| Year Ended 5/31/2022 | $14.49 | (0.33%) | 0.66% | 0.66% | 4.40% | 38% | $23,010 |
| Year Ended 5/31/2021 | $15.83 | 38.70% | 0.68% | 0.68% | 4.47% | 58% | $17,878 |
| Year Ended 5/31/2020 | $12.01 | 1.16% | 0.68% | 0.68% | 5.36% | 59% | $14,621 |
| Year Ended 5/31/2019 | $12.51 | 1.16% | 0.70% | 0.69% | 4.66% | 32% | $9,267 |
| Class R | |||||||
| Year Ended 5/31/2023 | $12.35 | (8.54%) | 1.24% | 1.24%(c) | 4.83% | 44% | $886 |
| Year Ended 5/31/2022 | $14.55 | (0.84%) | 1.23% | 1.23% | 3.78% | 38% | $1,122 |
| Year Ended 5/31/2021 | $15.88 | 37.88% | 1.25% | 1.25% | 3.88% | 58% | $1,329 |
| Year Ended 5/31/2020 | $12.05 | 0.52% | 1.26% | 1.26% | 4.68% | 59% | $912 |
| Year Ended 5/31/2019 | $12.55 | 0.57% | 1.27% | 1.27% | 4.08% | 32% | $1,402 |
| Columbia Flexible Capital Income Fund | Annual Report 2023 | 25 |
May 31, 2023
| 26 | Columbia Flexible Capital Income Fund | Annual Report 2023 |
May 31, 2023
| Columbia Flexible Capital Income Fund | Annual Report 2023 | 27 |
May 31, 2023
| 28 | Columbia Flexible Capital Income Fund | Annual Report 2023 |
May 31, 2023
| Columbia Flexible Capital Income Fund | Annual Report 2023 | 29 |
May 31, 2023
| Effective rate (%) | |
| Class A | 0.08 |
| Advisor Class | 0.08 |
| Class C | 0.08 |
| Institutional Class | 0.08 |
| Institutional 2 Class | 0.06 |
| Institutional 3 Class | 0.01 |
| Class R | 0.08 |
| Front End (%) | CDSC (%) | Amount ($) | |
| Class A | 5.75 | 0.50 - 1.00(a) | 728,364 |
| Class C | — | 1.00(b) | 14,283 |
| (a) | This charge is imposed on certain investments of between $1 million and $50 million redeemed within 18 months after purchase, as follows: 1.00% if redeemed within 12 months after purchase, and 0.50% if redeemed more than 12, but less than 18, months after purchase, with certain limited exceptions. |
| (b) | This charge applies to redemptions within 12 months after purchase, with certain limited exceptions. |
| 30 | Columbia Flexible Capital Income Fund | Annual Report 2023 |
May 31, 2023
| October 1, 2022 through September 30, 2023 | Prior to October 1, 2022 | |
| Class A | 1.15% | 1.20% |
| Advisor Class | 0.90 | 0.95 |
| Class C | 1.90 | 1.95 |
| Institutional Class | 0.90 | 0.95 |
| Institutional 2 Class | 0.88 | 0.94 |
| Institutional 3 Class | 0.83 | 0.89 |
| Class R | 1.40 | 1.45 |
| Undistributed net investment income ($) | Accumulated net realized (loss) ($) | Paid in capital ($) |
| (444,604) | (635,316) | 1,079,920 |
| Columbia Flexible Capital Income Fund | Annual Report 2023 | 31 |
May 31, 2023
| Year Ended May 31, 2023 | Year Ended May 31, 2022 | ||||
| Ordinary income ($) | Long-term capital gains ($) | Total ($) | Ordinary income ($) | Long-term capital gains ($) | Total ($) |
| 70,801,021 | 36,772,551 | 107,573,572 | 55,987,653 | 57,501,420 | 113,489,073 |
| Undistributed ordinary income ($) | Undistributed long-term capital gains ($) | Capital loss carryforwards ($) | Net unrealized (depreciation) ($) |
| 13,858,701 | — | (64,430,178) | (101,395,122) |
| Federal tax cost ($) | Gross unrealized appreciation ($) | Gross unrealized (depreciation) ($) | Net unrealized (depreciation) ($) |
| 1,389,040,009 | 67,930,850 | (169,325,972) | (101,395,122) |
| No expiration short-term ($) | No expiration long-term ($) | Total ($) | Utilized ($) |
| (55,637,974) | (8,792,204) | (64,430,178) | — |
| 32 | Columbia Flexible Capital Income Fund | Annual Report 2023 |
May 31, 2023
| Borrower or lender | Average loan balance ($) | Weighted average interest rate (%) | Number of days with outstanding loans |
| Lender | 400,000 | 5.10 | 2 |
| Columbia Flexible Capital Income Fund | Annual Report 2023 | 33 |
May 31, 2023
| 34 | Columbia Flexible Capital Income Fund | Annual Report 2023 |
May 31, 2023
| Columbia Flexible Capital Income Fund | Annual Report 2023 | 35 |
| 36 | Columbia Flexible Capital Income Fund | Annual Report 2023 |
| Qualified dividend income | Dividends received deduction | Section 199A dividends |
| 41.73% | 39.71% | 4.50% |
| Name, address, year of birth | Position held with the Columbia Funds and length of service | Principal occupation(s) during past five years and other relevant professional experience | Number of Funds in the Columbia Funds Complex* overseen | Other directorships held by Trustee during the past five years and other relevant Board experience |
| George S. Batejan c/o Columbia Management Investment Advisers, LLC 290 Congress Street Boston, MA 02210 1954 | Trustee since 2017 | Executive Vice President, Global Head of Technology and Operations, Janus Capital Group, Inc., 2010-2016 | 174 | Former Chairman of the Board, NICSA (National Investment Company Services Association) (Executive Committee, Nominating Committee and Governance Committee), 2014-2016; former Director, Intech Investment Management, 2011-2016; former Board Member, Metro Denver Chamber of Commerce, 2015-2016; former Advisory Board Member, University of Colorado Business School, 2015-2018; former Board Member, Chase Bank International, 1993-1994 |
| Columbia Flexible Capital Income Fund | Annual Report 2023 | 37 |
(Unaudited)
Independent trustees (continued)
| Name, address, year of birth | Position held with the Columbia Funds and length of service | Principal occupation(s) during past five years and other relevant professional experience | Number of Funds in the Columbia Funds Complex* overseen | Other directorships held by Trustee during the past five years and other relevant Board experience |
| Kathleen Blatz c/o Columbia Management Investment Advisers, LLC 290 Congress Street Boston, MA 02210 1954 | Trustee since 2006 | Attorney, specializing in arbitration and mediation; Chief Justice, Minnesota Supreme Court, 1998-2006; Associate Justice, Minnesota Supreme Court, 1996-1998; Fourth Judicial District Court Judge, Hennepin County, 1994-1996; Attorney in private practice and public service, 1984-1993; State Representative, Minnesota House of Representatives, 1979-1993, which included service on the Tax and Financial Institutions and Insurance Committees; Member and Interim Chair, Minnesota Sports Facilities Authority, January-July 2017; Interim President and Chief Executive Officer, Blue Cross and Blue Shield of Minnesota (health care insurance), February-July 2018, April-October 2021 | 174 | Former Trustee, Blue Cross and Blue Shield of Minnesota, 2009-2021 (Chair of the Business Development Committee, 2014-2017; Chair of the Governance Committee, 2017-2019); former Member and Chair of the Board, Minnesota Sports Facilities Authority, January 2017-July 2017; former Director, Robina Foundation, 2009-2020 (Chair, 2014-2020); Director, Richard M. Schulze Family Foundation, since 2021 |
| Pamela G. Carlton c/o Columbia Management Investment Advisers, LLC 290 Congress Street Boston, MA 02210 1954 | Chair since 2023; Trustee since 2007 | President, Springboard — Partners in Cross Cultural Leadership (consulting company), since 2003; Managing Director of US Equity Research, JP Morgan Chase, 1999-2003; Director of US Equity Research, Chase Asset Management, 1996-1999; Co-Director Latin America Research, 1993-1996, COO Global Research, 1992-1996, Co-Director of US Research, 1991-1992, Investment Banker, 1982-1991, Morgan Stanley; Attorney, Cleary Gottlieb Steen & Hamilton LLP, 1980-1982 | 174 | Trustee, New York Presbyterian Hospital Board, since 1996; Director, DR Bank (Audit Committee) since 2017; Director, Evercore Inc. (Audit Committee, Nominating and Governance Committee), since 2019; Director, Apollo Commercial Real Estate Finance, Inc. (Chair, Nominating and Governance Committee) (financial services), since 2021; the Governing Council of the Independent Directors Council (IDC), since 2021 |
| Janet Langford Carrig c/o Columbia Management Investment Advisers, LLC 290 Congress Street Boston, MA 02210 1957 | Trustee since 1996 | Senior Vice President, General Counsel and Corporate Secretary, ConocoPhillips (independent energy company), September 2007-October 2018 | 174 | Director, EQT Corporation (natural gas producer), since 2019; former Director, Whiting Petroleum Corporation (independent oil and gas company), 2020-2022 |
| J. Kevin Connaughton c/o Columbia Management Investment Advisers, LLC 290 Congress Street Boston, MA 02210 1964 | Trustee since 2020 | CEO and President, RhodeWay Financial (non-profit financial planning firm), since December 2022; Member, FINRA National Adjudicatory Council, since January 2020; Adjunct Professor of Finance, Bentley University since January 2018; Consultant to Independent Trustees of CFVIT and CFST I from March 2016 to June 2020 with respect to CFVIT and to December 2020 with respect to CFST I; Managing Director and General Manager of Mutual Fund Products, Columbia Management Investment Advisers, LLC, May 2010-February 2015; President, Columbia Funds, 2008-2015; and senior officer of Columbia Funds and affiliated funds, 2003-2015 | 172 | Former Director, The Autism Project, March 2015-December 2021; former Member of the Investment Committee, St. Michael’s College, November 2015-February 2020; former Trustee, St. Michael’s College, June 2017-September 2019; former Trustee, New Century Portfolios (former mutual fund complex), January 2015-December 2017 |
| 38 | Columbia Flexible Capital Income Fund | Annual Report 2023 |
(Unaudited)
Independent trustees (continued)
| Name, address, year of birth | Position held with the Columbia Funds and length of service | Principal occupation(s) during past five years and other relevant professional experience | Number of Funds in the Columbia Funds Complex* overseen | Other directorships held by Trustee during the past five years and other relevant Board experience |
| Olive M. Darragh c/o Columbia Management Investment Advisers, LLC 290 Congress Street Boston, MA 02210 1962 | Trustee since 2020 | Managing Director of Darragh Inc. (strategy and talent management consulting firm), since 2010; Founder and CEO, Zolio, Inc. (investment management talent identification platform), since 2004; Consultant to Independent Trustees of CFVIT and CFST I from June 2019 to June 2020 with respect to CFVIT and to December 2020 with respect to CFST I; Partner, Tudor Investments, 2004-2010; Senior Partner, McKinsey & Company (consulting), 1990-2004; Touche Ross CPA, 1985-1988 | 172 | Treasurer, Edinburgh University US Trust Board, since January 2023; Member, HBS Community Action Partners Board, since September 2022; former Director, University of Edinburgh Business School (Member of US Board), 2004-2019; former Director, Boston Public Library Foundation, 2008-2017 |
| Patricia M. Flynn c/o Columbia Management Investment Advisers, LLC 290 Congress Street Boston, MA 02210 1950 | Trustee since 2004 | Professor of Economics and Management, Bentley University, since 2002; Dean, McCallum Graduate School of Business, Bentley University, 1992-2002 | 174 | Former Trustee, MA Taxpayers Foundation, 1997-2022; former Director, The MA Business Roundtable, 2003-2019; former Chairperson, Innovation Index Advisory Committee, MA Technology Collaborative, 1997-2020 |
| Brian J. Gallagher c/o Columbia Management Investment Advisers, LLC 290 Congress Street Boston, MA 02210 1954 | Trustee since 2017 | Retired; Partner with Deloitte & Touche LLP and its predecessors, 1977-2016 | 174 | Trustee, Catholic Schools Foundation, since 2004 |
| Douglas A. Hacker c/o Columbia Management Investment Advisers, LLC 290 Congress Street Boston, MA 02210 1955 | Trustee since 1996 | Independent business executive, since May 2006; Executive Vice President – Strategy of United Airlines, December 2002 - May 2006; President of UAL Loyalty Services (airline marketing company), September 2001-December 2002; Executive Vice President and Chief Financial Officer of United Airlines, July 1999-September 2001 | 174 | Director, SpartanNash Company since November 2013 (Chair of the Board, since May 2021) (food distributor); Director, Aircastle Limited (Chair of Audit Committee) (aircraft leasing), since August 2006; former Director, Nash Finch Company (food distributor), 2005-2013; former Director, SeaCube Container Leasing Ltd. (container leasing), 2010-2013; and former Director, Travelport Worldwide Limited (travel information technology), 2014-2019 |
| Nancy T. Lukitsh c/o Columbia Management Investment Advisers, LLC 290 Congress Street Boston, MA 02210 1956 | Trustee since 2011 | Senior Vice President, Partner and Director of Marketing, Wellington Management Company, LLP (investment adviser), 1997-2010; Chair, Wellington Management Portfolios (commingled non-U.S. investment pools), 2007-2010; Director, Wellington Trust Company, NA and other Wellington affiliates, 1997-2010 | 172 | None |
| Columbia Flexible Capital Income Fund | Annual Report 2023 | 39 |
(Unaudited)
Independent trustees (continued)
| Name, address, year of birth | Position held with the Columbia Funds and length of service | Principal occupation(s) during past five years and other relevant professional experience | Number of Funds in the Columbia Funds Complex* overseen | Other directorships held by Trustee during the past five years and other relevant Board experience |
| David M. Moffett c/o Columbia Management Investment Advisers, LLC 290 Congress Street Boston, MA 02210 1952 | Trustee since 2011 | Retired; former Chief Executive Officer of Freddie Mac and Chief Financial Officer of U.S. Bank | 172 | Director, CSX Corporation (transportation suppliers); Director, PayPal Holdings Inc. (payment and data processing services); Trustee, University of Oklahoma Foundation; former Director, eBay Inc. (online trading community), 2007-2015; and former Director, CIT Bank, CIT Group Inc. (commercial and consumer finance), 2010-2016; former Senior Adviser to The Carlyle Group (financial services), March 2008-September 2008; former Governance Consultant to Bridgewater Associates, January 2013-December 2015 |
| Catherine James Paglia c/o Columbia Management Investment Advisers, LLC 290 Congress Street Boston, MA 02210 1952 | Trustee since 2004 | Director, Enterprise Asset Management, Inc. (private real estate and asset management company), since September 1998; Managing Director and Partner, Interlaken Capital, Inc., 1989-1997; Vice President, 1982-1985, Principal, 1985-1987, Managing Director, 1987-1989, Morgan Stanley; Vice President, Investment Banking, 1980-1982, Associate, Investment Banking, 1976-1980, Dean Witter Reynolds, Inc. | 174 | Director, Valmont Industries, Inc. (irrigation systems manufacturer), since 2012; Trustee, Carleton College (on the Investment Committee), since 1987; Trustee, Carnegie Endowment for International Peace (on the Investment Committee), since 2009 |
| Natalie A. Trunow c/o Columbia Management Investment Advisers, LLC 290 Congress Street Boston, MA 02210 1967 | Trustee since 2020 | Chief Executive Officer, Millennial Portfolio Solutions LLC (asset management and consulting services), January 2016-January 2021; Non-executive Member of the Investment Committee and Valuation Committee, Sarona Asset Management Inc. (private equity firm) since September 2019; Advisor, Horizon Investments (asset management and consulting services), August 2018-January 2022; Advisor, Paradigm Asset Management, November 2016-January 2022; Consultant to Independent Trustees of CFVIT and CFST I from September 2016 to June 2020 with respect to CFVIT and to December 2020 with respect to CFST I; Director of Investments/Consultant, Casey Family Programs, April 2016-November 2016; Senior Vice President and Chief Investment Officer, Calvert Investments, August 2008-January 2016; Section Head and Portfolio Manager, General Motors Asset Management, June 1997-August 2008 | 172 | Independent Director, Investment Committee, Health Services for Children with Special Needs, Inc., 2010-2021; Independent Director, (Executive Committee and Chair, Audit Committee), Consumer Credit Counseling Services (formerly Guidewell Financial Solutions), since 2016; Independent Director, (Investment Committee), Sarona Asset Management, since 2019 |
| 40 | Columbia Flexible Capital Income Fund | Annual Report 2023 |
(Unaudited)
Independent trustees (continued)
| Name, address, year of birth | Position held with the Columbia Funds and length of service | Principal occupation(s) during past five years and other relevant professional experience | Number of Funds in the Columbia Funds Complex* overseen | Other directorships held by Trustee during the past five years and other relevant Board experience |
| Sandra L. Yeager c/o Columbia Management Investment Advisers, LLC 290 Congress Street Boston, MA 02210 1964 | Trustee since 2017 | Retired; President and founder, Hanoverian Capital, LLC (SEC registered investment advisor firm), 2008-2016; Managing Director, DuPont Capital, 2006-2008; Managing Director, Morgan Stanley Investment Management, 2004-2006; Senior Vice President, Alliance Bernstein, 1990-2004 | 174 | Former Director, NAPE (National Alliance for Partnerships in Equity) Education Foundation, October 2016-October 2020; Advisory Board, Jennersville YMCA, since 2022 |
| Name, address, year of birth | Position held with the Columbia Funds and length of service | Principal occupation(s) during the past five years and other relevant professional experience | Number of Funds in the Columbia Funds Complex overseen | Other directorships held by Trustee during the past five years and other relevant Board experience |
| Daniel J. Beckman c/o Columbia Management Investment Advisers, LLC 290 Congress Street Boston, MA 02210 1962 | Trustee since November 2021 and President since June 2021 | Vice President – Head of North America Product, Columbia Management Investment Advisers, LLC, since April 2015; President and Principal Executive Officer of the Columbia Funds, since June 2021; officer of Columbia Funds and affiliated funds, 2020-2021 | 174 | Director, Ameriprise Trust Company, since October 2016; Director, Columbia Management Investment Distributors, Inc. since November 2018; Board of Governors, Columbia Wanger Asset Management, LLC since, January 2022; Director, Columbia Threadneedle Canada, Inc., since December 2022 |
| * | The term “Columbia Funds Complex” as used herein includes Columbia Seligman Premium Technology Growth Fund, Tri-Continental Corporation and each series of Columbia Funds Series Trust (CFST), Columbia Funds Series Trust I (CFST I), Columbia Funds Series Trust II (CFST II), Columbia ETF Trust I (CET I), Columbia ETF Trust II (CET II), Columbia Funds Variable Insurance Trust (CFVIT) and Columbia Funds Variable Series Trust II (CFVST II). Messrs. Batejan, Beckman, Gallagher and Hacker and Mses. Blatz, Carlton, Carrig, Flynn, Paglia, and Yeager serve as directors of Columbia Seligman Premium Technology Growth Fund and Tri-Continental Corporation. |
| ** | Interested person (as defined under the 1940 Act) by reason of being an officer, director, security holder and/or employee of the Investment Manager or Ameriprise Financial. |
| Columbia Flexible Capital Income Fund | Annual Report 2023 | 41 |
(Unaudited)
The Board has appointed officers who are responsible for day-to-day business decisions based on policies it has established. The officers serve at the pleasure of the Board. The following table provides basic information about the Officers of the Fund as of the printing of this report, including principal occupations during the past five years, although their specific titles may have varied over the period. In addition to Mr. Beckman, who is President and Principal Executive Officer, the Fund’s other officers are:
| Name, address and year of birth | Position and year first appointed to position for any Fund in the Columbia Funds Complex or a predecessor thereof | Principal occupation(s) during past five years |
| Michael G. Clarke 290 Congress Street Boston, MA 02210 1969 | Chief Financial Officer and Principal Financial Officer (2009) and Senior Vice President (2019) | Senior Vice President and North America Head of Operations & Investor Services, Columbia Management Investment Advisers, LLC, since June 2023 (previously Senior Vice President and Head of Global Operations, March 2022 – June 2023, Vice President, Head of North America Operations, and Co-Head of Global Operations, June 2019 - February 2022 and Vice President – Accounting and Tax, May 2010 - May 2019); senior officer of Columbia Funds and affiliated funds, since 2002. Director, Ameriprise Trust Company, since June 2023. |
| Joseph Beranek 5890 Ameriprise Financial Center Minneapolis, MN 55474 1965 | Treasurer and Chief Accounting Officer (Principal Accounting Officer) (2019) and Principal Financial Officer (2020), CFST, CFST I, CFST II, CFVIT and CFVST II; Assistant Treasurer, CET I and CET II | Vice President – Mutual Fund Accounting and Financial Reporting, Columbia Management Investment Advisers, LLC, since December 2018 and March 2017, respectively. |
| Marybeth Pilat 290 Congress Street Boston, MA 02210 1968 | Treasurer and Chief Accounting Officer (Principal Accounting Officer) and Principal Financial Officer (2020) for CET I and CET II; Assistant Treasurer, CFST, CFST I, CFST II, CFVIT and CFVST II | Vice President – Product Pricing and Administration, Columbia Management Investment Advisers, LLC, since May 2017. |
| William F. Truscott 290 Congress Street Boston, MA 02210 1960 | Senior Vice President (2001) | Formerly, Trustee/Director of Columbia Funds Complex or legacy funds, November 2001 - January 1, 2021; Chief Executive Officer, Global Asset Management, Ameriprise Financial, Inc., since September 2012; Chairman of the Board and President, Columbia Management Investment Advisers, LLC, since July 2004 and February 2012, respectively; Chairman of the Board and Chief Executive Officer, Columbia Management Investment Distributors, Inc., since November 2008 and February 2012, respectively;Chairman of the Board and Director, Threadneedle Asset Management Holdings, Sàrl, since March 2013 and December 2008, respectively; senior executive of various entities affiliated with Columbia Threadneedle. |
| Christopher O. Petersen 5228 Ameriprise Financial Center Minneapolis, MN 55474 1970 | Senior Vice President and Assistant Secretary (2021) | Formerly, Trustee/Director of funds within the Columbia Funds Complex, July 1, 2020 - November 22, 2021; Senior Vice President and Assistant General Counsel, Ameriprise Financial, Inc., since September 2021 (previously Vice President and Lead Chief Counsel, January 2015 - September 2021); formerly, President and Principal Executive Officer of the Columbia Funds, 2015 - 2021; officer of Columbia Funds and affiliated funds, since 2007. |
| Thomas P. McGuire 290 Congress Street Boston, MA 02210 1972 | Senior Vice President and Chief Compliance Officer (2012) | Vice President – Asset Management Compliance, Ameriprise Financial, Inc., since May 2010; Chief Compliance Officer, Columbia Acorn/Wanger Funds, since December 2015; formerly, Chief Compliance Officer, Ameriprise Certificate Company, September 2010 – September 2020. |
| Ryan C. Larrenaga 290 Congress Street Boston, MA 02210 1970 | Senior Vice President (2017), Chief Legal Officer (2017), and Secretary (2015) | Vice President and Chief Counsel, Ameriprise Financial, Inc., since August 2018 (previously Vice President and Group Counsel, August 2011 - August 2018); Chief Legal Officer, Columbia Acorn/Wanger Funds, since September 2020; officer of Columbia Funds and affiliated funds, since 2005. |
| 42 | Columbia Flexible Capital Income Fund | Annual Report 2023 |
(Unaudited)
Fund officers (continued)
| Name, address and year of birth | Position and year first appointed to position for any Fund in the Columbia Funds Complex or a predecessor thereof | Principal occupation(s) during past five years |
| Michael E. DeFao 290 Congress Street Boston, MA 02210 1968 | Vice President (2011) and Assistant Secretary (2010) | Vice President and Chief Counsel, Ameriprise Financial, Inc., since May 2010; Vice President, Chief Legal Officer and Assistant Secretary, Columbia Management Investment Advisers, LLC, since October 2021 (previously Vice President and Assistant Secretary, May 2010 – September 2021). |
| Lyn Kephart-Strong 5903 Ameriprise Financial Center Minneapolis, MN 55474 1960 | Vice President (2015) | Vice President, Global Investment Operations Services, Columbia Management Investment Advisers, LLC, since 2010; Director (since January 2007) and President (since October 2014), Columbia Management Investment Services Corp.; Director (since December 2017) and President (since January 2017), Ameriprise Trust Company. |
| • | the Fund had sufficient liquidity to both meet redemptions and operate effectively on behalf of shareholders; |
| • | there were no material changes to the Program during the period; |
| • | the implementation of the Program was effective to manage the Fund’s liquidity risk; and |
| • | the Program operated adequately during the period. |
| Columbia Flexible Capital Income Fund | Annual Report 2023 | 43 |
columbiathreadneedleus.com/investor/. The Fund is distributed by Columbia Management Investment Distributors, Inc., member FINRA, and managed by Columbia Management Investment Advisers, LLC.
Item 2. Code of Ethics.
(a) | The registrant has adopted a code of ethics that applies to the registrant’s principal executive officer, principal financial officer, principal accounting officer or controller, or persons performing similar functions, regardless of whether these individuals are employed by the registrant or a third party. |
(b) | During the period covered by this report, there were not any amendments to a provision of the code of ethics that applies to the registrant’s principal executive officer, principal financial officer, principal accounting officer or controller, or persons performing similar functions, regardless of whether these individuals are employed by the registrant or a third party, and that relates to any element of the code of ethics definition enumerated in paragraph (b) of this Item. |
(c) | During the period covered by this report, there were no waivers, including any implicit waivers, from a provision of the code of ethics to the registrant’s principal executive officer, principal financial officer, principal accounting officer or controller, or persons performing similar functions, regardless of whether these individuals are employed by the registrant or a third party that relates to one or more of the items set forth in paragraph (b) of this Item. |
Item 3. Audit Committee Financial Expert.
The registrant’s Board of Trustees has determined that David M. Moffett, Brian J. Gallagher, J. Kevin Connaughton, Sandra L. Yeager, and Douglas A. Hacker, each of whom are members of the registrant’s Board of Trustees and Audit Committee, each qualify as an audit committee financial expert. Mr. Moffett, Mr. Gallagher, Mr. Connaughton, Ms. Yeager, and Mr. Hacker are each independent trustees, as defined in paragraph (a)(2) of this item’s instructions.
Item 4. Principal Accountant Fees and Services.
Fee information below is disclosed for the eleven series of the registrant whose reports to stockholders are included in this annual filing.
(a) Audit Fees. Aggregate Audit Fees billed by the principal accountant for professional services rendered during the fiscal years ended May 31, 2023 and May 31, 2022 are approximately as follows:
2023 | 2022 |
$392,200 | $384,500 |
Audit Fees include amounts related to the audit of the registrant’s annual financial statements or services that are normally provided by the accountant in connection with statutory and regulatory filings or engagements for those fiscal years.
(b) Audit-Related Fees. Aggregate Audit-Related Fees billed to the registrant by the principal accountant for professional services rendered during the fiscal years ended May 31, 2023 and May 31, 2022 are approximately as follows:
2023 | 2022 |
$0 | $10,000 |
Audit-Related Fees include amounts for assurance and related services by the principal accountant that are reasonably related to the performance of the audit of the registrant’s financial statements and are not reported in Audit Fees above.
During the fiscal years ended May 31, 2023 and May 31, 2022, there were no Audit-Related Fees billed by the registrant’s principal accountant to the registrant’s investment adviser (not including any sub-adviser whose role is primarily portfolio management and is subcontracted with or overseen by another investment adviser) and any entity controlling, controlled by, or under common control with the adviser that provides ongoing services to the registrant for an engagement that related directly to the operations and financial reporting of the registrant.
(c) Tax Fees. Aggregate Tax Fees billed by the principal accountant to the registrant for professional services rendered during the fiscal years ended May 31, 2023 and May 31, 2022 are approximately as follows:
2023 | 2022 |
$137,500 | $48,300 |
Tax Fees include amounts for the review of annual tax returns, the review of required shareholder distribution calculations and typically include amounts for professional services by the principal accountant for tax compliance, tax advice and tax planning.
During the fiscal years ended May 31, 2023 and May 31, 2022, there were no Tax Fees billed by the registrant’s principal accountant to the registrant’s investment adviser (not including any sub-adviser whose role is primarily portfolio management and is subcontracted with or overseen by another investment adviser) and any entity controlling, controlled by, or under common control with the adviser that provides ongoing services to the registrant for an engagement that related directly to the operations and financial reporting of the registrant.
(d) All Other Fees. Aggregate All Other Fees billed by the principal accountant to the registrant for professional services rendered during the fiscal years ended May 31, 2023 and May 31, 2022 are approximately as follows:
2023 | 2022 |
$0 | $0 |
All Other Fees, if any, include amounts for products and services provided by the principal accountant, other than the services reported in paragraphs (a) through (c) above.
Aggregate All Other Fees billed by the registrant’s principal accountant to the registrant’s investment adviser (not including any sub-adviser whose role is primarily portfolio management and is subcontracted with or overseen by another investment adviser) and any entity controlling, controlled by, or under common control with the adviser that provides ongoing services to the registrant for an engagement that related directly to the operations and financial reporting of the registrant during the fiscal years ended May 31, 2023 and May 31, 2022 are approximately as follows:
2023 | 2022 |
$557,000 | $535,000 |
In fiscal years 2023 and 2022, All Other Fees primarily consists of fees billed for internal control examinations of the registrant’s transfer agent and investment adviser.
(e)(1) Audit Committee Pre-Approval Policies and Procedures
The registrant’s Audit Committee is required to pre-approve the engagement of the registrant’s independent auditors to provide audit and non-audit services to the registrant and non-audit services to its investment adviser (excluding any sub-adviser whose role is primarily portfolio management and is sub-contracted or overseen by another investment adviser (the “Adviser”) or any entity controlling, controlled by or under common control with the Adviser that provides ongoing services to the Fund (a “Control Affiliate”) if the engagement relates directly to the operations and financial reporting of the registrant.
The Audit Committee has adopted a Policy for Engagement of Independent Auditors for Audit and Non-Audit Services (the “Policy”). The Policy sets forth the understanding of the Audit Committee regarding the engagement of the registrant’s independent accountants to provide (i) audit and permissible audit-related, tax and other services to the registrant (“Fund Services”); (ii) non-audit services to the registrant’s Adviser and any Control Affiliates, that relates directly to the operations and financial reporting of a Fund (“Fund-related Adviser Services”); and (iii) certain other audit and non-audit services to the registrant’s Adviser and its Control Affiliates. A service will require specific pre-approval by the Audit Committee if it is to be provided by the Fund’s independent auditor; provided, however, that pre-approval of non-audit services to the Fund, the Adviser or Control Affiliates may be waived if certain de minimis requirements set forth in the SEC’s rules are met.
Under the Policy, the Audit Committee may delegate pre-approval authority to any pre-designated member or members who are independent board members. The member(s) to whom such authority is delegated must report, for informational purposes only, any pre-approval decisions to the Audit Committee at its next regular meeting. The Audit Committee's responsibilities with respect to the pre-approval of services performed by the independent auditor may not be delegated to management.
On an annual basis, at a regularly scheduled Audit Committee meeting, the Fund’s Treasurer or other Fund officer shall submit to the Audit Committee a schedule of the types of Fund Services and Fund-related Adviser Services that are subject to specific pre-approval. This schedule will provide a description of each type of service that is subject to specific pre-approval, along with total projected fees for each service. The pre-approval will generally cover a one-year period. The Audit Committee will review and approve the types of services and the projected fees for the next one-year period and may add to, or subtract from, the list of pre-approved services from time to time, based on subsequent determinations. This specific approval acknowledges that the Audit Committee is in agreement with the specific types of services that the independent auditor will be permitted to perform and the projected fees for each service.
The Fund’s Treasurer or other Fund officer shall report to the Audit Committee at each of its regular meetings regarding all Fund Services or Fund-related Adviser Services provided since the last such report was rendered, including a description of the services, by category, with forecasted fees for the annual reporting period, proposed changes requiring specific pre-approval and a description of services provided by the independent auditor, by category, with actual fees during the current reporting period.
*****
(e)(2) None, or 0%, of the Audit-Related Fees, Tax Fees and All Other Fees paid by the Fund or affiliated entities relating directly to the operations and financial reporting of the Registrant disclosed above were approved by the audit committee pursuant to paragraphs (c)(7)(i)(C) of Rule 2-01 of Regulation S-X (which permits audit committee approval after the start of the engagement with respect to services other than audit, review or attest services, if certain conditions are satisfied).
(f) Not applicable.
(g) The aggregate non-audit fees billed by the registrant’s accountant for services rendered to the registrant, and rendered to the registrant’s investment adviser (not including any sub-adviser whose role is primarily portfolio management and is subcontracted with or overseen by another investment adviser), and any entity controlling, controlled by, or under common control with the adviser that provides ongoing services to the registrant for the fiscal years ended May 31, 2023 and May 31, 2022 are approximately as follows:
2023 | 2022 |
$694,500 | $593,300 |
(h) The registrant’s Audit Committee of the Board of Directors has considered whether the provision of non-audit services that were rendered to the registrant’s adviser (not including any sub-adviser whose role is primarily portfolio management and is subcontracted with or overseen by another investment adviser), and any entity controlling, controlled by, or under common control with the investment adviser that provides ongoing services to the registrant that were not pre-approved pursuant to paragraph (c)(7)(ii) of Rule 2-01 of Regulation S-X, is compatible with maintaining the principal accountant’s independence.
Item 5. Audit Committee of Listed Registrants.
Not applicable.
Item 6. Investments
(a) | The registrant’s “Schedule I – Investments in securities of unaffiliated issuers” (as set forth in 17 CFR 210.12-12) is included in Item 1 of this Form N-CSR. |
(b) | Not applicable. |
Item 7. Disclosure of Proxy Voting Policies and Procedures for Closed-End Management Investment Companies.
Not applicable.
Item 8. Portfolio Managers of Closed-End Management Investment Companies.
Not applicable.
Item 9. Purchases of Equity Securities by Closed-End Management Investment Company and Affiliated Purchasers.
Not applicable.
Item 10. Submission of Matters to a Vote of Security Holders.
There were no material changes to the procedures by which shareholders may recommend nominees to the registrant's board of directors.
Item 11. Controls and Procedures.
(a) | The registrant’s principal executive officer and principal financial officer, based on their evaluation of the registrant’s disclosure controls and procedures as of a date within 90 days of the filing of this report, have concluded that such controls and procedures are adequately designed to ensure that information required to be disclosed by the registrant in Form N-CSR is accumulated and communicated to the registrant’s management, including the principal executive officer and principal financial officer, or persons performing similar functions, as appropriate to allow timely decisions regarding required disclosure. |
(b) | There was no change in the registrant's internal control over financial reporting that occurred during the period covered by this report that has materially affected, or is reasonably likely to materially affect, the registrant's internal control over financial reporting. |
Item 12. Disclosure of Securities Lending Activities for Closed-End Management Investment Companies
Not applicable.
Item 13. Exhibits.
SIGNATURES
Pursuant to the requirements of the Securities Exchange Act of 1934 and the Investment Company Act of 1940, the registrant has duly caused this report to be signed on its behalf by the undersigned, thereunto duly authorized.
(registrant) | Columbia Funds Series Trust II |
|
|
By (Signature and Title) | /s/ Daniel J. Beckman |
| Daniel J. Beckman, President and Principal Executive Officer |
|
|
Date | July 21, 2023 |
|
|
|
|
Pursuant to the requirements of the Securities Exchange Act of 1934 and the Investment Company Act of 1940, this report has been signed below by the following persons on behalf of the registrant and in the capacities and on the dates indicated.
By (Signature and Title) | /s/ Daniel J. Beckman |
| Daniel J. Beckman, President and Principal Executive Officer |
|
|
Date | July 21, 2023 |
By (Signature and Title) | /s/ Michael G. Clarke |
| Michael G. Clarke, Chief Financial Officer, |
| Principal Financial Officer and Senior Vice President |
|
|
Date | July 21, 2023 |
By (Signature and Title) | /s/ Joseph Beranek |
| Joseph Beranek, Treasurer, Chief Accounting |
| Officer and Principal Financial Officer |
|
|
Date | July 21, 2023 |