UNITED STATES
SECURITIES AND EXCHANGE COMMISSION
Washington, D.C. 20549
FORM N-CSR
CERTIFIED SHAREHOLDER REPORT OF REGISTERED MANAGEMENT INVESTMENT COMPANIES
Investment Company Act file number 811-21852
Columbia Funds Series Trust II
(Exact name of registrant as specified in charter)
290 Congress Street
Boston, MA 02210
(Address of principal executive offices) (Zip code)
Daniel J. Beckman
c/o Columbia Management Investment Advisers, LLC
290 Congress Street
Boston, MA 02210
Ryan C. Larrenaga, Esq.
c/o Columbia Management Investment Advisers, LLC
290 Congress Street
Boston, MA 02210
(Name and address of agent for service)
Registrant's telephone number, including area code: (800) 345-6611
Date of fiscal year end: August 31
Date of reporting period: August 31, 2023
Form N-CSR is to be used by management investment companies to file reports with the Commission not later than 10 days after the transmission to stockholders of any report that is required to be transmitted to stockholders under Rule 30e-1 under the Investment Company Act of 1940 (17 CFR 270.30e-1). The Commission may use the information provided on Form N-CSR in its regulatory, disclosure review, inspection, and policymaking roles.
A registrant is required to disclose the information specified by Form N-CSR, and the Commission will make this information public. A registrant is not required to respond to the collection of information contained in Form N-CSR unless the Form displays a currently valid Office of Management and Budget ("OMB") control number. Please direct comments concerning the accuracy of the information collection burden estimate and any suggestions for reducing the burden to Secretary, Securities and Exchange Commission, 100 F Street, NE, Washington, DC 20549. The OMB has reviewed this collection of information under the clearance requirements of 44 U.S.C. § 3507.
Item 1. Reports to Stockholders.

August 31, 2023

| 3 | |
| 6 | |
| 9 | |
| 10 | |
| 16 | |
| 18 | |
| 19 | |
| 22 | |
| 26 | |
| 40 | |
| 41 | |
| 41 | |
| 47 | |
| 48 |
(Unaudited)
| Average annual total returns (%) (for the period ended August 31, 2023) | |||||
| Inception | 1 Year | 5 Years | 10 Years | ||
| Class A | Excluding sales charges | 02/16/06 | 4.40 | 0.02 | 1.89 |
| Including sales charges | -0.57 | -0.95 | 1.39 | ||
| Advisor Class | 03/19/13 | 4.77 | 0.30 | 2.15 | |
| Class C | Excluding sales charges | 02/16/06 | 3.65 | -0.73 | 1.12 |
| Including sales charges | 2.66 | -0.73 | 1.12 | ||
| Institutional Class | 09/27/10 | 4.66 | 0.28 | 2.15 | |
| Institutional 2 Class | 11/08/12 | 4.95 | 0.43 | 2.31 | |
| Institutional 3 Class | 11/08/12 | 4.88 | 0.46 | 2.36 | |
| Class R | 11/16/11 | 4.26 | -0.21 | 1.64 | |
| JPMorgan Emerging Markets Bond Index-Global | 4.96 | 0.84 | 2.80 | ||
| Columbia Emerging Markets Bond Fund | Annual Report 2023 | 3 |
(Unaudited)

| 4 | Columbia Emerging Markets Bond Fund | Annual Report 2023 |
(Unaudited)
| Quality breakdown (%) (at August 31, 2023) | |
| AA rating | 8.6 |
| A rating | 9.3 |
| BBB rating | 30.4 |
| BB rating | 20.4 |
| B rating | 20.2 |
| CCC rating | 3.2 |
| CC rating | 3.7 |
| C rating | 0.1 |
| Not rated | 4.1 |
| Total | 100.0 |
| Country breakdown (%) (at August 31, 2023) | |
| Angola | 1.4 |
| Argentina | 2.0 |
| Azerbaijan | 0.6 |
| Bahrain | 1.8 |
| Brazil | 1.3 |
| Chile | 0.6 |
| China | 0.1 |
| Colombia | 4.7 |
| Croatia | 0.3 |
| Dominican Republic | 2.8 |
| Ecuador | 0.9 |
| Egypt | 2.4 |
| Guatemala | 0.9 |
| Hong Kong | 0.6 |
| Hungary | 1.3 |
| India | 1.5 |
| Indonesia | 5.5 |
| Isle of Man | 0.2 |
| Ivory Coast | 1.3 |
| Jersey | 1.2 |
| Jordan | 0.3 |
| Kazakhstan | 2.2 |
| Malaysia | 0.6 |
| Mexico | 10.5 |
| Mongolia | 0.4 |
| Netherlands | 0.7 |
| Nigeria | 1.1 |
| Oman | 1.3 |
| Pakistan | 0.4 |
| Panama | 2.3 |
| Paraguay | 1.5 |
| Peru | 2.0 |
| Philippines | 1.0 |
| Qatar | 5.0 |
| Romania | 1.3 |
| Russian Federation | 0.7 |
| Saudi Arabia | 6.0 |
| Serbia | 0.3 |
| South Africa | 1.6 |
| Turkey | 4.0 |
| Ukraine | 1.1 |
| United Arab Emirates | 3.3 |
| United Kingdom | 0.5 |
| United States(a) | 17.1 |
| Venezuela | 0.7 |
| Virgin Islands | 2.7 |
| Total | 100.0 |
| (a) | Includes investments in Money Market Funds. |
| Columbia Emerging Markets Bond Fund | Annual Report 2023 | 5 |
(Unaudited)
| • | Underweights to El Salvador and Turkey detracted most from the Fund’s relative results. |
| 6 | Columbia Emerging Markets Bond Fund | Annual Report 2023 |
(Unaudited)
| ○ | Similar factors described above for Venezuela and Ukraine affected the bonds of El Salvador and thus an underweight to its market hurt the Fund. El Salvador’s bond spreads also narrowed during the second half of the period in a rally triggered by hopes a key new adviser to its finance ministry would be able to help secure a debt deal with the International Monetary Fund. |
| ○ | The Turkish bond market rallied after Presidential elections were held there in May 2023. Investors hoped incumbent Erdogan’s main opponent Kilicdaroglu would win, anticipating continuation of Erdogan’s unorthodox approach to monetary policy otherwise, i.e., cutting interest rates to bring inflation down. However, after his victory, Erdogan quickly made some market-friendly cabinet appointments. He also appointed a new central bank governor who already went against prior policy and implemented three interest rate hikes in Turkey to combat inflation. Consequently, Turkish bond spreads rallied, and the Fund’s underweight detracted. |
| • | Overall, duration positioning contributed positively to the Fund’s relative performance, as the Fund maintained a shorter duration than that of the benchmark during a period when U.S. Treasury and other government bond yields rose. |
| • | Security selection overall added significant value. |
| ○ | For example, the Fund had exposure to Studio City, a Macau gaming company, which notably benefited since the lifting of strict COVID-19 restrictions in China. |
| • | Country allocation positioning had a minimal effect on the Fund’s relative results overall but underweights to China and United Arab Emirates and overweights to Venezuela, Macau and Ukraine contributed positively. |
| ○ | Despite a strong rally in the first half of the period given the lifting of its strict zero-COVID policies, Chinese debt assets came under pressure during the second half of the period as a result of persistently negative headlines. Economic growth forecasts for China were downgraded. Also, its property sector came under renewed stress and the response from policymakers in China was underwhelming. |
| ○ | There was a strong rally in distressed and semi-distressed names (i.e., bonds rated CCC and below and those rated B-, respectively) in June 2023, especially in Venezuela and Ukraine. These bonds are generally highly sensitive to tighter financial conditions, vulnerable to rising interest rates and high beta assets that tend to sell off in risk-averse times. This was apparent in March 2023 when market volatility increased following the U.S. regional banking crisis. However, in June, these assets enjoyed significant spread tightening as market sentiment shifted and some improving idiosyncratic stories emerged. For example, there was renewed optimism in Ukraine given some advances in the war. In Venezuela, there were murmurs the U.S. could lift sanctions against the country. |
| ○ | Macau, a tourist destination for those looking to visit casinos in Asia, benefited significantly from China’s reopening and the resulting significant increase in the number of tourist arrivals, flights and hotel bookings. |
| • | Allocations to local rates and currencies contributed positively overall to the Fund’s relative results, with positioning in Indonesia proving especially beneficial. |
| Columbia Emerging Markets Bond Fund | Annual Report 2023 | 7 |
(Unaudited)
| 8 | Columbia Emerging Markets Bond Fund | Annual Report 2023 |
(Unaudited)
| March 1, 2023 — August 31, 2023 | |||||||
| Account value at the beginning of the period ($) | Account value at the end of the period ($) | Expenses paid during the period ($) | Fund’s annualized expense ratio (%) | ||||
| Actual | Hypothetical | Actual | Hypothetical | Actual | Hypothetical | Actual | |
| Class A | 1,000.00 | 1,000.00 | 1,023.60 | 1,019.56 | 5.71 | 5.70 | 1.12 |
| Advisor Class | 1,000.00 | 1,000.00 | 1,024.80 | 1,020.77 | 4.49 | 4.48 | 0.88 |
| Class C | 1,000.00 | 1,000.00 | 1,019.80 | 1,015.78 | 9.52 | 9.50 | 1.87 |
| Institutional Class | 1,000.00 | 1,000.00 | 1,024.80 | 1,020.82 | 4.44 | 4.43 | 0.87 |
| Institutional 2 Class | 1,000.00 | 1,000.00 | 1,025.70 | 1,021.42 | 3.83 | 3.82 | 0.75 |
| Institutional 3 Class | 1,000.00 | 1,000.00 | 1,025.90 | 1,021.68 | 3.57 | 3.57 | 0.70 |
| Class R | 1,000.00 | 1,000.00 | 1,022.30 | 1,018.30 | 6.98 | 6.97 | 1.37 |
| Columbia Emerging Markets Bond Fund | Annual Report 2023 | 9 |
August 31, 2023
| Corporate Bonds & Notes 9.2% | ||||
| Issuer | Coupon Rate | Principal Amount ($) | Value ($) | |
| China 0.1% | ||||
| Country Garden Holdings Co., Ltd.(a),(b) | ||||
| 07/12/2026 | 0.000% | 3,600,000 | 318,033 | |
| Colombia 0.8% | ||||
| Millicom International Cellular SA(a) | ||||
| 01/15/2028 | 5.125% | 1,215,000 | 1,099,508 | |
| 03/25/2029 | 6.250% | 1,260,000 | 1,155,056 | |
| 03/25/2029 | 6.250% | 180,000 | 165,008 | |
| Total | 2,419,572 | |||
| Guatemala 0.6% | ||||
| Energuate Trust(a) | ||||
| 05/03/2027 | 5.875% | 1,300,000 | 1,199,044 | |
| 05/03/2027 | 5.875% | 550,000 | 507,287 | |
| Total | 1,706,331 | |||
| Hong Kong 0.6% | ||||
| Xiaomi Best Time International Ltd.(a) | ||||
| 07/14/2031 | 2.875% | 2,100,000 | 1,594,229 | |
| India 0.3% | ||||
| Adani Electricity Mumbai Ltd.(a) | ||||
| 02/12/2030 | 3.949% | 1,300,000 | 956,071 | |
| Isle of Man 0.2% | ||||
| AngloGold Ashanti Holdings PLC | ||||
| 10/01/2030 | 3.750% | 565,000 | 468,431 | |
| Jersey 1.2% | ||||
| Galaxy Pipeline Assets Bidco Ltd.(a) | ||||
| 03/31/2036 | 2.625% | 1,780,000 | 1,408,888 | |
| 09/30/2040 | 2.940% | 2,532,300 | 1,996,371 | |
| Total | 3,405,259 | |||
| Jordan 0.3% | ||||
| Jordan Government International Bond(a) | ||||
| 01/13/2029 | 7.500% | 722,000 | 730,630 | |
| Netherlands 0.7% | ||||
| Braskem Netherlands Finance BV(a) | ||||
| 01/31/2050 | 5.875% | 2,000,000 | 1,533,596 | |
| Mong Duong Finance Holdings BV(a) | ||||
| 05/07/2029 | 5.125% | 570,000 | 515,689 | |
| Total | 2,049,285 | |||
| Russian Federation 0.3% | ||||
| Phosagro OAO Via Phosagro Bond Funding DAC(a) | ||||
| 09/16/2028 | 2.600% | 1,532,000 | 986,414 | |
| Corporate Bonds & Notes (continued) | ||||
| Issuer | Coupon Rate | Principal Amount ($) | Value ($) | |
| Saudi Arabia 0.4% | ||||
| Greensaif Pipelines Bidco Sarl(a) | ||||
| 02/23/2038 | 6.129% | 1,100,000 | 1,103,687 | |
| United Kingdom 0.5% | ||||
| Tullow Oil PLC(a) | ||||
| 03/01/2025 | 7.000% | 2,200,000 | 1,522,442 | |
| United States 0.5% | ||||
| Sasol Financing USA LLC | ||||
| 03/18/2031 | 5.500% | 1,800,000 | 1,437,630 | |
| Virgin Islands 2.7% | ||||
| JGSH Philippines Ltd.(a) | ||||
| 07/09/2030 | 4.125% | 6,100,000 | 5,536,924 | |
| Studio City Finance Ltd.(a) | ||||
| 01/15/2029 | 5.000% | 2,900,000 | 2,180,335 | |
| Total | 7,717,259 | |||
| Total Corporate Bonds & Notes (Cost $30,082,954) | 26,415,273 | |||
| Foreign Government Obligations(c),(d) 72.7% | ||||
| Angola 1.4% | ||||
| Angolan Government International Bond(a) | ||||
| 11/26/2029 | 8.000% | 3,600,000 | 2,975,398 | |
| 05/08/2048 | 9.375% | 1,300,000 | 991,307 | |
| Total | 3,966,705 | |||
| Argentina 2.0% | ||||
| Argentine Republic Government International Bond(e) | ||||
| 07/09/2035 | 3.625% | 18,700,000 | 5,521,930 | |
| 07/09/2046 | 3.625% | 610,000 | 181,522 | |
| Total | 5,703,452 | |||
| Azerbaijan 0.6% | ||||
| Republic of Azerbaijan International Bond(a) | ||||
| 09/01/2032 | 3.500% | 2,000,000 | 1,679,524 | |
| Bahrain 1.8% | ||||
| Bahrain Government International Bond(a) | ||||
| 05/18/2034 | 5.625% | 3,100,000 | 2,724,995 | |
| CBB International Sukuk Programme Co. WLL(a) | ||||
| 05/18/2029 | 3.875% | 2,707,000 | 2,411,578 | |
| Total | 5,136,573 | |||
| 10 | Columbia Emerging Markets Bond Fund | Annual Report 2023 |
August 31, 2023
| Foreign Government Obligations(c),(d) (continued) | ||||
| Issuer | Coupon Rate | Principal Amount ($) | Value ($) | |
| Brazil 1.3% | ||||
| Brazilian Government International Bond | ||||
| 06/12/2030 | 3.875% | 2,833,000 | 2,509,091 | |
| 01/27/2045 | 5.000% | 1,600,000 | 1,245,809 | |
| Total | 3,754,900 | |||
| Chile 0.6% | ||||
| Chile Government International Bond | ||||
| 01/25/2050 | 3.500% | 1,500,000 | 1,088,928 | |
| Empresa Nacional del Petroleo(a) | ||||
| 05/10/2033 | 6.150% | 613,000 | 604,835 | |
| Total | 1,693,763 | |||
| Colombia 3.8% | ||||
| Colombia Government International Bond | ||||
| 01/30/2030 | 3.000% | 6,600,000 | 5,246,165 | |
| 04/15/2031 | 3.125% | 5,675,000 | 4,375,266 | |
| 04/22/2032 | 3.250% | 1,652,000 | 1,238,395 | |
| Total | 10,859,826 | |||
| Croatia 0.3% | ||||
| Croatia Government International Bond(a) | ||||
| 01/26/2024 | 6.000% | 767,000 | 765,433 | |
| Dominican Republic 2.7% | ||||
| Dominican Republic International Bond(a) | ||||
| 01/30/2030 | 4.500% | 2,489,000 | 2,169,201 | |
| 09/23/2032 | 4.875% | 3,428,000 | 2,906,216 | |
| 04/30/2044 | 7.450% | 1,714,000 | 1,649,545 | |
| 06/05/2049 | 6.400% | 1,300,000 | 1,089,467 | |
| Total | 7,814,429 | |||
| Ecuador 0.9% | ||||
| Ecuador Government International Bond(a),(e) | ||||
| 07/31/2030 | 6.000% | 3,500,000 | 1,711,523 | |
| 07/31/2035 | 3.500% | 630,416 | 234,205 | |
| 07/31/2040 | 2.500% | 1,899,850 | 629,829 | |
| Total | 2,575,557 | |||
| Egypt 2.4% | ||||
| Egypt Government International Bond(a) | ||||
| 04/16/2030 | 5.625% | EUR | 2,200,000 | 1,308,152 |
| 04/11/2031 | 6.375% | EUR | 1,700,000 | 1,012,563 |
| 05/29/2032 | 7.625% | 2,500,000 | 1,434,675 | |
| 09/30/2033 | 7.300% | 3,600,000 | 1,980,193 | |
| 02/21/2048 | 7.903% | 2,200,000 | 1,116,343 | |
| Total | 6,851,926 | |||
| Foreign Government Obligations(c),(d) (continued) | ||||
| Issuer | Coupon Rate | Principal Amount ($) | Value ($) | |
| Guatemala 0.3% | ||||
| Guatemala Government Bond(a) | ||||
| 10/07/2033 | 3.700% | 792,000 | 638,797 | |
| 06/01/2050 | 6.125% | 357,000 | 325,215 | |
| Total | 964,012 | |||
| Hungary 1.2% | ||||
| Hungary Government International Bond(a) | ||||
| 09/22/2031 | 2.125% | 1,950,000 | 1,499,725 | |
| 09/21/2051 | 3.125% | 2,700,000 | 1,629,141 | |
| 09/25/2052 | 6.750% | 457,000 | 463,628 | |
| Total | 3,592,494 | |||
| India 1.2% | ||||
| Export-Import Bank of India(a) | ||||
| 01/15/2030 | 3.250% | 3,900,000 | 3,390,826 | |
| Indonesia 5.4% | ||||
| Indonesia Asahan Aluminium Persero PT(a) | ||||
| 05/15/2050 | 5.800% | 4,400,000 | 3,773,481 | |
| Indonesia Government International Bond(a) | ||||
| 01/15/2045 | 5.125% | 2,300,000 | 2,228,886 | |
| Indonesia Government International Bond | ||||
| 10/30/2049 | 3.700% | 4,100,000 | 3,129,801 | |
| 03/31/2052 | 4.300% | 555,000 | 463,241 | |
| Indonesia Treasury Bond | ||||
| 04/15/2032 | 6.375% | IDR | 50,550,000,000 | 3,315,466 |
| Perusahaan Penerbit SBSN Indonesia III(a) | ||||
| 06/23/2025 | 2.300% | 1,145,000 | 1,080,568 | |
| Perusahaan Perseroan Persero PT Perusahaan Listrik Negara(a) | ||||
| 06/30/2050 | 4.000% | 500,000 | 349,602 | |
| PT Perusahaan Listrik Negara(a) | ||||
| 07/17/2049 | 4.875% | 1,500,000 | 1,195,193 | |
| Total | 15,536,238 | |||
| Ivory Coast 1.3% | ||||
| Ivory Coast Government International Bond(a) | ||||
| 10/17/2031 | 5.875% | EUR | 3,440,000 | 3,115,009 |
| 06/15/2033 | 6.125% | 700,000 | 598,810 | |
| Total | 3,713,819 | |||
| Kazakhstan 2.2% | ||||
| KazMunayGas National Co. JSC(a) | ||||
| 04/19/2027 | 4.750% | 2,200,000 | 2,069,696 | |
| 04/24/2030 | 5.375% | 3,800,000 | 3,461,013 | |
| 04/19/2047 | 5.750% | 1,018,000 | 817,284 | |
| Total | 6,347,993 | |||
| Columbia Emerging Markets Bond Fund | Annual Report 2023 | 11 |
August 31, 2023
| Foreign Government Obligations(c),(d) (continued) | ||||
| Issuer | Coupon Rate | Principal Amount ($) | Value ($) | |
| Malaysia 0.6% | ||||
| Petronas Capital Ltd.(a) | ||||
| 04/21/2030 | 3.500% | 1,795,000 | 1,631,847 | |
| Mexico 10.3% | ||||
| Comision Federal de Electricidad(a) | ||||
| 07/26/2033 | 3.875% | 4,100,000 | 3,188,937 | |
| Mexican Bonos | ||||
| 05/31/2029 | 8.500% | MXN | 61,500,000 | 3,468,773 |
| Mexico Government International Bond | ||||
| 04/16/2030 | 3.250% | 5,250,000 | 4,648,438 | |
| 01/15/2047 | 4.350% | 1,800,000 | 1,403,118 | |
| 02/10/2048 | 4.600% | 1,600,000 | 1,284,923 | |
| Petroleos Mexicanos | ||||
| 11/12/2026 | 7.470% | MXN | 50,100,000 | 2,479,216 |
| 01/28/2031 | 5.950% | 5,000,000 | 3,631,236 | |
| 02/16/2032 | 6.700% | 5,590,000 | 4,227,739 | |
| 01/23/2045 | 6.375% | 4,800,000 | 2,910,919 | |
| 01/23/2050 | 7.690% | 2,700,000 | 1,806,459 | |
| Petroleos Mexicanos(a) | ||||
| 02/07/2033 | 10.000% | 898,000 | 813,361 | |
| Total | 29,863,119 | |||
| Mongolia 0.4% | ||||
| Mongolia Government International Bond(a) | ||||
| 01/19/2028 | 8.650% | 340,000 | 340,449 | |
| 07/07/2031 | 4.450% | 1,100,000 | 853,070 | |
| Total | 1,193,519 | |||
| Nigeria 1.0% | ||||
| Nigeria Government International Bond(a) | ||||
| 09/28/2028 | 6.125% | 1,100,000 | 908,629 | |
| 09/28/2033 | 7.375% | 1,600,000 | 1,224,175 | |
| 11/28/2047 | 7.625% | 1,300,000 | 895,788 | |
| Total | 3,028,592 | |||
| Oman 1.3% | ||||
| Oman Government International Bond(a) | ||||
| 01/25/2031 | 6.250% | 1,339,000 | 1,354,428 | |
| 01/17/2048 | 6.750% | 2,400,000 | 2,324,416 | |
| Total | 3,678,844 | |||
| Pakistan 0.4% | ||||
| Pakistan Government International Bond(a) | ||||
| 09/30/2025 | 8.250% | 419,000 | 255,668 | |
| 12/05/2027 | 6.875% | 1,000,000 | 505,284 | |
| 04/08/2031 | 7.375% | 1,078,000 | 495,973 | |
| Total | 1,256,925 | |||
| Foreign Government Obligations(c),(d) (continued) | ||||
| Issuer | Coupon Rate | Principal Amount ($) | Value ($) | |
| Panama 2.3% | ||||
| Panama Government International Bond | ||||
| 03/16/2025 | 3.750% | 900,000 | 872,211 | |
| 09/29/2032 | 2.252% | 2,200,000 | 1,670,477 | |
| 01/19/2033 | 3.298% | 2,186,000 | 1,800,141 | |
| 02/14/2035 | 6.400% | 919,000 | 943,804 | |
| 01/19/2063 | 4.500% | 1,783,000 | 1,274,459 | |
| Total | 6,561,092 | |||
| Paraguay 1.4% | ||||
| Paraguay Government International Bond(a) | ||||
| 08/11/2044 | 6.100% | 3,700,000 | 3,426,074 | |
| 03/30/2050 | 5.400% | 925,000 | 773,366 | |
| Total | 4,199,440 | |||
| Peru 1.9% | ||||
| Peruvian Government International Bond | ||||
| 01/15/2034 | 3.000% | 2,625,000 | 2,132,533 | |
| 11/18/2050 | 5.625% | 3,462,000 | 3,446,292 | |
| Total | 5,578,825 | |||
| Philippines 1.0% | ||||
| Philippine Government International Bond | ||||
| 07/06/2046 | 3.200% | 4,100,000 | 2,915,498 | |
| Qatar 4.9% | ||||
| Ooredoo International Finance Ltd.(a) | ||||
| 04/08/2031 | 2.625% | 1,063,000 | 903,096 | |
| Qatar Government International Bond(a) | ||||
| 04/23/2028 | 4.500% | 700,000 | 693,540 | |
| 03/14/2029 | 4.000% | 4,700,000 | 4,541,137 | |
| 04/23/2048 | 5.103% | 2,350,000 | 2,256,195 | |
| 03/14/2049 | 4.817% | 2,550,000 | 2,377,975 | |
| 04/16/2050 | 4.400% | 1,276,000 | 1,123,671 | |
| Qatar Petroleum(a) | ||||
| 07/12/2031 | 2.250% | 2,763,000 | 2,273,079 | |
| Total | 14,168,693 | |||
| Romania 1.3% | ||||
| Romanian Government International Bond(a) | ||||
| 02/27/2027 | 3.000% | 2,284,000 | 2,090,455 | |
| 02/14/2051 | 4.000% | 2,400,000 | 1,641,365 | |
| Total | 3,731,820 | |||
| Russian Federation 0.3% | ||||
| Gazprom PJSC via Gaz Finance PLC(a),(f) | ||||
| 02/25/2030 | 3.250% | 1,383,000 | 860,143 | |
| Saudi Arabia 5.5% | ||||
| Gaci First Investment Co.(a) | ||||
| 02/14/2053 | 5.125% | 4,200,000 | 3,630,436 | |
| 12 | Columbia Emerging Markets Bond Fund | Annual Report 2023 |
August 31, 2023
| Foreign Government Obligations(c),(d) (continued) | ||||
| Issuer | Coupon Rate | Principal Amount ($) | Value ($) | |
| KSA Sukuk Ltd.(a) | ||||
| 10/29/2029 | 2.969% | 1,400,000 | 1,256,715 | |
| Saudi Arabian Oil Co.(a) | ||||
| 11/24/2030 | 2.250% | 3,200,000 | 2,631,241 | |
| Saudi Government International Bond(a) | ||||
| 07/18/2033 | 4.875% | 1,596,000 | 1,573,388 | |
| 01/21/2055 | 3.750% | 3,950,000 | 2,829,392 | |
| 01/21/2055 | 3.750% | 2,200,000 | 1,575,864 | |
| 02/02/2061 | 3.450% | 3,500,000 | 2,323,815 | |
| Total | 15,820,851 | |||
| Serbia 0.2% | ||||
| Serbia International Bond(a) | ||||
| 12/01/2030 | 2.125% | 965,000 | 735,112 | |
| South Africa 1.6% | ||||
| Eskom Holdings SOC Ltd.(a) | ||||
| 02/11/2025 | 7.125% | 2,300,000 | 2,268,217 | |
| Republic of South Africa Government International Bond | ||||
| 09/30/2049 | 5.750% | 2,100,000 | 1,482,738 | |
| 04/20/2052 | 7.300% | 1,000,000 | 841,934 | |
| Total | 4,592,889 | |||
| Turkey 3.9% | ||||
| Turkey Government International Bond | ||||
| 04/14/2026 | 4.250% | 1,350,000 | 1,245,504 | |
| 03/25/2027 | 6.000% | 2,000,000 | 1,885,831 | |
| 02/17/2028 | 5.125% | 4,900,000 | 4,400,211 | |
| 03/14/2029 | 9.375% | 800,000 | 829,973 | |
| 04/26/2029 | 7.625% | 2,400,000 | 2,337,521 | |
| 05/30/2040 | 6.750% | 760,000 | 634,487 | |
| Total | 11,333,527 | |||
| Ukraine 1.0% | ||||
| Ukraine Government International Bond(a) | ||||
| 09/01/2028 | 7.750% | 7,000,000 | 2,007,779 | |
| 05/21/2031 | 6.876% | 3,810,000 | 1,005,351 | |
| Total | 3,013,130 | |||
| United Arab Emirates 3.3% | ||||
| Abu Dhabi Government International Bond(a) | ||||
| 09/30/2049 | 3.125% | 2,500,000 | 1,753,316 | |
| 04/16/2050 | 3.875% | 385,000 | 310,153 | |
| Foreign Government Obligations(c),(d) (continued) | ||||
| Issuer | Coupon Rate | Principal Amount ($) | Value ($) | |
| Abu Dhabi Ports Co. PJSC(a) | ||||
| 05/06/2031 | 2.500% | 1,800,000 | 1,497,821 | |
| DP World Ltd.(a) | ||||
| 09/25/2048 | 5.625% | 500,000 | 461,344 | |
| DP World PLC(a) | ||||
| 07/02/2037 | 6.850% | 3,600,000 | 3,856,071 | |
| MDGH GMTN (RSC), Ltd.(a) | ||||
| 04/28/2033 | 5.500% | 1,292,000 | 1,332,572 | |
| MDGH GMTN RSC Ltd.(a) | ||||
| 05/22/2053 | 5.084% | 205,000 | 194,131 | |
| Total | 9,405,408 | |||
| Venezuela 0.7% | ||||
| Petroleos de Venezuela SA(a),(b) | ||||
| 05/16/2024 | 0.000% | 22,627,059 | 1,358,538 | |
| Venezuela Government International Bond(a),(b) | ||||
| 10/13/2024 | 0.000% | 7,500,000 | 718,290 | |
| Total | 2,076,828 | |||
| Total Foreign Government Obligations (Cost $269,931,754) | 209,993,572 | |||
| Money Market Funds 16.3% | ||
| Shares | Value ($) | |
| Columbia Short-Term Cash Fund, 5.476%(g),(h) | 47,096,907 | 47,082,778 |
| Total Money Market Funds (Cost $47,079,031) | 47,082,778 | |
| Total Investments in Securities (Cost $347,093,739) | 283,491,623 | |
| Other Assets & Liabilities, Net | 5,302,490 | |
| Net Assets | $288,794,113 | |
| Columbia Emerging Markets Bond Fund | Annual Report 2023 | 13 |
August 31, 2023
| Forward foreign currency exchange contracts | |||||
| Currency to be sold | Currency to be purchased | Counterparty | Settlement date | Unrealized appreciation ($) | Unrealized depreciation ($) |
| 6,223,060 EUR | 6,819,166 USD | Citi | 09/22/2023 | 65,655 | — |
| 200,603 USD | 3,372,800 MXN | Goldman Sachs International | 09/22/2023 | — | (3,382) |
| 913,783 USD | 836,057 EUR | HSBC | 09/22/2023 | — | (6,460) |
| 108,000,000 MXN | 6,267,046 USD | Wells Fargo | 09/22/2023 | — | (48,129) |
| Total | 65,655 | (57,971) | |||
| (a) | Represents privately placed and other securities and instruments exempt from Securities and Exchange Commission registration (collectively, private placements), such as Section 4(a)(2) and Rule 144A eligible securities, which are often sold only to qualified institutional buyers. At August 31, 2023, the total value of these securities amounted to $151,612,735, which represents 52.50% of total net assets. |
| (b) | Represents a security in default. |
| (c) | Principal amounts are denominated in United States Dollars unless otherwise noted. |
| (d) | Principal and interest may not be guaranteed by a governmental entity. |
| (e) | Represents a variable rate security with a step coupon where the rate adjusts according to a schedule for a series of periods, typically lower for an initial period and then increasing to a higher coupon rate thereafter. The interest rate shown was the current rate as of August 31, 2023. |
| (f) | As a result of sanctions and restricted cross-border payments, certain income and/or principal has not been recognized by the Fund. The Fund will continue to monitor the net realizable value and record the income when it is considered collectible. |
| (g) | The rate shown is the seven-day current annualized yield at August 31, 2023. |
| (h) | As defined in the Investment Company Act of 1940, as amended, an affiliated company is one in which the Fund owns 5% or more of the company’s outstanding voting securities, or a company which is under common ownership or control with the Fund. The value of the holdings and transactions in these affiliated companies during the year ended August 31, 2023 are as follows: |
| Affiliated issuers | Beginning of period($) | Purchases($) | Sales($) | Net change in unrealized appreciation (depreciation)($) | End of period($) | Realized gain (loss)($) | Dividends($) | End of period shares |
| Columbia Short-Term Cash Fund, 5.476% | ||||||||
| 38,514,208 | 99,501,847 | (90,938,056) | 4,779 | 47,082,778 | 7,157 | 1,438,673 | 47,096,907 | |
| EUR | Euro |
| IDR | Indonesian Rupiah |
| MXN | Mexican Peso |
| USD | US Dollar |
| ■ | Level 1 — Valuations based on quoted prices for investments in active markets that the Fund has the ability to access at the measurement date. Valuation adjustments are not applied to Level 1 investments. |
| ■ | Level 2 — Valuations based on other significant observable inputs (including quoted prices for similar securities, interest rates, prepayment speeds, credit risks, etc.). |
| ■ | Level 3 — Valuations based on significant unobservable inputs (including the Fund’s own assumptions and judgment in determining the fair value of investments). |
| 14 | Columbia Emerging Markets Bond Fund | Annual Report 2023 |
August 31, 2023
Inputs that are used in determining fair value of an investment may include price information, credit data, volatility statistics, and other factors. These inputs can be either observable or unobservable. The availability of observable inputs can vary between investments, and is affected by various factors such as the type of investment, and the volume and level of activity for that investment or similar investments in the marketplace. The inputs will be considered by the Investment Manager, along with any other relevant factors in the calculation of an investment’s fair value. The Fund uses prices and inputs that are current as of the measurement date, which may include periods of market dislocations. During these periods, the availability of prices and inputs may be reduced for many investments. This condition could cause an investment to be reclassified between the various levels within the hierarchy.
| Level 1 ($) | Level 2 ($) | Level 3 ($) | Total ($) | |
| Investments in Securities | ||||
| Corporate Bonds & Notes | — | 26,415,273 | — | 26,415,273 |
| Foreign Government Obligations | — | 209,993,572 | — | 209,993,572 |
| Money Market Funds | 47,082,778 | — | — | 47,082,778 |
| Total Investments in Securities | 47,082,778 | 236,408,845 | — | 283,491,623 |
| Investments in Derivatives | ||||
| Asset | ||||
| Forward Foreign Currency Exchange Contracts | — | 65,655 | — | 65,655 |
| Liability | ||||
| Forward Foreign Currency Exchange Contracts | — | (57,971) | — | (57,971) |
| Total | 47,082,778 | 236,416,529 | — | 283,499,307 |
| Columbia Emerging Markets Bond Fund | Annual Report 2023 | 15 |
August 31, 2023
| Assets | |
| Investments in securities, at value | |
| Unaffiliated issuers (cost $300,014,708) | $236,408,845 |
| Affiliated issuers (cost $47,079,031) | 47,082,778 |
| Cash | 45,766 |
| Foreign currency (cost $1,500) | 1,459 |
| Unrealized appreciation on forward foreign currency exchange contracts | 65,655 |
| Receivable for: | |
| Investments sold | 1,380,869 |
| Capital shares sold | 458,424 |
| Dividends | 212,819 |
| Interest | 3,492,145 |
| Foreign tax reclaims | 8,036 |
| Prepaid expenses | 8,218 |
| Total assets | 289,165,014 |
| Liabilities | |
| Unrealized depreciation on forward foreign currency exchange contracts | 57,971 |
| Payable for: | |
| Capital shares redeemed | 173,444 |
| Foreign capital gains taxes deferred | 2,284 |
| Management services fees | 4,747 |
| Distribution and/or service fees | 415 |
| Transfer agent fees | 18,968 |
| Trustees’ fees | 83,593 |
| Other expenses | 29,479 |
| Total liabilities | 370,901 |
| Net assets applicable to outstanding capital stock | $288,794,113 |
| Represented by | |
| Paid in capital | 407,194,994 |
| Total distributable earnings (loss) | (118,400,881) |
| Total - representing net assets applicable to outstanding capital stock | $288,794,113 |
| 16 | Columbia Emerging Markets Bond Fund | Annual Report 2023 |
August 31, 2023
| Class A | |
| Net assets | $27,469,269 |
| Shares outstanding | 3,069,062 |
| Net asset value per share | $8.95 |
| Maximum sales charge | 4.75% |
| Maximum offering price per share (calculated by dividing the net asset value per share by 1.0 minus the maximum sales charge for Class A shares) | $9.40 |
| Advisor Class | |
| Net assets | $1,587,185 |
| Shares outstanding | 176,958 |
| Net asset value per share | $8.97 |
| Class C | |
| Net assets | $1,179,666 |
| Shares outstanding | 132,811 |
| Net asset value per share | $8.88 |
| Institutional Class | |
| Net assets | $32,917,518 |
| Shares outstanding | 3,673,154 |
| Net asset value per share | $8.96 |
| Institutional 2 Class | |
| Net assets | $41,340,736 |
| Shares outstanding | 4,615,085 |
| Net asset value per share | $8.96 |
| Institutional 3 Class | |
| Net assets | $170,183,183 |
| Shares outstanding | 18,990,345 |
| Net asset value per share | $8.96 |
| Class R | |
| Net assets | $14,116,556 |
| Shares outstanding | 1,577,765 |
| Net asset value per share | $8.95 |
| Columbia Emerging Markets Bond Fund | Annual Report 2023 | 17 |
Year Ended August 31, 2023
| Net investment income | |
| Income: | |
| Dividends — affiliated issuers | $1,438,673 |
| Interest | 15,793,794 |
| Interfund lending | 1,017 |
| Foreign taxes withheld | (29,712) |
| Total income | 17,203,772 |
| Expenses: | |
| Management services fees | 1,737,596 |
| Distribution and/or service fees | |
| Class A | 70,539 |
| Class C | 15,088 |
| Class R | 72,106 |
| Transfer agent fees | |
| Class A | 57,515 |
| Advisor Class | 2,651 |
| Class C | 3,114 |
| Institutional Class | 75,982 |
| Institutional 2 Class | 24,420 |
| Institutional 3 Class | 10,970 |
| Class R | 29,403 |
| Trustees’ fees | 26,472 |
| Custodian fees | 30,988 |
| Printing and postage fees | 22,860 |
| Registration fees | 107,640 |
| Accounting services fees | 38,360 |
| Legal fees | 15,589 |
| Compensation of chief compliance officer | 57 |
| Other | 16,896 |
| Total expenses | 2,358,246 |
| Fees waived or expenses reimbursed by Investment Manager and its affiliates | (551) |
| Fees waived by transfer agent | |
| Institutional 2 Class | (1,673) |
| Total net expenses | 2,356,022 |
| Net investment income | 14,847,750 |
| Realized and unrealized gain (loss) — net | |
| Net realized gain (loss) on: | |
| Investments — unaffiliated issuers | (15,148,189) |
| Investments — affiliated issuers | 7,157 |
| Foreign currency translations | 62,460 |
| Forward foreign currency exchange contracts | (1,724,152) |
| Net realized loss | (16,802,724) |
| Net change in unrealized appreciation (depreciation) on: | |
| Investments — unaffiliated issuers | 15,258,045 |
| Investments — affiliated issuers | 4,779 |
| Foreign currency translations | 18,986 |
| Forward foreign currency exchange contracts | 42,559 |
| Foreign capital gains tax | (2,284) |
| Net change in unrealized appreciation (depreciation) | 15,322,085 |
| Net realized and unrealized loss | (1,480,639) |
| Net increase in net assets resulting from operations | $13,367,111 |
| 18 | Columbia Emerging Markets Bond Fund | Annual Report 2023 |
| Year Ended August 31, 2023 | Year Ended August 31, 2022 | |
| Operations | ||
| Net investment income | $14,847,750 | $13,436,396 |
| Net realized loss | (16,802,724) | (9,246,253) |
| Net change in unrealized appreciation (depreciation) | 15,322,085 | (77,828,822) |
| Net increase (decrease) in net assets resulting from operations | 13,367,111 | (73,638,679) |
| Distributions to shareholders | ||
| Net investment income and net realized gains | ||
| Class A | (1,368,336) | (1,326,434) |
| Advisor Class | (65,338) | (94,669) |
| Class C | (61,294) | (84,422) |
| Institutional Class | (1,880,246) | (1,881,366) |
| Institutional 2 Class | (2,083,914) | (1,860,774) |
| Institutional 3 Class | (8,880,547) | (7,168,624) |
| Class R | (662,314) | (617,895) |
| Total distributions to shareholders | (15,001,989) | (13,034,184) |
| Increase (decrease) in net assets from capital stock activity | (10,576,915) | 26,080,715 |
| Total decrease in net assets | (12,211,793) | (60,592,148) |
| Net assets at beginning of year | 301,005,906 | 361,598,054 |
| Net assets at end of year | $288,794,113 | $301,005,906 |
| Columbia Emerging Markets Bond Fund | Annual Report 2023 | 19 |
| Year Ended | Year Ended | |||
| August 31, 2023 | August 31, 2022 | |||
| Shares | Dollars ($) | Shares | Dollars ($) | |
| Capital stock activity | ||||
| Class A | ||||
| Shares sold | 1,017,525 | 9,006,889 | 656,294 | 6,426,256 |
| Distributions reinvested | 149,076 | 1,322,316 | 124,289 | 1,274,044 |
| Shares redeemed | (1,473,922) | (13,067,425) | (1,194,245) | (11,877,927) |
| Net decrease | (307,321) | (2,738,220) | (413,662) | (4,177,627) |
| Advisor Class | ||||
| Shares sold | 85,117 | 766,368 | 28,096 | 302,300 |
| Distributions reinvested | 7,371 | 65,338 | 9,167 | 94,669 |
| Shares redeemed | (109,203) | (963,309) | (117,546) | (1,204,654) |
| Net decrease | (16,715) | (131,603) | (80,283) | (807,685) |
| Class C | ||||
| Shares sold | 19,757 | 176,605 | 7,772 | 75,381 |
| Distributions reinvested | 6,968 | 61,294 | 8,156 | 84,422 |
| Shares redeemed | (97,127) | (853,186) | (192,022) | (1,954,058) |
| Net decrease | (70,402) | (615,287) | (176,094) | (1,794,255) |
| Institutional Class | ||||
| Shares sold | 761,782 | 6,813,623 | 2,789,462 | 30,371,586 |
| Distributions reinvested | 210,377 | 1,867,335 | 183,527 | 1,868,569 |
| Shares redeemed | (1,897,677) | (16,915,498) | (2,247,081) | (22,507,461) |
| Net increase (decrease) | (925,518) | (8,234,540) | 725,908 | 9,732,694 |
| Institutional 2 Class | ||||
| Shares sold | 993,748 | 8,886,440 | 1,162,439 | 11,724,986 |
| Distributions reinvested | 234,524 | 2,082,197 | 181,616 | 1,859,313 |
| Shares redeemed | (1,165,687) | (10,336,921) | (1,418,767) | (14,025,890) |
| Net increase (decrease) | 62,585 | 631,716 | (74,712) | (441,591) |
| Institutional 3 Class | ||||
| Shares sold | 621,049 | 5,554,093 | 2,690,582 | 27,564,102 |
| Distributions reinvested | 999,451 | 8,880,308 | 704,745 | 7,168,606 |
| Shares redeemed | (1,400,138) | (12,521,452) | (1,014,916) | (10,086,443) |
| Net increase | 220,362 | 1,912,949 | 2,380,411 | 24,646,265 |
| Class R | ||||
| Shares sold | 78,465 | 702,673 | 111,185 | 1,194,470 |
| Distributions reinvested | 74,700 | 662,272 | 60,171 | 615,880 |
| Shares redeemed | (312,358) | (2,766,875) | (283,526) | (2,887,436) |
| Net decrease | (159,193) | (1,401,930) | (112,170) | (1,077,086) |
| Total net increase (decrease) | (1,196,202) | (10,576,915) | 2,249,398 | 26,080,715 |
| 20 | Columbia Emerging Markets Bond Fund | Annual Report 2023 |
| Net asset value, beginning of period | Net investment income | Net realized and unrealized gain (loss) | Total from investment operations | Distributions from net investment income | Total distributions to shareholders | |
| Class A | ||||||
| Year Ended 8/31/2023 | $9.00 | 0.43 | (0.05) | 0.38 | (0.43) | (0.43) |
| Year Ended 8/31/2022 | $11.59 | 0.37 | (2.59) | (2.22) | (0.37) | (0.37) |
| Year Ended 8/31/2021 | $11.31 | 0.40 | 0.20 | 0.60 | (0.32) | (0.32) |
| Year Ended 8/31/2020 | $11.29 | 0.45 | (0.08) | 0.37 | (0.35) | (0.35) |
| Year Ended 8/31/2019 | $10.74 | 0.59 | 0.39 | 0.98 | (0.43) | (0.43) |
| Advisor Class | ||||||
| Year Ended 8/31/2023 | $9.01 | 0.45 | (0.03) | 0.42 | (0.46) | (0.46) |
| Year Ended 8/31/2022 | $11.61 | 0.40 | (2.61) | (2.21) | (0.39) | (0.39) |
| Year Ended 8/31/2021 | $11.33 | 0.43 | 0.20 | 0.63 | (0.35) | (0.35) |
| Year Ended 8/31/2020 | $11.31 | 0.51 | (0.11) | 0.40 | (0.38) | (0.38) |
| Year Ended 8/31/2019 | $10.75 | 0.61 | 0.41 | 1.02 | (0.46) | (0.46) |
| Class C | ||||||
| Year Ended 8/31/2023 | $8.93 | 0.36 | (0.04) | 0.32 | (0.37) | (0.37) |
| Year Ended 8/31/2022 | $11.51 | 0.30 | (2.59) | (2.29) | (0.29) | (0.29) |
| Year Ended 8/31/2021 | $11.23 | 0.31 | 0.21 | 0.52 | (0.24) | (0.24) |
| Year Ended 8/31/2020 | $11.22 | 0.37 | (0.09) | 0.28 | (0.27) | (0.27) |
| Year Ended 8/31/2019 | $10.67 | 0.51 | 0.39 | 0.90 | (0.35) | (0.35) |
| Institutional Class | ||||||
| Year Ended 8/31/2023 | $9.01 | 0.45 | (0.04) | 0.41 | (0.46) | (0.46) |
| Year Ended 8/31/2022 | $11.60 | 0.40 | (2.60) | (2.20) | (0.39) | (0.39) |
| Year Ended 8/31/2021 | $11.32 | 0.43 | 0.20 | 0.63 | (0.35) | (0.35) |
| Year Ended 8/31/2020 | $11.30 | 0.49 | (0.09) | 0.40 | (0.38) | (0.38) |
| Year Ended 8/31/2019 | $10.75 | 0.62 | 0.39 | 1.01 | (0.46) | (0.46) |
| Institutional 2 Class | ||||||
| Year Ended 8/31/2023 | $9.00 | 0.46 | (0.03) | 0.43 | (0.47) | (0.47) |
| Year Ended 8/31/2022 | $11.60 | 0.41 | (2.61) | (2.20) | (0.40) | (0.40) |
| Year Ended 8/31/2021 | $11.31 | 0.44 | 0.22 | 0.66 | (0.37) | (0.37) |
| Year Ended 8/31/2020 | $11.30 | 0.49 | (0.09) | 0.40 | (0.39) | (0.39) |
| Year Ended 8/31/2019 | $10.74 | 0.63 | 0.40 | 1.03 | (0.47) | (0.47) |
| 22 | Columbia Emerging Markets Bond Fund | Annual Report 2023 |
| Net asset value, end of period | Total return | Total gross expense ratio to average net assets(a) | Total net expense ratio to average net assets(a),(b) | Net investment income ratio to average net assets | Portfolio turnover | Net assets, end of period (000’s) | |
| Class A | |||||||
| Year Ended 8/31/2023 | $8.95 | 4.40% | 1.14% | 1.14% | 4.79% | 22% | $27,469 |
| Year Ended 8/31/2022 | $9.00 | (19.53%) | 1.12% | 1.12% | 3.65% | 28% | $30,371 |
| Year Ended 8/31/2021 | $11.59 | 5.42% | 1.12% | 1.12%(c) | 3.49% | 56% | $43,920 |
| Year Ended 8/31/2020 | $11.31 | 3.40% | 1.11%(d) | 1.11%(d) | 4.13% | 175% | $46,632 |
| Year Ended 8/31/2019 | $11.29 | 9.33% | 1.11%(d) | 1.11%(d) | 5.40% | 106% | $54,778 |
| Advisor Class | |||||||
| Year Ended 8/31/2023 | $8.97 | 4.77% | 0.89% | 0.89% | 5.07% | 22% | $1,587 |
| Year Ended 8/31/2022 | $9.01 | (19.38%) | 0.87% | 0.87% | 3.88% | 28% | $1,745 |
| Year Ended 8/31/2021 | $11.61 | 5.67% | 0.87% | 0.87%(c) | 3.75% | 56% | $3,180 |
| Year Ended 8/31/2020 | $11.33 | 3.65% | 0.85%(d) | 0.85%(d) | 4.51% | 175% | $4,799 |
| Year Ended 8/31/2019 | $11.31 | 9.69% | 0.86%(d) | 0.86%(d) | 5.51% | 106% | $20,141 |
| Class C | |||||||
| Year Ended 8/31/2023 | $8.88 | 3.65% | 1.89% | 1.89% | 4.04% | 22% | $1,180 |
| Year Ended 8/31/2022 | $8.93 | (20.19%) | 1.87% | 1.87% | 2.86% | 28% | $1,815 |
| Year Ended 8/31/2021 | $11.51 | 4.66% | 1.87% | 1.87%(c) | 2.76% | 56% | $4,365 |
| Year Ended 8/31/2020 | $11.23 | 2.55% | 1.86%(d) | 1.86%(d) | 3.39% | 175% | $8,881 |
| Year Ended 8/31/2019 | $11.22 | 8.57% | 1.86%(d) | 1.86%(d) | 4.66% | 106% | $13,374 |
| Institutional Class | |||||||
| Year Ended 8/31/2023 | $8.96 | 4.66% | 0.89% | 0.89% | 5.04% | 22% | $32,918 |
| Year Ended 8/31/2022 | $9.01 | (19.31%) | 0.87% | 0.87% | 3.91% | 28% | $41,413 |
| Year Ended 8/31/2021 | $11.60 | 5.67% | 0.87% | 0.87%(c) | 3.75% | 56% | $44,921 |
| Year Ended 8/31/2020 | $11.32 | 3.66% | 0.86%(d) | 0.86%(d) | 4.40% | 175% | $51,668 |
| Year Ended 8/31/2019 | $11.30 | 9.60% | 0.86%(d) | 0.86%(d) | 5.65% | 106% | $71,443 |
| Institutional 2 Class | |||||||
| Year Ended 8/31/2023 | $8.96 | 4.95% | 0.75% | 0.75% | 5.20% | 22% | $41,341 |
| Year Ended 8/31/2022 | $9.00 | (19.29%) | 0.73% | 0.73% | 4.05% | 28% | $40,987 |
| Year Ended 8/31/2021 | $11.60 | 5.90% | 0.75% | 0.75% | 3.86% | 56% | $53,660 |
| Year Ended 8/31/2020 | $11.31 | 3.69% | 0.73%(d) | 0.73%(d) | 4.44% | 175% | $42,699 |
| Year Ended 8/31/2019 | $11.30 | 9.83% | 0.75%(d) | 0.75%(d) | 5.75% | 106% | $35,131 |
| Columbia Emerging Markets Bond Fund | Annual Report 2023 | 23 |
| Net asset value, beginning of period | Net investment income | Net realized and unrealized gain (loss) | Total from investment operations | Distributions from net investment income | Total distributions to shareholders | |
| Institutional 3 Class | ||||||
| Year Ended 8/31/2023 | $9.01 | 0.47 | (0.05) | 0.42 | (0.47) | (0.47) |
| Year Ended 8/31/2022 | $11.60 | 0.42 | (2.60) | (2.18) | (0.41) | (0.41) |
| Year Ended 8/31/2021 | $11.32 | 0.45 | 0.20 | 0.65 | (0.37) | (0.37) |
| Year Ended 8/31/2020 | $11.30 | 0.50 | (0.09) | 0.41 | (0.39) | (0.39) |
| Year Ended 8/31/2019 | $10.75 | 0.64 | 0.39 | 1.03 | (0.48) | (0.48) |
| Class R | ||||||
| Year Ended 8/31/2023 | $8.99 | 0.40 | (0.03) | 0.37 | (0.41) | (0.41) |
| Year Ended 8/31/2022 | $11.58 | 0.35 | (2.60) | (2.25) | (0.34) | (0.34) |
| Year Ended 8/31/2021 | $11.30 | 0.37 | 0.20 | 0.57 | (0.29) | (0.29) |
| Year Ended 8/31/2020 | $11.29 | 0.42 | (0.09) | 0.33 | (0.32) | (0.32) |
| Year Ended 8/31/2019 | $10.73 | 0.56 | 0.40 | 0.96 | (0.40) | (0.40) |
| Notes to Financial Highlights | |
| (a) | In addition to the fees and expenses that the Fund bears directly, the Fund indirectly bears a pro rata share of the fees and expenses of any other funds in which it invests. Such indirect expenses are not included in the Fund’s reported expense ratios. |
| (b) | Total net expenses include the impact of certain fee waivers/expense reimbursements made by the Investment Manager and certain of its affiliates, if applicable. |
| (c) | The benefits derived from expense reductions had an impact of less than 0.01%. |
| (d) | Ratios include interest on collateral expense which is less than 0.01%. |
| 24 | Columbia Emerging Markets Bond Fund | Annual Report 2023 |
| Net asset value, end of period | Total return | Total gross expense ratio to average net assets(a) | Total net expense ratio to average net assets(a),(b) | Net investment income ratio to average net assets | Portfolio turnover | Net assets, end of period (000’s) | |
| Institutional 3 Class | |||||||
| Year Ended 8/31/2023 | $8.96 | 4.88% | 0.70% | 0.70% | 5.25% | 22% | $170,183 |
| Year Ended 8/31/2022 | $9.01 | (19.16%) | 0.68% | 0.68% | 4.11% | 28% | $169,057 |
| Year Ended 8/31/2021 | $11.60 | 5.86% | 0.69% | 0.69% | 3.92% | 56% | $190,133 |
| Year Ended 8/31/2020 | $11.32 | 3.83% | 0.68%(d) | 0.68%(d) | 4.53% | 175% | $184,834 |
| Year Ended 8/31/2019 | $11.30 | 9.79% | 0.69%(d) | 0.69%(d) | 5.83% | 106% | $182,472 |
| Class R | |||||||
| Year Ended 8/31/2023 | $8.95 | 4.26% | 1.39% | 1.39% | 4.55% | 22% | $14,117 |
| Year Ended 8/31/2022 | $8.99 | (19.75%) | 1.37% | 1.37% | 3.40% | 28% | $15,618 |
| Year Ended 8/31/2021 | $11.58 | 5.15% | 1.37% | 1.37%(c) | 3.25% | 56% | $21,419 |
| Year Ended 8/31/2020 | $11.30 | 3.05% | 1.36%(d) | 1.36%(d) | 3.87% | 175% | $21,748 |
| Year Ended 8/31/2019 | $11.29 | 9.16% | 1.36%(d) | 1.36%(d) | 5.15% | 106% | $24,620 |
| Columbia Emerging Markets Bond Fund | Annual Report 2023 | 25 |
August 31, 2023
| 26 | Columbia Emerging Markets Bond Fund | Annual Report 2023 |
August 31, 2023
| Columbia Emerging Markets Bond Fund | Annual Report 2023 | 27 |
August 31, 2023
| 28 | Columbia Emerging Markets Bond Fund | Annual Report 2023 |
August 31, 2023
| Asset derivatives | ||
| Risk exposure category | Statement of assets and liabilities location | Fair value ($) |
| Foreign exchange risk | Unrealized appreciation on forward foreign currency exchange contracts | 65,655 |
| Liability derivatives | ||
| Risk exposure category | Statement of assets and liabilities location | Fair value ($) |
| Foreign exchange risk | Unrealized depreciation on forward foreign currency exchange contracts | 57,971 |
| Amount of realized gain (loss) on derivatives recognized in income | ||||||
| Risk exposure category | Forward foreign currency exchange contracts ($) | |||||
| Foreign exchange risk | (1,724,152) | |||||
| Change in unrealized appreciation (depreciation) on derivatives recognized in income | ||||||
| Risk exposure category | Forward foreign currency exchange contracts ($) | |||||
| Foreign exchange risk | 42,559 | |||||
| Derivative instrument | Average unrealized appreciation ($) | Average unrealized depreciation ($) |
| Forward foreign currency exchange contracts | 70,704 | (144,746) |
| Columbia Emerging Markets Bond Fund | Annual Report 2023 | 29 |
August 31, 2023
| Citi ($) | Goldman Sachs International ($) | HSBC ($) | Wells Fargo ($) | Total ($) | |||
| Assets | |||||||
| Forward foreign currency exchange contracts | 65,655 | - | - | - | 65,655 | ||
| Liabilities | |||||||
| Forward foreign currency exchange contracts | - | 3,382 | 6,460 | 48,129 | 57,971 | ||
| Total financial and derivative net assets | 65,655 | (3,382) | (6,460) | (48,129) | 7,684 | ||
| Total collateral received (pledged) (a) | - | - | - | - | - | ||
| Net amount (b) | 65,655 | (3,382) | (6,460) | (48,129) | 7,684 |
| (a) | In some instances, the actual collateral received and/or pledged may be more than the amount shown due to overcollateralization. |
| (b) | Represents the net amount due from/(to) counterparties in the event of default. |
| 30 | Columbia Emerging Markets Bond Fund | Annual Report 2023 |
August 31, 2023
| Columbia Emerging Markets Bond Fund | Annual Report 2023 | 31 |
August 31, 2023
| 32 | Columbia Emerging Markets Bond Fund | Annual Report 2023 |
August 31, 2023
| Effective rate (%) | |
| Class A | 0.20 |
| Advisor Class | 0.21 |
| Class C | 0.21 |
| Institutional Class | 0.21 |
| Institutional 2 Class | 0.06 |
| Institutional 3 Class | 0.01 |
| Class R | 0.20 |
| Front End (%) | CDSC (%) | Amount ($) | |
| Class A | 4.75 | 0.50 - 1.00(a) | 9,912 |
| Class C | — | 1.00(b) | 0(c) |
| (a) | This charge is imposed on certain investments of between $1 million and $50 million redeemed within 18 months after purchase, as follows: 1.00% if redeemed within 12 months after purchase, and 0.50% if redeemed more than 12, but less than 18, months after purchase, with certain limited exceptions. |
| (b) | This charge applies to redemptions within 12 months after purchase, with certain limited exceptions. |
| (c) | Rounds to zero. |
| Columbia Emerging Markets Bond Fund | Annual Report 2023 | 33 |
August 31, 2023
| January 1, 2023 through December 31, 2023 | Prior to January 1, 2023 | |
| Class A | 1.16% | 1.16% |
| Advisor Class | 0.91 | 0.91 |
| Class C | 1.91 | 1.91 |
| Institutional Class | 0.91 | 0.91 |
| Institutional 2 Class | 0.77 | 0.77 |
| Institutional 3 Class | 0.72 | 0.73 |
| Class R | 1.41 | 1.41 |
| Excess of distributions over net investment income ($) | Accumulated net realized (loss) ($) | Paid in capital ($) |
| (455,013) | 455,013 | — |
| 34 | Columbia Emerging Markets Bond Fund | Annual Report 2023 |
August 31, 2023
| Year Ended August 31, 2023 | Year Ended August 31, 2022 | ||||
| Ordinary income ($) | Long-term capital gains ($) | Total ($) | Ordinary income ($) | Long-term capital gains ($) | Total ($) |
| 15,001,989 | — | 15,001,989 | 13,034,184 | — | 13,034,184 |
| Undistributed ordinary income ($) | Undistributed long-term capital gains ($) | Capital loss carryforwards ($) | Net unrealized (depreciation) ($) |
| 83,324 | — | (52,853,120) | (65,547,229) |
| Federal tax cost ($) | Gross unrealized appreciation ($) | Gross unrealized (depreciation) ($) | Net unrealized (depreciation) ($) |
| 349,046,536 | 1,102,426 | (66,649,655) | (65,547,229) |
| No expiration short-term ($) | No expiration long-term ($) | Total ($) | Utilized ($) |
| (13,376,002) | (39,477,118) | (52,853,120) | — |
| Columbia Emerging Markets Bond Fund | Annual Report 2023 | 35 |
August 31, 2023
| Borrower or lender | Average loan balance ($) | Weighted average interest rate (%) | Number of days with outstanding loans |
| Lender | 1,520,000 | 4.95 | 5 |
| 36 | Columbia Emerging Markets Bond Fund | Annual Report 2023 |
August 31, 2023
| Columbia Emerging Markets Bond Fund | Annual Report 2023 | 37 |
August 31, 2023
| 38 | Columbia Emerging Markets Bond Fund | Annual Report 2023 |
August 31, 2023
| Columbia Emerging Markets Bond Fund | Annual Report 2023 | 39 |
| 40 | Columbia Emerging Markets Bond Fund | Annual Report 2023 |
| Foreign taxes paid to foreign countries | Foreign taxes paid per share to foreign countries | Foreign source income | Foreign source income per share |
| $29,711 | $0.0009 | $15,035,391 | $0.47 |
| Name, address, year of birth | Position held with the Columbia Funds and length of service | Principal occupation(s) during past five years and other relevant professional experience | Number of Funds in the Columbia Funds Complex* overseen | Other directorships held by Trustee during the past five years and other relevant Board experience |
| George S. Batejan c/o Columbia Management Investment Advisers, LLC 290 Congress Street Boston, MA 02210 1954 | Trustee since 2017 | Executive Vice President, Global Head of Technology and Operations, Janus Capital Group, Inc., 2010-2016 | 173 | Former Chairman of the Board, NICSA (National Investment Company Services Association) (Executive Committee, Nominating Committee and Governance Committee), 2014-2016; former Director, Intech Investment Management, 2011-2016; former Board Member, Metro Denver Chamber of Commerce, 2015-2016; former Advisory Board Member, University of Colorado Business School, 2015-2018; former Board Member, Chase Bank International, 1993-1994 |
| Columbia Emerging Markets Bond Fund | Annual Report 2023 | 41 |
(Unaudited)
Independent trustees (continued)
| Name, address, year of birth | Position held with the Columbia Funds and length of service | Principal occupation(s) during past five years and other relevant professional experience | Number of Funds in the Columbia Funds Complex* overseen | Other directorships held by Trustee during the past five years and other relevant Board experience |
| Kathleen Blatz c/o Columbia Management Investment Advisers, LLC 290 Congress Street Boston, MA 02210 1954 | Trustee since 2006 | Attorney, specializing in arbitration and mediation; Chief Justice, Minnesota Supreme Court, 1998-2006; Associate Justice, Minnesota Supreme Court, 1996-1998; Fourth Judicial District Court Judge, Hennepin County, 1994-1996; Attorney in private practice and public service, 1984-1993; State Representative, Minnesota House of Representatives, 1979-1993, which included service on the Tax and Financial Institutions and Insurance Committees; Member and Interim Chair, Minnesota Sports Facilities Authority, January-July 2017; Interim President and Chief Executive Officer, Blue Cross and Blue Shield of Minnesota (health care insurance), February-July 2018, April-October 2021 | 173 | Former Trustee, Blue Cross and Blue Shield of Minnesota, 2009-2021 (Chair of the Business Development Committee, 2014-2017; Chair of the Governance Committee, 2017-2019); former Member and Chair of the Board, Minnesota Sports Facilities Authority, January 2017-July 2017; former Director, Robina Foundation, 2009-2020 (Chair, 2014-2020); Director, Richard M. Schulze Family Foundation, since 2021 |
| Pamela G. Carlton c/o Columbia Management Investment Advisers, LLC 290 Congress Street Boston, MA 02210 1954 | Chair since 2023; Trustee since 2007 | President, Springboard – Partners in Cross Cultural Leadership (consulting company), since 2003; Managing Director of US Equity Research, JP Morgan Chase, 1999-2003; Director of US Equity Research, Chase Asset Management, 1996-1999; Co-Director Latin America Research, 1993-1996, COO Global Research, 1992-1996, Co-Director of US Research, 1991-1992, Investment Banker, 1982-1991, Morgan Stanley; Attorney, Cleary Gottlieb Steen & Hamilton LLP, 1980-1982 | 173 | Trustee, New York Presbyterian Hospital Board, since 1996; Director, DR Bank (Audit Committee) since 2017; Director, Evercore Inc. (Audit Committee, Nominating and Governance Committee), since 2019; Director, Apollo Commercial Real Estate Finance, Inc. (Chair, Nominating and Governance Committee) (financial services), since 2021; the Governing Council of the Independent Directors Council (IDC), since 2021 |
| Janet Langford Carrig c/o Columbia Management Investment Advisers, LLC 290 Congress Street Boston, MA 02210 1957 | Trustee since 1996 | Senior Vice President, General Counsel and Corporate Secretary, ConocoPhillips (independent energy company), September 2007-October 2018 | 173 | Director, EQT Corporation (natural gas producer), since 2019; former Director, Whiting Petroleum Corporation (independent oil and gas company), 2020-2022 |
| J. Kevin Connaughton c/o Columbia Management Investment Advisers, LLC 290 Congress Street Boston, MA 02210 1964 | Trustee since 2020 | CEO and President, RhodeWay Financial (non-profit financial planning firm), since December 2022; Member, FINRA National Adjudicatory Council, since January 2020; Adjunct Professor of Finance, Bentley University since January 2018; Consultant to Independent Trustees of CFVIT and CFST I from March 2016 to June 2020 with respect to CFVIT and to December 2020 with respect to CFST I; Managing Director and General Manager of Mutual Fund Products, Columbia Management Investment Advisers, LLC, May 2010-February 2015; President, Columbia Funds, 2008-2015; and senior officer of Columbia Funds and affiliated funds, 2003-2015 | 171 | Former Director, The Autism Project, March 2015-December 2021; former Member of the Investment Committee, St. Michael’s College, November 2015-February 2020; former Trustee, St. Michael’s College, June 2017-September 2019; former Trustee, New Century Portfolios (former mutual fund complex), January 2015-December 2017 |
| 42 | Columbia Emerging Markets Bond Fund | Annual Report 2023 |
(Unaudited)
Independent trustees (continued)
| Name, address, year of birth | Position held with the Columbia Funds and length of service | Principal occupation(s) during past five years and other relevant professional experience | Number of Funds in the Columbia Funds Complex* overseen | Other directorships held by Trustee during the past five years and other relevant Board experience |
| Olive M. Darragh c/o Columbia Management Investment Advisers, LLC 290 Congress Street Boston, MA 02210 1962 | Trustee since 2020 | Managing Director of Darragh Inc. (strategy and talent management consulting firm), since 2010; Founder and CEO, Zolio, Inc. (investment management talent identification platform), since 2004; Consultant to Independent Trustees of CFVIT and CFST I from June 2019 to June 2020 with respect to CFVIT and to December 2020 with respect to CFST I; Partner, Tudor Investments, 2004-2010; Senior Partner, McKinsey & Company (consulting), 1990-2004; Touche Ross CPA, 1985-1988 | 171 | Treasurer, Edinburgh University US Trust Board, since January 2023; Member, HBS Community Action Partners Board, since September 2022; former Director, University of Edinburgh Business School (Member of US Board), 2004-2019; former Director, Boston Public Library Foundation, 2008-2017 |
| Patricia M. Flynn c/o Columbia Management Investment Advisers, LLC 290 Congress Street Boston, MA 02210 1950 | Trustee since 2004 | Professor of Economics and Management, Bentley University, since 2002; Dean, McCallum Graduate School of Business, Bentley University, 1992-2002 | 173 | Former Trustee, MA Taxpayers Foundation, 1997-2022; former Director, The MA Business Roundtable, 2003-2019; former Chairperson, Innovation Index Advisory Committee, MA Technology Collaborative, 1997-2020 |
| Brian J. Gallagher c/o Columbia Management Investment Advisers, LLC 290 Congress Street Boston, MA 02210 1954 | Trustee since 2017 | Retired; Partner with Deloitte & Touche LLP and its predecessors, 1977-2016 | 173 | Trustee, Catholic Schools Foundation, since 2004 |
| Douglas A. Hacker c/o Columbia Management Investment Advisers, LLC 290 Congress Street Boston, MA 02210 1955 | Trustee since 1996 | Independent business executive, since May 2006; Executive Vice President – Strategy of United Airlines, December 2002 - May 2006; President of UAL Loyalty Services (airline marketing company), September 2001-December 2002; Executive Vice President and Chief Financial Officer of United Airlines, July 1999-September 2001 | 173 | Director, SpartanNash Company since November 2013 (Chair of the Board, since May 2021) (food distributor); Director, Aircastle Limited (Chair of Audit Committee) (aircraft leasing), since August 2006; former Director, Nash Finch Company (food distributor), 2005-2013; former Director, SeaCube Container Leasing Ltd. (container leasing), 2010-2013; and former Director, Travelport Worldwide Limited (travel information technology), 2014-2019 |
| Nancy T. Lukitsh c/o Columbia Management Investment Advisers, LLC 290 Congress Street Boston, MA 02210 1956 | Trustee since 2011 | Senior Vice President, Partner and Director of Marketing, Wellington Management Company, LLP (investment adviser), 1997-2010; Chair, Wellington Management Portfolios (commingled non-U.S. investment pools), 2007-2010; Director, Wellington Trust Company, NA and other Wellington affiliates, 1997-2010 | 171 | None |
| Columbia Emerging Markets Bond Fund | Annual Report 2023 | 43 |
(Unaudited)
Independent trustees (continued)
| Name, address, year of birth | Position held with the Columbia Funds and length of service | Principal occupation(s) during past five years and other relevant professional experience | Number of Funds in the Columbia Funds Complex* overseen | Other directorships held by Trustee during the past five years and other relevant Board experience |
| David M. Moffett c/o Columbia Management Investment Advisers, LLC 290 Congress Street Boston, MA 02210 1952 | Trustee since 2011 | Retired; former Chief Executive Officer of Freddie Mac and Chief Financial Officer of U.S. Bank | 171 | Director, CSX Corporation (transportation suppliers); Director, PayPal Holdings Inc. (payment and data processing services); Trustee, University of Oklahoma Foundation; former Director, eBay Inc. (online trading community), 2007-2015; and former Director, CIT Bank, CIT Group Inc. (commercial and consumer finance), 2010-2016; former Senior Adviser to The Carlyle Group (financial services), March 2008-September 2008; former Governance Consultant to Bridgewater Associates, January 2013-December 2015 |
| Catherine James Paglia c/o Columbia Management Investment Advisers, LLC 290 Congress Street Boston, MA 02210 1952 | Trustee since 2004 | Director, Enterprise Asset Management, Inc. (private real estate and asset management company), since September 1998; Managing Director and Partner, Interlaken Capital, Inc., 1989-1997; Vice President, 1982-1985, Principal, 1985-1987, Managing Director, 1987-1989, Morgan Stanley; Vice President, Investment Banking, 1980-1982, Associate, Investment Banking, 1976-1980, Dean Witter Reynolds, Inc. | 173 | Director, Valmont Industries, Inc. (irrigation systems manufacturer), since 2012; Trustee, Carleton College (on the Investment Committee), since 1987; Trustee, Carnegie Endowment for International Peace (on the Investment Committee), since 2009 |
| Natalie A. Trunow c/o Columbia Management Investment Advisers, LLC 290 Congress Street Boston, MA 02210 1967 | Trustee since 2020 | Chief Executive Officer, Millennial Portfolio Solutions LLC (asset management and consulting services), January 2016-January 2021; Non-executive Member of the Investment Committee and Valuation Committee, Sarona Asset Management Inc. (private equity firm) since September 2019; Advisor, Horizon Investments (asset management and consulting services), August 2018-January 2022; Advisor, Paradigm Asset Management, November 2016-January 2022; Consultant to Independent Trustees of CFVIT and CFST I from September 2016 to June 2020 with respect to CFVIT and to December 2020 with respect to CFST I; Director of Investments/Consultant, Casey Family Programs, April 2016-November 2016; Senior Vice President and Chief Investment Officer, Calvert Investments, August 2008-January 2016; Section Head and Portfolio Manager, General Motors Asset Management, June 1997-August 2008 | 171 | Independent Director, Investment Committee, Health Services for Children with Special Needs, Inc., 2010-2021; Independent Director, (Executive Committee and Chair, Audit Committee), Consumer Credit Counseling Services (formerly Guidewell Financial Solutions), since 2016; Independent Director, (Investment Committee), Sarona Asset Management, since 2019 |
| 44 | Columbia Emerging Markets Bond Fund | Annual Report 2023 |
(Unaudited)
Independent trustees (continued)
| Name, address, year of birth | Position held with the Columbia Funds and length of service | Principal occupation(s) during past five years and other relevant professional experience | Number of Funds in the Columbia Funds Complex* overseen | Other directorships held by Trustee during the past five years and other relevant Board experience |
| Sandra L. Yeager c/o Columbia Management Investment Advisers, LLC 290 Congress Street Boston, MA 02210 1964 | Trustee since 2017 | Retired; President and founder, Hanoverian Capital, LLC (SEC registered investment advisor firm), 2008-2016; Managing Director, DuPont Capital, 2006-2008; Managing Director, Morgan Stanley Investment Management, 2004-2006; Senior Vice President, Alliance Bernstein, 1990-2004 | 173 | Former Director, NAPE (National Alliance for Partnerships in Equity) Education Foundation, October 2016-October 2020; Advisory Board, Jennersville YMCA, since 2022 |
| Name, address, year of birth | Position held with the Columbia Funds and length of service | Principal occupation(s) during the past five years and other relevant professional experience | Number of Funds in the Columbia Funds Complex* overseen | Other directorships held by Trustee during the past five years and other relevant Board experience |
| Daniel J. Beckman c/o Columbia Management Investment Advisers, LLC 290 Congress Street Boston, MA 02210 1962 | Trustee since November 2021 and President since June 2021 | Vice President – Head of North America Product, Columbia Management Investment Advisers, LLC, since April 2015; President and Principal Executive Officer of the Columbia Funds, since June 2021; officer of Columbia Funds and affiliated funds, 2020-2021 | 173 | Director, Ameriprise Trust Company, since October 2016; Director, Columbia Management Investment Distributors, Inc. since November 2018; Board of Governors, Columbia Wanger Asset Management, LLC since, January 2022; Director, Columbia Threadneedle Canada, Inc., since December 2022 |
| * | The term “Columbia Funds Complex” as used herein includes Columbia Seligman Premium Technology Growth Fund, Tri-Continental Corporation and each series of Columbia Funds Series Trust (CFST), Columbia Funds Series Trust I (CFST I), Columbia Funds Series Trust II (CFST II), Columbia ETF Trust I (CET I), Columbia ETF Trust II (CET II), Columbia Funds Variable Insurance Trust (CFVIT) and Columbia Funds Variable Series Trust II (CFVST II). Messrs. Batejan, Beckman, Gallagher and Hacker and Mses. Blatz, Carlton, Carrig, Flynn, Paglia, and Yeager serve as directors of Columbia Seligman Premium Technology Growth Fund and Tri-Continental Corporation. |
| ** | Interested person (as defined under the 1940 Act) by reason of being an officer, director, security holder and/or employee of the Investment Manager or Ameriprise Financial. |
| Columbia Emerging Markets Bond Fund | Annual Report 2023 | 45 |
(Unaudited)
The Board has appointed officers who are responsible for day-to-day business decisions based on policies it has established. The officers serve at the pleasure of the Board. The following table provides basic information about the Officers of the Fund as of the printing of this report, including principal occupations during the past five years, although their specific titles may have varied over the period. In addition to Mr. Beckman, who is President and Principal Executive Officer, the Fund’s other officers are:
| Name, address and year of birth | Position and year first appointed to position for any Fund in the Columbia Funds Complex or a predecessor thereof | Principal occupation(s) during past five years |
| Michael G. Clarke 290 Congress Street Boston, MA 02210 1969 | Chief Financial Officer and Principal Financial Officer (2009) and Senior Vice President (2019) | Senior Vice President and North America Head of Operations & Investor Services, Columbia Management Investment Advisers, LLC, since June 2023 (previously Senior Vice President and Head of Global Operations, March 2022 – June 2023, Vice President, Head of North America Operations, and Co-Head of Global Operations, June 2019 - February 2022 and Vice President – Accounting and Tax, May 2010 - May 2019); senior officer of Columbia Funds and affiliated funds, since 2002. Director, Ameriprise Trust Company, since June 2023. |
| Joseph Beranek 5890 Ameriprise Financial Center Minneapolis, MN 55474 1965 | Treasurer and Chief Accounting Officer (Principal Accounting Officer) (2019) and Principal Financial Officer (2020), CFST, CFST I, CFST II, CFVIT and CFVST II; Assistant Treasurer, CET I and CET II | Vice President – Mutual Fund Accounting and Financial Reporting, Columbia Management Investment Advisers, LLC, since December 2018 and March 2017, respectively. |
| Marybeth Pilat 290 Congress Street Boston, MA 02210 1968 | Treasurer and Chief Accounting Officer (Principal Accounting Officer) and Principal Financial Officer (2020) for CET I and CET II; Assistant Treasurer, CFST, CFST I, CFST II, CFVIT and CFVST II | Vice President – Product Pricing and Administration, Columbia Management Investment Advisers, LLC, since May 2017. |
| William F. Truscott 290 Congress Street Boston, MA 02210 1960 | Senior Vice President (2001) | Formerly, Trustee/Director of Columbia Funds Complex or legacy funds, November 2001 - January 1, 2021; Chief Executive Officer, Global Asset Management, Ameriprise Financial, Inc., since September 2012; Chairman of the Board and President, Columbia Management Investment Advisers, LLC, since July 2004 and February 2012, respectively; Chairman of the Board and Chief Executive Officer, Columbia Management Investment Distributors, Inc., since November 2008 and February 2012, respectively; Chairman of the Board and Director, Threadneedle Asset Management Holdings, Sàrl, since March 2013 and December 2008, respectively; senior executive of various entities affiliated with Columbia Threadneedle. |
| Christopher O. Petersen 5228 Ameriprise Financial Center Minneapolis, MN 55474 1970 | Senior Vice President and Assistant Secretary (2021) | Formerly, Trustee/Director of funds within the Columbia Funds Complex, July 1, 2020 - November 22, 2021; Senior Vice President and Assistant General Counsel, Ameriprise Financial, Inc., since September 2021 (previously Vice President and Lead Chief Counsel, January 2015 - September 2021); formerly, President and Principal Executive Officer of the Columbia Funds, 2015 - 2021; officer of Columbia Funds and affiliated funds, since 2007. |
| Thomas P. McGuire 290 Congress Street Boston, MA 02210 1972 | Senior Vice President and Chief Compliance Officer (2012) | Vice President – Asset Management Compliance, Ameriprise Financial, Inc., since May 2010; Chief Compliance Officer, Columbia Acorn/Wanger Funds, since December 2015; formerly, Chief Compliance Officer, Ameriprise Certificate Company, September 2010 – September 2020. |
| Ryan C. Larrenaga 290 Congress Street Boston, MA 02210 1970 | Senior Vice President (2017), Chief Legal Officer (2017), and Secretary (2015) | Vice President and Chief Counsel, Ameriprise Financial, Inc., since August 2018 (previously Vice President and Group Counsel, August 2011 - August 2018); Chief Legal Officer, Columbia Acorn/Wanger Funds, since September 2020; officer of Columbia Funds and affiliated funds, since 2005. |
| 46 | Columbia Emerging Markets Bond Fund | Annual Report 2023 |
(Unaudited)
Fund officers (continued)
| Name, address and year of birth | Position and year first appointed to position for any Fund in the Columbia Funds Complex or a predecessor thereof | Principal occupation(s) during past five years |
| Michael E. DeFao 290 Congress Street Boston, MA 02210 1968 | Vice President (2011) and Assistant Secretary (2010) | Vice President and Chief Counsel, Ameriprise Financial, Inc., since May 2010; Vice President, Chief Legal Officer and Assistant Secretary, Columbia Management Investment Advisers, LLC, since October 2021 (previously Vice President and Assistant Secretary, May 2010 – September 2021). |
| Lyn Kephart-Strong 5903 Ameriprise Financial Center Minneapolis, MN 55474 1960 | Vice President (2015) | Vice President, Global Investment Operations Services, Columbia Management Investment Advisers, LLC, since 2010; Director (since January 2007) and President (since October 2014), Columbia Management Investment Services Corp.; Director (since December 2017) and President (since January 2017), Ameriprise Trust Company. |
| • | the Fund had sufficient liquidity to both meet redemptions and operate effectively on behalf of shareholders; |
| • | there were no material changes to the Program during the period; |
| • | the implementation of the Program was effective to manage the Fund’s liquidity risk; and |
| • | the Program operated adequately during the period. |
| Columbia Emerging Markets Bond Fund | Annual Report 2023 | 47 |
| • | Information on the investment performance of the Fund relative to the performance of a group of mutual funds determined to be comparable to the Fund by Broadridge, as well as performance relative to one or more benchmarks; |
| • | Information on the Fund’s management fees and total expenses, including information comparing the Fund’s expenses to those of a group of comparable mutual funds, as determined by Broadridge; |
| • | The Investment Manager’s agreement to contractually limit or cap total operating expenses for the Fund so that total operating expenses (excluding certain fees and expenses, such as transaction costs and certain other investment related expenses, interest, taxes, acquired fund fees and expenses and infrequent and/or unusual expenses) would not exceed a specified annual rate, as a percentage of the Fund’s net assets; |
| • | Terms of the Management Agreement; |
| • | Descriptions of other agreements and arrangements with affiliates of the Investment Manager relating to the operations of the Fund, including agreements with respect to the provision of transfer agency and shareholder services to the Fund; |
| • | Descriptions of various services performed by the Investment Manager under the Management Agreement, including portfolio management and portfolio trading practices; |
| • | Information regarding any recently negotiated management fees of similarly-managed portfolios of other institutional clients of the Investment Manager; |
| • | Information regarding the resources of the Investment Manager, including information regarding senior management, portfolio managers and other personnel; |
| • | Information regarding the capabilities of the Investment Manager with respect to compliance monitoring services; |
| • | The profitability to the Investment Manager and its affiliates from their relationships with the Fund; and |
| • | Report provided by the Board’s independent fee consultant, JDL Consultants, LLC (JDL). |
| 48 | Columbia Emerging Markets Bond Fund | Annual Report 2023 |
(Unaudited)
Following an analysis and discussion of the foregoing, and the factors identified below, the Board, including all of the Independent Trustees, approved the renewal of the Management Agreement.
| Columbia Emerging Markets Bond Fund | Annual Report 2023 | 49 |
(Unaudited)
The Board considered the reports of JDL, which assisted in the Board’s analysis of the Funds’ performance and expenses and the reasonableness of the Funds’ fee rates. The Board accorded particular weight to the notion that a primary objective of the level of fees is to achieve a rational pricing model applied consistently across the various product lines in the Fund family, while assuring that the overall fees for each Fund (with certain exceptions) are generally in line with the current “pricing philosophy” such that Fund total expense ratios, in general, approximate or are lower than the median expense ratios of funds in the same Lipper comparison universe. The Board took into account that the Fund’s total expense ratio (after considering proposed expense caps/waivers) approximated the peer universe’s median expense ratio.
| 50 | Columbia Emerging Markets Bond Fund | Annual Report 2023 |
columbiathreadneedleus.com/investor/. The Fund is distributed by Columbia Management Investment Distributors, Inc., member FINRA, and managed by Columbia Management Investment Advisers, LLC.

August 31, 2023

| 3 | |
| 5 | |
| 7 | |
| 8 | |
| 15 | |
| 16 | |
| 17 | |
| 18 | |
| 20 | |
| 29 | |
| 30 | |
| 30 | |
| 36 | |
| 36 |
(Unaudited)
| Average annual total returns (%) (for the period ended August 31, 2023) | |||||
| Inception | 1 Year | 5 Years | 10 Years | ||
| Class A* | 05/27/14 | 2.03 | 0.91 | 0.80 | |
| Advisor Class | 09/30/09 | 2.18 | 1.13 | 1.04 | |
| Institutional Class* | 01/26/22 | 2.17 | 1.13 | 1.04 | |
| Institutional 3 Class* | 01/26/22 | 2.28 | 1.27 | 1.11 | |
| Bloomberg 1 Year Municipal Bond Index | 1.83 | 1.08 | 0.93 | ||
| * | The returns shown for periods prior to the share class inception date (including returns for the Life of the Fund, if shown, which are since Fund inception) include the returns of the Fund’s oldest share class. These returns are adjusted to reflect any higher class-related operating expenses of the newer share classes, as applicable. Please visit columbiathreadneedleus.com/investor/investment-products/mutual-funds/appended-performance for more information. |
| Columbia Ultra Short Duration Municipal Bond Fund | Annual Report 2023 | 3 |
(Unaudited)

| Quality breakdown (%) (at August 31, 2023) | |
| AAA rating | 23.1 |
| AA rating | 43.3 |
| A rating | 17.8 |
| BBB rating | 8.8 |
| Not rated | 7.0 |
| Total | 100.0 |
| Top Ten States/Territories (%) (at August 31, 2023) | |
| Texas | 21.7 |
| Illinois | 7.6 |
| New York | 6.5 |
| Massachusetts | 6.2 |
| Michigan | 5.8 |
| California | 5.7 |
| Pennsylvania | 5.1 |
| Connecticut | 4.4 |
| Kentucky | 4.1 |
| South Carolina | 3.9 |
| 4 | Columbia Ultra Short Duration Municipal Bond Fund | Annual Report 2023 |
(Unaudited)
| • | Duration and yield curve positioning contributed most positively to relative performance. |
| ○ | The Fund maintained a duration position shorter than that of its benchmark, which proved beneficial as interest rates rose. |
| ○ | The Fund had a barbelled yield curve position, with an overweight to the 0-1 year portion of the curve, or spectrum of maturities, a corresponding underweight to the 1-2 year portion of the curve, and some exposure to slightly longer than benchmark securities in the 2-3 year maturity range. |
| • | Exposure to the ultra short-term end of the curve, i.e., to securities with maturities of 0-3 months, along with exposure to cash, was particularly helpful, as cash yields, variable rate demand note yields and ultra short-term bond yields remained elevated relative to most 1-2 year maturity bonds. |
| • | Such positioning provided enhanced income with limited duration exposure and helped mitigate the impact of rising interest rates. |
| Columbia Ultra Short Duration Municipal Bond Fund | Annual Report 2023 | 5 |
(Unaudited)
| • | Sector allocation positioning overall contributed positively. |
| ○ | An overweight to local general obligations proved most beneficial. |
| ○ | Overweighted exposures to the transportation and resource recovery sectors further boosted relative results. |
| • | Security selection within the local general obligations sector contributed positively, especially selection among non-rated notes. To a more modest degree, security selection within the electric, water and sewer, and prepaid gas sectors was also additive. |
| • | Having underweights to the hospitals, industrial development revenue/pollution control revenue (IDR/PCR) and pre-refunded sectors, which each outperformed the benchmark during the annual period, detracted. |
| • | Allocation positioning and security selection within the housing sector was also a drag on the Fund’s results, especially exposure to lower coupon housing sector issues. |
| • | Holdings within the 1-2 year maturity segment of the yield curve dampened the Fund’s results. Cash and variable rate demand notes outyielded 1-2 year maturity bonds for most of the annual period, and while the Fund was underweight 1-2 year maturity holdings versus the benchmark, what exposure the Fund did have underperformed shorter maturity, higher yielding holdings. |
| • | Credit quality positioning overall detracted modestly. |
| ○ | The Fund maintained its high quality bias throughout the annual period. |
| ○ | As lower quality holdings fared better during the annual period than higher quality issues, the Fund’s up-in-quality bias modestly hurt. |
| 6 | Columbia Ultra Short Duration Municipal Bond Fund | Annual Report 2023 |
(Unaudited)
| March 1, 2023 — August 31, 2023 | |||||||
| Account value at the beginning of the period ($) | Account value at the end of the period ($) | Expenses paid during the period ($) | Fund’s annualized expense ratio (%) | ||||
| Actual | Hypothetical | Actual | Hypothetical | Actual | Hypothetical | Actual | |
| Class A | 1,000.00 | 1,000.00 | 1,013.10 | 1,022.68 | 2.54 | 2.55 | 0.50 |
| Advisor Class | 1,000.00 | 1,000.00 | 1,013.80 | 1,023.44 | 1.78 | 1.79 | 0.35 |
| Institutional Class | 1,000.00 | 1,000.00 | 1,013.80 | 1,023.49 | 1.73 | 1.73 | 0.34 |
| Institutional 3 Class | 1,000.00 | 1,000.00 | 1,014.40 | 1,023.95 | 1.27 | 1.28 | 0.25 |
| Columbia Ultra Short Duration Municipal Bond Fund | Annual Report 2023 | 7 |
August 31, 2023
| Floating Rate Notes 2.1% | ||||
| Issue Description | Yield | Principal Amount ($) | Value ($) | |
| New York 1.3% | ||||
| New York City Water & Sewer System(a),(b) | ||||
| Revenue Bonds | ||||
| 2nd General Resolution | ||||
| Series 2013 (JPMorgan Chase Bank) | ||||
| 06/15/2050 | 4.000% | 1,700,000 | 1,700,000 | |
| Utah 0.8% | ||||
| City of Murray(a),(b) | ||||
| Revenue Bonds | ||||
| IHC Health Services, Inc. | ||||
| Series 2005B (JPMorgan Chase Bank) | ||||
| 05/15/2037 | 4.000% | 1,000,000 | 1,000,000 | |
| Total Floating Rate Notes (Cost $2,700,000) | 2,700,000 | |||
| Municipal Bonds 90.1% | ||||
| Issue Description | Coupon Rate | Principal Amount ($) | Value ($) | |
| Alaska 0.8% | ||||
| State of Alaska | ||||
| Unlimited General Obligation Refunding Bonds | ||||
| Series 2023A | ||||
| 08/01/2025 | 5.000% | 1,000,000 | 1,030,457 | |
| Arizona 0.8% | ||||
| Arizona Water Infrastructure Finance Authority | ||||
| Prerefunded 10/01/24 Revenue Bonds | ||||
| Water Quality | ||||
| Series 2014A | ||||
| 10/01/2028 | 5.000% | 1,020,000 | 1,038,697 | |
| California 5.7% | ||||
| Bay Area Toll Authority(c) | ||||
| Revenue Bonds | ||||
| San Francisco Bay Area Toll Bridge | ||||
| Series 2012 (Mandatory Put 04/01/24) | ||||
| Muni Swap Index Yield + 1.100% 04/01/2045 | 5.570% | 1,750,000 | 1,750,750 | |
| California Infrastructure & Economic Development Bank(d) | ||||
| Revenue Bonds | ||||
| Brightline West Passenger Rail Project | ||||
| Series 2023 (Mandatory Put 01/31/24) | ||||
| 01/01/2050 | 3.650% | 1,000,000 | 994,754 | |
| City of Los Angeles Department of Airports(d) | ||||
| Refunding Revenue Bonds | ||||
| Series 2018B | ||||
| 05/15/2024 | 5.000% | 1,500,000 | 1,512,556 | |
| Municipal Bonds (continued) | ||||
| Issue Description | Coupon Rate | Principal Amount ($) | Value ($) | |
| Los Angeles Department of Water & Power Water System | ||||
| Refunding Revenue Bonds | ||||
| Series 2023A | ||||
| 07/01/2024 | 5.000% | 250,000 | 253,843 | |
| State of California | ||||
| Unlimited General Obligation Refunding Bonds | ||||
| Various Purpose | ||||
| Series 2018 | ||||
| 10/01/2025 | 5.000% | 2,880,000 | 2,989,709 | |
| Total | 7,501,612 | |||
| Colorado 2.7% | ||||
| City & County of Denver Airport System(d) | ||||
| Revenue Bonds | ||||
| Series 2022D | ||||
| 11/15/2024 | 5.000% | 1,000,000 | 1,012,829 | |
| E-470 Public Highway Authority(c) | ||||
| Refunding Revenue Bonds | ||||
| Series 2021B (Mandatory Put 09/01/24) | ||||
| 0.7 x SOFR + 0.350% 09/01/2039 | 3.901% | 2,500,000 | 2,494,052 | |
| Total | 3,506,881 | |||
| Connecticut 4.4% | ||||
| Connecticut Housing Finance Authority | ||||
| Refunding Revenue Bonds | ||||
| Housing Mortgage Finance Program | ||||
| Series 2020 (Mandatory Put 11/15/23) | ||||
| 05/15/2060 | 0.500% | 325,000 | 322,231 | |
| State of Connecticut | ||||
| Unlimited General Obligation Refunding Bonds | ||||
| Series 2022F | ||||
| 11/15/2024 | 5.000% | 2,500,000 | 2,549,685 | |
| State of Connecticut Special Tax | ||||
| Refunding Revenue Bonds | ||||
| Transportation Infrastructure Purposes | ||||
| Series 2014 | ||||
| 09/01/2025 | 5.000% | 2,500,000 | 2,537,851 | |
| Revenue Bonds | ||||
| Transportation Infrasturucture Purposes | ||||
| Series 2022A | ||||
| 07/01/2024 | 5.000% | 350,000 | 354,610 | |
| Total | 5,764,377 | |||
| District of Columbia 1.2% | ||||
| District of Columbia Housing Finance Agency | ||||
| Revenue Bonds | ||||
| Faircliff Plaza East Apartments Project | ||||
| Series 2022 (FHA) (Mandatory Put 12/01/25) | ||||
| 12/01/2026 | 5.000% | 600,000 | 610,727 | |
| 8 | Columbia Ultra Short Duration Municipal Bond Fund | Annual Report 2023 |
August 31, 2023
| Municipal Bonds (continued) | ||||
| Issue Description | Coupon Rate | Principal Amount ($) | Value ($) | |
| Metropolitan Washington Airports Authority Aviation(d) | ||||
| Refunding Revenue Bonds | ||||
| Airport System | ||||
| Series 2019A | ||||
| 10/01/2024 | 5.000% | 1,000,000 | 1,012,313 | |
| Total | 1,623,040 | |||
| Florida 2.8% | ||||
| County of Miami-Dade Seaport Department(d) | ||||
| Refunding Revenue Bonds | ||||
| Series 2023A | ||||
| 10/01/2025 | 5.000% | 850,000 | 869,658 | |
| Duval County Public Schools | ||||
| Certificate of Participation | ||||
| Series 2022A | ||||
| 07/01/2024 | 5.000% | 1,750,000 | 1,771,625 | |
| Greater Orlando Aviation Authority | ||||
| Revenue Bonds | ||||
| Series 2019A | ||||
| 10/01/2024 | 5.000% | 1,000,000 | 1,011,052 | |
| Total | 3,652,335 | |||
| Georgia 1.5% | ||||
| County of DeKalb Water & Sewerage | ||||
| Refunding Revenue Bonds | ||||
| Second Resolution | ||||
| Series 2022 | ||||
| 10/01/2024 | 5.000% | 2,000,000 | 2,034,753 | |
| Hawaii 1.9% | ||||
| Honolulu City & County Board of Water Supply | ||||
| Prerefunded 07/01/24 Revenue Bonds | ||||
| Series 2014A | ||||
| 07/01/2032 | 4.000% | 2,540,000 | 2,554,075 | |
| Illinois 7.6% | ||||
| City of Joliet Waterworks & Sewerage | ||||
| Revenue Bonds | ||||
| Senior Lien | ||||
| BAN Series 2022 | ||||
| 01/01/2024 | 5.000% | 2,000,000 | 2,004,887 | |
| Illinois Finance Authority | ||||
| Prerefunded 08/01/24 Revenue Bonds | ||||
| Advocate Health Care | ||||
| Series 2014 | ||||
| 08/01/2031 | 5.000% | 2,580,000 | 2,612,867 | |
| Refunding Revenue Bonds | ||||
| American Water Capital Corp. Project | ||||
| Series 2020 (Mandatory Put 09/01/23) | ||||
| 05/01/2040 | 0.700% | 2,800,000 | 2,800,000 | |
| Municipal Bonds (continued) | ||||
| Issue Description | Coupon Rate | Principal Amount ($) | Value ($) | |
| State of Illinois | ||||
| Unlimited General Obligation Bonds | ||||
| Series 2020C | ||||
| 05/01/2024 | 5.500% | 500,000 | 505,548 | |
| Village of Schaumburg | ||||
| Unlimited General Obligation Refunding Bonds | ||||
| Series 2022 | ||||
| 12/01/2024 | 4.000% | 2,000,000 | 2,004,161 | |
| Total | 9,927,463 | |||
| Indiana 1.5% | ||||
| Indiana Finance Authority(d) | ||||
| Refunding Revenue Bonds | ||||
| Fulcrum Centerpoint LLC Project | ||||
| Series 2022 (Mandatory Put 11/15/23) | ||||
| 12/15/2046 | 4.500% | 2,000,000 | 1,997,125 | |
| Kentucky 4.0% | ||||
| County of Owen | ||||
| Refunding Revenue Bonds | ||||
| Kentucky-American Water Co. Project | ||||
| Series 2020 (Mandatory Put 09/01/23) | ||||
| 06/01/2040 | 0.700% | 2,800,000 | 2,800,000 | |
| Kentucky Public Energy Authority(c) | ||||
| Revenue Bonds | ||||
| Series 2019A-2 (Mandatory Put 06/01/25) | ||||
| 0.7 x 1-month USD LIBOR + 1.120% 12/01/2049 | 4.759% | 2,500,000 | 2,497,475 | |
| Total | 5,297,475 | |||
| Maryland 0.8% | ||||
| State of Maryland Department of Transportation | ||||
| Revenue Bonds | ||||
| 2nd Issue | ||||
| Series 2018 | ||||
| 10/01/2024 | 5.000% | 1,000,000 | 1,017,800 | |
| Massachusetts 2.0% | ||||
| Berkshire Regional Transit Authority | ||||
| Revenue Notes | ||||
| RAN Series 2023 | ||||
| 07/25/2024 | 4.500% | 1,600,000 | 1,608,481 | |
| Massachusetts Educational Financing Authority(d) | ||||
| Revenue Bonds | ||||
| Education Loan | ||||
| Series 2014-I | ||||
| 01/01/2025 | 5.000% | 1,000,000 | 1,012,871 | |
| Total | 2,621,352 | |||
| Columbia Ultra Short Duration Municipal Bond Fund | Annual Report 2023 | 9 |
August 31, 2023
| Municipal Bonds (continued) | ||||
| Issue Description | Coupon Rate | Principal Amount ($) | Value ($) | |
| Michigan 5.8% | ||||
| Michigan Finance Authority | ||||
| Prerefunded 06/01/24 Revenue Bonds | ||||
| MidMichigan Health | ||||
| Series 2014 | ||||
| 06/01/2033 | 5.000% | 2,910,000 | 2,942,291 | |
| University of Michigan | ||||
| Prerefunded 04/01/24 Revenue Bonds | ||||
| Series 2014A | ||||
| 04/01/2031 | 4.500% | 3,110,000 | 3,131,599 | |
| Wayne County Airport Authority(d),(e) | ||||
| Refunding Revenue Bonds | ||||
| Detroit Metro Wayne County Airport | ||||
| Series 2017 | ||||
| 12/01/2025 | 4.000% | 1,500,000 | 1,503,035 | |
| Total | 7,576,925 | |||
| Minnesota 0.6% | ||||
| Minnesota Rural Water Finance Authority, Inc. | ||||
| Revenue Notes | ||||
| Public Projects Construction | ||||
| Series 2022 | ||||
| 12/01/2023 | 2.625% | 800,000 | 795,678 | |
| New Jersey 1.2% | ||||
| New Jersey Higher Education Student Assistance Authority(d) | ||||
| Revenue Bonds | ||||
| Series 2023B | ||||
| 12/01/2025 | 5.000% | 1,000,000 | 1,019,379 | |
| New Jersey Transportation Trust Fund Authority | ||||
| Revenue Bonds | ||||
| Series 2023AA | ||||
| 06/15/2025 | 5.000% | 500,000 | 511,974 | |
| Total | 1,531,353 | |||
| New York 5.1% | ||||
| New York State Urban Development Corp. | ||||
| Refunding Revenue Bonds | ||||
| Series 2020E | ||||
| 03/15/2024 | 5.000% | 2,135,000 | 2,154,357 | |
| Port Authority of New York & New Jersey(d) | ||||
| Refunding Revenue Bonds | ||||
| Series 2014-186 | ||||
| 10/15/2026 | 5.000% | 1,000,000 | 1,008,753 | |
| Triborough Bridge & Tunnel Authority(c) | ||||
| Refunding Revenue Bonds | ||||
| MTA Bridges and Tunnels | ||||
| Series 2021 (Mandatory Put 02/01/24) | ||||
| 0.7 x SOFR + 0.380% 01/01/2032 | 3.931% | 485,000 | 482,755 | |
| Municipal Bonds (continued) | ||||
| Issue Description | Coupon Rate | Principal Amount ($) | Value ($) | |
| Triborough Bridge & Tunnel Authority | ||||
| Refunding Revenue Bonds | ||||
| MTA Bridges and Tunnels | ||||
| Series 2023 | ||||
| 11/15/2025 | 5.000% | 2,000,000 | 2,075,242 | |
| Revenue Bonds | ||||
| BAN Series 2022A | ||||
| 08/15/2024 | 5.000% | 1,000,000 | 1,015,080 | |
| Total | 6,736,187 | |||
| North Carolina 0.9% | ||||
| North Carolina Medical Care Commission | ||||
| Revenue Bonds | ||||
| Friends Home, Inc. | ||||
| Series 2020B2 | ||||
| 09/01/2025 | 2.300% | 1,250,000 | 1,187,048 | |
| North Dakota 1.8% | ||||
| Cass County Joint Water Resource District | ||||
| Unlimited General Obligation Bonds | ||||
| Series 2021A | ||||
| 05/01/2024 | 0.480% | 2,500,000 | 2,420,294 | |
| Ohio 1.1% | ||||
| City of Columbus | ||||
| Unlimited General Obligation Bonds | ||||
| Series 2023A | ||||
| 08/15/2024 | 5.000% | 525,000 | 533,456 | |
| State of Ohio | ||||
| Revenue Bonds | ||||
| Series 2022-1 | ||||
| 12/15/2025 | 5.000% | 835,000 | 867,043 | |
| Total | 1,400,499 | |||
| Oregon 1.2% | ||||
| State of Oregon Department of Transportation | ||||
| Prerefunded 11/15/24 Revenue Bonds | ||||
| Series 2015A | ||||
| 11/15/2029 | 5.000% | 1,485,000 | 1,514,461 | |
| Pennsylvania 3.6% | ||||
| Bethlehem Area School District Authority(c) | ||||
| Refunding Revenue Bonds | ||||
| Series 2021 (Mandatory Put 11/01/25) | ||||
| 0.7 x SOFR + 0.350% 01/01/2032 | 3.901% | 1,780,000 | 1,741,294 | |
| Pennsylvania Turnpike Commission | ||||
| Refunding Revenue Bonds | ||||
| Series 2022B | ||||
| 12/01/2025 | 5.000% | 400,000 | 414,518 | |
| Revenue Bonds | ||||
| Subordinated Series 2017B-1 | ||||
| 06/01/2025 | 5.000% | 1,580,000 | 1,618,295 | |
| 10 | Columbia Ultra Short Duration Municipal Bond Fund | Annual Report 2023 |
August 31, 2023
| Municipal Bonds (continued) | ||||
| Issue Description | Coupon Rate | Principal Amount ($) | Value ($) | |
| Southeastern Pennsylvania Transportation Authority | ||||
| Revenue Bonds | ||||
| Asset Improvement Program | ||||
| Series 2022 | ||||
| 06/01/2024 | 5.000% | 1,000,000 | 1,012,415 | |
| Total | 4,786,522 | |||
| Rhode Island 0.8% | ||||
| Rhode Island Student Loan Authority(d) | ||||
| Revenue Bonds | ||||
| Series 2020A | ||||
| 12/01/2025 | 5.000% | 1,000,000 | 1,021,960 | |
| South Carolina 3.9% | ||||
| Patriots Energy Group Financing Agency(c) | ||||
| Revenue Bonds | ||||
| Series 2018B (Mandatory Put 02/01/24) | ||||
| 0.7 x 1-month USD LIBOR + 0.860% 10/01/2048 | 4.499% | 2,000,000 | 1,998,237 | |
| South Carolina Ports Authority(d) | ||||
| Prerefunded 07/01/25 Revenue Bonds | ||||
| Series 2015 | ||||
| 07/01/2050 | 5.250% | 2,000,000 | 2,050,082 | |
| South Carolina Public Service Authority | ||||
| Refunding Revenue Bonds | ||||
| Series 2021A | ||||
| 12/01/2025 | 5.000% | 1,000,000 | 1,027,794 | |
| Total | 5,076,113 | |||
| Texas 21.2% | ||||
| City of San Antonio Electric & Gas Systems | ||||
| Refunding Revenue Bonds | ||||
| Series 2022 | ||||
| 02/01/2024 | 5.000% | 2,500,000 | 2,515,915 | |
| Colorado River Municipal Water District | ||||
| Refunding Revenue Bonds | ||||
| Series 2017 | ||||
| 01/01/2025 | 5.000% | 1,055,000 | 1,076,367 | |
| County of Williamson | ||||
| Prerefunded 02/15/25 Unlimited General Obligation Bonds | ||||
| Series 2015 | ||||
| 02/15/2034 | 4.000% | 2,000,000 | 2,019,820 | |
| Dallas Fort Worth International Airport(f) | ||||
| Refunding Revenue Bonds | ||||
| Series 2023B | ||||
| 11/01/2024 | 5.000% | 660,000 | 670,621 | |
| Dallas Independent School District | ||||
| Unlimited General Obligation Refunding Bonds | ||||
| Series 2023 | ||||
| 02/15/2024 | 5.000% | 2,500,000 | 2,519,045 | |
| Municipal Bonds (continued) | ||||
| Issue Description | Coupon Rate | Principal Amount ($) | Value ($) | |
| Matagorda County Navigation District No. 1(d) | ||||
| Revenue Bonds | ||||
| Central Power and Light Co. Project | ||||
| Series 2020 (Mandatory Put 09/01/23) | ||||
| 05/01/2030 | 0.900% | 3,000,000 | 3,000,000 | |
| Pharr San Juan Alamo Independent School District | ||||
| Prerefunded 02/01/25 Unlimited General Obligation Bonds | ||||
| Series 2015 | ||||
| 02/01/2030 | 4.000% | 1,450,000 | 1,461,990 | |
| Plano Independent School District | ||||
| Unlimited General Obligation Bonds | ||||
| Series 2023 | ||||
| 02/15/2025 | 5.000% | 3,000,000 | 3,068,850 | |
| Spring Branch Independent School District | ||||
| Unlimited General Obligation Bonds | ||||
| Series 2022 | ||||
| 02/01/2024 | 5.000% | 1,000,000 | 1,006,366 | |
| State of Texas | ||||
| Unlimited General Obligation Bonds | ||||
| Texas Transportation Commission - Highway Improvement | ||||
| Series 2016 | ||||
| 04/01/2024 | 5.000% | 4,000,000 | 4,039,017 | |
| Unlimited General Obligation Refunding Bonds | ||||
| Water Financial Assistance | ||||
| Subordinated Series 2018 | ||||
| 08/01/2025 | 5.000% | 2,875,000 | 2,911,339 | |
| Texas Water Development Board | ||||
| Revenue Bonds | ||||
| State Revolving Fund | ||||
| Series 2018 | ||||
| 08/01/2024 | 5.000% | 1,610,000 | 1,632,093 | |
| State Water Implementation Fund | ||||
| Series 2019 | ||||
| 10/15/2025 | 5.000% | 1,905,000 | 1,973,567 | |
| Total | 27,894,990 | |||
| Utah 0.8% | ||||
| Utah Housing Corp. | ||||
| Revenue Bonds | ||||
| Moda Shoreline Apartments | ||||
| Series 2022 (Mandatory Put 09/01/24) | ||||
| 09/01/2025 | 4.000% | 1,000,000 | 997,155 | |
| Virginia 0.9% | ||||
| Virginia Port Authority Commonwealth Port Fund(d) | ||||
| Prerefunded 07/01/25 Revenue Bonds | ||||
| Series 2015 | ||||
| 07/01/2030 | 5.000% | 1,210,000 | 1,235,026 | |
| Columbia Ultra Short Duration Municipal Bond Fund | Annual Report 2023 | 11 |
August 31, 2023
| Municipal Bonds (continued) | ||||
| Issue Description | Coupon Rate | Principal Amount ($) | Value ($) | |
| Washington 2.9% | ||||
| King County School District No. 411 Issaquah | ||||
| Unlimited General Obligation Refunding Bonds | ||||
| Series 2022 | ||||
| 12/01/2025 | 5.000% | 600,000 | 622,567 | |
| Port of Seattle | ||||
| Refunding Revenue Bonds | ||||
| Private Activity | ||||
| Series 2021 | ||||
| 09/01/2025 | 5.000% | 1,100,000 | 1,125,492 | |
| State of Washington | ||||
| Unlimited General Obligation Bonds | ||||
| Series 2023C | ||||
| 06/01/2025 | 5.000% | 1,985,000 | 2,044,628 | |
| Total | 3,792,687 | |||
| Wisconsin 0.6% | ||||
| State of Wisconsin | ||||
| Unlimited General Obligation Refunding Bonds | ||||
| Series 2022-4 | ||||
| 05/01/2025 | 5.000% | 750,000 | 771,409 | |
| Total Municipal Bonds (Cost $119,035,074) | 118,305,749 | |||
| Municipal Short Term 7.3% | ||||
| Issue Description | Yield | Principal Amount ($) | Value ($) | |
| Indiana 0.6% | ||||
| Indiana Finance Authority(d) | ||||
| Revenue Bonds | ||||
| Republic Services, Inc. Project | ||||
| Series 2012 (Mandatory Put 09/01/23) | ||||
| 12/01/2037 | 4.300% | 750,000 | 750,000 | |
| Massachusetts 4.2% | ||||
| Brockton Area Transit Authority | ||||
| Revenue Notes | ||||
| RAN Series 2023 | ||||
| 07/26/2024 | 3.900% | 1,000,000 | 1,005,151 | |
| Merrimack Valley Regional Transit Authority | ||||
| Revenue Notes | ||||
| RAN Series 2023 | ||||
| 06/21/2024 | 3.860% | 1,500,000 | 1,507,146 | |
| Metrowest Regional Transit Authority | ||||
| Revenue Notes | ||||
| Series 2022 | ||||
| 09/15/2023 | 3.770% | 2,000,000 | 1,999,871 | |
| Municipal Short Term (continued) | ||||
| Issue Description | Yield | Principal Amount ($) | Value ($) | |
| Pioneer Valley Transit Authority | ||||
| Revenue Notes | ||||
| RAN Series 2023 | ||||
| 07/12/2024 | 3.790% | 1,000,000 | 1,007,835 | |
| Total | 5,520,003 | |||
| New Jersey 0.8% | ||||
| New Jersey Economic Development Authority | ||||
| Refunding Revenue Bonds | ||||
| Series 2023RRR | ||||
| 03/01/2024 | 3.700% | 1,000,000 | 1,006,418 | |
| Pennsylvania 1.4% | ||||
| Pennsylvania Economic Development Financing Authority(d) | ||||
| Revenue Bonds | ||||
| Republic Services, Inc. Project | ||||
| Series 2022 (Mandatory Put 01/16/24) | ||||
| 04/01/2049 | 4.200% | 900,000 | 899,363 | |
| Waste Management, Inc. Project | ||||
| Series 2013 (Mandatory Put 11/01/23) | ||||
| 07/31/2045 | 4.130% | 1,000,000 | 999,958 | |
| Total | 1,899,321 | |||
| Texas 0.3% | ||||
| City of Dallas | ||||
| Limited General Obligation Refunding Bonds | ||||
| Series 2023A | ||||
| 02/15/2024 | 3.360% | 425,000 | 428,125 | |
| Total Municipal Short Term (Cost $9,609,252) | 9,603,867 | |||
| Money Market Funds 0.1% | ||
| Shares | Value ($) | |
| JPMorgan Institutional Tax Free Money Market Fund, Institutional Shares, 3.904%(g) | 147,976 | 147,976 |
| Total Money Market Funds (Cost $147,976) | 147,976 | |
| Total Investments in Securities (Cost $131,492,302) | 130,757,592 | |
| Other Assets & Liabilities, Net | 540,491 | |
| Net Assets | $131,298,083 | |
| 12 | Columbia Ultra Short Duration Municipal Bond Fund | Annual Report 2023 |
August 31, 2023
| (a) | The Fund is entitled to receive principal and interest from the guarantor after a day or a week’s notice or upon maturity. The maturity date disclosed represents the final maturity. |
| (b) | Represents a variable rate security where the coupon rate adjusts on specified dates (generally daily or weekly) using the prevailing money market rate. The interest rate shown was the current rate as of August 31, 2023. |
| (c) | Variable rate security. The interest rate shown was the current rate as of August 31, 2023. |
| (d) | Income from this security may be subject to alternative minimum tax. |
| (e) | Represents privately placed and other securities and instruments exempt from Securities and Exchange Commission registration (collectively, private placements), such as Section 4(a)(2) and Rule 144A eligible securities, which are often sold only to qualified institutional buyers. At August 31, 2023, the total value of these securities amounted to $1,503,035, which represents 1.14% of total net assets. |
| (f) | Represents a security purchased on a when-issued basis. |
| (g) | The rate shown is the seven-day current annualized yield at August 31, 2023. |
| BAN | Bond Anticipation Note |
| FHA | Federal Housing Authority |
| LIBOR | London Interbank Offered Rate |
| RAN | Revenue Anticipation Note |
| SOFR | Secured Overnight Financing Rate |
| ■ | Level 1 — Valuations based on quoted prices for investments in active markets that the Fund has the ability to access at the measurement date. Valuation adjustments are not applied to Level 1 investments. |
| ■ | Level 2 — Valuations based on other significant observable inputs (including quoted prices for similar securities, interest rates, prepayment speeds, credit risks, etc.). |
| ■ | Level 3 — Valuations based on significant unobservable inputs (including the Fund’s own assumptions and judgment in determining the fair value of investments). |
| Columbia Ultra Short Duration Municipal Bond Fund | Annual Report 2023 | 13 |
August 31, 2023
The following table is a summary of the inputs used to value the Fund’s investments at August 31, 2023:
| Level 1 ($) | Level 2 ($) | Level 3 ($) | Total ($) | |
| Investments in Securities | ||||
| Floating Rate Notes | — | 2,700,000 | — | 2,700,000 |
| Municipal Bonds | — | 118,305,749 | — | 118,305,749 |
| Municipal Short Term | — | 9,603,867 | — | 9,603,867 |
| Money Market Funds | 147,976 | — | — | 147,976 |
| Total Investments in Securities | 147,976 | 130,609,616 | — | 130,757,592 |
| 14 | Columbia Ultra Short Duration Municipal Bond Fund | Annual Report 2023 |
August 31, 2023
| Assets | |
| Investments in securities, at value | |
| Unaffiliated issuers (cost $131,492,302) | $130,757,592 |
| Receivable for: | |
| Capital shares sold | 614,821 |
| Dividends | 1,357 |
| Interest | 1,498,498 |
| Prepaid expenses | 3,288 |
| Total assets | 132,875,556 |
| Liabilities | |
| Due to custodian | 8,122 |
| Payable for: | |
| Investments purchased on a delayed delivery basis | 670,679 |
| Capital shares redeemed | 562,728 |
| Distributions to shareholders | 300,331 |
| Management services fees | 757 |
| Distribution and/or service fees | 18 |
| Transfer agent fees | 6,591 |
| Trustees’ fees | 10,384 |
| Other expenses | 17,863 |
| Total liabilities | 1,577,473 |
| Net assets applicable to outstanding capital stock | $131,298,083 |
| Represented by | |
| Paid in capital | 134,656,955 |
| Total distributable earnings (loss) | (3,358,872) |
| Total - representing net assets applicable to outstanding capital stock | $131,298,083 |
| Class A | |
| Net assets | $4,224,337 |
| Shares outstanding | 423,810 |
| Net asset value per share | $9.97 |
| Advisor Class | |
| Net assets | $126,309,191 |
| Shares outstanding | 12,687,827 |
| Net asset value per share | $9.96 |
| Institutional Class | |
| Net assets | $752,689 |
| Shares outstanding | 75,521 |
| Net asset value per share | $9.97 |
| Institutional 3 Class | |
| Net assets | $11,866 |
| Shares outstanding | 1,192 |
| Net asset value per share(a) | $9.96 |
| (a) | Net asset value per share rounds to this amount due to fractional shares outstanding. |
| Columbia Ultra Short Duration Municipal Bond Fund | Annual Report 2023 | 15 |
Year Ended August 31, 2023
| Net investment income | |
| Income: | |
| Dividends — unaffiliated issuers | $231,323 |
| Interest | 5,096,010 |
| Total income | 5,327,333 |
| Expenses: | |
| Management services fees | 444,650 |
| Distribution and/or service fees | |
| Class A | 9,083 |
| Transfer agent fees | |
| Class A | 2,654 |
| Advisor Class | 88,446 |
| Institutional Class | 1,315 |
| Institutional 3 Class | 2 |
| Trustees’ fees | 19,456 |
| Custodian fees | 6,830 |
| Printing and postage fees | 10,234 |
| Registration fees | 76,628 |
| Accounting services fees | 30,090 |
| Legal fees | 14,683 |
| Interest on interfund lending | 781 |
| Compensation of chief compliance officer | 9 |
| Other | 46,980 |
| Total expenses | 751,841 |
| Fees waived or expenses reimbursed by Investment Manager and its affiliates | (32,747) |
| Expense reduction | (20) |
| Total net expenses | 719,074 |
| Net investment income | 4,608,259 |
| Realized and unrealized gain (loss) — net | |
| Net realized gain (loss) on: | |
| Investments — unaffiliated issuers | (1,347,001) |
| Net realized loss | (1,347,001) |
| Net change in unrealized appreciation (depreciation) on: | |
| Investments — unaffiliated issuers | 1,433,241 |
| Net change in unrealized appreciation (depreciation) | 1,433,241 |
| Net realized and unrealized gain | 86,240 |
| Net increase in net assets resulting from operations | $4,694,499 |
| 16 | Columbia Ultra Short Duration Municipal Bond Fund | Annual Report 2023 |
| Year Ended August 31, 2023 | Year Ended August 31, 2022 (a) | |
| Operations | ||
| Net investment income | $4,608,259 | $3,081,885 |
| Net realized loss | (1,347,001) | (796,845) |
| Net change in unrealized appreciation (depreciation) | 1,433,241 | (5,177,921) |
| Net increase (decrease) in net assets resulting from operations | 4,694,499 | (2,892,881) |
| Distributions to shareholders | ||
| Net investment income and net realized gains | ||
| Class A | (122,725) | (51,202) |
| Advisor Class | (4,423,029) | (2,713,640) |
| Institutional Class | (68,543) | (6,418) |
| Institutional 3 Class | (280) | (13,910) |
| Total distributions to shareholders | (4,614,577) | (2,785,170) |
| Decrease in net assets from capital stock activity | (147,309,527) | (292,742,453) |
| Redemption fees | — | 170 |
| Total decrease in net assets | (147,229,605) | (298,420,334) |
| Net assets at beginning of year | 278,527,688 | 576,948,022 |
| Net assets at end of year | $131,298,083 | $278,527,688 |
| Year Ended | Year Ended | |||
| August 31, 2023 | August 31, 2022 (a) | |||
| Shares | Dollars ($) | Shares | Dollars ($) | |
| Capital stock activity | ||||
| Class A | ||||
| Shares sold | 136,063 | 1,357,615 | 76,162 | 763,990 |
| Distributions reinvested | 11,868 | 118,411 | 5,066 | 50,745 |
| Shares redeemed | (545,836) | (5,452,382) | (393,090) | (3,940,940) |
| Net decrease | (397,905) | (3,976,356) | (311,862) | (3,126,205) |
| Advisor Class | ||||
| Shares sold | 6,578,796 | 65,547,289 | 35,773,136 | 359,829,889 |
| Distributions reinvested | 159,871 | 1,593,636 | 108,173 | 1,085,073 |
| Shares redeemed | (21,044,492) | (209,960,794) | (64,864,397) | (651,879,114) |
| Net decrease | (14,305,825) | (142,819,869) | (28,983,088) | (290,964,152) |
| Institutional Class | ||||
| Shares sold | 493,280 | 4,907,505 | 186,283 | 1,865,120 |
| Distributions reinvested | 965 | 9,629 | 635 | 6,351 |
| Shares redeemed | (544,459) | (5,430,436) | (61,183) | (612,381) |
| Net increase (decrease) | (50,214) | (513,302) | 125,735 | 1,259,090 |
| Institutional 3 Class | ||||
| Shares sold | — | — | 1,044,160 | 10,504,262 |
| Distributions reinvested | — | — | 833 | 8,348 |
| Shares redeemed | — | — | (1,043,801) | (10,423,796) |
| Net increase | — | — | 1,192 | 88,814 |
| Total net decrease | (14,753,944) | (147,309,527) | (29,168,023) | (292,742,453) |
| (a) | Institutional Class and Institutional 3 Class shares are based on operations from January 26, 2022 (commencement of operations) through the stated period end. |
| Columbia Ultra Short Duration Municipal Bond Fund | Annual Report 2023 | 17 |
| Net asset value, beginning of period | Net investment income | Net realized and unrealized gain (loss) | Total from investment operations | Distributions from net investment income | Distributions from net realized gains | Total distributions to shareholders | |
| Class A | |||||||
| Year Ended 8/31/2023 | $9.98 | 0.20 | 0.00(d) | 0.20 | (0.21) | — | (0.21) |
| Year Ended 8/31/2022 | $10.11 | 0.06 | (0.13) | (0.07) | (0.06) | — | (0.06) |
| Year Ended 8/31/2021(h) | $10.09 | 0.04 | 0.02 | 0.06 | (0.04) | — | (0.04) |
| Year Ended 8/31/2020 | $10.09 | 0.09 | 0.01 | 0.10 | (0.10) | — | (0.10) |
| Year Ended 8/31/2019 | $10.07 | 0.13 | 0.03 | 0.16 | (0.14) | — | (0.14) |
| Advisor Class | |||||||
| Year Ended 8/31/2023 | $9.97 | 0.22 | 0.00(d) | 0.22 | (0.23) | — | (0.23) |
| Year Ended 8/31/2022(i) | $10.10 | 0.07 | (0.13) | (0.06) | (0.07) | — | (0.07) |
| Year Ended 8/31/2021(h) | $10.08 | 0.06 | 0.03 | 0.09 | (0.07) | — | (0.07) |
| Year Ended 8/31/2020 | $10.09 | 0.13 | (0.01) | 0.12 | (0.13) | — | (0.13) |
| Year Ended 8/31/2019 | $10.06 | 0.17 | 0.03 | 0.20 | (0.17) | — | (0.17) |
| Institutional Class | |||||||
| Year Ended 8/31/2023 | $9.98 | 0.22 | (0.01)(j) | 0.21 | (0.22) | — | (0.22) |
| Year Ended 8/31/2022(k) | $10.07 | 0.07 | (0.10) | (0.03) | (0.06) | — | (0.06) |
| Institutional 3 Class | |||||||
| Year Ended 8/31/2023 | $9.97 | 0.23 | (0.01)(j) | 0.22 | (0.23) | — | (0.23) |
| Year Ended 8/31/2022(k) | $10.07 | 0.04 | (0.01) | 0.03 | (0.13) | — | (0.13) |
| Notes to Financial Highlights | |
| (a) | In addition to the fees and expenses that the Fund bears directly, the Fund indirectly bears a pro rata share of the fees and expenses of any other funds in which it invests. Such indirect expenses are not included in the Fund’s reported expense ratios. |
| (b) | Total net expenses include the impact of certain fee waivers/expense reimbursements made by the Investment Manager and certain of its affiliates, if applicable. |
| (c) | Total net expenses include the impact of certain fee waivers/expense reimbursements made by BMO Asset Management Corp, and certain of its affiliates, if applicable, for the account periods prior to the closing of the Reorganization, which occurred on January 21, 2022. |
| (d) | Rounds to zero. |
| (e) | Ratios include interfund lending expense which is less than 0.01%. |
| (f) | The benefits derived from expense reductions had an impact of less than 0.01%. |
| (g) | Ratios include line of credit interest expense which is less than 0.01%. |
| (h) | Net investment income (loss) per share calculated using the average shares method. |
| (i) | Redemption fees consisted of per share amounts less than $0.01. |
| (j) | Calculation of the net gain (loss) per share (both realized and unrealized) does not correlate to the aggregate realized and unrealized gain (loss) presented in the Statement of Operations due to timing of Fund shares sold and redeemed in relation to fluctuations in the market value of the portfolio. |
| (k) | Institutional Class and Institutional 3 Class shares commenced operations on January 26, 2022. Per share data and total return reflect activity from that date. |
| 18 | Columbia Ultra Short Duration Municipal Bond Fund | Annual Report 2023 |
| Net asset value, end of period | Total return | Total gross expense ratio to average net assets(a) | Total net expense ratio to average net assets(a),(b),(c) | Net investment income ratio to average net assets | Portfolio turnover | Net assets, end of period (000’s) | |
| Class A | |||||||
| Year Ended 8/31/2023 | $9.97 | 2.03% | 0.50%(e) | 0.48%(e),(f) | 2.02% | 82% | $4,224 |
| Year Ended 8/31/2022 | $9.98 | (0.74%) | 0.56%(e),(g) | 0.48%(e),(g) | 0.57% | 104% | $8,199 |
| Year Ended 8/31/2021(h) | $10.11 | 0.59% | 0.64% | 0.55% | 0.40% | 137% | $11,463 |
| Year Ended 8/31/2020 | $10.09 | 1.06% | 0.63% | 0.55% | 1.05% | 267% | $12,998 |
| Year Ended 8/31/2019 | $10.09 | 1.62% | 0.62% | 0.55% | 1.41% | 155% | $16,498 |
| Advisor Class | |||||||
| Year Ended 8/31/2023 | $9.96 | 2.18% | 0.35%(e) | 0.34%(e),(f) | 2.18% | 82% | $126,309 |
| Year Ended 8/31/2022(i) | $9.97 | (0.56%) | 0.38%(e),(g) | 0.29%(e),(g) | 0.72% | 104% | $269,063 |
| Year Ended 8/31/2021(h) | $10.10 | 0.85% | 0.39% | 0.30% | 0.64% | 137% | $565,485 |
| Year Ended 8/31/2020 | $10.08 | 1.21% | 0.38% | 0.30% | 1.28% | 267% | $523,605 |
| Year Ended 8/31/2019 | $10.09 | 1.98% | 0.37% | 0.30% | 1.66% | 155% | $541,859 |
| Institutional Class | |||||||
| Year Ended 8/31/2023 | $9.97 | 2.17% | 0.35%(e) | 0.35%(e),(f) | 2.24% | 82% | $753 |
| Year Ended 8/31/2022(k) | $9.98 | (0.33%) | 0.31%(e),(g) | 0.27%(e),(g) | 1.14% | 104% | $1,254 |
| Institutional 3 Class | |||||||
| Year Ended 8/31/2023 | $9.96 | 2.28% | 0.33%(e) | 0.25%(e) | 2.35% | 82% | $12 |
| Year Ended 8/31/2022(k) | $9.97 | 0.27% | 0.28%(e),(g) | 0.23%(e),(g) | 0.70% | 104% | $12 |
| Columbia Ultra Short Duration Municipal Bond Fund | Annual Report 2023 | 19 |
August 31, 2023
| 20 | Columbia Ultra Short Duration Municipal Bond Fund | Annual Report 2023 |
August 31, 2023
| Columbia Ultra Short Duration Municipal Bond Fund | Annual Report 2023 | 21 |
August 31, 2023
| 22 | Columbia Ultra Short Duration Municipal Bond Fund | Annual Report 2023 |
August 31, 2023
| Effective rate (%) | |
| Class A | 0.04 |
| Advisor Class | 0.04 |
| Institutional Class | 0.04 |
| Institutional 3 Class | 0.02 |
| Columbia Ultra Short Duration Municipal Bond Fund | Annual Report 2023 | 23 |
August 31, 2023
| Fee rate(s) contractual through December 31, 2023 | |
| Class A | 0.51% |
| Advisor Class | 0.36 |
| Institutional Class | 0.36 |
| Institutional 3 Class | 0.25 |
| Year Ended August 31, 2023 | Year Ended August 31, 2022 | ||||||
| Ordinary income ($) | Tax-exempt income ($) | Long-term capital gains ($) | Total ($) | Ordinary income ($) | Tax-exempt income ($) | Long-term capital gains ($) | Total ($) |
| 8,451 | 4,606,126 | — | 4,614,577 | 7,181 | 2,777,989 | — | 2,785,170 |
| Undistributed ordinary income ($) | Undistributed tax- exempt income ($) | Undistributed long-term capital gains ($) | Capital loss carryforwards ($) | Net unrealized (depreciation) ($) |
| — | 573,011 | — | (2,887,883) | (734,710) |
| 24 | Columbia Ultra Short Duration Municipal Bond Fund | Annual Report 2023 |
August 31, 2023
| Federal tax cost ($) | Gross unrealized appreciation ($) | Gross unrealized (depreciation) ($) | Net unrealized (depreciation) ($) |
| 131,492,302 | 131,188 | (865,898) | (734,710) |
| No expiration short-term ($) | No expiration long-term ($) | Total ($) | Utilized ($) |
| (984,197) | (1,903,686) | (2,887,883) | — |
| Borrower or lender | Average loan balance ($) | Weighted average interest rate (%) | Number of days with outstanding loans |
| Borrower | 1,060,000 | 5.25 | 5 |
| Columbia Ultra Short Duration Municipal Bond Fund | Annual Report 2023 | 25 |
August 31, 2023
| 26 | Columbia Ultra Short Duration Municipal Bond Fund | Annual Report 2023 |
August 31, 2023
| Columbia Ultra Short Duration Municipal Bond Fund | Annual Report 2023 | 27 |
August 31, 2023
| 28 | Columbia Ultra Short Duration Municipal Bond Fund | Annual Report 2023 |
| Columbia Ultra Short Duration Municipal Bond Fund | Annual Report 2023 | 29 |
| Exempt- interest dividends | |
| 99.82% |
| Name, address, year of birth | Position held with the Columbia Funds and length of service | Principal occupation(s) during past five years and other relevant professional experience | Number of Funds in the Columbia Funds Complex* overseen | Other directorships held by Trustee during the past five years and other relevant Board experience |
| George S. Batejan c/o Columbia Management Investment Advisers, LLC 290 Congress Street Boston, MA 02210 1954 | Trustee since 2017 | Executive Vice President, Global Head of Technology and Operations, Janus Capital Group, Inc., 2010-2016 | 173 | Former Chairman of the Board, NICSA (National Investment Company Services Association) (Executive Committee, Nominating Committee and Governance Committee), 2014-2016; former Director, Intech Investment Management, 2011-2016; former Board Member, Metro Denver Chamber of Commerce, 2015-2016; former Advisory Board Member, University of Colorado Business School, 2015-2018; former Board Member, Chase Bank International, 1993-1994 |
| 30 | Columbia Ultra Short Duration Municipal Bond Fund | Annual Report 2023 |
(Unaudited)
Independent trustees (continued)
| Name, address, year of birth | Position held with the Columbia Funds and length of service | Principal occupation(s) during past five years and other relevant professional experience | Number of Funds in the Columbia Funds Complex* overseen | Other directorships held by Trustee during the past five years and other relevant Board experience |
| Kathleen Blatz c/o Columbia Management Investment Advisers, LLC 290 Congress Street Boston, MA 02210 1954 | Trustee since 2006 | Attorney, specializing in arbitration and mediation; Chief Justice, Minnesota Supreme Court, 1998-2006; Associate Justice, Minnesota Supreme Court, 1996-1998; Fourth Judicial District Court Judge, Hennepin County, 1994-1996; Attorney in private practice and public service, 1984-1993; State Representative, Minnesota House of Representatives, 1979-1993, which included service on the Tax and Financial Institutions and Insurance Committees; Member and Interim Chair, Minnesota Sports Facilities Authority, January-July 2017; Interim President and Chief Executive Officer, Blue Cross and Blue Shield of Minnesota (health care insurance), February-July 2018, April-October 2021 | 173 | Former Trustee, Blue Cross and Blue Shield of Minnesota, 2009-2021 (Chair of the Business Development Committee, 2014-2017; Chair of the Governance Committee, 2017-2019); former Member and Chair of the Board, Minnesota Sports Facilities Authority, January 2017-July 2017; former Director, Robina Foundation, 2009-2020 (Chair, 2014-2020); Director, Richard M. Schulze Family Foundation, since 2021 |
| Pamela G. Carlton c/o Columbia Management Investment Advisers, LLC 290 Congress Street Boston, MA 02210 1954 | Chair since 2023; Trustee since 2007 | President, Springboard – Partners in Cross Cultural Leadership (consulting company), since 2003; Managing Director of US Equity Research, JP Morgan Chase, 1999-2003; Director of US Equity Research, Chase Asset Management, 1996-1999; Co-Director Latin America Research, 1993-1996, COO Global Research, 1992-1996, Co-Director of US Research, 1991-1992, Investment Banker, 1982-1991, Morgan Stanley; Attorney, Cleary Gottlieb Steen & Hamilton LLP, 1980-1982 | 173 | Trustee, New York Presbyterian Hospital Board, since 1996; Director, DR Bank (Audit Committee) since 2017; Director, Evercore Inc. (Audit Committee, Nominating and Governance Committee), since 2019; Director, Apollo Commercial Real Estate Finance, Inc. (Chair, Nominating and Governance Committee) (financial services), since 2021; the Governing Council of the Independent Directors Council (IDC), since 2021 |
| Janet Langford Carrig c/o Columbia Management Investment Advisers, LLC 290 Congress Street Boston, MA 02210 1957 | Trustee since 1996 | Senior Vice President, General Counsel and Corporate Secretary, ConocoPhillips (independent energy company), September 2007-October 2018 | 173 | Director, EQT Corporation (natural gas producer), since 2019; former Director, Whiting Petroleum Corporation (independent oil and gas company), 2020-2022 |
| J. Kevin Connaughton c/o Columbia Management Investment Advisers, LLC 290 Congress Street Boston, MA 02210 1964 | Trustee since 2020 | CEO and President, RhodeWay Financial (non-profit financial planning firm), since December 2022; Member, FINRA National Adjudicatory Council, since January 2020; Adjunct Professor of Finance, Bentley University since January 2018; Consultant to Independent Trustees of CFVIT and CFST I from March 2016 to June 2020 with respect to CFVIT and to December 2020 with respect to CFST I; Managing Director and General Manager of Mutual Fund Products, Columbia Management Investment Advisers, LLC, May 2010-February 2015; President, Columbia Funds, 2008-2015; and senior officer of Columbia Funds and affiliated funds, 2003-2015 | 171 | Former Director, The Autism Project, March 2015-December 2021; former Member of the Investment Committee, St. Michael’s College, November 2015-February 2020; former Trustee, St. Michael’s College, June 2017-September 2019; former Trustee, New Century Portfolios (former mutual fund complex), January 2015-December 2017 |
| Columbia Ultra Short Duration Municipal Bond Fund | Annual Report 2023 | 31 |
(Unaudited)
Independent trustees (continued)
| Name, address, year of birth | Position held with the Columbia Funds and length of service | Principal occupation(s) during past five years and other relevant professional experience | Number of Funds in the Columbia Funds Complex* overseen | Other directorships held by Trustee during the past five years and other relevant Board experience |
| Olive M. Darragh c/o Columbia Management Investment Advisers, LLC 290 Congress Street Boston, MA 02210 1962 | Trustee since 2020 | Managing Director of Darragh Inc. (strategy and talent management consulting firm), since 2010; Founder and CEO, Zolio, Inc. (investment management talent identification platform), since 2004; Consultant to Independent Trustees of CFVIT and CFST I from June 2019 to June 2020 with respect to CFVIT and to December 2020 with respect to CFST I; Partner, Tudor Investments, 2004-2010; Senior Partner, McKinsey & Company (consulting), 1990-2004; Touche Ross CPA, 1985-1988 | 171 | Treasurer, Edinburgh University US Trust Board, since January 2023; Member, HBS Community Action Partners Board, since September 2022; former Director, University of Edinburgh Business School (Member of US Board), 2004-2019; former Director, Boston Public Library Foundation, 2008-2017 |
| Patricia M. Flynn c/o Columbia Management Investment Advisers, LLC 290 Congress Street Boston, MA 02210 1950 | Trustee since 2004 | Professor of Economics and Management, Bentley University, since 2002; Dean, McCallum Graduate School of Business, Bentley University, 1992-2002 | 173 | Former Trustee, MA Taxpayers Foundation, 1997-2022; former Director, The MA Business Roundtable, 2003-2019; former Chairperson, Innovation Index Advisory Committee, MA Technology Collaborative, 1997-2020 |
| Brian J. Gallagher c/o Columbia Management Investment Advisers, LLC 290 Congress Street Boston, MA 02210 1954 | Trustee since 2017 | Retired; Partner with Deloitte & Touche LLP and its predecessors, 1977-2016 | 173 | Trustee, Catholic Schools Foundation, since 2004 |
| Douglas A. Hacker c/o Columbia Management Investment Advisers, LLC 290 Congress Street Boston, MA 02210 1955 | Trustee since 1996 | Independent business executive, since May 2006; Executive Vice President – Strategy of United Airlines, December 2002 - May 2006; President of UAL Loyalty Services (airline marketing company), September 2001-December 2002; Executive Vice President and Chief Financial Officer of United Airlines, July 1999-September 2001 | 173 | Director, SpartanNash Company since November 2013 (Chair of the Board, since May 2021) (food distributor); Director, Aircastle Limited (Chair of Audit Committee) (aircraft leasing), since August 2006; former Director, Nash Finch Company (food distributor), 2005-2013; former Director, SeaCube Container Leasing Ltd. (container leasing), 2010-2013; and former Director, Travelport Worldwide Limited (travel information technology), 2014-2019 |
| Nancy T. Lukitsh c/o Columbia Management Investment Advisers, LLC 290 Congress Street Boston, MA 02210 1956 | Trustee since 2011 | Senior Vice President, Partner and Director of Marketing, Wellington Management Company, LLP (investment adviser), 1997-2010; Chair, Wellington Management Portfolios (commingled non-U.S. investment pools), 2007-2010; Director, Wellington Trust Company, NA and other Wellington affiliates, 1997-2010 | 171 | None |
| 32 | Columbia Ultra Short Duration Municipal Bond Fund | Annual Report 2023 |
(Unaudited)
Independent trustees (continued)
| Name, address, year of birth | Position held with the Columbia Funds and length of service | Principal occupation(s) during past five years and other relevant professional experience | Number of Funds in the Columbia Funds Complex* overseen | Other directorships held by Trustee during the past five years and other relevant Board experience |
| David M. Moffett c/o Columbia Management Investment Advisers, LLC 290 Congress Street Boston, MA 02210 1952 | Trustee since 2011 | Retired; former Chief Executive Officer of Freddie Mac and Chief Financial Officer of U.S. Bank | 171 | Director, CSX Corporation (transportation suppliers); Director, PayPal Holdings Inc. (payment and data processing services); Trustee, University of Oklahoma Foundation; former Director, eBay Inc. (online trading community), 2007-2015; and former Director, CIT Bank, CIT Group Inc. (commercial and consumer finance), 2010-2016; former Senior Adviser to The Carlyle Group (financial services), March 2008-September 2008; former Governance Consultant to Bridgewater Associates, January 2013-December 2015 |
| Catherine James Paglia c/o Columbia Management Investment Advisers, LLC 290 Congress Street Boston, MA 02210 1952 | Trustee since 2004 | Director, Enterprise Asset Management, Inc. (private real estate and asset management company), since September 1998; Managing Director and Partner, Interlaken Capital, Inc., 1989-1997; Vice President, 1982-1985, Principal, 1985-1987, Managing Director, 1987-1989, Morgan Stanley; Vice President, Investment Banking, 1980-1982, Associate, Investment Banking, 1976-1980, Dean Witter Reynolds, Inc. | 173 | Director, Valmont Industries, Inc. (irrigation systems manufacturer), since 2012; Trustee, Carleton College (on the Investment Committee), since 1987; Trustee, Carnegie Endowment for International Peace (on the Investment Committee), since 2009 |
| Natalie A. Trunow c/o Columbia Management Investment Advisers, LLC 290 Congress Street Boston, MA 02210 1967 | Trustee since 2020 | Chief Executive Officer, Millennial Portfolio Solutions LLC (asset management and consulting services), January 2016-January 2021; Non-executive Member of the Investment Committee and Valuation Committee, Sarona Asset Management Inc. (private equity firm) since September 2019; Advisor, Horizon Investments (asset management and consulting services), August 2018-January 2022; Advisor, Paradigm Asset Management, November 2016-January 2022; Consultant to Independent Trustees of CFVIT and CFST I from September 2016 to June 2020 with respect to CFVIT and to December 2020 with respect to CFST I; Director of Investments/Consultant, Casey Family Programs, April 2016-November 2016; Senior Vice President and Chief Investment Officer, Calvert Investments, August 2008-January 2016; Section Head and Portfolio Manager, General Motors Asset Management, June 1997-August 2008 | 171 | Independent Director, Investment Committee, Health Services for Children with Special Needs, Inc., 2010-2021; Independent Director, (Executive Committee and Chair, Audit Committee), Consumer Credit Counseling Services (formerly Guidewell Financial Solutions), since 2016; Independent Director, (Investment Committee), Sarona Asset Management, since 2019 |
| Columbia Ultra Short Duration Municipal Bond Fund | Annual Report 2023 | 33 |
(Unaudited)
Independent trustees (continued)
| Name, address, year of birth | Position held with the Columbia Funds and length of service | Principal occupation(s) during past five years and other relevant professional experience | Number of Funds in the Columbia Funds Complex* overseen | Other directorships held by Trustee during the past five years and other relevant Board experience |
| Sandra L. Yeager c/o Columbia Management Investment Advisers, LLC 290 Congress Street Boston, MA 02210 1964 | Trustee since 2017 | Retired; President and founder, Hanoverian Capital, LLC (SEC registered investment advisor firm), 2008-2016; Managing Director, DuPont Capital, 2006-2008; Managing Director, Morgan Stanley Investment Management, 2004-2006; Senior Vice President, Alliance Bernstein, 1990-2004 | 173 | Former Director, NAPE (National Alliance for Partnerships in Equity) Education Foundation, October 2016-October 2020; Advisory Board, Jennersville YMCA, since 2022 |
| Name, address, year of birth | Position held with the Columbia Funds and length of service | Principal occupation(s) during the past five years and other relevant professional experience | Number of Funds in the Columbia Funds Complex* overseen | Other directorships held by Trustee during the past five years and other relevant Board experience |
| Daniel J. Beckman c/o Columbia Management Investment Advisers, LLC 290 Congress Street Boston, MA 02210 1962 | Trustee since November 2021 and President since June 2021 | Vice President – Head of North America Product, Columbia Management Investment Advisers, LLC, since April 2015; President and Principal Executive Officer of the Columbia Funds, since June 2021; officer of Columbia Funds and affiliated funds, 2020-2021 | 173 | Director, Ameriprise Trust Company, since October 2016; Director, Columbia Management Investment Distributors, Inc. since November 2018; Board of Governors, Columbia Wanger Asset Management, LLC since, January 2022; Director, Columbia Threadneedle Canada, Inc., since December 2022 |
| * | The term “Columbia Funds Complex” as used herein includes Columbia Seligman Premium Technology Growth Fund, Tri-Continental Corporation and each series of Columbia Funds Series Trust (CFST), Columbia Funds Series Trust I (CFST I), Columbia Funds Series Trust II (CFST II), Columbia ETF Trust I (CET I), Columbia ETF Trust II (CET II), Columbia Funds Variable Insurance Trust (CFVIT) and Columbia Funds Variable Series Trust II (CFVST II). Messrs. Batejan, Beckman, Gallagher and Hacker and Mses. Blatz, Carlton, Carrig, Flynn, Paglia, and Yeager serve as directors of Columbia Seligman Premium Technology Growth Fund and Tri-Continental Corporation. |
| ** | Interested person (as defined under the 1940 Act) by reason of being an officer, director, security holder and/or employee of the Investment Manager or Ameriprise Financial. |
| 34 | Columbia Ultra Short Duration Municipal Bond Fund | Annual Report 2023 |
(Unaudited)
The Board has appointed officers who are responsible for day-to-day business decisions based on policies it has established. The officers serve at the pleasure of the Board. The following table provides basic information about the Officers of the Fund as of the printing of this report, including principal occupations during the past five years, although their specific titles may have varied over the period. In addition to Mr. Beckman, who is President and Principal Executive Officer, the Fund’s other officers are:
| Name, address and year of birth | Position and year first appointed to position for any Fund in the Columbia Funds Complex or a predecessor thereof | Principal occupation(s) during past five years |
| Michael G. Clarke 290 Congress Street Boston, MA 02210 1969 | Chief Financial Officer and Principal Financial Officer (2009) and Senior Vice President (2019) | Senior Vice President and North America Head of Operations & Investor Services, Columbia Management Investment Advisers, LLC, since June 2023 (previously Senior Vice President and Head of Global Operations, March 2022 – June 2023, Vice President, Head of North America Operations, and Co-Head of Global Operations, June 2019 - February 2022 and Vice President – Accounting and Tax, May 2010 - May 2019); senior officer of Columbia Funds and affiliated funds, since 2002. Director, Ameriprise Trust Company, since June 2023. |
| Joseph Beranek 5890 Ameriprise Financial Center Minneapolis, MN 55474 1965 | Treasurer and Chief Accounting Officer (Principal Accounting Officer) (2019) and Principal Financial Officer (2020), CFST, CFST I, CFST II, CFVIT and CFVST II; Assistant Treasurer, CET I and CET II | Vice President – Mutual Fund Accounting and Financial Reporting, Columbia Management Investment Advisers, LLC, since December 2018 and March 2017, respectively. |
| Marybeth Pilat 290 Congress Street Boston, MA 02210 1968 | Treasurer and Chief Accounting Officer (Principal Accounting Officer) and Principal Financial Officer (2020) for CET I and CET II; Assistant Treasurer, CFST, CFST I, CFST II, CFVIT and CFVST II | Vice President – Product Pricing and Administration, Columbia Management Investment Advisers, LLC, since May 2017. |
| William F. Truscott 290 Congress Street Boston, MA 02210 1960 | Senior Vice President (2001) | Formerly, Trustee/Director of Columbia Funds Complex or legacy funds, November 2001 - January 1, 2021; Chief Executive Officer, Global Asset Management, Ameriprise Financial, Inc., since September 2012; Chairman of the Board and President, Columbia Management Investment Advisers, LLC, since July 2004 and February 2012, respectively; Chairman of the Board and Chief Executive Officer, Columbia Management Investment Distributors, Inc., since November 2008 and February 2012, respectively; Chairman of the Board and Director, Threadneedle Asset Management Holdings, Sàrl, since March 2013 and December 2008, respectively; senior executive of various entities affiliated with Columbia Threadneedle. |
| Christopher O. Petersen 5228 Ameriprise Financial Center Minneapolis, MN 55474 1970 | Senior Vice President and Assistant Secretary (2021) | Formerly, Trustee/Director of funds within the Columbia Funds Complex, July 1, 2020 - November 22, 2021; Senior Vice President and Assistant General Counsel, Ameriprise Financial, Inc., since September 2021 (previously Vice President and Lead Chief Counsel, January 2015 - September 2021); formerly, President and Principal Executive Officer of the Columbia Funds, 2015 - 2021; officer of Columbia Funds and affiliated funds, since 2007. |
| Thomas P. McGuire 290 Congress Street Boston, MA 02210 1972 | Senior Vice President and Chief Compliance Officer (2012) | Vice President – Asset Management Compliance, Ameriprise Financial, Inc., since May 2010; Chief Compliance Officer, Columbia Acorn/Wanger Funds, since December 2015; formerly, Chief Compliance Officer, Ameriprise Certificate Company, September 2010 – September 2020. |
| Ryan C. Larrenaga 290 Congress Street Boston, MA 02210 1970 | Senior Vice President (2017), Chief Legal Officer (2017), and Secretary (2015) | Vice President and Chief Counsel, Ameriprise Financial, Inc., since August 2018 (previously Vice President and Group Counsel, August 2011 - August 2018); Chief Legal Officer, Columbia Acorn/Wanger Funds, since September 2020; officer of Columbia Funds and affiliated funds, since 2005. |
| Columbia Ultra Short Duration Municipal Bond Fund | Annual Report 2023 | 35 |
(Unaudited)
Fund officers (continued)
| Name, address and year of birth | Position and year first appointed to position for any Fund in the Columbia Funds Complex or a predecessor thereof | Principal occupation(s) during past five years |
| Michael E. DeFao 290 Congress Street Boston, MA 02210 1968 | Vice President (2011) and Assistant Secretary (2010) | Vice President and Chief Counsel, Ameriprise Financial, Inc., since May 2010; Vice President, Chief Legal Officer and Assistant Secretary, Columbia Management Investment Advisers, LLC, since October 2021 (previously Vice President and Assistant Secretary, May 2010 – September 2021). |
| Lyn Kephart-Strong 5903 Ameriprise Financial Center Minneapolis, MN 55474 1960 | Vice President (2015) | Vice President, Global Investment Operations Services, Columbia Management Investment Advisers, LLC, since 2010; Director (since January 2007) and President (since October 2014), Columbia Management Investment Services Corp.; Director (since December 2017) and President (since January 2017), Ameriprise Trust Company. |
| • | the Fund had sufficient liquidity to both meet redemptions and operate effectively on behalf of shareholders; |
| • | there were no material changes to the Program during the period; |
| • | the implementation of the Program was effective to manage the Fund’s liquidity risk; and |
| • | the Program operated adequately during the period. |
| 36 | Columbia Ultra Short Duration Municipal Bond Fund | Annual Report 2023 |
(Unaudited)
Columbia Management Investment Advisers, LLC (the Investment Manager, and together with its domestic and global affiliates, Columbia Threadneedle Investments), a wholly-owned subsidiary of Ameriprise Financial, Inc. (Ameriprise Financial), serves as the investment manager to Columbia Ultra Short Duration Municipal Bond Fund (the Fund). Under a management agreement (the Management Agreement), the Investment Manager provides investment advice and other services to the Fund and other funds distributed by Columbia Management Investment Distributors, Inc. (collectively, the Funds).
| • | Information on the investment performance of the Fund relative to the performance of a group of mutual funds determined to be comparable to the Fund by Broadridge, as well as performance relative to one or more benchmarks; |
| • | Information on the Fund’s management fees and total expenses, including information comparing the Fund’s expenses to those of a group of comparable mutual funds, as determined by Broadridge; |
| • | The Investment Manager’s agreement to contractually limit or cap total operating expenses for the Fund so that total operating expenses (excluding certain fees and expenses, such as transaction costs and certain other investment related expenses, interest, taxes, acquired fund fees and expenses and infrequent and/or unusual expenses) would not exceed a specified annual rate, as a percentage of the Fund’s net assets; |
| • | Terms of the Management Agreement; |
| • | Descriptions of other agreements and arrangements with affiliates of the Investment Manager relating to the operations of the Fund, including agreements with respect to the provision of transfer agency and shareholder services to the Fund; |
| • | Descriptions of various services performed by the Investment Manager under the Management Agreement, including portfolio management and portfolio trading practices; |
| • | Information regarding any recently negotiated management fees of similarly-managed portfolios of other institutional clients of the Investment Manager; |
| • | Information regarding the resources of the Investment Manager, including information regarding senior management, portfolio managers and other personnel; |
| • | Information regarding the capabilities of the Investment Manager with respect to compliance monitoring services; |
| • | The profitability to the Investment Manager and its affiliates from their relationships with the Fund; and |
| • | Report provided by the Board’s independent fee consultant, JDL Consultants, LLC (JDL). |
| Columbia Ultra Short Duration Municipal Bond Fund | Annual Report 2023 | 37 |
(Unaudited)
Following an analysis and discussion of the foregoing, and the factors identified below, the Board, including all of the Independent Trustees, approved the renewal of the Management Agreement.
| 38 | Columbia Ultra Short Duration Municipal Bond Fund | Annual Report 2023 |
(Unaudited)
The Board considered the reports of JDL, which assisted in the Board’s analysis of the Funds’ performance and expenses and the reasonableness of the Funds’ fee rates. The Board accorded particular weight to the notion that a primary objective of the level of fees is to achieve a rational pricing model applied consistently across the various product lines in the Fund family, while assuring that the overall fees for each Fund (with certain exceptions) are generally in line with the current “pricing philosophy” such that Fund total expense ratios, in general, approximate or are lower than the median expense ratios of funds in the same Lipper comparison universe. The Board took into account that the Fund’s total expense ratio (after considering proposed expense caps/waivers) approximated the peer universe’s median expense ratio.
| Columbia Ultra Short Duration Municipal Bond Fund | Annual Report 2023 | 39 |
columbiathreadneedleus.com/investor/. The Fund is distributed by Columbia Management Investment Distributors, Inc., member FINRA, and managed by Columbia Management Investment Advisers, LLC.

August 31, 2023

| 3 | |
| 5 | |
| 7 | |
| 8 | |
| 12 | |
| 14 | |
| 15 | |
| 18 | |
| 22 | |
| 32 | |
| 33 | |
| 33 | |
| 39 | |
| 40 |
(Unaudited)
| Average annual total returns (%) (for the period ended August 31, 2023) | |||||
| Inception | 1 Year | 5 Years | 10 Years | ||
| Class A* | Excluding sales charges | 05/27/14 | 8.83 | 6.12 | 8.92 |
| Including sales charges | 2.57 | 4.87 | 8.28 | ||
| Advisor Class | 01/31/08 | 9.10 | 6.38 | 9.20 | |
| Class C* | Excluding sales charges | 01/26/22 | 7.88 | 5.30 | 8.10 |
| Including sales charges | 6.93 | 5.30 | 8.10 | ||
| Institutional Class* | 01/26/22 | 9.12 | 6.38 | 9.20 | |
| Institutional 2 Class* | 01/26/22 | 9.21 | 6.42 | 9.22 | |
| Institutional 3 Class* | 01/26/22 | 9.19 | 6.43 | 9.22 | |
| Class R* | 01/26/22 | 8.49 | 5.85 | 8.65 | |
| Russell 1000 Value Index | 8.59 | 7.11 | 9.15 | ||
| * | The returns shown for periods prior to the share class inception date (including returns for the Life of the Fund, if shown, which are since Fund inception) include the returns of the Fund’s oldest share class. These returns are adjusted to reflect any higher class-related operating expenses of the newer share classes, as applicable. Please visit columbiathreadneedleus.com/investor/investment-products/mutual-funds/appended-performance for more information. |
| Columbia Integrated Large Cap Value Fund | Annual Report 2023 | 3 |
(Unaudited)

| Portfolio breakdown (%) (at August 31, 2023) | |
| Common Stocks | 98.3 |
| Money Market Funds | 1.7 |
| Total | 100.0 |
| Equity sector breakdown (%) (at August 31, 2023) | |
| Communication Services | 7.1 |
| Consumer Discretionary | 5.5 |
| Consumer Staples | 8.7 |
| Energy | 9.1 |
| Financials | 19.1 |
| Health Care | 16.3 |
| Industrials | 12.6 |
| Information Technology | 11.6 |
| Materials | 2.1 |
| Real Estate | 4.3 |
| Utilities | 3.6 |
| Total | 100.0 |
| 4 | Columbia Integrated Large Cap Value Fund | Annual Report 2023 |
(Unaudited)
| • | Overall sector allocation was additive to relative performance. |
| • | Overall stock selection was also additive to relative performance. |
| • | The Fund’s underweight to the utilities sector was the top contributor from a sector allocation perspective, followed by an overweight to the industrials sector and slight overweight to the consumer discretionary sector. |
| • | Stock selection in the communication services sector was the largest positive contribution for the period, followed by the health care and consumer staples sectors. |
| • | The three largest individual contributors to the fund were Meta Platforms, Inc., Horizon Therapeutics PLC and Exxon Mobil Corp. We sold the Fund’s position in Horizon Therapeutics. |
| • | The Fund’s slight overweight to the real estate sector was the top detractor from a sector allocation perspective, followed closely by an overweight to the consumer staples sector and an underweight to the materials sector. |
| • | Stock selection in the financials sector was the largest detractor for the period, followed by the materials and information technology sectors. |
| • | The three largest individual detractors to the fund were CVS Health Corp., KeyCorp, and Fidelity National Information Services, Inc. |
| Columbia Integrated Large Cap Value Fund | Annual Report 2023 | 5 |
(Unaudited)
| 6 | Columbia Integrated Large Cap Value Fund | Annual Report 2023 |
(Unaudited)
| March 1, 2023 — August 31, 2023 | |||||||
| Account value at the beginning of the period ($) | Account value at the end of the period ($) | Expenses paid during the period ($) | Fund’s annualized expense ratio (%) | ||||
| Actual | Hypothetical | Actual | Hypothetical | Actual | Hypothetical | Actual | |
| Class A | 1,000.00 | 1,000.00 | 1,039.20 | 1,021.22 | 4.06 | 4.02 | 0.79 |
| Advisor Class | 1,000.00 | 1,000.00 | 1,040.40 | 1,022.48 | 2.78 | 2.75 | 0.54 |
| Class C | 1,000.00 | 1,000.00 | 1,034.40 | 1,017.44 | 7.90 | 7.83 | 1.54 |
| Institutional Class | 1,000.00 | 1,000.00 | 1,040.20 | 1,022.48 | 2.78 | 2.75 | 0.54 |
| Institutional 2 Class | 1,000.00 | 1,000.00 | 1,041.40 | 1,022.94 | 2.32 | 2.29 | 0.45 |
| Institutional 3 Class | 1,000.00 | 1,000.00 | 1,040.90 | 1,023.19 | 2.06 | 2.04 | 0.40 |
| Class R | 1,000.00 | 1,000.00 | 1,037.60 | 1,019.96 | 5.34 | 5.30 | 1.04 |
| Columbia Integrated Large Cap Value Fund | Annual Report 2023 | 7 |
August 31, 2023
| Common Stocks 98.2% | ||
| Issuer | Shares | Value ($) |
| Communication Services 7.0% | ||
| Entertainment 1.5% | ||
| Electronic Arts, Inc. | 25,176 | 3,020,617 |
| Interactive Media & Services 3.4% | ||
| Alphabet, Inc., Class C(a) | 20,917 | 2,872,950 |
| Meta Platforms, Inc., Class A(a) | 9,440 | 2,793,201 |
| Pinterest, Inc., Class A(a) | 44,916 | 1,234,741 |
| Total | 6,900,892 | |
| Media 2.1% | ||
| Charter Communications, Inc., Class A(a) | 4,159 | 1,822,141 |
| Comcast Corp., Class A | 52,853 | 2,471,406 |
| Total | 4,293,547 | |
| Total Communication Services | 14,215,056 | |
| Consumer Discretionary 5.4% | ||
| Auto Components 1.6% | ||
| Aptiv PLC(a) | 20,446 | 2,074,247 |
| Gentex Corp. | 34,373 | 1,122,622 |
| Total | 3,196,869 | |
| Hotels, Restaurants & Leisure 1.7% | ||
| Expedia Group, Inc.(a) | 32,191 | 3,489,182 |
| Specialty Retail 2.1% | ||
| AutoZone, Inc.(a) | 1,648 | 4,171,632 |
| Total Consumer Discretionary | 10,857,683 | |
| Consumer Staples 8.6% | ||
| Beverages 1.7% | ||
| PepsiCo, Inc. | 18,930 | 3,368,026 |
| Consumer Staples Distribution & Retail 2.6% | ||
| Walmart, Inc. | 32,415 | 5,271,003 |
| Food Products 0.8% | ||
| Hershey Co. (The) | 7,734 | 1,661,727 |
| Household Products 3.5% | ||
| Colgate-Palmolive Co. | 31,177 | 2,290,574 |
| Procter & Gamble Co. (The) | 30,758 | 4,747,190 |
| Total | 7,037,764 | |
| Total Consumer Staples | 17,338,520 | |
| Common Stocks (continued) | ||
| Issuer | Shares | Value ($) |
| Energy 8.9% | ||
| Energy Equipment & Services 0.8% | ||
| Schlumberger NV | 26,484 | 1,561,497 |
| Oil, Gas & Consumable Fuels 8.1% | ||
| Diamondback Energy, Inc. | 17,988 | 2,730,219 |
| EOG Resources, Inc. | 26,870 | 3,456,019 |
| Exxon Mobil Corp. | 70,854 | 7,878,256 |
| Marathon Petroleum Corp. | 17,490 | 2,497,047 |
| Total | 16,561,541 | |
| Total Energy | 18,123,038 | |
| Financials 18.7% | ||
| Banks 5.0% | ||
| Bank of America Corp. | 95,568 | 2,739,935 |
| Citigroup, Inc. | 48,543 | 2,004,340 |
| KeyCorp | 85,931 | 973,598 |
| Wells Fargo & Co. | 110,549 | 4,564,568 |
| Total | 10,282,441 | |
| Capital Markets 3.6% | ||
| Cboe Global Markets, Inc. | 17,726 | 2,653,760 |
| Charles Schwab Corp. (The) | 31,239 | 1,847,787 |
| State Street Corp. | 40,518 | 2,785,207 |
| Total | 7,286,754 | |
| Consumer Finance 2.0% | ||
| American Express Co. | 25,630 | 4,049,284 |
| Financial Services 4.9% | ||
| Fidelity National Information Services, Inc. | 27,955 | 1,561,566 |
| FleetCor Technologies, Inc.(a) | 8,193 | 2,226,284 |
| Global Payments, Inc. | 24,451 | 3,097,697 |
| PayPal Holdings, Inc.(a) | 48,570 | 3,036,111 |
| Total | 9,921,658 | |
| Insurance 3.2% | ||
| Arch Capital Group Ltd.(a) | 28,045 | 2,155,538 |
| Chubb Ltd. | 4,932 | 990,691 |
| Everest Group Ltd. | 9,150 | 3,300,222 |
| Total | 6,446,451 | |
| Total Financials | 37,986,588 | |
| 8 | Columbia Integrated Large Cap Value Fund | Annual Report 2023 |
August 31, 2023
| Common Stocks (continued) | ||
| Issuer | Shares | Value ($) |
| Health Care 16.0% | ||
| Biotechnology 4.6% | ||
| Exelixis, Inc.(a) | 71,245 | 1,595,175 |
| Incyte Corp.(a) | 30,837 | 1,989,912 |
| Neurocrine Biosciences, Inc.(a) | 20,233 | 2,203,171 |
| Vertex Pharmaceuticals, Inc.(a) | 9,932 | 3,459,713 |
| Total | 9,247,971 | |
| Health Care Equipment & Supplies 1.9% | ||
| Medtronic PLC | 48,225 | 3,930,337 |
| Health Care Providers & Services 3.8% | ||
| Elevance Health, Inc. | 8,049 | 3,557,739 |
| McKesson Corp. | 4,617 | 1,903,681 |
| UnitedHealth Group, Inc. | 4,908 | 2,339,055 |
| Total | 7,800,475 | |
| Life Sciences Tools & Services 0.5% | ||
| IQVIA Holdings, Inc.(a) | 4,282 | 953,302 |
| Pharmaceuticals 5.2% | ||
| Johnson & Johnson | 23,244 | 3,758,090 |
| Merck & Co., Inc. | 34,967 | 3,810,704 |
| Pfizer, Inc. | 81,835 | 2,895,322 |
| Total | 10,464,116 | |
| Total Health Care | 32,396,201 | |
| Industrials 12.4% | ||
| Building Products 2.1% | ||
| Fortune Brands Innovations, Inc. | 15,444 | 1,065,945 |
| Owens Corning | 22,668 | 3,262,152 |
| Total | 4,328,097 | |
| Commercial Services & Supplies 2.2% | ||
| Clean Harbors, Inc.(a) | 10,554 | 1,787,214 |
| Waste Management, Inc. | 16,496 | 2,586,243 |
| Total | 4,373,457 | |
| Construction & Engineering 1.2% | ||
| MasTec, Inc.(a) | 25,313 | 2,518,390 |
| Electrical Equipment 1.3% | ||
| Sensata Technologies Holding | 69,983 | 2,632,760 |
| Common Stocks (continued) | ||
| Issuer | Shares | Value ($) |
| Machinery 1.9% | ||
| Gates Industrial Corp. PLC(a) | 155,243 | 1,906,384 |
| Oshkosh Corp. | 18,877 | 1,959,999 |
| Total | 3,866,383 | |
| Passenger Airlines 1.0% | ||
| United Airlines Holdings, Inc.(a) | 38,750 | 1,930,138 |
| Trading Companies & Distributors 2.7% | ||
| Ferguson PLC | 12,747 | 2,059,405 |
| MSC Industrial Direct Co., Inc., Class A | 12,165 | 1,241,560 |
| W.W. Grainger, Inc. | 3,091 | 2,207,407 |
| Total | 5,508,372 | |
| Total Industrials | 25,157,597 | |
| Information Technology 11.4% | ||
| Communications Equipment 3.2% | ||
| Cisco Systems, Inc. | 42,883 | 2,459,340 |
| F5, Inc.(a) | 14,662 | 2,399,583 |
| Motorola Solutions, Inc. | 6,054 | 1,716,733 |
| Total | 6,575,656 | |
| Electronic Equipment, Instruments & Components 0.8% | ||
| IPG Photonics Corp.(a) | 14,949 | 1,619,873 |
| IT Services 1.5% | ||
| Akamai Technologies, Inc.(a) | 28,286 | 2,972,576 |
| Semiconductors & Semiconductor Equipment 2.5% | ||
| Advanced Micro Devices, Inc.(a) | 26,402 | 2,791,220 |
| Texas Instruments, Inc. | 13,804 | 2,319,900 |
| Total | 5,111,120 | |
| Software 3.4% | ||
| Dolby Laboratories, Inc., Class A | 13,440 | 1,135,277 |
| Dropbox, Inc., Class A(a) | 79,489 | 2,208,999 |
| Salesforce, Inc.(a) | 16,046 | 3,553,547 |
| Total | 6,897,823 | |
| Total Information Technology | 23,177,048 | |
| Materials 2.1% | ||
| Chemicals 1.3% | ||
| Linde PLC | 6,536 | 2,529,694 |
| Columbia Integrated Large Cap Value Fund | Annual Report 2023 | 9 |
August 31, 2023
| Common Stocks (continued) | ||
| Issuer | Shares | Value ($) |
| Containers & Packaging 0.8% | ||
| Sealed Air Corp. | 46,037 | 1,706,131 |
| Total Materials | 4,235,825 | |
| Real Estate 4.2% | ||
| Residential REITs 0.7% | ||
| Camden Property Trust | 12,738 | 1,370,864 |
| Retail REITs 1.1% | ||
| Brixmor Property Group, Inc. | 100,710 | 2,213,606 |
| Specialized REITs 2.4% | ||
| Gaming and Leisure Properties, Inc. | 41,117 | 1,948,946 |
| Public Storage | 11,109 | 3,070,305 |
| Total | 5,019,251 | |
| Total Real Estate | 8,603,721 | |
| Utilities 3.5% | ||
| Electric Utilities 2.5% | ||
| Pinnacle West Capital Corp. | 29,934 | 2,313,000 |
| PPL Corp. | 111,109 | 2,768,837 |
| Total | 5,081,837 | |
| Common Stocks (continued) | ||
| Issuer | Shares | Value ($) |
| Independent Power and Renewable Electricity Producers 1.0% | ||
| AES Corp. (The) | 113,185 | 2,029,407 |
| Total Utilities | 7,111,244 | |
| Total Common Stocks (Cost $162,757,753) | 199,202,521 | |
| Money Market Funds 1.7% | ||
| Shares | Value ($) | |
| Columbia Short-Term Cash Fund, 5.476%(b),(c) | 3,516,179 | 3,515,124 |
| Total Money Market Funds (Cost $3,514,674) | 3,515,124 | |
| Total Investments in Securities (Cost: $166,272,427) | 202,717,645 | |
| Other Assets & Liabilities, Net | 249,464 | |
| Net Assets | 202,967,109 | |
| (a) | Non-income producing investment. |
| (b) | The rate shown is the seven-day current annualized yield at August 31, 2023. |
| (c) | As defined in the Investment Company Act of 1940, as amended, an affiliated company is one in which the Fund owns 5% or more of the company’s outstanding voting securities, or a company which is under common ownership or control with the Fund. The value of the holdings and transactions in these affiliated companies during the year ended August 31, 2023 are as follows: |
| Affiliated issuers | Beginning of period($) | Purchases($) | Sales($) | Net change in unrealized appreciation (depreciation)($) | End of period($) | Realized gain (loss)($) | Dividends($) | End of period shares |
| Columbia Short-Term Cash Fund, 5.476% | ||||||||
| 3,583,115 | 53,781,000 | (53,849,432) | 441 | 3,515,124 | 276 | 132,193 | 3,516,179 | |
| ■ | Level 1 — Valuations based on quoted prices for investments in active markets that the Fund has the ability to access at the measurement date. Valuation adjustments are not applied to Level 1 investments. |
| ■ | Level 2 — Valuations based on other significant observable inputs (including quoted prices for similar securities, interest rates, prepayment speeds, credit risks, etc.). |
| ■ | Level 3 — Valuations based on significant unobservable inputs (including the Fund’s own assumptions and judgment in determining the fair value of investments). |
| 10 | Columbia Integrated Large Cap Value Fund | Annual Report 2023 |
August 31, 2023
Inputs that are used in determining fair value of an investment may include price information, credit data, volatility statistics, and other factors. These inputs can be either observable or unobservable. The availability of observable inputs can vary between investments, and is affected by various factors such as the type of investment, and the volume and level of activity for that investment or similar investments in the marketplace. The inputs will be considered by the Investment Manager, along with any other relevant factors in the calculation of an investment’s fair value. The Fund uses prices and inputs that are current as of the measurement date, which may include periods of market dislocations. During these periods, the availability of prices and inputs may be reduced for many investments. This condition could cause an investment to be reclassified between the various levels within the hierarchy.
| Level 1 ($) | Level 2 ($) | Level 3 ($) | Total ($) | |
| Investments in Securities | ||||
| Common Stocks | ||||
| Communication Services | 14,215,056 | — | — | 14,215,056 |
| Consumer Discretionary | 10,857,683 | — | — | 10,857,683 |
| Consumer Staples | 17,338,520 | — | — | 17,338,520 |
| Energy | 18,123,038 | — | — | 18,123,038 |
| Financials | 37,986,588 | — | — | 37,986,588 |
| Health Care | 32,396,201 | — | — | 32,396,201 |
| Industrials | 25,157,597 | — | — | 25,157,597 |
| Information Technology | 23,177,048 | — | — | 23,177,048 |
| Materials | 4,235,825 | — | — | 4,235,825 |
| Real Estate | 8,603,721 | — | — | 8,603,721 |
| Utilities | 7,111,244 | — | — | 7,111,244 |
| Total Common Stocks | 199,202,521 | — | — | 199,202,521 |
| Money Market Funds | 3,515,124 | — | — | 3,515,124 |
| Total Investments in Securities | 202,717,645 | — | — | 202,717,645 |
| Columbia Integrated Large Cap Value Fund | Annual Report 2023 | 11 |
August 31, 2023
| Assets | |
| Investments in securities, at value | |
| Unaffiliated issuers (cost $162,757,753) | $199,202,521 |
| Affiliated issuers (cost $3,514,674) | 3,515,124 |
| Receivable for: | |
| Capital shares sold | 33,834 |
| Dividends | 339,007 |
| Expense reimbursement due from Investment Manager | 2,569 |
| Prepaid expenses | 3,514 |
| Total assets | 203,096,569 |
| Liabilities | |
| Payable for: | |
| Capital shares redeemed | 61,416 |
| Management services fees | 4,187 |
| Distribution and/or service fees | 214 |
| Transfer agent fees | 30,380 |
| Trustees’ fees | 10,992 |
| Accounting services fees | 15,045 |
| Other expenses | 7,226 |
| Total liabilities | 129,460 |
| Net assets applicable to outstanding capital stock | $202,967,109 |
| Represented by | |
| Paid in capital | 148,888,318 |
| Total distributable earnings (loss) | 54,078,791 |
| Total - representing net assets applicable to outstanding capital stock | $202,967,109 |
| Class A | |
| Net assets | $31,103,591 |
| Shares outstanding | 2,251,960 |
| Net asset value per share | $13.81 |
| Maximum sales charge | 5.75% |
| Maximum offering price per share (calculated by dividing the net asset value per share by 1.0 minus the maximum sales charge for Class A shares) | $14.65 |
| Advisor Class | |
| Net assets | $132,498,500 |
| Shares outstanding | 9,582,050 |
| Net asset value per share | $13.83 |
| Class C | |
| Net assets | $2,228 |
| Shares outstanding | 161 |
| Net asset value per share(a) | $13.87 |
| Institutional Class | |
| Net assets | $37,903,710 |
| Shares outstanding | 2,725,102 |
| Net asset value per share | $13.91 |
| Institutional 2 Class | |
| Net assets | $627,580 |
| Shares outstanding | 45,101 |
| Net asset value per share(a) | $13.92 |
| Institutional 3 Class | |
| Net assets | $829,270 |
| Shares outstanding | 59,600 |
| Net asset value per share | $13.91 |
| Class R | |
| Net assets | $2,230 |
| Shares outstanding | 161 |
| Net asset value per share(a) | $13.89 |
| 12 | Columbia Integrated Large Cap Value Fund | Annual Report 2023 |
August 31, 2023
| (a) | Net asset value per share rounds to this amount due to fractional shares outstanding. |
| Columbia Integrated Large Cap Value Fund | Annual Report 2023 | 13 |
Year Ended August 31, 2023
| Net investment income | |
| Income: | |
| Dividends — unaffiliated issuers | $4,652,316 |
| Dividends — affiliated issuers | 132,193 |
| Total income | 4,784,509 |
| Expenses: | |
| Management services fees | 1,958,693 |
| Distribution and/or service fees | |
| Class A | 82,325 |
| Class C | 93 |
| Class R | 11 |
| Transfer agent fees | |
| Class A | 48,420 |
| Advisor Class | 199,770 |
| Class C | 14 |
| Institutional Class | 133,863 |
| Institutional 2 Class | 487 |
| Institutional 3 Class | 78 |
| Class R | 3 |
| Trustees’ fees | 20,342 |
| Custodian fees | 9,730 |
| Printing and postage fees | 21,427 |
| Registration fees | 106,338 |
| Accounting services fees | 30,090 |
| Legal fees | 15,337 |
| Compensation of chief compliance officer | 6 |
| Other | 71,851 |
| Total expenses | 2,698,878 |
| Fees waived or expenses reimbursed by Investment Manager and its affiliates | (1,215,293) |
| Fees waived by transfer agent | |
| Institutional 3 Class | (29) |
| Expense reduction | (717) |
| Total net expenses | 1,482,839 |
| Net investment income | 3,301,670 |
| Realized and unrealized gain (loss) — net | |
| Net realized gain (loss) on: | |
| Investments — unaffiliated issuers | 24,301,571 |
| Investments — affiliated issuers | 276 |
| Net realized gain | 24,301,847 |
| Net change in unrealized appreciation (depreciation) on: | |
| Investments — unaffiliated issuers | (4,284,782) |
| Investments — affiliated issuers | 441 |
| Net change in unrealized appreciation (depreciation) | (4,284,341) |
| Net realized and unrealized gain | 20,017,506 |
| Net increase in net assets resulting from operations | $23,319,176 |
| 14 | Columbia Integrated Large Cap Value Fund | Annual Report 2023 |
| Year Ended August 31, 2023 | Year Ended August 31, 2022 (a),(b) | |
| Operations | ||
| Net investment income | $3,301,670 | $5,170,370 |
| Net realized gain | 24,301,847 | 65,041,500 |
| Net change in unrealized appreciation (depreciation) | (4,284,341) | (97,681,422) |
| Net increase (decrease) in net assets resulting from operations | 23,319,176 | (27,469,552) |
| Distributions to shareholders | ||
| Net investment income and net realized gains | ||
| Class A | (4,494,329) | (3,482,605) |
| Advisor Class | (18,921,678) | (51,340,591) |
| Class C | (423) | (3) |
| Institutional Class | (15,834,293) | (696,387) |
| Institutional 2 Class | (115,570) | (4,409) |
| Institutional 3 Class | (5,296) | (17) |
| Class R | (306) | (9) |
| Class R6 | — | (3,864,120) |
| Total distributions to shareholders | (39,371,895) | (59,388,141) |
| Increase (decrease) in net assets from capital stock activity | (113,088,744) | 76,293,216 |
| Redemption fees | — | 30 |
| Total decrease in net assets | (129,141,463) | (10,564,447) |
| Net assets at beginning of year | 332,108,572 | 342,673,019 |
| Net assets at end of year | $202,967,109 | $332,108,572 |
| (a) | Class R6 shares are based on operations from September 1, 2021 through the liquidation of Class R6 shares of the Predecessor Fund prior to the Reorganization described in the Notes to Financial Statements. |
| (b) | Class C, Institutional Class, Institutional 2 Class, Institutional 3 Class, and Class R shares are based on operations from January 26, 2022 (commencement of operations) through the stated period end. |
| Columbia Integrated Large Cap Value Fund | Annual Report 2023 | 15 |
| Year Ended | Year Ended | |||
| August 31, 2023 | August 31, 2022 (a),(b) | |||
| Shares | Dollars ($) | Shares | Dollars ($) | |
| Capital stock activity | ||||
| Class A | ||||
| Shares sold | 23,030 | 315,761 | 62,515 | 998,413 |
| Fund reorganization | — | — | 1,901,735(c) | 29,561,709(c) |
| Distributions reinvested | 336,818 | 4,458,940 | 209,483 | 3,404,751 |
| Shares redeemed | (563,800) | (7,749,651) | (691,968) | (10,867,655) |
| Net increase (decrease) | (203,952) | (2,974,950) | 1,481,765 | 23,097,218 |
| Advisor Class | ||||
| Shares sold | 2,600,496 | 35,085,811 | 3,067,030 | 51,067,146 |
| Fund reorganization | — | — | 15,894,230(c) | 247,297,962(c) |
| Distributions reinvested | 944,719 | 12,520,975 | 2,964,372 | 48,526,335 |
| Shares redeemed | (4,221,426) | (57,687,814) | (26,593,500) | (426,108,839) |
| Net decrease | (676,211) | (10,081,028) | (4,667,868) | (79,217,396) |
| Class C | ||||
| Shares sold | — | — | 3,836 | 55,500 |
| Distributions reinvested | 9 | 127 | — | — |
| Shares redeemed | (3,684) | (51,694) | — | — |
| Net increase (decrease) | (3,675) | (51,567) | 3,836 | 55,500 |
| Institutional Class | ||||
| Shares sold | 450,430 | 6,239,160 | 16,934,795 | 271,307,013 |
| Distributions reinvested | 1,185,785 | 15,814,896 | 50,395 | 696,048 |
| Shares redeemed | (8,838,661) | (122,470,065) | (7,057,642) | (104,513,477) |
| Net increase (decrease) | (7,202,446) | (100,416,009) | 9,927,548 | 167,489,584 |
| Institutional 2 Class | ||||
| Shares sold | — | — | 74,067 | 1,094,096 |
| Distributions reinvested | 8,639 | 115,251 | 319 | 4,393 |
| Shares redeemed | (34,558) | (484,848) | (3,366) | (48,662) |
| Net increase (decrease) | (25,919) | (369,597) | 71,020 | 1,049,827 |
| Institutional 3 Class | ||||
| Shares sold | 64,041 | 867,478 | 160 | 2,500 |
| Distributions reinvested | 375 | 4,975 | — | — |
| Shares redeemed | (4,976) | (68,046) | — | — |
| Net increase | 59,440 | 804,407 | 160 | 2,500 |
| Class R | ||||
| Shares sold | — | — | 161 | 2,500 |
| Net increase | — | — | 161 | 2,500 |
| Class R6 | ||||
| Shares sold | — | — | 241,999 | 4,417,303 |
| Distributions reinvested | — | — | 225,333 | 3,753,432 |
| Shares redeemed | — | — | (2,527,701) | (44,357,252) |
| Net decrease | — | — | (2,060,369) | (36,186,517) |
| Total net increase (decrease) | (8,052,763) | (113,088,744) | 4,756,253 | 76,293,216 |
| (a) | Class R6 shares are based on operations from September 1, 2021 through the liquidation of Class R6 shares of the Predecessor Fund prior to the Reorganization described in the Notes to Financial Statements. |
| (b) | Class C, Institutional Class, Institutional 2 Class, Institutional 3 Class, and Class R shares are based on operations from January 26, 2022 (commencement of operations) through the stated period end. |
| (c) | Represents the acquisition of BMO Dividend Income Fund and BMO Low Volatility Fund in connection with the Fund Reorganizations. See Note 9 of the Notes to Financial Statements for additional information. |
| 16 | Columbia Integrated Large Cap Value Fund | Annual Report 2023 |
| Net asset value, beginning of period | Net investment income | Net realized and unrealized gain (loss) | Total from investment operations | Distributions from net investment income | Distributions from net realized gains | Total distributions to shareholders | |
| Class A | |||||||
| Year Ended 8/31/2023 | $14.57 | 0.14 | 1.04 | 1.18 | (0.17) | (1.77) | (1.94) |
| Year Ended 8/31/2022(e) | $19.06 | 0.18 | (1.27) | (1.09) | (0.18) | (3.22) | (3.40) |
| Year Ended 8/31/2021(g) | $13.52 | 0.18 | 5.53 | 5.71 | (0.17) | — | (0.17) |
| Year Ended 8/31/2020 | $13.72 | 0.22 | (0.18) | 0.04 | (0.24) | — | (0.24) |
| Year Ended 8/31/2019 | $16.59 | 0.26 | (1.46) | (1.20) | (0.27) | (1.40) | (1.67) |
| Advisor Class | |||||||
| Year Ended 8/31/2023 | $14.59 | 0.18 | 1.04 | 1.22 | (0.21) | (1.77) | (1.98) |
| Year Ended 8/31/2022(e) | $19.08 | 0.21 | (1.26) | (1.05) | (0.22) | (3.22) | (3.44) |
| Year Ended 8/31/2021(g) | $13.53 | 0.22 | 5.54 | 5.76 | (0.21) | — | (0.21) |
| Year Ended 8/31/2020 | $13.74 | 0.27 | (0.20) | 0.07 | (0.28) | — | (0.28) |
| Year Ended 8/31/2019 | $16.61 | 0.30 | (1.46) | (1.16) | (0.31) | (1.40) | (1.71) |
| Class C | |||||||
| Year Ended 8/31/2023 | $14.64 | 0.03 | 1.04 | 1.07 | (0.07) | (1.77) | (1.84) |
| Year Ended 8/31/2022(h) | $15.57 | 0.07 | (0.98) | (0.91) | (0.02) | — | (0.02) |
| Institutional Class | |||||||
| Year Ended 8/31/2023 | $14.66 | 0.18 | 1.05 | 1.23 | (0.21) | (1.77) | (1.98) |
| Year Ended 8/31/2022(h) | $15.59 | 0.13 | (0.97) | (0.84) | (0.09) | — | (0.09) |
| Institutional 2 Class | |||||||
| Year Ended 8/31/2023 | $14.67 | 0.19 | 1.05 | 1.24 | (0.22) | (1.77) | (1.99) |
| Year Ended 8/31/2022(h) | $15.59 | 0.16 | (0.98) | (0.82) | (0.10) | — | (0.10) |
| Institutional 3 Class | |||||||
| Year Ended 8/31/2023 | $14.67 | 0.19 | 1.05 | 1.24 | (0.23) | (1.77) | (2.00) |
| Year Ended 8/31/2022(h) | $15.59 | 0.15 | (0.96) | (0.81) | (0.11) | — | (0.11) |
| 18 | Columbia Integrated Large Cap Value Fund | Annual Report 2023 |
| Net asset value, end of period | Total return | Total gross expense ratio to average net assets(a) | Total net expense ratio to average net assets(a),(b),(c) | Net investment income ratio to average net assets | Portfolio turnover | Net assets, end of period (000’s) | |
| Class A | |||||||
| Year Ended 8/31/2023 | $13.81 | 8.83% | 1.25% | 0.79%(d) | 1.04% | 39% | $31,104 |
| Year Ended 8/31/2022(e) | $14.57 | (6.97%) | 1.17%(f) | 0.79%(f) | 1.11% | 51% | $35,789 |
| Year Ended 8/31/2021(g) | $19.06 | 42.53% | 0.86% | 0.79% | 1.17% | 60% | $18,563 |
| Year Ended 8/31/2020 | $13.52 | 0.43% | 0.85% | 0.79% | 1.62% | 76% | $14,047 |
| Year Ended 8/31/2019 | $13.72 | (7.15%) | 0.85% | 0.79% | 1.78% | 67% | $18,621 |
| Advisor Class | |||||||
| Year Ended 8/31/2023 | $13.83 | 9.10% | 1.00% | 0.54%(d) | 1.29% | 39% | $132,499 |
| Year Ended 8/31/2022(e) | $14.59 | (6.72%) | 0.89%(f) | 0.54%(f) | 1.28% | 51% | $149,646 |
| Year Ended 8/31/2021(g) | $19.08 | 42.93% | 0.61% | 0.54% | 1.42% | 60% | $284,731 |
| Year Ended 8/31/2020 | $13.53 | 0.70% | 0.60% | 0.54% | 1.90% | 76% | $213,466 |
| Year Ended 8/31/2019 | $13.74 | (6.97%) | 0.59% | 0.54% | 2.01% | 67% | $224,930 |
| Class C | |||||||
| Year Ended 8/31/2023 | $13.87 | 7.88% | 2.00% | 1.53%(d) | 0.24% | 39% | $2 |
| Year Ended 8/31/2022(h) | $14.64 | (5.85%) | 1.97%(f) | 1.53%(f) | 0.82% | 51% | $56 |
| Institutional Class | |||||||
| Year Ended 8/31/2023 | $13.91 | 9.12% | 1.00% | 0.54%(d) | 1.31% | 39% | $37,904 |
| Year Ended 8/31/2022(h) | $14.66 | (5.36%) | 0.97%(f) | 0.53%(f) | 1.44% | 51% | $145,571 |
| Institutional 2 Class | |||||||
| Year Ended 8/31/2023 | $13.92 | 9.21% | 0.92% | 0.45% | 1.39% | 39% | $628 |
| Year Ended 8/31/2022(h) | $14.67 | (5.25%) | 0.89%(f) | 0.45%(f) | 1.81% | 51% | $1,042 |
| Institutional 3 Class | |||||||
| Year Ended 8/31/2023 | $13.91 | 9.19% | 0.88% | 0.40% | 1.42% | 39% | $829 |
| Year Ended 8/31/2022(h) | $14.67 | (5.22%) | 0.86%(f) | 0.40%(f) | 1.63% | 51% | $2 |
| Columbia Integrated Large Cap Value Fund | Annual Report 2023 | 19 |
| Net asset value, beginning of period | Net investment income | Net realized and unrealized gain (loss) | Total from investment operations | Distributions from net investment income | Distributions from net realized gains | Total distributions to shareholders | |
| Class R | |||||||
| Year Ended 8/31/2023 | $14.65 | 0.10 | 1.05 | 1.15 | (0.14) | (1.77) | (1.91) |
| Year Ended 8/31/2022(h) | $15.57 | 0.09 | (0.95) | (0.86) | (0.06) | — | (0.06) |
| Notes to Financial Highlights | |
| (a) | In addition to the fees and expenses that the Fund bears directly, the Fund indirectly bears a pro rata share of the fees and expenses of any other funds in which it invests. Such indirect expenses are not included in the Fund’s reported expense ratios. |
| (b) | Total net expenses include the impact of certain fee waivers/expense reimbursements made by the Investment Manager and certain of its affiliates, if applicable. |
| (c) | Total net expenses include the impact of certain fee waivers/expense reimbursements made by BMO Asset Management Corp, and certain of its affiliates, if applicable, for the account periods prior to the closing of the Reorganization, which occurred on January 21, 2022. |
| (d) | The benefits derived from expense reductions had an impact of less than 0.01%. |
| (e) | Redemption fees consisted of per share amounts less than $0.01. |
| (f) | Ratios include interfund lending expense which is less than 0.01%. |
| (g) | Net investment income (loss) per share calculated using the average shares method. |
| (h) | Class C, Institutional Class, Institutional 2 Class, Institutional 3 Class and Class R shares commenced operations on January 26, 2022. Per share data and total return reflect activity from that date. |
| 20 | Columbia Integrated Large Cap Value Fund | Annual Report 2023 |
| Net asset value, end of period | Total return | Total gross expense ratio to average net assets(a) | Total net expense ratio to average net assets(a),(b),(c) | Net investment income ratio to average net assets | Portfolio turnover | Net assets, end of period (000’s) | |
| Class R | |||||||
| Year Ended 8/31/2023 | $13.89 | 8.49% | 1.50% | 1.04%(d) | 0.77% | 39% | $2 |
| Year Ended 8/31/2022(h) | $14.65 | (5.55%) | 1.47%(f) | 1.03%(f) | 1.00% | 51% | $2 |
| Columbia Integrated Large Cap Value Fund | Annual Report 2023 | 21 |
August 31, 2023
| 22 | Columbia Integrated Large Cap Value Fund | Annual Report 2023 |
August 31, 2023
| Columbia Integrated Large Cap Value Fund | Annual Report 2023 | 23 |
August 31, 2023
| 24 | Columbia Integrated Large Cap Value Fund | Annual Report 2023 |
August 31, 2023
| Effective rate (%) | |
| Class A | 0.15 |
| Advisor Class | 0.15 |
| Class C | 0.15 |
| Institutional Class | 0.15 |
| Institutional 2 Class | 0.06 |
| Institutional 3 Class | 0.01 |
| Class R | 0.15 |
| Columbia Integrated Large Cap Value Fund | Annual Report 2023 | 25 |
August 31, 2023
| Front End (%) | CDSC (%) | Amount ($) | |
| Class A | 5.75 | 0.50 - 1.00(a) | 1,907 |
| Class C | — | 1.00(b) | — |
| (a) | This charge is imposed on certain investments of between $1 million and $50 million redeemed within 18 months after purchase, as follows: 1.00% if redeemed within 12 months after purchase, and 0.50% if redeemed more than 12, but less than 18, months after purchase, with certain limited exceptions. |
| (b) | This charge applies to redemptions within 12 months after purchase, with certain limited exceptions. |
| Fee rate(s) contractual through December 31, 2023 | |
| Class A | 0.80% |
| Advisor Class | 0.55 |
| Class C | 1.55 |
| Institutional Class | 0.55 |
| Institutional 2 Class | 0.46 |
| Institutional 3 Class | 0.40 |
| Class R | 1.05 |
| 26 | Columbia Integrated Large Cap Value Fund | Annual Report 2023 |
August 31, 2023
| Undistributed net investment income ($) | Accumulated net realized gain ($) | Paid in capital ($) |
| — | (12,284,000) | 12,284,000 |
| Year Ended August 31, 2023 | Year Ended August 31, 2022 | ||||
| Ordinary income ($) | Long-term capital gains ($) | Total ($) | Ordinary income ($) | Long-term capital gains ($) | Total ($) |
| 4,061,251 | 35,310,644 | 39,371,895 | 8,386,631 | 51,001,510 | 59,388,141 |
| Undistributed ordinary income ($) | Undistributed long-term capital gains ($) | Capital loss carryforwards ($) | Net unrealized appreciation ($) |
| 553,757 | 18,104,847 | — | 35,429,668 |
| Federal tax cost ($) | Gross unrealized appreciation ($) | Gross unrealized (depreciation) ($) | Net unrealized appreciation ($) |
| 167,287,977 | 41,411,517 | (5,981,849) | 35,429,668 |
| Columbia Integrated Large Cap Value Fund | Annual Report 2023 | 27 |
August 31, 2023
| 28 | Columbia Integrated Large Cap Value Fund | Annual Report 2023 |
August 31, 2023
| Shares | |
| Class A | 3,059,526 |
| Advisor Class | 32,641,515 |
| ($) | |
| Net investment income | 7,276,000 |
| Net realized gain | 159,215,000 |
| Net change in unrealized appreciation/(depreciation) | (181,663,000) |
| Net decrease in net assets from operations | (15,172,000) |
| Columbia Integrated Large Cap Value Fund | Annual Report 2023 | 29 |
August 31, 2023
| 30 | Columbia Integrated Large Cap Value Fund | Annual Report 2023 |
August 31, 2023
| Columbia Integrated Large Cap Value Fund | Annual Report 2023 | 31 |
| 32 | Columbia Integrated Large Cap Value Fund | Annual Report 2023 |
| Qualified dividend income | Dividends received deduction | Capital gain dividend |
| 100.00% | 100.00% | $23,507,398 |
| Name, address, year of birth | Position held with the Columbia Funds and length of service | Principal occupation(s) during past five years and other relevant professional experience | Number of Funds in the Columbia Funds Complex* overseen | Other directorships held by Trustee during the past five years and other relevant Board experience |
| George S. Batejan c/o Columbia Management Investment Advisers, LLC 290 Congress Street Boston, MA 02210 1954 | Trustee since 2017 | Executive Vice President, Global Head of Technology and Operations, Janus Capital Group, Inc., 2010-2016 | 173 | Former Chairman of the Board, NICSA (National Investment Company Services Association) (Executive Committee, Nominating Committee and Governance Committee), 2014-2016; former Director, Intech Investment Management, 2011-2016; former Board Member, Metro Denver Chamber of Commerce, 2015-2016; former Advisory Board Member, University of Colorado Business School, 2015-2018; former Board Member, Chase Bank International, 1993-1994 |
| Columbia Integrated Large Cap Value Fund | Annual Report 2023 | 33 |
(Unaudited)
Independent trustees (continued)
| Name, address, year of birth | Position held with the Columbia Funds and length of service | Principal occupation(s) during past five years and other relevant professional experience | Number of Funds in the Columbia Funds Complex* overseen | Other directorships held by Trustee during the past five years and other relevant Board experience |
| Kathleen Blatz c/o Columbia Management Investment Advisers, LLC 290 Congress Street Boston, MA 02210 1954 | Trustee since 2006 | Attorney, specializing in arbitration and mediation; Chief Justice, Minnesota Supreme Court, 1998-2006; Associate Justice, Minnesota Supreme Court, 1996-1998; Fourth Judicial District Court Judge, Hennepin County, 1994-1996; Attorney in private practice and public service, 1984-1993; State Representative, Minnesota House of Representatives, 1979-1993, which included service on the Tax and Financial Institutions and Insurance Committees; Member and Interim Chair, Minnesota Sports Facilities Authority, January-July 2017; Interim President and Chief Executive Officer, Blue Cross and Blue Shield of Minnesota (health care insurance), February-July 2018, April-October 2021 | 173 | Former Trustee, Blue Cross and Blue Shield of Minnesota, 2009-2021 (Chair of the Business Development Committee, 2014-2017; Chair of the Governance Committee, 2017-2019); former Member and Chair of the Board, Minnesota Sports Facilities Authority, January 2017-July 2017; former Director, Robina Foundation, 2009-2020 (Chair, 2014-2020); Director, Richard M. Schulze Family Foundation, since 2021 |
| Pamela G. Carlton c/o Columbia Management Investment Advisers, LLC 290 Congress Street Boston, MA 02210 1954 | Chair since 2023; Trustee since 2007 | President, Springboard – Partners in Cross Cultural Leadership (consulting company), since 2003; Managing Director of US Equity Research, JP Morgan Chase, 1999-2003; Director of US Equity Research, Chase Asset Management, 1996-1999; Co-Director Latin America Research, 1993-1996, COO Global Research, 1992-1996, Co-Director of US Research, 1991-1992, Investment Banker, 1982-1991, Morgan Stanley; Attorney, Cleary Gottlieb Steen & Hamilton LLP, 1980-1982 | 173 | Trustee, New York Presbyterian Hospital Board, since 1996; Director, DR Bank (Audit Committee) since 2017; Director, Evercore Inc. (Audit Committee, Nominating and Governance Committee), since 2019; Director, Apollo Commercial Real Estate Finance, Inc. (Chair, Nominating and Governance Committee) (financial services), since 2021; the Governing Council of the Independent Directors Council (IDC), since 2021 |
| Janet Langford Carrig c/o Columbia Management Investment Advisers, LLC 290 Congress Street Boston, MA 02210 1957 | Trustee since 1996 | Senior Vice President, General Counsel and Corporate Secretary, ConocoPhillips (independent energy company), September 2007-October 2018 | 173 | Director, EQT Corporation (natural gas producer), since 2019; former Director, Whiting Petroleum Corporation (independent oil and gas company), 2020-2022 |
| J. Kevin Connaughton c/o Columbia Management Investment Advisers, LLC 290 Congress Street Boston, MA 02210 1964 | Trustee since 2020 | CEO and President, RhodeWay Financial (non-profit financial planning firm), since December 2022; Member, FINRA National Adjudicatory Council, since January 2020; Adjunct Professor of Finance, Bentley University since January 2018; Consultant to Independent Trustees of CFVIT and CFST I from March 2016 to June 2020 with respect to CFVIT and to December 2020 with respect to CFST I; Managing Director and General Manager of Mutual Fund Products, Columbia Management Investment Advisers, LLC, May 2010-February 2015; President, Columbia Funds, 2008-2015; and senior officer of Columbia Funds and affiliated funds, 2003-2015 | 171 | Former Director, The Autism Project, March 2015-December 2021; former Member of the Investment Committee, St. Michael’s College, November 2015-February 2020; former Trustee, St. Michael’s College, June 2017-September 2019; former Trustee, New Century Portfolios (former mutual fund complex), January 2015-December 2017 |
| 34 | Columbia Integrated Large Cap Value Fund | Annual Report 2023 |
(Unaudited)
Independent trustees (continued)
| Name, address, year of birth | Position held with the Columbia Funds and length of service | Principal occupation(s) during past five years and other relevant professional experience | Number of Funds in the Columbia Funds Complex* overseen | Other directorships held by Trustee during the past five years and other relevant Board experience |
| Olive M. Darragh c/o Columbia Management Investment Advisers, LLC 290 Congress Street Boston, MA 02210 1962 | Trustee since 2020 | Managing Director of Darragh Inc. (strategy and talent management consulting firm), since 2010; Founder and CEO, Zolio, Inc. (investment management talent identification platform), since 2004; Consultant to Independent Trustees of CFVIT and CFST I from June 2019 to June 2020 with respect to CFVIT and to December 2020 with respect to CFST I; Partner, Tudor Investments, 2004-2010; Senior Partner, McKinsey & Company (consulting), 1990-2004; Touche Ross CPA, 1985-1988 | 171 | Treasurer, Edinburgh University US Trust Board, since January 2023; Member, HBS Community Action Partners Board, since September 2022; former Director, University of Edinburgh Business School (Member of US Board), 2004-2019; former Director, Boston Public Library Foundation, 2008-2017 |
| Patricia M. Flynn c/o Columbia Management Investment Advisers, LLC 290 Congress Street Boston, MA 02210 1950 | Trustee since 2004 | Professor of Economics and Management, Bentley University, since 2002; Dean, McCallum Graduate School of Business, Bentley University, 1992-2002 | 173 | Former Trustee, MA Taxpayers Foundation, 1997-2022; former Director, The MA Business Roundtable, 2003-2019; former Chairperson, Innovation Index Advisory Committee, MA Technology Collaborative, 1997-2020 |
| Brian J. Gallagher c/o Columbia Management Investment Advisers, LLC 290 Congress Street Boston, MA 02210 1954 | Trustee since 2017 | Retired; Partner with Deloitte & Touche LLP and its predecessors, 1977-2016 | 173 | Trustee, Catholic Schools Foundation, since 2004 |
| Douglas A. Hacker c/o Columbia Management Investment Advisers, LLC 290 Congress Street Boston, MA 02210 1955 | Trustee since 1996 | Independent business executive, since May 2006; Executive Vice President – Strategy of United Airlines, December 2002 - May 2006; President of UAL Loyalty Services (airline marketing company), September 2001-December 2002; Executive Vice President and Chief Financial Officer of United Airlines, July 1999-September 2001 | 173 | Director, SpartanNash Company since November 2013 (Chair of the Board, since May 2021) (food distributor); Director, Aircastle Limited (Chair of Audit Committee) (aircraft leasing), since August 2006; former Director, Nash Finch Company (food distributor), 2005-2013; former Director, SeaCube Container Leasing Ltd. (container leasing), 2010-2013; and former Director, Travelport Worldwide Limited (travel information technology), 2014-2019 |
| Nancy T. Lukitsh c/o Columbia Management Investment Advisers, LLC 290 Congress Street Boston, MA 02210 1956 | Trustee since 2011 | Senior Vice President, Partner and Director of Marketing, Wellington Management Company, LLP (investment adviser), 1997-2010; Chair, Wellington Management Portfolios (commingled non-U.S. investment pools), 2007-2010; Director, Wellington Trust Company, NA and other Wellington affiliates, 1997-2010 | 171 | None |
| Columbia Integrated Large Cap Value Fund | Annual Report 2023 | 35 |
(Unaudited)
Independent trustees (continued)
| Name, address, year of birth | Position held with the Columbia Funds and length of service | Principal occupation(s) during past five years and other relevant professional experience | Number of Funds in the Columbia Funds Complex* overseen | Other directorships held by Trustee during the past five years and other relevant Board experience |
| David M. Moffett c/o Columbia Management Investment Advisers, LLC 290 Congress Street Boston, MA 02210 1952 | Trustee since 2011 | Retired; former Chief Executive Officer of Freddie Mac and Chief Financial Officer of U.S. Bank | 171 | Director, CSX Corporation (transportation suppliers); Director, PayPal Holdings Inc. (payment and data processing services); Trustee, University of Oklahoma Foundation; former Director, eBay Inc. (online trading community), 2007-2015; and former Director, CIT Bank, CIT Group Inc. (commercial and consumer finance), 2010-2016; former Senior Adviser to The Carlyle Group (financial services), March 2008-September 2008; former Governance Consultant to Bridgewater Associates, January 2013-December 2015 |
| Catherine James Paglia c/o Columbia Management Investment Advisers, LLC 290 Congress Street Boston, MA 02210 1952 | Trustee since 2004 | Director, Enterprise Asset Management, Inc. (private real estate and asset management company), since September 1998; Managing Director and Partner, Interlaken Capital, Inc., 1989-1997; Vice President, 1982-1985, Principal, 1985-1987, Managing Director, 1987-1989, Morgan Stanley; Vice President, Investment Banking, 1980-1982, Associate, Investment Banking, 1976-1980, Dean Witter Reynolds, Inc. | 173 | Director, Valmont Industries, Inc. (irrigation systems manufacturer), since 2012; Trustee, Carleton College (on the Investment Committee), since 1987; Trustee, Carnegie Endowment for International Peace (on the Investment Committee), since 2009 |
| Natalie A. Trunow c/o Columbia Management Investment Advisers, LLC 290 Congress Street Boston, MA 02210 1967 | Trustee since 2020 | Chief Executive Officer, Millennial Portfolio Solutions LLC (asset management and consulting services), January 2016-January 2021; Non-executive Member of the Investment Committee and Valuation Committee, Sarona Asset Management Inc. (private equity firm) since September 2019; Advisor, Horizon Investments (asset management and consulting services), August 2018-January 2022; Advisor, Paradigm Asset Management, November 2016-January 2022; Consultant to Independent Trustees of CFVIT and CFST I from September 2016 to June 2020 with respect to CFVIT and to December 2020 with respect to CFST I; Director of Investments/Consultant, Casey Family Programs, April 2016-November 2016; Senior Vice President and Chief Investment Officer, Calvert Investments, August 2008-January 2016; Section Head and Portfolio Manager, General Motors Asset Management, June 1997-August 2008 | 171 | Independent Director, Investment Committee, Health Services for Children with Special Needs, Inc., 2010-2021; Independent Director, (Executive Committee and Chair, Audit Committee), Consumer Credit Counseling Services (formerly Guidewell Financial Solutions), since 2016; Independent Director, (Investment Committee), Sarona Asset Management, since 2019 |
| 36 | Columbia Integrated Large Cap Value Fund | Annual Report 2023 |
(Unaudited)
Independent trustees (continued)
| Name, address, year of birth | Position held with the Columbia Funds and length of service | Principal occupation(s) during past five years and other relevant professional experience | Number of Funds in the Columbia Funds Complex* overseen | Other directorships held by Trustee during the past five years and other relevant Board experience |
| Sandra L. Yeager c/o Columbia Management Investment Advisers, LLC 290 Congress Street Boston, MA 02210 1964 | Trustee since 2017 | Retired; President and founder, Hanoverian Capital, LLC (SEC registered investment advisor firm), 2008-2016; Managing Director, DuPont Capital, 2006-2008; Managing Director, Morgan Stanley Investment Management, 2004-2006; Senior Vice President, Alliance Bernstein, 1990-2004 | 173 | Former Director, NAPE (National Alliance for Partnerships in Equity) Education Foundation, October 2016-October 2020; Advisory Board, Jennersville YMCA, since 2022 |
| Name, address, year of birth | Position held with the Columbia Funds and length of service | Principal occupation(s) during the past five years and other relevant professional experience | Number of Funds in the Columbia Funds Complex* overseen | Other directorships held by Trustee during the past five years and other relevant Board experience |
| Daniel J. Beckman c/o Columbia Management Investment Advisers, LLC 290 Congress Street Boston, MA 02210 1962 | Trustee since November 2021 and President since June 2021 | Vice President – Head of North America Product, Columbia Management Investment Advisers, LLC, since April 2015; President and Principal Executive Officer of the Columbia Funds, since June 2021; officer of Columbia Funds and affiliated funds, 2020-2021 | 173 | Director, Ameriprise Trust Company, since October 2016; Director, Columbia Management Investment Distributors, Inc. since November 2018; Board of Governors, Columbia Wanger Asset Management, LLC since, January 2022; Director, Columbia Threadneedle Canada, Inc., since December 2022 |
| * | The term “Columbia Funds Complex” as used herein includes Columbia Seligman Premium Technology Growth Fund, Tri-Continental Corporation and each series of Columbia Funds Series Trust (CFST), Columbia Funds Series Trust I (CFST I), Columbia Funds Series Trust II (CFST II), Columbia ETF Trust I (CET I), Columbia ETF Trust II (CET II), Columbia Funds Variable Insurance Trust (CFVIT) and Columbia Funds Variable Series Trust II (CFVST II). Messrs. Batejan, Beckman, Gallagher and Hacker and Mses. Blatz, Carlton, Carrig, Flynn, Paglia, and Yeager serve as directors of Columbia Seligman Premium Technology Growth Fund and Tri-Continental Corporation. |
| ** | Interested person (as defined under the 1940 Act) by reason of being an officer, director, security holder and/or employee of the Investment Manager or Ameriprise Financial. |
| Columbia Integrated Large Cap Value Fund | Annual Report 2023 | 37 |
(Unaudited)
The Board has appointed officers who are responsible for day-to-day business decisions based on policies it has established. The officers serve at the pleasure of the Board. The following table provides basic information about the Officers of the Fund as of the printing of this report, including principal occupations during the past five years, although their specific titles may have varied over the period. In addition to Mr. Beckman, who is President and Principal Executive Officer, the Fund’s other officers are:
| Name, address and year of birth | Position and year first appointed to position for any Fund in the Columbia Funds Complex or a predecessor thereof | Principal occupation(s) during past five years |
| Michael G. Clarke 290 Congress Street Boston, MA 02210 1969 | Chief Financial Officer and Principal Financial Officer (2009) and Senior Vice President (2019) | Senior Vice President and North America Head of Operations & Investor Services, Columbia Management Investment Advisers, LLC, since June 2023 (previously Senior Vice President and Head of Global Operations, March 2022 – June 2023, Vice President, Head of North America Operations, and Co-Head of Global Operations, June 2019 - February 2022 and Vice President – Accounting and Tax, May 2010 - May 2019); senior officer of Columbia Funds and affiliated funds, since 2002. Director, Ameriprise Trust Company, since June 2023. |
| Joseph Beranek 5890 Ameriprise Financial Center Minneapolis, MN 55474 1965 | Treasurer and Chief Accounting Officer (Principal Accounting Officer) (2019) and Principal Financial Officer (2020), CFST, CFST I, CFST II, CFVIT and CFVST II; Assistant Treasurer, CET I and CET II | Vice President – Mutual Fund Accounting and Financial Reporting, Columbia Management Investment Advisers, LLC, since December 2018 and March 2017, respectively. |
| Marybeth Pilat 290 Congress Street Boston, MA 02210 1968 | Treasurer and Chief Accounting Officer (Principal Accounting Officer) and Principal Financial Officer (2020) for CET I and CET II; Assistant Treasurer, CFST, CFST I, CFST II, CFVIT and CFVST II | Vice President – Product Pricing and Administration, Columbia Management Investment Advisers, LLC, since May 2017. |
| William F. Truscott 290 Congress Street Boston, MA 02210 1960 | Senior Vice President (2001) | Formerly, Trustee/Director of Columbia Funds Complex or legacy funds, November 2001 - January 1, 2021; Chief Executive Officer, Global Asset Management, Ameriprise Financial, Inc., since September 2012; Chairman of the Board and President, Columbia Management Investment Advisers, LLC, since July 2004 and February 2012, respectively; Chairman of the Board and Chief Executive Officer, Columbia Management Investment Distributors, Inc., since November 2008 and February 2012, respectively; Chairman of the Board and Director, Threadneedle Asset Management Holdings, Sàrl, since March 2013 and December 2008, respectively; senior executive of various entities affiliated with Columbia Threadneedle. |
| Christopher O. Petersen 5228 Ameriprise Financial Center Minneapolis, MN 55474 1970 | Senior Vice President and Assistant Secretary (2021) | Formerly, Trustee/Director of funds within the Columbia Funds Complex, July 1, 2020 - November 22, 2021; Senior Vice President and Assistant General Counsel, Ameriprise Financial, Inc., since September 2021 (previously Vice President and Lead Chief Counsel, January 2015 - September 2021); formerly, President and Principal Executive Officer of the Columbia Funds, 2015 - 2021; officer of Columbia Funds and affiliated funds, since 2007. |
| Thomas P. McGuire 290 Congress Street Boston, MA 02210 1972 | Senior Vice President and Chief Compliance Officer (2012) | Vice President – Asset Management Compliance, Ameriprise Financial, Inc., since May 2010; Chief Compliance Officer, Columbia Acorn/Wanger Funds, since December 2015; formerly, Chief Compliance Officer, Ameriprise Certificate Company, September 2010 – September 2020. |
| Ryan C. Larrenaga 290 Congress Street Boston, MA 02210 1970 | Senior Vice President (2017), Chief Legal Officer (2017), and Secretary (2015) | Vice President and Chief Counsel, Ameriprise Financial, Inc., since August 2018 (previously Vice President and Group Counsel, August 2011 - August 2018); Chief Legal Officer, Columbia Acorn/Wanger Funds, since September 2020; officer of Columbia Funds and affiliated funds, since 2005. |
| 38 | Columbia Integrated Large Cap Value Fund | Annual Report 2023 |
(Unaudited)
Fund officers (continued)
| Name, address and year of birth | Position and year first appointed to position for any Fund in the Columbia Funds Complex or a predecessor thereof | Principal occupation(s) during past five years |
| Michael E. DeFao 290 Congress Street Boston, MA 02210 1968 | Vice President (2011) and Assistant Secretary (2010) | Vice President and Chief Counsel, Ameriprise Financial, Inc., since May 2010; Vice President, Chief Legal Officer and Assistant Secretary, Columbia Management Investment Advisers, LLC, since October 2021 (previously Vice President and Assistant Secretary, May 2010 – September 2021). |
| Lyn Kephart-Strong 5903 Ameriprise Financial Center Minneapolis, MN 55474 1960 | Vice President (2015) | Vice President, Global Investment Operations Services, Columbia Management Investment Advisers, LLC, since 2010; Director (since January 2007) and President (since October 2014), Columbia Management Investment Services Corp.; Director (since December 2017) and President (since January 2017), Ameriprise Trust Company. |
| • | the Fund had sufficient liquidity to both meet redemptions and operate effectively on behalf of shareholders; |
| • | there were no material changes to the Program during the period; |
| • | the implementation of the Program was effective to manage the Fund’s liquidity risk; and |
| • | the Program operated adequately during the period. |
| Columbia Integrated Large Cap Value Fund | Annual Report 2023 | 39 |
| • | Information on the investment performance of the Fund relative to the performance of a group of mutual funds determined to be comparable to the Fund by Broadridge, as well as performance relative to one or more benchmarks; |
| • | Information on the Fund’s management fees and total expenses, including information comparing the Fund’s expenses to those of a group of comparable mutual funds, as determined by Broadridge; |
| • | The Investment Manager’s agreement to contractually limit or cap total operating expenses for the Fund so that total operating expenses (excluding certain fees and expenses, such as transaction costs and certain other investment related expenses, interest, taxes, acquired fund fees and expenses and infrequent and/or unusual expenses) would not exceed a specified annual rate, as a percentage of the Fund’s net assets; |
| • | Terms of the Management Agreement; |
| • | Descriptions of other agreements and arrangements with affiliates of the Investment Manager relating to the operations of the Fund, including agreements with respect to the provision of transfer agency and shareholder services to the Fund; |
| • | Descriptions of various services performed by the Investment Manager under the Management Agreement, including portfolio management and portfolio trading practices; |
| • | Information regarding any recently negotiated management fees of similarly-managed portfolios of other institutional clients of the Investment Manager; |
| • | Information regarding the resources of the Investment Manager, including information regarding senior management, portfolio managers and other personnel; |
| • | Information regarding the capabilities of the Investment Manager with respect to compliance monitoring services; |
| • | The profitability to the Investment Manager and its affiliates from their relationships with the Fund; and |
| • | Report provided by the Board’s independent fee consultant, JDL Consultants, LLC (JDL). |
| 40 | Columbia Integrated Large Cap Value Fund | Annual Report 2023 |
(Unaudited)
Following an analysis and discussion of the foregoing, and the factors identified below, the Board, including all of the Independent Trustees, approved the renewal of the Management Agreement.
| Columbia Integrated Large Cap Value Fund | Annual Report 2023 | 41 |
(Unaudited)
Investment Manager’s profitability. The Board reviewed the fees charged to comparable institutional or other accounts/vehicles managed by the Investment Manager and discussed differences in how the products are managed and operated, thus explaining many of the differences in fees.
| 42 | Columbia Integrated Large Cap Value Fund | Annual Report 2023 |
columbiathreadneedleus.com/investor/. The Fund is distributed by Columbia Management Investment Distributors, Inc., member FINRA, and managed by Columbia Management Investment Advisers, LLC.

August 31, 2023

| 3 | |
| 5 | |
| 7 | |
| 8 | |
| 12 | |
| 14 | |
| 15 | |
| 18 | |
| 22 | |
| 32 | |
| 33 | |
| 33 | |
| 39 | |
| 40 |
(Unaudited)
| Average annual total returns (%) (for the period ended August 31, 2023) | |||||
| Inception | 1 Year | 5 Years | 10 Years | ||
| Class A* | Excluding sales charges | 05/27/14 | 20.51 | 10.74 | 14.48 |
| Including sales charges | 13.55 | 9.44 | 13.80 | ||
| Advisor Class | 01/31/08 | 20.64 | 10.98 | 14.75 | |
| Class C* | Excluding sales charges | 01/26/22 | 19.47 | 9.88 | 13.61 |
| Including sales charges | 18.56 | 9.88 | 13.61 | ||
| Institutional Class* | 01/26/22 | 20.62 | 10.98 | 14.75 | |
| Institutional 2 Class* | 01/26/22 | 20.62 | 10.99 | 14.75 | |
| Institutional 3 Class* | 12/28/15 | 20.78 | 11.14 | 14.88 | |
| Class R* | 01/26/22 | 19.99 | 10.43 | 14.18 | |
| Russell 1000 Growth Index | 21.94 | 13.81 | 15.63 | ||
| * | The returns shown for periods prior to the share class inception date (including returns for the Life of the Fund, if shown, which are since Fund inception) include the returns of the Fund’s oldest share class. These returns are adjusted to reflect any higher class-related operating expenses of the newer share classes, as applicable. Please visit columbiathreadneedleus.com/investor/investment-products/mutual-funds/appended-performance for more information. |
| Columbia Integrated Large Cap Growth Fund | Annual Report 2023 | 3 |
(Unaudited)

| Portfolio breakdown (%) (at August 31, 2023) | |
| Common Stocks | 98.0 |
| Money Market Funds | 2.0 |
| Total | 100.0 |
| Equity sector breakdown (%) (at August 31, 2023) | |
| Communication Services | 11.9 |
| Consumer Discretionary | 15.4 |
| Consumer Staples | 4.1 |
| Energy | 0.5 |
| Financials | 8.2 |
| Health Care | 12.9 |
| Industrials | 5.0 |
| Information Technology | 41.6 |
| Materials | 0.4 |
| Total | 100.0 |
| Equity sub-industry breakdown (%) (at August 31, 2023) | |
| Information Technology | |
| Application Software | 7.2 |
| Communications Equipment | 0.9 |
| Internet Services & Infrastructure | 1.1 |
| Semiconductors | 11.6 |
| Systems Software | 11.0 |
| Technology Hardware, Storage & Peripherals | 9.8 |
| Total | 41.6 |
| 4 | Columbia Integrated Large Cap Growth Fund | Annual Report 2023 |
(Unaudited)
| • | The Fund’s underweight to the information technology sector was the top detractor from a sector allocation perspective, followed closely by an overweight to the financials sector. |
| • | Overall stock selection was detractive to relative performance. |
| • | Stock selection in the financials sector was the largest detractor for the period, followed by the industrials sector. The three largest individual detractors were Tesla, Inc., PayPal Holdings, Inc. and Estee Lauder Companies, Inc. |
| • | Overall sector allocation was additive to relative performance. |
| • | The Fund’s underweight to the consumer discretionary sector was the top contributor from a sector allocation perspective, followed by an overweight to the health care sector and an underweight to the real estate sector. |
| • | Stock selection in the health care sector made the largest positive contribution for the period, followed by the communication services and energy sectors. |
| • | Eight of the top ten individual contributors for the fund came from the information technology sector. |
| • | The three largest individual contributors were NVIDIA Corp., Microsoft Corp., and Broadcom, Inc. All three companies have strong ties to AI which has sent stocks surrounding the theme upwards. |
| Columbia Integrated Large Cap Growth Fund | Annual Report 2023 | 5 |
(Unaudited)
| 6 | Columbia Integrated Large Cap Growth Fund | Annual Report 2023 |
(Unaudited)
| March 1, 2023 — August 31, 2023 | |||||||
| Account value at the beginning of the period ($) | Account value at the end of the period ($) | Expenses paid during the period ($) | Fund’s annualized expense ratio (%) | ||||
| Actual | Hypothetical | Actual | Hypothetical | Actual | Hypothetical | Actual | |
| Class A | 1,000.00 | 1,000.00 | 1,209.10 | 1,021.83 | 3.73 | 3.41 | 0.67 |
| Advisor Class | 1,000.00 | 1,000.00 | 1,209.80 | 1,022.63 | 2.84 | 2.60 | 0.51 |
| Class C | 1,000.00 | 1,000.00 | 1,204.00 | 1,017.64 | 8.33 | 7.63 | 1.50 |
| Institutional Class | 1,000.00 | 1,000.00 | 1,209.50 | 1,022.63 | 2.84 | 2.60 | 0.51 |
| Institutional 2 Class | 1,000.00 | 1,000.00 | 1,210.30 | 1,022.89 | 2.56 | 2.35 | 0.46 |
| Institutional 3 Class | 1,000.00 | 1,000.00 | 1,211.00 | 1,023.19 | 2.23 | 2.04 | 0.40 |
| Class R | 1,000.00 | 1,000.00 | 1,207.00 | 1,020.06 | 5.67 | 5.19 | 1.02 |
| Columbia Integrated Large Cap Growth Fund | Annual Report 2023 | 7 |
August 31, 2023
| Common Stocks 97.9% | ||
| Issuer | Shares | Value ($) |
| Communication Services 11.6% | ||
| Entertainment 0.9% | ||
| Electronic Arts, Inc. | 19,901 | 2,387,722 |
| Interactive Media & Services 10.7% | ||
| Alphabet, Inc., Class A(a) | 26,137 | 3,559,075 |
| Alphabet, Inc., Class C(a) | 91,858 | 12,616,696 |
| Meta Platforms, Inc., Class A(a) | 32,531 | 9,625,598 |
| Pinterest, Inc., Class A(a) | 51,345 | 1,411,474 |
| Total | 27,212,843 | |
| Total Communication Services | 29,600,565 | |
| Consumer Discretionary 15.1% | ||
| Automobiles 1.5% | ||
| Tesla, Inc.(a) | 14,923 | 3,851,328 |
| Broadline Retail 5.2% | ||
| Amazon.com, Inc.(a) | 96,740 | 13,351,087 |
| Hotels, Restaurants & Leisure 3.3% | ||
| Booking Holdings, Inc.(a) | 456 | 1,415,894 |
| Domino’s Pizza, Inc. | 5,538 | 2,145,421 |
| Expedia Group, Inc.(a) | 21,758 | 2,358,349 |
| Starbucks Corp. | 24,445 | 2,381,921 |
| Total | 8,301,585 | |
| Leisure Products 1.2% | ||
| YETI Holdings, Inc.(a) | 61,529 | 3,073,373 |
| Specialty Retail 2.6% | ||
| AutoZone, Inc.(a) | 1,414 | 3,579,301 |
| TJX Companies, Inc. (The) | 14,952 | 1,382,761 |
| Williams-Sonoma, Inc. | 12,395 | 1,750,174 |
| Total | 6,712,236 | |
| Textiles, Apparel & Luxury Goods 1.3% | ||
| Deckers Outdoor Corp.(a) | 3,547 | 1,876,682 |
| lululemon athletica, Inc.(a) | 3,448 | 1,314,585 |
| Total | 3,191,267 | |
| Total Consumer Discretionary | 38,480,876 | |
| Common Stocks (continued) | ||
| Issuer | Shares | Value ($) |
| Consumer Staples 4.0% | ||
| Beverages 3.1% | ||
| Monster Beverage Corp.(a) | 70,753 | 4,061,930 |
| PepsiCo, Inc. | 21,505 | 3,826,169 |
| Total | 7,888,099 | |
| Personal Care Products 0.9% | ||
| Estee Lauder Companies, Inc. (The), Class A | 14,282 | 2,292,690 |
| Total Consumer Staples | 10,180,789 | |
| Energy 0.5% | ||
| Oil, Gas & Consumable Fuels 0.5% | ||
| EOG Resources, Inc. | 9,095 | 1,169,799 |
| Total Energy | 1,169,799 | |
| Financials 8.0% | ||
| Capital Markets 1.6% | ||
| Charles Schwab Corp. (The) | 38,438 | 2,273,608 |
| MSCI, Inc. | 3,368 | 1,830,912 |
| Total | 4,104,520 | |
| Financial Services 5.7% | ||
| FleetCor Technologies, Inc.(a) | 10,941 | 2,972,998 |
| MasterCard, Inc., Class A | 20,478 | 8,450,042 |
| PayPal Holdings, Inc.(a) | 50,976 | 3,186,510 |
| Total | 14,609,550 | |
| Insurance 0.7% | ||
| Progressive Corp. (The) | 13,133 | 1,752,861 |
| Total Financials | 20,466,931 | |
| Health Care 12.7% | ||
| Biotechnology 4.2% | ||
| Exelixis, Inc.(a) | 92,114 | 2,062,432 |
| Incyte Corp.(a) | 26,307 | 1,697,591 |
| Neurocrine Biosciences, Inc.(a) | 18,095 | 1,970,365 |
| Vertex Pharmaceuticals, Inc.(a) | 13,920 | 4,848,893 |
| Total | 10,579,281 | |
| Health Care Equipment & Supplies 1.0% | ||
| DexCom, Inc.(a) | 13,872 | 1,400,795 |
| Stryker Corp. | 4,033 | 1,143,557 |
| Total | 2,544,352 | |
| 8 | Columbia Integrated Large Cap Growth Fund | Annual Report 2023 |
August 31, 2023
| Common Stocks (continued) | ||
| Issuer | Shares | Value ($) |
| Health Care Providers & Services 3.9% | ||
| Cigna Group (The) | 12,087 | 3,339,155 |
| McKesson Corp. | 2,929 | 1,207,685 |
| UnitedHealth Group, Inc. | 11,416 | 5,440,637 |
| Total | 9,987,477 | |
| Health Care Technology 1.8% | ||
| Veeva Systems Inc., Class A(a) | 21,773 | 4,544,025 |
| Pharmaceuticals 1.8% | ||
| Eli Lilly & Co. | 8,235 | 4,563,837 |
| Total Health Care | 32,218,972 | |
| Industrials 4.9% | ||
| Aerospace & Defense 0.7% | ||
| Axon Enterprise, Inc.(a) | 8,525 | 1,815,058 |
| Commercial Services & Supplies 1.0% | ||
| Waste Management, Inc. | 16,000 | 2,508,480 |
| Construction & Engineering 1.4% | ||
| Valmont Industries, Inc. | 7,230 | 1,832,805 |
| WillScot Mobile Mini Holdings Corp.(a) | 40,713 | 1,670,047 |
| Total | 3,502,852 | |
| Electrical Equipment 0.4% | ||
| Acuity Brands, Inc. | 5,970 | 962,841 |
| Ground Transportation 0.9% | ||
| Knight-Swift Transportation Holdings, Inc. | 22,522 | 1,234,656 |
| Landstar System, Inc. | 6,011 | 1,140,948 |
| Total | 2,375,604 | |
| Machinery 0.5% | ||
| ITT, Inc. | 12,544 | 1,283,000 |
| Total Industrials | 12,447,835 | |
| Information Technology 40.7% | ||
| Communications Equipment 0.8% | ||
| F5, Inc.(a) | 3,865 | 632,546 |
| Motorola Solutions, Inc. | 5,450 | 1,545,456 |
| Total | 2,178,002 | |
| IT Services 1.1% | ||
| GoDaddy, Inc., Class A(a) | 38,099 | 2,762,559 |
| Common Stocks (continued) | ||
| Issuer | Shares | Value ($) |
| Semiconductors & Semiconductor Equipment 11.4% | ||
| Advanced Micro Devices, Inc.(a) | 41,262 | 4,362,219 |
| Broadcom, Inc. | 7,843 | 7,238,226 |
| NVIDIA Corp. | 25,457 | 12,564,302 |
| QUALCOMM, Inc. | 41,470 | 4,749,559 |
| Total | 28,914,306 | |
| Software 17.9% | ||
| Adobe, Inc.(a) | 15,267 | 8,539,444 |
| Autodesk, Inc.(a) | 7,197 | 1,597,302 |
| Crowdstrike Holdings, Inc., Class A(a) | 7,029 | 1,145,938 |
| Dropbox, Inc., Class A(a) | 87,723 | 2,437,822 |
| Microsoft Corp. | 66,780 | 21,887,813 |
| Salesforce, Inc.(a) | 5,540 | 1,226,889 |
| ServiceNow, Inc.(a) | 7,586 | 4,466,864 |
| Workday, Inc., Class A(a) | 17,258 | 4,219,581 |
| Total | 45,521,653 | |
| Technology Hardware, Storage & Peripherals 9.5% | ||
| Apple, Inc. | 129,420 | 24,314,135 |
| Total Information Technology | 103,690,655 | |
| Materials 0.4% | ||
| Containers & Packaging 0.4% | ||
| Sealed Air Corp. | 29,143 | 1,080,040 |
| Total Materials | 1,080,040 | |
| Total Common Stocks (Cost $141,430,977) | 249,336,462 | |
| Money Market Funds 2.0% | ||
| Shares | Value ($) | |
| Columbia Short-Term Cash Fund, 5.476%(b),(c) | 5,082,232 | 5,080,707 |
| Total Money Market Funds (Cost $5,080,077) | 5,080,707 | |
| Total Investments in Securities (Cost: $146,511,054) | 254,417,169 | |
| Other Assets & Liabilities, Net | 187,617 | |
| Net Assets | 254,604,786 | |
| Columbia Integrated Large Cap Growth Fund | Annual Report 2023 | 9 |
August 31, 2023
| (a) | Non-income producing investment. |
| (b) | The rate shown is the seven-day current annualized yield at August 31, 2023. |
| (c) | As defined in the Investment Company Act of 1940, as amended, an affiliated company is one in which the Fund owns 5% or more of the company’s outstanding voting securities, or a company which is under common ownership or control with the Fund. The value of the holdings and transactions in these affiliated companies during the year ended August 31, 2023 are as follows: |
| Affiliated issuers | Beginning of period($) | Purchases($) | Sales($) | Net change in unrealized appreciation (depreciation)($) | End of period($) | Realized gain (loss)($) | Dividends($) | End of period shares |
| Columbia Short-Term Cash Fund, 5.476% | ||||||||
| 3,862,804 | 68,308,018 | (67,090,500) | 385 | 5,080,707 | (215) | 159,497 | 5,082,232 | |
| ■ | Level 1 — Valuations based on quoted prices for investments in active markets that the Fund has the ability to access at the measurement date. Valuation adjustments are not applied to Level 1 investments. |
| ■ | Level 2 — Valuations based on other significant observable inputs (including quoted prices for similar securities, interest rates, prepayment speeds, credit risks, etc.). |
| ■ | Level 3 — Valuations based on significant unobservable inputs (including the Fund’s own assumptions and judgment in determining the fair value of investments). |
| Level 1 ($) | Level 2 ($) | Level 3 ($) | Total ($) | |
| Investments in Securities | ||||
| Common Stocks | ||||
| Communication Services | 29,600,565 | — | — | 29,600,565 |
| Consumer Discretionary | 38,480,876 | — | — | 38,480,876 |
| Consumer Staples | 10,180,789 | — | — | 10,180,789 |
| Energy | 1,169,799 | — | — | 1,169,799 |
| Financials | 20,466,931 | — | — | 20,466,931 |
| Health Care | 32,218,972 | — | — | 32,218,972 |
| Industrials | 12,447,835 | — | — | 12,447,835 |
| 10 | Columbia Integrated Large Cap Growth Fund | Annual Report 2023 |
August 31, 2023
| Level 1 ($) | Level 2 ($) | Level 3 ($) | Total ($) | |
| Information Technology | 103,690,655 | — | — | 103,690,655 |
| Materials | 1,080,040 | — | — | 1,080,040 |
| Total Common Stocks | 249,336,462 | — | — | 249,336,462 |
| Money Market Funds | 5,080,707 | — | — | 5,080,707 |
| Total Investments in Securities | 254,417,169 | — | — | 254,417,169 |
| Columbia Integrated Large Cap Growth Fund | Annual Report 2023 | 11 |
August 31, 2023
| Assets | |
| Investments in securities, at value | |
| Unaffiliated issuers (cost $141,430,977) | $249,336,462 |
| Affiliated issuers (cost $5,080,077) | 5,080,707 |
| Receivable for: | |
| Capital shares sold | 116,994 |
| Dividends | 154,739 |
| Expense reimbursement due from Investment Manager | 3,065 |
| Prepaid expenses | 3,668 |
| Total assets | 254,695,635 |
| Liabilities | |
| Payable for: | |
| Capital shares redeemed | 37,661 |
| Management services fees | 5,206 |
| Distribution and/or service fees | 314 |
| Transfer agent fees | 15,602 |
| Trustees’ fees | 10,495 |
| Accounting services fees | 15,045 |
| Other expenses | 6,526 |
| Total liabilities | 90,849 |
| Net assets applicable to outstanding capital stock | $254,604,786 |
| Represented by | |
| Paid in capital | 152,524,911 |
| Total distributable earnings (loss) | 102,079,875 |
| Total - representing net assets applicable to outstanding capital stock | $254,604,786 |
| Class A | |
| Net assets | $63,805,437 |
| Shares outstanding | 3,872,443 |
| Net asset value per share | $16.48 |
| Maximum sales charge | 5.75% |
| Maximum offering price per share (calculated by dividing the net asset value per share by 1.0 minus the maximum sales charge for Class A shares) | $17.49 |
| Advisor Class | |
| Net assets | $33,324,180 |
| Shares outstanding | 1,978,803 |
| Net asset value per share | $16.84 |
| Class C | |
| Net assets | $15,309 |
| Shares outstanding | 940 |
| Net asset value per share | $16.29 |
| Institutional Class | |
| Net assets | $41,369,472 |
| Shares outstanding | 2,453,222 |
| Net asset value per share | $16.86 |
| Institutional 2 Class | |
| Net assets | $147,631 |
| Shares outstanding | 8,754 |
| Net asset value per share | $16.86 |
| Institutional 3 Class | |
| Net assets | $115,940,711 |
| Shares outstanding | 6,848,525 |
| Net asset value per share | $16.93 |
| Class R | |
| Net assets | $2,046 |
| Shares outstanding | 124 |
| Net asset value per share(a) | $16.44 |
| 12 | Columbia Integrated Large Cap Growth Fund | Annual Report 2023 |
August 31, 2023
| (a) | Net asset value per share rounds to this amount due to fractional shares outstanding. |
| Columbia Integrated Large Cap Growth Fund | Annual Report 2023 | 13 |
Year Ended August 31, 2023
| Net investment income | |
| Income: | |
| Dividends — unaffiliated issuers | $1,715,653 |
| Dividends — affiliated issuers | 159,497 |
| Interfund lending | 30 |
| Total income | 1,875,180 |
| Expenses: | |
| Management services fees | 1,834,497 |
| Distribution and/or service fees | |
| Class A | 74,421 |
| Class C | 69 |
| Class R | 10 |
| Transfer agent fees | |
| Class A | 67,216 |
| Advisor Class | 38,800 |
| Class C | 8 |
| Institutional Class | 74,631 |
| Institutional 2 Class | 93 |
| Institutional 3 Class | 5,730 |
| Class R | 2 |
| Trustees’ fees | 19,685 |
| Custodian fees | 5,696 |
| Printing and postage fees | 21,584 |
| Registration fees | 105,157 |
| Accounting services fees | 30,090 |
| Legal fees | 15,069 |
| Compensation of chief compliance officer | 4 |
| Other | 71,917 |
| Total expenses | 2,364,679 |
| Fees waived or expenses reimbursed by Investment Manager and its affiliates | (1,149,759) |
| Expense reduction | (700) |
| Total net expenses | 1,214,220 |
| Net investment income | 660,960 |
| Realized and unrealized gain (loss) — net | |
| Net realized gain (loss) on: | |
| Investments — unaffiliated issuers | 12,936,220 |
| Investments — affiliated issuers | (215) |
| Net realized gain | 12,936,005 |
| Net change in unrealized appreciation (depreciation) on: | |
| Investments — unaffiliated issuers | 32,304,326 |
| Investments — affiliated issuers | 385 |
| Net change in unrealized appreciation (depreciation) | 32,304,711 |
| Net realized and unrealized gain | 45,240,716 |
| Net increase in net assets resulting from operations | $45,901,676 |
| 14 | Columbia Integrated Large Cap Growth Fund | Annual Report 2023 |
| Year Ended August 31, 2023 | Year Ended August 31, 2022 (a) | |
| Operations | ||
| Net investment income | $660,960 | $899,469 |
| Net realized gain | 12,936,005 | 110,357,496 |
| Net change in unrealized appreciation (depreciation) | 32,304,711 | (199,384,850) |
| Net increase (decrease) in net assets resulting from operations | 45,901,676 | (88,127,885) |
| Distributions to shareholders | ||
| Net investment income and net realized gains | ||
| Class A | (13,522,959) | (246,598) |
| Advisor Class | (6,382,265) | (27,671,125) |
| Class C | (995) | — |
| Institutional Class | (16,988,688) | — |
| Institutional 2 Class | (30,029) | — |
| Institutional 3 Class | (23,658,084) | (56,772,058) |
| Class R | (538) | — |
| Investor Class | — | (13,323,922) |
| Total distributions to shareholders | (60,583,558) | (98,013,703) |
| Increase (decrease) in net assets from capital stock activity | 15,384,236 | (148,070,471) |
| Redemption fees | — | 20 |
| Total increase (decrease) in net assets | 702,354 | (334,212,039) |
| Net assets at beginning of year | 253,902,432 | 588,114,471 |
| Net assets at end of year | $254,604,786 | $253,902,432 |
| (a) | Class C, Institutional Class, Institutional 2 Class, and Class R shares are based on operations from January 26, 2022 (commencement of operations) through the stated period end. |
| Columbia Integrated Large Cap Growth Fund | Annual Report 2023 | 15 |
| Year Ended | Year Ended | |||
| August 31, 2023 | August 31, 2022 (a) | |||
| Shares | Dollars ($) | Shares | Dollars ($) | |
| Capital stock activity | ||||
| Class A | ||||
| Shares sold | 372,195 | 5,965,904 | 3,283,034 | 66,942,122 |
| Distributions reinvested | 984,012 | 13,185,752 | 10,578 | 246,598 |
| Shares redeemed | (573,327) | (8,348,185) | (262,351) | (5,197,256) |
| Net increase | 782,880 | 10,803,471 | 3,031,261 | 61,991,464 |
| Advisor Class | ||||
| Shares sold | 573,257 | 8,341,217 | 686,569 | 15,461,705 |
| Distributions reinvested | 438,464 | 5,998,191 | 1,121,682 | 26,347,865 |
| Shares redeemed | (1,390,486) | (23,474,665) | (5,641,994) | (125,324,561) |
| Net decrease | (378,765) | (9,135,257) | (3,833,743) | (83,514,991) |
| Class C | ||||
| Shares sold | 676 | 10,077 | 230 | 4,500 |
| Distributions reinvested | 34 | 456 | — | — |
| Net increase | 710 | 10,533 | 230 | 4,500 |
| Institutional Class | ||||
| Shares sold | 553,988 | 8,319,303 | 4,978,716 | 104,642,992 |
| Distributions reinvested | 1,238,595 | 16,968,753 | — | — |
| Shares redeemed | (3,982,244) | (60,742,515) | (335,833) | (6,336,622) |
| Net increase (decrease) | (2,189,661) | (35,454,459) | 4,642,883 | 98,306,370 |
| Institutional 2 Class | ||||
| Shares sold | — | — | 8,316 | 152,793 |
| Distributions reinvested | 2,153 | 29,489 | — | — |
| Shares redeemed | (1,712) | (27,653) | (3) | (45) |
| Net increase | 441 | 1,836 | 8,313 | 152,748 |
| Institutional 3 Class | ||||
| Shares sold | 2,072,565 | 35,410,530 | 1,221,581 | 28,290,217 |
| Distributions reinvested | 1,719,813 | 23,630,231 | 2,404,299 | 56,629,103 |
| Shares redeemed | (642,625) | (9,882,649) | (12,195,076) | (253,954,561) |
| Net increase (decrease) | 3,149,753 | 49,158,112 | (8,569,196) | (169,035,241) |
| Class R | ||||
| Shares sold | — | — | 124 | 2,500 |
| Net increase | — | — | 124 | 2,500 |
| Investor Class | ||||
| Shares sold | — | — | 35,788 | 899,427 |
| Distributions reinvested | — | — | 558,721 | 12,932,997 |
| Shares redeemed | — | — | (3,379,215) | (69,810,245) |
| Net decrease | — | — | (2,784,706) | (55,977,821) |
| Total net increase (decrease) | 1,365,358 | 15,384,236 | (7,504,834) | (148,070,471) |
| (a) | Class C, Institutional Class, Institutional 2 Class, and Class R shares are based on operations from January 26, 2022 (commencement of operations) through the stated period end. |
| 16 | Columbia Integrated Large Cap Growth Fund | Annual Report 2023 |
| Columbia Integrated Large Cap Growth Fund | Annual Report 2023 | 17 |
| Net asset value, beginning of period | Net investment income (loss) | Net realized and unrealized gain (loss) | Total from investment operations | Distributions from net investment income | Distributions from net realized gains | Total distributions to shareholders | |
| Class A | |||||||
| Year Ended 8/31/2023 | $18.13 | 0.02 | 2.69 | 2.71 | (0.03) | (4.33) | (4.36) |
| Year Ended 8/31/2022 | $27.22 | 0.03 | (4.40) | (4.37) | (0.01) | (4.71) | (4.72) |
| Year Ended 8/31/2021(f) | $22.22 | (0.01) | 6.77 | 6.76 | (0.04) | (1.72) | (1.76) |
| Year Ended 8/31/2020(f) | $17.94 | 0.04 | 5.12 | 5.16 | (0.09) | (0.79) | (0.88) |
| Year Ended 8/31/2019 | $20.96 | 0.09 | (0.48) | (0.39) | (0.08) | (2.55) | (2.63) |
| Advisor Class | |||||||
| Year Ended 8/31/2023 | $18.44 | 0.04 | 2.75 | 2.79 | (0.06) | (4.33) | (4.39) |
| Year Ended 8/31/2022 | $27.60 | 0.04 | (4.42) | (4.38) | (0.07) | (4.71) | (4.78) |
| Year Ended 8/31/2021(f) | $22.49 | 0.05 | 6.86 | 6.91 | (0.08) | (1.72) | (1.80) |
| Year Ended 8/31/2020(f) | $18.15 | 0.09 | 5.18 | 5.27 | (0.14) | (0.79) | (0.93) |
| Year Ended 8/31/2019 | $21.17 | 0.18 | (0.53) | (0.35) | (0.12) | (2.55) | (2.67) |
| Class C | |||||||
| Year Ended 8/31/2023 | $18.06 | (0.11) | 2.67 | 2.56 | — | (4.33) | (4.33) |
| Year Ended 8/31/2022(g) | $20.09 | (0.07) | (1.96) | (2.03) | — | — | — |
| Institutional Class | |||||||
| Year Ended 8/31/2023 | $18.46 | 0.04 | 2.75 | 2.79 | (0.06) | (4.33) | (4.39) |
| Year Ended 8/31/2022(g) | $20.41 | 0.05 | (2.00) | (1.95) | — | — | — |
| Institutional 2 Class | |||||||
| Year Ended 8/31/2023 | $18.47 | 0.05 | 2.74 | 2.79 | (0.07) | (4.33) | (4.40) |
| Year Ended 8/31/2022(g) | $20.41 | 0.06 | (2.00) | (1.94) | — | — | — |
| Institutional 3 Class | |||||||
| Year Ended 8/31/2023 | $18.52 | 0.06 | 2.76 | 2.82 | (0.08) | (4.33) | (4.41) |
| Year Ended 8/31/2022 | $27.69 | 0.06 | (4.43) | (4.37) | (0.09) | (4.71) | (4.80) |
| Year Ended 8/31/2021(f) | $22.56 | 0.08 | 6.88 | 6.96 | (0.11) | (1.72) | (1.83) |
| Year Ended 8/31/2020(f) | $18.20 | 0.12 | 5.19 | 5.31 | (0.16) | (0.79) | (0.95) |
| Year Ended 8/31/2019 | $21.21 | 0.13 | (0.44) | (0.31) | (0.15) | (2.55) | (2.70) |
| 18 | Columbia Integrated Large Cap Growth Fund | Annual Report 2023 |
| Net asset value, end of period | Total return | Total gross expense ratio to average net assets(a) | Total net expense ratio to average net assets(a),(b),(c) | Net investment income (loss) ratio to average net assets | Portfolio turnover | Net assets, end of period (000’s) | |
| Class A | |||||||
| Year Ended 8/31/2023 | $16.48 | 20.51% | 1.12% | 0.65%(d) | 0.12% | 48% | $63,805 |
| Year Ended 8/31/2022 | $18.13 | (19.28%) | 0.95%(e) | 0.70%(e) | 0.16% | 42% | $56,024 |
| Year Ended 8/31/2021(f) | $27.22 | 32.70% | 0.84% | 0.79% | (0.03%) | 50% | $1,587 |
| Year Ended 8/31/2020(f) | $22.22 | 29.85% | 0.83% | 0.79% | 0.22% | 71% | $687 |
| Year Ended 8/31/2019 | $17.94 | (0.63%) | 0.84% | 0.79% | 0.49% | 89% | $712 |
| Advisor Class | |||||||
| Year Ended 8/31/2023 | $16.84 | 20.64% | 0.98% | 0.51%(d) | 0.24% | 48% | $33,324 |
| Year Ended 8/31/2022 | $18.44 | (19.10%) | 0.82%(e) | 0.53%(e) | 0.16% | 42% | $43,484 |
| Year Ended 8/31/2021(f) | $27.60 | 33.03% | 0.58% | 0.54% | 0.21% | 50% | $170,901 |
| Year Ended 8/31/2020(f) | $22.49 | 30.19% | 0.58% | 0.54% | 0.48% | 71% | $121,958 |
| Year Ended 8/31/2019 | $18.15 | (0.40%) | 0.59% | 0.54% | 0.75% | 89% | $168,838 |
| Class C | |||||||
| Year Ended 8/31/2023 | $16.29 | 19.47% | 1.96% | 1.50%(d) | (0.74%) | 48% | $15 |
| Year Ended 8/31/2022(g) | $18.06 | (10.10%) | 1.96% | 1.51% | (0.62%) | 42% | $4 |
| Institutional Class | |||||||
| Year Ended 8/31/2023 | $16.86 | 20.62% | 0.98% | 0.51%(d) | 0.26% | 48% | $41,369 |
| Year Ended 8/31/2022(g) | $18.46 | (9.55%) | 0.96% | 0.51% | 0.42% | 42% | $85,728 |
| Institutional 2 Class | |||||||
| Year Ended 8/31/2023 | $16.86 | 20.62% | 0.93% | 0.46% | 0.30% | 48% | $148 |
| Year Ended 8/31/2022(g) | $18.47 | (9.50%) | 0.90% | 0.45% | 0.57% | 42% | $154 |
| Institutional 3 Class | |||||||
| Year Ended 8/31/2023 | $16.93 | 20.78% | 0.87% | 0.40% | 0.37% | 48% | $115,941 |
| Year Ended 8/31/2022 | $18.52 | (18.97%) | 0.61%(e) | 0.40%(e) | 0.26% | 42% | $68,507 |
| Year Ended 8/31/2021(f) | $27.69 | 33.19% | 0.43% | 0.39% | 0.36% | 50% | $339,707 |
| Year Ended 8/31/2020(f) | $22.56 | 30.40% | 0.43% | 0.39% | 0.62% | 71% | $268,706 |
| Year Ended 8/31/2019 | $18.20 | (0.22%) | 0.43% | 0.39% | 0.94% | 89% | $226,978 |
| Columbia Integrated Large Cap Growth Fund | Annual Report 2023 | 19 |
| Net asset value, beginning of period | Net investment income (loss) | Net realized and unrealized gain (loss) | Total from investment operations | Distributions from net investment income | Distributions from net realized gains | Total distributions to shareholders | |
| Class R | |||||||
| Year Ended 8/31/2023 | $18.12 | (0.04) | 2.69 | 2.65 | — | (4.33) | (4.33) |
| Year Ended 8/31/2022(g) | $20.09 | (0.01) | (1.96) | (1.97) | — | — | — |
| Notes to Financial Highlights | |
| (a) | In addition to the fees and expenses that the Fund bears directly, the Fund indirectly bears a pro rata share of the fees and expenses of any other funds in which it invests. Such indirect expenses are not included in the Fund’s reported expense ratios. |
| (b) | Total net expenses include the impact of certain fee waivers/expense reimbursements made by the Investment Manager and certain of its affiliates, if applicable. |
| (c) | Total net expenses include the impact of certain fee waivers/expense reimbursements made by BMO Asset Management Corp, and certain of its affiliates, if applicable, for the account periods prior to the closing of the Reorganization, which occurred on January 21, 2022. |
| (d) | The benefits derived from expense reductions had an impact of less than 0.01%. |
| (e) | Ratios include interfund lending expense which is less than 0.01%. |
| (f) | Net investment income (loss) per share calculated using the average shares method. |
| (g) | Class C, Institutional Class, Institutional 2 Class and Class R shares commenced operations on January 26, 2022. Per share data and total return reflect activity from that date. |
| 20 | Columbia Integrated Large Cap Growth Fund | Annual Report 2023 |
| Net asset value, end of period | Total return | Total gross expense ratio to average net assets(a) | Total net expense ratio to average net assets(a),(b),(c) | Net investment income (loss) ratio to average net assets | Portfolio turnover | Net assets, end of period (000’s) | |
| Class R | |||||||
| Year Ended 8/31/2023 | $16.44 | 19.99% | 1.48% | 1.01%(d) | (0.27%) | 48% | $2 |
| Year Ended 8/31/2022(g) | $18.12 | (9.81%) | 1.46% | 1.01% | (0.13%) | 42% | $2 |
| Columbia Integrated Large Cap Growth Fund | Annual Report 2023 | 21 |
August 31, 2023
| 22 | Columbia Integrated Large Cap Growth Fund | Annual Report 2023 |
August 31, 2023
| Columbia Integrated Large Cap Growth Fund | Annual Report 2023 | 23 |
August 31, 2023
| 24 | Columbia Integrated Large Cap Growth Fund | Annual Report 2023 |
August 31, 2023
| Effective rate (%) | |
| Class A | 0.12 |
| Advisor Class | 0.12 |
| Class C | 0.11 |
| Institutional Class | 0.12 |
| Institutional 2 Class | 0.07 |
| Institutional 3 Class | 0.01 |
| Class R | 0.12 |
| Columbia Integrated Large Cap Growth Fund | Annual Report 2023 | 25 |
August 31, 2023
| Front End (%) | CDSC (%) | Amount ($) | |
| Class A | 5.75 | 0.50 - 1.00(a) | 4,106 |
| Class C | — | 1.00(b) | — |
| (a) | This charge is imposed on certain investments of between $1 million and $50 million redeemed within 18 months after purchase, as follows: 1.00% if redeemed within 12 months after purchase, and 0.50% if redeemed more than 12, but less than 18, months after purchase, with certain limited exceptions. |
| (b) | This charge applies to redemptions within 12 months after purchase, with certain limited exceptions. |
| Fee rate(s) contractual through December 31, 2023 | |
| Class A | 0.80% |
| Advisor Class | 0.55 |
| Class C | 1.55 |
| Institutional Class | 0.55 |
| Institutional 2 Class | 0.46 |
| Institutional 3 Class | 0.40 |
| Class R | 1.05 |
| 26 | Columbia Integrated Large Cap Growth Fund | Annual Report 2023 |
August 31, 2023
| Undistributed net investment income ($) | Accumulated net realized (loss) ($) | Paid in capital ($) |
| (2) | (28,989,391) | 28,989,393 |
| Year Ended August 31, 2023 | Year Ended August 31, 2022 | ||||
| Ordinary income ($) | Long-term capital gains ($) | Total ($) | Ordinary income ($) | Long-term capital gains ($) | Total ($) |
| 956,890 | 59,626,668 | 60,583,558 | 24,067,569 | 73,946,134 | 98,013,703 |
| Undistributed ordinary income ($) | Undistributed long-term capital gains ($) | Capital loss carryforwards ($) | Net unrealized appreciation ($) |
| 346,099 | — | (4,226,040) | 105,968,761 |
| Federal tax cost ($) | Gross unrealized appreciation ($) | Gross unrealized (depreciation) ($) | Net unrealized appreciation ($) |
| 148,448,408 | 112,294,115 | (6,325,354) | 105,968,761 |
| No expiration short-term ($) | No expiration long-term ($) | Total ($) | Utilized ($) |
| (4,226,040) | — | (4,226,040) | — |
| Columbia Integrated Large Cap Growth Fund | Annual Report 2023 | 27 |
August 31, 2023
| Borrower or lender | Average loan balance ($) | Weighted average interest rate (%) | Number of days with outstanding loans |
| Lender | 300,000 | 3.59 | 1 |
| 28 | Columbia Integrated Large Cap Growth Fund | Annual Report 2023 |
August 31, 2023
| Columbia Integrated Large Cap Growth Fund | Annual Report 2023 | 29 |
August 31, 2023
| 30 | Columbia Integrated Large Cap Growth Fund | Annual Report 2023 |
August 31, 2023
| Columbia Integrated Large Cap Growth Fund | Annual Report 2023 | 31 |
| 32 | Columbia Integrated Large Cap Growth Fund | Annual Report 2023 |
| Qualified dividend income | Dividends received deduction | Section 199A dividends |
| 91.29% | 91.32% | 2.67% |
| Name, address, year of birth | Position held with the Columbia Funds and length of service | Principal occupation(s) during past five years and other relevant professional experience | Number of Funds in the Columbia Funds Complex* overseen | Other directorships held by Trustee during the past five years and other relevant Board experience |
| George S. Batejan c/o Columbia Management Investment Advisers, LLC 290 Congress Street Boston, MA 02210 1954 | Trustee since 2017 | Executive Vice President, Global Head of Technology and Operations, Janus Capital Group, Inc., 2010-2016 | 173 | Former Chairman of the Board, NICSA (National Investment Company Services Association) (Executive Committee, Nominating Committee and Governance Committee), 2014-2016; former Director, Intech Investment Management, 2011-2016; former Board Member, Metro Denver Chamber of Commerce, 2015-2016; former Advisory Board Member, University of Colorado Business School, 2015-2018; former Board Member, Chase Bank International, 1993-1994 |
| Columbia Integrated Large Cap Growth Fund | Annual Report 2023 | 33 |
(Unaudited)
Independent trustees (continued)
| Name, address, year of birth | Position held with the Columbia Funds and length of service | Principal occupation(s) during past five years and other relevant professional experience | Number of Funds in the Columbia Funds Complex* overseen | Other directorships held by Trustee during the past five years and other relevant Board experience |
| Kathleen Blatz c/o Columbia Management Investment Advisers, LLC 290 Congress Street Boston, MA 02210 1954 | Trustee since 2006 | Attorney, specializing in arbitration and mediation; Chief Justice, Minnesota Supreme Court, 1998-2006; Associate Justice, Minnesota Supreme Court, 1996-1998; Fourth Judicial District Court Judge, Hennepin County, 1994-1996; Attorney in private practice and public service, 1984-1993; State Representative, Minnesota House of Representatives, 1979-1993, which included service on the Tax and Financial Institutions and Insurance Committees; Member and Interim Chair, Minnesota Sports Facilities Authority, January-July 2017; Interim President and Chief Executive Officer, Blue Cross and Blue Shield of Minnesota (health care insurance), February-July 2018, April-October 2021 | 173 | Former Trustee, Blue Cross and Blue Shield of Minnesota, 2009-2021 (Chair of the Business Development Committee, 2014-2017; Chair of the Governance Committee, 2017-2019); former Member and Chair of the Board, Minnesota Sports Facilities Authority, January 2017-July 2017; former Director, Robina Foundation, 2009-2020 (Chair, 2014-2020); Director, Richard M. Schulze Family Foundation, since 2021 |
| Pamela G. Carlton c/o Columbia Management Investment Advisers, LLC 290 Congress Street Boston, MA 02210 1954 | Chair since 2023; Trustee since 2007 | President, Springboard – Partners in Cross Cultural Leadership (consulting company), since 2003; Managing Director of US Equity Research, JP Morgan Chase, 1999-2003; Director of US Equity Research, Chase Asset Management, 1996-1999; Co-Director Latin America Research, 1993-1996, COO Global Research, 1992-1996, Co-Director of US Research, 1991-1992, Investment Banker, 1982-1991, Morgan Stanley; Attorney, Cleary Gottlieb Steen & Hamilton LLP, 1980-1982 | 173 | Trustee, New York Presbyterian Hospital Board, since 1996; Director, DR Bank (Audit Committee) since 2017; Director, Evercore Inc. (Audit Committee, Nominating and Governance Committee), since 2019; Director, Apollo Commercial Real Estate Finance, Inc. (Chair, Nominating and Governance Committee) (financial services), since 2021; the Governing Council of the Independent Directors Council (IDC), since 2021 |
| Janet Langford Carrig c/o Columbia Management Investment Advisers, LLC 290 Congress Street Boston, MA 02210 1957 | Trustee since 1996 | Senior Vice President, General Counsel and Corporate Secretary, ConocoPhillips (independent energy company), September 2007-October 2018 | 173 | Director, EQT Corporation (natural gas producer), since 2019; former Director, Whiting Petroleum Corporation (independent oil and gas company), 2020-2022 |
| J. Kevin Connaughton c/o Columbia Management Investment Advisers, LLC 290 Congress Street Boston, MA 02210 1964 | Trustee since 2020 | CEO and President, RhodeWay Financial (non-profit financial planning firm), since December 2022; Member, FINRA National Adjudicatory Council, since January 2020; Adjunct Professor of Finance, Bentley University since January 2018; Consultant to Independent Trustees of CFVIT and CFST I from March 2016 to June 2020 with respect to CFVIT and to December 2020 with respect to CFST I; Managing Director and General Manager of Mutual Fund Products, Columbia Management Investment Advisers, LLC, May 2010-February 2015; President, Columbia Funds, 2008-2015; and senior officer of Columbia Funds and affiliated funds, 2003-2015 | 171 | Former Director, The Autism Project, March 2015-December 2021; former Member of the Investment Committee, St. Michael’s College, November 2015-February 2020; former Trustee, St. Michael’s College, June 2017-September 2019; former Trustee, New Century Portfolios (former mutual fund complex), January 2015-December 2017 |
| 34 | Columbia Integrated Large Cap Growth Fund | Annual Report 2023 |
(Unaudited)
Independent trustees (continued)
| Name, address, year of birth | Position held with the Columbia Funds and length of service | Principal occupation(s) during past five years and other relevant professional experience | Number of Funds in the Columbia Funds Complex* overseen | Other directorships held by Trustee during the past five years and other relevant Board experience |
| Olive M. Darragh c/o Columbia Management Investment Advisers, LLC 290 Congress Street Boston, MA 02210 1962 | Trustee since 2020 | Managing Director of Darragh Inc. (strategy and talent management consulting firm), since 2010; Founder and CEO, Zolio, Inc. (investment management talent identification platform), since 2004; Consultant to Independent Trustees of CFVIT and CFST I from June 2019 to June 2020 with respect to CFVIT and to December 2020 with respect to CFST I; Partner, Tudor Investments, 2004-2010; Senior Partner, McKinsey & Company (consulting), 1990-2004; Touche Ross CPA, 1985-1988 | 171 | Treasurer, Edinburgh University US Trust Board, since January 2023; Member, HBS Community Action Partners Board, since September 2022; former Director, University of Edinburgh Business School (Member of US Board), 2004-2019; former Director, Boston Public Library Foundation, 2008-2017 |
| Patricia M. Flynn c/o Columbia Management Investment Advisers, LLC 290 Congress Street Boston, MA 02210 1950 | Trustee since 2004 | Professor of Economics and Management, Bentley University, since 2002; Dean, McCallum Graduate School of Business, Bentley University, 1992-2002 | 173 | Former Trustee, MA Taxpayers Foundation, 1997-2022; former Director, The MA Business Roundtable, 2003-2019; former Chairperson, Innovation Index Advisory Committee, MA Technology Collaborative, 1997-2020 |
| Brian J. Gallagher c/o Columbia Management Investment Advisers, LLC 290 Congress Street Boston, MA 02210 1954 | Trustee since 2017 | Retired; Partner with Deloitte & Touche LLP and its predecessors, 1977-2016 | 173 | Trustee, Catholic Schools Foundation, since 2004 |
| Douglas A. Hacker c/o Columbia Management Investment Advisers, LLC 290 Congress Street Boston, MA 02210 1955 | Trustee since 1996 | Independent business executive, since May 2006; Executive Vice President – Strategy of United Airlines, December 2002 - May 2006; President of UAL Loyalty Services (airline marketing company), September 2001-December 2002; Executive Vice President and Chief Financial Officer of United Airlines, July 1999-September 2001 | 173 | Director, SpartanNash Company since November 2013 (Chair of the Board, since May 2021) (food distributor); Director, Aircastle Limited (Chair of Audit Committee) (aircraft leasing), since August 2006; former Director, Nash Finch Company (food distributor), 2005-2013; former Director, SeaCube Container Leasing Ltd. (container leasing), 2010-2013; and former Director, Travelport Worldwide Limited (travel information technology), 2014-2019 |
| Nancy T. Lukitsh c/o Columbia Management Investment Advisers, LLC 290 Congress Street Boston, MA 02210 1956 | Trustee since 2011 | Senior Vice President, Partner and Director of Marketing, Wellington Management Company, LLP (investment adviser), 1997-2010; Chair, Wellington Management Portfolios (commingled non-U.S. investment pools), 2007-2010; Director, Wellington Trust Company, NA and other Wellington affiliates, 1997-2010 | 171 | None |
| Columbia Integrated Large Cap Growth Fund | Annual Report 2023 | 35 |
(Unaudited)
Independent trustees (continued)
| Name, address, year of birth | Position held with the Columbia Funds and length of service | Principal occupation(s) during past five years and other relevant professional experience | Number of Funds in the Columbia Funds Complex* overseen | Other directorships held by Trustee during the past five years and other relevant Board experience |
| David M. Moffett c/o Columbia Management Investment Advisers, LLC 290 Congress Street Boston, MA 02210 1952 | Trustee since 2011 | Retired; former Chief Executive Officer of Freddie Mac and Chief Financial Officer of U.S. Bank | 171 | Director, CSX Corporation (transportation suppliers); Director, PayPal Holdings Inc. (payment and data processing services); Trustee, University of Oklahoma Foundation; former Director, eBay Inc. (online trading community), 2007-2015; and former Director, CIT Bank, CIT Group Inc. (commercial and consumer finance), 2010-2016; former Senior Adviser to The Carlyle Group (financial services), March 2008-September 2008; former Governance Consultant to Bridgewater Associates, January 2013-December 2015 |
| Catherine James Paglia c/o Columbia Management Investment Advisers, LLC 290 Congress Street Boston, MA 02210 1952 | Trustee since 2004 | Director, Enterprise Asset Management, Inc. (private real estate and asset management company), since September 1998; Managing Director and Partner, Interlaken Capital, Inc., 1989-1997; Vice President, 1982-1985, Principal, 1985-1987, Managing Director, 1987-1989, Morgan Stanley; Vice President, Investment Banking, 1980-1982, Associate, Investment Banking, 1976-1980, Dean Witter Reynolds, Inc. | 173 | Director, Valmont Industries, Inc. (irrigation systems manufacturer), since 2012; Trustee, Carleton College (on the Investment Committee), since 1987; Trustee, Carnegie Endowment for International Peace (on the Investment Committee), since 2009 |
| Natalie A. Trunow c/o Columbia Management Investment Advisers, LLC 290 Congress Street Boston, MA 02210 1967 | Trustee since 2020 | Chief Executive Officer, Millennial Portfolio Solutions LLC (asset management and consulting services), January 2016-January 2021; Non-executive Member of the Investment Committee and Valuation Committee, Sarona Asset Management Inc. (private equity firm) since September 2019; Advisor, Horizon Investments (asset management and consulting services), August 2018-January 2022; Advisor, Paradigm Asset Management, November 2016-January 2022; Consultant to Independent Trustees of CFVIT and CFST I from September 2016 to June 2020 with respect to CFVIT and to December 2020 with respect to CFST I; Director of Investments/Consultant, Casey Family Programs, April 2016-November 2016; Senior Vice President and Chief Investment Officer, Calvert Investments, August 2008-January 2016; Section Head and Portfolio Manager, General Motors Asset Management, June 1997-August 2008 | 171 | Independent Director, Investment Committee, Health Services for Children with Special Needs, Inc., 2010-2021; Independent Director, (Executive Committee and Chair, Audit Committee), Consumer Credit Counseling Services (formerly Guidewell Financial Solutions), since 2016; Independent Director, (Investment Committee), Sarona Asset Management, since 2019 |
| 36 | Columbia Integrated Large Cap Growth Fund | Annual Report 2023 |
(Unaudited)
Independent trustees (continued)
| Name, address, year of birth | Position held with the Columbia Funds and length of service | Principal occupation(s) during past five years and other relevant professional experience | Number of Funds in the Columbia Funds Complex* overseen | Other directorships held by Trustee during the past five years and other relevant Board experience |
| Sandra L. Yeager c/o Columbia Management Investment Advisers, LLC 290 Congress Street Boston, MA 02210 1964 | Trustee since 2017 | Retired; President and founder, Hanoverian Capital, LLC (SEC registered investment advisor firm), 2008-2016; Managing Director, DuPont Capital, 2006-2008; Managing Director, Morgan Stanley Investment Management, 2004-2006; Senior Vice President, Alliance Bernstein, 1990-2004 | 173 | Former Director, NAPE (National Alliance for Partnerships in Equity) Education Foundation, October 2016-October 2020; Advisory Board, Jennersville YMCA, since 2022 |
| Name, address, year of birth | Position held with the Columbia Funds and length of service | Principal occupation(s) during the past five years and other relevant professional experience | Number of Funds in the Columbia Funds Complex* overseen | Other directorships held by Trustee during the past five years and other relevant Board experience |
| Daniel J. Beckman c/o Columbia Management Investment Advisers, LLC 290 Congress Street Boston, MA 02210 1962 | Trustee since November 2021 and President since June 2021 | Vice President – Head of North America Product, Columbia Management Investment Advisers, LLC, since April 2015; President and Principal Executive Officer of the Columbia Funds, since June 2021; officer of Columbia Funds and affiliated funds, 2020-2021 | 173 | Director, Ameriprise Trust Company, since October 2016; Director, Columbia Management Investment Distributors, Inc. since November 2018; Board of Governors, Columbia Wanger Asset Management, LLC since, January 2022; Director, Columbia Threadneedle Canada, Inc., since December 2022 |
| * | The term “Columbia Funds Complex” as used herein includes Columbia Seligman Premium Technology Growth Fund, Tri-Continental Corporation and each series of Columbia Funds Series Trust (CFST), Columbia Funds Series Trust I (CFST I), Columbia Funds Series Trust II (CFST II), Columbia ETF Trust I (CET I), Columbia ETF Trust II (CET II), Columbia Funds Variable Insurance Trust (CFVIT) and Columbia Funds Variable Series Trust II (CFVST II). Messrs. Batejan, Beckman, Gallagher and Hacker and Mses. Blatz, Carlton, Carrig, Flynn, Paglia, and Yeager serve as directors of Columbia Seligman Premium Technology Growth Fund and Tri-Continental Corporation. |
| ** | Interested person (as defined under the 1940 Act) by reason of being an officer, director, security holder and/or employee of the Investment Manager or Ameriprise Financial. |
| Columbia Integrated Large Cap Growth Fund | Annual Report 2023 | 37 |
(Unaudited)
The Board has appointed officers who are responsible for day-to-day business decisions based on policies it has established. The officers serve at the pleasure of the Board. The following table provides basic information about the Officers of the Fund as of the printing of this report, including principal occupations during the past five years, although their specific titles may have varied over the period. In addition to Mr. Beckman, who is President and Principal Executive Officer, the Fund’s other officers are:
| Name, address and year of birth | Position and year first appointed to position for any Fund in the Columbia Funds Complex or a predecessor thereof | Principal occupation(s) during past five years |
| Michael G. Clarke 290 Congress Street Boston, MA 02210 1969 | Chief Financial Officer and Principal Financial Officer (2009) and Senior Vice President (2019) | Senior Vice President and North America Head of Operations & Investor Services, Columbia Management Investment Advisers, LLC, since June 2023 (previously Senior Vice President and Head of Global Operations, March 2022 – June 2023, Vice President, Head of North America Operations, and Co-Head of Global Operations, June 2019 - February 2022 and Vice President – Accounting and Tax, May 2010 - May 2019); senior officer of Columbia Funds and affiliated funds, since 2002. Director, Ameriprise Trust Company, since June 2023. |
| Joseph Beranek 5890 Ameriprise Financial Center Minneapolis, MN 55474 1965 | Treasurer and Chief Accounting Officer (Principal Accounting Officer) (2019) and Principal Financial Officer (2020), CFST, CFST I, CFST II, CFVIT and CFVST II; Assistant Treasurer, CET I and CET II | Vice President – Mutual Fund Accounting and Financial Reporting, Columbia Management Investment Advisers, LLC, since December 2018 and March 2017, respectively. |
| Marybeth Pilat 290 Congress Street Boston, MA 02210 1968 | Treasurer and Chief Accounting Officer (Principal Accounting Officer) and Principal Financial Officer (2020) for CET I and CET II; Assistant Treasurer, CFST, CFST I, CFST II, CFVIT and CFVST II | Vice President – Product Pricing and Administration, Columbia Management Investment Advisers, LLC, since May 2017. |
| William F. Truscott 290 Congress Street Boston, MA 02210 1960 | Senior Vice President (2001) | Formerly, Trustee/Director of Columbia Funds Complex or legacy funds, November 2001 - January 1, 2021; Chief Executive Officer, Global Asset Management, Ameriprise Financial, Inc., since September 2012; Chairman of the Board and President, Columbia Management Investment Advisers, LLC, since July 2004 and February 2012, respectively; Chairman of the Board and Chief Executive Officer, Columbia Management Investment Distributors, Inc., since November 2008 and February 2012, respectively; Chairman of the Board and Director, Threadneedle Asset Management Holdings, Sàrl, since March 2013 and December 2008, respectively; senior executive of various entities affiliated with Columbia Threadneedle. |
| Christopher O. Petersen 5228 Ameriprise Financial Center Minneapolis, MN 55474 1970 | Senior Vice President and Assistant Secretary (2021) | Formerly, Trustee/Director of funds within the Columbia Funds Complex, July 1, 2020 - November 22, 2021; Senior Vice President and Assistant General Counsel, Ameriprise Financial, Inc., since September 2021 (previously Vice President and Lead Chief Counsel, January 2015 - September 2021); formerly, President and Principal Executive Officer of the Columbia Funds, 2015 - 2021; officer of Columbia Funds and affiliated funds, since 2007. |
| Thomas P. McGuire 290 Congress Street Boston, MA 02210 1972 | Senior Vice President and Chief Compliance Officer (2012) | Vice President – Asset Management Compliance, Ameriprise Financial, Inc., since May 2010; Chief Compliance Officer, Columbia Acorn/Wanger Funds, since December 2015; formerly, Chief Compliance Officer, Ameriprise Certificate Company, September 2010 – September 2020. |
| Ryan C. Larrenaga 290 Congress Street Boston, MA 02210 1970 | Senior Vice President (2017), Chief Legal Officer (2017), and Secretary (2015) | Vice President and Chief Counsel, Ameriprise Financial, Inc., since August 2018 (previously Vice President and Group Counsel, August 2011 - August 2018); Chief Legal Officer, Columbia Acorn/Wanger Funds, since September 2020; officer of Columbia Funds and affiliated funds, since 2005. |
| 38 | Columbia Integrated Large Cap Growth Fund | Annual Report 2023 |
(Unaudited)
Fund officers (continued)
| Name, address and year of birth | Position and year first appointed to position for any Fund in the Columbia Funds Complex or a predecessor thereof | Principal occupation(s) during past five years |
| Michael E. DeFao 290 Congress Street Boston, MA 02210 1968 | Vice President (2011) and Assistant Secretary (2010) | Vice President and Chief Counsel, Ameriprise Financial, Inc., since May 2010; Vice President, Chief Legal Officer and Assistant Secretary, Columbia Management Investment Advisers, LLC, since October 2021 (previously Vice President and Assistant Secretary, May 2010 – September 2021). |
| Lyn Kephart-Strong 5903 Ameriprise Financial Center Minneapolis, MN 55474 1960 | Vice President (2015) | Vice President, Global Investment Operations Services, Columbia Management Investment Advisers, LLC, since 2010; Director (since January 2007) and President (since October 2014), Columbia Management Investment Services Corp.; Director (since December 2017) and President (since January 2017), Ameriprise Trust Company. |
| • | the Fund had sufficient liquidity to both meet redemptions and operate effectively on behalf of shareholders; |
| • | there were no material changes to the Program during the period; |
| • | the implementation of the Program was effective to manage the Fund’s liquidity risk; and |
| • | the Program operated adequately during the period. |
| Columbia Integrated Large Cap Growth Fund | Annual Report 2023 | 39 |
| • | Information on the investment performance of the Fund relative to the performance of a group of mutual funds determined to be comparable to the Fund by Broadridge, as well as performance relative to one or more benchmarks; |
| • | Information on the Fund’s management fees and total expenses, including information comparing the Fund’s expenses to those of a group of comparable mutual funds, as determined by Broadridge; |
| • | The Investment Manager’s agreement to contractually limit or cap total operating expenses for the Fund so that total operating expenses (excluding certain fees and expenses, such as transaction costs and certain other investment related expenses, interest, taxes, acquired fund fees and expenses and infrequent and/or unusual expenses) would not exceed a specified annual rate, as a percentage of the Fund’s net assets; |
| • | Terms of the Management Agreement; |
| • | Descriptions of other agreements and arrangements with affiliates of the Investment Manager relating to the operations of the Fund, including agreements with respect to the provision of transfer agency and shareholder services to the Fund; |
| • | Descriptions of various services performed by the Investment Manager under the Management Agreement, including portfolio management and portfolio trading practices; |
| • | Information regarding any recently negotiated management fees of similarly-managed portfolios of other institutional clients of the Investment Manager; |
| • | Information regarding the resources of the Investment Manager, including information regarding senior management, portfolio managers and other personnel; |
| • | Information regarding the capabilities of the Investment Manager with respect to compliance monitoring services; |
| • | The profitability to the Investment Manager and its affiliates from their relationships with the Fund; and |
| • | Report provided by the Board’s independent fee consultant, JDL Consultants, LLC (JDL). |
| 40 | Columbia Integrated Large Cap Growth Fund | Annual Report 2023 |
(Unaudited)
Following an analysis and discussion of the foregoing, and the factors identified below, the Board, including all of the Independent Trustees, approved the renewal of the Management Agreement.
| Columbia Integrated Large Cap Growth Fund | Annual Report 2023 | 41 |
(Unaudited)
Investment Manager’s profitability. The Board reviewed the fees charged to comparable institutional or other accounts/vehicles managed by the Investment Manager, including vehicles subadvised by the Investment Manager, and discussed differences in how the products are managed and operated, thus explaining many of the differences in fees.
| 42 | Columbia Integrated Large Cap Growth Fund | Annual Report 2023 |
columbiathreadneedleus.com/investor/. The Fund is distributed by Columbia Management Investment Distributors, Inc., member FINRA, and managed by Columbia Management Investment Advisers, LLC.

August 31, 2023

| 3 | |
| 5 | |
| 7 | |
| 8 | |
| 13 | |
| 15 | |
| 16 | |
| 18 | |
| 22 | |
| 33 | |
| 34 | |
| 40 | |
| 41 |
(Unaudited)
| Average annual total returns (%) (for the period ended August 31, 2023) | |||||
| Inception | 1 Year | 5 Years | 10 Years | ||
| Class A* | Excluding sales charges | 05/31/17 | 8.89 | 2.03 | 6.02 |
| Including sales charges | 2.66 | 0.83 | 5.39 | ||
| Advisor Class | 01/31/08 | 9.16 | 2.28 | 6.29 | |
| Class C* | Excluding sales charges | 01/26/22 | 8.03 | 1.26 | 5.23 |
| Including sales charges | 7.03 | 1.26 | 5.23 | ||
| Institutional Class* | 01/26/22 | 9.21 | 2.29 | 6.29 | |
| Institutional 2 Class* | 01/26/22 | 9.28 | 2.32 | 6.30 | |
| Institutional 3 Class* | 01/26/22 | 9.36 | 2.34 | 6.31 | |
| Class R* | 01/26/22 | 8.53 | 1.75 | 5.75 | |
| Russell 2000® Growth Index | 6.78 | 2.46 | 8.17 | ||
| * | The returns shown for periods prior to the share class inception date (including returns for the Life of the Fund, if shown, which are since Fund inception) include the returns of the Fund’s oldest share class. These returns are adjusted to reflect any higher class-related operating expenses of the newer share classes, as applicable. Please visit columbiathreadneedleus.com/investor/investment-products/mutual-funds/appended-performance for more information. |
| Columbia Integrated Small Cap Growth Fund | Annual Report 2023 | 3 |
(Unaudited)
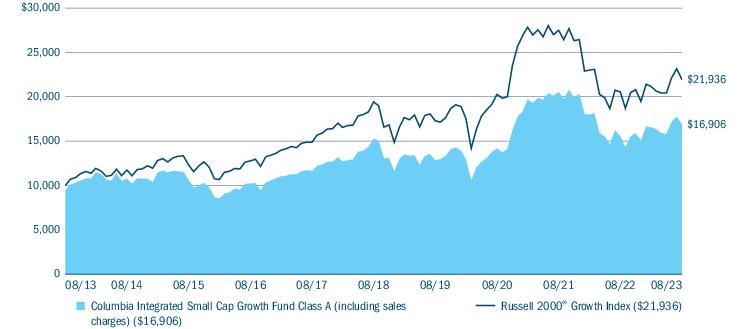
| Portfolio breakdown (%) (at August 31, 2023) | |
| Common Stocks | 99.1 |
| Money Market Funds | 0.9 |
| Total | 100.0 |
| Equity sector breakdown (%) (at August 31, 2023) | |
| Communication Services | 1.0 |
| Consumer Discretionary | 11.3 |
| Consumer Staples | 3.7 |
| Energy | 5.6 |
| Financials | 5.6 |
| Health Care | 22.7 |
| Industrials | 21.3 |
| Information Technology | 23.0 |
| Materials | 5.3 |
| Utilities | 0.5 |
| Total | 100.0 |
| 4 | Columbia Integrated Small Cap Growth Fund | Annual Report 2023 |
(Unaudited)
| • | Overall sector allocation was additive to relative performance. |
| • | Overall stock selection was also additive to relative performance. |
| • | The Fund’s overweight to the information technology sector was the top contributor from a sector allocation perspective, followed by an underweight to the utilities sector and an underweight to the communication services sector. |
| • | Stock selection in the financials sector was the largest positive contribution for the period, followed by the energy and consumer discretionary sectors. |
| • | The three largest individual contributors to the Fund were Oceaneering International, Inc., Duolingo, Inc. and Prothena Corp., PLC. |
| • | The Fund’s slight overweight to the energy sector was the top detractor from a sector allocation perspective, followed by an overweight to the materials sector. |
| • | Stock selection in the health care sector was the largest detractor for the period, followed by the communication services and utilities sectors. |
| • | The three largest individual detractors to the Fund were Funko, Inc., Coherus Biosciences, Inc. and Angiodynamics, Inc. We sold the Fund’s positions in Funko and Angiodynamics. |
| Columbia Integrated Small Cap Growth Fund | Annual Report 2023 | 5 |
(Unaudited)
| 6 | Columbia Integrated Small Cap Growth Fund | Annual Report 2023 |
(Unaudited)
| March 1, 2023 — August 31, 2023 | |||||||
| Account value at the beginning of the period ($) | Account value at the end of the period ($) | Expenses paid during the period ($) | Fund’s annualized expense ratio (%) | ||||
| Actual | Hypothetical | Actual | Hypothetical | Actual | Hypothetical | Actual | |
| Class A | 1,000.00 | 1,000.00 | 1,020.30 | 1,019.11 | 6.16 | 6.16 | 1.21 |
| Advisor Class | 1,000.00 | 1,000.00 | 1,021.50 | 1,020.21 | 5.04 | 5.04 | 0.99 |
| Class C | 1,000.00 | 1,000.00 | 1,016.00 | 1,015.17 | 10.11 | 10.11 | 1.99 |
| Institutional Class | 1,000.00 | 1,000.00 | 1,022.00 | 1,020.21 | 5.05 | 5.04 | 0.99 |
| Institutional 2 Class | 1,000.00 | 1,000.00 | 1,022.70 | 1,020.67 | 4.59 | 4.58 | 0.90 |
| Institutional 3 Class | 1,000.00 | 1,000.00 | 1,022.70 | 1,020.92 | 4.33 | 4.33 | 0.85 |
| Class R | 1,000.00 | 1,000.00 | 1,018.40 | 1,017.54 | 7.73 | 7.73 | 1.52 |
| Columbia Integrated Small Cap Growth Fund | Annual Report 2023 | 7 |
August 31, 2023
| Common Stocks 99.2% | ||
| Issuer | Shares | Value ($) |
| Communication Services 1.0% | ||
| Media 1.0% | ||
| Integral Ad Science Holding Corp.(a) | 25,891 | 369,465 |
| TechTarget, Inc.(a) | 6,986 | 200,847 |
| Total | 570,312 | |
| Total Communication Services | 570,312 | |
| Consumer Discretionary 11.2% | ||
| Auto Components 1.5% | ||
| Gentherm, Inc.(a) | 7,075 | 425,986 |
| Standard Motor Products, Inc. | 11,301 | 418,476 |
| Total | 844,462 | |
| Diversified Consumer Services 2.1% | ||
| Duolingo, Inc.(a) | 4,886 | 719,024 |
| Rover Group, Inc.(a) | 65,353 | 442,440 |
| Total | 1,161,464 | |
| Hotels, Restaurants & Leisure 2.9% | ||
| Century Casinos, Inc.(a) | 50,010 | 325,065 |
| Everi Holdings, Inc.(a) | 29,878 | 432,036 |
| Inspired Entertainment, Inc.(a) | 18,628 | 245,517 |
| Shake Shack, Inc., Class A(a) | 8,921 | 624,470 |
| Total | 1,627,088 | |
| Household Durables 1.7% | ||
| M/I Homes, Inc.(a) | 4,677 | 459,188 |
| Skyline Champion Corp.(a) | 7,074 | 504,164 |
| Total | 963,352 | |
| Leisure Products 0.9% | ||
| YETI Holdings, Inc.(a) | 9,553 | 477,172 |
| Specialty Retail 0.7% | ||
| Chico’s FAS, Inc.(a) | 74,869 | 384,078 |
| Textiles, Apparel & Luxury Goods 1.4% | ||
| Crocs, Inc.(a) | 3,780 | 367,945 |
| Movado Group, Inc. | 13,955 | 381,669 |
| Total | 749,614 | |
| Total Consumer Discretionary | 6,207,230 | |
| Common Stocks (continued) | ||
| Issuer | Shares | Value ($) |
| Consumer Staples 3.7% | ||
| Beverages 1.1% | ||
| Primo Water Corp. | 40,825 | 622,990 |
| Consumer Staples Distribution & Retail 0.9% | ||
| Sprouts Farmers Market, Inc.(a) | 12,248 | 499,596 |
| Household Products 1.0% | ||
| Central Garden & Pet Co., Class A(a) | 13,360 | 545,088 |
| Personal Care Products 0.7% | ||
| Inter Parfums, Inc. | 2,848 | 397,951 |
| Total Consumer Staples | 2,065,625 | |
| Energy 5.5% | ||
| Energy Equipment & Services 3.2% | ||
| ChampionX Corp. | 18,347 | 662,143 |
| DMC Global Inc(a) | 19,892 | 477,806 |
| Oceaneering International, Inc.(a) | 28,393 | 647,077 |
| Total | 1,787,026 | |
| Oil, Gas & Consumable Fuels 2.3% | ||
| Magnolia Oil & Gas Corp., Class A | 20,100 | 458,280 |
| Riley Exploration Permian, Inc. | 12,036 | 403,085 |
| W&T Offshore, Inc.(a) | 99,972 | 407,886 |
| Total | 1,269,251 | |
| Total Energy | 3,056,277 | |
| Financials 5.6% | ||
| Capital Markets 1.7% | ||
| Hamilton Lane, Inc., Class A | 6,030 | 559,524 |
| WisdomTree, Inc. | 48,663 | 355,240 |
| Total | 914,764 | |
| Financial Services 1.8% | ||
| Essent Group Ltd. | 13,606 | 683,293 |
| International Money Express, Inc.(a) | 18,160 | 314,168 |
| Total | 997,461 | |
| 8 | Columbia Integrated Small Cap Growth Fund | Annual Report 2023 |
August 31, 2023
| Common Stocks (continued) | ||
| Issuer | Shares | Value ($) |
| Insurance 2.1% | ||
| Goosehead Insurance, Inc., Class A(a) | 11,261 | 786,693 |
| Palomar Holdings, Inc.(a) | 7,706 | 393,083 |
| Total | 1,179,776 | |
| Total Financials | 3,092,001 | |
| Health Care 22.5% | ||
| Biotechnology 10.4% | ||
| ACADIA Pharmaceuticals, Inc.(a) | 16,926 | 457,341 |
| Aldeyra Therapeutics, Inc.(a) | 42,789 | 319,206 |
| Amicus Therapeutics, Inc.(a) | 39,688 | 508,800 |
| Anika Therapeutics, Inc.(a) | 13,027 | 232,532 |
| Avid Bioservices, Inc.(a) | 33,748 | 398,226 |
| Deciphera Pharmaceuticals, Inc.(a) | 24,061 | 337,816 |
| Halozyme Therapeutics, Inc.(a) | 15,987 | 680,407 |
| Kiniksa Pharmaceuticals(a) | 29,746 | 512,524 |
| Madrigal Pharmaceuticals, Inc.(a) | 1,606 | 289,080 |
| Mirum Pharmaceuticals, Inc.(a) | 15,551 | 411,013 |
| Prothena Corp., PLC(a) | 6,317 | 333,664 |
| PTC Therapeutics, Inc.(a) | 10,907 | 430,826 |
| Vericel Corp.(a) | 14,810 | 486,212 |
| Xencor, Inc.(a) | 17,406 | 382,584 |
| Total | 5,780,231 | |
| Health Care Equipment & Supplies 6.0% | ||
| Avanos Medical, Inc.(a) | 14,627 | 307,752 |
| AxoGen, Inc.(a) | 44,790 | 280,385 |
| Inspire Medical Systems, Inc.(a) | 1,867 | 423,585 |
| LivaNova PLC(a) | 8,396 | 466,398 |
| Merit Medical Systems, Inc.(a) | 10,087 | 658,479 |
| Omnicell, Inc.(a) | 5,903 | 335,645 |
| Tactile Systems Technology, Inc.(a) | 27,359 | 518,453 |
| Treace Medical Concepts, Inc.(a) | 20,812 | 323,627 |
| Total | 3,314,324 | |
| Health Care Providers & Services 3.1% | ||
| Option Care Health, Inc.(a) | 18,173 | 632,965 |
| PetIQ, Inc.(a) | 30,187 | 575,968 |
| RadNet, Inc.(a) | 14,621 | 488,488 |
| Total | 1,697,421 | |
| Common Stocks (continued) | ||
| Issuer | Shares | Value ($) |
| Health Care Technology 2.0% | ||
| Evolent Health, Inc., Class A(a) | 17,033 | 434,512 |
| Health Catalyst, Inc.(a) | 27,269 | 318,774 |
| HealthStream, Inc. | 16,356 | 343,967 |
| Total | 1,097,253 | |
| Life Sciences Tools & Services 0.4% | ||
| MaxCyte, Inc.(a) | 65,477 | 239,646 |
| Pharmaceuticals 0.6% | ||
| Intra-Cellular Therapies, Inc.(a) | 6,036 | 335,119 |
| Total Health Care | 12,463,994 | |
| Industrials 21.1% | ||
| Aerospace & Defense 2.7% | ||
| Aerovironment, Inc.(a) | 4,780 | 463,803 |
| Astronics Corp.(a) | 24,375 | 427,294 |
| Kratos Defense & Security Solutions, Inc.(a) | 36,818 | 592,402 |
| Total | 1,483,499 | |
| Air Freight & Logistics 0.8% | ||
| HUB Group, Inc., Class A(a) | 5,358 | 418,138 |
| Building Products 1.3% | ||
| Gibraltar Industries, Inc.(a) | 9,720 | 729,292 |
| Construction & Engineering 2.3% | ||
| MYR Group, Inc.(a) | 4,457 | 633,206 |
| Primoris Services Corp. | 18,797 | 664,850 |
| Total | 1,298,056 | |
| Electrical Equipment 0.8% | ||
| Thermon(a) | 16,517 | 453,887 |
| Ground Transportation 1.2% | ||
| Marten Transport Ltd. | 30,911 | 649,131 |
| Machinery 5.8% | ||
| Alamo Group, Inc. | 2,877 | 493,837 |
| Helios Technologies, Inc. | 5,495 | 318,051 |
| John Bean Technologies Corp. | 4,025 | 442,388 |
| Lindsay Corp. | 3,073 | 381,359 |
| Mueller Water Products, Inc., Class A | 39,002 | 550,708 |
| REV Group, Inc. | 33,202 | 450,883 |
| Tennant Co. | 7,113 | 586,325 |
| Total | 3,223,551 | |
| Columbia Integrated Small Cap Growth Fund | Annual Report 2023 | 9 |
August 31, 2023
| Common Stocks (continued) | ||
| Issuer | Shares | Value ($) |
| Professional Services 4.4% | ||
| ExlService Holdings, Inc.(a) | 17,072 | 499,015 |
| ICF International, Inc. | 5,010 | 676,651 |
| Legalzoom.com, Inc.(a) | 37,952 | 433,032 |
| NV5 Global, Inc.(a) | 3,790 | 385,746 |
| Upwork, Inc.(a) | 31,998 | 473,890 |
| Total | 2,468,334 | |
| Trading Companies & Distributors 1.8% | ||
| Applied Industrial Technologies, Inc. | 3,017 | 465,734 |
| NOW, Inc.(a) | 46,548 | 519,941 |
| Total | 985,675 | |
| Total Industrials | 11,709,563 | |
| Information Technology 22.9% | ||
| Communications Equipment 1.7% | ||
| Calix, Inc.(a) | 10,997 | 511,470 |
| Viavi Solutions, Inc.(a) | 40,246 | 420,571 |
| Total | 932,041 | |
| Electronic Equipment, Instruments & Components 3.9% | ||
| Advanced Energy Industries, Inc. | 6,199 | 731,916 |
| Itron, Inc.(a) | 7,821 | 535,035 |
| Rogers Corp.(a) | 2,990 | 432,085 |
| Sanmina Corp.(a) | 7,966 | 443,706 |
| Total | 2,142,742 | |
| IT Services 1.7% | ||
| Grid Dynamics Holdings, Inc.(a) | 32,818 | 381,673 |
| Squarespace, Inc., Class A(a) | 17,840 | 537,876 |
| Total | 919,549 | |
| Semiconductors & Semiconductor Equipment 5.4% | ||
| Amkor Technology, Inc. | 16,405 | 458,684 |
| Formfactor, Inc.(a) | 15,307 | 540,643 |
| MaxLinear, Inc.(a) | 15,073 | 354,215 |
| NVE Corp. | 4,692 | 415,007 |
| Onto Innovation, Inc.(a) | 5,523 | 767,587 |
| Rambus, Inc.(a) | 8,057 | 454,979 |
| Total | 2,991,115 | |
| Common Stocks (continued) | ||
| Issuer | Shares | Value ($) |
| Software 10.2% | ||
| A10 Networks, Inc. | 30,115 | 448,412 |
| Alkami Technology, Inc.(a) | 26,873 | 468,128 |
| Box, Inc., Class A(a) | 13,881 | 367,569 |
| CommVault Systems, Inc.(a) | 7,998 | 546,344 |
| EngageSmart, Inc.(a) | 24,114 | 427,059 |
| Everbridge, Inc.(a) | 13,297 | 329,899 |
| LiveRamp Holdings, Inc.(a) | 20,396 | 659,607 |
| Mitek Systems, Inc.(a) | 32,107 | 358,635 |
| N-Able, Inc.(a) | 31,149 | 416,462 |
| SPS Commerce, Inc.(a) | 2,517 | 468,489 |
| Tenable Holdings, Inc.(a) | 11,192 | 507,781 |
| Workiva, Inc., Class A(a) | 6,151 | 687,989 |
| Total | 5,686,374 | |
| Total Information Technology | 12,671,821 | |
| Materials 5.2% | ||
| Chemicals 0.6% | ||
| Ingevity Corp.(a) | 6,707 | 361,440 |
| Construction Materials 1.2% | ||
| Summit Materials, Inc., Class A(a) | 17,455 | 652,992 |
| Metals & Mining 3.4% | ||
| Commercial Metals Co. | 11,186 | 629,660 |
| Materion Corp. | 6,243 | 679,176 |
| MP Materials Corp.(a) | 13,683 | 286,522 |
| Piedmont Lithium, Inc.(a) | 6,606 | 295,684 |
| Total | 1,891,042 | |
| Total Materials | 2,905,474 | |
| Utilities 0.5% | ||
| Independent Power and Renewable Electricity Producers 0.5% | ||
| Altus Power, Inc.(a) | 42,278 | 273,116 |
| Total Utilities | 273,116 | |
| Total Common Stocks (Cost $47,449,638) | 55,015,413 | |
| 10 | Columbia Integrated Small Cap Growth Fund | Annual Report 2023 |
August 31, 2023
| Money Market Funds 0.9% | ||
| Shares | Value ($) | |
| Columbia Short-Term Cash Fund, 5.476%(b),(c) | 489,199 | 489,052 |
| Total Money Market Funds (Cost $488,962) | 489,052 | |
| Total Investments in Securities (Cost: $47,938,600) | 55,504,465 | |
| Other Assets & Liabilities, Net | (31,794) | |
| Net Assets | 55,472,671 | |
| (a) | Non-income producing investment. |
| (b) | The rate shown is the seven-day current annualized yield at August 31, 2023. |
| (c) | As defined in the Investment Company Act of 1940, as amended, an affiliated company is one in which the Fund owns 5% or more of the company’s outstanding voting securities, or a company which is under common ownership or control with the Fund. The value of the holdings and transactions in these affiliated companies during the year ended August 31, 2023 are as follows: |
| Affiliated issuers | Beginning of period($) | Purchases($) | Sales($) | Net change in unrealized appreciation (depreciation)($) | End of period($) | Realized gain (loss)($) | Dividends($) | End of period shares |
| Columbia Short-Term Cash Fund, 5.476% | ||||||||
| 772,168 | 9,247,655 | (9,530,771) | — | 489,052 | 211 | 28,860 | 489,199 | |
| ■ | Level 1 — Valuations based on quoted prices for investments in active markets that the Fund has the ability to access at the measurement date. Valuation adjustments are not applied to Level 1 investments. |
| ■ | Level 2 — Valuations based on other significant observable inputs (including quoted prices for similar securities, interest rates, prepayment speeds, credit risks, etc.). |
| ■ | Level 3 — Valuations based on significant unobservable inputs (including the Fund’s own assumptions and judgment in determining the fair value of investments). |
| Columbia Integrated Small Cap Growth Fund | Annual Report 2023 | 11 |
August 31, 2023
in default; and the effectiveness of third party pricing vendors, including periodic reviews of vendors. The Committee meets more frequently, as needed, to discuss additional valuation matters, which may include the need to review back-testing results, review time-sensitive information or approve related valuation actions. Representatives of Columbia Management Investment Advisers, LLC report to the Board at each of its regularly scheduled meetings to discuss valuation matters and actions during the period, similar to those described earlier.
| Level 1 ($) | Level 2 ($) | Level 3 ($) | Total ($) | |
| Investments in Securities | ||||
| Common Stocks | ||||
| Communication Services | 570,312 | — | — | 570,312 |
| Consumer Discretionary | 6,207,230 | — | — | 6,207,230 |
| Consumer Staples | 2,065,625 | — | — | 2,065,625 |
| Energy | 3,056,277 | — | — | 3,056,277 |
| Financials | 3,092,001 | — | — | 3,092,001 |
| Health Care | 12,463,994 | — | — | 12,463,994 |
| Industrials | 11,709,563 | — | — | 11,709,563 |
| Information Technology | 12,671,821 | — | — | 12,671,821 |
| Materials | 2,905,474 | — | — | 2,905,474 |
| Utilities | 273,116 | — | — | 273,116 |
| Total Common Stocks | 55,015,413 | — | — | 55,015,413 |
| Money Market Funds | 489,052 | — | — | 489,052 |
| Total Investments in Securities | 55,504,465 | — | — | 55,504,465 |
| 12 | Columbia Integrated Small Cap Growth Fund | Annual Report 2023 |
August 31, 2023
| Assets | |
| Investments in securities, at value | |
| Unaffiliated issuers (cost $47,449,638) | $55,015,413 |
| Affiliated issuers (cost $488,962) | 489,052 |
| Receivable for: | |
| Capital shares sold | 26,383 |
| Dividends | 20,125 |
| Foreign tax reclaims | 327 |
| Expense reimbursement due from Investment Manager | 548 |
| Prepaid expenses | 3,071 |
| Total assets | 55,554,919 |
| Liabilities | |
| Payable for: | |
| Capital shares redeemed | 41,955 |
| Management services fees | 1,296 |
| Distribution and/or service fees | 133 |
| Transfer agent fees | 9,728 |
| Trustees’ fees | 8,585 |
| Accounting services fees | 15,045 |
| Other expenses | 5,506 |
| Total liabilities | 82,248 |
| Net assets applicable to outstanding capital stock | $55,472,671 |
| Represented by | |
| Paid in capital | 53,572,960 |
| Total distributable earnings (loss) | 1,899,711 |
| Total - representing net assets applicable to outstanding capital stock | $55,472,671 |
| Columbia Integrated Small Cap Growth Fund | Annual Report 2023 | 13 |
August 31, 2023
| Class A | |
| Net assets | $21,069,885 |
| Shares outstanding | 1,742,384 |
| Net asset value per share | $12.09 |
| Maximum sales charge | 5.75% |
| Maximum offering price per share (calculated by dividing the net asset value per share by 1.0 minus the maximum sales charge for Class A shares) | $12.83 |
| Advisor Class | |
| Net assets | $3,718,887 |
| Shares outstanding | 279,577 |
| Net asset value per share | $13.30 |
| Class C | |
| Net assets | $8,191 |
| Shares outstanding | 678 |
| Net asset value per share | $12.08 |
| Institutional Class | |
| Net assets | $30,638,879 |
| Shares outstanding | 2,274,787 |
| Net asset value per share | $13.47 |
| Institutional 2 Class | |
| Net assets | $19,457 |
| Shares outstanding | 1,443 |
| Net asset value per share(a) | $13.49 |
| Institutional 3 Class | |
| Net assets | $15,075 |
| Shares outstanding | 1,117 |
| Net asset value per share | $13.50 |
| Class R | |
| Net assets | $2,297 |
| Shares outstanding | 189 |
| Net asset value per share(a) | $12.17 |
| (a) | Net asset value per share rounds to this amount due to fractional shares outstanding. |
| 14 | Columbia Integrated Small Cap Growth Fund | Annual Report 2023 |
Year Ended August 31, 2023
| Net investment income | |
| Income: | |
| Dividends — unaffiliated issuers | $348,023 |
| Dividends — affiliated issuers | 28,860 |
| Foreign taxes withheld | (3,946) |
| Total income | 372,937 |
| Expenses: | |
| Management services fees | 477,222 |
| Distribution and/or service fees | |
| Class A | 42,285 |
| Class C | 279 |
| Class R | 11 |
| Transfer agent fees | |
| Class A | 33,145 |
| Advisor Class | 5,784 |
| Class C | 43 |
| Institutional Class | 49,075 |
| Institutional 2 Class | 12 |
| Institutional 3 Class | 3 |
| Class R | 5 |
| Trustees’ fees | 16,350 |
| Custodian fees | 6,760 |
| Printing and postage fees | 17,094 |
| Registration fees | 102,745 |
| Accounting services fees | 30,090 |
| Legal fees | 12,576 |
| Offering costs | 54,767 |
| Compensation of chief compliance officer | 4 |
| Other | 11,219 |
| Total expenses | 859,469 |
| Fees waived or expenses reimbursed by Investment Manager and its affiliates | (262,836) |
| Expense reduction | (779) |
| Total net expenses | 595,854 |
| Net investment loss | (222,917) |
| Realized and unrealized gain (loss) — net | |
| Net realized gain (loss) on: | |
| Investments — unaffiliated issuers | (743,162) |
| Investments — affiliated issuers | 211 |
| Net realized loss | (742,951) |
| Net change in unrealized appreciation (depreciation) on: | |
| Investments — unaffiliated issuers | 5,700,532 |
| Net change in unrealized appreciation (depreciation) | 5,700,532 |
| Net realized and unrealized gain | 4,957,581 |
| Net increase in net assets resulting from operations | $4,734,664 |
| Columbia Integrated Small Cap Growth Fund | Annual Report 2023 | 15 |
| Year Ended August 31, 2023 | Year Ended August 31, 2022 (a) | |
| Operations | ||
| Net investment loss | $(222,917) | $(511,769) |
| Net realized gain (loss) | (742,951) | 13,384,378 |
| Net change in unrealized appreciation (depreciation) | 5,700,532 | (34,316,453) |
| Net increase (decrease) in net assets resulting from operations | 4,734,664 | (21,443,844) |
| Distributions to shareholders | ||
| Net investment income and net realized gains | ||
| Class A | (1,095,113) | (10,822,640) |
| Advisor Class | (171,886) | (22,458,727) |
| Class C | (2,213) | — |
| Institutional Class | (1,413,522) | — |
| Institutional 2 Class | (834) | — |
| Institutional 3 Class | (646) | — |
| Class R | (114) | — |
| Total distributions to shareholders | (2,684,328) | (33,281,367) |
| Decrease in net assets from capital stock activity | (6,918,081) | (7,416,221) |
| Redemption fees | — | 20 |
| Total decrease in net assets | (4,867,745) | (62,141,412) |
| Net assets at beginning of year | 60,340,416 | 122,481,828 |
| Net assets at end of year | $55,472,671 | $60,340,416 |
| (a) | Class C, Institutional Class, Institutional 2 Class, Institutional 3 Class, and Class R shares are based on operations from January 26, 2022 (commencement of operations) through the stated period end. |
| 16 | Columbia Integrated Small Cap Growth Fund | Annual Report 2023 |
| Year Ended | Year Ended | |||
| August 31, 2023 | August 31, 2022 (a) | |||
| Shares | Dollars ($) | Shares | Dollars ($) | |
| Capital stock activity | ||||
| Class A | ||||
| Shares sold | 28,739 | 337,940 | 127,686 | 1,730,459 |
| Distributions reinvested | 98,419 | 1,085,560 | 659,788 | 10,585,029 |
| Shares redeemed | (255,135) | (2,942,610) | (376,964) | (6,073,298) |
| Net increase (decrease) | (127,977) | (1,519,110) | 410,510 | 6,242,190 |
| Advisor Class | ||||
| Shares sold | 6,943 | 91,052 | 240,885 | 4,343,667 |
| Distributions reinvested | 14,045 | 170,229 | 1,135,271 | 20,155,352 |
| Shares redeemed | (39,522) | (500,872) | (4,681,388) | (78,221,553) |
| Net decrease | (18,534) | (239,591) | (3,305,232) | (53,722,534) |
| Class C | ||||
| Shares sold | 1,412 | 16,058 | 2,757 | 38,017 |
| Distributions reinvested | 189 | 2,099 | — | — |
| Shares redeemed | (3,680) | (45,358) | — | — |
| Net increase (decrease) | (2,079) | (27,201) | 2,757 | 38,017 |
| Institutional Class | ||||
| Shares sold | 279,155 | 3,584,998 | 2,920,768 | 43,250,236 |
| Distributions reinvested | 115,077 | 1,411,998 | — | — |
| Shares redeemed | (789,827) | (10,130,447) | (250,386) | (3,258,105) |
| Net increase (decrease) | (395,595) | (5,133,451) | 2,670,382 | 39,992,131 |
| Institutional 2 Class | ||||
| Shares sold | — | — | 1,725 | 22,035 |
| Distributions reinvested | 60 | 730 | — | — |
| Shares redeemed | — | — | (342) | (4,236) |
| Net increase | 60 | 730 | 1,383 | 17,799 |
| Institutional 3 Class | ||||
| Shares sold | — | — | 1,073 | 13,676 |
| Distributions reinvested | 44 | 542 | — | — |
| Net increase | 44 | 542 | 1,073 | 13,676 |
| Class R | ||||
| Shares sold | — | — | 189 | 2,500 |
| Net increase | — | — | 189 | 2,500 |
| Total net decrease | (544,081) | (6,918,081) | (218,938) | (7,416,221) |
| (a) | Class C, Institutional Class, Institutional 2 Class, Institutional 3 Class, and Class R shares are based on operations from January 26, 2022 (commencement of operations) through the stated period end. |
| Columbia Integrated Small Cap Growth Fund | Annual Report 2023 | 17 |
| Net asset value, beginning of period | Net investment income (loss) | Net realized and unrealized gain (loss) | Total from investment operations | Distributions from net realized gains | Total distributions to shareholders | |
| Class A | ||||||
| Year Ended 8/31/2023 | $11.71 | (0.06) | 1.04 | 0.98 | (0.60) | (0.60) |
| Year Ended 8/31/2022(e) | $23.20 | (0.12) | (4.08) | (4.20) | (7.29) | (7.29) |
| Year Ended 8/31/2021(g) | $16.64 | (0.19) | 7.48 | 7.29 | (0.73) | (0.73) |
| Year Ended 8/31/2020 | $15.32 | (0.07) | 1.69 | 1.62 | (0.30) | (0.30) |
| Year Ended 8/31/2019 | $21.60 | (0.02) | (3.51) | (3.53) | (2.75) | (2.75) |
| Advisor Class | ||||||
| Year Ended 8/31/2023 | $12.79 | (0.04) | 1.15 | 1.11 | (0.60) | (0.60) |
| Year Ended 8/31/2022(e) | $24.59 | (0.10) | (4.41) | (4.51) | (7.29) | (7.29) |
| Year Ended 8/31/2021(g) | $17.55 | (0.14) | 7.91 | 7.77 | (0.73) | (0.73) |
| Year Ended 8/31/2020 | $16.10 | (0.03) | 1.78 | 1.75 | (0.30) | (0.30) |
| Year Ended 8/31/2019 | $22.48 | 0.01 | (3.64) | (3.63) | (2.75) | (2.75) |
| Class C | ||||||
| Year Ended 8/31/2023 | $11.79 | (0.15) | 1.04 | 0.89 | (0.60) | (0.60) |
| Year Ended 8/31/2022(h) | $13.25 | (0.11) | (1.35) | (1.46) | — | — |
| Institutional Class | ||||||
| Year Ended 8/31/2023 | $12.94 | (0.04) | 1.17 | 1.13 | (0.60) | (0.60) |
| Year Ended 8/31/2022(h) | $14.46 | (0.04) | (1.48) | (1.52) | — | — |
| Institutional 2 Class | ||||||
| Year Ended 8/31/2023 | $12.95 | (0.03) | 1.17 | 1.14 | (0.60) | (0.60) |
| Year Ended 8/31/2022(h) | $14.46 | (0.03) | (1.48) | (1.51) | — | — |
| Institutional 3 Class | ||||||
| Year Ended 8/31/2023 | $12.95 | (0.02) | 1.17 | 1.15 | (0.60) | (0.60) |
| Year Ended 8/31/2022(h) | $14.46 | (0.03) | (1.48) | (1.51) | — | — |
| 18 | Columbia Integrated Small Cap Growth Fund | Annual Report 2023 |
| Net asset value, end of period | Total return | Total gross expense ratio to average net assets(a) | Total net expense ratio to average net assets(a),(b),(c) | Net investment income (loss) ratio to average net assets | Portfolio turnover | Net assets, end of period (000’s) | |
| Class A | |||||||
| Year Ended 8/31/2023 | $12.09 | 8.89% | 1.65% | 1.19%(d) | (0.52%) | 58% | $21,070 |
| Year Ended 8/31/2022(e) | $11.71 | (24.43%) | 1.60%(f) | 1.22%(f) | (0.78%) | 54% | $21,895 |
| Year Ended 8/31/2021(g) | $23.20 | 44.85% | 1.35% | 1.24% | (0.86%) | 62% | $33,873 |
| Year Ended 8/31/2020 | $16.64 | 10.60% | 1.34% | 1.24% | (0.46%) | 70% | $27,152 |
| Year Ended 8/31/2019 | $15.32 | (16.12%) | 1.30% | 1.24% | (0.54%) | 61% | $31,378 |
| Advisor Class | |||||||
| Year Ended 8/31/2023 | $13.30 | 9.16% | 1.45% | 0.99%(d) | (0.32%) | 58% | $3,719 |
| Year Ended 8/31/2022(e) | $12.79 | (24.27%) | 1.39%(f) | 0.98%(f) | (0.51%) | 54% | $3,813 |
| Year Ended 8/31/2021(g) | $24.59 | 45.27% | 1.10% | 0.99% | (0.61%) | 62% | $88,609 |
| Year Ended 8/31/2020 | $17.55 | 10.89% | 1.09% | 0.99% | (0.22%) | 70% | $69,926 |
| Year Ended 8/31/2019 | $16.10 | (15.92%) | 1.05% | 0.99% | (0.29%) | 61% | $68,226 |
| Class C | |||||||
| Year Ended 8/31/2023 | $12.08 | 8.03% | 2.49% | 1.98%(d) | (1.33%) | 58% | $8 |
| Year Ended 8/31/2022(h) | $11.79 | (11.02%) | 2.45% | 1.98% | (1.55%) | 54% | $33 |
| Institutional Class | |||||||
| Year Ended 8/31/2023 | $13.47 | 9.21% | 1.46% | 0.99%(d) | (0.32%) | 58% | $30,639 |
| Year Ended 8/31/2022(h) | $12.94 | (10.51%) | 1.45% | 0.98% | (0.58%) | 54% | $34,566 |
| Institutional 2 Class | |||||||
| Year Ended 8/31/2023 | $13.49 | 9.28% | 1.37% | 0.90% | (0.23%) | 58% | $19 |
| Year Ended 8/31/2022(h) | $12.95 | (10.44%) | 1.37% | 0.90% | (0.44%) | 54% | $18 |
| Institutional 3 Class | |||||||
| Year Ended 8/31/2023 | $13.50 | 9.36% | 1.31% | 0.85% | (0.18%) | 58% | $15 |
| Year Ended 8/31/2022(h) | $12.95 | (10.44%) | 1.32% | 0.85% | (0.40%) | 54% | $14 |
| Columbia Integrated Small Cap Growth Fund | Annual Report 2023 | 19 |
| Net asset value, beginning of period | Net investment income (loss) | Net realized and unrealized gain (loss) | Total from investment operations | Distributions from net realized gains | Total distributions to shareholders | |
| Class R | ||||||
| Year Ended 8/31/2023 | $11.82 | (0.10) | 1.05 | 0.95 | (0.60) | (0.60) |
| Year Ended 8/31/2022(h) | $13.25 | (0.08) | (1.35) | (1.43) | — | — |
| Notes to Financial Highlights | |
| (a) | In addition to the fees and expenses that the Fund bears directly, the Fund indirectly bears a pro rata share of the fees and expenses of any other funds in which it invests. Such indirect expenses are not included in the Fund’s reported expense ratios. |
| (b) | Total net expenses include the impact of certain fee waivers/expense reimbursements made by the Investment Manager and certain of its affiliates, if applicable. |
| (c) | Total net expenses include the impact of certain fee waivers/expense reimbursements made by BMO Asset Management Corp, and certain of its affiliates, if applicable, for the account periods prior to the closing of the Reorganization, which occurred on January 21, 2022. |
| (d) | The benefits derived from expense reductions had an impact of less than 0.01%. |
| (e) | Redemption fees consisted of per share amounts less than $0.01. |
| (f) | Ratios include interfund lending expense which is less than 0.01%. |
| (g) | Net investment income (loss) per share calculated using the average shares method. |
| (h) | Class C, Institutional Class, Institutional 2 Class, Institutional 3 Class and Class R shares commenced operations on January 26, 2022. Per share data and total return reflect activity from that date. |
| 20 | Columbia Integrated Small Cap Growth Fund | Annual Report 2023 |
| Net asset value, end of period | Total return | Total gross expense ratio to average net assets(a) | Total net expense ratio to average net assets(a),(b),(c) | Net investment income (loss) ratio to average net assets | Portfolio turnover | Net assets, end of period (000’s) | |
| Class R | |||||||
| Year Ended 8/31/2023 | $12.17 | 8.53% | 1.95% | 1.52%(d) | (0.89%) | 58% | $2 |
| Year Ended 8/31/2022(h) | $11.82 | (10.79%) | 1.95% | 1.48% | (1.08%) | 54% | $2 |
| Columbia Integrated Small Cap Growth Fund | Annual Report 2023 | 21 |
August 31, 2023
| 22 | Columbia Integrated Small Cap Growth Fund | Annual Report 2023 |
August 31, 2023
| Columbia Integrated Small Cap Growth Fund | Annual Report 2023 | 23 |
August 31, 2023
| 24 | Columbia Integrated Small Cap Growth Fund | Annual Report 2023 |
August 31, 2023
| Columbia Integrated Small Cap Growth Fund | Annual Report 2023 | 25 |
August 31, 2023
| Effective rate (%) | |
| Class A | 0.16 |
| Advisor Class | 0.16 |
| Class C | 0.16 |
| Institutional Class | 0.16 |
| Institutional 2 Class | 0.07 |
| Institutional 3 Class | 0.02 |
| Class R | 0.19 |
| Front End (%) | CDSC (%) | Amount ($) | |
| Class A | 5.75 | 0.50 - 1.00(a) | 748 |
| Class C | — | 1.00(b) | — |
| (a) | This charge is imposed on certain investments of between $1 million and $50 million redeemed within 18 months after purchase, as follows: 1.00% if redeemed within 12 months after purchase, and 0.50% if redeemed more than 12, but less than 18, months after purchase, with certain limited exceptions. |
| (b) | This charge applies to redemptions within 12 months after purchase, with certain limited exceptions. |
| 26 | Columbia Integrated Small Cap Growth Fund | Annual Report 2023 |
August 31, 2023
| Fee rate(s) contractual through December 31, 2023 | |
| Class A | 1.27% |
| Advisor Class | 1.02 |
| Class C | 2.02 |
| Institutional Class | 1.02 |
| Institutional 2 Class | 0.90 |
| Institutional 3 Class | 0.85 |
| Class R | 1.52 |
| Excess of distributions over net investment income ($) | Accumulated net realized (loss) ($) | Paid in capital ($) |
| 366,294 | 16,897 | (383,191) |
| Columbia Integrated Small Cap Growth Fund | Annual Report 2023 | 27 |
August 31, 2023
| Year Ended August 31, 2023 | Year Ended August 31, 2022 | ||||
| Ordinary income ($) | Long-term capital gains ($) | Total ($) | Ordinary income ($) | Long-term capital gains ($) | Total ($) |
| — | 2,684,328 | 2,684,328 | 7,005,722 | 26,275,645 | 33,281,367 |
| Undistributed ordinary income ($) | Undistributed long-term capital gains ($) | Capital loss carryforwards ($) | Net unrealized appreciation ($) |
| — | — | (5,234,184) | 7,301,811 |
| Federal tax cost ($) | Gross unrealized appreciation ($) | Gross unrealized (depreciation) ($) | Net unrealized appreciation ($) |
| 48,202,654 | 10,822,126 | (3,520,315) | 7,301,811 |
| No expiration short-term ($) | No expiration long-term ($) | Total ($) | Utilized ($) |
| (4,952,244) | (281,940) | (5,234,184) | — |
| Late year ordinary losses ($) | Post-October capital losses ($) |
| 160,633 | — |
| 28 | Columbia Integrated Small Cap Growth Fund | Annual Report 2023 |
August 31, 2023
| Columbia Integrated Small Cap Growth Fund | Annual Report 2023 | 29 |
August 31, 2023
| 30 | Columbia Integrated Small Cap Growth Fund | Annual Report 2023 |
August 31, 2023
| Columbia Integrated Small Cap Growth Fund | Annual Report 2023 | 31 |
August 31, 2023
| 32 | Columbia Integrated Small Cap Growth Fund | Annual Report 2023 |
| Columbia Integrated Small Cap Growth Fund | Annual Report 2023 | 33 |
| Name, address, year of birth | Position held with the Columbia Funds and length of service | Principal occupation(s) during past five years and other relevant professional experience | Number of Funds in the Columbia Funds Complex* overseen | Other directorships held by Trustee during the past five years and other relevant Board experience |
| George S. Batejan c/o Columbia Management Investment Advisers, LLC 290 Congress Street Boston, MA 02210 1954 | Trustee since 2017 | Executive Vice President, Global Head of Technology and Operations, Janus Capital Group, Inc., 2010-2016 | 173 | Former Chairman of the Board, NICSA (National Investment Company Services Association) (Executive Committee, Nominating Committee and Governance Committee), 2014-2016; former Director, Intech Investment Management, 2011-2016; former Board Member, Metro Denver Chamber of Commerce, 2015-2016; former Advisory Board Member, University of Colorado Business School, 2015-2018; former Board Member, Chase Bank International, 1993-1994 |
| Kathleen Blatz c/o Columbia Management Investment Advisers, LLC 290 Congress Street Boston, MA 02210 1954 | Trustee since 2006 | Attorney, specializing in arbitration and mediation; Chief Justice, Minnesota Supreme Court, 1998-2006; Associate Justice, Minnesota Supreme Court, 1996-1998; Fourth Judicial District Court Judge, Hennepin County, 1994-1996; Attorney in private practice and public service, 1984-1993; State Representative, Minnesota House of Representatives, 1979-1993, which included service on the Tax and Financial Institutions and Insurance Committees; Member and Interim Chair, Minnesota Sports Facilities Authority, January-July 2017; Interim President and Chief Executive Officer, Blue Cross and Blue Shield of Minnesota (health care insurance), February-July 2018, April-October 2021 | 173 | Former Trustee, Blue Cross and Blue Shield of Minnesota, 2009-2021 (Chair of the Business Development Committee, 2014-2017; Chair of the Governance Committee, 2017-2019); former Member and Chair of the Board, Minnesota Sports Facilities Authority, January 2017-July 2017; former Director, Robina Foundation, 2009-2020 (Chair, 2014-2020); Director, Richard M. Schulze Family Foundation, since 2021 |
| 34 | Columbia Integrated Small Cap Growth Fund | Annual Report 2023 |
(Unaudited)
Independent trustees (continued)
| Name, address, year of birth | Position held with the Columbia Funds and length of service | Principal occupation(s) during past five years and other relevant professional experience | Number of Funds in the Columbia Funds Complex* overseen | Other directorships held by Trustee during the past five years and other relevant Board experience |
| Pamela G. Carlton c/o Columbia Management Investment Advisers, LLC 290 Congress Street Boston, MA 02210 1954 | Chair since 2023; Trustee since 2007 | President, Springboard – Partners in Cross Cultural Leadership (consulting company), since 2003; Managing Director of US Equity Research, JP Morgan Chase, 1999-2003; Director of US Equity Research, Chase Asset Management, 1996-1999; Co-Director Latin America Research, 1993-1996, COO Global Research, 1992-1996, Co-Director of US Research, 1991-1992, Investment Banker, 1982-1991, Morgan Stanley; Attorney, Cleary Gottlieb Steen & Hamilton LLP, 1980-1982 | 173 | Trustee, New York Presbyterian Hospital Board, since 1996; Director, DR Bank (Audit Committee) since 2017; Director, Evercore Inc. (Audit Committee, Nominating and Governance Committee), since 2019; Director, Apollo Commercial Real Estate Finance, Inc. (Chair, Nominating and Governance Committee) (financial services), since 2021; the Governing Council of the Independent Directors Council (IDC), since 2021 |
| Janet Langford Carrig c/o Columbia Management Investment Advisers, LLC 290 Congress Street Boston, MA 02210 1957 | Trustee since 1996 | Senior Vice President, General Counsel and Corporate Secretary, ConocoPhillips (independent energy company), September 2007-October 2018 | 173 | Director, EQT Corporation (natural gas producer), since 2019; former Director, Whiting Petroleum Corporation (independent oil and gas company), 2020-2022 |
| J. Kevin Connaughton c/o Columbia Management Investment Advisers, LLC 290 Congress Street Boston, MA 02210 1964 | Trustee since 2020 | CEO and President, RhodeWay Financial (non-profit financial planning firm), since December 2022; Member, FINRA National Adjudicatory Council, since January 2020; Adjunct Professor of Finance, Bentley University since January 2018; Consultant to Independent Trustees of CFVIT and CFST I from March 2016 to June 2020 with respect to CFVIT and to December 2020 with respect to CFST I; Managing Director and General Manager of Mutual Fund Products, Columbia Management Investment Advisers, LLC, May 2010-February 2015; President, Columbia Funds, 2008-2015; and senior officer of Columbia Funds and affiliated funds, 2003-2015 | 171 | Former Director, The Autism Project, March 2015-December 2021; former Member of the Investment Committee, St. Michael’s College, November 2015-February 2020; former Trustee, St. Michael’s College, June 2017-September 2019; former Trustee, New Century Portfolios (former mutual fund complex), January 2015-December 2017 |
| Olive M. Darragh c/o Columbia Management Investment Advisers, LLC 290 Congress Street Boston, MA 02210 1962 | Trustee since 2020 | Managing Director of Darragh Inc. (strategy and talent management consulting firm), since 2010; Founder and CEO, Zolio, Inc. (investment management talent identification platform), since 2004; Consultant to Independent Trustees of CFVIT and CFST I from June 2019 to June 2020 with respect to CFVIT and to December 2020 with respect to CFST I; Partner, Tudor Investments, 2004-2010; Senior Partner, McKinsey & Company (consulting), 1990-2004; Touche Ross CPA, 1985-1988 | 171 | Treasurer, Edinburgh University US Trust Board, since January 2023; Member, HBS Community Action Partners Board, since September 2022; former Director, University of Edinburgh Business School (Member of US Board), 2004-2019; former Director, Boston Public Library Foundation, 2008-2017 |
| Columbia Integrated Small Cap Growth Fund | Annual Report 2023 | 35 |
(Unaudited)
Independent trustees (continued)
| Name, address, year of birth | Position held with the Columbia Funds and length of service | Principal occupation(s) during past five years and other relevant professional experience | Number of Funds in the Columbia Funds Complex* overseen | Other directorships held by Trustee during the past five years and other relevant Board experience |
| Patricia M. Flynn c/o Columbia Management Investment Advisers, LLC 290 Congress Street Boston, MA 02210 1950 | Trustee since 2004 | Professor of Economics and Management, Bentley University, since 2002; Dean, McCallum Graduate School of Business, Bentley University, 1992-2002 | 173 | Former Trustee, MA Taxpayers Foundation, 1997-2022; former Director, The MA Business Roundtable, 2003-2019; former Chairperson, Innovation Index Advisory Committee, MA Technology Collaborative, 1997-2020 |
| Brian J. Gallagher c/o Columbia Management Investment Advisers, LLC 290 Congress Street Boston, MA 02210 1954 | Trustee since 2017 | Retired; Partner with Deloitte & Touche LLP and its predecessors, 1977-2016 | 173 | Trustee, Catholic Schools Foundation, since 2004 |
| Douglas A. Hacker c/o Columbia Management Investment Advisers, LLC 290 Congress Street Boston, MA 02210 1955 | Trustee since 1996 | Independent business executive, since May 2006; Executive Vice President – Strategy of United Airlines, December 2002 - May 2006; President of UAL Loyalty Services (airline marketing company), September 2001-December 2002; Executive Vice President and Chief Financial Officer of United Airlines, July 1999-September 2001 | 173 | Director, SpartanNash Company since November 2013 (Chair of the Board, since May 2021) (food distributor); Director, Aircastle Limited (Chair of Audit Committee) (aircraft leasing), since August 2006; former Director, Nash Finch Company (food distributor), 2005-2013; former Director, SeaCube Container Leasing Ltd. (container leasing), 2010-2013; and former Director, Travelport Worldwide Limited (travel information technology), 2014-2019 |
| Nancy T. Lukitsh c/o Columbia Management Investment Advisers, LLC 290 Congress Street Boston, MA 02210 1956 | Trustee since 2011 | Senior Vice President, Partner and Director of Marketing, Wellington Management Company, LLP (investment adviser), 1997-2010; Chair, Wellington Management Portfolios (commingled non-U.S. investment pools), 2007-2010; Director, Wellington Trust Company, NA and other Wellington affiliates, 1997-2010 | 171 | None |
| 36 | Columbia Integrated Small Cap Growth Fund | Annual Report 2023 |
(Unaudited)
Independent trustees (continued)
| Name, address, year of birth | Position held with the Columbia Funds and length of service | Principal occupation(s) during past five years and other relevant professional experience | Number of Funds in the Columbia Funds Complex* overseen | Other directorships held by Trustee during the past five years and other relevant Board experience |
| David M. Moffett c/o Columbia Management Investment Advisers, LLC 290 Congress Street Boston, MA 02210 1952 | Trustee since 2011 | Retired; former Chief Executive Officer of Freddie Mac and Chief Financial Officer of U.S. Bank | 171 | Director, CSX Corporation (transportation suppliers); Director, PayPal Holdings Inc. (payment and data processing services); Trustee, University of Oklahoma Foundation; former Director, eBay Inc. (online trading community), 2007-2015; and former Director, CIT Bank, CIT Group Inc. (commercial and consumer finance), 2010-2016; former Senior Adviser to The Carlyle Group (financial services), March 2008-September 2008; former Governance Consultant to Bridgewater Associates, January 2013-December 2015 |
| Catherine James Paglia c/o Columbia Management Investment Advisers, LLC 290 Congress Street Boston, MA 02210 1952 | Trustee since 2004 | Director, Enterprise Asset Management, Inc. (private real estate and asset management company), since September 1998; Managing Director and Partner, Interlaken Capital, Inc., 1989-1997; Vice President, 1982-1985, Principal, 1985-1987, Managing Director, 1987-1989, Morgan Stanley; Vice President, Investment Banking, 1980-1982, Associate, Investment Banking, 1976-1980, Dean Witter Reynolds, Inc. | 173 | Director, Valmont Industries, Inc. (irrigation systems manufacturer), since 2012; Trustee, Carleton College (on the Investment Committee), since 1987; Trustee, Carnegie Endowment for International Peace (on the Investment Committee), since 2009 |
| Natalie A. Trunow c/o Columbia Management Investment Advisers, LLC 290 Congress Street Boston, MA 02210 1967 | Trustee since 2020 | Chief Executive Officer, Millennial Portfolio Solutions LLC (asset management and consulting services), January 2016-January 2021; Non-executive Member of the Investment Committee and Valuation Committee, Sarona Asset Management Inc. (private equity firm) since September 2019; Advisor, Horizon Investments (asset management and consulting services), August 2018-January 2022; Advisor, Paradigm Asset Management, November 2016-January 2022; Consultant to Independent Trustees of CFVIT and CFST I from September 2016 to June 2020 with respect to CFVIT and to December 2020 with respect to CFST I; Director of Investments/Consultant, Casey Family Programs, April 2016-November 2016; Senior Vice President and Chief Investment Officer, Calvert Investments, August 2008-January 2016; Section Head and Portfolio Manager, General Motors Asset Management, June 1997-August 2008 | 171 | Independent Director, Investment Committee, Health Services for Children with Special Needs, Inc., 2010-2021; Independent Director, (Executive Committee and Chair, Audit Committee), Consumer Credit Counseling Services (formerly Guidewell Financial Solutions), since 2016; Independent Director, (Investment Committee), Sarona Asset Management, since 2019 |
| Columbia Integrated Small Cap Growth Fund | Annual Report 2023 | 37 |
(Unaudited)
Independent trustees (continued)
| Name, address, year of birth | Position held with the Columbia Funds and length of service | Principal occupation(s) during past five years and other relevant professional experience | Number of Funds in the Columbia Funds Complex* overseen | Other directorships held by Trustee during the past five years and other relevant Board experience |
| Sandra L. Yeager c/o Columbia Management Investment Advisers, LLC 290 Congress Street Boston, MA 02210 1964 | Trustee since 2017 | Retired; President and founder, Hanoverian Capital, LLC (SEC registered investment advisor firm), 2008-2016; Managing Director, DuPont Capital, 2006-2008; Managing Director, Morgan Stanley Investment Management, 2004-2006; Senior Vice President, Alliance Bernstein, 1990-2004 | 173 | Former Director, NAPE (National Alliance for Partnerships in Equity) Education Foundation, October 2016-October 2020; Advisory Board, Jennersville YMCA, since 2022 |
| Name, address, year of birth | Position held with the Columbia Funds and length of service | Principal occupation(s) during the past five years and other relevant professional experience | Number of Funds in the Columbia Funds Complex* overseen | Other directorships held by Trustee during the past five years and other relevant Board experience |
| Daniel J. Beckman c/o Columbia Management Investment Advisers, LLC 290 Congress Street Boston, MA 02210 1962 | Trustee since November 2021 and President since June 2021 | Vice President – Head of North America Product, Columbia Management Investment Advisers, LLC, since April 2015; President and Principal Executive Officer of the Columbia Funds, since June 2021; officer of Columbia Funds and affiliated funds, 2020-2021 | 173 | Director, Ameriprise Trust Company, since October 2016; Director, Columbia Management Investment Distributors, Inc. since November 2018; Board of Governors, Columbia Wanger Asset Management, LLC since, January 2022; Director, Columbia Threadneedle Canada, Inc., since December 2022 |
| * | The term “Columbia Funds Complex” as used herein includes Columbia Seligman Premium Technology Growth Fund, Tri-Continental Corporation and each series of Columbia Funds Series Trust (CFST), Columbia Funds Series Trust I (CFST I), Columbia Funds Series Trust II (CFST II), Columbia ETF Trust I (CET I), Columbia ETF Trust II (CET II), Columbia Funds Variable Insurance Trust (CFVIT) and Columbia Funds Variable Series Trust II (CFVST II). Messrs. Batejan, Beckman, Gallagher and Hacker and Mses. Blatz, Carlton, Carrig, Flynn, Paglia, and Yeager serve as directors of Columbia Seligman Premium Technology Growth Fund and Tri-Continental Corporation. |
| ** | Interested person (as defined under the 1940 Act) by reason of being an officer, director, security holder and/or employee of the Investment Manager or Ameriprise Financial. |
| 38 | Columbia Integrated Small Cap Growth Fund | Annual Report 2023 |
(Unaudited)
The Board has appointed officers who are responsible for day-to-day business decisions based on policies it has established. The officers serve at the pleasure of the Board. The following table provides basic information about the Officers of the Fund as of the printing of this report, including principal occupations during the past five years, although their specific titles may have varied over the period. In addition to Mr. Beckman, who is President and Principal Executive Officer, the Fund’s other officers are:
| Name, address and year of birth | Position and year first appointed to position for any Fund in the Columbia Funds Complex or a predecessor thereof | Principal occupation(s) during past five years |
| Michael G. Clarke 290 Congress Street Boston, MA 02210 1969 | Chief Financial Officer and Principal Financial Officer (2009) and Senior Vice President (2019) | Senior Vice President and North America Head of Operations & Investor Services, Columbia Management Investment Advisers, LLC, since June 2023 (previously Senior Vice President and Head of Global Operations, March 2022 – June 2023, Vice President, Head of North America Operations, and Co-Head of Global Operations, June 2019 - February 2022 and Vice President – Accounting and Tax, May 2010 - May 2019); senior officer of Columbia Funds and affiliated funds, since 2002. Director, Ameriprise Trust Company, since June 2023. |
| Joseph Beranek 5890 Ameriprise Financial Center Minneapolis, MN 55474 1965 | Treasurer and Chief Accounting Officer (Principal Accounting Officer) (2019) and Principal Financial Officer (2020), CFST, CFST I, CFST II, CFVIT and CFVST II; Assistant Treasurer, CET I and CET II | Vice President – Mutual Fund Accounting and Financial Reporting, Columbia Management Investment Advisers, LLC, since December 2018 and March 2017, respectively. |
| Marybeth Pilat 290 Congress Street Boston, MA 02210 1968 | Treasurer and Chief Accounting Officer (Principal Accounting Officer) and Principal Financial Officer (2020) for CET I and CET II; Assistant Treasurer, CFST, CFST I, CFST II, CFVIT and CFVST II | Vice President – Product Pricing and Administration, Columbia Management Investment Advisers, LLC, since May 2017. |
| William F. Truscott 290 Congress Street Boston, MA 02210 1960 | Senior Vice President (2001) | Formerly, Trustee/Director of Columbia Funds Complex or legacy funds, November 2001 - January 1, 2021; Chief Executive Officer, Global Asset Management, Ameriprise Financial, Inc., since September 2012; Chairman of the Board and President, Columbia Management Investment Advisers, LLC, since July 2004 and February 2012, respectively; Chairman of the Board and Chief Executive Officer, Columbia Management Investment Distributors, Inc., since November 2008 and February 2012, respectively; Chairman of the Board and Director, Threadneedle Asset Management Holdings, Sàrl, since March 2013 and December 2008, respectively; senior executive of various entities affiliated with Columbia Threadneedle. |
| Christopher O. Petersen 5228 Ameriprise Financial Center Minneapolis, MN 55474 1970 | Senior Vice President and Assistant Secretary (2021) | Formerly, Trustee/Director of funds within the Columbia Funds Complex, July 1, 2020 - November 22, 2021; Senior Vice President and Assistant General Counsel, Ameriprise Financial, Inc., since September 2021 (previously Vice President and Lead Chief Counsel, January 2015 - September 2021); formerly, President and Principal Executive Officer of the Columbia Funds, 2015 - 2021; officer of Columbia Funds and affiliated funds, since 2007. |
| Thomas P. McGuire 290 Congress Street Boston, MA 02210 1972 | Senior Vice President and Chief Compliance Officer (2012) | Vice President – Asset Management Compliance, Ameriprise Financial, Inc., since May 2010; Chief Compliance Officer, Columbia Acorn/Wanger Funds, since December 2015; formerly, Chief Compliance Officer, Ameriprise Certificate Company, September 2010 – September 2020. |
| Ryan C. Larrenaga 290 Congress Street Boston, MA 02210 1970 | Senior Vice President (2017), Chief Legal Officer (2017), and Secretary (2015) | Vice President and Chief Counsel, Ameriprise Financial, Inc., since August 2018 (previously Vice President and Group Counsel, August 2011 - August 2018); Chief Legal Officer, Columbia Acorn/Wanger Funds, since September 2020; officer of Columbia Funds and affiliated funds, since 2005. |
| Columbia Integrated Small Cap Growth Fund | Annual Report 2023 | 39 |
(Unaudited)
Fund officers (continued)
| Name, address and year of birth | Position and year first appointed to position for any Fund in the Columbia Funds Complex or a predecessor thereof | Principal occupation(s) during past five years |
| Michael E. DeFao 290 Congress Street Boston, MA 02210 1968 | Vice President (2011) and Assistant Secretary (2010) | Vice President and Chief Counsel, Ameriprise Financial, Inc., since May 2010; Vice President, Chief Legal Officer and Assistant Secretary, Columbia Management Investment Advisers, LLC, since October 2021 (previously Vice President and Assistant Secretary, May 2010 – September 2021). |
| Lyn Kephart-Strong 5903 Ameriprise Financial Center Minneapolis, MN 55474 1960 | Vice President (2015) | Vice President, Global Investment Operations Services, Columbia Management Investment Advisers, LLC, since 2010; Director (since January 2007) and President (since October 2014), Columbia Management Investment Services Corp.; Director (since December 2017) and President (since January 2017), Ameriprise Trust Company. |
| • | the Fund had sufficient liquidity to both meet redemptions and operate effectively on behalf of shareholders; |
| • | there were no material changes to the Program during the period; |
| • | the implementation of the Program was effective to manage the Fund’s liquidity risk; and |
| • | the Program operated adequately during the period. |
| 40 | Columbia Integrated Small Cap Growth Fund | Annual Report 2023 |
| • | Information on the investment performance of the Fund relative to the performance of a group of mutual funds determined to be comparable to the Fund by Broadridge, as well as performance relative to one or more benchmarks; |
| • | Information on the Fund’s management fees and total expenses, including information comparing the Fund’s expenses to those of a group of comparable mutual funds, as determined by Broadridge; |
| • | The Investment Manager’s agreement to contractually limit or cap total operating expenses for the Fund so that total operating expenses (excluding certain fees and expenses, such as transaction costs and certain other investment related expenses, interest, taxes, acquired fund fees and expenses and infrequent and/or unusual expenses) would not exceed a specified annual rate, as a percentage of the Fund’s net assets; |
| • | Terms of the Management Agreement; |
| • | Descriptions of other agreements and arrangements with affiliates of the Investment Manager relating to the operations of the Fund, including agreements with respect to the provision of transfer agency and shareholder services to the Fund; |
| • | Descriptions of various services performed by the Investment Manager under the Management Agreement, including portfolio management and portfolio trading practices; |
| • | Information regarding any recently negotiated management fees of similarly-managed portfolios of other institutional clients of the Investment Manager; |
| • | Information regarding the resources of the Investment Manager, including information regarding senior management, portfolio managers and other personnel; |
| • | Information regarding the capabilities of the Investment Manager with respect to compliance monitoring services; |
| • | The profitability to the Investment Manager and its affiliates from their relationships with the Fund; and |
| • | Report provided by the Board’s independent fee consultant, JDL Consultants, LLC (JDL). |
| Columbia Integrated Small Cap Growth Fund | Annual Report 2023 | 41 |
(Unaudited)
Following an analysis and discussion of the foregoing, and the factors identified below, the Board, including all of the Independent Trustees, approved the renewal of the Management Agreement.
| 42 | Columbia Integrated Small Cap Growth Fund | Annual Report 2023 |
(Unaudited)
The Board considered the reports of JDL, which assisted in the Board’s analysis of the Funds’ performance and expenses and the reasonableness of the Funds’ fee rates. The Board accorded particular weight to the notion that a primary objective of the level of fees is to achieve a rational pricing model applied consistently across the various product lines in the Fund family, while assuring that the overall fees for each Fund (with certain exceptions) are generally in line with the current “pricing philosophy” such that Fund total expense ratios, in general, approximate or are lower than the median expense ratios of funds in the same Lipper comparison universe. The Board took into account that the Fund’s total expense ratio (after considering proposed expense caps/waivers) approximated the peer universe’s median expense ratio.
| Columbia Integrated Small Cap Growth Fund | Annual Report 2023 | 43 |
columbiathreadneedleus.com/investor/. The Fund is distributed by Columbia Management Investment Distributors, Inc., member FINRA, and managed by Columbia Management Investment Advisers, LLC.

August 31, 2023

| 3 | |
| 5 | |
| 7 | |
| 9 | |
| 13 | |
| 15 | |
| 16 | |
| 18 | |
| 22 | |
| 33 | |
| 34 | |
| 34 | |
| 40 | |
| 41 |
(Unaudited)

| Average annual total returns (%) (for the period ended August 31, 2023) | |||||
| Inception | 1 Year | 5 Years | 10 Years | ||
| Class A* | Excluding sales charges | 05/27/14 | 14.42 | 3.86 | 3.99 |
| Including sales charges | 7.81 | 2.64 | 3.37 | ||
| Advisor Class | 12/29/11 | 14.73 | 4.11 | 4.25 | |
| Class C* | Excluding sales charges | 12/15/21 | 13.48 | 3.08 | 3.21 |
| Including sales charges | 12.48 | 3.08 | 3.21 | ||
| Institutional Class* | 12/15/21 | 14.75 | 4.14 | 4.26 | |
| Institutional 2 Class* | 12/15/21 | 14.87 | 4.16 | 4.27 | |
| Institutional 3 Class* | 05/27/14 | 14.86 | 4.27 | 4.39 | |
| Class R* | 12/15/21 | 14.10 | 3.60 | 3.73 | |
| MSCI EAFE Index (Net) | 17.92 | 4.14 | 4.93 | ||
| * | The returns shown for periods prior to the share class inception date (including returns for the Life of the Fund, if shown, which are since Fund inception) include the returns of the Fund’s oldest share class. These returns are adjusted to reflect any higher class-related operating expenses of the newer share classes, as applicable. Please visit columbiathreadneedleus.com/investor/investment-products/mutual-funds/appended-performance for more information. |
| Columbia Pyrford International Stock Fund | Annual Report 2023 | 3 |
(Unaudited)

| Equity sector breakdown (%) (at August 31, 2023) | |
| Communication Services | 10.9 |
| Consumer Discretionary | 3.9 |
| Consumer Staples | 16.1 |
| Energy | 4.4 |
| Financials | 13.4 |
| Health Care | 9.9 |
| Industrials | 25.6 |
| Information Technology | 6.6 |
| Materials | 5.7 |
| Utilities | 3.5 |
| Total | 100.0 |
| Country breakdown (%) (at August 31, 2023) | |
| Australia | 10.2 |
| Finland | 2.4 |
| France | 7.5 |
| Germany | 10.4 |
| Hong Kong | 4.6 |
| Indonesia | 2.9 |
| Japan | 13.9 |
| Malaysia | 2.7 |
| Netherlands | 3.9 |
| Norway | 1.9 |
| Singapore | 7.5 |
| Sweden | 2.3 |
| Switzerland | 8.1 |
| Taiwan | 2.8 |
| United Kingdom | 15.6 |
| United States(a) | 3.3 |
| Total | 100.0 |
| (a) | Includes investments in Money Market Funds. |
| 4 | Columbia Pyrford International Stock Fund | Annual Report 2023 |
(Unaudited)
| • | The Fund’s currency exposure detracted from relative performance. This was led by an underweight to the euro and an overweight to the Australian dollar. |
| • | The Fund’s overall country allocation detracted from relative performance. This was led by an overweight to Singapore and an overweight to Malaysia. The underweight to the eurozone also detracted. |
| • | On a sector basis, selections within the communication services, financials and industrials sectors detracted the most from relative performance. |
| • | The three largest individual detractors to the fund were Vodafone Group PLC, Nabtesco Corp. and Axiata Group Bhd. |
| • | The Fund’s overall stock selection was additive to relative performance, led by stock selection in Japan, the eurozone and Australia. |
| • | Within the Fund’s currency exposure, an underweight to the Yen was additive as the Bank of Japan was looking to depreciate the currency, with the Yen down 4.78% over the period. |
| • | On a sector basis, selections within the materials, energy and information technology sectors were additive to performance. An underweight to the real estate sector also contributed. |
| • | The three largest individual contributors to the fund were Fuchs Petrolub SE, Japan Tobacco, Inc. and Koninklijke Vopak NV. |
| Columbia Pyrford International Stock Fund | Annual Report 2023 | 5 |
(Unaudited)
| 6 | Columbia Pyrford International Stock Fund | Annual Report 2023 |
(Unaudited)
| March 1, 2023 — August 31, 2023 | |||||||
| Account value at the beginning of the period ($) | Account value at the end of the period ($) | Expenses paid during the period ($) | Fund’s annualized expense ratio (%) | ||||
| Actual | Hypothetical | Actual | Hypothetical | Actual | Hypothetical | Actual | |
| Class A | 1,000.00 | 1,000.00 | 1,047.80 | 1,019.76 | 5.57 | 5.50 | 1.08 |
| Advisor Class | 1,000.00 | 1,000.00 | 1,049.00 | 1,021.02 | 4.29 | 4.23 | 0.83 |
| Class C | 1,000.00 | 1,000.00 | 1,043.20 | 1,015.98 | 9.42 | 9.30 | 1.83 |
| Institutional Class | 1,000.00 | 1,000.00 | 1,049.50 | 1,021.02 | 4.29 | 4.23 | 0.83 |
| Institutional 2 Class | 1,000.00 | 1,000.00 | 1,049.50 | 1,021.42 | 3.87 | 3.82 | 0.75 |
| Institutional 3 Class | 1,000.00 | 1,000.00 | 1,049.70 | 1,021.42 | 3.87 | 3.82 | 0.75 |
| Class R | 1,000.00 | 1,000.00 | 1,046.10 | 1,018.50 | 6.86 | 6.77 | 1.33 |
| Columbia Pyrford International Stock Fund | Annual Report 2023 | 7 |
(Unaudited)
| 8 | Columbia Pyrford International Stock Fund | Annual Report 2023 |
August 31, 2023
| Common Stocks 95.8% | ||
| Issuer | Shares | Value ($) |
| Australia 10.0% | ||
| Brambles Ltd. | 1,039,233 | 10,063,909 |
| Computershare Ltd. | 519,606 | 8,447,206 |
| Endeavour Group Ltd. | 778,391 | 2,768,445 |
| QBE Insurance Group Ltd. | 612,227 | 5,905,471 |
| Rio Tinto Ltd. | 62,086 | 4,496,667 |
| Woodside Energy Group Ltd. | 244,890 | 5,846,073 |
| Woolworths Group Ltd. | 315,561 | 7,776,334 |
| Total | 45,304,105 | |
| Finland 2.4% | ||
| KONE OYJ, Class B | 84,699 | 3,852,890 |
| Sampo OYJ, Class A | 158,951 | 6,977,002 |
| Total | 10,829,892 | |
| France 7.4% | ||
| Air Liquide SA | 52,763 | 9,533,018 |
| Bureau Veritas A | 217,019 | 5,813,529 |
| Legrand SA | 71,016 | 6,996,454 |
| Rubis SCA | 131,910 | 3,215,944 |
| Sanofi | 72,189 | 7,688,415 |
| Total | 33,247,360 | |
| Germany 8.3% | ||
| Brenntag SE | 111,130 | 8,988,657 |
| DHL Group | 172,997 | 8,067,375 |
| Fielmann Group AG | 90,115 | 4,229,567 |
| GEA Group AG | 105,821 | 4,172,874 |
| Nemetschek SE | 42,388 | 2,927,554 |
| SAP SE | 66,039 | 9,212,732 |
| Total | 37,598,759 | |
| Hong Kong 4.6% | ||
| AIA Group Ltd. | 711,200 | 6,435,122 |
| ASMPT Ltd. | 435,070 | 4,353,708 |
| Power Assets Holdings Ltd. | 991,569 | 4,881,031 |
| VTech Holdings Ltd. | 821,700 | 5,016,077 |
| Total | 20,685,938 | |
| Common Stocks (continued) | ||
| Issuer | Shares | Value ($) |
| Indonesia 2.8% | ||
| PT Bank Rakyat Indonesia Persero Tbk | 19,029,700 | 6,932,446 |
| PT Telekomunikasi Indonesia Persero Tbk | 23,851,600 | 5,830,257 |
| Total | 12,762,703 | |
| Japan 13.7% | ||
| ABC-Mart, Inc. | 382,800 | 6,964,132 |
| Japan Tobacco, Inc. | 661,268 | 14,479,312 |
| KDDI Corp. | 318,700 | 9,474,133 |
| Mitsubishi Electric Corp. | 710,500 | 9,256,450 |
| Nabtesco Corp. | 253,600 | 4,794,987 |
| Nihon Kohden Corp. | 284,800 | 7,582,608 |
| Sumitomo Rubber Industries Ltd. | 535,500 | 5,643,486 |
| Toyota Tsusho Corp. | 63,300 | 3,768,161 |
| Total | 61,963,269 | |
| Malaysia 2.7% | ||
| Axiata Group Bhd | 6,946,100 | 3,534,755 |
| Malayan Banking Bhd | 4,451,300 | 8,737,812 |
| Total | 12,272,567 | |
| Netherlands 3.9% | ||
| Koninklijke Philips NV(a) | 139,598 | 3,136,988 |
| Koninklijke Vopak NV | 143,194 | 5,162,684 |
| Shell PLC | 144,954 | 4,432,008 |
| Wolters Kluwer NV | 39,646 | 4,776,961 |
| Total | 17,508,641 | |
| Norway 1.9% | ||
| Telenor ASA | 787,898 | 8,435,519 |
| Singapore 7.4% | ||
| ComfortDelGro Corp., Ltd. | 6,948,500 | 6,524,011 |
| Singapore Technologies Engineering Ltd. | 1,899,900 | 5,352,986 |
| Singapore Telecommunications Ltd. | 5,677,407 | 9,975,424 |
| United Overseas Bank Ltd. | 547,002 | 11,491,072 |
| Total | 33,343,493 | |
| Columbia Pyrford International Stock Fund | Annual Report 2023 | 9 |
August 31, 2023
| Common Stocks (continued) | ||
| Issuer | Shares | Value ($) |
| Sweden 2.3% | ||
| ASSA ABLOY AB, Class B | 147,663 | 3,323,294 |
| Atlas Copco AB, Class A | 232,874 | 3,078,879 |
| Essity AB, Class B | 173,453 | 4,049,468 |
| Total | 10,451,641 | |
| Switzerland 8.0% | ||
| Geberit AG | 5,026 | 2,601,168 |
| Givaudan SA | 781 | 2,601,537 |
| Nestlé SA, Registered Shares | 94,355 | 11,345,190 |
| Novartis AG, Registered Shares | 91,390 | 9,197,651 |
| Schindler Holding AG | 11,009 | 2,451,693 |
| SGS SA, Registered Shares | 29,625 | 2,690,626 |
| Zurich Insurance Group AG | 10,927 | 5,123,596 |
| Total | 36,011,461 | |
| Taiwan 2.8% | ||
| Advantech Co., Ltd. | 227,674 | 2,450,083 |
| Chunghwa Telecom Co., Ltd. | 1,215,000 | 4,429,709 |
| Merida Industry Co., Ltd. | 89,000 | 537,999 |
| Taiwan Semiconductor Manufacturing Co., Ltd. | 291,000 | 5,000,241 |
| Total | 12,418,032 | |
| United Kingdom 15.4% | ||
| BP PLC | 614,674 | 3,798,247 |
| British American Tobacco PLC | 235,402 | 7,797,547 |
| Bunzl PLC | 120,110 | 4,301,028 |
| GSK PLC | 360,683 | 6,317,704 |
| Haleon PLC | 450,854 | 1,846,042 |
| IMI PLC | 189,243 | 3,591,369 |
| Common Stocks (continued) | ||
| Issuer | Shares | Value ($) |
| Imperial Brands PLC | 222,987 | 5,048,781 |
| Legal & General Group PLC | 2,718,104 | 7,509,849 |
| National Grid PLC | 596,671 | 7,447,890 |
| Reckitt Benckiser Group PLC | 92,400 | 6,668,115 |
| Unilever PLC | 179,174 | 9,166,570 |
| Vodafone Group PLC | 6,772,174 | 6,278,174 |
| Total | 69,771,316 | |
| United States 2.2% | ||
| Roche Holding AG, Genusschein Shares | 33,993 | 9,976,552 |
| Total Common Stocks (Cost $364,557,534) | 432,581,248 | |
| Preferred Stocks 1.9% | |||
| Issuer | Shares | Value ($) | |
| Germany 1.9% | |||
| FUCHS SE | 207,939 | 8,619,692 | |
| Total Preferred Stocks (Cost $6,859,283) | 8,619,692 | ||
| Money Market Funds 1.0% | ||
| Shares | Value ($) | |
| Columbia Short-Term Cash Fund, 5.476%(b),(c) | 4,716,201 | 4,714,786 |
| Total Money Market Funds (Cost $4,714,314) | 4,714,786 | |
| Total Investments in Securities (Cost $376,131,131) | 445,915,726 | |
| Other Assets & Liabilities, Net | 5,781,502 | |
| Net Assets | $451,697,228 | |
| (a) | Non-income producing investment. |
| (b) | The rate shown is the seven-day current annualized yield at August 31, 2023. |
| (c) | As defined in the Investment Company Act of 1940, as amended, an affiliated company is one in which the Fund owns 5% or more of the company’s outstanding voting securities, or a company which is under common ownership or control with the Fund. The value of the holdings and transactions in these affiliated companies during the year ended August 31, 2023 are as follows: |
| Affiliated issuers | Beginning of period($) | Purchases($) | Sales($) | Net change in unrealized appreciation (depreciation)($) | End of period($) | Realized gain (loss)($) | Dividends($) | End of period shares |
| Columbia Short-Term Cash Fund, 5.476% | ||||||||
| 13,344,812 | 112,200,600 | (120,829,787) | (839) | 4,714,786 | 4,645 | 440,535 | 4,716,201 | |
| 10 | Columbia Pyrford International Stock Fund | Annual Report 2023 |
August 31, 2023
| ■ | Level 1 — Valuations based on quoted prices for investments in active markets that the Fund has the ability to access at the measurement date. Valuation adjustments are not applied to Level 1 investments. |
| ■ | Level 2 — Valuations based on other significant observable inputs (including quoted prices for similar securities, interest rates, prepayment speeds, credit risks, etc.). |
| ■ | Level 3 — Valuations based on significant unobservable inputs (including the Fund’s own assumptions and judgment in determining the fair value of investments). |
| Level 1 ($) | Level 2 ($) | Level 3 ($) | Total ($) | |
| Investments in Securities | ||||
| Common Stocks | ||||
| Australia | — | 45,304,105 | — | 45,304,105 |
| Finland | — | 10,829,892 | — | 10,829,892 |
| France | — | 33,247,360 | — | 33,247,360 |
| Germany | — | 37,598,759 | — | 37,598,759 |
| Hong Kong | — | 20,685,938 | — | 20,685,938 |
| Indonesia | — | 12,762,703 | — | 12,762,703 |
| Japan | — | 61,963,269 | — | 61,963,269 |
| Malaysia | — | 12,272,567 | — | 12,272,567 |
| Netherlands | — | 17,508,641 | — | 17,508,641 |
| Norway | — | 8,435,519 | — | 8,435,519 |
| Singapore | — | 33,343,493 | — | 33,343,493 |
| Sweden | — | 10,451,641 | — | 10,451,641 |
| Switzerland | — | 36,011,461 | — | 36,011,461 |
| Taiwan | — | 12,418,032 | — | 12,418,032 |
| Columbia Pyrford International Stock Fund | Annual Report 2023 | 11 |
August 31, 2023
| Level 1 ($) | Level 2 ($) | Level 3 ($) | Total ($) | |
| United Kingdom | — | 69,771,316 | — | 69,771,316 |
| United States | — | 9,976,552 | — | 9,976,552 |
| Total Common Stocks | — | 432,581,248 | — | 432,581,248 |
| Preferred Stocks | ||||
| Germany | — | 8,619,692 | — | 8,619,692 |
| Total Preferred Stocks | — | 8,619,692 | — | 8,619,692 |
| Money Market Funds | 4,714,786 | — | — | 4,714,786 |
| Total Investments in Securities | 4,714,786 | 441,200,940 | — | 445,915,726 |
| 12 | Columbia Pyrford International Stock Fund | Annual Report 2023 |
August 31, 2023
| Assets | |
| Investments in securities, at value | |
| Unaffiliated issuers (cost $371,416,817) | $441,200,940 |
| Affiliated issuers (cost $4,714,314) | 4,714,786 |
| Foreign currency (cost $253,727) | 252,397 |
| Receivable for: | |
| Capital shares sold | 61,303 |
| Dividends | 1,698,427 |
| Foreign tax reclaims | 3,886,797 |
| Expense reimbursement due from Investment Manager | 2,244 |
| Prepaid expenses | 4,329 |
| Total assets | 451,821,223 |
| Liabilities | |
| Payable for: | |
| Capital shares redeemed | 7,018 |
| Management services fees | 10,738 |
| Distribution and/or service fees | 14 |
| Transfer agent fees | 59,391 |
| Trustees’ fees | 13,672 |
| Accounting services fees | 15,045 |
| Custodian fees | 15,842 |
| Other expenses | 2,275 |
| Total liabilities | 123,995 |
| Net assets applicable to outstanding capital stock | $451,697,228 |
| Represented by | |
| Paid in capital | 370,564,987 |
| Total distributable earnings (loss) | 81,132,241 |
| Total - representing net assets applicable to outstanding capital stock | $451,697,228 |
| Columbia Pyrford International Stock Fund | Annual Report 2023 | 13 |
August 31, 2023
| Class A | |
| Net assets | $2,048,963 |
| Shares outstanding | 143,702 |
| Net asset value per share | $14.26 |
| Maximum sales charge | 5.75% |
| Maximum offering price per share (calculated by dividing the net asset value per share by 1.0 minus the maximum sales charge for Class A shares) | $15.13 |
| Advisor Class | |
| Net assets | $285,141,283 |
| Shares outstanding | 20,479,968 |
| Net asset value per share | $13.92 |
| Class C | |
| Net assets | $2,430 |
| Shares outstanding | 173 |
| Net asset value per share(a) | $14.01 |
| Institutional Class | |
| Net assets | $3,028,413 |
| Shares outstanding | 219,996 |
| Net asset value per share | $13.77 |
| Institutional 2 Class | |
| Net assets | $34,905,259 |
| Shares outstanding | 2,535,662 |
| Net asset value per share | $13.77 |
| Institutional 3 Class | |
| Net assets | $126,568,442 |
| Shares outstanding | 9,082,485 |
| Net asset value per share | $13.94 |
| Class R | |
| Net assets | $2,438 |
| Shares outstanding | 173 |
| Net asset value per share(a) | $14.06 |
| (a) | Net asset value per share rounds to this amount due to fractional shares outstanding. |
| 14 | Columbia Pyrford International Stock Fund | Annual Report 2023 |
Year Ended August 31, 2023
| Net investment income | |
| Income: | |
| Dividends — unaffiliated issuers | $18,937,472 |
| Dividends — affiliated issuers | 440,535 |
| Interfund lending | 80 |
| Foreign taxes withheld | (1,428,561) |
| Total income | 17,949,526 |
| Expenses: | |
| Management services fees | 4,068,901 |
| Distribution and/or service fees | |
| Class A | 4,787 |
| Class C | 23 |
| Class R | 12 |
| Transfer agent fees | |
| Class A | 1,974 |
| Advisor Class | 325,291 |
| Class C | 4 |
| Institutional Class | 2,787 |
| Institutional 2 Class | 2,420 |
| Institutional 3 Class | 7,309 |
| Class R | 4 |
| Trustees’ fees | 23,878 |
| Custodian fees | 54,233 |
| Printing and postage fees | 10,316 |
| Registration fees | 106,045 |
| Accounting services fees | 30,090 |
| Legal fees | 18,022 |
| Interest on interfund lending | 629 |
| Compensation of chief compliance officer | 93 |
| Other | 67,181 |
| Total expenses | 4,723,999 |
| Fees waived or expenses reimbursed by Investment Manager and its affiliates | (889,592) |
| Expense reduction | (300) |
| Total net expenses | 3,834,107 |
| Net investment income | 14,115,419 |
| Realized and unrealized gain (loss) — net | |
| Net realized gain (loss) on: | |
| Investments — unaffiliated issuers | 12,885,038 |
| Investments — affiliated issuers | 4,645 |
| Foreign currency translations | (82,624) |
| Net realized gain | 12,807,059 |
| Net change in unrealized appreciation (depreciation) on: | |
| Investments — unaffiliated issuers | 37,325,639 |
| Investments — affiliated issuers | (839) |
| Foreign currency translations | 294,015 |
| Net change in unrealized appreciation (depreciation) | 37,618,815 |
| Net realized and unrealized gain | 50,425,874 |
| Net increase in net assets resulting from operations | $64,541,293 |
| Columbia Pyrford International Stock Fund | Annual Report 2023 | 15 |
| Year Ended August 31, 2023 | Year Ended August 31, 2022 (a) | |
| Operations | ||
| Net investment income | $14,115,419 | $17,348,501 |
| Net realized gain | 12,807,059 | 8,258,127 |
| Net change in unrealized appreciation (depreciation) | 37,618,815 | (117,332,247) |
| Net increase (decrease) in net assets resulting from operations | 64,541,293 | (91,725,619) |
| Distributions to shareholders | ||
| Net investment income and net realized gains | ||
| Class A | (59,933) | (55,459) |
| Advisor Class | (11,579,584) | (15,466,525) |
| Class C | (59) | — |
| Institutional Class | (101,501) | — |
| Institutional 2 Class | (1,534,697) | — |
| Institutional 3 Class | (3,891,976) | (8,840,663) |
| Class R | (70) | — |
| Total distributions to shareholders | (17,167,820) | (24,362,647) |
| Decrease in net assets from capital stock activity | (72,719,878) | (168,031,905) |
| Redemption fees | — | 10 |
| Total decrease in net assets | (25,346,405) | (284,120,161) |
| Net assets at beginning of year | 477,043,633 | 761,163,794 |
| Net assets at end of year | $451,697,228 | $477,043,633 |
| (a) | Class C, Institutional Class, Institutional 2 Class, and Class R shares are based on operations from December 15, 2021 (commencement of operations) through the stated period end. |
| 16 | Columbia Pyrford International Stock Fund | Annual Report 2023 |
| Year Ended | Year Ended | |||
| August 31, 2023 | August 31, 2022 (a) | |||
| Shares | Dollars ($) | Shares | Dollars ($) | |
| Capital stock activity | ||||
| Class A | ||||
| Shares sold | 25,281 | 347,457 | 16,215 | 239,949 |
| Distributions reinvested | 4,527 | 59,252 | 3,688 | 53,915 |
| Shares redeemed | (17,063) | (230,242) | (16,412) | (230,422) |
| Net increase | 12,745 | 176,467 | 3,491 | 63,442 |
| Advisor Class | ||||
| Shares sold | 252,082 | 3,266,002 | 2,682,236 | 38,124,461 |
| Distributions reinvested | 814,016 | 10,386,839 | 975,399 | 13,918,949 |
| Shares redeemed | (6,407,774) | (85,584,836) | (9,773,907) | (135,441,338) |
| Net decrease | (5,341,676) | (71,931,995) | (6,116,272) | (83,397,928) |
| Class C | ||||
| Shares sold | — | — | 173 | 2,500 |
| Net increase | — | — | 173 | 2,500 |
| Institutional Class | ||||
| Shares sold | 170,036 | 2,128,730 | 104,939 | 1,415,111 |
| Distributions reinvested | 8,042 | 101,417 | — | — |
| Shares redeemed | (59,006) | (779,518) | (4,015) | (51,336) |
| Net increase | 119,072 | 1,450,629 | 100,924 | 1,363,775 |
| Institutional 2 Class | ||||
| Shares sold | 322,802 | 4,321,432 | 3,241,704 | 41,713,761 |
| Distributions reinvested | 121,794 | 1,534,610 | — | — |
| Shares redeemed | (1,095,181) | (14,634,248) | (55,457) | (738,302) |
| Net increase (decrease) | (650,585) | (8,778,206) | 3,186,247 | 40,975,459 |
| Institutional 3 Class | ||||
| Shares sold | 2,285,545 | 30,829,967 | 1,345,251 | 18,944,248 |
| Distributions reinvested | 300,337 | 3,832,298 | 619,048 | 8,833,813 |
| Shares redeemed | (2,191,297) | (28,299,038) | (11,135,983) | (154,819,714) |
| Net increase (decrease) | 394,585 | 6,363,227 | (9,171,684) | (127,041,653) |
| Class R | ||||
| Shares sold | — | — | 173 | 2,500 |
| Net increase | — | — | 173 | 2,500 |
| Total net decrease | (5,465,859) | (72,719,878) | (11,996,948) | (168,031,905) |
| (a) | Class C, Institutional Class, Institutional 2 Class, and Class R shares are based on operations from December 15, 2021 (commencement of operations) through the stated period end. |
| Columbia Pyrford International Stock Fund | Annual Report 2023 | 17 |
| Net asset value, beginning of period | Net investment income | Net realized and unrealized gain (loss) | Total from investment operations | Distributions from net investment income | Distributions from net realized gains | Total distributions to shareholders | |
| Class A | |||||||
| Year Ended 8/31/2023 | $12.88 | 0.39 | 1.43 | 1.82 | (0.44) | — | (0.44) |
| Year Ended 8/31/2022 | $15.58 | 0.36 | (2.61) | (2.25) | (0.36) | (0.09) | (0.45) |
| Year Ended 8/31/2021(f),(g) | $13.56 | 0.37 | 1.89 | 2.26 | (0.24) | — | (0.24) |
| Year Ended 8/31/2020(f),(g) | $13.08 | 0.26 | 0.54 | 0.80 | (0.32) | — | (0.32) |
| Year Ended 8/31/2019(g) | $13.43 | 0.32 | (0.34) | (0.02) | (0.33) | — | (0.33) |
| Advisor Class | |||||||
| Year Ended 8/31/2023 | $12.58 | 0.39 | 1.42 | 1.81 | (0.47) | — | (0.47) |
| Year Ended 8/31/2022 | $15.24 | 0.37 | (2.55) | (2.18) | (0.39) | (0.09) | (0.48) |
| Year Ended 8/31/2021(f),(g) | $13.29 | 0.40 | 1.85 | 2.25 | (0.30) | — | (0.30) |
| Year Ended 8/31/2020(f),(g) | $12.84 | 0.31 | 0.51 | 0.82 | (0.37) | — | (0.37) |
| Year Ended 8/31/2019(g) | $13.18 | 0.33 | (0.33) | 0.00(h) | (0.34) | — | (0.34) |
| Class C | |||||||
| Year Ended 8/31/2023 | $12.67 | 0.27 | 1.41 | 1.68 | (0.34) | — | (0.34) |
| Year Ended 8/31/2022(i) | $14.42 | 0.24 | (1.99) | (1.75) | — | — | — |
| Institutional Class | |||||||
| Year Ended 8/31/2023 | $12.45 | 0.39 | 1.40 | 1.79 | (0.47) | — | (0.47) |
| Year Ended 8/31/2022(i) | $14.07 | 0.27 | (1.89) | (1.62) | — | — | — |
| Institutional 2 Class | |||||||
| Year Ended 8/31/2023 | $12.45 | 0.40 | 1.41 | 1.81 | (0.49) | — | (0.49) |
| Year Ended 8/31/2022(i) | $14.07 | 0.28 | (1.90) | (1.62) | — | — | — |
| Institutional 3 Class | |||||||
| Year Ended 8/31/2023 | $12.60 | 0.42 | 1.41 | 1.83 | (0.49) | — | (0.49) |
| Year Ended 8/31/2022(g) | $15.26 | 0.39 | (2.55) | (2.16) | (0.41) | (0.09) | (0.50) |
| Year Ended 8/31/2021(f),(g) | $13.31 | 0.43 | 1.84 | 2.27 | (0.32) | — | (0.32) |
| Year Ended 8/31/2020(f),(g) | $12.86 | 0.34 | 0.50 | 0.84 | (0.39) | — | (0.39) |
| Year Ended 8/31/2019(g) | $13.20 | 0.34 | (0.31) | 0.03 | (0.37) | — | (0.37) |
| 18 | Columbia Pyrford International Stock Fund | Annual Report 2023 |
| Net asset value, end of period | Total return | Total gross expense ratio to average net assets(a) | Total net expense ratio to average net assets(a),(b),(c) | Net investment income ratio to average net assets | Portfolio turnover | Net assets, end of period (000’s) | |
| Class A | |||||||
| Year Ended 8/31/2023 | $14.26 | 14.42% | 1.28%(d) | 1.09%(d),(e) | 2.81% | 7% | $2,049 |
| Year Ended 8/31/2022 | $12.88 | (14.81%) | 1.29%(d) | 1.12%(d) | 2.51% | 17% | $1,686 |
| Year Ended 8/31/2021(f),(g) | $15.58 | 16.83% | 1.20% | 1.19% | 2.54% | 13% | $1,986 |
| Year Ended 8/31/2020(f),(g) | $13.56 | 6.11% | 1.20% | 1.19% | 1.95% | 28% | $1,816 |
| Year Ended 8/31/2019(g) | $13.08 | 0.04% | 1.21% | 1.19% | 2.32% | 16% | $4,621 |
| Advisor Class | |||||||
| Year Ended 8/31/2023 | $13.92 | 14.73% | 1.03%(d) | 0.84%(d),(e) | 2.93% | 7% | $285,141 |
| Year Ended 8/31/2022 | $12.58 | (14.68%) | 1.04%(d) | 0.88%(d) | 2.65% | 17% | $324,963 |
| Year Ended 8/31/2021(f),(g) | $15.24 | 17.18% | 0.95% | 0.94% | 2.78% | 13% | $486,673 |
| Year Ended 8/31/2020(f),(g) | $13.29 | 6.38% | 0.95% | 0.94% | 2.40% | 28% | $463,023 |
| Year Ended 8/31/2019(g) | $12.84 | 0.25% | 0.96% | 0.94% | 2.71% | 16% | $486,114 |
| Class C | |||||||
| Year Ended 8/31/2023 | $14.01 | 13.48% | 2.03%(d) | 1.84%(d),(e) | 2.04% | 7% | $2 |
| Year Ended 8/31/2022(i) | $12.67 | (12.14%) | 2.03%(d) | 1.85%(d) | 2.36% | 17% | $2 |
| Institutional Class | |||||||
| Year Ended 8/31/2023 | $13.77 | 14.75% | 1.03%(d) | 0.84%(d),(e) | 2.97% | 7% | $3,028 |
| Year Ended 8/31/2022(i) | $12.45 | (11.51%) | 1.03%(d) | 0.85%(d) | 3.00% | 17% | $1,256 |
| Institutional 2 Class | |||||||
| Year Ended 8/31/2023 | $13.77 | 14.87% | 0.94%(d) | 0.75%(d) | 3.02% | 7% | $34,905 |
| Year Ended 8/31/2022(i) | $12.45 | (11.51%) | 0.92%(d) | 0.75%(d) | 3.12% | 17% | $39,674 |
| Institutional 3 Class | |||||||
| Year Ended 8/31/2023 | $13.94 | 14.86% | 0.94%(d) | 0.75%(d) | 3.17% | 7% | $126,568 |
| Year Ended 8/31/2022(g) | $12.60 | (14.53%) | 0.88%(d) | 0.75%(d) | 2.74% | 17% | $109,460 |
| Year Ended 8/31/2021(f),(g) | $15.26 | 17.31% | 0.80% | 0.79% | 2.99% | 13% | $272,505 |
| Year Ended 8/31/2020(f),(g) | $13.31 | 6.54% | 0.80% | 0.79% | 2.65% | 28% | $230,148 |
| Year Ended 8/31/2019(g) | $12.86 | 0.44% | 0.81% | 0.79% | 2.86% | 16% | $163,829 |
| Columbia Pyrford International Stock Fund | Annual Report 2023 | 19 |
| Net asset value, beginning of period | Net investment income | Net realized and unrealized gain (loss) | Total from investment operations | Distributions from net investment income | Distributions from net realized gains | Total distributions to shareholders | |
| Class R | |||||||
| Year Ended 8/31/2023 | $12.71 | 0.34 | 1.42 | 1.76 | (0.41) | — | (0.41) |
| Year Ended 8/31/2022(i) | $14.42 | 0.29 | (2.00) | (1.71) | — | — | — |
| Notes to Financial Highlights | |
| (a) | In addition to the fees and expenses that the Fund bears directly, the Fund indirectly bears a pro rata share of the fees and expenses of any other funds in which it invests. Such indirect expenses are not included in the Fund’s reported expense ratios. |
| (b) | Total net expenses include the impact of certain fee waivers/expense reimbursements made by the Investment Manager and certain of its affiliates, if applicable. |
| (c) | Total net expenses include the impact of certain fee waivers/expense reimbursements made by BMO Asset Management Corp, and certain of its affiliates, if applicable, for the account periods prior to the closing of the Reorganization, which occurred on December 10, 2021. |
| (d) | Ratios include interfund lending expense which is less than 0.01%. |
| (e) | The benefits derived from expense reductions had an impact of less than 0.01%. |
| (f) | Net investment income (loss) per share calculated using the average shares method. |
| (g) | Redemption fees consisted of per share amounts less than $0.01. |
| (h) | Rounds to zero. |
| (i) | Class C, Institutional Class, Institutional 2 Class and Class R shares commenced operations on December 15, 2021. Per share data and total return reflect activity from that date. |
| 20 | Columbia Pyrford International Stock Fund | Annual Report 2023 |
| Net asset value, end of period | Total return | Total gross expense ratio to average net assets(a) | Total net expense ratio to average net assets(a),(b),(c) | Net investment income ratio to average net assets | Portfolio turnover | Net assets, end of period (000’s) | |
| Class R | |||||||
| Year Ended 8/31/2023 | $14.06 | 14.10% | 1.53%(d) | 1.34%(d),(e) | 2.54% | 7% | $2 |
| Year Ended 8/31/2022(i) | $12.71 | (11.86%) | 1.53%(d) | 1.35%(d) | 2.87% | 17% | $2 |
| Columbia Pyrford International Stock Fund | Annual Report 2023 | 21 |
August 31, 2023
| 22 | Columbia Pyrford International Stock Fund | Annual Report 2023 |
August 31, 2023
| Columbia Pyrford International Stock Fund | Annual Report 2023 | 23 |
August 31, 2023
| 24 | Columbia Pyrford International Stock Fund | Annual Report 2023 |
August 31, 2023
| Columbia Pyrford International Stock Fund | Annual Report 2023 | 25 |
August 31, 2023
| Effective rate (%) | |
| Class A | 0.10 |
| Advisor Class | 0.10 |
| Class C | 0.10 |
| Institutional Class | 0.10 |
| Institutional 2 Class | 0.01 |
| Institutional 3 Class | 0.01 |
| Class R | 0.10 |
| Front End (%) | CDSC (%) | Amount ($) | |
| Class A | 5.75 | 0.50 - 1.00(a) | 40 |
| Class C | — | 1.00(b) | — |
| (a) | This charge is imposed on certain investments of between $1 million and $50 million redeemed within 18 months after purchase, as follows: 1.00% if redeemed within 12 months after purchase, and 0.50% if redeemed more than 12, but less than 18, months after purchase, with certain limited exceptions. |
| (b) | This charge applies to redemptions within 12 months after purchase, with certain limited exceptions. |
| 26 | Columbia Pyrford International Stock Fund | Annual Report 2023 |
August 31, 2023
| Fee rate(s) contractual through December 31, 2023 | |
| Class A | 1.17% |
| Advisor Class | 0.92 |
| Class C | 1.92 |
| Institutional Class | 0.92 |
| Institutional 2 Class | 0.81 |
| Institutional 3 Class | 0.75 |
| Class R | 1.42 |
| Undistributed net investment income ($) | Accumulated net realized (loss) ($) | Paid in capital ($) |
| (82,624) | (815,376) | 898,000 |
| Columbia Pyrford International Stock Fund | Annual Report 2023 | 27 |
August 31, 2023
| Year Ended August 31, 2023 | Year Ended August 31, 2022 | ||||
| Ordinary income ($) | Long-term capital gains ($) | Total ($) | Ordinary income ($) | Long-term capital gains ($) | Total ($) |
| 17,167,820 | — | 17,167,820 | 20,753,308 | 3,609,339 | 24,362,647 |
| Undistributed ordinary income ($) | Undistributed long-term capital gains ($) | Capital loss carryforwards ($) | Net unrealized appreciation ($) |
| 11,249,881 | 8,639,744 | — | 61,134,702 |
| Federal tax cost ($) | Gross unrealized appreciation ($) | Gross unrealized (depreciation) ($) | Net unrealized appreciation ($) |
| 384,781,024 | 94,151,734 | (33,017,032) | 61,134,702 |
| 28 | Columbia Pyrford International Stock Fund | Annual Report 2023 |
August 31, 2023
| Borrower or lender | Average loan balance ($) | Weighted average interest rate (%) | Number of days with outstanding loans |
| Borrower | 1,300,000 | 4.73 | 4 |
| Lender | 800,000 | 3.60 | 1 |
| Columbia Pyrford International Stock Fund | Annual Report 2023 | 29 |
August 31, 2023
| 30 | Columbia Pyrford International Stock Fund | Annual Report 2023 |
August 31, 2023
| Columbia Pyrford International Stock Fund | Annual Report 2023 | 31 |
August 31, 2023
| 32 | Columbia Pyrford International Stock Fund | Annual Report 2023 |
| Columbia Pyrford International Stock Fund | Annual Report 2023 | 33 |
| Qualified dividend income | Capital gain dividend | Foreign taxes paid to foreign countries | Foreign taxes paid per share to foreign countries | Foreign source income | Foreign source income per share |
| 99.00% | $10,014,631 | $1,428,561 | $0.04 | $18,937,100 | $0.58 |
| Name, address, year of birth | Position held with the Columbia Funds and length of service | Principal occupation(s) during past five years and other relevant professional experience | Number of Funds in the Columbia Funds Complex* overseen | Other directorships held by Trustee during the past five years and other relevant Board experience |
| George S. Batejan c/o Columbia Management Investment Advisers, LLC 290 Congress Street Boston, MA 02210 1954 | Trustee since 2017 | Executive Vice President, Global Head of Technology and Operations, Janus Capital Group, Inc., 2010-2016 | 173 | Former Chairman of the Board, NICSA (National Investment Company Services Association) (Executive Committee, Nominating Committee and Governance Committee), 2014-2016; former Director, Intech Investment Management, 2011-2016; former Board Member, Metro Denver Chamber of Commerce, 2015-2016; former Advisory Board Member, University of Colorado Business School, 2015-2018; former Board Member, Chase Bank International, 1993-1994 |
| 34 | Columbia Pyrford International Stock Fund | Annual Report 2023 |
(Unaudited)
Independent trustees (continued)
| Name, address, year of birth | Position held with the Columbia Funds and length of service | Principal occupation(s) during past five years and other relevant professional experience | Number of Funds in the Columbia Funds Complex* overseen | Other directorships held by Trustee during the past five years and other relevant Board experience |
| Kathleen Blatz c/o Columbia Management Investment Advisers, LLC 290 Congress Street Boston, MA 02210 1954 | Trustee since 2006 | Attorney, specializing in arbitration and mediation; Chief Justice, Minnesota Supreme Court, 1998-2006; Associate Justice, Minnesota Supreme Court, 1996-1998; Fourth Judicial District Court Judge, Hennepin County, 1994-1996; Attorney in private practice and public service, 1984-1993; State Representative, Minnesota House of Representatives, 1979-1993, which included service on the Tax and Financial Institutions and Insurance Committees; Member and Interim Chair, Minnesota Sports Facilities Authority, January-July 2017; Interim President and Chief Executive Officer, Blue Cross and Blue Shield of Minnesota (health care insurance), February-July 2018, April-October 2021 | 173 | Former Trustee, Blue Cross and Blue Shield of Minnesota, 2009-2021 (Chair of the Business Development Committee, 2014-2017; Chair of the Governance Committee, 2017-2019); former Member and Chair of the Board, Minnesota Sports Facilities Authority, January 2017-July 2017; former Director, Robina Foundation, 2009-2020 (Chair, 2014-2020); Director, Richard M. Schulze Family Foundation, since 2021 |
| Pamela G. Carlton c/o Columbia Management Investment Advisers, LLC 290 Congress Street Boston, MA 02210 1954 | Chair since 2023; Trustee since 2007 | President, Springboard – Partners in Cross Cultural Leadership (consulting company), since 2003; Managing Director of US Equity Research, JP Morgan Chase, 1999-2003; Director of US Equity Research, Chase Asset Management, 1996-1999; Co-Director Latin America Research, 1993-1996, COO Global Research, 1992-1996, Co-Director of US Research, 1991-1992, Investment Banker, 1982-1991, Morgan Stanley; Attorney, Cleary Gottlieb Steen & Hamilton LLP, 1980-1982 | 173 | Trustee, New York Presbyterian Hospital Board, since 1996; Director, DR Bank (Audit Committee) since 2017; Director, Evercore Inc. (Audit Committee, Nominating and Governance Committee), since 2019; Director, Apollo Commercial Real Estate Finance, Inc. (Chair, Nominating and Governance Committee) (financial services), since 2021; the Governing Council of the Independent Directors Council (IDC), since 2021 |
| Janet Langford Carrig c/o Columbia Management Investment Advisers, LLC 290 Congress Street Boston, MA 02210 1957 | Trustee since 1996 | Senior Vice President, General Counsel and Corporate Secretary, ConocoPhillips (independent energy company), September 2007-October 2018 | 173 | Director, EQT Corporation (natural gas producer), since 2019; former Director, Whiting Petroleum Corporation (independent oil and gas company), 2020-2022 |
| J. Kevin Connaughton c/o Columbia Management Investment Advisers, LLC 290 Congress Street Boston, MA 02210 1964 | Trustee since 2020 | CEO and President, RhodeWay Financial (non-profit financial planning firm), since December 2022; Member, FINRA National Adjudicatory Council, since January 2020; Adjunct Professor of Finance, Bentley University since January 2018; Consultant to Independent Trustees of CFVIT and CFST I from March 2016 to June 2020 with respect to CFVIT and to December 2020 with respect to CFST I; Managing Director and General Manager of Mutual Fund Products, Columbia Management Investment Advisers, LLC, May 2010-February 2015; President, Columbia Funds, 2008-2015; and senior officer of Columbia Funds and affiliated funds, 2003-2015 | 171 | Former Director, The Autism Project, March 2015-December 2021; former Member of the Investment Committee, St. Michael’s College, November 2015-February 2020; former Trustee, St. Michael’s College, June 2017-September 2019; former Trustee, New Century Portfolios (former mutual fund complex), January 2015-December 2017 |
| Columbia Pyrford International Stock Fund | Annual Report 2023 | 35 |
(Unaudited)
Independent trustees (continued)
| Name, address, year of birth | Position held with the Columbia Funds and length of service | Principal occupation(s) during past five years and other relevant professional experience | Number of Funds in the Columbia Funds Complex* overseen | Other directorships held by Trustee during the past five years and other relevant Board experience |
| Olive M. Darragh c/o Columbia Management Investment Advisers, LLC 290 Congress Street Boston, MA 02210 1962 | Trustee since 2020 | Managing Director of Darragh Inc. (strategy and talent management consulting firm), since 2010; Founder and CEO, Zolio, Inc. (investment management talent identification platform), since 2004; Consultant to Independent Trustees of CFVIT and CFST I from June 2019 to June 2020 with respect to CFVIT and to December 2020 with respect to CFST I; Partner, Tudor Investments, 2004-2010; Senior Partner, McKinsey & Company (consulting), 1990-2004; Touche Ross CPA, 1985-1988 | 171 | Treasurer, Edinburgh University US Trust Board, since January 2023; Member, HBS Community Action Partners Board, since September 2022; former Director, University of Edinburgh Business School (Member of US Board), 2004-2019; former Director, Boston Public Library Foundation, 2008-2017 |
| Patricia M. Flynn c/o Columbia Management Investment Advisers, LLC 290 Congress Street Boston, MA 02210 1950 | Trustee since 2004 | Professor of Economics and Management, Bentley University, since 2002; Dean, McCallum Graduate School of Business, Bentley University, 1992-2002 | 173 | Former Trustee, MA Taxpayers Foundation, 1997-2022; former Director, The MA Business Roundtable, 2003-2019; former Chairperson, Innovation Index Advisory Committee, MA Technology Collaborative, 1997-2020 |
| Brian J. Gallagher c/o Columbia Management Investment Advisers, LLC 290 Congress Street Boston, MA 02210 1954 | Trustee since 2017 | Retired; Partner with Deloitte & Touche LLP and its predecessors, 1977-2016 | 173 | Trustee, Catholic Schools Foundation, since 2004 |
| Douglas A. Hacker c/o Columbia Management Investment Advisers, LLC 290 Congress Street Boston, MA 02210 1955 | Trustee since 1996 | Independent business executive, since May 2006; Executive Vice President – Strategy of United Airlines, December 2002 - May 2006; President of UAL Loyalty Services (airline marketing company), September 2001-December 2002; Executive Vice President and Chief Financial Officer of United Airlines, July 1999-September 2001 | 173 | Director, SpartanNash Company since November 2013 (Chair of the Board, since May 2021) (food distributor); Director, Aircastle Limited (Chair of Audit Committee) (aircraft leasing), since August 2006; former Director, Nash Finch Company (food distributor), 2005-2013; former Director, SeaCube Container Leasing Ltd. (container leasing), 2010-2013; and former Director, Travelport Worldwide Limited (travel information technology), 2014-2019 |
| Nancy T. Lukitsh c/o Columbia Management Investment Advisers, LLC 290 Congress Street Boston, MA 02210 1956 | Trustee since 2011 | Senior Vice President, Partner and Director of Marketing, Wellington Management Company, LLP (investment adviser), 1997-2010; Chair, Wellington Management Portfolios (commingled non-U.S. investment pools), 2007-2010; Director, Wellington Trust Company, NA and other Wellington affiliates, 1997-2010 | 171 | None |
| 36 | Columbia Pyrford International Stock Fund | Annual Report 2023 |
(Unaudited)
Independent trustees (continued)
| Name, address, year of birth | Position held with the Columbia Funds and length of service | Principal occupation(s) during past five years and other relevant professional experience | Number of Funds in the Columbia Funds Complex* overseen | Other directorships held by Trustee during the past five years and other relevant Board experience |
| David M. Moffett c/o Columbia Management Investment Advisers, LLC 290 Congress Street Boston, MA 02210 1952 | Trustee since 2011 | Retired; former Chief Executive Officer of Freddie Mac and Chief Financial Officer of U.S. Bank | 171 | Director, CSX Corporation (transportation suppliers); Director, PayPal Holdings Inc. (payment and data processing services); Trustee, University of Oklahoma Foundation; former Director, eBay Inc. (online trading community), 2007-2015; and former Director, CIT Bank, CIT Group Inc. (commercial and consumer finance), 2010-2016; former Senior Adviser to The Carlyle Group (financial services), March 2008-September 2008; former Governance Consultant to Bridgewater Associates, January 2013-December 2015 |
| Catherine James Paglia c/o Columbia Management Investment Advisers, LLC 290 Congress Street Boston, MA 02210 1952 | Trustee since 2004 | Director, Enterprise Asset Management, Inc. (private real estate and asset management company), since September 1998; Managing Director and Partner, Interlaken Capital, Inc., 1989-1997; Vice President, 1982-1985, Principal, 1985-1987, Managing Director, 1987-1989, Morgan Stanley; Vice President, Investment Banking, 1980-1982, Associate, Investment Banking, 1976-1980, Dean Witter Reynolds, Inc. | 173 | Director, Valmont Industries, Inc. (irrigation systems manufacturer), since 2012; Trustee, Carleton College (on the Investment Committee), since 1987; Trustee, Carnegie Endowment for International Peace (on the Investment Committee), since 2009 |
| Natalie A. Trunow c/o Columbia Management Investment Advisers, LLC 290 Congress Street Boston, MA 02210 1967 | Trustee since 2020 | Chief Executive Officer, Millennial Portfolio Solutions LLC (asset management and consulting services), January 2016-January 2021; Non-executive Member of the Investment Committee and Valuation Committee, Sarona Asset Management Inc. (private equity firm) since September 2019; Advisor, Horizon Investments (asset management and consulting services), August 2018-January 2022; Advisor, Paradigm Asset Management, November 2016-January 2022; Consultant to Independent Trustees of CFVIT and CFST I from September 2016 to June 2020 with respect to CFVIT and to December 2020 with respect to CFST I; Director of Investments/Consultant, Casey Family Programs, April 2016-November 2016; Senior Vice President and Chief Investment Officer, Calvert Investments, August 2008-January 2016; Section Head and Portfolio Manager, General Motors Asset Management, June 1997-August 2008 | 171 | Independent Director, Investment Committee, Health Services for Children with Special Needs, Inc., 2010-2021; Independent Director, (Executive Committee and Chair, Audit Committee), Consumer Credit Counseling Services (formerly Guidewell Financial Solutions), since 2016; Independent Director, (Investment Committee), Sarona Asset Management, since 2019 |
| Columbia Pyrford International Stock Fund | Annual Report 2023 | 37 |
(Unaudited)
Independent trustees (continued)
| Name, address, year of birth | Position held with the Columbia Funds and length of service | Principal occupation(s) during past five years and other relevant professional experience | Number of Funds in the Columbia Funds Complex* overseen | Other directorships held by Trustee during the past five years and other relevant Board experience |
| Sandra L. Yeager c/o Columbia Management Investment Advisers, LLC 290 Congress Street Boston, MA 02210 1964 | Trustee since 2017 | Retired; President and founder, Hanoverian Capital, LLC (SEC registered investment advisor firm), 2008-2016; Managing Director, DuPont Capital, 2006-2008; Managing Director, Morgan Stanley Investment Management, 2004-2006; Senior Vice President, Alliance Bernstein, 1990-2004 | 173 | Former Director, NAPE (National Alliance for Partnerships in Equity) Education Foundation, October 2016-October 2020; Advisory Board, Jennersville YMCA, since 2022 |
| Name, address, year of birth | Position held with the Columbia Funds and length of service | Principal occupation(s) during the past five years and other relevant professional experience | Number of Funds in the Columbia Funds Complex* overseen | Other directorships held by Trustee during the past five years and other relevant Board experience |
| Daniel J. Beckman c/o Columbia Management Investment Advisers, LLC 290 Congress Street Boston, MA 02210 1962 | Trustee since November 2021 and President since June 2021 | Vice President – Head of North America Product, Columbia Management Investment Advisers, LLC, since April 2015; President and Principal Executive Officer of the Columbia Funds, since June 2021; officer of Columbia Funds and affiliated funds, 2020-2021 | 173 | Director, Ameriprise Trust Company, since October 2016; Director, Columbia Management Investment Distributors, Inc. since November 2018; Board of Governors, Columbia Wanger Asset Management, LLC since, January 2022; Director, Columbia Threadneedle Canada, Inc., since December 2022 |
| * | The term “Columbia Funds Complex” as used herein includes Columbia Seligman Premium Technology Growth Fund, Tri-Continental Corporation and each series of Columbia Funds Series Trust (CFST), Columbia Funds Series Trust I (CFST I), Columbia Funds Series Trust II (CFST II), Columbia ETF Trust I (CET I), Columbia ETF Trust II (CET II), Columbia Funds Variable Insurance Trust (CFVIT) and Columbia Funds Variable Series Trust II (CFVST II). Messrs. Batejan, Beckman, Gallagher and Hacker and Mses. Blatz, Carlton, Carrig, Flynn, Paglia, and Yeager serve as directors of Columbia Seligman Premium Technology Growth Fund and Tri-Continental Corporation. |
| ** | Interested person (as defined under the 1940 Act) by reason of being an officer, director, security holder and/or employee of the Investment Manager or Ameriprise Financial. |
| 38 | Columbia Pyrford International Stock Fund | Annual Report 2023 |
(Unaudited)
The Board has appointed officers who are responsible for day-to-day business decisions based on policies it has established. The officers serve at the pleasure of the Board. The following table provides basic information about the Officers of the Fund as of the printing of this report, including principal occupations during the past five years, although their specific titles may have varied over the period. In addition to Mr. Beckman, who is President and Principal Executive Officer, the Fund’s other officers are:
| Name, address and year of birth | Position and year first appointed to position for any Fund in the Columbia Funds Complex or a predecessor thereof | Principal occupation(s) during past five years |
| Michael G. Clarke 290 Congress Street Boston, MA 02210 1969 | Chief Financial Officer and Principal Financial Officer (2009) and Senior Vice President (2019) | Senior Vice President and North America Head of Operations & Investor Services, Columbia Management Investment Advisers, LLC, since June 2023 (previously Senior Vice President and Head of Global Operations, March 2022 – June 2023, Vice President, Head of North America Operations, and Co-Head of Global Operations, June 2019 - February 2022 and Vice President – Accounting and Tax, May 2010 - May 2019); senior officer of Columbia Funds and affiliated funds, since 2002. Director, Ameriprise Trust Company, since June 2023. |
| Joseph Beranek 5890 Ameriprise Financial Center Minneapolis, MN 55474 1965 | Treasurer and Chief Accounting Officer (Principal Accounting Officer) (2019) and Principal Financial Officer (2020), CFST, CFST I, CFST II, CFVIT and CFVST II; Assistant Treasurer, CET I and CET II | Vice President – Mutual Fund Accounting and Financial Reporting, Columbia Management Investment Advisers, LLC, since December 2018 and March 2017, respectively. |
| Marybeth Pilat 290 Congress Street Boston, MA 02210 1968 | Treasurer and Chief Accounting Officer (Principal Accounting Officer) and Principal Financial Officer (2020) for CET I and CET II; Assistant Treasurer, CFST, CFST I, CFST II, CFVIT and CFVST II | Vice President – Product Pricing and Administration, Columbia Management Investment Advisers, LLC, since May 2017. |
| William F. Truscott 290 Congress Street Boston, MA 02210 1960 | Senior Vice President (2001) | Formerly, Trustee/Director of Columbia Funds Complex or legacy funds, November 2001 - January 1, 2021; Chief Executive Officer, Global Asset Management, Ameriprise Financial, Inc., since September 2012; Chairman of the Board and President, Columbia Management Investment Advisers, LLC, since July 2004 and February 2012, respectively; Chairman of the Board and Chief Executive Officer, Columbia Management Investment Distributors, Inc., since November 2008 and February 2012, respectively; Chairman of the Board and Director, Threadneedle Asset Management Holdings, Sàrl, since March 2013 and December 2008, respectively; senior executive of various entities affiliated with Columbia Threadneedle. |
| Christopher O. Petersen 5228 Ameriprise Financial Center Minneapolis, MN 55474 1970 | Senior Vice President and Assistant Secretary (2021) | Formerly, Trustee/Director of funds within the Columbia Funds Complex, July 1, 2020 - November 22, 2021; Senior Vice President and Assistant General Counsel, Ameriprise Financial, Inc., since September 2021 (previously Vice President and Lead Chief Counsel, January 2015 - September 2021); formerly, President and Principal Executive Officer of the Columbia Funds, 2015 - 2021; officer of Columbia Funds and affiliated funds, since 2007. |
| Thomas P. McGuire 290 Congress Street Boston, MA 02210 1972 | Senior Vice President and Chief Compliance Officer (2012) | Vice President – Asset Management Compliance, Ameriprise Financial, Inc., since May 2010; Chief Compliance Officer, Columbia Acorn/Wanger Funds, since December 2015; formerly, Chief Compliance Officer, Ameriprise Certificate Company, September 2010 – September 2020. |
| Ryan C. Larrenaga 290 Congress Street Boston, MA 02210 1970 | Senior Vice President (2017), Chief Legal Officer (2017), and Secretary (2015) | Vice President and Chief Counsel, Ameriprise Financial, Inc., since August 2018 (previously Vice President and Group Counsel, August 2011 - August 2018); Chief Legal Officer, Columbia Acorn/Wanger Funds, since September 2020; officer of Columbia Funds and affiliated funds, since 2005. |
| Columbia Pyrford International Stock Fund | Annual Report 2023 | 39 |
(Unaudited)
Fund officers (continued)
| Name, address and year of birth | Position and year first appointed to position for any Fund in the Columbia Funds Complex or a predecessor thereof | Principal occupation(s) during past five years |
| Michael E. DeFao 290 Congress Street Boston, MA 02210 1968 | Vice President (2011) and Assistant Secretary (2010) | Vice President and Chief Counsel, Ameriprise Financial, Inc., since May 2010; Vice President, Chief Legal Officer and Assistant Secretary, Columbia Management Investment Advisers, LLC, since October 2021 (previously Vice President and Assistant Secretary, May 2010 – September 2021). |
| Lyn Kephart-Strong 5903 Ameriprise Financial Center Minneapolis, MN 55474 1960 | Vice President (2015) | Vice President, Global Investment Operations Services, Columbia Management Investment Advisers, LLC, since 2010; Director (since January 2007) and President (since October 2014), Columbia Management Investment Services Corp.; Director (since December 2017) and President (since January 2017), Ameriprise Trust Company. |
| • | the Fund had sufficient liquidity to both meet redemptions and operate effectively on behalf of shareholders; |
| • | there were no material changes to the Program during the period; |
| • | the implementation of the Program was effective to manage the Fund’s liquidity risk; and |
| • | the Program operated adequately during the period. |
| 40 | Columbia Pyrford International Stock Fund | Annual Report 2023 |
| • | Information on the investment performance of the Fund relative to the performance of a group of mutual funds determined to be comparable to the Fund by Broadridge, as well as performance relative to one or more benchmarks; |
| • | Information on the Fund’s management fees and total expenses, including information comparing the Fund’s expenses to those of a group of comparable mutual funds, as determined by Broadridge; |
| • | The Investment Manager’s agreement to contractually limit or cap total operating expenses for the Fund so that total operating expenses (excluding certain fees and expenses, such as transaction costs and certain other investment related expenses, interest, taxes, acquired fund fees and expenses and infrequent and/or unusual expenses) would not exceed a specified annual rate, as a percentage of the Fund’s net assets; |
| • | Terms of the Advisory Agreements; |
| • | Subadvisory fees payable by the Investment Manager under the Subadvisory Agreement; |
| • | Descriptions of other agreements and arrangements with affiliates of the Investment Manager relating to the operations of the Fund, including agreements with respect to the provision of transfer agency and shareholder services to the Fund; |
| • | Descriptions of various services performed by the Investment Manager and the Subadviser under the Advisory Agreements, including portfolio management and portfolio trading practices; |
| • | Information regarding any recently negotiated management fees of similarly-managed portfolios of other institutional clients of the Investment Manager; |
| Columbia Pyrford International Stock Fund | Annual Report 2023 | 41 |
| • | Information regarding the resources of the Investment Manager and the Subadviser, including information regarding senior management, portfolio managers and other personnel; |
| • | Information regarding the capabilities of the Investment Manager and the Subadviser with respect to compliance monitoring services; |
| • | The profitability to the Investment Manager and its affiliates from their relationships with the Fund; and |
| • | Report provided by the Board’s independent fee consultant, JDL Consultants, LLC (JDL). |
| 42 | Columbia Pyrford International Stock Fund | Annual Report 2023 |
| Columbia Pyrford International Stock Fund | Annual Report 2023 | 43 |
| 44 | Columbia Pyrford International Stock Fund | Annual Report 2023 |
columbiathreadneedleus.com/investor/. The Fund is distributed by Columbia Management Investment Distributors, Inc., member FINRA, and managed by Columbia Management Investment Advisers, LLC.
Item 2. Code of Ethics.
(a) | The registrant has adopted a code of ethics that applies to the registrant’s principal executive officer, principal financial officer, principal accounting officer or controller, or persons performing similar functions, regardless of whether these individuals are employed by the registrant or a third party. |
(b) | During the period covered by this report, there were not any amendments to a provision of the code of ethics that applies to the registrant’s principal executive officer, principal financial officer, principal accounting officer or controller, or persons performing similar functions, regardless of whether these individuals are employed by the registrant or a third party, and that relates to any element of the code of ethics definition enumerated in paragraph (b) of this Item. |
(c) | During the period covered by this report, there were no waivers, including any implicit waivers, from a provision of the code of ethics to the registrant’s principal executive officer, principal financial officer, principal accounting officer or controller, or persons performing similar functions, regardless of whether these individuals are employed by the registrant or a third party that relates to one or more of the items set forth in paragraph (b) of this Item. |
Item 3. Audit Committee Financial Expert.
The registrant’s Board of Trustees has determined that David M. Moffett, Brian J. Gallagher, J. Kevin Connaughton, Sandra L. Yeager, and Douglas A. Hacker, each of whom are members of the registrant’s Board of Trustees and Audit Committee, each qualify as an audit committee financial expert. Mr. Moffett, Mr. Gallagher, Mr. Connaughton, Ms. Yeager, and Mr. Hacker are each independent trustees, as defined in paragraph (a)(2) of this item’s instructions.
Item 4. Principal Accountant Fees and Services.
Fee information below is disclosed for the six series of the registrant whose reports to stockholders are included in this annual filing.
(a) Audit Fees. Aggregate Audit Fees billed by the principal accountant for professional services rendered during the fiscal years ended August 31, 2023 and August 31, 2022 are approximately as follows:
2023 | 2022 |
$180,500 | $29,500 |
Audit Fees include amounts related to the audit of the registrant’s annual financial statements or services that are normally provided by the accountant in connection with statutory and regulatory filings or engagements for those fiscal years.
(b) Audit-Related Fees. Aggregate Audit-Related Fees billed to the registrant by the principal accountant for professional services rendered during the fiscal years ended August 31, 2023 and August 31, 2022 are approximately as follows:
2023 | 2022 |
$0 | $0 |
Audit-Related Fees, if any, include amounts for assurance and related services by the principal accountant that are reasonably related to the performance of the audit of the registrant’s financial statements and are not reported in Audit Fees above.
During the fiscal years ended August 31, 2023 and August 31, 2022, there were no Audit-Related Fees billed by the registrant’s principal accountant to the registrant’s investment adviser (not including any sub-adviser whose role is primarily portfolio management and is subcontracted with or overseen by another investment adviser) and any entity controlling, controlled by, or under common control with the adviser that provides ongoing services to the registrant for an engagement that related directly to the operations and financial reporting of the registrant.
(c) Tax Fees. Aggregate Tax Fees billed by the principal accountant to the registrant for professional services rendered during the fiscal years ended August 31, 2023 and August 31, 2022 are approximately as follows:
2023 | 2022 |
$78,000 | $91,000 |
Tax Fees include amounts for the review of annual tax returns, the review of required shareholder distribution calculations and typically include amounts for professional services by the principal accountant for tax compliance, tax advice and tax planning. Fiscal Years 2023 and 2022 also include Tax Fees for foreign tax filings.
During the fiscal years ended August 31, 2023 and August 31, 2022, there were no Tax Fees billed by the registrant’s principal accountant to the registrant’s investment adviser (not including any sub-adviser whose role is primarily portfolio management and is subcontracted with or overseen by another investment adviser) and any entity controlling, controlled by, or under common control with the adviser that provides ongoing services to the registrant for an engagement that related directly to the operations and financial reporting of the registrant.
(d) All Other Fees. Aggregate All Other Fees billed by the principal accountant to the registrant for professional services rendered during the fiscal years ended August 31, 2023 and August 31, 2022 are approximately as follows:
2023 | 2022 |
$0 | $0 |
All Other Fees, if any, include amounts for products and services provided by the principal accountant, other than the services reported in paragraphs (a) through (c) above.
Aggregate All Other Fees billed by the registrant’s principal accountant to the registrant’s investment adviser (not including any sub-adviser whose role is primarily portfolio management and is subcontracted with or overseen by another investment adviser) and any entity controlling, controlled by, or under common control with the adviser that provides ongoing services to the registrant for an engagement that related directly to the operations and financial reporting of the registrant during the fiscal years ended August 31, 2023 and August 31, 2022 are approximately as follows:
2023 | 2022 |
$557,000 | $535,000 |
In fiscal years 2023 and 2022, All Other Fees primarily consists of fees billed for internal control examinations of the registrant’s transfer agent and investment adviser.
(e)(1) Audit Committee Pre-Approval Policies and Procedures
The registrant’s Audit Committee is required to pre-approve the engagement of the registrant’s independent auditors to provide audit and non-audit services to the registrant and non-audit services to its investment adviser (excluding any sub-adviser whose role is primarily portfolio management and is sub-contracted or overseen by another investment adviser (the “Adviser”) or any entity controlling, controlled by or under common control with the Adviser that provides ongoing services to the Fund (a “Control Affiliate”) if the engagement relates directly to the operations and financial reporting of the registrant.
The Audit Committee has adopted a Policy for Engagement of Independent Auditors for Audit and Non-Audit Services (the “Policy”). The Policy sets forth the understanding of the Audit Committee regarding the engagement of the registrant’s independent accountants to provide (i) audit and permissible audit-related, tax and other services to the registrant (“Fund Services”); (ii) non-audit services to the registrant’s Adviser and any Control Affiliates, that relates directly to the operations and financial reporting of a Fund (“Fund-related Adviser Services”); and (iii) certain other audit and non-audit services to the registrant’s Adviser and its Control Affiliates. A service will require specific pre-approval by the Audit Committee if it is to be provided by the Fund’s independent auditor; provided, however, that pre-approval of non-audit services to the Fund, the Adviser or Control Affiliates may be waived if certain de minimis requirements set forth in the SEC’s rules are met.
Under the Policy, the Audit Committee may delegate pre-approval authority to any pre-designated member or members who are independent board members. The member(s) to whom such authority is delegated must report, for informational purposes only, any pre-approval decisions to the Audit Committee at its next regular meeting. The Audit Committee's responsibilities with respect to the pre-approval of services performed by the independent auditor may not be delegated to management.
On an annual basis, at a regularly scheduled Audit Committee meeting, the Fund’s Treasurer or other Fund officer shall submit to the Audit Committee a schedule of the types of Fund Services and Fund-related Adviser Services that are subject to specific pre-approval. This schedule will provide a description of each type of service that is subject to specific pre-approval, along with total projected fees for each service. The pre-approval will generally cover a one-year period. The Audit Committee will review and approve the types of services and the projected fees for the next one-year period and may add to, or subtract from, the list of pre-approved services from time to time, based on subsequent determinations. This specific approval acknowledges that the Audit Committee is in agreement with the specific types of services that the independent auditor will be permitted to perform and the projected fees for each service.
The Fund’s Treasurer or other Fund officer shall report to the Audit Committee at each of its regular meetings regarding all Fund Services or Fund-related Adviser Services provided since the last such report was rendered, including a description of the services, by category, with forecasted fees for the annual reporting period, proposed changes requiring specific pre-approval and a description of services provided by the independent auditor, by category, with actual fees during the current reporting period.
*****
(e)(2) None, or 0%, of the Audit-Related Fees, Tax Fees and All Other Fees paid by the Fund or affiliated entities relating directly to the operations and financial reporting of the Registrant disclosed above were approved by the audit committee pursuant to paragraphs (c)(7)(i)(C) of Rule 2-01 of Regulation S-X (which permits audit committee approval after the start of the engagement with respect to services other than audit, review or attest services, if certain conditions are satisfied).
(f) Not applicable.
(g) The aggregate non-audit fees billed by the registrant’s accountant for services rendered to the registrant, and rendered to the registrant’s investment adviser (not including any sub-adviser whose role is primarily portfolio management and is subcontracted with or overseen by another investment adviser), and any entity controlling, controlled by, or under common control with the adviser that provides ongoing services to the registrant for the fiscal years ended August 31, 2023 and August 31, 2022 are approximately as follows:
2023 | 2022 |
$635,000 | $626,000 |
(h) The registrant’s Audit Committee of the Board of Directors has considered whether the provision of non-audit services that were rendered to the registrant’s adviser (not including any sub-adviser whose role is primarily portfolio management and is subcontracted with or overseen by another investment adviser), and any entity controlling, controlled by, or under common control with the investment adviser that provides ongoing services to the registrant that were not pre-approved pursuant to paragraph (c)(7)(ii) of Rule 2-01 of Regulation S-X, is compatible with maintaining the principal accountant’s independence.
Item 5. Audit Committee of Listed Registrants.
Not applicable.
Item 6. Investments
(a) | The registrant’s “Schedule I – Investments in securities of unaffiliated issuers” (as set forth in 17 CFR 210.12-12) is included in Item 1 of this Form N-CSR. |
(b) | Not applicable. |
Item 7. Disclosure of Proxy Voting Policies and Procedures for Closed-End Management Investment Companies.
Not applicable.
Item 8. Portfolio Managers of Closed-End Management Investment Companies.
Not applicable.
Item 9. Purchases of Equity Securities by Closed-End Management Investment Company and Affiliated Purchasers.
Not applicable.
Item 10. Submission of Matters to a Vote of Security Holders.
There were no material changes to the procedures by which shareholders may recommend nominees to the registrant's board of directors.
Item 11. Controls and Procedures.
(a) | The registrant’s principal executive officer and principal financial officer, based on their evaluation of the registrant’s disclosure controls and procedures as of a date within 90 days of the filing of this report, have concluded that such controls and procedures are adequately designed to ensure that information required to be disclosed by the registrant in Form N-CSR is accumulated and communicated to the registrant’s management, including the principal executive officer and principal financial officer, or persons performing similar functions, as appropriate to allow timely decisions regarding required disclosure. |
(b) | There was no change in the registrant's internal control over financial reporting that occurred during the period covered by this report that has materially affected, or is reasonably likely to materially affect, the registrant's internal control over financial reporting. |
Item 12. Disclosure of Securities Lending Activities for Closed-End Management Investment Companies
Not applicable.
Item 13. Exhibits.
(a)(3) Not applicable.
(a)(4) Change in Independent Registered Public Accounting Firm
SIGNATURES
Pursuant to the requirements of the Securities Exchange Act of 1934 and the Investment Company Act of 1940, the registrant has duly caused this report to be signed on its behalf by the undersigned, thereunto duly authorized.
(registrant) | Columbia Funds Series Trust II |
|
|
By (Signature and Title) | /s/ Daniel J. Beckman |
| Daniel J. Beckman, President and Principal Executive Officer |
|
|
Date | October 23, 2023 |
|
|
|
|
Pursuant to the requirements of the Securities Exchange Act of 1934 and the Investment Company Act of 1940, this report has been signed below by the following persons on behalf of the registrant and in the capacities and on the dates indicated.
By (Signature and Title) | /s/ Daniel J. Beckman |
| Daniel J. Beckman, President and Principal Executive Officer |
|
|
Date | October 23, 2023 |
By (Signature and Title) | /s/ Michael G. Clarke |
| Michael G. Clarke, Chief Financial Officer, |
| Principal Financial Officer and Senior Vice President |
|
|
Date | October 23, 2023 |
By (Signature and Title) | /s/ Joseph Beranek |
| Joseph Beranek, Treasurer, Chief Accounting |
| Officer and Principal Financial Officer |
|
|
Date | October 23, 2023 |