UNITED STATES
SECURITIES AND EXCHANGE COMMISSION
Washington, D.C. 20549
FORM N-CSR
CERTIFIED SHAREHOLDER REPORT OF REGISTERED MANAGEMENT INVESTMENT COMPANIES
Investment Company Act file number 811-21852
Columbia Funds Series Trust II
(Exact name of registrant as specified in charter)
290 Congress Street
Boston, MA 02210
(Address of principal executive offices) (Zip code)
Daniel J. Beckman
c/o Columbia Management Investment Advisers, LLC
290 Congress Street
Boston, MA 02210
Ryan C. Larrenaga, Esq.
c/o Columbia Management Investment Advisers, LLC
290 Congress Street
Boston, MA 02210
(Name and address of agent for service)
Registrant's telephone number, including area code: (800) 345-6611
Date of fiscal year end: February 28
Date of reporting period: February 28, 2023
Form N-CSR is to be used by management investment companies to file reports with the Commission not later than 10 days after the transmission to stockholders of any report that is required to be transmitted to stockholders under Rule 30e-1 under the Investment Company Act of 1940 (17 CFR 270.30e-1). The Commission may use the information provided on Form N-CSR in its regulatory, disclosure review, inspection, and policymaking roles.
A registrant is required to disclose the information specified by Form N-CSR, and the Commission will make this information public. A registrant is not required to respond to the collection of information contained in Form N-CSR unless the Form displays a currently valid Office of Management and Budget ("OMB") control number. Please direct comments concerning the accuracy of the information collection burden estimate and any suggestions for reducing the burden to Secretary, Securities and Exchange Commission, 100 F Street, NE, Washington, DC 20549. The OMB has reviewed this collection of information under the clearance requirements of 44 U.S.C. § 3507.
Item 1. Reports to Stockholders.

February 28, 2023

| 3 | |
| 5 | |
| 7 | |
| 8 | |
| 13 | |
| 15 | |
| 16 | |
| 18 | |
| 22 | |
| 35 | |
| 36 | |
| 36 |
(Unaudited)
| Average annual total returns (%) (for the period ended February 28, 2023) | |||||
| Inception | 1 Year | 5 Years | 10 Years | ||
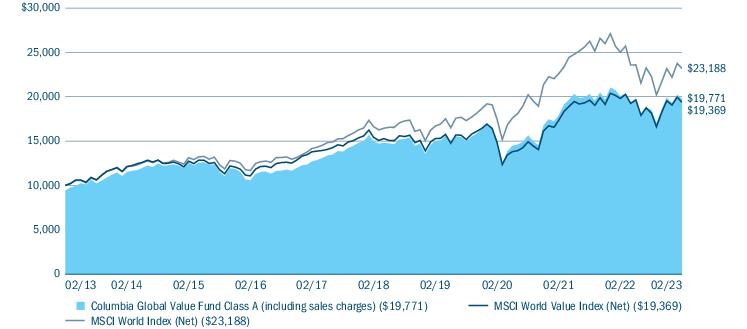
| Class A | Excluding sales charges | 03/20/95 | -1.40 | 5.77 | 7.69 |
| Including sales charges | -7.09 | 4.52 | 7.05 | ||
| Advisor Class | 12/11/06 | -1.21 | 6.03 | 7.96 | |
| Class C | Excluding sales charges | 06/26/00 | -2.13 | 4.97 | 6.88 |
| Including sales charges | -3.04 | 4.97 | 6.88 | ||
| Institutional Class | 09/27/10 | -1.22 | 6.03 | 7.95 | |
| Institutional 2 Class | 12/11/06 | -1.06 | 6.12 | 8.05 | |
| Institutional 3 Class | 02/28/13 | -1.05 | 6.17 | 8.12 | |
| Class R | 12/11/06 | -1.74 | 5.51 | 7.42 | |
| MSCI World Value Index (Net) | -2.21 | 4.67 | 6.83 | ||
| MSCI World Index (Net) | -7.33 | 6.88 | 8.77 | ||
| Columbia Global Value Fund | Annual Report 2023 | 3 |
(Unaudited)
| Equity sector breakdown (%) (at February 28, 2023) | |
| Communication Services | 5.2 |
| Consumer Discretionary | 4.9 |
| Consumer Staples | 12.2 |
| Energy | 11.4 |
| Financials | 21.0 |
| Health Care | 14.8 |
| Industrials | 10.8 |
| Information Technology | 9.9 |
| Materials | 2.5 |
| Real Estate | 2.7 |
| Utilities | 4.6 |
| Total | 100.0 |
| Country breakdown (%) (at February 28, 2023) | |
| Australia | 1.5 |
| Canada | 3.1 |
| Finland | 1.0 |
| France | 4.4 |
| Hong Kong | 0.9 |
| Japan | 7.0 |
| Netherlands | 3.9 |
| Puerto Rico | 0.7 |
| Russian Federation | 0.0 |
| Singapore | 2.0 |
| South Korea | 1.6 |
| Spain | 0.6 |
| United Kingdom | 6.8 |
| United States(a) | 66.5 |
| Total | 100.0 |
| (a) | Includes investments in Money Market Funds. |
| 4 | Columbia Global Value Fund | Annual Report 2023 |
(Unaudited)
| • | The Fund’s outperformance of its primary benchmark during the period was largely a result of strong stock selection within the financials and energy sectors as well as within Canada and France. |
| • | From an allocation perspective, an overweight to energy and an underweight to real estate helped relative results, as did overweights to the United Kingdom, France and Singapore. |
| • | The Fund’s holdings in BP PLC (United Kingdom), Alimentation Couche-Tard, Inc. (Canada), AXA SA (France), TP Icap Group PLC (United Kingdom) and Johnson & Johnson (United States) were top contributors to performance versus the primary benchmark during the period. |
| Columbia Global Value Fund | Annual Report 2023 | 5 |
(Unaudited)
| • | Security selection within the consumer discretionary and communication services sectors detracted from relative results, as did selection within the U.S. |
| • | The Fund’s holdings in Vodafone Group PLC (United Kingdom), Target Corp. (United States), Merck & Co., Inc. (United States), Charles Schwab Corp. (United States) and AT& T, Inc. (United States) detracted from relative results versus the primary benchmark during the period. The Fund sold its position in Charles Schwab early in the period. |
| 6 | Columbia Global Value Fund | Annual Report 2023 |
(Unaudited)
| September 1, 2022 — February 28, 2023 | |||||||
| Account value at the beginning of the period ($) | Account value at the end of the period ($) | Expenses paid during the period ($) | Fund’s annualized expense ratio (%) | ||||
| Actual | Hypothetical | Actual | Hypothetical | Actual | Hypothetical | Actual | |
| Class A | 1,000.00 | 1,000.00 | 1,068.40 | 1,019.14 | 5.85 | 5.71 | 1.14 |
| Advisor Class | 1,000.00 | 1,000.00 | 1,069.20 | 1,020.38 | 4.57 | 4.46 | 0.89 |
| Class C | 1,000.00 | 1,000.00 | 1,064.80 | 1,015.42 | 9.68 | 9.44 | 1.89 |
| Institutional Class | 1,000.00 | 1,000.00 | 1,069.50 | 1,020.38 | 4.57 | 4.46 | 0.89 |
| Institutional 2 Class | 1,000.00 | 1,000.00 | 1,070.20 | 1,020.73 | 4.21 | 4.11 | 0.82 |
| Institutional 3 Class | 1,000.00 | 1,000.00 | 1,070.40 | 1,020.93 | 4.00 | 3.91 | 0.78 |
| Class R | 1,000.00 | 1,000.00 | 1,066.40 | 1,017.90 | 7.12 | 6.95 | 1.39 |
| Columbia Global Value Fund | Annual Report 2023 | 7 |
February 28, 2023
| Common Stocks 96.9% | ||
| Issuer | Shares | Value ($) |
| Australia 1.5% | ||
| Northern Star Resources Ltd. | 1,712,999 | 11,955,582 |
| Canada 3.0% | ||
| Alimentation Couche-Tard, Inc. | 307,208 | 14,411,421 |
| Cameco Corp. | 377,336 | 10,316,366 |
| Total | 24,727,787 | |
| Finland 1.0% | ||
| UPM-Kymmene OYJ | 219,534 | 7,955,134 |
| France 4.4% | ||
| AXA SA | 560,848 | 17,673,157 |
| BNP Paribas SA | 260,950 | 18,243,325 |
| Total | 35,916,482 | |
| Hong Kong 0.9% | ||
| WH Group Ltd. | 12,771,593 | 7,432,160 |
| Japan 7.0% | ||
| Daiwabo Holdings Co., Ltd. | 670,800 | 10,366,292 |
| ITOCHU Corp. | 491,200 | 14,682,309 |
| ORIX Corp. | 809,201 | 14,503,314 |
| Takeda Pharmaceutical Co., Ltd. | 558,328 | 17,210,070 |
| Total | 56,761,985 | |
| Netherlands 3.9% | ||
| ING Groep NV | 1,047,186 | 14,655,494 |
| Shell PLC | 571,099 | 17,297,665 |
| Total | 31,953,159 | |
| Puerto Rico 0.7% | ||
| Popular, Inc. | 81,657 | 5,830,310 |
| Russian Federation —% | ||
| Lukoil PJSC(a),(b),(c) | 48,225 | — |
| Singapore 2.0% | ||
| BW LPG Ltd. | 493,939 | 4,320,895 |
| Venture Corp., Ltd. | 917,200 | 11,680,189 |
| Total | 16,001,084 | |
| Common Stocks (continued) | ||
| Issuer | Shares | Value ($) |
| South Korea 1.6% | ||
| Hyundai Home Shopping Network Corp. | 77,381 | 3,012,690 |
| Youngone Corp.(d) | 299,871 | 9,655,179 |
| Total | 12,667,869 | |
| Spain 0.5% | ||
| Endesa SA | 228,099 | 4,473,028 |
| United Kingdom 6.8% | ||
| BP PLC, ADR | 361,865 | 14,329,854 |
| BT Group PLC | 3,420,543 | 5,734,396 |
| DCC PLC | 74,928 | 4,161,244 |
| John Wood Group PLC(d) | 1,071,007 | 2,517,822 |
| Just Group PLC | 6,205,213 | 6,530,948 |
| TP Icap Group PLC | 4,361,487 | 10,125,194 |
| Vodafone Group PLC | 9,793,118 | 11,726,031 |
| Total | 55,125,489 | |
| United States 63.6% | ||
| AbbVie, Inc. | 121,999 | 18,775,646 |
| Ameren Corp. | 207,352 | 17,150,084 |
| American Electric Power Co., Inc. | 168,531 | 14,825,672 |
| American Homes 4 Rent, Class A | 292,781 | 9,082,067 |
| AT&T, Inc. | 754,685 | 14,271,093 |
| Bank of America Corp. | 573,534 | 19,672,216 |
| Boston Scientific Corp.(d) | 253,603 | 11,848,332 |
| Broadcom, Inc. | 26,920 | 15,998,287 |
| Cigna Corp. (The) | 40,514 | 11,834,139 |
| Cisco Systems, Inc. | 352,265 | 17,056,671 |
| Coca-Cola Co. (The) | 267,182 | 15,900,001 |
| Discover Financial Services | 112,258 | 12,572,896 |
| Electronic Arts, Inc. | 86,006 | 9,541,506 |
| Elevance Health, Inc. | 16,925 | 7,949,165 |
| Eli Lilly & Co. | 25,376 | 7,897,519 |
| EOG Resources, Inc. | 110,317 | 12,468,027 |
| Exxon Mobil Corp. | 259,304 | 28,500,103 |
| Hershey Co. (The) | 51,250 | 12,213,900 |
| Hilton Worldwide Holdings, Inc. | 45,725 | 6,607,720 |
| Home Depot, Inc. (The) | 28,670 | 8,501,802 |
| 8 | Columbia Global Value Fund | Annual Report 2023 |
February 28, 2023
| Common Stocks (continued) | ||
| Issuer | Shares | Value ($) |
| Jazz Pharmaceuticals PLC(d) | 71,328 | 10,014,451 |
| Las Vegas Sands Corp.(d) | 187,771 | 10,791,199 |
| MasTec, Inc.(d) | 112,833 | 11,026,041 |
| Merck & Co., Inc. | 172,640 | 18,341,274 |
| MetLife, Inc. | 235,831 | 16,916,158 |
| Morgan Stanley | 189,032 | 18,241,588 |
| Primo Water Corp. | 402,572 | 6,231,814 |
| Procter & Gamble Co. (The) | 160,440 | 22,070,126 |
| Prologis, Inc. | 96,416 | 11,897,734 |
| QUALCOMM, Inc. | 88,954 | 10,988,488 |
| Quotient Ltd.(d) | 12,226 | 581 |
| Raytheon Technologies Corp. | 147,715 | 14,489,364 |
| Republic Services, Inc. | 109,017 | 14,055,562 |
| S&P Global, Inc. | 31,234 | 10,657,041 |
| TE Connectivity Ltd. | 95,583 | 12,169,627 |
| Trane Technologies PLC | 74,307 | 13,744,566 |
| Union Pacific Corp. | 62,542 | 12,963,706 |
| Walmart, Inc. | 125,592 | 17,850,391 |
| Common Stocks (continued) | ||
| Issuer | Shares | Value ($) |
| Zoetis, Inc. | 74,714 | 12,477,238 |
| Total | 517,593,795 | |
| Total Common Stocks (Cost $712,358,941) | 788,393,864 | |
| Exchange-Traded Equity Funds 2.0% | ||
| Shares | Value ($) | |
| United States 2.0% | ||
| iShares Russell 1000 Value ETF | 104,920 | 16,139,844 |
| Total Exchange-Traded Equity Funds (Cost $16,292,106) | 16,139,844 | |
| Money Market Funds 0.6% | ||
| Columbia Short-Term Cash Fund, 4.748%(e),(f) | 4,892,819 | 4,890,862 |
| Total Money Market Funds (Cost $4,890,511) | 4,890,862 | |
| Total Investments in Securities (Cost $733,541,558) | 809,424,570 | |
| Other Assets & Liabilities, Net | 4,207,675 | |
| Net Assets | $813,632,245 | |
| Forward foreign currency exchange contracts | |||||
| Currency to be sold | Currency to be purchased | Counterparty | Settlement date | Unrealized appreciation ($) | Unrealized depreciation ($) |
| 7,058,000 AUD | 4,890,800 USD | Morgan Stanley | 03/09/2023 | 140,171 | — |
| 5,256,000 CHF | 5,671,156 USD | Morgan Stanley | 03/09/2023 | 86,057 | — |
| 2,257,000 EUR | 2,438,515 USD | Morgan Stanley | 03/09/2023 | 50,217 | — |
| 1,371,000 GBP | 1,648,898 USD | Morgan Stanley | 03/09/2023 | — | (433) |
| 2,461,384,000 JPY | 18,976,996 USD | Morgan Stanley | 03/09/2023 | 880,239 | — |
| 17,197,813,000 KRW | 13,835,730 USD | Morgan Stanley | 03/09/2023 | 830,469 | — |
| 74,462,000 NOK | 7,364,127 USD | Morgan Stanley | 03/09/2023 | 191,050 | — |
| 61,242,000 SEK | 5,787,505 USD | Morgan Stanley | 03/09/2023 | — | (65,182) |
| 4,325,000 SGD | 3,263,616 USD | Morgan Stanley | 03/09/2023 | 55,636 | — |
| 2,475,843 USD | 3,572,000 AUD | Morgan Stanley | 03/09/2023 | — | (71,586) |
| 25,287,595 USD | 33,926,000 CAD | Morgan Stanley | 03/09/2023 | — | (422,616) |
| 1,656,096 USD | 1,371,000 GBP | Morgan Stanley | 03/09/2023 | — | (6,765) |
| 1,642,182 USD | 210,150,000 JPY | Morgan Stanley | 03/09/2023 | — | (97,103) |
| 13,012,287 USD | 20,469,000 NZD | Morgan Stanley | 03/09/2023 | — | (356,161) |
| 8,163,017 USD | 84,637,000 SEK | Morgan Stanley | 03/09/2023 | — | (74,550) |
| 3,272,202 USD | 4,325,000 SGD | Morgan Stanley | 03/09/2023 | — | (64,221) |
| Total | 2,233,839 | (1,158,617) | |||
| Columbia Global Value Fund | Annual Report 2023 | 9 |
February 28, 2023
| (a) | Represents fair value as determined in good faith under procedures approved by the Board of Trustees. At February 28, 2023, the total value of these securities amounted to $0, which represents less than 0.01% of total net assets. |
| (b) | Denotes a restricted security, which is subject to legal or contractual restrictions on resale under federal securities laws. Disposal of a restricted investment may involve time-consuming negotiations and expenses, and prompt sale at an acceptable price may be difficult to achieve. Private placement securities are generally considered to be restricted, although certain of those securities may be traded between qualified institutional investors under the provisions of Section 4(a)(2) and Rule 144A. The Fund will not incur any registration costs upon such a trade. These securities are valued at fair value determined in good faith under consistently applied procedures approved by the Fund’s Board of Trustees. At February 28, 2023, the total market value of these securities amounted to $0, which represents less than 0.01% of total net assets. Additional information on these securities is as follows: |
| Security | Acquisition Dates | Shares | Cost ($) | Value ($) |
| Lukoil PJSC | 01/27/2022 | 48,225 | 4,239,605 | — |
| (c) | Valuation based on significant unobservable inputs. |
| (d) | Non-income producing investment. |
| (e) | The rate shown is the seven-day current annualized yield at February 28, 2023. |
| (f) | As defined in the Investment Company Act of 1940, as amended, an affiliated company is one in which the Fund owns 5% or more of the company’s outstanding voting securities, or a company which is under common ownership or control with the Fund. The value of the holdings and transactions in these affiliated companies during the year ended February 28, 2023 are as follows: |
| Affiliated issuers | Beginning of period($) | Purchases($) | Sales($) | Net change in unrealized appreciation (depreciation)($) | End of period($) | Realized gain (loss)($) | Dividends($) | End of period shares |
| Columbia Short-Term Cash Fund, 4.748% | ||||||||
| 11,225,219 | 97,195,597 | (103,530,501) | 547 | 4,890,862 | (1,595) | 165,089 | 4,892,819 | |
| ADR | American Depositary Receipt |
| AUD | Australian Dollar |
| CAD | Canada Dollar |
| CHF | Swiss Franc |
| EUR | Euro |
| GBP | British Pound |
| JPY | Japanese Yen |
| KRW | South Korean Won |
| NOK | Norwegian Krone |
| NZD | New Zealand Dollar |
| SEK | Swedish Krona |
| SGD | Singapore Dollar |
| USD | US Dollar |
| ■ | Level 1 — Valuations based on quoted prices for investments in active markets that the Fund has the ability to access at the measurement date. Valuation adjustments are not applied to Level 1 investments. |
| 10 | Columbia Global Value Fund | Annual Report 2023 |
February 28, 2023
| ■ | Level 2 — Valuations based on other significant observable inputs (including quoted prices for similar securities, interest rates, prepayment speeds, credit risks, etc.). |
| ■ | Level 3 — Valuations based on significant unobservable inputs (including the Fund’s own assumptions and judgment in determining the fair value of investments). |
| Level 1 ($) | Level 2 ($) | Level 3 ($) | Total ($) | |
| Investments in Securities | ||||
| Common Stocks | ||||
| Australia | — | 11,955,582 | — | 11,955,582 |
| Canada | 24,727,787 | — | — | 24,727,787 |
| Finland | — | 7,955,134 | — | 7,955,134 |
| France | — | 35,916,482 | — | 35,916,482 |
| Hong Kong | — | 7,432,160 | — | 7,432,160 |
| Japan | — | 56,761,985 | — | 56,761,985 |
| Netherlands | — | 31,953,159 | — | 31,953,159 |
| Puerto Rico | 5,830,310 | — | — | 5,830,310 |
| Russian Federation | — | — | 0* | 0* |
| Singapore | — | 16,001,084 | — | 16,001,084 |
| South Korea | — | 12,667,869 | — | 12,667,869 |
| Spain | — | 4,473,028 | — | 4,473,028 |
| United Kingdom | 14,329,854 | 40,795,635 | — | 55,125,489 |
| United States | 517,593,214 | 581 | — | 517,593,795 |
| Total Common Stocks | 562,481,165 | 225,912,699 | 0* | 788,393,864 |
| Exchange-Traded Equity Funds | 16,139,844 | — | — | 16,139,844 |
| Money Market Funds | 4,890,862 | — | — | 4,890,862 |
| Total Investments in Securities | 583,511,871 | 225,912,699 | 0* | 809,424,570 |
| Investments in Derivatives | ||||
| Asset | ||||
| Forward Foreign Currency Exchange Contracts | — | 2,233,839 | — | 2,233,839 |
| Liability | ||||
| Forward Foreign Currency Exchange Contracts | — | (1,158,617) | — | (1,158,617) |
| Total | 583,511,871 | 226,987,921 | 0* | 810,499,792 |
| * | Rounds to zero. |
| Columbia Global Value Fund | Annual Report 2023 | 11 |
February 28, 2023
The Fund’s assets assigned to the Level 2 input category are generally valued using the market approach, in which a security’s value is determined through reference to prices and information from market transactions for similar or identical assets. These assets include certain foreign securities for which a third party statistical pricing service may be employed for purposes of fair market valuation. The model utilized by such third party statistical pricing service takes into account a security’s correlation to available market data including, but not limited to, intraday index, ADR, and exchange-traded fund movements.
| 12 | Columbia Global Value Fund | Annual Report 2023 |
February 28, 2023
| Assets | |
| Investments in securities, at value | |
| Unaffiliated issuers (cost $728,651,047) | $804,533,708 |
| Affiliated issuers (cost $4,890,511) | 4,890,862 |
| Cash | 20,574 |
| Unrealized appreciation on forward foreign currency exchange contracts | 2,233,839 |
| Receivable for: | |
| Investments sold | 1,639,962 |
| Capital shares sold | 306,939 |
| Dividends | 1,642,555 |
| Foreign tax reclaims | 569,401 |
| Prepaid expenses | 9,812 |
| Trustees’ deferred compensation plan | 87,151 |
| Total assets | 815,934,803 |
| Liabilities | |
| Foreign currency (cost $20,574) | 20,385 |
| Unrealized depreciation on forward foreign currency exchange contracts | 1,158,617 |
| Payable for: | |
| Capital shares purchased | 613,467 |
| Management services fees | 15,685 |
| Distribution and/or service fees | 4,683 |
| Transfer agent fees | 68,625 |
| Compensation of board members | 268,237 |
| Compensation of chief compliance officer | 157 |
| Other expenses | 65,551 |
| Trustees’ deferred compensation plan | 87,151 |
| Total liabilities | 2,302,558 |
| Net assets applicable to outstanding capital stock | $813,632,245 |
| Represented by | |
| Paid in capital | 775,891,615 |
| Total distributable earnings (loss) | 37,740,630 |
| Total - representing net assets applicable to outstanding capital stock | $813,632,245 |
| Columbia Global Value Fund | Annual Report 2023 | 13 |
February 28, 2023
| Class A | |
| Net assets | $633,846,934 |
| Shares outstanding | 53,859,972 |
| Net asset value per share | $11.77 |
| Maximum sales charge | 5.75% |
| Maximum offering price per share (calculated by dividing the net asset value per share by 1.0 minus the maximum sales charge for Class A shares) | $12.49 |
| Advisor Class | |
| Net assets | $5,904,287 |
| Shares outstanding | 498,074 |
| Net asset value per share | $11.85 |
| Class C | |
| Net assets | $8,526,862 |
| Shares outstanding | 739,109 |
| Net asset value per share | $11.54 |
| Institutional Class | |
| Net assets | $136,608,205 |
| Shares outstanding | 11,575,290 |
| Net asset value per share | $11.80 |
| Institutional 2 Class | |
| Net assets | $8,989,941 |
| Shares outstanding | 764,085 |
| Net asset value per share | $11.77 |
| Institutional 3 Class | |
| Net assets | $13,348,948 |
| Shares outstanding | 1,180,462 |
| Net asset value per share | $11.31 |
| Class R | |
| Net assets | $6,407,068 |
| Shares outstanding | 546,509 |
| Net asset value per share | $11.72 |
| 14 | Columbia Global Value Fund | Annual Report 2023 |
Year Ended February 28, 2023
| Net investment income | |
| Income: | |
| Dividends — unaffiliated issuers | $25,094,584 |
| Dividends — affiliated issuers | 165,089 |
| European Union tax reclaim | 294,507 |
| Foreign taxes withheld | (1,808,429) |
| Total income | 23,745,751 |
| Expenses: | |
| Management services fees | 5,954,368 |
| Distribution and/or service fees | |
| Class A | 1,610,179 |
| Class C | 95,142 |
| Class R | 31,334 |
| Transfer agent fees | |
| Class A | 818,461 |
| Advisor Class | 8,347 |
| Class C | 12,083 |
| Institutional Class | 178,635 |
| Institutional 2 Class | 19,321 |
| Institutional 3 Class | 1,078 |
| Class R | 7,961 |
| Compensation of board members | 12,834 |
| Custodian fees | 60,670 |
| Printing and postage fees | 94,206 |
| Registration fees | 118,209 |
| Audit fees | 75,706 |
| Legal fees | 24,655 |
| Interest on collateral | 2,684 |
| Compensation of chief compliance officer | 153 |
| Other | 32,541 |
| Total expenses | 9,158,567 |
| Expense reduction | (6,786) |
| Total net expenses | 9,151,781 |
| Net investment income | 14,593,970 |
| Realized and unrealized gain (loss) — net | |
| Net realized gain (loss) on: | |
| Investments — unaffiliated issuers | 24,443,950 |
| Investments — affiliated issuers | (1,595) |
| Foreign currency translations | (257,579) |
| Forward foreign currency exchange contracts | 1,987,358 |
| Options purchased | (255,587) |
| Options contracts written | 425,167 |
| Net realized gain | 26,341,714 |
| Net change in unrealized appreciation (depreciation) on: | |
| Investments — unaffiliated issuers | (61,831,224) |
| Investments — affiliated issuers | 547 |
| Foreign currency translations | (8,146) |
| Forward foreign currency exchange contracts | 790,093 |
| Options contracts written | 43,054 |
| Net change in unrealized appreciation (depreciation) | (61,005,676) |
| Net realized and unrealized loss | (34,663,962) |
| Net decrease in net assets resulting from operations | $(20,069,992) |
| Columbia Global Value Fund | Annual Report 2023 | 15 |
| Year Ended February 28, 2023 | Year Ended February 28, 2022 | |
| Operations | ||
| Net investment income | $14,593,970 | $16,045,728 |
| Net realized gain | 26,341,714 | 84,746,566 |
| Net change in unrealized appreciation (depreciation) | (61,005,676) | 14,119,018 |
| Net increase (decrease) in net assets resulting from operations | (20,069,992) | 114,911,312 |
| Distributions to shareholders | ||
| Net investment income and net realized gains | ||
| Class A | (47,053,581) | (81,232,263) |
| Advisor Class | (508,198) | (633,869) |
| Class C | (656,180) | (1,386,628) |
| Institutional Class | (10,693,987) | (17,775,009) |
| Institutional 2 Class | (4,318,013) | (8,001,138) |
| Institutional 3 Class | (712,368) | (1,020,438) |
| Class R | (437,067) | (894,905) |
| Total distributions to shareholders | (64,379,394) | (110,944,250) |
| Increase (decrease) in net assets from capital stock activity | (76,626,875) | 26,543,451 |
| Total increase (decrease) in net assets | (161,076,261) | 30,510,513 |
| Net assets at beginning of year | 974,708,506 | 944,197,993 |
| Net assets at end of year | $813,632,245 | $974,708,506 |
| 16 | Columbia Global Value Fund | Annual Report 2023 |
| Year Ended | Year Ended | |||
| February 28, 2023 | February 28, 2022 | |||
| Shares | Dollars ($) | Shares | Dollars ($) | |
| Capital stock activity | ||||
| Class A | ||||
| Subscriptions | 1,057,347 | 12,178,834 | 1,347,530 | 18,331,729 |
| Distributions reinvested | 4,045,837 | 43,975,633 | 5,685,027 | 75,872,270 |
| Redemptions | (6,294,521) | (73,402,862) | (6,099,044) | (83,270,532) |
| Net increase (decrease) | (1,191,337) | (17,248,395) | 933,513 | 10,933,467 |
| Advisor Class | ||||
| Subscriptions | 132,358 | 1,571,155 | 236,921 | 3,233,007 |
| Distributions reinvested | 38,995 | 427,022 | 38,492 | 516,791 |
| Redemptions | (248,167) | (2,879,175) | (81,795) | (1,113,927) |
| Net increase (decrease) | (76,814) | (880,998) | 193,618 | 2,635,871 |
| Class C | ||||
| Subscriptions | 45,688 | 516,066 | 56,966 | 762,318 |
| Distributions reinvested | 61,736 | 654,781 | 105,312 | 1,383,420 |
| Redemptions | (280,309) | (3,185,575) | (394,505) | (5,323,836) |
| Net decrease | (172,885) | (2,014,728) | (232,227) | (3,178,098) |
| Institutional Class | ||||
| Subscriptions | 1,003,017 | 11,724,293 | 1,271,495 | 17,347,950 |
| Distributions reinvested | 889,213 | 9,706,409 | 1,203,185 | 16,093,539 |
| Redemptions | (2,362,528) | (27,347,764) | (1,972,965) | (26,981,639) |
| Net increase (decrease) | (470,298) | (5,917,062) | 501,715 | 6,459,850 |
| Institutional 2 Class | ||||
| Subscriptions | 415,453 | 5,015,187 | 849,645 | 11,595,971 |
| Distributions reinvested | 396,061 | 4,282,197 | 595,599 | 7,939,385 |
| Redemptions | (5,646,478) | (64,232,463) | (768,848) | (10,516,857) |
| Net increase (decrease) | (4,834,964) | (54,935,079) | 676,396 | 9,018,499 |
| Institutional 3 Class | ||||
| Subscriptions | 681,678 | 7,597,930 | 313,137 | 4,125,712 |
| Distributions reinvested | 67,545 | 708,542 | 79,198 | 1,019,983 |
| Redemptions | (328,683) | (3,766,597) | (280,170) | (3,706,710) |
| Net increase | 420,540 | 4,539,875 | 112,165 | 1,438,985 |
| Class R | ||||
| Subscriptions | 167,223 | 1,940,562 | 196,910 | 2,689,995 |
| Distributions reinvested | 40,371 | 437,064 | 66,898 | 891,234 |
| Redemptions | (215,393) | (2,548,114) | (319,417) | (4,346,352) |
| Net decrease | (7,799) | (170,488) | (55,609) | (765,123) |
| Total net increase (decrease) | (6,333,557) | (76,626,875) | 2,129,571 | 26,543,451 |
| Columbia Global Value Fund | Annual Report 2023 | 17 |
| Net asset value, beginning of period | Net investment income | Net realized and unrealized gain (loss) | Total from investment operations | Distributions from net investment income | Distributions from net realized gains | Total distributions to shareholders | |
| Class A | |||||||
| Year Ended 2/28/2023 | $12.91 | 0.19 | (0.46) | (0.27) | (0.18) | (0.69) | (0.87) |
| Year Ended 2/28/2022 | $12.87 | 0.21 | 1.35 | 1.56 | (0.33) | (1.19) | (1.52) |
| Year Ended 2/28/2021 | $11.89 | 0.19 | 1.89 | 2.08 | (0.20) | (0.90) | (1.10) |
| Year Ended 2/29/2020 | $13.00 | 0.29 | (0.18) | 0.11 | (0.27) | (0.95) | (1.22) |
| Year Ended 2/28/2019 | $14.20 | 0.22 | (0.22) | 0.00(e) | (0.17) | (1.03) | (1.20) |
| Advisor Class | |||||||
| Year Ended 2/28/2023 | $13.00 | 0.23 | (0.48) | (0.25) | (0.21) | (0.69) | (0.90) |
| Year Ended 2/28/2022 | $12.95 | 0.24 | 1.37 | 1.61 | (0.37) | (1.19) | (1.56) |
| Year Ended 2/28/2021 | $11.96 | 0.20 | 1.92 | 2.12 | (0.23) | (0.90) | (1.13) |
| Year Ended 2/29/2020 | $13.07 | 0.32 | (0.18) | 0.14 | (0.30) | (0.95) | (1.25) |
| Year Ended 2/28/2019 | $14.26 | 0.24 | (0.20) | 0.04 | (0.20) | (1.03) | (1.23) |
| Class C | |||||||
| Year Ended 2/28/2023 | $12.67 | 0.11 | (0.46) | (0.35) | (0.09) | (0.69) | (0.78) |
| Year Ended 2/28/2022 | $12.66 | 0.11 | 1.32 | 1.43 | (0.23) | (1.19) | (1.42) |
| Year Ended 2/28/2021 | $11.70 | 0.06 | 1.91 | 1.97 | (0.11) | (0.90) | (1.01) |
| Year Ended 2/29/2020 | $12.81 | 0.19 | (0.18) | 0.01 | (0.17) | (0.95) | (1.12) |
| Year Ended 2/28/2019 | $14.04 | 0.16 | (0.27) | (0.11) | (0.09) | (1.03) | (1.12) |
| Institutional Class | |||||||
| Year Ended 2/28/2023 | $12.95 | 0.22 | (0.47) | (0.25) | (0.21) | (0.69) | (0.90) |
| Year Ended 2/28/2022 | $12.90 | 0.24 | 1.37 | 1.61 | (0.37) | (1.19) | (1.56) |
| Year Ended 2/28/2021 | $11.92 | 0.21 | 1.90 | 2.11 | (0.23) | (0.90) | (1.13) |
| Year Ended 2/29/2020 | $13.03 | 0.32 | (0.18) | 0.14 | (0.30) | (0.95) | (1.25) |
| Year Ended 2/28/2019 | $14.22 | 0.25 | (0.21) | 0.04 | (0.20) | (1.03) | (1.23) |
| Institutional 2 Class | |||||||
| Year Ended 2/28/2023 | $12.91 | 0.27 | (0.50) | (0.23) | (0.22) | (0.69) | (0.91) |
| Year Ended 2/28/2022 | $12.87 | 0.25 | 1.36 | 1.61 | (0.38) | (1.19) | (1.57) |
| Year Ended 2/28/2021 | $11.89 | 0.19 | 1.93 | 2.12 | (0.24) | (0.90) | (1.14) |
| Year Ended 2/29/2020 | $13.00 | 0.32 | (0.17) | 0.15 | (0.31) | (0.95) | (1.26) |
| Year Ended 2/28/2019 | $14.19 | 0.25 | (0.21) | 0.04 | (0.20) | (1.03) | (1.23) |
| Institutional 3 Class | |||||||
| Year Ended 2/28/2023 | $12.45 | 0.22 | (0.44) | (0.22) | (0.23) | (0.69) | (0.92) |
| Year Ended 2/28/2022 | $12.46 | 0.25 | 1.32 | 1.57 | (0.39) | (1.19) | (1.58) |
| Year Ended 2/28/2021 | $11.55 | 0.19 | 1.87 | 2.06 | (0.25) | (0.90) | (1.15) |
| Year Ended 2/29/2020 | $12.66 | 0.32 | (0.16) | 0.16 | (0.32) | (0.95) | (1.27) |
| Year Ended 2/28/2019 | $13.85 | 0.25 | (0.20) | 0.05 | (0.21) | (1.03) | (1.24) |
| 18 | Columbia Global Value Fund | Annual Report 2023 |
| Net asset value, end of period | Total return | Total gross expense ratio to average net assets(a) | Total net expense ratio to average net assets(a),(b) | Net investment income ratio to average net assets | Portfolio turnover | Net assets, end of period (000’s) | |
| Class A | |||||||
| Year Ended 2/28/2023 | $11.77 | (1.40%) | 1.13%(c) | 1.13%(c),(d) | 1.65% | 52% | $633,847 |
| Year Ended 2/28/2022 | $12.91 | 12.13% | 1.11%(c) | 1.11%(c),(d) | 1.52% | 48% | $710,822 |
| Year Ended 2/28/2021 | $12.87 | 18.84% | 1.15%(c) | 1.15%(c),(d) | 1.61% | 70% | $696,568 |
| Year Ended 2/29/2020 | $11.89 | 0.36% | 1.13%(c) | 1.13%(c),(d) | 2.20% | 37% | $570,739 |
| Year Ended 2/28/2019 | $13.00 | 0.40% | 1.15%(c) | 1.15%(c),(d) | 1.62% | 33% | $645,363 |
| Advisor Class | |||||||
| Year Ended 2/28/2023 | $11.85 | (1.21%) | 0.88%(c) | 0.87%(c),(d) | 1.93% | 52% | $5,904 |
| Year Ended 2/28/2022 | $13.00 | 12.44% | 0.83%(c) | 0.83%(c),(d) | 1.77% | 48% | $7,474 |
| Year Ended 2/28/2021 | $12.95 | 19.14% | 0.90%(c) | 0.90%(c),(d) | 1.72% | 70% | $4,937 |
| Year Ended 2/29/2020 | $11.96 | 0.61% | 0.88%(c) | 0.88%(c),(d) | 2.44% | 37% | $2,349 |
| Year Ended 2/28/2019 | $13.07 | 0.66% | 0.90%(c) | 0.90%(c),(d) | 1.77% | 33% | $1,856 |
| Class C | |||||||
| Year Ended 2/28/2023 | $11.54 | (2.13%) | 1.88%(c) | 1.87%(c),(d) | 0.92% | 52% | $8,527 |
| Year Ended 2/28/2022 | $12.67 | 11.24% | 1.85%(c) | 1.85%(c),(d) | 0.82% | 48% | $11,556 |
| Year Ended 2/28/2021 | $12.66 | 18.01% | 1.90%(c) | 1.90%(c),(d) | 0.54% | 70% | $14,480 |
| Year Ended 2/29/2020 | $11.70 | (0.39%) | 1.89%(c) | 1.89%(c),(d) | 1.46% | 37% | $3,696 |
| Year Ended 2/28/2019 | $12.81 | (0.39%) | 1.89%(c) | 1.89%(c),(d) | 1.17% | 33% | $5,573 |
| Institutional Class | |||||||
| Year Ended 2/28/2023 | $11.80 | (1.22%) | 0.88%(c) | 0.88%(c),(d) | 1.91% | 52% | $136,608 |
| Year Ended 2/28/2022 | $12.95 | 12.47% | 0.85%(c) | 0.85%(c),(d) | 1.77% | 48% | $155,962 |
| Year Ended 2/28/2021 | $12.90 | 19.11% | 0.90%(c) | 0.90%(c),(d) | 1.78% | 70% | $148,950 |
| Year Ended 2/29/2020 | $11.92 | 0.61% | 0.88%(c) | 0.88%(c),(d) | 2.45% | 37% | $88,301 |
| Year Ended 2/28/2019 | $13.03 | 0.66% | 0.90%(c) | 0.90%(c),(d) | 1.87% | 33% | $99,972 |
| Institutional 2 Class | |||||||
| Year Ended 2/28/2023 | $11.77 | (1.06%) | 0.78%(c) | 0.78%(c) | 2.26% | 52% | $8,990 |
| Year Ended 2/28/2022 | $12.91 | 12.48% | 0.79%(c) | 0.79%(c) | 1.81% | 48% | $72,299 |
| Year Ended 2/28/2021 | $12.87 | 19.26% | 0.84%(c) | 0.84%(c) | 1.55% | 70% | $63,366 |
| Year Ended 2/29/2020 | $11.89 | 0.68% | 0.81%(c) | 0.81%(c) | 2.48% | 37% | $1,008 |
| Year Ended 2/28/2019 | $13.00 | 0.72% | 0.83%(c) | 0.83%(c) | 1.86% | 33% | $626 |
| Institutional 3 Class | |||||||
| Year Ended 2/28/2023 | $11.31 | (1.05%) | 0.76%(c) | 0.76%(c) | 1.94% | 52% | $13,349 |
| Year Ended 2/28/2022 | $12.45 | 12.59% | 0.70%(c) | 0.70%(c) | 1.90% | 48% | $9,462 |
| Year Ended 2/28/2021 | $12.46 | 19.29% | 0.78%(c) | 0.78%(c) | 1.65% | 70% | $8,071 |
| Year Ended 2/29/2020 | $11.55 | 0.75% | 0.77%(c) | 0.77%(c) | 2.56% | 37% | $809 |
| Year Ended 2/28/2019 | $12.66 | 0.78% | 0.78%(c) | 0.78%(c) | 1.96% | 33% | $578 |
| Columbia Global Value Fund | Annual Report 2023 | 19 |
| Net asset value, beginning of period | Net investment income | Net realized and unrealized gain (loss) | Total from investment operations | Distributions from net investment income | Distributions from net realized gains | Total distributions to shareholders | |
| Class R | |||||||
| Year Ended 2/28/2023 | $12.87 | 0.16 | (0.47) | (0.31) | (0.15) | (0.69) | (0.84) |
| Year Ended 2/28/2022 | $12.83 | 0.18 | 1.35 | 1.53 | (0.30) | (1.19) | (1.49) |
| Year Ended 2/28/2021 | $11.85 | 0.13 | 1.92 | 2.05 | (0.17) | (0.90) | (1.07) |
| Year Ended 2/29/2020 | $12.96 | 0.26 | (0.18) | 0.08 | (0.24) | (0.95) | (1.19) |
| Year Ended 2/28/2019 | $14.17 | 0.18 | (0.22) | (0.04) | (0.14) | (1.03) | (1.17) |
| Notes to Financial Highlights | |
| (a) | In addition to the fees and expenses that the Fund bears directly, the Fund indirectly bears a pro rata share of the fees and expenses of any other funds in which it invests. Such indirect expenses are not included in the Fund’s reported expense ratios. |
| (b) | Total net expenses include the impact of certain fee waivers/expense reimbursements made by the Investment Manager and certain of its affiliates, if applicable. |
| (c) | Ratios include interest on collateral expense which is less than 0.01%. |
| (d) | The benefits derived from expense reductions had an impact of less than 0.01%. |
| (e) | Rounds to zero. |
| 20 | Columbia Global Value Fund | Annual Report 2023 |
| Net asset value, end of period | Total return | Total gross expense ratio to average net assets(a) | Total net expense ratio to average net assets(a),(b) | Net investment income ratio to average net assets | Portfolio turnover | Net assets, end of period (000’s) | |
| Class R | |||||||
| Year Ended 2/28/2023 | $11.72 | (1.74%) | 1.38%(c) | 1.38%(c),(d) | 1.39% | 52% | $6,407 |
| Year Ended 2/28/2022 | $12.87 | 11.92% | 1.32%(c) | 1.32%(c),(d) | 1.34% | 48% | $7,132 |
| Year Ended 2/28/2021 | $12.83 | 18.59% | 1.40%(c) | 1.40%(c),(d) | 1.08% | 70% | $7,825 |
| Year Ended 2/29/2020 | $11.85 | 0.11% | 1.38%(c) | 1.38%(c),(d) | 1.96% | 37% | $784 |
| Year Ended 2/28/2019 | $12.96 | 0.14% | 1.40%(c) | 1.40%(c),(d) | 1.37% | 33% | $1,187 |
| Columbia Global Value Fund | Annual Report 2023 | 21 |
February 28, 2023
| 22 | Columbia Global Value Fund | Annual Report 2023 |
February 28, 2023
| Columbia Global Value Fund | Annual Report 2023 | 23 |
February 28, 2023
| 24 | Columbia Global Value Fund | Annual Report 2023 |
February 28, 2023
| Asset derivatives | ||
| Risk exposure category | Statement of assets and liabilities location | Fair value ($) |
| Foreign exchange risk | Unrealized appreciation on forward foreign currency exchange contracts | 2,233,839 |
| Columbia Global Value Fund | Annual Report 2023 | 25 |
February 28, 2023
| Liability derivatives | ||
| Risk exposure category | Statement of assets and liabilities location | Fair value ($) |
| Foreign exchange risk | Unrealized depreciation on forward foreign currency exchange contracts | 1,158,617 |
| Amount of realized gain (loss) on derivatives recognized in income | ||||
| Risk exposure category | Forward foreign currency exchange contracts ($) | Options contracts written ($) | Options contracts purchased ($) | Total ($) |
| Equity risk | — | 425,167 | (255,587) | 169,580 |
| Foreign exchange risk | 1,987,358 | — | — | 1,987,358 |
| Total | 1,987,358 | 425,167 | (255,587) | 2,156,938 |
| Change in unrealized appreciation (depreciation) on derivatives recognized in income | |||
| Risk exposure category | Forward foreign currency exchange contracts ($) | Options contracts written ($) | Total ($) |
| Equity risk | — | 43,054 | 43,054 |
| Foreign exchange risk | 790,093 | — | 790,093 |
| Total | 790,093 | 43,054 | 833,147 |
| Derivative instrument | Average value ($) |
| Options contracts — purchased | 9,564* |
| Options contracts — written | (13,421)** |
| Derivative instrument | Average unrealized appreciation ($)** | Average unrealized depreciation ($)** |
| Forward foreign currency exchange contracts | 1,956,961 | (1,578,760) |
| * | Based on the ending daily outstanding amounts for the year ended February 28, 2023. |
| ** | Based on the ending quarterly outstanding amounts for the year ended February 28, 2023. |
| 26 | Columbia Global Value Fund | Annual Report 2023 |
February 28, 2023
| Morgan Stanley ($) | |
| Assets | |
| Forward foreign currency exchange contracts | 2,233,839 |
| Liabilities | |
| Forward foreign currency exchange contracts | 1,158,617 |
| Total financial and derivative net assets | 1,075,222 |
| Total collateral received (pledged) (a) | 763,000 |
| Net amount (b) | 312,222 |
| (a) | In some instances, the actual collateral received and/or pledged may be more than the amount shown due to overcollateralization. |
| (b) | Represents the net amount due from/(to) counterparties in the event of default. |
| Columbia Global Value Fund | Annual Report 2023 | 27 |
February 28, 2023
| 28 | Columbia Global Value Fund | Annual Report 2023 |
February 28, 2023
| Effective rate (%) | |
| Class A | 0.13 |
| Advisor Class | 0.13 |
| Class C | 0.13 |
| Institutional Class | 0.13 |
| Institutional 2 Class | 0.06 |
| Institutional 3 Class | 0.01 |
| Class R | 0.13 |
| Columbia Global Value Fund | Annual Report 2023 | 29 |
February 28, 2023
| Front End (%) | CDSC (%) | Amount ($) | |
| Class A | 5.75 | 0.50 - 1.00(a) | 70,183 |
| Class C | — | 1.00(b) | 1,066 |
| (a) | This charge is imposed on certain investments of between $1 million and $50 million redeemed within 18 months after purchase, as follows: 1.00% if redeemed within 12 months after purchase, and 0.50% if redeemed more than 12, but less than 18, months after purchase, with certain limited exceptions. |
| (b) | This charge applies to redemptions within 12 months after purchase, with certain limited exceptions. |
| July 1, 2022 through June 30, 2023 | Prior to July 1, 2022 | |
| Class A | 1.15% | 1.15% |
| Advisor Class | 0.90 | 0.90 |
| Class C | 1.90 | 1.90 |
| Institutional Class | 0.90 | 0.90 |
| Institutional 2 Class | 0.84 | 0.83 |
| Institutional 3 Class | 0.79 | 0.78 |
| Class R | 1.40 | 1.40 |
| 30 | Columbia Global Value Fund | Annual Report 2023 |
February 28, 2023
| Excess of distributions over net investment income ($) | Accumulated net realized (loss) ($) | Paid in capital ($) |
| 2,155,370 | (2,155,370) | — |
| Year Ended February 28, 2023 | Year Ended February 28, 2022 | ||||
| Ordinary income ($) | Long-term capital gains ($) | Total ($) | Ordinary income ($) | Long-term capital gains ($) | Total ($) |
| 29,509,096 | 34,870,298 | 64,379,394 | 29,704,924 | 81,239,326 | 110,944,250 |
| Undistributed ordinary income ($) | Undistributed long-term capital gains ($) | Capital loss carryforwards ($) | Net unrealized appreciation ($) |
| 2,319,583 | 17,360,286 | (51,887,781) | 70,342,130 |
| Federal tax cost ($) | Gross unrealized appreciation ($) | Gross unrealized (depreciation) ($) | Net unrealized appreciation ($) |
| 740,157,662 | 116,582,278 | (46,240,148) | 70,342,130 |
| Columbia Global Value Fund | Annual Report 2023 | 31 |
February 28, 2023
| No expiration short-term ($) | No expiration long-term ($) | Total ($) | Utilized ($) |
| (6,433,790) | (45,453,991) | (51,887,781) | 873,936 |
| 32 | Columbia Global Value Fund | Annual Report 2023 |
February 28, 2023
| Columbia Global Value Fund | Annual Report 2023 | 33 |
February 28, 2023
| 34 | Columbia Global Value Fund | Annual Report 2023 |
| Columbia Global Value Fund | Annual Report 2023 | 35 |
| Qualified dividend income | Dividends received deduction | Section 199A dividends | Capital gain dividend |
| 78.24% | 49.60% | 0.85% | $24,097,854 |
| 36 | Columbia Global Value Fund | Annual Report 2023 |
(Unaudited)
Independent trustees
| Name, address, year of birth | Position held with the Columbia Funds and length of service | Principal occupation(s) during past five years and other relevant professional experience | Number of Funds in the Columbia Funds Complex* overseen | Other directorships held by Trustee during the past five years |
| George S. Batejan c/o Columbia Management Investment Advisers, LLC 290 Congress Street Boston, MA 02210 1954 | Trustee since 2017 | Executive Vice President, Global Head of Technology and Operations, Janus Capital Group, Inc., 2010-2016 | 176 | Former Chairman of the Board, NICSA (National Investment Company Services Association) (Executive Committee, Nominating Committee and Governance Committee), 2014-2016; former Director, Intech Investment Management, 2011-2016; former Board Member, Metro Denver Chamber of Commerce, 2015-2016; former Advisory Board Member, University of Colorado Business School, 2015-2018; former Board Member, Chase Bank International, 1993-1994 |
| Kathleen Blatz c/o Columbia Management Investment Advisers, LLC 290 Congress Street Boston, MA 02210 1954 | Trustee since 2006 | Attorney, specializing in arbitration and mediation; Chief Justice, Minnesota Supreme Court, 1998-2006; Associate Justice, Minnesota Supreme Court, 1996-1998; Fourth Judicial District Court Judge, Hennepin County, 1994-1996; Attorney in private practice and public service, 1984-1993; State Representative, Minnesota House of Representatives, 1979-1993, which included service on the Tax and Financial Institutions and Insurance Committees; Member and Interim Chair, Minnesota Sports Facilities Authority, January-July 2017; Interim President and Chief Executive Officer, Blue Cross and Blue Shield of Minnesota (health care insurance), February-July 2018, April-October 2021 | 176 | Former Trustee, Blue Cross and Blue Shield of Minnesota, 2009-2021 (Chair of the Business Development Committee, 2014-2017; Chair of the Governance Committee, 2017-2019); former Member and Chair of the Board, Minnesota Sports Facilities Authority, January 2017-July 2017; former Director, Robina Foundation, 2009-2020 (Chair, 2014-2020); Director, Richard M. Schulze Family Foundation, since 2021 |
| Pamela G. Carlton c/o Columbia Management Investment Advisers, LLC 290 Congress Street Boston, MA 02210 1954 | Chair since 2023; Trustee since 2007 | President, Springboard — Partners in Cross Cultural Leadership (consulting company), since 2003; Managing Director of US Equity Research, JP Morgan Chase, 1999-2003; Director of US Equity Research, Chase Asset Management, 1996-1999; Co-Director Latin America Research, 1993-1996, COO Global Research, 1992-1996, Co-Director of US Research, 1991-1992, Investment Banker, 1982-1991, Morgan Stanley; Attorney, Cleary Gottlieb Steen & Hamilton LLP, 1980-1982 | 176 | Trustee, New York Presbyterian Hospital Board, since 1996; Director, DR Bank (Audit Committee) since 2017; Director, Evercore Inc. (Audit Committee, Nominating and Governance Committee), since 2019; Director, Apollo Commercial Real Estate Finance, Inc. (Chair, Nominating and Governance Committee), since 2021; the Governing Council of the Independent Directors Council (IDC), since 2021 |
| Columbia Global Value Fund | Annual Report 2023 | 37 |
(Unaudited)
Independent trustees (continued)
| Name, address, year of birth | Position held with the Columbia Funds and length of service | Principal occupation(s) during past five years and other relevant professional experience | Number of Funds in the Columbia Funds Complex* overseen | Other directorships held by Trustee during the past five years |
| Janet Langford Carrig c/o Columbia Management Investment Advisers, LLC 290 Congress Street Boston, MA 02210 1957 | Trustee since 1996 | Senior Vice President, General Counsel and Corporate Secretary, ConocoPhillips (independent energy company), September 2007-October 2018 | 174 | Director, EQT Corporation (natural gas producer), since 2019; former Director, Whiting Petroleum Corporation (independent oil and gas company), 2020-2022 |
| J. Kevin Connaughton c/o Columbia Management Investment Advisers, LLC 290 Congress Street Boston, MA 02210 1964 | Trustee since 2020 | CEO and President, RhodeWay Financial (non-profit financial planning firm), since December 2022; Member, FINRA National Adjudicatory Council, since January 2020; Adjunct Professor of Finance, Bentley University since January 2018; Consultant to Independent Trustees of CFVIT and CFST I from March 2016 to June 2020 with respect to CFVIT and to December 2020 with respect to CFST I; Managing Director and General Manager of Mutual Fund Products, Columbia Management Investment Advisers, LLC, May 2010-February 2015; President, Columbia Funds, 2008-2015; and senior officer of Columbia Funds and affiliated funds, 2003-2015 | 174 | Former Director, The Autism Project, March 2015-December 2021; former Member of the Investment Committee, St. Michael’s College, November 2015-February 2020; former Trustee, St. Michael’s College, June 2017-September 2019; former Trustee, New Century Portfolios, January 2015-December 2017 |
| Olive M. Darragh c/o Columbia Management Investment Advisers, LLC 290 Congress Street Boston, MA 02210 1962 | Trustee since 2020 | Managing Director of Darragh Inc. (strategy and talent management consulting firm), since 2010; Founder and CEO, Zolio, Inc. (investment management talent identification platform), since 2004; Consultant to Independent Trustees of CFVIT and CFST I from June 2019 to June 2020 with respect to CFVIT and to December 2020 with respect to CFST I; Partner, Tudor Investments, 2004-2010; Senior Partner, McKinsey & Company (consulting), 1990-2004; Touche Ross CPA, 1985-1988 | 174 | Treasurer, Edinburgh University US Trust Board; Member, HBS Community Action Partners Board; Former Director, University of Edinburgh Business School (Member of US Board); former Director, Boston Public Library Foundation |
| Patricia M. Flynn c/o Columbia Management Investment Advisers, LLC 290 Congress Street Boston, MA 02210 1950 | Trustee since 2004 | Professor of Economics and Management, Bentley University, since 2002; Dean, McCallum Graduate School of Business, Bentley University, 1992-2002 | 176 | Former Trustee, MA Taxpayers Foundation,1997-2022; former Governing Board Member (Chairperson of Innovation Index Advisory Committee), MA Technology Collaborative, 1997-2020; former Director, The MA Business Roundtable, 2003-2019 |
| Brian J. Gallagher c/o Columbia Management Investment Advisers, LLC 290 Congress Street Boston, MA 02210 1954 | Trustee since 2017 | Retired; Partner with Deloitte & Touche LLP and its predecessors, 1977-2016 | 176 | Trustee, Catholic Schools Foundation, since 2004 |
| 38 | Columbia Global Value Fund | Annual Report 2023 |
(Unaudited)
Independent trustees (continued)
| Name, address, year of birth | Position held with the Columbia Funds and length of service | Principal occupation(s) during past five years and other relevant professional experience | Number of Funds in the Columbia Funds Complex* overseen | Other directorships held by Trustee during the past five years |
| Douglas A. Hacker c/o Columbia Management Investment Advisers, LLC 290 Congress Street Boston, MA 02210 1955 | Trustee since 1996 | Independent business executive, since May 2006; Executive Vice President – Strategy of United Airlines, December 2002 - May 2006; President of UAL Loyalty Services (airline marketing company), September 2001-December 2002; Executive Vice President and Chief Financial Officer of United Airlines, July 1999-September 2001 | 176 | Director, Spartan Nash Company (Chair of the Board) (food distributor); Director, Aircastle Limited (Chair of Audit Committee) (aircraft leasing); former Director, Nash Finch Company (food distributor), 2005-2013; former Director, SeaCube Container Leasing Ltd. (container leasing), 2010-2013; and former Director, Travelport Worldwide Limited (travel information technology), 2014-2019 |
| Nancy T. Lukitsh c/o Columbia Management Investment Advisers, LLC 290 Congress Street Boston, MA 02210 1956 | Trustee since 2011 | Senior Vice President, Partner and Director of Marketing, Wellington Management Company, LLP (investment adviser), 1997-2010; Chair, Wellington Management Portfolios (commingled non-U.S. investment pools), 2007-2010; Director, Wellington Trust Company, NA and other Wellington affiliates, 1997-2010 | 174 | None |
| David M. Moffett c/o Columbia Management Investment Advisers, LLC 290 Congress Street Boston, MA 02210 1952 | Trustee since 2011 | Retired; former Chief Executive Officer of Freddie Mac and Chief Financial Officer of U.S. Bank | 174 | Director, CSX Corporation (transportation suppliers); Director, PayPal Holdings Inc. (payment and data processing services); Trustee, University of Oklahoma Foundation; former Director, eBay Inc. (online trading community), 2007-2015; and former Director, CIT Bank, CIT Group Inc. (commercial and consumer finance), 2010-2016; former Advisor to Bridgewater Associates and The Carlyle Group |
| Catherine James Paglia c/o Columbia Management Investment Advisers, LLC 290 Congress Street Boston, MA 02210 1952 | Trustee since 2004 | Director, Enterprise Asset Management, Inc. (private real estate and asset management company), since September 1998; Managing Director and Partner, Interlaken Capital, Inc., 1989-1997; Vice President, 1982-1985, Principal, 1985-1987, Managing Director, 1987-1989, Morgan Stanley; Vice President, Investment Banking, 1980-1982, Associate, Investment Banking, 1976-1980, Dean Witter Reynolds, Inc. | 176 | Director, Valmont Industries, Inc. (irrigation systems manufacturer), since 2012; Trustee, Carleton College (on the Investment Committee); Trustee, Carnegie Endowment for International Peace (on the Investment Committee) |
| Columbia Global Value Fund | Annual Report 2023 | 39 |
(Unaudited)
Independent trustees (continued)
| Name, address, year of birth | Position held with the Columbia Funds and length of service | Principal occupation(s) during past five years and other relevant professional experience | Number of Funds in the Columbia Funds Complex* overseen | Other directorships held by Trustee during the past five years |
| Natalie A. Trunow c/o Columbia Management Investment Advisers, LLC 290 Congress Street Boston, MA 02210 1967 | Trustee since 2020 | Chief Executive Officer, Millennial Portfolio Solutions LLC (asset management and consulting services), January 2016-January 2021; Non-executive Member of the Investment Committee and Valuation Committee, Sarona Asset Management Inc. (private equity firm) since September 2019; Advisor, Horizon Investments (asset management and consulting services), August 2018-January 2022; Advisor, Paradigm Asset Management, November 2016-January 2022; Consultant to Independent Trustees of CFVIT and CFST I from September 2016 to June 2020 with respect to CFVIT and to December 2020 with respect to CFST I; Director of Investments/Consultant, Casey Family Programs, April 2016-November 2016; Senior Vice President and Chief Investment Officer, Calvert Investments, August 2008-January 2016; Section Head and Portfolio Manager, General Motors Asset Management, June 1997-August 2008 | 174 | Independent Director, Investment Committee, Health Services for Children with Special Needs, Inc., 2010-2021; Independent Director, (Executive Committee and Chair, Audit Committee), Consumer Credit Counseling Services (formerly Guidewell Financial Solutions), since 2016; Independent Director, (Investment Committee), Sarona Asset Management, since 2019 |
| Sandra L. Yeager c/o Columbia Management Investment Advisers, LLC 290 Congress Street Boston, MA 02210 1964 | Trustee since 2017 | Retired; President and founder, Hanoverian Capital, LLC (SEC registered investment advisor firm), 2008-2016; Managing Director, DuPont Capital, 2006-2008; Managing Director, Morgan Stanley Investment Management, 2004-2006; Senior Vice President, Alliance Bernstein, 1990-2004 | 176 | Former Director, NAPE Education Foundation, October 2016-October 2020; Advisory Board, Jennersville YMCA, since 2022 |
| * | The term “Columbia Funds Complex” as used herein includes Columbia Seligman Premium Technology Growth Fund, Tri-Continental Corporation and each series of Columbia Funds Series Trust (CFST), Columbia Funds Series Trust I (CFST I), Columbia Funds Series Trust II (CFST II), Columbia ETF Trust I (CET I), Columbia ETF Trust II (CET II), Columbia Funds Variable Insurance Trust (CFVIT) and Columbia Funds Variable Series Trust II (CFVST II). Messrs. Batejan, Beckman, Gallagher and Hacker and Mses. Blatz, Carlton, Carrig, Flynn, Paglia and Yeager serve as Directors of Columbia Seligman Premium Technology Growth Fund and Tri-Continental Corporation. |
| Name, address, year of birth | Position held with the Columbia Funds and length of service | Principal occupation(s) during the past five years and other relevant professional experience | Number of Funds in the Columbia Funds Complex overseen | Other directorships held by Trustee during the past five years |
| Daniel J. Beckman c/o Columbia Management Investment Advisers, LLC 290 Congress Street Boston, MA 02210 1962 | Trustee since November 2021 and President since June 2021 | Vice President – Head of North America Product, Columbia Management Investment Advisers, LLC, since April 2015; President and Principal Executive Officer of the Columbia Funds, since June 2021; officer of Columbia Funds and affiliated funds, 2020-2021 | 176 | Director, Ameriprise Trust Company, since October 2016; Director, Columbia Management Investment Distributors, Inc. since November 2018; Board of Governors, Columbia Wanger Asset Management, LLC since, January 2022; Director, Columbia Threadneedle Canada, Inc., since December 2022 |
| * | Interested person (as defined under the 1940 Act) by reason of being an officer, director, security holder and/or employee of the Investment Manager or Ameriprise Financial. |
| 40 | Columbia Global Value Fund | Annual Report 2023 |
(Unaudited)
The Statement of Additional Information has additional information about the Fund’s Board members and is available, without charge, upon request by calling 800.345.6611, visiting columbiathreadneedleus.com/investor/ or contacting your financial intermediary.
| Name, address and year of birth | Position and year first appointed to position for any Fund in the Columbia Funds Complex or a predecessor thereof | Principal occupation(s) during past five years |
| Michael G. Clarke 290 Congress Street Boston, MA 02210 1969 | Chief Financial Officer and Principal Financial Officer (2009) and Senior Vice President (2019) | Senior Vice President and Head of Global Operations & Investor Services, Columbia Management Investment Advisers, LLC, since March 2022 (previously Vice President, Head of North American Operations, and Co-Head of Global Operations, June 2019 to February 2022 and Vice President – Accounting and Tax, May 2010 - May 2019); senior officer of Columbia Funds and affiliated funds, since 2002. |
| Joseph Beranek 5890 Ameriprise Financial Center Minneapolis, MN 55474 1965 | Treasurer and Chief Accounting Officer (Principal Accounting Officer) (2019) and Principal Financial Officer (2020), CFST, CFST I, CFST II, CFVIT and CFVST II; Assistant Treasurer, CET I and CET II | Vice President – Mutual Fund Accounting and Financial Reporting, Columbia Management Investment Advisers, LLC, since December 2018 and March 2017, respectively. |
| Marybeth Pilat 290 Congress Street Boston, MA 02210 1968 | Treasurer and Chief Accounting Officer (Principal Accounting Officer) and Principal Financial Officer (2020) for CET I and CET II; Assistant Treasurer, CFST, CFST I, CFST II, CFVIT and CFVST II | Vice President – Product Pricing and Administration, Columbia Management Investment Advisers, LLC, since May 2017. |
| William F. Truscott 290 Congress Street Boston, MA 02210 1960 | Senior Vice President (2001) | Formerly, Trustee/Director of Columbia Funds Complex or legacy funds, November 2001-January 1, 2021; Chief Executive Officer, Global Asset Management, Ameriprise Financial, Inc., since September 2012; Chairman of the Board and President, Columbia Management Investment Advisers, LLC, since July 2004 and February 2012, respectively; Chairman of the Board and Chief Executive Officer, Columbia Management Investment Distributors, Inc., since November 2008 and February 2012, respectively; Chairman of the Board and Director, Threadneedle Asset Management Holdings, Sàrl, since March 2013 and December 2008, respectively; senior executive of various entities affiliated with Columbia Threadneedle. |
| Christopher O. Petersen 5228 Ameriprise Financial Center Minneapolis, MN 55474 1970 | Senior Vice President and Assistant Secretary (2021) | Formerly, Trustee/Director of funds within the Columbia Funds Complex, July 1, 2020 - November 22, 2021; Senior Vice President and Assistant General Counsel, Ameriprise Financial, Inc., since September 2021 (previously Vice President and Lead Chief Counsel, January 2015 - September 2021); formerly, President and Principal Executive Officer of the Columbia Funds, 2015 - 2021; officer of Columbia Funds and affiliated funds, since 2007. |
| Thomas P. McGuire 290 Congress Street Boston, MA 02210 1972 | Senior Vice President and Chief Compliance Officer (2012) | Vice President – Asset Management Compliance, Ameriprise Financial, Inc., since May 2010; Chief Compliance Officer, Columbia Acorn/Wanger Funds, since December 2015; formerly, Chief Compliance Officer, Ameriprise Certificate Company, September 2010 – September 2020. |
| Columbia Global Value Fund | Annual Report 2023 | 41 |
(Unaudited)
Fund officers (continued)
| Name, address and year of birth | Position and year first appointed to position for any Fund in the Columbia Funds Complex or a predecessor thereof | Principal occupation(s) during past five years |
| Ryan C. Larrenaga 290 Congress Street Boston, MA 02210 1970 | Senior Vice President (2017), Chief Legal Officer (2017), and Secretary (2015) | Vice President and Chief Counsel, Ameriprise Financial, Inc., since August 2018 (previously Vice President and Group Counsel, August 2011 - August 2018); Chief Legal Officer, Columbia Acorn/Wanger Funds, since September 2020; officer of Columbia Funds and affiliated funds, since 2005. |
| Michael E. DeFao 290 Congress Street Boston, MA 02210 1968 | Vice President (2011) and Assistant Secretary (2010) | Vice President and Chief Counsel, Ameriprise Financial, Inc., since May 2010; Vice President, Chief Legal Officer and Assistant Secretary, Columbia Management Investment Advisers, LLC, since October 2021 (previously Vice President and Assistant Secretary, May 2010 – September 2021). |
| Lyn Kephart-Strong 5228 Ameriprise Financial Center Minneapolis, MN 55474 1960 | Vice President (2015) | Vice President, Global Investment Operations Services, Columbia Management Investment Advisers, LLC, since 2010; President, Columbia Management Investment Services Corp., since October 2014; President, Ameriprise Trust Company, since January 2017. |
| 42 | Columbia Global Value Fund | Annual Report 2023 |
columbiathreadneedleus.com/investor/. The Fund is distributed by Columbia Management Investment Distributors, Inc., member FINRA, and managed by Columbia Management Investment Advisers, LLC.

February 28, 2023

| 3 | |
| 5 | |
| 7 | |
| 8 | |
| 14 | |
| 16 | |
| 17 | |
| 20 | |
| 24 | |
| 38 | |
| 39 | |
| 39 |
(Unaudited)

| Average annual total returns (%) (for the period ended February 28, 2023) | ||||
| Inception | 1 Year | Life | ||
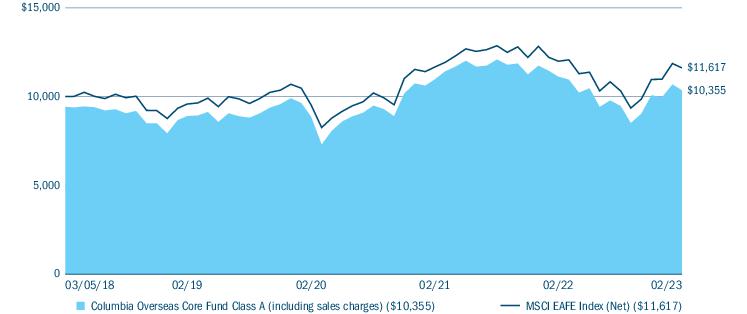
| Class A | Excluding sales charges | 03/05/18 | -6.89 | 1.91 |
| Including sales charges | -12.21 | 0.70 | ||
| Advisor Class | 03/05/18 | -6.69 | 2.15 | |
| Class C | Excluding sales charges | 03/05/18 | -7.60 | 1.14 |
| Including sales charges | -8.51 | 1.14 | ||
| Institutional Class | 03/05/18 | -6.68 | 2.17 | |
| Institutional 2 Class | 03/05/18 | -6.58 | 2.26 | |
| Institutional 3 Class | 03/05/18 | -6.58 | 2.31 | |
| Class R | 03/05/18 | -7.09 | 1.66 | |
| MSCI EAFE Index (Net) | -3.14 | 3.05 | ||
| Columbia Overseas Core Fund | Annual Report 2023 | 3 |
(Unaudited)
| Equity sector breakdown (%) (at February 28, 2023) | |
| Communication Services | 5.0 |
| Consumer Discretionary | 9.7 |
| Consumer Staples | 12.3 |
| Energy | 9.7 |
| Financials | 17.3 |
| Health Care | 14.8 |
| Industrials | 9.7 |
| Information Technology | 11.9 |
| Materials | 6.5 |
| Real Estate | 1.7 |
| Utilities | 1.4 |
| Total | 100.0 |
| Country breakdown (%) (at February 28, 2023) | |
| Australia | 4.3 |
| Austria | 0.6 |
| Brazil | 0.4 |
| Canada | 5.8 |
| China | 1.4 |
| Denmark | 1.7 |
| Finland | 1.8 |
| Country breakdown (%) (at February 28, 2023) | |
| France | 5.2 |
| Germany | 2.7 |
| Hong Kong | 0.4 |
| Ireland | 2.1 |
| Israel | 3.1 |
| Japan | 18.8 |
| Netherlands | 10.4 |
| Norway | 1.6 |
| Russian Federation | 0.0(a) |
| Singapore | 2.5 |
| South Africa | 0.4 |
| South Korea | 2.2 |
| Sweden | 1.0 |
| Switzerland | 6.3 |
| Taiwan | 4.0 |
| United Kingdom | 14.9 |
| United States(b) | 8.4 |
| Total | 100.0 |
| (a) | Rounds to zero. |
| (b) | Includes investments in Money Market Funds and Exchange-Traded Funds. |
| 4 | Columbia Overseas Core Fund | Annual Report 2023 |
(Unaudited)
| • | The Fund’s underperformance of its benchmark during the period was caused primarily by adverse stock selection, particularly within Sweden, Germany and the United Kingdom, as well as within the communication services, industrials and real estate sectors. |
| Columbia Overseas Core Fund | Annual Report 2023 | 5 |
(Unaudited)
| • | Individual holdings that lagged in absolute and relative terms included Samhallsbyggnadsbolaget I Norden AB (Sweden), Parade Technologies Ltd. (Taiwan), KION Group AG (Germany), Vodafone Group PLC (United Kingdom) and Aroundtown SA (Germany). The Fund sold its position in Aroundtown. |
| • | From a geographical perspective, the Fund’s overweight position in Taiwan hurt relative performance. |
| • | Relative to its benchmark, the Fund’s overweight positions in Canada and the energy sector helped relative results. |
| • | Individual top performers included Alimentation Couche-Tard, Inc. (Canada), MatsukiyoCocokara & Co. (Japan), AstraZeneca PLC (United Kingdom), TP Icap Group PLC (United Kingdom) and ABN AMRO Bank NV (Netherlands). |
| 6 | Columbia Overseas Core Fund | Annual Report 2023 |
(Unaudited)
| September 1, 2022 — February 28, 2023 | |||||||
| Account value at the beginning of the period ($) | Account value at the end of the period ($) | Expenses paid during the period ($) | Fund’s annualized expense ratio (%) | ||||
| Actual | Hypothetical | Actual | Hypothetical | Actual | Hypothetical | Actual | |
| Class A | 1,000.00 | 1,000.00 | 1,093.20 | 1,018.74 | 6.33 | 6.11 | 1.22 |
| Advisor Class | 1,000.00 | 1,000.00 | 1,094.30 | 1,019.98 | 5.04 | 4.86 | 0.97 |
| Class C | 1,000.00 | 1,000.00 | 1,089.20 | 1,015.03 | 10.20 | 9.84 | 1.97 |
| Institutional Class | 1,000.00 | 1,000.00 | 1,094.20 | 1,019.98 | 5.04 | 4.86 | 0.97 |
| Institutional 2 Class | 1,000.00 | 1,000.00 | 1,095.20 | 1,020.33 | 4.68 | 4.51 | 0.90 |
| Institutional 3 Class | 1,000.00 | 1,000.00 | 1,095.20 | 1,020.58 | 4.42 | 4.26 | 0.85 |
| Class R | 1,000.00 | 1,000.00 | 1,092.20 | 1,017.50 | 7.63 | 7.35 | 1.47 |
| Columbia Overseas Core Fund | Annual Report 2023 | 7 |
February 28, 2023
| Common Stocks 97.2% | ||
| Issuer | Shares | Value ($) |
| Australia 4.3% | ||
| Ansell Ltd. | 378,882 | 6,899,179 |
| Northern Star Resources Ltd. | 2,003,699 | 13,984,473 |
| Paladin Energy Ltd.(a) | 8,672,885 | 4,033,027 |
| Santos Ltd. | 2,644,647 | 12,348,942 |
| Total | 37,265,621 | |
| Austria 0.6% | ||
| Kontron AG | 242,970 | 4,861,727 |
| Brazil 0.4% | ||
| JBS SA | 914,464 | 3,337,900 |
| Canada 5.7% | ||
| Alimentation Couche-Tard, Inc. | 345,139 | 16,190,800 |
| Cameco Corp. | 493,747 | 13,499,043 |
| Pan American Silver Corp. | 168,057 | 2,497,327 |
| Vermilion Energy, Inc. | 198,527 | 2,660,262 |
| West Fraser Timber Co., Ltd. | 36,510 | 2,742,598 |
| Whitecap Resources, Inc. | 1,534,324 | 11,761,839 |
| Total | 49,351,869 | |
| China 1.4% | ||
| China Merchants Bank Co., Ltd., Class H | 1,476,000 | 8,009,517 |
| Li Ning Co., Ltd. | 465,000 | 3,967,708 |
| Total | 11,977,225 | |
| Denmark 1.7% | ||
| Novo Nordisk A/S, Class B | 102,575 | 14,489,259 |
| Finland 1.8% | ||
| UPM-Kymmene OYJ | 421,764 | 15,283,233 |
| France 5.2% | ||
| DBV Technologies SA, ADR(a) | 162,564 | 235,718 |
| Eiffage SA | 165,433 | 18,156,137 |
| Sanofi | 147,398 | 13,781,467 |
| TotalEnergies SE | 171,392 | 10,575,611 |
| Worldline SA(a) | 49,428 | 2,058,799 |
| Total | 44,807,732 | |
| Common Stocks (continued) | ||
| Issuer | Shares | Value ($) |
| Germany 2.7% | ||
| Duerr AG | 168,257 | 6,333,808 |
| E.ON SE | 1,050,098 | 11,457,488 |
| KION Group AG | 130,769 | 5,121,699 |
| Total | 22,912,995 | |
| Hong Kong 0.4% | ||
| WH Group Ltd. | 6,647,402 | 3,868,316 |
| Ireland 2.1% | ||
| Amarin Corp. PLC, ADR(a) | 109,962 | 223,223 |
| Flutter Entertainment PLC(a) | 108,714 | 17,454,950 |
| Total | 17,678,173 | |
| Israel 3.1% | ||
| Bank Hapoalim BM | 1,154,383 | 9,655,520 |
| Check Point Software Technologies Ltd.(a) | 135,698 | 16,788,557 |
| Total | 26,444,077 | |
| Japan 18.8% | ||
| Amano Corp. | 307,000 | 5,677,419 |
| BayCurrent Consulting, Inc. | 267,100 | 10,485,724 |
| COMSYS Holdings Corp. | 22,300 | 405,682 |
| Denso Corp. | 144,300 | 7,672,241 |
| Invincible Investment Corp. | 19,027 | 7,668,125 |
| ITOCHU Corp. | 555,600 | 16,607,270 |
| JustSystems Corp. | 107,600 | 2,626,384 |
| Kinden Corp. | 327,200 | 3,673,768 |
| MatsukiyoCocokara & Co. | 317,400 | 14,749,936 |
| Mebuki Financial Group, Inc. | 974,800 | 2,620,445 |
| Meitec Corp. | 180,500 | 3,233,120 |
| Mitsubishi UFJ Financial Group, Inc. | 1,900,800 | 13,475,709 |
| Nihon M&A Center Holdings, Inc. | 386,200 | 3,219,992 |
| Nippon Telegraph & Telephone Corp. | 160,800 | 4,659,472 |
| ORIX Corp. | 681,900 | 12,221,698 |
| Round One Corp. | 1,798,200 | 6,831,228 |
| Ship Healthcare Holdings, Inc. | 503,100 | 9,080,371 |
| Takeda Pharmaceutical Co., Ltd. | 643,577 | 19,837,811 |
| Takuma Co., Ltd. | 360,900 | 3,633,964 |
| Uchida Yoko Co., Ltd. | 101,600 | 3,720,832 |
| 8 | Columbia Overseas Core Fund | Annual Report 2023 |
February 28, 2023
| Common Stocks (continued) | ||
| Issuer | Shares | Value ($) |
| USS Co., Ltd. | 469,100 | 7,610,513 |
| ValueCommerce Co., Ltd. | 134,200 | 1,652,058 |
| Total | 161,363,762 | |
| Netherlands 10.4% | ||
| ABN AMRO Bank NV | 553,244 | 9,762,647 |
| Adyen NV(a) | 3,381 | 4,792,331 |
| ASR Nederland NV | 241,930 | 11,010,445 |
| ING Groep NV | 941,050 | 13,170,108 |
| Koninklijke Ahold Delhaize NV | 537,098 | 17,053,884 |
| Prosus NV(a) | 175,296 | 12,566,835 |
| Shell PLC | 701,643 | 21,251,631 |
| Total | 89,607,881 | |
| Norway 1.6% | ||
| SalMar ASA | 132,243 | 5,482,150 |
| Yara International ASA | 172,032 | 8,178,198 |
| Total | 13,660,348 | |
| Russian Federation —% | ||
| Lukoil PJSC(b),(c),(d) | 33,398 | — |
| Singapore 2.5% | ||
| BW LPG Ltd. | 292,642 | 2,559,983 |
| DBS Group Holdings Ltd. | 263,500 | 6,685,295 |
| Venture Corp., Ltd. | 993,500 | 12,651,840 |
| Total | 21,897,118 | |
| South Africa 0.4% | ||
| Impala Platinum Holdings Ltd. | 355,562 | 3,319,842 |
| South Korea 2.2% | ||
| Hyundai Home Shopping Network Corp. | 64,469 | 2,509,985 |
| Samsung Electronics Co., Ltd. | 214,181 | 9,799,836 |
| Youngone Corp.(a) | 198,007 | 6,375,384 |
| Total | 18,685,205 | |
| Sweden 1.0% | ||
| Samhallsbyggnadsbolaget i Norden AB | 3,753,081 | 6,123,980 |
| Stillfront Group AB(a) | 1,198,537 | 2,206,416 |
| Total | 8,330,396 | |
| Common Stocks (continued) | ||
| Issuer | Shares | Value ($) |
| Switzerland 6.2% | ||
| Landis+Gyr Group AG(a) | 107,436 | 8,078,910 |
| Nestlé SA, Registered Shares | 76,823 | 8,655,697 |
| Novartis AG, Registered Shares | 65,598 | 5,520,736 |
| Roche Holding AG, Genusschein Shares | 38,801 | 11,187,841 |
| UBS AG | 929,360 | 20,199,869 |
| Total | 53,643,053 | |
| Taiwan 4.0% | ||
| Fubon Financial Holding Co., Ltd. | 7,157,425 | 13,995,730 |
| Parade Technologies Ltd. | 439,000 | 13,651,136 |
| Taiwan Semiconductor Manufacturing Co., Ltd., ADR | 38,973 | 3,393,379 |
| Tripod Technology Corp. | 971,000 | 3,325,470 |
| Total | 34,365,715 | |
| United Kingdom 14.9% | ||
| AstraZeneca PLC, ADR | 434,087 | 28,293,791 |
| British American Tobacco PLC | 521,533 | 19,737,830 |
| Crest Nicholson Holdings PLC | 917,327 | 2,695,773 |
| DCC PLC | 186,758 | 10,371,899 |
| Intermediate Capital Group PLC | 245,026 | 4,125,017 |
| JD Sports Fashion PLC | 6,167,108 | 13,426,831 |
| John Wood Group PLC(a) | 796,802 | 1,873,196 |
| Just Group PLC | 3,383,461 | 3,561,072 |
| Liberty Global PLC, Class C(a) | 683,087 | 14,515,599 |
| TP Icap Group PLC | 4,275,724 | 9,926,095 |
| Vodafone Group PLC | 15,878,666 | 19,012,712 |
| Total | 127,539,815 | |
| United States 5.8% | ||
| ACADIA Pharmaceuticals, Inc.(a) | 26,068 | 539,347 |
| Broadcom, Inc. | 13,230 | 7,862,457 |
| Burford Capital Ltd. | 747,792 | 6,094,505 |
| Insmed, Inc.(a) | 90,685 | 1,848,160 |
| Jazz Pharmaceuticals PLC(a) | 75,399 | 10,586,019 |
| Livent Corp.(a) | 332,158 | 7,789,105 |
| Primo Water Corp. | 890,471 | 13,784,491 |
| Quotient Ltd.(a) | 8,772 | 417 |
| Columbia Overseas Core Fund | Annual Report 2023 | 9 |
February 28, 2023
| Common Stocks (continued) | ||
| Issuer | Shares | Value ($) |
| Sage Therapeutics, Inc.(a) | 31,415 | 1,308,121 |
| Total | 49,812,622 | |
| Total Common Stocks (Cost $805,446,764) | 834,503,884 | |
| Exchange-Traded Equity Funds 2.3% | ||
| Shares | Value ($) | |
| United States 2.3% | ||
| iShares MSCI EAFE ETF | 283,439 | 19,656,495 |
| Total Exchange-Traded Equity Funds (Cost $20,176,919) | 19,656,495 | |
| Money Market Funds 0.3% | ||
| Shares | Value ($) | |
| Columbia Short-Term Cash Fund, 4.748%(e),(f) | 2,641,237 | 2,640,181 |
| Total Money Market Funds (Cost $2,640,172) | 2,640,181 | |
| Total Investments in Securities (Cost $828,263,855) | 856,800,560 | |
| Other Assets & Liabilities, Net | 1,509,760 | |
| Net Assets | $858,310,320 | |
| Forward foreign currency exchange contracts | |||||
| Currency to be sold | Currency to be purchased | Counterparty | Settlement date | Unrealized appreciation ($) | Unrealized depreciation ($) |
| 40,490,000 CAD | 30,202,539 USD | Morgan Stanley | 03/09/2023 | 526,687 | — |
| 1,658,000 EUR | 1,814,314 USD | Morgan Stanley | 03/09/2023 | 59,862 | — |
| 1,439,000 GBP | 1,783,030 USD | Morgan Stanley | 03/09/2023 | 51,894 | — |
| 1,857,102,000 JPY | 14,342,122 USD | Morgan Stanley | 03/09/2023 | 688,208 | — |
| 21,966,542,000 KRW | 17,672,198 USD | Morgan Stanley | 03/09/2023 | 1,060,747 | — |
| 159,028,000 NOK | 15,851,875 USD | Morgan Stanley | 03/09/2023 | 532,381 | — |
| 46,425,000 SEK | 4,387,266 USD | Morgan Stanley | 03/09/2023 | — | (49,413) |
| 1,468,457,000 TWD | 48,575,478 USD | Morgan Stanley | 03/09/2023 | 448,289 | — |
| 9,735,173 USD | 14,049,000 AUD | Morgan Stanley | 03/09/2023 | — | (279,011) |
| 5,261,450 USD | 7,070,000 CAD | Morgan Stanley | 03/09/2023 | — | (79,719) |
| 7,916,528 USD | 7,337,000 CHF | Morgan Stanley | 03/09/2023 | — | (120,130) |
| 7,087,555 USD | 48,781,000 DKK | Morgan Stanley | 03/09/2023 | — | (151,964) |
| 60,964,734 USD | 56,418,000 EUR | Morgan Stanley | 03/09/2023 | — | (1,264,692) |
| 14,107,859 USD | 11,610,000 GBP | Morgan Stanley | 03/09/2023 | — | (140,874) |
| 5,409,779 USD | 696,215,000 JPY | Morgan Stanley | 03/09/2023 | — | (291,019) |
| 14,127,952 USD | 22,224,000 NZD | Morgan Stanley | 03/09/2023 | — | (386,698) |
| 19,487,176 USD | 202,652,000 SEK | Morgan Stanley | 03/09/2023 | — | (120,422) |
| 10,657,921 USD | 14,087,000 SGD | Morgan Stanley | 03/09/2023 | — | (209,175) |
| Total | 3,368,068 | (3,093,117) | |||
| (a) | Non-income producing investment. |
| (b) | Represents fair value as determined in good faith under procedures approved by the Board of Trustees. At February 28, 2023, the total value of these securities amounted to $0, which represents less than 0.01% of total net assets. |
| (c) | Denotes a restricted security, which is subject to legal or contractual restrictions on resale under federal securities laws. Disposal of a restricted investment may involve time-consuming negotiations and expenses, and prompt sale at an acceptable price may be difficult to achieve. Private placement securities are generally considered to be restricted, although certain of those securities may be traded between qualified institutional investors under the provisions of Section 4(a)(2) and Rule 144A. The Fund will not incur any registration costs upon such a trade. These securities are valued at fair value determined in good faith under consistently applied procedures approved by the Fund’s Board of Trustees. At February 28, 2023, the total market value of these securities amounted to $0, which represents less than 0.01% of total net assets. Additional information on these securities is as follows: |
| Security | Acquisition Dates | Shares | Cost ($) | Value ($) |
| Lukoil PJSC | 01/25/2022-02/02/2022 | 33,398 | 2,752,771 | — |
| 10 | Columbia Overseas Core Fund | Annual Report 2023 |
February 28, 2023
| (d) | Valuation based on significant unobservable inputs. |
| (e) | The rate shown is the seven-day current annualized yield at February 28, 2023. |
| (f) | As defined in the Investment Company Act of 1940, as amended, an affiliated company is one in which the Fund owns 5% or more of the company’s outstanding voting securities, or a company which is under common ownership or control with the Fund. The value of the holdings and transactions in these affiliated companies during the year ended February 28, 2023 are as follows: |
| Affiliated issuers | Beginning of period($) | Purchases($) | Sales($) | Net change in unrealized appreciation (depreciation)($) | End of period($) | Realized gain (loss)($) | Dividends($) | End of period shares |
| Columbia Short-Term Cash Fund, 4.748% | ||||||||
| 3,955,509 | 328,183,777 | (329,499,109) | 4 | 2,640,181 | (1,273) | 142,233 | 2,641,237 | |
| ADR | American Depositary Receipt |
| AUD | Australian Dollar |
| CAD | Canada Dollar |
| CHF | Swiss Franc |
| DKK | Danish Krone |
| EUR | Euro |
| GBP | British Pound |
| JPY | Japanese Yen |
| KRW | South Korean Won |
| NOK | Norwegian Krone |
| NZD | New Zealand Dollar |
| SEK | Swedish Krona |
| SGD | Singapore Dollar |
| TWD | New Taiwan Dollar |
| USD | US Dollar |
| ■ | Level 1 — Valuations based on quoted prices for investments in active markets that the Fund has the ability to access at the measurement date. Valuation adjustments are not applied to Level 1 investments. |
| ■ | Level 2 — Valuations based on other significant observable inputs (including quoted prices for similar securities, interest rates, prepayment speeds, credit risks, etc.). |
| ■ | Level 3 — Valuations based on significant unobservable inputs (including the Fund’s own assumptions and judgment in determining the fair value of investments). |
| Columbia Overseas Core Fund | Annual Report 2023 | 11 |
February 28, 2023
Investments falling into the Level 3 category are primarily supported by quoted prices from brokers and dealers participating in the market for those investments. However, these may be classified as Level 3 investments due to lack of market transparency and corroboration to support these quoted prices. Additionally, valuation models may be used as the pricing source for any remaining investments classified as Level 3. These models may rely on one or more significant unobservable inputs and/or significant assumptions by the Investment Manager. Inputs used in valuations may include, but are not limited to, financial statement analysis, capital account balances, discount rates and estimated cash flows, and comparable company data.
| Level 1 ($) | Level 2 ($) | Level 3 ($) | Total ($) | |
| Investments in Securities | ||||
| Common Stocks | ||||
| Australia | — | 37,265,621 | — | 37,265,621 |
| Austria | — | 4,861,727 | — | 4,861,727 |
| Brazil | 3,337,900 | — | — | 3,337,900 |
| Canada | 49,351,869 | — | — | 49,351,869 |
| China | — | 11,977,225 | — | 11,977,225 |
| Denmark | — | 14,489,259 | — | 14,489,259 |
| Finland | — | 15,283,233 | — | 15,283,233 |
| France | 235,718 | 44,572,014 | — | 44,807,732 |
| Germany | — | 22,912,995 | — | 22,912,995 |
| Hong Kong | — | 3,868,316 | — | 3,868,316 |
| Ireland | 223,223 | 17,454,950 | — | 17,678,173 |
| Israel | 16,788,557 | 9,655,520 | — | 26,444,077 |
| Japan | — | 161,363,762 | — | 161,363,762 |
| Netherlands | — | 89,607,881 | — | 89,607,881 |
| Norway | — | 13,660,348 | — | 13,660,348 |
| Russian Federation | — | — | 0* | 0* |
| Singapore | — | 21,897,118 | — | 21,897,118 |
| South Africa | — | 3,319,842 | — | 3,319,842 |
| South Korea | — | 18,685,205 | — | 18,685,205 |
| Sweden | — | 8,330,396 | — | 8,330,396 |
| Switzerland | — | 53,643,053 | — | 53,643,053 |
| Taiwan | 3,393,379 | 30,972,336 | — | 34,365,715 |
| United Kingdom | 42,809,390 | 84,730,425 | — | 127,539,815 |
| United States | 49,812,205 | 417 | — | 49,812,622 |
| Total Common Stocks | 165,952,241 | 668,551,643 | 0* | 834,503,884 |
| Exchange-Traded Equity Funds | 19,656,495 | — | — | 19,656,495 |
| Money Market Funds | 2,640,181 | — | — | 2,640,181 |
| Total Investments in Securities | 188,248,917 | 668,551,643 | 0* | 856,800,560 |
| Investments in Derivatives | ||||
| Asset | ||||
| Forward Foreign Currency Exchange Contracts | — | 3,368,068 | — | 3,368,068 |
| Liability | ||||
| Forward Foreign Currency Exchange Contracts | — | (3,093,117) | — | (3,093,117) |
| Total | 188,248,917 | 668,826,594 | 0* | 857,075,511 |
| * | Rounds to zero. |
| 12 | Columbia Overseas Core Fund | Annual Report 2023 |
February 28, 2023
The Fund’s assets assigned to the Level 2 input category are generally valued using the market approach, in which a security’s value is determined through reference to prices and information from market transactions for similar or identical assets. These assets include certain foreign securities for which a third party statistical pricing service may be employed for purposes of fair market valuation. The model utilized by such third party statistical pricing service takes into account a security’s correlation to available market data including, but not limited to, intraday index, ADR, and exchange-traded fund movements.
| Columbia Overseas Core Fund | Annual Report 2023 | 13 |
February 28, 2023
| Assets | |
| Investments in securities, at value | |
| Unaffiliated issuers (cost $825,623,683) | $854,160,379 |
| Affiliated issuers (cost $2,640,172) | 2,640,181 |
| Unrealized appreciation on forward foreign currency exchange contracts | 3,368,068 |
| Receivable for: | |
| Investments sold | 1,898,378 |
| Capital shares sold | 104,290 |
| Dividends | 1,637,267 |
| Foreign tax reclaims | 1,638,904 |
| Expense reimbursement due from Investment Manager | 1,930 |
| Prepaid expenses | 9,494 |
| Total assets | 865,458,891 |
| Liabilities | |
| Due to custodian | 13,409 |
| Foreign currency (cost $178,770) | 178,770 |
| Unrealized depreciation on forward foreign currency exchange contracts | 3,093,117 |
| Payable for: | |
| Investments purchased | 3,366,455 |
| Capital shares purchased | 271,024 |
| Foreign capital gains taxes deferred | 881 |
| Management services fees | 19,921 |
| Distribution and/or service fees | 367 |
| Transfer agent fees | 45,999 |
| Compensation of board members | 83,489 |
| Compensation of chief compliance officer | 170 |
| Other expenses | 74,969 |
| Total liabilities | 7,148,571 |
| Net assets applicable to outstanding capital stock | $858,310,320 |
| Represented by | |
| Paid in capital | 897,405,405 |
| Total distributable earnings (loss) | (39,095,085) |
| Total - representing net assets applicable to outstanding capital stock | $858,310,320 |
| 14 | Columbia Overseas Core Fund | Annual Report 2023 |
February 28, 2023
| Class A | |
| Net assets | $47,249,723 |
| Shares outstanding | 5,037,646 |
| Net asset value per share | $9.38 |
| Maximum sales charge | 5.75% |
| Maximum offering price per share (calculated by dividing the net asset value per share by 1.0 minus the maximum sales charge for Class A shares) | $9.95 |
| Advisor Class | |
| Net assets | $189,019 |
| Shares outstanding | 20,101 |
| Net asset value per share | $9.40 |
| Class C | |
| Net assets | $1,493,941 |
| Shares outstanding | 160,928 |
| Net asset value per share | $9.28 |
| Institutional Class | |
| Net assets | $286,668,606 |
| Shares outstanding | 30,460,516 |
| Net asset value per share | $9.41 |
| Institutional 2 Class | |
| Net assets | $849,977 |
| Shares outstanding | 90,160 |
| Net asset value per share | $9.43 |
| Institutional 3 Class | |
| Net assets | $521,856,107 |
| Shares outstanding | 55,327,883 |
| Net asset value per share | $9.43 |
| Class R | |
| Net assets | $2,947 |
| Shares outstanding | 315 |
| Net asset value per share | $9.36 |
| Columbia Overseas Core Fund | Annual Report 2023 | 15 |
Year Ended February 28, 2023
| Net investment income | |
| Income: | |
| Dividends — unaffiliated issuers | $31,490,535 |
| Dividends — affiliated issuers | 142,233 |
| European Union tax reclaim | 192,773 |
| Foreign taxes withheld | (3,812,278) |
| Total income | 28,013,263 |
| Expenses: | |
| Management services fees | 7,850,696 |
| Distribution and/or service fees | |
| Class A | 119,735 |
| Class C | 19,244 |
| Class R | 15 |
| Transfer agent fees | |
| Class A | 67,772 |
| Advisor Class | 295 |
| Class C | 2,696 |
| Institutional Class | 441,222 |
| Institutional 2 Class | 422 |
| Institutional 3 Class | 34,926 |
| Class R | 4 |
| Compensation of board members | 24,750 |
| Custodian fees | 161,785 |
| Printing and postage fees | 47,394 |
| Registration fees | 135,894 |
| Audit fees | 46,652 |
| Legal fees | 25,926 |
| Interest on collateral | 13,057 |
| Interest on interfund lending | 2,799 |
| Compensation of chief compliance officer | 168 |
| Other | 46,595 |
| Total expenses | 9,042,047 |
| Fees waived or expenses reimbursed by Investment Manager and its affiliates | (520,108) |
| Fees waived by transfer agent | |
| Institutional 2 Class | (14) |
| Expense reduction | (20) |
| Total net expenses | 8,521,905 |
| Net investment income | 19,491,358 |
| Realized and unrealized gain (loss) — net | |
| Net realized gain (loss) on: | |
| Investments — unaffiliated issuers | (72,233,464) |
| Investments — affiliated issuers | (1,273) |
| Foreign currency translations | (193,351) |
| Forward foreign currency exchange contracts | 1,518,808 |
| Futures contracts | (477,883) |
| Options purchased | (384,355) |
| Options contracts written | 1,095,270 |
| Net realized loss | (70,676,248) |
| Net change in unrealized appreciation (depreciation) on: | |
| Investments — unaffiliated issuers | (30,906,757) |
| Investments — affiliated issuers | 4 |
| Foreign currency translations | (94,129) |
| Forward foreign currency exchange contracts | 766,905 |
| Options contracts written | 63,404 |
| Foreign capital gains tax | (881) |
| Net change in unrealized appreciation (depreciation) | (30,171,454) |
| Net realized and unrealized loss | (100,847,702) |
| Net decrease in net assets resulting from operations | $(81,356,344) |
| 16 | Columbia Overseas Core Fund | Annual Report 2023 |
| Year Ended February 28, 2023 | Year Ended February 28, 2022 | |
| Operations | ||
| Net investment income | $19,491,358 | $17,675,646 |
| Net realized gain (loss) | (70,676,248) | 41,781,419 |
| Net change in unrealized appreciation (depreciation) | (30,171,454) | (49,402,278) |
| Net increase (decrease) in net assets resulting from operations | (81,356,344) | 10,054,787 |
| Distributions to shareholders | ||
| Net investment income and net realized gains | ||
| Class A | (711,103) | (4,475,901) |
| Advisor Class | (3,199) | (24,634) |
| Class C | (30,685) | (210,035) |
| Institutional Class | (4,867,701) | (18,273,977) |
| Institutional 2 Class | (6,050) | (36,785) |
| Institutional 3 Class | (8,588,232) | (52,919,165) |
| Class R | (42) | (258) |
| Total distributions to shareholders | (14,207,012) | (75,940,755) |
| Increase (decrease) in net assets from capital stock activity | (46,696,535) | 233,287,464 |
| Total increase (decrease) in net assets | (142,259,891) | 167,401,496 |
| Net assets at beginning of year | 1,000,570,211 | 833,168,715 |
| Net assets at end of year | $858,310,320 | $1,000,570,211 |
| Columbia Overseas Core Fund | Annual Report 2023 | 17 |
| Year Ended | Year Ended | |||
| February 28, 2023 | February 28, 2022 | |||
| Shares | Dollars ($) | Shares | Dollars ($) | |
| Capital stock activity | ||||
| Class A | ||||
| Subscriptions | 417,180 | 3,782,989 | 440,480 | 5,026,131 |
| Distributions reinvested | 81,687 | 697,607 | 401,739 | 4,394,805 |
| Redemptions | (908,262) | (8,071,441) | (653,764) | (7,367,436) |
| Net increase (decrease) | (409,395) | (3,590,845) | 188,455 | 2,053,500 |
| Advisor Class | ||||
| Subscriptions | 286 | 2,538 | 3,182 | 37,260 |
| Distributions reinvested | 341 | 2,921 | 2,074 | 22,784 |
| Redemptions | (6,164) | (52,080) | (13,390) | (155,182) |
| Net decrease | (5,537) | (46,621) | (8,134) | (95,138) |
| Class C | ||||
| Subscriptions | 14,576 | 132,658 | 29,678 | 329,924 |
| Distributions reinvested | 3,401 | 28,907 | 17,841 | 196,304 |
| Redemptions | (118,762) | (1,041,494) | (141,615) | (1,615,193) |
| Net decrease | (100,785) | (879,929) | (94,096) | (1,088,965) |
| Institutional Class | ||||
| Subscriptions | 15,681,407 | 153,782,615 | 7,846,015 | 85,315,544 |
| Distributions reinvested | 568,340 | 4,864,990 | 1,671,172 | 18,258,565 |
| Redemptions | (12,654,681) | (112,948,653) | (2,459,012) | (28,436,361) |
| Net increase | 3,595,066 | 45,698,952 | 7,058,175 | 75,137,748 |
| Institutional 2 Class | ||||
| Subscriptions | 70,546 | 639,595 | 3,636 | 41,864 |
| Distributions reinvested | 701 | 6,009 | 3,340 | 36,506 |
| Redemptions | (25,357) | (225,576) | (2,997) | (34,437) |
| Net increase | 45,890 | 420,028 | 3,979 | 43,933 |
| Institutional 3 Class | ||||
| Subscriptions | 892,497 | 8,278,860 | 14,220,931 | 160,654,936 |
| Distributions reinvested | 1,002,123 | 8,588,191 | 4,836,826 | 52,918,883 |
| Redemptions | (11,594,370) | (105,165,171) | (4,967,797) | (56,337,433) |
| Net increase (decrease) | (9,699,750) | (88,298,120) | 14,089,960 | 157,236,386 |
| Total net increase (decrease) | (6,574,511) | (46,696,535) | 21,238,339 | 233,287,464 |
| 18 | Columbia Overseas Core Fund | Annual Report 2023 |
| Net asset value, beginning of period | Net investment income (loss) | Net realized and unrealized gain (loss) | Total from investment operations | Distributions from net investment income | Distributions from net realized gains | Total distributions to shareholders | |
| Class A | |||||||
| Year Ended 2/28/2023 | $10.23 | 0.16 | (0.88) | (0.72) | — | (0.13) | (0.13) |
| Year Ended 2/28/2022 | $10.89 | 0.17 | 0.02(f) | 0.19 | (0.27) | (0.58) | (0.85) |
| Year Ended 2/28/2021 | $8.99 | 0.06 | 2.06 | 2.12 | (0.05) | (0.17) | (0.22) |
| Year Ended 2/29/2020 | $9.36 | 0.09 | (0.11) | (0.02) | (0.31) | (0.04) | (0.35) |
| Year Ended 2/28/2019(g) | $10.00 | 0.25 | (0.81) | (0.56) | (0.08) | — | (0.08) |
| Advisor Class | |||||||
| Year Ended 2/28/2023 | $10.23 | 0.19 | (0.89) | (0.70) | — | (0.13) | (0.13) |
| Year Ended 2/28/2022 | $10.89 | 0.21 | 0.01(f) | 0.22 | (0.30) | (0.58) | (0.88) |
| Year Ended 2/28/2021 | $8.99 | 0.09 | 2.05 | 2.14 | (0.07) | (0.17) | (0.24) |
| Year Ended 2/29/2020 | $9.37 | 0.19 | (0.19) | 0.00 | (0.34) | (0.04) | (0.38) |
| Year Ended 2/28/2019(g) | $10.00 | 0.28 | (0.81) | (0.53) | (0.10) | — | (0.10) |
| Class C | |||||||
| Year Ended 2/28/2023 | $10.20 | 0.10 | (0.89) | (0.79) | — | (0.13) | (0.13) |
| Year Ended 2/28/2022 | $10.86 | 0.09 | 0.02(f) | 0.11 | (0.19) | (0.58) | (0.77) |
| Year Ended 2/28/2021 | $9.00 | (0.01) | 2.04 | 2.03 | — | (0.17) | (0.17) |
| Year Ended 2/29/2020 | $9.36 | 0.06 | (0.15) | (0.09) | (0.23) | (0.04) | (0.27) |
| Year Ended 2/28/2019(g) | $10.00 | 0.18 | (0.80) | (0.62) | (0.02) | — | (0.02) |
| Institutional Class | |||||||
| Year Ended 2/28/2023 | $10.24 | 0.19 | (0.89) | (0.70) | — | (0.13) | (0.13) |
| Year Ended 2/28/2022 | $10.89 | 0.19 | 0.04(f) | 0.23 | (0.30) | (0.58) | (0.88) |
| Year Ended 2/28/2021 | $9.00 | 0.13 | 2.00 | 2.13 | (0.07) | (0.17) | (0.24) |
| Year Ended 2/29/2020 | $9.37 | 0.19 | (0.18) | 0.01 | (0.34) | (0.04) | (0.38) |
| Year Ended 2/28/2019(g) | $10.00 | 0.38 | (0.91) | (0.53) | (0.10) | — | (0.10) |
| Institutional 2 Class | |||||||
| Year Ended 2/28/2023 | $10.25 | 0.16 | (0.85) | (0.69) | — | (0.13) | (0.13) |
| Year Ended 2/28/2022 | $10.90 | 0.20 | 0.04(f) | 0.24 | (0.31) | (0.58) | (0.89) |
| Year Ended 2/28/2021 | $9.00 | 0.10 | 2.05 | 2.15 | (0.08) | (0.17) | (0.25) |
| Year Ended 2/29/2020 | $9.38 | 0.19 | (0.18) | 0.01 | (0.35) | (0.04) | (0.39) |
| Year Ended 2/28/2019(g) | $10.00 | 0.28 | (0.81) | (0.53) | (0.09) | — | (0.09) |
| Institutional 3 Class | |||||||
| Year Ended 2/28/2023 | $10.25 | 0.19 | (0.88) | (0.69) | — | (0.13) | (0.13) |
| Year Ended 2/28/2022 | $10.91 | 0.21 | 0.03(f) | 0.24 | (0.32) | (0.58) | (0.90) |
| Year Ended 2/28/2021 | $9.00 | 0.12 | 2.05 | 2.17 | (0.09) | (0.17) | (0.26) |
| Year Ended 2/29/2020 | $9.38 | 0.21 | (0.19) | 0.02 | (0.36) | (0.04) | (0.40) |
| Year Ended 2/28/2019(g) | $10.00 | 0.29 | (0.81) | (0.52) | (0.10) | — | (0.10) |
| 20 | Columbia Overseas Core Fund | Annual Report 2023 |
| Net asset value, end of period | Total return | Total gross expense ratio to average net assets(a) | Total net expense ratio to average net assets(a),(b) | Net investment income (loss) ratio to average net assets | Portfolio turnover | Net assets, end of period (000’s) | |
| Class A | |||||||
| Year Ended 2/28/2023 | $9.38 | (6.89%) | 1.28%(c),(d) | 1.22%(c),(d),(e) | 1.74% | 60% | $47,250 |
| Year Ended 2/28/2022 | $10.23 | 1.38% | 1.27%(c),(d) | 1.22%(c),(d),(e) | 1.47% | 43% | $55,723 |
| Year Ended 2/28/2021 | $10.89 | 23.80% | 1.33%(c),(d) | 1.24%(c),(d),(e) | 0.59% | 39% | $57,243 |
| Year Ended 2/29/2020 | $8.99 | (0.46%) | 1.40% | 1.26% | 0.94% | 48% | $431 |
| Year Ended 2/28/2019(g) | $9.36 | (5.55%) | 1.65%(d),(h) | 1.28%(d),(h) | 2.64%(h) | 71% | $30 |
| Advisor Class | |||||||
| Year Ended 2/28/2023 | $9.40 | (6.69%) | 1.03%(c),(d) | 0.97%(c),(d),(e) | 2.05% | 60% | $189 |
| Year Ended 2/28/2022 | $10.23 | 1.64% | 1.02%(c),(d) | 0.97%(c),(d),(e) | 1.83% | 43% | $262 |
| Year Ended 2/28/2021 | $10.89 | 24.07% | 1.08%(c),(d) | 0.99%(c),(d),(e) | 0.91% | 39% | $368 |
| Year Ended 2/29/2020 | $8.99 | (0.30%) | 1.15% | 1.01% | 1.98% | 48% | $19 |
| Year Ended 2/28/2019(g) | $9.37 | (5.22%) | 1.40%(d),(h) | 1.03%(d),(h) | 2.95%(h) | 71% | $20 |
| Class C | |||||||
| Year Ended 2/28/2023 | $9.28 | (7.60%) | 2.03%(c),(d) | 1.97%(c),(d),(e) | 1.13% | 60% | $1,494 |
| Year Ended 2/28/2022 | $10.20 | 0.60% | 2.02%(c),(d) | 1.97%(c),(d),(e) | 0.82% | 43% | $2,670 |
| Year Ended 2/28/2021 | $10.86 | 22.80% | 2.07%(c),(d) | 1.99%(c),(d),(e) | (0.14%) | 39% | $3,863 |
| Year Ended 2/29/2020 | $9.00 | (1.17%) | 2.15% | 2.01% | 0.63% | 48% | $49 |
| Year Ended 2/28/2019(g) | $9.36 | (6.22%) | 2.40%(d),(h) | 2.03%(d),(h) | 1.89%(h) | 71% | $25 |
| Institutional Class | |||||||
| Year Ended 2/28/2023 | $9.41 | (6.68%) | 1.03%(c),(d) | 0.97%(c),(d),(e) | 2.05% | 60% | $286,669 |
| Year Ended 2/28/2022 | $10.24 | 1.73% | 1.02%(c),(d) | 0.97%(c),(d),(e) | 1.68% | 43% | $275,013 |
| Year Ended 2/28/2021 | $10.89 | 23.93% | 1.10%(c),(d) | 1.00%(c),(d),(e) | 1.40% | 39% | $215,765 |
| Year Ended 2/29/2020 | $9.00 | (0.19%) | 1.15% | 1.02% | 1.98% | 48% | $131,881 |
| Year Ended 2/28/2019(g) | $9.37 | (5.22%) | 1.37%(d),(h) | 1.03%(d),(h) | 4.47%(h) | 71% | $120,114 |
| Institutional 2 Class | |||||||
| Year Ended 2/28/2023 | $9.43 | (6.58%) | 0.97%(c),(d) | 0.90%(c),(d) | 1.78% | 60% | $850 |
| Year Ended 2/28/2022 | $10.25 | 1.81% | 0.95%(c),(d) | 0.90%(c),(d) | 1.77% | 43% | $454 |
| Year Ended 2/28/2021 | $10.90 | 24.16% | 0.99%(c),(d) | 0.90%(c),(d) | 1.02% | 39% | $439 |
| Year Ended 2/29/2020 | $9.00 | (0.18%) | 1.04% | 0.91% | 1.99% | 48% | $47 |
| Year Ended 2/28/2019(g) | $9.38 | (5.17%) | 1.25%(d),(h) | 0.93%(d),(h) | 3.02%(h) | 71% | $29 |
| Institutional 3 Class | |||||||
| Year Ended 2/28/2023 | $9.43 | (6.58%) | 0.90%(c),(d) | 0.85%(c),(d) | 2.13% | 60% | $521,856 |
| Year Ended 2/28/2022 | $10.25 | 1.78% | 0.89%(c),(d) | 0.84%(c),(d) | 1.85% | 43% | $666,445 |
| Year Ended 2/28/2021 | $10.91 | 24.34% | 0.94%(c),(d) | 0.84%(c),(d) | 1.21% | 39% | $555,487 |
| Year Ended 2/29/2020 | $9.00 | (0.11%) | 0.97% | 0.85% | 2.18% | 48% | $119,513 |
| Year Ended 2/28/2019(g) | $9.38 | (5.11%) | 1.19%(d),(h) | 0.87%(d),(h) | 3.14%(h) | 71% | $132,187 |
| Columbia Overseas Core Fund | Annual Report 2023 | 21 |
| Net asset value, beginning of period | Net investment income (loss) | Net realized and unrealized gain (loss) | Total from investment operations | Distributions from net investment income | Distributions from net realized gains | Total distributions to shareholders | |
| Class R | |||||||
| Year Ended 2/28/2023 | $10.23 | 0.13 | (0.87) | (0.74) | — | (0.13) | (0.13) |
| Year Ended 2/28/2022 | $10.88 | 0.15 | 0.02(f) | 0.17 | (0.24) | (0.58) | (0.82) |
| Year Ended 2/28/2021 | $8.99 | 0.20 | 1.88 | 2.08 | (0.02) | (0.17) | (0.19) |
| Year Ended 2/29/2020 | $9.36 | 0.18 | (0.22) | (0.04) | (0.29) | (0.04) | (0.33) |
| Year Ended 2/28/2019(g) | $10.00 | 0.26 | (0.84) | (0.58) | (0.06) | — | (0.06) |
| Notes to Financial Highlights | |
| (a) | In addition to the fees and expenses that the Fund bears directly, the Fund indirectly bears a pro rata share of the fees and expenses of any other funds in which it invests. Such indirect expenses are not included in the Fund’s reported expense ratios. |
| (b) | Total net expenses include the impact of certain fee waivers/expense reimbursements made by the Investment Manager and certain of its affiliates, if applicable. |
| (c) | Ratios include interest on collateral expense which is less than 0.01%. |
| (d) | Ratios include interfund lending expense which is less than 0.01%. |
| (e) | The benefits derived from expense reductions had an impact of less than 0.01%. |
| (f) | Calculation of the net gain (loss) per share (both realized and unrealized) does not correlate to the aggregate realized and unrealized gain (loss) presented in the Statement of Operations due to the timing of subscriptions and redemptions of Fund shares in relation to fluctuations in the market value of the portfolio. |
| (g) | The Fund commenced operations on March 5, 2018. Per share data and total return reflect activity from that date. |
| (h) | Annualized. |
| 22 | Columbia Overseas Core Fund | Annual Report 2023 |
| Net asset value, end of period | Total return | Total gross expense ratio to average net assets(a) | Total net expense ratio to average net assets(a),(b) | Net investment income (loss) ratio to average net assets | Portfolio turnover | Net assets, end of period (000’s) | |
| Class R | |||||||
| Year Ended 2/28/2023 | $9.36 | (7.09%) | 1.50%(c),(d) | 1.47%(c),(d),(e) | 1.46% | 60% | $3 |
| Year Ended 2/28/2022 | $10.23 | 1.18% | 1.51%(c),(d) | 1.47%(c),(d),(e) | 1.24% | 43% | $3 |
| Year Ended 2/28/2021 | $10.88 | 23.43% | 1.59%(c),(d) | 1.48%(c),(d),(e) | 2.33% | 39% | $3 |
| Year Ended 2/29/2020 | $8.99 | (0.73%) | 1.65% | 1.52% | 1.88% | 48% | $19 |
| Year Ended 2/28/2019(g) | $9.36 | (5.77%) | 1.90%(d),(h) | 1.53%(d),(h) | 2.91%(h) | 71% | $64 |
| Columbia Overseas Core Fund | Annual Report 2023 | 23 |
February 28, 2023
| 24 | Columbia Overseas Core Fund | Annual Report 2023 |
February 28, 2023
| Columbia Overseas Core Fund | Annual Report 2023 | 25 |
February 28, 2023
| 26 | Columbia Overseas Core Fund | Annual Report 2023 |
February 28, 2023
| Columbia Overseas Core Fund | Annual Report 2023 | 27 |
February 28, 2023
| Asset derivatives | ||
| Risk exposure category | Statement of assets and liabilities location | Fair value ($) |
| Foreign exchange risk | Unrealized appreciation on forward foreign currency exchange contracts | 3,368,068 |
| Liability derivatives | ||
| Risk exposure category | Statement of assets and liabilities location | Fair value ($) |
| Foreign exchange risk | Unrealized depreciation on forward foreign currency exchange contracts | 3,093,117 |
| Amount of realized gain (loss) on derivatives recognized in income | |||||
| Risk exposure category | Forward foreign currency exchange contracts ($) | Futures contracts ($) | Options contracts written ($) | Options contracts purchased ($) | Total ($) |
| Equity risk | — | (477,883) | 1,095,270 | (384,355) | 233,032 |
| Foreign exchange risk | 1,518,808 | — | — | — | 1,518,808 |
| Total | 1,518,808 | (477,883) | 1,095,270 | (384,355) | 1,751,840 |
| Change in unrealized appreciation (depreciation) on derivatives recognized in income | |||
| Risk exposure category | Forward foreign currency exchange contracts ($) | Options contracts written ($) | Total ($) |
| Equity risk | — | 63,404 | 63,404 |
| Foreign exchange risk | 766,905 | — | 766,905 |
| Total | 766,905 | 63,404 | 830,309 |
| Derivative instrument | Average notional amounts ($)* |
| Futures contracts — long | 109,507 |
| 28 | Columbia Overseas Core Fund | Annual Report 2023 |
February 28, 2023
| Derivative instrument | Average value ($) |
| Options contracts — purchased | 118,981** |
| Options contracts — written | (156,086)** |
| Derivative instrument | Average unrealized appreciation ($) | Average unrealized depreciation ($) |
| Forward foreign currency exchange contracts | 4,961,766** | (3,820,317)** |
| * | Based on the ending daily outstanding amounts for the year ended February 28, 2023. |
| ** | Based on the ending quarterly outstanding amounts for the year ended February 28, 2023. |
| Morgan Stanley ($) | |
| Assets | |
| Forward foreign currency exchange contracts | 3,368,068 |
| Liabilities | |
| Forward foreign currency exchange contracts | 3,093,117 |
| Total financial and derivative net assets | 274,951 |
| Total collateral received (pledged) (a) | 274,951 |
| Net amount (b) | - |
| (a) | In some instances, the actual collateral received and/or pledged may be more than the amount shown due to overcollateralization. |
| (b) | Represents the net amount due from/(to) counterparties in the event of default. |
| Columbia Overseas Core Fund | Annual Report 2023 | 29 |
February 28, 2023
| 30 | Columbia Overseas Core Fund | Annual Report 2023 |
February 28, 2023
| Columbia Overseas Core Fund | Annual Report 2023 | 31 |
February 28, 2023
| Effective rate (%) | |
| Class A | 0.14 |
| Advisor Class | 0.14 |
| Class C | 0.14 |
| Institutional Class | 0.14 |
| Institutional 2 Class | 0.07 |
| Institutional 3 Class | 0.01 |
| Class R | 0.13 |
| Front End (%) | CDSC (%) | Amount ($) | |
| Class A | 5.75 | 0.50 - 1.00(a) | 11,795 |
| Class C | — | 1.00(b) | 19 |
| (a) | This charge is imposed on certain investments of between $1 million and $50 million redeemed within 18 months after purchase, as follows: 1.00% if redeemed within 12 months after purchase, and 0.50% if redeemed more than 12, but less than 18, months after purchase, with certain limited exceptions. |
| (b) | This charge applies to redemptions within 12 months after purchase, with certain limited exceptions. |
| 32 | Columbia Overseas Core Fund | Annual Report 2023 |
February 28, 2023
| July 1, 2022 through June 30, 2023 | Prior to July 1, 2022 | |
| Class A | 1.22% | 1.24% |
| Advisor Class | 0.97 | 0.99 |
| Class C | 1.97 | 1.99 |
| Institutional Class | 0.97 | 0.99 |
| Institutional 2 Class | 0.90 | 0.90 |
| Institutional 3 Class | 0.85 | 0.85 |
| Class R | 1.47 | 1.49 |
| Undistributed net investment income ($) | Accumulated net realized (loss) ($) | Paid in capital ($) |
| 884,668 | (884,667) | (1) |
| Columbia Overseas Core Fund | Annual Report 2023 | 33 |
February 28, 2023
| Year Ended February 28, 2023 | Year Ended February 28, 2022 | ||||
| Ordinary income ($) | Long-term capital gains ($) | Total ($) | Ordinary income ($) | Long-term capital gains ($) | Total ($) |
| 249,728 | 13,957,284 | 14,207,012 | 26,538,226 | 49,402,529 | 75,940,755 |
| Undistributed ordinary income ($) | Undistributed long-term capital gains ($) | Capital loss carryforwards ($) | Net unrealized appreciation ($) |
| 16,347,578 | — | (65,247,319) | 10,045,875 |
| Federal tax cost ($) | Gross unrealized appreciation ($) | Gross unrealized (depreciation) ($) | Net unrealized appreciation ($) |
| 847,029,636 | 92,727,967 | (82,682,092) | 10,045,875 |
| No expiration short-term ($) | No expiration long-term ($) | Total ($) | Utilized ($) |
| (31,432,423) | (33,814,896) | (65,247,319) | — |
| 34 | Columbia Overseas Core Fund | Annual Report 2023 |
February 28, 2023
| Borrower or lender | Average loan balance ($) | Weighted average interest rate (%) | Number of days with outstanding loans |
| Borrower | 2,381,818 | 4.05 | 11 |
| Columbia Overseas Core Fund | Annual Report 2023 | 35 |
February 28, 2023
| 36 | Columbia Overseas Core Fund | Annual Report 2023 |
February 28, 2023
| Columbia Overseas Core Fund | Annual Report 2023 | 37 |
| 38 | Columbia Overseas Core Fund | Annual Report 2023 |
| Qualified dividend income | Dividends received deduction | Foreign taxes paid to foreign countries | Foreign taxes paid per share to foreign countries | Foreign source income | Foreign source income per share |
| 100.00% | 1.26% | $3,811,152 | $0.04 | $30,599,580 | $0.34 |
| Name, address, year of birth | Position held with the Columbia Funds and length of service | Principal occupation(s) during past five years and other relevant professional experience | Number of Funds in the Columbia Funds Complex* overseen | Other directorships held by Trustee during the past five years |
| George S. Batejan c/o Columbia Management Investment Advisers, LLC 290 Congress Street Boston, MA 02210 1954 | Trustee since 2017 | Executive Vice President, Global Head of Technology and Operations, Janus Capital Group, Inc., 2010-2016 | 176 | Former Chairman of the Board, NICSA (National Investment Company Services Association) (Executive Committee, Nominating Committee and Governance Committee), 2014-2016; former Director, Intech Investment Management, 2011-2016; former Board Member, Metro Denver Chamber of Commerce, 2015-2016; former Advisory Board Member, University of Colorado Business School, 2015-2018; former Board Member, Chase Bank International, 1993-1994 |
| Columbia Overseas Core Fund | Annual Report 2023 | 39 |
(Unaudited)
Independent trustees (continued)
| Name, address, year of birth | Position held with the Columbia Funds and length of service | Principal occupation(s) during past five years and other relevant professional experience | Number of Funds in the Columbia Funds Complex* overseen | Other directorships held by Trustee during the past five years |
| Kathleen Blatz c/o Columbia Management Investment Advisers, LLC 290 Congress Street Boston, MA 02210 1954 | Trustee since 2006 | Attorney, specializing in arbitration and mediation; Chief Justice, Minnesota Supreme Court, 1998-2006; Associate Justice, Minnesota Supreme Court, 1996-1998; Fourth Judicial District Court Judge, Hennepin County, 1994-1996; Attorney in private practice and public service, 1984-1993; State Representative, Minnesota House of Representatives, 1979-1993, which included service on the Tax and Financial Institutions and Insurance Committees; Member and Interim Chair, Minnesota Sports Facilities Authority, January-July 2017; Interim President and Chief Executive Officer, Blue Cross and Blue Shield of Minnesota (health care insurance), February-July 2018, April-October 2021 | 176 | Former Trustee, Blue Cross and Blue Shield of Minnesota, 2009-2021 (Chair of the Business Development Committee, 2014-2017; Chair of the Governance Committee, 2017-2019); former Member and Chair of the Board, Minnesota Sports Facilities Authority, January 2017-July 2017; former Director, Robina Foundation, 2009-2020 (Chair, 2014-2020); Director, Richard M. Schulze Family Foundation, since 2021 |
| Pamela G. Carlton c/o Columbia Management Investment Advisers, LLC 290 Congress Street Boston, MA 02210 1954 | Chair since 2023; Trustee since 2007 | President, Springboard — Partners in Cross Cultural Leadership (consulting company), since 2003; Managing Director of US Equity Research, JP Morgan Chase, 1999-2003; Director of US Equity Research, Chase Asset Management, 1996-1999; Co-Director Latin America Research, 1993-1996, COO Global Research, 1992-1996, Co-Director of US Research, 1991-1992, Investment Banker, 1982-1991, Morgan Stanley; Attorney, Cleary Gottlieb Steen & Hamilton LLP, 1980-1982 | 176 | Trustee, New York Presbyterian Hospital Board, since 1996; Director, DR Bank (Audit Committee) since 2017; Director, Evercore Inc. (Audit Committee, Nominating and Governance Committee), since 2019; Director, Apollo Commercial Real Estate Finance, Inc. (Chair, Nominating and Governance Committee), since 2021; the Governing Council of the Independent Directors Council (IDC), since 2021 |
| Janet Langford Carrig c/o Columbia Management Investment Advisers, LLC 290 Congress Street Boston, MA 02210 1957 | Trustee since 1996 | Senior Vice President, General Counsel and Corporate Secretary, ConocoPhillips (independent energy company), September 2007-October 2018 | 174 | Director, EQT Corporation (natural gas producer), since 2019; former Director, Whiting Petroleum Corporation (independent oil and gas company), 2020-2022 |
| J. Kevin Connaughton c/o Columbia Management Investment Advisers, LLC 290 Congress Street Boston, MA 02210 1964 | Trustee since 2020 | CEO and President, RhodeWay Financial (non-profit financial planning firm), since December 2022; Member, FINRA National Adjudicatory Council, since January 2020; Adjunct Professor of Finance, Bentley University since January 2018; Consultant to Independent Trustees of CFVIT and CFST I from March 2016 to June 2020 with respect to CFVIT and to December 2020 with respect to CFST I; Managing Director and General Manager of Mutual Fund Products, Columbia Management Investment Advisers, LLC, May 2010-February 2015; President, Columbia Funds, 2008-2015; and senior officer of Columbia Funds and affiliated funds, 2003-2015 | 174 | Former Director, The Autism Project, March 2015-December 2021; former Member of the Investment Committee, St. Michael’s College, November 2015-February 2020; former Trustee, St. Michael’s College, June 2017-September 2019; former Trustee, New Century Portfolios, January 2015-December 2017 |
| 40 | Columbia Overseas Core Fund | Annual Report 2023 |
(Unaudited)
Independent trustees (continued)
| Name, address, year of birth | Position held with the Columbia Funds and length of service | Principal occupation(s) during past five years and other relevant professional experience | Number of Funds in the Columbia Funds Complex* overseen | Other directorships held by Trustee during the past five years |
| Olive M. Darragh c/o Columbia Management Investment Advisers, LLC 290 Congress Street Boston, MA 02210 1962 | Trustee since 2020 | Managing Director of Darragh Inc. (strategy and talent management consulting firm), since 2010; Founder and CEO, Zolio, Inc. (investment management talent identification platform), since 2004; Consultant to Independent Trustees of CFVIT and CFST I from June 2019 to June 2020 with respect to CFVIT and to December 2020 with respect to CFST I; Partner, Tudor Investments, 2004-2010; Senior Partner, McKinsey & Company (consulting), 1990-2004; Touche Ross CPA, 1985-1988 | 174 | Treasurer, Edinburgh University US Trust Board; Member, HBS Community Action Partners Board; Former Director, University of Edinburgh Business School (Member of US Board); former Director, Boston Public Library Foundation |
| Patricia M. Flynn c/o Columbia Management Investment Advisers, LLC 290 Congress Street Boston, MA 02210 1950 | Trustee since 2004 | Professor of Economics and Management, Bentley University, since 2002; Dean, McCallum Graduate School of Business, Bentley University, 1992-2002 | 176 | Former Trustee, MA Taxpayers Foundation,1997-2022; former Governing Board Member (Chairperson of Innovation Index Advisory Committee), MA Technology Collaborative, 1997-2020; former Director, The MA Business Roundtable, 2003-2019 |
| Brian J. Gallagher c/o Columbia Management Investment Advisers, LLC 290 Congress Street Boston, MA 02210 1954 | Trustee since 2017 | Retired; Partner with Deloitte & Touche LLP and its predecessors, 1977-2016 | 176 | Trustee, Catholic Schools Foundation, since 2004 |
| Douglas A. Hacker c/o Columbia Management Investment Advisers, LLC 290 Congress Street Boston, MA 02210 1955 | Trustee since 1996 | Independent business executive, since May 2006; Executive Vice President – Strategy of United Airlines, December 2002 - May 2006; President of UAL Loyalty Services (airline marketing company), September 2001-December 2002; Executive Vice President and Chief Financial Officer of United Airlines, July 1999-September 2001 | 176 | Director, Spartan Nash Company (Chair of the Board) (food distributor); Director, Aircastle Limited (Chair of Audit Committee) (aircraft leasing); former Director, Nash Finch Company (food distributor), 2005-2013; former Director, SeaCube Container Leasing Ltd. (container leasing), 2010-2013; and former Director, Travelport Worldwide Limited (travel information technology), 2014-2019 |
| Nancy T. Lukitsh c/o Columbia Management Investment Advisers, LLC 290 Congress Street Boston, MA 02210 1956 | Trustee since 2011 | Senior Vice President, Partner and Director of Marketing, Wellington Management Company, LLP (investment adviser), 1997-2010; Chair, Wellington Management Portfolios (commingled non-U.S. investment pools), 2007-2010; Director, Wellington Trust Company, NA and other Wellington affiliates, 1997-2010 | 174 | None |
| Columbia Overseas Core Fund | Annual Report 2023 | 41 |
(Unaudited)
Independent trustees (continued)
| Name, address, year of birth | Position held with the Columbia Funds and length of service | Principal occupation(s) during past five years and other relevant professional experience | Number of Funds in the Columbia Funds Complex* overseen | Other directorships held by Trustee during the past five years |
| David M. Moffett c/o Columbia Management Investment Advisers, LLC 290 Congress Street Boston, MA 02210 1952 | Trustee since 2011 | Retired; former Chief Executive Officer of Freddie Mac and Chief Financial Officer of U.S. Bank | 174 | Director, CSX Corporation (transportation suppliers); Director, PayPal Holdings Inc. (payment and data processing services); Trustee, University of Oklahoma Foundation; former Director, eBay Inc. (online trading community), 2007-2015; and former Director, CIT Bank, CIT Group Inc. (commercial and consumer finance), 2010-2016; former Advisor to Bridgewater Associates and The Carlyle Group |
| Catherine James Paglia c/o Columbia Management Investment Advisers, LLC 290 Congress Street Boston, MA 02210 1952 | Trustee since 2004 | Director, Enterprise Asset Management, Inc. (private real estate and asset management company), since September 1998; Managing Director and Partner, Interlaken Capital, Inc., 1989-1997; Vice President, 1982-1985, Principal, 1985-1987, Managing Director, 1987-1989, Morgan Stanley; Vice President, Investment Banking, 1980-1982, Associate, Investment Banking, 1976-1980, Dean Witter Reynolds, Inc. | 176 | Director, Valmont Industries, Inc. (irrigation systems manufacturer), since 2012; Trustee, Carleton College (on the Investment Committee); Trustee, Carnegie Endowment for International Peace (on the Investment Committee) |
| Natalie A. Trunow c/o Columbia Management Investment Advisers, LLC 290 Congress Street Boston, MA 02210 1967 | Trustee since 2020 | Chief Executive Officer, Millennial Portfolio Solutions LLC (asset management and consulting services), January 2016-January 2021; Non-executive Member of the Investment Committee and Valuation Committee, Sarona Asset Management Inc. (private equity firm) since September 2019; Advisor, Horizon Investments (asset management and consulting services), August 2018-January 2022; Advisor, Paradigm Asset Management, November 2016-January 2022; Consultant to Independent Trustees of CFVIT and CFST I from September 2016 to June 2020 with respect to CFVIT and to December 2020 with respect to CFST I; Director of Investments/Consultant, Casey Family Programs, April 2016-November 2016; Senior Vice President and Chief Investment Officer, Calvert Investments, August 2008-January 2016; Section Head and Portfolio Manager, General Motors Asset Management, June 1997-August 2008 | 174 | Independent Director, Investment Committee, Health Services for Children with Special Needs, Inc., 2010-2021; Independent Director, (Executive Committee and Chair, Audit Committee), Consumer Credit Counseling Services (formerly Guidewell Financial Solutions), since 2016; Independent Director, (Investment Committee), Sarona Asset Management, since 2019 |
| Sandra L. Yeager c/o Columbia Management Investment Advisers, LLC 290 Congress Street Boston, MA 02210 1964 | Trustee since 2017 | Retired; President and founder, Hanoverian Capital, LLC (SEC registered investment advisor firm), 2008-2016; Managing Director, DuPont Capital, 2006-2008; Managing Director, Morgan Stanley Investment Management, 2004-2006; Senior Vice President, Alliance Bernstein, 1990-2004 | 176 | Former Director, NAPE Education Foundation, October 2016-October 2020; Advisory Board, Jennersville YMCA, since 2022 |
| 42 | Columbia Overseas Core Fund | Annual Report 2023 |
(Unaudited)
| * | The term “Columbia Funds Complex” as used herein includes Columbia Seligman Premium Technology Growth Fund, Tri-Continental Corporation and each series of Columbia Funds Series Trust (CFST), Columbia Funds Series Trust I (CFST I), Columbia Funds Series Trust II (CFST II), Columbia ETF Trust I (CET I), Columbia ETF Trust II (CET II), Columbia Funds Variable Insurance Trust (CFVIT) and Columbia Funds Variable Series Trust II (CFVST II). Messrs. Batejan, Beckman, Gallagher and Hacker and Mses. Blatz, Carlton, Carrig, Flynn, Paglia and Yeager serve as Directors of Columbia Seligman Premium Technology Growth Fund and Tri-Continental Corporation. |
| Name, address, year of birth | Position held with the Columbia Funds and length of service | Principal occupation(s) during the past five years and other relevant professional experience | Number of Funds in the Columbia Funds Complex overseen | Other directorships held by Trustee during the past five years |
| Daniel J. Beckman c/o Columbia Management Investment Advisers, LLC 290 Congress Street Boston, MA 02210 1962 | Trustee since November 2021 and President since June 2021 | Vice President – Head of North America Product, Columbia Management Investment Advisers, LLC, since April 2015; President and Principal Executive Officer of the Columbia Funds, since June 2021; officer of Columbia Funds and affiliated funds, 2020-2021 | 176 | Director, Ameriprise Trust Company, since October 2016; Director, Columbia Management Investment Distributors, Inc. since November 2018; Board of Governors, Columbia Wanger Asset Management, LLC since, January 2022; Director, Columbia Threadneedle Canada, Inc., since December 2022 |
| * | Interested person (as defined under the 1940 Act) by reason of being an officer, director, security holder and/or employee of the Investment Manager or Ameriprise Financial. |
| Name, address and year of birth | Position and year first appointed to position for any Fund in the Columbia Funds Complex or a predecessor thereof | Principal occupation(s) during past five years |
| Michael G. Clarke 290 Congress Street Boston, MA 02210 1969 | Chief Financial Officer and Principal Financial Officer (2009) and Senior Vice President (2019) | Senior Vice President and Head of Global Operations & Investor Services, Columbia Management Investment Advisers, LLC, since March 2022 (previously Vice President, Head of North American Operations, and Co-Head of Global Operations, June 2019 to February 2022 and Vice President – Accounting and Tax, May 2010 - May 2019); senior officer of Columbia Funds and affiliated funds, since 2002. |
| Joseph Beranek 5890 Ameriprise Financial Center Minneapolis, MN 55474 1965 | Treasurer and Chief Accounting Officer (Principal Accounting Officer) (2019) and Principal Financial Officer (2020), CFST, CFST I, CFST II, CFVIT and CFVST II; Assistant Treasurer, CET I and CET II | Vice President – Mutual Fund Accounting and Financial Reporting, Columbia Management Investment Advisers, LLC, since December 2018 and March 2017, respectively. |
| Columbia Overseas Core Fund | Annual Report 2023 | 43 |
(Unaudited)
Fund officers (continued)
| Name, address and year of birth | Position and year first appointed to position for any Fund in the Columbia Funds Complex or a predecessor thereof | Principal occupation(s) during past five years |
| Marybeth Pilat 290 Congress Street Boston, MA 02210 1968 | Treasurer and Chief Accounting Officer (Principal Accounting Officer) and Principal Financial Officer (2020) for CET I and CET II; Assistant Treasurer, CFST, CFST I, CFST II, CFVIT and CFVST II | Vice President – Product Pricing and Administration, Columbia Management Investment Advisers, LLC, since May 2017. |
| William F. Truscott 290 Congress Street Boston, MA 02210 1960 | Senior Vice President (2001) | Formerly, Trustee/Director of Columbia Funds Complex or legacy funds, November 2001-January 1, 2021; Chief Executive Officer, Global Asset Management, Ameriprise Financial, Inc., since September 2012; Chairman of the Board and President, Columbia Management Investment Advisers, LLC, since July 2004 and February 2012, respectively; Chairman of the Board and Chief Executive Officer, Columbia Management Investment Distributors, Inc., since November 2008 and February 2012, respectively; Chairman of the Board and Director, Threadneedle Asset Management Holdings, Sàrl, since March 2013 and December 2008, respectively; senior executive of various entities affiliated with Columbia Threadneedle. |
| Christopher O. Petersen 5228 Ameriprise Financial Center Minneapolis, MN 55474 1970 | Senior Vice President and Assistant Secretary (2021) | Formerly, Trustee/Director of funds within the Columbia Funds Complex, July 1, 2020 - November 22, 2021; Senior Vice President and Assistant General Counsel, Ameriprise Financial, Inc., since September 2021 (previously Vice President and Lead Chief Counsel, January 2015 - September 2021); formerly, President and Principal Executive Officer of the Columbia Funds, 2015 - 2021; officer of Columbia Funds and affiliated funds, since 2007. |
| Thomas P. McGuire 290 Congress Street Boston, MA 02210 1972 | Senior Vice President and Chief Compliance Officer (2012) | Vice President – Asset Management Compliance, Ameriprise Financial, Inc., since May 2010; Chief Compliance Officer, Columbia Acorn/Wanger Funds, since December 2015; formerly, Chief Compliance Officer, Ameriprise Certificate Company, September 2010 – September 2020. |
| Ryan C. Larrenaga 290 Congress Street Boston, MA 02210 1970 | Senior Vice President (2017), Chief Legal Officer (2017), and Secretary (2015) | Vice President and Chief Counsel, Ameriprise Financial, Inc., since August 2018 (previously Vice President and Group Counsel, August 2011 - August 2018); Chief Legal Officer, Columbia Acorn/Wanger Funds, since September 2020; officer of Columbia Funds and affiliated funds, since 2005. |
| Michael E. DeFao 290 Congress Street Boston, MA 02210 1968 | Vice President (2011) and Assistant Secretary (2010) | Vice President and Chief Counsel, Ameriprise Financial, Inc., since May 2010; Vice President, Chief Legal Officer and Assistant Secretary, Columbia Management Investment Advisers, LLC, since October 2021 (previously Vice President and Assistant Secretary, May 2010 – September 2021). |
| Lyn Kephart-Strong 5228 Ameriprise Financial Center Minneapolis, MN 55474 1960 | Vice President (2015) | Vice President, Global Investment Operations Services, Columbia Management Investment Advisers, LLC, since 2010; President, Columbia Management Investment Services Corp., since October 2014; President, Ameriprise Trust Company, since January 2017. |
| 44 | Columbia Overseas Core Fund | Annual Report 2023 |
columbiathreadneedleus.com/investor/. The Fund is distributed by Columbia Management Investment Distributors, Inc., member FINRA, and managed by Columbia Management Investment Advisers, LLC.
Item 2. Code of Ethics.
(a) | The registrant has adopted a code of ethics that applies to the registrant’s principal executive officer, principal financial officer, principal accounting officer or controller, or persons performing similar functions, regardless of whether these individuals are employed by the registrant or a third party. |
(b) | During the period covered by this report, there were not any amendments to a provision of the code of ethics that applies to the registrant’s principal executive officer, principal financial officer, principal accounting officer or controller, or persons performing similar functions, regardless of whether these individuals are employed by the registrant or a third party, and that relates to any element of the code of ethics definition enumerated in paragraph (b) of this Item. |
(c) | During the period covered by this report, there were no waivers, including any implicit waivers, from a provision of the code of ethics to the registrant’s principal executive officer, principal financial officer, principal accounting officer or controller, or persons performing similar functions, regardless of whether these individuals are employed by the registrant or a third party that relates to one or more of the items set forth in paragraph (b) of this Item. |
Item 3. Audit Committee Financial Expert.
The registrant’s Board of Trustees has determined that David M. Moffett, Brian J. Gallagher, J. Kevin Connaughton, Sandra L. Yeager, and Douglas A. Hacker, each of whom are members of the registrant’s Board of Trustees and Audit Committee, each qualify as an audit committee financial expert. Mr. Moffett, Mr. Gallagher, Mr. Connaughton, Ms. Yeager, and Mr. Hacker are each independent trustees, as defined in paragraph (a)(2) of this item’s instructions.
Item 4. Principal Accountant Fees and Services.
Fee information below is disclosed for the two series of the registrant whose reports to stockholders are included in this annual filing.
(a) Audit Fees. Aggregate Audit Fees billed by the principal accountant for professional services rendered during the fiscal years ended February 28, 2023 and February 28, 2022 are approximately as follows:
2023 | 2022 |
$60,200 | $59,000 |
Audit Fees include amounts related to the audit of the registrant’s annual financial statements or services that are normally provided by the accountant in connection with statutory and regulatory filings or engagements for those fiscal years.
(b) Audit-Related Fees. Aggregate Audit-Related Fees billed to the registrant by the principal accountant for professional services rendered during the fiscal years ended February 28, 2023 and February 28, 2022 are approximately as follows:
2023 | 2022 |
$0 | $29,600 |
Audit-Related Fees include amounts for assurance and related services by the principal accountant that are reasonably related to the performance of the audit of the registrant’s financial statements and are not reported in Audit Fees above.
During the fiscal years ended February 28, 2023 and February 28, 2022, there were no Audit-Related Fees billed by the registrant’s principal accountant to the registrant’s investment adviser (not including any sub-adviser whose role is primarily portfolio management and is subcontracted with or overseen by another investment adviser) and any entity controlling, controlled by, or under common control with the adviser that provides ongoing services to the registrant for an engagement that related directly to the operations and financial reporting of the registrant.
(c) Tax Fees. Aggregate Tax Fees billed by the principal accountant to the registrant for professional services rendered during the fiscal years ended February 28, 2023 and February 28, 2022 are approximately as follows:
2023 | 2022 |
$25,000 | $14,100 |
Tax Fees include amounts for the review of annual tax returns, the review of required shareholder distribution calculations and typically include amounts for professional services by the principal accountant for tax compliance, tax advice and tax planning.
During the fiscal years ended February 28, 2023 and February 28, 2022, there were no Tax Fees billed by the registrant’s principal accountant to the registrant’s investment adviser (not including any sub-adviser whose role is primarily portfolio management and is subcontracted with or overseen by another investment adviser) and any entity controlling, controlled by, or under common control with the adviser that provides ongoing services to the registrant for an engagement that related directly to the operations and financial reporting of the registrant.
(d) All Other Fees. Aggregate All Other Fees billed by the principal accountant to the registrant for professional services rendered during the fiscal years ended February 28, 2023 and February 28, 2022 are approximately as follows:
2023 | 2022 |
$0 | $0 |
All Other Fees, if any, include amounts for products and services provided by the principal accountant, other than the services reported in paragraphs (a) through (c) above.
Aggregate All Other Fees billed by the registrant’s principal accountant to the registrant’s investment adviser (not including any sub-adviser whose role is primarily portfolio management and is subcontracted with or overseen by another investment adviser) and any entity controlling, controlled by, or under common control with the adviser that provides ongoing services to the registrant for an engagement that related directly to the operations and financial reporting of the registrant during the fiscal years ended February 28, 2023 and February 28, 2022 are approximately as follows:
2023 | 2022 |
$541,000 | $535,000 |
In fiscal years 2023 and 2022, All Other Fees primarily consists of fees billed for internal control examinations of the registrant’s transfer agent and investment adviser.
(e)(1) Audit Committee Pre-Approval Policies and Procedures
The registrant’s Audit Committee is required to pre-approve the engagement of the registrant’s independent auditors to provide audit and non-audit services to the registrant and non-audit services to its investment adviser (excluding any sub-adviser whose role is primarily portfolio management and is sub-contracted or overseen by another investment adviser (the “Adviser”) or any entity controlling, controlled by or under common control with the Adviser that provides ongoing services to the Fund (a “Control Affiliate”) if the engagement relates directly to the operations and financial reporting of the registrant.
The Audit Committee has adopted a Policy for Engagement of Independent Auditors for Audit and Non-Audit Services (the “Policy”). The Policy sets forth the understanding of the Audit Committee regarding the engagement of the registrant’s independent accountants to provide (i) audit and permissible audit-related, tax and other services to the registrant (“Fund Services”); (ii) non-audit services to the registrant’s Adviser and any Control Affiliates, that relates directly to the operations and financial reporting of a Fund (“Fund-related Adviser Services”); and (iii) certain other audit and non-audit services to the registrant’s Adviser and its Control Affiliates. A service will require specific pre-approval by the Audit Committee if it is to be provided by the Fund’s independent auditor; provided, however, that pre-approval of non-audit services to the Fund, the Adviser or Control Affiliates may be waived if certain de minimis requirements set forth in the SEC’s rules are met.
Under the Policy, the Audit Committee may delegate pre-approval authority to any pre-designated member or members who are independent board members. The member(s) to whom such authority is delegated must report, for informational purposes only, any pre-approval decisions to the Audit Committee at its next regular meeting. The Audit Committee's responsibilities with respect to the pre-approval of services performed by the independent auditor may not be delegated to management.
On an annual basis, at a regularly scheduled Audit Committee meeting, the Fund’s Treasurer or other Fund officer shall submit to the Audit Committee a schedule of the types of Fund Services and Fund-related Adviser Services that are subject to specific pre-approval. This schedule will provide a description of each type of service that is subject to specific pre-approval, along with total projected fees for each service. The pre-approval will generally cover a one-year period. The Audit Committee will review and approve the types of services and the projected fees for the next one-year period and may add to, or subtract from, the list of pre-approved services from time to time, based on subsequent determinations. This specific approval acknowledges that the Audit Committee is in agreement with the specific types of services that the independent auditor will be permitted to perform and the projected fees for each service.
The Fund’s Treasurer or other Fund officer shall report to the Audit Committee at each of its regular meetings regarding all Fund Services or Fund-related Adviser Services provided since the last such report was rendered, including a description of the services, by category, with forecasted fees for the annual reporting period, proposed changes requiring specific pre-approval and a description of services provided by the independent auditor, by category, with actual fees during the current reporting period.
*****
(e)(2) None, or 0%, of the Audit-Related Fees, Tax Fees and All Other Fees paid by the Fund or affiliated entities relating directly to the operations and financial reporting of the Registrant disclosed above were approved by the audit committee pursuant to paragraphs (c)(7)(i)(C) of Rule 2-01 of Regulation S-X (which permits audit committee approval after the start of the engagement with respect to services other than audit, review or attest services, if certain conditions are satisfied).
(f) Not applicable.
(g) The aggregate non-audit fees billed by the registrant’s accountant for services rendered to the registrant, and rendered to the registrant’s investment adviser (not including any sub-adviser whose role is primarily portfolio management and is subcontracted with or overseen by another investment adviser), and any entity controlling, controlled by, or under common control with the adviser that provides ongoing services to the registrant for the fiscal years ended February 28, 2023 and February 28, 2022 are approximately as follows:
2023 | 2022 |
$566,000 | $579,000 |
(h) The registrant’s Audit Committee of the Board of Directors has considered whether the provision of non-audit services that were rendered to the registrant’s adviser (not including any sub-adviser whose role is primarily portfolio management and is subcontracted with or overseen by another investment adviser), and any entity controlling, controlled by, or under common control with the investment adviser that provides ongoing services to the registrant that were not pre-approved pursuant to paragraph (c)(7)(ii) of Rule 2-01 of Regulation S-X, is compatible with maintaining the principal accountant’s independence.
Item 5. Audit Committee of Listed Registrants.
Not applicable.
Item 6. Investments
(a) | The registrant’s “Schedule I – Investments in securities of unaffiliated issuers” (as set forth in 17 CFR 210.12-12) is included in Item 1 of this Form N-CSR. |
(b) | Not applicable. |
Item 7. Disclosure of Proxy Voting Policies and Procedures for Closed-End Management Investment Companies.
Not applicable.
Item 8. Portfolio Managers of Closed-End Management Investment Companies.
Not applicable.
Item 9. Purchases of Equity Securities by Closed-End Management Investment Company and Affiliated Purchasers.
Not applicable.
Item 10. Submission of Matters to a Vote of Security Holders.
There were no material changes to the procedures by which shareholders may recommend nominees to the registrant's board of directors.
Item 11. Controls and Procedures.
(a) | The registrant’s principal executive officer and principal financial officer, based on their evaluation of the registrant’s disclosure controls and procedures as of a date within 90 days of the filing of this report, have concluded that such controls and procedures are adequately designed to ensure that information required to be disclosed by the registrant in Form N-CSR is accumulated and communicated to the registrant’s management, including the principal executive officer and principal financial officer, or persons performing similar functions, as appropriate to allow timely decisions regarding required disclosure. |
(b) | There was no change in the registrant's internal control over financial reporting that occurred during the period covered by this report that has materially affected, or is reasonably likely to materially affect, the registrant's internal control over financial reporting. |
Item 12. Disclosure of Securities Lending Activities for Closed-End Management Investment Companies
Not applicable.
Item 13. Exhibits.
SIGNATURES
Pursuant to the requirements of the Securities Exchange Act of 1934 and the Investment Company Act of 1940, the registrant has duly caused this report to be signed on its behalf by the undersigned, thereunto duly authorized.
(registrant) | Columbia Funds Series Trust II |
|
|
By (Signature and Title) | /s/ Daniel J. Beckman |
| Daniel J. Beckman, President and Principal Executive Officer |
|
|
Date | April 21, 2023 |
|
|
|
|
Pursuant to the requirements of the Securities Exchange Act of 1934 and the Investment Company Act of 1940, this report has been signed below by the following persons on behalf of the registrant and in the capacities and on the dates indicated.
By (Signature and Title) | /s/ Daniel J. Beckman |
| Daniel J. Beckman, President and Principal Executive Officer |
|
|
Date | April 21, 2023 |
By (Signature and Title) | /s/ Michael G. Clarke |
| Michael G. Clarke, Chief Financial Officer, |
| Principal Financial Officer and Senior Vice President |
|
|
Date | April 21, 2023 |
By (Signature and Title) | /s/ Joseph Beranek |
| Joseph Beranek, Treasurer, Chief Accounting |
| Officer and Principal Financial Officer |
|
|
Date | April 21, 2023 |