united states
securities and exchange commission
washington, d.c. 20549
form n-csr
certified shareholder report of registered management
investment companies
| Investment Company Act file number | 811-21872 |
| Mutual Fund Series Trust |
| (Exact name of registrant as specified in charter) |
| 225 Pictoria Drive, Suite 450, Cincinnati, OH | 45246 |
| (Address of principal executive offices) | (Zip code) |
| CT CORPORATION SYSTEM |
| 1300 EAST NINTH STREET, CLEVELAND, OH 44114 |
| (Name and address of agent for service) |
| Registrant’s telephone number, including area code: | 631-470-2600 |
| Date of fiscal year end: | 6/30 |
| | |
| Date of reporting period: | 6/30/2024 |
Item 1. Reports to Stockholders.
(a)
0001355064mfst:C000128969Membermfst:FinancialsSectorMember2024-06-30
Catalyst Enhanced Income Strategy Fund
Annual Shareholder Report - June 30, 2024
This annual shareholder report contains important information about Catalyst Enhanced Income Strategy Fund for the period of July 1, 2023 to June 30, 2024. You can find additional information about the Fund at https://catalystmf.com/literature-and-forms/. You can also request this information by contacting us at 1-866-447-4228.
What were the Fund’s costs for the last year?
(based on a hypothetical $10,000 investment)
| Class Name | Costs of a $10,000 investment | Costs paid as a percentage of a $10,000 investment |
|---|
| Class A | $178 | 1.78% |
How did the Fund perform during the reporting period?
This past year has been challenging for most subsectors within fixed income as persistent inflation and thus elevated interest rates have caused most fixed income assets to go sideways. Fortunately, due to the credit strength of our investments and our tactful investment thesis, we have fared considerably better than our benchmark historically. During the last year, duration rallied considerably; however, the Fund has much less exposure to interest rate duration and thus underperformed its benchmark.
Due to macro uncertainty and higher rates, investments in the Fund now yield more than they have in years and are less volatile than they were in the past. For example, before the 2022 bond rout, generic Non-agency RMBS senior bonds yielded 3-5% and now yield 7-12%. They are generally less volatile now than they were then due to amortization and continued strength in the housing market.
We have added and continue to optimistically add agency inverse interest only securities (IIO). These bonds benefit from the front end of the rate curve going lower, which would drive the coupon higher, hence the term inverse. This small position serves as a bit of a macro hedge in the event of large market disruption or recession. We anticipate the interest rate curve steepening towards the end of this year and into 2025, which would be beneficial for this position. This small position can have an outsized impact on total return for the fund.
Over the past year, we have maintained an allocation to select commercial mortgage-backed securities. While these securities provided positive performance in the past, they came under significant pressure late in 2022 and 2023. We did sell some bonds at the end of 2023/early 2024 as this subsector rallied. We find this sector to be one of the best opportunities in fixed income, albeit with specific asset selection.
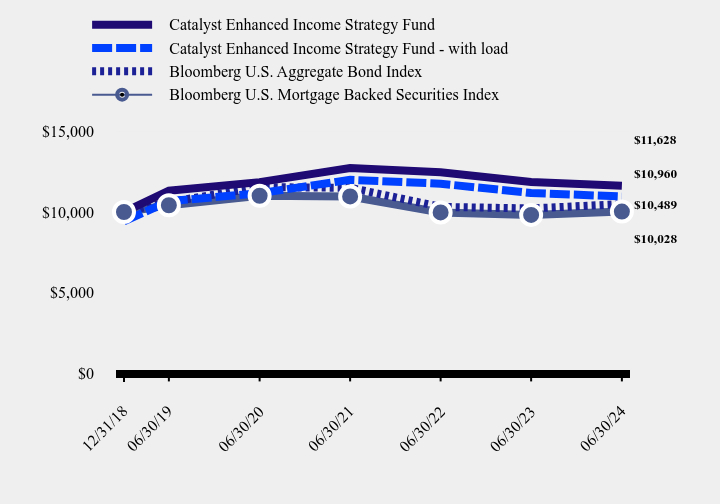
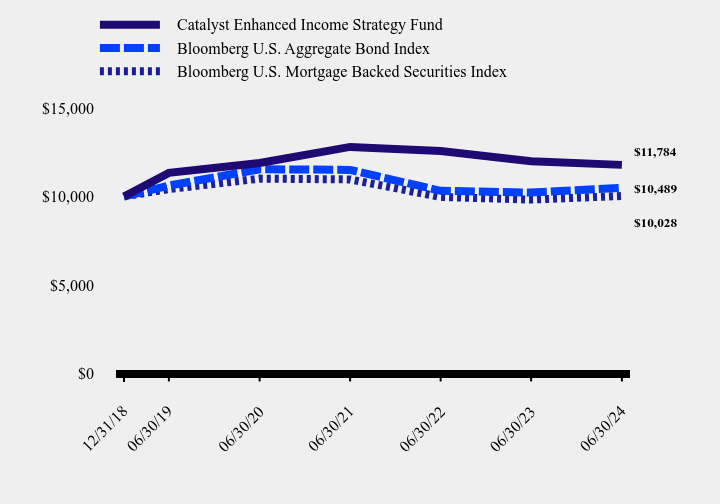
How has the Fund performed since inception?
Total Return Based on $10,000 Investment
| Catalyst Enhanced Income Strategy Fund | Catalyst Enhanced Income Strategy Fund - with load | Bloomberg U.S. Aggregate Bond Index | Bloomberg U.S. Mortgage Backed Securities Index |
|---|
| 12/31/18 | $10,000 | $9,425 | $10,000 | $10,000 |
| 06/30/19 | $11,318 | $10,668 | $10,611 | $10,417 |
| 06/30/20 | $11,850 | $11,168 | $11,539 | $11,008 |
| 06/30/21 | $12,726 | $11,994 | $11,500 | $10,962 |
| 06/30/22 | $12,467 | $11,750 | $10,317 | $9,972 |
| 06/30/23 | $11,862 | $11,180 | $10,220 | $9,821 |
| 06/30/24 | $11,628 | $10,960 | $10,489 | $10,028 |
Average Annual Total Returns
| 1 Year | 5 Years | Since Inception (12/31/2018) |
|---|
| Catalyst Enhanced Income Strategy Fund | | | |
| Without Load | | 0.54% | 2.78% |
| With Load | | | 1.68% |
| Bloomberg U.S. Aggregate Bond Index | 2.63% | | 0.87% |
| Bloomberg U.S. Mortgage Backed Securities Index | 2.12% | | 0.05% |
The Fund's past performance is not a good predictor of how the Fund will perform in the future. The graph and table do not reflect the deduction of taxes that a shareholder would pay on fund distributions or redemption of fund shares.
- Net Assets$219,641,002
- Number of Portfolio Holdings312
- Advisory Fee (net of waivers)$3,359,700
- Portfolio Turnover13%
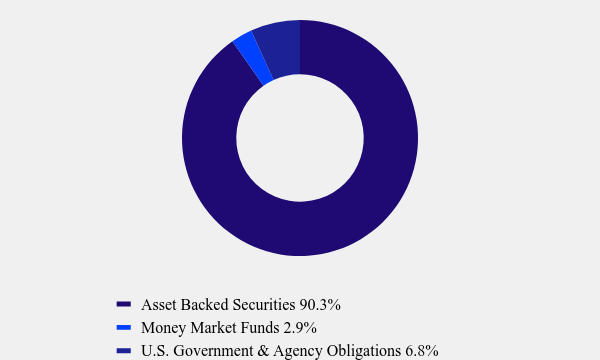
Asset Weighting (% of total investments)
| Value | Value |
|---|
| Asset Backed Securities | 90.3% |
| Money Market Funds | 2.9% |
| U.S. Government & Agency Obligations | 6.8% |
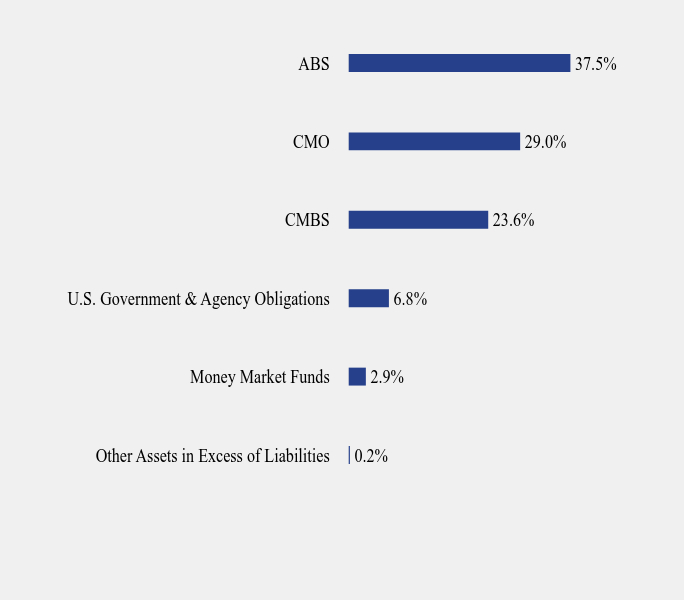
What did the Fund invest in?
Sector Weighting (% of net assets)
| Value | Value |
|---|
| Other Assets in Excess of Liabilities | 0.2% |
| Money Market Funds | 2.9% |
| U.S. Government & Agency Obligations | 6.8% |
| CMBS | 23.6% |
| CMO | 29.0% |
| ABS | 37.5% |
Top 10 Holdings (% of net assets)
| Holding Name | % of Net Assets |
| Starwood Retail Property Trust, 2014-STAR A, 8.500%, 11/15/27 | 4.4% |
| Terwin Mortgage Trust, 2006-3 2A3, 1.566%, 04/25/37 | 3.4% |
| Carrington Mortgage Loan Trust, 2006-FRE2 A2, 2.789%, 10/25/36 | 3.3% |
| JP Morgan Chase Commercial Mortgage Securities Trust, 2011-C3, 5.360%, 02/15/46 | 2.8% |
| Citigroup Commercial Mortgage Trust, 2014-GC21 E, 3.588%, 05/10/47 | 2.1% |
| Credit Suisse Seasoned Loan Trust, 2006-1 M1, 3.268%, 10/25/34 | 2.0% |
| Carrington Mortgage Loan Trust, 2006-FRE2 A5, 2.789%, 03/25/35 | 1.9% |
| Morgan Stanley Capital I Trust, 2006-T21 C, 5.187%, 10/12/52 | 1.8% |
| EMC Mortgage Loan Trust, 2004-B M2, 4.898%, 01/25/41 | 1.8% |
| Citicorp Mortgage Securities Trust, 2008-1 1A1, 6.250%, 02/25/38 | 1.8% |
No material changes occurred during the year ended June 30, 2024.
Catalyst Enhanced Income Strategy Fund - Class A (EIXAX)
Annual Shareholder Report - June 30, 2024
Where can I find additional information about the Fund?
Additional information is available on the Fund's website ( https://catalystmf.com/literature-and-forms/ ), including its:
Prospectus
Financial information
Holdings
Proxy voting information
Catalyst Enhanced Income Strategy Fund
Annual Shareholder Report - June 30, 2024
This annual shareholder report contains important information about Catalyst Enhanced Income Strategy Fund for the period of July 1, 2023 to June 30, 2024. You can find additional information about the Fund at https://catalystmf.com/literature-and-forms/. You can also request this information by contacting us at 1-866-447-4228.
What were the Fund’s costs for the last year?
(based on a hypothetical $10,000 investment)
| Class Name | Costs of a $10,000 investment | Costs paid as a percentage of a $10,000 investment |
|---|
| Class C | $253 | 2.53% |
How did the Fund perform during the reporting period?
This past year has been challenging for most subsectors within fixed income as persistent inflation and thus elevated interest rates have caused most fixed income assets to go sideways. Fortunately, due to the credit strength of our investments and our tactful investment thesis, we have fared considerably better than our benchmark historically. During the last year, duration rallied considerably; however, the Fund has much less exposure to interest rate duration and thus underperformed its benchmark.
Due to macro uncertainty and higher rates, investments in the Fund now yield more than they have in years and are less volatile than they were in the past. For example, before the 2022 bond rout, generic Non-agency RMBS senior bonds yielded 3-5% and now yield 7-12%. They are generally less volatile now than they were then due to amortization and continued strength in the housing market.
We have added and continue to optimistically add agency inverse interest only securities (IIO). These bonds benefit from the front end of the rate curve going lower, which would drive the coupon higher, hence the term inverse. This small position serves as a bit of a macro hedge in the event of large market disruption or recession. We anticipate the interest rate curve steepening towards the end of this year and into 2025, which would be beneficial for this position. This small position can have an outsized impact on total return for the fund.
Over the past year, we have maintained an allocation to select commercial mortgage-backed securities. While these securities provided positive performance in the past, they came under significant pressure late in 2022 and 2023. We did sell some bonds at the end of 2023/early 2024 as this subsector rallied. We find this sector to be one of the best opportunities in fixed income, albeit with specific asset selection.
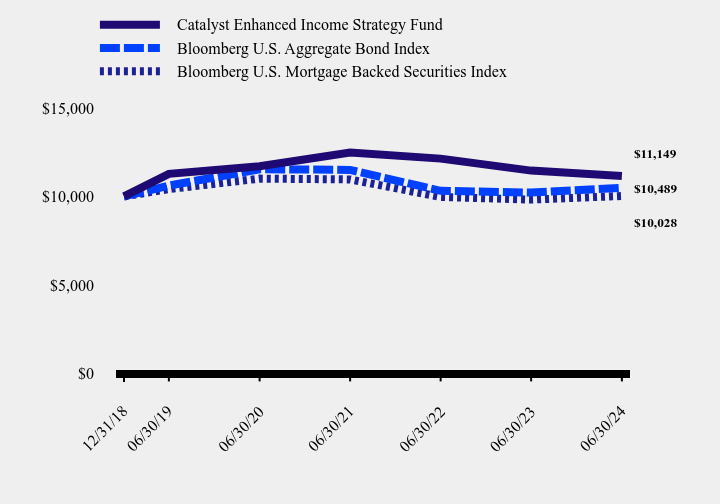
How has the Fund performed since inception?
Total Return Based on $10,000 Investment
| Catalyst Enhanced Income Strategy Fund | Bloomberg U.S. Aggregate Bond Index | Bloomberg U.S. Mortgage Backed Securities Index |
|---|
| 12/31/18 | $10,000 | $10,000 | $10,000 |
| 06/30/19 | $11,275 | $10,611 | $10,417 |
| 06/30/20 | $11,706 | $11,539 | $11,008 |
| 06/30/21 | $12,480 | $11,500 | $10,962 |
| 06/30/22 | $12,138 | $10,317 | $9,972 |
| 06/30/23 | $11,460 | $10,220 | $9,821 |
| 06/30/24 | $11,149 | $10,489 | $10,028 |
Average Annual Total Returns
| 1 Year | 5 Years | Since Inception (December 31, 2018) |
|---|
| Catalyst Enhanced Income Strategy Fund | | | 2.00% |
| Bloomberg U.S. Aggregate Bond Index | 2.63% | | 0.87% |
| Bloomberg U.S. Mortgage Backed Securities Index | 2.12% | | 0.05% |
The Fund's past performance is not a good predictor of how the Fund will perform in the future. The graph and table do not reflect the deduction of taxes that a shareholder would pay on fund distributions or redemption of fund shares.
- Net Assets$219,641,002
- Number of Portfolio Holdings312
- Advisory Fee (net of waivers)$3,359,700
- Portfolio Turnover13%
Asset Weighting (% of total investments)
| Value | Value |
|---|
| Asset Backed Securities | 90.3% |
| Money Market Funds | 2.9% |
| U.S. Government & Agency Obligations | 6.8% |
What did the Fund invest in?
Sector Weighting (% of net assets)
| Value | Value |
|---|
| Other Assets in Excess of Liabilities | 0.2% |
| Money Market Funds | 2.9% |
| U.S. Government & Agency Obligations | 6.8% |
| CMBS | 23.6% |
| CMO | 29.0% |
| ABS | 37.5% |
Top 10 Holdings (% of net assets)
| Holding Name | % of Net Assets |
| Starwood Retail Property Trust, 2014-STAR A, 8.500%, 11/15/27 | 4.4% |
| Terwin Mortgage Trust, 2006-3 2A3, 1.566%, 04/25/37 | 3.4% |
| Carrington Mortgage Loan Trust, 2006-FRE2 A2, 2.789%, 10/25/36 | 3.3% |
| JP Morgan Chase Commercial Mortgage Securities Trust, 2011-C3, 5.360%, 02/15/46 | 2.8% |
| Citigroup Commercial Mortgage Trust, 2014-GC21 E, 3.588%, 05/10/47 | 2.1% |
| Credit Suisse Seasoned Loan Trust, 2006-1 M1, 3.268%, 10/25/34 | 2.0% |
| Carrington Mortgage Loan Trust, 2006-FRE2 A5, 2.789%, 03/25/35 | 1.9% |
| Morgan Stanley Capital I Trust, 2006-T21 C, 5.187%, 10/12/52 | 1.8% |
| EMC Mortgage Loan Trust, 2004-B M2, 4.898%, 01/25/41 | 1.8% |
| Citicorp Mortgage Securities Trust, 2008-1 1A1, 6.250%, 02/25/38 | 1.8% |
No material changes occurred during the year ended June 30, 2024.
Catalyst Enhanced Income Strategy Fund - Class C (EIXCX)
Annual Shareholder Report - June 30, 2024
Where can I find additional information about the Fund?
Additional information is available on the Fund's website ( https://catalystmf.com/literature-and-forms/ ), including its:
Prospectus
Financial information
Holdings
Proxy voting information
Catalyst Enhanced Income Strategy Fund
Annual Shareholder Report - June 30, 2024
This annual shareholder report contains important information about Catalyst Enhanced Income Strategy Fund for the period of July 1, 2023 to June 30, 2024. You can find additional information about the Fund at https://catalystmf.com/literature-and-forms/. You can also request this information by contacting us at 1-866-447-4228.
What were the Fund’s costs for the last year?
(based on a hypothetical $10,000 investment)
| Class Name | Costs of a $10,000 investment | Costs paid as a percentage of a $10,000 investment |
|---|
| Class I | $153 | 1.53% |
How did the Fund perform during the reporting period?
This past year has been challenging for most subsectors within fixed income as persistent inflation and thus elevated interest rates have caused most fixed income assets to go sideways. Fortunately, due to the credit strength of our investments and our tactful investment thesis, we have fared considerably better than our benchmark historically. During the last year, duration rallied considerably; however, the Fund has much less exposure to interest rate duration and thus underperformed its benchmark.
Due to macro uncertainty and higher rates, investments in the Fund now yield more than they have in years and are less volatile than they were in the past. For example, before the 2022 bond rout, generic Non-agency RMBS senior bonds yielded 3-5% and now yield 7-12%. They are generally less volatile now than they were then due to amortization and continued strength in the housing market.
We have added and continue to optimistically add agency inverse interest only securities (IIO). These bonds benefit from the front end of the rate curve going lower, which would drive the coupon higher, hence the term inverse. This small position serves as a bit of a macro hedge in the event of large market disruption or recession. We anticipate the interest rate curve steepening towards the end of this year and into 2025, which would be beneficial for this position. This small position can have an outsized impact on total return for the fund.
Over the past year, we have maintained an allocation to select commercial mortgage-backed securities. While these securities provided positive performance in the past, they came under significant pressure late in 2022 and 2023. We did sell some bonds at the end of 2023/early 2024 as this subsector rallied. We find this sector to be one of the best opportunities in fixed income, albeit with specific asset selection.
How has the Fund performed since inception?
Total Return Based on $10,000 Investment
| Catalyst Enhanced Income Strategy Fund | Bloomberg U.S. Aggregate Bond Index | Bloomberg U.S. Mortgage Backed Securities Index |
|---|
| 12/31/18 | $10,000 | $10,000 | $10,000 |
| 06/30/19 | $11,332 | $10,611 | $10,417 |
| 06/30/20 | $11,891 | $11,539 | $11,008 |
| 06/30/21 | $12,800 | $11,500 | $10,962 |
| 06/30/22 | $12,571 | $10,317 | $9,972 |
| 06/30/23 | $11,991 | $10,220 | $9,821 |
| 06/30/24 | $11,784 | $10,489 | $10,028 |
Average Annual Total Returns
| 1 Year | 5 Years | Since Inception (December 31, 2018) |
|---|
| Catalyst Enhanced Income Strategy Fund | | 0.79% | 3.03% |
| Bloomberg U.S. Aggregate Bond Index | 2.63% | | 0.87% |
| Bloomberg U.S. Mortgage Backed Securities Index | 2.12% | | 0.05% |
The Fund's past performance is not a good predictor of how the Fund will perform in the future. The graph and table do not reflect the deduction of taxes that a shareholder would pay on fund distributions or redemption of fund shares.
- Net Assets$219,641,002
- Number of Portfolio Holdings312
- Advisory Fee (net of waivers)$3,359,700
- Portfolio Turnover13%
Asset Weighting (% of total investments)
| Value | Value |
|---|
| Asset Backed Securities | 90.3% |
| Money Market Funds | 2.9% |
| U.S. Government & Agency Obligations | 6.8% |
What did the Fund invest in?
Sector Weighting (% of net assets)
| Value | Value |
|---|
| Other Assets in Excess of Liabilities | 0.2% |
| Money Market Funds | 2.9% |
| U.S. Government & Agency Obligations | 6.8% |
| CMBS | 23.6% |
| CMO | 29.0% |
| ABS | 37.5% |
Top 10 Holdings (% of net assets)
| Holding Name | % of Net Assets |
| Starwood Retail Property Trust, 2014-STAR A, 8.500%, 11/15/27 | 4.4% |
| Terwin Mortgage Trust, 2006-3 2A3, 1.566%, 04/25/37 | 3.4% |
| Carrington Mortgage Loan Trust, 2006-FRE2 A2, 2.789%, 10/25/36 | 3.3% |
| JP Morgan Chase Commercial Mortgage Securities Trust, 2011-C3, 5.360%, 02/15/46 | 2.8% |
| Citigroup Commercial Mortgage Trust, 2014-GC21 E, 3.588%, 05/10/47 | 2.1% |
| Credit Suisse Seasoned Loan Trust, 2006-1 M1, 3.268%, 10/25/34 | 2.0% |
| Carrington Mortgage Loan Trust, 2006-FRE2 A5, 2.789%, 03/25/35 | 1.9% |
| Morgan Stanley Capital I Trust, 2006-T21 C, 5.187%, 10/12/52 | 1.8% |
| EMC Mortgage Loan Trust, 2004-B M2, 4.898%, 01/25/41 | 1.8% |
| Citicorp Mortgage Securities Trust, 2008-1 1A1, 6.250%, 02/25/38 | 1.8% |
No material changes occurred during the year ended June 30, 2024.
Catalyst Enhanced Income Strategy Fund - Class I (EIXIX)
Annual Shareholder Report - June 30, 2024
Where can I find additional information about the Fund?
Additional information is available on the Fund's website ( https://catalystmf.com/literature-and-forms/ ), including its:
Prospectus
Financial information
Holdings
Proxy voting information
Catalyst Insider Income Fund
Annual Shareholder Report - June 30, 2024
This annual shareholder report contains important information about Catalyst Insider Income Fund for the period of July 1, 2023 to June 30, 2024. You can find additional information about the Fund at https://catalystmf.com/literature-and-forms/. You can also request this information by contacting us at 1-866-447-4228.
What were the Fund’s costs for the last year?
(based on a hypothetical $10,000 investment)
| Class Name | Costs of a $10,000 investment | Costs paid as a percentage of a $10,000 investment |
|---|
| Class A | $100 | 1.00% |
How did the Fund perform during the reporting period?
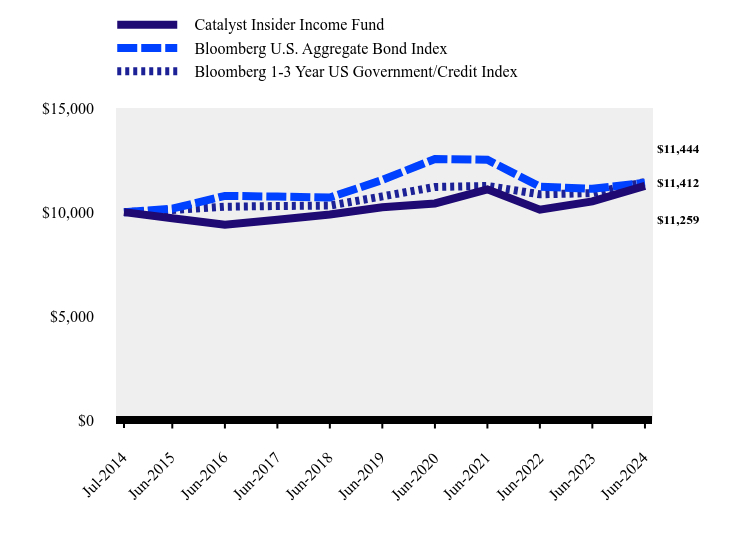
The Catalyst Insider Income Fund holds a portfolio of short-term bonds issued by corporations whose executives are purchasing shares of the company’s common stock. Our historical research indicates that companies where insiders are buying the company’s common stock experience substantially lower default rates and bankruptcy rates. The intuition is that corporate insiders would not take an equity stake if the company were in jeopardy of bankruptcy. We believe this provides us with opportunities to identify undervalued bonds of companies with very high-quality credit fundamentals before the market does.
During the reporting period the fund outperformed the Bloomberg U.S. Aggregate Bond Index by over 548 basis points. By using the insider buying signal as the first step in our credit evaluation process, we identified a number of bonds that we believe have been overlooked by the market and possess superior yields to bonds of comparable credit fundamentals. Throughout the year, the portfolio’s average maturity was under 2 years, which worked to the Fund's benefit as yields were highest in the front end of the yield curve. Additionally, the Fund remained default-free during the year and remains default-free since inception. The Fund significantly outperformed the benchmark in part because we identified bonds that had superior yields, did not default, and were short dated (which limited the portfolio’s interest rate risk).
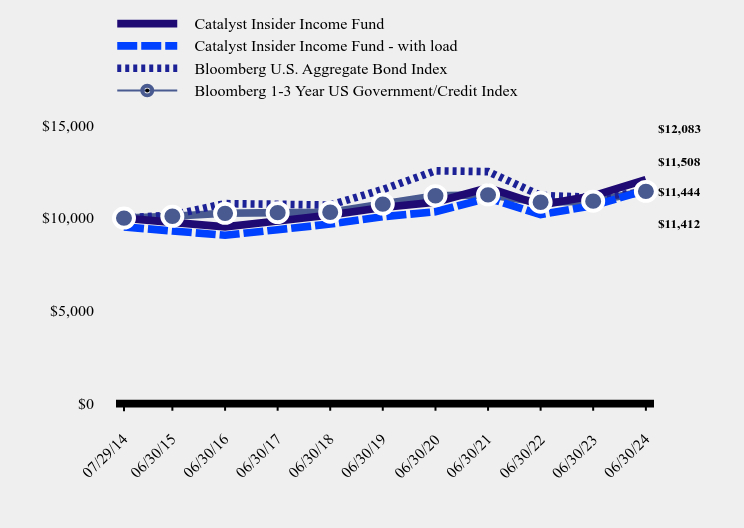
How has the Fund performed since inception?
Total Return Based on $10,000 Investment
| Catalyst Insider Income Fund | Catalyst Insider Income Fund - with load | Bloomberg U.S. Aggregate Bond Index | Bloomberg 1-3 Year US Government/Credit Index |
|---|
| 07/29/14 | $10,000 | $9,524 | $10,000 | $10,000 |
| 06/30/15 | $9,768 | $9,303 | $10,169 | $10,098 |
| 06/30/16 | $9,528 | $9,074 | $10,780 | $10,259 |
| 06/30/17 | $9,841 | $9,372 | $10,746 | $10,294 |
| 06/30/18 | $10,163 | $9,680 | $10,703 | $10,316 |
| 06/30/19 | $10,576 | $10,072 | $11,545 | $10,756 |
| 06/30/20 | $10,862 | $10,345 | $12,554 | $11,208 |
| 06/30/21 | $11,639 | $11,085 | $12,512 | $11,257 |
| 06/30/22 | $10,701 | $10,192 | $11,225 | $10,856 |
| 06/30/23 | $11,205 | $10,672 | $11,119 | $10,913 |
| 06/30/24 | $12,083 | $11,508 | $11,412 | $11,444 |
Average Annual Total Returns
| 1 Year | 5 Years | Since Inception (7/29/2014) |
|---|
| Catalyst Insider Income Fund | | | |
| Without Load | 7.84% | 2.70% | 1.93% |
| With Load | 2.71% | 1.70% | 1.43% |
| Bloomberg U.S. Aggregate Bond Index | 2.63% | | 1.34% |
| Bloomberg 1-3 Year US Government/Credit Index | 4.87% | 1.25% | 1.37% |
The Fund's past performance is not a good predictor of how the Fund will perform in the future. The graph and table do not reflect the deduction of taxes that a shareholder would pay on fund distributions or redemption of fund shares.
- Net Assets$55,632,643
- Number of Portfolio Holdings20
- Advisory Fee (net of waivers)$213,631
- Portfolio Turnover17%
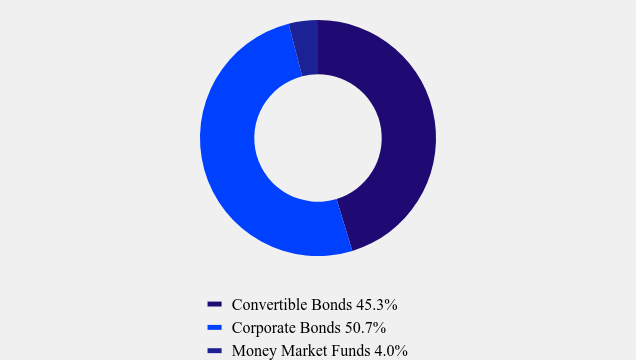
Asset Weighting (% of total investments)
| Value | Value |
|---|
| Convertible Bonds | 45.3% |
| Corporate Bonds | 50.7% |
| Money Market Funds | 4.0% |
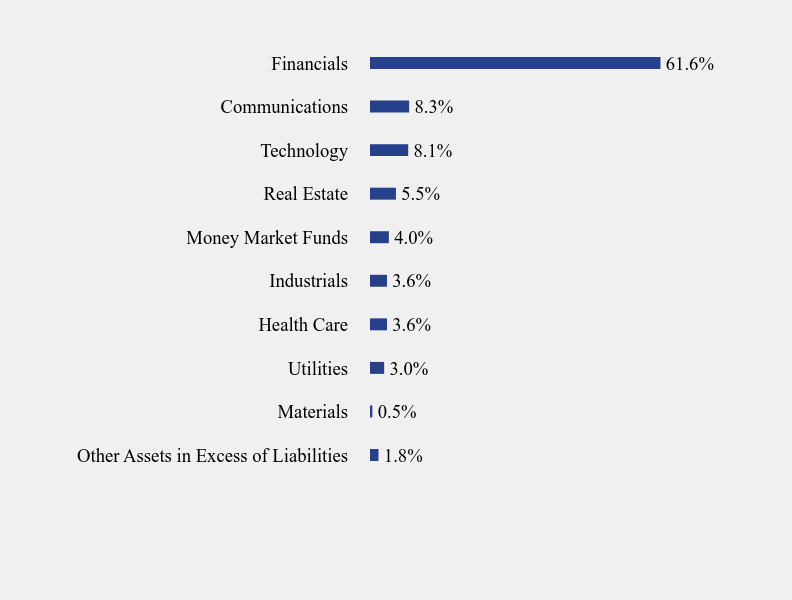
What did the Fund invest in?
Sector Weighting (% of net assets)
| Value | Value |
|---|
| Other Assets in Excess of Liabilities | 1.8% |
| Materials | 0.5% |
| Utilities | 3.0% |
| Health Care | 3.6% |
| Industrials | 3.6% |
| Money Market Funds | 4.0% |
| Real Estate | 5.5% |
| Technology | 8.1% |
| Communications | 8.3% |
| Financials | 61.6% |
Top 10 Holdings (% of net assets)
| Holding Name | % of Net Assets |
| Two Harbors Investment Corporation, 6.250%, due 01/15/26 | 12.1% |
| Redwood Trust, Inc., 5.625%, due 07/15/24 | 8.3% |
| SoFi Technologies, Inc., 10.320%, due 10/15/26 | 7.8% |
| Ambac Assurance Corporation, 5.100%, due 06/7/69 | 7.5% |
| Prospect Capital Corporation, 6.375%, due 03/1/25 | 7.4% |
| Prospect Capital Corporation, 3.706%, due 01/22/26 | 4.9% |
| Ares Capital Corporation, 4.250%, due 03/1/25 | 4.8% |
| New Mountain Finance Corporation, 7.500%, due 10/15/25 | 4.7% |
| VeriSign, Inc., 5.250%, due 04/1/25 | 4.7% |
| Broadcom, Inc., 3.625%, due 10/15/24 | 4.5% |
No material changes occurred during the year ended June 30, 2024.
Catalyst Insider Income Fund - Class A (IIXAX)
Annual Shareholder Report - June 30, 2024
Where can I find additional information about the Fund?
Additional information is available on the Fund's website ( https://catalystmf.com/literature-and-forms/ ), including its:
Prospectus
Financial information
Holdings
Proxy voting information
Catalyst Insider Income Fund
Annual Shareholder Report - June 30, 2024
This annual shareholder report contains important information about Catalyst Insider Income Fund for the period of July 1, 2023 to June 30, 2024. You can find additional information about the Fund at https://catalystmf.com/literature-and-forms/. You can also request this information by contacting us at 1-866-447-4228.
What were the Fund’s costs for the last year?
(based on a hypothetical $10,000 investment)
| Class Name | Costs of a $10,000 investment | Costs paid as a percentage of a $10,000 investment |
|---|
| Class C | $175 | 1.75% |
How did the Fund perform during the reporting period?
The Catalyst Insider Income Fund holds a portfolio of short-term bonds issued by corporations whose executives are purchasing shares of the company’s common stock. Our historical research indicates that companies where insiders are buying the company’s common stock experience substantially lower default rates and bankruptcy rates. The intuition is that corporate insiders would not take an equity stake if the company were in jeopardy of bankruptcy. We believe this provides us with opportunities to identify undervalued bonds of companies with very high-quality credit fundamentals before the market does.
During the reporting period the fund outperformed the Bloomberg U.S. Aggregate Bond Index by over 548 basis points. By using the insider buying signal as the first step in our credit evaluation process, we identified a number of bonds that we believe have been overlooked by the market and possess superior yields to bonds of comparable credit fundamentals. Throughout the year, the portfolio’s average maturity was under 2 years, which worked to the Fund's benefit as yields were highest in the front end of the yield curve. Additionally, the Fund remained default-free during the year and remains default-free since inception. The Fund significantly outperformed the benchmark in part because we identified bonds that had superior yields, did not default, and were short dated (which limited the portfolio’s interest rate risk).
How has the Fund performed since inception?
Total Return Based on $10,000 Investment
| Catalyst Insider Income Fund | Bloomberg U.S. Aggregate Bond Index | Bloomberg 1-3 Year US Government/Credit Index |
|---|
| Jul-2014 | $10,000 | $10,000 | $10,000 |
| Jun-2015 | $9,706 | $10,169 | $10,098 |
| Jun-2016 | $9,399 | $10,780 | $10,259 |
| Jun-2017 | $9,630 | $10,746 | $10,294 |
| Jun-2018 | $9,883 | $10,703 | $10,316 |
| Jun-2019 | $10,230 | $11,545 | $10,756 |
| Jun-2020 | $10,418 | $12,554 | $11,208 |
| Jun-2021 | $11,093 | $12,512 | $11,257 |
| Jun-2022 | $10,120 | $11,225 | $10,856 |
| Jun-2023 | $10,519 | $11,119 | $10,913 |
| Jun-2024 | $11,259 | $11,412 | $11,444 |
Average Annual Total Returns
| 1 Year | 5 Years | 10 Years |
|---|
| Catalyst Insider Income Fund | 7.04% | 1.94% | 1.20% |
| Bloomberg U.S. Aggregate Bond Index | 2.63% | | 1.34% |
| Bloomberg 1-3 Year US Government/Credit Index | 4.87% | 1.25% | 1.37% |
The Fund's past performance is not a good predictor of how the Fund will perform in the future. The graph and table do not reflect the deduction of taxes that a shareholder would pay on fund distributions or redemption of fund shares.
- Net Assets$55,632,643
- Number of Portfolio Holdings20
- Advisory Fee (net of waivers)$213,631
- Portfolio Turnover17%
Asset Weighting (% of total investments)
| Value | Value |
|---|
| Convertible Bonds | 45.3% |
| Corporate Bonds | 50.7% |
| Money Market Funds | 4.0% |
What did the Fund invest in?
Sector Weighting (% of net assets)
| Value | Value |
|---|
| Other Assets in Excess of Liabilities | 1.8% |
| Materials | 0.5% |
| Utilities | 3.0% |
| Health Care | 3.6% |
| Industrials | 3.6% |
| Money Market Funds | 4.0% |
| Real Estate | 5.5% |
| Technology | 8.1% |
| Communications | 8.3% |
| Financials | 61.6% |
Top 10 Holdings (% of net assets)
| Holding Name | % of Net Assets |
| Two Harbors Investment Corporation, 6.250%, due 01/15/26 | 12.1% |
| Redwood Trust, Inc., 5.625%, due 07/15/24 | 8.3% |
| SoFi Technologies, Inc., 10.320%, due 10/15/26 | 7.8% |
| Ambac Assurance Corporation, 5.100%, due 06/7/69 | 7.5% |
| Prospect Capital Corporation, 6.375%, due 03/1/25 | 7.4% |
| Prospect Capital Corporation, 3.706%, due 01/22/26 | 4.9% |
| Ares Capital Corporation, 4.250%, due 03/1/25 | 4.8% |
| New Mountain Finance Corporation, 7.500%, due 10/15/25 | 4.7% |
| VeriSign, Inc., 5.250%, due 04/1/25 | 4.7% |
| Broadcom, Inc., 3.625%, due 10/15/24 | 4.5% |
No material changes occurred during the year ended June 30, 2024.
Catalyst Insider Income Fund - Class C (IIXCX)
Annual Shareholder Report - June 30, 2024
Where can I find additional information about the Fund?
Additional information is available on the Fund's website ( https://catalystmf.com/literature-and-forms/ ), including its:
Prospectus
Financial information
Holdings
Proxy voting information
Catalyst Insider Income Fund
Annual Shareholder Report - June 30, 2024
This annual shareholder report contains important information about Catalyst Insider Income Fund for the period of July 1, 2023 to June 30, 2024. You can find additional information about the Fund at https://catalystmf.com/literature-and-forms/. You can also request this information by contacting us at 1-866-447-4228.
What were the Fund’s costs for the last year?
(based on a hypothetical $10,000 investment)
| Class Name | Costs of a $10,000 investment | Costs paid as a percentage of a $10,000 investment |
|---|
| Class I | $75 | 0.75% |
How did the Fund perform during the reporting period?
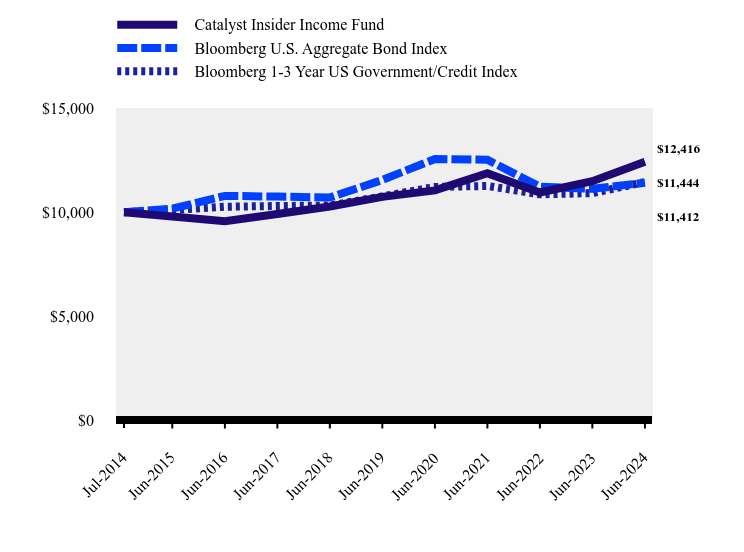
The Catalyst Insider Income Fund holds a portfolio of short-term bonds issued by corporations whose executives are purchasing shares of the company’s common stock. Our historical research indicates that companies where insiders are buying the company’s common stock experience substantially lower default rates and bankruptcy rates. The intuition is that corporate insiders would not take an equity stake if the company were in jeopardy of bankruptcy. We believe this provides us with opportunities to identify undervalued bonds of companies with very high-quality credit fundamentals before the market does.
During the reporting period the fund outperformed the Bloomberg U.S. Aggregate Bond Index by over 548 basis points. By using the insider buying signal as the first step in our credit evaluation process, we identified a number of bonds that we believe have been overlooked by the market and possess superior yields to bonds of comparable credit fundamentals. Throughout the year, the portfolio’s average maturity was under 2 years, which worked to the Fund's benefit as yields were highest in the front end of the yield curve. Additionally, the Fund remained default-free during the year and remains default-free since inception. The Fund significantly outperformed the benchmark in part because we identified bonds that had superior yields, did not default, and were short dated (which limited the portfolio’s interest rate risk).
How has the Fund performed since inception?
Total Return Based on $10,000 Investment
| Catalyst Insider Income Fund | Bloomberg U.S. Aggregate Bond Index | Bloomberg 1-3 Year US Government/Credit Index |
|---|
| Jul-2014 | $10,000 | $10,000 | $10,000 |
| Jun-2015 | $9,791 | $10,169 | $10,098 |
| Jun-2016 | $9,563 | $10,780 | $10,259 |
| Jun-2017 | $9,910 | $10,746 | $10,294 |
| Jun-2018 | $10,272 | $10,703 | $10,316 |
| Jun-2019 | $10,733 | $11,545 | $10,756 |
| Jun-2020 | $11,044 | $12,554 | $11,208 |
| Jun-2021 | $11,866 | $12,512 | $11,257 |
| Jun-2022 | $10,941 | $11,225 | $10,856 |
| Jun-2023 | $11,485 | $11,119 | $10,913 |
| Jun-2024 | $12,416 | $11,412 | $11,444 |
Average Annual Total Returns
| 1 Year | 5 Years | 10 Years |
|---|
| Catalyst Insider Income Fund | 8.11% | 2.96% | 2.21% |
| Bloomberg U.S. Aggregate Bond Index | 2.63% | | 1.34% |
| Bloomberg 1-3 Year US Government/Credit Index | 4.87% | 1.25% | 1.37% |
The Fund's past performance is not a good predictor of how the Fund will perform in the future. The graph and table do not reflect the deduction of taxes that a shareholder would pay on fund distributions or redemption of fund shares.
- Net Assets$55,632,643
- Number of Portfolio Holdings20
- Advisory Fee (net of waivers)$213,631
- Portfolio Turnover17%
Asset Weighting (% of total investments)
| Value | Value |
|---|
| Convertible Bonds | 45.3% |
| Corporate Bonds | 50.7% |
| Money Market Funds | 4.0% |
What did the Fund invest in?
Sector Weighting (% of net assets)
| Value | Value |
|---|
| Other Assets in Excess of Liabilities | 1.8% |
| Materials | 0.5% |
| Utilities | 3.0% |
| Health Care | 3.6% |
| Industrials | 3.6% |
| Money Market Funds | 4.0% |
| Real Estate | 5.5% |
| Technology | 8.1% |
| Communications | 8.3% |
| Financials | 61.6% |
Top 10 Holdings (% of net assets)
| Holding Name | % of Net Assets |
| Two Harbors Investment Corporation, 6.250%, due 01/15/26 | 12.1% |
| Redwood Trust, Inc., 5.625%, due 07/15/24 | 8.3% |
| SoFi Technologies, Inc., 10.320%, due 10/15/26 | 7.8% |
| Ambac Assurance Corporation, 5.100%, due 06/7/69 | 7.5% |
| Prospect Capital Corporation, 6.375%, due 03/1/25 | 7.4% |
| Prospect Capital Corporation, 3.706%, due 01/22/26 | 4.9% |
| Ares Capital Corporation, 4.250%, due 03/1/25 | 4.8% |
| New Mountain Finance Corporation, 7.500%, due 10/15/25 | 4.7% |
| VeriSign, Inc., 5.250%, due 04/1/25 | 4.7% |
| Broadcom, Inc., 3.625%, due 10/15/24 | 4.5% |
No material changes occurred during the year ended June 30, 2024.
Catalyst Insider Income Fund - Class I (IIXIX)
Annual Shareholder Report - June 30, 2024
Where can I find additional information about the Fund?
Additional information is available on the Fund's website ( https://catalystmf.com/literature-and-forms/ ), including its:
Prospectus
Financial information
Holdings
Proxy voting information
Catalyst/CIFC Senior Secured Income Fund
Annual Shareholder Report - June 30, 2024
This annual shareholder report contains important information about Catalyst/CIFC Senior Secured Income Fund for the period of July 1, 2023 to June 30, 2024.You can find additional information about the Fund at https://catalystmf.com/literature-and-forms/. You can also request this information by contacting us at 1-866-447-4228. This report describes change to the Fund that occurred during the reporting period.
What were the Fund’s costs for the last year?
(based on a hypothetical $10,000 investment)
| Class Name | Costs of a $10,000 investment | Costs paid as a percentage of a $10,000 investment |
|---|
| Class A | $115 | 1.15% |
How did the Fund perform during the reporting period?
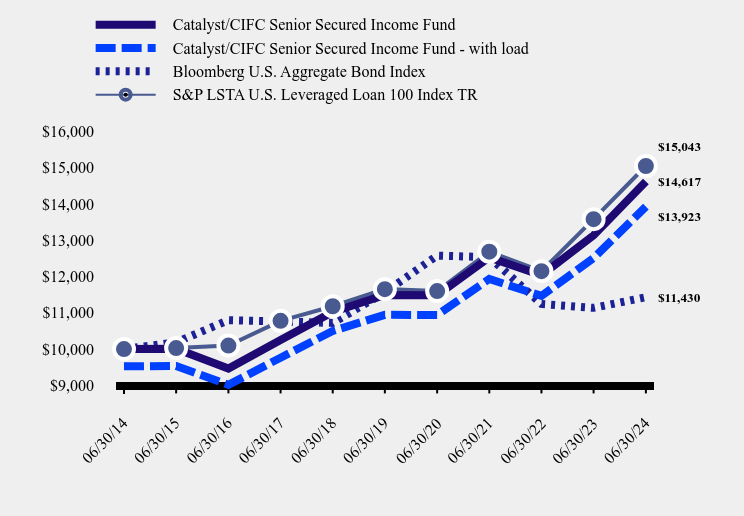
Overall, 2023 was a blockbuster year for the loan market, which performed exceptionally well despite various macroeconomic challenges, including pervasive expectations of a recession that ultimately never materialized. The positive momentum carried over into 2024 as loans continued to benefit from higher base rates and a resilient economic growth and labor market environment, which drove the Fund’s strong positive returns.
During the fiscal year ended June 30, 2024, the Fund maintained its higher quality and diversification bias, positioning our portfolio toward what we perceive as stable revenue, EBITDA, and cash flow corporate profiles. The Fund also maintained a structural underweight to lower-quality names and significantly reduced downgrade vulnerable risks, particularly in the B- segment of the market.
How has the Fund performed over the last ten years?
Total Return Based on $10,000 Investment
| Catalyst/CIFC Senior Secured Income Fund | Catalyst/CIFC Senior Secured Income Fund - with load | Bloomberg U.S. Aggregate Bond Index | S&P LSTA U.S. Leveraged Loan 100 Index TR |
|---|
| 06/30/14 | $10,000 | $9,525 | $10,000 | $10,000 |
| 06/30/15 | $10,011 | $9,536 | $10,186 | $10,028 |
| 06/30/16 | $9,465 | $9,015 | $10,797 | $10,098 |
| 06/30/17 | $10,251 | $9,764 | $10,763 | $10,778 |
| 06/30/18 | $11,023 | $10,500 | $10,720 | $11,180 |
| 06/30/19 | $11,490 | $10,944 | $11,564 | $11,652 |
| 06/30/20 | $11,483 | $10,938 | $12,575 | $11,598 |
| 06/30/21 | $12,527 | $11,932 | $12,533 | $12,684 |
| 06/30/22 | $12,036 | $11,465 | $11,243 | $12,148 |
| 06/30/23 | $13,134 | $12,511 | $11,137 | $13,580 |
| 06/30/24 | $14,617 | $13,923 | $11,430 | $15,043 |
Average Annual Total Returns
| 1 Year | 5 Years | 10 Years |
|---|
| Catalyst/CIFC Senior Secured Income Fund | | | |
| Without Load | 11.29% | 4.93% | 3.87% |
| With Load | 6.02% | 3.91% | 3.36% |
| Bloomberg U.S. Aggregate Bond Index | 2.63% | | 1.35% |
| S&P LSTA U.S. Leveraged Loan 100 Index TR | 10.78% | 5.24% | 4.17% |
The Fund's past performance is not a good predictor of how the Fund will perform in the future. The graph and table do not reflect the deduction of taxes that a shareholder would pay on fund distributions or redemption of fund shares.
- Net Assets$467,457,691
- Number of Portfolio Holdings352
- Advisory Fee (net of waivers)$2,359,996
- Portfolio Turnover103%
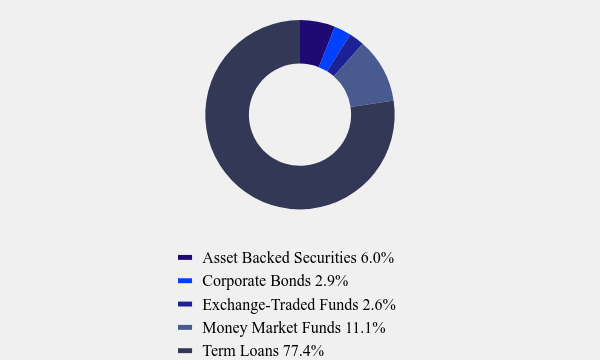
Asset Weighting (% of total investments)
| Value | Value |
|---|
| Asset Backed Securities | 6.0% |
| Corporate Bonds | 2.9% |
| Exchange-Traded Funds | 2.6% |
| Money Market Funds | 11.1% |
| Term Loans | 77.4% |
What did the Fund invest in?
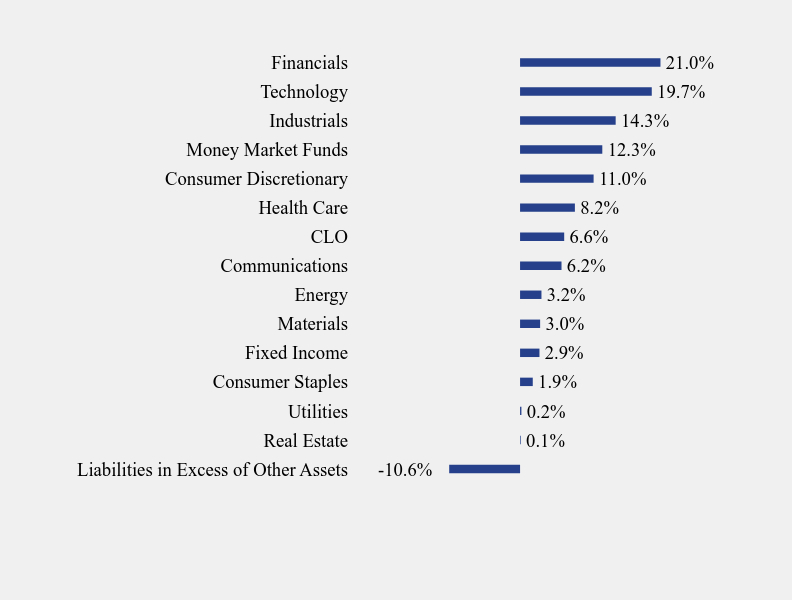
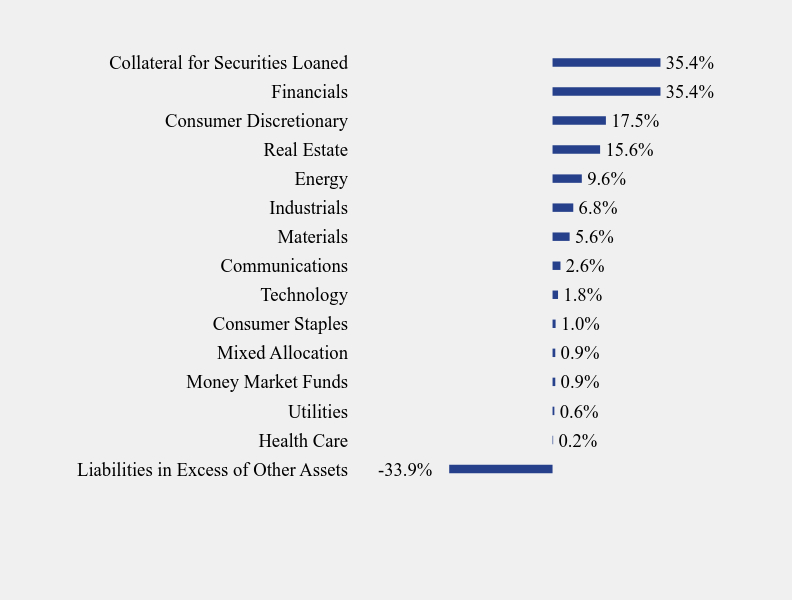
Sector Weighting (% of net assets)
| Value | Value |
|---|
| Liabilities in Excess of Other Assets | -10.6% |
| Real Estate | 0.1% |
| Utilities | 0.2% |
| Consumer Staples | 1.9% |
| Fixed Income | 2.9% |
| Materials | 3.0% |
| Energy | 3.2% |
| Communications | 6.2% |
| CLO | 6.6% |
| Health Care | 8.2% |
| Consumer Discretionary | 11.0% |
| Money Market Funds | 12.3% |
| Industrials | 14.3% |
| Technology | 19.7% |
| Financials | 21.0% |
Top 10 Holdings (% of net assets)
| Holding Name | % of Net Assets |
| Invesco Senior Loan ETF | 1.9% |
| Aretec Group, Inc., 9.320%, 08/09/30 | 1.4% |
| BroadStreet Partners, Inc., 8.571%, 05/12/31 | 1.4% |
| Pug, LLC, 10.079%, 03/12/30 | 1.2% |
| Genesys Cloud Services Holdings II, LLC, 8.829%, 12/01/27 | 1.2% |
| Osaic Holdings, Inc., 9.321%, 08/16/28 | 1.2% |
| Cloud Software Group, Inc., 9.331%, 03/29/29 | 1.2% |
| GTCR W Merger Sub, LLC, 8.309%, 09/20/30 | 1.2% |
| Cotiviti, Inc., 8.579%, 02/24/31 | 1.1% |
| UKG, Inc., 8.576%, 01/31/31 | 1.1% |
During the reporting period, Rick Lam was added as a portfolio manager of the Fund.
Effective April 26, 2024, the Fund’s name changed from “Catalyst/CIFC Floating Rate Income Fund” to “Catalyst/CIFC Senior Secured Income Fund. The Fund further adopted a policy to invest at least 80% of its net assets (plus borrowing for investment purposes) in senior secured debt instruments.
Catalyst/CIFC Senior Secured Income Fund - Class A (CFRAX)
Annual Shareholder Report - June 30, 2024
Where can I find additional information about the Fund?
Additional information is available on the Fund's website (https://catalystmf.com/literature-and-forms/), including its:
Prospectus
Financial information
Holdings
Proxy voting information
Catalyst/CIFC Senior Secured Income Fund
Annual Shareholder Report - June 30, 2024
This annual shareholder report contains important information about Catalyst/CIFC Senior Secured Income Fund for the period of July 1, 2023 to June 30, 2024.You can find additional information about the Fund at https://catalystmf.com/literature-and-forms/. You can also request this information by contacting us at 1-866-447-4228. This report describes change to the Fund that occurred during the reporting period.
What were the Fund’s costs for the last year?
(based on a hypothetical $10,000 investment)
| Class Name | Costs of a $10,000 investment | Costs paid as a percentage of a $10,000 investment |
|---|
| Class C | $190 | 1.90% |
How did the Fund perform during the reporting period?
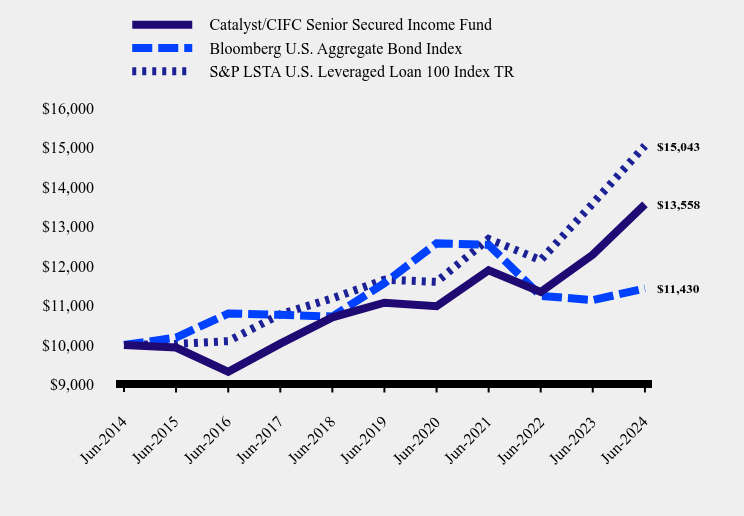
Overall, 2023 was a blockbuster year for the loan market, which performed exceptionally well despite various macroeconomic challenges, including pervasive expectations of a recession that ultimately never materialized. The positive momentum carried over into 2024 as loans continued to benefit from higher base rates and a resilient economic growth and labor market environment, which drove the Fund’s strong positive returns.
During the fiscal year ended June 30, 2024, the Fund maintained its higher quality and diversification bias, positioning our portfolio toward what we perceive as stable revenue, EBITDA, and cash flow corporate profiles. The Fund also maintained a structural underweight to lower-quality names and significantly reduced downgrade vulnerable risks, particularly in the B- segment of the market.
How has the Fund performed over the last ten years?
Total Return Based on $10,000 Investment
| Catalyst/CIFC Senior Secured Income Fund | Bloomberg U.S. Aggregate Bond Index | S&P LSTA U.S. Leveraged Loan 100 Index TR |
|---|
| Jun-2014 | $10,000 | $10,000 | $10,000 |
| Jun-2015 | $9,936 | $10,186 | $10,028 |
| Jun-2016 | $9,320 | $10,797 | $10,098 |
| Jun-2017 | $10,034 | $10,763 | $10,778 |
| Jun-2018 | $10,700 | $10,720 | $11,180 |
| Jun-2019 | $11,071 | $11,564 | $11,652 |
| Jun-2020 | $10,981 | $12,575 | $11,598 |
| Jun-2021 | $11,893 | $12,533 | $12,684 |
| Jun-2022 | $11,342 | $11,243 | $12,148 |
| Jun-2023 | $12,285 | $11,137 | $13,580 |
| Jun-2024 | $13,558 | $11,430 | $15,043 |
Average Annual Total Returns
| 1 Year | 5 Years | 10 Years |
|---|
| Catalyst/CIFC Senior Secured Income Fund | 10.36% | 4.14% | 3.09% |
| Bloomberg U.S. Aggregate Bond Index | 2.63% | | 1.35% |
| S&P LSTA U.S. Leveraged Loan 100 Index TR | 10.78% | 5.24% | 4.17% |
The Fund's past performance is not a good predictor of how the Fund will perform in the future. The graph and table do not reflect the deduction of taxes that a shareholder would pay on fund distributions or redemption of fund shares.
- Net Assets$467,457,691
- Number of Portfolio Holdings352
- Advisory Fee (net of waivers)$2,359,996
- Portfolio Turnover103%
Asset Weighting (% of total investments)
| Value | Value |
|---|
| Asset Backed Securities | 6.0% |
| Corporate Bonds | 2.9% |
| Exchange-Traded Funds | 2.6% |
| Money Market Funds | 11.1% |
| Term Loans | 77.4% |
What did the Fund invest in?
Sector Weighting (% of net assets)
| Value | Value |
|---|
| Liabilities in Excess of Other Assets | -10.6% |
| Real Estate | 0.1% |
| Utilities | 0.2% |
| Consumer Staples | 1.9% |
| Fixed Income | 2.9% |
| Materials | 3.0% |
| Energy | 3.2% |
| Communications | 6.2% |
| CLO | 6.6% |
| Health Care | 8.2% |
| Consumer Discretionary | 11.0% |
| Money Market Funds | 12.3% |
| Industrials | 14.3% |
| Technology | 19.7% |
| Financials | 21.0% |
Top 10 Holdings (% of net assets)
| Holding Name | % of Net Assets |
| Invesco Senior Loan ETF | 1.9% |
| Aretec Group, Inc., 9.320%, 08/09/30 | 1.4% |
| BroadStreet Partners, Inc., 8.571%, 05/12/31 | 1.4% |
| Pug, LLC, 10.079%, 03/12/30 | 1.2% |
| Genesys Cloud Services Holdings II, LLC, 8.829%, 12/01/27 | 1.2% |
| Osaic Holdings, Inc., 9.321%, 08/16/28 | 1.2% |
| Cloud Software Group, Inc., 9.331%, 03/29/29 | 1.2% |
| GTCR W Merger Sub, LLC, 8.309%, 09/20/30 | 1.2% |
| Cotiviti, Inc., 8.579%, 02/24/31 | 1.1% |
| UKG, Inc., 8.576%, 01/31/31 | 1.1% |
During the reporting period, Rick Lam was added as a portfolio manager of the Fund.
Effective April 26, 2024, the Fund’s name changed from “Catalyst/CIFC Floating Rate Income Fund” to “Catalyst/CIFC Senior Secured Income Fund. The Fund further adopted a policy to invest at least 80% of its net assets (plus borrowing for investment purposes) in senior secured debt instruments.
Catalyst/CIFC Senior Secured Income Fund - Class C (CFRCX)
Annual Shareholder Report - June 30, 2024
Where can I find additional information about the Fund?
Additional information is available on the Fund's website (https://catalystmf.com/literature-and-forms/), including its:
Prospectus
Financial information
Holdings
Proxy voting information
Catalyst/CIFC Senior Secured Income Fund
Annual Shareholder Report - June 30, 2024
This annual shareholder report contains important information about Catalyst/CIFC Senior Secured Income Fund for the period of July 1, 2023 to June 30, 2024.You can find additional information about the Fund at https://catalystmf.com/literature-and-forms/. You can also request this information by contacting us at 1-866-447-4228. This report describes change to the Fund that occurred during the reporting period.
What were the Fund’s costs for the last year?
(based on a hypothetical $10,000 investment)
| Class Name | Costs of a $10,000 investment | Costs paid as a percentage of a $10,000 investment |
|---|
| Class C1 | $190 | 1.90% |
How did the Fund perform during the reporting period?
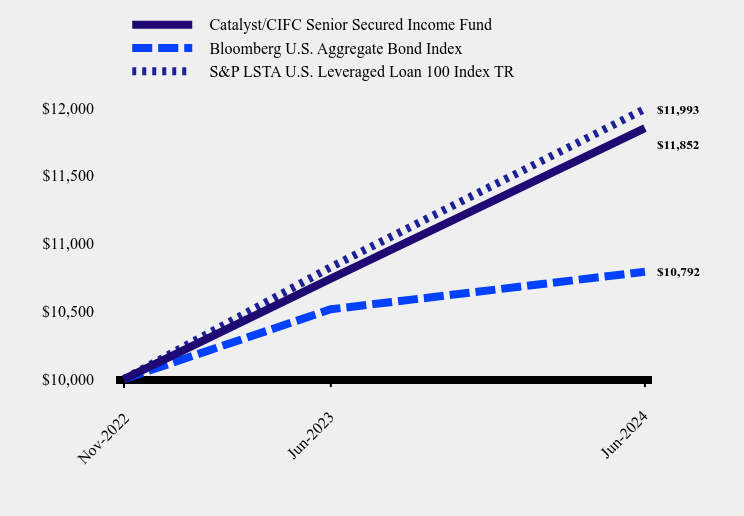
Overall, 2023 was a blockbuster year for the loan market, which performed exceptionally well despite various macroeconomic challenges, including pervasive expectations of a recession that ultimately never materialized. The positive momentum carried over into 2024 as loans continued to benefit from higher base rates and a resilient economic growth and labor market environment, which drove the Fund’s strong positive returns.
During the fiscal year ended June 30, 2024, the Fund maintained its higher quality and diversification bias, positioning our portfolio toward what we perceive as stable revenue, EBITDA, and cash flow corporate profiles. The Fund also maintained a structural underweight to lower-quality names and significantly reduced downgrade vulnerable risks, particularly in the B- segment of the market.
How has the Fund performed since inception?
Total Return Based on $10,000 Investment
| Catalyst/CIFC Senior Secured Income Fund | Bloomberg U.S. Aggregate Bond Index | S&P LSTA U.S. Leveraged Loan 100 Index TR |
|---|
| Nov-2022 | $10,000 | $10,000 | $10,000 |
| Jun-2023 | $10,741 | $10,515 | $10,826 |
| Jun-2024 | $11,852 | $10,792 | $11,993 |
Average Annual Total Returns
| 1 Year | Since Inception (November 1, 2022) |
|---|
| Catalyst/CIFC Senior Secured Income Fund | 10.34% | 10.77% |
| Bloomberg U.S. Aggregate Bond Index | 2.63% | 4.70% |
| S&P LSTA U.S. Leveraged Loan 100 Index TR | 10.78% | 11.57% |
The Fund's past performance is not a good predictor of how the Fund will perform in the future. The graph and table do not reflect the deduction of taxes that a shareholder would pay on fund distributions or redemption of fund shares.
- Net Assets$467,457,691
- Number of Portfolio Holdings352
- Advisory Fee (net of waivers)$2,359,996
- Portfolio Turnover103%
Asset Weighting (% of total investments)
| Value | Value |
|---|
| Asset Backed Securities | 6.0% |
| Corporate Bonds | 2.9% |
| Exchange-Traded Funds | 2.6% |
| Money Market Funds | 11.1% |
| Term Loans | 77.4% |
What did the Fund invest in?
Sector Weighting (% of net assets)
| Value | Value |
|---|
| Liabilities in Excess of Other Assets | -10.6% |
| Real Estate | 0.1% |
| Utilities | 0.2% |
| Consumer Staples | 1.9% |
| Fixed Income | 2.9% |
| Materials | 3.0% |
| Energy | 3.2% |
| Communications | 6.2% |
| CLO | 6.6% |
| Health Care | 8.2% |
| Consumer Discretionary | 11.0% |
| Money Market Funds | 12.3% |
| Industrials | 14.3% |
| Technology | 19.7% |
| Financials | 21.0% |
Top 10 Holdings (% of net assets)
| Holding Name | % of Net Assets |
| Invesco Senior Loan ETF | 1.9% |
| Aretec Group, Inc., 9.320%, 08/09/30 | 1.4% |
| BroadStreet Partners, Inc., 8.571%, 05/12/31 | 1.4% |
| Pug, LLC, 10.079%, 03/12/30 | 1.2% |
| Genesys Cloud Services Holdings II, LLC, 8.829%, 12/01/27 | 1.2% |
| Osaic Holdings, Inc., 9.321%, 08/16/28 | 1.2% |
| Cloud Software Group, Inc., 9.331%, 03/29/29 | 1.2% |
| GTCR W Merger Sub, LLC, 8.309%, 09/20/30 | 1.2% |
| Cotiviti, Inc., 8.579%, 02/24/31 | 1.1% |
| UKG, Inc., 8.576%, 01/31/31 | 1.1% |
During the reporting period, Rick Lam was added as a portfolio manager of the Fund.
Effective April 26, 2024, the Fund’s name changed from “Catalyst/CIFC Floating Rate Income Fund” to “Catalyst/CIFC Senior Secured Income Fund. The Fund further adopted a policy to invest at least 80% of its net assets (plus borrowing for investment purposes) in senior secured debt instruments.
Catalyst/CIFC Senior Secured Income Fund - Class C1 (CFRFX)
Annual Shareholder Report - June 30, 2024
Where can I find additional information about the Fund?
Additional information is available on the Fund's website (https://catalystmf.com/literature-and-forms/), including its:
Prospectus
Financial information
Holdings
Proxy voting information
Catalyst/CIFC Senior Secured Income Fund
Annual Shareholder Report - June 30, 2024
This annual shareholder report contains important information about Catalyst/CIFC Senior Secured Income Fund for the period of July 1, 2023 to June 30, 2024.You can find additional information about the Fund at https://catalystmf.com/literature-and-forms/. You can also request this information by contacting us at 1-866-447-4228. This report describes change to the Fund that occurred during the reporting period.
What were the Fund’s costs for the last year?
(based on a hypothetical $10,000 investment)
| Class Name | Costs of a $10,000 investment | Costs paid as a percentage of a $10,000 investment |
|---|
| Class I | $90 | 0.90% |
How did the Fund perform during the reporting period?
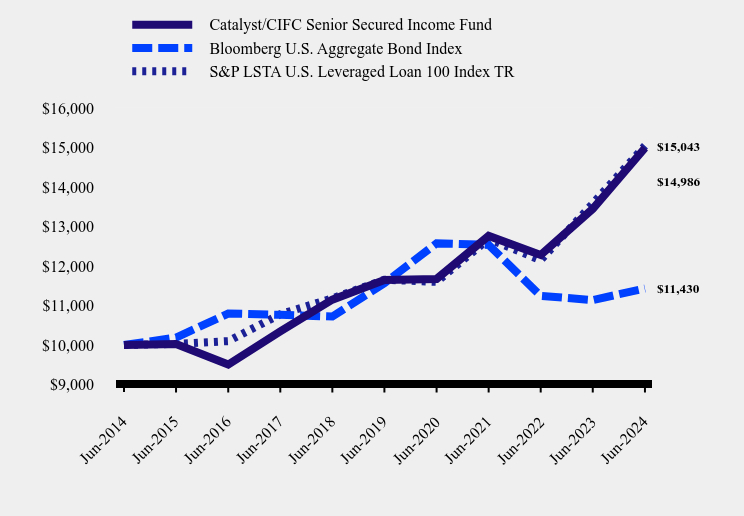
Overall, 2023 was a blockbuster year for the loan market, which performed exceptionally well despite various macroeconomic challenges, including pervasive expectations of a recession that ultimately never materialized. The positive momentum carried over into 2024 as loans continued to benefit from higher base rates and a resilient economic growth and labor market environment, which drove the Fund’s strong positive returns.
During the fiscal year ended June 30, 2024, the Fund maintained its higher quality and diversification bias, positioning our portfolio toward what we perceive as stable revenue, EBITDA, and cash flow corporate profiles. The Fund also maintained a structural underweight to lower-quality names and significantly reduced downgrade vulnerable risks, particularly in the B- segment of the market.
How has the Fund performed over the last ten years?
Total Return Based on $10,000 Investment
| Catalyst/CIFC Senior Secured Income Fund | Bloomberg U.S. Aggregate Bond Index | S&P LSTA U.S. Leveraged Loan 100 Index TR |
|---|
| Jun-2014 | $10,000 | $10,000 | $10,000 |
| Jun-2015 | $10,027 | $10,186 | $10,028 |
| Jun-2016 | $9,504 | $10,797 | $10,098 |
| Jun-2017 | $10,342 | $10,763 | $10,778 |
| Jun-2018 | $11,147 | $10,720 | $11,180 |
| Jun-2019 | $11,648 | $11,564 | $11,652 |
| Jun-2020 | $11,672 | $12,575 | $11,598 |
| Jun-2021 | $12,762 | $12,533 | $12,684 |
| Jun-2022 | $12,279 | $11,243 | $12,148 |
| Jun-2023 | $13,447 | $11,137 | $13,580 |
| Jun-2024 | $14,986 | $11,430 | $15,043 |
Average Annual Total Returns
| 1 Year | 5 Years | 10 Years |
|---|
| Catalyst/CIFC Senior Secured Income Fund | 11.44% | 5.17% | 4.13% |
| Bloomberg U.S. Aggregate Bond Index | 2.63% | | 1.35% |
| S&P LSTA U.S. Leveraged Loan 100 Index TR | 10.78% | 5.24% | 4.17% |
The Fund's past performance is not a good predictor of how the Fund will perform in the future. The graph and table do not reflect the deduction of taxes that a shareholder would pay on fund distributions or redemption of fund shares.
- Net Assets$467,457,691
- Number of Portfolio Holdings352
- Advisory Fee (net of waivers)$2,359,996
- Portfolio Turnover103%
Asset Weighting (% of total investments)
| Value | Value |
|---|
| Asset Backed Securities | 6.0% |
| Corporate Bonds | 2.9% |
| Exchange-Traded Funds | 2.6% |
| Money Market Funds | 11.1% |
| Term Loans | 77.4% |
What did the Fund invest in?
Sector Weighting (% of net assets)
| Value | Value |
|---|
| Liabilities in Excess of Other Assets | -10.6% |
| Real Estate | 0.1% |
| Utilities | 0.2% |
| Consumer Staples | 1.9% |
| Fixed Income | 2.9% |
| Materials | 3.0% |
| Energy | 3.2% |
| Communications | 6.2% |
| CLO | 6.6% |
| Health Care | 8.2% |
| Consumer Discretionary | 11.0% |
| Money Market Funds | 12.3% |
| Industrials | 14.3% |
| Technology | 19.7% |
| Financials | 21.0% |
Top 10 Holdings (% of net assets)
| Holding Name | % of Net Assets |
| Invesco Senior Loan ETF | 1.9% |
| Aretec Group, Inc., 9.320%, 08/09/30 | 1.4% |
| BroadStreet Partners, Inc., 8.571%, 05/12/31 | 1.4% |
| Pug, LLC, 10.079%, 03/12/30 | 1.2% |
| Genesys Cloud Services Holdings II, LLC, 8.829%, 12/01/27 | 1.2% |
| Osaic Holdings, Inc., 9.321%, 08/16/28 | 1.2% |
| Cloud Software Group, Inc., 9.331%, 03/29/29 | 1.2% |
| GTCR W Merger Sub, LLC, 8.309%, 09/20/30 | 1.2% |
| Cotiviti, Inc., 8.579%, 02/24/31 | 1.1% |
| UKG, Inc., 8.576%, 01/31/31 | 1.1% |
During the reporting period, Rick Lam was added as a portfolio manager of the Fund.
Effective April 26, 2024, the Fund’s name changed from “Catalyst/CIFC Floating Rate Income Fund” to “Catalyst/CIFC Senior Secured Income Fund. The Fund further adopted a policy to invest at least 80% of its net assets (plus borrowing for investment purposes) in senior secured debt instruments.
Catalyst/CIFC Senior Secured Income Fund - Class I (CFRIX)
Annual Shareholder Report - June 30, 2024
Where can I find additional information about the Fund?
Additional information is available on the Fund's website (https://catalystmf.com/literature-and-forms/), including its:
Prospectus
Financial information
Holdings
Proxy voting information
Catalyst/MAP Global Balanced Fund
Annual Shareholder Report - June 30, 2024
This annual shareholder report contains important information about Catalyst/MAP Global Balanced Fund for the period of July 1, 2023 to June 30, 2024. You can find additional information about the Fund at https://catalystmf.com/literature-and-forms/. You can also request this information by contacting us at 1-866-447-4228.
What were the Fund’s costs for the last year?
(based on a hypothetical $10,000 investment)
| Class Name | Costs of a $10,000 investment | Costs paid as a percentage of a $10,000 investment |
|---|
| Class A | $122 | 1.22% |
How did the Fund perform during the reporting period?
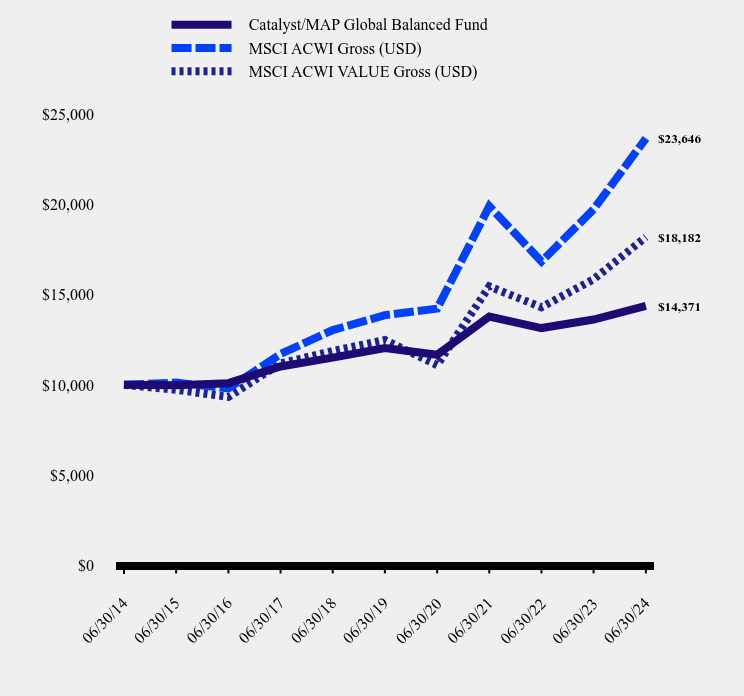
At the start of 2023 we did not believe that high interest rates would tip the economy into a recession; however, we did expect the economy to continue to slow. But to our surprise, economic growth grew robustly in 2023. During the fall of 2023, the Federal Reserve (the Fed) declared the rate hike cycle over and that they had conquered inflation. Bond prices rose, causing rates to fall, leading to a strong risk-on feedback loop, rewarding investors who added beta and momentum to their portfolios. With stock valuations today near where they were before the Fed began their aggressive hikes, equity risk premiums are historically low. As a value manager requiring a margin of safety, we find that difficult to achieve in this environment. Relative fund performance for the reporting period was impacted by the outsized performance of momentum stocks, particularly those involved with Artificial Intelligence (AI). Furthermore, our cautious economic stance led to underperformance relative to stronger than expected economic growth.
We believe that the historic rally over the past six months and investors' singular focus on AI and its future potential has caused many to shift their focus away from the numerous structural issues prevalent in the economy. Accordingly, the Fund remains positioned with a defensive bias. The Fund is currently overweight Consumer Staples and Health Care. The Fund has some equity exposure to copper and agricultural commodities, as well as to areas of the market that we believe will benefit from structural technology growth, along with utilities and infrastructure companies. We believe this blueprint will successfully navigate a market where growth is likely to slow, and inflation is expected to remain volatile and above the Fed’s 2% target, and over the long term we believe yields will remain higher for longer.
How has the Fund performed over the last ten years?
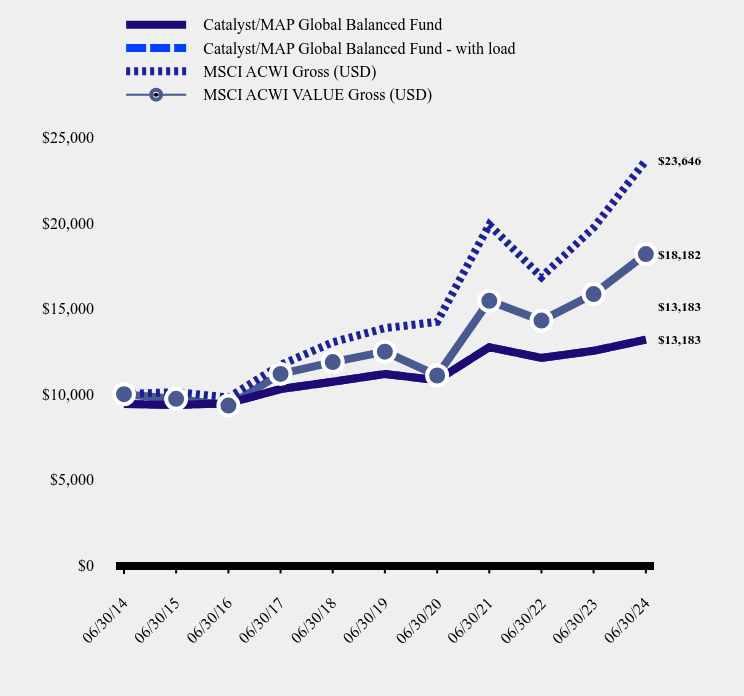
Total Return Based on $10,000 Investment
| Catalyst/MAP Global Balanced Fund | Catalyst/MAP Global Balanced Fund - with load | MSCI ACWI Gross (USD) | MSCI ACWI VALUE Gross (USD) |
|---|
| 06/30/14 | $9,425 | $9,425 | $10,000 | $10,000 |
| 06/30/15 | $9,371 | $9,371 | $10,123 | $9,725 |
| 06/30/16 | $9,465 | $9,465 | $9,802 | $9,333 |
| 06/30/17 | $10,299 | $10,299 | $11,706 | $11,184 |
| 06/30/18 | $10,722 | $10,722 | $13,030 | $11,872 |
| 06/30/19 | $11,181 | $11,181 | $13,854 | $12,482 |
| 06/30/20 | $10,815 | $10,815 | $14,220 | $11,090 |
| 06/30/21 | $12,744 | $12,744 | $19,890 | $15,450 |
| 06/30/22 | $12,119 | $12,119 | $16,833 | $14,296 |
| 06/30/23 | $12,531 | $12,531 | $19,717 | $15,844 |
| 06/30/24 | $13,183 | $13,183 | $23,646 | $18,182 |
Average Annual Total Returns
| 1 Year | 5 Years | 10 Years |
|---|
| Catalyst/MAP Global Balanced Fund | 5.20% | 3.35% | 3.41% |
| With Load | (0.85)% | 2.13% | 2.80% |
| MSCI ACWI Gross (USD) | 19.92% | 11.28% | 8.99% |
| MSCI ACWI VALUE Gross (USD) | 14.76% | 7.81% | 6.16% |
The Fund's past performance is not a good predictor of how the Fund will perform in the future. The graph and table do not reflect the deduction of taxes that a shareholder would pay on fund distributions or redemption of fund shares.
- Net Assets$14,587,043
- Number of Portfolio Holdings61
- Advisory Fee (net of waivers)$0
- Portfolio Turnover30%
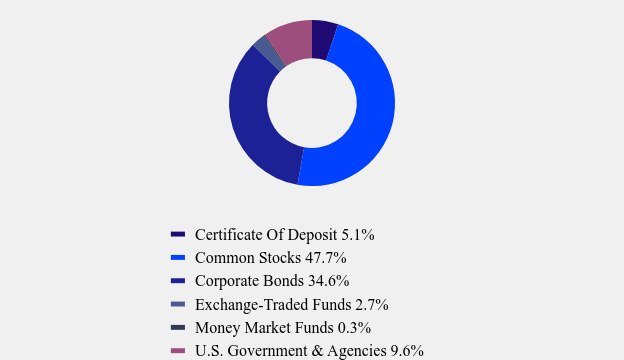
Asset Weighting (% of total investments)
| Value | Value |
|---|
| Certificate Of Deposit | 5.1% |
| Common Stocks | 47.7% |
| Corporate Bonds | 34.6% |
| Exchange-Traded Funds | 2.7% |
| Money Market Funds | 0.3% |
| U.S. Government & Agencies | 9.6% |
What did the Fund invest in?
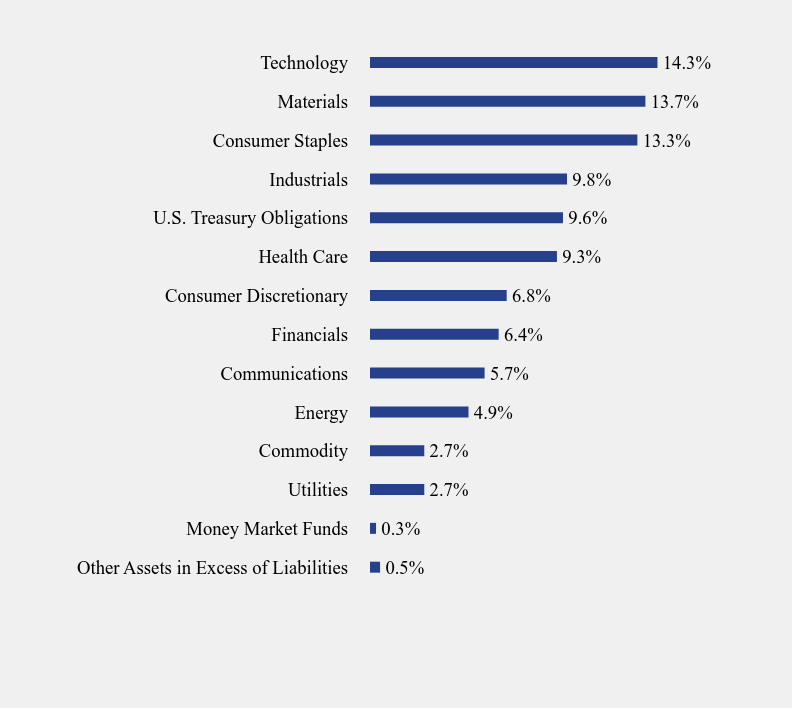
Sector Weighting (% of net assets)
| Value | Value |
|---|
| Other Assets in Excess of Liabilities | 0.5% |
| Money Market Funds | 0.3% |
| Utilities | 2.7% |
| Commodity | 2.7% |
| Energy | 4.9% |
| Communications | 5.7% |
| Financials | 6.4% |
| Consumer Discretionary | 6.8% |
| Health Care | 9.3% |
| U.S. Treasury Obligations | 9.6% |
| Industrials | 9.8% |
| Consumer Staples | 13.3% |
| Materials | 13.7% |
| Technology | 14.3% |
Top 10 Holdings (% of net assets)
| Holding Name | % of Net Assets |
| United States Treasury Note, 0.375%, 07/15/24 | 6.8% |
| Microsoft Corporation | 3.6% |
| United States Treasury Note, 2.500%, 01/31/25 | 2.7% |
| Vivendi S.E. | 2.7% |
| SPDR Gold MiniShares Trust | 2.7% |
| Imperial Brands PLC | 2.6% |
| Bunge Global S.A. | 2.6% |
| Sanofi S.A. | 2.5% |
| Nestle S.A. | 2.5% |
| Holcim A.G. | 2.4% |
No material changes occurred during the year ended June 30, 2024.
Catalyst/MAP Global Balanced Fund - Class A (TRXAX)
Annual Shareholder Report - June 30, 2024
Where can I find additional information about the Fund?
Additional information is available on the Fund's website ( https://catalystmf.com/literature-and-forms/ ), including its:
Prospectus
Financial information
Holdings
Proxy voting information
Catalyst/MAP Global Balanced Fund
Annual Shareholder Report - June 30, 2024
This annual shareholder report contains important information about Catalyst/MAP Global Balanced Fund for the period of July 1, 2023 to June 30, 2024. You can find additional information about the Fund at https://catalystmf.com/literature-and-forms/. You can also request this information by contacting us at 1-866-447-4228.
What were the Fund’s costs for the last year?
(based on a hypothetical $10,000 investment)
| Class Name | Costs of a $10,000 investment | Costs paid as a percentage of a $10,000 investment |
|---|
| Class C | $197 | 1.97% |
How did the Fund perform during the reporting period?
At the start of 2023 we did not believe that high interest rates would tip the economy into a recession; however, we did expect the economy to continue to slow. But to our surprise, economic growth grew robustly in 2023. During the fall of 2023, the Federal Reserve (the Fed) declared the rate hike cycle over and that they had conquered inflation. Bond prices rose, causing rates to fall, leading to a strong risk-on feedback loop, rewarding investors who added beta and momentum to their portfolios. With stock valuations today near where they were before the Fed began their aggressive hikes, equity risk premiums are historically low. As a value manager requiring a margin of safety, we find that difficult to achieve in this environment. Relative fund performance for the reporting period was impacted by the outsized performance of momentum stocks, particularly those involved with Artificial Intelligence (AI). Furthermore, our cautious economic stance led to underperformance relative to stronger than expected economic growth.
We believe that the historic rally over the past six months and investors' singular focus on AI and its future potential has caused many to shift their focus away from the numerous structural issues prevalent in the economy. Accordingly, the Fund remains positioned with a defensive bias. The Fund is currently overweight Consumer Staples and Health Care. The Fund has some equity exposure to copper and agricultural commodities, as well as to areas of the market that we believe will benefit from structural technology growth, along with utilities and infrastructure companies. We believe this blueprint will successfully navigate a market where growth is likely to slow, and inflation is expected to remain volatile and above the Fed’s 2% target, and over the long term we believe yields will remain higher for longer.
How has the Fund performed over the last ten years?
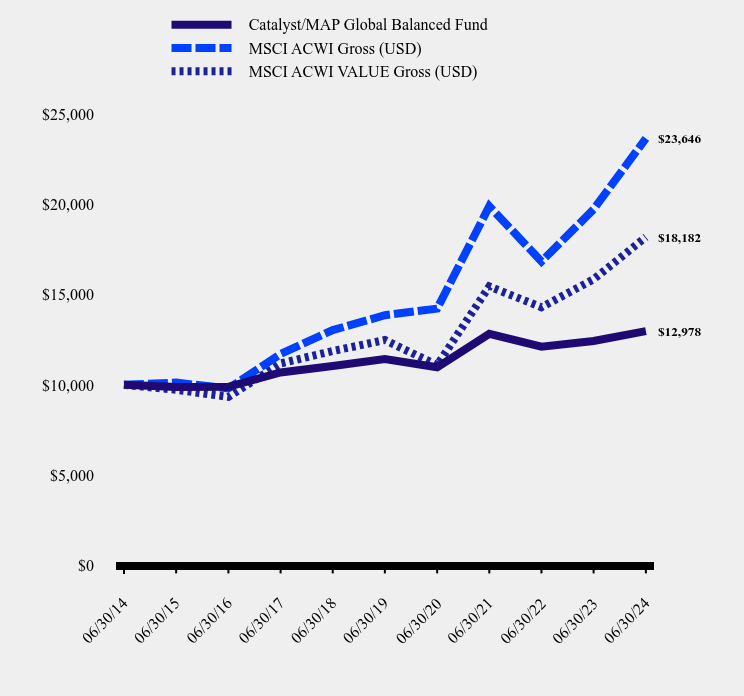
Total Return Based on $10,000 Investment
| Catalyst/MAP Global Balanced Fund | MSCI ACWI Gross (USD) | MSCI ACWI VALUE Gross (USD) |
|---|
| 06/30/14 | $10,000 | $10,000 | $10,000 |
| 06/30/15 | $9,876 | $10,123 | $9,725 |
| 06/30/16 | $9,892 | $9,802 | $9,333 |
| 06/30/17 | $10,686 | $11,706 | $11,184 |
| 06/30/18 | $11,043 | $13,030 | $11,872 |
| 06/30/19 | $11,424 | $13,854 | $12,482 |
| 06/30/20 | $10,974 | $14,220 | $11,090 |
| 06/30/21 | $12,826 | $19,890 | $15,450 |
| 06/30/22 | $12,112 | $16,833 | $14,296 |
| 06/30/23 | $12,428 | $19,717 | $15,844 |
| 06/30/24 | $12,978 | $23,646 | $18,182 |
Average Annual Total Returns
| 1 Year | 5 Years | 10 Years |
|---|
| Catalyst/MAP Global Balanced Fund | 4.43% | 2.58% | 2.64% |
| MSCI ACWI Gross (USD) | 19.92% | 11.28% | 8.99% |
| MSCI ACWI VALUE Gross (USD) | 14.76% | 7.81% | 6.16% |
The Fund's past performance is not a good predictor of how the Fund will perform in the future. The graph and table do not reflect the deduction of taxes that a shareholder would pay on fund distributions or redemption of fund shares.
- Net Assets$14,587,043
- Number of Portfolio Holdings61
- Advisory Fee (net of waivers)$0
- Portfolio Turnover30%
Asset Weighting (% of total investments)
| Value | Value |
|---|
| Certificate Of Deposit | 5.1% |
| Common Stocks | 47.7% |
| Corporate Bonds | 34.6% |
| Exchange-Traded Funds | 2.7% |
| Money Market Funds | 0.3% |
| U.S. Government & Agencies | 9.6% |
What did the Fund invest in?
Sector Weighting (% of net assets)
| Value | Value |
|---|
| Other Assets in Excess of Liabilities | 0.5% |
| Money Market Funds | 0.3% |
| Utilities | 2.7% |
| Commodity | 2.7% |
| Energy | 4.9% |
| Communications | 5.7% |
| Financials | 6.4% |
| Consumer Discretionary | 6.8% |
| Health Care | 9.3% |
| U.S. Treasury Obligations | 9.6% |
| Industrials | 9.8% |
| Consumer Staples | 13.3% |
| Materials | 13.7% |
| Technology | 14.3% |
Top 10 Holdings (% of net assets)
| Holding Name | % of Net Assets |
| United States Treasury Note, 0.375%, 07/15/24 | 6.8% |
| Microsoft Corporation | 3.6% |
| United States Treasury Note, 2.500%, 01/31/25 | 2.7% |
| Vivendi S.E. | 2.7% |
| SPDR Gold MiniShares Trust | 2.7% |
| Imperial Brands PLC | 2.6% |
| Bunge Global S.A. | 2.6% |
| Sanofi S.A. | 2.5% |
| Nestle S.A. | 2.5% |
| Holcim A.G. | 2.4% |
No material changes occurred during the year ended June 30, 2024.
Catalyst/MAP Global Balanced Fund - Class C (TRXCX)
Annual Shareholder Report - June 30, 2024
Where can I find additional information about the Fund?
Additional information is available on the Fund's website ( https://catalystmf.com/literature-and-forms/ ), including its:
Prospectus
Financial information
Holdings
Proxy voting information
Catalyst/MAP Global Balanced Fund
Annual Shareholder Report - June 30, 2024
This annual shareholder report contains important information about Catalyst/MAP Global Balanced Fund for the period of July 1, 2023 to June 30, 2024. You can find additional information about the Fund at https://catalystmf.com/literature-and-forms/. You can also request this information by contacting us at 1-866-447-4228.
What were the Fund’s costs for the last year?
(based on a hypothetical $10,000 investment)
| Class Name | Costs of a $10,000 investment | Costs paid as a percentage of a $10,000 investment |
|---|
| Class I | $97 | 0.97% |
How did the Fund perform during the reporting period?
At the start of 2023 we did not believe that high interest rates would tip the economy into a recession; however, we did expect the economy to continue to slow. But to our surprise, economic growth grew robustly in 2023. During the fall of 2023, the Federal Reserve (the Fed) declared the rate hike cycle over and that they had conquered inflation. Bond prices rose, causing rates to fall, leading to a strong risk-on feedback loop, rewarding investors who added beta and momentum to their portfolios. With stock valuations today near where they were before the Fed began their aggressive hikes, equity risk premiums are historically low. As a value manager requiring a margin of safety, we find that difficult to achieve in this environment. Relative fund performance for the reporting period was impacted by the outsized performance of momentum stocks, particularly those involved with Artificial Intelligence (AI). Furthermore, our cautious economic stance led to underperformance relative to stronger than expected economic growth.
We believe that the historic rally over the past six months and investors' singular focus on AI and its future potential has caused many to shift their focus away from the numerous structural issues prevalent in the economy. Accordingly, the Fund remains positioned with a defensive bias. The Fund is currently overweight Consumer Staples and Health Care. The Fund has some equity exposure to copper and agricultural commodities, as well as to areas of the market that we believe will benefit from structural technology growth, along with utilities and infrastructure companies. We believe this blueprint will successfully navigate a market where growth is likely to slow, and inflation is expected to remain volatile and above the Fed’s 2% target, and over the long term we believe yields will remain higher for longer.
How has the Fund performed over the last ten years?
Total Return Based on $10,000 Investment
| Catalyst/MAP Global Balanced Fund | MSCI ACWI Gross (USD) | MSCI ACWI VALUE Gross (USD) |
|---|
| 06/30/14 | $10,000 | $10,000 | $10,000 |
| 06/30/15 | $9,976 | $10,123 | $9,725 |
| 06/30/16 | $10,092 | $9,802 | $9,333 |
| 06/30/17 | $11,015 | $11,706 | $11,184 |
| 06/30/18 | $11,509 | $13,030 | $11,872 |
| 06/30/19 | $12,032 | $13,854 | $12,482 |
| 06/30/20 | $11,666 | $14,220 | $11,090 |
| 06/30/21 | $13,780 | $19,890 | $15,450 |
| 06/30/22 | $13,144 | $16,833 | $14,296 |
| 06/30/23 | $13,616 | $19,717 | $15,844 |
| 06/30/24 | $14,371 | $23,646 | $18,182 |
Average Annual Total Returns
| 1 Year | 5 Years | 10 Years |
|---|
| Catalyst/MAP Global Balanced Fund | 5.55% | 3.62% | 3.69% |
| MSCI ACWI Gross (USD) | 19.92% | 11.28% | 8.99% |
| MSCI ACWI VALUE Gross (USD) | 14.76% | 7.81% | 6.16% |
The Fund's past performance is not a good predictor of how the Fund will perform in the future. The graph and table do not reflect the deduction of taxes that a shareholder would pay on fund distributions or redemption of fund shares.
- Net Assets$14,587,043
- Number of Portfolio Holdings61
- Advisory Fee (net of waivers)$0
- Portfolio Turnover30%
Asset Weighting (% of total investments)
| Value | Value |
|---|
| Certificate Of Deposit | 5.1% |
| Common Stocks | 47.7% |
| Corporate Bonds | 34.6% |
| Exchange-Traded Funds | 2.7% |
| Money Market Funds | 0.3% |
| U.S. Government & Agencies | 9.6% |
What did the Fund invest in?
Sector Weighting (% of net assets)
| Value | Value |
|---|
| Other Assets in Excess of Liabilities | 0.5% |
| Money Market Funds | 0.3% |
| Utilities | 2.7% |
| Commodity | 2.7% |
| Energy | 4.9% |
| Communications | 5.7% |
| Financials | 6.4% |
| Consumer Discretionary | 6.8% |
| Health Care | 9.3% |
| U.S. Treasury Obligations | 9.6% |
| Industrials | 9.8% |
| Consumer Staples | 13.3% |
| Materials | 13.7% |
| Technology | 14.3% |
Top 10 Holdings (% of net assets)
| Holding Name | % of Net Assets |
| United States Treasury Note, 0.375%, 07/15/24 | 6.8% |
| Microsoft Corporation | 3.6% |
| United States Treasury Note, 2.500%, 01/31/25 | 2.7% |
| Vivendi S.E. | 2.7% |
| SPDR Gold MiniShares Trust | 2.7% |
| Imperial Brands PLC | 2.6% |
| Bunge Global S.A. | 2.6% |
| Sanofi S.A. | 2.5% |
| Nestle S.A. | 2.5% |
| Holcim A.G. | 2.4% |
No material changes occurred during the year ended June 30, 2024.
Catalyst/MAP Global Balanced Fund - Class I (TRXIX)
Annual Shareholder Report - June 30, 2024
Where can I find additional information about the Fund?
Additional information is available on the Fund's website ( https://catalystmf.com/literature-and-forms/ ), including its:
Prospectus
Financial information
Holdings
Proxy voting information
Catalyst/SMH High Income Fund
Annual Shareholder Report - June 30, 2024
This annual shareholder report contains important information about Catalyst/SMH High Income Fund for the period of July 1, 2023 to June 30, 2024. You can find additional information about the Fund at https://catalystmf.com/literature-and-forms/. You can also request this information by contacting us at 1-866-447-4228.
What were the Fund’s costs for the last year?
(based on a hypothetical $10,000 investment)
| Class Name | Costs of a $10,000 investment | Costs paid as a percentage of a $10,000 investment |
|---|
| Class A | $148 | 1.48% |
How did the Fund perform during the reporting period?
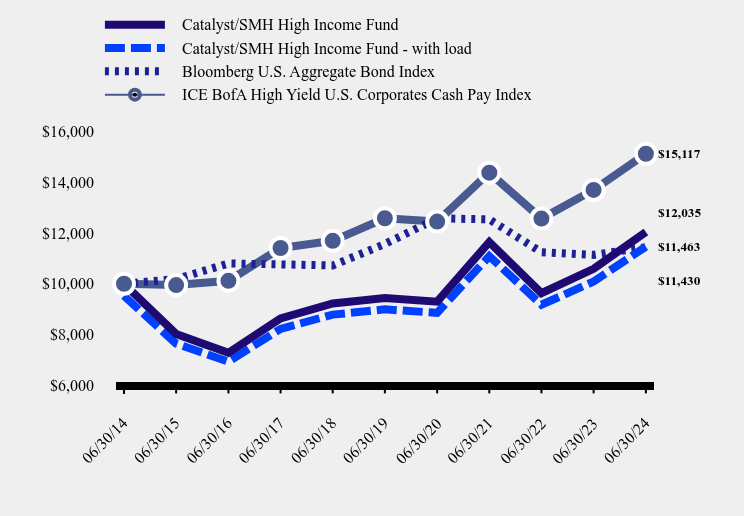
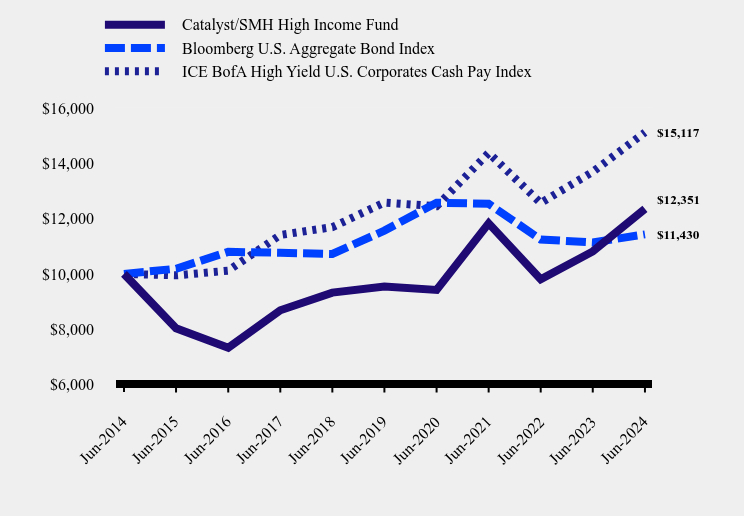
Performance of the Fund was primarily driven by the stoppage of increasing interest rates and a general move into more risk-based assets. The Fund outperformed the Ice BofA Cash Pay High Yield Index during the reporting period. The Fund’s returns were higher than our return expectations for the period. We do see a high likelihood of an economic slowdown and uncertainty and expect the overall markets to be volatile moving forward. The high yield class in general should be one of the better performing asset classes in credit on a go forward basis. We are looking at current yields of 6.4% and hope to add a couple more percent in returns above that.
How has the Fund performed over the last ten years?
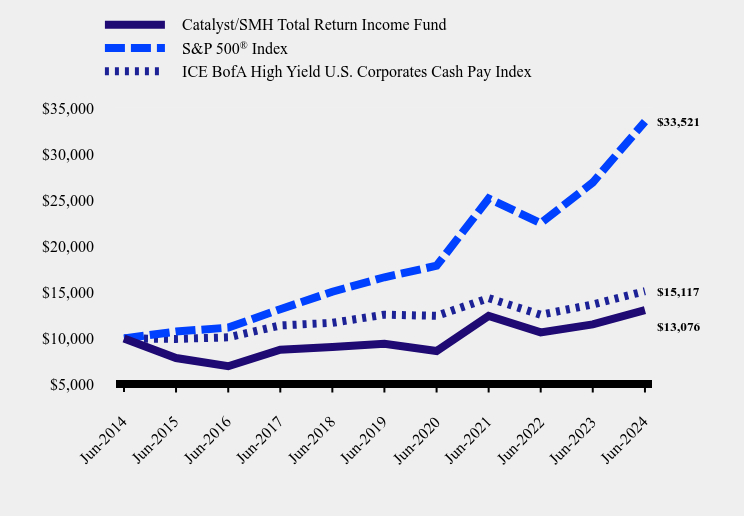
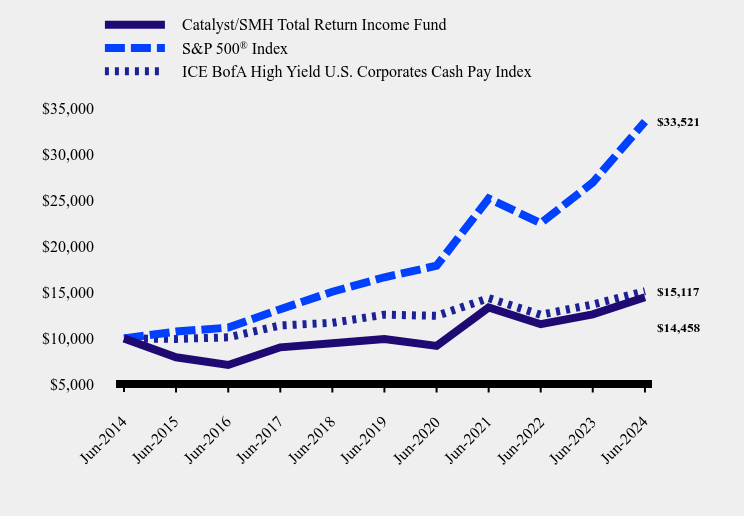
Total Return Based on $10,000 Investment
| Catalyst/SMH High Income Fund | Catalyst/SMH High Income Fund - with load | Bloomberg U.S. Aggregate Bond Index | ICE BofA High Yield U.S. Corporates Cash Pay Index |
|---|
| 06/30/14 | $10,000 | $9,525 | $10,000 | $10,000 |
| 06/30/15 | $8,024 | $7,643 | $10,186 | $9,947 |
| 06/30/16 | $7,281 | $6,935 | $10,797 | $10,116 |
| 06/30/17 | $8,636 | $8,225 | $10,763 | $11,406 |
| 06/30/18 | $9,223 | $8,785 | $10,720 | $11,690 |
| 06/30/19 | $9,440 | $8,992 | $11,564 | $12,579 |
| 06/30/20 | $9,297 | $8,856 | $12,575 | $12,446 |
| 06/30/21 | $11,642 | $11,089 | $12,533 | $14,372 |
| 06/30/22 | $9,632 | $9,174 | $11,243 | $12,564 |
| 06/30/23 | $10,589 | $10,086 | $11,137 | $13,691 |
| 06/30/24 | $12,035 | $11,463 | $11,430 | $15,117 |
Average Annual Total Returns
| 1 Year | 5 Years | 10 Years |
|---|
| Catalyst/SMH High Income Fund | | | |
| Without Load | 13.65% | 4.98% | 1.87% |
| With Load | 8.25% | 3.96% | 1.37% |
| Bloomberg U.S. Aggregate Bond Index | 2.63% | | 1.35% |
| ICE BofA High Yield U.S. Corporates Cash Pay Index | 10.41% | 3.74% | 4.22% |
The Fund's past performance is not a good predictor of how the Fund will perform in the future. The graph and table do not reflect the deduction of taxes that a shareholder would pay on fund distributions or redemption of fund shares.
- Net Assets$15,131,607
- Number of Portfolio Holdings34
- Advisory Fee (net of waivers)$15,158
- Portfolio Turnover33%
Asset Weighting (% of total investments)
| Value | Value |
|---|
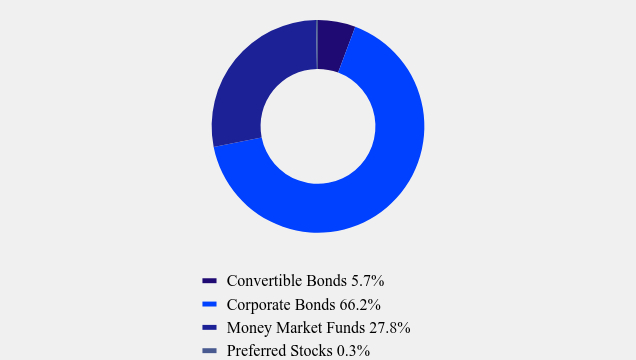
| Convertible Bonds | 5.7% |
| Corporate Bonds | 66.2% |
| Money Market Funds | 27.8% |
| Preferred Stocks | 0.3% |
What did the Fund invest in?
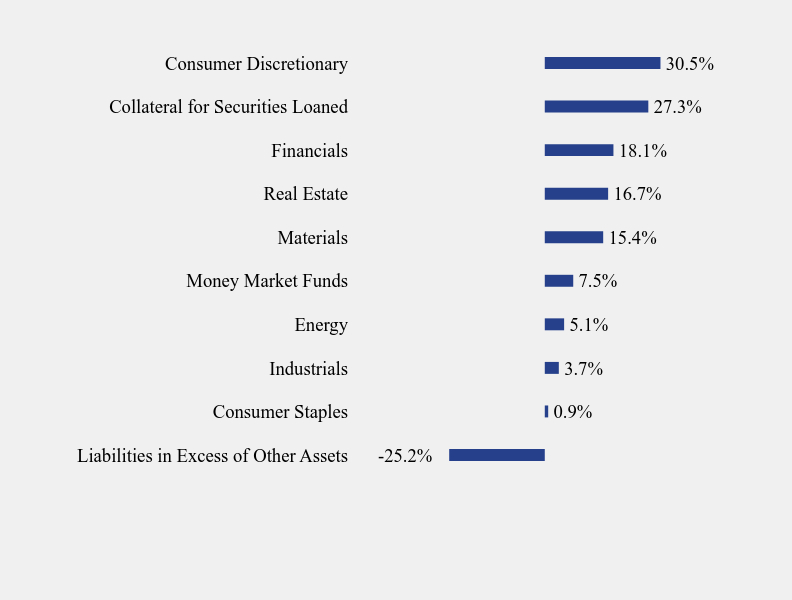
Sector Weighting (% of net assets)
| Value | Value |
|---|
| Liabilities in Excess of Other Assets | -25.2% |
| Consumer Staples | 0.9% |
| Industrials | 3.7% |
| Energy | 5.1% |
| Money Market Funds | 7.5% |
| Materials | 15.4% |
| Real Estate | 16.7% |
| Financials | 18.1% |
| Collateral for Securities Loaned | 27.3% |
| Consumer Discretionary | 30.5% |
Top 10 Holdings (% of net assets)
| Holding Name | % of Net Assets |
| Coeur Mining, Inc., 5.125%, 02/15/29 | 5.4% |
| Howard Hughes Corporation (The), 4.375%, 02/01/31 | 4.8% |
| American Axle & Manufacturing, Inc., 5.000%, 10/01/29 | 4.5% |
| Nordstrom, Inc., 5.000%, 01/15/44 | 4.4% |
| United States Steel Corporation, 6.650%, 06/01/37 | 4.3% |
| WisdomTree, Inc., 5.750%, 08/15/28 | 4.1% |
| Odeon Finco PLC, 12.750%, 11/01/27 | 3.8% |
| Beazer Homes USA, Inc., 5.875%, 10/15/27 | 3.8% |
| Rayonier AM Products, Inc., 7.625%, 01/15/26 | 3.8% |
| Enova International, Inc., 8.500%, 09/15/25 | 3.7% |
No material changes occurred during the year ended June 30, 2024.
Catalyst/SMH High Income Fund - Class A (HIIFX)
Annual Shareholder Report - June 30, 2024
Where can I find additional information about the Fund?
Additional information is available on the Fund's website (https://catalystmf.com/literature-and-forms/), including its:
Prospectus
Financial information
Holdings
Proxy voting information
Catalyst/SMH High Income Fund
Annual Shareholder Report - June 30, 2024
This annual shareholder report contains important information about Catalyst/SMH High Income Fund for the period of July 1, 2023 to June 30, 2024. You can find additional information about the Fund at https://catalystmf.com/literature-and-forms/. You can also request this information by contacting us at 1-866-447-4228.
What were the Fund’s costs for the last year?
(based on a hypothetical $10,000 investment)
| Class Name | Costs of a $10,000 investment | Costs paid as a percentage of a $10,000 investment |
|---|
| Class C | $223 | 2.23% |
How did the Fund perform during the reporting period?
Performance of the Fund was primarily driven by the stoppage of increasing interest rates and a general move into more risk-based assets. The Fund outperformed the Ice BofA Cash Pay High Yield Index during the reporting period. The Fund’s returns were higher than our return expectations for the period. We do see a high likelihood of an economic slowdown and uncertainty and expect the overall markets to be volatile moving forward. The high yield class in general should be one of the better performing asset classes in credit on a go forward basis. We are looking at current yields of 6.4% and hope to add a couple more percent in returns above that.
How has the Fund performed over the last ten years?
Total Return Based on $10,000 Investment
| Catalyst/SMH High Income Fund | Bloomberg U.S. Aggregate Bond Index | ICE BofA High Yield U.S. Corporates Cash Pay Index |
|---|
| Jun-2014 | $10,000 | $10,000 | $10,000 |
| Jun-2015 | $7,964 | $10,186 | $9,947 |
| Jun-2016 | $7,192 | $10,797 | $10,116 |
| Jun-2017 | $8,442 | $10,763 | $11,406 |
| Jun-2018 | $8,970 | $10,720 | $11,690 |
| Jun-2019 | $9,090 | $11,564 | $12,579 |
| Jun-2020 | $8,885 | $12,575 | $12,446 |
| Jun-2021 | $11,042 | $12,533 | $14,372 |
| Jun-2022 | $9,064 | $11,243 | $12,564 |
| Jun-2023 | $9,917 | $11,137 | $13,691 |
| Jun-2024 | $11,182 | $11,430 | $15,117 |
Average Annual Total Returns
| 1 Year | 5 Years | 10 Years |
|---|
| Catalyst/SMH High Income Fund | 12.77% | 4.23% | 1.12% |
| Bloomberg U.S. Aggregate Bond Index | 2.63% | | 1.35% |
| ICE BofA High Yield U.S. Corporates Cash Pay Index | 10.41% | 3.74% | 4.22% |
The Fund's past performance is not a good predictor of how the Fund will perform in the future. The graph and table do not reflect the deduction of taxes that a shareholder would pay on fund distributions or redemption of fund shares.
- Net Assets$15,131,607
- Number of Portfolio Holdings34
- Advisory Fee (net of waivers)$15,158
- Portfolio Turnover33%
Asset Weighting (% of total investments)
| Value | Value |
|---|
| Convertible Bonds | 5.7% |
| Corporate Bonds | 66.2% |
| Money Market Funds | 27.8% |
| Preferred Stocks | 0.3% |
What did the Fund invest in?
Sector Weighting (% of net assets)
| Value | Value |
|---|
| Liabilities in Excess of Other Assets | -25.2% |
| Consumer Staples | 0.9% |
| Industrials | 3.7% |
| Energy | 5.1% |
| Money Market Funds | 7.5% |
| Materials | 15.4% |
| Real Estate | 16.7% |
| Financials | 18.1% |
| Collateral for Securities Loaned | 27.3% |
| Consumer Discretionary | 30.5% |
Top 10 Holdings (% of net assets)
| Holding Name | % of Net Assets |
| Coeur Mining, Inc., 5.125%, 02/15/29 | 5.4% |
| Howard Hughes Corporation (The), 4.375%, 02/01/31 | 4.8% |
| American Axle & Manufacturing, Inc., 5.000%, 10/01/29 | 4.5% |
| Nordstrom, Inc., 5.000%, 01/15/44 | 4.4% |
| United States Steel Corporation, 6.650%, 06/01/37 | 4.3% |
| WisdomTree, Inc., 5.750%, 08/15/28 | 4.1% |
| Odeon Finco PLC, 12.750%, 11/01/27 | 3.8% |
| Beazer Homes USA, Inc., 5.875%, 10/15/27 | 3.8% |
| Rayonier AM Products, Inc., 7.625%, 01/15/26 | 3.8% |
| Enova International, Inc., 8.500%, 09/15/25 | 3.7% |
No material changes occurred during the year ended June 30, 2024.
Catalyst/SMH High Income Fund - Class C (HIICX)
Annual Shareholder Report - June 30, 2024
Where can I find additional information about the Fund?
Additional information is available on the Fund's website (https://catalystmf.com/literature-and-forms/), including its:
Prospectus
Financial information
Holdings
Proxy voting information
Catalyst/SMH High Income Fund
Annual Shareholder Report - June 30, 2024
This annual shareholder report contains important information about Catalyst/SMH High Income Fund for the period of July 1, 2023 to June 30, 2024. You can find additional information about the Fund at https://catalystmf.com/literature-and-forms/. You can also request this information by contacting us at 1-866-447-4228.
What were the Fund’s costs for the last year?
(based on a hypothetical $10,000 investment)
| Class Name | Costs of a $10,000 investment | Costs paid as a percentage of a $10,000 investment |
|---|
| Class I | $123 | 1.23% |
How did the Fund perform during the reporting period?
Performance of the Fund was primarily driven by the stoppage of increasing interest rates and a general move into more risk-based assets. The Fund outperformed the Ice BofA Cash Pay High Yield Index during the reporting period. The Fund’s returns were higher than our return expectations for the period. We do see a high likelihood of an economic slowdown and uncertainty and expect the overall markets to be volatile moving forward. The high yield class in general should be one of the better performing asset classes in credit on a go forward basis. We are looking at current yields of 6.4% and hope to add a couple more percent in returns above that.
How has the Fund performed over the last ten years?
Total Return Based on $10,000 Investment
| Catalyst/SMH High Income Fund | Bloomberg U.S. Aggregate Bond Index | ICE BofA High Yield U.S. Corporates Cash Pay Index |
|---|
| Jun-2014 | $10,000 | $10,000 | $10,000 |
| Jun-2015 | $8,030 | $10,186 | $9,947 |
| Jun-2016 | $7,327 | $10,797 | $10,116 |
| Jun-2017 | $8,686 | $10,763 | $11,406 |
| Jun-2018 | $9,323 | $10,720 | $11,690 |
| Jun-2019 | $9,543 | $11,564 | $12,579 |
| Jun-2020 | $9,422 | $12,575 | $12,446 |
| Jun-2021 | $11,827 | $12,533 | $14,372 |
| Jun-2022 | $9,809 | $11,243 | $12,564 |
| Jun-2023 | $10,811 | $11,137 | $13,691 |
| Jun-2024 | $12,351 | $11,430 | $15,117 |
Average Annual Total Returns
| 1 Year | 5 Years | 10 Years |
|---|
| Catalyst/SMH High Income Fund | 14.24% | 5.30% | 2.13% |
| Bloomberg U.S. Aggregate Bond Index | 2.63% | | 1.35% |
| ICE BofA High Yield U.S. Corporates Cash Pay Index | 10.41% | 3.74% | 4.22% |
The Fund's past performance is not a good predictor of how the Fund will perform in the future. The graph and table do not reflect the deduction of taxes that a shareholder would pay on fund distributions or redemption of fund shares.
- Net Assets$15,131,607
- Number of Portfolio Holdings34
- Advisory Fee (net of waivers)$15,158
- Portfolio Turnover33%
Asset Weighting (% of total investments)
| Value | Value |
|---|
| Convertible Bonds | 5.7% |
| Corporate Bonds | 66.2% |
| Money Market Funds | 27.8% |
| Preferred Stocks | 0.3% |
What did the Fund invest in?
Sector Weighting (% of net assets)
| Value | Value |
|---|
| Liabilities in Excess of Other Assets | -25.2% |
| Consumer Staples | 0.9% |
| Industrials | 3.7% |
| Energy | 5.1% |
| Money Market Funds | 7.5% |
| Materials | 15.4% |
| Real Estate | 16.7% |
| Financials | 18.1% |
| Collateral for Securities Loaned | 27.3% |
| Consumer Discretionary | 30.5% |
Top 10 Holdings (% of net assets)
| Holding Name | % of Net Assets |
| Coeur Mining, Inc., 5.125%, 02/15/29 | 5.4% |
| Howard Hughes Corporation (The), 4.375%, 02/01/31 | 4.8% |
| American Axle & Manufacturing, Inc., 5.000%, 10/01/29 | 4.5% |
| Nordstrom, Inc., 5.000%, 01/15/44 | 4.4% |
| United States Steel Corporation, 6.650%, 06/01/37 | 4.3% |
| WisdomTree, Inc., 5.750%, 08/15/28 | 4.1% |
| Odeon Finco PLC, 12.750%, 11/01/27 | 3.8% |
| Beazer Homes USA, Inc., 5.875%, 10/15/27 | 3.8% |
| Rayonier AM Products, Inc., 7.625%, 01/15/26 | 3.8% |
| Enova International, Inc., 8.500%, 09/15/25 | 3.7% |
No material changes occurred during the year ended June 30, 2024.
Catalyst/SMH High Income Fund - Class I (HIIIX)
Annual Shareholder Report - June 30, 2024
Where can I find additional information about the Fund?
Additional information is available on the Fund's website (https://catalystmf.com/literature-and-forms/), including its:
Prospectus
Financial information
Holdings
Proxy voting information
Catalyst/SMH Total Return Income Fund
Annual Shareholder Report - June 30, 2024
This annual shareholder report contains important information about Catalyst/SMH Total Return Income Fund for the period of July 1, 2023 to June 30, 2024.You can find additional information about the Fund at https://catalystmf.com/literature-and-forms/. You can also request this information by contacting us at 1-866-447-4228.
What were the Fund’s costs for the last year?
(based on a hypothetical $10,000 investment)
| Class Name | Costs of a $10,000 investment | Costs paid as a percentage of a $10,000 investment |
|---|
| Class A | $158 | 1.58% |
How did the Fund perform during the reporting period?
We were pleased with Catalyst/SMH Total Return Income Fund’s 14.30% return (without load) during the reporting period. There were no major individual contributors or detractors from performance but the Fund instead saw a nice steady increase throughout the year. We target returns of inflation plus 3-5%. As long as the Fund achieves that goal, we are happy with performance. We feel the Fund is positioned strongly with about 50 positions and a 7.1% current yield. We expect significant economic uncertainty ahead, and that could make the Fund a bit more volatile but expect it to be muted quite considerably because of the high income level.
How has the Fund performed over the last ten years?
Total Return Based on $10,000 Investment
| Catalyst/SMH Total Return Income Fund | Catalyst/SMH Total Return Income Fund - with load | S&P 500® Index | ICE BofA High Yield U.S. Corporates Cash Pay Index |
|---|
| 06/30/14 | $10,000 | $9,425 | $10,000 | $10,000 |
| 06/30/15 | $7,932 | $7,476 | $10,742 | $9,947 |
| 06/30/16 | $7,091 | $6,683 | $11,171 | $10,116 |
| 06/30/17 | $8,968 | $8,453 | $13,170 | $11,406 |
| 06/30/18 | $9,377 | $8,838 | $15,064 | $11,690 |
| 06/30/19 | $9,783 | $9,220 | $16,633 | $12,579 |
| 06/30/20 | $9,051 | $8,530 | $17,881 | $12,446 |
| 06/30/21 | $13,135 | $12,380 | $25,175 | $14,372 |
| 06/30/22 | $11,306 | $10,656 | $22,503 | $12,564 |
| 06/30/23 | $12,325 | $11,616 | $26,912 | $13,691 |
| 06/30/24 | $14,087 | $13,277 | $33,521 | $15,117 |
Average Annual Total Returns
| 1 Year | 5 Years | 10 Years |
|---|
| Catalyst/SMH Total Return Income Fund | | | |
| Without Load | 14.30% | 7.56% | 3.49% |
| With Load | 7.72% | 6.30% | 2.87% |
S&P 500® Index | 24.56% | 15.05% | 12.86% |
| ICE BofA High Yield U.S. Corporates Cash Pay Index | 10.41% | 3.74% | 4.22% |
The Fund's past performance is not a good predictor of how the Fund will perform in the future. The graph and table do not reflect the deduction of taxes that a shareholder would pay on fund distributions or redemption of fund shares.
- Net Assets$17,829,270
- Number of Portfolio Holdings50
- Advisory Fee (net of waivers)$54,238
- Portfolio Turnover35%
Asset Weighting (% of total investments)
| Value | Value |
|---|
| Common Stocks | 29.9% |
| Convertible Bonds | 5.1% |
| Corporate Bonds | 37.9% |
| Money Market Funds | 27.1% |
What did the Fund invest in?
Sector Weighting (% of net assets)
| Value | Value |
|---|
| Liabilities in Excess of Other Assets | -33.9% |
| Health Care | 0.2% |
| Utilities | 0.6% |
| Money Market Funds | 0.9% |
| Mixed Allocation | 0.9% |
| Consumer Staples | 1.0% |
| Technology | 1.8% |
| Communications | 2.6% |
| Materials | 5.6% |
| Industrials | 6.8% |
| Energy | 9.6% |
| Real Estate | 15.6% |
| Consumer Discretionary | 17.5% |
| Financials | 35.4% |
| Collateral for Securities Loaned | 35.4% |
Top 10 Holdings (% of net assets)
| Holding Name | % of Net Assets |
| Transocean, Inc., 6.800%, 03/15/38 | 4.4% |
| Compass Diversified Holdings | 4.3% |
| PennantPark Investment Corporation | 4.2% |
| CoreCivic, Inc., 4.750%, 10/15/27 | 4.1% |
| EZCORP, Inc., 2.375%, 05/01/25 | 3.9% |
| Titan International, Inc., 7.000%, 04/30/28 | 3.7% |
| Enova International, Inc., 8.500%, 09/15/25 | 3.6% |
| Beazer Homes USA, Inc., 5.875%, 10/15/27 | 3.5% |
| Main Street Capital Corporation | 3.4% |
| American Axle & Manufacturing, Inc., 5.000%, 10/01/29 | 3.3% |
No material changes occurred during the year ended June 30, 2024.
Catalyst/SMH Total Return Income Fund - Class A (TRIFX)
Annual Shareholder Report - June 30, 2024
Where can I find additional information about the Fund?
Additional information is available on the Fund's website (https://catalystmf.com/literature-and-forms/), including its:
Prospectus
Financial information
Holdings
Proxy voting information
Catalyst/SMH Total Return Income Fund
Annual Shareholder Report - June 30, 2024
This annual shareholder report contains important information about Catalyst/SMH Total Return Income Fund for the period of July 1, 2023 to June 30, 2024.You can find additional information about the Fund at https://catalystmf.com/literature-and-forms/. You can also request this information by contacting us at 1-866-447-4228.
What were the Fund’s costs for the last year?
(based on a hypothetical $10,000 investment)
| Class Name | Costs of a $10,000 investment | Costs paid as a percentage of a $10,000 investment |
|---|
| Class C | $233 | 2.33% |
How did the Fund perform during the reporting period?
We were pleased with Catalyst/SMH Total Return Income Fund’s 13.46% return during the reporting period. There were no major individual contributors or detractors from performance but the Fund instead saw a nice steady increase throughout the year. We target returns of inflation plus 3-5%. As long as the Fund achieves that goal, we are happy with performance. We feel the Fund is positioned strongly with about 50 positions and a 7.1% current yield. We expect significant economic uncertainty ahead, and that could make the Fund a bit more volatile but expect it to be muted quite considerably because of the high income level.
How has the Fund performed over the last ten years?
Total Return Based on $10,000 Investment
| Catalyst/SMH Total Return Income Fund | S&P 500® Index | ICE BofA High Yield U.S. Corporates Cash Pay Index |
|---|
| Jun-2014 | $10,000 | $10,000 | $10,000 |
| Jun-2015 | $7,872 | $10,742 | $9,947 |
| Jun-2016 | $6,984 | $11,171 | $10,116 |
| Jun-2017 | $8,769 | $13,170 | $11,406 |
| Jun-2018 | $9,081 | $15,064 | $11,690 |
| Jun-2019 | $9,425 | $16,633 | $12,579 |
| Jun-2020 | $8,634 | $17,881 | $12,446 |
| Jun-2021 | $12,448 | $25,175 | $14,372 |
| Jun-2022 | $10,653 | $22,503 | $12,564 |
| Jun-2023 | $11,525 | $26,912 | $13,691 |
| Jun-2024 | $13,076 | $33,521 | $15,117 |
Average Annual Total Returns
| 1 Year | 5 Years | 10 Years |
|---|
| Catalyst/SMH Total Return Income Fund | 13.46% | 6.77% | 2.72% |
S&P 500® Index | 24.56% | 15.05% | 12.86% |
| ICE BofA High Yield U.S. Corporates Cash Pay Index | 10.41% | 3.74% | 4.22% |
The Fund's past performance is not a good predictor of how the Fund will perform in the future. The graph and table do not reflect the deduction of taxes that a shareholder would pay on fund distributions or redemption of fund shares.
- Net Assets$17,829,270
- Number of Portfolio Holdings50
- Advisory Fee (net of waivers)$54,238
- Portfolio Turnover35%
Asset Weighting (% of total investments)
| Value | Value |
|---|
| Common Stocks | 29.9% |
| Convertible Bonds | 5.1% |
| Corporate Bonds | 37.9% |
| Money Market Funds | 27.1% |
What did the Fund invest in?
Sector Weighting (% of net assets)
| Value | Value |
|---|
| Liabilities in Excess of Other Assets | -33.9% |
| Health Care | 0.2% |
| Utilities | 0.6% |
| Money Market Funds | 0.9% |
| Mixed Allocation | 0.9% |
| Consumer Staples | 1.0% |
| Technology | 1.8% |
| Communications | 2.6% |
| Materials | 5.6% |
| Industrials | 6.8% |
| Energy | 9.6% |
| Real Estate | 15.6% |
| Consumer Discretionary | 17.5% |
| Financials | 35.4% |
| Collateral for Securities Loaned | 35.4% |
Top 10 Holdings (% of net assets)
| Holding Name | % of Net Assets |
| Transocean, Inc., 6.800%, 03/15/38 | 4.4% |
| Compass Diversified Holdings | 4.3% |
| PennantPark Investment Corporation | 4.2% |
| CoreCivic, Inc., 4.750%, 10/15/27 | 4.1% |
| EZCORP, Inc., 2.375%, 05/01/25 | 3.9% |
| Titan International, Inc., 7.000%, 04/30/28 | 3.7% |
| Enova International, Inc., 8.500%, 09/15/25 | 3.6% |
| Beazer Homes USA, Inc., 5.875%, 10/15/27 | 3.5% |
| Main Street Capital Corporation | 3.4% |
| American Axle & Manufacturing, Inc., 5.000%, 10/01/29 | 3.3% |
No material changes occurred during the year ended June 30, 2024.
Catalyst/SMH Total Return Income Fund - Class C (TRICX)
Annual Shareholder Report - June 30, 2024
Where can I find additional information about the Fund?
Additional information is available on the Fund's website (https://catalystmf.com/literature-and-forms/), including its:
Prospectus
Financial information
Holdings
Proxy voting information
Catalyst/SMH Total Return Income Fund
Annual Shareholder Report - June 30, 2024
This annual shareholder report contains important information about Catalyst/SMH Total Return Income Fund for the period of July 1, 2023 to June 30, 2024.You can find additional information about the Fund at https://catalystmf.com/literature-and-forms/. You can also request this information by contacting us at 1-866-447-4228.
What were the Fund’s costs for the last year?
(based on a hypothetical $10,000 investment)
| Class Name | Costs of a $10,000 investment | Costs paid as a percentage of a $10,000 investment |
|---|
| Class I | $133 | 1.33% |
How did the Fund perform during the reporting period?
We were pleased with Catalyst/SMH Total Return Income Fund’s 14.63% return during the reporting period. There were no major individual contributors or detractors from performance but the Fund instead saw a nice steady increase throughout the year. We target returns of inflation plus 3-5%. As long as the Fund achieves that goal, we are happy with performance. We feel the Fund is positioned strongly with about 50 positions and a 7.1% current yield. We expect significant economic uncertainty ahead, and that could make the Fund a bit more volatile but expect it to be muted quite considerably because of the high income level.
How has the Fund performed over the last ten years?
Total Return Based on $10,000 Investment
| Catalyst/SMH Total Return Income Fund | S&P 500® Index | ICE BofA High Yield U.S. Corporates Cash Pay Index |
|---|
| Jun-2014 | $10,000 | $10,000 | $10,000 |
| Jun-2015 | $7,949 | $10,742 | $9,947 |
| Jun-2016 | $7,122 | $11,171 | $10,116 |
| Jun-2017 | $9,033 | $13,170 | $11,406 |
| Jun-2018 | $9,472 | $15,064 | $11,690 |
| Jun-2019 | $9,930 | $16,633 | $12,579 |
| Jun-2020 | $9,187 | $17,881 | $12,446 |
| Jun-2021 | $13,350 | $25,175 | $14,372 |
| Jun-2022 | $11,539 | $22,503 | $12,564 |
| Jun-2023 | $12,614 | $26,912 | $13,691 |
| Jun-2024 | $14,458 | $33,521 | $15,117 |
Average Annual Total Returns
| 1 Year | 5 Years | 10 Years |
|---|
| Catalyst/SMH Total Return Income Fund | 14.63% | 7.80% | 3.76% |
S&P 500® Index | 24.56% | 15.05% | 12.86% |
| ICE BofA High Yield U.S. Corporates Cash Pay Index | 10.41% | 3.74% | 4.22% |
The Fund's past performance is not a good predictor of how the Fund will perform in the future. The graph and table do not reflect the deduction of taxes that a shareholder would pay on fund distributions or redemption of fund shares.
- Net Assets$17,829,270
- Number of Portfolio Holdings50
- Advisory Fee (net of waivers)$54,238
- Portfolio Turnover35%
Asset Weighting (% of total investments)
| Value | Value |
|---|
| Common Stocks | 29.9% |
| Convertible Bonds | 5.1% |
| Corporate Bonds | 37.9% |
| Money Market Funds | 27.1% |
What did the Fund invest in?
Sector Weighting (% of net assets)
| Value | Value |
|---|
| Liabilities in Excess of Other Assets | -33.9% |
| Health Care | 0.2% |
| Utilities | 0.6% |
| Money Market Funds | 0.9% |
| Mixed Allocation | 0.9% |
| Consumer Staples | 1.0% |
| Technology | 1.8% |
| Communications | 2.6% |
| Materials | 5.6% |
| Industrials | 6.8% |
| Energy | 9.6% |
| Real Estate | 15.6% |
| Consumer Discretionary | 17.5% |
| Financials | 35.4% |
| Collateral for Securities Loaned | 35.4% |
Top 10 Holdings (% of net assets)
| Holding Name | % of Net Assets |
| Transocean, Inc., 6.800%, 03/15/38 | 4.4% |
| Compass Diversified Holdings | 4.3% |
| PennantPark Investment Corporation | 4.2% |
| CoreCivic, Inc., 4.750%, 10/15/27 | 4.1% |
| EZCORP, Inc., 2.375%, 05/01/25 | 3.9% |
| Titan International, Inc., 7.000%, 04/30/28 | 3.7% |
| Enova International, Inc., 8.500%, 09/15/25 | 3.6% |
| Beazer Homes USA, Inc., 5.875%, 10/15/27 | 3.5% |
| Main Street Capital Corporation | 3.4% |
| American Axle & Manufacturing, Inc., 5.000%, 10/01/29 | 3.3% |
No material changes occurred during the year ended June 30, 2024.
Catalyst/SMH Total Return Income Fund - Class I (TRIIX)
Annual Shareholder Report - June 30, 2024
Where can I find additional information about the Fund?
Additional information is available on the Fund's website (https://catalystmf.com/literature-and-forms/), including its:
Prospectus
Financial information
Holdings
Proxy voting information
(b) Not applicable
Item 2. Code of Ethics.
| (a) | The registrant has, as of the end of the period covered by this report, adopted a code of ethics that applies to the registrant’s principal executive officer, principal financial officer, and principal accounting officer or controller, or persons performing similar functions, regardless of whether these individuals are employed by the registrant or a third party. |
| | |
| (b) | N/A |
| | |
(c) | During the period covered by this report, there were no amendments to any provision of the code of ethics. |
| | |
| (d) | During the period covered by this report, there were no waivers or implicit waivers of a provision of the code of ethics. |
| | |
(e) | N/A |
| | |
| (f) | See Item 19(a)(1) |
Item 3. Audit Committee Financial Expert.
(a)(1) The Registrant’s Board of Trustees has determined that it does not have an audit committee financial expert serving on its audit committee. At this time, the Registrant believes that the experience provided by each member of the audit committee together offer the Registrant adequate oversight for the Registrant’s level of financial complexity.
(a)(2) Not applicable.
(a)(3) Not applicable.
Item 4. Principal Accountant Fees and Services.
| (a) | Audit Fees. The aggregate fees billed for each of the last two fiscal years for professional services rendered by the registrant’s principal accountant for the audit of the registrant’s annual financial statements or services that are normally provided by the accountant in connection with statutory and regulatory filings or engagements for those fiscal years are as follows: 2024 $42,409 2023 $80,500 |
| (b) | Audit-Related Fees. There were no fees billed in each of the last two fiscal years for assurances and related services by the principal accountant that are reasonably related to the performance of the audit of the registrant’s financial statements and are not reported under paragraph (a) of this Item. |
| | |
| (c) | Tax Fees. The aggregate fees billed in each of the last two fiscal years for professional services rendered by the principal accountant for tax compliance are as follows: |
| | |
| | 2024 $16,000 2023 $17,500 |
Preparation of Federal & State income tax returns, assistance with calculation of required income, capital gain and excise distributions and preparation of Federal excise tax returns.
| (d) | All Other Fees. The aggregate fees billed in each of the last two fiscal years for products and services provided by the registrant’s principal accountant, other than the services reported in paragraphs (a) through (c) of this item were $0 and $0 for the fiscal years ended June 30, 2024 and 2023 respectively. |
| | |
| (e)(1) | The audit committee does not have pre-approval policies and procedures. Instead, the audit committee or audit committee chairman approves on a case-by-case basis each audit or non-audit service before the principal accountant is engaged by the registrant. |
| | |
| (e)(2) | There were no services described in each of paragraphs (b) through (d) of this Item that were approved by the audit committee pursuant to paragraph (c)(7)(i)(C) of Rule 2-01 of Regulation S-X. |
| | |
| (f) | Not applicable. |
| | |
| (g) | All non-audit fees billed by the registrant’s principal accountant for services rendered to the registrant for the fiscal years ended June 30, 2024 and 2023 respectively are disclosed in (b)-(d) above. There were no audit or non-audit services performed by the registrant’s principal accountant for the registrant’s adviser. |
| | |
| (h) | Not applicable. |
| | |
| (i) | Not applicable. |
| | |
| (j) | Not applicable. |
Item 5. Audit Committee of Listed Registrants.
Not applicable
Item 6. Investments.
The Registrant’s schedule of investments in unaffiliated issuers is included in the Financial Statements under Item 7 of this form.
Item 7. Financial Statements and Financial Highlights for Open-End Management Investment Companies.
(a)
| FINANCIAL STATEMENTS |
| |
| |
| |
| |
| |
| |
| |
| |
| |
| |
| Catalyst Insider Income Fund |
| (IIXAX, IIXCX, IIXIX) |
| Catalyst Enhanced Income Strategy Fund |
| (EIXAX, EIXCX, EIXIX) |
| Catalyst/MAP Global Balanced Fund |
| (TRXAX, TRXCX, TRXIX) |
| Catalyst/CIFC Senior Secured Income Fund |
| (CFRAX, CFRCX, CFRFX, CFRIX) |
| Catalyst/SMH High Income Fund |
| (HIIFX, HIICX, HIIIX) |
| Catalyst/SMH Total Return Income Fund |
| (TRIFX, TRICX, TRIIX) |
| |
| |
| June 30, 2024 |
| |
| |
 |
| |
| |
| Mutual Fund Series Trust |
| |
| |
| |
| |
| |
| |
| |
| |
| |
| |
| |
| |
| |
| |
| |
| CATALYST FUNDS |
| FINANCIAL STATEMENTS |
| TABLE OF CONTENTS |
| Schedules of Investments | Page 1 |
| | |
| Statements of Assets and Liabilities | Page 45 |
| | |
| Statements of Operations | Page 46 |
| | |
| Statements of Changes in Net Assets | Page 47 |
| | |
| Financial Highlights | Page 49 |
| | |
| Notes to Financial Statements | Page 61 |
| | |
| Report of Independent Registered Accounting Firm | Page 74 |
| | |
| Supplemental Information | Page 75 |
| CATALYST INSIDER INCOME FUND |
| SCHEDULE OF INVESTMENTS |
| June 30, 2024 |
| Principal | | | | | Coupon Rate | | | | | |
| Amount ($) | | | | | (%) | | Maturity | | Fair Value | |
| | | | | CONVERTIBLE BONDS — 44.4% | | | | | | | | |
| | | | | ASSET MANAGEMENT — 12.1% | | | | | | | | |
| | 2,600,000 | | | New Mountain Finance Corporation | | 7.5000 | | 10/15/25 | | $ | 2,630,875 | |
| | 4,079,000 | | | Prospect Capital Corporation | | 6.3750 | | 03/01/25 | | | 4,094,500 | |
| | | | | | | | | | | | 6,725,375 | |
| | | | | SPECIALTY FINANCE — 32.3% | | | | | | | | |
| | 2,300,000 | | | Arbor Realty Trust, Inc. | | 7.5000 | | 08/01/25 | | | 2,308,625 | |
| | 4,620,000 | | | Redwood Trust, Inc. | | 5.6250 | | 07/15/24 | | | 4,622,005 | |
| | 5,000,000 | | | SoFi Technologies, Inc.(a),(b) | | 10.3200 | | 10/15/26 | | | 4,340,290 | |
| | 7,000,000 | | | Two Harbors Investment Corporation | | 6.2500 | | 01/15/26 | | | 6,720,000 | |
| | | | | | | | | | | | 17,990,920 | |
| | | | | | | | | | | | | |
| | | | | TOTAL CONVERTIBLE BONDS (Cost $25,146,550) | | | | | | | 24,716,295 | |
| | | | | | | | | | | | | |
| | | | | CORPORATE BONDS — 49.7% | | | | | | | | |
| | | | | AEROSPACE & DEFENSE — 3.6% | | | | | | | | |
| | 2,000,000 | | | Boeing Company (The) | | 4.8750 | | 05/01/25 | | | 1,979,122 | |
| | | | | | | | | | | | | |
| | | | | ASSET MANAGEMENT — 9.6% | | | | | | | | |
| | 2,700,000 | | | Ares Capital Corporation | | 4.2500 | | 03/01/25 | | | 2,667,006 | |
| | 2,861,000 | | | Prospect Capital Corporation | | 3.7060 | | 01/22/26 | | | 2,726,024 | |
| | | | | | | | | | | | 5,393,030 | |
| | | | | BIOTECH & PHARMA — 3.6% | | | | | | | | |
| | 2,000,000 | | | AbbVie, Inc. | | 3.8000 | | 03/15/25 | | | 1,975,660 | |
| | | | | | | | | | | | | |
| | | | | GAS & WATER UTILITIES — 3.0% | | | | | | | | |
| | 1,700,000 | | | National Fuel Gas Company | | 5.5000 | | 01/15/26 | | | 1,695,575 | |
| | | | | | | | | | | | | |
| | | | | INSURANCE — 7.5% | | | | | | | | |
| | 2,862,526 | | | Ambac Assurance Corporation(a),(d) | | 5.1000 | | 06/07/69 | | | 4,152,433 | |
| | | | | | | | | | | | | |
| | | | | INTERNET MEDIA & SERVICES — 8.3% | | | | | | | | |
| | 2,000,000 | | | Netflix, Inc. | | 5.8750 | | 02/15/25 | | | 2,003,539 | |
| | 2,612,000 | | | VeriSign, Inc. | | 5.2500 | | 04/01/25 | | | 2,605,327 | |
| | | | | | | | | | | | 4,608,866 | |
The accompanying notes are an integral part of these financial statements.
| CATALYST INSIDER INCOME FUND |
| SCHEDULE OF INVESTMENTS (Continued) |
| June 30, 2024 |
| Principal | | | | | Coupon Rate | | | | | |
| Amount ($) | | | | | (%) | | Maturity | | Fair Value | |
| | | | | CORPORATE BONDS — 49.7% (Continued) | | | | | | | | |
| | | | | METALS & MINING — 0.5% | | | | | | | | |
| | 299,000 | | | Warrior Met Coal, Inc.(a) | | 7.8750 | | 12/01/28 | | $ | 305,661 | |
| | | | | | | | | | | | | |
| | | | | REAL ESTATE INVESTMENT TRUSTS — 5.5% | | | | | | | | |
| | 1,007,000 | | | Omega Healthcare Investors, Inc. | | 4.5000 | | 04/01/27 | | | 975,268 | |
| | 2,100,000 | | | Sabra Health Care, L.P. | | 5.1250 | | 08/15/26 | | | 2,067,468 | |
| | | | | | | | | | | | 3,042,736 | |
| | | | | SEMICONDUCTORS — 4.5% | | | | | | | | |
| | 2,500,000 | | | Broadcom, Inc. | | 3.6250 | | 10/15/24 | | | 2,484,105 | |
| | | | | | | | | | | | | |
| | | | | TECHNOLOGY HARDWARE — 3.6% | | | | | | | | |
| | 2,000,000 | | | Dell International, LLC / EMC Corporation | | 4.0000 | | 07/15/24 | | | 1,998,638 | |
| | | | | | | | | | | | | |
| | | | | TOTAL CORPORATE BONDS (Cost $27,719,525) | | | | | | | 27,635,826 | |
| | | | | | | | | | | | | |
| Shares | | | | | | | | | | | |
| | | | | SHORT-TERM INVESTMENTS — 4.0% | | | | | | | | |
| | | | | MONEY MARKET FUNDS - 4.0% | | | | | | | | |
| | 2,208,449 | | | First American Treasury Obligations Fund, Class X, 5.21%(c) (Cost $2,208,449) | | | | | | | 2,208,449 | |
| | | | | | | | | | | | | |
| | | | | TOTAL INVESTMENTS - 98.1% (Cost $55,074,524) | | | | | | $ | 54,560,570 | |
| | | | | OTHER ASSETS IN EXCESS OF LIABILITIES - 1.9% | | | | | | | 1,072,073 | |
| | | | | NET ASSETS - 100.0% | | | | | | $ | 55,632,643 | |
| LLC | - Limited Liability Company |
| |
| L.P. | - Limited Partnership |
| (a) | Security exempt from registration under Rule 144A or Section 4(2) of the Securities Act of 1933. The security may be resold in transactions exempt from registration, normally to qualified institutional buyers. As of June 30, 2024, the total market value of 144A securities is 8,798,384 or 15.8% of net assets. |
| (c) | Rate disclosed is the seven-day effective yield as of June 30, 2024. |
| (d) | Security in default. Non income producting. |
The accompanying notes are an integral part of these financial statements.
| CATALYST ENHANCED INCOME STRATEGY FUND |
| SCHEDULE OF INVESTMENTS |
| June 30, 2024 |
| Principal | | | | | | | Coupon Rate | | | | | |
| Amount ($) | | | | | Spread | | (%) | | Maturity | | Fair Value | |
| | | | | ASSET BACKED SECURITIES — 90.0% | | | | | | | | | | |
| | | | | COLLATERALIZED MORTGAGE OBLIGATIONS — 28.9% | | | | | | | | | | |
| | 143,027 | | | Alternative Loan Trust Series 2006-J3 4A2 | | | | 5.7500 | | 05/25/26 | | $ | 135,300 | |
| | 364,056 | | | Alternative Loan Trust Series 2005-J1 1A8 | | | | 5.5000 | | 02/25/35 | | | 314,368 | |
| | 232,458 | | | Alternative Loan Trust Series 2005-3CB 2A1 | | | | 5.0000 | | 03/25/35 | | | 208,416 | |
| | 2,347,632 | | | Alternative Loan Trust Series 2005-43 4A3(a) | | | | 4.0050 | | 10/25/35 | | | 1,883,329 | |
| | 1,802,288 | | | Alternative Loan Trust Series 2005-69 A1(b) | | 12MTA + 1.000% | | 3.6440 | | 12/25/35 | | | 1,565,349 | |
| | 1,057,619 | | | Alternative Loan Trust Series 2006-4CB 2A6 | | | | 5.5000 | | 04/25/36 | | | 797,030 | |
| | 160,302 | | | Alternative Loan Trust Series 2006-4CB 2A3 | | | | 5.5000 | | 04/25/36 | | | 104,438 | |
| | 408,299 | | | Alternative Loan Trust Series 2006-28CB A3 | | | | 6.5000 | | 10/25/36 | | | 215,507 | |
| | 1,655,587 | | | Alternative Loan Trust Series 2006-45T1 2A5 | | | | 3.8479 | | 02/25/37 | | | 893,122 | |
| | 636,525 | | | Alternative Loan Trust Series 2007-12T1 A3 | | | | 6.0000 | | 06/25/37 | | | 292,520 | |
| | 176,160 | | | Banc of America Alternative Loan Trust Series 2006-4 3CB4 | | | | 6.0000 | | 05/25/46 | | | 150,679 | |
| | 323,377 | | | Banc of America Alternative Loan Trust Series 2006-6 2A8 | | | | 6.0000 | | 07/25/46 | | | 264,594 | |
| | 448,503 | | | Banc of America Alternative Loan Trust Series 2006-6 2A10 | | | | 6.0000 | | 07/25/46 | | | 366,974 | |
| | 5,214 | | | Banc of America Funding Trust Series 2004-3 1A11 | | | | 5.5000 | | 10/25/34 | | | 4,687 | |
| | 204,065 | | | Banc of America Funding Trust Series 2005-H 1A1(a) | | | | 5.5900 | | 11/20/35 | | | 187,808 | |
| | 268,871 | | | Banc of America Funding Trust Series 2010-R8 1A4(c) | | | | 5.7500 | | 05/26/36 | | | 158,017 | |
| | 47,297 | | | Banc of America Funding Trust Series 2006-5 4A8 | | | | 6.0000 | | 09/25/36 | | | 38,803 | |
| | 804,889 | | | Banc of America Funding Trust Series 5 CA4 | | | | 6.0000 | | 07/25/37 | | | 678,724 | |
| | 39,346 | | | Banc of America Funding Trust Series 2006-J 2A3(a) | | | | 4.3480 | | 01/20/47 | | | 32,527 | |
| | 335,948 | | | Banc of America Funding Trust Series 2006-J 4A1(a) | | | | 5.0240 | | 01/20/47 | | | 280,190 | |
| | 126,514 | | | Banc of America Funding Trust Series 2007-A 2A2(b) | | TSFR1M + 0.534% | | 5.8730 | | 02/20/47 | | | 100,878 | |
| | 410,268 | | | Banc of America Funding Trust Series 2009-R9 3A3(a),(c) | | | | 3.5060 | | 11/25/56 | | | 283,458 | |
| | 107,065 | | | Banc of America Mortgage Trust Series 2005-A 1A1(a) | | | | 3.9050 | | 02/25/35 | | | 88,967 | |
| | 8,498 | | | Banc of America Mortgage Trust Series 2005-G 4A2(a) | | | | 3.4760 | | 08/25/35 | | | 7,248 | |
| | 392,675 | | | Banc of America Mortgage Trust Series 2005-G 2A1(a) | | | | 5.1470 | | 08/25/35 | | | 363,655 | |
| | 187,776 | | | Banc of America Mortgage Trust Series 2007-2 A6 | | | | 5.7500 | | 05/25/37 | | | 137,806 | |
| | 1,972,004 | | | Banc of America Mortgage Trust Series 2007-2 A1(b) | | TSFR1M + 0.464% | | 5.8100 | | 05/25/37 | | | 1,324,411 | |
| | 730,404 | | | Bear Stearns ALT-A Trust Series 2005-4 23A2(a) | | | | 5.3180 | | 05/25/35 | | | 675,238 | |
| | 395,035 | | | Bear Stearns ALT-A Trust Series 2005-5 24A1(a) | | | | 4.5360 | | 07/25/35 | | | 328,376 | |
| | 47,083 | | | Bear Stearns ARM Trust Series 2004-7 1A1(a) | | | | 0.0001 | | 10/25/34 | | | 35,015 | |
| | 64,911 | | | Bear Stearns ARM Trust Series 2005-12 13A1(a) | | | | 5.0130 | | 02/25/36 | | | 47,804 | |
| | 60,073 | | | Bear Stearns ARM Trust Series 2006-2 3A2(a) | | | | 4.5330 | | 07/25/36 | | | 50,330 | |
| | 200,573 | | | Bear Stearns ARM Trust Series 2006-4 2A1(a) | | | | 4.3640 | | 10/25/36 | | | 172,684 | |
| | 890,940 | | | BRAVO Residential Funding Trust Series 2023-NQM4 A2(c),(d) | | | | 6.5870 | | 05/25/63 | | | 891,367 | |
| | 175,630 | | | Chase Mortgage Finance Trust Series 2005-S2 A1 | | | | 5.5000 | | 10/25/35 | | | 162,720 | |
| | 317,536 | | | Chase Mortgage Finance Trust Series 2006-S3 1A6 | | | | 6.0000 | | 11/25/36 | | | 126,112 | |
The accompanying notes are an integral part of these financial statements.
| CATALYST ENHANCED INCOME STRATEGY FUND |
| SCHEDULE OF INVESTMENTS (Continued) |
| June 30, 2024 |
| Principal | | | | | | | Coupon Rate | | | | | |
| Amount ($) | | | | | Spread | | (%) | | Maturity | | Fair Value | |
| | | | | ASSET BACKED SECURITIES — 90.0% (Continued) | | | | | | | | | | |
| | | | | COLLATERALIZED MORTGAGE OBLIGATIONS — 28.9% (Continued) | | | | | | | | | | |
| | 203,285 | | | ChaseFlex Trust Series 2005-2 2A2 | | | | 6.5000 | | 06/25/35 | | $ | 105,397 | |
| | 87,480 | | | ChaseFlex Trust Series 2006-1 A4(a) | | | | 6.3000 | | 06/25/36 | | | 73,868 | |
| | 65,906 | | | Chevy Chase Funding, LLC Mortgage-Backed Certificates Series 2004-1A A2(b),(c) | | TSFR1M + 0.444% | | 5.7900 | | 01/25/35 | | | 61,816 | |
| | 70,510 | | | CHL Mortgage Pass-Through Trust Series 2005-HYB2 1A4(a) | | | | 5.1400 | | 05/20/35 | | | 65,436 | |
| | 278,012 | | | CHL Mortgage Pass-Through Trust Series 2005-18 A1 | | | | 5.5000 | | 10/25/35 | | | 148,368 | |
| | 369,808 | | | CHL Mortgage Pass-Through Trust Series 2006-HYB2 1A1(a) | | | | 5.2020 | | 04/20/36 | | | 315,834 | |
| | 909,779 | | | CHL Mortgage Pass-Through Trust Series 2006-12 A1 | | | | 6.0000 | | 07/25/36 | | | 449,762 | |
| | 199,602 | | | CHL Mortgage Pass-Through Trust Series 2007-J2 1A1 | | | | 6.0000 | | 07/25/37 | | | 171,193 | |
| | 162,469 | | | CHL Mortgage Pass-Through Trust Series 2007-J2 2A5 | | | | 6.0000 | | 07/25/37 | | | 55,030 | |
| | 826,140 | | | CHL Mortgage Pass-Through Trust Series 2007-17 3A1 | | | | 2.4710 | | 10/25/37 | | | 202,457 | |
| | 680,923 | | | CHL Mortgage Pass-Through Trust Series 2007-HY3 4A1(a) | | | | 5.8150 | | 06/25/47 | | | 670,178 | |
| | 4,249,534 | | | Citicorp Mortgage Securities Trust Series 2008-1 1A1 | | | | 6.2500 | | 02/25/38 | | | 3,866,767 | |
| | 292,574 | | | Citigroup Mortgage Loan Trust, Inc. Series 2007-6 1A1A(a) | | | | 4.7050 | | 03/25/37 | | | 249,346 | |
| | 2,899,150 | | | Citigroup Mortgage Loan Trust, Inc. Series 2007-AR7 A3A(a) | | | | 3.6300 | | 05/25/47 | | | 2,206,901 | |
| | 120,406 | | | CitiMortgage Alternative Loan Trust Series 2007-A4 1A6 | | | | 5.7500 | | 04/25/37 | | | 108,424 | |
| | 506,591 | | | Credit Suisse First Boston Mortgage Securities Corporation Series 2002-30 DB1(a) | | | | 7.3290 | | 11/25/32 | | | 498,536 | |
| | 256,861 | | | Credit Suisse First Boston Mortgage Securities Corporation Series 2005-5 6A3 | | | | 5.0000 | | 07/25/35 | | | 245,896 | |
| | 2,747,263 | | | Credit Suisse First Boston Mortgage Securities Corporation Series 2005-8 2A1 | | | | 3.9450 | | 09/25/35 | | | 775,267 | |
| | 284,958 | | | Credit Suisse First Boston Mortgage Securities Corporation Series 2005-11 8A4 | | | | 6.0000 | | 12/25/35 | | | 214,882 | |
| | 30,417 | | | CSFB Mortgage-Backed Pass-Through Certificates Series 2003-29 7A1 | | | | 6.5000 | | 12/25/33 | | | 30,218 | |
| | 204,836 | | | CSFB Mortgage-Backed Pass-Through Certificates Series 2005-10 6A3 | | | | 5.7500 | | 11/25/35 | | | 77,494 | |
| | 27,456 | | | CSMC Mortgage-Backed Trust Series 2007-5 8A2 | | | | 6.0000 | | 10/25/24 | | | 26,008 | |
| | 1,863,653 | | | CSMC Mortgage-Backed Trust Series 2006-5 3A1 | | | | 2.7857 | | 06/25/36 | | | 307,605 | |
| | 1,570,110 | | | CSMC Mortgage-Backed Trust Series 2006-5 3A3 | | | | 2.7857 | | 06/25/36 | | | 259,155 | |
| | 664,171 | | | CSMC Mortgage-Backed Trust Series 2006-5 3A4 | | | | 2.7857 | | 06/25/36 | | | 109,625 | |
| | 2,999,202 | | | CSMC Mortgage-Backed Trust Series 2006-7 9A5 | | | | 2.4940 | | 08/25/36 | | | 530,892 | |
| | 5,013,693 | | | CSMC Mortgage-Backed Trust Series 2006-9 4A1 | | | | 6.0000 | | 11/25/36 | | | 2,997,158 | |
| | 1,533,835 | | | Deutsche Alt-A Securities Mortgage Loan Trust Series 2007-1 1A4A(b) | | TSFR1M + 0.334% | | 5.6800 | | 08/25/37 | | | 1,275,535 | |
| | 101,658 | | | Deutsche Mortgage Securities Inc Mortgage Loan Trust Series 2004-2 M1(d) | | | | 5.5900 | | 01/25/34 | | | 94,378 | |
| | 34,970 | | | First Horizon Alternative Mortgage Securities Trust Series 2004-AA3 A1(a) | | | | 5.8160 | | 09/25/34 | | | 34,365 | |
| | 7,605 | | | First Horizon Alternative Mortgage Securities Trust Series 2005-AA6 2A1(a) | | | | 6.3510 | | 08/25/35 | | | 5,356 | |
| | 13,837 | | | First Horizon Mortgage Pass-Through Trust Series 2000-H 2B1(a) | | | | 5.9920 | | 05/25/30 | | | 13,681 | |
| | 146,033 | | | First Horizon Mortgage Pass-Through Trust Series 2007-AR3 2A2(a) | | | | 5.6660 | | 11/25/37 | | | 109,672 | |
The accompanying notes are an integral part of these financial statements.
| CATALYST ENHANCED INCOME STRATEGY FUND |
| SCHEDULE OF INVESTMENTS (Continued) |
| June 30, 2024 |
| Principal | | | | | | | Coupon Rate | | | | | |
| Amount ($) | | | | | Spread | | (%) | | Maturity | | Fair Value | |
| | | | | ASSET BACKED SECURITIES — 90.0% (Continued) | | | | | | | | | | |
| | | | | COLLATERALIZED MORTGAGE OBLIGATIONS — 28.9% (Continued) | | | | | | | | | | |
| | 15,760 | | | GMACM Mortgage Loan Trust Series 2005-AR1 4A(a) | | | | 0.0001 | | 03/18/35 | | $ | 15,469 | |
| | 309,831 | | | GMACM Mortgage Loan Trust Series 2006-J1 A2 | | | | 5.7500 | | 04/25/36 | | | 263,413 | |
| | 3,405,974 | | | GreenPoint Mortgage Funding Trust Series 2006-AR6 A4(b) | | US0001M + 0.794% | | 6.1400 | | 10/25/46 | | | 2,471,851 | |
| | 89,096 | | | GSMPS Mortgage Loan Trust Series 1998-5 A(a),(c) | | | | 7.5000 | | 06/19/27 | | | 87,392 | |
| | 152,046 | | | GSMPS Mortgage Loan Trust Series 1999-2 A(a),(c) | | | | 8.0000 | | 09/19/27 | | | 149,902 | |
| | 164,920 | | | GSR Mortgage Loan Trust Series 2003-5F 2A1 | | | | 4.0000 | | 08/25/32 | | | 152,366 | |
| | 14,384 | | | GSR Mortgage Loan Trust Series 2004-2F 6A1 | | | | 7.0000 | | 01/25/34 | | | 14,469 | |
| | 36,587 | | | GSR Mortgage Loan Trust Series 2004-6F 1A2 | | | | 5.0000 | | 05/25/34 | | | 34,977 | |
| | 891,713 | | | GSR Mortgage Loan Trust Series 2005-3F 1A3 | | | | 5.5000 | | 03/25/35 | | | 743,992 | |
| | 102,670 | | | GSR Mortgage Loan Trust Series 2005-AR4 4A1(a) | | | | 7.3750 | | 07/25/35 | | | 98,244 | |
| | 250,256 | | | GSR Mortgage Loan Trust Series 2006-3F 2A7 | | | | 5.7500 | | 03/25/36 | | | 213,934 | |
| | 507,140 | | | GSR Mortgage Loan Trust Series 2006-9F 4A1 | | | | 4.1840 | | 10/25/36 | | | 207,028 | |
| | 91,724 | | | HomeBanc Mortgage Trust Series 2004-2 A1(b) | | TSFR1M + 0.854% | | 6.2000 | | 12/25/34 | | | 85,075 | |
| | 447,945 | | | HSI Asset Loan Obligation Trust Series 2007-2 3A6 | | | | 6.0000 | | 09/25/37 | | | 135,723 | |
| | 228,101 | | | Impac CMB Trust Series 2004-9 1A2(b) | | TSFR1M + 0.994% | | 6.3400 | | 01/25/35 | | | 207,651 | |
| | 312,423 | | | Impac CMB Trust Series 2005-5 M1(b) | | TSFR1M + 0.624% | | 6.2250 | | 08/25/35 | | | 239,838 | |
| | 2,021,400 | | | IndyMac IMSC Mortgage Loan Trust Series 2007-F2 1A4 | | | | 6.0000 | | 07/25/37 | | | 1,390,934 | |
| | 485,328 | | | IndyMac INDA Mortgage Loan Trust Series 2006-AR1 A3(a) | | | | 3.5970 | | 08/25/36 | | | 370,316 | |
| | 144,325 | | | IndyMac INDX Mortgage Loan Trust Series 2005-AR3 3A1(a) | | | | 4.3510 | | 04/25/35 | | | 131,667 | |
| | 80,501 | | | IndyMac INDX Mortgage Loan Trust Series 2005-AR5 4A1(a) | | | | 4.4510 | | 05/25/35 | | | 54,315 | |
| | 1,357,485 | | | JP Morgan Alternative Loan Trust Series 2005-S1 1A6 | | | | 6.5000 | | 12/25/35 | | | 496,137 | |
| | 137,977 | | | JP Morgan Mortgage Trust Series 2004-S1 1A7 | | | | 5.0000 | | 09/25/34 | | | 124,575 | |
| | 10,438 | | | JP Morgan Mortgage Trust Series 2005-A1 4A1(a) | | | | 6.2050 | | 02/25/35 | | | 10,290 | |
| | 28,518 | | | JP Morgan Mortgage Trust Series 2006-A2 2A2(a) | | | | 5.0840 | | 04/25/36 | | | 24,470 | |
| | 367,417 | | | JP Morgan Mortgage Trust Series 2007-A3 1A1(a) | | | | 4.6150 | | 05/25/37 | | | 305,535 | |
| | 4,529 | | | Lehman Mortgage Trust Series 2007-9 1A1 | | | | 6.0000 | | 10/25/37 | | | 4,142 | |
| | 9,444 | | | MASTR Adjustable Rate Mortgages Trust Series 2003-5 4A1(a) | | | | 2.9850 | | 11/25/33 | | | 8,277 | |
| | 17,723 | | | MASTR Adjustable Rate Mortgages Trust Series 2004-4 4A1(a) | | | | 5.7330 | | 05/25/34 | | | 16,664 | |
| | 367,697 | | | MASTR Adjustable Rate Mortgages Trust Series 2005-2 3A1(a) | | | | 4.3450 | | 03/25/35 | | | 327,159 | |
| | 177,260 | | | MASTR Adjustable Rate Mortgages Trust Series 2006-2 1A1(a) | | | | 6.6490 | | 04/25/36 | | | 166,290 | |
| | 113,338 | | | MASTR Alternative Loan Trust Series 2005-5 2A3 | | | | 5.5000 | | 07/25/25 | | | 105,468 | |
| | 5,877 | | | MASTR Alternative Loan Trust Series 2004-5 1A1 | | | | 5.5000 | | 06/25/34 | | | 5,682 | |
| | 69,197 | | | MASTR Alternative Loan Trust Series 2005-3 2A1 | | | | 6.0000 | | 03/25/35 | | | 62,047 | |
| | 351 | | | MASTR Asset Securitization Trust Series 2005-1 1A1(f) | | | | 5.0000 | | Perpetual | | | 163 | |
| | 671,906 | | | MASTR Asset Securitization Trust Series 2004-3 4A10 | | | | 5.5000 | | 03/25/34 | | | 574,279 | |
| | 685,659 | | | Merrill Lynch Alternative Note Asset Trust Series 2007-A2 A3D(b) | | TSFR1M + 0.714% | | 0.7980 | | 03/25/37 | | | 28,239 | |
The accompanying notes are an integral part of these financial statements.
| CATALYST ENHANCED INCOME STRATEGY FUND |
| SCHEDULE OF INVESTMENTS (Continued) |
| June 30, 2024 |
| Principal | | | | | | | Coupon Rate | | | | | |
| Amount ($) | | | | | Spread | | (%) | | Maturity | | Fair Value | |
| | | | | ASSET BACKED SECURITIES — 90.0% (Continued) | | | | | | | | | | |
| | | | | COLLATERALIZED MORTGAGE OBLIGATIONS — 28.9% (Continued) | | | | | | | | | | |
| | 978,614 | | | Merrill Lynch Mortgage Investors Trust Series 2006-AF2 AF1 | | | | 1.7580 | | 10/25/36 | | $ | 385,384 | |
| | 53,103 | | | Morgan Stanley Mortgage Loan Trust Series 2004-5AR 1A1(a) | | | | 5.9600 | | 07/25/34 | | | 52,300 | |
| | 260,719 | | | Morgan Stanley Mortgage Loan Trust Series 2006-2 2A4 | | | | 5.7500 | | 02/25/36 | | | 232,641 | |
| | 563,450 | | | Morgan Stanley Mortgage Loan Trust Series 2006-8AR 3A(a) | | | | 4.6750 | | 06/25/36 | | | 407,410 | |
| | 2,825,000 | | | Morgan Stanley Mortgage Loan Trust Series 2007-6XS 2A6M(d) | | | | 6.2500 | | 02/25/47 | | | 180,686 | |
| | 13,191,000 | | | Morgan Stanley Mortgage Loan Trust Series 2007-6XS 2A7M(d) | | | | 6.6620 | | 02/25/47 | | | 846,048 | |
| | 2,208,000 | | | New Century Alternative Mortgage Loan Trust Series 2006-ALT2 AF6B(d) | | | | 0.8490 | | 10/25/36 | | | 126,735 | |
| | 1,322,338 | | | Nomura Asset Acceptance Corp Alternative Loan Trust Series 2005-AP3 A3(a) | | | | 1.4390 | | 08/25/35 | | | 576,017 | |
| | 544,214 | | | Nomura Asset Acceptance Corp Alternative Loan Trust Series 2005-AR4 5A3(b) | | TSFR1M + 0.694% | | 2.8144 | | 08/25/35 | | | 313,851 | |
| | 11,119,879 | | | Nomura Asset Acceptance Corp Alternative Loan Trust Series 2006-AR2 3A1(b) | | TSFR1M + 0.514% | | 1.2232 | | 04/25/36 | | | 2,423,727 | |
| | 898,150 | | | OBX Trust Series 2023-NQM10 A2(c),(d) | | | | 6.9200 | | 10/25/63 | | | 906,847 | |
| | 8,339,596 | | | PHH Alternative Mortgage Trust Series 2007-1 1A3(b) | | TSFR1M + 0.594% | | 2.4278 | | 02/25/37 | | | 1,011,251 | |
| | 51,078 | | | Prime Mortgage Trust Series 2004-1 1A6 | | | | 5.2500 | | 08/25/34 | | | 48,132 | |
| | 286,839 | | | RALI Series 2005-QO1 Trust Series 2005-QO1 A2(b) | | 12MTA + 1.500% | | 6.6150 | | 08/25/35 | | | 232,109 | |
| | 4,971,402 | | | RALI Series 2006-QO3 Trust Series 2006-QO3 A2(b) | | TSFR1M + 0.634% | | 3.3326 | | 04/25/46 | | | 1,323,582 | |
| | 74,277 | | | RALI Series 2006-QS17 Trust Series 2006-QS17 A4 | | | | 6.0000 | | 12/25/36 | | | 58,810 | |
| | 273,043 | | | Residential Asset Securitization Trust Series 2004-A7 A2 | | | | 5.5000 | | 10/25/34 | | | 254,522 | |
| | 3,655,251 | | | Residential Asset Securitization Trust Series 2006-A6 1A13 | | | | 1.3218 | | 07/25/36 | | | 960,535 | |
| | 2,823,097 | | | Residential Asset Securitization Trust Series 2006-A6 1A14 | | | | 1.3218 | | 07/25/36 | | | 741,859 | |
| | 737,377 | | | Residential Asset Securitization Trust Series 2006-A6 1A1 | | | | 1.4320 | | 07/25/36 | | | 209,763 | |
| | 882,887 | | | Residential Asset Securitization Trust Series 2006-A13 A1 | | | | 3.8440 | | 12/25/36 | | | 303,013 | |
| | 362,239 | | | Residential Asset Securitization Trust Series 2007-A7 A6 | | | | 6.0000 | | 07/25/37 | | | 134,248 | |
| | 2,379,133 | | | Residential Asset Securitization Trust Series 2007-A8 3A1(a) | | | | 2.6340 | | 08/25/37 | | | 938,865 | |
| | 213,401 | | | Residential Asset Securitization Trust Series 2007-A8 1A2 | | | | 6.0000 | | 08/25/37 | | | 107,710 | |
| | 1,344,406 | | | Residential Asset Securitization Trust Series 2007-A9 A3 | | | | 2.9110 | | 09/25/37 | | | 538,810 | |
| | 1,503,494 | | | Residential Asset Securitization Trust Series 2007-A9 A7 | | | | 2.9110 | | 09/25/37 | | | 602,570 | |
| | 41,264 | | | RFMSI Trust Series 2006-S3 A2 | | | | 5.5000 | | 03/25/36 | | | 32,080 | |
| | 1,364,150 | | | RFMSI Trust Series 2006-SA4 2A1(a) | | | | 5.5190 | | 11/25/36 | | | 1,121,324 | |
| | 310,321 | | | STARM Mortgage Loan Trust Series 2007-2 3A3(a) | | | | 5.9400 | | 04/25/37 | | | 174,848 | |
| | 139,644 | | | Structured Adjustable Rate Mortgage Loan Trust Series 2004-17 A1(a) | | | | 4.3730 | | 11/25/34 | | | 122,094 | |
| | 187,395 | | | Structured Adjustable Rate Mortgage Loan Trust Series 2004-19 1A2(a) | | | | 4.8460 | | 01/25/35 | | | 175,182 | |
| | 33,835 | | | Structured Adjustable Rate Mortgage Loan Trust Series 2005-7 3A1(a) | | | | 5.5620 | | 04/25/35 | | | 32,831 | |
| | 184,769 | | | Structured Asset Mortgage Investments II Trust Series 2007-AR3 2A1(b) | | TSFR1M + 0.304% | | 5.6500 | | 09/25/47 | | | 161,872 | |
The accompanying notes are an integral part of these financial statements.
| CATALYST ENHANCED INCOME STRATEGY FUND |
| SCHEDULE OF INVESTMENTS (Continued) |
| June 30, 2024 |
| Principal | | | | | | | Coupon Rate | | | | | |
| Amount ($) | | | | | Spread | | (%) | | Maturity | | Fair Value | |
| | | | | ASSET BACKED SECURITIES — 90.0% (Continued) | | | | | | | | | | |
| | | | | COLLATERALIZED MORTGAGE OBLIGATIONS — 28.9% (Continued) | | | | | | | | | | |
| | 1,447,992 | | | Structured Asset Securities Corporation Series 1998-RF1 A(a),(c) | | | | 3.8970 | | 04/15/27 | | $ | 1,444,981 | |
| | 1,176,269 | | | SunTrust Alternative Loan Trust Series 2006-1F 2A | | | | 6.5000 | | 04/25/36 | | | 444,518 | |
| | 164,504 | | | TBW Mortgage-Backed Trust Series 2006-2 3A1 | | | | 5.5000 | | 07/25/36 | | | 12,222 | |
| | 3,295,120 | | | TBW Mortgage-Backed Trust Series 2007-2 A6B(d) | | | | 1.3080 | | 07/25/37 | | | 193,746 | |
| | 1,525,000 | | | TBW Mortgage-Backed Trust Series 2007-2 A3B(a) | | | | 1.3080 | | 07/25/37 | | | 90,368 | |
| | 1,963,000 | | | TBW Mortgage-Backed Trust Series 2007-2 A2B(a) | | | | 1.3080 | | 07/25/37 | | | 116,517 | |
| | 9,868 | | | Thornburg Mortgage Securities Trust Series 2006-4 A2B(a) | | | | 5.8650 | | 07/25/36 | | | 7,810 | |
| | 1,522,140 | | | Thornburg Mortgage Securities Trust Series 2007-2 A2A(b) | | TSFR12M + 1.965% | | 3.2240 | | 06/25/37 | | | 1,299,671 | |
| | 5,334,475 | | | Thornburg Mortgage Securities Trust Series 2006-3 A1(a) | | | | 4.5550 | | 06/25/46 | | | 3,289,531 | |
| | 264,169 | | | Thornburg Mortgage Securities Trust Series 2007-3 3A1(b) | | TSFR12M + 1.965% | | 7.0170 | | 06/25/47 | | | 221,852 | |
| | 797,843 | | | Verus Securitization Trust Series 2023-5 A2(c),(d) | | | | 6.7590 | | 06/25/68 | | | 799,509 | |
| | 56,639 | | | WaMu Mortgage Pass-Through Certificates Series 2005-AR18 2A1(a) | | | | 4.2460 | | 01/25/36 | | | 50,322 | |
| | 188,197 | | | Washington Mutual Mortgage Pass-Through Certificates Series 2005-4 CB11 | | | | 5.5000 | | 06/25/35 | | | 159,585 | |
| | 550,765 | | | Washington Mutual Mortgage Pass-Through Certificates Series 2006-2 1A4(b) | | TSFR1M + 0.814% | | 6.0000 | | 03/25/36 | | | 497,338 | |
| | 244,553 | | | Wells Fargo Mortgage Backed Securities Series 2006-7 2A1 | | | | 6.0000 | | 06/25/36 | | | 209,538 | |
| | | | | | | | | | | | | | 63,628,088 | |
| | | | | HOME EQUITY — 19.9% | | | | | | | | | | |
| | 2,247 | | | ABFC Trust Series 2003-AHL1 M1(b) | | TSFR1M + 1.389% | | 6.7350 | | 03/25/33 | | | 2,188 | |
| | 6,876,877 | | | ACE Securities Corp Home Equity Loan Trust Series 2007-HE5 A2C(b) | | TSFR1M + 0.474% | | 1.5630 | | 07/25/37 | | | 2,474,002 | |
| | 73,969 | | | Ameriquest Mortgage Securities Asset-Backed Pass-Through Ctfs Series 2002-AR1 M2(b) | | TSFR1M + 2.064% | | 3.8510 | | 09/25/32 | | | 62,309 | |
| | 167,056 | | | Amresco Residential Securities Corp Mortgage Loan Trust Series 1997-3 M2F(a) | | | | 4.4300 | | 09/25/27 | | | 158,382 | |
| | 478,178 | | | Bayview Financial Acquisition Trust Series 2007-A 2A(b) | | TSFR1M + 0.639% | | 5.9830 | | 05/28/37 | | | 441,563 | |
| | 2,801,432 | | | Bayview Financial Mortgage Pass-Through Trust Series 2007-B 2A3(b) | | TSFR1M + 1.389% | | 1.0451 | | 08/28/47 | | | 714,643 | |
| | 917,360 | | | Bayview Financial Mortgage Pass-Through Trust Series 2007-B 2A4(b) | | TSFR1M + 1.164% | | 1.0451 | | 08/28/47 | | | 234,018 | |
| | 334,034 | | | Bear Stearns Asset Backed Securities I Trust Series 2004-FR2 M5(b) | | TSFR1M + 2.739% | | 5.4630 | | 06/25/34 | | | 309,958 | |
| | 81,855 | | | Bear Stearns Asset Backed Securities I Trust Series 2004-HE7 M5(b) | | TSFR1M + 3.039% | | 8.3850 | | 08/25/34 | | | 76,070 | |
| | 1,195,886 | | | Bear Stearns Asset Backed Securities I Trust Series 2004-FR3 M4(b) | | TSFR1M + 2.814% | | 6.0310 | | 09/25/34 | | | 1,101,002 | |
| | 457,270 | | | Bear Stearns Asset Backed Securities Trust Series 2004-HE3 M5(b) | | TSFR1M + 2.889% | | 5.7100 | | 04/25/34 | | | 390,103 | |
| | 915,923 | | | Bear Stearns Asset Backed Securities Trust Series 2 M2(b) | | TSFR1M + 2.964% | | 4.4702 | | 08/25/34 | | | 903,789 | |
| | 967,307 | | | CDC Mortgage Capital Trust Series 2004-HE2 M2(b) | | TSFR1M + 1.914% | | 7.2600 | | 07/25/34 | | | 955,338 | |
| | 6,357 | | | Centex Home Equity Loan Trust Series 2002-A AF6 | | | | 5.5400 | | 01/25/32 | | | 6,264 | |
| | 95,480 | | | CHEC Loan Trust Series 2004-2 M1(b) | | TSFR1M + 1.074% | | 6.4200 | | 06/25/34 | | | 93,510 | |
| | 4,462,440 | | | Credit Suisse Seasoned Loan Trust Series 2006-1 M1(b),(c) | | TSFR1M + 0.939% | | 3.2681 | | 10/25/34 | | | 4,400,569 | |
| | 412,475 | | | Delta Funding Home Equity Loan Trust Series 1998-1 B1A(b) | | TSFR1M + 2.004% | | 0.6671 | | 05/25/30 | | | 404,560 | |
The accompanying notes are an integral part of these financial statements.
| CATALYST ENHANCED INCOME STRATEGY FUND |
| SCHEDULE OF INVESTMENTS (Continued) |
| June 30, 2024 |
| Principal | | | | | | | Coupon Rate | | | | | |
| Amount ($) | | | | | Spread | | (%) | | Maturity | | Fair Value | |
| | | | | ASSET BACKED SECURITIES — 90.0% (Continued) | | | | | | | | | | |
| | | | | HOME EQUITY — 19.9% (Continued) | | | | | | | | | | |
| | 524,994 | | | EMC Mortgage Loan Trust Series 2001-A A(b),(c) | | TSFR1M + 0.854% | | 6.2000 | | 05/25/40 | | $ | 521,073 | |
| | 4,009,227 | | | EMC Mortgage Loan Trust 2004-B Series 2004-B M2(b),(c) | | TSFR1M + 3.489% | | 4.8980 | | 01/25/41 | | | 3,866,836 | |
| | 78,314 | | | GE Mortgage Services, LLC Series 1998-HE2 A6(a) | | | | 6.6450 | | 09/25/28 | | | 76,843 | |
| | 11,286,673 | | | GSAA Home Equity Trust Series 2006-3 A4(b) | | TSFR1M + 0.814% | | 1.5612 | | 03/25/36 | | | 866,000 | |
| | 2,844,310 | | | GSR Mortgage Loan Trust Series 2005-AR3 6A1(a) | | | | 4.5170 | | 05/25/35 | | | 2,263,949 | |
| | 44,563 | | | Home Equity Asset Trust Series 2003-3 M2(b) | | TSFR1M + 2.484% | | 7.8300 | | 08/25/33 | | | 42,069 | |
| | 2,769,946 | | | Home Equity Asset Trust Series 2004-5 M6(b) | | TSFR1M + 2.064% | | 4.8550 | | 11/25/34 | | | 2,757,289 | |
| | 735,695 | | | Home Equity Asset Trust Series 2004-8 M5(b) | | TSFR1M + 1.714% | | 4.7122 | | 03/25/35 | | | 681,805 | |
| | 3,972,085 | | | Home Equity Loan Trust Series 2006-HSA2 AI3(a) | | | | 1.3520 | | 03/25/36 | | | 174,481 | |
| | 313,129 | | | Home Equity Mortgage Loan Asset-Backed Trust SPMD Series 2004-C M3(b) | | TSFR1M + 1.089% | | 4.8620 | | 03/25/35 | | | 272,435 | |
| | 184,628 | | | Home Equity Mortgage Loan Asset-Backed Trust SPMD Series 2004-C M7(b) | | TSFR1M + 2.739% | | 4.8620 | | 03/25/35 | | | 145,667 | |
| | 930,786 | | | Mastr Asset Backed Securities Trust Series 2003-OPT2 M4(b) | | TSFR1M + 5.889% | | 3.2245 | | 05/25/33 | | | 769,042 | |
| | 443,099 | | | Mastr Asset Backed Securities Trust Series 2003-WMC2(b) | | TSFR1M + 6.114% | | 4.6180 | | 08/25/33 | | | 463,023 | |
| | 5,244,349 | | | Mastr Asset Backed Securities Trust Series 2006-WMC2 A5(b) | | TSFR1M + 0.614% | | 1.1295 | | 04/25/36 | | | 1,111,413 | |
| | 305,864 | | | Meritage Mortgage Loan Trust Series 2004-1 M1(b) | | TSFR1M + 0.864% | | 6.2100 | | 07/25/34 | | | 304,145 | |
| | 2,303,632 | | | Merrill Lynch Mortgage Investors Trust Series 2002-AFC1 BV1(b) | | TSFR1M + 3.564% | | 5.5000 | | 09/25/32 | | | 2,215,316 | |
| | 658,196 | | | Merrill Lynch Mortgage Investors Trust Series 2004-HE1 M2(b) | | TSFR1M + 2.364% | | 4.3412 | | 04/25/35 | | | 607,104 | |
| | 494,300 | | | Merrill Lynch Mortgage Investors Trust Series 2006-AR1 A1(b) | | TSFR1M + 0.444% | | 1.6148 | | 03/25/37 | | | 168,943 | |
| | 58,606 | | | Morgan Stanley A.B.S Capital I Inc Trust Series 2004-HE1 B1(b) | | TSFR1M + 2.739% | | 8.0850 | | 01/25/34 | | | 59,937 | |
| | 812,893 | | | Nomura Home Equity Loan Inc Home Equity Loan Trust Series 2006-AF1 A4(b) | | TSFR1M + 0.774% | | 1.0916 | | 10/25/36 | | | 181,465 | |
| | 351,509 | | | NovaStar Mortgage Funding Trust Series 2003-1 M1(b) | | TSFR1M + 1.539% | | 6.8850 | | 05/25/33 | | | 332,370 | |
| | 167,479 | | | NovaStar Mortgage Funding Trust Series 2004-1 M4(b) | | TSFR1M + 1.577% | | 6.9220 | | 06/25/34 | | | 155,991 | |
| | 2,930,988 | | | NovaStar Mortgage Funding Trust Series 2006-6 A2B(b) | | TSFR1M + 0.314% | | 1.0944 | | 01/25/37 | | | 1,006,241 | |
| | 254,492 | | | RASC Series 2004-KS10 M4 Trust Series 2004-KS10 M4(b) | | TSFR1M + 2.589% | | 7.9350 | | 11/25/34 | | | 248,078 | |
| | 249,836 | | | Renaissance Home Equity Loan Trust Series 2003-2 M1(b) | | TSFR1M + 1.352% | | 4.2840 | | 08/25/33 | | | 228,599 | |
| | 330,202 | | | Renaissance Home Equity Loan Trust Series 2007-2 AF2(d) | | | | 5.6750 | | 06/25/37 | | | 81,607 | |
| | 431,110 | | | Renaissance Home Equity Loan Trust Series 2007-1 AF5(d) | | | | 3.6230 | | 04/25/37 | | | 116,254 | |
| | 619,666 | | | Saxon Asset Sec Trust Mtg Ln Asset Bk Cert Series 2000-1 BF1(a) | | | | 3.4690 | | 02/25/30 | | | 745,214 | |
| | 3,392,722 | | | Structured Asset Securities Corp Mortgage Loan Trust Series 2005-NC2 M7(b) | | TSFR1M + 1.164% | | 4.1330 | | 05/25/35 | | | 3,019,489 | |
| | 2,101 | | | Terwin Mortgage Trust Series 2004-7HE M1(b),(c) | | TSFR1M + 1.389% | | 6.7350 | | 07/25/34 | | | 2,030 | |
| | 23,587,000 | | | Terwin Mortgage Trust Series 2006-3 2A3(b),(c) | | TSFR1M + 0.734% | | 1.5660 | | 04/25/37 | | | 7,416,490 | |
| | | | | | | | | | | | | | 43,629,466 | |
| | | | | MANUFACTURED HOUSING — 0.3% | | | | | | | | | | |
| | 1,611,849 | | | BCMSC Trust Series 2000-A A4(a) | | | | 8.2900 | | 06/15/30 | | | 171,705 | |
The accompanying notes are an integral part of these financial statements.
| CATALYST ENHANCED INCOME STRATEGY FUND |
| SCHEDULE OF INVESTMENTS (Continued) |
| June 30, 2024 |
| Principal | | | | | | | Coupon Rate | | | | | |
| Amount ($) | | | | | Spread | | (%) | | Maturity | | Fair Value | |
| | | | | ASSET BACKED SECURITIES — 90.0% (Continued) | | | | | | | | | | |
| | | | | MANUFACTURED HOUSING — 0.3% (Continued) | | | | | | | | | | |
| | 500,000 | | | Cascade MH Asset Trust Series 2019-MH1 M(a),(c) | | | | 5.9850 | | 11/01/44 | | $ | 468,082 | |
| | | | | | | | | | | | | | 639,787 | |
| | | | | NON AGENCY CMBS — 23.6% | | | | | | | | | | |
| | 1,000,000 | | | BXP Trust Series 2017-CQHP A(b),(c) | | TSFR1M + 0.897% | | 6.2260 | | 11/15/34 | | | 932,796 | |
| | 2,869,000 | | | CFCRE Commercial Mortgage Trust Series 2011-C2 E(a),(c) | | | | 5.0800 | | 12/15/47 | | | 2,495,230 | |
| | 6,357,126 | | | Citigroup Commercial Mortgage Trust Series 2014-GC21 E(a),(c) | | | | 3.5880 | | 05/10/47 | | | 4,643,394 | |
| | 4,565,000 | | | Citigroup Commercial Mortgage Trust Series 2015-GC35 D | | | | 3.2360 | | 11/10/48 | | | 2,756,685 | |
| | 5,000,000 | | | Citigroup Commercial Mortgage Trust Series 2015-GC35 C(a) | | | | 4.6060 | | 11/10/48 | | | 3,550,184 | |
| | 4,108,000 | | | COMM 2013-CCRE12 Mortgage Trust Series 2013-CR12 C(a) | | | | 0.0001 | | 10/10/46 | | | 441,027 | |
| | 2,964,000 | | | Commercial Mortgage Pass Through Certificates Series 2012-LTRT B(c) | | | | 3.8000 | | 10/05/30 | | | 2,638,910 | |
| | 336,456 | | | DBUBS Mortgage Trust Series 2011-LC3A PM1(c) | | | | 4.4520 | | 05/10/44 | | | 299,091 | |
| | 2,622,300 | | | GS Mortgage Securities Trust Series 2014-GC22 D(a),(c) | | | | 4.7900 | | 06/10/47 | | | 968,682 | |
| | 5,726,000 | | | GS Mortgage Securities Trust Series 2014-GC22 E(c) | | | | 3.5820 | | 06/10/47 | | | 1,731,114 | |
| | 1,350,000 | | | HMH Trust Series 2017-NSS E(c) | | | | 6.2920 | | 07/05/31 | | | 285,971 | |
| | 7,005,000 | | | JP Morgan Chase Commercial Mortgage Securities Trust Series 2011-C3 C(a),(c) | | | | 5.3600 | | 02/15/46 | | | 6,177,567 | |
| | 1,250,000 | | | JPMBB Commercial Mortgage Securities Trust Series 2015-C32 D(a) | | | | 4.3040 | | 11/15/48 | | | 223,049 | |
| | 2,626,409 | | | Morgan Stanley Capital I Trust Series 2006-HQ10 B(a) | | | | — | | 11/12/41 | | | 2,249,651 | |
| | 5,000,000 | | | Morgan Stanley Capital I Trust Series 2012-C4 E(a),(c) | | | | 5.3360 | | 03/15/45 | | | 3,124,214 | |
| | 4,926,315 | | | Morgan Stanley Capital I Trust Series 2006-T21 C(a),(c) | | | | 5.1870 | | 10/12/52 | | | 3,965,683 | |
| | 13,533,384 | | | Starwood Retail Property Trust Series 2014-STAR A(b),(c) | | PRIME -—% | | 8.5000 | | 11/15/27 | | | 9,672,297 | |
| | 418,071 | | | Velocity Commercial Capital Loan Trust Series 2022-3 M1(a),(c) | | | | 6.1300 | | 06/25/52 | | | 411,649 | |
| | 1,885,398 | | | Wachovia Bank Commercial Mortgage Trust Series 2006-C24 E(a) | | | | 5.5410 | | 03/15/45 | | | 1,762,236 | |
| | 3,546,000 | | | WFRBS Commercial Mortgage Trust Series 2013-C15 D(a),(c) | | | | 4.3280 | | 08/15/46 | | | 1,470,148 | |
| | 3,000,000 | | | WFRBS Commercial Mortgage Trust Series 2014-C22 E(c) | | | | 3.4550 | | 09/15/57 | | | 1,377,859 | |
| | 727,344 | | | WFRBS Commercial Mortgage Trust Series 2014-LC14 D(a),(c) | | | | 4.5860 | | 03/15/47 | | | 672,429 | |
| | | | | | | | | | | | | | 51,849,866 | |
| | | | | RESIDENTIAL MORTGAGE — 17.3% | | | | | | | | | | |
| | 61,763 | | | Bear Stearns Asset Backed Securities Trust Series 2004-SD4 A1(b) | | TSFR1M + 1.014% | | 6.3600 | | 08/25/44 | | | 58,967 | |
| | 86,791 | | | Carrington Mortgage Loan Trust Series 2004-NC2 M1(b) | | TSFR1M + 1.149% | | 6.4950 | | 08/25/34 | | | 84,680 | |
| | 5,300,599 | | | Carrington Mortgage Loan Trust Series 2006-FRE2 A5(b) | | TSFR1M + 0.194% | | 2.7889 | | 03/25/35 | | | 4,159,601 | |
| | 9,192,823 | | | Carrington Mortgage Loan Trust Series 2006-FRE2 A2(b) | | TSFR1M + 0.234% | | 2.7889 | | 10/25/36 | | | 7,213,967 | |
| | 2,207,495 | | | Carrington Mortgage Loan Trust Series 2006-FRE2 A3(b) | | TSFR1M + 0.274% | | 2.7889 | | 10/25/36 | | | 1,732,301 | |
| | 350,305 | | | Chase Funding Trust Series 2003-3 2M2(b) | | TSFR1M + 1.959% | | 7.3050 | | 11/25/32 | | | 344,063 | |
| | 997,919 | | | Countrywide Asset-Backed Certificates Series 2002-4 M2(b) | | TSFR1M + 2.364% | | 5.3405 | | 11/25/32 | | | 1,006,293 | |
| | 928,113 | | | Credit-Based Asset Servicing and Securitization, LLC Series 2002-CB2 M2(b) | | TSFR1M + 1.950% | | 1.9644 | | 04/25/32 | | | 955,082 | |
The accompanying notes are an integral part of these financial statements.
| CATALYST ENHANCED INCOME STRATEGY FUND |
| SCHEDULE OF INVESTMENTS (Continued) |
| June 30, 2024 |
| Principal | | | | | | | Coupon Rate | | | | | |
| Amount ($) | | | | | Spread | | (%) | | Maturity | | Fair Value | |
| | | | | ASSET BACKED SECURITIES — 90.0% (Continued) | | | | | | | | | | |
| | | | | RESIDENTIAL MORTGAGE — 17.3% (Continued) | | | | | | | | | | |
| | 37,734 | | | Credit-Based Asset Servicing and Securitization, LLC Series 2002-CB4 B1(b) | | US0001M + 2.850% | | 8.3100 | | 02/25/33 | | $ | 38,977 | |
| | 399,821 | | | Credit-Based Asset Servicing and Securitization, LLC Series 2004-CB2 M1(b) | | TSFR1M + 0.894% | | 6.2400 | | 07/25/33 | | | 389,533 | |
| | 1,727,392 | | | Credit-Based Asset Servicing and Securitization, LLC Series 2004-CB8 M3(b) | | TSFR1M + 1.614% | | 3.9260 | | 12/25/35 | | | 1,498,569 | |
| | 1,960,341 | | | CSMC Trust Series 2006-CF3 M3(b),(c) | | TSFR1M + 1.364% | | 6.7100 | | 10/25/36 | | | 2,196,331 | |
| | 1,168,247 | | | CWABS Asset-Backed Certificates Trust Series 2004-10 MF3(a) | | | | 4.3290 | | 09/25/34 | | | 1,000,468 | |
| | 626,282 | | | Encore Credit Receivables Trust Series 2005-1 M4(b) | | TSFR1M + 1.134% | | 6.4800 | | 07/25/35 | | | 550,580 | |
| | 667,699 | | | Equity One Mortgage Pass-Through Trust Series 2004-3 M2(d) | | | | 3.8480 | | 07/25/34 | | | 555,377 | |
| | 246,381 | | | Finance America Mortgage Loan Trust Series 2004-3 M4(b) | | TSFR1M + 1.494% | | 6.8400 | | 11/25/34 | | | 189,233 | |
| | 133,398 | | | Fremont Home Loan Trust Series 2004-2 M6(b) | | TSFR1M + 2.139% | | 7.4850 | | 07/25/34 | | | 109,586 | |
| | 8,069,759 | | | GE-WMC Mortgage Securities Trust Series 2006-1 A2B(b) | | TSFR1M + 0.414% | | 1.4180 | | 08/25/36 | | | 3,362,896 | |
| | 3,147,778 | | | GE-WMC Mortgage Securities Trust Series 2006-1 A2C(b) | | TSFR1M + 0.594% | | 1.4226 | | 08/25/36 | | | 1,311,720 | |
| | 876,195 | | | GSAMP Trust Series 2004-AR1 B2(b) | | TSFR1M + 3.489% | | 3.7165 | | 06/25/34 | | | 687,399 | |
| | 2,228,800 | | | GSRPM Mortgage Loan Trust Series 2007-1 A(b),(c) | | TSFR1M + 0.514% | | 3.2554 | | 10/25/46 | | | 2,012,302 | |
| | 75,465 | | | Home Equity Mortgage Loan Asset-Backed Trust Series INABS 2006-D 2A3(b) | | TSFR1M + 0.274% | | 5.6200 | | 11/25/36 | | | 66,100 | |
| | 391,956 | | | IXIS Real Estate Capital Trust Series 2006-HE2 A3(b) | | TSFR1M + 0.434% | | 1.1013 | | 08/25/36 | | | 107,391 | |
| | 341,073 | | | Lehman XS Trust Series 2007-3 1BA1(b) | | TSFR1M + 0.434% | | 5.7800 | | 03/25/37 | | | 318,445 | |
| | 320,729 | | | Lehman XS Trust Series 2007-3 1BA2(b) | | TSFR6M + 0.928% | | 6.2370 | | 03/25/37 | | | 313,152 | |
| | 44,650,621 | | | Merrill Lynch Mortgage Investors Trust Series 2006-RM2 A1B(b) | | TSFR1M + 0.584% | | 0.6330 | | 05/25/37 | | | 1,721,598 | |
| | 39,783 | | | Morgan Stanley A.B.S Capital I Inc Trust Series 2004-NC8 M4(b) | | TSFR1M + 1.614% | | 6.9600 | | 09/25/34 | | | 41,557 | |
| | 8,875,000 | | | Morgan Stanley A.B.S Capital I Inc Trust Series 2007-SEA1 2A4(b),(c) | | TSFR1M + 3.914% | | 1.3442 | | 02/25/47 | | | 823,519 | |
| | 3,173,453 | | | Park Place Securities Inc Asset-Backed Pass-Through Certificates Series 2004-WCW2 M6(b) | | TSFR1M + 2.289% | | 3.2340 | | 10/25/34 | | | 2,682,849 | |
| | 2,034,195 | | | RAMP Series 2007-RS1 Trust Series 2007-RS1 A3(b) | | TSFR1M + 0.454% | | 4.3715 | | 02/25/37 | | | 486,975 | |
| | 98,962,397 | | | Saxon Asset Securities Trust Series 2006-3 ES(c),(d),(e) | | | | 0.3000 | | 10/25/46 | | | 1,279,752 | |
| | 527,649 | | | Specialty Underwriting & Residential Finance Trust Series 2007-AB1 A2D (b) | | TSFR1M + 0.464% | | 5.8100 | | 03/25/37 | | | 286,184 | |
| | 201,347 | | | Structured Asset Investment Loan Trust Series 2004-5 M5(b) | | TSFR1M + 1.839% | | 7.1850 | | 05/25/34 | | | 178,166 | |
| | 278,525 | | | Structured Asset Securities Corp Series 2005-WF1 M8(b) | | TSFR1M + 2.169% | | 7.5150 | | 02/25/35 | | | 278,753 | |
| | | | | | | | | | | | | | 38,042,366 | |
| | | | | | | | | | | | | | | |
| | | | | TOTAL ASSET BACKED SECURITIES (Cost $246,680,485) | | | | | | | | | 197,789,573 | |
The accompanying notes are an integral part of these financial statements.
| CATALYST ENHANCED INCOME STRATEGY FUND |
| SCHEDULE OF INVESTMENTS (Continued) |
| June 30, 2024 |
| Principal | | | | | | | Coupon Rate | | | | | |
| Amount ($) | | | | | Spread | | (%) | | Maturity | | Fair Value | |
| | | | | U.S. GOVERNMENT & AGENCY OBLIGATIONS — 6.8% | | | | | | | | | | |
| | 193,389 | | | Fannie Mae REMICS Series 2012-126 DI(e) | | | | 3.0000 | | 11/25/27 | | $ | 6,638 | |
| | 164,449 | | | Fannie Mae REMICS Series 2012-94 YS(b),(e) | | SOFR30A + 6.654% | | 1.2000 | | 06/25/39 | | | 670 | |
| | 858,126 | | | Fannie Mae REMICS Series 2011-124 NS(b),(e) | | SOFR30A + 6.390% | | 1.0500 | | 12/25/41 | | | 88,109 | |
| | 866,527 | | | Fannie Mae REMICS Series 2017-30 MI(e) | | | | 4.0000 | | 02/25/44 | | | 37,283 | |
| | 29,853 | | | Fannie Mae REMICS Series 2017-6 MI(e) | | | | 4.0000 | | 08/25/44 | | | 1,803 | |
| | 2,195,555 | | | Fannie Mae REMICS Series 2016-64 SA(b),(e) | | SOFR30A + 5.886% | | 0.5500 | | 09/25/46 | | | 214,462 | |
| | 592,924 | | | Fannie Mae REMICS Series 2017-38 S(b),(e) | | SOFR30A + 5.986% | | 0.6500 | | 05/25/47 | | | 62,704 | |
| | 880,317 | | | Fannie Mae REMICS Series 2017-112 SC(b),(e) | | SOFR30A + 6.036% | | 0.7000 | | 01/25/48 | | | 105,641 | |
| | 14,329,979 | | | Fannie Mae REMICS Series 2018-28 ID(a),(e) | | | | 0.6270 | | 05/25/48 | | | 978,953 | |
| | 251,045 | | | Fannie Mae REMICS Series 2020-16 SJ(b),(e) | | SOFR30A + 5.936% | | 0.6000 | | 03/25/50 | | | 26,451 | |
| | 3,021,889 | | | Fannie Mae REMICS Series 2020-95 IB(e) | | | | 2.5000 | | 01/25/51 | | | 479,923 | |
| | 7,256,362 | | | Fannie Mae REMICS Series 2021-45 JI(e) | | | | 2.5000 | | 07/25/51 | | | 1,079,020 | |
| | 3,040,464 | | | Fannie Mae REMICS Series 2021-56 IM(b),(e) | | SOFR30A + 2.200% | | 0.0001 | | 09/25/51 | | | 50,406 | |
| | 21,103,151 | | | Fannie Mae REMICS Series 2021-69 JS(b),(e) | | SOFR30A + 2.550% | | 0.0001 | | 10/25/51 | | | 314,120 | |
| | 11,716,408 | | | Fannie Mae REMICS Series 2021-80 IA(e) | | | | 2.0000 | | 11/25/51 | | | 1,469,530 | |
| | 169,124 | | | Freddie Mac REMICS Series 4205 AI(e) | | | | 2.5000 | | 05/15/28 | | | 5,130 | |
| | 880,836 | | | Freddie Mac REMICS Series 4226 IM(e) | | | | 3.5000 | | 09/15/31 | | | 6,620 | |
| | 7,299,122 | | | Freddie Mac REMICS Series 4639 GS(e) | | | | 0.4390 | | 03/15/36 | | | 353,517 | |
| | 774,542 | | | Freddie Mac REMICS Series 3852 SW(b),(e) | | SOFR30A + 5.886% | | 0.5520 | | 05/15/41 | | | 67,402 | |
| | 143,551 | | | Freddie Mac REMICS Series 3980 TS(b),(e) | | SOFR30A + 6.500% | | 1.0520 | | 09/15/41 | | | 14,958 | |
| | 763,332 | | | Freddie Mac REMICS Series 4100 JI(e) | | | | 3.5000 | | 10/15/41 | | | 90,566 | |
| | 503,772 | | | Freddie Mac REMICS Series 4580 MI(e) | | | | 3.5000 | | 02/15/43 | | | 11,254 | |
| | 5,250,294 | | | Freddie Mac REMICS Series 4239 NI(b),(e) | | SOFR30A + 28.791% | | 0.0001 | | 07/15/43 | | | 877,239 | |
| | 36,069 | | | Freddie Mac REMICS Series 4680 LI(e) | | | | 4.0000 | | 10/15/43 | | | 254 | |
| | 57,475 | | | Freddie Mac REMICS Series 4449 PI(e) | | | | 4.0000 | | 11/15/43 | | | 5,207 | |
| | 446,809 | | | Freddie Mac REMICS Series 4314 SE(b),(e) | | SOFR30A + 5.936% | | 0.6020 | | 03/15/44 | | | 45,792 | |
| | 344,058 | | | Freddie Mac REMICS Series 4431 ST(b),(e) | | SOFR30A + 5.986% | | 0.6520 | | 01/15/45 | | | 34,047 | |
| | 60,023 | | | Freddie Mac REMICS Series 4818 BI(e) | | | | 4.0000 | | 03/15/45 | | | 1,237 | |
| | 210,023 | | | Freddie Mac REMICS Series 4672 AI(e) | | | | 4.5000 | | 03/15/45 | | | 2,090 | |
| | 399,000 | | | Freddie Mac REMICS Series 5050 GL | | | | 1.2500 | | 12/25/50 | | | 171,986 | |
| | 5,683,298 | | | Freddie Mac REMICS Series 5071 IS(e) | | | | 2.0000 | | 02/25/51 | | | 638,661 | |
| | 18,648,892 | | | Freddie Mac REMICS Series 5090 SA(b),(e) | | SOFR30A + 1.550% | | 0.0001 | | 03/25/51 | | | 56,226 | |
| | 15,123,099 | | | Freddie Mac REMICS Series 5177 AS(b),(e) | | SOFR30A + 3.150% | | 0.0001 | | 12/25/51 | | | 160,400 | |
| | 356,796 | | | Government National Mortgage Association Series 2014-118 AI(e) | | | | 3.5000 | | 05/16/40 | | | 13,181 | |
| | 3,617,876 | | | Government National Mortgage Association Series 2015-3 DS(b),(e) | | TSFR1M + 5.486% | | 0.1470 | | 11/20/41 | | | 49,696 | |
The accompanying notes are an integral part of these financial statements.
| CATALYST ENHANCED INCOME STRATEGY FUND |
| SCHEDULE OF INVESTMENTS (Continued) |
| June 30, 2024 |
| Principal | | | | | | | Coupon Rate | | | | | |
| Amount ($) | | | | | Spread | | (%) | | Maturity | | Fair Value | |
| | | | | U.S. GOVERNMENT & AGENCY OBLIGATIONS — 6.8% (Continued) | | | | | | | | | | |
| | 175,523 | | | Government National Mortgage Association Series 2012-36 QS(b),(e) | | TSFR1M + 6.506% | | 1.1670 | | 03/20/42 | | $ | 12,352 | |
| | 291,350 | | | Government National Mortgage Association Series 2018-154 DI(e) | | | | 4.0000 | | 01/20/45 | | | 8,210 | |
| | 207,741 | | | Government National Mortgage Association Series 2016-1 ST(b),(e) | | TSFR1M + 6.086% | | 0.7470 | | 01/20/46 | | | 20,223 | |
| | 4,529,205 | | | Government National Mortgage Association Series 2018-154 SP(b),(e) | | TSFR1M + 6.036% | | 0.6970 | | 11/20/48 | | | 435,848 | |
| | 11,356,082 | | | Government National Mortgage Association Series 2019-20 ES(b),(e) | | TSFR1M + 3.676% | | 0.0001 | | 02/20/49 | | | 194,532 | |
| | 20,236,603 | | | Government National Mortgage Association Series 2019-112 AS(b),(e) | | TSFR1M + 3.296% | | 0.0001 | | 09/20/49 | | | 336,838 | |
| | 4,134,558 | | | Government National Mortgage Association Series 2020-122 YI(e) | | | | 2.5000 | | 08/20/50 | | | 601,927 | |
| | 952,000 | | | Government National Mortgage Association Series 2020-141 ML | | | | 1.5000 | | 09/20/50 | | | 441,509 | |
| | 7,913,978 | | | Government National Mortgage Association Series 2021-24 LI(e) | | | | 2.5000 | | 01/20/51 | | | 1,125,012 | |
| | 6,110,779 | | | Government National Mortgage Association Series 2021-49 IP(e) | | | | 2.5000 | | 01/20/51 | | | 658,953 | |
| | 290,582 | | | Government National Mortgage Association Series 2021-89 JL | | | | 1.5000 | | 05/20/51 | | | 151,410 | |
| | 3,494,318 | | | Government National Mortgage Association Series 2021-83 EI(e) | | | | 2.5000 | | 05/20/51 | | | 462,141 | |
| | 15,712,906 | | | Government National Mortgage Association Series 2022-22 PS(b),(e) | | SOFR30A + 3.650% | | 0.0001 | | 08/20/51 | | | 273,419 | |
| | 9,501,254 | | | Government National Mortgage Association Series 2021-156 BI(e) | | | | 2.5000 | | 09/20/51 | | | 1,402,243 | |
| | 16,233,683 | | | Government National Mortgage Association Series 2022-93 AS(b),(e) | | SOFR30A + 4.150% | | 0.0001 | | 05/20/52 | | | 513,605 | |
| | 17,050,988 | | | Government National Mortgage Association Series 2022-83 SJ(b),(e) | | SOFR30A + 3.200% | | 0.0001 | | 05/20/52 | | | 178,916 | |
| | 43,551,471 | | | Government National Mortgage Association Series 2022-121 SA(b),(e) | | SOFR30A + 3.690% | | 0.0001 | | 07/20/52 | | | 570,877 | |
| | | | | U.S. GOVERNMENT & AGENCY OBLIGATIONS (Cost $23,510,335) | | | | | | | | | 14,909,191 | |
| | | | | | | | | | | | | | | |
| Shares | | | | | | | | | | | | | |
| | | | | SHORT-TERM INVESTMENTS — 2.9% | | | | | | | | | | |
| | | | | MONEY MARKET FUNDS - 2.9% | | | | | | | | | | |
| | 6,280,161 | | | First American Treasury Obligations Fund, Class X, 5.21%(g) (Cost $6,280,161) | | | 6,280,161 | |
| | | | | | | | | | | | | | | |
| | | | | TOTAL INVESTMENTS - 99.7% (Cost $276,470,981) | | | | $ | 218,978,925 | |
| | | | | OTHER ASSETS IN EXCESS OF LIABILITIES - 0.3% | | | | | 662,077 | |
| | | | | NET ASSETS - 100.0% | | | | | | | | $ | 219,641,002 | |
| LLC | - Limited Liability Company |
| | |
| REMIC | - Real Estate Mortgage Investment Conduit |
| | |
| 12MTA | - Federal Reserve US 12 Month Cumulative Avg 1 Year CMT |
| | |
| PRIME | - Prime Rate by Country United States |
| | |
| SOFR30A | - United States 30 Day Average SOFR Secured Overnight Financing Rate |
| | |
| TSFR12M | - Secured Overnight Financing Rate 12 Month |
| | |
| TSFR1M | - Secured Overnight Financing Rate 1 Month |
| | |
| TSFR6M | - Secured Overnight Financing Rate 6 Month |
| | |
| US0001M | - ICE LIBOR USD 1 Month |
| (a) | Variable or floating rate security, the interest rate of which adjusts periodically based on changes in current interest rates and prepayments on the underlying pool of assets. |
| (b) | Variable rate security: the rate shown represents the rate on June 30, 2024. |
| (c) | Security exempt from registration under Rule 144A or Section 4(2) of the Securities Act of 1933. The security may be resold in transactions exempt from registration, normally to qualified institutional buyers. As of June 30, 2024, the total market value of 144A securities is 68,637,307 or 31.2% of net assets. |
| (d) | Step bond. Coupon rate is fixed rate that changes on a specified date. The rate shown is the current rate at June 30, 2024. |
| (e) | Interest only securities. |
| (f) | Maturity not determined on this security, maturity will occur based on the maturity of the underlying bonds. |
| (g) | Rate disclosed is the seven-day effective yield as of June 30, 2024. |
The accompanying notes are an integral part of these financial statements.
| CATALYST/MAP GLOBAL BALANCED FUND |
| SCHEDULE OF INVESTMENTS |
| June 30, 2024 |
| Shares | | | | | Fair Value | |
| | | | | COMMON STOCKS — 47.4% | | | | |
| | | | | BEVERAGES - 1.4% | | | | |
| | 600,000 | | | Thai Beverage PCL | | $ | 199,124 | |
| | | | | | | | | |
| | | | | BIOTECH & PHARMA - 8.3% | | | | |
| | 1,960 | | | Johnson & Johnson | | | 286,474 | |
| | 2,516 | | | Novartis A.G. - ADR | | | 267,853 | |
| | 7,528 | | | Sanofi S.A. - ADR | | | 365,259 | |
| | 23,000 | | | Takeda Pharmaceutical Company Ltd. - ADR | | | 297,620 | |
| | | | | | | | 1,217,206 | |
| | | | | CHEMICALS - 0.8% | | | | |
| | 4,190 | | | Mosaic Company | | | 121,091 | |
| | | | | | | | | |
| | | | | CONSTRUCTION MATERIALS - 3.7% | | | | |
| | 3,930 | | | Holcim A.G. | | | 348,320 | |
| | 7,000 | | | MDU Resources Group, Inc. | | | 175,700 | |
| | | | | | | | 524,020 | |
| | | | | E-COMMERCE DISCRETIONARY - 1.3% | | | | |
| | 3,500 | | | eBay, Inc.(b) | | | 188,020 | |
| | | | | | | | | |
| | | | | ENGINEERING & CONSTRUCTION - 1.5% | | | | |
| | 1,057 | | | Tetra Tech, Inc. | | | 216,135 | |
| | | | | | | | | |
| | | | | ENTERTAINMENT CONTENT - 2.7% | | | | |
| | 37,700 | | | Vivendi S.E. | | | 394,002 | |
| | | | | | | | | |
| | | | | FOOD - 2.5% | | | | |
| | 3,533 | | | Nestle S.A. - ADR | | | 361,956 | |
| | | | | | | | | |
| | | | | GAS & WATER UTILITIES - 2.1% | | | | |
| | 5,575 | | | National Fuel Gas Company | | | 302,109 | |
| | | | | | | | | |
| | | | | HOUSEHOLD PRODUCTS - 1.4% | | | | |
| | 3,800 | | | Unilever PLC - ADR | | | 208,962 | |
The accompanying notes are an integral part of these financial statements.
| CATALYST/MAP GLOBAL BALANCED FUND |
| SCHEDULE OF INVESTMENTS (Continued) |
| June 30, 2024 |
| Shares | | | | | Fair Value | |
| | | | | COMMON STOCKS — 47.4% (Continued) | | | | |
| | | | | INTERNET MEDIA & SERVICES - 0.5% | | | | |
| | 153 | | | Meta Platforms, Inc., Class A | | $ | 77,146 | |
| | | | | | | | | |
| | | | | MEDICAL EQUIPMENT & DEVICES - 1.0% | | | | |
| | 1,800 | | | Medtronic PLC | | | 141,678 | |
| | | | | | | | | |
| | | | | METALS & MINING - 0.4% | | | | |
| | 12,000 | | | Grupo Mexico S.A.B. de C.V. - Series B | | | 64,744 | |
| | | | | | | | | |
| | | | | OIL & GAS PRODUCERS - 1.6% | | | | |
| | 1,970 | | | BP PLC - ADR | | | 71,117 | |
| | 1,000 | | | Chevron Corporation | | | 156,420 | |
| | | | | | | | 227,537 | |
| | | | | RETAIL - DISCRETIONARY - 0.8% | | | | |
| | 323 | | | Home Depot, Inc. | | | 111,190 | |
| | | | | | | | | |
| | | | | SEMICONDUCTORS - 3.1% | | | | |
| | 1,000 | | | Applied Materials, Inc. | | | 235,990 | |
| | 1,630 | | | Micron Technology, Inc. | | | 214,394 | |
| | | | | | | | 450,384 | |
| | | | | SOFTWARE - 3.5% | | | | |
| | 1,190 | | | Microsoft Corporation | | | 531,870 | |
| | | | | | | | | |
| | | | | TECHNOLOGY HARDWARE - 3.2% | | | | |
| | 650 | | | Apple, Inc. | | | 136,903 | |
| | 6,825 | | | Cisco Systems, Inc. | | | 324,256 | |
| | | | | | | | 461,159 | |
| | | | | TELECOMMUNICATIONS - 2.5% | | | | |
| | 5,000 | | | AT&T, Inc. | | | 95,550 | |
| | 26,340 | | | Orange S.A. - ADR | | | 263,137 | |
| | | | | | | | 358,687 | |
| | | | | TOBACCO & CANNABIS - 2.6% | | | | |
| | 15,000 | | | Imperial Brands PLC - ADR | | | 384,899 | |
The accompanying notes are an integral part of these financial statements.
| CATALYST/MAP GLOBAL BALANCED FUND |
| SCHEDULE OF INVESTMENTS (Continued) |
| June 30, 2024 |
| Shares | | | | | | | | | Fair Value | |
| | | | | COMMON STOCKS — 47.4% (Continued) | | | | | | | | |
| | | | | WHOLESALE - CONSUMER STAPLES - 2.5% | | | | | | | | |
| | 3,502 | | | Bunge Global S.A. | | | | | | $ | 373,908 | |
| | | | | | | | | | | | | |
| | | | | TOTAL COMMON STOCKS (Cost $5,221,215) | | | | | | | 6,915,827 | |
| | | | | | | | | | | | | |
| | | | | EXCHANGE-TRADED FUNDS — 2.7% | | | | | | | | |
| | | | | COMMODITY - 2.7% | | | | | | | | |
| | 8,500 | | | SPDR Gold MiniShares Trust(a) | | | | | | | 391,765 | |
| | | | | TOTAL EXCHANGE-TRADED FUNDS (Cost $314,458) | | | | | | | | |
| | | | | | | | | | | | | |
| Principal | | | | | Coupon Rate | | | | | | |
| Amount ($) | | | | | (%) | | Maturity | | | | |
| | | | | CORPORATE BONDS — 34.4% | | | | | | | | |
| | | | | AEROSPACE & DEFENSE — 4.8% | | | | | | | | |
| | 250,000 | | | Boeing Company (The) | | 4.8750 | | 05/01/25 | | | 247,390 | |
| | 250,000 | | | Hexcel Corporation(f) | | 4.9500 | | 08/15/25 | | | 247,395 | |
| | 200,000 | | | Howmet Aerospace, Inc. | | 6.8750 | | 05/01/25 | | | 201,673 | |
| | | | | | | | | | | | 696,458 | |
| | | | | AUTOMOTIVE — 3.0% | | | | | | | | |
| | 250,000 | | | Ford Motor Credit Company, LLC | | 4.1340 | | 08/04/25 | | | 245,402 | |
| | 200,000 | | | Honda Motor Company Ltd. | | 2.5340 | | 03/10/27 | | | 187,595 | |
| | | | | | | | | | | | 432,997 | |
| | | | | BANKING — 1.3% | | | | | | | | |
| | 200,000 | | | Sumitomo Mitsui Financial Group, Inc. | | 1.4740 | | 07/08/25 | | | 192,050 | |
| | | | | | | | | | | | | |
| | | | | CHEMICALS — 4.2% | | | | | | | | |
| | 250,000 | | | Methanex Corporation | | 4.2500 | | 12/01/24 | | | 248,400 | |
| | 222,000 | | | Nutrien Ltd. | | 5.9000 | | 11/07/24 | | | 222,082 | |
| | 150,000 | | | Nutrien Ltd. | | 3.0000 | | 04/01/25 | | | 147,084 | |
| | | | | | | | | | | | 617,566 | |
| | | | | CONTAINERS & PACKAGING — 1.2% | | | | | | | | |
| | 175,000 | | | Ball Corporation | | 5.2500 | | 07/01/25 | | | 175,018 | |
The accompanying notes are an integral part of these financial statements.
| CATALYST/MAP GLOBAL BALANCED FUND |
| SCHEDULE OF INVESTMENTS (Continued) |
| June 30, 2024 |
| Principal | | | | | Coupon Rate | | | | | |
| Amount ($) | | | | | (%) | | Maturity | | Fair Value | |
| | | | | CORPORATE BONDS — 34.4% (Continued) | | | | | | | | |
| | | | | ELECTRIC UTILITIES — 0.7% | | | | | | | | |
| | 100,000 | | | DTE Energy Company | | 1.0500 | | 06/01/25 | | $ | 95,912 | |
| | | | | | | | | | | | | |
| | | | | LEISURE FACILITIES & SERVICES — 1.8% | | | | | | | | |
| | 275,000 | | | Las Vegas Sands Corporation | | 2.9000 | | 06/25/25 | | | 267,117 | |
| | | | | | | | | | | | | |
| | | | | OIL & GAS PRODUCERS — 3.3% | | | | | | | | |
| | 275,000 | | | Canadian Natural Resources Ltd. | | 2.0500 | | 07/15/25 | | | 264,919 | |
| | 218,000 | | | Occidental Petroleum Corporation | | 2.9000 | | 08/15/24 | | | 217,088 | |
| | | | | | | | | | | | 482,007 | |
| | | | | SEMICONDUCTORS — 0.8% | | | | | | | | |
| | 125,000 | | | NXP BV / NXP Funding, LLC / NXP USA, Inc. | | 2.7000 | | 05/01/25 | | | 122,075 | |
| | | | | | | | | | | | | |
| | | | | STEEL — 3.4% | | | | | | | | |
| | 200,000 | | | ArcelorMittal S.A. | | 3.6000 | | 07/16/24 | | | 199,767 | |
| | 300,000 | | | ArcelorMittal S.A. | | 6.1250 | | 06/01/25 | | | 302,079 | |
| | | | | | | | | | | | 501,846 | |
| | | | | TECHNOLOGY HARDWARE — 3.6% | | | | | | | | |
| | 225,000 | | | NetApp, Inc. | | 1.8750 | | 06/22/25 | | | 216,818 | |
| | 300,000 | | | Seagate HDD Cayman | | 4.7500 | | 01/01/25 | | | 297,967 | |
| | | | | | | | | | | | 514,785 | |
| | | | | TOBACCO & CANNABIS — 2.8% | | | | | | | | |
| | 250,000 | | | BAT International Finance PLC | | 1.6680 | | 03/25/26 | | | 234,320 | |
| | 175,000 | | | Reynolds American, Inc. | | 4.4500 | | 06/12/25 | | | 173,007 | |
| | | | | | | | | | | | 407,327 | |
| | | | | TRANSPORTATION & LOGISTICS — 3.5% | | | | | | | | |
| | 325,000 | | | Canadian Pacific Railway Company | | 1.3500 | | 12/02/24 | | | 319,146 | |
| | 200,000 | | | Ryder System, Inc. | | 4.6250 | | 06/01/25 | | | 198,004 | |
| | | | | | | | | | | | 517,150 | |
| | | | | | | | | | | | | |
| | | | | TOTAL CORPORATE BONDS (Cost $5,021,695) | | | | | | | 5,022,308 | |
The accompanying notes are an integral part of these financial statements.
| CATALYST/MAP GLOBAL BALANCED FUND |
| SCHEDULE OF INVESTMENTS (Continued) |
| June 30, 2024 |
Principal
Amount ($) | | | | | Coupon Rate
(%) | | Maturity | | Fair Value | |
| | | | | U.S. GOVERNMENT & AGENCIES — 9.6% | | | | | | | | |
| | | | | U.S. TREASURY NOTES — 9.6% | | | | | | | | |
| | 1,000,000 | | | United States Treasury Note | | 0.3750 | | 07/15/24 | | $ | 998,093 | |
| | 405,000 | | | United States Treasury Note | | 2.5000 | | 01/31/25 | | | 398,497 | |
| | | | | TOTAL U.S. GOVERNMENT & AGENCIES (Cost $1,398,733) | | | | | | | 1,396,590 | |
| | | | | | | | | | | | | |
| | | | | CERTIFICATE OF DEPOSIT — 5.1% | | | | | | | | |
| | | | | BANKING - 5.1% | | | | | | | | |
| | 125,000 | | | American Express National Bank | | 5.2500 | | 03/24/25 | | | 124,947 | |
| | 175,000 | | | Charles Schwab Bank SSB | | 5.4000 | | 09/23/24 | | | 174,863 | |
| | 220,000 | | | Comerica Bank-Texas | | 5.2500 | | 09/30/24 | | | 219,778 | |
| | 220,000 | | | Customers Bank | | 5.2500 | | 07/01/24 | | | 219,998 | |
| | | | | TOTAL CERTIFICATE OF DEPOSIT (Cost $740,000) | | | | | | | 739,586 | |
| | | | | | | | | | | | | |
| Shares | | | | | | | | | | | |
| | | | | SHORT-TERM INVESTMENTS — 0.3% | | | | | | | | |
| | | | | MONEY MARKET FUNDS - 0.3% | | | | | | | | |
| | 48,885 | | | First American Treasury Obligations Fund, Class X, 5.21%(c) (Cost $48,885) | | | 48,885 | |
| | | | | | | | | | | | | |
| | | | | TOTAL INVESTMENTS - 99.5% (Cost $12,744,986) | | | | | | $ | 14,514,961 | |
| | | | | CALL OPTIONS WRITTEN - 0.0% (Premiums received - $4,933) | | | | | | | (2,450 | ) |
| | | | | OTHER ASSETS IN EXCESS OF LIABILITIES - 0.5% | | | | | | | 74,532 | |
| | | | | NET ASSETS - 100.0% | | | | | | $ | 14,587,043 | |
| Contracts(d) | | | | | Expiration Date | | Exercise Price | | | Notional Value | | | Fair Value | |
| | | | | WRITTEN EQUITY OPTIONS - 0.0% (e) | | | | | | | | | | | | | | |
| | | | | CALL OPTIONS WRITTEN - 0.0%(e) | | | | | | | | | | | | | | |
| | 35 | | | eBay, Inc. | | 07/19/2024 | | $ | 55 | | | $ | 188,020 | | | $ | 2,450 | |
| | | | | TOTAL CALL OPTIONS WRITTEN (Premiums received - $4,933) | | | | | | |
| ADR | - American Depositary Receipt |
| | |
| A.G. | - Aktiengesellschaft |
| | |
| LLC | - Limited Liability Company |
| | |
| Ltd. | - Limited Company |
| | |
| PCL | - Public Company Limited |
| | |
| PLC | - Public Limited Company |
| | |
| S.A. | - Société Anonyme |
| | |
| S.E. | - Societas Europaea |
| | |
| SPDR | - Standard & Poor’s Depositary Receipt |
| (a) | Non-income producing security. |
| (b) | All or a portion of this security is segregated as collateral for and is subject to call options written. |
| (c) | Rate disclosed is the seven-day effective yield as of June 30, 2024. |
| (d) | Each option contract allows the holder of the option to purchase or sell 100 shares of the underlying security. |
| (e) | Percentage rounds to greater than (0.1%). |
| (f) | Step bond. Coupon rate is fixed rate that changes on a specified date. The rate shown is the current rate at June 30, 2024. |
The accompanying notes are an integral part of these financial statements.
| CATALYST/CIFC SENIOR SECURED INCOME FUND |
| SCHEDULE OF INVESTMENTS |
| June 30, 2024 |
| Shares | | | | | | | | | | | Fair Value | |
| | | | | EXCHANGE-TRADED FUNDS — 2.9% | | | | | | | | | | |
| | | | | FIXED INCOME - 2.9% | | | | | | | | | | |
| | 425,928 | | | Invesco Senior Loan ETF | | | | | | | | $ | 8,961,525 | |
| | 111,697 | | | SPDR Blackstone Senior Loan ETF | | | | | | | | | 4,668,935 | |
| | | | | | | | | | | | | | 13,630,460 | |
| | | | | | | | | | | | | | | |
| | | | | TOTAL EXCHANGE-TRADED FUNDS (Cost $13,555,968) | | | | | | | | | 13,630,460 | |
| | | | | | | | | | | | | | | |
| Principal | | | | | | | Coupon Rate | | | | | | |
| Amount ($) | | | | | Spread | | (%) | | Maturity | | | | |
| | | | | ASSET BACKED SECURITIES — 6.6% | | | | | | | | | | |
| | | | | CLO — 6.6% | | | | | | | | | | |
| | 500,000 | | | Alinea CLO Ltd. Series 2018-1 E(a),(b) | | TSFR3M + 6.262% | | 11.5860 | | 07/20/31 | | | 496,314 | |
| | 500,000 | | | Apidos CLO XXX D(a),(b) | | TSFR3M + 5.862% | | 11.1890 | | 10/18/31 | | | 502,940 | |
| | 750,000 | | | ARES XLV CLO Ltd. Series 2017-45A E(a),(b) | | TSFR3M + 6.362% | | 11.6900 | | 10/15/30 | | | 747,628 | |
| | 500,000 | | | ARES XLVII CLO Ltd. Series 2018-47A E(a),(b) | | TSFR3M + 5.762% | | 11.0900 | | 04/15/30 | | | 497,424 | |
| | 1,000,000 | | | Ares XXXVR CLO Ltd. Series 2015-35RA E(a),(b) | | TSFR3M + 5.962% | | 11.2900 | | 07/15/30 | | | 993,128 | |
| | 1,000,000 | | | Bardot CLO Ltd. Series 2019-2A ER(a),(b) | | TSFR3M + 6.562% | | 11.8860 | | 10/22/32 | | | 997,786 | |
| | 1,500,000 | | | Betony CLO 2 Ltd. Series 2018-1A D(a),(b) | | TSFR3M + 5.912% | | 11.2410 | | 04/30/31 | | | 1,476,958 | |
| | 500,000 | | | BlueMountain CLO Ltd. Series 2018-3A E(a),(b) | | TSFR3M + 6.212% | | 11.5350 | | 10/25/30 | | | 485,759 | |
| | 500,000 | | | BlueMountain CLO XXII Ltd. Series 2018-22A E(a),(b) | | TSFR3M + 5.312% | | 10.6400 | | 07/15/31 | | | 463,594 | |
| | 500,000 | | | BlueMountain Fuji US Clo I Ltd. Series 2017-1A E(a),(b) | | TSFR3M + 6.262% | | 11.5860 | | 07/20/29 | | | 470,102 | |
| | 500,000 | | | Carbone Clo Ltd. Series 2017-1A D(a),(b) | | TSFR3M + 6.162% | | 11.4860 | | 01/20/31 | | | 497,443 | |
| | 500,000 | | | Carlyle Global Market Strategies CLO Ltd. Series 2014-1A ER(a),(b) | | TSFR3M + 5.662% | | 10.9790 | | 04/17/31 | | | 463,451 | |
| | 500,000 | | | Carlyle Global Market Strategies CLO Ltd. Series 2017-1A D(a),(b) | | TSFR3M + 6.262% | | 11.5860 | | 04/20/31 | | | 495,367 | |
| | 500,000 | | | CARLYLE US CLO Ltd. Series 2017-5A D(a),(b) | | TSFR3M + 5.562% | | 10.8860 | | 01/20/30 | | | 487,830 | |
| | 1,000,000 | | | Catskill Park CLO Ltd. Series 2017-1A(a),(b) | | TSFR3M + 6.262% | | 11.5860 | | 04/20/29 | | | 1,006,196 | |
| | 1,000,000 | | | Cedar Funding XIV CLO Ltd. Series 2021-14a E(a),(b) | | TSFR3M + 6.602% | | 11.9300 | | 07/15/33 | | | 990,012 | |
| | 1,000,000 | | | Cook Park CLO Ltd. Series 2018-1A E(a),(b) | | TSFR3M + 5.662% | | 10.9790 | | 04/17/30 | | | 991,034 | |
| | 750,000 | | | Dryden 54 Senior Loan Fund Series 2017-54A E(a),(b) | | TSFR3M + 6.462% | | 11.7880 | | 10/19/29 | | | 710,627 | |
| | 500,000 | | | Flatiron Clo 17 Ltd. Series 2017-1A ER(a),(b) | | TSFR3M + 6.162% | | 11.4840 | | 05/15/30 | | | 500,183 | |
| | 500,000 | | | Galaxy XV CLO Ltd. Series 2013-15A ER(a),(b) | | TSFR3M + 6.907% | | 12.2350 | | 10/15/30 | | | 495,895 | |
| | 624,000 | | | Galaxy XX CLO Ltd. Series 2015-20A ER(a),(b) | | TSFR3M + 5.562% | | 10.8860 | | 04/20/31 | | | 622,025 | |
| | 500,000 | | | Galaxy XXI CLO Ltd. Series 2015-21A ER(a),(b) | | TSFR3M + 5.512% | | 10.8360 | | 04/20/31 | | | 499,963 | |
| | 500,000 | | | Grippen Park CLO Ltd. Series 2017-1A E(a),(b) | | TSFR3M + 5.962% | | 11.2860 | | 01/20/30 | | | 500,483 | |
| | 500,000 | | | Harbor Park CLO Ltd. Series 2018-1A E(a),(b) | | TSFR3M + 5.862% | | 11.1860 | | 01/20/31 | | | 502,554 | |
| | 500,000 | | | Highbridge Loan Management Ltd. Series 2013-2A DR(a),(b) | | TSFR3M + 6.862% | | 12.1860 | | 10/20/29 | | | 499,604 | |
The accompanying notes are an integral part of these financial statements.
| CATALYST/CIFC SENIOR SECURED INCOME FUND |
| SCHEDULE OF INVESTMENTS (Continued) |
| June 30, 2024 |
| Principal | | | | | | | Coupon Rate | | | | | |
| Amount ($) | | | | | Spread | | (%) | | Maturity | | Fair Value | |
| | | | | ASSET BACKED SECURITIES — 6.6% (Continued) | | | | | | | | | | |
| | | | | CLO — 6.6% (Continued) | | | | | | | | | | |
| | 500,000 | | | Magnetite XV Ltd. Series 2015-15A ER(a),(b) | | TSFR3M + 5.462% | | 10.7850 | | 07/25/31 | | $ | 503,233 | |
| | 500,000 | | | Neuberger Berman CLO XVIII Ltd. Series 2014-18A DR2(a),(b) | | TSFR3M + 6.182% | | 11.5060 | | 10/21/30 | | | 498,297 | |
| | 500,000 | | | Neuberger Berman Loan Advisers CLO Ltd. Series 2018-27A E(a),(b) | | TSFR3M + 5.462% | | 10.7900 | | 01/15/30 | | | 500,000 | |
| | 750,000 | | | Neuberger Berman Loan Advisers CLO Ltd. Series 2017-24A E(a),(b) | | TSFR3M + 6.282% | | 11.6080 | | 04/19/30 | | | 751,253 | |
| | 1,000,000 | | | Neuberger Berman Loan Advisers CLO Ltd. Series 2017-26A E(a),(b) | | TSFR3M + 6.162% | | 11.4890 | | 10/18/30 | | | 990,958 | |
| | 500,000 | | | Octagon Investment Partners 26 Ltd. Series 2016-1A ER(a),(b) | | TSFR3M + 5.662% | | 10.9900 | | 07/15/30 | | | 463,703 | |
| | 500,000 | | | Octagon Investment Partners 37 Ltd. Series 2018-2A D(a),(b) | | TSFR3M + 5.662% | | 10.9850 | | 07/25/30 | | | 472,515 | |
| | 500,000 | | | Octagon Investment Partners Ltd. Series 2018-18A C(a),(b) | | TSFR3M + 2.962% | | 8.2890 | | 04/16/31 | | | 493,061 | |
| | 500,000 | | | Octagon Investment Partners XVII Ltd. Series 2013-1A ER2(a),(b) | | TSFR3M + 5.412% | | 10.7350 | | 01/25/31 | | | 464,682 | |
| | 1,000,000 | | | Octagon Investment Partners XXII Ltd. Series 2014-1A ERR(a),(b) | | TSFR3M + 5.712% | | 11.0360 | | 01/22/30 | | | 976,061 | |
| | 500,000 | | | Palmer Square CLO Ltd. Series 2014-1A DR2(a),(b) | | TSFR3M + 5.962% | | 11.2790 | | 01/17/31 | | | 503,456 | |
| | 550,000 | | | Regatta XI Funding Ltd. Series 2018-1A E(a),(b) | | TSFR3M + 5.762% | | 11.0790 | | 07/17/31 | | | 550,000 | |
| | 1,000,000 | | | Regatta XIV Funding Ltd. Series 2018-3A E(a),(b) | | TSFR3M + 6.212% | | 11.5350 | | 10/25/31 | | | 994,303 | |
| | 1,000,000 | | | RR 3 Ltd. Series 2018-3A DR2(a),(b) | | TSFR3M + 5.662% | | 10.9900 | | 01/15/30 | | | 980,972 | |
| | 1,000,000 | | | Shackleton CLO Ltd. Series 2017-10A E(a),(b) | | TSFR3M + 6.477% | | 11.8010 | | 04/20/29 | | | 951,416 | |
| | 500,000 | | | Upland CLO Ltd. Series 2016-1A DR(a),(b) | | TSFR3M + 6.162% | | 11.4860 | | 04/20/31 | | | 499,624 | |
| | 525,000 | | | Voya CLO Ltd. Series 2018-4A E(a),(b) | | TSFR3M + 6.562% | | 11.8900 | | 01/15/32 | | | 523,161 | |
| | 1,500,000 | | | Wellfleet CLO Ltd. Series 2016-1A ER(a),(b) | | TSFR3M + 6.062% | | 11.3860 | | 04/20/28 | | | 1,499,462 | |
| | 500,000 | | | Wellfleet CLO Ltd. Series 2017-1A D(a),(b) | | TSFR3M + 6.312% | | 11.6360 | | 04/20/29 | | | 490,000 | |
| | 500,000 | | | Wellfleet CLO Ltd. Series 2015-1A ER3(a),(b) | | TSFR3M + 7.312% | | 12.6360 | | 07/20/29 | | | 325,019 | |
| | 500,000 | | | Wellfleet CLO Ltd. Series 2018-2A D(a),(b) | | TSFR3M + 6.332% | | 11.6560 | | 10/20/31 | | | 481,656 | |
| | 500,000 | | | Wellfleet CLO Ltd. Series 2018-3A D(a),(b) | | TSFR3M + 6.512% | | 11.8360 | | 01/20/32 | | | 474,923 | |
| | | | | | | | | | | | | | 30,782,055 | |
| | | | | TOTAL ASSET BACKED SECURITIES (Cost $30,303,214) | | | | | | | | | 30,782,055 | |
| | | | | | | | | | | | | | | |
| | | | | CORPORATE BONDS — 3.2% | | | | | | | | | | |
| | | | | BIOTECH & PHARMA — 0.0%(c) | | | | | | | | | | |
| | 91,000 | | | Organon & Company / Organon Foreign Debt Co-Issuer(a) | | | | 7.8750 | | 05/15/34 | | | 93,615 | |
| | | | | | | | | | | | | | | |
| | | | | CHEMICALS — 0.3% | | | | | | | | | | |
| | 1,300,000 | | | Valvoline, Inc.(a) | | | | 3.6250 | | 06/15/31 | | | 1,121,637 | |
The accompanying notes are an integral part of these financial statements.
| CATALYST/CIFC SENIOR SECURED INCOME FUND |
| SCHEDULE OF INVESTMENTS (Continued) |
| June 30, 2024 |
| Principal | | | | | Coupon Rate | | | | | |
| Amount ($) | | | | | (%) | | Maturity | | Fair Value | |
| | | | | CORPORATE BONDS — 3.2% (Continued) | | | | | | | | |
| | | | | HEALTH CARE FACILITIES & SERVICES — 0.5% | | | | | | | | |
| | 1,090,000 | | | LifePoint Health, Inc.(a) | | 11.0000 | | 10/15/30 | | | 1,202,378 | |
| | 183,000 | | | LifePoint Health, Inc.(a) | | 10.0000 | | 06/01/32 | | | 187,378 | |
| | 168,000 | | | Team Health Holdings, Inc.(a) | | 13.5000 | | 06/30/28 | | | 186,690 | |
| | 720,000 | | | Tenet Healthcare Corporation | | 6.7500 | | 05/15/31 | | | 731,407 | |
| | | | | | | | | | | | 2,307,853 | |
| | | | | INDUSTRIAL SUPPORT SERVICES — 0.0%(c) | | | | | | | | |
| | 57,000 | | | EquipmentShare.com, Inc.(a) | | 8.6250 | | 05/15/32 | | | 59,183 | |
| | | | | | | | | | | | | |
| | | | | INSURANCE — 0.0%(c) | | | | | | | | |
| | 62,000 | | | Acrisure, LLC / Acrisure Finance, Inc.(a) | | 8.5000 | | 06/15/29 | | | 62,753 | |
| | | | | | | | | | | | | |
| | | | | METALS & MINING — 0.0%(c) | | | | | | | | |
| | 134,000 | | | Alcoa Nederland Holding BV(a) | | 7.1250 | | 03/15/31 | | | 138,162 | |
| | | | | | | | | | | | | |
| | | | | OIL & GAS PRODUCERS — 0.8% | | | | | | | | |
| | 102,000 | | | Antero Midstream Partners, L.P. / Antero Midstream(a) | | 6.6250 | | 02/01/32 | | | 102,980 | |
| | 188,000 | | | Buckeye Partners, L.P.(a) | | 6.8750 | | 07/01/29 | | | 188,908 | |
| | 275,000 | | | Crescent Energy Finance, LLC(a) | | 7.6250 | | 04/01/32 | | | 280,465 | |
| | 1,104,000 | | | Earthstone Energy Holdings, LLC(a) | | 9.8750 | | 07/15/31 | | | 1,223,168 | |
| | 126,000 | | | Howard Midstream Energy Partners, LLC(a) | | 7.3750 | | 07/15/32 | | | 128,337 | |
| | 95,000 | | | Kinetik Holdings, L.P.(a) | | 6.6250 | | 12/15/28 | | | 96,559 | |
| | 74,000 | | | Venture Global LNG, Inc.(a) | | 8.1250 | | 06/01/28 | | | 76,359 | |
| | 93,000 | | | Venture Global LNG, Inc.(a) | | 9.5000 | | 02/01/29 | | | 101,989 | |
| | 1,300,000 | | | Venture Global LNG, Inc.(a) | | 9.8750 | | 02/01/32 | | | 1,414,189 | |
| | 56,000 | | | Vital Energy, Inc.(a) | | 7.8750 | | 04/15/32 | | | 56,968 | |
| | | | | | | | | | | | 3,669,922 | |
| | | | | RETAIL - DISCRETIONARY — 0.5% | | | | | | | | |
| | 1,108,000 | | | Global Auto Holdings Ltd./AAG FH UK Ltd.(a) | | 8.7500 | | 01/15/32 | | | 1,061,093 | |
| | 1,400,000 | | | Metis Merger Sub, LLC(a) | | 6.5000 | | 05/15/29 | | | 1,306,000 | |
| | | | | | | | | | | | 2,367,093 | |
| | | | | SOFTWARE — 0.6% | | | | | | | | |
| | 1,344,000 | | | Cloud Software Group, Inc.(a) | | 8.2500 | | 06/30/32 | | | 1,370,720 | |
| | 1,300,000 | | | UKG, Inc.(a) | | 6.8750 | | 02/01/31 | | | 1,317,182 | |
| | | | | | | | | | | | 2,687,902 | |
The accompanying notes are an integral part of these financial statements.
| CATALYST/CIFC SENIOR SECURED INCOME FUND |
| SCHEDULE OF INVESTMENTS (Continued) |
| June 30, 2024 |
| Principal | | | | | | | Coupon Rate | | | | | |
| Amount ($) | | | | | | | (%) | | Maturity | | Fair Value | |
| | | | | CORPORATE BONDS — 3.2% (Continued) | | | | | | | | | | |
| | | | | SPECIALTY FINANCE — 0.2% | | | | | | | | | | |
| | 650,000 | | | Fortress Transportation and Infrastructure(a) | | | | 7.8750 | | 12/01/30 | | | 680,726 | |
| | 313,000 | | | Fortress Transportation and Infrastructure(a) | | | | 7.0000 | | 06/15/32 | | | 317,758 | |
| | | | | | | | | | | | | | 998,484 | |
| | | | | | | | | | | | | | | |
| | | | | TECHNOLOGY SERVICES — 0.3% | | | | | | | | | | |
| | 365,000 | | | Block, Inc.(a) | | | | 6.5000 | | 05/15/32 | | | 369,781 | |
| | 120,000 | | | Fortress Intermediate 3, Inc.(a) | | | | 7.5000 | | 06/01/31 | | | 123,096 | |
| | 994,000 | | | Iron Mountain Information Management Services,(a) | | | | 5.0000 | | 07/15/32 | | | 909,633 | |
| | | | | | | | | | | | | | 1,402,510 | |
| | | | | TOTAL CORPORATE BONDS (Cost $14,647,847) | | | | | | | | | 14,909,114 | |
| | | | | | | | | | | | | | | |
| | | | | | | Spread | | | | | | | | |
| | | | | TERM LOANS — 85.6% | | | | | | | | | | |
| | | | | ADVERTISING & MARKETING — 0.6% | | | | | | | | | | |
| | 2,827,300 | | | ABG Intermediate Holdings 2, LLC(b) | | TSFR1M + 3.600% | | 8.9270 | | 12/10/28 | | | 2,833,393 | |
| | | | | | | | | | | | | | | |
| | | | | AEROSPACE & DEFENSE — 2.8% | | | | | | | | | | |
| | 3,999,125 | | | Bleriot US Bidco, Inc.(b) | | TSFR1M + 4.000% | | 9.5710 | | 10/31/28 | | | 4,022,619 | |
| | 3,354,248 | | | Dynasty Acquisition Company, Inc.(b) | | TSFR1M + 3.500% | | 8.8290 | | 08/24/28 | | | 3,370,248 | |
| | 99,000 | | | Novaria Holdings, LLC(b) | | TSFR1M + 4.250% | | 9.5780 | | 06/04/31 | | | 99,743 | |
| | 2,306,973 | | | Spirit AeroSystems, Inc.(b) | | TSFR1M + 4.500% | | 9.5790 | | 11/23/27 | | | 2,324,852 | |
| | 1,395,752 | | | Standard Aero Ltd.(b) | | TSFR1M + 3.500% | | 8.8290 | | 08/24/28 | | | 1,402,410 | |
| | 1,002,718 | | | TransDigm, Inc.(b) | | TSFR1M + 2.750% | | 8.0590 | | 08/24/28 | | | 1,005,666 | |
| | 1,035,202 | | | TransDigm, Inc.(b) | | TSFR1M + 3.250% | | 8.5590 | | 02/28/31 | | | 1,038,567 | |
| | | | | | | | | | | | | | 13,264,105 | |
| | | | | APPAREL & TEXTILE PRODUCTS — 0.1% | | | | | | | | | | |
| | 443,087 | | | Hanesbrands, Inc.(b) | | TSFR1M + 3.850% | | 9.0800 | | 03/08/30 | | | 445,025 | |
| | | | | | | | | | | | | | | |
| | | | | ASSET MANAGEMENT — 6.5% | | | | | | | | | | |
| | 1,257,181 | | | Aragorn Parent Corporation(b) | | TSFR1M + 4.250% | | 9.5690 | | 12/08/28 | | | 1,263,077 | |
| | 2,019,640 | | | Edelman Financial Engines Center, LLC (The)(b) | | TSFR1M + 3.250% | | 8.5780 | | 04/07/28 | | | 2,024,850 | |
| | 1,256,934 | | | Edelman Financial Engines Center, LLC (The)(b) | | TSFR1M + 5.250% | | 10.5710 | | 10/23/28 | | | 1,261,648 | |
| | 261,028 | | | FinCompany I, LLC(b) | | TSFR1M + 3.000% | | 8.3300 | | 06/27/29 | | | 262,305 | |
| | 746,000 | | | First Eagle Holdings, Inc.(b) | | TSFR1M + 3.000% | | 8.3340 | | 02/22/29 | | | 743,669 | |
The accompanying notes are an integral part of these financial statements.
| CATALYST/CIFC SENIOR SECURED INCOME FUND |
| SCHEDULE OF INVESTMENTS (Continued) |
| June 30, 2024 |
| Principal | | | | | | | Coupon Rate | | | | | |
| Amount ($) | | | | | Spread | | (%) | | Maturity | | Fair Value | |
| | | | | TERM LOANS — 85.6% (Continued) | | | | | | | | | | |
| | | | | ASSET MANAGEMENT — 6.5% (Continued) | | | | | | | | | | |
| | 1,250,000 | | | Focus Financial Partners, LLC(b) | | TSFR1M + 2.500% | | 7.8130 | | 06/30/28 | | | 1,250,294 | |
| | 1,529,141 | | | Focus Financial Partners, LLC(b) | | TSFR1M + 2.750% | | 8.0800 | | 06/30/28 | | | 1,529,362 | |
| | 2,203,356 | | | GTCR Everest Borrower, LLC(b) | | TSFR1M + 3.000% | | 8.3250 | | 06/03/31 | | | 2,207,488 | |
| | 5,500,000 | | | GTCR W Merger Sub, LLC(b) | | TSFR1M + 3.000% | | 8.3090 | | 09/20/30 | | | 5,514,520 | |
| | 1,234,300 | | | Guggenheim Partners Investment Management(b) | | TSFR1M + 3.250% | | 8.5520 | | 12/07/29 | | | 1,242,792 | |
| | 80,793 | | | Hightower Holding, LLC(b) | | TSFR3M + 4.262% | | 9.5860 | | 04/21/28 | | | 81,083 | |
| | 2,488,308 | | | Nexus Buyer, LLC(b) | | TSFR1M + 3.750% | | 9.1790 | | 11/08/26 | | | 2,489,515 | |
| | 799,000 | | | Nexus Buyer, LLC(b) | | TSFR1M + 4.500% | | 9.8270 | | 12/23/30 | | | 800,698 | |
| | 5,645,021 | | | Osaic Holdings, Inc.(b) | | TSFR1M + 4.000% | | 9.3210 | | 08/16/28 | | | 5,669,379 | |
| | 1,088,962 | | | Victory Capital Holdings, Inc.(b) | | TSFR1M + 2.250% | | 7.6790 | | 07/01/26 | | | 1,090,667 | |
| | 2,844,370 | | | Wec US Holdings Ltd.(b) | | TSFR1M + 2.750% | | 8.0790 | | 01/20/31 | | | 2,850,329 | |
| | | | | | | | | | | | | | 30,281,676 | |
| | | | | AUTOMOTIVE — 1.6% | | | | | | | | | | |
| | 3,724,822 | | | First Brands Group, LLC(b) | | SOFRRATE + 5.000% | | 10.5910 | | 03/24/27 | | | 3,706,795 | |
| | 818,178 | | | First Brands Group, LLC(b) | | TSFR1M + 6.000% | | 10.5910 | | 03/30/27 | | | 814,598 | |
| | 1,134,141 | | | First Brands Group, LLC(b) | | TSFR6M + 8.500% | | 14.1410 | | 03/30/28 | | | 1,102,952 | |
| | 1,077,975 | | | Tenneco, Inc.(b) | | TSFR1M + 4.750% | | 10.1700 | | 11/17/28 | | | 1,035,529 | |
| | 885,000 | | | Tenneco, Inc.(b) | | TSFR1M + 5.000% | | 10.4190 | | 11/17/28 | | | 850,945 | |
| | | | | | | | | | | | | | 7,510,819 | |
| | | | | BEVERAGES — 0.1% | | | | | | | | | | |
| | 292,268 | | | Pegasus Bidco BV(b) | | TSFR1M + 3.750% | | 9.0720 | | 07/12/29 | | | 294,337 | |
| | | | | | | | | | | | | | | |
| | | | | BIOTECH & PHARMA — 0.6% | | | | | | | | | | |
| | 783,874 | | | Curium Bidco Sarl(b) | | TSFR1M + 4.000% | | 9.3290 | | 07/31/29 | | | 788,287 | |
| | 1,496,094 | | | Grifols Worldwide Operations USA, Inc.(b) | | TSFR3M + 2.000% | | 7.4590 | | 11/08/27 | | | 1,473,652 | |
| | 322,000 | | | Organon & Company(b) | | TSFR1M + 2.500% | | 7.8200 | | 05/14/31 | | | 322,604 | |
| | | | | | | | | | | | | | 2,584,543 | |
| | | | | | | | | | | | | | | |
| | | | | CABLE & SATELLITE — 0.3% | | | | | | | | | | |
| | 105,617 | | | Directv Financing, LLC(b) | | TSFR1M + 5.000% | | 10.4410 | | 07/22/27 | | | 105,960 | |
| | 137,828 | | | Directv Financing, LLC(b) | | TSFR1M + 5.365% | | 10.6940 | | 08/02/29 | | | 137,397 | |
| | 1,173,724 | | | Virgin Media Bristol, LLC(b) | | TSFR1M + 3.250% | | 8.6560 | | 03/06/31 | | | 1,111,053 | |
| | | | | | | | | | | | | | 1,354,410 | |
The accompanying notes are an integral part of these financial statements.
| CATALYST/CIFC SENIOR SECURED INCOME FUND |
| SCHEDULE OF INVESTMENTS (Continued) |
| June 30, 2024 |
| Principal | | | | | | | Coupon Rate | | | | | |
| Amount ($) | | | | | Spread | | (%) | | Maturity | | Fair Value | |
| | | | | TERM LOANS — 85.6% (Continued) | | | | | | | | | | |
| | | | | CHEMICALS — 1.4% | | | | | | | | | | |
| | 101,745 | | | INEOS Enterprises Holdings US Finco, LLC(b) | | TSFR1M + 3.850% | | 9.1930 | | 07/07/30 | | | 102,127 | |
| | 77,000 | | | INEOS US Finance, LLC(b) | | TSFR1M + 3.500% | | 8.9560 | | 02/09/30 | | | 76,654 | |
| | 375,000 | | | INEOS US Finance, LLC(b) | | TSFR1M + 3.750% | | 9.0800 | | 01/31/31 | | | 376,406 | |
| | 1,067,168 | | | INEOS US Petrochem, LLC(b) | | TSFR1M + 4.350% | | 9.6800 | | 11/14/29 | | | 1,066,501 | |
| | 1,924,338 | | | Nouryon USA, LLC(b) | | TSFR1M + 3.500% | | 8.8160 | | 04/03/28 | | | 1,936,364 | |
| | 195,018 | | | Nouryon USA, LLC(b) | | TSFR1M + 3.500% | | 8.8260 | | 04/03/28 | | | 195,773 | |
| | 674,453 | | | Olympus Water US Holding Corporation(b) | | TSFR1M + 4.250% | | 9.5760 | | 11/09/28 | | | 678,108 | |
| | 456,000 | | | Olympus Water US Holding Corporation(b) | | TSFR1M + 3.500% | | 8.8300 | | 06/06/31 | | | 457,425 | |
| | 636,476 | | | PQ Group Holdings, Inc.(b) | | TSFR1M + 3.500% | | 8.6930 | | 04/30/28 | | | 637,329 | |
| | 1,048,996 | | | Windsor Holdings III, LLC(b) | | TSFR1M + 4.000% | | 9.3200 | | 08/01/30 | | | 1,057,126 | |
| | 75,000 | | | WR Grace Holdings, LLC | | SOFRRATE + 3.250% | | 4.2500 | | 08/11/28 | | | 75,429 | |
| | | | | | | | | | | | | | 6,659,242 | |
| | | | | COMMERCIAL SUPPORT SERVICES — 6.6% | | | | | | | | | | |
| | 153,043 | | | Action Environmental Group, Inc. (The)(b) | | TSFR1M + 4.500% | | 9.3240 | | 10/05/30 | | | 154,191 | |
| | 22,957 | | | Action Environmental Group, Inc. (The)(b) | | TSFR1M + 4.500% | | 9.8240 | | 10/05/30 | | | 23,129 | |
| | 1,100,000 | | | Allied Universal Holdco, LLC(b) | | TSFR1M + 3.750% | | 9.1790 | | 05/05/28 | | | 1,097,014 | |
| | 400,373 | | | Amentum Government Services Holdings, LLC(b) | | TSFR1M + 8.750% | | 14.1950 | | 01/31/28 | | | 401,374 | |
| | 1,421,678 | | | Amentum Government Services Holdings, LLC | | SOFRRATE + 4.000% | | 9.3210 | | 02/07/29 | | | 1,429,674 | |
| | 2,416,239 | | | AVSC Holding Corporation(b) | | TSFR1M + 3.500% | | 8.6660 | | 03/01/25 | | | 2,404,315 | |
| | 239,200 | | | AVSC Holding Corporation(b) | | TSFR1M + 7.360% | | 12.7100 | | 09/02/25 | | | 236,584 | |
| | 1,915,209 | | | AVSC Holding Corporation(b) | | TSFR1M + 4.500% | | 9.9160 | | 09/26/26 | | | 1,919,700 | |
| | 1,227,254 | | | Bifm CA Buyer, Inc.(b) | | TSFR1M + 4.250% | | 9.5710 | | 05/31/28 | | | 1,234,544 | |
| | 1,886,517 | | | CHG Healthcare Services, Inc.(b) | | TSFR1M + 3.750% | | 9.0790 | | 09/30/28 | | | 1,894,186 | |
| | 346,434 | | | Conservice Midco, LLC(b) | | TSFR1M + 4.000% | | 9.3300 | | 05/13/27 | | | 347,247 | |
| | 2,435,107 | | | Creative Artists Agency, LLC(b) | | TSFR1M + 3.250% | | 8.5700 | | 11/27/28 | | | 2,449,376 | |
| | 520,632 | | | EnergySolutions, LLC(b) | | TSFR1M + 4.000% | | 9.3130 | | 09/18/30 | | | 525,351 | |
| | 1,375,000 | | | Ensemble RCM, LLC(b) | | TSFR1M + 3.000% | | 8.3300 | | 08/03/29 | | | 1,372,786 | |
| | 2,559,487 | | | Garda World Security Corporation(b) | | TSFR1M + 4.350% | | 9.5830 | | 02/01/29 | | | 2,578,683 | |
| | 210,000 | | | GFL Environmental, Inc.(b) | | TSFR1M + 2.000% | | 7.3430 | | 06/27/31 | | | 210,525 | |
| | 2,105,738 | | | Grant Thornton LLP/Chicago(b) | | TSFR1M + 3.250% | | 8.5730 | | 05/30/31 | | | 2,114,403 | |
| | 2,909,307 | | | OMNIA Partners, LLC(b) | | TSFR1M + 3.750% | | 9.0700 | | 07/25/30 | | | 2,914,297 | |
| | 1,512,000 | | | Prime Security Services Borrower, LLC(b) | | TSFR1M + 2.250% | | 7.5790 | | 10/15/30 | | | 1,513,058 | |
| | 537,255 | | | Ryan, LLC(b) | | TSFR1M + 4.500% | | 8.8280 | | 11/09/30 | | | 540,143 | |
The accompanying notes are an integral part of these financial statements.
| CATALYST/CIFC SENIOR SECURED INCOME FUND |
| SCHEDULE OF INVESTMENTS (Continued) |
| June 30, 2024 |
| Principal | | | | | | | Coupon Rate | | | | | |
| Amount ($) | | | | | Spread | | (%) | | Maturity | | Fair Value | |
| | | | | TERM LOANS — 85.6% (Continued) | | | | | | | | | | |
| | | | | COMMERCIAL SUPPORT SERVICES — 6.6% (Continued) | | | | | | | | | | |
| | 62,745 | | | Ryan, LLC(b) | | TSFR1M + 4.500% | | 9.8250 | | 11/09/30 | | | 63,082 | |
| | 508,000 | | | Soliant Lower Intermediate, LLC(b) | | TSFR1M + 3.750% | | 9.0790 | | 06/23/31 | | | 508,000 | |
| | 688,000 | | | Teneo Holdings, LLC(b) | | TSFR1M + 4.750% | | 10.0800 | | 03/11/31 | | | 690,724 | |
| | 4,294,370 | | | WestJet Loyalty, L.P.(b) | | TSFR1M + 3.850% | | 9.0680 | | 02/01/31 | | | 4,319,064 | |
| | | | | | | | | | | | | | 30,941,450 | |
| | | | | CONSTRUCTION MATERIALS — 0.2% | | | | | | | | | | |
| | 1,000,000 | | | Quikrete Holdings, Inc.(b) | | TSFR1M + 2.250% | | 7.5790 | | 03/26/29 | | | 1,001,815 | |
| | | | | | | | | | | | | | | |
| | | | | CONSUMER SERVICES — 1.4% | | | | | | | | | | |
| | 723,386 | | | Fugue Finance, LLC(b) | | TSFR1M + 4.000% | | 9.3430 | | 01/26/28 | | | 729,792 | |
| | 306,000 | | | Fugue Finance, LLC(b) | | TSFR1M + 3.750% | | 9.0740 | | 02/13/31 | | | 308,945 | |
| | 1,592,797 | | | KUEHG Corporation(b) | | TSFR1M + 4.500% | | 9.8020 | | 06/12/30 | | | 1,600,864 | |
| | 1,573,610 | | | Prometric Holdings, Inc.(b) | | TSFR1M + 4.750% | | 10.1940 | | 01/31/28 | | | 1,585,019 | |
| | 1,017,726 | | | Spin Holdco, Inc.(b) | | TSFR3M + 4.000% | | 9.5850 | | 03/01/28 | | | 872,064 | |
| | 1,248,087 | | | University Support Services, LLC(b) | | TSFR1M + 3.350% | | 8.4300 | | 06/29/28 | | | 1,248,867 | |
| | | | | | | | | | | | | | 6,345,551 | |
| | | | | CONTAINERS & PACKAGING — 1.4% | | | | | | | | | | |
| | 191,000 | | | Berlin Packaging, LLC(b) | | TSFR1M + 3.750% | | 9.0710 | | 05/12/31 | | | 191,651 | |
| | 5,207,819 | | | Charter Next Generation, Inc.(b) | | TSFR1M + 3.500% | | 8.8270 | | 12/01/27 | | | 5,222,922 | |
| | 1,147,125 | | | Proampac PG Borrower, LLC(b) | | TSFR1M + 4.000% | | 9.3290 | | 09/15/28 | | | 1,151,283 | |
| | | | | | | | | | | | | | 6,565,856 | |
| | | | | E-COMMERCE DISCRETIONARY — 0.4% | | | | | | | | | | |
| | 1,879,262 | | | CNT Holdings I Corporation(b) | | TSFR1M + 3.500% | | 8.8300 | | 10/16/27 | | | 1,886,055 | |
| | | | | | | | | | | | | | | |
| | | | | ELECTRIC UTILITIES — 0.3% | | | | | | | | | | |
| | 1,000,000 | | | Calpine Corporation(b) | | TSFR1M + 2.000% | | 7.3210 | | 12/16/27 | | | 1,002,320 | |
| | 217,000 | | | Hamilton Projects Acquiror, LLC(b) | | TSFR1M + 3.750% | | 9.0670 | | 05/22/31 | | | 218,667 | |
| | | | | | | | | | | | | | 1,220,987 | |
| | | | | ELECTRICAL EQUIPMENT — 0.1% | | | | | | | | | | |
| | 610,526 | | | Belfor Holdings, Inc.(b) | | TSFR1M + 3.750% | | 9.0800 | | 10/25/30 | | | 615,105 | |
| | | | | | | | | | | | | | | |
| | | | | ENGINEERING & CONSTRUCTION — 0.3% | | | | | | | | | | |
| | 1,277,677 | | | Chromalloy Corporation(b) | | TSFR1M + 3.750% | | 9.0580 | | 03/24/31 | | | 1,283,107 | |
The accompanying notes are an integral part of these financial statements.
| CATALYST/CIFC SENIOR SECURED INCOME FUND |
| SCHEDULE OF INVESTMENTS (Continued) |
| June 30, 2024 |
| Principal | | | | | | | Coupon Rate | | | | | |
| Amount ($) | | | | | Spread | | (%) | | Maturity | | Fair Value | |
| | | | | TERM LOANS — 85.6% (Continued) | | | | | | | | | | |
| | | | | ENTERTAINMENT CONTENT — 0.8% | | | | | | | | | | |
| | 1,725,073 | | | AP Core Holdings II, LLC(b) | | TSFR1M + 5.500% | | 10.9450 | | 09/01/27 | | | 1,511,241 | |
| | 1,140,517 | | | NEP Group, Inc.(b) | | TSFR1M + 4.115% | | 9.4410 | | 08/19/26 | | | 1,084,916 | |
| | 978,438 | | | Univision Communications, Inc.(b) | | TSFR1M + 3.360% | | 8.6940 | | 03/24/26 | | | 980,091 | |
| | 262,000 | | | Univision Communications, Inc.(b) | | TSFR1M + 3.500% | | 8.9340 | | 01/31/29 | | | 259,708 | |
| | | | | | | | | | | | | | 3,835,956 | |
| | | | | FOOD — 1.3% | | | | | | | | | | |
| | 4,013,500 | | | Nomad Foods US, LLC(b) | | TSFR1M + 3.000% | | 8.2720 | | 11/08/29 | | | 4,023,172 | |
| | 225,000 | | | Saratoga Food Specialties, LLC(b) | | TSFR1M + 3.750% | | 9.0660 | | 03/01/29 | | | 226,547 | |
| | 458,000 | | | Simply Good Foods USA, Inc.(b) | | TSFR1M + 2.600% | | 7.9280 | | 03/17/27 | | | 460,100 | |
| | 1,436,250 | | | Snacking Investments US, LLC(b) | | TSFR1M + 4.000% | | 9.3300 | | 12/01/26 | | | 1,439,840 | |
| | 79,000 | | | Utz Quality Foods, LLC(b) | | TSFR1M + 2.750% | | 8.0670 | | 01/20/28 | | | 79,336 | |
| | | | | | | | | | | | | | 6,228,995 | |
| | | | | HEALTH CARE FACILITIES & SERVICES — 6.0% | | | | | | | | | | |
| | 248,082 | | | ADMI Corporation(b) | | TSFR1M + 3.375% | | 8.8200 | | 12/23/27 | | | 242,934 | |
| | 573,563 | | | ADMI Corporation(b) | | TSFR1M + 5.750% | | 11.0800 | | 12/23/27 | | | 578,340 | |
| | 497,481 | | | Charlotte Buyer, Inc.(b) | | TSFR3M + 5.250% | | 10.5780 | | 02/11/28 | | | 499,404 | |
| | 168,000 | | | Concentra Health Services, Inc.(b) | | TSFR1M + 2.250% | | 7.5890 | | 06/26/31 | | | 168,840 | |
| | 4,654,733 | | | Heartland Dental, LLC(b) | | TSFR1M + 4.500% | | 9.8170 | | 04/28/28 | | | 4,672,492 | |
| | 4,776,052 | | | LifePoint Health, Inc.(b) | | TSFR1M + 4.750% | | 10.0560 | | 11/16/28 | | | 4,808,004 | |
| | 240,000 | | | LifePoint Health, Inc.(b) | | TSFR1M + 4.000% | | 9.3200 | | 05/09/31 | | | 240,638 | |
| | 3,528,509 | | | MED ParentCo, L.P.(b) | | TSFR1M + 4.000% | | 9.3300 | | 04/07/31 | | | 3,531,508 | |
| | 1,932,236 | | | Milano Acquisition Corporation(b) | | TSFR3M + 4.000% | | 9.4090 | | 08/17/27 | | | 1,875,873 | |
| | 84,240 | | | National Mentor Holdings, Inc.(b) | | TSFR1M + 3.750% | | 9.1590 | | 02/18/28 | | | 79,723 | |
| | 2,959,835 | | | National Mentor Holdings, Inc.(b) | | TSFR1M + 3.750% | | 9.1660 | | 02/18/28 | | | 2,801,114 | |
| | 610,658 | | | One Call Corporation(b) | | TSFR3M + 5.500% | | 11.0860 | | 04/08/27 | | | 581,081 | |
| | 650,000 | | | Outcomes Group Holdings, Inc.(b) | | TSFR1M + 4.250% | | 9.5860 | | 04/02/31 | | | 652,896 | |
| | 4,075,778 | | | Phoenix Guarantor, Inc.(b) | | TSFR1M + 3.250% | | 8.5790 | | 02/13/31 | | | 4,070,194 | |
| | 2,094,816 | | | Phoenix Newco, Inc.(b) | | TSFR1M + 3.250% | | 8.6940 | | 08/11/28 | | | 2,101,687 | |
| | 962,205 | | | Select Medical Corporation(b) | | TSFR1M + 3.100% | | 8.3300 | | 03/05/27 | | | 963,807 | |
| | 95,753 | | | Team Public Choices, LLC(b) | | TSFR6M + 5.428% | | 10.5810 | | 12/20/27 | | | 95,833 | |
| | 306,830 | | | US Anesthesia Partners, Inc.(b) | | TSFR1M + 4.250% | | 9.6920 | | 09/23/28 | | | 295,110 | |
| | | | | | | | | | | | | | 28,259,478 | |
| | | | | HOME & OFFICE PRODUCTS — 0.8% | | | | | | | | | | |
| | 69,000 | | | AI Aqua Merger Sub, Inc.(b) | | TSFR1M + 4.250% | | 9.5790 | | 07/30/28 | | | 69,181 | |
The accompanying notes are an integral part of these financial statements.
| CATALYST/CIFC SENIOR SECURED INCOME FUND |
| SCHEDULE OF INVESTMENTS (Continued) |
| June 30, 2024 |
| Principal | | | | | | | Coupon Rate | | | | | |
| Amount ($) | | | | | Spread | | (%) | | Maturity | | Fair Value | |
| | | | | TERM LOANS — 85.6% (Continued) | | | | | | | | | | |
| | | | | HOME & OFFICE PRODUCTS — 0.8% (Continued) | | | | | | | | | | |
| | 2,600,000 | | | Osmosis Debt Merger Sub, Inc.(b) | | SOFRRATE + 3.750% | | 9.3240 | | 06/17/28 | | | 2,607,566 | |
| | 454,564 | | | Weber-Stephen Products, LLC(b) | | TSFR1M + 3.250% | | 8.6920 | | 10/20/27 | | | 423,942 | |
| | 675,775 | | | Weber-Stephen Products, LLC(b) | | TSFR1M + 4.350% | | 9.6770 | | 10/29/27 | | | 630,160 | |
| | | | | | | | | | | | | | 3,730,849 | |
| | | | | HOUSEHOLD PRODUCTS — 0.1% | | | | | | | | | | |
| | 449,000 | | | Kronos Acquisition Holdings, Inc.(b) | | TSFR1M + 4.000% | | 9.3390 | | 06/27/31 | | | 446,755 | |
| | | | | | | | | | | | | | | |
| | | | | INDUSTRIAL SUPPORT SERVICES — 0.0%(c) | | | | | | | | | | |
| | 104,000 | | | BCPE Empire Holdings, Inc.(b) | | TSFR1M + 4.000% | | 9.3300 | | 12/25/28 | | | 104,150 | |
| | | | | | | | | | | | | | | |
| | | | | INSTITUTIONAL FINANCIAL SERVICES — 3.1% | | | | | | | | | | |
| | 6,662,331 | | | Aretec Group, Inc.(b) | | TSFR1M + 4.000% | | 9.3200 | | 08/09/30 | | | 6,696,342 | |
| | 3,249,654 | | | Armor Holdco, Inc.(b) | | TSFR6M + 4.500% | | 9.9340 | | 10/29/28 | | | 3,267,933 | |
| | 1,245,422 | | | Ascensus Holdings, Inc.(b) | | TSFR1M + 3.500% | | 8.9440 | | 08/02/28 | | | 1,247,913 | |
| | 2,206,647 | | | Deerfield Dakota Holding, LLC(b) | | SOFRRATE + 3.750% | | 8.6480 | | 03/06/27 | | | 2,208,280 | |
| | 379,000 | | | Eisner Advisory Group, LLC(b) | | TSFR1M + 4.000% | | 9.3270 | | 02/24/31 | | | 383,186 | |
| | 792,000 | | | VFH Parent, LLC(b) | | TSFR1M + 2.750% | | 8.0790 | | 06/13/31 | | | 792,661 | |
| | | | | | | | | | | | | | 14,596,315 | |
| | | | | INSURANCE — 9.7% | | | | | | | | | | |
| | 1,246,034 | | | Acrisure, LLC(b) | | TSFR1M + 3.500% | | 8.9450 | | 01/31/27 | | | 1,247,330 | |
| | 2,116,695 | | | Acrisure, LLC(b) | | TSFR1M + 4.500% | | 9.8290 | | 10/20/30 | | | 2,132,570 | |
| | 267,000 | | | Acrisure, LLC(b) | | TSFR1M + 3.250% | | 8.5780 | | 11/06/30 | | | 267,001 | |
| | 2,632,666 | | | AmWINS Group, Inc.(b) | | TSFR1M + 2.250% | | 7.6800 | | 02/17/28 | | | 2,633,693 | |
| | 337,000 | | | Amynta Agency Borrower, Inc.(b) | | TSFR1M + 3.750% | | 9.0800 | | 02/28/28 | | | 338,233 | |
| | 597,000 | | | Ardonagh Group Finco Pty Ltd.(b) | | TSFR1M + 3.000% | | 8.3440 | | 06/27/31 | | | 596,627 | |
| | 2,463,749 | | | AssuredPartners, Inc.(b) | | TSFR1M + 3.500% | | 8.8220 | | 02/10/31 | | | 2,472,988 | |
| | 3,314,218 | | | Asurion, LLC(b) | | TSFR1M + 3.365% | | 8.6940 | | 12/18/26 | | | 3,291,200 | |
| | 2,411,000 | | | Asurion, LLC(b) | | TSFR1M + 5.250% | | 10.6940 | | 01/29/28 | | | 2,252,778 | |
| | 595,466 | | | Asurion, LLC(b) | | TSFR1M + 4.000% | | 9.4270 | | 08/17/28 | | | 589,696 | |
| | 900,000 | | | Asurion, LLC(b) | | TSFR1M + 5.250% | | 10.6940 | | 01/14/29 | | | 832,851 | |
| | 749,000 | | | Baldwin Insurance Group Holdings, LLC (The)(b) | | TSFR1M + 3.250% | | 8.5710 | | 05/14/31 | | | 749,936 | |
| | 6,480,000 | | | BroadStreet Partners, Inc.(b) | | TSFR1M + 3.250% | | 8.5710 | | 05/12/31 | | | 6,470,279 | |
| | 2,625,263 | | | HUB International Ltd.(b) | | TSFR1M + 3.250% | | 8.5750 | | 06/20/30 | | | 2,634,019 | |
The accompanying notes are an integral part of these financial statements.
| CATALYST/CIFC SENIOR SECURED INCOME FUND |
| SCHEDULE OF INVESTMENTS (Continued) |
| June 30, 2024 |
| Principal | | | | | | | Coupon Rate | | | | | |
| Amount ($) | | | | | Spread | | (%) | | Maturity | | Fair Value | |
| | | | | TERM LOANS — 85.6% (Continued) | | | | | | | | | | |
| | | | | INSURANCE — 9.7% (Continued) | | | | | | | | | | |
| | 2,978,955 | | | Hyperion Refinance Sarl(b) | | TSFR1M + 4.000% | | 9.3290 | | 03/24/30 | | | 2,987,162 | |
| | 1,345,345 | | | Hyperion Refinance Sarl(b) | | TSFR1M + 3.500% | | 8.8290 | | 02/03/31 | | | 1,349,939 | |
| | 2,904,397 | | | IMA Financial Group, Inc. (The)(b) | | TSFR1M + 3.850% | | 9.1920 | | 11/01/28 | | | 2,909,842 | |
| | 2,221,073 | | | OneDigital Borrower, LLC(b) | | SOFRRATE + 4.250% | | 9.6800 | | 11/16/27 | | | 2,218,297 | |
| | 2,321,000 | | | OneDigital Borrower, LLC(b) | | TSFR1M + 3.250% | | 8.5780 | | 06/13/31 | | | 2,318,110 | |
| | 599,000 | | | OneDigital Borrower, LLC(b) | | TSFR1M + 5.250% | | 10.5770 | | 06/14/32 | | | 597,503 | |
| | 1,670,672 | | | Ryan Specialty Group, LLC | | SOFRRATE + 3.000% | | 8.0800 | | 07/23/27 | | | 1,681,322 | |
| | 902,924 | | | Sedgwick Claims Management Services, Inc.(b) | | TSFR1M + 3.750% | | 9.0790 | | 02/17/28 | | | 905,055 | |
| | 506,000 | | | Truist Insurance Holdings, LLC(b) | | TSFR1M + 3.250% | | 8.5860 | | 03/24/31 | | | 507,715 | |
| | 379,000 | | | Truist Insurance Holdings, LLC(b) | | TSFR1M + 4.750% | | 10.0730 | | 03/08/32 | | | 387,528 | |
| | 1,448,658 | | | USI, Inc.(b) | | TSFR1M + 3.000% | | 8.3020 | | 11/22/29 | | | 1,450,476 | |
| | 1,218,875 | | | USI, Inc.(b) | | TSFR1M + 2.750% | | 8.0790 | | 09/27/30 | | | 1,220,399 | |
| | | | | | | | | | | | | | 45,042,549 | |
| | | | | INTERNET MEDIA & SERVICES — 2.7% | | | | | | | | | | |
| | 1,064,000 | | | Hunter Holdco 3 Ltd.(b) | | TSFR3M + 4.350% | | 9.6590 | | 08/06/28 | | | 1,054,690 | |
| | 316,000 | | | Knot Worldwide, Inc. (The)(b) | | TSFR1M + 4.500% | | 9.8220 | | 01/31/28 | | | 317,580 | |
| | 4,834,553 | | | MH Sub I, LLC(b) | | TSFR1M + 4.250% | | 9.5800 | | 05/03/28 | | | 4,835,544 | |
| | 550,000 | | | MH Sub I, LLC(b) | | TSFR1M + 6.250% | | 11.5800 | | 02/23/29 | | | 549,656 | |
| | 5,728,304 | | | Pug, LLC(b) | | TSFR1M + 4.750% | | 10.0790 | | 03/12/30 | | | 5,737,270 | |
| | | | | | | | | | | | | | 12,494,740 | |
| | | | | LEISURE FACILITIES & SERVICES — 2.8% | | | | | | | | | | |
| | 1,500,000 | | | 1011778 BC ULC(b) | | TSFR1M + 1.750% | | 7.0940 | | 09/23/30 | | | 1,498,103 | |
| | 145,635 | | | BCPE Grill Parent, Inc.(b) | | TSFR1M + 4.750% | | 10.0790 | | 09/21/30 | | | 143,851 | |
| | 219,000 | | | Bulldog Purchaser, Inc.(b) | | TSFR1M + 4.250% | | 9.5780 | | 06/13/31 | | | 220,369 | |
| | 3,400,000 | | | Fertitta Entertainment, LLC/NV(b) | | SOFRRATE + 4.000% | | 9.0690 | | 01/13/29 | | | 3,407,854 | |
| | 722,000 | | | Fitness International, LLC(b) | | TSFR1M + 5.250% | | 10.5770 | | 02/05/29 | | | 726,513 | |
| | 2,803,362 | | | Ontario Gaming GTA, L.P.(b) | | TSFR1M + 4.250% | | 9.5590 | | 07/20/30 | | | 2,820,434 | |
| | 761,000 | | | PCI Gaming Authority(b) | | SOFRRATE + 2.500% | | 2.6470 | | 05/31/26 | | | 760,620 | |
| | 1,969,802 | | | Raptor Acquisition Corporation(b) | | TSFR3M + 4.000% | | 9.5900 | | 11/01/26 | | | 1,981,088 | |
| | 105,000 | | | Tacala Investment Corporation(b) | | TSFR1M + 4.000% | | 9.3270 | | 01/27/31 | | | 105,580 | |
| | 1,654,764 | | | UFC Holdings, LLC(b) | | TSFR1M + 2.750% | | 8.3360 | | 04/29/26 | | | 1,660,407 | |
| | | | | | | | | | | | | | 13,324,819 | |
The accompanying notes are an integral part of these financial statements.
| CATALYST/CIFC SENIOR SECURED INCOME FUND |
| SCHEDULE OF INVESTMENTS (Continued) |
| June 30, 2024 |
| Principal | | | | | | | Coupon Rate | | | | | |
| Amount ($) | | | | | Spread | | (%) | | Maturity | | Fair Value | |
| | | | | TERM LOANS — 85.6% (Continued) | | | | | | | | | | |
| | | | | LEISURE PRODUCTS — 0.5% | | | | | | | | | | |
| | 151,000 | | | Amer Sports Company(b) | | TSFR1M + 3.250% | | 8.5760 | | 02/10/31 | | | 152,133 | |
| | 2,380,654 | | | Varsity Brands Holding Company, Inc.(b) | | TSFR1M + 5.000% | | 10.4450 | | 12/15/26 | | | 2,408,031 | |
| | | | | | | | | | | | | | 2,560,164 | |
| | | | | MACHINERY — 0.3% | | | | | | | | | | |
| | 204,000 | | | STS Operating, Inc.(b) | | TSFR1M + 4.100% | | 9.4200 | | 03/17/31 | | | 204,638 | |
| | 1,000,000 | | | Titan Acquisition Ltd.(b) | | TSFR1M + 5.000% | | 10.3260 | | 02/01/29 | | | 1,003,545 | |
| | | | | | | | | | | | | | 1,208,183 | |
| | | | | MEDICAL EQUIPMENT & DEVICES — 0.9% | | | | | | | | | | |
| | 3,562,337 | | | Bausch + Lomb Corporation(b) | | SOFRRATE + 3.250% | | 8.6690 | | 05/05/27 | | | 3,528,939 | |
| | 292,000 | | | Medline Borrower, L.P.(b) | | TSFR1M + 2.250% | | 7.5780 | | 10/23/28 | | | 292,365 | |
| | 348,659 | | | Medline Borrower, L.P.(b) | | TSFR1M + 2.750% | | 8.0790 | | 10/23/28 | | | 349,749 | |
| | | | | | | | | | | | | | 4,171,053 | |
| | | | | OIL & GAS PRODUCERS — 2.0% | | | | | | | | | | |
| | 3,034,088 | | | EPIC Crude Services, L.P.(b) | | TSFR6M + 5.428% | | 10.6050 | | 03/01/26 | | | 3,044,722 | |
| | 446,523 | | | GIP III Stetson I, L.P.(b) | | TSFR1M + 4.350% | | 9.6800 | | 10/05/28 | | | 450,262 | |
| | 191,096 | | | GIP Pilot Acquisition Partners, L.P.(b) | | TSFR1M + 2.500% | | 7.8270 | | 10/04/30 | | | 191,574 | |
| | 3,136,946 | | | Medallion Midland Acquisition, L.P.(b) | | TSFR1M + 3.500% | | 8.8300 | | 10/18/28 | | | 3,156,066 | |
| | 872,958 | | | Parkway Generation, LLC(b) | | TSFR1M + 4.864% | | 10.3410 | | 02/18/29 | | | 873,285 | |
| | 115,967 | | | Parkway Generation, LLC(b) | | TSFR1M + 4.750% | | 10.3410 | | 02/18/29 | | | 116,010 | |
| | 1,514,249 | | | Prairie ECI Acquiror, L.P.(b) | | TSFR1M + 4.750% | | 10.0800 | | 08/01/29 | | | 1,517,096 | |
| | | | | | | | | | | | | | 9,349,015 | |
| | | | | PUBLISHING & BROADCASTING — 1.1% | | | | | | | | | | |
| | 1,658,224 | | | Cengage Learning, Inc.(b) | | TSFR1M + 4.250% | | 9.5730 | | 03/18/31 | | | 1,664,965 | |
| | 569,000 | | | Century DE Buyer, LLC(b) | | TSFR1M + 4.000% | | 9.3300 | | 09/27/30 | | | 570,303 | |
| | 2,946,283 | | | Mav Acquisition Corporation(b) | | TSFR1M + 4.750% | | 10.1920 | | 07/21/28 | | | 2,955,077 | |
| | | | | | | | | | | | | | 5,190,345 | |
| | | | | REAL ESTATE INVESTMENT TRUSTS — 0.1% | | | | | | | | | | |
| | 515,000 | | | Iron Mountain, Inc.(b) | | TSFR1M + 2.250% | | 7.5790 | | 01/31/31 | | | 513,497 | |
| | 117,000 | | | Ovg Business Services, LLC(b) | | TSFR1M + 3.000% | | 8.3270 | | 06/13/31 | | | 116,927 | |
| | | | | | | | | | | | | | 630,424 | |
The accompanying notes are an integral part of these financial statements.
| CATALYST/CIFC SENIOR SECURED INCOME FUND |
| SCHEDULE OF INVESTMENTS (Continued) |
| June 30, 2024 |
| Principal | | | | | | | Coupon Rate | | | | | |
| Amount ($) | | | | | Spread | | (%) | | Maturity | | Fair Value | |
| | | | | TERM LOANS — 85.6% (Continued) | | | | | | | | | | |
| | | | | RENEWABLE ENERGY — 0.4% | | | | | | | | | | |
| | 2,176,437 | | | Granite Acquisition, Inc.(b) | | TSFR1M + 2.865% | | 8.1800 | | 03/17/28 | | | 2,032,117 | |
| | | | | | | | | | | | | | | |
| | | | | RETAIL - CONSUMER STAPLES — 0.1% | | | | | | | | | | |
| | 370,000 | | | BJ’s Wholesale Club, Inc.(b) | | TSFR1M + 2.000% | | 7.3190 | | 02/03/29 | | | 371,273 | |
| | | | | | | | | | | | | | | |
| | | | | RETAIL - DISCRETIONARY — 2.8% | | | | | | | | | | |
| | 793,008 | | | Belron Finance US, LLC(b) | | TSFR1M + 2.350% | | 7.6770 | | 04/13/29 | | | 795,815 | |
| | 195,442 | | | Hertz Corporation (The)(b) | | TSFR1M + 3.250% | | 8.8590 | | 06/14/28 | | | 177,319 | |
| | 37,875 | | | Hertz Corporation (The)(b) | | TSFR1M + 3.250% | | 8.8590 | | 06/14/28 | | | 34,363 | |
| | 785,195 | | | Hertz Corporation (The)(b) | | TSFR1M + 3.865% | | 9.0650 | | 06/30/28 | | | 714,108 | |
| | 752,602 | | | LBM Acquisition, LLC(b) | | TSFR1M + 3.850% | | 7.1210 | | 12/08/27 | | | 752,290 | |
| | 455,000 | | | LBM Acquisition, LLC(b) | | SOFRRATE + 3.750% | | 9.1700 | | 05/30/31 | | | 448,016 | |
| | 679,000 | | | LS Group OpCompany Acquistion, LLC(b) | | TSFR1M + 3.000% | | 8.3210 | | 04/16/31 | | | 680,131 | |
| | 5,073,064 | | | Mavis Tire Express Services Topco Corporation(b) | | TSFR1M + 3.750% | | 9.0770 | | 05/04/28 | | | 5,090,667 | |
| | 1,005,642 | | | Michaels Companies, Inc. (The)(b) | | TSFR3M + 4.250% | | 9.8210 | | 04/09/28 | | | 906,451 | |
| | 1,447,284 | | | Peer Holding III BV(b) | | TSFR1M + 3.250% | | 8.5590 | | 10/19/30 | | | 1,452,262 | |
| | 392,000 | | | Peer Holding III BV(b) | | TSFR1M + 3.000% | | 8.3290 | | 06/23/31 | | | 392,900 | |
| | 535,916 | | | PetSmart, Inc.(b) | | TSFR1M + 3.750% | | 9.1790 | | 01/29/28 | | | 535,021 | |
| | 1,086,000 | | | Staples, Inc.(b) | | TSFR1M + 5.750% | | 11.0670 | | 08/23/29 | | | 998,848 | |
| | | | | | | | | | | | | | 12,978,191 | |
| | | | | SOFTWARE — 14.7% | | | | | | | | | | |
| | 1,747,462 | | | athenahealth, Inc.(b) | | SOFRRATE + 3.750% | | 8.5790 | | 01/27/29 | | | 1,743,915 | |
| | 3,600,777 | | | Azalea Topco, Inc.(b) | | TSFR1M + 3.500% | | 8.8190 | | 04/24/31 | | | 3,602,649 | |
| | 2,425,244 | | | Boxer Parent Company, Inc.(b) | | TSFR1M + 4.250% | | 9.5800 | | 12/08/28 | | | 2,433,247 | |
| | 1,246,859 | | | Bracket Intermediate Holding Corporation(b) | | TSFR1M + 5.100% | | 10.4020 | | 05/03/28 | | | 1,253,225 | |
| | 3,212,938 | | | Central Parent, Inc.(b) | | TSFR1M + 3.250% | | 8.5820 | | 07/06/29 | | | 3,175,796 | |
| | 5,513,776 | | | Cloud Software Group, Inc.(b) | | TSFR1M + 4.000% | | 9.3310 | | 03/29/29 | | | 5,516,201 | |
| | 94,000 | | | Cloud Software Group, Inc.(b) | | TSFR1M + 4.500% | | 9.9290 | | 03/19/31 | | | 94,375 | |
| | 5,380,507 | | | Cotiviti, Inc.(b) | | TSFR1M + 3.250% | | 8.5790 | | 02/24/31 | | | 5,367,055 | |
| | 820,000 | | | DS Admiral Bidco, LLC(b) | | TSFR1M + 4.250% | | 9.5780 | | 06/05/31 | | | 812,825 | |
| | 1,000,000 | | | ECI Macola/Max Holding, LLC(b) | | TSFR1M + 3.750% | | 9.0520 | | 05/28/30 | | | 1,007,295 | |
| | 113,199 | | | Epicor Software Corporation(b) | | TSFR1M + 3.250% | | 8.5710 | | 05/23/31 | | | 113,812 | |
| | 964,801 | | | Epicor Software Corporation(b) | | TSFR1M + 3.250% | | 8.5780 | | 05/23/31 | | | 970,026 | |
The accompanying notes are an integral part of these financial statements.
| CATALYST/CIFC SENIOR SECURED INCOME FUND |
| SCHEDULE OF INVESTMENTS (Continued) |
| June 30, 2024 |
| Principal | | | | | | | Coupon Rate | | | | | |
| Amount ($) | | | | | Spread | | (%) | | Maturity | | Fair Value | |
| | | | | TERM LOANS — 85.6% (Continued) | | | | | | | | | | |
| | | | | SOFTWARE — 14.7% (Continued) | | | | | | | | | | |
| | 1,083,000 | | | Flexera Software, LLC(b) | | TSFR1M + 3.500% | | 8.8170 | | 03/03/28 | | | 1,088,415 | |
| | 5,643,399 | | | Genesys Cloud Services Holdings II, LLC(b) | | TSFR1M + 3.500% | | 8.8290 | | 12/01/27 | | | 5,676,666 | |
| | 695,882 | | | Genesys Cloud Services Holdings II, LLC(b) | | TSFR1M + 4.115% | | 9.1820 | | 12/01/27 | | | 701,463 | |
| | 716,806 | | | HS Purchaser, LLC(b) | | SOFRRATE + 4.000% | | 9.4300 | | 11/30/26 | | | 647,365 | |
| | 1,385,564 | | | Idera, Inc.(b) | | TSFR1M + 3.750% | | 9.2270 | | 03/02/28 | | | 1,377,770 | |
| | 1,473,750 | | | Imprivata, Inc.(b) | | TSFR1M + 3.500% | | 9.0910 | | 12/01/27 | | | 1,482,828 | |
| | 1,768,088 | | | Isolved, Inc.(b) | | TSFR1M + 3.500% | | 8.8150 | | 10/15/30 | | | 1,774,718 | |
| | 85,000 | | | Marcel Bidco, LLC(b) | | TSFR1M + 4.000% | | 9.3170 | | 10/07/30 | | | 85,638 | |
| | 3,497,000 | | | McAfee Corporation(b) | | TSFR1M + 3.250% | | 8.5700 | | 03/01/29 | | | 3,497,822 | |
| | 2,296,000 | | | Mitchell International, Inc.(b) | | TSFR1M + 3.250% | | 8.5720 | | 06/06/31 | | | 2,279,331 | |
| | 1,680,555 | | | Mitchell International, Inc.(b) | | TSFR1M + 5.250% | | 10.5720 | | 06/07/32 | | | 1,679,513 | |
| | 1,084,542 | | | Modena Buyer, LLC(b) | | TSFR1M + 4.500% | | 9.8240 | | 04/21/31 | | | 1,059,972 | |
| | 2,500,000 | | | Mosel Bidco S.E.(b) | | TSFR1M + 4.750% | | 10.0590 | | 08/01/30 | | | 2,515,625 | |
| | 1,250,000 | | | Project Alpha Intermediate Holding, Inc.(b) | | TSFR1M + 3.750% | | 9.0700 | | 10/28/30 | | | 1,255,381 | |
| | 1,235,398 | | | Project Sky Merger Sub, Inc.(b) | | TSFR1M + 6.000% | | 11.4300 | | 08/10/29 | | | 1,228,449 | |
| | 3,365,643 | | | Proofpoint, Inc.(b) | | TSFR1M + 3.000% | | 8.3250 | | 08/31/28 | | | 3,372,593 | |
| | 1,592,000 | | | Quartz Acquireco, LLC(b) | | TSFR1M + 2.750% | | 8.0790 | | 06/28/30 | | | 1,594,985 | |
| | 344,217 | | | Rocket Software, Inc.(b) | | TSFR1M + 4.750% | | 10.0660 | | 11/28/28 | | | 346,078 | |
| | 945,138 | | | SolarWinds Holdings, Inc.(b) | | TSFR1M + 3.250% | | 8.5800 | | 02/05/27 | | | 947,501 | |
| | 123,000 | | | SolarWinds Holdings, Inc.(b) | | TSFR1M + 2.750% | | 8.0890 | | 02/05/30 | | | 123,308 | |
| | 1,023,214 | | | SS&C Technologies, Inc.(b) | | TSFR1M + 2.000% | | 7.3130 | | 05/09/31 | | | 1,025,864 | |
| | 627,346 | | | Surf Holdings, LLC(b) | | TSFR1M + 3.500% | | 8.9330 | | 10/14/26 | | | 628,818 | |
| | 5,329,484 | | | UKG, Inc.(b) | | TSFR1M + 3.600% | | 8.5760 | | 01/31/31 | | | 5,355,678 | |
| | 597,000 | | | VS Buyer, LLC(b) | | TSFR1M + 3.250% | | 8.5710 | | 04/04/31 | | | 599,239 | |
| | 113,000 | | | Webpros Investments Sarl(b) | | TSFR1M + 4.000% | | 9.3300 | | 03/19/31 | | | 114,059 | |
| | 838,650 | | | Weld North Education, LLC(b) | | TSFR1M + 3.615% | | 8.8300 | | 12/17/29 | | | 839,564 | |
| | 1,252,037 | | | Zelis Payments Buyer, Inc.(b) | | TSFR1M + 2.750% | | 8.0770 | | 09/28/29 | | | 1,253,182 | |
| | | | | | | | | | | | | | 68,642,246 | |
| | | | | SPECIALTY FINANCE — 1.0% | | | | | | | | | | |
| | 271,625 | | | Apex Group Treasury, LLC(b) | | TSFR1M + 5.000% | | 10.3170 | | 07/27/28 | | | 273,322 | |
| | 1,243,606 | | | Castlelake Aviation One DAC(b) | | TSFR3M + 2.500% | | 7.8290 | | 10/22/26 | | | 1,247,188 | |
| | 230,840 | | | Citco Funding, LLC(b) | | TSFR1M + 2.750% | | 8.0940 | | 04/27/28 | | | 231,898 | |
| | 317,000 | | | Inception Finco Sarl(b) | | TSFR1M + 4.500% | | 9.8210 | | 03/17/31 | | | 319,328 | |
The accompanying notes are an integral part of these financial statements.
| CATALYST/CIFC SENIOR SECURED INCOME FUND |
| SCHEDULE OF INVESTMENTS (Continued) |
| June 30, 2024 |
| Principal | | | | | | | Coupon Rate | | | | | |
| Amount ($) | | | | | Spread | | (%) | | Maturity | | Fair Value | |
| | | | | TERM LOANS — 85.6% (Continued) | | | | | | | | | | |
| | | | | SPECIALTY FINANCE — 1.0% (Continued) | | | | | | | | | | |
| | 2,425,000 | | | Kestra Advisor Services Holdings A, Inc.(b) | | TSFR1M + 4.000% | | 9.3190 | | 03/19/31 | | | 2,436,823 | |
| | | | | | | | | | | | | | 4,508,559 | |
| | | | | TECHNOLOGY HARDWARE — 0.0%(c) | | | | | | | | | | |
| | 135,000 | | | Celestica, Inc.(b) | | TSFR1M + 1.850% | | 7.0710 | | 05/23/31 | | | 135,000 | |
| | | | | | | | | | | | | | | |
| | | | | TECHNOLOGY SERVICES — 4.1% | | | | | | | | | | |
| | 2,910,110 | | | Access CIG, LLC(b) | | TSFR1M + 5.000% | | 10.3300 | | 08/15/28 | | | 2,932,401 | |
| | 335,000 | | | Ahead DB Holdings, LLC(b) | | TSFR1M + 4.250% | | 9.5590 | | 01/24/31 | | | 336,519 | |
| | 531,966 | | | Amentum Government Services Holdings, LLC(b) | | TSFR1M + 8.000% | | 12.9150 | | 02/15/30 | | | 533,296 | |
| | 3,151,250 | | | Blackhawk Network Holdings, Inc.(b) | | TSFR1M + 5.000% | | 10.3290 | | 02/26/29 | | | 3,162,091 | |
| | 3,251,284 | | | Fortress Intermediate 3, Inc.(b) | | TSFR1M + 3.750% | | 9.0630 | | 05/09/31 | | | 3,259,413 | |
| | 1,529,713 | | | ION Trading Finance Ltd.(b) | | TSFR1M + 4.000% | | 9.3460 | | 04/03/28 | | | 1,530,027 | |
| | 3,056,946 | | | Netsmart, Inc.(b) | | TSFR1M + 4.000% | | 9.1950 | | 10/01/27 | | | 3,068,761 | |
| | 3,822,367 | | | Peraton Corporation(b) | | TSFR1M + 3.750% | | 9.1790 | | 02/24/28 | | | 3,827,432 | |
| | 128,919 | | | Peraton Corporation(b) | | TSFR3M + 7.750% | | 13.1760 | | 02/01/29 | | | 129,697 | |
| | 399,500 | | | Sabre GLBL, Inc.(b) | | TSFR1M + 5.000% | | 10.4300 | | 06/30/28 | | | 367,604 | |
| | | | | | | | | | | | | | 19,147,241 | |
| | | | | TELECOMMUNICATIONS — 0.8% | | | | | | | | | | |
| | 493,750 | | | Altice France S.A.(b) | | TSFR1M + 4.000% | | 9.5690 | | 01/31/26 | | | 382,553 | |
| | 2,398,228 | | | CCI Buyer, Inc.(b) | | SOFRRATE + 4.000% | | 9.3020 | | 12/12/27 | | | 2,403,660 | |
| | 730,000 | | | Crown Subsea Communications Holding, Inc.(b) | | TSFR1M + 4.750% | | 10.0790 | | 01/27/31 | | | 732,887 | |
| | 98,000 | | | Lorca Co-Borrower, LLC(b) | | TSFR1M + 3.500% | | 8.8170 | | 04/17/31 | | | 98,368 | |
| | 1,577,023 | | | Xplornet Communications, Inc.(b) | | TSFR1M + 4.000% | | 9.5710 | | 09/30/28 | | | 271,492 | |
| | | | | | | | | | | | | | 3,888,960 | |
| | | | | TRANSPORTATION & LOGISTICS — 4.5% | | | | | | | | | | |
| | 2,366,678 | | | AAdvantage Loyalty IP Ltd.(b) | | TSFR1M + 4.750% | | 10.3360 | | 03/10/28 | | | 2,448,033 | |
| | 1,146,513 | | | Air Canada(b) | | TSFR1M + 2.500% | | 7.8470 | | 03/14/31 | | | 1,149,557 | |
| | 500,889 | | | American Airlines, Inc.(b) | | TSFR1M + 2.750% | | 8.5970 | | 02/09/28 | | | 500,403 | |
| | 1,403,955 | | | American Airlines, Inc.(b) | | TSFR1M + 3.500% | | 7.7750 | | 05/29/29 | | | 1,403,429 | |
| | 2,059,751 | | | Genesee & Wyoming, Inc.(b) | | TSFR1M + 2.000% | | 7.3010 | | 04/07/31 | | | 2,059,946 | |
| | 1,200,086 | | | Kenan Advantage Group, Inc. (The)(b) | | TSFR1M + 3.750% | | 9.0790 | | 01/19/29 | | | 1,207,587 | |
| | 3,132,413 | | | KKR Apple Bidco, LLC(b) | | TSFR1M + 4.000% | | 8.8300 | | 09/23/28 | | | 3,143,783 | |
The accompanying notes are an integral part of these financial statements.
| CATALYST/CIFC SENIOR SECURED INCOME FUND |
| SCHEDULE OF INVESTMENTS (Continued) |
| June 30, 2024 |
| Principal | | | | | | | Coupon Rate | | | | | |
| Amount ($) | | | | | Spread | | (%) | | Maturity | | Fair Value | |
| | | | | TERM LOANS — 85.6% (Continued) | | | | | | | | | | |
| | | | | TRANSPORTATION & LOGISTICS — 4.5% (Continued) | | | | | | | | | | |
| | 2,873,231 | | | Patriot Rail Company, LLC(b) | | TSFR3M + 4.262% | | 9.5710 | | 10/18/26 | | | 2,875,027 | |
| | 3,704,000 | | | Savage Enterprises, LLC(b) | | TSFR1M + 3.365% | | 8.6920 | | 09/17/28 | | | 3,717,037 | |
| | 1,968,722 | | | United Airlines, Inc.(b) | | TSFR1M + 2.750% | | 8.0940 | | 02/17/31 | | | 1,976,105 | |
| | 402,177 | | | WestJet Airlines Ltd.(b) | | TSFR3M + 3.000% | | 8.4280 | | 10/08/26 | | | 403,854 | |
| | | | | | | | | | | | | | 20,884,761 | |
| | | | | WHOLESALE - CONSUMER STAPLES — 0.2% | | | | | | | | | | |
| | 1,051,431 | | | Quirch Foods Holdings, LLC(b) | | SOFRRATE + 4.500% | | 10.3240 | | 10/27/27 | | | 1,025,146 | |
| | | | | | | | | | | | | | | |
| | | | | WHOLESALE - DISCRETIONARY — 0.1% | | | | | | | | | | |
| | 293,000 | | | Dealer Tire Financial, LLC(b) | | TSFR1M + 3.500% | | 8.8390 | | 06/25/31 | | | 293,000 | |
| | | | | | | | | | | | | | | |
| | | | | TOTAL TERM LOANS (Cost $400,071,423) | | | | | | | | | 400,167,760 | |
| | | | | | | | | | | | | | | |
| Shares | | | | | | | | | | | | | |
| | | | | SHORT-TERM INVESTMENTS — 12.3% | | | | | | | | | | |
| | | | | MONEY MARKET FUNDS - 12.3% | | | | | | | | | | |
| | 57,404,245 | | | First American Treasury Obligations Fund, Class X, 5.21% (d) (Cost $57,404,245) | | | 57,404,245 | |
| | | | | | | | | | | | | | | |
| | | | | TOTAL INVESTMENTS - 110.6% (Cost $515,982,697) | | | $ | 516,893,634 | |
| | | | | LIABILITIES IN EXCESS OF OTHER ASSETS - (10.6)% | | | | | (49,435,943 | ) |
| | | | | NET ASSETS - 100.0% | | | | | | | | $ | 467,457,691 | |
| ETF | - Exchange-Traded Fund |
| | |
| LLP | - Limited Liability Partnership |
| | |
| LTD | - Limited Company |
| | |
| SPDR | - Standard & Poor’s Depositary Receipt |
| | |
| SOFRRATE | United States SOFR Secured Overnight Financing Rate |
| | |
| TSFR1M | Secured Overnight Financing Rate 1 Month |
| | |
| TSFR3M | Secured Overnight Financing Rate 3 Month |
| | |
| TSFR6M | Secured Overnight Financing Rate 6 Month |
| (a) | Security exempt from registration under Rule 144A or Section 4(2) of the Securities Act of 1933. The security may be resold in transactions exempt from registration, normally to qualified institutional buyers. As of June 30, 2024 the total market value of 144A securities is 44,959,762 or 9.6% of net assets. |
| (b) | Variable rate security; the rate shown represents the rate on June 30, 2024. |
| (c) | Percentage rounds to less than 0.1%. |
| (d) | Rate disclosed is the seven day effective yield as of June 30, 2024. |
The accompanying notes are an integral part of these financial statements.
| CATALYST/SMH HIGH INCOME FUND |
| SCHEDULE OF INVESTMENTS |
| June 30, 2024 |
| | | | | | Coupon Rate | | | | | |
| Shares | | | | | (%) | | Maturity | | Fair Value | |
| | | | | PREFERRED STOCKS — 0.4% | | | | | | | | |
| | | | | LEISURE FACILITIES & SERVICES — 0.4% | | | | | | | | |
| | 4,371 | | | FAT Brands, Inc. | | 8.2500 | | | | $ | 60,669 | |
| | | | | | | | | | | | | |
| | | | | TOTAL PREFERRED STOCKS (Cost $102,762) | | | | | | | 60,669 | |
| | | | | | | | | | | | | |
| Principal | | | | | | | | | | | |
| Amount ($) | | | | | | | | | | | |
| | | | | CONVERTIBLE BONDS — 7.1% | | | | | | | | |
| | | | | ASSET MANAGEMENT — 4.0% | | | | | | | | |
| | 500,000 | | | WisdomTree, Inc. | | 5.7500 | | 08/15/28 | | | 614,487 | |
| | | | | | | | | | | | | |
| | | | | SPECIALTY FINANCE — 3.1% | | | | | | | | |
| | 584,000 | | | Upstart Holdings, Inc. | | 0.2500 | | 08/15/26 | | | 465,244 | |
| | | | | | | | | | | | | |
| | | | | TOTAL CONVERTIBLE BONDS (Cost $1,055,240) | | | | | | | 1,079,731 | |
| | | | | | | | | | | | | |
| | | | | CORPORATE BONDS — 82.9% | | | | | | | | |
| | | | | APPAREL & TEXTILE PRODUCTS — 1.9% | | | | | | | | |
| | 300,000 | | | Under Armour, Inc. | | 3.2500 | | 06/15/26 | | | 285,107 | |
| | | | | | | | | | | | | |
| | | | | ASSET MANAGEMENT — 5.6% | | | | | | | | |
| | 540,000 | | | BlackRock TCP Capital Corporation | | 6.9500 | | 05/30/29 | | | 527,498 | |
| | 350,000 | | | Icahn Enterprises, L.P. / Icahn Enterprises | | 5.2500 | | 05/15/27 | | | 328,878 | |
| | | | | | | | | | | | 856,376 | |
| | | | | AUTOMOTIVE — 4.5% | | | | | | | | |
| | 741,000 | | | American Axle & Manufacturing, Inc.(a) | | 5.0000 | | 10/01/29 | | | 680,235 | |
| | | | | | | | | | | | | |
| | | | | CHEMICALS — 3.8% | | | | | | | | |
| | 607,000 | | | Rayonier AM Products, Inc.(b) | | 7.6250 | | 01/15/26 | | | 569,718 | |
| | | | | | | | | | | | | |
| | | | | CONSUMER SERVICES — 1.9% | | | | | | | | |
| | 300,000 | | | Upbound Group, Inc.(b) | | 6.3750 | | 02/15/29 | | | 288,048 | |
The accompanying notes are an integral part of these financial statements.
| CATALYST/SMH HIGH INCOME FUND |
| SCHEDULE OF INVESTMENTS (Continued) |
| June 30, 2024 |
| Principal | | | | | Coupon Rate | | | | | |
| Amount ($) | | | | | (%) | | Maturity | | Fair Value | |
| | | | | CORPORATE BONDS — 82.9% (Continued) | | | | | | | | |
| | | | | HOME CONSTRUCTION — 3.8% | | | | | | | | |
| | 582,000 | | | Beazer Homes USA, Inc. | | 5.8750 | | 10/15/27 | | $ | 575,372 | |
| | | | | | | | | | | | | |
| | | | | HOUSEHOLD PRODUCTS — 0.9% | | | | | | | | |
| | 150,000 | | | Central Garden & Pet Company | | 4.1250 | | 10/15/30 | | | 133,870 | |
| | | | | | | | | | | | | |
| | | | | INSTITUTIONAL FINANCIAL SERVICES — 1.6% | | | | | | | | |
| | 300,000 | | | Coinbase Global, Inc.(b) | | 3.6250 | | 10/01/31 | | | 240,857 | |
| | | | | | | | | | | | | |
| | | | | LEISURE FACILITIES & SERVICES — 7.0% | | | | | | | | |
| | 500,000 | | | Full House Resorts, Inc.(a),(b) | | 8.2500 | | 02/15/28 | | | 481,097 | |
| | 550,000 | | | Odeon Finco PLC(b) | | 12.7500 | | 11/01/27 | | | 576,894 | |
| | | | | | | | | | | | 1,057,991 | |
| | | | | MACHINERY — 3.7% | | | | | | | | |
| | 578,000 | | | Titan International, Inc. | | 7.0000 | | 04/30/28 | | | 556,333 | |
| | | | | | | | | | | | | |
| | | | | METALS & MINING — 7.3% | | | | | | | | |
| | 865,000 | | | Coeur Mining, Inc.(b) | | 5.1250 | | 02/15/29 | | | 811,803 | |
| | 300,000 | | | Hecla Mining Company | | 7.2500 | | 02/15/28 | | | 300,504 | |
| | | | | | | | | | | | 1,112,307 | |
| | | | | OIL & GAS PRODUCERS — 1.2% | | | | | | | | |
| | 175,000 | | | Occidental Petroleum Corporation(a) | | 6.6000 | | 03/15/46 | | | 182,693 | |
| | | | | | | | | | | | | |
| | | | | OIL & GAS SERVICES & EQUIPMENT — 3.9% | | | | | | | | |
| | 200,000 | | | Nine Energy Service, Inc. | | 13.0000 | | 02/01/28 | | | 165,147 | |
| | 517,000 | | | Transocean, Inc.(a) | | 6.8000 | | 03/15/38 | | | 428,123 | |
| | | | | | | | | | | | 593,270 | |
| | | | | REAL ESTATE INVESTMENT TRUSTS — 11.9% | | | | | | | | |
| | 400,000 | | | CoreCivic, Inc.(a) | | 4.7500 | | 10/15/27 | | | 376,656 | |
| | 425,000 | | | EPR Properties | | 3.7500 | | 08/15/29 | | | 378,970 | |
| | 651,000 | | | MPT Operating Partnership, L.P. / MPT Finance(a) | | 5.0000 | | 10/15/27 | | | 537,770 | |
| | 653,535 | | | Office Properties Income Trust(a),(b) | | 9.0000 | | 09/30/29 | | | 514,659 | |
| | | | | | | | | | | | 1,808,055 | |
| | | | | REAL ESTATE OWNERS & DEVELOPERS — 4.8% | | | | | | | | |
| | 840,000 | | | Howard Hughes Corporation (The)(b) | | 4.3750 | | 02/01/31 | | | 724,302 | |
The accompanying notes are an integral part of these financial statements.
| CATALYST/SMH HIGH INCOME FUND |
| SCHEDULE OF INVESTMENTS (Continued) |
| June 30, 2024 |
Principal
Amount ($) | | | | | Coupon Rate
(%) | | Maturity | | Fair Value | |
| | | | | CORPORATE BONDS — 82.9% (Continued) | | | | | | | | |
| | | | | RETAIL - DISCRETIONARY — 11.1% | | | | | | | | |
| | 1,065,000 | | | Bed Bath & Beyond, Inc.(c) | | 5.1650 | | 08/01/44 | | $ | 10,023 | |
| | 400,000 | | | Carvana Company(b) | | 14.0000 | | 06/01/31 | | | 450,228 | |
| | 783,000 | | | Kohl’s Corporation | | 5.5500 | | 07/17/45 | | | 535,740 | |
| | 825,000 | | | Nordstrom, Inc.(a) | | 5.0000 | | 01/15/44 | | | 667,335 | |
| | | | | | | | | | | | 1,663,326 | |
| | | | | SPECIALTY FINANCE — 3.7% | | | | | | | | |
| | 557,000 | | | Enova International, Inc.(b) | | 8.5000 | | 09/15/25 | | | 558,174 | |
| | | | | | | | | | | | | |
| | | | | STEEL — 4.3% | | | | | | | | |
| | 653,000 | | | United States Steel Corporation | | 6.6500 | | 06/01/37 | | | 650,997 | |
| | | | | | | | | | | | | |
| | | | | TECHNOLOGY HARDWARE — 0.0% | | | | | | | | |
| | 8,669,000 | | | Energy Conversion Devices, Inc.(b)(c)(e)(f) | | 0.0000 | | 12/15/49 | | | — | |
| | | | | | | | | | | | | |
| | | | | TOTAL CORPORATE BONDS (Cost $16,219,132) | | | | | | | 12,537,031 | |
| | | | | | | | | | | | | |
| Shares | | | | | | | | | | | |
| | | | | SHORT-TERM INVESTMENTS — 34.8% | | | | | | | | |
| | | | | COLLATERAL FOR SECURITIES LOANED - 27.3% | | | | | | | | |
| | 4,123,185 | | | Mount Vernon Liquid Assets Portfolio, , 5.46%(d)(g) (Cost $4,123,185) | | | | | | | 4,123,185 | |
| | | | | | | | | | | | | |
| | | | | MONEY MARKET FUNDS - 7.5% | | | | | | | | |
| | 1,141,700 | | | First American Treasury Obligations Fund, Class X, 5.21%(d) (Cost $1,141,700) | | | | | | | 1,141,700 | |
| | | | | | | | | | | | | |
| | | | | TOTAL SHORT-TERM INVESTMENTS (Cost $5,264,885) | | | | | | | 5,264,885 | |
| | | | | | | | | | | | | |
| | | | | TOTAL INVESTMENTS - 125.2% (Cost $22,642,019) | | | | | | $ | 18,942,316 | |
| | | | | LIABILITIES IN EXCESS OF OTHER ASSETS - (25.2)% | | | | | | | (3,810,709 | ) |
| | | | | NET ASSETS - 100.0% | | | | | | $ | 15,131,607 | |
| PLC | - Public Limited Company |
| (a) | All or a portion for these securities are on loan. Total loaned securities had a value of $4,025,898 at June 30, 2024. |
| (b) | Security exempt from registration under Rule 144A or Section 4(2) of the Securities Act of 1933. The security may be resold in transactions exempt from registration, normally to qualified institutional buyers. As of June 30, 2024 the total market value of 144A securities is 5,215,780 or 34.5% of net assets. |
| (c) | Represents issuer in default on interest payments; non-income producing security. |
| (d) | Rate disclosed is the seven day effective yield as of June 30, 2024. |
| (e) | Illiquid security. The total fair value of these securities as of June 30, 2024 was $0, representing 0% of net assets. |
| (f) | The value of this security has been determined using significant unobservable inputs in good faith under policies of the Board of Trustees. The total of these securities is $0 or 0.0% of net assets. |
| (g) | Security was purchased with cash received as collateral for securities on loan at June 30, 2024. Total collateral had a value of $4,123,185 at June 30, 2024. |
The accompanying notes are an integral part of these financial statements.
| CATALYST/SMH TOTAL RETURN INCOME FUND |
| SCHEDULE OF INVESTMENTS |
| June 30, 2024 |
| Shares | | | | | Fair Value | |
| | | | | COMMON STOCKS — 40.0% | | | | |
| | | | | ASSET MANAGEMENT - 15.1% | | | | |
| | 3,300 | | | Apollo Global Management, Inc. | | $ | 389,631 | |
| | 6,000 | | | Carlyle Group, Inc. (The) | | | 240,900 | |
| | 35,292 | | | Compass Diversified Holdings(a) | | | 772,541 | |
| | 99,131 | | | PennantPark Investment Corporation(a) | | | 748,439 | |
| | 42,466 | | | SuRo Capital Corporation(b) | | | 170,289 | |
| | 18,137 | | | Trinity Capital, Inc. | | | 256,457 | |
| | 49,500 | | | US Global Investors, Inc., Class A | | | 129,195 | |
| | | | | | | | 2,707,452 | |
| | | | | AUTOMOTIVE - 0.4% | | | | |
| | 6,200 | | | Ford Motor Company | | | 77,748 | |
| | | | | | | | | |
| | | | | BUSINESS DEVELOPMENT COMPANIES - 6.4% | | | | |
| | 12,128 | | | Main Street Capital Corporation(a) | | | 612,343 | |
| | 95,140 | | | Prospect Capital Corporation(a) | | | 526,124 | |
| | | | | | | | 1,138,467 | |
| | | | | DIVERSIFIED INDUSTRIALS - 1.4% | | | | |
| | 2,393 | | | 3M Company | | | 244,541 | |
| | | | | | | | | |
| | | | | ELECTRIC UTILITIES - 0.6% | | | | |
| | 1,442 | | | NextEra Energy, Inc. | | | 102,108 | |
| | | | | | | | | |
| | | | | FOOD - 1.0% | | | | |
| | 5,284 | | | Kraft Heinz Company (The) | | | 170,250 | |
| | | | | | | | | |
| | | | | GAMING REIT - 2.3% | | | | |
| | 14,475 | | | VICI Properties, Inc. | | | 414,564 | |
| | | | | | | | | |
| | | | | INDUSTRIAL REIT - 1.5% | | | | |
| | 2,390 | | | Innovative Industrial Properties, Inc.(a) | | | 261,036 | |
| | | | | | | | | |
| | | | | MEDICAL EQUIPMENT & DEVICES - 0.2% | | | | |
| | 598 | | | Solventum Corporation(a),(b) | | | 31,622 | |
The accompanying notes are an integral part of these financial statements.
| CATALYST/SMH TOTAL RETURN INCOME FUND |
| SCHEDULE OF INVESTMENTS (Continued) |
| June 30, 2024 |
| Shares | | | | | | | | | Fair Value | |
| | | | | COMMON STOCKS — 40.0% (Continued) | | | | | | | | |
| | | | | MIXED ALLOCATION - 0.9% | | | | | | | | |
| | 30,120 | | | NexPoint Diversified Real Estate Trust | | | | | | $ | 166,566 | |
| | | | | | | | | | | | | |
| | | | | MORTGAGE FINANCE - 1.5% | | | | | | | | |
| | 24,106 | | | New Residential Investment Corporation | | | | | | | 262,996 | |
| | | | | | | | | | | | | |
| | | | | OIL & GAS PRODUCERS - 2.0% | | | | | | | | |
| | 10,028 | | | Enbridge, Inc. | | | | | | | 356,897 | |
| | | | | | | | | | | | | |
| | | | | RETAIL REIT - 1.5% | | | | | | | | |
| | 5,000 | | | Realty Income Corporation(a) | | | | | | | 264,100 | |
| | | | | | | | | | | | | |
| | | | | TECHNOLOGY HARDWARE - 0.8% | | | | | | | | |
| | 697 | | | Apple, Inc. | | | | | | | 146,802 | |
| | | | | | | | | | | | | |
| | | | | TECHNOLOGY SERVICES - 0.1% | | | | | | | | |
| | 432 | | | Kyndryl Holdings, Inc.(b) | | | | | | | 11,366 | |
| | | | | | | | | | | | | |
| | | | | TELECOMMUNICATIONS - 2.5% | | | | | | | | |
| | 14,000 | | | AT&T, Inc. | | | | | | | 267,540 | |
| | 4,561 | | | Verizon Communications, Inc. | | | | | | | 188,096 | |
| | | | | | | | | | | | 455,636 | |
| | | | | TRANSPORT OPERATIONS & SERVICES - 1.8% | | | | | | | | |
| | 26,000 | | | AFC Gamma, Inc. | | | | | | | 317,200 | |
| | | | | | | | | | | | | |
| | | | | TOTAL COMMON STOCKS (Cost $8,662,192) | | | | | | | 7,129,351 | |
| | | | | | | | | | | | | |
| Principal | | | | | Coupon Rate | | | | | | |
| Amount ($) | | | | | (%) | | Maturity | | | | |
| | | | | CONVERTIBLE BONDS — 6.9% | | | | | | | | |
| | | | | ASSET MANAGEMENT — 3.0% | | | | | | | | |
| | 435,000 | | | WisdomTree, Inc. | | 5.7500 | | 08/15/28 | | | 534,604 | |
| | | | | | | | | | | | | |
| | | | | SPECIALTY FINANCE — 3.9% | | | | | | | | |
| | 717,000 | | | EZCORP, Inc. | | 2.3750 | | 05/01/25 | | | 698,924 | |
| | | | | | | | | | | | | |
| | | | | TOTAL CONVERTIBLE BONDS (Cost $1,240,592) | | | | | | | 1,233,528 | |
The accompanying notes are an integral part of these financial statements.
| CATALYST/SMH TOTAL RETURN INCOME FUND |
| SCHEDULE OF INVESTMENTS (Continued) |
| June 30, 2024 |
| Principal | | | | | Coupon Rate | | | | | |
| Amount ($) | | | | | (%) | | Maturity | | Fair Value | |
| | | | | CORPORATE BONDS — 50.7% | | | | | | | | |
| | | | | ASSET MANAGEMENT — 1.8% | | | | | | | | |
| | 350,000 | | | Icahn Enterprises, L.P. / Icahn Enterprises | | 5.2500 | | 05/15/27 | | $ | 328,878 | |
| | | | | | | | | | | | | |
| | | | | AUTOMOTIVE — 3.3% | | | | | | | | |
| | 639,000 | | | American Axle & Manufacturing, Inc.(a) | | 5.0000 | | 10/01/29 | | | 586,599 | |
| | | | | | | | | | | | | |
| | | | | CHEMICALS — 2.7% | | | | | | | | |
| | 520,000 | | | Rayonier AM Products, Inc.(c) | | 7.6250 | | 01/15/26 | | | 488,062 | |
| | | | | | | | | | | | | |
| | | | | HOME CONSTRUCTION — 3.5% | | | | | | | | |
| | 635,000 | | | Beazer Homes USA, Inc. | | 5.8750 | | 10/15/27 | | | 627,769 | |
| | | | | | | | | | | | | |
| | | | | LEISURE FACILITIES & SERVICES — 5.8% | | | | | | | | |
| | 500,000 | | | Full House Resorts, Inc.(a),(c) | | 8.2500 | | 02/15/28 | | | 481,097 | |
| | 515,000 | | | Odeon Finco PLC(c) | | 12.7500 | | 11/01/27 | | | 540,181 | |
| | | | | | | | | | | | 1,021,278 | |
| | | | | MACHINERY — 3.7% | | | | | | | | |
| | 687,000 | | | Titan International, Inc. | | 7.0000 | | 04/30/28 | | | 661,247 | |
| | | | | | | | | | | | | |
| | | | | METALS & MINING — 2.8% | | | | | | | | |
| | 534,000 | | | Coeur Mining, Inc.(c) | | 5.1250 | | 02/15/29 | | | 501,159 | |
| | | | | | | | | | | | | |
| | | | | OIL & GAS PRODUCERS — 2.0% | | | | | | | | |
| | 350,000 | | | Occidental Petroleum Corporation(a) | | 6.6000 | | 03/15/46 | | | 365,387 | |
| | | | | | | | | | | | | |
| | | | | OIL & GAS SERVICES & EQUIPMENT — 5.6% | | | | | | | | |
| | 250,000 | | | Nine Energy Service, Inc. | | 13.0000 | | 02/01/28 | | | 206,434 | |
| | 953,000 | | | Transocean, Inc.(a) | | 6.8000 | | 03/15/38 | | | 789,170 | |
| | | | | | | | | | | | 995,604 | |
The accompanying notes are an integral part of these financial statements.
| CATALYST/SMH TOTAL RETURN INCOME FUND |
| SCHEDULE OF INVESTMENTS (Continued) |
| June 30, 2024 |
| Principal | | | | | Coupon Rate | | | | | |
| Amount ($) | | | | | (%) | | Maturity | | Fair Value | |
| | | | | CORPORATE BONDS — 50.7% (Continued) | | | | | | | | |
| | | | | REAL ESTATE INVESTMENT TRUSTS — 8.1% | | | | | | | | |
| | 778,000 | | | CoreCivic, Inc.(a) | | 4.7500 | | 10/15/27 | | $ | 732,597 | |
| | 537,000 | | | MPT Operating Partnership, L.P. / MPT Finance(a) | | 5.0000 | | 10/15/27 | | | 443,598 | |
| | 346,080 | | | Office Properties Income Trust(a),(c) | | 9.0000 | | 09/30/29 | | | 272,538 | |
| | | | | | | | | | | | 1,448,733 | |
| | | | | REAL ESTATE OWNERS & DEVELOPERS — 2.2% | | | | | | | | |
| | 445,000 | | | Howard Hughes Corporation (The)(c) | | 4.3750 | | 02/01/31 | | | 383,708 | |
| | | | | | | | | | | | | |
| | | | | RETAIL - DISCRETIONARY — 4.6% | | | | | | | | |
| | 373,000 | | | Bed Bath & Beyond, Inc.(d) | | 5.1650 | | 08/01/44 | | | 3,510 | |
| | 400,000 | | | Carvana Company(c) | | 14.0000 | | 06/01/31 | | | 450,228 | |
| | 528,000 | | | Kohl’s Corporation | | 5.5500 | | 07/17/45 | | | 361,265 | |
| | | | | | | | | | | | 815,003 | |
| | | | | SPECIALTY FINANCE — 3.7% | | | | | | | | |
| | 647,000 | | | Enova International, Inc.(c) | | 8.5000 | | 09/15/25 | | | 648,363 | |
| | | | | | | | | | | | | |
| | | | | TECHNOLOGY HARDWARE — 0.0% | | | | | | | | |
| | 5,543,000 | | | ENERGY CONVERSION DEVICES INC(c)(d)(f)(g) | | 0.0000 | | 12/15/49 | | | — | |
| | | | | | | | | | | | | |
| | | | | TECHNOLOGY SERVICES — 0.9% | | | | | | | | |
| | 200,000 | | | Kyndryl Holdings, Inc. | | 3.1500 | | 10/15/31 | | | 167,832 | |
| | | | | | | | | | | | | |
| | | | | TOTAL CORPORATE BONDS (Cost $10,842,047) | | | | | | | 9,039,622 | |
| | | | | | | | | | | | | |
| Shares | | | | | | | | | | | |
| | | | | SHORT-TERM INVESTMENTS — 36.3% | | | | | | | | |
| | | | | COLLATERAL FOR SECURITIES LOANED - 35.4% | | | | | | | | |
| | 6,310,735 | | | Mount Vernon Liquid Assets Portfolio, , 5.46%(e)(h) (Cost $6,310,735) | | | | | | | 6,310,735 | |
| | | | | | | | | | | | | |
| | | | | MONEY MARKET FUNDS - 0.9% | | | | | | | | |
| | 153,455 | | | First American Treasury Obligations Fund, Class X, 5.21%(e)(Cost $153,455) | | | | | | | 153,455 | |
| | | | | | | | | | | | | |
| | | | | TOTAL SHORT-TERM INVESTMENTS (Cost $6,464,190) | | | | | | | 6,464,190 | |
The accompanying notes are an integral part of these financial statements.
| CATALYST/SMH TOTAL RETURN INCOME FUND |
| SCHEDULE OF INVESTMENTS (Continued) |
| June 30, 2024 |
| | | | | | Fair Value | |
| | | | | TOTAL INVESTMENTS - 133.9% (Cost $27,209,021) | | $ | 23,866,691 | |
| | | | | LIABILITIES IN EXCESS OF OTHER ASSETS - (33.9)% | | | (6,037,421 | ) |
| | | | | NET ASSETS - 100.0% | | $ | 17,829,270 | |
| PLC | - Public Limited Company |
| (a) | All or a portion for these securities are on loan. Total loaned securities had a value of $6,169,232 at June 30, 2024. |
| (b) | Non-income producing security. |
| (c) | Security exempt from registration under Rule 144A or Section 4(2) of the Securities Act of 1933. The security may be resold in transactions exempt from registration, normally to qualified institutional buyers. As of June 30, 2024 the total market value of 144A securities is 3,765,336 or 21.1% of net assets. |
| (d) | Represents issuer in default on interest payments; non-income producing security. |
| (e) | Rate disclosed is the seven day effective yield as of June 30, 2024. |
| (f) | Illiquid security. The total fair value of these securities as of June 30, 2024 was $0, representing 0% of net assets. |
| (g) | The value of this security has been determined using significant unobservable inputs in good faith under policies of the Board of Trustees. The total of these securities is $0 or 0.0% of net assets. |
| (h) | Security was purchased with cash received as collateral for securities on loan at June 30, 2024. Total collateral had a value of $6,310,735 at June 30, 2024. |
The accompanying notes are an integral part of these financial statements.
| CATALYST FUNDS |
| Statements of Assets and Liabilities |
| June 30, 2024 |
| | | | | | | | | Catalyst/MAP | | | Catalyst/CIFC | | | | | | Catalyst/SMH | |
| | | Catalyst Insider | | | Catalyst Enhanced | | | Global Balanced | | | Senior Secured | | | Catalyst/SMH | | | Total Return | |
| | | Income Fund | | | Income Strategy Fund | | | Fund | | | Income Fund | | | High Income Fund | | | Income Fund | |
| ASSETS: | | | | | | | | | | | | | | | | | | | | | | | | |
| Investment in Securities, at Cost | | $ | 55,074,524 | | | $ | 276,470,981 | | | $ | 12,744,986 | | | $ | 515,982,697 | | | $ | 22,642,019 | | | $ | 27,209,021 | |
| Investment in Securities, at Value | | $ | 54,560,570 | | | $ | 218,978,925 | | | $ | 14,514,961 | | | $ | 516,893,634 | | | $ | 18,942,316 | | | $ | 23,866,691 | |
| Receivable for Fund shares sold | | | 54,694 | | | | 128,736 | | | | 750 | | | | 784,829 | | | | 42,096 | | | | — | |
| Receivable for securities sold | | | 299,625 | | | | — | | | | — | | | | 17,438,459 | | | | — | | | | — | |
| Dividends and interest receivable | | | 879,185 | | | | 987,348 | | | | 82,621 | | | | 4,435,306 | | | | 271,154 | | | | 264,363 | |
| Due from Manager | | | — | | | | — | | | | 498 | | | | — | | | | — | | | | — | |
| Prepaid expenses and other assets | | | 29,810 | | | | 38,865 | | | | 26,830 | | | | 71,032 | | | | 33,148 | | | | 29,379 | |
| Total Assets | | | 55,823,884 | | | | 220,133,874 | | | | 14,625,660 | | | | 539,623,260 | | | | 19,288,714 | | | | 24,160,433 | |
| | | | | | | | | | | | | | | | | | | | | | | | | |
| LIABILITIES: | | | | | | | | | | | | | | | | | | | | | | | | |
| Options written (premiums received $0, $0, $4,933, $0, $0, $0) | | | — | | | | — | | | | 2,450 | | | | — | | | | — | | | | — | |
| Payable for securities purchased | | | — | | | | — | | | | — | | | | 68,774,169 | | | | — | | | | — | |
| Investment advisory fees payable | | | 21,236 | | | | 250,785 | | | | — | | | | 248,045 | | | | 3,014 | | | | 749 | |
| Distribution Payable | | | 43,450 | | | | — | | | | — | | | | 722,151 | | | | — | | | | — | |
| Payable upon return of securities loaned (Market value of securities on loan $0; $0; $0; $0; $4,025,898; $6,169,232) | | | — | | | | — | | | | — | | | | — | | | | 4,123,185 | | | | 6,310,735 | |
| Due to custodian | | | — | | | | — | | | | — | | | | 1,072,875 | | | | — | | | | — | |
| Payable for Fund shares redeemed | | | 85,764 | | | | 102,821 | | | | 2,791 | | | | 1,210,655 | | | | — | | | | 94 | |
| Payable to related parties | | | 5,006 | | | | 26,222 | | | | 5,080 | | | | 24,513 | | | | 4,159 | | | | 3,459 | |
| Trustee fee payable | | | 4,162 | | | | 4,220 | | | | 4,202 | | | | 4,072 | | | | 4,220 | | | | 4,193 | |
| Accrued 12b-1 fees | | | 5,726 | | | | 9,721 | | | | 8,934 | | | | 36,429 | | | | 7,952 | | | | 6,447 | |
| Compliance Officer fees payable | | | 10 | | | | 107 | | | | 127 | | | | 90 | | | | 28 | | | | 27 | |
| Accrued expenses and other liabilities | | | 25,887 | | | | 98,996 | | | | 15,033 | | | | 72,570 | | | | 14,549 | | | | 5,459 | |
| Total Liabilities | | | 191,241 | | | | 492,872 | | | | 38,617 | | | | 72,165,569 | | | | 4,157,107 | | | | 6,331,163 | |
| | | | | | | | | | | | | | | | | | | | | | | | | |
| Net Assets | | $ | 55,632,643 | | | $ | 219,641,002 | | | $ | 14,587,043 | | | $ | 467,457,691 | | | $ | 15,131,607 | | | $ | 17,829,270 | |
| | | | | | | | | | | | | | | | | | | | | | | | | |
| NET ASSETS CONSIST OF: | | | | | | | | | | | | | | | | | | | | | | | | |
| Paid in capital | | $ | 64,936,562 | | | $ | 353,356,530 | | | $ | 13,372,549 | | | $ | 486,331,818 | | | $ | 50,480,171 | | | $ | 39,030,641 | |
| Accumulated earnings (losses) | | | (9,303,919 | ) | | | (133,715,528 | ) | | | 1,214,494 | | | | (18,874,127 | ) | | | (35,348,564 | ) | | | (21,201,371 | ) |
| Net Assets | | $ | 55,632,643 | | | $ | 219,641,002 | | | $ | 14,587,043 | | | $ | 467,457,691 | | | $ | 15,131,607 | | | $ | 17,829,270 | |
| | | | | | | | | | | | | | | | | | | | | | | | | |
| Class A | | | | | | | | | | | | | | | | | | | | | | | | |
| Net Assets | | $ | 4,521,933 | | | $ | 17,616,019 | | | $ | 4,147,060 | | | $ | 34,555,564 | | | $ | 7,992,557 | | | $ | 5,376,329 | |
| Shares of beneficial interest outstanding (a) | | | 499,108 | | | | 2,131,264 | | | | 363,008 | | | | 3,729,175 | | | | 2,199,009 | | | | 1,137,721 | |
| Net asset value per share (Net assets/shares outstanding) | | $ | 9.06 | | | $ | 8.27 | | | $ | 11.42 | | | $ | 9.27 | | | $ | 3.63 | | | $ | 4.73 | |
| Maximum offering price per share (b) | | $ | 9.51 | | | $ | 8.68 | | | $ | 12.12 | | | $ | 9.73 | | | $ | 3.81 | | | $ | 5.02 | |
| Minimum redemption price per share (c) | | $ | 8.97 | | | $ | 8.19 | | | $ | 11.31 | | | $ | 9.18 | | | $ | 3.59 | | | $ | 4.68 | |
| | | | | | | | | | | | | | | | | | | | | | | | | |
| Class C | | | | | | | | | | | | | | | | | | | | | | | | |
| Net Assets | | $ | 2,830,452 | | | $ | 10,637,452 | | | $ | 3,097,146 | | | $ | 36,065,916 | | | $ | 1,875,337 | | | $ | 2,551,104 | |
| Shares of beneficial interest outstanding (a) | | | 312,057 | | | | 1,294,593 | | | | 276,603 | | | | 3,907,766 | | | | 514,735 | | | | 540,581 | |
| Net asset value, offering price and redemption price per share (Net assets/shares outstanding) | | $ | 9.07 | | | $ | 8.22 | | | $ | 11.20 | | | $ | 9.23 | | | $ | 3.64 | | | $ | 4.72 | |
| | | | | | | | | | | | | | | | | | | | | | | | | |
| Class I | | | | | | | | | | | | | | | | | | | | | | | | |
| Net Assets | | $ | 48,280,258 | | | $ | 191,387,531 | | | $ | 7,342,837 | | | $ | 396,246,076 | | | $ | 5,263,713 | | | $ | 9,901,837 | |
| Shares of beneficial interest outstanding (a) | | | 5,315,549 | | | | 23,153,233 | | | | 641,947 | | | | 42,741,279 | | | | 1,447,217 | | | | 2,102,154 | |
| Net asset value, offering price and redemption price per share (Net assets/shares outstanding) | | $ | 9.08 | | | $ | 8.27 | | | $ | 11.44 | | | $ | 9.27 | | | $ | 3.64 | | | $ | 4.71 | |
| | | | | | | | | | | | | | | | | | | | | | | | | |
| Class C-1 (d) | | | | | | | | | | | | | | | | | | | | | | | | |
| Net Assets | | | | | | | | | | | | | | $ | 590,135 | | | | | | | | | |
| Shares of beneficial interest outstanding (a) | | | | | | | | | | | | | | | 63,974 | | | | | | | | | |
| Net asset value, offering price and redemption price per share (Net assets/shares outstanding) (e) | | | | | | | | | | | | | | $ | 9.22 | | | | | | | | | |
| (a) | Unlimited number of shares of no par value beneficial interest authorized. |
| (b) | There is a maximum front-end sales charge (load) of 4.75% imposed on purchases of Class A shares for each Fund, excluding the Catalyst/MAP Global Balanced Fund and the Catalyst/SMH Total Return Income Fund which impose a sales load of 5.75%. |
| (c) | Investments in Class A shares made at or above $1 million breakpoint are not subject to an initial sales charge and may be subject to a 1% contingent deferred sales charges (“CDSC”) on shares redeemed within two years of purchases. |
| (d) | Class C-1 only applies to Catalyst/CIFC Senior Secured Income Fund. |
| (e) | Shares redeemed within 12 months after purchase will be charged a contingent deferred sales charge (“CDSC”) of up to 1.00%. |
The accompanying notes are an integral part of these financial statements.
| CATALYST FUNDS |
| Statements of Operations |
| For the Year Ended June 30, 2024 |
| | | | | | | | | Catalyst/MAP | | | Catalyst/CIFC | | | | | | Catalyst/SMH | |
| | | Catalyst Insider | | | Catalyst Enhanced | | | Global Balanced | | | Senior Secured | | | Catalyst/SMH | | | Total Return | |
| | | Income Fund | | | Income Strategy Fund | | | Fund | | | Income Fund | | | High Income Fund | | | Income Fund | |
| Investment Income: | | | | | | | | | | | | | | | | | | | | | | | | |
| Dividend Income | | $ | — | | | $ | — | | | $ | 248,892 | | | $ | 937,542 | | | $ | 48,682 | | | $ | 410,691 | |
| Interest Income | | | 3,317,643 | | | | 24,845,276 | | | | 365,592 | | | | 33,090,544 | | | | 1,114,446 | | | | 911,055 | |
| Securities Lending Income - net | | | — | | | | — | | | | — | | | | — | | | | 79,011 | | | | 79,845 | |
| Foreign tax withheld | | | — | | | | — | | | | (52,312 | ) | | | — | | | | — | | | | — | |
| Total Investment Income | | | 3,317,643 | | | | 24,845,276 | | | | 562,172 | | | | 34,028,086 | | | | 1,242,139 | | | | 1,401,591 | |
| | | | | | | | | | | | | | | | | | | | | | | | | |
| Operating Expenses: | | | | | | | | | | | | | | | | | | | | | | | | |
| Investment advisory fees | | | 440,836 | | | | 4,198,850 | | | | 149,504 | | | | 3,532,699 | | | | 145,929 | | | | 170,206 | |
| 12b-1 Fees: | | | | | | | | | | | | | | | | | | | | | | | | |
| Class A | | | 11,059 | | | | 56,147 | | | | 5,477 | | | | 61,680 | | | | 19,604 | | | | 14,737 | |
| Class C | | | 28,229 | | | | 146,039 | | | | 52,842 | | | | 292,294 | | | | 20,211 | | | | 27,552 | |
| Class C-1 * | | | — | | | | — | | | | — | | | | 749 | | | | — | | | | — | |
| Networking fees | | | 60,896 | | | | 315,124 | | | | 16,397 | | | | 303,536 | | | | 15,814 | | | | 14,238 | |
| Registration fees | | | 47,118 | | | | 68,003 | | | | 40,072 | | | | 90,862 | | | | 44,843 | | | | 42,434 | |
| Financial administration/Fund accounting fees | | | 38,313 | | | | 224,566 | | | | 35,428 | | | | 211,237 | | | | 32,985 | | | | 31,437 | |
| Legal fees | | | 17,328 | | | | 18,915 | | | | 17,807 | | | | 19,366 | | | | 19,124 | | | | 32,864 | |
| Trustees’ fees | | | 15,775 | | | | 15,784 | | | | 15,781 | | | | 15,784 | | | | 15,783 | | | | 15,781 | |
| Legal administration/Management services fees | | | 11,374 | | | | 51,776 | | | | 2,813 | | | | 64,498 | | | | 2,542 | | | | 3,198 | |
| Transfer Agent fees | | | 8,063 | | | | 27,587 | | | | 6,817 | | | | 16,695 | | | | 7,865 | | | | 6,102 | |
| Audit fees | | | 7,917 | | | | 25,257 | | | | 6,782 | | | | 14,028 | | | | 7,504 | | | | 6,780 | |
| Compliance officer fees | | | 7,118 | | | | 18,761 | | | | 9,081 | | | | 19,208 | | | | 8,945 | | | | 8,999 | |
| Printing expense | | | 6,027 | | | | 29,928 | | | | 1,962 | | | | 27,676 | | | | 2,495 | | | | 3,948 | |
| Custody fees | | | 3,016 | | | | 19,083 | | | | 11,239 | | | | 20,041 | | | | 3,364 | | | | 3,447 | |
| Insurance expense | | | 1,722 | | | | 13,599 | | | | 488 | | | | 10,449 | | | | 469 | | | | 534 | |
| Interest expense | | | 455 | | | | 89,114 | | | | 367 | | | | 257 | | | | 254 | | | | 515 | |
| Miscellaneous expense | | | 2,438 | | | | 2,638 | | | | 2,425 | | | | 12,136 | | | | 2,651 | | | | 2,420 | |
| Total Operating Expenses | | | 707,684 | | | | 5,321,171 | | | | 375,282 | | | | 4,713,195 | | | | 350,382 | | | | 385,192 | |
| Less: Fees waived/ Expenses reimbursed by Manager | | | (227,205 | ) | | | (839,150 | ) | | | (171,633 | ) | | | (1,172,703 | ) | | | (130,771 | ) | | | (115,968 | ) |
| Net Operating Expenses | | | 480,479 | | | | 4,482,021 | | | | 203,649 | | | | 3,540,492 | | | | 219,611 | | | | 269,224 | |
| | | | | | | | | | | | | | | | | | | | | | | | | |
| Net Investment Income | | | 2,837,164 | | | | 20,363,255 | | | | 358,523 | | | | 30,487,594 | | | | 1,022,528 | | | | 1,132,367 | |
| | | | | | | | | | | | | | | | | | | | | | | | | |
| Realized and Unrealized Gain (Loss) on Investments: | | | | | | | | | | | | | | | | | | | | | | | | |
| Net realized gain (loss) from: | | | | | | | | | | | | | | | | | | | | | | | | |
| Investments | | | (391,047 | ) | | | (45,562,510 | ) | | | (557,741 | ) | | | (373,923 | ) | | | (905,631 | ) | | | (691,853 | ) |
| Options written | | | — | | | | — | | | | 30,848 | | | | — | | | | — | | | | — | |
| Foreign currency transactions | | | — | | | | — | | | | (2,013 | ) | | | — | | | | — | | | | — | |
| Net realized gain (loss) | | | (391,047 | ) | | | (45,562,510 | ) | | | (528,906 | ) | | | (373,923 | ) | | | (905,631 | ) | | | (691,853 | ) |
| | | | | | | | | | | | | | | | | | | | | | | | | |
| Net change in unrealized appreciation (depreciation) on: | | | | | | | | | | | | | | | | | | | | | | | | |
| Investments | | | 2,074,653 | | | | 19,198,591 | | | | 939,054 | | | | 7,081,519 | | | | 1,738,203 | | | | 1,853,549 | |
| Options written | | | — | | | | — | | | | (25,953 | ) | | | — | | | | — | | | | — | |
| Foreign currency translations | | | — | | | | — | | | | (453 | ) | | | — | | | | — | | | | — | |
| Net change in unrealized appreciation | | | 2,074,653 | | | | 19,198,591 | | | | 912,648 | | | | 7,081,519 | | | | 1,738,203 | | | | 1,853,549 | |
| | | | | | | | | | | | | | | | | | | | | | | | | |
| Net Realized and Unrealized Gain (Loss) on Investments | | | 1,683,606 | | | | (26,363,919 | ) | | | 383,742 | | | | 6,707,596 | | | | 832,572 | | | | 1,161,696 | |
| | | | | | | | | | | | | | | | | | | | | | | | | |
| Net Increase (Decrease) in Net Assets Resulting From Operations | | $ | 4,520,770 | | | $ | (6,000,664 | ) | | $ | 742,265 | | | $ | 37,195,190 | | | $ | 1,855,100 | | | $ | 2,294,063 | |
| * | Class C-1 only applies to Catalyst/CIFC Senior Secured Income Fund |
The accompanying notes are an integral part of these financial statements.
| CATALYST FUNDS |
| Statements of Changes in Net Assets |
| | | | | | | | | Catalyst Enhanced | | | Catalyst/MAP Global | |
| | | Catalyst Insider Income Fund | | | Income Strategy Fund | | | Balanced Fund | |
| | | Year Ended | | | Year Ended | | | Year Ended | | | Year Ended | | | Year Ended | | | Year Ended | |
| | | June 30, 2024 | | | June 30, 2023 | | | June 30, 2024 | | | June 30, 2023 | | | June 30, 2024 | | | June 30, 2023 | |
| Operations: | | | | | | | | | | | | | | | | | | |
| Net investment income | | $ | 2,837,164 | | | $ | 3,821,270 | | | $ | 20,363,255 | | | $ | 31,335,850 | | | $ | 358,523 | | | $ | 294,079 | |
| Net realized gain (loss) on investments | | | (391,047 | ) | | | (5,629,641 | ) | | | (45,562,510 | ) | | | (18,961,852 | ) | | | (528,906 | ) | | | 612,314 | |
| Net change in unrealized appreciation (depreciation) on investments | | | 2,074,653 | | | | 5,175,207 | | | | 19,198,591 | | | | (38,279,159 | ) | | | 912,648 | | | | (462,912 | ) |
| Net increase (decrease) in net assets resulting from operations | | | 4,520,770 | | | | 3,366,836 | | | | (6,000,664 | ) | | | (25,905,161 | ) | | | 742,265 | | | | 443,481 | |
| | | | | | | | | | | | | | | | | | | | | | | | | |
| Distributions to Shareholders from: | | | | | | | | | | | | | | | | | | | | | | | | |
| Accumulated Earnings | | | | | | | | | | | | | | | | | | | | | | | | |
| Class A | | | (211,833 | ) | | | (217,101 | ) | | | (1,900,826 | ) | | | (2,258,906 | ) | | | (127,465 | ) | | | (57,328 | ) |
| Class C | | | (114,233 | ) | | | (119,836 | ) | | | (1,144,428 | ) | | | (1,346,973 | ) | | | (232,856 | ) | | | (113,738 | ) |
| Class I | | | (2,603,184 | ) | | | (3,490,674 | ) | | | (21,066,612 | ) | | | (30,216,491 | ) | | | (419,231 | ) | | | (218,497 | ) |
| | | | | | | | | | | | | | | | | | | | | | | | | |
| Total distributions to shareholders | | | (2,929,250 | ) | | | (3,827,611 | ) | | | (24,111,866 | ) | | | (33,822,370 | ) | | | (779,552 | ) | | | (389,563 | ) |
| | | | | | | | | | | | | | | | | | | | | | | | | |
| Share Transactions of Beneficial Interest: | | | | | | | | | | | | | | | | | | | | | | | | |
| Net proceeds from shares sold | | | | | | | | | | | | | | | | | | | | | | | | |
| Class A | | | 562,550 | | | | 254,920 | | | | 5,769,739 | | | | 12,419,595 | | | | 2,471,185 | | | | 718,627 | |
| Class C | | | 429,442 | | | | 575,080 | | | | 755,757 | | | | 2,146,164 | | | | 1,405,314 | | | | 1,035,514 | |
| Class I | | | 19,443,345 | | | | 12,111,866 | | | | 53,861,279 | | | | 191,576,626 | | | | 363,033 | | | | 491,407 | |
| Reinvestment of distributions | | | | | | | | | | | | | | | | | | | | | | | | |
| Class A | | | 203,611 | | | | 209,190 | | | | 1,624,416 | | | | 1,899,033 | | | | 120,889 | | | | 53,199 | |
| Class C | | | 109,212 | | | | 115,588 | | | | 953,473 | | | | 1,142,563 | | | | 230,286 | | | | 110,526 | |
| Class I | | | 2,188,520 | | | | 2,935,293 | | | | 17,927,164 | | | | 24,473,183 | | | | 337,992 | | | | 176,489 | |
| Cost of shares redeemed | | | | | | | | | | | | | | | | | | | | | | | | |
| Class A | | | (789,029 | ) | | | (1,133,809 | ) | | | (18,491,536 | ) | | | (12,662,715 | ) | | | (625,510 | ) | | | (978,904 | ) |
| Class C | | | (417,030 | ) | | | (1,719,665 | ) | | | (8,142,773 | ) | | | (9,302,213 | ) | | | (3,774,297 | ) | | | (1,933,703 | ) |
| Class I | | | (28,610,888 | ) | | | (48,914,776 | ) | | | (208,691,689 | ) | | | (289,632,571 | ) | | | (865,155 | ) | | | (1,900,744 | ) |
| Net decrease in net assets from share transactions of beneficial interest | | | (6,880,267 | ) | | | (35,566,313 | ) | | | (154,434,170 | ) | | | (77,940,335 | ) | | | (336,263 | ) | | | (2,227,589 | ) |
| | | | | | | | | | | | | | | | | | | | | | | | | |
| Total Decrease in Net Assets | | | (5,288,747 | ) | | | (36,027,088 | ) | | | (184,546,700 | ) | | | (137,667,866 | ) | | | (373,550 | ) | | | (2,173,671 | ) |
| | | | | | | | | | | | | | | | | | | | | | | | | |
| Net Assets: | | | | | | | | | | | | | | | | | | | | | | | | |
| Beginning of year | | | 60,921,390 | | | | 96,948,478 | | | | 404,187,702 | | | | 541,855,568 | | | | 14,960,593 | | | | 17,134,264 | |
| End of year | | $ | 55,632,643 | | | $ | 60,921,390 | | | $ | 219,641,002 | | | $ | 404,187,702 | | | $ | 14,587,043 | | | $ | 14,960,593 | |
| | | | | | | | | | | | | | | | | | | | | | | | | |
| Share Activity: | | | | | | | | | | | | | | | | | | | | | | | | |
| Class A | | | | | | | | | | | | | | | | | | | | | | | | |
| Shares Sold | | | 62,767 | | | | 29,121 | | | | 661,229 | | | | 1,267,353 | | | | 213,429 | | | | 62,434 | |
| Shares Reinvested | | | 22,715 | | | | 23,844 | | | | 187,641 | | | | 197,454 | | | | 10,738 | | | | 4,689 | |
| Shares Redeemed | | | (88,293 | ) | | | (128,391 | ) | | | (2,109,191 | ) | | | (1,315,054 | ) | | | (55,155 | ) | | | (85,925 | ) |
| Net increase (decrease) in shares of Beneficial interest | | | (2,811 | ) | | | (75,426 | ) | | | (1,260,321 | ) | | | 149,753 | | | | 169,012 | | | | (18,802 | ) |
| | | | | | | | | | | | | | | | | | | | | | | | | |
| Class C | | | | | | | | | | | | | | | | | | | | | | | | |
| Shares Sold | | | 48,261 | | | | 65,849 | | | | 87,306 | | | | 220,151 | | | | 126,175 | | | | 93,244 | |
| Shares Reinvested | | | 12,171 | | | | 13,150 | | | | 110,638 | | | | 118,996 | | | | 21,009 | | | | 9,876 | |
| Shares Redeemed | | | (46,593 | ) | | | (195,146 | ) | | | (944,876 | ) | | | (963,302 | ) | | | (335,256 | ) | | | (172,593 | ) |
| Net increase (decrease) in shares of Beneficial interest | | | 13,839 | | | | (116,147 | ) | | | (746,932 | ) | | | (624,155 | ) | | | (188,072 | ) | | | (69,473 | ) |
| | | | | | | | | | | | | | | | | | | | | | | | | |
| Class I | | | | | | | | | | | | | | | | | | | | | | | | |
| Shares Sold | | | 2,176,924 | | | | 1,375,911 | | | | 6,195,478 | | | | 19,422,148 | | | | 32,010 | | | | 42,438 | |
| Shares Reinvested | | | 243,666 | | | | 333,590 | | | | 2,068,886 | | | | 2,538,785 | | | | 30,085 | | | | 15,535 | |
| Shares Redeemed | | | (3,203,173 | ) | | | (5,590,560 | ) | | | (23,749,277 | ) | | | (29,884,494 | ) | | | (76,062 | ) | | | (169,727 | ) |
| Net decrease in shares of Beneficial interest | | | (782,583 | ) | | | (3,881,059 | ) | | | (15,484,913 | ) | | | (7,923,561 | ) | | | (13,967 | ) | | | (111,754 | ) |
| | | | | | | | | | | | | | | | | | | | | | | | | |
The accompanying notes are an integral part of these financial statements.
| CATALYST FUNDS |
| Statements of Changes in Net Assets (Continued) |
| | | Catalyst/CIFC Senior | | | | | | Catalyst/SMH Total | |
| | | Secured Income Fund | | | Catalyst/SMH High Income Fund | | | Return Income Fund | |
| | | Year Ended | | | Year Ended | | | Year Ended | | | Year Ended | | | Year Ended | | | Year Ended | |
| | | June 30, 2024 | | | June 30, 2023 | | | June 30, 2024 | | | June 30, 2023 | | | June 30, 2024 | | | June 30, 2023 | |
| Operations: | | | | | | | | | | | | | | | | | | | | | | | | |
| Net investment income | | $ | 30,487,594 | | | $ | 17,654,567 | | | $ | 1,022,528 | | | $ | 1,001,152 | | | $ | 1,132,367 | | | $ | 912,561 | |
| Net realized gain (loss) on investments | | | (373,923 | ) | | | (9,082,302 | ) | | | (905,631 | ) | | | (989,782 | ) | | | (691,853 | ) | | | 370,668 | |
| Net change in unrealized appreciation on investments | | | 7,081,519 | | | | 11,932,360 | | | | 1,738,203 | | | | 1,480,890 | | | | 1,853,549 | | | | 226,887 | |
| Net increase in net assets resulting from operations | | | 37,195,190 | | | | 20,504,625 | | | | 1,855,100 | | | | 1,492,260 | | | | 2,294,063 | | | | 1,510,116 | |
| | | | | | | | | | | | | | | | | | | | | | | | | |
| Distributions to Shareholders from: | | | | | | | | | | | | | | | | | | | | | | | | |
| Accumulated Earnings | | | | | | | | | | | | | | | | | | | | | | | | |
| Class A | | | (2,092,222 | ) | | | (1,787,180 | ) | | | (559,444 | ) | | | (504,426 | ) | | | (358,205 | ) | | | (311,976 | ) |
| Class C | | | (2,259,010 | ) | | | (1,469,063 | ) | | | (128,610 | ) | | | (124,597 | ) | | | (147,694 | ) | | | (128,857 | ) |
| Class I | | | (26,132,411 | ) | | | (14,447,784 | ) | | | (351,416 | ) | | | (342,953 | ) | | | (540,469 | ) | | | (375,166 | ) |
| Class C-1 (a,b) | | | (5,765 | ) | | | (51 | ) | | | — | | | | — | | | | — | | | | — | |
| Total distributions to shareholders | | | (30,489,408 | ) | | | (17,704,078 | ) | | | (1,039,470 | ) | | | (971,976 | ) | | | (1,046,368 | ) | | | (815,999 | ) |
| | | | | | | | | | | | | | | | | | | | | | | | | |
| Share Transactions of Beneficial Interest: | | | | | | | | | | | | | | | | | | | | | | | | |
| Net proceeds from shares sold | | | | | | | | | | | | | | | | | | | | | | | | |
| Class A | | | 23,196,697 | | | | 11,618,099 | | | | 845,838 | | | | 454,907 | | | | 390,621 | | | | 341,398 | |
| Class C | | | 21,466,919 | | | | 5,610,393 | | | | 415,478 | | | | 145,931 | | | | 312,279 | | | | 201,541 | |
| Class I | | | 289,406,236 | | | | 141,099,268 | | | | 3,156,150 | | | | 6,817,299 | | | | 2,809,859 | | | | 1,373,805 | |
| Class C-1 (a,b) | | | 590,551 | | | | 1,000 | | | | — | | | | — | | | | — | | | | — | |
| Reinvestment of distributions | | | | | | | | | | | | | | | | | | | | | | | | |
| Class A | | | 1,576,454 | | | | 1,622,461 | | | | 424,037 | | | | 293,022 | | | | 348,311 | | | | 204,919 | |
| Class C | | | 1,997,040 | | | | 1,331,066 | | | | 77,188 | | | | 74,167 | | | | 142,054 | | | | 117,348 | |
| Class I | | | 21,011,444 | | | | 12,583,296 | | | | 303,310 | | | | 259,885 | | | | 540,238 | | | | 281,144 | |
| Cost of shares redeemed | | | | | | | | | | | | | | | | | | | | | | | | |
| Class A | | | (7,245,157 | ) | | | (20,633,178 | ) | | | (1,221,117 | ) | | | (1,510,222 | ) | | | (1,961,080 | ) | | | (1,368,164 | ) |
| Class C | | | (11,195,997 | ) | | | (5,924,852 | ) | | | (709,333 | ) | | | (862,825 | ) | | | (942,426 | ) | | | (904,360 | ) |
| Class I | | | (118,014,889 | ) | | | (160,179,903 | ) | | | (2,594,971 | ) | | | (10,674,272 | ) | | | (1,274,009 | ) | | | (3,480,707 | ) |
| Net increase (decrease) in net assets from share transactions of beneficial interest | | | 222,789,298 | | | | (12,872,350 | ) | | | 696,580 | | | | (5,002,108 | ) | | | 365,847 | | | | (3,233,076 | ) |
| | | | | | | | | | | | | | | | | | | | | | | | | |
| Total Increase (decrease) in Net Assets | | | 229,495,080 | | | | (10,071,803 | ) | | | 1,512,210 | | | | (4,481,824 | ) | | | 1,613,542 | | | | (2,538,959 | ) |
| | | | | | | | | | | | | | | | | | | | | | | | | |
| Net Assets: | | | | | | | | | | | | | | | | | | | | | | | | |
| Beginning of year/period | | | 237,962,611 | | | | 248,034,414 | | | | 13,619,397 | | | | 18,101,221 | | | | 16,215,728 | | | | 18,754,687 | |
| End of year/period | | $ | 467,457,691 | | | $ | 237,962,611 | | | $ | 15,131,607 | | | $ | 13,619,397 | | | $ | 17,829,270 | | | $ | 16,215,728 | |
| | | | | | | | | | | | | | | | | | | | | | | | | |
| Share Activity: | | | | | | | | | | | | | | | | | | | | | | | | |
| Class A | | | | | | | | | | | | | | | | | | | | | | | | |
| Shares Sold | | | 2,514,371 | | | | 1,294,348 | | | | 237,476 | | | | 133,533 | | | | 85,089 | | | | 79,002 | |
| Shares Reinvested | | | 170,837 | | | | 180,423 | | | | 119,572 | | | | 86,755 | | | | 76,291 | | | | 47,477 | |
| Shares Redeemed | | | (784,448 | ) | | | (2,296,374 | ) | | | (342,396 | ) | | | (442,070 | ) | | | (428,043 | ) | | | (318,362 | ) |
| Net increase (decrease) in shares of Beneficial interest | | | 1,900,760 | | | | (821,603 | ) | | | 14,652 | | | | (221,782 | ) | | | (266,663 | ) | | | (191,883 | ) |
| | | | | | | | | | | | | | | | | | | | | | | | | |
| Class C | | | | | | | | | | | | | | | | | | | | | | | | |
| Shares Sold | | | 2,333,208 | | | | 624,705 | | | | 118,595 | | | | 43,498 | | | | 67,888 | | | | 47,052 | |
| Shares Reinvested | | | 217,363 | | | | 148,497 | | | | 21,718 | | | | 21,903 | | | | 31,151 | | | | 27,195 | |
| Shares Redeemed | | | (1,215,441 | ) | | | (660,622 | ) | | | (199,581 | ) | | | (251,913 | ) | | | (204,426 | ) | | | (207,917 | ) |
| Net increase (decrease) in shares of Beneficial interest | | | 1,335,130 | | | | 112,580 | | | | (59,268 | ) | | | (186,512 | ) | | | (105,387 | ) | | | (133,670 | ) |
| | | | | | | | | | | | | | | | | | | | | | | | | |
| Class I | | | | | | | | | | | | | | | | | | | | | | | | |
| Shares Sold | | | 31,395,006 | | | | 15,654,524 | | | | 881,885 | | | | 2,025,976 | | | | 614,238 | | | | 318,807 | |
| Shares Reinvested | | | 2,276,540 | | | | 1,397,734 | | | | 85,363 | | | | 76,815 | | | | 118,401 | | | | 65,296 | |
| Shares Redeemed | | | (12,784,581 | ) | | | (17,834,518 | ) | | | (728,987 | ) | | | (3,168,129 | ) | | | (277,694 | ) | | | (798,714 | ) |
| Net increase (decrease) in shares of Beneficial interest | | | 20,886,965 | | | | (782,260 | ) | | | 238,261 | | | | (1,065,338 | ) | | | 454,945 | | | | (414,611 | ) |
| | | | | | | | | | | | | | | | | | | | | | | | | |
| Class C-1 (a,b) | | | | | | | | | | | | | | | | | | | | | | | | |
| Shares Sold | | | 63,861 | | | | 113 | | | | | | | | | | | | | | | | | |
| Shares Reinvested | | | — | | | | — | | | | | | | | | | | | | | | | | |
| Shares Redeemed | | | — | | | | — | | | | | | | | | | | | | | | | | |
| Net increase in shares of Beneficial interest | | | 63,861 | | | | 113 | | | | | | | | | | | | | | | | | |
| (a) | Class C-1 only applies to Catalyst/CIFC Senior Secured Income Fund |
| (b) | The Catalyst/CIFC Senior Secured Income Fund Class C-1 commenced operations on November 1, 2022 |
The accompanying notes are an integral part of these financial statements.
| CATALYST FUNDS |
| Catalyst Insider Income Fund |
| Financial Highlights |
| |
| For a Share Outstanding Throughout Each Year |
| | | Class A | |
| | | For the | | | For the | | | For the | | | For the | | | For the | |
| | | Year Ended | | | Year Ended | | | Year Ended | | | Year Ended | | | Year Ended | |
| | | June 30, 2024 | | | June 30, 2023 | | | June 30, 2022 | | | June 30, 2021 | | | June 30, 2020 | |
| Net asset value, beginning of year | | $ | 8.81 | | | $ | 8.82 | | | $ | 9.88 | | | $ | 9.50 | | | $ | 9.55 | |
| INCOME (LOSS) FROM INVESTMENT OPERATIONS: | | | | | | | | | | | | | | | | | | | | |
| Net investment income (A) | | | 0.42 | | | | 0.41 | | | | 0.26 | | | | 0.28 | | | | 0.28 | |
| Net realized and unrealized gain (loss) on investments | | | 0.26 | | | | (0.00 | ) (B) | | | (1.04 | ) | | | 0.39 | | | | (0.03 | ) |
| Total from investment operations | | | 0.68 | | | | 0.41 | | | | (0.78 | ) | | | 0.67 | | | | 0.25 | |
| LESS DISTRIBUTIONS: | | | | | | | | | | | | | | | | | | | | |
| From net investment income | | | (0.43 | ) | | | (0.42 | ) | | | (0.25 | ) | | | (0.29 | ) | | | (0.28 | ) |
| From net realized gains | | | — | | | | — | | | | (0.03 | ) | | | — | | | | (0.02 | ) |
| Total distributions | | | (0.43 | ) | | | (0.42 | ) | | | (0.28 | ) | | | (0.29 | ) | | | (0.30 | ) |
| Net asset value, end of year | | $ | 9.06 | | | $ | 8.81 | | | $ | 8.82 | | | $ | 9.88 | | | $ | 9.50 | |
| Total return (C) | | | 7.84 | % | | | 4.71 | % | | | (8.06 | )% | | | 7.15 | % | | | 2.72 | % |
| RATIOS/SUPPLEMENTAL DATA: | | | | | | | | | | | | | | | | | | | | |
| Net assets, end of year (in 000’s) | | $ | 4,522 | | | $ | 4,422 | | | $ | 5,090 | | | $ | 4,764 | | | $ | 3,500 | |
| Ratios to average net assets (including interest expense) | | | | | | | | | | | | | | | | | | | | |
| Expenses, before waiver and reimbursement | | | 1.39 | % (D) | | | 1.39 | % (D) | | | 1.34 | % | | | 1.37 | % | | | 1.43 | % |
| Expenses, net waiver and reimbursement | | | 1.00 | % (D) | | | 1.01 | % (D) | | | 1.00 | % | | | 1.00 | % | | | 1.00 | % |
| Net investment Income, before waiver and reimbursement | | | 4.26 | % | | | 4.32 | % | | | 2.34 | % | | | 2.50 | % | | | 2.55 | % |
| Net investment income, net waiver and reimbursement | | | 4.65 | % | | | 4.70 | % | | | 2.68 | % | | | 2.87 | % | | | 2.98 | % |
| Portfolio turnover rate | | | 17 | % | | | 43 | % | | | 70 | % | | | 89 | % | | | 172 | % |
| | | | | | | | | | | | | | | | |
| | | | | | | | | | | | | | | | |
| | | Class C | |
| | | For the | | | For the | | | For the | | | For the | | | For the | |
| | | Year Ended | | | Year Ended | | | Year Ended | | | Year Ended | | | Year Ended | |
| | | June 30, 2024 | | | June 30, 2023 | | | June 30, 2022 | | | June 30, 2021 | | | June 30, 2020 | |
| Net asset value, beginning of year | | $ | 8.82 | | | $ | 8.83 | | | $ | 9.89 | | | $ | 9.50 | | | $ | 9.56 | |
| INCOME (LOSS) FROM INVESTMENT OPERATIONS: | | | | | | | | | | | | | | | | | | | | |
| Net investment income (A) | | | 0.35 | | | | 0.35 | | | | 0.18 | | | | 0.19 | | | | 0.21 | |
| Net realized and unrealized gain (loss) on investments | | | 0.26 | | | | (0.01 | ) | | | (1.03 | ) | | | 0.42 | | | | (0.04 | ) |
| Total from investment operations | | | 0.61 | | | | 0.34 | | | | (0.85 | ) | | | 0.61 | | | | 0.17 | |
| LESS DISTRIBUTIONS: | | | | | | | | | | | | | | | | | | | | |
| From net investment income | | | (0.36 | ) | | | (0.35 | ) | | | (0.18 | ) | | | (0.22 | ) | | | (0.21 | ) |
| From net realized gains | | | — | | | | — | | | | (0.03 | ) | | | — | | | | (0.02 | ) |
| Total distributions | | | (0.36 | ) | | | (0.35 | ) | | | (0.21 | ) | | | (0.22 | ) | | | (0.23 | ) |
| Net asset value, end of year | | $ | 9.07 | | | $ | 8.82 | | | $ | 8.83 | | | $ | 9.89 | | | $ | 9.50 | |
| Total return (C) | | | 7.04 | % | | | 3.94 | % | | | (8.76 | )% | | | 6.48 | % | | | 1.84 | % |
| RATIOS/SUPPLEMENTAL DATA: | | | | | | | | | | | | | | | | | | | | |
| Net assets, end of year (in 000’s) | | $ | 2,830 | | | $ | 2,631 | | | $ | 3,658 | | | $ | 3,851 | | | $ | 1,668 | |
| Ratios to average net assets (including interest expense) | | | | | | | | | | | | | | | | | | | | |
| Expenses, before waiver and reimbursement | | | 2.14 | % (E) | | | 2.14 | % (E) | | | 2.09 | % | | | 2.12 | % | | | 2.18 | % |
| Expenses, net waiver and reimbursement | | | 1.75 | % (E) | | | 1.76 | % (E) | | | 1.75 | % | | | 1.75 | % | | | 1.75 | % |
| Net investment income, before waiver and reimbursement | | | 3.51 | % | | | 3.57 | % | | | 1.57 | % | | | 1.60 | % | | | 1.80 | % |
| Net investment income, net waiver and reimbursement | | | 3.90 | % | | | 3.95 | % | | | 1.91 | % | | | 1.97 | % | | | 2.23 | % |
| Portfolio turnover rate | | | 17 | % | | | 43 | % | | | 70 | % | | | 89 | % | | | 172 | % |
| | | | | | | | | | | | | | | | | | | | | |
| (A) | Per share amounts calculated using average shares method, which more appropriately presents the per share data for the period. |
| (B) | Less than 0.01 per share. |
| (C) | Total return in the above tables represents the rate that the investor would have earned or lost on an investment in the Fund assuming reinvestment of dividends and does not reflect the impact of sales charges, if any. Had the advisor not waived its fees and reimbursed expenses, total return would have been lower. |
| (D) | Ratios to average net assets (excluding interest expense) |
| Expenses, before waiver and reimbursement | | | 1.39 | % | | | 1.38 | % |
| Expenses, net waiver and reimbursement | | | 1.00 | % | | | 1.00 | % |
| (E) | Ratios to average net assets (excluding interest expense) |
| Expenses, before waiver and reimbursement | | | 2.14 | % | | | 2.13 | % |
| Expenses, net waiver and reimbursement | | | 1.75 | % | | | 1.75 | % |
The accompanying notes are an integral part of these financial statements.
| CATALYST FUNDS |
| Catalyst Insider Income Fund (Continued) |
| Financial Highlights |
| |
| For a Share Outstanding Throughout Each Year |
| | | Class I | |
| | | For the | | | For the | | | For the | | | For the | | | For the | |
| | | Year Ended | | | Year Ended | | | Year Ended | | | Year Ended | | | Year Ended | |
| | | June 30, 2024 | | | June 30, 2023 | | | June 30, 2022 | | | June 30, 2021 | | | June 30, 2020 | |
| Net asset value, beginning of year | | $ | 8.83 | | | $ | 8.84 | | | $ | 9.90 | | | $ | 9.51 | | | $ | 9.56 | |
| INCOME (LOSS) FROM INVESTMENT OPERATIONS: | | | | | | | | | | | | | | | | | | | | |
| Net investment income (A) | | | 0.44 | | | | 0.44 | | | | 0.28 | | | | 0.30 | | | | 0.31 | |
| Net realized and unrealized gain (loss) on investments | | | 0.26 | | | | (0.01 | ) | | | (1.03 | ) | | | 0.40 | | | | (0.05 | ) |
| Total from investment operations | | | 0.70 | | | | 0.43 | | | | (0.75 | ) | | | 0.70 | | | | 0.26 | |
| LESS DISTRIBUTIONS: | | | | | | | | | | | | | | | | | | | | |
| From net investment income | | | (0.45 | ) | | | (0.44 | ) | | | (0.28 | ) | | | (0.31 | ) | | | (0.29 | ) |
| From net realized gains | | | — | | | | — | | | | (0.03 | ) | | | — | | | | (0.02 | ) |
| Total distributions | | | (0.45 | ) | | | (0.44 | ) | | | (0.31 | ) | | | (0.31 | ) | | | (0.31 | ) |
| Net asset value, end of year | | $ | 9.08 | | | $ | 8.83 | | | $ | 8.84 | | | $ | 9.90 | | | $ | 9.51 | |
| Total return (B) | | | 8.11 | % | | | 4.97 | % | | | (7.79 | )% | | | 7.45 | % | | | 2.90 | % |
| RATIOS/SUPPLEMENTAL DATA: | | | | | | | | | | | | | | | | | | | | |
| Net assets, end of year (in 000’s) | | $ | 48,280 | | | $ | 53,869 | | | $ | 88,201 | | | $ | 95,976 | | | $ | 46,580 | |
| Ratios to average net assets (including interest expense) | | | | | | | | | | | | | | | | | | | | |
| Expenses, before waiver and reimbursement | | | 1.14 | % (C) | | | 1.14 | % (C) | | | 1.09 | % | | | 1.12 | % | | | 1.18 | % |
| Expenses, net waiver and reimbursement | | | 0.75 | % (C) | | | 0.76 | % (C) | | | 0.75 | % | | | 0.75 | % | | | 0.75 | % |
| Net investment Income, before waiver and reimbursement | | | 4.51 | % | | | 4.57 | % | | | 2.57 | % | | | 2.65 | % | | | 2.80 | % |
| Net investment income, net waiver and reimbursement | | | 4.90 | % | | | 4.95 | % | | | 2.91 | % | | | 3.02 | % | | | 3.23 | % |
| Portfolio turnover rate | | | 17 | % | | | 43 | % | | | 70 | % | | | 89 | % | | | 172 | % |
| (A) | Per share amounts calculated using average shares method, which more appropriately presents the per share data for the period. |
| (B) | Total return in the above table represents the rate that the investor would have earned or lost on an investment in the Fund assuming reinvestment of dividends. Had the advisor not waived its fees and reimbursed expenses, total return would have been lower. |
| (C) | Ratios to average net assets (excluding interest expense) |
| Expenses, before waiver and reimbursement | | | 1.14 | % | | | 1.13 | % |
| Expenses, net waiver and reimbursement | | | 0.75 | % | | | 0.75 | % |
The accompanying notes are an integral part of these financial statements.
| CATALYST FUNDS |
| Catalyst Enhanced Income Strategy Fund |
| Financial Highlights |
| |
| For a Share Outstanding Throughout Each Year |
| | | Class A | |
| | | For the | | | For the | | | For the | | | For the | | | For the | |
| | | Year Ended | | | Year Ended | | | Year Ended | | | Year Ended | | | Year Ended | |
| | | June 30, 2024 | | | June 30, 2023 | | | June 30, 2022 | | | June 30, 2021 | | | June 30, 2020 | |
| Net asset value, beginning of year | | $ | 9.17 | | | $ | 10.33 | | | $ | 11.21 | | | $ | 11.11 | | | $ | 11.16 | |
| INCOME (LOSS) FROM INVESTMENT OPERATIONS: | | | | | | | | | | | | | | | | | | | | |
| Net investment income (A) | | | 0.62 | | | | 0.60 | | | | 0.66 | | | | 0.73 | | | | 0.57 | |
| Net realized and unrealized gain(loss) on investments | | | (0.77 | ) | | | (1.11 | ) | | | (0.87 | ) | | | 0.08 | | | | (0.07 | ) |
| Total from investment operations | | | (0.15 | ) | | | (0.51 | ) | | | (0.21 | ) | | | 0.81 | | | | 0.50 | |
| LESS DISTRIBUTIONS: | | | | | | | | | | | | | | | | | | | | |
| From net investment income | | | (0.75 | ) | | | (0.65 | ) | | | (0.66 | ) | | | (0.71 | ) | | | (0.55 | ) |
| From net realized gains | | | — | | | | — | | | | (0.01 | ) | | | — | | | | — | |
| Total distributions | | | (0.75 | ) | | | (0.65 | ) | | | (0.67 | ) | | | (0.71 | ) | | | (0.55 | ) |
| Net asset value, end of year | | $ | 8.27 | | | $ | 9.17 | | | $ | 10.33 | | | $ | 11.21 | | | $ | 11.11 | |
| Total return (B) | | | (1.64 | )% (C) | | | (5.06 | )% (C) | | | (2.03 | )% | | | 7.39 | % | | | 4.60 | % |
| RATIOS/SUPPLEMENTAL DATA: | | | | | | | | | | | | | | | | | | | | |
| Net assets, end of year (in 000’s) | | $ | 17,616 | | | $ | 31,114 | | | $ | 33,489 | | | $ | 34,778 | | | $ | 15,978 | |
| Ratios to average net assets | | | | | | | | | | | | | | | | | | | | |
| Expenses, before waiver and reimbursement | | | 2.08 | % (D) | | | 2.03 | % | | | 1.99 | % | | | 2.04 | % | | | 2.11 | % |
| Expenses, net waiver and reimbursement | | | 1.78 | % (D) | | | 1.75 | % | | | 1.75 | % | | | 1.75 | % | | | 1.75 | % |
| Net investment income, before waiver and reimbursement | | | 6.82 | % | | | 5.84 | % | | | 5.81 | % | | | 6.13 | % | | | 4.83 | % |
| Net investment income, net waiver and reimbursement | | | 7.12 | % | | | 6.12 | % | | | 6.05 | % | | | 6.42 | % | | | 5.18 | % |
| Portfolio turnover rate | | | 13 | % | | | 29 | % | | | 57 | % | | | 58 | % | | | 94 | % |
| | | | | | | | | | | | | | | | | | | | | |
| | | | | | | | | | | | | | | | | | | | | |
| | | Class C | |
| | | For the | | | For the | | | For the | | | For the | | | For the | |
| | | Year Ended | | | Year Ended | | | Year Ended | | | Year Ended | | | Year Ended | |
| | | June 30, 2024 | | | June 30, 2023 | | | June 30, 2022 | | | June 30, 2021 | | | June 30, 2020 | |
| Net asset value, beginning of year | | $ | 9.12 | | | $ | 10.28 | | | $ | 11.16 | | | $ | 11.07 | | | $ | 11.13 | |
| INCOME (LOSS) FROM INVESTMENT OPERATIONS: | | | | | | | | | | | | | | | | | | | | |
| Net investment income (A) | | | 0.55 | | | | 0.52 | | | | 0.58 | | | | 0.65 | | | | 0.46 | |
| Net realized and unrealized gain (loss) on investments | | | (0.76 | ) | | | (1.10 | ) | | | (0.87 | ) | | | 0.07 | | | | (0.05 | ) |
| Total from investment operations | | | (0.21 | ) | | | (0.58 | ) | | | (0.29 | ) | | | 0.72 | | | | 0.41 | |
| LESS DISTRIBUTIONS: | | | | | | | | | | | | | | | | | | | | |
| From net investment income | | | (0.69 | ) | | | (0.58 | ) | | | (0.58 | ) | | | (0.63 | ) | | | (0.47 | ) |
| From net realized gains | | | — | | | | — | | | | (0.01 | ) | | | — | | | | — | |
| Total distributions | | | (0.69 | ) | | | (0.58 | ) | | | (0.59 | ) | | | (0.63 | ) | | | (0.47 | ) |
| Net asset value, end of year | | $ | 8.22 | | | $ | 9.12 | | | $ | 10.28 | | | $ | 11.16 | | | $ | 11.07 | |
| Total return (B) | | | (2.38 | )% (C) | | | (5.79 | )% (C) | | | (2.74 | )% | | | 6.61 | % | | | 3.82 | % |
| RATIOS/SUPPLEMENTAL DATA: | | | | | | | | | | | | | | | | | | | | |
| Net assets, end of year (in 000’s) | | $ | 10,637 | | | $ | 18,626 | | | $ | 27,398 | | | $ | 19,059 | | | $ | 4,605 | |
| Ratios to average net assets | | | | | | | | | | | | | | | | | | | | |
| Expenses, before waiver and reimbursement | | | 2.83 | % (E) | | | 2.78 | % | | | 2.74 | % | | | 2.79 | % | | | 2.86 | % |
| Expenses, net waiver and reimbursement | | | 2.53 | % (E) | | | 2.50 | % | | | 2.50 | % | | | 2.50 | % | | | 2.50 | % |
| Net investment Income, before waiver and reimbursement | | | 6.06 | % | | | 5.04 | % | | | 5.06 | % | | | 5.47 | % | | | 3.82 | % |
| Net investment income, net waiver and reimbursement | | | 6.36 | % | | | 5.32 | % | | | 5.30 | % | | | 5.76 | % | | | 4.17 | % |
| Portfolio turnover rate | | | 13 | % | | | 29 | % | | | 57 | % | | | 58 | % | | | 94 | % |
| | | | | | | | | | | | | | | | | | | | | |
| (A) | Per share amounts calculated using average shares method, which more appropriately presents the per share data for the period. |
| (B) | Total return in the above tables represents the rate that the investor would have earned or lost on an investment in the Fund assuming reinvestment of dividends and does not reflect the impact of sales charges, if any. Had the advisor not waived its fees and reimbursed expenses, total return would have been lower. |
| (C) | Includes adjustments in accordance with accounting principles generally accepted in the United States and, consequently, the net asset value for financial reporting purposes and the returns based upon those net asset values may differ from the net asset values and returns for shareholder transactions. |
| (D) | Ratios to average net assets (excluding interest expense) |
| Expenses, before waiver and reimbursement | | | 2.05 | % |
| Expenses, net waiver and reimbursement | | | 1.75 | % |
| (E) | Ratios to average net assets (excluding interest expense) |
| Expenses, before waiver and reimbursement | | | 2.80 | % |
| Expenses, net waiver and reimbursement | | | 2.50 | % |
The accompanying notes are an integral part of these financial statements.
| CATALYST FUNDS |
| Catalyst Enhanced Income Strategy Fund (Continued) |
| Financial Highlights |
| |
| For a Share Outstanding Throughout Each Year |
| | | Class I | |
| | | For the | | | For the | | | For the | | | For the | | | For the | |
| | | Year Ended | | | Year Ended | | | Year Ended | | | Year Ended | | | Year Ended | |
| | | June 30, 2024 | | | June 30, 2023 | | | June 30, 2022 | | | June 30, 2021 | | | June 30, 2020 | |
| Net asset value, beginning of year | | $ | 9.17 | | | $ | 10.33 | | | $ | 11.21 | | | $ | 11.11 | | | $ | 11.15 | |
| INCOME (LOSS) FROM INVESTMENT OPERATIONS: | | | | | | | | | | | | | | | | | | | | |
| Net investment income (A) | | | 0.64 | | | | 0.62 | | | | 0.69 | | | | 0.76 | | | | 0.57 | |
| Net realized and unrealized gain (loss) on investments | | | (0.77 | ) | | | (1.11 | ) | | | (0.87 | ) | | | 0.07 | | | | (0.04 | ) |
| Total from investment operations | | | (0.13 | ) | | | (0.49 | ) | | | (0.18 | ) | | | 0.83 | | | | 0.53 | |
| LESS DISTRIBUTIONS: | | | | | | | | | | | | | | | | | | | | |
| From net investment income | | | (0.77 | ) | | | (0.67 | ) | | | (0.69 | ) | | | (0.73 | ) | | | (0.57 | ) |
| From net realized gains | | | — | | | | — | | | | (0.01 | ) | | | — | | | | — | |
| Total distributions | | | (0.77 | ) | | | (0.67 | ) | | | (0.70 | ) | | | (0.73 | ) | | | (0.57 | ) |
| Net asset value, end of year | | $ | 8.27 | | | $ | 9.17 | | | $ | 10.33 | | | $ | 11.21 | | | $ | 11.11 | |
| Total return (B) | | | (1.39 | )% (C) | | | (4.82 | )% (C) | | | (1.79 | )% | | | 7.64 | % | | | 4.93 | % |
| RATIOS/SUPPLEMENTAL DATA: | | | | | | | | | | | | | | | | | | | | |
| Net assets, end of year (in 000’s) | | $ | 191,388 | | | $ | 354,447 | | | $ | 480,968 | | | $ | 280,265 | | | $ | 125,800 | |
| Ratios to average net assets | | | | | | | | | | | | | | | | | | | | |
| Expenses, before waiver and reimbursement | | | 1.83 | % (D) | | | 1.78 | % | | | 1.74 | % | | | 1.79 | % | | | 1.86 | % |
| Expenses, net waiver and reimbursement | | | 1.53 | % (D) | | | 1.50 | % | | | 1.50 | % | | | 1.50 | % | | | 1.50 | % |
| Net investment income, before waiver and reimbursement | | | 7.06 | % | | | 6.05 | % | | | 6.07 | % | | | 6.39 | % | | | 4.82 | % |
| Net investment income, net waiver and reimbursement | | | 7.36 | % | | | 6.33 | % | | | 6.31 | % | | | 6.68 | % | | | 5.17 | % |
| Portfolio turnover rate | | | 13 | % | | | 29 | % | | | 57 | % | | | 58 | % | | | 94 | % |
| (A) | Per share amounts calculated using average shares method, which more appropriately presents the per share data for the period. |
| (B) | Total return in the above table represents the rate that the investor would have earned or lost on an investment in the Fund assuming reinvestment of dividends. Had the advisor not waived its fees and reimbursed expenses, total return would have been lower. |
| (C) | Includes adjustments in accordance with accounting principles generally accepted in the United States and, consequently, the net asset value for financial reporting purposes and the returns based upon those net asset values may differ from the net asset values and returns for shareholder transactions. |
| (D) | Ratios to average net assets (excluding interest expense) |
| Expenses, before waiver and reimbursement | | | 1.80 | % |
| Expenses, net waiver and reimbursement | | | 1.50 | % |
The accompanying notes are an integral part of these financial statements.
| CATALYST FUNDS |
| Catalyst/MAP Global Balanced Fund |
| Financial Highlights |
| |
| For a Share Outstanding Throughout Each Year |
| | | Class A | |
| | | For the | | | For the | | | For the | | | For the | | | For the | |
| | | Year Ended | | | Year Ended | | | Year Ended | | | Year Ended | | | Year Ended | |
| | | June 30, 2024 | | | June 30, 2023 | | | June 30, 2022 | | | June 30, 2021 | | | June 30, 2020 | |
| Net asset value, beginning of year | | $ | 11.44 | | | $ | 11.36 | | | $ | 12.69 | | | $ | 10.95 | | | $ | 11.65 | |
| INCOME (LOSS) FROM INVESTMENT OPERATIONS: | | | | | | | | | | | | | | | | | | | | |
| Net investment income (A) | | | 0.28 | | | | 0.23 | | | | 0.22 | | | | 0.20 | | | | 0.22 | |
| Net realized and unrealized gain (loss) on investments | | | 0.29 | | | | 0.15 | | | | (0.80 | ) | | | 1.74 | | | | (0.60 | ) |
| Total from investment operations | | | 0.57 | | | | 0.38 | | | | (0.58 | ) | | | 1.94 | | | | (0.38 | ) |
| LESS DISTRIBUTIONS: | | | | | | | | | | | | | | | | | | | | |
| From net investment income | | | (0.27 | ) | | | (0.23 | ) | | | (0.28 | ) | | | (0.20 | ) | | | (0.21 | ) |
| From net realized gains | | | (0.32 | ) | | | (0.07 | ) | | | (0.47 | ) | | | (0.00 | ) (B) | | | (0.11 | ) |
| Total distributions | | | (0.59 | ) | | | (0.30 | ) | | | (0.75 | ) | | | (0.20 | ) | | | (0.32 | ) |
| Net asset value, end of year | | $ | 11.42 | | | $ | 11.44 | | | $ | 11.36 | | | $ | 12.69 | | | $ | 10.95 | |
| Total return (C) | | | 5.20 | % | | | 3.40 | % | | | (4.90 | )% | | | 17.83 | % | | | (3.27 | )% |
| RATIOS/SUPPLEMENTAL DATA: | | | | | | | | | | | | | | | | | | | | |
| Net assets, end of year (in 000’s) | | $ | 4,147 | | | $ | 2,219 | | | $ | 2,418 | | | $ | 2,681 | | | $ | 3,502 | |
| Ratios to average net assets | | | | | | | | | | | | | | | | | | | | |
| Expenses, before waiver and reimbursement (D) | | | 2.37 | % | | | 2.27 | % | | | 2.07 | % | | | 2.00 | % | | | 1.95 | % |
| Expenses, net waiver and reimbursement (D) | | | 1.22 | % | | | 1.22 | % | | | 1.22 | % | | | 1.22 | % | | | 1.22 | % |
| Net investment income, before waiver and reimbursement (D,E) | | | 1.32 | % | | | 0.95 | % | | | 0.95 | % | | | 0.92 | % | | | 1.22 | % |
| Net investment income, net waiver and reimbursement (D,E) | | | 2.47 | % | | | 2.00 | % | | | 1.81 | % | | | 1.70 | % | | | 1.95 | % |
| Portfolio turnover rate | | | 30 | % | | | 36 | % | | | 25 | % | | | 18 | % | | | 49 | % |
| | | | | | | | | | | | | | | | | | | | | |
| | | | | | | | | | | | | | | | | | | | | |
| | | Class C | |
| | | For the | | | For the | | | For the | | | For the | | | For the | |
| | | Year Ended | | | Year Ended | | | Year Ended | | | Year Ended | | | Year Ended | |
| | | June 30, 2024 | | | June 30, 2023 | | | June 30, 2022 | | | June 30, 2021 | | | June 30, 2020 | |
| Net asset value, beginning of year | | $ | 11.23 | | | $ | 11.18 | | | $ | 12.55 | | | $ | 10.85 | | | $ | 11.52 | |
| INCOME (LOSS) FROM INVESTMENT OPERATIONS: | | | | | | | | | | | | | | | | | | | | |
| Net investment income (A) | | | 0.20 | | | | 0.14 | | | | 0.13 | | | | 0.12 | | | | 0.13 | |
| Net realized and unrealized gain (loss) on investments | | | 0.28 | | | | 0.15 | | | | (0.78 | ) | | | 1.70 | | | | (0.58 | ) |
| Total from investment operations | | | 0.48 | | | | 0.29 | | | | (0.65 | ) | | | 1.82 | | | | (0.45 | ) |
| LESS DISTRIBUTIONS: | | | | | | | | | | | | | | | | | | | | |
| From net investment income | | | (0.19 | ) | | | (0.17 | ) | | | (0.25 | ) | | | (0.12 | ) | | | (0.11 | ) |
| From net realized gains | | | (0.32 | ) | | | (0.07 | ) | | | (0.47 | ) | | | (0.00 | ) (B) | | | (0.11 | ) |
| Total distributions | | | (0.51 | ) | | | (0.24 | ) | | | (0.72 | ) | | | (0.12 | ) | | | (0.22 | ) |
| Net asset value, end of year | | $ | 11.20 | | | $ | 11.23 | | | $ | 11.18 | | | $ | 12.55 | | | $ | 10.85 | |
| Total return (C) | | | 4.43 | % | | | 2.60 | % | | | (5.57 | )% | | | 16.87 | % | | | (3.93 | )% |
| RATIOS/SUPPLEMENTAL DATA: | | | | | | | | | | | | | | | | | | | | |
| Net assets, end of year (in 000’s) | | $ | 3,097 | | | $ | 5,217 | | | $ | 5,972 | | | $ | 6,653 | | | $ | 6,249 | |
| Ratios to average net assets | | | | | | | | | | | | | | | | | | | | |
| Expenses, before waiver and reimbursement (D) | | | 3.12 | % | | | 3.02 | % | | | 2.82 | % | | | 2.75 | % | | | 2.70 | % |
| Expenses, net waiver and reimbursement (D) | | | 1.97 | % | | | 1.97 | % | | | 1.97 | % | | | 1.97 | % | | | 1.97 | % |
| Net investment income, before waiver and reimbursement (D,E) | | | 0.68 | % | | | 0.17 | % | | | 0.19 | % | | | 0.23 | % | | | 0.47 | % |
| Net investment income, net waiver and reimbursement (D,E) | | | 1.83 | % | | | 1.22 | % | | | 1.04 | % | | | 1.01 | % | | | 1.20 | % |
| Portfolio turnover rate | | | 30 | % | | | 36 | % | | | 25 | % | | | 18 | % | | | 49 | % |
| (A) | Per share amounts calculated using average shares method, which more appropriately presents the per share data for the year. |
| (B) | Represents less than $0.01 per share. |
| (C) | Total return in the above tables represents the rate that the investor would have earned or lost on an investment in the Fund assuming reinvestment of dividends and does not reflect the impact of sales charges, if any. Had the advisor not waived its fees and reimbursed expenses, total return would have been lower. |
| (D) | Does not include expenses of the underlying investment companies in which the Fund invests. |
| (E) | Recognition of net investment income is affected by the timing and declaration of dividends by the underlying investment companies in which the Fund invests. |
The accompanying notes are an integral part of these financial statements.
| CATALYST FUNDS |
| Catalyst/MAP Global Balanced Fund (Continued) |
| Financial Highlights |
| |
| For a Share Outstanding Throughout Each Year |
| | | Class I | |
| | | For the | | | For the | | | For the | | | For the | | | For the | |
| | | Year Ended | | | Year Ended | | | Year Ended | | | Year Ended | | | Year Ended | |
| | | June 30, 2024 | | | June 30, 2023 | | | June 30, 2022 | | | June 30, 2021 | | | June 30, 2020 | |
| Net asset value, beginning of year | | $ | 11.47 | | | $ | 11.39 | | | $ | 12.70 | | | $ | 10.96 | | | $ | 11.67 | |
| INCOME (LOSS) FROM INVESTMENT OPERATIONS: | | | | | | | | | | | | | | | | | | | | |
| Net investment income (A) | | | 0.32 | | | | 0.25 | | | | 0.25 | | | | 0.23 | | | | 0.25 | |
| Net realized and unrealized gain (loss) on investments | | | 0.29 | | | | 0.15 | | | | (0.79 | ) | | | 1.74 | | | | (0.60 | ) |
| Total from investment operations | | | 0.61 | | | | 0.40 | | | | (0.54 | ) | | | 1.97 | | | | (0.35 | ) |
| LESS DISTRIBUTIONS: | | | | | | | | | | | | | | | | | | | | |
| From net investment income | | | (0.32 | ) | | | (0.25 | ) | | | (0.30 | ) | | | (0.23 | ) | | | (0.25 | ) |
| From net realized gains | | | (0.32 | ) | | | (0.07 | ) | | | (0.47 | ) | | | (0.00 | ) (B) | | | (0.11 | ) |
| Total distributions | | | (0.64 | ) | | | (0.32 | ) | | | (0.77 | ) | | | (0.23 | ) | | | (0.36 | ) |
| Net asset value, end of year | | $ | 11.44 | | | $ | 11.47 | | | $ | 11.39 | | | $ | 12.70 | | | $ | 10.96 | |
| Total return (C) | | | 5.55 | % | | | 3.59 | % | | | (4.61 | )% | | | 18.12 | % | | | (3.04 | )% |
| RATIOS/SUPPLEMENTAL DATA: | | | | | | | | | | | | | | | | | | | | |
| Net assets, end of year (in 000’s) | | $ | 7,343 | | | $ | 7,525 | | | $ | 8,744 | | | $ | 10,504 | | | $ | 12,763 | |
| Ratios to average net assets | | | | | | | | | | | | | | | | | | | | |
| Expenses, before waiver and reimbursement (D) | | | 2.12 | % | | | 2.02 | % | | | 1.82 | % | | | 1.75 | % | | | 1.70 | % |
| Expenses, net waiver and reimbursement (D) | | | 0.97 | % | | | 0.97 | % | | | 0.97 | % | | | 0.97 | % | | | 0.97 | % |
| Net investment income, before waiver and reimbursement (D,E) | | | 1.64 | % | | | 1.18 | % | | | 1.16 | % | | | 1.15 | % | | | 1.47 | % |
| Net investment income, net waiver and reimbursement (D,E) | | | 2.79 | % | | | 2.23 | % | | | 2.01 | % | | | 1.93 | % | | | 2.20 | % |
| Portfolio turnover rate | | | 30 | % | | | 36 | % | | | 25 | % | | | 18 | % | | | 49 | % |
| | | | | | | | | | | | | | | | | | | | | |
| (A) | Per share amounts calculated using average shares method, which more appropriately presents the per share data for the period. |
| (B) | Represents less than $0.01 per share. |
| (C) | Total return in the above table represents the rate that the investor would have earned or lost on an investment in the Fund assuming reinvestment of dividends. Had the advisor not waived its fees and reimbursed expenses, total return would have been lower. |
| (D) | Does not include expenses of the underlying investment companies in which the Fund invests. |
| (E) | Recognition of net investment income is affected by the timing and declaration of dividends by the underlying investment companies in which the Fund invests. |
The accompanying notes are an integral part of these financial statements.
| CATALYST FUNDS |
| Catalyst/CIFC Senior Secured Income Fund |
| Financial Highlights |
| |
| For a Share Outstanding Throughout Each Year |
| | | Class A | |
| | | For the | | | For the | | | For the | | | For the | | | For the | |
| | | Year Ended | | | Year Ended | | | Year Ended | | | Year Ended | | | Year Ended | |
| | | June 30, 2024 | | | June 30, 2023 | | | June 30, 2022 | | | June 30, 2021 | | | June 30, 2020 | |
| Net asset value, beginning of year | | $ | 9.06 | | | $ | 8.94 | | | $ | 9.62 | | | $ | 9.11 | | | $ | 9.57 | |
| INCOME (LOSS) FROM INVESTMENT OPERATIONS: | | | | | | | | | | | | | | | | | | | | |
| Net investment income (A) | | | 0.78 | | | | 0.66 | | | | 0.33 | | | | 0.28 | | | | 0.40 | |
| Net realized and unrealized gain (loss) on investments | | | 0.21 | | | | 0.13 | | | | (0.69 | ) | | | 0.54 | | | | (0.40 | ) |
| Total from investment operations | | | 0.99 | | | | 0.79 | | | | (0.36 | ) | | | 0.82 | | | | 0.00 | |
| LESS DISTRIBUTIONS: | | | | | | | | | | | | | | | | | | | | |
| From net investment income | | | (0.78 | ) | | | (0.67 | ) | | | (0.32 | ) | | | (0.31 | ) | | | (0.46 | ) |
| Total distributions | | | (0.78 | ) | | | (0.67 | ) | | | (0.32 | ) | | | (0.31 | ) | | | (0.46 | ) |
| Net asset value, end of year | | $ | 9.27 | | | $ | 9.06 | | | $ | 8.94 | | | $ | 9.62 | | | $ | 9.11 | |
| Total return (B) | | | 11.29 | % | | | 9.12 | % | | | (3.91 | )% | | | 9.08 | % | | | (0.06 | )% (C,H) |
| RATIOS/SUPPLEMENTAL DATA: | | | | | | | | | | | | | | | | | | | | |
| Net assets, end of year (in 000’s) | | $ | 34,556 | | | $ | 16,572 | | | $ | 23,683 | | | $ | 19,682 | | | $ | 15,341 | |
| Ratios to average net assets (including interest expense) | | | | | | | | | | | | | | | | | | | | |
| Expenses, before waiver and reimbursement (D,E) | | | 1.48 | % | | | 1.55 | % | | | 1.53 | % | | | 1.59 | % | | | 1.66 | % |
| Expenses, net waiver and reimbursement (D,E) | | | 1.15 | % | | | 1.15 | % | | | 1.15 | % | | | 1.15 | % | | | 1.15 | % |
| Net investment income, before waiver and reimbursement (D,G) | | | 8.13 | % | | | 6.88 | % | | | 3.10 | % | | | 2.52 | % | | | 3.75 | % |
| Net investment income, net waiver and reimbursement (D,G) | | | 8.46 | % | | | 7.28 | % | | | 3.48 | % | | | 2.96 | % | | | 4.27 | % |
| Portfolio turnover rate | | | 103 | % | | | 84 | % | | | 95 | % | | | 180 | % | | | 231 | % |
| | | | | | | | | | | | | | | | |
| | | | | | | | | | | | | | | | |
| | | Class C | |
| | | For the | | | For the | | | For the | | | For the | | | For the | |
| | | Year Ended | | | Year Ended | | | Year Ended | | | Year Ended | | | Year Ended | |
| | | June 30, 2024 | | | June 30, 2023 | | | June 30, 2022 | | | June 30, 2021 | | | June 30, 2020 | |
| Net asset value, beginning of year | | $ | 9.03 | | | $ | 8.91 | | | $ | 9.59 | | | $ | 9.08 | | | $ | 9.54 | |
| INCOME (LOSS) FROM INVESTMENT OPERATIONS: | | | | | | | | | | | | | | | | | | | | |
| Net investment income (A) | | | 0.71 | | | | 0.60 | | | | 0.26 | | | | 0.21 | | | | 0.32 | |
| Net realized and unrealized gain (loss) on investments | | | 0.20 | | | | 0.12 | | | | (0.69 | ) | | | 0.54 | | | | (0.40 | ) |
| Total from investment operations | | | 0.91 | | | | 0.72 | | | | (0.43 | ) | | | 0.75 | | | | (0.08 | ) |
| LESS DISTRIBUTIONS: | | | | | | | | | | | | | | | | | | | | |
| From net investment income | | | (0.71 | ) | | | (0.60 | ) | | | (0.25 | ) | | | (0.24 | ) | | | (0.38 | ) |
| Total distributions | | | (0.71 | ) | | | (0.60 | ) | | | (0.25 | ) | | | (0.24 | ) | | | (0.38 | ) |
| Net asset value, end of year | | $ | 9.23 | | | $ | 9.03 | | | $ | 8.91 | | | $ | 9.59 | | | $ | 9.08 | |
| Total return (B) | | | 10.36 | % | | | 8.32 | % | | | (4.63 | )% | | | 8.30 | % | | | (0.81 | )% (C,H) |
| RATIOS/SUPPLEMENTAL DATA: | | | | | | | | | | | | | | | | | | | | |
| Net assets, end of year (in 000’s) | | $ | 36,066 | | | $ | 23,226 | | | $ | 21,907 | | | $ | 14,399 | | | $ | 11,716 | |
| Ratios to average net assets (including interest expense) | | | | | | | | | | | | | | | | | | | | |
| Expenses, before waiver and reimbursement (D,F) | | | 2.23 | % | | | 2.30 | % | | | 2.28 | % | | | 2.34 | % | | | 2.41 | % |
| Expenses, net waiver and reimbursement (D,F) | | | 1.90 | % | | | 1.90 | % | | | 1.90 | % | | | 1.90 | % | | | 1.90 | % |
| Net investment income, before waiver and reimbursement (D,G) | | | 7.38 | % | | | 6.26 | % | | | 2.37 | % | | | 1.75 | % | | | 2.95 | % |
| Net investment income, net waiver and reimbursement (D,G) | | | 7.72 | % | | | 6.66 | % | | | 2.74 | % | | | 2.19 | % | | | 3.46 | % |
| Portfolio turnover rate | | | 103 | % | | | 84 | % | | | 95 | % | | | 180 | % | | | 231 | % |
| (A) | Per share amounts calculated using average shares method, which more appropriately presents the per share data for the year. |
| (B) | Total return in the above table represents the rate that the investor would have earned or lost on an investment in the Fund assuming reinvestment of dividends and does not reflect the impact of sales charges, if any. Had the advisor not waived its fees and reimbursed expenses, total return would have been lower. |
| (C) | Includes increase from payments made by affiliated parties of 0.00% for the A shares and 0.11% for the C shares for June 30, 2020 related to the pricing errors reimbursement. Without these transactions, total return would have been (0.81)% for the A shares and (0.92)% for the C shares for June 30, 2020. |
| (D) | The ratios of expenses to average net assets and net investment income to average net assets do not reflect the expenses of the underlying investment companies in which the Fund invests. |
| (E) | Ratios to average net assets (excluding interest expense) |
| Expenses, before waiver and reimbursement (D) | | | 1.48 | % | | | 1.55 | % | | | 1.53 | % | | | 1.59 | % | | | 1.66 | % |
| Expenses, net waiver and reimbursement (D) | | | 1.15 | % | | | 1.15 | % | | | 1.15 | % | | | 1.15 | % | | | 1.15 | % |
| (F) | Ratios to average net assets (excluding interest expense) |
| Expenses, before waiver and reimbursement (D) | | | 2.23 | % | | | 2.30 | % | | | 2.28 | % | | | 2.34 | % | | | 2.41 | % |
| Expenses, net waiver and reimbursement (D) | | | 1.90 | % | | | 1.90 | % | | | 1.90 | % | | | 1.90 | % | | | 1.90 | % |
| (G) | Recognition of net investment income is affected by the timing and declaration of dividends by the underlying investment companies in which the Fund invests. |
| (H) | Includes adjustments in accordance with accounting principles generally accepted in the United States and, consequently, the net asset value for financial reporting purposes and the returns based upon those net asset values may differ from the net asset values and returns for shareholder transactions. |
The accompanying notes are an integral part of these financial statements.
| CATALYST FUNDS |
| Catalyst/CIFC Senior Secured Income Fund (Continued) |
| Financial Highlights |
| |
| For a Share Outstanding Throughout Each Year/Period |
| | | Class I | |
| | | For the | | | For the | | | For the | | | For the | | | For the | |
| | | Year Ended | | | Year Ended | | | Year Ended | | | Year Ended | | | Year Ended | |
| | | June 30, 2024 | | | June 30, 2023 | | | June 30, 2022 | | | June 30, 2021 | | | June 30, 2020 | |
| Net asset value, beginning of year | | $ | 9.07 | | | $ | 8.94 | | | $ | 9.63 | | | $ | 9.12 | | | $ | 9.59 | |
| INCOME (LOSS) FROM INVESTMENT OPERATIONS: | | | | | | | | | | | | | | | | | | | | |
| Net investment income (B) | | | 0.80 | | | | 0.68 | | | | 0.36 | | | | 0.32 | | | | 0.41 | |
| Net realized and unrealized gain (loss) on investments | | | 0.20 | | | | 0.14 | | | | (0.71 | ) | | | 0.52 | | | | (0.40 | ) |
| Total from investment operations | | | 1.00 | | | | 0.82 | | | | (0.35 | ) | | | 0.84 | | | | 0.01 | |
| LESS DISTRIBUTIONS: | | | | | | | | | | | | | | | | | | | | |
| From net investment income | | | (0.80 | ) | | | (0.69 | ) | | | (0.34 | ) | | | (0.33 | ) | | | (0.48 | ) |
| Total distributions | | | (0.80 | ) | | | (0.69 | ) | | | (0.34 | ) | | | (0.33 | ) | | | (0.48 | ) |
| Net asset value, end of year | | $ | 9.27 | | | $ | 9.07 | | | $ | 8.94 | | | $ | 9.63 | | | $ | 9.12 | |
| Total return (C) | | | 11.44 | % | | | 9.51 | % | | | (3.74 | )% (I) | | | 9.34 | % | | | 0.21 | % (D,I) |
| RATIOS/SUPPLEMENTAL DATA: | | | | | | | | | | | | | | | | | | | | |
| Net assets, end of year (in 000’s) | | $ | 396,246 | | | $ | 198,164 | | | $ | 202,444 | | | $ | 121,480 | | | $ | 63,191 | |
| Ratios to average net assets (including interest expense) | | | | | | | | | | | | | | | | | | | | |
| Expenses, before waiver and reimbursement (E,F) | | | 1.23 | % | | | 1.30 | % | | | 1.28 | % | | | 1.34 | % | | | 1.41 | % |
| Expenses, net waiver and reimbursement (E,F) | | | 0.90 | % | | | 0.90 | % | | | 0.90 | % | | | 0.90 | % | | | 0.90 | % |
| Net investment income, before waiver and reimbursement (E,H) | | | 8.38 | % | | | 7.19 | % | | | 3.39 | % | | | 2.88 | % | | | 3.88 | % |
| Net investment income, net waiver and reimbursement (E,H) | | | 8.71 | % | | | 7.59 | % | | | 3.77 | % | | | 3.31 | % | | | 4.39 | % |
| Portfolio turnover rate | | | 103 | % | | | 84 | % | | | 95 | % | | | 180 | % | | | 231 | % |
| | | | | | | | | | | | | | | | | | | | | |
| | | | | | | | | | | | | | | | | | | | | |
| | | Class C-1 (A) | | | | | | | | | | | | | |
| | | For the | | | For the | | | | | | | | | | | | | |
| | | Year Ended | | | Period Ended | | | | | | | | | | | | | |
| | | June 30, 2024 | | | June 30, 2023 | | | | | | | | | | | | | |
| Net asset value, beginning of year/period | | $ | 9.03 | | | $ | 8.84 | | | | | | | | | | | | | |
| INCOME (LOSS) FROM INVESTMENT OPERATIONS: | | | | | | | | | | | | | | | | | | | | |
| Net investment income (B) | | | 0.70 | | | | 0.45 | | | | | | | | | | | | | |
| Net realized and unrealized gain on investments | | | 0.20 | | | | 0.19 | | | | | | | | | | | | | |
| Total from investment operations | | | 0.90 | | | | 0.64 | | | | | | | | | | | | | |
| LESS DISTRIBUTIONS: | | | | | | | | | | | | | | | | | | | | |
| From net investment income | | | (0.71 | ) | | | (0.45 | ) | | | | | | | | | | | | |
| Total distributions | | | (0.71 | ) | | | (0.45 | ) | | | | | | | | | | | | |
| Net asset value, end of year | | $ | 9.22 | | | $ | 9.03 | | | | | | | | | | | | | |
| Total return (C) | | | 10.34 | % | | | 7.41 | % (J) | | | | | | | | | | | | |
| RATIOS/SUPPLEMENTAL DATA: | | | | | | | | | | | | | | | | | | | | |
| Net assets, end of period (in 000’s) | | $ | 590 | | | $ | 1 | | | | | | | | | | | | | |
| Ratios to average net assets (including interest expense) | | | | | | | | | | | | | | | | | | | | |
| Expenses, before waiver and reimbursement (E,G) | | | 2.23 | % | | | 2.51 | % (K) | | | | | | | | | | | | |
| Expenses, net waiver and reimbursement (E,G) | | | 1.90 | % | | | 1.90 | % (K) | | | | | | | | | | | | |
| Net investment income, before waiver and reimbursement (E,H) | | | 7.26 | % | | | 6.95 | % (K) | | | | | | | | | | | | |
| Net investment income, net waiver and reimbursement (E,H) | | | 7.58 | % | | | 7.56 | % (K) | | | | | | | | | | | | |
| Portfolio turnover rate | | | 103 | % | | | 84 | % (J) | | | | | | | | | | | | |
| (A) | Class C-1 commenced investment operations on November 1, 2022. |
| (B) | Per share amounts calculated using average shares method, which more appropriately presents the per share data for the year/period. |
| (C) | Total return in the above table represents the rate that the investor would have earned or lost on an investment in the Fund assuming reinvestment of dividends and does not reflect the impact of sales charges, if any. Had the advisor not waived its fees and reimbursed expenses, total return would have been lower. |
| (D) | Includes increase from payments made by affiliated parties of 0.11% related to the pricing errors reimbursement for June 30, 2020. Without these transactions, total return would have been 0.10% for June 30, 2020. |
| (E) | The ratios of expenses to average net assets and net investment income to average net assets do not reflect the expenses of the underlying investment companies in which the Fund invests. |
| (F) | Ratios to average net assets (excluding interest expense) |
| Expenses, before waiver and reimbursement (E) | | | 1.23 | % | | 1.30 | % (K) | | | 1.28 | % | | | 1.34 | % | | | 1.41 | % |
| Expenses, net waiver and reimbursement (E) | | | 0.90 | % | | 0.90 | % (K) | | | 0.90 | % | | | 0.90 | % | | | 0.90 | % |
| (G) | Ratios to average net assets (excluding interest expense) |
| Expenses, before waiver and reimbursement (E) | | | 2.23 | % | | | 2.51 | % (K) |
| Expenses, net waiver and reimbursement (E) | | | 1.90 | % | | | 1.90 | % (K) |
| (H) | Recognition of net investment income is affected by the timing and declaration of dividends by the underlying investment companies in which the Fund invests. |
| (I) | Includes adjustments in accordance with accounting principles generally accepted in the United States and, consequently, the net asset value for financial reporting purposes and the returns based upon those net asset values may differ from the net asset values and returns for shareholder transactions. |
The accompanying notes are an integral part of these financial statements.
| CATALYST FUNDS |
| Catalyst/SMH High Income Fund |
| Financial Highlights |
| |
| For a Share Outstanding Throughout Each Year |
| | | Class A | |
| | | For the | | | For the | | | For the | | | For the | | | For the | |
| | | Year Ended | | | Year Ended | | | Year Ended | | | Year Ended | | | Year Ended | |
| | | June 30, 2024 | | | June 30, 2023 | | | June 30, 2022 | | | June 30, 2021 | | | June 30, 2020 | |
| Net asset value, beginning of year | | $ | 3.43 | | | $ | 3.33 | | | $ | 4.23 | | | $ | 3.53 | | | $ | 3.79 | |
| INCOME (LOSS) FROM INVESTMENT OPERATIONS: | | | | | | | | | | | | | | | | | | | | |
| Net investment income (A) | | | 0.25 | | | | 0.22 | | | | 0.19 | | | | 0.17 | | | | 0.18 | |
| Net realized and unrealized gain (loss) on investments | | | 0.20 | | | | 0.10 | | | | (0.90 | ) | | | 0.70 | | | | (0.24 | ) |
| Total from investment operations | | | 0.45 | | | | 0.32 | | | | (0.71 | ) | | | 0.87 | | | | (0.06 | ) |
| LESS DISTRIBUTIONS: | | | | | | | | | | | | | | | | | | | | |
| From net investment income | | | (0.25 | ) | | | (0.22 | ) | | | (0.19 | ) | | | (0.16 | ) | | | (0.18 | ) |
| From net realized gains | | | — | | | | — | | | | (0.00 | ) (C) | | | (0.01 | ) | | | — | |
| From return of capital | | | — | | | | — | | | | (0.00 | ) (C) | | | (0.00 | ) (C) | | | (0.02 | ) |
| Total distributions | | | (0.25 | ) | | | (0.22 | ) | | | (0.19 | ) | | | (0.17 | ) | | | (0.20 | ) |
| Net asset value, end of year | | $ | 3.63 | | | $ | 3.43 | | | $ | 3.33 | | | $ | 4.23 | | | $ | 3.53 | |
| Total return (B) | | | 13.65 | % | | | 9.94 | % | | | (17.26 | )% | | | 25.21 | % | | | (1.51 | )% |
| RATIOS/SUPPLEMENTAL DATA: | | | | | | | | | | | | | | | | | | | | |
| Net assets, end of year (in 000’s) | | $ | 7,993 | | | $ | 7,495 | | | $ | 8,002 | | | $ | 8,889 | | | $ | 8,421 | |
| Ratios to average net assets (including interest expense) | | | | | | | | | | | | | | | | | | | | |
| Expenses, before waiver and reimbursement | | | 2.38 | % (D) | | | 2.36 | % (D) | | | 1.95 | % (D) | | | 2.04 | % | | | 2.07 | % |
| Expenses, net waiver and reimbursement | | | 1.48 | % (D) | | | 1.52 | % (D) | | | 1.49 | % (D) | | | 1.48 | % | | | 1.48 | % |
| Net investment income, before waiver and reimbursement | | | 6.13 | % | | | 5.72 | % | | | 4.31 | % | | | 3.71 | % | | | 4.22 | % |
| Net investment income, net waiver and reimbursement | | | 7.02 | % | | | 6.56 | % | | | 4.78 | % | | | 4.27 | % | | | 4.81 | % |
| Portfolio turnover rate | | | 33 | % | | | 41 | % | | | 42 | % | | | 51 | % | | | 21 | % |
| | | | | | | | | | | | | | | | | | | | | |
| | | | | | | | | | | | | | | | | | | | | |
| | | Class C | |
| | | For the | | | For the | | | For the | | | For the | | | For the | |
| | | Year Ended | | | Year Ended | | | Year Ended | | | Year Ended | | | Year Ended | |
| | | June 30, 2024 | | | June 30, 2023 | | | June 30, 2022 | | | June 30, 2021 | | | June 30, 2020 | |
| Net asset value, beginning of year | | $ | 3.44 | | | $ | 3.33 | | | $ | 4.23 | | | $ | 3.53 | | | $ | 3.79 | |
| INCOME (LOSS) FROM INVESTMENT OPERATIONS: | | | | | | | | | | | | | | | | | | | | |
| Net investment income (A) | | | 0.22 | | | | 0.20 | | | | 0.15 | | | | 0.14 | | | | 0.15 | |
| Net realized and unrealized gain (loss) on investments | | | 0.21 | | | | 0.10 | | | | (0.88 | ) | | | 0.70 | | | | (0.23 | ) |
| Total from investment operations | | | 0.43 | | | | 0.30 | | | | (0.73 | ) | | | 0.84 | | | | (0.08 | ) |
| LESS DISTRIBUTIONS: | | | | | | | | | | | | | | | | | | | | |
| From net investment income | | | (0.23 | ) | | | (0.19 | ) | | | (0.16 | ) | | | (0.13 | ) | | | (0.16 | ) |
| From net realized gains | | | — | | | | — | | | | (0.00 | ) (C) | | | (0.01 | ) | | | — | |
| From return of capital | | | — | | | | — | | | | (0.01 | ) | | | (0.00 | ) (C) | | | (0.02 | ) |
| Total distributions | | | (0.23 | ) | | | (0.19 | ) | | | (0.17 | ) | | | (0.14 | ) | | | (0.18 | ) |
| Net asset value, end of year | | $ | 3.64 | | | $ | 3.44 | | | $ | 3.33 | | | $ | 4.23 | | | $ | 3.53 | |
| Total return (B) | | | 12.77 | % | | | 9.40 | % | | | (17.91 | )% | | | 24.28 | % | | | (2.26 | )% |
| RATIOS/SUPPLEMENTAL DATA: | | | | | | | | | | | | | | | | | | | | |
| Net assets, end of year (in 000’s) | | $ | 1,875 | | | $ | 1,974 | | | $ | 2,534 | | | $ | 6,067 | | | $ | 5,444 | |
| Ratios to average net assets (including interest expense) | | | | | | | | | | | | | | | | | | | | |
| Expenses, before waiver and reimbursement | | | 3.13 | % (E) | | | 3.11 | % (E) | | | 2.70 | % (E) | | | 2.79 | % | | | 2.82 | % |
| Expenses, net waiver and reimbursement | | | 2.23 | % (E) | | | 2.27 | % (E) | | | 2.24 | % (E) | | | 2.23 | % | | | 2.23 | % |
| Net investment income, before waiver and reimbursement | | | 5.38 | % | | | 4.95 | % | | | 3.36 | % | | | 2.97 | % | | | 3.51 | % |
| Net investment income, net waiver and reimbursement | | | 6.28 | % | | | 5.79 | % | | | 3.81 | % | | | 3.53 | % | | | 4.09 | % |
| Portfolio turnover rate | | | 33 | % | | | 41 | % | | | 42 | % | | | 51 | % | | | 21 | % |
| (A) | Per share amounts calculated using average shares method, which more appropriately presents the per share data for the year. |
| (B) | Total return in the above table represents the rate that the investor would have earned or lost on an investment in the Fund assuming reinvestment of dividends and does not reflect the impact of sales charges, if any. Had the advisor not waived its fees and reimbursed expenses, total return would have been lower. |
| (C) | Less than $.005 per share |
| (D) | Ratios to average net assets (excluding interest expense) |
| Expenses, before waiver and reimbursement | | | 2.38 | % | | | 2.32 | % | | | 1.94 | % |
| Expenses, net waiver and reimbursement | | | 1.48 | % | | | 1.48 | % | | | 1.48 | % |
| (E) | Ratios to average net assets (excluding interest expense) |
| Expenses, before waiver and reimbursement | | | 3.13 | % | | | 3.07 | % | | | 2.69 | % |
| Expenses, net waiver and reimbursement | | | 2.23 | % | | | 2.23 | % | | | 2.23 | % |
The accompanying notes are an integral part of these financial statements.
| CATALYST FUNDS |
| Catalyst/SMH High Income Fund (Continued) |
| Financial Highlights |
| |
| For a Share Outstanding Throughout Each Year |
| | | Class I | |
| | | For the | | | For the | | | For the | | | For the | | | For the | |
| | | Year Ended | | | Year Ended | | | Year Ended | | | Year Ended | | | Year Ended | |
| | | June 30, 2024 | | | June 30, 2023 | | | June 30, 2022 | | | June 30, 2021 | | | June 30, 2020 | |
| Net asset value, beginning of year | | $ | 3.43 | | | $ | 3.33 | | | $ | 4.23 | | | $ | 3.53 | | | $ | 3.79 | |
| INCOME (LOSS) FROM INVESTMENT OPERATIONS: | | | | | | | | | | | | | | | | | | | | |
| Net investment income (A) | | | 0.26 | | | | 0.23 | | | | 0.20 | | | | 0.18 | | | | 0.19 | |
| Net realized and unrealized gain (loss) on investments | | | 0.21 | | | | 0.10 | | | | (0.90 | ) | | | 0.70 | | | | (0.24 | ) |
| Total from investment operations | | | 0.47 | | | | 0.33 | | | | (0.70 | ) | | | 0.88 | | | | (0.05 | ) |
| LESS DISTRIBUTIONS: | | | | | | | | | | | | | | | | | | | | |
| From net investment income | | | (0.26 | ) | | | (0.23 | ) | | | (0.20 | ) | | | (0.17 | ) | | | (0.19 | ) |
| From net realized gains | | | — | | | | — | | | | (0.00 | ) (C) | | | (0.01 | ) | | | — | |
| From return of capital | | | — | | | | — | | | | (0.00 | ) (C) | | | (0.00 | ) (C) | | | (0.02 | ) |
| Total distributions | | | (0.26 | ) | | | (0.23 | ) | | | (0.20 | ) | | | (0.18 | ) | | | (0.21 | ) |
| Net asset value, end of year | | $ | 3.64 | | | $ | 3.43 | | | $ | 3.33 | | | $ | 4.23 | | | $ | 3.53 | |
| Total return (B) | | | 14.24 | % | | | 10.22 | % | | | (17.06 | )% | | | 25.53 | % | | | (1.27 | )% |
| RATIOS/SUPPLEMENTAL DATA: | | | | | | | | | | | | | | | | | | | | |
| Net assets, end of year (in 000’s) | | $ | 5,264 | | | $ | 4,150 | | | $ | 7,566 | | | $ | 10,930 | | | $ | 2,995 | |
| Ratios to average net assets (including interest expense) | | | | | | | | | | | | | | | | | | | | |
| Expenses, before waiver and reimbursement | | | 2.13 | % (D) | | | 2.11 | % (D) | | | 1.70 | % (D) | | | 1.74 | % | | | 1.82 | % |
| Expenses, net waiver and reimbursement | | | 1.23 | % (D) | | | 1.27 | % (D) | | | 1.24 | % (D) | | | 1.23 | % | | | 1.23 | % |
| Net investment income, before waiver and reimbursement | | | 6.39 | % | | | 5.94 | % | | | 4.49 | % | | | 3.91 | % | | | 4.53 | % |
| Net investment income, net waiver and reimbursement | | | 7.28 | % | | | 6.72 | % | | | 4.94 | % | | | 4.42 | % | | | 5.12 | % |
| Portfolio turnover rate | | | 33 | % | | | 41 | % | | | 42 | % | | | 51 | % | | | 21 | % |
| (A) | Per share amounts calculated using average shares method, which more appropriately presents the per share data for the year. |
| (B) | Total return in the above table represents the rate that the investor would have earned or lost on an investment in the Fund assuming reinvestment of dividends. Had the advisor not waived its fees and reimbursed expenses, total return would have been lower. |
| (C) | Less than $.005 per share |
| (D) | Ratios to average net assets (excluding interest expense) |
| Expenses, before waiver and reimbursement | | | 2.13 | % | | | 2.07 | % | | | 1.69 | % |
| Expenses, net waiver and reimbursement | | | 1.23 | % | | | 1.23 | % | | | 1.23 | % |
The accompanying notes are an integral part of these financial statements.
| CATALYST FUNDS |
| Catalyst/SMH Total Return Income Fund |
| Financial Highlights |
| |
| For a Share Outstanding Throughout Each Year |
| | | Class A | |
| | | For the | | | For the | | | For the | | | For the | | | For the | |
| | | Year Ended | | | Year Ended | | | Year Ended | | | Year Ended | | | Year Ended | |
| | | June 30, 2024 | | | June 30, 2023 | | | June 30, 2022 | | | June 30, 2021 | | | June 30, 2020 | |
| Net asset value, beginning of year | | $ | 4.39 | | | $ | 4.23 | | | $ | 5.15 | | | $ | 3.74 | | | $ | 4.32 | |
| INCOME (LOSS) FROM INVESTMENT OPERATIONS: | | | | | | | | | | | | | | | | | | | | |
| Net investment income (A) | | | 0.30 | | | | 0.24 | | | | 0.18 | | | | 0.24 | | | | 0.22 | |
| Net realized and unrealized gain (loss) on investments | | | 0.32 | | | | 0.13 | | | | (0.87 | ) | | | 1.41 | | | | (0.53 | ) |
| Total from investment operations | | | 0.62 | | | | 0.37 | | | | (0.69 | ) | | | 1.65 | | | | (0.31 | ) |
| LESS DISTRIBUTIONS: | | | | | | | | | | | | | | | | | | | | |
| From net investment income | | | (0.28 | ) | | | (0.21 | ) | | | (0.15 | ) | | | (0.24 | ) | | | (0.23 | ) |
| From return of capital | | | — | | | | — | | | | (0.08 | ) | | | — | | | | (0.04 | ) |
| Total distributions | | | (0.28 | ) | | | (0.21 | ) | | | (0.23 | ) | | | (0.24 | ) | | | (0.27 | ) |
| Net asset value, end of year | | $ | 4.73 | | | $ | 4.39 | | | $ | 4.23 | | | $ | 5.15 | | | $ | 3.74 | |
| Total return (B) | | | 14.54 | % (G) | | | 9.01 | % | | | (13.92 | )% | | | 45.12 | % | | | (7.48 | )% |
| RATIOS/SUPPLEMENTAL DATA: | | | | | | | | | | | | | | | | | | | | |
| Net assets, end of year (in 000’s) | | $ | 5,376 | | | $ | 6,169 | | | $ | 6,756 | | | $ | 4,164 | | | $ | 2,485 | |
| Ratios to average net assets (including interest expense) | | | | | | | | | | | | | | | | | | | | |
| Expenses, before waiver and reimbursement (C) | | | 2.26 | % (E) | | | 2.18 | % (E) | | | 1.99 | % | | | 2.16 | % | | | 2.12 | % |
| Expenses, net waiver and reimbursement (C) | | | 1.58 | % (E) | | | 1.59 | % (E) | | | 1.58 | % | | | 1.58 | % | | | 1.58 | % |
| Net investment income, before waiver and reimbursement (C,D) | | | 5.94 | % | | | 4.86 | % | | | 3.22 | % | | | 4.85 | % | | | 4.81 | % |
| Net investment income, net waiver and reimbursement (C,D) | | | 6.62 | % | | | 5.45 | % | | | 3.63 | % | | | 5.43 | % | | | 5.35 | % |
| Portfolio turnover rate | | | 35 | % | | | 15 | % | | | 26 | % | | | 42 | % | | | 22 | % |
| | | | | | | | | | | | | | | | | | | | | |
| | | | | | | | | | | | | | | | | | | | | |
| | | Class C | |
| | | For the | | | For the | | | For the | | | For the | | | For the | |
| | | Year Ended | | | Year Ended | | | Year Ended | | | Year Ended | | | Year Ended | |
| | | June 30, 2024 | | | June 30, 2023 | | | June 30, 2022 | | | June 30, 2021 | | | June 30, 2020 | |
| Net asset value, beginning of year | | $ | 4.39 | | | $ | 4.23 | | | $ | 5.14 | | | $ | 3.73 | | | $ | 4.32 | |
| INCOME (LOSS) FROM INVESTMENT OPERATIONS: | | | | | | | | | | | | | | | | | | | | |
| Net investment income (A) | | | 0.27 | | | | 0.20 | | | | 0.15 | | | | 0.21 | | | | 0.19 | |
| Net realized and unrealized gain (loss) on investments | | | 0.31 | | | | 0.14 | | | | (0.87 | ) | | | 1.40 | | | | (0.54 | ) |
| Total from investment operations | | | 0.58 | | | | 0.34 | | | | (0.72 | ) | | | 1.61 | | | | (0.35 | ) |
| LESS DISTRIBUTIONS: | | | | | | | | | | | | | | | | | | | | |
| From net investment income | | | (0.25 | ) | | | (0.18 | ) | | | (0.11 | ) | | | (0.20 | ) | | | (0.20 | ) |
| From return of capital | | | — | | | | — | | | | (0.08 | ) | | | — | | | | (0.04 | ) |
| Total distributions | | | (0.25 | ) | | | (0.18 | ) | | | (0.19 | ) | | | (0.20 | ) | | | (0.24 | ) |
| Net asset value, end of year | | $ | 4.72 | | | $ | 4.39 | | | $ | 4.23 | | | $ | 5.14 | | | $ | 3.73 | |
| Total return (B) | | | 13.46 | % | | | 8.19 | % | | | (14.43 | )% | | | 44.18 | % | | | (8.40 | )% |
| RATIOS/SUPPLEMENTAL DATA: | | | | | | | | | | | | | | | | | | | | |
| Net assets, end of year (in 000’s) | | $ | 2,551 | | | $ | 2,834 | | | $ | 3,296 | | | $ | 8,600 | | | $ | 6,455 | |
| Ratios to average net assets (including interest expense) | | | | | | | | | | | | | | | | | | | | |
| Expenses, before waiver and reimbursement (C) | | | 3.01 | % (F) | | | 2.93 | % (F) | | | 2.74 | % | | | 2.92 | % | | | 2.87 | % |
| Expenses, net waiver and reimbursement (C) | | | 2.33 | % (F) | | | 2.34 | % (F) | | | 2.33 | % | | | 2.33 | % | | | 2.33 | % |
| Net investment income, before waiver and reimbursement (C,D) | | | 5.20 | % | | | 4.09 | % | | | 2.61 | % | | | 4.24 | % | | | 4.08 | % |
| Net investment income, net waiver and reimbursement (C,D) | | | 5.87 | % | | | 4.68 | % | | | 2.99 | % | | | 4.82 | % | | | 4.62 | % |
| Portfolio turnover rate | | | 35 | % | | | 15 | % | | | 26 | % | | | 42 | % | | | 22 | % |
| (A) | Per share amounts calculated using average shares method, which more appropriately presents the per share data for the year. |
| (B) | Total return in the above table represents the rate that the investor would have earned or lost on an investment in the Fund assuming reinvestment of dividends and does not reflect the impact of sales charges, if any. Had the advisor not waived its fees and reimbursed expenses, total return would have been lower. |
| (C) | Does not include expenses of the underlying investment companies in which the Fund invests. |
| (D) | Recognition of net investment income is affected by the timing and declaration of dividends by the underlying investment companies in which the Fund invests. |
| (E) | Ratios to average net assets (excluding interest expense) |
| Expenses, before waiver and reimbursement (C) | | | 2.26 | % | | | 2.17 | % |
| Expenses, net waiver and reimbursement (C) | | | 1.58 | % | | | 1.58 | % |
| (F) | Ratios to average net assets (excluding interest expense) |
| Expenses, before waiver and reimbursement (C) | | | 3.01 | % | | | 2.92 | % |
| Expenses, net waiver and reimbursement (C) | | | 2.33 | % | | | 2.33 | % |
| (G) | Includes adjustments in accordance with accounting principles generally accepted in the United States and, consequently, the net asset value for financial reporting purposes and the returns based upon those net asset values may differ from the net asset values and returns for shareholder transactions. |
The accompanying notes are an integral part of these financial statements.
| CATALYST FUNDS |
| Catalyst/SMH Total Return Income Fund (Continued) |
| Financial Highlights |
| |
| For a Share Outstanding Throughout Each Year |
| | | Class I | |
| | | For the | | | For the | | | For the | | | For the | | | For the | |
| | | Year Ended | | | Year Ended | | | Year Ended | | | Year Ended | | | Year Ended | |
| | | June 30, 2024 | | | June 30, 2023 | | | June 30, 2022 | | | June 30, 2021 | | | June 30, 2020 | |
| Net asset value, beginning of year | | $ | 4.38 | | | $ | 4.22 | | | $ | 5.13 | | | $ | 3.73 | | | $ | 4.32 | |
| INCOME (LOSS) FROM INVESTMENT OPERATIONS: | | | | | | | | | | | | | | | | | | | | |
| Net investment income (A) | | | 0.32 | | | | 0.25 | | | | 0.19 | | | | 0.27 | | | | 0.23 | |
| Net realized and unrealized gain (loss) on investments | | | 0.30 | | | | 0.13 | | | | (0.86 | ) | | | 1.38 | | | | (0.54 | ) |
| Total from investment operations | | | 0.62 | | | | 0.38 | | | | (0.67 | ) | | | 1.65 | | | | (0.31 | ) |
| LESS DISTRIBUTIONS: | | | | | | | | | | | | | | | | | | | | |
| From net investment income | | | (0.29 | ) | | | (0.22 | ) | | | (0.16 | ) | | | (0.25 | ) | | | (0.24 | ) |
| From return of capital | | | — | | | | — | | | | (0.08 | ) | | | — | | | | (0.04 | ) |
| Total distributions | | | (0.29 | ) | | | (0.22 | ) | | | (0.24 | ) | | | (0.25 | ) | | | (0.28 | ) |
| Net asset value, end of year | | $ | 4.71 | | | $ | 4.38 | | | $ | 4.22 | | | $ | 5.13 | | | $ | 3.73 | |
| Total return (B) | | | 14.63 | % | | | 9.32 | % | | | (13.57 | )% | | | 45.31 | % | | | (7.48 | )% |
| RATIOS/SUPPLEMENTAL DATA: | | | | | | | | | | | | | | | | | | | | |
| Net assets, end of year (in 000’s) | | $ | 9,902 | | | $ | 7,213 | | | $ | 8,702 | | | $ | 7,220 | | | $ | 4,304 | |
| Ratios to average net assets (including interest expense) | | | | | | | | | | | | | | | | | | | | |
| Expenses, before waiver and reimbursement (C) | | | 2.01 | % (E) | | | 1.93 | % (E) | | | 1.74 | % | | | 1.91 | % | | | 1.87 | % |
| Expenses, net waiver and reimbursement (C) | | | 1.33 | % (E) | | | 1.34 | % (E) | | | 1.33 | % | | | 1.33 | % | | | 1.33 | % |
| Net investment income, before waiver and reimbursement (C,D) | | | 6.23 | % | | | 5.10 | % | | | 3.52 | % | | | 5.39 | % | | | 5.03 | % |
| Net investment income, net waiver and reimbursement (C,D) | | | 6.92 | % | | | 5.69 | % | | | 3.93 | % | | | 5.96 | % | | | 5.56 | % |
| Portfolio turnover rate | | | 35 | % | | | 15 | % | | | 26 | % | | | 42 | % | | | 22 | % |
| (A) | Per share amounts calculated using average shares method, which more appropriately presents the per share data for the year. |
| (B) | Total return in the above table represents the rate that the investor would have earned or lost on an investment in the Fund assuming reinvestment of dividends. Had the advisor not waived its fees and reimbursed expenses, total return would have been lower. |
| (C) | Does not include expenses of the underlying investment companies in which the Fund invests. |
| (D) | Recognition of net investment income is affected by the timing and declaration of dividends by the underlying investment companies in which the Fund invests. |
| (E) | Ratios to average net assets (excluding interest expense) |
| Expenses, before waiver and reimbursement (C) | | | 2.01 | % | | | 1.92 | % |
| Expenses, net waiver and reimbursement (C) | | | 1.33 | % | | | 1.33 | % |
The accompanying notes are an integral part of these financial statements.
| CATALYST FUNDS |
| NOTES TO FINANCIAL STATEMENTS |
| June 30, 2024 |
(1) ORGANIZATION AND SIGNIFICANT ACCOUNTING POLICIES
Mutual Fund Series Trust (the “Trust”), was organized as an Ohio business trust on February 27, 2006. The Trust is registered as an open-end management investment company under the Investment Company Act of 1940, as amended, (“1940 Act”). The Trust currently consists of thirty-five series. These financial statements include the following six series set forth below (each a “Fund” and collectively, the “Funds”). The investment objectives of each Fund are set forth below. The Funds’ investment advisor is Catalyst Capital Advisors, LLC (the “Advisor” or “CCA”).
| Fund | Sub-Advisor | Primary Objective |
| Catalyst Insider Income (“Insider Income”) | | Current income |
| Catalyst Enhanced Income Strategy (“Enhanced Income”) | Wynkoop, LLC | Current income |
| Catalyst/MAP Global Balanced (“Global Balanced”) | Managed Asset Portfolios, LLC (“MAP”) | Total return which consists of current income and capital appreciation |
| Catalyst/CIFC Senior Secured Income Fund Formerly, Catalyst/CIFC Floating Rate Income (“Senior Secured Income”) | CIFC Investment Management, LLC | Current income |
| Catalyst/SMH High Income (“High Income”) | SMH Capital Advisors LLC (“SMH”) | Income with capital appreciation as secondary objective |
| Catalyst/SMH Total Return Income (“Total Return Income”) | SMH | Income and capital appreciation |
During the year ended June 30, 2024, Catalyst/CIFC Floating Rate Income Fund changed its name to Catalyst/CIFC Senior Secured Income Fund.
Insider Income, High Income and Total Return Income are each registered as non-diversified series of the trust, while Enhanced Income, Global Balanced and Senior Secured Income are diversified series of the Trust.
As of June 30, 2024, each Fund offers Class A, Class C and Class I shares. Additionally, Senior Secured Income Fund offers Class C-1 shares. Each class represents an interest in the same assets of the applicable Fund, and the classes are identical except for differences in their sales charge structures and ongoing service and distribution charges. All classes of shares have equal voting privileges except that each class has exclusive voting rights with respect to its service and/or distribution plans.
The following is a summary of significant accounting policies consistently followed by the Funds and are in accordance with accounting principles generally accepted in the United States of America (“GAAP”). Each Fund is an investment company and accordingly follows the investment company accounting and reporting guidance of the Financial Accounting Standards Board (“FASB”) Accounting Standards Codification Topic 946 “Financial Services – Investment Companies” and Accounting Standards Update (“ASU”) 2013-08.
a) Securities Valuation - Securities listed on an exchange are valued at the last reported sale price at the close of the regular trading session of the exchange on the business day the value is being determined, or in the case of securities listed on NASDAQ, at the NASDAQ Official Closing Price (“NOCP”). In the absence of a sale, such securities shall be valued at the last bid price on the day of valuation. Debt securities, including Bank Loans, (other than short-term obligations) are valued each day by an independent pricing service approved by the Board of Trustees (the “Board”) pursuant to Rule 2a-5 under the 1940 Act using methods which include current market quotations from a major market maker in the securities and based on methods which include the consideration of yields or prices of securities of comparable quality, coupon, maturity and type. The Funds may invest in portfolios of open-end (the “open-end funds”) or closed-end investment companies. Open-end funds are valued at their respective net asset values as reported by such investment companies. The underlying funds value securities in their portfolios for which market quotations are readily available at their market values (generally the last reported sale price) and all other securities and assets at their fair value by the methods established by the boards of directors of the open-end funds. The shares of many closed-end investment companies, after their initial public offering, frequently trade at a price per share, which is different than the net asset value per share. The difference represents a market premium or market discount of such shares. There can be no assurances that the market discount or market premium on shares of any closed-end investment company purchased by the Funds will not change. Short-term debt obligations having 60 days or less remaining until maturity, at time of purchase, may be valued at amortized cost, provided such valuations represent fair value. Options are valued at their closing price on the exchange they are traded on. When no closing price is available, options are valued at their mean price. Futures, which are traded on an exchange, are valued at the settlement price determined by the exchange. Foreign currency and forward currency exchange contracts are valued daily at the London Stock Exchange close each day.
| CATALYST FUNDS |
| NOTES TO FINANCIAL STATEMENTS (Continued) |
| June 30, 2024 |
In some circumstances, instead of valuing securities in the usual manner, the Funds may value securities at “fair value” as determined in good faith by the Advisor as valuation designee, pursuant to the 2a-5 procedures (the “Procedures”) approved by the Board. The Procedures consider, among others, the following factors to determine a security’s fair value: the nature and pricing history (if any) of the security; whether any dealer quotations for the security are available; and possible valuation methodologies that could be used to determine the fair value of the security. Fair value may also be used by the Board if extraordinary events occur after the close of the relevant world market but prior to the NYSE close.
Each Fund utilizes various methods to measure the fair value of most of its investments on a recurring basis. GAAP establishes a hierarchy that prioritizes inputs to valuation methods. The three levels of input are:
Level 1 – Unadjusted quoted prices in active markets for identical assets and liabilities that the Funds have the ability to access.
Level 2 – Observable inputs other than quoted prices included in Level 1 that are observable for the asset or liability, either directly or indirectly. These inputs may include quoted prices for the identical instrument in an inactive market, prices for similar instruments, interest rates, prepayment speeds, credit risk, yield curves, default rates and similar data.
Level 3 – Unobservable inputs for the asset or liability, to the extent relevant observable inputs are not available, representing the Funds’ own assumptions about the assumptions a market participant would use in valuing the asset or liability, and would be based on the best information available.
The availability of observable inputs can vary from security to security and is affected by a wide variety of factors, including, for example, the type of security, whether the security is new and not yet established in the marketplace, the liquidity of markets, and other characteristics particular to the security. To the extent that valuation is based on models or inputs that are less observable or unobservable in the market, the determination of fair value requires more judgment. Accordingly, the degree of judgment exercised in determining fair value is greatest for instruments categorized in Level 3.
The inputs used to measure fair value may fall into different levels of the fair value hierarchy. In such cases, for disclosure purposes, the level in the fair value hierarchy within which the fair value measurement falls in its entirety, is determined based on the lowest level input that is significant to the fair value measurement in its entirety.
The inputs or methodology used for valuing securities are not necessarily an indication of the risk associated with investing in those securities. The following tables summarize the inputs used as of June 30, 2024 for each Fund’s assets and liabilities measured at fair value:
| Insider Income | | | | | | | | | | | | |
| Assets(a) | | Level 1 | | | Level 2 | | | Level 3 | | | Total | |
| Convertible Bonds | | $ | — | | | $ | 24,716,295 | | | $ | — | | | $ | 24,716,295 | |
| Corporate Bonds | | | — | | | | 27,635,826 | | | | — | | | | 27,635,826 | |
| Money Market Fund | | | 2,208,449 | | | | — | | | | — | | | | 2,208,449 | |
| Total Assets | | $ | 2,208,449 | | | $ | 52,352,121 | | | $ | — | | | $ | 54,560,570 | |
| | | | | | | | | | | | | | | | | |
| Enhanced Income | | | | | | | | | | | | | | | | |
| Assets(a) | | Level 1 | | | Level 2 | | | Level 3 | | | Total | |
| Asset Backed Securities | | $ | — | | | $ | 197,789,573 | | | $ | — | | | $ | 197,789,573 | |
| U.S. Government & Agency Obligations | | | — | | | | 14,909,191 | | | | — | | | | 14,909,191 | |
| Money Market Fund | | | 6,280,161 | | | | — | | | | — | | | | 6,280,161 | |
| Total Assets | | $ | 6,280,161 | | | $ | 212,698,764 | | | $ | — | | | $ | 218,978,925 | |
| CATALYST FUNDS |
| NOTES TO FINANCIAL STATEMENTS (Continued) |
| June 30, 2024 |
| Global Balanced |
| Assets(a) | | Level 1 | | | Level 2 | | | Level 3 | | | Total | |
| Common Stocks | | $ | 6,915,827 | | | $ | — | | | $ | — | | | $ | 6,915,827 | |
| Exchange-Traded Fund | | | 391,765 | | | | — | | | | — | | | | 391,765 | |
| Corporate Bonds | | | — | | | | 5,022,308 | | | | — | | | | 5,022,308 | |
| U.S. Government & Agencies | | | — | | | | 1,396,590 | | | | — | | | | 1,396,590 | |
| Certificates of Deposit | | | — | | | | 739,586 | | | | — | | | | 739,586 | |
| Money Market Fund | | | 48,885 | | | | — | | | | — | | | | 48,885 | |
| Total Assets | | $ | 7,356,477 | | | $ | 7,158,484 | | | $ | — | | | $ | 14,514,961 | |
| Derivatives | | | | | | | | | | | | | | | | |
| Liabilities(a) | | | | | | | | | | | | | | | | |
| Call Options Written | | $ | 2,450 | | | $ | — | | | $ | — | | | $ | 2,450 | |
| Total Liabilities | | $ | 2,450 | | | $ | — | | | $ | — | | | $ | 2,450 | |
| | | | | | | | | | | | | | | | | |
| Senior Secured Income |
| Assets(a) | | Level 1 | | | Level 2 | | | Level 3 | | | Total | |
| Exchange-Traded Funds | | $ | 13,630,460 | | | $ | — | | | $ | — | | | $ | 13,630,460 | |
| Asset Backed Securities | | | — | | | | 30,782,055 | | | | — | | | | 30,782,055 | |
| Corporate Bonds | | | — | | | | 14,909,114 | | | | — | | | | 14,909,114 | |
| Term Loans | | | — | | | | 400,167,760 | | | | — | | | | 400,167,760 | |
| Money Market Fund | | | 57,404,245 | | | | — | | | | — | | | | 57,404,245 | |
| Total Assets | | $ | 71,034,705 | | | $ | 445,858,929 | | | $ | — | | | $ | 516,893,634 | |
| | | | | | | | | | | | | | | | | |
| High Income |
| Assets(a) | | Level 1 | | | Level 2 | | | Level 3 | | | Total | |
| Preferred Stock | | $ | 60,669 | | | $ | — | | | $ | — | | | $ | 60,669 | |
| Convertible Bonds | | | — | | | | 1,079,731 | | | | — | | | | 1,079,731 | |
| Corporate Bonds | | | — | | | | 12,537,031 | | | | 0 | | | | 12,537,031 | |
| Money Market Fund | | | 1,141,700 | | | | — | | | | — | | | | 1,141,700 | |
| Total | | | 1,202,369 | | | | 13,616,762 | | | | 0 | | | | 14,819,131 | |
| Collateral For Securities Loaned(b) | | | | | | | | | | | | | | | 4,123,185 | |
| Total Assets | | | | | | | | | | | | | | $ | 18,942,316 | |
| | | | | | | | | | | | | | | | | |
| Total Return Income |
| Assets(a) | | Level 1 | | | Level 2 | | | Level 3 | | | Total | |
| Common Stocks | | $ | 7,129,351 | | | $ | — | | | $ | — | | | $ | 7,129,351 | |
| Convertible Bonds | | | — | | | | 1,233,528 | | | | — | | | | 1,233,528 | |
| Corporate Bonds | | | — | | | | 9,039,622 | | | | 0 | | | | 9,039,622 | |
| Money Market Fund | | | 153,455 | | | | — | | | | — | | | | 153,455 | |
| Total | | | 7,282,806 | | | | 10,273,150 | | | | 0 | | | | 17,555,956 | |
| Collateral For Securities Loaned(b) | | | | | | | | | | | | | | | 6,310,735 | |
| Total Assets | | | | | | | | | | | | | | $ | 23,866,691 | |
| CATALYST FUNDS |
| NOTES TO FINANCIAL STATEMENTS (Continued) |
| June 30, 2024 |
Insider Income, Enhanced Income, Global Balanced and Senior Secured Income did not hold any Level 3 securities during the period. High Income and Total Return Income held level 3 securities. A reconciliation used in determining High Income’s and Total Return Income’s Level 3 securities is shown in the Level 3 Input table below.
| (a) | Refer to the Schedule of Investments for security details. |
| (b) | In accordance with Subtopic 820-10, certain investments that are measured at fair value using the net asset value per share (or its equivalent) have not been classified in the fair value hierarchy. The fair value amount presented in this table is intended to permit reconciliation of the fair value hierarchy to the amounts presented in the Statements of Assets and Liabilities. |
The following is a reconciliation for which Level 3 inputs were used in determining value:
| | | High Income | | | Total Return Income | |
| | | Energy Conversion | | | Energy Conversion | |
| | | Devices, Inc. | | | Devices, Inc. | |
| | | Corporate Bond | | | Corporate Bond | |
| Beginning balance June 30, 2023 | | $ | 0 | | | $ | 0 | |
| Purchases | | | — | | | | — | |
| Total realized gain/(loss) | | | — | | | | — | |
| Change in unrealized depreciation | | | — | | | | — | |
| Proceeds from sale/maturities/calls | | | — | | | | — | |
| Capital distribution | | | — | | | | — | |
| Net transfers in/(out) of Level 3 | | | — | | | $ | — | |
| Ending balance June 30, 2024 | | $ | 0 | | | | 0 | |
The total change in unrealized appreciation/(depreciation) included in the Statements of Operations attributable to Level 3 investments still held at June 30, 2024, was $0 for High Income and $0 for Total Return Income.
Quantitative disclosures of unobservable inputs and assumptions used by High Income and Total Return Income are below.
| | | | | | Market Value impact if |
| Fund | Investment Type | Fair Value | Valuation Methodology | Unobservable Input Type | input increases |
| High Income | Corporate Bonds | $0 | Bankruptcy | Potential Future Cash Pa yments | Increase |
| Total Return Income | Corporate Bonds | $0 | Bankruptcy | Potential Future Cash Pa yments | Increase |
Fair value securities as a percent of net assets at June 30, 2024, were 0.0% and 0.0% for High Income and Total Return Income, respectively.
b) Accounting for Options - The Funds are subject to equity price risks in the normal course of pursuing their investment objectives and may purchase or sell options to help hedge against risk. When the Funds write a call or put option, an amount equal to the premium received is included in the Statements of Assets and Liabilities as a liability. The amount of the liability is subsequently marked-to-market to reflect the current market value of the option. If an option expires on its stipulated expiration date or if the Funds enter into a closing purchase transaction, a gain or loss is realized. If a written put option is exercised, the purchase cost of the underlying security is reduced by the premium originally received. If a written call option is exercised, a gain or loss is realized for the sale of the underlying security and the proceeds from the sale are increased by the premium originally received. As writer of an option, the Funds have no control over whether the option will be exercised and, as a result, retain the market risk of an unfavorable change in the price of the security underlying the written option.
Certain Funds may purchase put and call options. Put options are purchased to hedge against a decline in the value of securities held in a Fund’s portfolio. If such a decline occurs, the put options will permit the Fund to sell the securities underlying such options at the exercise price, or to close out the options at a profit. The premium paid for a put or call option plus any transaction costs will reduce the benefit, if any, realized by the Fund upon exercise of the option, and, unless the price of the underlying security rises or declines sufficiently, the option may expire worthless to the Fund. In addition, in the event that the price of the security in connection with which an option was purchased moves in a direction favorable to the Fund, the benefits realized by the Fund as a result of such favorable movement will be reduced by the amount of the premium paid for the option and related transaction costs. Written and purchased options are non-income producing securities. With purchased options, there is minimal counterparty risk to the Funds since these options are exchange traded and the exchange’s clearinghouse, as counterparty to all exchange traded options, guarantees against a possible default. Initial margin deposits required upon entering into options contracts are satisfied by the deposits of cash as collateral for the account of the broker (the relevant Fund’s agent in acquiring the options). For the year ended June 30, 2024, Global Balanced invested in options.
| CATALYST FUNDS |
| NOTES TO FINANCIAL STATEMENTS (Continued) |
| June 30, 2024 |
Foreign Currency – All assets and liabilities denominated in foreign currencies are translated into U.S. dollars based on the rate of exchange of such currencies against U.S. dollars on the date of valuation. Purchases and sales of securities and income and expenses are translated at the rate of exchange quoted on the respective date that such transactions are recorded. The Funds do not isolate the portion of the results of operations for realized gain and losses resulting from changes in foreign exchange rates on investments from the fluctuations arising from changes in market prices of securities held. Unrealized gains and losses resulting from changes in foreign exchange rates on investments are not isolated from changes in the valuation of securities held.
Derivatives Risk – The use of derivative instruments, such as forwards, interest rate swaps, futures and options, involves risks different from, or possibly greater than, the risks associated with investing directly in securities and other traditional investments. These risks include (i) the risk that the counterparty to a derivative transaction may not fulfill its contractual obligations; (ii) risk of mispricing or improper valuation; and (iii) the risk that changes in the value of the derivative may not correlate perfectly with the underlying asset, rate or index. Derivative prices are highly volatile and may fluctuate substantially during a short period of time. Such prices are influenced by numerous factors that affect the markets, including, but not limited to: changing supply and demand relationships; government programs and policies; national and international political and economic events, changes in interest rates, inflation and deflation and changes in supply and demand relationships. Trading derivative instruments involves risks different from, or possibly greater than, the risks associated with investing directly in securities.
Credit Risk – Credit risk relates to the ability of the issuer to meet interest and principal payments, or both, as they come due. In general, lower-grade, higher-yield bonds are subject to credit risk to a greater extent than lower-yield, higher-quality bonds.
Foreign Exchange Rate Risk – Foreign exchange rate risk relates to the change in the U.S. dollar value of a security held that is denominated in a foreign currency. The U.S. dollar value of a foreign currency denominated security will decrease as the dollar appreciates against the currency, while the U.S. dollar value will increase as the dollar depreciates against the currency.
Interest Rate Risk – Interest rate risk refers to the fluctuations in value of fixed-income securities resulting from the inverse relationship between price and yield. For example, an increase in general interest rates will tend to reduce the market value of already issued fixed-income investments, and a decline in general interest rates will tend to increase their value. In addition, debt securities with longer maturities, which tend to have higher yields, are subject to potentially greater fluctuations in value from changes in interest rates than obligations with shorter maturities.
Volatility Risk – Volatility risk refers to the magnitude of the movement, but not the direction of the movement, in a financial instrument’s price over a defined time period. Large increases or decreases in a financial instrument’s price over a relative time period typically indicate greater volatility risk, while small increases or decreases in its price typically indicate lower volatility risk.
Market Risk – Overall market risks may also affect the value of the Funds. The market values of securities or other investments owned by the Funds will go up or down, sometimes rapidly or unpredictably. Factors such as economic growth and market conditions, interest rate levels, exchange rates and political events affect the securities markets. Changes in market conditions and interest rates generally do not have the same impact on all types of securities and instruments. Unexpected local, regional or global events and their aftermath, such as war; acts of terrorism; financial, political or social disruptions; natural, environmental or man-made disasters; climate-change and climate related events; the spread of infectious illnesses or other public health issues; recessions and depressions; or other tragedies, catastrophes and events could have a significant impact on the Funds and their investments and could result in increased premiums or discounts to a Fund’s net asset value, and may impair market liquidity, thereby increasing liquidity risk. Such events can cause investor fear and panic, which can adversely affect the economies of many companies, sectors, nations, regions and the market in general, in ways that cannot necessarily be foreseen. The Funds could lose money over short periods due to short-term market movements and over longer periods during more prolonged market downturns. During a general market downturn, multiple asset classes may be negatively affected. In times of severe market disruptions, you could lose your entire investment.
| CATALYST FUNDS |
| NOTES TO FINANCIAL STATEMENTS (Continued) |
| June 30, 2024 |
Derivatives are not accounted for as hedging instruments under GAAP. The effect of derivative instruments on the Statements of Assets and Liabilities at June 30, 2024, was as follows:
| | | | | | | Location of Derivatives on Statements | | Fair Value of asset/liability | |
| Fund | | Derivative | | Risk Type | | of Assets and Liabilities | | derivatives | |
| Global Balanced | | Call options written | | Equity | | Options written | | $ | (2,450 | ) |
| | | | | | | Total | | $ | (2,450 | ) |
The effect of derivative instruments on the Statements of Operations for the year ended June 30, 2024, was as follows:
| | | | | | | | | Realized and unrealized | |
| Fund | | Derivative | | Risk Type | | Location of gain (loss) on derivatives | | gain (loss) on derivatives | |
| Global Balanced | | | | | | | | | | |
| | | Options written | | Equity | | Net realized gain on options written | | $ | 30,848 | |
| | | Options written | | Equity | | Net change in unrealized depreciation on options written | | $ | (25,953 | ) |
| | | | | | | Total | | $ | 4,895 | |
The notional value of derivative instruments outstanding as of June 30, 2024, as disclosed in the Schedules of Investments and the amounts realized and changes in unrealized gains and losses on derivative instruments during the year ended June 30, 2024 as disclosed above and within the Statements of Operations serve as indicators of the volume of derivative activity for the Funds.
c) Investment Companies – Some Funds may invest in other investment companies, including closed-end funds and exchange traded funds (“ETFs”). ETFs are a type of fund bought and sold on a securities exchange. An ETF trades like common stock and represents a portfolio of securities. The risks of owning an ETF generally reflect the risks of owning the underlying securities, although the lack of liquidity on an ETF could result in it being more volatile. Additionally, ETFs have fees and expenses that reduce their value.
Underlying funds in which the Funds invest are subject to investment advisory and other expenses, which will be indirectly paid by the Funds. As a result, the cost of investing in the Funds will be higher than the cost of investing directly in the underlying funds and may be higher than other mutual funds that invest directly in stocks and bonds. Each of the underlying funds is subject to its own specific risks, but the advisor/sub-advisor expects the principal investments risks of such underlying funds will be similar to the risks of investing in the Funds.
d) Federal Income Tax - The Funds have qualified and intend to continue to qualify as regulated investment companies and to comply with the applicable provisions of the Internal Revenue Code of 1986, as amended, and to distribute substantially all of their taxable income to their shareholders. Therefore, no federal income or excise tax provisions are required.
As of and during the year or period ended June 30, 2024, the Funds did not have a liability for any unrecognized tax expense. The Funds recognize interest and penalties, if any, related to unrecognized tax expense as income tax expense in the Statements of Operations. As of June 30, 2024, the Funds did not incur any interest or penalties. As required, management has analyzed the Funds’ tax positions taken on or to be taken on Federal income tax returns for all open tax years (tax years or periods ended 2021-2023 for the Funds) or expected to be taken in 2024 and has concluded that no provision for income tax is required in these financial statements. The tax filings are open for examination by applicable taxing authorities, including the Internal Revenue Service. No examinations of the Funds’ filings are presently in progress.
e) Security Transactions and Investment Income - Investment and shareholder transactions are recorded on trade date. The Funds determine the gain or loss realized from the investment transactions by comparing the original cost of the security lot sold with the net sales proceeds. Dividend income is recognized on the ex-dividend date or as soon as information is available to the Funds and interest income is recognized on an accrual basis. Discounts and premiums on debt securities are amortized over their respective lives using the effective interest method, except certain callable debt securities that are held at premium and will be amortized to the earliest call date. Withholding taxes on foreign dividends have been provided for in accordance with the Funds’ understanding of the applicable country’s tax rules and rates. Distributions received from a Fund’s investments in MLPs generally are comprised of income and return of capital. The Funds record these distributions as investment income and subsequently adjusts these distributions within the components of net assets based upon their tax treatment when the information becomes available.
| CATALYST FUNDS |
| NOTES TO FINANCIAL STATEMENTS (Continued) |
| June 30, 2024 |
f) Multiple Class Allocations - Income, non-class specific expenses and realized/unrealized gains or losses are allocated to each class based on relative net assets. Distribution fees are charged to each respective share class in accordance with the distribution plan.
g) Expenses of the Trust that are directly identifiable to a specific fund are charged to that fund. Expenses, which are not readily identifiable to a specific fund, are allocated in such a manner as deemed equitable, taking into consideration the nature and type of expense and the relative sizes of the funds in the Trust.
h) Distribution to Shareholders - Distributions to shareholders, which are determined in accordance with income tax regulations and may differ from GAAP, are recorded on the ex-dividend date. The following table summarizes each Fund’s dividend and capital gain declaration policy:
| Fund | | Income Dividends | | Capital Gains |
| Insider Income | | Daily | | Annually |
| Enhanced Income | | Monthly | | Annually |
| Global Balanced | | Quarterly | | Annually |
| Senior Secured Income | | Daily | | Annually |
| High Income | | Monthly | | Annually |
| Total Return Income | | Monthly | | Annually |
i) Use of Estimates - The preparation of financial statements in conformity with GAAP requires management to make estimates and assumptions that affect the reported amounts of assets and liabilities and disclosure of contingent assets and liabilities at the date of the financial statements and the reported amounts of revenues and expenses during the reporting period. Actual results could differ from those estimates.
j) Indemnification - The Trust indemnifies its Officers and Trustees for certain liabilities that may arise from the performance of their duties to the Trust. Additionally, in the normal course of business, the Funds enter into contracts that contain a variety of representations and warranties and which provide general indemnities. The Funds’ maximum exposure under these arrangements is unknown, as this would involve future claims that may be made against the Funds that have not yet occurred. However, based on experience, the risk of loss due to these warranties and indemnities appears to be remote.
k) Redemption Fees and Sales Charges (loads) - A wire transfer fee of $15 may be charged to defray custodial charges for redemptions paid by wire transfer. A maximum sales charge of 5.75% is imposed on Class A shares of the Global Balanced and Total Return Income. A maximum sales charge of 4.75% is imposed on Class A shares of the Insider Income, Enhanced Income, Senior Secured Income , and High Income. Investments in Class A shares made at or above the $1 million breakpoint are not subject to an initial sales charge and may be subject to a 1% contingent deferred sales charge (“CDSC”) on shares redeemed within two years of purchase (excluding shares purchased with reinvested dividends and/or distributions). A CDSC of 1.00% is imposed on Class C-1 in the event of certain redemption transactions within one year following such investments. The respective shareholders pay such CDSC charges, which are not an expense of the Funds. During the year ended June 30, 2024 there were no CDSC fees paid by the shareholders of the Funds.
l) Cash – The Funds consider their investments in an FDIC insured interest bearing savings account to be cash. The Funds maintain cash balances, which, at times, may exceed federally insured limits. The Funds maintain these balances with a high quality financial institution.
m) Distributions from REITS — Distribution from REITs are initially recorded as dividend income and, to the extent such represent a return of capital or capital gain for tax purposes, are reclassified when such information becomes available.
| CATALYST FUNDS |
| NOTES TO FINANCIAL STATEMENTS (Continued) |
| June 30, 2024 |
(2) INVESTMENT TRANSACTIONS
For the year ended June 30, 2024, aggregate purchases and proceeds from sales of investment securities (excluding short-term investments) for the Funds were as follows:
| Fund | | Purchases | | | Sales | |
| Insider Income | | $ | 8,383,778 | | | $ | 24,058,894 | |
| Enhanced Income | | | 34,885,105 | | | | 197,323,525 | |
| Global Balanced | | | 3,950,927 | | | | 6,501,526 | |
| Senior Secured Income | | | 718,632,097 | | | | 360,605,792 | |
| High Income | | | 4,494,615 | | | | 4,845,430 | |
| Total Return Income | | | 5,995,352 | | | | 5,607,550 | |
(3) INVESTMENT ADVISORY AGREEMENT AND OTHER RELATED PARTY TRANSACTIONS
CCA acts as investment advisor for the Funds pursuant to the terms of a Investment Advisory Agreement with the Trust, on behalf of the Funds (the “Investment Advisory Agreement”). Under the terms of the Investment Advisory Agreement, the Advisor directs the investment operations of the Funds in accordance with each Fund’s respective investment policies and restrictions. The investment sub-advisors are responsible for the day-to-day operations of their Fund’s portfolios. The Advisor provides the Funds with investment advice and supervision and furnishes an investment program for the Funds. For its investment advisory services, the Funds pay to the Advisor, as of the last day of each month, an annualized fee as shown in the below table, such fees are to be computed daily based upon daily average net assets of the Funds. The Funds’ sub-advisors are paid by the Advisor, not the Funds.
The Advisor and the Trust, with respect to the Funds have entered into Expense Limitation Agreements (the “Expense Limitation”) under which the Advisor has contractually agreed to waive fees and/or reimburse expenses to the extent necessary to maintain total annual operating expenses (excluding brokerage costs; borrowing costs, such as (a) interest and (b) dividends on securities sold short; taxes; underlying fund expenses; and extraordinary expenses such as regulatory inquiry and litigation expenses) do not exceed the expense limitation shown in the table below based on each Fund’s average daily net assets.
For the year ended June 30, 2024, the Advisor waived advisory fees and reimbursed expenses. The Advisor may recapture a portion of the waived and/or reimbursed amounts. The Advisor may seek reimbursement only for fees waived or expenses reimbursed by a Fund within the three years following the date the waiver and/or reimbursement was incurred if the Fund is able to make the repayment without exceeding the limitation in effect at that time of the waiver and the limitation in effect at the time of recoupment, no later than the dates as stated below:
| | | | | | | | | | | | | | | Investment Advisory | |
| | | | | | | | | | | | | | | Fees Waived/ | |
| | | Investment | | Expense Limitation | | | | Expenses | |
| Fund | | Advisory Fee | | Cl A | | Cl C | | Cl I | | Cl C-1 | | Expires | | Reimbursed | |
| Insider Income | | 0.75% | | 1.00% | | 1.75% | | 0.75% | | N/A | | 10/31/2024 | | $ | 227,205 | |
| Enhanced Income | | 1.50% | | 1.75% | | 2.50% | | 1.50% | | N/A | | 10/31/2024 | | | 839,150 | |
| Global Balanced | | 1.00% | | 1.22% | | 1.97% | | 0.97% | | N/A | | 10/31/2024 | | | 171,633 | |
| Senior Secured Income | | 1.00% | | 1.15% | | 1.90% | | 0.90% | | 1.90% | | 10/31/2024 | | | 1,172,703 | |
| High Income | | 1.00% | | 1.48% | | 2.23% | | 1.23% | | N/A | | 10/31/2024 | | | 130,771 | |
| Total Return Income | | 1.00% | | 1.58% | | 2.33% | | 1.33% | | N/A | | 10/31/2024 | | | 115,968 | |
| CATALYST FUNDS |
| NOTES TO FINANCIAL STATEMENTS (Continued) |
| June 30, 2024 |
| | | Recapture Expires | |
| | | June 30, | |
| Fund | | 2025 | | | 2026 | | | 2027 | |
| Insider Income | | $ | 372,543 | | | $ | 292,989 | | | $ | 227,205 | |
| Enhanced Income | | | 1,120,683 | | | | 1,401,166 | | | | 839,150 | |
| Global Balanced | | | 161,770 | | | | 167,066 | | | | 171,633 | |
| Senior Secured Income | | | 785,104 | | | | 947,927 | | | | 1,172,703 | |
| High Income | | | 117,270 | | | | 127,991 | | | | 130,771 | |
| Total Return Income | | | 83,714 | | | | 100,308 | | | | 115,968 | |
A Trustee is also the controlling member of MFund Services, LLC (“MFund”) and the Advisor, and is not paid any fees directly by the Trust for serving as a Trustee.
Trustees who are not “interested persons” as that term is defined in the 1940 Act, are paid a quarterly retainer and receive compensation for each special Board meeting and Risk and Compliance Committee meeting attended. The fees paid to the Independent Trustees for their attendance at a meeting will be shared equally by the funds of the Trust in which the meeting relates. The Lead Independent Trustee of the Trust and, the Chairmen of the Trust’s Audit Committee and the Risk and Compliance Committee Chairmen receive an additional quarterly retainer. The “interested persons” of the Trust receive no compensation from the Funds. The Trust reimburses each Trustee and Officer for his or her travel and other expenses related to attendance at such meetings.
The Board has adopted the Trust’s Master Distribution Plan Pursuant to Rule 12b-1 (the “Plan”) under the 1940 Act. Each class of shares, excluding Class I shares, allows the Funds to pay distribution and shareholder servicing expenses of up to 0.50% per annum for the Class A shares and up to 1.00% for the Class C and Class C-1 shares based on average daily net assets of each class. The Class A shares are currently paying 0.25% per annum of 12b-1 fees and Class C and Class C-1 shares are currently paying 1.00% per annum of 12b-1 fees. The Plan for Class I Shares of Enhanced Income Fund allows the Fund to pay distribution and shareholder servicing expenses of up to 0.25% per annum of the average daily net assets of the Fund’s Class I Shares, although the Fund is not currently paying 12b-1 fees and there are no plans to impose those fees. The fee may be used for a variety of purposes, including compensating dealers and other financial service organizations for eligible services provided by those parties to the Funds and their shareholders and to reimburse Northern Lights Distributors, LLC (the “Distributor”) and Advisor for distribution related expenses. Brokers may receive a 1.00% commission from the Distributor for the sale of Class C and Class C-1 shares. Alt Fund Distributors LLC, acts as a wholesale marketing and distribution agent for the Funds. As compensation for these services, Alt Fund Distributors is entitled to reimbursement, through the Funds’ Rule 12b-1 Plan, of expenses attributable to sales of Fund shares including marketing materials, broker commission financing costs, and wholesaling fees.
Pursuant to the Management Services Agreement between the Trust and MFund, MFund, an affiliate of the Advisor, MFund provides the Funds with various management and legal administrative services (the “Management Services Agreement”). For these services, the Funds pay MFund an annual asset-based fee in accordance with the following schedule applied at the Fund family level (i.e., all the Funds in the Trust advised by the Advisor): 0.10% of net assets up to $50 million; 0.07% of net assets from $50 million to $100 million; 0.05% of net assets from $100 million to $250 million; 0.04% of net assets from $250 million to $500 million; 0.03% of net assets from $500 million to $1 billion; 0.02% of net assets from $1 billion to $5 billion; and 0.01% of assets from $5 billion and above. In addition, the Funds reimburse MFund for any reasonable out- of- pocket expenses incurred in the performance of its duties under the Management Services Agreement. The amounts due to MFund for the Management Services Agreement are listed in the Statements of Assets and Liabilities under “Payable to related parties” and the amounts accrued for the year are shown in the Statements of Operations under “Legal administration/Management service fees.”
Pursuant to the Compliance Services Agreement (the “Compliance Services Agreement”), MFund, provides chief compliance officer services to the Funds. For these services, the Funds pay MFund $1,200 per month for the first fund in the fund family and $400 each additional fund; $400 for each adviser and sub-adviser; and .0025% of the assets of each Fund. In addition, the Funds reimburse MFund for any reasonable out-of-pocket expenses incurred in the performance of its duties under the Compliance Services Agreement. The amounts due to MFund for chief compliance officer services are listed in the Statements of Assets and Liabilities under “Compliance Officer fees payable” and the amounts accrued for the year are shown in the Statements of Operations under “Compliance Officer fees.”
| CATALYST FUNDS |
| NOTES TO FINANCIAL STATEMENTS (Continued) |
| June 30, 2024 |
In addition, certain affiliates of the Distributor provide services to the Funds as follows:
Ultimus Fund Solutions, LLC (“UFS”) - an affiliate of the Distributor, provides administrative, fund accounting, and transfer agency services to the Funds pursuant to agreements with the Trust, for which it receives from each Fund: (i) basis points in decreasing amounts as assets reach certain breakpoints; and (ii) any related out-of-pocket expenses. Officers of the Trust are also employees of UFS, and are not paid any fees directly by the Trust for serving in such capacity.
Blu Giant, LLC (“Blu Giant”) – Blu Giant, an affiliate of the Distributor and UFS, provides EDGAR conversion and filing services as well as print management services for the Funds on an ad-hoc basis. For the provision of these services, Blu Giant receives customary fees from the Funds.
For the year ended June 30, 2024, the 12b-1 expenses accrued by the Funds were as follows:
| | | 12b-1 Fees | |
| Fund | | Class A | | | Class C | | | Class C-1 | |
| Insider Income | | $ | 11,059 | | | $ | 28,229 | | | | N/A | |
| Enhanced Income | | | 56,147 | | | | 146,039 | | | | N/A | |
| Global Balanced | | | 5,477 | | | | 52,842 | | | | N/A | |
| Senior Secured Income | | | 61,680 | | | | 292,294 | | | | 749 | |
| High Income | | | 19,604 | | | | 20,211 | | | | N/A | |
| Total Return Income | | | 14,737 | | | | 27,552 | | | | N/A | |
(4) AGGREGATE UNREALIZED APPRECIATION AND DEPRECIATION – TAX BASIS
| | | | | | Gross | | | Gross | | | Net Unrealized | |
| | | | | | Unrealized | | | Unrealized | | | Appreciation | |
| Fund | | Tax Cost | | | Appreciation | | | Depreciation | | | (Depreciation) | |
| Insider Income | | $ | 55,111,913 | | | $ | 481,654 | | | $ | (1,032,997 | ) | | $ | (551,343 | ) |
| Enhanced Income | | | 276,471,649 | | | | 6,202,315 | | | | (63,695,039 | ) | | | (57,492,724 | ) |
| Global Balanced | | | 12,800,480 | | | | 2,086,522 | | | | (374,491 | ) | | | 1,712,031 | |
| Senior Secured Income | | | 516,020,231 | | | | 4,791,722 | | | | (3,918,319 | ) | | | 873,403 | |
| High Income | | | 22,642,088 | | | | 417,017 | | | | (4,116,789 | ) | | | (3,699,772 | ) |
| Total Return Income | | | 27,154,324 | | | | 1,049,119 | | | | (4,336,752 | ) | | | (3,287,633 | ) |
(5) DISTRIBUTIONS TO SHAREHOLDERS AND TAX COMPONENTS OF CAPITAL
The tax character of distributions paid for the years ended June 30, 2024 and June 30, 2023 was as follows:
| For fiscal year ended | | Ordinary | | | Long-Term | | | Return of | | | | |
| 6/30/2024 | | Income | | | Capital Gains | | | Capital | | | Total | |
| Insider Income | | $ | 2,912,653 | | | $ | — | | | $ | — | | | $ | 2,912,653 | |
| Enhanced Income | | | 24,111,866 | | | | — | | | | — | | | | 24,111,866 | |
| Global Balanced | | | 362,732 | | | | 416,820 | | | | — | | | | 779,552 | |
| Senior Secured Income | | | 30,003,146 | | | | — | | | | — | | | | 30,003,146 | |
| High Income | | | 1,039,470 | | | | — | | | | — | | | | 1,039,470 | |
| Total Return Income | | | 1,046,368 | | | | — | | | | — | | | | 1,046,368 | |
| For fiscal year ended | | Ordinary | | | Long-Term | | | Return of | | | | |
| 6/30/2023 | | Income | | | Capital Gains | | | Capital | | | Total | |
| Insider Income | | $ | 3,798,325 | | | $ | 2,433 | | | $ | — | | | $ | 3,800,758 | |
| Enhanced Income | | | 33,822,370 | | | | — | | | | — | | | | 33,822,370 | |
| Global Balanced | | | 289,031 | | | | 100,532 | | | | — | | | | 389,563 | |
| Senior Secured Income | | | 17,581,441 | | | | — | | | | — | | | | 17,581,441 | |
| High Income | | | 971,976 | | | | — | | | | — | | | | 971,976 | |
| Total Return Income | | | 815,999 | | | | — | | | | — | | | | 815,999 | |
| CATALYST FUNDS |
| NOTES TO FINANCIAL STATEMENTS (Continued) |
| June 30, 2024 |
As of June 30, 2024, the components of accumulated earnings/(deficit) on a tax basis were as follows:
| | | Undistributed | | | Undistributed | | | Post October Loss | | | Capital Loss | | | Other | | | Unrealized | | | Total | |
| | | Ordinary | | | Long-Term | | | and | | | Carry | | | Book/Tax | | | Appreciation/ | | | Accumulated | |
| | | Income | | | Capital Gains | | | Late Year Loss | | | Forwards | | | Differences | | | (Depreciation) | | | Earnings/(Losses) | |
| Insider Income | | $ | 47,361 | | | $ | — | | | $ | (330,066 | ) | | $ | (8,426,421 | ) | | $ | (43,450 | ) | | $ | (551,343 | ) | | $ | (9,303,919 | ) |
| Enhanced Income | | | 209,091 | | | | — | | | | (31,433,819 | ) | | | (44,998,076 | ) | | | — | | | | (57,492,724 | ) | | | (133,715,528 | ) |
| Global Balanced | | | 29,375 | | | | — | | | | (420,376 | ) | | | (106,508 | ) | | | — | | | | 1,712,003 | | | | 1,214,494 | |
| Senior Secured Income | | | 1,365,982 | | | | — | | | | (233,855 | ) | | | (20,157,506 | ) | | | (722,151 | ) | | | 873,403 | | | | (18,874,127 | ) |
| High Income | | | 12,299 | | | | — | | | | (439,577 | ) | | | (31,221,514 | ) | | | — | | | | (3,699,772 | ) | | | (35,348,564 | ) |
| Total Return Income | | | 142,335 | | | | — | | | | (238,790 | ) | | | (17,817,283 | ) | | | — | | | | (3,287,633 | ) | | | (21,201,371 | ) |
The difference between book basis and tax basis unrealized appreciation (depreciation), undistributed net investment income (loss) and accumulated net realized gains (losses) from investments is primarily attributable to the tax deferral of losses on wash sales deemed dividend distributions, perpetual bonds and C-Corporation adjustments, adjustments for partnerships, grantor trusts and dividend distributions from business development companies. In addition, the amount listed under other book/tax differences is primarily attributable to dividends payable. The unrealized appreciation (depreciation) in the table above may include unrealized foreign currency gains (losses).
Capital losses incurred after October 31 within the fiscal year are deemed to arise on the first business day of the following fiscal year for tax purposes. The following Funds incurred and elected to defer such capital losses as follows:
| | | Post October | |
| | | Losses | |
| Insider Income | | $ | 330,066 | |
| Enhanced Income | | | 31,433,819 | |
| Global Balanced | | | 420,376 | |
| Senior Secured Income | | | 233,855 | |
| High Income | | | 439,577 | |
| Total Return Income | | | 238,790 | |
At June 30, 2024, the Funds below had capital loss carry forwards for federal income tax purposes available to offset future capital gains, as follows:
| | | Non - Expiring | | | | | | CLCF | |
| | | Short-Term | | | Long-Term | | | Total | | | Utilized | |
| Insider Income | | $ | 4,430,002 | | | $ | 3,996,419 | | | $ | 8,426,421 | | | $ | — | |
| Enhanced Income | | | 8,868,024 | | | | 36,130,052 | | | | 44,998,076 | | | | — | |
| Global Balanced | | | 27,807 | | | | 78,701 | | | | 106,508 | | | | — | |
| Senior Secured Income | | | 6,171,742 | | | | 13,985,764 | | | | 20,157,506 | | | | — | |
| High Income | | | 6,527 | | | | 31,214,987 | | | | 31,221,514 | | | | — | |
| Total Return Income | | | — | | | | 17,817,283 | | | | 17,817,283 | | | | — | |
| CATALYST FUNDS |
| NOTES TO FINANCIAL STATEMENTS (Continued) |
| June 30, 2024 |
(6) LINE OF CREDIT
Currently, the Funds have a $150,000,000 uncommitted line of credit provided by U.S. Bank National Association (the “Bank”) under an agreement (the “Uncommitted Line”). Any advance under the Uncommitted Line is contemplated primarily for temporary or emergency purposes, including the meeting of redemption requests that otherwise might require the untimely disposition of securities. Interest on borrowings is payable on an annualized basis. The Uncommitted Line has an interest rate of the Prime Rate with a maturity of January 22, 2025. The Uncommitted Line is not a “committed” line of credit, which is to say that the Bank is not obligated to lend money to the Funds. Accordingly, it is possible that the Funds may wish to borrow money for a temporary or emergency purpose but may not be able to do so. During the year ended June 30, 2024, Global Balanced and High Income did not access the line of credit. The Funds accessed the line of credit, based only on the days borrowed, as follows:
| | | Average Amount | | | | | | | | | | | | Outstanding | |
| | | Borrowings | | | Number of | | | Interest | | | Average | | | Borrowings | |
| | | Outstanding | | | Days Outstanding | | | Expense (1) | | | Interest Rate | | | 6/30/2024 | |
| Insider Income | | $ | 106,400 | | | | 8 | | | $ | 201 | | | | 8.50 | % | | $ | — | |
| Enhanced Income | | | 4,326,895 | | | | 87 | | | | 88,860 | | | | 8.50 | % | | | — | |
| Global Balanced | | | 31,941 | | | | 15 | | | | 113 | | | | 8.50 | % | | | — | |
| Total Return Income | | | 184,833 | | | | 6 | | | | 262 | | | | 8.50 | % | | | — | |
| (1) | Includes only Interest Expense for the year ended June 30, 2024 and may not agree back to the Statements of Operations, which also may include overdrafts, line of credit fees, and broker interests. |
(7) UNDERLYING INVESTMENTS IN OTHER INVESTMENT COMPANIES
Each underlying fund, including each ETF, is subject to specific risks, depending on the nature of the underlying fund. These risks could include liquidity risk, sector risk, foreign and related currency risk, as well as risks associated with real estate investments and commodities. Investors in the Funds will indirectly bear fees and expenses charged by the underlying investment companies in which the Funds invest in addition to the Funds’ direct fees and expenses.
The performance of the High Income and Total Return Income Funds will be directly affected by the performance of the Mount Vernon Liquid Assets Portfolio, LLC. The financial statements of the Mount Vernon Liquid Assets Portfolio, LLC, including the Schedule of Investments, can be found at the Securities and Exchange Commission’s (“SEC”) website www.sec.gov and should be read in conjunction with the Funds’ financial statements. As of June 30, 2024, the percentage of the High Income and Total Return Income Funds’ net assets invested in Mount Vernon Liquid Assets Portfolio, LLC was 27.3% and 35.4%, respectively.
(8) SECURITIES LENDING
The Funds have entered into a Securities Lending Agreement with the Bank. Each participating Fund can lend its securities to brokers, dealers and other financial institutions approved by the Board to earn additional income. Loans are collateralized at a value at least equal to 105% of the then current market value of any loaned security that are foreign, or 102% of the then current market value of any other loaned security. All interest and dividend payments received on securities which are held on loan, provided that there is no material default, will be paid to the respective Fund. A portion of the income generated by the investment in the Funds collateral, net of any rebates paid by the Bank to the borrowers is remitted to the Bank as lending agent and the remainder is paid to the Fund(s).
Securities lending income, if any, is disclosed in the Funds’ Statements of Operations and is net of fees retained by the counterparty. Although risk is mitigated by the collateral, the Funds could experience a delay in recovering their securities and possible loss of income or value if the Borrower fails to return them. Should the borrower of the securities fail financially, each Fund has the right to repurchase the securities using the collateral in the open market. The remaining contractual maturity of all securities lending transactions are overnight and continuous.
| CATALYST FUNDS |
| NOTES TO FINANCIAL STATEMENTS (Continued) |
| June 30, 2024 |
The below table shows the collateral held by each Fund at the year ended June 30, 2024.
| | | | | | | | | Percentage of Total | |
| Fund | | Market Value of Loaned Securities | | | Market Value of Collateral | | | Investment Income | |
| High Income * | | $ | 4,025,898 | | | $ | 4,123,185 | | | | 6.36 | % |
| Total Return Income* | | | 6,169,232 | | | | 6,310,735 | | | | 5.63 | % |
| * | Securities collateralized below 102% or 105% for foreign securities. The Trust’s securities lending policies and procedures require that the borrow er: (i) deliver cash or U.S. Government securities as collateral w ith respect to each new loan of U.S. securities, equal to at least 102% or 105% of the value of the portfolio securities loaned, and (ii) at all times thereafter mark-to-market the collateral on a daily basis so that the market value of such collateral is at least 100% of the value of securities loaned. From time to time the collateral may not be 102% or 105% due to end of day market movement. The next business day additional collateral is obtained/received from the borrow er to replenish/reestablish 102% or 105%. |
The following table presents financial instruments that are subject to enforceable netting arrangements as of June 30, 2024:
| | | | | | | | | | | | | | | | | | |
| | | | | | | | | | | | | | Gross Amounts Not Offset in the
Statement of Assets & Liabilities | | | | |
| Description | | Counterparty | | Gross Amounts
of Recognized
Assets | | | Gross Amounts
Offset in the
Statement of Assets &
Liabilities | | | Net Amounts of
Liabilities Presented in
the Statement of Assets
& Liabilities | | | Financial
Instruments (1) | | | Cash Collateral
Pledged | | | Net Amount | |
| High Income | | | | | | | | | | | | | | | | | | | | | | | | | | |
| Assets | | | | | | | | | | | | | | | | | | | | | | | | | | |
| Securities Loaned | | US Bank | | $ | 4,025,898 | | | $ | — | | | $ | 4,025,898 | | | $ | (4,025,898 | ) | | $ | — | | | $ | — | |
| | | | | | | | | | | | | | | | | | | | | | | | | | | |
| Total Return Income | | | | | | | | | | | | | | | | | | | | | | | | | | |
| Assets | | | | | | | | | | | | | | | | | | | | | | | | | | |
| Securities Loaned | | US Bank | | $ | 6,169,232 | | | $ | — | | | $ | 6,169,232 | | | $ | (6,169,232 | ) | | $ | — | | | $ | — | |
| | | | | | | | | | | | | | | | | | | | | | | | | | | |
| (1) | The amount is limited to the loaned securities and accordingly, does not include excess collateral pledged. |
(9) BENEFICIAL OWNERSHIP
The beneficial ownership, either directly or indirectly, of more than 25% of the voting securities of a fund creates a presumption of control of the fund, under Section 2(a)(9) of the 1940 Act. As of June 30, 2024, the companies that held more than 25% of the voting securities of the Funds, and may be deemed to control each respective Fund, are as follows:
| | | Insider | | | Enhanced | | | | | | High | | | Total Return | |
| Owner | | Income | | | Income | | | Global Balanced | | | Income | | | Income | |
| Charles Schwab & Co.(1) | | | — | | | | — | | | | — | | | | — | | | | 34 | % |
| LPL Financial (1) | | | 32 | % | | | 30 | % | | | — | | | | — | | | | — | |
| National Financial Services LLC (1) | | | — | | | | 31 | % | | | — | | | | — | | | | — | |
| Pershing LLC (1) | | | — | | | | — | | | | — | | | | 26 | % | | | — | |
| Raymond James (1) | | | — | | | | — | | | | 40 | % | | | — | | | | — | |
| Wells Fargo (1) | | | — | | | | — | | | | — | | | | 27 | % | | | 49 | % |
| (1) | These owners are comprised of multiple investors and accounts. |
(10) SUBSEQUENT EVENTS
Subsequent events after the date of the Statements of Assets and Liabilities have been evaluated through the date the financial statements were issued. Management has determined that no events or transactions occurred requiring adjustment or disclosure in the financial statements.

REPORT OF INDEPENDENT REGISTERED PUBLIC ACCOUNTING FIRM
To the Shareholders of Catalyst Insider Income Fund, Catalyst Enhanced Income Strategy Fund, Catalyst/MAP Global Balanced Fund, Catalyst/CIFC Senior Secured Income Fund, Catalyst/SMH High Income Fund, and Catalyst/SMH Total Return Income Fund and Board of Trustees of Mutual Fund Series Trust
Opinion on the Financial Statements
We have audited the accompanying statements of assets and liabilities, including the schedules of investments, of Catalyst Insider Income Fund, Catalyst Enhanced Income Strategy Fund, Catalyst/MAP Global Balanced Fund, Catalyst/CIFC Senior Secured Income Fund (formerly, Catalyst/CIFC Floating Rate Income Fund), Catalyst/SMH High Income Fund, and Catalyst/SMH Total Return Income Fund (the “Funds”), each a series of Mutual Fund Series Trust, as of June 30, 2024, the related statements of operations for the year then ended, the statements of changes in net assets and the financial highlights for each of the two years in the period then ended, and the related notes (collectively referred to as the “financial statements”). In our opinion, the financial statements present fairly, in all material respects, the financial position of the Funds as of June 30, 2024, the results of their operations for the year then ended, and the changes in net assets and the financial highlights for each of the two years in the period then ended, in conformity with accounting principles generally accepted in the United States of America.
The Funds’ financial highlights for the years ended June 30, 2022, and prior, were audited by other auditors whose report dated August 29, 2022, expressed an unqualified opinion on those financial highlights.
Basis for Opinion
These financial statements are the responsibility of the Funds’ management. Our responsibility is to express an opinion on the Funds’ financial statements based on our audits. We are a public accounting firm registered with the Public Company Accounting Oversight Board (United States) (“PCAOB”) and are required to be independent with respect to the Funds in accordance with the U.S. federal securities laws and the applicable rules and regulations of the Securities and Exchange Commission and the PCAOB.
We conducted our audits in accordance with the standards of the PCAOB. Those standards require that we plan and perform the audits to obtain reasonable assurance about whether the financial statements are free of material misstatement whether due to error or fraud.
Our audits included performing procedures to assess the risks of material misstatement of the financial statements, whether due to error or fraud, and performing procedures that respond to those risks. Such procedures included examining, on a test basis, evidence regarding the amounts and disclosures in the financial statements. Our procedures included confirmation of securities owned as of June 30, 2024, by correspondence with the custodians, brokers and agent banks; when replies were not received from brokers and agent banks, we performed other auditing procedures. Our audits also included evaluating the accounting principles used and significant estimates made by management, as well as evaluating the overall presentation of the financial statements. We believe that our audits provide a reasonable basis for our opinion.
We have served as the Funds’ auditor since 2023.

COHEN & COMPANY, LTD.
Philadelphia, Pennsylvania
August 29, 2024
COHEN & COMPANY, LTD.
800.229.1099 | 866.818.4538 fax | cohencpa.com
Registered with the Public Company Accounting Oversight Board
Page 5
| CATALYST FUNDS |
| SUPPLEMENTAL INFORMATION (Unaudited) |
| June 30, 2024 |
Consideration and Renewal of the Advisory Agreement between Catalyst Capital Advisors, LLC and Mutual Fund Series Trust with respect to Catalyst Systematic Alpha Fund, Catalyst/Warrington Strategic Program Fund, Catalyst Buffered Shield Fund, Catalyst/Millburn Dynamic Commodity Strategy Fund, Catalyst/Millburn Hedge Strategy Fund, Catalyst Nasdaq-100 Hedged Equity Fund, Catalyst Insider Buying Fund, Catalyst Energy Infrastructure Fund, Catalyst/MAP Global Equity Fund, Catalyst/MAP Global Balanced Fund, Catalyst/Lyons Tactical Allocation Fund, Catalyst Dynamic Alpha Fund, Catalyst Insider Income Fund, Catalyst/SMH High Income Fund, Catalyst/SMH Total Return Income Fund, Catalyst/CIFC Senior Secured Income Fund, and Catalyst Enhanced Income Strategy Fund
In connection with a meeting held on May 8, 9, and 28, 2023, the Board of Trustees (the “Board”) of Mutual Fund Series Trust (the “Trust”), including a majority of the Trustees who are not “interested persons” as that term is defined in the Investment Company Act of 1940, as amended, discussed the renewal of the advisory agreement (the “Catalyst Agreement”) between the Trust and Catalyst Capital Advisors, LLC (“Catalyst”) with respect to Catalyst Systematic Alpha Fund (“Catalyst SA”), Catalyst/Warrington Strategic Program Fund (“Warrington SP”), Catalyst Buffered Shield Fund (“Catalyst Shield”), Catalyst/Millburn Dynamic Commodity Strategy Fund (“Millburn DCS”), Catalyst/Millburn Hedge Strategy Fund (“Millburn HS”), Catalyst Nasdaq-100 Hedged Equity Fund (“Catalyst HE”), Catalyst Insider Buying Fund (“Catalyst IB”), Catalyst Energy Infrastructure Fund (“Catalyst Energy”), Catalyst/MAP Global Equity Fund (“MAP Global Equity”), Catalyst/MAP Global Balanced Fund (“MAP Global Balanced”), Catalyst/Lyons Tactical Allocation Fund (“Lyons TA”), Catalyst Dynamic Alpha Fund, (“Catalyst DA”), Catalyst Insider Income Fund (“Catalyst Insider”), Catalyst/SMH High Income Fund (“SMH High Income”), Catalyst/SMH Total Return Income Fund (“SMH Total Return”), Catalyst/CIFC Senior Secured Income Fund (“CIFC SSI”) and Catalyst Enhanced Income Strategy Fund (“Catalyst EIS”) (collectively, the “Catalyst Renewal Funds”).
The Board examined Catalyst’s responses to a series of questions regarding, among other things, its advisory services provided to the Catalyst Renewal Funds, comparative fee and expense information, and profitability from advising the Catalyst Renewal Funds. The Board was assisted by legal counsel throughout the review process and relied upon the advice of legal counsel and its own business judgment in determining the material factors to be considered in evaluating the Catalyst Agreement and the weight to be given to each factor considered. The conclusions reached by the Board were based on a comprehensive evaluation of all of the information provided and were not the result of any one factor. Moreover, each Trustee may have afforded different weight to the various factors in reaching his conclusions with respect to renewal of the Catalyst Agreement.
Nature, Extent and Quality of Services: The Board reviewed Catalyst’s corporate structure, officers, and compliance record and reviewed the key personnel servicing the Catalyst Renewal Funds, noting their expertise and years of experience. The Board considered that Catalyst provided continuous oversight of the sub-advisers for the Catalyst Renewal Funds noting that Catalyst assessed and monitored portfolio risk for the Catalyst Renewal Funds and oversaw each sub-advisers’ risk management program. The Board noted that Catalyst continued expansion of its investment operations and resources. The Board discussed Catalyst’s compliance program, and the observations of the Trust’s chief compliance officer related to the program. The Board considered the extent of services provided by Catalyst, including valuation support, management of the derivatives risk management program, proxy voting and reporting, and other critical operational and regulatory functions. The Board agreed that the adviser was appropriately focused on risk management, which was beneficial to the Catalyst Renewal Funds and their respective shareholders. The Board concluded that Catalyst’s services to the Funds were comprehensive, and the quality of service met the Board’s expectations.
Performance. The Board reviewed the performance for each Catalyst Renewal Fund in relation to its peer group, Morningstar category and benchmark index.
Catalyst SA: The Board observed that Catalyst SA significantly outperformed its peer group average, Morningstar category and benchmark indexes, for all time periods with the exception of the S&P 500 TR Index for the 1-year period. The Board noted the inception performance numbers contained the performance data from the prior strategy which was significantly different than the current strategy.
| CATALYST FUNDS |
| SUPPLEMENTAL INFORMATION (Unaudited) (Continued) |
| June 30, 2024 |
Warrington SP: The Board commented that Warrington SP underperformed its peer group average, Morningstar category and benchmark index for the 1-year, 5-year and 10-year periods but outperformed its peer group for the 3-year period. The Board noted that Catalyst explained that Warrington SP did not have the same level of long equities exposure as the funds in its peer group. The Board acknowledged that Warrington SP had changed its investment strategies and not all time periods were equally relevant and noted the Fund had provided strong returns in prior down markets.
Catalyst Shield: The Board discussed that Catalyst Shield underperformed its peer group and Morningstar category over the 3-year and 5-year periods but outperformed its peer group for the 1-year period. The Board observed that Catalyst Shield underperformed the benchmark index for all time periods. The Board recognized that Catalyst attributed the recent underperformance to Catalyst Shield’s losses on short-term credit used as collateral in the portfolio and the strong returns of the S&P 500.
Millburn DCS: The Board discussed that Millburn DCS outperformed the Bloomberg Commodity Index but underperformed the Peer Group and Morningstar Systematic Trend category and Morningstar Broad Basket category for the 1-year period. The Board noted that Millburn DCS underperformed its peer group, benchmark index and Commodities Broad basket Morningstar Category for all other periods. The Board recognized that Millburn DCS changed sub-adviser and investment strategy in 2021 so not all time periods were equally relevant to assessing Millburn DCS, and that the new strategy should be given additional time to fully assess its performance.
Millburn HS: The Board observed that Millburn HS outperformed its peer group average, Macro Trading Morningstar Category and BofA US 3-Month Treasury Bill TR Index over all time periods. The Board commented that Millburn HS underperformed the Multi-strategy Morningstar category for the 1-year period, Systematic Trend Morningstar category for the 5-year period and Credit Suisse MF Hedge Fund Index for the 3-year and 5-year periods. The Board recognized that the Fund trailed its benchmark, the S&P 500 index for all periods but noted that the investment strategy was not designed to outperform the S&P 500 in times of strong markets.
Catalyst HE: The Board observed that Catalyst HE significantly outperformed its peer group average, the Derivative Income and the Options Trading Morningstar categories and outperformed the S&P 500 TR Index for the 1-year period. The Board commented that Catalyst HE had underperformed its peer group average, the Derivative Income and the Options Trading Morningstar categories and S&P 500 TR Index and NASDAQ-100 Index for the 3-year and 5-year periods. The Board noted that Catalyst HE changed strategies in 2020 and therefore the 1- and 3-year time periods were the most relevant performance periods.
Catalyst IB: The Board noted that Catalyst IB had outperformed the benchmark index but underperformed its peer group average and Morningstar category for the 1-year period. The Board acknowledged that Catalyst explained that Catalyst IB outperformed the S&P 500 as a result of strategic stock selections but underperformed the peer group and Morningstar category because its portfolio did not include some of the top performers included in the peer group’s portfolios and benchmark index. The Board noted that Catalyst IB underperformed its peer group average, Morningstar category and benchmark index for the 3-, 5-, and 10-year periods. The Board observed that Catalyst explained this underperformance was a largely result of Catalyst IB’s defensive positioning in March and April 2020.
Catalyst Energy: The Board noted that Catalyst Energy underperformed its peer group average for the 1-year, 5-year and since inception periods and underperformed its Morningstar category for the 1-year period. The Board recognized that Catalyst Energy outperformed its peer group average and Morningstar category for the 3-year period. The Board noted that Catalyst Energy underperformed the Alerian MLP TR Index across all periods but recognized that SL Advisors attributed the underperformance to the returns of corporations underperforming MLPs. The Board observed that as a registered investment company, Catalyst Energy had additional restrictions on its investments that the benchmark index did not.
MAP Global Equity: The Board discussed that MAP Global Equity underperformed its peer group average, Morningstar category and benchmark indexes for all periods. The Board observed that Catalyst noted that the Fund did not invest in the “magnificent 7” stocks which led to higher returns for the peer group.
| CATALYST FUNDS |
| SUPPLEMENTAL INFORMATION (Unaudited) (Continued) |
| June 30, 2024 |
MAP Global Balanced: The Board noted that MAP Global Balanced underperformed its peer group average, Morningstar category, MSCI ACWI Index and blended indexes for all time periods. The Board acknowledged Catalyst’s explanation that MAP Global Balanced underperformed the benchmarks for the 1-year period due to the Fund’s lack of exposure to the “magnificent 7” securities along with the over exposure to and losses in the utilities sector. The Board noted for the 3- and 5-year periods, Catalyst attributed the underperformance to over exposure in the Consumer Staples, Communications Services and Energy sectors.
Lyons TA: The Board noted that Lyons TA had strong 1-year performance and outperformed all benchmarks for the 1-year and since inception periods but underperformed all benchmarks for the 3-year period. The Board observed that the Fund outperformed its peer group average and Morningstar category but underperformed the Lipper Flexible Portfolio Funds Index for the 5-year period. The Board noted Catalyst’s explanation that the 3-year underperformance was due to Lyons TA’s defensive positioning in July 2022 – May 2023.
Catalyst DA: The Board observed Catalyst DA underperformed its peer group average, Morningstar category and S&P 500 TR Index for the 1-year, 5-year and since inception periods. The Board noted that Catalyst DA outperformed its peer group average and Morningstar category for the 3-year period but slightly trailed the benchmark index. The Board recognized that Catalyst attributed the underperformance to the lack of large cap stocks in Catalyst DA.
Catalyst Insider: The Board observed that Catalyst Insider had outperformed the Short-Term Bond Morningstar category and the Bloomberg US Government/Credit 1-3 Year TR Index for the 1-, 3- and 5-year periods. The Board discussed that Catalyst Insider performed similarly to but trailed the peer group average for all time periods.
SMH High Income: The Board commented that SMH High Income had outperformed its peer group average, Morningstar category and BofA Merrill lynch US Cash Pay High Yield Index for the 1- and 5-year periods and provided similar performance for the 3-year period. The Board noted SMH High Income underperformed all benchmarks for the 10-year period. The Board discussed that Catalyst noted the 10-year underperformance included commodity exposure from 2014-2015 but that since that time, the strategy had performed well.
SMH Total Return: The Board discussed that SMH Total Return performed in line with its peer group average and outperformed all other benchmarks for the 1-year period other than the S&P 500 TR Index and blended index. The Board noted that SMH Total Return outperformed the peer group average, Morningstar category and BofA Merrill lynch US Cash Pay High Yield Index for the 3- and 5-year periods but trailed all benchmarks for the 10-year period. The Board recognized that Catalyst attributed the underperformance to SMH Total Return’s strategy of not being fully invested in equities and, therefore, it should not be expected to track the performance of the S&P 500 in strong markets.
CIFC SSI: The Board noted that CIFC SSI outperformed its peer group average and Morningstar category for all periods but underperformed the S&P LSTA US Leveraged Loan 100 Index for all periods. The Board discussed that CIFC SSI had changed its sub-adviser and, therefore, the most relevant periods were the 1-, 3-, and 5-year periods.
Catalyst EIS: The Board observed that Catalyst EIS underperformed all of its benchmarks for the 1-year period but outperformed all benchmarks since inception. The Board noted Catalyst EIS outperformed the Bloomberg US Aggregate Bond Index and Bloomberg MBS Index for the 3- and 5-year periods and peer group average for the 5-year period but trailed both Morningstar categories for the same periods. The Board discussed that Catalyst explained that Catalyst EIS had been forced to sell securities in a weak market which hurt overall performance.
After further discussion, the Board concluded that the performance of each Catalyst Renewal Fund was acceptable.
Fees and Expenses: The Board discussed the advisory fee paid by each of the Catalyst Renewal Funds and compared it to the fees charged to the peer group funds, and the funds in each of the Catalyst Renewal Funds’ Morningstar category. The Board reviewed the expense limitation agreements in place with respect to the Catalyst Renewal Funds and discussed that Catalyst intended to renew each of those agreements with the exception of Milburn HS, which did not have an expense limitation agreement in place. The Board reviewed the allocation of fees between Catalyst and the various sub-advisers, based on the sub-advisory fees paid to the sub-advisers for the applicable Funds by the adviser, in comparison to the level of service provided by Catalyst and each sub-adviser. The Board noted that the agreement between Catalyst and each sub-adviser was the product of an arm’s length negotiation
| CATALYST FUNDS |
| SUPPLEMENTAL INFORMATION (Unaudited) (Continued) |
| June 30, 2024 |
Catalyst SA: The Board noted that the advisory fee was above the median and average for the peer group and Morningstar category but was well below the high for each. The Board added that the net expense ratio was above the median and average for the Morningstar category but was below the median and average for the peer group.
Warrington SP: The Board noted that the advisory fee was above the median and average for the peer group and Morningstar category but was well below the high for each. The Board added that the net expense ratio was above the median and average for the Morningstar category but was below the median and average for the peer group.
Catalyst Shield: The Board observed that both the advisory fee and net expense ratio were higher than the medians and averages of its peer group and Morningstar category but were significantly below the highs of each.
Millburn DCS: The Board observed the advisory fee was above the median and averages for the peer group and Systematic Trend and Commodities Broad Basket Morningstar categories. The Board added the Millburn DCS’ advisory fee was below the highs for the peer group and Systematic Trend Morningstar category but was the highest for the Commodities Broad Basket Morningstar category. The Board noted that the net expense ratio was the highest for the Commodities Broad Basket Morningstar category and was below the high for the Systematic Trend Morningstar category. The Board recognized Catalyst’s explanation that Millburn DCS did not fit well into either of the Morningstar categories given the Fund’s managed future-type strategy and that when the fee waiver was taken into effect, the net advisory fee received after waivers was below the peer group average and within the range of both Morningstar categories.
Millburn HS: The Board observed the advisory fee was tied for the high of the Macro Trading Morningstar category at 1.75% but was below the highs for the peer group, Multi-strategy Morningstar category and Systematic Trend Morningstar category. The Board noted that the net expense ratio was above the average and medians but well within the range for the peer group and all three Morningstar categories.
Catalyst HE: The Board acknowledged the advisory fee and net expense ratio were above the high for the Derivatives Income Morningstar category but noted both were within the ranges for the peer group, and Option Trading Morningstar category. The Board discussed Catalyst’s explanation that the fees were justified given the specialized nature of the Fund and that the Option Trading Morningstar category included more similar funds to Catalyst HE than the Derivative Income Morningstar category and therefore provided a better reference.
Catalyst IB: The Board discussed that the advisory fee of 1.00% was above the median and average for the peer group and Morningstar category but was below the high of 1.25% and 1.95%, respectively. The Board added that the net expense ratio was above the median and average for the peer group and Morningstar category but below the highs for both.
Catalyst Energy: The Board discussed that Catalyst Energy’s advisory fee was tied for the high in both the peer group and Morningstar category. The Board commented that the expense ratio was above the median but below the average for the Energy Limited Partnership Morningstar category.
MAP Global Equity: The Board recognized the advisory fee for MAP Global Equity was tied for the high in the peer group at 1.00% but was below the high for the Morningstar category of 1.13%. The Board added that the expense ratio of 0.96% was slightly above the median and the average of the peer group but was below the high.
MAP Global Balanced: The Board acknowledged the advisory fee was in line with the high for the peer group but was within the range for the Global Allocation Morningstar category. The Board noted MAP Global Balanced’s expense ratio was slightly above the median for the peer group and median and averages for the Morningstar category but was significantly below the highs of each.
Lyons TA: The Board noted that the advisory fee of 1.25% for Lyons TA was higher than the average and median of the peer group and Morningstar category but was in line with the high of the peer group. The Board discussed that the net expense ratio for Lyons TA was well below the median and average expense ratio of the peer group and below the Morningstar category median and average expense ratio.
Catalyst DA: The Board observed that the advisory fee and net expense ratio were higher than the averages and medians of the peer group and Morningstar category, but lower than the highs of each.
| CATALYST FUNDS |
| SUPPLEMENTAL INFORMATION (Unaudited) (Continued) |
| June 30, 2024 |
Catalyst Insider: The Board discussed that the advisory fee for Catalyst Insider was above the median and average for the Short-Term Bond and High Yield Morningstar categories but was slightly above the median and in line with the average advisory fee for the peer group. The Board noted the advisory fee was well below the highs for both Morningstar categories. The Board added that the expense ratio was tied with the peer group average and below the median and was within the range for both Morningstar categories.
SMH High Income: The Board observed that the advisory fee and net expense ratio of 1.00% and 1.27%, respectively, were higher than the averages and medians of the peer group and Morningstar category but were both significantly lower than the highs of each.
SMH Total Return: The Board noted the advisory fee for SMH Total Return was above the median and average for the peer group and Moderately Conservative Allocation Morningstar category but was within the range for both. The Board commented that the net expense ratio was above the median and average for the peer group and Morningstar category and was well below the high for the peer group and in line with the high for the Morningstar category.
CIFC SSI: The Board recognized that the advisory fee was higher than the high for the peer group and the Bank Loan Morningstar category. The Board noted that the net expense ratio was equal to the peer group average, but higher than the median, and above the median and average of the Morningstar category but well below the highs of each. The Board discussed that the Fund was actively managed and that its portfolio focused on bank loans and other asset backed securities which required special expertise and experience. The Board noted Catalyst’s explanation that with the expense limitation in place, the net earned advisory fee was 0.60%, which was within range of its peer group and Morningstar category.
Catalyst EIS: The Board discussed that the advisory fee was below the high for the Non-Traditional Bond Morningstar category but was above the high for the peer group and in line with the high for the Multisector Bond Morningstar Category. The Board recognized the net expense ratio was below the median for the peer group but above the average and above the median and average for both Morningstar categories but well below the highs for each. The Board observed that Catalyst explained that with the expense limitation in place, the net earned advisory fee was 1.22% which is within the range of the peer group and both Morningstar categories.
The Board concluded that the advisory fee paid by each of the Catalyst Funds to Catalyst was not unreasonable.
Profitability. The Board reviewed the financial information provided by Catalyst, and discussed Catalyst’s profitability from its services to each of the Catalyst Renewal Funds. The Board considered the soft dollar benefits received by Catalyst. The Board noted that Catalyst operated Catalyst IB, Catalyst SA, MAP Global Balanced, SMH High Income, Catalyst HE, and Warrington SP at a loss, thus excessive profitability was not an issue. The Board reviewed that the other Catalyst Renewal Funds all generated a profit for Catalyst and discussed the level of profit of each Fund in actual dollars and as a percent or revenue. The Board determined these profits were not excessive.
Economies of Scale. The Board noted that the Catalyst Agreement did not contain breakpoints reducing the fee rate on assets based on certain specified levels. The Board noted that the shareholders of most of the Catalyst Renewal Funds received a benefit from the expense limitation agreements in place. The Board discussed the additional benefits that could be provided to shareholders if the Catalyst Renewal Funds reached asset levels that provide material economies of scale and determined it would review break points again as the Catalyst Renewal Funds increased AUM. The Board added that no Catalyst Renewal Fund had reached such levels where profits were excessive and agreed to revisit the issue of breakpoints at the Catalyst Agreement’s next renewal.
Conclusion. Having requested and received such information from Catalyst as the Board believed to be reasonably necessary to evaluate the terms of the advisory agreement, and as assisted by the advice of counsel, the Board concluded that renewal of the advisory agreement was in the best interests of each Catalyst Renewal Fund and its respective shareholders.
| CATALYST FUNDS |
| SUPPLEMENTAL INFORMATION (Unaudited) |
| June 30, 2024 |
Consideration and Renewal of Sub-Advisory Agreement between Catalyst Capital Advisors, LLC and Wynkoop LLC with respect to Catalyst Enhanced Income Strategy Fund
In connection with a meeting held on May 8, 9, and 28, 2024, the Board of Trustees (the “Board”) of Mutual Fund Series Trust, including a majority of the Trustees who are not “interested persons” as that term is defined in the Investment Company Act of 1940, as amended, discussed the renewal of a sub-advisory agreement (the “Wynkoop Agreement”) between Catalyst Capital Advisors, LLC (“Catalyst”) and Wynkoop LLC (“Wynkoop”) with respect to Catalyst Enhanced Income Strategy Fund (“Catalyst EIS”).
The Board examined Wynkoop’s responses to a series of questions regarding, among other things, its sub-advisory services provided to Catalyst EIS, comparative fee and expense information, and profitability from sub-advising Catalyst EIS. The Board was assisted by legal counsel throughout the review process and relied upon the advice of legal counsel and its own business judgment in determining the material factors to be considered in evaluating the Wynkoop Agreement and the weight to be given to each factor considered. The conclusions reached by the Board were based on a comprehensive evaluation of all of the information provided and were not the result of any one factor. Moreover, each Trustee may have afforded different weight to the various factors in reaching his conclusions with respect to renewal of the Wynkoop Agreement.
Nature, Extent, and Quality of Services. The Board discussed the services provided to Catalyst EIS by Wynkoop. The Board reviewed the key personnel involved with Catalyst EIS, noting Wynkoop’s personnel had extensive experience in fixed income trading. The Board further noted that Wynkoop assembled research and conducted analysis in determining security selection and portfolio allocations. The Board reviewed Wynkoop’s compliance monitoring practices, noting that Wynkoop reported no material compliance issues. The Board noted Wynkoop provided continuous reviews of the portfolio to ensure compliance with credit and investment limitations. The Board agreed that Wynkoop had the experience and resources necessary to continue providing quality services to Catalyst EIS.
Performance. The Board observed that Catalyst EIS underperformed all benchmarks for the 1-year period but had outperformed all benchmarks since inception. The Board discussed Catalyst EIS outperformed the Bloomberg US Aggregate Bond Index and Bloomberg MBS Index for the 3-year and 5-year periods and peer group average for the 5-year period. The Board noted that Catalyst EIS trailed both Morningstar categories for the same periods. The Board recognized the impact of loss in Fund assets on performance.
Fees and Expenses. The Board reviewed the fees paid to Wynkoop and discussed the allocation of fees between Wynkoop and Catalyst relative to their respective duties and other factors. The Board noted that the advisory fee for Catalyst EIS was 1.5% and that Wynkoop received 50% of the net advisory fee. The Board noted that the fee Wynkoop charged to Catalyst EIS was lower than other accounts with similar strategies managed by Wynkoop. The Board concluded that the sub-advisory fee received by Wynkoop for managing Catalyst EIS was not unreasonable.
Profitability. The Board reviewed Wynkoop’s profitability from sub-advising Catalyst EIS. The Board recognized that Wynkoop earned a reasonable profit from sub-advising Catalyst EIS, noting that expenses were allocated based on the time spent sub-advising the Fund. The Board concluded that excessive profitability was not an issue at this time.
Economies of Scale. The Board considered whether Catalyst EIS had reached the size where Wynkoop benefited from economies of scale. The Board acknowledged economies of scale was an issue primarily considered by the Board when evaluating the advisory agreement. The Board determined that, based on the current size of Catalyst EIS, it was unlikely that Wynkoop benefitted from any meaningful economies of scale.
Conclusion. Having requested and received such information from Wynkoop as the Board believed to be reasonably necessary to evaluate the terms of the Wynkoop Agreement, and as assisted by the advice and guidance of counsel, the Board concluded that renewal of the Wynkoop Agreement was in the best interests of Catalyst EIS and its shareholders.
| CATALYST FUNDS |
| SUPPLEMENTAL INFORMATION (Unaudited) |
| June 30, 2024 |
Consideration and Renewal of Sub-Advisory Agreement between Catalyst Capital Advisors, LLC and Managed Asset Portfolios, LLC, with respect to Catalyst/MAP Global Equity Fund and Catalyst/MAP Global Balanced Fund
In connection with a meeting held on May 8, 9, and 28, 2024, the Board of Trustees (the “Board”) of Mutual Fund Series Trust, including a majority of the Trustees who are not “interested persons” as that term is defined in the Investment Company Act of 1940, as amended, discussed the renewal of a sub-advisory agreement (the “MAP Agreement”) between Catalyst Capital Advisors, LLC (“Catalyst”) and Managed Asset Portfolios, LLC (“MAP”) with respect to Catalyst/MAP Global Equity Fund (“MAP Global Equity”) and Catalyst/MAP Global Balanced Fund (“MAP Global Balanced”) (collectively, the “MAP Funds”).
The Board examined MAP’s responses to a series of questions regarding, among other things, its sub-advisory services provided to the MAP Funds, comparative fee and expense information, and profitability from sub-advising the MAP Funds. The Board was assisted by legal counsel throughout the review process and relied upon the advice of legal counsel and its own business judgment in determining the material factors to be considered in evaluating the MAP Agreement and the weight to be given to each factor considered. The conclusions reached by the Board were based on a comprehensive evaluation of all of the information provided and were not the result of any one factor. Moreover, each Trustee may have afforded different weight to the various factors in reaching his conclusions with respect to renewal of the MAP Agreement.
Nature, Extent and Quality of Services. The Board reviewed the experience of the key personnel at the sub-adviser and noted one individual was promoted to portfolio manager. The Board discussed MAP’s efforts in relation to the MAP Funds and recognized that MAP provided the MAP Funds’ investment decisions, managed the Funds’ investment operations, and conducted research and analysis related to the each of the MAP Funds’ investments. The Board discussed that MAP operated the controls and compliance procedures for the MAP Funds to ensure the MAP Funds remained in compliance with investment restrictions and limitations. The Board also noted that the adviser had recommended that the sub-advisory agreement be continued. The Board concluded that the services provided by MAP were in line with its expectations and could be expected to continue providing quality service to the MAP Funds and their respective shareholders.
Performance. The Board reviewed the performance of each MAP Fund relative to its benchmarks.
MAP Global Equity: The Board observed that MAP Global Equity underperformed its peer group average, Morningstar category and benchmark indexes for all periods. The Board recognized that Catalyst noted that the Fund did not invest in the “magnificent 7” stocks which led to higher returns for the peer group.
MAP Global Balanced: The Board acknowledged that MAP Global Balanced underperformed its peer group average, Morningstar category, MSCI ACWI Index and blended index for all time periods. The Board noted the adviser’s explanation that MAP Global Balanced underperformed the benchmarks for the 1-year period due to the Fund’s lack of exposure to the “magnificent 7” securities along with the over exposure to, and losses in, the utilities sector. The Board observed for the 3- and 5-year periods, the adviser attributed the underperformance to over exposure in the Consumer Staples sector, Communications Services sector and Energy sector.
After discussion, the Board concluded that the performance of each MAP Fund was acceptable.
Fees and Expenses. The Board noted the advisory fee for each MAP Fund was 1.00% and that 50% of each MAP Fund’s net advisory fee (after certain expenses) was paid to MAP by the adviser. The Board commented that this was lower than the fee MAP charged for other similar accounts. The Board discussed the allocation of fees between the adviser and MAP relative to their respective duties and other factors and agreed the allocation for each MAP Fund was appropriate. The Board determined that the sub-advisory fee was not unreasonable.
Profitability. The Board reviewed MAP’s profitability in connection with each MAP Fund. The Board commented that MAP was earning a reasonable profit from its relationship with MAP Global Equity and operated MAP Global Balanced at a loss. After further discussion the Board agreed that MAP’s profitability from either MAP Fund was not excessive.
| CATALYST FUNDS |
| SUPPLEMENTAL INFORMATION (Unaudited) (Continued) |
| June 30, 2024 |
Economies of Scale. The Board considered whether either MAP Fund had reached the size where MAP benefited from economies of scale. The Board acknowledged that this was generally an adviser issue and noted that it should be considered in terms of the advisory agreement and its potential impact on sub-adviser expenses. The Board concluded, based on the size of the MAP Funds, it was unlikely MAP had benefited from economies of scale.
Conclusion: Having requested and received information from MAP as the Board believed to be reasonably necessary to evaluate the terms of the sub-advisory agreement between Catalyst and MAP, and as assisted by the advice and guidance of counsel, the Board concluded that renewal of the sub-advisory agreement was in the best interests of each of the MAP Funds and their shareholders.
| CATALYST FUNDS |
| SUPPLEMENTAL INFORMATION (Unaudited) |
| June 30, 2024 |
Consideration and Renewal of Sub-Advisory Agreement between Catalyst Capital Advisors, LLC and CIFC Investment Management, LLC with respect to the Catalyst/CIFC Senior Secured Income Fund
In connection with a meeting held on May 8, 9 and 28, 2024, the Board of Trustees (the “Board”) of Mutual Fund Series Trust, including a majority of the Trustees who are not “interested persons” as that term is defined in the Investment Company Act of 1940, as amended, discussed the renewal of a sub-advisory agreement (the “CIFC Agreement”) between Catalyst Capital Advisors, LLC (“Catalyst”) and CIFC Investment Management, LLC (“CIFC”) with respect to the Catalyst/CIFC Senior Secured Income Fund (“CIFC SSI”).
The Board examined CIFC’s responses to a series of questions regarding, among other things, its sub-advisory services provided to CIFC SSI, comparative fee and expense information, and profitability from sub-advising CIFC SSI. The Board was assisted by legal counsel throughout the review process and relied upon the advice of legal counsel and its own business judgment in determining the material factors to be considered in evaluating the CIFC Agreement and the weight to be given to each factor considered. The conclusions reached by the Board were based on a comprehensive evaluation of all of the information provided and were not the result of any one factor. Moreover, each Trustee may have afforded different weight to the various factors in reaching his conclusions with respect to renewal of the CIFC Agreement.
Nature, Extent and Quality of Services. The Board reviewed the key personnel at CIFC who serviced CIFC SSI. The Board noted that a new portfolio manager joined CIFC in 2023 who had extensive experience in trading and market operations. The Board discussed CIFC’s services to CIFC SSI, including providing investment research, portfolio management, and trading services. The Board reviewed CIFC’s investment procedures and portfolio management process to ensure compliance with investment restrictions. The Board noted that CIFC did not report any material litigation or compliance issues in the prior year. After further discussion, the Board concluded that the nature, extent and quality of services provided by CIFC to CIFC SSI was adequate.
Performance. The Board recognized that CIFC SSI outperformed its peer group average and Morningstar category for all periods. The Board noted CIFC SSI underperformed the S&P LSTA US Leveraged Loan 100 Index for all periods. The Board discussed that CIFC SSI had changed sub-advisers and, therefore, the most relevant periods were the 1-, 3-, and 5-year periods.
Fees and Expenses. The Board reviewed the sub-advisory fee paid to CIFC and discussed the allocation of the advisory fee between CIFC and Catalyst relative to their respective duties and other factors. The Board noted that the advisory fee for CIFC SSI was 1.00% with 50% of the fee the net advisory fee (after certain expenses) paid to CIFC by the adviser. The Board recognized that CIFC’s sub-advisory fee was in line with the fees CIFC charged, to its other clients. The Board concluded that the sub-advisory fee received by CIFC for its services to CIFC SSI was not unreasonable.
Profitability. The Board recognized that CIFC did not make a profit from CIFC SSI. As such, the Board concluded that excessive profitability was not an issue for CIFC at this time.
Economies of Scale. The Board considered whether CIFC SSI had reached the size where CIFC would benefit from economies of scale. The Board acknowledged that this was generally an adviser issue and noted that it should be considered in terms of the advisory agreement and its potential impact on sub-adviser expenses. The Board determined that, based on the current size of CIFC SSI, it was unlikely that CIFC benefited from any meaningful economies of scale.
Conclusion. Having requested and received such information from CIFC as the Board believed to be reasonably necessary to evaluate the terms of the CIFC Agreement, and as assisted by the advice of counsel, the Board concluded that renewal of the CIFC Agreement was in the best interests of CIFC SSI and its shareholders.
| CATALYST FUNDS |
| SUPPLEMENTAL INFORMATION (Unaudited) |
| June 30, 2024 |
Consideration and Renewal of Sub-Advisory Agreement between Catalyst Capital Advisors, LLC and SMH Capital Advisors, Inc. with respect to Catalyst/SMH High Income Fund and Catalyst/SMH Total Return Income Fund
In connection with a meeting held on May 8, 9, and 28, 2023, the Board of Trustees (the “Board”) of Mutual Fund Series Trust, including a majority of the Trustees who are not “interested persons” as that term is defined in the Investment Company Act of 1940, as amended, discussed the renewal of a sub-advisory agreement (the “SMHCA Agreement”) between Catalyst Capital Advisors, LLC (“Catalyst”) and SMH Capital Advisors, Inc. (“SMHCA”) with respect to Catalyst/SMH High Income Fund (“SMH High Income”) and Catalyst/SMH Total Return Fund (“SMH Total Return Fund”) (collectively, the “SMH Funds”).
The Board examined SMHCA’s responses to a series of questions regarding, among other things, its sub-advisory services provided to the SMH Funds, comparative fee and expense information, and profitability from sub-advising the SMH Funds. The Board was assisted by legal counsel throughout the review process and relied upon the advice of legal counsel and its own business judgment in determining the material factors to be considered in evaluating the SMHCA Agreement and the weight to be given to each factor considered. The conclusions reached by the Board were based on a comprehensive evaluation of all of the information provided and were not the result of any one factor. Moreover, each Trustee may have afforded different weight to the various factors in reaching his conclusions with respect to renewal of the SMHCA Agreement.
Nature, Extent and Quality of Services. The Board considered the extensive professional experience of SMHCA’s key personnel involved in the SMH Funds. The Board noted that there were no recent changes in key personnel for SMHCA. The Board reviewed the services provided by SMHCA to the SMH Funds and noted that SMHCA operated the investment strategy and conducted research and portfolio modeling for the SMH Funds. The Board discussed that SMHCA executed transactions on behalf of the SMH Funds and assisted in fair valuing securities when necessary. The Board noted there were no material compliance issues in the last year and no ongoing SEC examinations. The Board noted that Catalyst had recommended continuing the sub-advisory agreement with SMHCA. The Board concluded that the nature, extent and quality of services provided by SMHCA to the SMH Funds was satisfactory.
Performance. The Board reviewed the performance of each SMH Fund relative to its benchmarks.
SMH High Income: The Board observed that SMH High Income outperformed its peer group average, Morningstar category, and BofA Merrill lynch US Cash Pay High Yield Index for the 1-year and 5-year periods and had similar performance to each benchmark for the 3-year period. The Board noted SMH High Income underperformed all benchmarks for the 10-year period. The Board discussed that SMHCA explained the 10-year underperformance included commodity exposure from 2014-2015 noting that since that time, the strategy had performed well.
SMH Total Return: The Board discussed that SMH Total Return performed in line with its peer group average and outperformed all other benchmarks for the 1-year period, other than the S&P 500 TR Index and blended index. The Board noted that SMH Total Return outperformed the peer group average, Morningstar category, and BofA Merrill lynch US Cash Pay High Yield Index for the 3-year and 5-year periods but trailed all benchmarks for the 10-year period. The Board observed that SMHCA attributed the underperformance to the fact that SMH Total Return’s strategy of not being fully invested in equities and therefore was not expected to track the performance of the S&P 500 in strong markets.
After discussion, the Board concluded that the performance of each SMH Fund was acceptable.
Fees and Expenses. The Board reviewed the fees paid to SMHCA and discussed the allocation of fees between SMHCA and Catalyst relative to their respective duties and other factors. The Board noted that the advisory fee for the SMH Funds was 1.00% and 50% of each SMH Fund’s net advisory fee (after certain expenses) was paid to SMHCA by the adviser. The Board recognized that SMHCA’s sub-advisory fee for each SMH Fund was comparable to, or lower than, the fees SMHCA charged, or would have charged, to its other clients. The Board concluded that the sub-advisory fee received by SMHCA from Catalyst for each of the SMH Funds was not unreasonable.
Profitability. The Board commented that SMHCA earned a reasonable profit from sub-advising each of the SMH Funds. The Board noted that SMHCA’s expenses are based on the overall gross revenue from each SMH Fund
| CATALYST FUNDS |
| SUPPLEMENTAL INFORMATION (Unaudited) (Continued) |
| June 30, 2024 |
compared to SMHCA’s total gross revenue. The Board concluded that SMHCA’s profitability from either SMH Fund was not excessive.
Economies of Scale. The Board discussed whether SMHCA had achieved economies of scale with respect to its sub-advisory services provided to each SMH Fund. The Board acknowledged that this was generally an adviser issue and noted that it should be considered in terms of the advisory agreement and its potential impact on sub-adviser expenses. The Board concluded that, based on the current size of each SMH Fund, it was unlikely that SMHCA was benefiting from economies of scale.
Conclusion. Having requested and received information from SMHCA as the Board believed to be reasonably necessary to evaluate the terms of the sub-advisory agreement between Catalyst and SMHCA, and as assisted by the advice and guidance of counsel, the Board concluded that renewal of the sub-advisory agreement was in the best interests of each of the SMH Funds and their shareholders.
A description of the policies and procedures that the Funds use to determine how to vote proxies relating to portfolio securities is available without charge, upon request, by calling 1-866-447-4228; and on the Commission’s website at http://www.sec.gov.
Information regarding how the Funds voted proxies relating to portfolio securities during the most recent 12-month period ended June 30 is available without charge, upon request, by calling 1-866-447-4228; and on the Commission’s website at http://www.sec.gov.
Item 8. Changes in and Disagreements with Accountants for Open-End Management Investment Companies.
Not applicable
Item 9. Proxy Disclosures for Open-End Management Investment Companies.
Not applicable
Item 10. Remuneration Paid to Directors, Officers, and Others of Open-End Management Investment Companies.
Included under Item 7
Item 11. Statement Regarding Basis for Approval of Investment Advisory Contract.
Included under Item 7
Item 12. Disclosure of Proxy Voting Policies and Procedures for Closed-End Management Investment Companies.
Not applicable
Item 13. Portfolio Managers of Closed-End Management Investment Companies.
Not applicable
Item 14. Purchases of Equity Securities by Closed-End Management Investment Company and Affiliated Purchasers.
Not applicable
Item 15. Submission of Matters to a Vote of Security Holders.
None
Item 16. Controls and Procedures
(a) The registrant’s Principal Executive Officer and Principal Financial Officer have concluded that the registrant’s disclosure controls and procedures (as defined in Rule 30a-3(c) under the Act) are effective in design and operation and are sufficient to form the basis of the certifications required by Rule 30a-(2) under the Act, based on their evaluation of these disclosure controls and procedures as of a date within 90 days of this report on Form N-CSR.
(b) There were no changes in the registrant’s internal control over financial reporting (as defined in Rule 30a-3(d) under the Act) during the period covered by this report that have materially affected, or are reasonably likely to materially affect, the registrant’s internal control over financial reporting.
Item 17. Disclosure of Securities Lending Activities for Closed-End Management Investment Companies.
Not applicable
Item 18. Recovery of Erroneously Awarded Compensation.
(a) Not applicable
(b) Not applicable
Item 19. Exhibits.
(a)(1) Code of Ethics for Principal Executive and Senior Financial Officers is attached hereto.
(a)(2) Not applicable
(a)(3) A separate certification for each principal executive officer and principal financial officer of the registrant as required by Rule 30a-2(a) under the Act (17 CFR 270.30a-2(a)): Attached hereto.
(a)(4) Not applicable
(b) Certifications required by Rule 30a-2(b) under the Act (17 CFR 270.30a-2(b)): Attached hereto
SIGNATURES
Pursuant to the requirements of the Securities Exchange Act of 1934 and the Investment Company Act of 1940, the registrant has duly caused this report to be signed on its behalf by the undersigned, thereunto duly authorized.
Mutual Fund Series Trust
Michael Schoonover
| By | /s/ Michael Schoonover |
| Principal Executive Officer/President |
| Date: 9/3/2024 |
Pursuant to the requirements of the Securities Exchange Act of 1934 and the Investment Company Act of 1940, this report has been signed below by the following persons on behalf of the registrant and in the capacities and on the dates indicated.
| By | /s/ Michael Schoonover |
| Michael Schoonover |
| Principal Executive Officer/President |
| Date: 9/3/2024 |
| By | /s/ Erik Naviloff |
| Erik Naviloff |
| Principal Financial Officer/Treasurer |
| Date: 9/3/2024 |