united states
securities and exchange commission
washington, d.c. 20549
form n-csr
certified shareholder report of registered management
investment companies
| Investment Company Act file number | 811-21872 |
| Mutual Fund Series Trust |
| (Exact name of registrant as specified in charter) |
| 225 Pictoria Drive, Suite 450, Cincinnati, OH | 45246 |
| (Address of principal executive offices) | (Zip code) |
| CT CORPORATION SYSTEM |
| 1300 EAST NINTH STREET, CLEVELAND, OH 44114 |
| (Name and address of agent for service) |
| Registrant’s telephone number, including area code: | 631-470-2600 |
| Date of fiscal year end: | 6/30 |
| Date of reporting period: | 6/30/2024 |
Item 1. Reports to Stockholders.
(a)
0001355064mfst:C000080457Membermfst:A592688105MettlerMinusToledoInternationalIncCTIMember2024-06-30
Annual Shareholder Report - June 30, 2024
This annual shareholder report contains important information about Eventide Balanced Fund for the period of July 1, 2023 to June 30, 2024. You can find additional information about the Fund at https://www.eventidefunds.com. You can also request this information by contacting us at 1-877-771-3836. This report describes changes to the Fund that occurred during the reporting period.
What were the Fund’s costs for the last year?
(based on a hypothetical $10,000 investment)
| Class Name | Costs of a $10,000 investment | Costs paid as a percentage of a $10,000 investment |
|---|
| Class A | $107 | 1.07% |
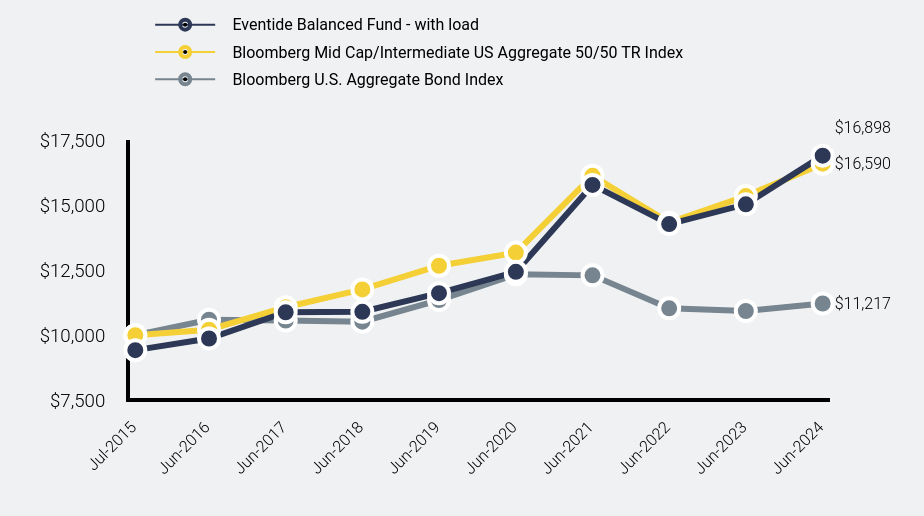
How has the Fund performed since inception?
Total Return Based on $10,000 Investment
| Eventide Balanced Fund - with load | Bloomberg Mid Cap/Intermediate US Aggregate 50/50 TR Index | Bloomberg U.S. Aggregate Bond Index |
|---|
| Jul-2015 | $9,425 | $10,000 | $10,000 |
| Jun-2016 | $9,872 | $10,210 | $10,595 |
| Jun-2017 | $10,882 | $11,074 | $10,562 |
| Jun-2018 | $10,899 | $11,757 | $10,520 |
| Jun-2019 | $11,614 | $12,668 | $11,348 |
| Jun-2020 | $12,435 | $13,172 | $12,339 |
| Jun-2021 | $15,773 | $16,127 | $12,298 |
| Jun-2022 | $14,268 | $14,324 | $11,032 |
| Jun-2023 | $15,027 | $15,344 | $10,929 |
| Jun-2024 | $16,898 | $16,590 | $11,217 |
The Fund's past performance is not a good predictor of how the Fund will perform in the future. The graph and table do not reflect the deduction of taxes that a shareholder would pay on fund distributions or redemption of fund shares. In connection with new SEC Rules on shareholder reporting, the Fund's performance information above is compared with a broad-based benchmark, Bloomberg US Aggregate Index, which represents the overall domestic bond market. In addition, the strategy benchmark, Bloomberg Mid Cap/Intermediate US Aggregate 50/50 TR Index, is included as the adviser believes it is more representative of the fund's investment universe.
How did the Fund perform during the reporting period?
For the year ended 6/30/2024, the Fund outperformed its primary benchmark. The Fund’s equity positions outperformed its benchmark for the year across many sectors (IT, Industrials, Energy, and Utilities), while underperforming in Consumer Discretionary and Financials. The Fund’s fixed income positions outperformed its benchmark due to the strength of corporate bonds versus treasuries. We believe the Fund is well-positioned in key growth themes (technology, AI, electrification, energy efficiency, and infrastructure). We remain focused on resilient companies led by excellent management teams and positioned for long-term growth. With lower interest rates, balanced strategies providing exposure to high-quality, dividend-growing equities, along with downside protection, may regain favor. We remain committed to resilient growth, strong financials, stakeholder value creation, and the overarching theme of human flourishing.
Average Annual Total Returns
| 1 Year | 5 Years | Since Inception (July 15, 2015) |
|---|
| Eventide Balanced Fund - Class A |
| Without Load | 12.45% | 7.79% | 6.73% |
| With Load | 5.98% | 6.53% | 6.03% |
| Bloomberg Mid Cap/Intermediate US Aggregate 50/50 TR Index | 8.12% | 5.54% | 5.81% |
| Bloomberg U.S. Aggregate Bond Index | 2.63% | | 1.29% |
| Net Assets | $379,519,782 |
| Number of Portfolio Holdings | 155 |
| Advisory Fee (net of waivers) | $1,839,950 |
| Portfolio Turnover | 43% |
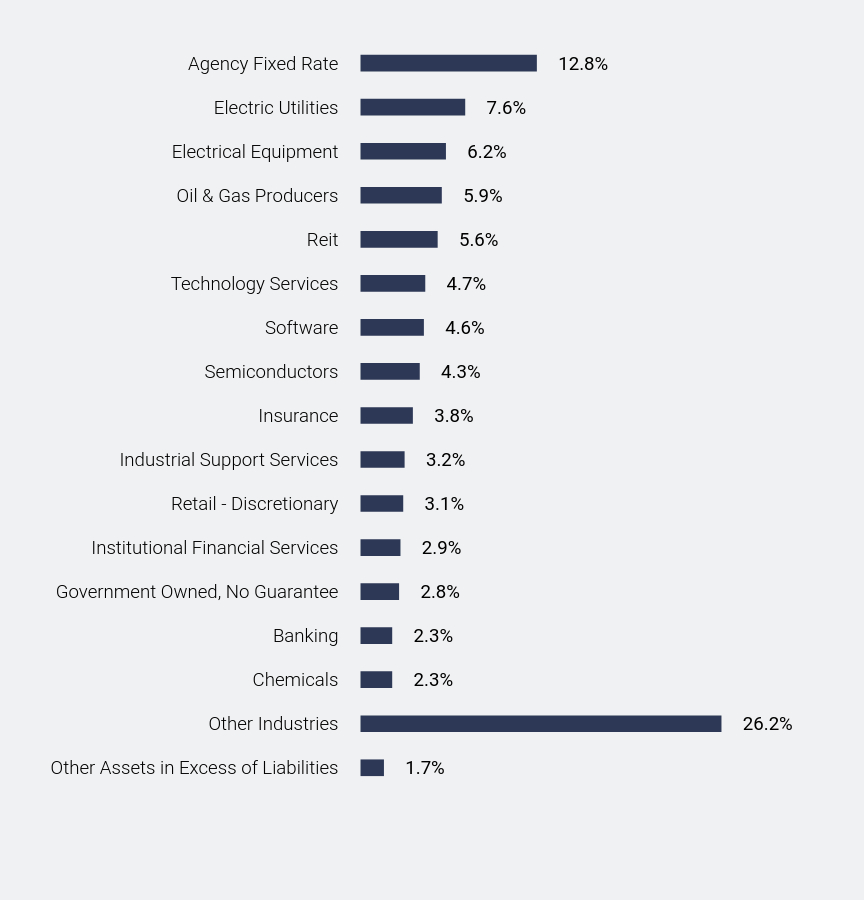
What did the Fund invest in?
Industry Weighting (% of net assets)
| Value | Value |
|---|
| Other Assets in Excess of Liabilities | 1.7% |
| Other Industries | 26.2% |
| Chemicals | 2.3% |
| Banking | 2.3% |
| Government Owned, No Guarantee | 2.8% |
| Institutional Financial Services | 2.9% |
| Retail - Discretionary | 3.1% |
| Industrial Support Services | 3.2% |
| Insurance | 3.8% |
| Semiconductors | 4.3% |
| Software | 4.6% |
| Technology Services | 4.7% |
| Reit | 5.6% |
| Oil & Gas Producers | 5.9% |
| Electrical Equipment | 6.2% |
| Electric Utilities | 7.6% |
| Agency Fixed Rate | 12.8% |
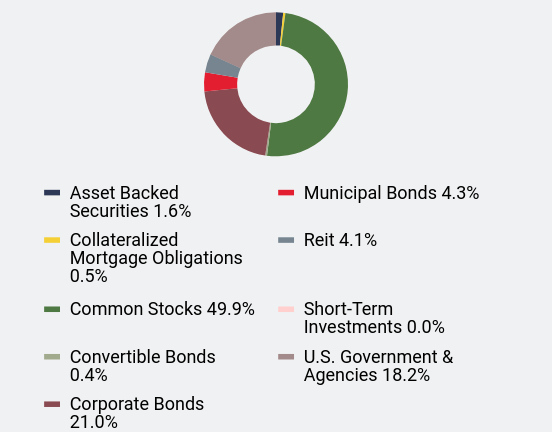
Asset Weighting (% of total investments)
| Value | Value |
|---|
| Asset Backed Securities | 1.6% |
| Collateralized Mortgage Obligations | 0.5% |
| Common Stocks | 49.9% |
| Convertible Bonds | 0.4% |
| Corporate Bonds | 21.0% |
| Municipal Bonds | 4.3% |
| Reit | 4.1% |
| Short-Term Investments | 0.0% |
| U.S. Government & Agencies | 18.2% |
Top 10 Holdings* (% of net assets)
| Holding Name | % of Net Assets |
| Trane Technologies PLC | 3.2% |
| nVent Electric PLC | 3.0% |
| Arthur J Gallagher & Company | 2.6% |
| Roper Technologies, Inc. | 2.6% |
| CDW Corporation | 2.3% |
| KLA Corporation | 2.3% |
| Targa Resources Corporation | 2.0% |
| Ferguson PLC | 2.0% |
| Williams Companies, Inc. (The) | 1.8% |
| Houlihan Lokey, Inc. | 1.6% |
* Does not include cash/money market funds/equivalents. Based on percentage of net assets. Holdings can change at any time, are subject to risks discussed in the Fund’s prospectus, and should not be considered investment advice.
This is a summary of certain changes to the Fund since July 1, 2023. For more complete information, you may review the Fund’s next prospectus, which we expect to be available by November 1, 2024 at https://www.eventidefunds.com/prospectus or upon request at 1-877-771-EVEN (3836). The Fund’s name changed from “Eventide Multi-Asset Income Fund” to “Eventide Balanced Fund” on November 1, 2023. That same day, the Fund adopted a policy to invest at least 25% of its assets in equity securities and at least 25% of its assets in fixed income securities.
Eventide Balanced Fund - Class A (ETAMX )
Annual Shareholder Report - June 30, 2024
Where can I find additional information about the Fund?
Additional information is available on the Fund's website ( https://www.eventidefunds.com ), including its:
Prospectus
Financial information
Holdings
Proxy voting information
Annual Shareholder Report - June 30, 2024
This annual shareholder report contains important information about Eventide Balanced Fund for the period of July 1, 2023 to June 30, 2024. You can find additional information about the Fund at https://www.eventidefunds.com. You can also request this information by contacting us at 1-877-771-3836. This report describes changes to the Fund that occurred during the reporting period.
What were the Fund’s costs for the last year?
(based on a hypothetical $10,000 investment)
| Class Name | Costs of a $10,000 investment | Costs paid as a percentage of a $10,000 investment |
|---|
| Class C | $182 | 1.82% |
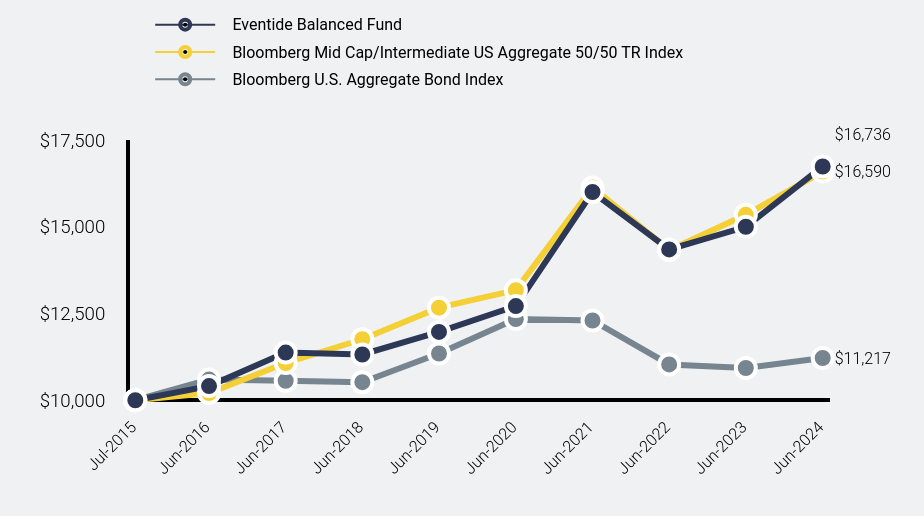
How has the Fund performed since inception?
Total Return Based on $10,000 Investment
| Eventide Balanced Fund | Bloomberg Mid Cap/Intermediate US Aggregate 50/50 TR Index | Bloomberg U.S. Aggregate Bond Index |
|---|
| Jul-2015 | $10,000 | $10,000 | $10,000 |
| Jun-2016 | $10,408 | $10,210 | $10,595 |
| Jun-2017 | $11,375 | $11,074 | $10,562 |
| Jun-2018 | $11,319 | $11,757 | $10,520 |
| Jun-2019 | $11,968 | $12,668 | $11,348 |
| Jun-2020 | $12,714 | $13,172 | $12,339 |
| Jun-2021 | $16,000 | $16,127 | $12,298 |
| Jun-2022 | $14,346 | $14,324 | $11,032 |
| Jun-2023 | $14,999 | $15,344 | $10,929 |
| Jun-2024 | $16,736 | $16,590 | $11,217 |
The Fund's past performance is not a good predictor of how the Fund will perform in the future. The graph and table do not reflect the deduction of taxes that a shareholder would pay on fund distributions or redemption of fund shares. In connection with new SEC Rules on shareholder reporting, the Fund's performance information above is compared with a broad-based benchmark, Bloomberg US Aggregate Index, which represents the overall domestic bond market. In addition, the strategy benchmark, Bloomberg Mid Cap/Intermediate US Aggregate 50/50 TR Index, is included as the adviser believes it is more representative of the fund's investment universe.
How did the Fund perform during the reporting period?
For the year ended 6/30/2024, the Fund outperformed its primary benchmark. The Fund’s equity positions outperformed its benchmark for the year across many sectors (IT, Industrials, Energy, and Utilities), while underperforming in Consumer Discretionary and Financials. The Fund’s fixed income positions outperformed its benchmark due to the strength of corporate bonds versus treasuries. We believe the Fund is well-positioned in key growth themes (technology, AI, electrification, energy efficiency, and infrastructure). We remain focused on resilient companies led by excellent management teams and positioned for long-term growth. With lower interest rates, balanced strategies providing exposure to high-quality, dividend-growing equities, along with downside protection, may regain favor. We remain committed to resilient growth, strong financials, stakeholder value creation, and the overarching theme of human flourishing.
Average Annual Total Returns
| 1 Year | 5 Years | Since Inception (July 15, 2015) |
|---|
| Eventide Balanced Fund - Class C | 11.58% | 6.94% | 5.91% |
| Bloomberg Mid Cap/Intermediate US Aggregate 50/50 TR Index | 8.12% | 5.54% | 5.81% |
| Bloomberg U.S. Aggregate Bond Index | 2.63% | | 1.29% |
| Net Assets | $379,519,782 |
| Number of Portfolio Holdings | 155 |
| Advisory Fee (net of waivers) | $1,839,950 |
| Portfolio Turnover | 43% |
What did the Fund invest in?
Industry Weighting (% of net assets)
| Value | Value |
|---|
| Other Assets in Excess of Liabilities | 1.7% |
| Other Industries | 26.2% |
| Chemicals | 2.3% |
| Banking | 2.3% |
| Government Owned, No Guarantee | 2.8% |
| Institutional Financial Services | 2.9% |
| Retail - Discretionary | 3.1% |
| Industrial Support Services | 3.2% |
| Insurance | 3.8% |
| Semiconductors | 4.3% |
| Software | 4.6% |
| Technology Services | 4.7% |
| Reit | 5.6% |
| Oil & Gas Producers | 5.9% |
| Electrical Equipment | 6.2% |
| Electric Utilities | 7.6% |
| Agency Fixed Rate | 12.8% |
Asset Weighting (% of total investments)
| Value | Value |
|---|
| Asset Backed Securities | 1.6% |
| Collateralized Mortgage Obligations | 0.5% |
| Common Stocks | 49.9% |
| Convertible Bonds | 0.4% |
| Corporate Bonds | 21.0% |
| Municipal Bonds | 4.3% |
| Reit | 4.1% |
| Short-Term Investments | 0.0% |
| U.S. Government & Agencies | 18.2% |
Top 10 Holdings* (% of net assets)
| Holding Name | % of Net Assets |
| Trane Technologies PLC | 3.2% |
| nVent Electric PLC | 3.0% |
| Arthur J Gallagher & Company | 2.6% |
| Roper Technologies, Inc. | 2.6% |
| CDW Corporation | 2.3% |
| KLA Corporation | 2.3% |
| Targa Resources Corporation | 2.0% |
| Ferguson PLC | 2.0% |
| Williams Companies, Inc. (The) | 1.8% |
| Houlihan Lokey, Inc. | 1.6% |
* Does not include cash/money market funds/equivalents. Based on percentage of net assets. Holdings can change at any time, are subject to risks discussed in the Fund’s prospectus, and should not be considered investment advice.
This is a summary of certain changes to the Fund since July 1, 2023. For more complete information, you may review the Fund’s next prospectus, which we expect to be available by November 1, 2024 at https://www.eventidefunds.com/prospectus or upon request at 1-877-771-EVEN (3836). The Fund’s name changed from “Eventide Multi-Asset Income Fund” to “Eventide Balanced Fund” on November 1, 2023. That same day, the Fund adopted a policy to invest at least 25% of its assets in equity securities and at least 25% of its assets in fixed income securities.
Eventide Balanced Fund - Class C (ETCMX )
Annual Shareholder Report - June 30, 2024
Where can I find additional information about the Fund?
Additional information is available on the Fund's website ( https://www.eventidefunds.com ), including its:
Prospectus
Financial information
Holdings
Proxy voting information
Annual Shareholder Report - June 30, 2024
This annual shareholder report contains important information about Eventide Balanced Fund for the period of July 1, 2023 to June 30, 2024. You can find additional information about the Fund at https://www.eventidefunds.com. You can also request this information by contacting us at 1-877-771-3836. This report describes changes to the Fund that occurred during the reporting period.
What were the Fund’s costs for the last year?
(based on a hypothetical $10,000 investment)
| Class Name | Costs of a $10,000 investment | Costs paid as a percentage of a $10,000 investment |
|---|
| Class I | $82 | 0.82% |
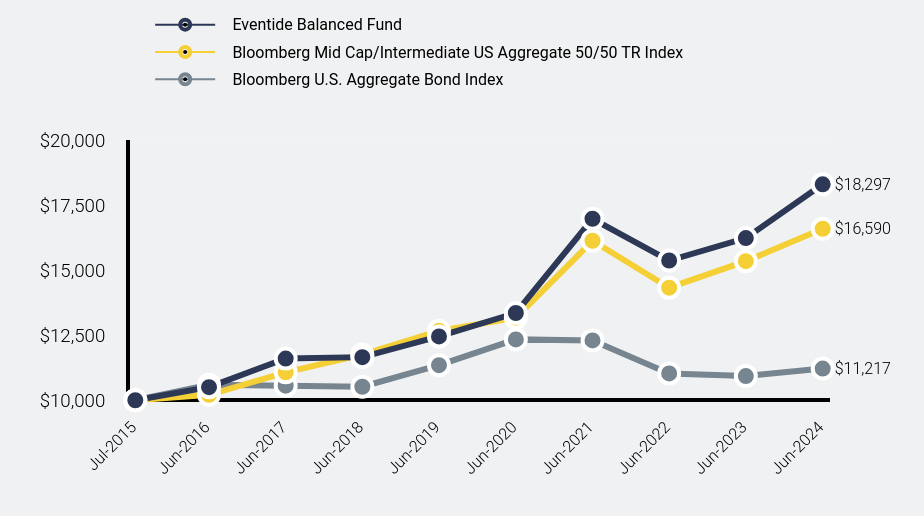
How has the Fund performed since inception?
Total Return Based on $10,000 Investment
| Eventide Balanced Fund | Bloomberg Mid Cap/Intermediate US Aggregate 50/50 TR Index | Bloomberg U.S. Aggregate Bond Index |
|---|
| Jul-2015 | $10,000 | $10,000 | $10,000 |
| Jun-2016 | $10,503 | $10,210 | $10,595 |
| Jun-2017 | $11,603 | $11,074 | $10,562 |
| Jun-2018 | $11,657 | $11,757 | $10,520 |
| Jun-2019 | $12,451 | $12,668 | $11,348 |
| Jun-2020 | $13,352 | $13,172 | $12,339 |
| Jun-2021 | $16,973 | $16,127 | $12,298 |
| Jun-2022 | $15,368 | $14,324 | $11,032 |
| Jun-2023 | $16,229 | $15,344 | $10,929 |
| Jun-2024 | $18,297 | $16,590 | $11,217 |
The Fund's past performance is not a good predictor of how the Fund will perform in the future. The graph and table do not reflect the deduction of taxes that a shareholder would pay on fund distributions or redemption of fund shares. In connection with new SEC Rules on shareholder reporting, the Fund's performance information above is compared with a broad-based benchmark, Bloomberg US Aggregate Index, which represents the overall domestic bond market. In addition, the strategy benchmark, Bloomberg Mid Cap/Intermediate US Aggregate 50/50 TR Index, is included as the adviser believes it is more representative of the fund's investment universe.
How did the Fund perform during the reporting period?
For the year ended 6/30/2024, the Fund outperformed its primary benchmark. The Fund’s equity positions outperformed its benchmark for the year across many sectors (IT, Industrials, Energy, and Utilities), while underperforming in Consumer Discretionary and Financials. The Fund’s fixed income positions outperformed its benchmark due to the strength of corporate bonds versus treasuries. We believe the Fund is well-positioned in key growth themes (technology, AI, electrification, energy efficiency, and infrastructure). We remain focused on resilient companies led by excellent management teams and positioned for long-term growth. With lower interest rates, balanced strategies providing exposure to high-quality, dividend-growing equities, along with downside protection, may regain favor. We remain committed to resilient growth, strong financials, stakeholder value creation, and the overarching theme of human flourishing.
Average Annual Total Returns
| 1 Year | 5 Years | Since Inception (July 15, 2015) |
|---|
| Eventide Balanced Fund - Class I | 12.75% | 8.00% | 6.97% |
| Bloomberg Mid Cap/Intermediate US Aggregate 50/50 TR Index | 8.12% | 5.54% | 5.81% |
| Bloomberg U.S. Aggregate Bond Index | 2.63% | | 1.29% |
| Net Assets | $379,519,782 |
| Number of Portfolio Holdings | 155 |
| Advisory Fee (net of waivers) | $1,839,950 |
| Portfolio Turnover | 43% |
What did the Fund invest in?
Industry Weighting (% of net assets)
| Value | Value |
|---|
| Other Assets in Excess of Liabilities | 1.7% |
| Other Industries | 26.2% |
| Chemicals | 2.3% |
| Banking | 2.3% |
| Government Owned, No Guarantee | 2.8% |
| Institutional Financial Services | 2.9% |
| Retail - Discretionary | 3.1% |
| Industrial Support Services | 3.2% |
| Insurance | 3.8% |
| Semiconductors | 4.3% |
| Software | 4.6% |
| Technology Services | 4.7% |
| Reit | 5.6% |
| Oil & Gas Producers | 5.9% |
| Electrical Equipment | 6.2% |
| Electric Utilities | 7.6% |
| Agency Fixed Rate | 12.8% |
Asset Weighting (% of total investments)
| Value | Value |
|---|
| Asset Backed Securities | 1.6% |
| Collateralized Mortgage Obligations | 0.5% |
| Common Stocks | 49.9% |
| Convertible Bonds | 0.4% |
| Corporate Bonds | 21.0% |
| Municipal Bonds | 4.3% |
| Reit | 4.1% |
| Short-Term Investments | 0.0% |
| U.S. Government & Agencies | 18.2% |
Top 10 Holdings* (% of net assets)
| Holding Name | % of Net Assets |
| Trane Technologies PLC | 3.2% |
| nVent Electric PLC | 3.0% |
| Arthur J Gallagher & Company | 2.6% |
| Roper Technologies, Inc. | 2.6% |
| CDW Corporation | 2.3% |
| KLA Corporation | 2.3% |
| Targa Resources Corporation | 2.0% |
| Ferguson PLC | 2.0% |
| Williams Companies, Inc. (The) | 1.8% |
| Houlihan Lokey, Inc. | 1.6% |
* Does not include cash/money market funds/equivalents. Based on percentage of net assets. Holdings can change at any time, are subject to risks discussed in the Fund’s prospectus, and should not be considered investment advice.
This is a summary of certain changes to the Fund since July 1, 2023. For more complete information, you may review the Fund’s next prospectus, which we expect to be available by November 1, 2024 at https://www.eventidefunds.com/prospectus or upon request at 1-877-771-EVEN (3836). The Fund’s name changed from “Eventide Multi-Asset Income Fund” to “Eventide Balanced Fund” on November 1, 2023. That same day, the Fund adopted a policy to invest at least 25% of its assets in equity securities and at least 25% of its assets in fixed income securities.
Eventide Balanced Fund - Class I (ETIMX )
Annual Shareholder Report - June 30, 2024
Where can I find additional information about the Fund?
Additional information is available on the Fund's website ( https://www.eventidefunds.com ), including its:
Prospectus
Financial information
Holdings
Proxy voting information
Annual Shareholder Report - June 30, 2024
This annual shareholder report contains important information about Eventide Balanced Fund for the period of July 1, 2023 to June 30, 2024. You can find additional information about the Fund at https://www.eventidefunds.com. You can also request this information by contacting us at 1-877-771-3836. This report describes changes to the Fund that occurred during the reporting period.
What were the Fund’s costs for the last year?
(based on a hypothetical $10,000 investment)
| Class Name | Costs of a $10,000 investment | Costs paid as a percentage of a $10,000 investment |
|---|
| Class N | $102 | 1.02% |
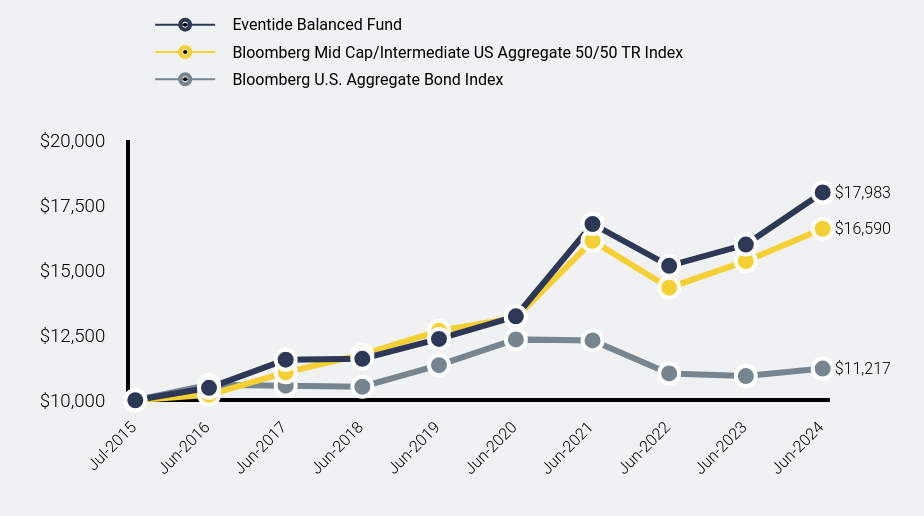
How has the Fund performed since inception?
Total Return Based on $10,000 Investment
| Eventide Balanced Fund | Bloomberg Mid Cap/Intermediate US Aggregate 50/50 TR Index | Bloomberg U.S. Aggregate Bond Index |
|---|
| Jul-2015 | $10,000 | $10,000 | $10,000 |
| Jun-2016 | $10,479 | $10,210 | $10,595 |
| Jun-2017 | $11,558 | $11,074 | $10,562 |
| Jun-2018 | $11,591 | $11,757 | $10,520 |
| Jun-2019 | $12,358 | $12,668 | $11,348 |
| Jun-2020 | $13,226 | $13,172 | $12,339 |
| Jun-2021 | $16,772 | $16,127 | $12,298 |
| Jun-2022 | $15,166 | $14,324 | $11,032 |
| Jun-2023 | $15,982 | $15,344 | $10,929 |
| Jun-2024 | $17,983 | $16,590 | $11,217 |
The Fund's past performance is not a good predictor of how the Fund will perform in the future. The graph and table do not reflect the deduction of taxes that a shareholder would pay on fund distributions or redemption of fund shares. In connection with new SEC Rules on shareholder reporting, the Fund's performance information above is compared with a broad-based benchmark, Bloomberg US Aggregate Index, which represents the overall domestic bond market. In addition, the strategy benchmark, Bloomberg Mid Cap/Intermediate US Aggregate 50/50 TR Index, is included as the adviser believes it is more representative of the fund's investment universe.
How did the Fund perform during the reporting period?
For the year ended 6/30/2024, the Fund outperformed its primary benchmark. The Fund’s equity positions outperformed its benchmark for the year across many sectors (IT, Industrials, Energy, and Utilities), while underperforming in Consumer Discretionary and Financials. The Fund’s fixed income positions outperformed its benchmark due to the strength of corporate bonds versus treasuries. We believe the Fund is well-positioned in key growth themes (technology, AI, electrification, energy efficiency, and infrastructure). We remain focused on resilient companies led by excellent management teams and positioned for long-term growth. With lower interest rates, balanced strategies providing exposure to high-quality, dividend-growing equities, along with downside protection, may regain favor. We remain committed to resilient growth, strong financials, stakeholder value creation, and the overarching theme of human flourishing.
Average Annual Total Returns
| 1 Year | 5 Years | Since Inception (July 15, 2015) |
|---|
| Eventide Balanced Fund - Class N | 12.52% | 7.79% | 6.77% |
| Bloomberg Mid Cap/Intermediate US Aggregate 50/50 TR Index | 8.12% | 5.54% | 5.81% |
| Bloomberg U.S. Aggregate Bond Index | 2.63% | | 1.29% |
| Net Assets | $379,519,782 |
| Number of Portfolio Holdings | 155 |
| Advisory Fee (net of waivers) | $1,839,950 |
| Portfolio Turnover | 43% |
What did the Fund invest in?
Industry Weighting (% of net assets)
| Value | Value |
|---|
| Other Assets in Excess of Liabilities | 1.7% |
| Other Industries | 26.2% |
| Chemicals | 2.3% |
| Banking | 2.3% |
| Government Owned, No Guarantee | 2.8% |
| Institutional Financial Services | 2.9% |
| Retail - Discretionary | 3.1% |
| Industrial Support Services | 3.2% |
| Insurance | 3.8% |
| Semiconductors | 4.3% |
| Software | 4.6% |
| Technology Services | 4.7% |
| Reit | 5.6% |
| Oil & Gas Producers | 5.9% |
| Electrical Equipment | 6.2% |
| Electric Utilities | 7.6% |
| Agency Fixed Rate | 12.8% |
Asset Weighting (% of total investments)
| Value | Value |
|---|
| Asset Backed Securities | 1.6% |
| Collateralized Mortgage Obligations | 0.5% |
| Common Stocks | 49.9% |
| Convertible Bonds | 0.4% |
| Corporate Bonds | 21.0% |
| Municipal Bonds | 4.3% |
| Reit | 4.1% |
| Short-Term Investments | 0.0% |
| U.S. Government & Agencies | 18.2% |
Top 10 Holdings* (% of net assets)
| Holding Name | % of Net Assets |
| Trane Technologies PLC | 3.2% |
| nVent Electric PLC | 3.0% |
| Arthur J Gallagher & Company | 2.6% |
| Roper Technologies, Inc. | 2.6% |
| CDW Corporation | 2.3% |
| KLA Corporation | 2.3% |
| Targa Resources Corporation | 2.0% |
| Ferguson PLC | 2.0% |
| Williams Companies, Inc. (The) | 1.8% |
| Houlihan Lokey, Inc. | 1.6% |
* Does not include cash/money market funds/equivalents. Based on percentage of net assets. Holdings can change at any time, are subject to risks discussed in the Fund’s prospectus, and should not be considered investment advice.
This is a summary of certain changes to the Fund since July 1, 2023. For more complete information, you may review the Fund’s next prospectus, which we expect to be available by November 1, 2024 at https://www.eventidefunds.com/prospectus or upon request at 1-877-771-EVEN (3836). The Fund’s name changed from “Eventide Multi-Asset Income Fund” to “Eventide Balanced Fund” on November 1, 2023. That same day, the Fund adopted a policy to invest at least 25% of its assets in equity securities and at least 25% of its assets in fixed income securities.
Eventide Balanced Fund - Class N (ETNMX )
Annual Shareholder Report - June 30, 2024
Where can I find additional information about the Fund?
Additional information is available on the Fund's website ( https://www.eventidefunds.com ), including its:
Prospectus
Financial information
Holdings
Proxy voting information
Annual Shareholder Report - June 30, 2024
This annual shareholder report contains important information about Eventide Core Bond Fund for the period of July 1, 2023 to June 30, 2024. You can find additional information about the Fund at https://www.eventidefunds.com. You can also request this information by contacting us at 1-877-771-3836.
What were the Fund’s costs for the last year?
(based on a hypothetical $10,000 investment)
| Class Name | Costs of a $10,000 investment | Costs paid as a percentage of a $10,000 investment |
|---|
| Class A | $83 | 0.83% |
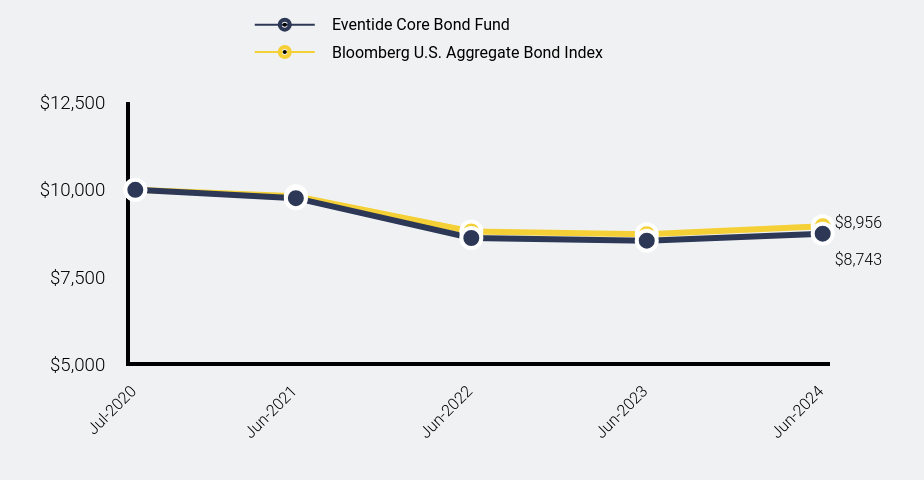
How did the Fund perform during the reporting period?
Performance of the Fund for the year was materially impacted by fluctuations of the yield curve and the performance of corporate bonds relative to treasuries. Corporate bonds outperformed treasuries for the year ended 6/30/24, which had a positive impact on the Fund's returns on an absolute and relative basis. However, this positive effect was offset by higher long-term rates as the yield curve flattened, resulting in slight underperformance of the Fund relative to the benchmark.
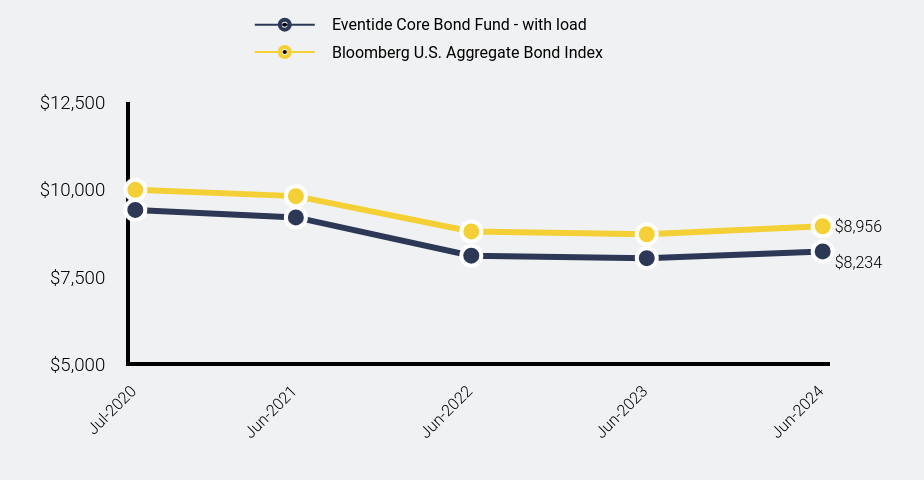
How has the Fund performed since inception?
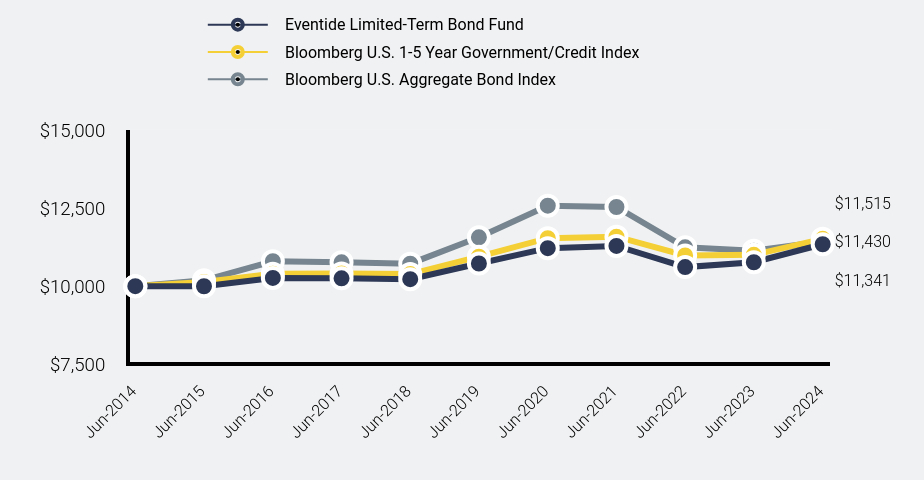
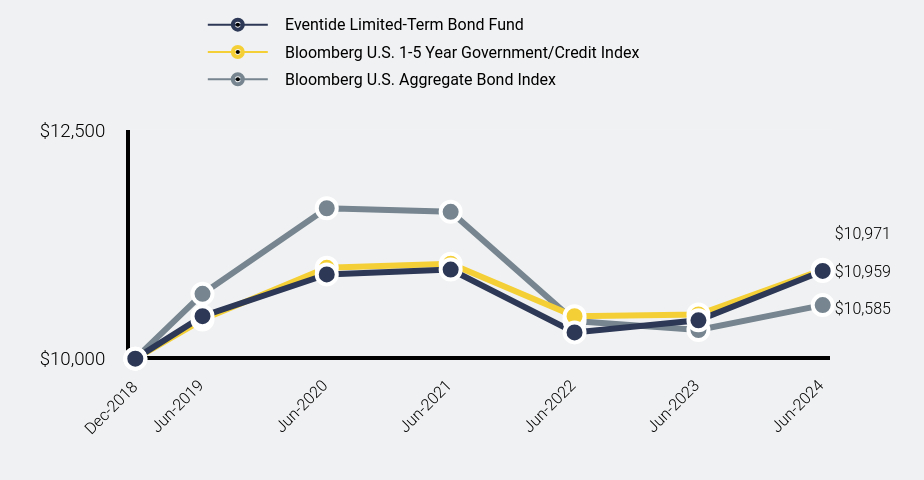
Total Return Based on $10,000 Investment
| Eventide Core Bond Fund - with load | Bloomberg U.S. Aggregate Bond Index |
|---|
| Jul-2020 | $9,425 | $10,000 |
| Jun-2021 | $9,210 | $9,820 |
| Jun-2022 | $8,113 | $8,809 |
| Jun-2023 | $8,040 | $8,727 |
| Jun-2024 | $8,234 | $8,956 |
The Fund's past performance is not a good predictor of how the Fund will perform in the future. The graph and table do not reflect the deduction of taxes that a shareholder would pay on fund distributions or redemption of fund shares. In connection with new SEC Rules on shareholder reporting, the Fund's performance information above is compared with a broad-based benchmark, Bloomberg US Aggregate Index, which represents the overall domestic bond market.
| Net Assets | $137,304,892 |
| Number of Portfolio Holdings | 95 |
| Advisory Fee (net of waivers) | $225,991 |
| Portfolio Turnover | 33% |
Average Annual Total Returns
| 1 Year | Since Inception (July 31, 2020) |
|---|
| Eventide Core Bond Fund - Class A |
| Without Load | 2.42% | |
| With Load | | |
| Bloomberg U.S. Aggregate Bond Index | 2.63% | |
What did the Fund invest in?
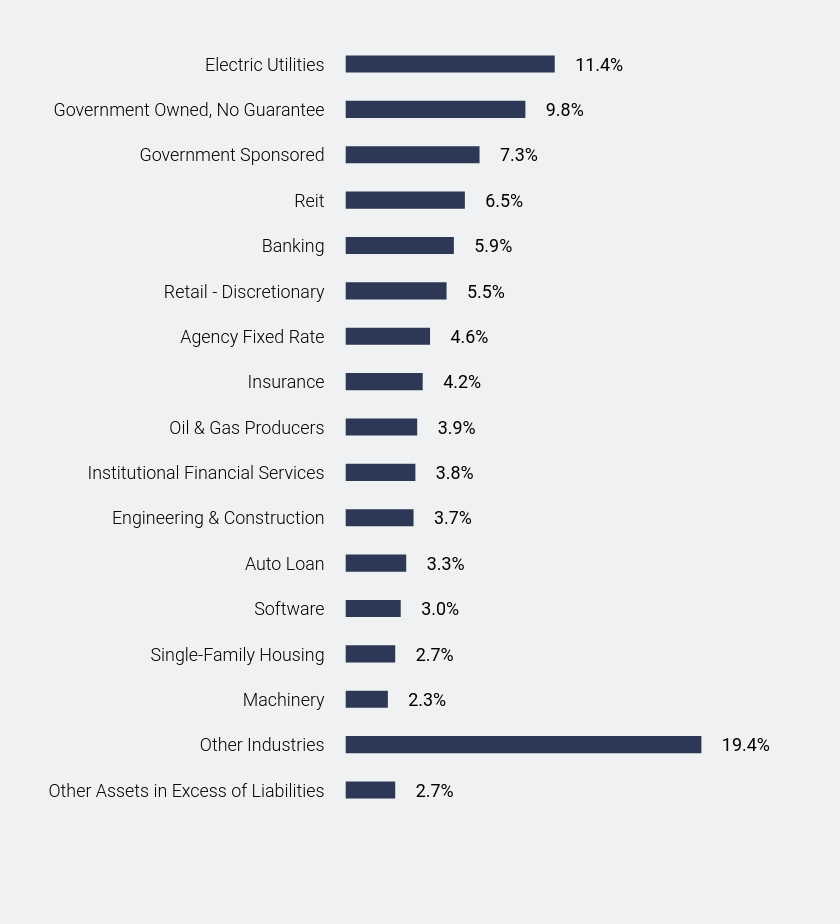
Industry Weighting (% of net assets)
| Value | Value |
|---|
| Other Assets in Excess of Liabilities | 2.7% |
| Other Industries | 14.5% |
| Technology Services | 1.5% |
| Retail - Discretionary | 1.7% |
| Auto Loan | 1.7% |
| Software | 2.3% |
| Semiconductors | 2.5% |
| Engineering & Construction | 2.7% |
| Banking | 3.0% |
| Institutional Financial Services | 3.0% |
| Oil & Gas Producers | 3.8% |
| Reit | 4.3% |
| Single-Family Housing | 5.2% |
| Government Owned, No Guarantee | 5.5% |
| Government Sponsored | 7.3% |
| Electric Utilities | 11.7% |
| Agency Fixed Rate | 26.6% |
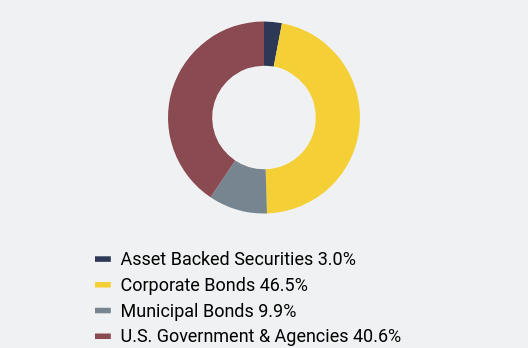
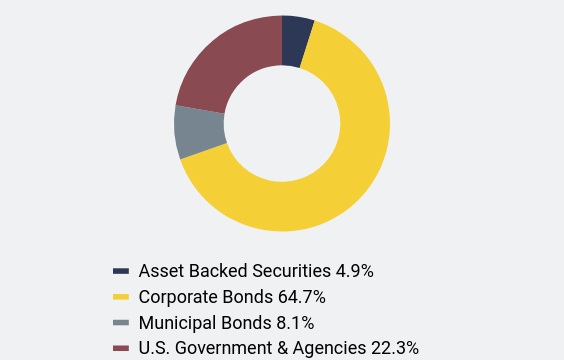
Asset Weighting (% of total investments)
| Value | Value |
|---|
| Asset Backed Securities | 3.0% |
| Corporate Bonds | 46.5% |
| Municipal Bonds | 9.9% |
| U.S. Government & Agencies | 40.6% |
Top 10 Holdings* (% of net assets)
| Holding Name | % of Net Assets |
| JPMorgan Chase & Company, 6.070%, due 10/22/27 | 1.9% |
| Federal Home Loan Mortgage Corporation, 6.250%, due 07/15/32 | 1.8% |
| Federal National Mortgage Association, 6.250%, due 05/15/29 | 1.8% |
| Freddie Mac Pool, 4.500%, due 08/1/52 | 1.8% |
| Fannie Mae Pool, 2.000%, due 06/1/51 | 1.8% |
| Fannie Mae Pool, 5.500%, due 01/1/53 | 1.6% |
| Fannie Mae Pool, 4.500%, due 11/1/52 | 1.6% |
| Freddie Mac Pool, 5.000%, due 01/1/53 | 1.6% |
| Morgan Stanley, 0.864%, due 10/21/25 | 1.6% |
| Freddie Mac Pool, 3.500%, due 06/1/52 | 1.5% |
* Does not include cash/money market funds/equivalents. Based on percentage of net assets. Holdings can change at any time, are subject to risks discussed in the Fund’s prospectus, and should not be considered investment advice.
No material changes occurred during the year ended June 30, 2024.
Eventide Core Bond Fund - Class A (ETARX )
Annual Shareholder Report - June 30, 2024
Where can I find additional information about the Fund?
Additional information is available on the Fund's website ( https://www.eventidefunds.com ), including its:
Prospectus
Financial information
Holdings
Proxy voting information
Annual Shareholder Report - June 30, 2024
This annual shareholder report contains important information about Eventide Core Bond Fund for the period of July 1, 2023 to June 30, 2024. You can find additional information about the Fund at https://www.eventidefunds.com. You can also request this information by contacting us at 1-877-771-3836.
What were the Fund’s costs for the last year?
(based on a hypothetical $10,000 investment)
| Class Name | Costs of a $10,000 investment | Costs paid as a percentage of a $10,000 investment |
|---|
| Class C | $158 | 1.58% |
How did the Fund perform during the reporting period?
Performance of the Fund for the year was materially impacted by fluctuations of the yield curve and the performance of corporate bonds relative to treasuries. Corporate bonds outperformed treasuries for the year ended 6/30/24, which had a positive impact on the Fund's returns on an absolute and relative basis. However, this positive effect was offset by higher long-term rates as the yield curve flattened, resulting in slight underperformance of the Fund relative to the benchmark.
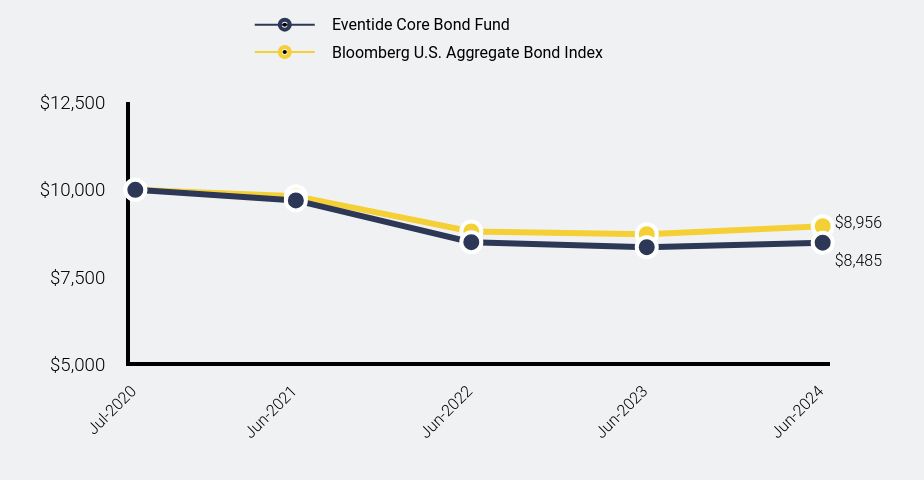
How has the Fund performed since inception?
Total Return Based on $10,000 Investment
| Eventide Core Bond Fund | Bloomberg U.S. Aggregate Bond Index |
|---|
| Jul-2020 | $10,000 | $10,000 |
| Jun-2021 | $9,698 | $9,820 |
| Jun-2022 | $8,499 | $8,809 |
| Jun-2023 | $8,357 | $8,727 |
| Jun-2024 | $8,485 | $8,956 |
The Fund's past performance is not a good predictor of how the Fund will perform in the future. The graph and table do not reflect the deduction of taxes that a shareholder would pay on fund distributions or redemption of fund shares. In connection with new SEC Rules on shareholder reporting, the Fund's performance information above is compared with a broad-based benchmark, Bloomberg US Aggregate Index, which represents the overall domestic bond market.
| Net Assets | $137,304,892 |
| Number of Portfolio Holdings | 95 |
| Advisory Fee (net of waivers) | $225,991 |
| Portfolio Turnover | 33% |
Average Annual Total Returns
| 1 Year | Since Inception (July 31, 2020) |
|---|
| Eventide Core Bond Fund - Class C | 1.53% | |
| Bloomberg U.S. Aggregate Bond Index | 2.63% | |
What did the Fund invest in?
Industry Weighting (% of net assets)
| Value | Value |
|---|
| Other Assets in Excess of Liabilities | 2.7% |
| Other Industries | 14.5% |
| Technology Services | 1.5% |
| Retail - Discretionary | 1.7% |
| Auto Loan | 1.7% |
| Software | 2.3% |
| Semiconductors | 2.5% |
| Engineering & Construction | 2.7% |
| Banking | 3.0% |
| Institutional Financial Services | 3.0% |
| Oil & Gas Producers | 3.8% |
| Reit | 4.3% |
| Single-Family Housing | 5.2% |
| Government Owned, No Guarantee | 5.5% |
| Government Sponsored | 7.3% |
| Electric Utilities | 11.7% |
| Agency Fixed Rate | 26.6% |
Asset Weighting (% of total investments)
| Value | Value |
|---|
| Asset Backed Securities | 3.0% |
| Corporate Bonds | 46.5% |
| Municipal Bonds | 9.9% |
| U.S. Government & Agencies | 40.6% |
Top 10 Holdings* (% of net assets)
| Holding Name | % of Net Assets |
| JPMorgan Chase & Company, 6.070%, due 10/22/27 | 1.9% |
| Federal Home Loan Mortgage Corporation, 6.250%, due 07/15/32 | 1.8% |
| Federal National Mortgage Association, 6.250%, due 05/15/29 | 1.8% |
| Freddie Mac Pool, 4.500%, due 08/1/52 | 1.8% |
| Fannie Mae Pool, 2.000%, due 06/1/51 | 1.8% |
| Fannie Mae Pool, 5.500%, due 01/1/53 | 1.6% |
| Fannie Mae Pool, 4.500%, due 11/1/52 | 1.6% |
| Freddie Mac Pool, 5.000%, due 01/1/53 | 1.6% |
| Morgan Stanley, 0.864%, due 10/21/25 | 1.6% |
| Freddie Mac Pool, 3.500%, due 06/1/52 | 1.5% |
* Does not include cash/money market funds/equivalents. Based on percentage of net assets. Holdings can change at any time, are subject to risks discussed in the Fund’s prospectus, and should not be considered investment advice.
No material changes occurred during the year ended June 30, 2024.
Eventide Core Bond Fund - Class C (ETCRX )
Annual Shareholder Report - June 30, 2024
Where can I find additional information about the Fund?
Additional information is available on the Fund's website ( https://www.eventidefunds.com ), including its:
Prospectus
Financial information
Holdings
Proxy voting information
Annual Shareholder Report - June 30, 2024
This annual shareholder report contains important information about Eventide Core Bond Fund for the period of July 1, 2023 to June 30, 2024. You can find additional information about the Fund at https://www.eventidefunds.com. You can also request this information by contacting us at 1-877-771-3836.
What were the Fund’s costs for the last year?
(based on a hypothetical $10,000 investment)
| Class Name | Costs of a $10,000 investment | Costs paid as a percentage of a $10,000 investment |
|---|
| Class I | $58 | 0.58% |
How did the Fund perform during the reporting period?
Performance of the Fund for the year was materially impacted by fluctuations of the yield curve and the performance of corporate bonds relative to treasuries. Corporate bonds outperformed treasuries for the year ended 6/30/24, which had a positive impact on the Fund's returns on an absolute and relative basis. However, this positive effect was offset by higher long-term rates as the yield curve flattened, resulting in slight underperformance of the Fund relative to the benchmark.
How has the Fund performed since inception?
Total Return Based on $10,000 Investment
| Eventide Core Bond Fund | Bloomberg U.S. Aggregate Bond Index |
|---|
| Jul-2020 | $10,000 | $10,000 |
| Jun-2021 | $9,776 | $9,820 |
| Jun-2022 | $8,651 | $8,809 |
| Jun-2023 | $8,593 | $8,727 |
| Jun-2024 | $8,812 | $8,956 |
The Fund's past performance is not a good predictor of how the Fund will perform in the future. The graph and table do not reflect the deduction of taxes that a shareholder would pay on fund distributions or redemption of fund shares. In connection with new SEC Rules on shareholder reporting, the Fund's performance information above is compared with a broad-based benchmark, Bloomberg US Aggregate Index, which represents the overall domestic bond market.
| Net Assets | $137,304,892 |
| Number of Portfolio Holdings | 95 |
| Advisory Fee (net of waivers) | $225,991 |
| Portfolio Turnover | 33% |
Average Annual Total Returns
| 1 Year | Since Inception (July 31, 2020) |
|---|
| Eventide Core Bond Fund - Class I | 2.54% | |
| Bloomberg U.S. Aggregate Bond Index | 2.63% | |
What did the Fund invest in?
Industry Weighting (% of net assets)
| Value | Value |
|---|
| Other Assets in Excess of Liabilities | 2.7% |
| Other Industries | 14.5% |
| Technology Services | 1.5% |
| Retail - Discretionary | 1.7% |
| Auto Loan | 1.7% |
| Software | 2.3% |
| Semiconductors | 2.5% |
| Engineering & Construction | 2.7% |
| Banking | 3.0% |
| Institutional Financial Services | 3.0% |
| Oil & Gas Producers | 3.8% |
| Reit | 4.3% |
| Single-Family Housing | 5.2% |
| Government Owned, No Guarantee | 5.5% |
| Government Sponsored | 7.3% |
| Electric Utilities | 11.7% |
| Agency Fixed Rate | 26.6% |
Asset Weighting (% of total investments)
| Value | Value |
|---|
| Asset Backed Securities | 3.0% |
| Corporate Bonds | 46.5% |
| Municipal Bonds | 9.9% |
| U.S. Government & Agencies | 40.6% |
Top 10 Holdings* (% of net assets)
| Holding Name | % of Net Assets |
| JPMorgan Chase & Company, 6.070%, due 10/22/27 | 1.9% |
| Federal Home Loan Mortgage Corporation, 6.250%, due 07/15/32 | 1.8% |
| Federal National Mortgage Association, 6.250%, due 05/15/29 | 1.8% |
| Freddie Mac Pool, 4.500%, due 08/1/52 | 1.8% |
| Fannie Mae Pool, 2.000%, due 06/1/51 | 1.8% |
| Fannie Mae Pool, 5.500%, due 01/1/53 | 1.6% |
| Fannie Mae Pool, 4.500%, due 11/1/52 | 1.6% |
| Freddie Mac Pool, 5.000%, due 01/1/53 | 1.6% |
| Morgan Stanley, 0.864%, due 10/21/25 | 1.6% |
| Freddie Mac Pool, 3.500%, due 06/1/52 | 1.5% |
* Does not include cash/money market funds/equivalents. Based on percentage of net assets. Holdings can change at any time, are subject to risks discussed in the Fund’s prospectus, and should not be considered investment advice.
No material changes occurred during the year ended June 30, 2024.
Eventide Core Bond Fund - Class I (ETIRX )
Annual Shareholder Report - June 30, 2024
Where can I find additional information about the Fund?
Additional information is available on the Fund's website ( https://www.eventidefunds.com ), including its:
Prospectus
Financial information
Holdings
Proxy voting information
Annual Shareholder Report - June 30, 2024
This annual shareholder report contains important information about Eventide Core Bond Fund for the period of July 1, 2023 to June 30, 2024. You can find additional information about the Fund at https://www.eventidefunds.com. You can also request this information by contacting us at 1-877-771-3836.
What were the Fund’s costs for the last year?
(based on a hypothetical $10,000 investment)
| Class Name | Costs of a $10,000 investment | Costs paid as a percentage of a $10,000 investment |
|---|
| Class N | $78 | 0.78% |
How did the Fund perform during the reporting period?
Performance of the Fund for the year was materially impacted by fluctuations of the yield curve and the performance of corporate bonds relative to treasuries. Corporate bonds outperformed treasuries for the year ended 6/30/24, which had a positive impact on the Fund's returns on an absolute and relative basis. However, this positive effect was offset by higher long-term rates as the yield curve flattened, resulting in slight underperformance of the Fund relative to the benchmark.
How has the Fund performed since inception?
Total Return Based on $10,000 Investment
| Eventide Core Bond Fund | Bloomberg U.S. Aggregate Bond Index |
|---|
| Jul-2020 | $10,000 | $10,000 |
| Jun-2021 | $9,761 | $9,820 |
| Jun-2022 | $8,620 | $8,809 |
| Jun-2023 | $8,543 | $8,727 |
| Jun-2024 | $8,743 | $8,956 |
The Fund's past performance is not a good predictor of how the Fund will perform in the future. The graph and table do not reflect the deduction of taxes that a shareholder would pay on fund distributions or redemption of fund shares. In connection with new SEC Rules on shareholder reporting, the Fund's performance information above is compared with a broad-based benchmark, Bloomberg US Aggregate Index, which represents the overall domestic bond market.
| Net Assets | $137,304,892 |
| Number of Portfolio Holdings | 95 |
| Advisory Fee (net of waivers) | $225,991 |
| Portfolio Turnover | 33% |
Average Annual Total Returns
| 1 Year | Since Inception (July 31, 2020) |
|---|
| Eventide Core Bond Fund - Class N | 2.34% | |
| Bloomberg U.S. Aggregate Bond Index | 2.63% | |
What did the Fund invest in?
Industry Weighting (% of net assets)
| Value | Value |
|---|
| Other Assets in Excess of Liabilities | 2.7% |
| Other Industries | 14.5% |
| Technology Services | 1.5% |
| Retail - Discretionary | 1.7% |
| Auto Loan | 1.7% |
| Software | 2.3% |
| Semiconductors | 2.5% |
| Engineering & Construction | 2.7% |
| Banking | 3.0% |
| Institutional Financial Services | 3.0% |
| Oil & Gas Producers | 3.8% |
| Reit | 4.3% |
| Single-Family Housing | 5.2% |
| Government Owned, No Guarantee | 5.5% |
| Government Sponsored | 7.3% |
| Electric Utilities | 11.7% |
| Agency Fixed Rate | 26.6% |
Asset Weighting (% of total investments)
| Value | Value |
|---|
| Asset Backed Securities | 3.0% |
| Corporate Bonds | 46.5% |
| Municipal Bonds | 9.9% |
| U.S. Government & Agencies | 40.6% |
Top 10 Holdings* (% of net assets)
| Holding Name | % of Net Assets |
| JPMorgan Chase & Company, 6.070%, due 10/22/27 | 1.9% |
| Federal Home Loan Mortgage Corporation, 6.250%, due 07/15/32 | 1.8% |
| Federal National Mortgage Association, 6.250%, due 05/15/29 | 1.8% |
| Freddie Mac Pool, 4.500%, due 08/1/52 | 1.8% |
| Fannie Mae Pool, 2.000%, due 06/1/51 | 1.8% |
| Fannie Mae Pool, 5.500%, due 01/1/53 | 1.6% |
| Fannie Mae Pool, 4.500%, due 11/1/52 | 1.6% |
| Freddie Mac Pool, 5.000%, due 01/1/53 | 1.6% |
| Morgan Stanley, 0.864%, due 10/21/25 | 1.6% |
| Freddie Mac Pool, 3.500%, due 06/1/52 | 1.5% |
* Does not include cash/money market funds/equivalents. Based on percentage of net assets. Holdings can change at any time, are subject to risks discussed in the Fund’s prospectus, and should not be considered investment advice.
No material changes occurred during the year ended June 30, 2024.
Eventide Core Bond Fund - Class N (ETNRX )
Annual Shareholder Report - June 30, 2024
Where can I find additional information about the Fund?
Additional information is available on the Fund's website ( https://www.eventidefunds.com ), including its:
Prospectus
Financial information
Holdings
Proxy voting information
Eventide Dividend Opportunities Fund
Annual Shareholder Report - June 30, 2024
This annual shareholder report contains important information about Eventide Dividend Opportunities Fund for the period of July 1, 2023 to June 30, 2024. You can find additional information about the Fund at https://www.eventidefunds.com. You can also request this information by contacting us at 1-877-771-3836.
What were the Fund’s costs for the last year?
(based on a hypothetical $10,000 investment)
| Class Name | Costs of a $10,000 investment | Costs paid as a percentage of a $10,000 investment |
|---|
| Class A | $120 | 1.20% |
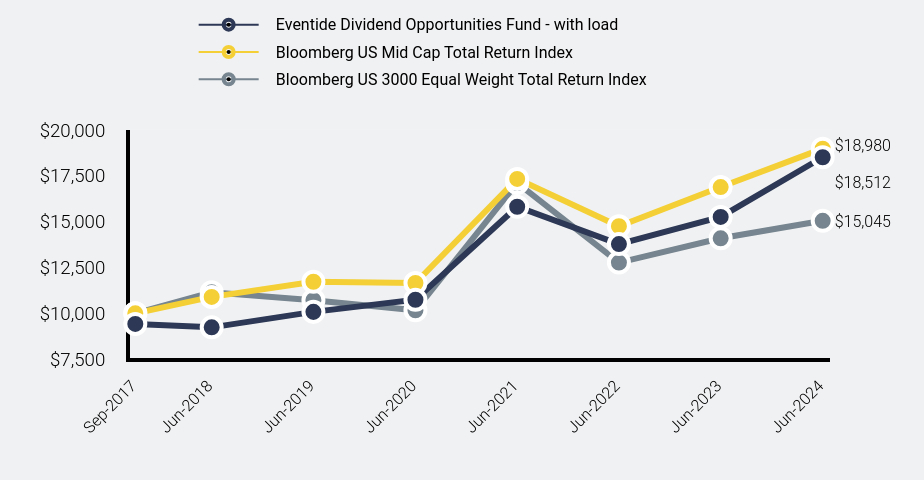
How has the Fund performed since inception?
Total Return Based on $10,000 Investment
| Eventide Dividend Opportunities Fund - with load | Bloomberg US Mid Cap Total Return Index | Bloomberg US 3000 Equal Weight Total Return Index |
|---|
| Sep-2017 | $9,425 | $10,000 | $10,000 |
| Jun-2018 | $9,236 | $10,897 | $11,146 |
| Jun-2019 | $10,081 | $11,723 | $10,713 |
| Jun-2020 | $10,742 | $11,654 | $10,166 |
| Jun-2021 | $15,814 | $17,332 | $17,109 |
| Jun-2022 | $13,778 | $14,753 | $12,770 |
| Jun-2023 | $15,256 | $16,886 | $14,093 |
| Jun-2024 | $18,512 | $18,980 | $15,045 |
The Fund's past performance is not a good predictor of how the Fund will perform in the future. The graph and table do not reflect the deduction of taxes that a shareholder would pay on fund distributions or redemption of fund shares. In connection with new SEC Rules on shareholder reporting, the Fund's performance information above is compared with a broad-based benchmark, Bloomberg US 3000 Equal Weight Total Return Index, which represents the overall domestic equity market. In addition, the strategy benchmark, Bloomberg US Mid Cap Total Return Index, is included as the adviser believes it is more representative of the fund's investment universe.
How did the Fund perform during the reporting period?
The Fund outperformed its benchmark for the year ended 6/30/2024. The Fund outperformed in many sectors (IT, Industrials, Energy, Utilities) and underperformed in Consumer Discretionary and Financials. We continue to add high-quality companies in growth areas (technology, AI, electrification, infrastructure). Emphasizing attractive valuations, dividend growth, and strong business fundamentals, we believe we are well-positioned for volatility or a pivot to lower interest rates, as investors seek dividends. The Fund may lag during rallies led by lower-quality or cyclical sectors. Our experience bolsters our confidence that high-quality, dividend-growth companies serving customers and stakeholders well also serve shareholders well. We are committed to resilient growth, strong financials, value creation, and human flourishing.
Average Annual Total Returns
| 1 Year | 5 Years | Since Inception (September 29, 2017) |
|---|
| Eventide Dividend Opportunities Fund - Class A |
| Without Load | 21.35% | 12.92% | 10.52% |
| With Load | 14.40% | 11.60% | 9.55% |
| Bloomberg US Mid Cap Total Return Index | 12.40% | 10.12% | 9.96% |
| Bloomberg US 3000 Equal Weight Total Return Index | 6.75% | 7.03% | 6.24% |
- Net Assets$863,913,670
- Number of Portfolio Holdings49
- Advisory Fee (net of waivers)$4,876,704
- Portfolio Turnover38%
What did the Fund invest in?
Industry Weighting (% of net assets)
| Value | Value |
|---|
| Other Assets in Excess of Liabilities | 1.7% |
| Other Industries | 13.4% |
| Diversified Industrials | 2.2% |
| Home Construction | 2.4% |
| Retail - Discretionary | 2.8% |
| Institutional Financial Services | 2.7% |
| Industrial Support Services | 4.9% |
| Semiconductors | 5.1% |
| Medical Equipment & Devices | 5.1% |
| Insurance | 5.3% |
| Chemicals | 5.5% |
| Software | 7.0% |
| Reit | 7.2% |
| Technology Services | 7.7% |
| Electric Utilities | 8.2% |
| Oil & Gas Producers | 8.4% |
| Electrical Equipment | 10.4% |
Asset Weighting (% of total investments)
| Value | Value |
|---|
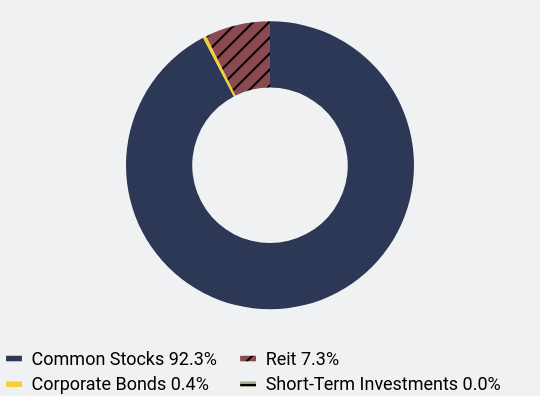
| Common Stocks | 92.3% |
| Corporate Bonds | 0.4% |
| Reit | 7.3% |
| Short-Term Investments | 0.0% |
Top 10 Holdings* (% of net assets)
| Holding Name | % of Net Assets |
| Trane Technologies PLC | 5.4% |
| nVent Electric PLC | 5.1% |
| Arthur J Gallagher & Company | 4.5% |
| Roper Technologies, Inc. | 4.4% |
| CDW Corporation | 4.1% |
| KLA Corporation | 4.0% |
| Targa Resources Corporation | 3.5% |
| Ferguson PLC | 3.4% |
| Williams Companies, Inc. (The) | 3.2% |
| STERIS plc | 2.8% |
* Does not include cash/money market funds/equivalents. Based on percentage of net assets. Holdings can change at any time, are subject to risks discussed in the Fund’s prospectus, and should not be considered investment advice.
No material changes occurred during the year ended June 30, 2024.
Eventide Dividend Opportunities Fund - Class A (ETADX )
Annual Shareholder Report - June 30, 2024
Where can I find additional information about the Fund?
Additional information is available on the Fund's website ( https://www.eventidefunds.com ), including its:
Prospectus
Financial information
Holdings
Proxy voting information
Eventide Dividend Opportunities Fund
Annual Shareholder Report - June 30, 2024
This annual shareholder report contains important information about Eventide Dividend Opportunities Fund for the period of July 1, 2023 to June 30, 2024. You can find additional information about the Fund at https://www.eventidefunds.com. You can also request this information by contacting us at 1-877-771-3836.
What were the Fund’s costs for the last year?
(based on a hypothetical $10,000 investment)
| Class Name | Costs of a $10,000 investment | Costs paid as a percentage of a $10,000 investment |
|---|
| Class C | $195 | 1.95% |
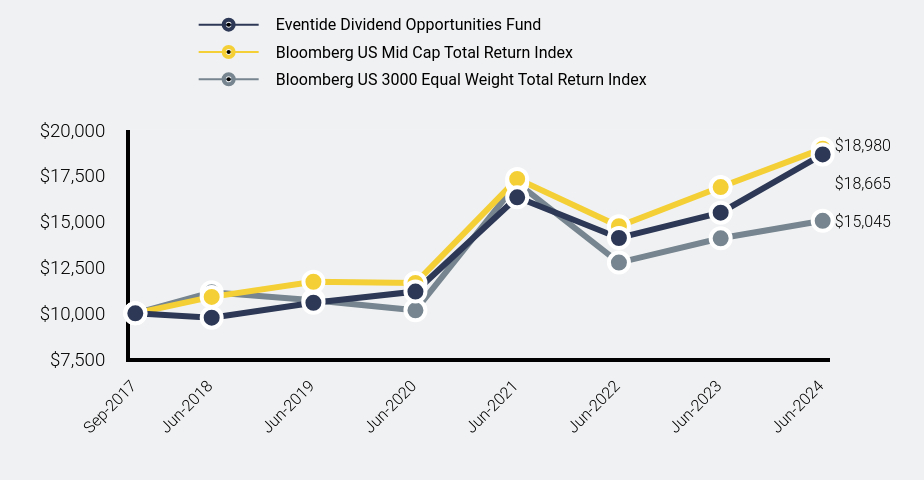
How has the Fund performed since inception?
Total Return Based on $10,000 Investment
| Eventide Dividend Opportunities Fund | Bloomberg US Mid Cap Total Return Index | Bloomberg US 3000 Equal Weight Total Return Index |
|---|
| Sep-2017 | $10,000 | $10,000 | $10,000 |
| Jun-2018 | $9,763 | $10,897 | $11,146 |
| Jun-2019 | $10,577 | $11,723 | $10,713 |
| Jun-2020 | $11,188 | $11,654 | $10,166 |
| Jun-2021 | $16,326 | $17,332 | $17,109 |
| Jun-2022 | $14,110 | $14,753 | $12,770 |
| Jun-2023 | $15,490 | $16,886 | $14,093 |
| Jun-2024 | $18,665 | $18,980 | $15,045 |
The Fund's past performance is not a good predictor of how the Fund will perform in the future. The graph and table do not reflect the deduction of taxes that a shareholder would pay on fund distributions or redemption of fund shares. In connection with new SEC Rules on shareholder reporting, the Fund's performance information above is compared with a broad-based benchmark, Bloomberg US 3000 Equal Weight Total Return Index, which represents the overall domestic equity market. In addition, the strategy benchmark, Bloomberg US Mid Cap Total Return Index, is included as the adviser believes it is more representative of the fund's investment universe.
How did the Fund perform during the reporting period?
The Fund outperformed its benchmark for the year ended 6/30/2024. The Fund outperformed in many sectors (IT, Industrials, Energy, Utilities) and underperformed in Consumer Discretionary and Financials. We continue to add high-quality companies in growth areas (technology, AI, electrification, infrastructure). Emphasizing attractive valuations, dividend growth, and strong business fundamentals, we believe we are well-positioned for volatility or a pivot to lower interest rates, as investors seek dividends. The Fund may lag during rallies led by lower-quality or cyclical sectors. Our experience bolsters our confidence that high-quality, dividend-growth companies serving customers and stakeholders well also serve shareholders well. We are committed to resilient growth, strong financials, value creation, and human flourishing.
Average Annual Total Returns
| 1 Year | 5 Years | Since Inception (September 29, 2017) |
|---|
| Eventide Dividend Opportunities Fund - Class C | 20.50% | 12.03% | 9.69% |
| Bloomberg US Mid Cap Total Return Index | 12.40% | 10.12% | 9.96% |
| Bloomberg US 3000 Equal Weight Total Return Index | 6.75% | 7.03% | 6.24% |
- Net Assets$863,913,670
- Number of Portfolio Holdings49
- Advisory Fee (net of waivers)$4,876,704
- Portfolio Turnover38%
What did the Fund invest in?
Industry Weighting (% of net assets)
| Value | Value |
|---|
| Other Assets in Excess of Liabilities | 1.7% |
| Other Industries | 13.4% |
| Diversified Industrials | 2.2% |
| Home Construction | 2.4% |
| Retail - Discretionary | 2.8% |
| Institutional Financial Services | 2.7% |
| Industrial Support Services | 4.9% |
| Semiconductors | 5.1% |
| Medical Equipment & Devices | 5.1% |
| Insurance | 5.3% |
| Chemicals | 5.5% |
| Software | 7.0% |
| Reit | 7.2% |
| Technology Services | 7.7% |
| Electric Utilities | 8.2% |
| Oil & Gas Producers | 8.4% |
| Electrical Equipment | 10.4% |
Asset Weighting (% of total investments)
| Value | Value |
|---|
| Common Stocks | 92.3% |
| Corporate Bonds | 0.4% |
| Reit | 7.3% |
| Short-Term Investments | 0.0% |
Top 10 Holdings* (% of net assets)
| Holding Name | % of Net Assets |
| Trane Technologies PLC | 5.4% |
| nVent Electric PLC | 5.1% |
| Arthur J Gallagher & Company | 4.5% |
| Roper Technologies, Inc. | 4.4% |
| CDW Corporation | 4.1% |
| KLA Corporation | 4.0% |
| Targa Resources Corporation | 3.5% |
| Ferguson PLC | 3.4% |
| Williams Companies, Inc. (The) | 3.2% |
| STERIS plc | 2.8% |
* Does not include cash/money market funds/equivalents. Based on percentage of net assets. Holdings can change at any time, are subject to risks discussed in the Fund’s prospectus, and should not be considered investment advice.
No material changes occurred during the year ended June 30, 2024.
Eventide Dividend Opportunities Fund - Class C (ETCDX )
Annual Shareholder Report - June 30, 2024
Where can I find additional information about the Fund?
Additional information is available on the Fund's website ( https://www.eventidefunds.com ), including its:
Prospectus
Financial information
Holdings
Proxy voting information
Eventide Dividend Opportunities Fund
Annual Shareholder Report - June 30, 2024
This annual shareholder report contains important information about Eventide Dividend Opportunities Fund for the period of July 1, 2023 to June 30, 2024. You can find additional information about the Fund at https://www.eventidefunds.com. You can also request this information by contacting us at 1-877-771-3836.
What were the Fund’s costs for the last year?
(based on a hypothetical $10,000 investment)
| Class Name | Costs of a $10,000 investment | Costs paid as a percentage of a $10,000 investment |
|---|
| Class I | $95 | 0.95% |
How has the Fund performed since inception?
Total Return Based on $10,000 Investment
| Eventide Dividend Opportunities Fund | Bloomberg US Mid Cap Total Return Index | Bloomberg US 3000 Equal Weight Total Return Index |
|---|
| Sep-2017 | $10,000 | $10,000 | $10,000 |
| Jun-2018 | $9,832 | $10,897 | $11,146 |
| Jun-2019 | $10,756 | $11,723 | $10,713 |
| Jun-2020 | $11,487 | $11,654 | $10,166 |
| Jun-2021 | $16,942 | $17,332 | $17,109 |
| Jun-2022 | $14,787 | $14,753 | $12,770 |
| Jun-2023 | $16,404 | $16,886 | $14,093 |
| Jun-2024 | $19,962 | $18,980 | $15,045 |
The Fund's past performance is not a good predictor of how the Fund will perform in the future. The graph and table do not reflect the deduction of taxes that a shareholder would pay on fund distributions or redemption of fund shares. In connection with new SEC Rules on shareholder reporting, the Fund's performance information above is compared with a broad-based benchmark, Bloomberg US 3000 Equal Weight Total Return Index, which represents the overall domestic equity market. In addition, the strategy benchmark, Bloomberg US Mid Cap Total Return Index, is included as the adviser believes it is more representative of the fund's investment universe.
How did the Fund perform during the reporting period?
The Fund outperformed its benchmark for the year ended 6/30/2024. The Fund outperformed in many sectors (IT, Industrials, Energy, Utilities) and underperformed in Consumer Discretionary and Financials. We continue to add high-quality companies in growth areas (technology, AI, electrification, infrastructure). Emphasizing attractive valuations, dividend growth, and strong business fundamentals, we believe we are well-positioned for volatility or a pivot to lower interest rates, as investors seek dividends. The Fund may lag during rallies led by lower-quality or cyclical sectors. Our experience bolsters our confidence that high-quality, dividend-growth companies serving customers and stakeholders well also serve shareholders well. We are committed to resilient growth, strong financials, value creation, and human flourishing.
Average Annual Total Returns
| 1 Year | 5 Years | Since Inception (September 29, 2017) |
|---|
| Eventide Dividend Opportunities Fund - Class I | 21.70% | 13.16% | 10.78% |
| Bloomberg US Mid Cap Total Return Index | 12.40% | 10.12% | 9.96% |
| Bloomberg US 3000 Equal Weight Total Return Index | 6.75% | 7.03% | 6.24% |
- Net Assets$863,913,670
- Number of Portfolio Holdings49
- Advisory Fee (net of waivers)$4,876,704
- Portfolio Turnover38%
What did the Fund invest in?
Industry Weighting (% of net assets)
| Value | Value |
|---|
| Other Assets in Excess of Liabilities | 1.7% |
| Other Industries | 13.4% |
| Diversified Industrials | 2.2% |
| Home Construction | 2.4% |
| Retail - Discretionary | 2.8% |
| Institutional Financial Services | 2.7% |
| Industrial Support Services | 4.9% |
| Semiconductors | 5.1% |
| Medical Equipment & Devices | 5.1% |
| Insurance | 5.3% |
| Chemicals | 5.5% |
| Software | 7.0% |
| Reit | 7.2% |
| Technology Services | 7.7% |
| Electric Utilities | 8.2% |
| Oil & Gas Producers | 8.4% |
| Electrical Equipment | 10.4% |
Asset Weighting (% of total investments)
| Value | Value |
|---|
| Common Stocks | 92.3% |
| Corporate Bonds | 0.4% |
| Reit | 7.3% |
| Short-Term Investments | 0.0% |
Top 10 Holdings* (% of net assets)
| Holding Name | % of Net Assets |
| Trane Technologies PLC | 5.4% |
| nVent Electric PLC | 5.1% |
| Arthur J Gallagher & Company | 4.5% |
| Roper Technologies, Inc. | 4.4% |
| CDW Corporation | 4.1% |
| KLA Corporation | 4.0% |
| Targa Resources Corporation | 3.5% |
| Ferguson PLC | 3.4% |
| Williams Companies, Inc. (The) | 3.2% |
| STERIS plc | 2.8% |
* Does not include cash/money market funds/equivalents. Based on percentage of net assets. Holdings can change at any time, are subject to risks discussed in the Fund’s prospectus, and should not be considered investment advice.
No material changes occurred during the year ended June 30, 2024.
Eventide Dividend Opportunities Fund - Class I (ETIDX )
Annual Shareholder Report - June 30, 2024
Where can I find additional information about the Fund?
Additional information is available on the Fund's website ( https://www.eventidefunds.com ), including its:
Prospectus
Financial information
Holdings
Proxy voting information
Eventide Dividend Opportunities Fund
Annual Shareholder Report - June 30, 2024
This annual shareholder report contains important information about Eventide Dividend Opportunities Fund for the period of July 1, 2023 to June 30, 2024. You can find additional information about the Fund at https://www.eventidefunds.com. You can also request this information by contacting us at 1-877-771-3836.
What were the Fund’s costs for the last year?
(based on a hypothetical $10,000 investment)
| Class Name | Costs of a $10,000 investment | Costs paid as a percentage of a $10,000 investment |
|---|
| Class N | $115 | 1.15% |
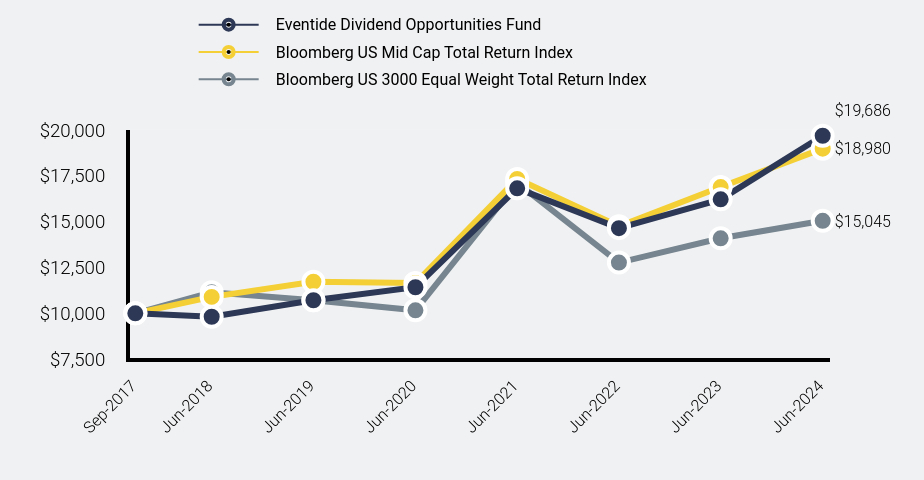
How has the Fund performed since inception?
Total Return Based on $10,000 Investment
| Eventide Dividend Opportunities Fund | Bloomberg US Mid Cap Total Return Index | Bloomberg US 3000 Equal Weight Total Return Index |
|---|
| Sep-2017 | $10,000 | $10,000 | $10,000 |
| Jun-2018 | $9,813 | $10,897 | $11,146 |
| Jun-2019 | $10,716 | $11,723 | $10,713 |
| Jun-2020 | $11,424 | $11,654 | $10,166 |
| Jun-2021 | $16,817 | $17,332 | $17,109 |
| Jun-2022 | $14,647 | $14,753 | $12,770 |
| Jun-2023 | $16,216 | $16,886 | $14,093 |
| Jun-2024 | $19,686 | $18,980 | $15,045 |
The Fund's past performance is not a good predictor of how the Fund will perform in the future. The graph and table do not reflect the deduction of taxes that a shareholder would pay on fund distributions or redemption of fund shares. In connection with new SEC Rules on shareholder reporting, the Fund's performance information above is compared with a broad-based benchmark, Bloomberg US 3000 Equal Weight Total Return Index, which represents the overall domestic equity market. In addition, the strategy benchmark, Bloomberg US Mid Cap Total Return Index, is included as the adviser believes it is more representative of the fund's investment universe.
How did the Fund perform during the reporting period?
The Fund outperformed its benchmark for the year ended 6/30/2024. The Fund outperformed in many sectors (IT, Industrials, Energy, Utilities) and underperformed in Consumer Discretionary and Financials. We continue to add high-quality companies in growth areas (technology, AI, electrification, infrastructure). Emphasizing attractive valuations, dividend growth, and strong business fundamentals, we believe we are well-positioned for volatility or a pivot to lower interest rates, as investors seek dividends. The Fund may lag during rallies led by lower-quality or cyclical sectors. Our experience bolsters our confidence that high-quality, dividend-growth companies serving customers and stakeholders well also serve shareholders well. We are committed to resilient growth, strong financials, value creation, and human flourishing.
Average Annual Total Returns
| 1 Year | 5 Years | Since Inception (September 29, 2017) |
|---|
| Eventide Dividend Opportunities Fund - Class N | 21.40% | 12.93% | 10.55% |
| Bloomberg US Mid Cap Total Return Index | 12.40% | 10.12% | 9.96% |
| Bloomberg US 3000 Equal Weight Total Return Index | 6.75% | 7.03% | 6.24% |
- Net Assets$863,913,670
- Number of Portfolio Holdings49
- Advisory Fee (net of waivers)$4,876,704
- Portfolio Turnover38%
What did the Fund invest in?
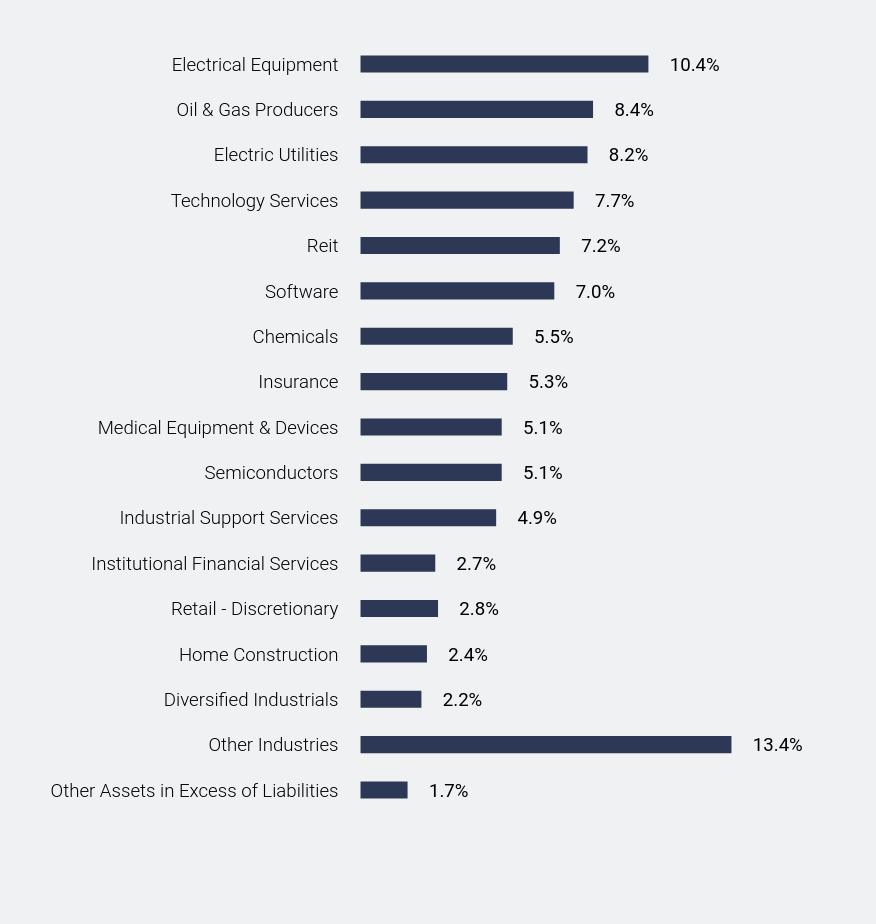
Industry Weighting (% of net assets)
| Value | Value |
|---|
| Other Assets in Excess of Liabilities | 1.7% |
| Other Industries | 13.4% |
| Diversified Industrials | 2.2% |
| Home Construction | 2.4% |
| Retail - Discretionary | 2.8% |
| Institutional Financial Services | 2.7% |
| Industrial Support Services | 4.9% |
| Semiconductors | 5.1% |
| Medical Equipment & Devices | 5.1% |
| Insurance | 5.3% |
| Chemicals | 5.5% |
| Software | 7.0% |
| Reit | 7.2% |
| Technology Services | 7.7% |
| Electric Utilities | 8.2% |
| Oil & Gas Producers | 8.4% |
| Electrical Equipment | 10.4% |
Asset Weighting (% of total investments)
| Value | Value |
|---|
| Common Stocks | 92.3% |
| Corporate Bonds | 0.4% |
| Reit | 7.3% |
| Short-Term Investments | 0.0% |
Top 10 Holdings* (% of net assets)
| Holding Name | % of Net Assets |
| Trane Technologies PLC | 5.4% |
| nVent Electric PLC | 5.1% |
| Arthur J Gallagher & Company | 4.5% |
| Roper Technologies, Inc. | 4.4% |
| CDW Corporation | 4.1% |
| KLA Corporation | 4.0% |
| Targa Resources Corporation | 3.5% |
| Ferguson PLC | 3.4% |
| Williams Companies, Inc. (The) | 3.2% |
| STERIS plc | 2.8% |
* Does not include cash/money market funds/equivalents. Based on percentage of net assets. Holdings can change at any time, are subject to risks discussed in the Fund’s prospectus, and should not be considered investment advice.
No material changes occurred during the year ended June 30, 2024.
Eventide Dividend Opportunities Fund - Class N (ETNDX )
Annual Shareholder Report - June 30, 2024
Where can I find additional information about the Fund?
Additional information is available on the Fund's website ( https://www.eventidefunds.com ), including its:
Prospectus
Financial information
Holdings
Proxy voting information
Eventide Exponential Technologies Fund
Annual Shareholder Report - June 30, 2024
This annual shareholder report contains important information about Eventide Exponential Technologies Fund for the period of July 1, 2023 to June 30, 2024. You can find additional information about the Fund at https://www.eventidefunds.com. You can also request this information by contacting us at 1-877-771-3836.
What were the Fund’s costs for the last year?
(based on a hypothetical $10,000 investment)
| Class Name | Costs of a $10,000 investment | Costs paid as a percentage of a $10,000 investment |
|---|
| Class A | $168 | 1.68% |
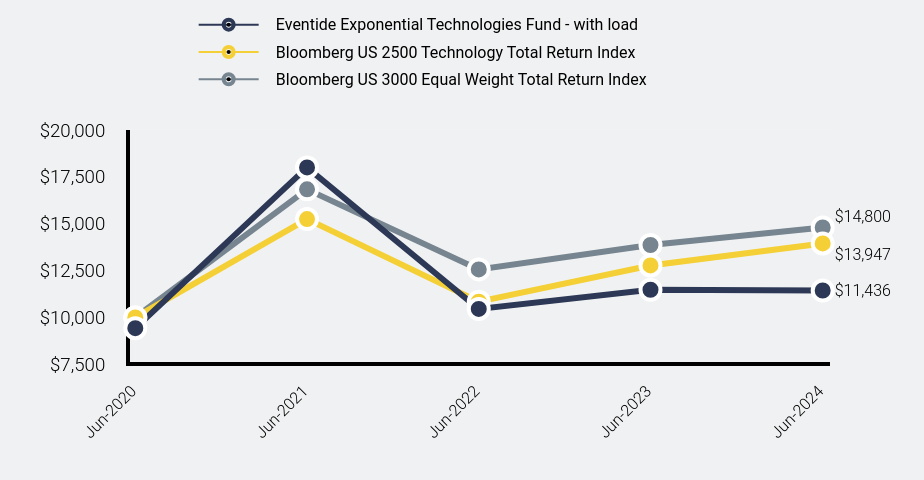
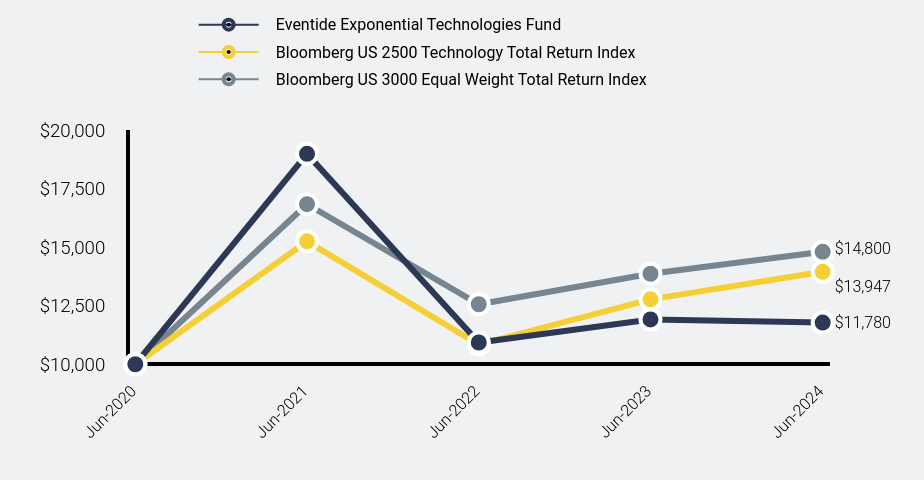
How has the Fund performed since inception?
Total Return Based on $10,000 Investment
| Eventide Exponential Technologies Fund - with load | Bloomberg US 2500 Technology Total Return Index | Bloomberg US 3000 Equal Weight Total Return Index |
|---|
| Jun-2020 | $9,425 | $10,000 | $10,000 |
| Jun-2021 | $18,002 | $15,247 | $16,831 |
| Jun-2022 | $10,451 | $10,839 | $12,562 |
| Jun-2023 | $11,474 | $12,771 | $13,864 |
| Jun-2024 | $11,436 | $13,947 | $14,800 |
The Fund's past performance is not a good predictor of how the Fund will perform in the future. The graph and table do not reflect the deduction of taxes that a shareholder would pay on fund distributions or redemption of fund shares. In connection with new SEC Rules on shareholder reporting, the Fund's performance information above is compared with a broad-based benchmark, Bloomberg US 3000 Equal Weight Total Return Index, which represents the overall domestic equity market. In addition, the strategy benchmark, Bloomberg US 2500 Technology Total Return Index, is included as the adviser believes it is more representative of the fund's investment universe.
How did the Fund perform during the reporting period?
The fiscal year began with the widest market dispersion between large and small companies in 20 years. This fissure provided opportunities to assert a contrarian position aligned with our vision for long-term success. At year’s end, the Fund – focusing on the long-term growth potential of small and mid-cap companies driven by innovative, high-performing cultures and strategic, high-integrity leadership – struggled against the overperforming large and mega-caps. We remain convinced the laggards harbor substantial potential, though they have in the short term negatively affected performance. Our fundamental analysis reveals companies we believe are unfairly overlooked, a dynamic that can present investment opportunities at attractive prices. We are confident in the Fund’s portfolio companies and look forward to the market realizing their potential.
Average Annual Total Returns
| 1 Year | Since Inception (June 30, 2020) |
|---|
| Eventide Exponential Technologies Fund - Class A |
| Without Load | | 4.95% |
| With Load | | 3.41% |
| Bloomberg US 2500 Technology Total Return Index | 9.21% | 8.67% |
| Bloomberg US 3000 Equal Weight Total Return Index | 6.75% | 10.30% |
| Net Assets | $115,486,506 |
| Number of Portfolio Holdings | 34 |
| Advisory Fee (net of waivers) | $1,245,618 |
| Portfolio Turnover | 70% |
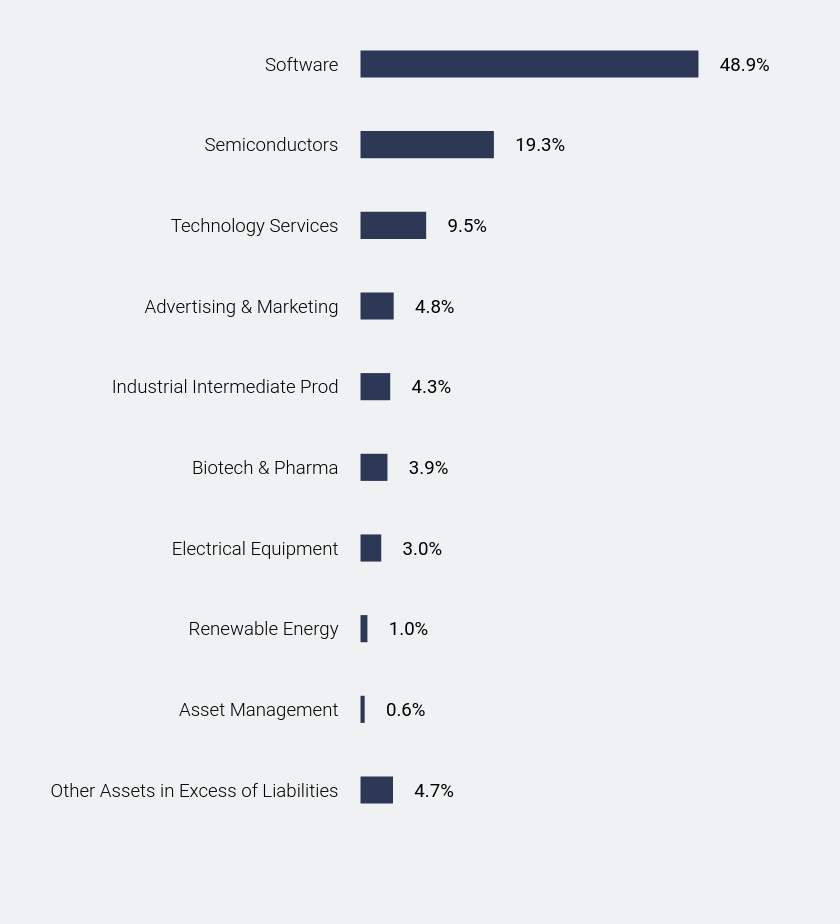
What did the Fund invest in?
Industry Weighting (% of net assets)
| Value | Value |
|---|
| Other Assets in Excess of Liabilities | 4.7% |
| Asset Management | 0.6% |
| Renewable Energy | 1.0% |
| Electrical Equipment | 3.0% |
| Biotech & Pharma | 3.9% |
| Industrial Intermediate Prod | 4.3% |
| Advertising & Marketing | 4.8% |
| Technology Services | 9.5% |
| Semiconductors | 19.3% |
| Software | 48.9% |
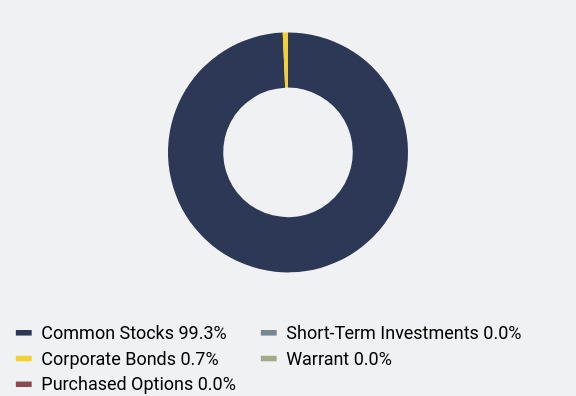
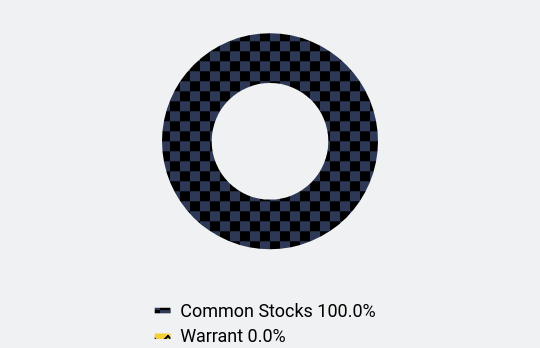
Asset Weighting (% of total investments)
| Value | Value |
|---|
| Common Stocks | 99.3% |
| Corporate Bonds | 0.7% |
| Purchased Options | 0.0% |
| Short-Term Investments | 0.0% |
| Warrant | 0.0% |
Top 10 Holdings* (% of net assets)
| Holding Name | % of Net Assets |
| Monday.com Ltd. | 5.6% |
| Datadog, Inc. - Class A | 5.4% |
| Monolithic Power Systems, Inc. | 5.3% |
| Synopsys, Inc. | 5.1% |
| Constellation Software, Inc. | 4.8% |
| Trade Desk, Inc. (The) - Class A | 4.8% |
| Lam Research Corporation | 4.7% |
| Xometry, Inc. | 4.3% |
| KLA Corporation | 4.0% |
| TransMedics Group, Inc. | 3.9% |
* Does not include cash/money market funds/equivalents. Based on percentage of net assets. Holdings can change at any time, are subject to risks discussed in the Fund’s prospectus, and should not be considered investment advice.
No material changes occurred during the year ended June 30, 2024.
Eventide Exponential Technologies Fund - Class A (ETAEX)
Annual Shareholder Report - June 30, 2024
Where can I find additional information about the Fund?
Additional information is available on the Fund's website ( https://www.eventidefunds.com ), including its:
Prospectus
Financial information
Holdings
Proxy voting information
Eventide Exponential Technologies Fund
Annual Shareholder Report - June 30, 2024
This annual shareholder report contains important information about Eventide Exponential Technologies Fund for the period of July 1, 2023 to June 30, 2024. You can find additional information about the Fund at https://www.eventidefunds.com. You can also request this information by contacting us at 1-877-771-3836.
What were the Fund’s costs for the last year?
(based on a hypothetical $10,000 investment)
| Class Name | Costs of a $10,000 investment | Costs paid as a percentage of a $10,000 investment |
|---|
| Class C | $243 | 2.43% |
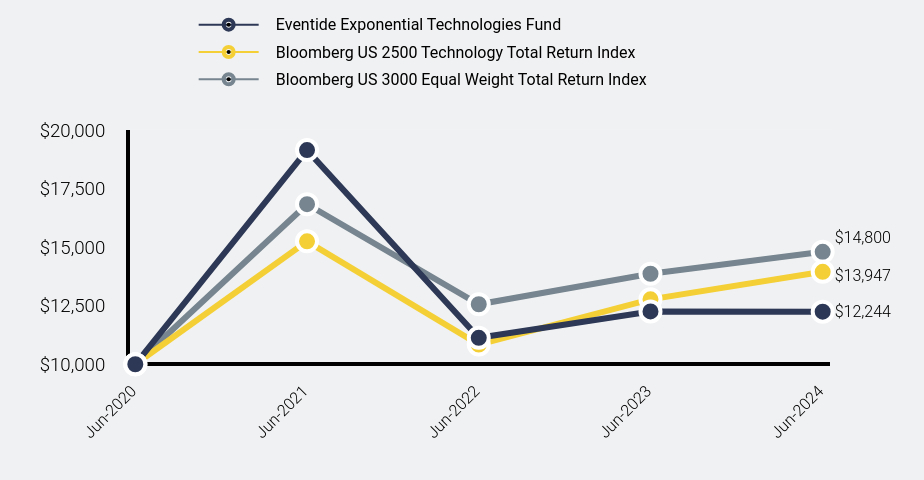
How has the Fund performed since inception?
Total Return Based on $10,000 Investment
| Eventide Exponential Technologies Fund | Bloomberg US 2500 Technology Total Return Index | Bloomberg US 3000 Equal Weight Total Return Index |
|---|
| Jun-2020 | $10,000 | $10,000 | $10,000 |
| Jun-2021 | $18,980 | $15,247 | $16,831 |
| Jun-2022 | $10,928 | $10,839 | $12,562 |
| Jun-2023 | $11,912 | $12,771 | $13,864 |
| Jun-2024 | $11,780 | $13,947 | $14,800 |
The Fund's past performance is not a good predictor of how the Fund will perform in the future. The graph and table do not reflect the deduction of taxes that a shareholder would pay on fund distributions or redemption of fund shares. In connection with new SEC Rules on shareholder reporting, the Fund's performance information above is compared with a broad-based benchmark, Bloomberg US 3000 Equal Weight Total Return Index, which represents the overall domestic equity market. In addition, the strategy benchmark, Bloomberg US 2500 Technology Total Return Index, is included as the adviser believes it is more representative of the fund's investment universe.
How did the Fund perform during the reporting period?
The fiscal year began with the widest market dispersion between large and small companies in 20 years. This fissure provided opportunities to assert a contrarian position aligned with our vision for long-term success. At year’s end, the Fund – focusing on the long-term growth potential of small and mid-cap companies driven by innovative, high-performing cultures and strategic, high-integrity leadership – struggled against the overperforming large and mega-caps. We remain convinced the laggards harbor substantial potential, though they have in the short term negatively affected performance. Our fundamental analysis reveals companies we believe are unfairly overlooked, a dynamic that can present investment opportunities at attractive prices. We are confident in the Fund’s portfolio companies and look forward to the market realizing their potential.
Average Annual Total Returns
| 1 Year | Since Inception (June 30, 2020) |
|---|
| Eventide Exponential Technologies Fund - Class C | | 4.18% |
| Bloomberg US 2500 Technology Total Return Index | 9.21% | 8.67% |
| Bloomberg US 3000 Equal Weight Total Return Index | 6.75% | 10.30% |
| Net Assets | $115,486,506 |
| Number of Portfolio Holdings | 34 |
| Advisory Fee (net of waivers) | $1,245,618 |
| Portfolio Turnover | 70% |
What did the Fund invest in?
Industry Weighting (% of net assets)
| Value | Value |
|---|
| Other Assets in Excess of Liabilities | 4.7% |
| Asset Management | 0.6% |
| Renewable Energy | 1.0% |
| Electrical Equipment | 3.0% |
| Biotech & Pharma | 3.9% |
| Industrial Intermediate Prod | 4.3% |
| Advertising & Marketing | 4.8% |
| Technology Services | 9.5% |
| Semiconductors | 19.3% |
| Software | 48.9% |
Asset Weighting (% of total investments)
| Value | Value |
|---|
| Common Stocks | 99.3% |
| Corporate Bonds | 0.7% |
| Purchased Options | 0.0% |
| Short-Term Investments | 0.0% |
| Warrant | 0.0% |
Top 10 Holdings* (% of net assets)
| Holding Name | % of Net Assets |
| Monday.com Ltd. | 5.6% |
| Datadog, Inc. - Class A | 5.4% |
| Monolithic Power Systems, Inc. | 5.3% |
| Synopsys, Inc. | 5.1% |
| Constellation Software, Inc. | 4.8% |
| Trade Desk, Inc. (The) - Class A | 4.8% |
| Lam Research Corporation | 4.7% |
| Xometry, Inc. | 4.3% |
| KLA Corporation | 4.0% |
| TransMedics Group, Inc. | 3.9% |
* Does not include cash/money market funds/equivalents. Based on percentage of net assets. Holdings can change at any time, are subject to risks discussed in the Fund’s prospectus, and should not be considered investment advice.
No material changes occurred during the year ended June 30, 2024.
Eventide Exponential Technologies Fund - Class C (ETCEX)
Annual Shareholder Report - June 30, 2024
Where can I find additional information about the Fund?
Additional information is available on the Fund's website ( https://www.eventidefunds.com ), including its:
Prospectus
Financial information
Holdings
Proxy voting information
Eventide Exponential Technologies Fund
Annual Shareholder Report - June 30, 2024
This annual shareholder report contains important information about Eventide Exponential Technologies Fund for the period of July 1, 2023 to June 30, 2024. You can find additional information about the Fund at https://www.eventidefunds.com. You can also request this information by contacting us at 1-877-771-3836.
What were the Fund’s costs for the last year?
(based on a hypothetical $10,000 investment)
| Class Name | Costs of a $10,000 investment | Costs paid as a percentage of a $10,000 investment |
|---|
| Class I | $143 | 1.43% |
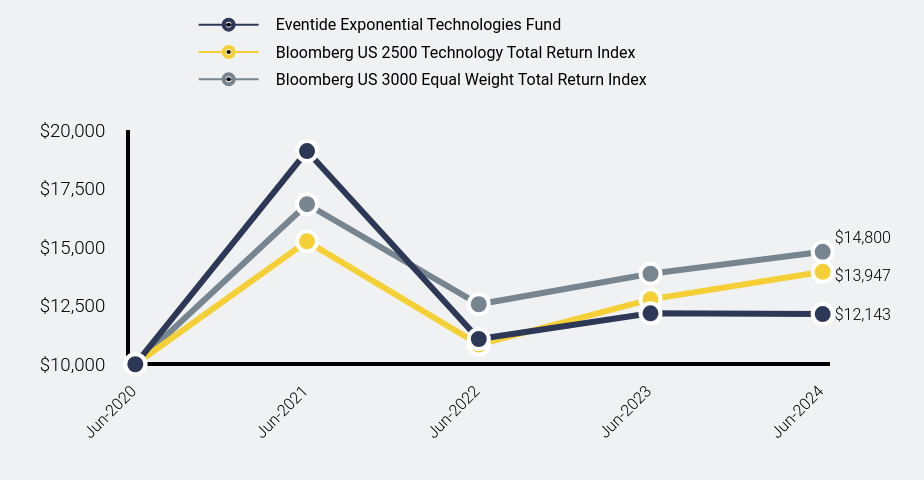
How has the Fund performed since inception?
Total Return Based on $10,000 Investment
| Eventide Exponential Technologies Fund | Bloomberg US 2500 Technology Total Return Index | Bloomberg US 3000 Equal Weight Total Return Index |
|---|
| Jun-2020 | $10,000 | $10,000 | $10,000 |
| Jun-2021 | $19,140 | $15,247 | $16,831 |
| Jun-2022 | $11,128 | $10,839 | $12,562 |
| Jun-2023 | $12,254 | $12,771 | $13,864 |
| Jun-2024 | $12,244 | $13,947 | $14,800 |
The Fund's past performance is not a good predictor of how the Fund will perform in the future. The graph and table do not reflect the deduction of taxes that a shareholder would pay on fund distributions or redemption of fund shares. In connection with new SEC Rules on shareholder reporting, the Fund's performance information above is compared with a broad-based benchmark, Bloomberg US 3000 Equal Weight Total Return Index, which represents the overall domestic equity market. In addition, the strategy benchmark, Bloomberg US 2500 Technology Total Return Index, is included as the adviser believes it is more representative of the fund's investment universe.
How did the Fund perform during the reporting period?
The fiscal year began with the widest market dispersion between large and small companies in 20 years. This fissure provided opportunities to assert a contrarian position aligned with our vision for long-term success. At year’s end, the Fund – focusing on the long-term growth potential of small and mid-cap companies driven by innovative, high-performing cultures and strategic, high-integrity leadership – struggled against the overperforming large and mega-caps. We remain convinced the laggards harbor substantial potential, though they have in the short term negatively affected performance. Our fundamental analysis reveals companies we believe are unfairly overlooked, a dynamic that can present investment opportunities at attractive prices. We are confident in the Fund’s portfolio companies and look forward to the market realizing their potential.
Average Annual Total Returns
| 1 Year | Since Inception (June 30, 2020) |
|---|
| Eventide Exponential Technologies Fund - Class I | | 5.19% |
| Bloomberg US 2500 Technology Total Return Index | 9.21% | 8.67% |
| Bloomberg US 3000 Equal Weight Total Return Index | 6.75% | 10.30% |
| Net Assets | $115,486,506 |
| Number of Portfolio Holdings | 34 |
| Advisory Fee (net of waivers) | $1,245,618 |
| Portfolio Turnover | 70% |
What did the Fund invest in?
Industry Weighting (% of net assets)
| Value | Value |
|---|
| Other Assets in Excess of Liabilities | 4.7% |
| Asset Management | 0.6% |
| Renewable Energy | 1.0% |
| Electrical Equipment | 3.0% |
| Biotech & Pharma | 3.9% |
| Industrial Intermediate Prod | 4.3% |
| Advertising & Marketing | 4.8% |
| Technology Services | 9.5% |
| Semiconductors | 19.3% |
| Software | 48.9% |
Asset Weighting (% of total investments)
| Value | Value |
|---|
| Common Stocks | 99.3% |
| Corporate Bonds | 0.7% |
| Purchased Options | 0.0% |
| Short-Term Investments | 0.0% |
| Warrant | 0.0% |
Top 10 Holdings* (% of net assets)
| Holding Name | % of Net Assets |
| Monday.com Ltd. | 5.6% |
| Datadog, Inc. - Class A | 5.4% |
| Monolithic Power Systems, Inc. | 5.3% |
| Synopsys, Inc. | 5.1% |
| Constellation Software, Inc. | 4.8% |
| Trade Desk, Inc. (The) - Class A | 4.8% |
| Lam Research Corporation | 4.7% |
| Xometry, Inc. | 4.3% |
| KLA Corporation | 4.0% |
| TransMedics Group, Inc. | 3.9% |
* Does not include cash/money market funds/equivalents. Based on percentage of net assets. Holdings can change at any time, are subject to risks discussed in the Fund’s prospectus, and should not be considered investment advice.
No material changes occurred during the year ended June 30, 2024.
Eventide Exponential Technologies Fund - Class I (ETIEX)
Annual Shareholder Report - June 30, 2024
Where can I find additional information about the Fund?
Additional information is available on the Fund's website ( https://www.eventidefunds.com ), including its:
Prospectus
Financial information
Holdings
Proxy voting information
Eventide Exponential Technologies Fund
Annual Shareholder Report - June 30, 2024
This annual shareholder report contains important information about Eventide Exponential Technologies Fund for the period of July 1, 2023 to June 30, 2024. You can find additional information about the Fund at https://www.eventidefunds.com. You can also request this information by contacting us at 1-877-771-3836.
What were the Fund’s costs for the last year?
(based on a hypothetical $10,000 investment)
| Class Name | Costs of a $10,000 investment | Costs paid as a percentage of a $10,000 investment |
|---|
| Class N | $163 | 1.63% |
How has the Fund performed since inception?
Total Return Based on $10,000 Investment
| Eventide Exponential Technologies Fund | Bloomberg US 2500 Technology Total Return Index | Bloomberg US 3000 Equal Weight Total Return Index |
|---|
| Jun-2020 | $10,000 | $10,000 | $10,000 |
| Jun-2021 | $19,100 | $15,247 | $16,831 |
| Jun-2022 | $11,078 | $10,839 | $12,562 |
| Jun-2023 | $12,174 | $12,771 | $13,864 |
| Jun-2024 | $12,143 | $13,947 | $14,800 |
The Fund's past performance is not a good predictor of how the Fund will perform in the future. The graph and table do not reflect the deduction of taxes that a shareholder would pay on fund distributions or redemption of fund shares. In connection with new SEC Rules on shareholder reporting, the Fund's performance information above is compared with a broad-based benchmark, Bloomberg US 3000 Equal Weight Total Return Index, which represents the overall domestic equity market. In addition, the strategy benchmark, Bloomberg US 2500 Technology Total Return Index, is included as the adviser believes it is more representative of the fund's investment universe.
How did the Fund perform during the reporting period?
The fiscal year began with the widest market dispersion between large and small companies in 20 years. This fissure provided opportunities to assert a contrarian position aligned with our vision for long-term success. At year’s end, the Fund – focusing on the long-term growth potential of small and mid-cap companies driven by innovative, high-performing cultures and strategic, high-integrity leadership – struggled against the overperforming large and mega-caps. We remain convinced the laggards harbor substantial potential, though they have in the short term negatively affected performance. Our fundamental analysis reveals companies we believe are unfairly overlooked, a dynamic that can present investment opportunities at attractive prices. We are confident in the Fund’s portfolio companies and look forward to the market realizing their potential.
Average Annual Total Returns
| 1 Year | Since Inception (June 30, 2020) |
|---|
| Eventide Exponential Technologies Fund - Class N | | 4.97% |
| Bloomberg US 2500 Technology Total Return Index | 9.21% | 8.67% |
| Bloomberg US 3000 Equal Weight Total Return Index | 6.75% | 10.30% |
| Net Assets | $115,486,506 |
| Number of Portfolio Holdings | 34 |
| Advisory Fee (net of waivers) | $1,245,618 |
| Portfolio Turnover | 70% |
What did the Fund invest in?
Industry Weighting (% of net assets)
| Value | Value |
|---|
| Other Assets in Excess of Liabilities | 4.7% |
| Asset Management | 0.6% |
| Renewable Energy | 1.0% |
| Electrical Equipment | 3.0% |
| Biotech & Pharma | 3.9% |
| Industrial Intermediate Prod | 4.3% |
| Advertising & Marketing | 4.8% |
| Technology Services | 9.5% |
| Semiconductors | 19.3% |
| Software | 48.9% |
Asset Weighting (% of total investments)
| Value | Value |
|---|
| Common Stocks | 99.3% |
| Corporate Bonds | 0.7% |
| Purchased Options | 0.0% |
| Short-Term Investments | 0.0% |
| Warrant | 0.0% |
Top 10 Holdings* (% of net assets)
| Holding Name | % of Net Assets |
| Monday.com Ltd. | 5.6% |
| Datadog, Inc. - Class A | 5.4% |
| Monolithic Power Systems, Inc. | 5.3% |
| Synopsys, Inc. | 5.1% |
| Constellation Software, Inc. | 4.8% |
| Trade Desk, Inc. (The) - Class A | 4.8% |
| Lam Research Corporation | 4.7% |
| Xometry, Inc. | 4.3% |
| KLA Corporation | 4.0% |
| TransMedics Group, Inc. | 3.9% |
* Does not include cash/money market funds/equivalents. Based on percentage of net assets. Holdings can change at any time, are subject to risks discussed in the Fund’s prospectus, and should not be considered investment advice.
No material changes occurred during the year ended June 30, 2024.
Eventide Exponential Technologies Fund - Class N (ETNEX)
Annual Shareholder Report - June 30, 2024
Where can I find additional information about the Fund?
Additional information is available on the Fund's website ( https://www.eventidefunds.com ), including its:
Prospectus
Financial information
Holdings
Proxy voting information
Annual Shareholder Report - June 30, 2024
This annual shareholder report contains important information about Eventide Gilead Fund for the period of July 1, 2023 to June 30, 2024. You can find additional information about the Fund at https://www.eventidefunds.com. You can also request this information by contacting us at 1-877-771-3836.
What were the Fund’s costs for the last year?
(based on a hypothetical $10,000 investment)
| Class Name | Costs of a $10,000 investment | Costs paid as a percentage of a $10,000 investment |
|---|
| Class A | $141 | 1.41% |
How did the Fund perform during the reporting period?
The year began with attractive valuations for smid-cap equities. Our positioning in October 2023 led to outperformance relative to the smid-cap category. However, “higher for longer” interest rate fears gripped the market, and the Fund underperformed in the second half of the fiscal year. Cybersecurity and supply chain resiliency provided positive attribution; but renewable energy, digital payments, and consumer health (more sensitive to high rates) hurt the Fund. The Fund remains focused on long-term opportunities, including recently out-of-favor companies. We expect the Fund to do well in a strong economy with stable or declining interest rates. The strategy may underperform if rates rise or the economy recedes. We believe high-quality companies that create value and trade at a discount to intrinsic value offer superior long-term risk-adjusted returns.
How has the Fund performed over the last ten years?
Total Return Based on $10,000 Investment
| Eventide Gilead Fund - with load | Bloomberg US Mid Cap Growth Total Return Index | Bloomberg US 3000 Equal Weight Total Return Index |
|---|
| Jun-2014 | $9,424 | $10,000 | $10,000 |
| Jun-2015 | $11,134 | $10,917 | $10,485 |
| Jun-2016 | $9,015 | $10,827 | $9,804 |
| Jun-2017 | $11,555 | $12,453 | $12,228 |
| Jun-2018 | $14,559 | $14,410 | $14,371 |
| Jun-2019 | $16,941 | $16,210 | $13,813 |
| Jun-2020 | $19,750 | $17,717 | $13,107 |
| Jun-2021 | $29,504 | $25,573 | $22,060 |
| Jun-2022 | $19,864 | $19,875 | $16,465 |
| Jun-2023 | $22,989 | $23,351 | $18,171 |
| Jun-2024 | $22,836 | $26,123 | $19,398 |
The Fund's past performance is not a good predictor of how the Fund will perform in the future. The graph and table do not reflect the deduction of taxes that a shareholder would pay on fund distributions or redemption of fund shares. In connection with new SEC Rules on shareholder reporting, the Fund's performance information above is compared with a broad-based benchmark, Bloomberg US 3000 Equal Weight Total Return Index, which represents the overall domestic equity market. In addition, the strategy benchmark, Bloomberg US Mid Cap Growth Total Return Index, is included as the adviser believes it is more representative of the fund's investment universe.
Average Annual Total Returns
| 1 Year | 5 Years | 10 Years |
|---|
| Eventide Gilead Fund - Class A |
| Without Load | | 6.15% | 9.25% |
| With Load | | 4.90% | 8.61% |
| Bloomberg US Mid Cap Growth Total Return Index | 11.87% | 10.01% | 10.08% |
| Bloomberg US 3000 Equal Weight Total Return Index | 6.75% | 7.03% | 6.85% |
| Net Assets | $3,349,337,130 |
| Number of Portfolio Holdings | 76 |
| Advisory Fee | $35,349,592 |
| Portfolio Turnover | 36% |
What did the Fund invest in?
Industry Weighting (% of net assets)
| Value | Value |
|---|
| Other Assets in Excess of Liabilities | 0.1% |
| Other Industries | 5.6% |
| Specialty Finance | 1.4% |
| Automotive | 1.4% |
| Industrial Intermediate Prod | 1.9% |
| Home Construction | 2.6% |
| Technology Services | 3.1% |
| Wholesale - Discretionary | 3.3% |
| Transportation & Logistics | 3.6% |
| Advertising & Marketing | 3.6% |
| Retail - Discretionary | 3.9% |
| Commercial Support Services | 6.2% |
| Electrical Equipment | 7.6% |
| Medical Equipment & Devices | 7.3% |
| Semiconductors | 9.0% |
| Biotech & Pharma | 15.7% |
| Software | 23.7% |
Asset Weighting (% of total investments)
| Value | Value |
|---|
| Common Stocks | 97.1% |
| Corporate Bonds | 1.3% |
| Private Investments | 1.3% |
| Short-Term Investments | 0.2% |
| Warrant | 0.1% |
Top 10 Holdings* (% of net assets)
| Holding Name | % of Net Assets |
| Trane Technologies PLC | 6.0% |
| Waste Connections, Inc. | 4.2% |
| TransMedics Group, Inc. | 4.0% |
| Datadog, Inc. - Class A | 3.7% |
| Trade Desk, Inc. (The) - Class A | 3.6% |
| Old Dominion Freight Line, Inc. | 3.3% |
| Crowdstrike Holdings, Inc. - Class A | 2.8% |
| IDEXX Laboratories, Inc. | 2.7% |
| Roper Technologies, Inc. | 2.7% |
| Mettler-Toledo International, Inc. | 2.6% |
* Does not include cash/money market funds/equivalents. Based on percentage of net assets. Holdings can change at any time, are subject to risks discussed in the Fund’s prospectus, and should not be considered investment advice.
No material changes occurred during the year ended June 30, 2024.
Eventide Gilead Fund - Class A (ETAGX )
Annual Shareholder Report - June 30, 2024
Where can I find additional information about the Fund?
Additional information is available on the Fund's website ( https://www.eventidefunds.com ), including its:
Prospectus
Financial information
Holdings
Proxy voting information
Annual Shareholder Report - June 30, 2024
This annual shareholder report contains important information about Eventide Gilead Fund for the period of July 1, 2023 to June 30, 2024. You can find additional information about the Fund at https://www.eventidefunds.com. You can also request this information by contacting us at 1-877-771-3836.
What were the Fund’s costs for the last year?
(based on a hypothetical $10,000 investment)
| Class Name | Costs of a $10,000 investment | Costs paid as a percentage of a $10,000 investment |
|---|
| Class C | $216 | 2.16% |
How did the Fund perform during the reporting period?
The year began with attractive valuations for smid-cap equities. Our positioning in October 2023 led to outperformance relative to the smid-cap category. However, “higher for longer” interest rate fears gripped the market, and the Fund underperformed in the second half of the fiscal year. Cybersecurity and supply chain resiliency provided positive attribution; but renewable energy, digital payments, and consumer health (more sensitive to high rates) hurt the Fund. The Fund remains focused on long-term opportunities, including recently out-of-favor companies. We expect the Fund to do well in a strong economy with stable or declining interest rates. The strategy may underperform if rates rise or the economy recedes. We believe high-quality companies that create value and trade at a discount to intrinsic value offer superior long-term risk-adjusted returns.
How has the Fund performed over the last ten years?
Total Return Based on $10,000 Investment
| Eventide Gilead Fund | Bloomberg US Mid Cap Growth Total Return Index | Bloomberg US 3000 Equal Weight Total Return Index |
|---|
| Jun-2014 | $10,000 | $10,000 | $10,000 |
| Jun-2015 | $11,725 | $10,917 | $10,485 |
| Jun-2016 | $9,423 | $10,827 | $9,804 |
| Jun-2017 | $11,990 | $12,453 | $12,228 |
| Jun-2018 | $14,992 | $14,410 | $14,371 |
| Jun-2019 | $17,317 | $16,210 | $13,813 |
| Jun-2020 | $20,037 | $17,717 | $13,107 |
| Jun-2021 | $29,699 | $25,573 | $22,060 |
| Jun-2022 | $19,837 | $19,875 | $16,465 |
| Jun-2023 | $22,787 | $23,351 | $18,171 |
| Jun-2024 | $22,470 | $26,123 | $19,398 |
The Fund's past performance is not a good predictor of how the Fund will perform in the future. The graph and table do not reflect the deduction of taxes that a shareholder would pay on fund distributions or redemption of fund shares. In connection with new SEC Rules on shareholder reporting, the Fund's performance information above is compared with a broad-based benchmark, Bloomberg US 3000 Equal Weight Total Return Index, which represents the overall domestic equity market. In addition, the strategy benchmark, Bloomberg US Mid Cap Growth Total Return Index, is included as the adviser believes it is more representative of the fund's investment universe.
Average Annual Total Returns
| 1 Year | 5 Years | 10 Years |
|---|
| Eventide Gilead Fund - Class C | | 5.35% | 8.43% |
| Bloomberg US Mid Cap Growth Total Return Index | 11.87% | 10.01% | 10.08% |
| Bloomberg US 3000 Equal Weight Total Return Index | 6.75% | 7.03% | 6.85% |
| Net Assets | $3,349,337,130 |
| Number of Portfolio Holdings | 76 |
| Advisory Fee | $35,349,592 |
| Portfolio Turnover | 36% |
What did the Fund invest in?
Industry Weighting (% of net assets)
| Value | Value |
|---|
| Other Assets in Excess of Liabilities | 0.1% |
| Other Industries | 5.6% |
| Specialty Finance | 1.4% |
| Automotive | 1.4% |
| Industrial Intermediate Prod | 1.9% |
| Home Construction | 2.6% |
| Technology Services | 3.1% |
| Wholesale - Discretionary | 3.3% |
| Transportation & Logistics | 3.6% |
| Advertising & Marketing | 3.6% |
| Retail - Discretionary | 3.9% |
| Commercial Support Services | 6.2% |
| Electrical Equipment | 7.6% |
| Medical Equipment & Devices | 7.3% |
| Semiconductors | 9.0% |
| Biotech & Pharma | 15.7% |
| Software | 23.7% |
Asset Weighting (% of total investments)
| Value | Value |
|---|
| Common Stocks | 97.1% |
| Corporate Bonds | 1.3% |
| Private Investments | 1.3% |
| Short-Term Investments | 0.2% |
| Warrant | 0.1% |
Top 10 Holdings* (% of net assets)
| Holding Name | % of Net Assets |
| Trane Technologies PLC | 6.0% |
| Waste Connections, Inc. | 4.2% |
| TransMedics Group, Inc. | 4.0% |
| Datadog, Inc. - Class A | 3.7% |
| Trade Desk, Inc. (The) - Class A | 3.6% |
| Old Dominion Freight Line, Inc. | 3.3% |
| Crowdstrike Holdings, Inc. - Class A | 2.8% |
| IDEXX Laboratories, Inc. | 2.7% |
| Roper Technologies, Inc. | 2.7% |
| Mettler-Toledo International, Inc. | 2.6% |
* Does not include cash/money market funds/equivalents. Based on percentage of net assets. Holdings can change at any time, are subject to risks discussed in the Fund’s prospectus, and should not be considered investment advice.
No material changes occurred during the year ended June 30, 2024.
Eventide Gilead Fund - Class C (ETCGX )
Annual Shareholder Report - June 30, 2024
Where can I find additional information about the Fund?
Additional information is available on the Fund's website ( https://www.eventidefunds.com ), including its:
Prospectus
Financial information
Holdings
Proxy voting information
Annual Shareholder Report - June 30, 2024
This annual shareholder report contains important information about Eventide Gilead Fund for the period of July 1, 2023 to June 30, 2024. You can find additional information about the Fund at https://www.eventidefunds.com. You can also request this information by contacting us at 1-877-771-3836.
What were the Fund’s costs for the last year?
(based on a hypothetical $10,000 investment)
| Class Name | Costs of a $10,000 investment | Costs paid as a percentage of a $10,000 investment |
|---|
| Class I | $116 | 1.16% |
How did the Fund perform during the reporting period?
The year began with attractive valuations for smid-cap equities. Our positioning in October 2023 led to outperformance relative to the smid-cap category. However, “higher for longer” interest rate fears gripped the market, and the Fund underperformed in the second half of the fiscal year. Cybersecurity and supply chain resiliency provided positive attribution; but renewable energy, digital payments, and consumer health (more sensitive to high rates) hurt the Fund. The Fund remains focused on long-term opportunities, including recently out-of-favor companies. We expect the Fund to do well in a strong economy with stable or declining interest rates. The strategy may underperform if rates rise or the economy recedes. We believe high-quality companies that create value and trade at a discount to intrinsic value offer superior long-term risk-adjusted returns.
How has the Fund performed over the last ten years?
Total Return Based on $10,000 Investment
| Eventide Gilead Fund | Bloomberg US Mid Cap Growth Total Return Index | Bloomberg US 3000 Equal Weight Total Return Index |
|---|
| Jun-2014 | $10,000 | $10,000 | $10,000 |
| Jun-2015 | $11,845 | $10,917 | $10,485 |
| Jun-2016 | $9,615 | $10,827 | $9,804 |
| Jun-2017 | $12,356 | $12,453 | $12,228 |
| Jun-2018 | $15,609 | $14,410 | $14,371 |
| Jun-2019 | $18,209 | $16,210 | $13,813 |
| Jun-2020 | $21,277 | $17,717 | $13,107 |
| Jun-2021 | $31,864 | $25,573 | $22,060 |
| Jun-2022 | $21,500 | $19,875 | $16,465 |
| Jun-2023 | $24,940 | $23,351 | $18,171 |
| Jun-2024 | $24,841 | $26,123 | $19,398 |
The Fund's past performance is not a good predictor of how the Fund will perform in the future. The graph and table do not reflect the deduction of taxes that a shareholder would pay on fund distributions or redemption of fund shares. In connection with new SEC Rules on shareholder reporting, the Fund's performance information above is compared with a broad-based benchmark, Bloomberg US 3000 Equal Weight Total Return Index, which represents the overall domestic equity market. In addition, the strategy benchmark, Bloomberg US Mid Cap Growth Total Return Index, is included as the adviser believes it is more representative of the fund's investment universe.
Average Annual Total Returns
| 1 Year | 5 Years | 10 Years |
|---|
| Eventide Gilead Fund - Class I | | 6.41% | 9.53% |
| Bloomberg US Mid Cap Growth Total Return Index | 11.87% | 10.01% | 10.08% |
| Bloomberg US 3000 Equal Weight Total Return Index | 6.75% | 7.03% | 6.85% |
| Net Assets | $3,349,337,130 |
| Number of Portfolio Holdings | 76 |
| Advisory Fee | $35,349,592 |
| Portfolio Turnover | 36% |
What did the Fund invest in?
Industry Weighting (% of net assets)
| Value | Value |
|---|
| Other Assets in Excess of Liabilities | 0.1% |
| Other Industries | 5.6% |
| Specialty Finance | 1.4% |
| Automotive | 1.4% |
| Industrial Intermediate Prod | 1.9% |
| Home Construction | 2.6% |
| Technology Services | 3.1% |
| Wholesale - Discretionary | 3.3% |
| Transportation & Logistics | 3.6% |
| Advertising & Marketing | 3.6% |
| Retail - Discretionary | 3.9% |
| Commercial Support Services | 6.2% |
| Electrical Equipment | 7.6% |
| Medical Equipment & Devices | 7.3% |
| Semiconductors | 9.0% |
| Biotech & Pharma | 15.7% |
| Software | 23.7% |
Asset Weighting (% of total investments)
| Value | Value |
|---|
| Common Stocks | 97.1% |
| Corporate Bonds | 1.3% |
| Private Investments | 1.3% |
| Short-Term Investments | 0.2% |
| Warrant | 0.1% |
Top 10 Holdings* (% of net assets)
| Holding Name | % of Net Assets |
| Trane Technologies PLC | 6.0% |
| Waste Connections, Inc. | 4.2% |
| TransMedics Group, Inc. | 4.0% |
| Datadog, Inc. - Class A | 3.7% |
| Trade Desk, Inc. (The) - Class A | 3.6% |
| Old Dominion Freight Line, Inc. | 3.3% |
| Crowdstrike Holdings, Inc. - Class A | 2.8% |
| IDEXX Laboratories, Inc. | 2.7% |
| Roper Technologies, Inc. | 2.7% |
| Mettler-Toledo International, Inc. | 2.6% |
* Does not include cash/money market funds/equivalents. Based on percentage of net assets. Holdings can change at any time, are subject to risks discussed in the Fund’s prospectus, and should not be considered investment advice.
No material changes occurred during the year ended June 30, 2024.
Eventide Gilead Fund - Class I (ETILX )
Annual Shareholder Report - June 30, 2024
Where can I find additional information about the Fund?
Additional information is available on the Fund's website ( https://www.eventidefunds.com ), including its:
Prospectus
Financial information
Holdings
Proxy voting information
Annual Shareholder Report - June 30, 2024
This annual shareholder report contains important information about Eventide Gilead Fund for the period of July 1, 2023 to June 30, 2024. You can find additional information about the Fund at https://www.eventidefunds.com. You can also request this information by contacting us at 1-877-771-3836.
What were the Fund’s costs for the last year?
(based on a hypothetical $10,000 investment)
| Class Name | Costs of a $10,000 investment | Costs paid as a percentage of a $10,000 investment |
|---|
| Class N | $136 | 1.36% |
How did the Fund perform during the reporting period?
The year began with attractive valuations for smid-cap equities. Our positioning in October 2023 led to outperformance relative to the smid-cap category. However, “higher for longer” interest rate fears gripped the market, and the Fund underperformed in the second half of the fiscal year. Cybersecurity and supply chain resiliency provided positive attribution; but renewable energy, digital payments, and consumer health (more sensitive to high rates) hurt the Fund. The Fund remains focused on long-term opportunities, including recently out-of-favor companies. We expect the Fund to do well in a strong economy with stable or declining interest rates. The strategy may underperform if rates rise or the economy recedes. We believe high-quality companies that create value and trade at a discount to intrinsic value offer superior long-term risk-adjusted returns.
How has the Fund performed over the last ten years?
Total Return Based on $10,000 Investment
| Eventide Gilead Fund | Bloomberg US Mid Cap Growth Total Return Index | Bloomberg US 3000 Equal Weight Total Return Index |
|---|
| Jun-2014 | $10,000 | $10,000 | $10,000 |
| Jun-2015 | $11,820 | $10,917 | $10,485 |
| Jun-2016 | $9,576 | $10,827 | $9,804 |
| Jun-2017 | $12,283 | $12,453 | $12,228 |
| Jun-2018 | $15,481 | $14,410 | $14,371 |
| Jun-2019 | $18,021 | $16,210 | $13,813 |
| Jun-2020 | $21,023 | $17,717 | $13,107 |
| Jun-2021 | $31,415 | $25,573 | $22,060 |
| Jun-2022 | $21,158 | $19,875 | $16,465 |
| Jun-2023 | $24,494 | $23,351 | $18,171 |
| Jun-2024 | $24,343 | $26,123 | $19,398 |
The Fund's past performance is not a good predictor of how the Fund will perform in the future. The graph and table do not reflect the deduction of taxes that a shareholder would pay on fund distributions or redemption of fund shares. In connection with new SEC Rules on shareholder reporting, the Fund's performance information above is compared with a broad-based benchmark, Bloomberg US 3000 Equal Weight Total Return Index, which represents the overall domestic equity market. In addition, the strategy benchmark, Bloomberg US Mid Cap Growth Total Return Index, is included as the adviser believes it is more representative of the fund's investment universe.
Average Annual Total Returns
| 1 Year | 5 Years | 10 Years |
|---|
| Eventide Gilead Fund - Class N | | 6.20% | 9.30% |
| Bloomberg US Mid Cap Growth Total Return Index | 11.87% | 10.01% | 10.08% |
| Bloomberg US 3000 Equal Weight Total Return Index | 6.75% | 7.03% | 6.85% |
| Net Assets | $3,349,337,130 |
| Number of Portfolio Holdings | 76 |
| Advisory Fee | $35,349,592 |
| Portfolio Turnover | 36% |
What did the Fund invest in?
Industry Weighting (% of net assets)
| Value | Value |
|---|
| Other Assets in Excess of Liabilities | 0.1% |
| Other Industries | 5.6% |
| Specialty Finance | 1.4% |
| Automotive | 1.4% |
| Industrial Intermediate Prod | 1.9% |
| Home Construction | 2.6% |
| Technology Services | 3.1% |
| Wholesale - Discretionary | 3.3% |
| Transportation & Logistics | 3.6% |
| Advertising & Marketing | 3.6% |
| Retail - Discretionary | 3.9% |
| Commercial Support Services | 6.2% |
| Electrical Equipment | 7.6% |
| Medical Equipment & Devices | 7.3% |
| Semiconductors | 9.0% |
| Biotech & Pharma | 15.7% |
| Software | 23.7% |
Asset Weighting (% of total investments)
| Value | Value |
|---|
| Common Stocks | 97.1% |
| Corporate Bonds | 1.3% |
| Private Investments | 1.3% |
| Short-Term Investments | 0.2% |
| Warrant | 0.1% |
Top 10 Holdings* (% of net assets)
| Holding Name | % of Net Assets |
| Trane Technologies PLC | 6.0% |
| Waste Connections, Inc. | 4.2% |
| TransMedics Group, Inc. | 4.0% |
| Datadog, Inc. - Class A | 3.7% |
| Trade Desk, Inc. (The) - Class A | 3.6% |
| Old Dominion Freight Line, Inc. | 3.3% |
| Crowdstrike Holdings, Inc. - Class A | 2.8% |
| IDEXX Laboratories, Inc. | 2.7% |
| Roper Technologies, Inc. | 2.7% |
| Mettler-Toledo International, Inc. | 2.6% |
* Does not include cash/money market funds/equivalents. Based on percentage of net assets. Holdings can change at any time, are subject to risks discussed in the Fund’s prospectus, and should not be considered investment advice.
No material changes occurred during the year ended June 30, 2024.
Eventide Gilead Fund - Class N (ETGLX )
Annual Shareholder Report - June 30, 2024
Where can I find additional information about the Fund?
Additional information is available on the Fund's website ( https://www.eventidefunds.com ), including its:
Prospectus
Financial information
Holdings
Proxy voting information
Eventide Healthcare & Life Sciences Fund
Annual Shareholder Report - June 30, 2024
This annual shareholder report contains important information about Eventide Healthcare & Life Sciences Fund for the period of July 1, 2023 to June 30, 2024. You can find additional information about the Fund at https://www.eventidefunds.com. You can also request this information by contacting us at 1-877-771-3836. This report describes changes to the Fund that occurred during the reporting period.
What were the Fund’s costs for the last year?
(based on a hypothetical $10,000 investment)
| Class Name | Costs of a $10,000 investment | Costs paid as a percentage of a $10,000 investment |
|---|
| Class A | $157 | 1.57% |
How has the Fund performed over the last ten years?
Total Return Based on $10,000 Investment
| Eventide Healthcare & Life Sciences Fund - with load | S&P Biotechnology Select Industry Total Return Index | Bloomberg US 3000 Equal Weight Total Return Index |
|---|
| Jun-2014 | $9,424 | $10,000 | $10,000 |
| Jun-2015 | $14,050 | $16,403 | $10,485 |
| Jun-2016 | $10,167 | $10,569 | $9,804 |
| Jun-2017 | $12,718 | $15,113 | $12,228 |
| Jun-2018 | $18,928 | $18,682 | $14,371 |
| Jun-2019 | $20,939 | $17,249 | $13,813 |
| Jun-2020 | $26,104 | $22,027 | $13,107 |
| Jun-2021 | $28,786 | $26,695 | $22,060 |
| Jun-2022 | $18,460 | $14,645 | $16,465 |
| Jun-2023 | $25,607 | $16,421 | $18,171 |
| Jun-2024 | $23,103 | $18,381 | $19,398 |
The Fund's past performance is not a good predictor of how the Fund will perform in the future. The graph and table do not reflect the deduction of taxes that a shareholder would pay on fund distributions or redemption of fund shares. In connection with new SEC Rules on shareholder reporting, the Fund's performance information above is compared with a broad-based benchmark, Bloomberg US 3000 Equal Weight Total Return Index, which represents the overall domestic equity market. In addition, the strategy benchmark, S&P Biotechnology Select Industry Total Return Index, is included as the adviser believes it is more representative of the fund's investment universe.
How did the Fund perform during the reporting period?
As the fiscal year began, the market faced the implications of “higher for longer” interest rates. With hopes for rate cuts diminishing, Biotechnology underperformed, though the disruption did offer investors attractive entry points. We are confident in the Fund’s investment process and the Healthcare sector’s remarkable innovation in diabetes, Alzheimer’s, cancer, and other conditions of unmet need. Given the scarcity of capital, the Fund has been overweight those in later development stages, especially in oncology and immunology. We believe the Fund is strategically aligned to leverage the Biotech’s anticipated growth. Despite recent underperformance relative to the Fund’s benchmark, we believe our focus on companies with high likelihood of clinical and commercial success positions the Fund well for long-term value creation.
Average Annual Total Returns
| 1 Year | 5 Years | 10 Years |
|---|
| Eventide Healthcare & Life Sciences Fund - Class A |
| Without Load | | 1.99% | 9.38% |
| With Load | | 0.78% | 8.73% |
| S&P Biotechnology Select Industry Total Return Index | 11.93% | 1.28% | 6.28% |
| Bloomberg US 3000 Equal Weight Total Return Index | 6.75% | 7.03% | 6.85% |
| Net Assets | $1,439,915,749 |
| Number of Portfolio Holdings | 94 |
| Advisory Fee | $17,506,668 |
| Portfolio Turnover | 71% |
What did the Fund invest in?
Industry Weighting (% of net assets)
| Value | Value |
|---|
| Other Assets in Excess of Liabilities | 1.2% |
| Money Market Funds | 2.4% |
| Software | 3.2% |
| Medical Equipment & Devices | 12.7% |
| Biotech & Pharma | 80.5% |
Asset Weighting (% of total investments)
| Value | Value |
|---|
| Common Stocks | 92.2% |
| Convertible Bonds | 0.0% |
| Private Investments | 7.4% |
| Short-Term Investments | 0.2% |
| Warrant | 0.2% |
Top 10 Holdings* (% of net assets)
| Holding Name | % of Net Assets |
| Celldex Therapeutics, Inc. | 4.0% |
| Mirum Pharmaceuticals, Inc. | 4.0% |
| Vaxcyte, Inc. | 3.9% |
| Insmed, Inc. | 3.1% |
| Aura Biosciences, Inc. | 3.0% |
| Guardant Health, Inc. | 2.9% |
| Collegium Pharmaceutical, Inc. | 2.9% |
| Axsome Therapeutics, Inc. | 2.8% |
| Sarepta Therapeutics, Inc. | 2.5% |
| Lexeo Therapeutics, Inc. | 2.3% |
* Does not include cash/money market funds/equivalents. Based on percentage of net assets. Holdings can change at any time, are subject to risks discussed in the Fund’s prospectus, and should not be considered investment advice.
This is a summary of certain changes to the Fund since July 1, 2023. For more complete information, you may review the Fund’s next prospectus, which we expect to be available by November 1, 2024 at https://www.eventidefunds.com/prospectus or upon request at 1-877-771-EVEN (3836). As of January 2024, Dr. Kyle Rasbach is no longer a portfolio manager of the Fund.
Eventide Healthcare & Life Sciences Fund - Class A (ETAHX )
Annual Shareholder Report - June 30, 2024
Where can I find additional information about the Fund?
Additional information is available on the Fund's website ( https://www.eventidefunds.com ), including its:
Prospectus
Financial information
Holdings
Proxy voting information
Eventide Healthcare & Life Sciences Fund
Annual Shareholder Report - June 30, 2024
This annual shareholder report contains important information about Eventide Healthcare & Life Sciences Fund for the period of July 1, 2023 to June 30, 2024. You can find additional information about the Fund at https://www.eventidefunds.com. You can also request this information by contacting us at 1-877-771-3836. This report describes changes to the Fund that occurred during the reporting period.
What were the Fund’s costs for the last year?
(based on a hypothetical $10,000 investment)
| Class Name | Costs of a $10,000 investment | Costs paid as a percentage of a $10,000 investment |
|---|
| Class C | $232 | 2.32% |
How has the Fund performed over the last ten years?
Total Return Based on $10,000 Investment
| Eventide Healthcare & Life Sciences Fund | S&P Biotechnology Select Industry Total Return Index | Bloomberg US 3000 Equal Weight Total Return Index |
|---|
| Jun-2014 | $10,000 | $10,000 | $10,000 |
| Jun-2015 | $14,801 | $16,403 | $10,485 |
| Jun-2016 | $10,635 | $10,569 | $9,804 |
| Jun-2017 | $13,203 | $15,113 | $12,228 |
| Jun-2018 | $19,498 | $18,682 | $14,371 |
| Jun-2019 | $21,415 | $17,249 | $13,813 |
| Jun-2020 | $26,498 | $22,027 | $13,107 |
| Jun-2021 | $29,002 | $26,695 | $22,060 |
| Jun-2022 | $18,450 | $14,645 | $16,465 |
| Jun-2023 | $25,409 | $16,421 | $18,171 |
| Jun-2024 | $22,757 | $18,381 | $19,398 |
The Fund's past performance is not a good predictor of how the Fund will perform in the future. The graph and table do not reflect the deduction of taxes that a shareholder would pay on fund distributions or redemption of fund shares. In connection with new SEC Rules on shareholder reporting, the Fund's performance information above is compared with a broad-based benchmark, Bloomberg US 3000 Equal Weight Total Return Index, which represents the overall domestic equity market. In addition, the strategy benchmark, S&P Biotechnology Select Industry Total Return Index, is included as the adviser believes it is more representative of the fund's investment universe.
How did the Fund perform during the reporting period?
As the fiscal year began, the market faced the implications of “higher for longer” interest rates. With hopes for rate cuts diminishing, Biotechnology underperformed, though the disruption did offer investors attractive entry points. We are confident in the Fund’s investment process and the Healthcare sector’s remarkable innovation in diabetes, Alzheimer’s, cancer, and other conditions of unmet need. Given the scarcity of capital, the Fund has been overweight those in later development stages, especially in oncology and immunology. We believe the Fund is strategically aligned to leverage the Biotech’s anticipated growth. Despite recent underperformance relative to the Fund’s benchmark, we believe our focus on companies with high likelihood of clinical and commercial success positions the Fund well for long-term value creation.
Average Annual Total Returns
| 1 Year | 5 Years | 10 Years |
|---|
| Eventide Healthcare & Life Sciences Fund - Class C | | 1.22% | 8.57% |
| S&P Biotechnology Select Industry Total Return Index | 11.93% | 1.28% | 6.28% |
| Bloomberg US 3000 Equal Weight Total Return Index | 6.75% | 7.03% | 6.85% |
| Net Assets | $1,439,915,749 |
| Number of Portfolio Holdings | 94 |
| Advisory Fee | $17,506,668 |
| Portfolio Turnover | 71% |
What did the Fund invest in?
Industry Weighting (% of net assets)
| Value | Value |
|---|
| Other Assets in Excess of Liabilities | 1.2% |
| Money Market Funds | 2.4% |
| Software | 3.2% |
| Medical Equipment & Devices | 12.7% |
| Biotech & Pharma | 80.5% |
Asset Weighting (% of total investments)
| Value | Value |
|---|
| Common Stocks | 92.2% |
| Convertible Bonds | 0.0% |
| Private Investments | 7.4% |
| Short-Term Investments | 0.2% |
| Warrant | 0.2% |
Top 10 Holdings* (% of net assets)
| Holding Name | % of Net Assets |
| Celldex Therapeutics, Inc. | 4.0% |
| Mirum Pharmaceuticals, Inc. | 4.0% |
| Vaxcyte, Inc. | 3.9% |
| Insmed, Inc. | 3.1% |
| Aura Biosciences, Inc. | 3.0% |
| Guardant Health, Inc. | 2.9% |
| Collegium Pharmaceutical, Inc. | 2.9% |
| Axsome Therapeutics, Inc. | 2.8% |
| Sarepta Therapeutics, Inc. | 2.5% |
| Lexeo Therapeutics, Inc. | 2.3% |
* Does not include cash/money market funds/equivalents. Based on percentage of net assets. Holdings can change at any time, are subject to risks discussed in the Fund’s prospectus, and should not be considered investment advice.
This is a summary of certain changes to the Fund since July 1, 2023. For more complete information, you may review the Fund’s next prospectus, which we expect to be available by November 1, 2024 at https://www.eventidefunds.com/prospectus or upon request at 1-877-771-EVEN (3836). As of January 2024, Dr. Kyle Rasbach is no longer a portfolio manager of the Fund.
Eventide Healthcare & Life Sciences Fund - Class C (ETCHX )
Annual Shareholder Report - June 30, 2024
Where can I find additional information about the Fund?
Additional information is available on the Fund's website ( https://www.eventidefunds.com ), including its:
Prospectus
Financial information
Holdings
Proxy voting information
Eventide Healthcare & Life Sciences Fund
Annual Shareholder Report - June 30, 2024
This annual shareholder report contains important information about Eventide Healthcare & Life Sciences Fund for the period of July 1, 2023 to June 30, 2024. You can find additional information about the Fund at https://www.eventidefunds.com. You can also request this information by contacting us at 1-877-771-3836. This report describes changes to the Fund that occurred during the reporting period.
What were the Fund’s costs for the last year?
(based on a hypothetical $10,000 investment)
| Class Name | Costs of a $10,000 investment | Costs paid as a percentage of a $10,000 investment |
|---|
| Class I | $132 | 1.32% |
How has the Fund performed over the last ten years?
Total Return Based on $10,000 Investment
| Eventide Healthcare & Life Sciences Fund | S&P Biotechnology Select Industry Total Return Index | Bloomberg US 3000 Equal Weight Total Return Index |
|---|
| Jun-2014 | $10,000 | $10,000 | $10,000 |
| Jun-2015 | $14,946 | $16,403 | $10,485 |
| Jun-2016 | $10,842 | $10,569 | $9,804 |
| Jun-2017 | $13,596 | $15,113 | $12,228 |
| Jun-2018 | $20,340 | $18,682 | $14,371 |
| Jun-2019 | $22,522 | $17,249 | $13,813 |
| Jun-2020 | $28,147 | $22,027 | $13,107 |
| Jun-2021 | $31,114 | $26,695 | $22,060 |
| Jun-2022 | $19,996 | $14,645 | $16,465 |
| Jun-2023 | $27,817 | $16,421 | $18,171 |
| Jun-2024 | $25,154 | $18,381 | $19,398 |
The Fund's past performance is not a good predictor of how the Fund will perform in the future. The graph and table do not reflect the deduction of taxes that a shareholder would pay on fund distributions or redemption of fund shares. In connection with new SEC Rules on shareholder reporting, the Fund's performance information above is compared with a broad-based benchmark, Bloomberg US 3000 Equal Weight Total Return Index, which represents the overall domestic equity market. In addition, the strategy benchmark, S&P Biotechnology Select Industry Total Return Index, is included as the adviser believes it is more representative of the fund's investment universe.
How did the Fund perform during the reporting period?
As the fiscal year began, the market faced the implications of “higher for longer” interest rates. With hopes for rate cuts diminishing, Biotechnology underperformed, though the disruption did offer investors attractive entry points. We are confident in the Fund’s investment process and the Healthcare sector’s remarkable innovation in diabetes, Alzheimer’s, cancer, and other conditions of unmet need. Given the scarcity of capital, the Fund has been overweight those in later development stages, especially in oncology and immunology. We believe the Fund is strategically aligned to leverage the Biotech’s anticipated growth. Despite recent underperformance relative to the Fund’s benchmark, we believe our focus on companies with high likelihood of clinical and commercial success positions the Fund well for long-term value creation.
Average Annual Total Returns
| 1 Year | 5 Years | 10 Years |
|---|
| Eventide Healthcare & Life Sciences Fund - Class I | | 2.23% | 9.66% |
| S&P Biotechnology Select Industry Total Return Index | 11.93% | 1.28% | 6.28% |
| Bloomberg US 3000 Equal Weight Total Return Index | 6.75% | 7.03% | 6.85% |
| Net Assets | $1,439,915,749 |
| Number of Portfolio Holdings | 94 |
| Advisory Fee | $17,506,668 |
| Portfolio Turnover | 71% |
What did the Fund invest in?
Industry Weighting (% of net assets)
| Value | Value |
|---|
| Other Assets in Excess of Liabilities | 1.2% |
| Money Market Funds | 2.4% |
| Software | 3.2% |
| Medical Equipment & Devices | 12.7% |
| Biotech & Pharma | 80.5% |
Asset Weighting (% of total investments)
| Value | Value |
|---|
| Common Stocks | 92.2% |
| Convertible Bonds | 0.0% |
| Private Investments | 7.4% |
| Short-Term Investments | 0.2% |
| Warrant | 0.2% |
Top 10 Holdings* (% of net assets)
| Holding Name | % of Net Assets |
| Celldex Therapeutics, Inc. | 4.0% |
| Mirum Pharmaceuticals, Inc. | 4.0% |
| Vaxcyte, Inc. | 3.9% |
| Insmed, Inc. | 3.1% |
| Aura Biosciences, Inc. | 3.0% |
| Guardant Health, Inc. | 2.9% |
| Collegium Pharmaceutical, Inc. | 2.9% |
| Axsome Therapeutics, Inc. | 2.8% |
| Sarepta Therapeutics, Inc. | 2.5% |
| Lexeo Therapeutics, Inc. | 2.3% |
* Does not include cash/money market funds/equivalents. Based on percentage of net assets. Holdings can change at any time, are subject to risks discussed in the Fund’s prospectus, and should not be considered investment advice.
This is a summary of certain changes to the Fund since July 1, 2023. For more complete information, you may review the Fund’s next prospectus, which we expect to be available by November 1, 2024 at https://www.eventidefunds.com/prospectus or upon request at 1-877-771-EVEN (3836). As of January 2024, Dr. Kyle Rasbach is no longer a portfolio manager of the Fund.
Eventide Healthcare & Life Sciences Fund - Class I (ETIHX )
Annual Shareholder Report - June 30, 2024
Where can I find additional information about the Fund?
Additional information is available on the Fund's website ( https://www.eventidefunds.com ), including its:
Prospectus
Financial information
Holdings
Proxy voting information
Eventide Healthcare & Life Sciences Fund
Annual Shareholder Report - June 30, 2024
This annual shareholder report contains important information about Eventide Healthcare & Life Sciences Fund for the period of July 1, 2023 to June 30, 2024. You can find additional information about the Fund at https://www.eventidefunds.com. You can also request this information by contacting us at 1-877-771-3836. This report describes changes to the Fund that occurred during the reporting period.
What were the Fund’s costs for the last year?
(based on a hypothetical $10,000 investment)
| Class Name | Costs of a $10,000 investment | Costs paid as a percentage of a $10,000 investment |
|---|
| Class N | $152 | 1.52% |
How has the Fund performed over the last ten years?
Total Return Based on $10,000 Investment
| Eventide Healthcare & Life Sciences Fund | S&P Biotechnology Select Industry Total Return Index | Bloomberg US 3000 Equal Weight Total Return Index |
|---|
| Jun-2014 | $10,000 | $10,000 | $10,000 |
| Jun-2015 | $14,923 | $16,403 | $10,485 |
| Jun-2016 | $10,799 | $10,569 | $9,804 |
| Jun-2017 | $13,518 | $15,113 | $12,228 |
| Jun-2018 | $20,180 | $18,682 | $14,371 |
| Jun-2019 | $22,301 | $17,249 | $13,813 |
| Jun-2020 | $27,805 | $22,027 | $13,107 |
| Jun-2021 | $30,680 | $26,695 | $22,060 |
| Jun-2022 | $19,681 | $14,645 | $16,465 |
| Jun-2023 | $27,322 | $16,421 | $18,171 |
| Jun-2024 | $24,657 | $18,381 | $19,398 |
The Fund's past performance is not a good predictor of how the Fund will perform in the future. The graph and table do not reflect the deduction of taxes that a shareholder would pay on fund distributions or redemption of fund shares. In connection with new SEC Rules on shareholder reporting, the Fund's performance information above is compared with a broad-based benchmark, Bloomberg US 3000 Equal Weight Total Return Index, which represents the overall domestic equity market. In addition, the strategy benchmark, S&P Biotechnology Select Industry Total Return Index, is included as the adviser believes it is more representative of the fund's investment universe.
How did the Fund perform during the reporting period?
As the fiscal year began, the market faced the implications of “higher for longer” interest rates. With hopes for rate cuts diminishing, Biotechnology underperformed, though the disruption did offer investors attractive entry points. We are confident in the Fund’s investment process and the Healthcare sector’s remarkable innovation in diabetes, Alzheimer’s, cancer, and other conditions of unmet need. Given the scarcity of capital, the Fund has been overweight those in later development stages, especially in oncology and immunology. We believe the Fund is strategically aligned to leverage the Biotech’s anticipated growth. Despite recent underperformance relative to the Fund’s benchmark, we believe our focus on companies with high likelihood of clinical and commercial success positions the Fund well for long-term value creation.
Average Annual Total Returns
| 1 Year | 5 Years | 10 Years |
|---|
| Eventide Healthcare & Life Sciences Fund - Class N | | 2.03% | 9.44% |
| S&P Biotechnology Select Industry Total Return Index | 11.93% | 1.28% | 6.28% |
| Bloomberg US 3000 Equal Weight Total Return Index | 6.75% | 7.03% | 6.85% |
| Net Assets | $1,439,915,749 |
| Number of Portfolio Holdings | 94 |
| Advisory Fee | $17,506,668 |
| Portfolio Turnover | 71% |
What did the Fund invest in?
Industry Weighting (% of net assets)
| Value | Value |
|---|
| Other Assets in Excess of Liabilities | 1.2% |
| Money Market Funds | 2.4% |
| Software | 3.2% |
| Medical Equipment & Devices | 12.7% |
| Biotech & Pharma | 80.5% |
Asset Weighting (% of total investments)
| Value | Value |
|---|
| Common Stocks | 92.2% |
| Convertible Bonds | 0.0% |
| Private Investments | 7.4% |
| Short-Term Investments | 0.2% |
| Warrant | 0.2% |
Top 10 Holdings* (% of net assets)
| Holding Name | % of Net Assets |
| Celldex Therapeutics, Inc. | 4.0% |
| Mirum Pharmaceuticals, Inc. | 4.0% |
| Vaxcyte, Inc. | 3.9% |
| Insmed, Inc. | 3.1% |
| Aura Biosciences, Inc. | 3.0% |
| Guardant Health, Inc. | 2.9% |
| Collegium Pharmaceutical, Inc. | 2.9% |
| Axsome Therapeutics, Inc. | 2.8% |
| Sarepta Therapeutics, Inc. | 2.5% |
| Lexeo Therapeutics, Inc. | 2.3% |
* Does not include cash/money market funds/equivalents. Based on percentage of net assets. Holdings can change at any time, are subject to risks discussed in the Fund’s prospectus, and should not be considered investment advice.
This is a summary of certain changes to the Fund since July 1, 2023. For more complete information, you may review the Fund’s next prospectus, which we expect to be available by November 1, 2024 at https://www.eventidefunds.com/prospectus or upon request at 1-877-771-EVEN (3836). As of January 2024, Dr. Kyle Rasbach is no longer a portfolio manager of the Fund.
Eventide Healthcare & Life Sciences Fund - Class N (ETNHX )
Annual Shareholder Report - June 30, 2024
Where can I find additional information about the Fund?
Additional information is available on the Fund's website ( https://www.eventidefunds.com ), including its:
Prospectus
Financial information
Holdings
Proxy voting information
Eventide Large Cap Focus Fund
Annual Shareholder Report - June 30, 2024
This annual shareholder report contains important information about Eventide Large Cap Focus Fund for the period of July 1, 2023 to June 30, 2024. You can find additional information about the Fund at https://www.eventidefunds.com. You can also request this information by contacting us at 1-877-771-3836. This report describes changes to the Fund that occurred during the reporting period.
What were the Fund’s costs for the last year?
(based on a hypothetical $10,000 investment)
| Class Name | Costs of a $10,000 investment | Costs paid as a percentage of a $10,000 investment |
|---|
| Class A | $119 | 1.19% |
How did the Fund perform during the reporting period?
The Fund’s outperformance in Information Technology, Industrials, Utilities, Energy, and Consumer Staples was offset by underperformance in Health Care, Financials, Consumer Discretionary, Communication Services, and Materials. While the macroeconomic conditions were volatile, the companies in the Fund’s portfolio benefitted from idiosyncratic factors, such as market share gains due to strong customer service. Beyond market dynamics, the intrinsic strength of the Fund’s portfolio companies lies in their industry leadership and commitment to addressing fundamental human needs. They have innovative and proprietary technologies, experienced management teams, strong corporate cultures, and fortress-like balance sheets. These attributes give us confidence in the sustained success and resilience of the Fund’s portfolio companies, both in the near future and over the long term.
How has the Fund performed since inception?
Total Return Based on $10,000 Investment
| Eventide Large Cap Focus Fund - with load | S&P 500® Index |
|---|
| Jun-2022 | $9,425 | $10,000 |
| Jun-2023 | $10,769 | $11,959 |
| Jun-2024 | $13,183 | $14,896 |
The Fund's past performance is not a good predictor of how the Fund will perform in the future. The graph and table do not reflect the deduction of taxes that a shareholder would pay on fund distributions or redemption of fund shares. In connection with new SEC Rules on shareholder reporting, the Fund's performance information above is compared with a broad-based benchmark, S&P 500 Total Return Index, which represents the overall domestic equity market.
- Net Assets$106,183,183
- Number of Portfolio Holdings43
- Advisory Fee (net of waivers)$218,136
- Portfolio Turnover101%
Average Annual Total Returns
| 1 Year | Since Inception (June 30, 2022) |
|---|
| Eventide Large Cap Focus Fund - Class A |
| Without Load | 22.42% | 18.27% |
| With Load | 15.35% | 14.82% |
S&P 500® Index | 24.56% | 22.05% |
What did the Fund invest in?
Industry Weighting (% of net assets)
| Value | Value |
|---|
| Other Assets in Excess of Liabilities | 3.2% |
| Other Industries | 6.1% |
| Insurance | 1.9% |
| Transportation & Logistics | 2.3% |
| Medical Equipment & Devices | 2.3% |
| Institutional Financial Services | 2.3% |
| Home Construction | 3.2% |
| Industrial Support Services | 3.4% |
| Technology Services | 5.6% |
| Electrical Equipment | 5.6% |
| Oil & Gas Producers | 5.8% |
| Electric Utilities | 6.0% |
| Biotech & Pharma | 6.2% |
| Chemicals | 8.8% |
| Retail - Discretionary | 9.6% |
| Software | 13.5% |
| Semiconductors | 14.2% |
Asset Weighting (% of total investments)
| Value | Value |
|---|
| Common Stocks | 100.0% |
| Warrant | 0.0% |
Top 10 Holdings* (% of net assets)
| Holding Name | % of Net Assets |
| Linde plc | 5.5% |
| Lam Research Corporation | 5.0% |
| S&P Global, Inc. | 4.7% |
| Taiwan Semiconductor Manufacturing Company Ltd. - ADR | 4.0% |
| Ferguson PLC | 3.4% |
| Sherwin-Williams Company (The) | 3.3% |
| O'Reilly Automotive, Inc. | 3.3% |
| Williams Companies, Inc. (The) | 3.3% |
| Southern Company (The) | 3.2% |
| DR Horton, Inc. | 3.2% |
* Does not include cash/money market funds/equivalents. Based on percentage of net assets. Holdings can change at any time, are subject to risks discussed in the Fund’s prospectus, and should not be considered investment advice.
This is a summary of certain changes to the Fund since July 1, 2023. For more complete information, you may review the Fund’s next prospectus, which we expect to be available by November 1, 2024 at https://www.eventidefunds.com/prospectus or upon request at 1-877-771-EVEN (3836). Dolores S. Bamford, CFA, Co-Chief Investment Officer and Senior Portfolio Manager of Eventide Asset Management, LLC began serving as a portfolio manager of the Fund on May 1, 2024. Ms. Bamford joined Anant Goel and Andrew Singer as portfolio managers of the Fund.
Eventide Large Cap Focus Fund - Class A (ETLAX)
Annual Shareholder Report - June 30, 2024
Where can I find additional information about the Fund?
Additional information is available on the Fund's website ( https://www.eventidefunds.com ), including its:
Prospectus
Financial information
Holdings
Proxy voting information
Eventide Large Cap Focus Fund
Annual Shareholder Report - June 30, 2024
This annual shareholder report contains important information about Eventide Large Cap Focus Fund for the period of July 1, 2023 to June 30, 2024. You can find additional information about the Fund at https://www.eventidefunds.com. You can also request this information by contacting us at 1-877-771-3836. This report describes changes to the Fund that occurred during the reporting period.
What were the Fund’s costs for the last year?
(based on a hypothetical $10,000 investment)
| Class Name | Costs of a $10,000 investment | Costs paid as a percentage of a $10,000 investment |
|---|
| Class C | $194 | 1.94% |
How did the Fund perform during the reporting period?
The Fund’s outperformance in Information Technology, Industrials, Utilities, Energy, and Consumer Staples was offset by underperformance in Health Care, Financials, Consumer Discretionary, Communication Services, and Materials. While the macroeconomic conditions were volatile, the companies in the Fund’s portfolio benefitted from idiosyncratic factors, such as market share gains due to strong customer service. Beyond market dynamics, the intrinsic strength of the Fund’s portfolio companies lies in their industry leadership and commitment to addressing fundamental human needs. They have innovative and proprietary technologies, experienced management teams, strong corporate cultures, and fortress-like balance sheets. These attributes give us confidence in the sustained success and resilience of the Fund’s portfolio companies, both in the near future and over the long term.
How has the Fund performed since inception?
Total Return Based on $10,000 Investment
| Eventide Large Cap Focus Fund | S&P 500® Index |
|---|
| Jun-2022 | $10,000 | $10,000 |
| Jun-2023 | $11,360 | $11,959 |
| Jun-2024 | $13,790 | $14,896 |
The Fund's past performance is not a good predictor of how the Fund will perform in the future. The graph and table do not reflect the deduction of taxes that a shareholder would pay on fund distributions or redemption of fund shares. In connection with new SEC Rules on shareholder reporting, the Fund's performance information above is compared with a broad-based benchmark, S&P 500 Total Return Index, which represents the overall domestic equity market.
- Net Assets$106,183,183
- Number of Portfolio Holdings43
- Advisory Fee (net of waivers)$218,136
- Portfolio Turnover101%
Average Annual Total Returns
| 1 Year | Since Inception (June 30, 2022) |
|---|
| Eventide Large Cap Focus Fund - Class C | 21.39% | 17.43% |
S&P 500® Index | 24.56% | 22.05% |
What did the Fund invest in?
Industry Weighting (% of net assets)
| Value | Value |
|---|
| Other Assets in Excess of Liabilities | 3.2% |
| Other Industries | 6.1% |
| Insurance | 1.9% |
| Transportation & Logistics | 2.3% |
| Medical Equipment & Devices | 2.3% |
| Institutional Financial Services | 2.3% |
| Home Construction | 3.2% |
| Industrial Support Services | 3.4% |
| Technology Services | 5.6% |
| Electrical Equipment | 5.6% |
| Oil & Gas Producers | 5.8% |
| Electric Utilities | 6.0% |
| Biotech & Pharma | 6.2% |
| Chemicals | 8.8% |
| Retail - Discretionary | 9.6% |
| Software | 13.5% |
| Semiconductors | 14.2% |
Asset Weighting (% of total investments)
| Value | Value |
|---|
| Common Stocks | 100.0% |
| Warrant | 0.0% |
Top 10 Holdings* (% of net assets)
| Holding Name | % of Net Assets |
| Linde plc | 5.5% |
| Lam Research Corporation | 5.0% |
| S&P Global, Inc. | 4.7% |
| Taiwan Semiconductor Manufacturing Company Ltd. - ADR | 4.0% |
| Ferguson PLC | 3.4% |
| Sherwin-Williams Company (The) | 3.3% |
| O'Reilly Automotive, Inc. | 3.3% |
| Williams Companies, Inc. (The) | 3.3% |
| Southern Company (The) | 3.2% |
| DR Horton, Inc. | 3.2% |
* Does not include cash/money market funds/equivalents. Based on percentage of net assets. Holdings can change at any time, are subject to risks discussed in the Fund’s prospectus, and should not be considered investment advice.
This is a summary of certain changes to the Fund since July 1, 2023. For more complete information, you may review the Fund’s next prospectus, which we expect to be available by November 1, 2024 at https://www.eventidefunds.com/prospectus or upon request at 1-877-771-EVEN (3836). Dolores S. Bamford, CFA, Co-Chief Investment Officer and Senior Portfolio Manager of Eventide Asset Management, LLC began serving as a portfolio manager of the Fund on May 1, 2024. Ms. Bamford joined Anant Goel and Andrew Singer as portfolio managers of the Fund.
Eventide Large Cap Focus Fund - Class C (ETLCX)
Annual Shareholder Report - June 30, 2024
Where can I find additional information about the Fund?
Additional information is available on the Fund's website ( https://www.eventidefunds.com ), including its:
Prospectus
Financial information
Holdings
Proxy voting information
Eventide Large Cap Focus Fund
Annual Shareholder Report - June 30, 2024
This annual shareholder report contains important information about Eventide Large Cap Focus Fund for the period of July 1, 2023 to June 30, 2024. You can find additional information about the Fund at https://www.eventidefunds.com. You can also request this information by contacting us at 1-877-771-3836. This report describes changes to the Fund that occurred during the reporting period.
What were the Fund’s costs for the last year?
(based on a hypothetical $10,000 investment)
| Class Name | Costs of a $10,000 investment | Costs paid as a percentage of a $10,000 investment |
|---|
| Class I | $94 | 0.94% |
How did the Fund perform during the reporting period?
The Fund’s outperformance in Information Technology, Industrials, Utilities, Energy, and Consumer Staples was offset by underperformance in Health Care, Financials, Consumer Discretionary, Communication Services, and Materials. While the macroeconomic conditions were volatile, the companies in the Fund’s portfolio benefitted from idiosyncratic factors, such as market share gains due to strong customer service. Beyond market dynamics, the intrinsic strength of the Fund’s portfolio companies lies in their industry leadership and commitment to addressing fundamental human needs. They have innovative and proprietary technologies, experienced management teams, strong corporate cultures, and fortress-like balance sheets. These attributes give us confidence in the sustained success and resilience of the Fund’s portfolio companies, both in the near future and over the long term.
How has the Fund performed since inception?
Total Return Based on $10,000 Investment
| Eventide Large Cap Focus Fund | S&P 500® Index |
|---|
| Jun-2022 | $10,000 | $10,000 |
| Jun-2023 | $11,455 | $11,959 |
| Jun-2024 | $14,058 | $14,896 |
The Fund's past performance is not a good predictor of how the Fund will perform in the future. The graph and table do not reflect the deduction of taxes that a shareholder would pay on fund distributions or redemption of fund shares. In connection with new SEC Rules on shareholder reporting, the Fund's performance information above is compared with a broad-based benchmark, S&P 500 Total Return Index, which represents the overall domestic equity market.
- Net Assets$106,183,183
- Number of Portfolio Holdings43
- Advisory Fee (net of waivers)$218,136
- Portfolio Turnover101%
Average Annual Total Returns
| 1 Year | Since Inception (June 30, 2022) |
|---|
| Eventide Large Cap Focus Fund - Class I | 22.73% | 18.57% |
S&P 500® Index | 24.56% | 22.05% |
What did the Fund invest in?
Industry Weighting (% of net assets)
| Value | Value |
|---|
| Other Assets in Excess of Liabilities | 3.2% |
| Other Industries | 6.1% |
| Insurance | 1.9% |
| Transportation & Logistics | 2.3% |
| Medical Equipment & Devices | 2.3% |
| Institutional Financial Services | 2.3% |
| Home Construction | 3.2% |
| Industrial Support Services | 3.4% |
| Technology Services | 5.6% |
| Electrical Equipment | 5.6% |
| Oil & Gas Producers | 5.8% |
| Electric Utilities | 6.0% |
| Biotech & Pharma | 6.2% |
| Chemicals | 8.8% |
| Retail - Discretionary | 9.6% |
| Software | 13.5% |
| Semiconductors | 14.2% |
Asset Weighting (% of total investments)
| Value | Value |
|---|
| Common Stocks | 100.0% |
| Warrant | 0.0% |
Top 10 Holdings* (% of net assets)
| Holding Name | % of Net Assets |
| Linde plc | 5.5% |
| Lam Research Corporation | 5.0% |
| S&P Global, Inc. | 4.7% |
| Taiwan Semiconductor Manufacturing Company Ltd. - ADR | 4.0% |
| Ferguson PLC | 3.4% |
| Sherwin-Williams Company (The) | 3.3% |
| O'Reilly Automotive, Inc. | 3.3% |
| Williams Companies, Inc. (The) | 3.3% |
| Southern Company (The) | 3.2% |
| DR Horton, Inc. | 3.2% |
* Does not include cash/money market funds/equivalents. Based on percentage of net assets. Holdings can change at any time, are subject to risks discussed in the Fund’s prospectus, and should not be considered investment advice.
This is a summary of certain changes to the Fund since July 1, 2023. For more complete information, you may review the Fund’s next prospectus, which we expect to be available by November 1, 2024 at https://www.eventidefunds.com/prospectus or upon request at 1-877-771-EVEN (3836). Dolores S. Bamford, CFA, Co-Chief Investment Officer and Senior Portfolio Manager of Eventide Asset Management, LLC began serving as a portfolio manager of the Fund on May 1, 2024. Ms. Bamford joined Anant Goel and Andrew Singer as portfolio managers of the Fund.
Eventide Large Cap Focus Fund - Class I (ETLIX)
Annual Shareholder Report - June 30, 2024
Where can I find additional information about the Fund?
Additional information is available on the Fund's website ( https://www.eventidefunds.com ), including its:
Prospectus
Financial information
Holdings
Proxy voting information
Eventide Large Cap Focus Fund
Annual Shareholder Report - June 30, 2024
This annual shareholder report contains important information about Eventide Large Cap Focus Fund for the period of July 1, 2023 to June 30, 2024. You can find additional information about the Fund at https://www.eventidefunds.com. You can also request this information by contacting us at 1-877-771-3836. This report describes changes to the Fund that occurred during the reporting period.
What were the Fund’s costs for the last year?
(based on a hypothetical $10,000 investment)
| Class Name | Costs of a $10,000 investment | Costs paid as a percentage of a $10,000 investment |
|---|
| Class N | $114 | 1.14% |
How did the Fund perform during the reporting period?
The Fund’s outperformance in Information Technology, Industrials, Utilities, Energy, and Consumer Staples was offset by underperformance in Health Care, Financials, Consumer Discretionary, Communication Services, and Materials. While the macroeconomic conditions were volatile, the companies in the Fund’s portfolio benefitted from idiosyncratic factors, such as market share gains due to strong customer service. Beyond market dynamics, the intrinsic strength of the Fund’s portfolio companies lies in their industry leadership and commitment to addressing fundamental human needs. They have innovative and proprietary technologies, experienced management teams, strong corporate cultures, and fortress-like balance sheets. These attributes give us confidence in the sustained success and resilience of the Fund’s portfolio companies, both in the near future and over the long term.
How has the Fund performed since inception?
Total Return Based on $10,000 Investment
| Eventide Large Cap Focus Fund | S&P 500® Index |
|---|
| Jun-2022 | $10,000 | $10,000 |
| Jun-2023 | $11,443 | $11,959 |
| Jun-2024 | $14,014 | $14,896 |
The Fund's past performance is not a good predictor of how the Fund will perform in the future. The graph and table do not reflect the deduction of taxes that a shareholder would pay on fund distributions or redemption of fund shares. In connection with new SEC Rules on shareholder reporting, the Fund's performance information above is compared with a broad-based benchmark, S&P 500 Total Return Index, which represents the overall domestic equity market.
- Net Assets$106,183,183
- Number of Portfolio Holdings43
- Advisory Fee (net of waivers)$218,136
- Portfolio Turnover101%
Average Annual Total Returns
| 1 Year | Since Inception (June 30, 2022) |
|---|
| Eventide Large Cap Focus Fund - Class N | 22.47% | 18.38% |
S&P 500® Index | 24.56% | 22.05% |
What did the Fund invest in?
Industry Weighting (% of net assets)
| Value | Value |
|---|
| Other Assets in Excess of Liabilities | 3.2% |
| Other Industries | 6.1% |
| Insurance | 1.9% |
| Transportation & Logistics | 2.3% |
| Medical Equipment & Devices | 2.3% |
| Institutional Financial Services | 2.3% |
| Home Construction | 3.2% |
| Industrial Support Services | 3.4% |
| Technology Services | 5.6% |
| Electrical Equipment | 5.6% |
| Oil & Gas Producers | 5.8% |
| Electric Utilities | 6.0% |
| Biotech & Pharma | 6.2% |
| Chemicals | 8.8% |
| Retail - Discretionary | 9.6% |
| Software | 13.5% |
| Semiconductors | 14.2% |
Asset Weighting (% of total investments)
| Value | Value |
|---|
| Common Stocks | 100.0% |
| Warrant | 0.0% |
Top 10 Holdings* (% of net assets)
| Holding Name | % of Net Assets |
| Linde plc | 5.5% |
| Lam Research Corporation | 5.0% |
| S&P Global, Inc. | 4.7% |
| Taiwan Semiconductor Manufacturing Company Ltd. - ADR | 4.0% |
| Ferguson PLC | 3.4% |
| Sherwin-Williams Company (The) | 3.3% |
| O'Reilly Automotive, Inc. | 3.3% |
| Williams Companies, Inc. (The) | 3.3% |
| Southern Company (The) | 3.2% |
| DR Horton, Inc. | 3.2% |
* Does not include cash/money market funds/equivalents. Based on percentage of net assets. Holdings can change at any time, are subject to risks discussed in the Fund’s prospectus, and should not be considered investment advice.
This is a summary of certain changes to the Fund since July 1, 2023. For more complete information, you may review the Fund’s next prospectus, which we expect to be available by November 1, 2024 at https://www.eventidefunds.com/prospectus or upon request at 1-877-771-EVEN (3836). Dolores S. Bamford, CFA, Co-Chief Investment Officer and Senior Portfolio Manager of Eventide Asset Management, LLC began serving as a portfolio manager of the Fund on May 1, 2024. Ms. Bamford joined Anant Goel and Andrew Singer as portfolio managers of the Fund.
Eventide Large Cap Focus Fund - Class N (ETLNX)
Annual Shareholder Report - June 30, 2024
Where can I find additional information about the Fund?
Additional information is available on the Fund's website ( https://www.eventidefunds.com ), including its:
Prospectus
Financial information
Holdings
Proxy voting information
Eventide Limited-Term Bond Fund
Annual Shareholder Report - June 30, 2024
This annual shareholder report contains important information about Eventide Limited-Term Bond Fund for the period of July 1, 2023 to June 30, 2024. You can find additional information about the Fund at https://www.eventidefunds.com. You can also request this information by contacting us at 1-877-771-3836.
What were the Fund’s costs for the last year?
(based on a hypothetical $10,000 investment)
| Class Name | Costs of a $10,000 investment | Costs paid as a percentage of a $10,000 investment |
|---|
| Class A | $80 | 0.80% |
How has the Fund performed over the last ten years?
Total Return Based on $10,000 Investment
| Eventide Limited-Term Bond Fund - with load | Bloomberg U.S. 1-5 Year Government/Credit Index | Bloomberg U.S. Aggregate Bond Index |
|---|
| Jun-2014 | $9,425 | $10,000 | $10,000 |
| Jun-2015 | $9,492 | $10,131 | $10,186 |
| Jun-2016 | $9,808 | $10,398 | $10,797 |
| Jun-2017 | $9,860 | $10,409 | $10,763 |
| Jun-2018 | $9,810 | $10,388 | $10,720 |
| Jun-2019 | $10,264 | $10,943 | $11,564 |
| Jun-2020 | $10,705 | $11,537 | $12,575 |
| Jun-2021 | $10,753 | $11,583 | $12,533 |
| Jun-2022 | $10,085 | $10,981 | $11,243 |
| Jun-2023 | $10,200 | $11,002 | $11,137 |
| Jun-2024 | $10,720 | $11,515 | $11,430 |
The Fund's past performance is not a good predictor of how the Fund will perform in the future. The graph and table do not reflect the deduction of taxes that a shareholder would pay on fund distributions or redemption of fund shares. In connection with new SEC Rules on shareholder reporting, the Fund's performance information above is compared with a broad-based benchmark, Bloomberg US Aggregate Index, which represents the overall domestic bond market. In addition, the strategy benchmark, Bloomberg 1-5 Year Gov/Credit Index, is included as the adviser believes it is more representative of the fund's investment universe.
How did the Fund perform during the reporting period?
The Fund’s performance for the year ended June 30, 2024, was materially impacted by fluctuations of the yield curve and the performance of corporate bonds relative to treasuries. The Fund's investments outperformed its benchmark for the one-year period ended 6/30/24, which was primarily due to the Fund's allocation to corporate bonds. Short-term corporate bonds significantly outperformed short-term treasuries, and the Fund's corporate bond investments outperformed the performance of corporate bond allocations within the benchmark.
Average Annual Total Returns
| 1 Year | 5 Years | 10 Years |
|---|
| Eventide Limited-Term Bond Fund - Class A |
| Without Load | 5.09% | 0.87% | 1.30% |
| With Load | | | 0.70% |
| Bloomberg U.S. 1-5 Year Government/Credit Index | 4.66% | 1.02% | 1.42% |
| Bloomberg U.S. Aggregate Bond Index | 2.63% | | 1.35% |
| Net Assets | $145,825,539 |
| Number of Portfolio Holdings | 96 |
| Advisory Fee (net of waivers) | $220,232 |
| Portfolio Turnover | 33% |
What did the Fund invest in?
Industry Weighting (% of net assets)
| Value | Value |
|---|
| Other Assets in Excess of Liabilities | 2.7% |
| Other Industries | 19.4% |
| Machinery | 2.3% |
| Single-Family Housing | 2.7% |
| Software | 3.0% |
| Auto Loan | 3.3% |
| Engineering & Construction | 3.7% |
| Institutional Financial Services | 3.8% |
| Oil & Gas Producers | 3.9% |
| Insurance | 4.2% |
| Agency Fixed Rate | 4.6% |
| Retail - Discretionary | 5.5% |
| Banking | 5.9% |
| Reit | 6.5% |
| Government Sponsored | 7.3% |
| Government Owned, No Guarantee | 9.8% |
| Electric Utilities | 11.4% |
Asset Weighting (% of total investments)
| Value | Value |
|---|
| Asset Backed Securities | 4.9% |
| Corporate Bonds | 64.7% |
| Municipal Bonds | 8.1% |
| U.S. Government & Agencies | 22.3% |
Top 10 Holdings* (% of net assets)
| Holding Name | % of Net Assets |
| JPMorgan Chase & Company, 6.070%, due 10/22/27 | 2.1% |
| Bank of America Corporation, 2.456%, due 10/22/25 | 2.0% |
| Morgan Stanley, 0.864%, due 10/21/25 | 2.0% |
| Federal National Mortgage Association, 6.250%, due 05/15/29 | 1.9% |
| Aflac, Inc., 1.125%, due 03/15/26 | 1.8% |
| CarMax Auto Owner Trust 2020-4, 1.300%, due 08/17/26 | 1.7% |
| Royal Bank of Canada, 1.150%, due 07/14/26 | 1.7% |
| MidAmerican Energy Company, 3.100%, due 05/1/27 | 1.7% |
| Nasdaq, Inc., 5.350%, due 06/28/28 | 1.7% |
| National Rural Utilities Cooperative Finance, 4.850%, due 02/7/29 | 1.7% |
* Does not include cash/money market funds/equivalents. Based on percentage of net assets. Holdings can change at any time, are subject to risks discussed in the Fund’s prospectus, and should not be considered investment advice.
No material changes occurred during the year ended June 30, 2024.
Eventide Limited-Term Bond Fund - Class A (ETABX )
Annual Shareholder Report - June 30, 2024
Where can I find additional information about the Fund?
Additional information is available on the Fund's website ( https://www.eventidefunds.com ), including its:
Prospectus
Financial information
Holdings
Proxy voting information
Eventide Limited-Term Bond Fund
Annual Shareholder Report - June 30, 2024
This annual shareholder report contains important information about Eventide Limited-Term Bond Fund for the period of July 1, 2023 to June 30, 2024. You can find additional information about the Fund at https://www.eventidefunds.com. You can also request this information by contacting us at 1-877-771-3836.
What were the Fund’s costs for the last year?
(based on a hypothetical $10,000 investment)
| Class Name | Costs of a $10,000 investment | Costs paid as a percentage of a $10,000 investment |
|---|
| Class C | $155 | 1.55% |
How has the Fund performed since inception?
Total Return Based on $10,000 Investment
| Eventide Limited-Term Bond Fund | Bloomberg U.S. 1-5 Year Government/Credit Index | Bloomberg U.S. Aggregate Bond Index |
|---|
| Dec-2018 | $10,000 | $10,000 | $10,000 |
| Jun-2019 | $10,424 | $10,427 | $10,708 |
| Jun-2020 | $10,789 | $10,993 | $11,644 |
| Jun-2021 | $10,749 | $11,037 | $11,605 |
| Jun-2022 | $10,003 | $10,463 | $10,411 |
| Jun-2023 | $10,052 | $10,483 | $10,313 |
| Jun-2024 | $10,481 | $10,971 | $10,585 |
The Fund's past performance is not a good predictor of how the Fund will perform in the future. The graph and table do not reflect the deduction of taxes that a shareholder would pay on fund distributions or redemption of fund shares. In connection with new SEC Rules on shareholder reporting, the Fund's performance information above is compared with a broad-based benchmark, Bloomberg US Aggregate Index, which represents the overall domestic bond market. In addition, the strategy benchmark, Bloomberg 1-5 Year Gov/Credit Index, is included as the adviser believes it is more representative of the fund's investment universe.
How did the Fund perform during the reporting period?
The Fund’s performance for the year ended June 30, 2024, was materially impacted by fluctuations of the yield curve and the performance of corporate bonds relative to treasuries. The Fund's investments outperformed its benchmark for the one-year period ended 6/30/24, which was primarily due to the Fund's allocation to corporate bonds. Short-term corporate bonds significantly outperformed short-term treasuries, and the Fund's corporate bond investments outperformed the performance of corporate bond allocations within the benchmark.
Average Annual Total Returns
| 1 Year | 5 Years | Since Inception (December 14, 2018) |
|---|
| Eventide Limited-Term Bond Fund - Class C | 4.26% | 0.11% | 0.85% |
| Bloomberg U.S. 1-5 Year Government/Credit Index | 4.66% | 1.02% | 1.69% |
| Bloomberg U.S. Aggregate Bond Index | 2.63% | | 1.03% |
| Net Assets | $145,825,539 |
| Number of Portfolio Holdings | 96 |
| Advisory Fee (net of waivers) | $220,232 |
| Portfolio Turnover | 33% |
What did the Fund invest in?
Industry Weighting (% of net assets)
| Value | Value |
|---|
| Other Assets in Excess of Liabilities | 2.7% |
| Other Industries | 19.4% |
| Machinery | 2.3% |
| Single-Family Housing | 2.7% |
| Software | 3.0% |
| Auto Loan | 3.3% |
| Engineering & Construction | 3.7% |
| Institutional Financial Services | 3.8% |
| Oil & Gas Producers | 3.9% |
| Insurance | 4.2% |
| Agency Fixed Rate | 4.6% |
| Retail - Discretionary | 5.5% |
| Banking | 5.9% |
| Reit | 6.5% |
| Government Sponsored | 7.3% |
| Government Owned, No Guarantee | 9.8% |
| Electric Utilities | 11.4% |
Asset Weighting (% of total investments)
| Value | Value |
|---|
| Asset Backed Securities | 4.9% |
| Corporate Bonds | 64.7% |
| Municipal Bonds | 8.1% |
| U.S. Government & Agencies | 22.3% |
Top 10 Holdings* (% of net assets)
| Holding Name | % of Net Assets |
| JPMorgan Chase & Company, 6.070%, due 10/22/27 | 2.1% |
| Bank of America Corporation, 2.456%, due 10/22/25 | 2.0% |
| Morgan Stanley, 0.864%, due 10/21/25 | 2.0% |
| Federal National Mortgage Association, 6.250%, due 05/15/29 | 1.9% |
| Aflac, Inc., 1.125%, due 03/15/26 | 1.8% |
| CarMax Auto Owner Trust 2020-4, 1.300%, due 08/17/26 | 1.7% |
| Royal Bank of Canada, 1.150%, due 07/14/26 | 1.7% |
| MidAmerican Energy Company, 3.100%, due 05/1/27 | 1.7% |
| Nasdaq, Inc., 5.350%, due 06/28/28 | 1.7% |
| National Rural Utilities Cooperative Finance, 4.850%, due 02/7/29 | 1.7% |
* Does not include cash/money market funds/equivalents. Based on percentage of net assets. Holdings can change at any time, are subject to risks discussed in the Fund’s prospectus, and should not be considered investment advice.
No material changes occurred during the year ended June 30, 2024.
Eventide Limited-Term Bond Fund - Class C (ETCBX )
Annual Shareholder Report - June 30, 2024
Where can I find additional information about the Fund?
Additional information is available on the Fund's website ( https://www.eventidefunds.com ), including its:
Prospectus
Financial information
Holdings
Proxy voting information
Eventide Limited-Term Bond Fund
Annual Shareholder Report - June 30, 2024
This annual shareholder report contains important information about Eventide Limited-Term Bond Fund for the period of July 1, 2023 to June 30, 2024. You can find additional information about the Fund at https://www.eventidefunds.com. You can also request this information by contacting us at 1-877-771-3836.
What were the Fund’s costs for the last year?
(based on a hypothetical $10,000 investment)
| Class Name | Costs of a $10,000 investment | Costs paid as a percentage of a $10,000 investment |
|---|
| Class I | $55 | 0.55% |
How has the Fund performed over the last ten years?
Total Return Based on $10,000 Investment
| Eventide Limited-Term Bond Fund | Bloomberg U.S. 1-5 Year Government/Credit Index | Bloomberg U.S. Aggregate Bond Index |
|---|
| Jun-2014 | $10,000 | $10,000 | $10,000 |
| Jun-2015 | $9,998 | $10,131 | $10,186 |
| Jun-2016 | $10,263 | $10,398 | $10,797 |
| Jun-2017 | $10,250 | $10,409 | $10,763 |
| Jun-2018 | $10,223 | $10,388 | $10,720 |
| Jun-2019 | $10,725 | $10,943 | $11,564 |
| Jun-2020 | $11,216 | $11,537 | $12,575 |
| Jun-2021 | $11,289 | $11,583 | $12,533 |
| Jun-2022 | $10,610 | $10,981 | $11,243 |
| Jun-2023 | $10,765 | $11,002 | $11,137 |
| Jun-2024 | $11,341 | $11,515 | $11,430 |
The Fund's past performance is not a good predictor of how the Fund will perform in the future. The graph and table do not reflect the deduction of taxes that a shareholder would pay on fund distributions or redemption of fund shares. In connection with new SEC Rules on shareholder reporting, the Fund's performance information above is compared with a broad-based benchmark, Bloomberg US Aggregate Index, which represents the overall domestic bond market. In addition, the strategy benchmark, Bloomberg 1-5 Year Gov/Credit Index, is included as the adviser believes it is more representative of the fund's investment universe.
How did the Fund perform during the reporting period?
The Fund’s performance for the year ended June 30, 2024, was materially impacted by fluctuations of the yield curve and the performance of corporate bonds relative to treasuries. The Fund's investments outperformed its benchmark for the one-year period ended 6/30/24, which was primarily due to the Fund's allocation to corporate bonds. Short-term corporate bonds significantly outperformed short-term treasuries, and the Fund's corporate bond investments outperformed the performance of corporate bond allocations within the benchmark.
Average Annual Total Returns
| 1 Year | 5 Years | 10 Years |
|---|
| Eventide Limited-Term Bond Fund - Class I | 5.35% | 1.12% | 1.27% |
| Bloomberg U.S. 1-5 Year Government/Credit Index | 4.66% | 1.02% | 1.42% |
| Bloomberg U.S. Aggregate Bond Index | 2.63% | | 1.35% |
| Net Assets | $145,825,539 |
| Number of Portfolio Holdings | 96 |
| Advisory Fee (net of waivers) | $220,232 |
| Portfolio Turnover | 33% |
What did the Fund invest in?
Industry Weighting (% of net assets)
| Value | Value |
|---|
| Other Assets in Excess of Liabilities | 2.7% |
| Other Industries | 19.4% |
| Machinery | 2.3% |
| Single-Family Housing | 2.7% |
| Software | 3.0% |
| Auto Loan | 3.3% |
| Engineering & Construction | 3.7% |
| Institutional Financial Services | 3.8% |
| Oil & Gas Producers | 3.9% |
| Insurance | 4.2% |
| Agency Fixed Rate | 4.6% |
| Retail - Discretionary | 5.5% |
| Banking | 5.9% |
| Reit | 6.5% |
| Government Sponsored | 7.3% |
| Government Owned, No Guarantee | 9.8% |
| Electric Utilities | 11.4% |
Asset Weighting (% of total investments)
| Value | Value |
|---|
| Asset Backed Securities | 4.9% |
| Corporate Bonds | 64.7% |
| Municipal Bonds | 8.1% |
| U.S. Government & Agencies | 22.3% |
Top 10 Holdings* (% of net assets)
| Holding Name | % of Net Assets |
| JPMorgan Chase & Company, 6.070%, due 10/22/27 | 2.1% |
| Bank of America Corporation, 2.456%, due 10/22/25 | 2.0% |
| Morgan Stanley, 0.864%, due 10/21/25 | 2.0% |
| Federal National Mortgage Association, 6.250%, due 05/15/29 | 1.9% |
| Aflac, Inc., 1.125%, due 03/15/26 | 1.8% |
| CarMax Auto Owner Trust 2020-4, 1.300%, due 08/17/26 | 1.7% |
| Royal Bank of Canada, 1.150%, due 07/14/26 | 1.7% |
| MidAmerican Energy Company, 3.100%, due 05/1/27 | 1.7% |
| Nasdaq, Inc., 5.350%, due 06/28/28 | 1.7% |
| National Rural Utilities Cooperative Finance, 4.850%, due 02/7/29 | 1.7% |
* Does not include cash/money market funds/equivalents. Based on percentage of net assets. Holdings can change at any time, are subject to risks discussed in the Fund’s prospectus, and should not be considered investment advice.
No material changes occurred during the year ended June 30, 2024.
Eventide Limited-Term Bond Fund - Class I (ETIBX )
Annual Shareholder Report - June 30, 2024
Where can I find additional information about the Fund?
Additional information is available on the Fund's website ( https://www.eventidefunds.com ), including its:
Prospectus
Financial information
Holdings
Proxy voting information
Eventide Limited-Term Bond Fund
Annual Shareholder Report - June 30, 2024
This annual shareholder report contains important information about Eventide Limited-Term Bond Fund for the period of July 1, 2023 to June 30, 2024. You can find additional information about the Fund at https://www.eventidefunds.com. You can also request this information by contacting us at 1-877-771-3836.
What were the Fund’s costs for the last year?
(based on a hypothetical $10,000 investment)
| Class Name | Costs of a $10,000 investment | Costs paid as a percentage of a $10,000 investment |
|---|
| Class N | $75 | 0.75% |
How has the Fund performed since inception?
Total Return Based on $10,000 Investment
| Eventide Limited-Term Bond Fund | Bloomberg U.S. 1-5 Year Government/Credit Index | Bloomberg U.S. Aggregate Bond Index |
|---|
| Dec-2018 | $10,000 | $10,000 | $10,000 |
| Jun-2019 | $10,464 | $10,427 | $10,708 |
| Jun-2020 | $10,921 | $10,993 | $11,644 |
| Jun-2021 | $10,974 | $11,037 | $11,605 |
| Jun-2022 | $10,287 | $10,463 | $10,411 |
| Jun-2023 | $10,419 | $10,483 | $10,313 |
| Jun-2024 | $10,959 | $10,971 | $10,585 |
The Fund's past performance is not a good predictor of how the Fund will perform in the future. The graph and table do not reflect the deduction of taxes that a shareholder would pay on fund distributions or redemption of fund shares. In connection with new SEC Rules on shareholder reporting, the Fund's performance information above is compared with a broad-based benchmark, Bloomberg US Aggregate Index, which represents the overall domestic bond market. In addition, the strategy benchmark, Bloomberg 1-5 Year Gov/Credit Index, is included as the adviser believes it is more representative of the fund's investment universe.
How did the Fund perform during the reporting period?
The Fund’s performance for the year ended June 30, 2024, was materially impacted by fluctuations of the yield curve and the performance of corporate bonds relative to treasuries. The Fund's investments outperformed its benchmark for the one-year period ended 6/30/24, which was primarily due to the Fund's allocation to corporate bonds. Short-term corporate bonds significantly outperformed short-term treasuries, and the Fund's corporate bond investments outperformed the performance of corporate bond allocations within the benchmark.
Average Annual Total Returns
| 1 Year | 5 Years | Since Inception (December 14, 2018) |
|---|
| Eventide Limited-Term Bond Fund - Class N | 5.18% | 0.93% | 1.67% |
| Bloomberg U.S. 1-5 Year Government/Credit Index | 4.66% | 1.02% | 1.69% |
| Bloomberg U.S. Aggregate Bond Index | 2.63% | | 1.03% |
| Net Assets | $145,825,539 |
| Number of Portfolio Holdings | 96 |
| Advisory Fee (net of waivers) | $220,232 |
| Portfolio Turnover | 33% |
What did the Fund invest in?
Industry Weighting (% of net assets)
| Value | Value |
|---|
| Other Assets in Excess of Liabilities | 2.7% |
| Other Industries | 19.4% |
| Machinery | 2.3% |
| Single-Family Housing | 2.7% |
| Software | 3.0% |
| Auto Loan | 3.3% |
| Engineering & Construction | 3.7% |
| Institutional Financial Services | 3.8% |
| Oil & Gas Producers | 3.9% |
| Insurance | 4.2% |
| Agency Fixed Rate | 4.6% |
| Retail - Discretionary | 5.5% |
| Banking | 5.9% |
| Reit | 6.5% |
| Government Sponsored | 7.3% |
| Government Owned, No Guarantee | 9.8% |
| Electric Utilities | 11.4% |
Asset Weighting (% of total investments)
| Value | Value |
|---|
| Asset Backed Securities | 4.9% |
| Corporate Bonds | 64.7% |
| Municipal Bonds | 8.1% |
| U.S. Government & Agencies | 22.3% |
Top 10 Holdings* (% of net assets)
| Holding Name | % of Net Assets |
| JPMorgan Chase & Company, 6.070%, due 10/22/27 | 2.1% |
| Bank of America Corporation, 2.456%, due 10/22/25 | 2.0% |
| Morgan Stanley, 0.864%, due 10/21/25 | 2.0% |
| Federal National Mortgage Association, 6.250%, due 05/15/29 | 1.9% |
| Aflac, Inc., 1.125%, due 03/15/26 | 1.8% |
| CarMax Auto Owner Trust 2020-4, 1.300%, due 08/17/26 | 1.7% |
| Royal Bank of Canada, 1.150%, due 07/14/26 | 1.7% |
| MidAmerican Energy Company, 3.100%, due 05/1/27 | 1.7% |
| Nasdaq, Inc., 5.350%, due 06/28/28 | 1.7% |
| National Rural Utilities Cooperative Finance, 4.850%, due 02/7/29 | 1.7% |
* Does not include cash/money market funds/equivalents. Based on percentage of net assets. Holdings can change at any time, are subject to risks discussed in the Fund’s prospectus, and should not be considered investment advice.
No material changes occurred during the year ended June 30, 2024.
Eventide Limited-Term Bond Fund - Class N (ETNBX )
Annual Shareholder Report - June 30, 2024
Where can I find additional information about the Fund?
Additional information is available on the Fund's website ( https://www.eventidefunds.com ), including its:
Prospectus
Financial information
Holdings
Proxy voting information
(b) Not applicable
Item 2. Code of Ethics.
| (a) | The registrant has, as of the end of the period covered by this report, adopted a code of ethics that applies to the registrant’s principal executive officer, principal financial officer, and principal accounting officer or controller, or persons performing similar functions, regardless of whether these individuals are employed by the registrant or a third party. |
| | |
| (b) | N/A |
| | |
| (c) | During the period covered by this report, there were no amendments to any provision of the code of ethics. |
| | |
| (d) | During the period covered by this report, there were no waivers or implicit waivers of a provision of the code of ethics. |
| | |
| (e) | N/A |
| | |
| (f) | See Item 19(a)(1) |
Item 3. Audit Committee Financial Expert.
| | (a)(1) The registrant’s Board of Trustees has determined that it does not have an audit committee financial expert serving on its audit committee. At this time, the registrant believes that the experience provided by each member of the audit committee together offer the registrant adequate oversight for the registrant’s level of financial complexity. (a)(2) Not applicable. (a)(3) Not applicable. |
Item 4. Principal Accountant Fees and Services.
| (a) | Audit Fees. The aggregate fees billed for each of the last two fiscal years for professional services rendered by the registrant’s principal accountant for the audit of the registrant’s annual financial statements or services that are normally provided by the accountant in connection with statutory and regulatory filings or engagements for those fiscal years are as follows: |
| Trust Series | 2024 | 2023 |
| Eventide Gilead Fund | 33,500 | 30,000 |
| Eventide Dividend Opportunities Fund | 14,750 | 13,000 |
| Eventide Healthcare & Life Sciences Fund | 36,500 | 30,000 |
| Eventide Limited Term Bond Fund | 16,750 | 15,000 |
| Eventide Balanced Fund | 18,750 | 17,000 |
| Eventide Core Bond Fund | 14,750 | 13,000 |
| Eventide Exponential Technologies Fund | 14,750 | 13,000 |
| Eventide Large Cap Focus Fund | 14,750 | 13,000 |
| (b) | Audit-Related Fees. There were no fees billed in each of the last two fiscal years for assurances and related services by the principal accountant that are reasonably related to the performance of the audit of the registrant’s financial statements and are not reported under paragraph (a) of this Item. |
| | |
| (c) | Tax Fees. The aggregate fees billed in each of the last two fiscal years for professional services rendered by the principal accountant for tax compliance are as follows: |
| Trust Series | 2024 | 2023 |
| Eventide Gilead Fund | 3,250 | 3,000 |
| Eventide Dividend Opportunities Fund | 3,250 | 3,000 |
| Eventide Healthcare & Life Sciences Fund | 3,250 | 3,000 |
| Eventide Limited Term Bond Fund | 2,750 | 2,500 |
| Eventide Balanced Fund | 3,250 | 3,000 |
| Eventide Core Bond Fund | 2,750 | 2,500 |
| Eventide Exponential Technologies Fund | 2,750 | 2,500 |
| Eventide Large Cap Focus Fund | 3,250 | 3,000 |
Preparation of Federal & State income tax returns, assistance with calculation of required income, capital gain and excise distributions and preparation of Federal excise tax returns.
| (d) | All Other Fees. The aggregate fees billed in each of the last two fiscal years for products and services provided by the registrant’s principal accountant, other than the services reported in paragraphs (a) through (c) of this item were $0 and $0 for the fiscal years ended June 30, 2024 and 2023 respectively. |
| | |
| (e)(1) | The audit committee does not have pre-approval policies and procedures. Instead, the audit committee or audit committee chairman approves on a case-by-case basis each audit or non-audit service before the principal accountant is engaged by the registrant. |
| | |
| (e)(2) | There were no services described in each of paragraphs (b) through (d) of this Item that were approved by the audit committee pursuant to paragraph (c)(7)(i)(C) of Rule 2-01 of Regulation S-X. |
| | |
| (f) | Not applicable. |
| | |
| (g) | All non-audit fees billed by the registrant’s principal accountant for services rendered to the registrant for the fiscal years ended June 30, 2024 and 2023 respectively are disclosed in (b)-(d) above. There were no audit or non-audit services performed by the registrant’s principal accountant for the registrant’s adviser. |
| | |
| (h) | Not applicable. |
| | |
| (i) | Not applicable. |
| | |
| (j) | Not applicable. |
Item 5. Audit Committee of Listed Registrants.
Not applicable
Item 6. Investments.
The Registrant’s schedule of investments in unaffiliated issuers is included in the Financial Statements under Item 7 of this form.
Item 7. Financial Statements and Financial Highlights for Open-End Management Investment Companies.
(a)
| |
| |
| |
| |
| |
 |
| |
| |
| |
| |
| |
| ANNUAL |
| FINANCIAL STATEMENTS |
| |
| |
| |
| |
| |
| Eventide Balanced Fund |
| |
| Eventide Core Bond Fund |
| |
| Eventide Dividend Opportunities Fund |
| |
| Eventide Exponential Technologies Fund |
| |
| Eventide Gilead Fund |
| |
| Eventide Healthcare & Life Sciences Fund |
| |
| Eventide Large Cap Focus Fund |
| |
| Eventide Limited-Term Bond Fund |
| |
| |
| |
| |
| |
| June 30, 2024 |
| |
| |
| |
| |
| |
| Eventide Asset Management, LLC |
| One International Place |
| Suite 4210 |
| Boston, MA 02110 |
| |
| 1-877-771-3836 |
| EVENTIDE BALANCED FUND |
| SCHEDULE OF INVESTMENTS |
| June 30, 2024 |
| Shares | | | | | Fair Value | |
| | | | | COMMON STOCKS — 53.1% | | | | |
| | | | | AUTOMOTIVE - 0.3% | | | | |
| | 11,883 | | | Autoliv, Inc. | | $ | 1,271,362 | |
| | | | | | | | | |
| | | | | BANKING - 0.4% | | | | |
| | 40,085 | | | Synovus Financial Corporation | | | 1,611,016 | |
| | | | | | | | | |
| | | | | BIOTECH & PHARMA - 0.9% | | | | |
| | 129,347 | | | Royalty Pharma plc, Class A | | | 3,410,880 | |
| | | | | | | | | |
| | | | | CHEMICALS - 2.3% | | | | |
| | 19,298 | | | Cabot Corporation | | | 1,773,293 | |
| | 83,482 | | | Element Solutions, Inc. | | | 2,264,032 | |
| | 15,910 | | | Sherwin-Williams Company (The) | | | 4,748,021 | |
| | | | | | | | 8,785,346 | |
| | | | | COMMERCIAL SUPPORT SERVICES - 0.7% | | | | |
| | 55,421 | | | Rollins, Inc. | | | 2,703,991 | |
| | | | | | | | | |
| | | | | CONTAINERS & PACKAGING - 0.9% | | | | |
| | 81,010 | | | International Paper Company | | | 3,495,582 | |
| | | | | | | | | |
| | | | | DIVERSIFIED INDUSTRIALS - 1.3% | | | | |
| | 64,362 | | | Pentair PLC | | | 4,934,635 | |
| | | | | | | | | |
| | | | | ELECTRIC UTILITIES - 4.4% | | | | |
| | 24,634 | | | CMS Energy Corporation | | | 1,466,462 | |
| | 9,684 | | | Constellation Energy Corporation | | | 1,939,415 | |
| | 54,842 | | | Public Service Enterprise Group, Inc. | | | 4,041,855 | |
| | 16,084 | | | Sempra Energy | | | 1,223,349 | |
| | 39,206 | | | Southern Company (The) | | | 3,041,209 | |
| | 59,509 | | | Vistra Corporation | | | 5,116,584 | |
| | | | | | | | 16,828,874 | |
| | | | | ELECTRICAL EQUIPMENT - 6.3% | | | | |
| | 146,044 | | | nVent Electric PLC | | | 11,188,431 | |
| | 37,143 | | | Trane Technologies PLC | | | 12,217,446 | |
| | | | | | | | 23,405,877 | |
See accompanying notes to financial statements.
| EVENTIDE BALANCED FUND |
| SCHEDULE OF INVESTMENTS (Continued) |
| June 30, 2024 |
| Shares | | | | | Fair Value | |
| | | | | COMMON STOCKS — 53.1% (Continued) | | | | |
| | | | | HOME CONSTRUCTION - 1.4% | | | | |
| | 36,936 | | | DR Horton, Inc. | | $ | 5,205,391 | |
| | | | | | | | | |
| | | | | INDUSTRIAL REIT - 1.4% | | | | |
| | 30,997 | | | EastGroup Properties, Inc. | | | 5,272,590 | |
| | | | | | | | | |
| | | | | INDUSTRIAL SUPPORT SERVICES - 2.8% | | | | |
| | 16,260 | | | Applied Industrial Technologies, Inc. | | | 3,154,440 | |
| | 38,200 | | | Ferguson PLC | | | 7,397,429 | |
| | | | | | | | 10,551,869 | |
| | | | | INSTITUTIONAL FINANCIAL SERVICES - 1.6% | | | | |
| | 43,975 | | | Houlihan Lokey, Inc. | | | 5,930,469 | |
| | | | | | | | | |
| | | | | INSURANCE - 3.0% | | | | |
| | 38,335 | | | Arthur J Gallagher & Company | | | 9,940,648 | |
| | 10,153 | | | RLI Corporation | | | 1,428,426 | |
| | | | | | | | 11,369,074 | |
| | | | | MACHINERY - 0.4% | | | | |
| | 7,926 | | | IDEX Corporation | | | 1,594,711 | |
| | | | | | | | | |
| | | | | MEDICAL EQUIPMENT & DEVICES - 1.3% | | | | |
| | 22,603 | | | STERIS plc | | | 4,962,263 | |
| | | | | | | | | |
| | | | | OIL & GAS PRODUCERS - 4.8% | | | | |
| | 92,367 | | | Coterra Energy, Inc. | | | 2,463,428 | |
| | 7,503 | | | Diamondback Energy, Inc. | | | 1,502,026 | |
| | 58,674 | | | Targa Resources Corporation | | | 7,556,037 | |
| | 156,721 | | | Williams Companies, Inc. (The) | | | 6,660,643 | |
| | | | | | | | 18,182,134 | |
| | | | | RESIDENTIAL REIT - 1.3% | | | | |
| | 23,326 | | | AvalonBay Communities, Inc. | | | 4,825,916 | |
| | | | | | | | | |
| | | | | RETAIL - DISCRETIONARY - 1.7% | | | | |
| | 6,532 | | | Group 1 Automotive, Inc. | | | 1,941,833 | |
| | 7,787 | | | Lithia Motors, Inc. | | | 1,965,828 | |
See accompanying notes to financial statements.
| EVENTIDE BALANCED FUND |
| SCHEDULE OF INVESTMENTS (Continued) |
| June 30, 2024 |
| Shares | | | | | Fair Value | |
| | | | | COMMON STOCKS — 53.1% (Continued) | | | | |
| | | | | RETAIL - DISCRETIONARY - 1.7% (Continued) | | | | |
| | 12,313 | | | Lowe’s Companies, Inc. | | $ | 2,714,525 | |
| | | | | | | | 6,622,186 | |
| | | | | SEMICONDUCTORS - 2.9% | | | | |
| | 10,411 | | | KLA Corporation | | | 8,583,973 | |
| | 2,142 | | | Lam Research Corporation | | | 2,280,909 | |
| | | | | | | | 10,864,882 | |
| | | | | SOFTWARE - 4.0% | | | | |
| | 17,360 | | | Roper Technologies, Inc. | | | 9,785,138 | |
| | 9,291 | | | Synopsys, Inc.(a) | | | 5,528,702 | |
| | | | | | | | 15,313,840 | |
| | | | | SPECIALTY REITS - 1.4% | | | | |
| | 59,101 | | | Iron Mountain, Inc. | | | 5,296,631 | |
| | | | | | | | | |
| | | | | TECHNOLOGY HARDWARE - 1.1% | | | | |
| | 33,175 | | | NetApp, Inc. | | | 4,272,940 | |
| | | | | | | | | |
| | | | | TECHNOLOGY SERVICES - 4.3% | | | | |
| | 39,481 | | | CDW Corporation | | | 8,837,427 | |
| | 6,341 | | | MSCI, Inc. | | | 3,054,777 | |
| | 16,070 | | | Verisk Analytics, Inc. | | | 4,331,669 | |
| | | | | | | | 16,223,873 | |
| | | | | TRANSPORTATION & LOGISTICS - 1.2% | | | | |
| | 26,576 | | | Old Dominion Freight Line, Inc. | | | 4,693,322 | |
| | | | | | | | | |
| | | | | WHOLESALE - CONSUMER STAPLES - 0.5% | | | | |
| | 26,127 | | | Sysco Corporation | | | 1,865,207 | |
| | | | | | | | | |
| | | | | WHOLESALE - DISCRETIONARY - 0.5% | | | | |
| | 6,101 | | | Pool Corporation | | | 1,875,020 | |
| | | | | | | | | |
| | | | | TOTAL COMMON STOCKS (Cost $148,526,989) | | | 201,369,881 | |
See accompanying notes to financial statements.
| EVENTIDE BALANCED FUND |
| SCHEDULE OF INVESTMENTS (Continued) |
| June 30, 2024 |
| Principal | | | | | | | Coupon Rate | | | | | |
| Amount ($) | | | | | Spread | | (%) | | Maturity | | Fair Value | |
| | | | | ASSET BACKED SECURITIES — 1.6% | | | | | | | | | | |
| | | | | AUTO LOAN — 1.0% | | | | | | | | | | |
| | 3,150,000 | | | CarMax Auto Owner Trust Series 2020-4 C | | | | 1.3000 | | 08/17/26 | | $ | 3,084,294 | |
| | 750,000 | | | CarMax Auto Owner Trust Series 2021-2 C | | | | 1.3400 | | 02/16/27 | | | 719,920 | |
| | | | | | | | | | | | | | 3,804,214 | |
| | | | | | | | | | | | | | | |
| | | | | OTHER ABS — 0.6% | | | | | | | | | | |
| | 2,250,000 | | | PFS Financing Corporation Series C A(b),(f) | | SOFR30A + 0.800% | | 6.1330 | | 04/17/28 | | | 2,253,916 | |
| | | | | | | | | | | | | | | |
| | | | | TOTAL ASSET BACKED SECURITIES (Cost $6,160,872) | | | | | | | | | 6,058,130 | |
| | | | | | | | | | | | | | | |
| Principal | | | | | | | Coupon Rate | | | | | | |
| Amount ($) | | | | | | | (%) | | Maturity | | Fair Value | |
| | | | | COLLATERALIZED MORTGAGE OBLIGATIONS — 0.5% | | | | | | | | | | |
| | | | | CMBS — 0.5% | | | | | | | | | | |
| | | | | | | | | | | | | | | |
| | 1,000,000 | | | Freddie Mac Multifamily Structured Pass Through Certificates Series KG01 A10 | | | | 2.9390 | | 04/25/29 | | | 924,024 | |
| | 1,000,000 | | | Freddie Mac Multifamily Structured Pass Through Certificates Series KG02 A2 | | | | 2.4120 | | 08/25/29 | | | 899,974 | |
| | | | | | | | | | | | | | 1,823,998 | |
| | | | | | | | | | | | | | | |
| | | | | TOTAL COLLATERALIZED MORTGAGE OBLIGATIONS (Cost $2,031,993) | | | | | | | | | 1,823,998 | |
| | | | | | | | | | | | | | | |
| Principal | | | | | | | Coupon Rate | | | | | | |
| Amount ($) | | | | | | | (%) | | Maturity | | Fair Value | |
| | | | | CONVERTIBLE BONDS — 0.3% | | | | | | | | | | |
| | | | | BIOTECH & PHARMA — 0.3% | | | | | | | | | | |
| | 950,000 | | | Mirium Pharmaceuticals, Inc. | | | | 4.0000 | | 05/01/29 | | | 1,277,156 | |
| | | | | | | | | | | | | | | |
| | | | | TOTAL CONVERTIBLE BONDS (Cost $1,068,522) | | | | | | | | | 1,277,156 | |
| | | | | | | | | | | | | | | |
| | Principal | | | | | | | Coupon Rate | | | | | | |
| Amount ($) | | | | | Spread | | (%) | | Maturity | | Fair Value | |
| | | | | CORPORATE BONDS — 20.6% | | | | | | | | | | |
| | | | | ASSET MANAGEMENT — 1.0% | | | | | | | | | | |
| | 3,800,000 | | | Vision Fund International(c),(d),(e) | | | | 3.7250 | | 02/24/25 | | | 3,739,496 | |
| | | | | | | | | | | | | | | |
| | | | | AUTOMOTIVE — 0.5% | | | | | | | | | | |
| | 2,025,000 | | | Dana, Inc. | | | | 4.2500 | | 09/01/30 | | | 1,769,409 | |
See accompanying notes to financial statements.
| EVENTIDE BALANCED FUND |
| SCHEDULE OF INVESTMENTS (Continued) |
| June 30, 2024 |
| Principal | | | | | | | Coupon Rate | | | | | |
| Amount ($) | | | | | Spread | | (%) | | Maturity | | Fair Value | |
| | | | | CORPORATE BONDS — 20.6% (Continued) | | | | | | | | | | |
| | | | | BANKING — 1.9% | | | | | | | | | | |
| | 3,725,000 | | | Bank of America Corporation Series N(f) | | TSFR3M + 1.132% | | 2.4560 | | 10/22/25 | | $ | 3,686,669 | |
| | 3,200,000 | | | JPMorgan Chase & Company(f) | | SOFRRATE + 1.330% | | 6.0700 | | 10/22/27 | | | 3,256,708 | |
| | | | | | | | | | | | | | 6,943,377 | |
| | | | | | | | | | | | | | | |
| | | | | COMMERCIAL SUPPORT SERVICES — 0.5% | | | | | | | | | | |
| | 1,790,000 | | | Waste Management, Inc. | | | | 4.9500 | | 07/03/31 | | | 1,777,516 | |
| | | | | | | | | | | | | | | |
| | | | | CONSTRUCTION MATERIALS — 0.4% | | | | | | | | | | |
| | 1,300,000 | | | Advanced Drainage Systems, Inc.(b) | | | | 5.0000 | | 09/30/27 | | | 1,272,856 | |
| | | | | | | | | | | | | | | |
| | | | | CONTAINERS & PACKAGING — 0.2% | | | | | | | | | | |
| | 1,000,000 | | | TriMas Corporation(b) | | | | 4.1250 | | 04/15/29 | | | 917,083 | |
| | | | | | | | | | | | | | | |
| | | | | ELEC & GAS MARKETING & TRADING — 0.2% | | | | | | | | | | |
| | 1,000,000 | | | Southern Power Company | | | | 0.9000 | | 01/15/26 | | | 932,513 | |
| | | | | | | | | | | | | | | |
| | | | | ELECTRIC UTILITIES — 3.3% | | | | | | | | | | |
| | 1,235,000 | | | AES Corporation (The) | | | | 1.3750 | | 01/15/26 | | | 1,157,743 | |
| | 1,750,000 | | | Constellation Energy Generation, LLC | | | | 6.1250 | | 01/15/34 | | | 1,827,195 | |
| | 1,000,000 | | | Duke Energy Florida, LLC | | | | 2.5000 | | 12/01/29 | | | 883,493 | |
| | 1,000,000 | | | MidAmerican Energy Company | | | | 3.1000 | | 05/01/27 | | | 954,411 | |
| | 3,475,000 | | | National Rural Utilities Cooperative Finance Corporation | | | | 1.3500 | | 03/15/31 | | | 2,726,686 | |
| | 3,600,000 | | | NextEra Energy Capital Holdings, Inc. | | | | 1.9000 | | 06/15/28 | | | 3,185,933 | |
| | 2,000,000 | | | Wisconsin Power and Light Company | | | | 1.9500 | | 09/16/31 | | | 1,604,366 | |
| | | | | | | | | | | | | | 12,339,827 | |
| | | | | ENGINEERING & CONSTRUCTION — 1.2% | | | | | | | | | | |
| | 1,435,000 | | | Installed Building Products, Inc.(b) | | | | 5.7500 | | 02/01/28 | | | 1,404,669 | |
| | 1,750,000 | | | MasTec, Inc.(b) | | | | 4.5000 | | 08/15/28 | | | 1,670,558 | |
| | 2,000,000 | | | Quanta Services, Inc. | | | | 2.9000 | | 10/01/30 | | | 1,764,674 | |
| | | | | | | | | | | | | | 4,839,901 | |
| | | | | FORESTRY, PAPER & WOOD PRODUCTS — 0.2% | | | | | | | | | | |
| | 1,000,000 | | | Louisiana-Pacific Corporation(b) | | | | 3.6250 | | 03/15/29 | | | 908,322 | |
See accompanying notes to financial statements.
| EVENTIDE BALANCED FUND |
| SCHEDULE OF INVESTMENTS (Continued) |
| June 30, 2024 |
| Principal | | | | | | | Coupon Rate | | | | | |
| Amount ($) | | | | | Spread | | (%) | | Maturity | | Fair Value | |
| | | | | CORPORATE BONDS — 20.6% (Continued) | | | | | | | | | | |
| | | | | HOME & OFFICE PRODUCTS — 0.5% | | | | | | | | | | |
| | 1,910,000 | | | Tempur Sealy International, Inc.(b) | | | | 4.0000 | | 04/15/29 | | $ | 1,725,273 | |
| | | | | | | | | | | | | | | |
| | | | | HOME CONSTRUCTION — 0.4% | | | | | | | | | | |
| | 1,750,000 | | | M/I Homes, Inc. | | | | 3.9500 | | 02/15/30 | | | 1,562,033 | |
| | | | | | | | | | | | | | | |
| | | | | INDUSTRIAL SUPPORT SERVICES — 0.4% | | | | | | | | | | |
| | 1,700,000 | | | United Rentals North America, Inc. | | | | 4.8750 | | 01/15/28 | | | 1,648,977 | |
| | | | | | | | | | | | | | | |
| | | | | INSTITUTIONAL FINANCIAL SERVICES — 1.3% | | | | | | | | | | |
| | 3,875,000 | | | Morgan Stanley(f) | | SOFRRATE + 0.745% | | 0.8640 | | 10/21/25 | | | 3,815,426 | |
| | 1,000,000 | | | Nasdaq, Inc. | | | | 5.3500 | | 06/28/28 | | | 1,009,951 | |
| | | | | | | | | | | | | | 4,825,377 | |
| | | | | INSURANCE — 0.9% | | | | | | | | | | |
| | 1,015,000 | | | Aflac, Inc. | | | | 1.1250 | | 03/15/26 | | | 948,148 | |
| | 500,000 | | | Brown & Brown, Inc. | | | | 4.5000 | | 03/15/29 | | | 482,571 | |
| | 2,000,000 | | | Pacific Life Global Funding II(b) | | | | 1.3750 | | 04/14/26 | | | 1,868,936 | |
| | | | | | | | | | | | | | 3,299,655 | |
| | | | | MACHINERY — 0.9% | | | | | | | | | | |
| | 1,750,000 | | | Mueller Water Products, Inc.(b) | | | | 4.0000 | | 06/15/29 | | | 1,603,951 | |
| | 1,875,000 | | | Xylem, Inc. | | | | 1.9500 | | 01/30/28 | | | 1,684,165 | |
| | | | | | | | | | | | | | 3,288,116 | |
| | | | | OIL & GAS PRODUCERS — 1.1% | | | | | | | | | | |
| | 2,325,000 | | | Cheniere Energy Partners, L.P. | | | | 4.5000 | | 10/01/29 | | | 2,216,416 | |
| | 1,750,000 | | | Diamondback Energy, Inc. | | | | 3.5000 | | 12/01/29 | | | 1,615,590 | |
| | 500,000 | | | Diamondback Energy, Inc. | | | | 5.1500 | | 01/30/30 | | | 497,821 | |
| | | | | | | | | | | | | | 4,329,827 | |
| | | | | REAL ESTATE INVESTMENT TRUSTS — 1.4% | | | | | | | | | | |
| | 1,750,000 | | | American Tower Corporation | | | | 4.0500 | | 03/15/32 | | | 1,603,641 | |
| | 1,000,000 | | | AvalonBay Communities, Inc. | | | | 2.0500 | | 01/15/32 | | | 820,130 | |
| | 1,750,000 | | | HAT Holdings I, LLC / HAT Holdings II, LLC(b) | | | | 3.3750 | | 06/15/26 | | | 1,652,828 | |
| | 1,500,000 | | | Welltower OP, LLC | | | | 2.7000 | | 02/15/27 | | | 1,414,265 | |
| | | | | | | | | | | | | | 5,490,864 | |
See accompanying notes to financial statements.
| EVENTIDE BALANCED FUND |
| SCHEDULE OF INVESTMENTS (Continued) |
| June 30, 2024 |
| Principal | | | | | | | Coupon Rate | | | | | |
| Amount ($) | | | | | Spread | | (%) | | Maturity | | Fair Value | |
| | | | | CORPORATE BONDS — 20.6% (Continued) | | | | | | | | | | |
| | | | | RETAIL - DISCRETIONARY — 1.3% | | | | | | | | | | |
| | 1,250,000 | | | Asbury Automotive Group, Inc. | | | | 4.5000 | | 03/01/28 | | $ | 1,186,165 | |
| | 1,450,000 | | | Builders FirstSource, Inc.(b) | | | | 4.2500 | | 02/01/32 | | | 1,283,193 | |
| | 1,600,000 | | | Home Depot, Inc. (The) | | | | 4.8750 | | 06/25/27 | | | 1,597,497 | |
| | 1,000,000 | | | Patrick Industries, Inc.(b) | | | | 7.5000 | | 10/15/27 | | | 1,011,028 | |
| | | | | | | | | | | | | | 5,077,883 | |
| | | | | SEMICONDUCTORS — 1.4% | | | | | | | | | | |
| | 1,185,000 | | | Amkor Technology, Inc.(b) | | | | 6.6250 | | 09/15/27 | | | 1,189,005 | |
| | 2,800,000 | | | NXP BV / NXP Funding, LLC / NXP USA, Inc. | | | | 2.5000 | | 05/11/31 | | | 2,352,064 | |
| | 1,925,000 | | | Synaptics, Inc.(b) | | | | 4.0000 | | 06/15/29 | | | 1,747,588 | |
| | | | | | | | | | | | | | 5,288,657 | |
| | | | | SOFTWARE — 0.6% | | | | | | | | | | |
| | 1,250,000 | | | Roper Technologies, Inc. | | | | 4.2000 | | 09/15/28 | | | 1,209,362 | |
| | 1,250,000 | | | Workday, Inc. | | | | 3.8000 | | 04/01/32 | | | 1,125,698 | |
| | | | | | | | | | | | | | 2,335,060 | |
| | | | | TECHNOLOGY SERVICES — 0.4% | | | | | | | | | | |
| | 1,500,000 | | | Verisk Analytics, Inc. | | | | 5.7500 | | 04/01/33 | | | 1,544,508 | |
| | | | | | | | | | | | | | | |
| | | | | WHOLESALE - CONSUMER STAPLES — 0.6% | | | | | | | | | | |
| | 2,775,000 | | | Sysco Corporation | | | | 2.4000 | | 02/15/30 | | | 2,407,486 | |
| | | | | | | | | | | | | | | |
| | | | | TOTAL CORPORATE BONDS (Cost $83,464,364) | | | | | | | | | 78,264,016 | |
| | | | | | | | | | | | | | | |
| Principal | | | | | | | Coupon Rate | | | | | | |
| Amount ($) | | | | | | | (%) | | Maturity | | Fair Value | |
| | | | | MUNICIPAL BONDS — 4.3% | | | | | | | | | | |
| | | | | COMBINED UTILITIES — 0.4% | | | | | | | | | | |
| | 1,475,000 | | | City of Tacoma, WA Electric System Revenue | | | | 5.6410 | | 01/01/27 | | | 1,489,643 | |
| | | | | | | | | | | | | | | |
| | | | | COUNTY — 0.0%(g) | | | | | | | | | | |
| | 150,000 | | | City & County of Honolulu, HI | | | | 2.5180 | | 10/01/26 | | | 142,629 | |
| | | | | | | | | | | | | | | |
| | | | | MISCELLANEOUS TAX — 0.5% | | | | | | | | | | |
| | 2,050,000 | | | Commonwealth of Massachusetts | | | | 3.6390 | | 07/15/24 | | | 2,048,552 | |
See accompanying notes to financial statements.
| EVENTIDE BALANCED FUND |
| SCHEDULE OF INVESTMENTS (Continued) |
| June 30, 2024 |
| Principal | | | | | Coupon Rate | | | | | |
| Amount ($) | | | | | (%) | | Maturity | | Fair Value | |
| | | | | MUNICIPAL BONDS — 4.3% (Continued) | | | | | | | | |
| | | | | MULTI-FAMILY HOUSING — 0.0%(g) | | | | | | | | |
| | 100,000 | | | New York State Housing Finance Agency | | 0.6500 | | 05/01/25 | | $ | 97,091 | |
| | | | | | | | | | | | | |
| | | | | RESOURCE RECOVERY — 0.0%(g) | | | | | | | | |
| | 100,000 | | | City of Napa, CA Solid Waste Revenue | | 2.3300 | | 08/01/25 | | | 96,970 | |
| | | | | | | | | | | | | |
| | | | | SINGLE-FAMILY HOUSING — 2.7% | | | | | | | | |
| | 1,700,000 | | | Florida Housing Finance Corporation | | 5.5610 | | 07/01/49 | | | 1,619,617 | |
| | 500,000 | | | Illinois Housing Development Authority | | 5.2440 | | 04/01/31 | | | 504,192 | |
| | 500,000 | | | Illinois Housing Development Authority | | 5.2940 | | 10/01/31 | | | 504,404 | |
| | 2,325,000 | | | Massachusetts Housing Finance Agency | | 5.8360 | | 12/01/42 | | | 2,305,529 | |
| | 2,250,000 | | | Minnesota Housing Finance Agency | | 5.5880 | | 07/01/39 | | | 2,248,801 | |
| | 1,715,000 | | | Virginia Housing Development Authority | | 4.9140 | | 04/01/30 | | | 1,706,878 | |
| | 1,000,000 | | | Virginia Housing Development Authority | | 5.6620 | | 10/01/39 | | | 996,084 | |
| | | | | | | | | | | | 9,885,505 | |
| | | | | STATE — 0.2% | | | | | | | | |
| | 200,000 | | | State of Oregon | | 0.8950 | | 05/01/25 | | | 193,018 | |
| | 500,000 | | | State of Oregon | | 1.3150 | | 05/01/27 | | | 454,900 | |
| | | | | | | | | | | | 647,918 | |
| | | | | WATER AND SEWER — 0.5% | | | | | | | | |
| | 2,000,000 | | | City of Aurora, CO Water Revenue | | 2.0980 | | 08/01/34 | | | 1,586,884 | |
| | 200,000 | | | City of Los Angeles, CA Wastewater System Revenue | | 3.6940 | | 06/01/32 | | | 184,835 | |
| | | | | | | | | | | | 1,771,719 | |
| | | | | | | | | | | | | |
| | | | | TOTAL MUNICIPAL BONDS (Cost $16,960,504) | | | | | | | 16,180,027 | |
| | | | | | | | | | | | | |
| Principal | | | | | Coupon Rate | | | | | | |
| Amount ($) | | | | | (%) | | Maturity | | Fair Value | |
| | | | | U.S. GOVERNMENT & AGENCIES — 17.9% | | | | | | | | |
| | | | | AGENCY FIXED RATE — 12.7% | | | | | | | | |
| | 152,085 | | | Fannie Mae Pool MA2915 | | 3.0000 | | 02/01/27 | | | 147,968 | |
| | 759,442 | | | Fannie Mae Pool MA4263 | | 1.5000 | | 02/01/31 | | | 694,553 | |
| | 585,733 | | | Fannie Mae Pool FM3333 | | 2.0000 | | 06/01/35 | | | 519,553 | |
| | 434,152 | | | Fannie Mae Pool MA4095 | | 2.0000 | | 08/01/35 | | | 385,096 | |
See accompanying notes to financial statements.
| EVENTIDE BALANCED FUND |
| SCHEDULE OF INVESTMENTS (Continued) |
| June 30, 2024 |
| Principal | | | | | Coupon Rate | | | | | |
| Amount ($) | | | | | (%) | | Maturity | | Fair Value | |
| | | | | U.S. GOVERNMENT & AGENCIES — 17.9% (Continued) | | | | | | | | |
| | | | | AGENCY FIXED RATE — 12.7% (Continued) | | | | | | | | |
| | 410,095 | | | Fannie Mae Pool BM5466 | | 2.5000 | | 10/01/43 | | $ | 348,471 | |
| | 382,085 | | | Fannie Mae Pool BM5975 | | 3.0000 | | 12/01/45 | | | 337,810 | |
| | 340,335 | | | Fannie Mae Pool MA2806 | | 3.0000 | | 11/01/46 | | | 297,142 | |
| | 353,875 | | | Fannie Mae Pool BM5976 | | 3.0000 | | 02/01/47 | | | 312,936 | |
| | 1,250,514 | | | Fannie Mae Pool MA4096 | | 2.5000 | | 08/01/50 | | | 1,033,992 | |
| | 1,631,259 | | | Fannie Mae Pool MA4327 | | 3.0000 | | 05/01/51 | | | 1,400,910 | |
| | 2,836,101 | | | Fannie Mae Pool MA4355 | | 2.0000 | | 06/01/51 | | | 2,235,932 | |
| | 1,738,857 | | | Fannie Mae Pool MA4356 | | 2.5000 | | 06/01/51 | | | 1,433,624 | |
| | 2,104,012 | | | Fannie Mae Pool MA4379 | | 2.5000 | | 07/01/51 | | | 1,734,132 | |
| | 3,311,801 | | | Fannie Mae Pool CB2661 | | 3.0000 | | 01/01/52 | | | 2,848,105 | |
| | 3,237,193 | | | Fannie Mae Pool MA4600 | | 3.5000 | | 05/01/52 | | | 2,874,049 | |
| | 3,053,204 | | | Fannie Mae Pool MA4625 | | 3.5000 | | 06/01/52 | | | 2,710,705 | |
| | 3,134,482 | | | Fannie Mae Pool MA4655 | | 4.0000 | | 07/01/52 | | | 2,874,680 | |
| | 3,163,683 | | | Fannie Mae Pool MA4805 | | 4.5000 | | 11/01/52 | | | 2,990,334 | |
| | 3,092,399 | | | Fannie Mae Pool MA4869 | | 5.5000 | | 01/01/53 | | | 3,060,978 | |
| | 3,374,501 | | | Fannie Mae Pool MA4916 | | 4.0000 | | 02/01/53 | | | 3,095,152 | |
| | 642,039 | | | Freddie Mac Pool ZS9163 | | 3.0000 | | 09/01/33 | | | 601,701 | |
| | 605,698 | | | Freddie Mac Pool ZS9382 | | 3.0000 | | 09/01/43 | | | 535,696 | |
| | 1,263,001 | | | Freddie Mac Pool SD8122 | | 2.5000 | | 01/01/51 | | | 1,043,774 | |
| | 1,801,591 | | | Freddie Mac Pool RA5696 | | 2.5000 | | 08/01/51 | | | 1,483,568 | |
| | 2,858,094 | | | Freddie Mac Pool SD8214 | | 3.5000 | | 05/01/52 | | | 2,537,281 | |
| | 2,747,352 | | | Freddie Mac Pool SD8238 | | 4.5000 | | 08/01/52 | | | 2,595,811 | |
| | 3,254,553 | | | Freddie Mac Pool SD8288 | | 5.0000 | | 01/01/53 | | | 3,155,564 | |
| | 1,906,000 | | | Freddie Mac Pool SD3026 | | 5.0000 | | 06/01/53 | | | 1,851,288 | |
| | 2,701,915 | | | Freddie Mac Pool SD8332 | | 6.0000 | | 06/01/53 | | | 2,718,583 | |
| | 316,808 | | | Ginnie Mae II Pool MA3375 | | 3.0000 | | 01/20/46 | | | 281,257 | |
| | | | | | | | | | | | 48,140,645 | |
| | | | | GOVERNMENT OWNED, NO GUARANTEE — 2.9% | | | | | | | | |
| | 1,350,000 | | | Federal Home Loan Mortgage Corporation | | 5.2500 | | 12/09/24 | | | 1,347,497 | |
| | 2,250,000 | | | Federal Home Loan Mortgage Corporation | | 5.5000 | | 04/08/27 | | | 2,245,886 | |
| | 1,500,000 | | | Federal Home Loan Mortgage Corporation | | 5.0000 | | 09/18/28 | | | 1,491,443 | |
| | 2,500,000 | | | Federal Home Loan Mortgage Corporation | | 6.2500 | | 07/15/32 | | | 2,804,507 | |
| | 2,900,000 | | | Federal National Mortgage Association | | 6.2500 | | 05/15/29 | | | 3,136,873 | |
| | | | | | | | | | | | 11,026,206 | |
See accompanying notes to financial statements.
| EVENTIDE BALANCED FUND |
| SCHEDULE OF INVESTMENTS (Continued) |
| June 30, 2024 |
| Principal | | | | | Coupon Rate | | | | | |
| Amount ($) | | | | | (%) | | Maturity | | Fair Value | |
| | | | | U.S. GOVERNMENT & AGENCIES — 17.9% (Continued) | | | | | | | | |
| | | | | GOVERNMENT SPONSORED — 2.3% | | | | | | | | |
| | 2,250,000 | | | Federal Farm Credit Banks Funding Corporation | | 5.2300 | | 05/20/26 | | $ | 2,250,071 | |
| | 1,750,000 | | | Federal Farm Credit Banks Funding Corporation | | 4.3750 | | 02/28/28 | | | 1,743,707 | |
| | 2,750,000 | | | Federal Farm Credit Banks Funding Corporation | | 4.6250 | | 04/05/29 | | | 2,778,826 | |
| | 2,000,000 | | | Federal Farm Credit Banks Funding Corporation | | 4.3750 | | 03/03/33 | | | 1,964,524 | |
| | | | | | | | | | | | 8,737,128 | |
| | | | | TOTAL U.S. GOVERNMENT & AGENCIES (Cost $72,567,556) | | | | | | | 67,903,979 | |
| | | | | | | | | | | | | |
| Shares | | | | | | | | | Fair Value | |
| | | | | SHORT-TERM INVESTMENTS — 0.0% (g) | | | | | | | | |
| | | | | MONEY MARKET FUNDS - 0.0% (g) | | | | | | | | |
| | 111,291 | | | Fidelity Money Market Government Portfolio Class I, 5.20% (Cost $111,291)(h) | | | | | | | 111,291 | |
| | | | | | | | | | | | | |
| | | | | TOTAL INVESTMENTS – 98.3% (Cost $330,892,091) | | | | | | $ | 372,988,478 | |
| | | | | OTHER ASSETS IN EXCESS OF LIABILITIES – 1.7% | | | | | | | 6,531,305 | |
| | | | | NET ASSETS - 100.0% | | | | | | $ | 379,519,782 | |
| LLC | - Limited Liability Company |
| | |
| LP | - Limited Partnership |
| | |
| MSCI | - Morgan Stanley Capital International |
| | |
| PLC | - Public Limited Company |
| | |
| REIT | - Real Estate Investment Trust |
| | |
| SOFR30A | United States 30 Day Average SOFR Secured Overnight Financing Rate |
| | |
| SOFRRATE | United States SOFR Secured Overnight Financing Rate |
| | |
| TSFR3M | CME Term SOFR 3 Month |
| (a) | Non-income producing security. |
| (b) | Security exempt from registration under Rule 144A or Section 4(2) of the Securities Act of 1933. The security may be resold in transactions exempt from registration, normally to qualified institutional buyers. As of June 30, 2024 the total market value of 144A securities is $20,509,206 or 5.4% of net assets. |
| (c) | Illiquid security. The total fair value of these securities as of June 30, 2024 was $3,739,496, representing 1.0% of net assets. |
| (d) | Restricted security. See Note 6 for additional details. |
| (f) | Variable or floating rate security, the interest rate of which adjusts periodically based on changes in current interest rates and prepayments on the underlying pool of assets. |
| (g) | Percentage rounds to less than 0.1%. |
| (h) | Rate disclosed is the seven day effective yield as of June 30, 2024. |
See accompanying notes to financial statements.
| EVENTIDE CORE BOND FUND |
| SCHEDULE OF INVESTMENTS |
| June 30, 2024 |
| Principal | | | | | | | Coupon Rate | | | | | |
| Amount ($) | | | | | Spread | | (%) | | Maturity | | Fair Value | |
| | | | | ASSET BACKED SECURITIES — 3.0% | | | | | | | | | | |
| | | | | AUTO LOAN — 1.7% | | | | | | | | | | |
| | 1,375,000 | | | CarMax Auto Owner Trust 2020-4 C | | | | 1.3000 | | 08/17/26 | | $ | 1,346,319 | |
| | 1,000,000 | | | CarMax Auto Owner Trust 2021-2 C | | | | 1.3400 | | 02/16/27 | | | 959,894 | |
| | | | | | | | | | | | | | 2,306,213 | |
| | | | | OTHER ABS — 1.3% | | | | | | | | | | |
| | 1,775,000 | | | PFS Financing Corporation Series C A(a),(b) | | SOFR30A + 0.800% | | 6.1330 | | 04/17/28 | | | 1,778,089 | |
| | | | | | | | | | | | | | | |
| | | | | TOTAL ASSET BACKED SECURITIES (Cost $4,156,473) | | | | | | | | | 4,084,302 | |
| | | | | | | | | | | | | | | |
| Principal | | | | | | | Coupon Rate | | | | | | |
| Amount ($) | | | | | Spread | | (%) | | Maturity | | Fair Value | |
| | | | | CORPORATE BONDS — 45.3% | | | | | | | | | | |
| | | | | AUTOMOTIVE — 0.3% | | | | | | | | | | |
| | 500,000 | | | Dana, Inc. | | | | 4.2500 | | 09/01/30 | | | 436,891 | |
| | | | | | | | | | | | | | | |
| | | | | BANKING — 3.0% | | | | | | | | | | |
| | 1,700,000 | | | Bank of America Corporation Series N(b) | | TSFR3M + 1.132% | | 2.4560 | | 10/22/25 | | | 1,682,507 | |
| | 2,500,000 | | | JPMorgan Chase & Company(b) | | SOFRRATE + 1.330% | | 6.0700 | | 10/22/27 | | | 2,544,302 | |
| | | | | | | | | | | | | | 4,226,809 | |
| | | | | BIOTECH & PHARMA — 1.2% | | | | | | | | | | |
| | 1,750,000 | | | Zoetis, Inc. | | | | 3.9000 | | 08/20/28 | | | 1,672,227 | |
| | | | | | | | | | | | | | | |
| | | | | COMMERCIAL SUPPORT SERVICES — 1.2% | | | | | | | | | | |
| | 1,700,000 | | | Waste Management, Inc. | | | | 4.9500 | | 07/03/31 | | | 1,688,143 | |
| | | | | | | | | | | | | | | |
| | | | | ELECTRIC UTILITIES — 11.7% | | | | | | | | | | |
| | 1,000,000 | | | AES Corporation (The) | | | | 5.4500 | | 06/01/28 | | | 998,853 | |
| | 1,750,000 | | | Ameren Illinois Company | | | | 5.9000 | | 12/01/52 | | | 1,815,656 | |
| | 1,750,000 | | | Constellation Energy Generation, LLC | | | | 5.7500 | | 03/15/54 | | | 1,706,303 | |
| | 2,250,000 | | | DTE Electric Company | | | | 3.9500 | | 03/01/49 | | | 1,784,208 | |
| | 2,000,000 | | | Duke Energy Florida, LLC | | | | 2.5000 | | 12/01/29 | | | 1,766,986 | |
| | 650,000 | | | Interstate Power and Light Company | | | | 3.5000 | | 09/30/49 | | | 460,654 | |
| | 1,750,000 | | | MidAmerican Energy Company | | | | 4.2500 | | 07/15/49 | | | 1,447,015 | |
| | 1,400,000 | | | National Rural Utilities Cooperative Finance Corporation | | | | 1.3500 | | 03/15/31 | | | 1,098,521 | |
| | 1,000,000 | | | NextEra Energy Capital Holdings, Inc. | | | | 5.0500 | | 02/28/33 | | | 973,976 | |
See accompanying notes to financial statements.
| EVENTIDE CORE BOND FUND |
| SCHEDULE OF INVESTMENTS (Continued) |
| June 30, 2024 |
| Principal | | | | | | | Coupon Rate | | | | | |
| Amount ($) | | | | | Spread | | (%) | | Maturity | | Fair Value | |
| | | | | CORPORATE BONDS — 45.3% (Continued) | | | | | | | | | | |
| | | | | ELECTRIC UTILITIES — 11.7% (Continued) | | | | | | | | | | |
| | 1,500,000 | | | NextEra Energy Capital Holdings, Inc.(b) | | US0003M + 2.409% | | 4.8000 | | 12/01/77 | | $ | 1,391,050 | |
| | 1,600,000 | | | Public Service Company of Oklahoma | | | | 3.1500 | | 08/15/51 | | | 1,037,066 | |
| | 2,450,000 | | | Wisconsin Public Service Corporation | | | | 2.8500 | | 12/01/51 | | | 1,525,397 | |
| | | | | | | | | | | | | | 16,005,685 | |
| | | | | ELECTRICAL EQUIPMENT — 1.3% | | | | | | | | | | |
| | 1,800,000 | | | Lennox International, Inc. | | | | 5.5000 | | 09/15/28 | | | 1,822,156 | |
| | | | | | | | | | | | | | | |
| | | | | ENGINEERING & CONSTRUCTION — 2.7% | | | | | | | | | | |
| | 850,000 | | | Installed Building Products, Inc.(a) | | | | 5.7500 | | 02/01/28 | | | 832,034 | |
| | 750,000 | | | MasTec, Inc.(a) | | | | 4.5000 | | 08/15/28 | | | 715,953 | |
| | 2,275,000 | | | Quanta Services, Inc. | | | | 2.9000 | | 10/01/30 | | | 2,007,318 | |
| | | | | | | | | | | | | | 3,555,305 | |
| | | | | HOME CONSTRUCTION — 0.7% | | | | | | | | | | |
| | 1,000,000 | | | M/I Homes, Inc. | | | | 3.9500 | | 02/15/30 | | | 892,590 | |
| | | | | | | | | | | | | | | |
| | | | | INDUSTRIAL SUPPORT SERVICES — 0.4% | | | | | | | | | | |
| | 625,000 | | | United Rentals North America, Inc. | | | | 4.8750 | | 01/15/28 | | | 606,241 | |
| | | | | | | | | | | | | | | |
| | | | | INSTITUTIONAL FINANCIAL SERVICES — 3.0% | | | | | | | | | | |
| | 2,225,000 | | | Morgan Stanley(b) | | SOFRRATE + 0.745% | | 0.8640 | | 10/21/25 | | | 2,190,792 | |
| | 1,900,000 | | | Nasdaq, Inc. | | | | 5.3500 | | 06/28/28 | | | 1,918,907 | |
| | | | | | | | | | | | | | 4,109,699 | |
| | | | | INSURANCE — 1.4% | | | | | | | | | | |
| | 2,175,000 | | | Brown & Brown, Inc. | | | | 4.9500 | | 03/17/52 | | | 1,862,203 | |
| | | | | | | | | | | | | | | |
| | | | | MACHINERY — 1.1% | | | | | | | | | | |
| | 650,000 | | | Mueller Water Products, Inc.(a) | | | | 4.0000 | | 06/15/29 | | | 595,753 | |
| | 1,000,000 | | | Xylem, Inc./NY | | | | 1.9500 | | 01/30/28 | | | 898,222 | |
| | | | | | | | | | | | | | 1,493,975 | |
| | | | | OIL & GAS PRODUCERS — 3.8% | | | | | | | | | | |
| | 2,025,000 | | | Cheniere Energy Partners, L.P. | | | | 4.5000 | | 10/01/29 | | | 1,930,426 | |
| | 2,000,000 | | | Diamondback Energy, Inc. | | | | 3.5000 | | 12/01/29 | | | 1,846,389 | |
See accompanying notes to financial statements.
| EVENTIDE CORE BOND FUND |
| SCHEDULE OF INVESTMENTS (Continued) |
| June 30, 2024 |
| Principal | | | | | | | Coupon Rate | | | | | |
| Amount ($) | | | | | Spread | | (%) | | Maturity | | Fair Value | |
| | | | | CORPORATE BONDS — 45.3% (Continued) | | | | | | | | | | |
| | | | | OIL & GAS PRODUCERS — 3.8% (Continued) | | | | | | | | | | |
| | 1,500,000 | | | EQT Corporation | | | | 5.7500 | | 02/01/34 | | $ | 1,487,690 | |
| | | | | | | | | | | | | | 5,264,505 | |
| | | | | REAL ESTATE INVESTMENT TRUSTS — 4.3% | | | | | | | | | | |
| | 1,700,000 | | | American Tower Corporation | | | | 4.0500 | | 03/15/32 | | | 1,557,822 | |
| | 2,000,000 | | | Equinix, Inc. | | | | 3.9000 | | 04/15/32 | | | 1,823,839 | |
| | 700,000 | | | HAT Holdings I, LLC / HAT Holdings II, LLC(a) | | | | 3.3750 | | 06/15/26 | | | 661,131 | |
| | 2,000,000 | | | Welltower OP, LLC | | | | 3.8500 | | 06/15/32 | | | 1,805,868 | |
| | | | | | | | | | | | | | 5,848,660 | |
| | | | | RETAIL - DISCRETIONARY — 1.7% | | | | | | | | | | |
| | 1,250,000 | | | Builders FirstSource, Inc.(a) | | | | 4.2500 | | 02/01/32 | | | 1,106,201 | |
| | 1,250,000 | | | Home Depot, Inc. (The) | | | | 5.3000 | | 06/25/54 | | | 1,227,460 | |
| | | | | | | | | | | | | | 2,333,661 | |
| | | | | SEMICONDUCTORS — 2.5% | | | | | | | | | | |
| | 1,000,000 | | | KLA Corporation | | | | 3.3000 | | 03/01/50 | | | 708,558 | |
| | 2,200,000 | | | NXP BV/NXP Funding, LLC/NXP USA, Inc. | | | | 2.5000 | | 05/11/31 | | | 1,848,050 | |
| | 1,100,000 | | | Synaptics, Inc.(a) | | | | 4.0000 | | 06/15/29 | | | 998,622 | |
| | | | | | | | | | | | | | 3,555,230 | |
| | | | | SOFTWARE — 2.3% | | | | | | | | | | |
| | 2,000,000 | | | Roper Technologies, Inc. | | | | 4.2000 | | 09/15/28 | | | 1,934,980 | |
| | 1,250,000 | | | Workday, Inc. | | | | 3.7000 | | 04/01/29 | | | 1,173,815 | |
| | | | | | | | | | | | | | 3,108,795 | |
| | | | | TECHNOLOGY SERVICES — 1.5% | | | | | | | | | | |
| | 1,950,000 | | | Verisk Analytics, Inc. | | | | 5.7500 | | 04/01/33 | | | 2,007,860 | |
| | | | | | | | | | | | | | | |
| | | | | WHOLESALE - CONSUMER STAPLES — 1.2% | | | | | | | | | | |
| | 1,875,000 | | | Sysco Corporation | | | | 2.4000 | | 02/15/30 | | | 1,626,680 | |
| | | | | | | | | | | | | | | |
| | | | | TOTAL CORPORATE BONDS (Cost $65,070,521) | | | | | | | | | 62,117,315 | |
See accompanying notes to financial statements.
| EVENTIDE CORE BOND FUND |
| SCHEDULE OF INVESTMENTS (Continued) |
| June 30, 2024 |
| Principal | | | | | Coupon Rate | | | | | |
| Amount ($) | | | | | (%) | | Maturity | | Fair Value | |
| | | | | MUNICIPAL BONDS — 9.6% | | | | | | | | |
| | | | | COMBINED UTILITIES — 0.7% | | | | | | | | |
| | 1,000,000 | | | City of Tacoma, WA Electric System Revenue | | 5.6410 | | 01/01/27 | | $ | 1,009,927 | |
| | | | | | | | | | | | | |
| | | | | MISCELLANEOUS TAX — 0.7% | | | | | | | | |
| | 900,000 | | | Commonwealth of Massachusetts | | 3.6390 | | 07/15/24 | | | 899,364 | |
| | | | | | | | | | | | | |
| | | | | MULTI-FAMILY HOUSING — 1.4% | | | | | | | | |
| | 1,800,000 | | | Florida Housing Finance Corporation | | 5.5610 | | 07/01/49 | | | 1,714,888 | |
| | 250,000 | | | Maine State Housing Authority | | 0.4000 | | 11/15/24 | | | 246,653 | |
| | 100,000 | | | New York State Housing Finance Agency | | 0.7000 | | 11/01/25 | | | 94,986 | |
| | | | | | | | | | | | 2,056,527 | |
| | | | | SINGLE-FAMILY HOUSING — 5.2% | | | | | | | | |
| | 1,000,000 | | | Illinois Housing Development Authority | | 5.6140 | | 10/01/39 | | | 995,367 | |
| | 1,825,000 | | | Massachusetts Housing Finance Agency | | 5.8360 | | 12/01/42 | | | 1,809,717 | |
| | 1,495,000 | | | Minnesota Housing Finance Agency | | 5.9000 | | 01/01/49 | | | 1,495,801 | |
| | 389,199 | | | Minnesota Housing Finance Agency | | 1.5800 | | 02/01/51 | | | 292,450 | |
| | 480,000 | | | Texas Department of Housing & Community Affairs | | 0.5000 | | 07/01/24 | | | 480,000 | |
| | 2,000,000 | | | Virginia Housing Development Authority | | 5.6620 | | 10/01/39 | | | 1,992,167 | |
| | | | | | | | | | | | 7,065,502 | |
| | | | | STATE — 0.7% | | | | | | | | |
| | 1,250,000 | | | State of Oregon | | 2.3370 | | 11/01/33 | | | 1,016,202 | |
| | | | | | | | | | | | | |
| | | | | WATER AND SEWER — 0.9% | | | | | | | | |
| | 1,500,000 | | | City of Aurora, CO Water Revenue | | 2.6260 | | 08/01/41 | | | 1,126,212 | |
| | | | | | | | | | | | | |
| | | | | TOTAL MUNICIPAL BONDS (Cost $14,148,754) | | | | | | | 13,173,734 | |
| | | | | | | | | | | | | |
| Principal | | | | | Coupon Rate | | | | | | |
| Amount ($) | | | | | (%) | | Maturity | | Fair Value | |
| | | | | U.S. GOVERNMENT & AGENCIES — 39.4% | | | | | | | | |
| | | | | AGENCY FIXED RATE — 26.6% | | | | | | | | |
| | 798,350 | | | Fannie Mae Pool BO9355 | | 3.0000 | | 03/01/50 | | | 690,218 | |
| | 1,812,552 | | | Fannie Mae Pool MA4120 | | 2.5000 | | 09/01/50 | | | 1,498,717 | |
| | 695,517 | | | Fannie Mae Pool FM4720 | | 3.0000 | | 10/01/50 | | | 600,953 | |
| | 1,822,463 | | | Fannie Mae Pool CA8256 | | 2.5000 | | 12/01/50 | | | 1,498,198 | |
See accompanying notes to financial statements.
| EVENTIDE CORE BOND FUND |
| SCHEDULE OF INVESTMENTS (Continued) |
| June 30, 2024 |
| Principal | | | | | Coupon Rate | | | | | |
| Amount ($) | | | | | (%) | | Maturity | | Fair Value | |
| | | | | U.S. GOVERNMENT & AGENCIES — 39.4% (Continued) | | | | | | | | |
| | | | | AGENCY FIXED RATE — 26.6% (Continued) | | | | | | | | |
| | 1,930,722 | | | Fannie Mae Pool CB0199 | | 3.0000 | | 04/01/51 | | $ | 1,654,085 | |
| | 651,948 | | | Fannie Mae Pool MA4307 | | 3.0000 | | 04/01/51 | | | 559,742 | |
| | 3,049,811 | | | Fannie Mae Pool MA4355 | | 2.0000 | | 06/01/51 | | | 2,404,417 | |
| | 1,576,096 | | | Fannie Mae Pool MA4379 | | 2.5000 | | 07/01/51 | | | 1,299,022 | |
| | 1,312,376 | | | Fannie Mae Pool MA4600 | | 3.5000 | | 05/01/52 | | | 1,165,155 | |
| | 2,118,076 | | | Fannie Mae Pool MA4625 | | 3.5000 | | 06/01/52 | | | 1,880,477 | |
| | 2,146,651 | | | Fannie Mae Pool MA4700 | | 4.0000 | | 08/01/52 | | | 1,969,697 | |
| | 2,367,072 | | | Fannie Mae Pool MA4805 | | 4.5000 | | 11/01/52 | | | 2,237,372 | |
| | 2,275,122 | | | Fannie Mae Pool MA4869 | | 5.5000 | | 01/01/53 | | | 2,252,005 | |
| | 1,201,877 | | | Fannie Mae Pool MA4916 | | 4.0000 | | 02/01/53 | | | 1,102,383 | |
| | 1,511,991 | | | Freddie Mac Pool SD8090 | | 2.0000 | | 09/01/50 | | | 1,197,964 | |
| | 1,675,403 | | | Freddie Mac Pool SD8128 | | 2.0000 | | 02/01/51 | | | 1,320,295 | |
| | 1,032,372 | | | Freddie Mac Pool RA5696 | | 2.5000 | | 08/01/51 | | | 850,134 | |
| | 1,972,191 | | | Freddie Mac Pool SD8206 | | 3.0000 | | 04/01/52 | | | 1,684,043 | |
| | 2,255,038 | | | Freddie Mac Pool RA7587 | | 3.5000 | | 06/01/52 | | | 2,015,507 | |
| | 2,046,032 | | | Freddie Mac Pool SD8237 | | 4.0000 | | 08/01/52 | | | 1,876,788 | |
| | 2,547,948 | | | Freddie Mac Pool SD8238 | | 4.5000 | | 08/01/52 | | | 2,407,405 | |
| | 2,298,670 | | | Freddie Mac Pool SD8288 | | 5.0000 | | 01/01/53 | | | 2,228,756 | |
| | 1,143,600 | | | Freddie Mac Pool SD3026 | | 5.0000 | | 06/01/53 | | | 1,110,773 | |
| | 1,125,798 | | | Freddie Mac Pool SD8332 | | 6.0000 | | 06/01/53 | | | 1,132,743 | |
| | | | | | | | | | | | 36,636,849 | |
| | | | | GOVERNMENT OWNED, NO GUARANTEE — 5.5% | | | | | | | | |
| | 1,250,000 | | | Federal Home Loan Mortgage Corporation | | 5.5000 | | 04/08/27 | | | 1,247,714 | |
| | 2,250,000 | | | Federal Home Loan Mortgage Corporation | | 6.2500 | | 07/15/32 | | | 2,524,056 | |
| | 2,300,000 | | | Federal National Mortgage Association | | 6.2500 | | 05/15/29 | | | 2,487,865 | |
| | 1,200,000 | | | Federal National Mortgage Association | | 5.6250 | | 07/15/37 | | | 1,320,631 | |
| | | | | | | | | | | | 7,580,266 | |
| | | | | GOVERNMENT SPONSORED — 7.3% | | | | | | | | |
| | 1,250,000 | | | Federal Farm Credit Banks Funding Corporation | | 5.2300 | | 05/20/26 | | | 1,250,040 | |
| | 1,750,000 | | | Federal Farm Credit Banks Funding Corporation | | 4.3750 | | 02/28/28 | | | 1,743,707 | |
| | 1,520,000 | | | Federal Farm Credit Banks Funding Corporation | | 4.8750 | | 11/01/28 | | | 1,547,360 | |
| | 1,500,000 | | | Federal Farm Credit Banks Funding Corporation | | 4.2500 | | 12/15/28 | | | 1,490,918 | |
| | 1,425,000 | | | Federal Farm Credit Banks Funding Corporation | | 4.5000 | | 03/09/29 | | | 1,433,333 | |
| | 1,500,000 | | | Federal Farm Credit Banks Funding Corporation | | 4.1250 | | 07/05/29 | | | 1,483,682 | |
See accompanying notes to financial statements.
| EVENTIDE CORE BOND FUND |
| SCHEDULE OF INVESTMENTS (Continued) |
| June 30, 2024 |
| Principal | | | | | Coupon Rate | | | | | |
| Amount ($) | | | | | (%) | | Maturity | | Fair Value | |
| | | | | U.S. GOVERNMENT & AGENCIES — 39.4% (Continued) | | | | | | | | |
| | | | | GOVERNMENT SPONSORED — 7.3% (Continued) | | | | | | | | |
| | 1,000,000 | | | Federal Farm Credit Banks Funding Corporation | | 4.3750 | | 10/24/29 | | $ | 998,346 | |
| | | | | | | | | | | | 9,947,386 | |
| | | | | TOTAL U.S. GOVERNMENT & AGENCIES (Cost $55,757,142) | | | | | | | 54,164,501 | |
| | | | | | | | | | | | | |
| | | | | TOTAL INVESTMENTS - 97.3% (Cost $139,132,890) | | | | | | $ | 133,539,852 | |
| | | | | OTHER ASSETS IN EXCESS OF LIABILITIES- 2.7% | | | | | | | 3,765,040 | |
| | | | | NET ASSETS - 100.0% | | | | | | $ | 137,304,892 | |
| LLC | - Limited Liability Company |
| | |
| L.P. | - Limited Partnership |
| | |
| SOFR30A | United States 30 Day Average SOFR Secured Overnight Financing Rate |
| | |
| SOFRRATE | United States SOFR Secured Overnight Financing Rate |
| | |
| TSFR3M | CME Term SOFR 3 Month |
| | |
| US0003M | ICE LIBOR USD 3 Month |
| (a) | Security exempt from registration under Rule 144A or Section 4(2) of the Securities Act of 1933. The security may be resold in transactions exempt from registration, normally to qualified institutional buyers. As of June 30, 2024 the total market value of 144A securities is $6,687,783 or 4.9% of net assets. |
| (b) | Variable or floating rate security, the interest rate of which adjusts periodically based on changes in current interest rates and prepayments on the underlying pool of assets. |
See accompanying notes to financial statements.
| EVENTIDE DIVIDEND OPPORTUNITIES FUND |
| SCHEDULE OF INVESTMENTS |
| June 30, 2024 |
| Shares | | | | | Fair Value | |
| | | | | COMMON STOCKS — 97.9% | | | | |
| | | | | BANKING - 0.9% | | | | |
| | 45,077 | | | Pinnacle Financial Partners, Inc. | | $ | 3,607,963 | |
| | 95,715 | | | Synovus Financial Corporation | | | 3,846,786 | |
| | | | | | | | 7,454,749 | |
| | | | | BIOTECH & PHARMA - 1.5% | | | | |
| | 494,331 | | | Royalty Pharma plc, Class A | | | 13,035,508 | |
| | | | | | | | | |
| | | | | CHEMICALS - 5.5% | | | | |
| | 82,851 | | | Cabot Corporation | | | 7,613,178 | |
| | 714,806 | | | Element Solutions, Inc. | | | 19,385,539 | |
| | 69,679 | | | Sherwin-Williams Company (The) | | | 20,794,304 | |
| | | | | | | | 47,793,021 | |
| | | | | COMMERCIAL SUPPORT SERVICES - 1.7% | | | | |
| | 302,995 | | | Rollins, Inc. | | | 14,783,126 | |
| | | | | | | | | |
| | | | | CONTAINERS & PACKAGING - 1.2% | | | | |
| | 234,998 | | | International Paper Company | | | 10,140,164 | |
| | | | | | | | | |
| | | | | DIVERSIFIED INDUSTRIALS - 2.2% | | | | |
| | 252,396 | | | Pentair PLC | | | 19,351,201 | |
| | | | | | | | | |
| | | | | ELECTRIC UTILITIES - 8.2% | | | | |
| | 99,796 | | | CMS Energy Corporation | | | 5,940,856 | |
| | 39,229 | | | Constellation Energy Corporation | | | 7,856,392 | |
| | 208,040 | | | Public Service Enterprise Group, Inc. | | | 15,332,548 | |
| | 62,311 | | | Sempra Energy | | | 4,739,375 | |
| | 206,700 | | | Southern Company (The) | | | 16,033,719 | |
| | 240,016 | | | Vistra Corporation | | | 20,636,575 | |
| | | | | | | | 70,539,465 | |
| | | | | ELECTRICAL EQUIPMENT - 10.4% | | | | |
| | 571,481 | | | nVent Electric PLC | | | 43,781,159 | |
| | 142,594 | | | Trane Technologies PLC | | | 46,903,444 | |
| | | | | | | | 90,684,603 | |
See accompanying notes to financial statements.
| EVENTIDE DIVIDEND OPPORTUNITIES FUND |
| SCHEDULE OF INVESTMENTS (Continued) |
| June 30, 2024 |
| Shares | | | | | Fair Value | |
| | | | | COMMON STOCKS — 97.9% (Continued) | | | | |
| | | | | HOME CONSTRUCTION - 2.4% | | | | |
| | 146,785 | | | DR Horton, Inc. | | $ | 20,686,410 | |
| | | | | | | | | |
| | | | | INDUSTRIAL REIT - 2.5% | | | | |
| | 125,157 | | | EastGroup Properties, Inc. | | | 21,289,206 | |
| | | | | | | | | |
| | | | | INDUSTRIAL SUPPORT SERVICES - 4.9% | | | | |
| | 63,870 | | | Applied Industrial Technologies, Inc. | | | 12,390,780 | |
| | 152,690 | | | Ferguson PLC | | | 29,568,419 | |
| | | | | | | | 41,959,199 | |
| | | | | INSTITUTIONAL FINANCIAL SERVICES - 2.7% | | | | |
| | 171,711 | | | Houlihan Lokey, Inc. | | | 23,156,945 | |
| | | | | | | | | |
| | | | | INSURANCE - 5.3% | | | | |
| | 151,582 | | | Arthur J Gallagher & Company | | | 39,306,729 | |
| | 52,192 | | | RLI Corporation | | | 7,342,892 | |
| | | | | | | | 46,649,621 | |
| | | | | MACHINERY - 1.4% | | | | |
| | 58,759 | | | IDEX Corporation | | | 11,822,311 | |
| | | | | | | | | |
| | | | | MEDICAL EQUIPMENT & DEVICES - 5.1% | | | | |
| | 131,085 | | | Bruker Corporation | | | 8,364,534 | |
| | 8,189 | | | Mettler-Toledo International, Inc.(a) | | | 11,444,865 | |
| | 108,899 | | | STERIS plc | | | 23,907,686 | |
| | | | | | | | 43,717,085 | |
| | | | | OIL & GAS PRODUCERS - 8.4% | | | | |
| | 324,473 | | | Coterra Energy, Inc. | | | 8,653,695 | |
| | 30,486 | | | Diamondback Energy, Inc. | | | 6,102,992 | |
| | 236,648 | | | Targa Resources Corporation | | | 30,475,530 | |
| | 641,394 | | | Williams Companies, Inc. (The) | | | 27,259,245 | |
| | | | | | | | 72,491,462 | |
| | | | | RESIDENTIAL REIT - 2.3% | | | | |
| | 95,317 | | | AvalonBay Communities, Inc. | | | 19,720,134 | |
See accompanying notes to financial statements.
| EVENTIDE DIVIDEND OPPORTUNITIES FUND |
| SCHEDULE OF INVESTMENTS (Continued) |
| June 30, 2024 |
| Shares | | | | | Fair Value | |
| | | | | COMMON STOCKS — 97.9% (Continued) | | | | |
| | | | | RETAIL - DISCRETIONARY - 2.8% | | | | |
| | 28,434 | | | Group 1 Automotive, Inc. | | $ | 8,452,860 | |
| | 60,453 | | | Lithia Motors, Inc. | | | 15,261,359 | |
| | | | | | | | 23,714,219 | |
| | | | | SEMICONDUCTORS - 5.1% | | | | |
| | 42,009 | | | KLA Corporation | | | 34,636,841 | |
| | 8,744 | | | Lam Research Corporation | | | 9,311,048 | |
| | | | | | | | 43,947,889 | |
| | | | | SOFTWARE - 7.0% | | | | |
| | 66,992 | | | Roper Technologies, Inc. | | | 37,760,711 | |
| | 38,514 | | | Synopsys, Inc.(a) | | | 22,918,141 | |
| | | | | | | | 60,678,852 | |
| | | | | SPECIALTY REITS - 2.4% | | | | |
| | 239,429 | | | Iron Mountain, Inc. | | | 21,457,627 | |
| | | | | | | | | |
| | | | | TECHNOLOGY HARDWARE - 2.0% | | | | |
| | 133,873 | | | NetApp, Inc. | | | 17,242,842 | |
| | | | | | | | | |
| | | | | TECHNOLOGY SERVICES - 7.7% | | | | |
| | 157,143 | | | CDW Corporation | | | 35,174,889 | |
| | 26,775 | | | MSCI, Inc. | | | 12,898,856 | |
| | 68,709 | | | Verisk Analytics, Inc. | | | 18,520,511 | |
| | | | | | | | 66,594,256 | |
| | | | | TRANSPORTATION & LOGISTICS - 2.0% | | | | |
| | 98,400 | | | Old Dominion Freight Line, Inc. | | | 17,377,440 | |
| | | | | | | | | |
| | | | | WHOLESALE - CONSUMER STAPLES - 0.8% | | | | |
| | 94,105 | | | Sysco Corporation | | | 6,718,156 | |
| | | | | | | | | |
| | | | | WHOLESALE - DISCRETIONARY - 1.5% | | | | |
| | 42,791 | | | Pool Corporation | | | 13,150,958 | |
| | | | | | | | | |
| | | | | TOTAL COMMON STOCKS (Cost $671,210,649) | | | 846,156,449 | |
See accompanying notes to financial statements.
| EVENTIDE DIVIDEND OPPORTUNITIES FUND |
| SCHEDULE OF INVESTMENTS (Continued) |
| June 30, 2024 |
| Principal | | | | | Coupon Rate | | | | | |
| Amount ($) | | | | | (%) | | Maturity | | Fair Value | |
| | | | | CORPORATE BONDS — 0.4% | | | | | | | | |
| | | | | ASSET MANAGEMENT — 0.4% | | | | | | | | |
| | 3,250,000 | | | Vision Fund International(b),(c),(d) | | 5.2600 | | 11/30/25 | | $ | 3,214,663 | |
| | | | | TOTAL CORPORATE BONDS (Cost $3,250,000) | | | | | | | 3,214,663 | |
| | | | | | | | | | | | | |
| Shares | | | | | | | | | Fair Value | |
| | | | | SHORT-TERM INVESTMENTS — 0.0%(e) | | | | | | | | |
| | | | | MONEY MARKET FUNDS - 0.0% (e) | | | | | | | | |
| | 111,652 | | | Fidelity Money Market Government Portfolio, Class I, 5.20%(f) (Cost $111,652) | | | | | | | 111,652 | |
| | | | | | | | | | | | | |
| | | | | TOTAL INVESTMENTS - 98.3% (Cost $674,572,301) | | | | | | $ | 849,482,764 | |
| | | | | OTHER ASSETS IN EXCESS OF LIABILITIES- 1.7% | | | | | | | 14,430,906 | |
| | | | | NET ASSETS - 100.0% | | | | | | $ | 863,913,670 | |
| MSCI | - Morgan Stanley Capital International |
| | |
| PLC | - Public Limited Company |
| | |
| REIT | - Real Estate Investment Trust |
| (a) | Non-income producing security. |
| (b) | Illiquid security. The total fair value of these securities as of June 30, 2024, was $3,214,663, representing 0.4% of net assets. |
| (d) | Restricted security. See Note 6 for additional details. |
| (e) | Percentage rounds to less than 0.1%. |
| (f) | Rate disclosed is the seven day effective yield as of June 30, 2024. |
See accompanying notes to financial statements.
| EVENTIDE EXPONENTIAL TECHNOLOGIES FUND |
| SCHEDULE OF INVESTMENTS |
| June 30, 2024 |
| Shares | | | | | Fair Value | |
| | | | | COMMON STOCKS — 94.7% | | | | |
| | | | | ADVERTISING & MARKETING - 4.8% | | | | |
| | 56,535 | | | Trade Desk, Inc. (The), Class A(a) | | $ | 5,521,773 | |
| | | | | | | | | |
| | | | | BIOTECH & PHARMA - 3.9% | | | | |
| | 29,919 | | | TransMedics Group, Inc.(a) | | | 4,506,400 | |
| | | | | | | | | |
| | | | | ELECTRICAL EQUIPMENT - 3.0% | | | | |
| | 75,055 | | | NEXTracker, Inc.(a) | | | 3,518,578 | |
| | | | | | | | | |
| | | | | INDUSTRIAL INTERMEDIATE PROD - 4.3% | | | | |
| | 429,173 | | | Xometry, Inc.(a) | | | 4,961,240 | |
| | | | | | | | | |
| | | | | RENEWABLE ENERGY - 1.0% | | | | |
| | 4,932 | | | First Solar, Inc.(a) | | | 1,111,969 | |
| | | | | | | | | |
| | | | | SEMICONDUCTORS - 19.3% | | | | |
| | 27,356 | | | Entegris, Inc. | | | 3,704,002 | |
| | 5,560 | | | KLA Corporation | | | 4,584,276 | |
| | 5,125 | | | Lam Research Corporation | | | 5,457,356 | |
| | 42,313 | | | Lattice Semiconductor Corporation(a) | | | 2,453,731 | |
| | 7,448 | | | Monolithic Power Systems, Inc. | | | 6,119,873 | |
| | | | | | | | 22,319,238 | |
| | | | | SOFTWARE - 48.9% | | | | |
| | 348,774 | | | Arteris, Inc.(a) | | | 2,619,293 | |
| | 1,934 | | | Constellation Software, Inc. | | | 5,547,021 | |
| | 6,475 | | | Crowdstrike Holdings, Inc., Class A(a) | | | 2,481,155 | |
| | 47,941 | | | Datadog, Inc., Class A(a) | | | 6,217,469 | |
| | 142,791 | | | DoubleVerify Holdings, Inc.(a) | | | 2,780,141 | |
| | 212,031 | | | Flywire Corporation(a) | | | 3,475,188 | |
| | 67,677 | | | Gitlab, Inc.(a) | | | 3,364,900 | |
| | 60,335 | | | Global-e Online Ltd.(a) | | | 2,188,350 | |
| | 4,301 | | | HubSpot, Inc.(a) | | | 2,536,687 | |
| | 41,693 | | | Mobileye Global, Inc., Class A(a) | | | 1,170,948 | |
| | 26,893 | | | Monday.com Ltd.(a) | | | 6,474,760 | |
| | 8,967 | | | MongoDB, Inc.(a) | | | 2,241,391 | |
See accompanying notes to financial statements.
| EVENTIDE EXPONENTIAL TECHNOLOGIES FUND |
| SCHEDULE OF INVESTMENTS (Continued) |
| June 30, 2024 |
| Shares | | | | | | | | | Fair Value | |
| | | | | COMMON STOCKS — 94.7% (Continued) | | | | | | | | |
| | | | | SOFTWARE - 48.9% (Continued) | | | | | | | | |
| | 44,628 | | | Nutanix, Inc., Class A(a) | | | | | | $ | 2,537,102 | |
| | 11,344 | | | Palo Alto Networks, Inc.(a) | | | | | | | 3,845,729 | |
| | 47,673 | | | Procore Technologies, Inc.(a) | | | | | | | 3,161,197 | |
| | 9,887 | | | Synopsys, Inc.(a) | | | | | | | 5,883,358 | |
| | | | | | | | | | | | 56,524,689 | |
| | | | | TECHNOLOGY SERVICES - 9.5% | | | | | | | | |
| | 279,597 | | | Adyen N.V. - ADR(a) | | | | | | | 3,318,816 | |
| | 87,502 | | | Nayax Ltd.(a) | | | | | | | 1,872,543 | |
| | 130,105 | | | Remitly Global, Inc.(a) | | | | | | | 1,576,873 | |
| | 159,765 | | | Toast, Inc., Class A(a) | | | | | | | 4,117,143 | |
| | | | | | | | | | | | 10,885,375 | |
| | | | | | | | | | | | | |
| | | | | TOTAL COMMON STOCKS (Cost $82,985,474) | | | | | | | 109,349,262 | |
| | | | | | | | | | | | | |
| Principal | | | | | Coupon Rate | | | | | | |
| Amount ($) | | | | | (%) | | Maturity | | Fair Value | |
| | | | | CORPORATE BONDS — 0.6% | | | | | | | | |
| | | | | ASSET MANAGEMENT — 0.6% | | | | | | | | |
| | 750,000 | | | Vision Fund International(b),(c),(d) | | 5.2600 | | 11/30/25 | | | 741,845 | |
| | | | | | | | | | | | | |
| | | | | TOTAL CORPORATE BONDS (Cost $750,000) | | | | | | | 741,845 | |
| | | | | | | | | | | | | |
| Shares | | | | | | | | | Fair Value | |
| | | | | WARRANT — 0.0%(f) | | | | | | | | |
| | | | | SOFTWARE - 0.0% (f) | | | | | | | | |
| | 1,934 | | | Constellation Software, Inc. (Canada)(a),(b),(e) | | | | | | | — | |
| | | | | | | | | | | | | |
| | | | | TOTAL WARRANT (Cost $–) | | | | | | | — | |
| | | | | | | | | | | | | |
| Shares | | | | | | | | | Fair Value | |
| | | | | | | | | | | | | |
| | | | | SHORT-TERM INVESTMENTS — 0.0%(f) | | | | | | | | |
| | | | | MONEY MARKET FUNDS - 0.0% (f) | | | | | | | | |
| | 12,517 | | | Fidelity Money Market Government Portfolio, Class I, 5.20%(g) (Cost $12,517) | | | | | | | 12,517 | |
See accompanying notes to financial statements.
| EVENTIDE EXPONENTIAL TECHNOLOGIES FUND |
| SCHEDULE OF INVESTMENTS (Continued) |
| June 30, 2024 |
| Contracts(h) | | | | | Counterparty | | Expiration
Date | | Exercise
Price | | | Notional
Value | | | Fair Value | |
| | | | | EQUITY OPTIONS PURCHASED - 0.0% (f) | | | | | | | | | | | | | | | | |
| | | | | CALL OPTIONS PURCHASED - 0.0%(f) | | | | | | | | | | | | | | | | |
| | 320 | | | Five9, Inc. | | IB | | 07/19/2024 | | $ | 70 | | | $ | 1,411,200 | | | $ | 4,000 | |
| | | | | TOTAL CALL OPTIONS PURCHASED (Cost - $143,936) | | | | | | | | | |
| | | | | | | | | | | | | | | | | | | | | |
| | | | | TOTAL EQUITY OPTIONS PURCHASED (Cost - $143,936) | | | | | | 4,000 | |
| | | | | | | | | | | | | | | | | | | | | |
| | | | | TOTAL INVESTMENTS - 95.3% (Cost $83,891,927) | | | | | | | $ | 110,107,624 | |
| | | | | OTHER ASSETS IN EXCESS OF LIABILITIES- 4.7% | | | | | 5,378,882 | |
| | | | | NET ASSETS - 100.0% | | | | $ | 115,486,506 | |
| ADR | - American Depositary Receipt |
| | |
| IB | - Interactive Brokers |
| | |
| LTD | - Limited Company |
| | |
| N.V. | - Naamioze Vennootschap |
| (a) | Non-income producing security. |
| (b) | Illiquid security. The total fair value of these securities as of June 30, 2024 was $741,845, representing 0.6% of net assets. |
| (d) | Restricted security. See Note 6 for additional details. |
| (e) | The value of this security has been determined in good faith under policies of the Board of Trustees. |
| (f) | Percentage rounds to less than 0.1%. |
| (g) | Rate disclosed is the seven day effective yield as of June 30, 2024. |
| (h) | Each option contract allows the holder of the option to purchase or sell 100 shares of the underlying security. |
See accompanying notes to financial statements.
| EVENTIDE GILEAD FUND |
| SCHEDULE OF INVESTMENTS |
| June 30, 2024 |
| Shares | | | | | Fair Value | |
| | | | | COMMON STOCKS — 97.0% | | | | |
| | | | | ADVERTISING & MARKETING - 3.6% | | | | |
| | 1,223,047 | | | Trade Desk, Inc. (The), Class A(a) | | $ | 119,455,000 | |
| | | | | | | | | |
| | | | | AUTOMOTIVE - 1.4% | | | | |
| | 249,790 | | | Aptiv PLC(a) | | | 17,590,212 | |
| | 265,593 | | | Autoliv, Inc. | | | 28,415,795 | |
| | | | | | | | 46,006,007 | |
| | | | | BIOTECH & PHARMA – 15.7% | | | | |
| | 2,568,543 | | | Ardelyx, Inc.(a) | | | 19,032,904 | |
| | 155,276 | | | Argenx S.E. - ADR(a) | | | 66,774,891 | |
| | 439,573 | | | Axsome Therapeutics, Inc.(a) | | | 35,385,626 | |
| | 1,759,475 | | | Celldex Therapeutics, Inc.(a) | | | 65,118,169 | |
| | 1,344,376 | | | Collegium Pharmaceutical, Inc.(a) | | | 43,288,907 | |
| | 1,306,685 | | | Dynavax Technologies Corporation(a) | | | 14,674,073 | |
| | 2,299,237 | | | Guardant Health, Inc.(a) | | | 66,401,964 | |
| | 1,542,961 | | | Mirum Pharmaceuticals, Inc.(a) | | | 52,753,837 | |
| | 1,382,242 | | | Scholar Rock Holding Corporation(a) | | | 11,514,076 | |
| | 898,059 | | | TransMedics Group, Inc.(a) | | | 135,265,646 | |
| | 3,584,309 | | | Zentalis Pharmaceuticals, Inc.(a),(b) | | | 14,659,824 | |
| | | | | | | | 524,869,917 | |
| | | | | COMMERCIAL SUPPORT SERVICES - 6.2% | | | | |
| | 1,339,752 | | | Rollins, Inc. | | | 65,366,500 | |
| | 804,000 | | | Waste Connections, Inc. | | | 140,989,440 | |
| | | | | | | | 206,355,940 | |
| | | | | ELECTRIC UTILITIES - 0.5% | | | | |
| | 192,155 | | | Vistra Corporation | | | 16,521,487 | |
| | | | | | | | | |
| | | | | ELECTRICAL EQUIPMENT - 7.6% | | | | |
| | 703,258 | | | NEXTracker, Inc.(a) | | | 32,968,735 | |
| | 125,900 | | | Novanta, Inc.(a) | | | 20,535,549 | |
| | 613,600 | | | Trane Technologies PLC | | | 201,831,448 | |
| | | | | | | | 255,335,732 | |
See accompanying notes to financial statements.
| EVENTIDE GILEAD FUND |
| SCHEDULE OF INVESTMENTS (Continued) |
| June 30, 2024 |
| Shares | | | | | Fair Value | |
| | | | | COMMON STOCKS — 97.0% (Continued) | | | | |
| | | | | ENGINEERING & CONSTRUCTION - 1.0% | | | | |
| | 125,405 | | | Quanta Services, Inc. | | $ | 31,864,156 | |
| | | | | | | | | |
| | | | | FORESTRY, PAPER & WOOD PRODUCTS - 1.4% | | | | |
| | 654,102 | | | Trex Company, Inc.(a) | | | 48,482,040 | |
| | | | | | | | | |
| | | | | HOME CONSTRUCTION - 2.6% | | | | |
| | 622,000 | | | DR Horton, Inc. | | | 87,658,460 | |
| | | | | | | | | |
| | | | | INDUSTRIAL INTERMEDIATE PROD - 1.9% | | | | |
| | 5,568,096 | | | Xometry, Inc.(a),(b) | | | 64,367,190 | |
| | | | | | | | | |
| | | | | MEDICAL EQUIPMENT & DEVICES - 7.3% | | | | |
| | 663,539 | | | Exact Sciences Corporation(a) | | | 28,034,523 | |
| | 187,567 | | | IDEXX Laboratories, Inc.(a) | | | 91,382,642 | |
| | 75,000 | | | Intuitive Surgical, Inc.(a) | | | 33,363,750 | |
| | 63,357 | | | Mettler-Toledo International, Inc.(a) | | | 88,547,110 | |
| | | | | | | | 241,328,025 | |
| | | | | OIL & GAS PRODUCERS - 0.9% | | | | |
| | 214,336 | | | Targa Resources Corporation | | | 27,602,190 | |
| | | | | | | | | |
| | | | | RENEWABLE ENERGY - 0.3% | | | | |
| | 50,261 | | | First Solar, Inc.(a) | | | 11,331,845 | |
| | | | | | | | | |
| | | | | RETAIL - DISCRETIONARY - 3.9% | | | | |
| | 171,076 | | | Lithia Motors, Inc. | | | 43,188,136 | |
| | 251,791 | | | Lowe’s Companies, Inc. | | | 55,509,844 | |
| | 30,033 | | | O’Reilly Automotive, Inc.(a) | | | 31,716,650 | |
| | | | | | | | 130,414,630 | |
| | | | | SEMICONDUCTORS - 9.0% | | | | |
| | 59,873 | | | ASML Holding N.V. | | | 61,233,913 | |
| | 397,941 | | | Entegris, Inc. | | | 53,881,211 | |
| | 79,558 | | | Lam Research Corporation | | | 84,717,337 | |
| | 512,605 | | | Lattice Semiconductor Corporation(a) | | | 29,725,964 | |
See accompanying notes to financial statements.
| EVENTIDE GILEAD FUND |
| SCHEDULE OF INVESTMENTS (Continued) |
| June 30, 2024 |
| Shares | | | | | Fair Value | |
| | | | | COMMON STOCKS — 97.0% (Continued) | | | | |
| | | | | SEMICONDUCTORS - 9.0% (Continued) | | | | |
| | 90,818 | | | Monolithic Power Systems, Inc. | | $ | 74,623,334 | |
| | | | | | | | 304,181,759 | |
| | | | | SOFTWARE – 23.7% | | | | |
| | 242,465 | | | Crowdstrike Holdings, Inc., Class A(a) | | | 92,910,164 | |
| | 954,252 | | | Datadog, Inc., Class A(a) | | | 123,756,943 | |
| | 1,162,238 | | | DoubleVerify Holdings, Inc.(a) | | | 22,628,774 | |
| | 2,284,740 | | | Evolent Health, Inc., Class A(a) | | | 43,684,229 | |
| | 577,271 | | | Five9, Inc.(a) | | | 25,457,651 | |
| | 2,848,666 | | | Flywire Corporation(a) | | | 46,689,636 | |
| | 909,349 | | | Gitlab, Inc.(a) | | | 45,212,832 | |
| | 918,794 | | | Global-e Online Ltd.(a) | | | 33,324,658 | |
| | 112,234 | | | HubSpot, Inc.(a) | | | 66,194,491 | |
| | 629,209 | | | Mobileye Global, Inc., Class A(a) | | | 17,671,335 | |
| | 290,798 | | | Monday.com Ltd.(a) | | | 70,012,526 | |
| | 537,718 | | | Nutanix, Inc., Class A(a) | | | 30,569,268 | |
| | 203,208 | | | Palo Alto Networks, Inc.(a) | | | 68,889,544 | |
| | 159,400 | | | Roper Technologies, Inc. | | | 89,847,405 | |
| | 89,331 | | | Workday, Inc., Class A(a) | | | 19,970,838 | |
| | | | | | | | 796,820,294 | |
| | | | | TECHNOLOGY SERVICES - 3.1% | | | | |
| | 9,100 | | | Adyen N.V.(a) | | | 10,851,762 | |
| | 1,132,371 | | | Remitly Global, Inc.(a) | | | 13,724,337 | |
| | 3,063,288 | | | Toast, Inc., Class A(a) | | | 78,940,931 | |
| | | | | | | | 103,517,030 | |
| | | | | TRANSPORTATION & LOGISTICS - 3.6% | | | | |
| | 220,000 | | | GXO Logistics, Inc.(a) | | | 11,110,000 | |
| | 618,706 | | | Old Dominion Freight Line, Inc. | | | 109,263,480 | |
| | | | | | | | 120,373,480 | |
See accompanying notes to financial statements.
| EVENTIDE GILEAD FUND |
| SCHEDULE OF INVESTMENTS (Continued) |
| June 30, 2024 |
| Shares | | | | | | | | | Fair Value | |
| | | | | COMMON STOCKS — 97.0% (Continued) | | | | | | | | |
| | | | | WHOLESALE - DISCRETIONARY - 3.3% | | | | | | | | |
| | 710,725 | | | Copart, Inc.(a) | | | | | | $ | 38,492,866 | |
| | 237,000 | | | Pool Corporation | | | | | | | 72,837,210 | |
| | | | | | | | | | | | 111,330,076 | |
| | | | | | | | | | | | | |
| | | | | TOTAL COMMON STOCKS (Cost $2,044,787,707) | | | | | | | 3,247,815,258 | |
| | | | | | | | | | | | | |
| Shares | | | | | | | | | Fair Value | |
| | | | | CONTINGENT VALUE RIGHTS — 0.1% | | | | | | | | |
| | | | | BIOTECH & PHARMA - 0.1% | | | | | | | | |
| | 3,982,940 | | | Peloton Therapeutics, Inc. - CVR(a),(c),(d),(e),(f) | | | | | | | 3,365,186 | |
| | | | | | | | | | | | | |
| | | | | TOTAL CONTINGENT VALUE RIGHTS (Cost $–) | | | | | | | 3,365,186 | |
| | | | | | | | | | | | | |
| Shares | | | | | | | | | Fair Value | |
| | | | | PRIVATE INVESTMENTS — 1.2% | | | | | | | | |
| | | | | BIOTECH & PHARMA — 0.2% | | | | | | | | |
| | 228,572 | | | Mirum Pharmaceuticals, Inc. PIPE(a),(b),(c),(f) | | | | | | | 7,814,877 | |
| | | | | | | | | | | | | |
| | | | | MEDICAL EQUIPMENT & DEVICES — 1.0% | | | | | | | | |
| | 1,881,321 | | | Beta Bionics, Inc. Series B (a),(b),(c),(d),(e),(f) | | | | | | | 14,072,281 | |
| | 665,474 | | | Beta Bionics, Inc. Series B2(a),(b),(c),(d),(e),(f) | | | | | | | 5,064,257 | |
| | 964,052 | | | Beta Bionics, Inc. Series C(a),(b),(c),(d),(e),(f) | | | | | | | 7,133,985 | |
| | 714,286 | | | Beta Bionics, Inc. Series D(a),(b),(c),(d),(e),(f) | | | | | | | 6,621,431 | |
| | | | | | | | | | | | 32,891,954 | |
| | | | | | | | | | | | | |
| | | | | TOTAL PRIVATE INVESTMENTS (Cost $49,399,904) | | | | | | | 40,706,831 | |
| | | | | | | | | | | | | |
| Principal | | | | | Coupon Rate | | | | | | |
| Amount ($) | | | | | (%) | | Maturity | | Fair Value | |
| | | | | CORPORATE BONDS — 1.2% | | | | | | | | |
| | | | | ASSET MANAGEMENT — 1.2% | | | | | | | | |
| | 12,000,000 | | | Calvert Impact Capital, Inc.(c) | | 1.5000 | | 11/15/24 | | | 12,000,000 | |
| | 2,000,000 | | | Hope Global International(c),(e),(f) | | 4.0000 | | 01/07/28 | | | 1,868,542 | |
| | 5,000,000 | | | Vision Fund International(c),(e),(f) | | 5.9030 | | 09/19/25 | | | 4,988,200 | |
| | 9,000,000 | | | Vision Fund International(c),(e),(f) | | 5.2600 | | 11/30/25 | | | 8,902,143 | |
| | 5,000,000 | | | Vision Fund International(c),(e),(f) | | 3.1500 | | 12/15/25 | | | 4,796,460 | |
See accompanying notes to financial statements.
| EVENTIDE GILEAD FUND |
| SCHEDULE OF INVESTMENTS (Continued) |
| June 30, 2024 |
| Principal | | | | | Coupon Rate | | | | | |
| Amount ($) | | | | | (%) | | Maturity | | Fair Value | |
| | | | | CORPORATE BONDS — 1.2% (Continued) | | | | | | | | |
| | | | | | | | | | | | | |
| | | | | ASSET MANAGEMENT — 1.2% (Continued) | | | | | | | | |
| | 5,000,000 | | | Vision Fund International(c),(e),(f) | | 3.2230 | | 12/15/26 | | $ | 4,681,510 | |
| | 5,000,000 | | | Vision Fund International(c),(e),(f) | | 4.7400 | | 05/16/25 | | | 4,941,120 | |
| | | | | | | | | | | | 42,177,975 | |
| | | | | TOTAL CORPORATE BONDS (Cost $43,000,000) | | | | | | | 42,177,975 | |
| | | | | | | | | | | | | |
| Shares | | | | | | | | | Fair Value | |
| | | | | WARRANT — 0.2% | | | | | | | | |
| | | | | MEDICAL EQUIPMENT & DEVICES - 0.2% | | | | | | | | |
| | 241,013 | | | Beta Bionics, Inc. Series C Warrant(a),(b),(c),(d),(e),(f) | | | | | | | 1,783,496 | |
| | 500,000 | | | Beta Bionics, Inc. Series D Warrant(a),(b),(c),(d),(e),(f) | | | | | | | 3,350,000 | |
| | | | | | | | | | | | 5,133,496 | |
| | | | | | | | | | | | | |
| | | | | TOTAL WARRANT (Cost $–) | | | | | | | 5,133,496 | |
| | | | | | | | | | | | | |
| Shares | | | | | | | | | Fair Value | |
| | | | | SHORT-TERM INVESTMENTS — 0.2% | | | | | | | | |
| | | | | MONEY MARKET FUNDS - 0.2% | | | | | | | | |
| | 5,197,620 | | | Fidelity Money Market Government Portfolio, Class I, 5.20%(g) (Cost $5,197,620) | | | | | | | 5,197,620 | |
| | | | | | | | | | | | | |
| | | | | TOTAL INVESTMENTS - 99.9% (Cost $2,142,385,231) | | | | | | $ | 3,344,396,366 | |
| | | | | OTHER ASSETS IN EXCESS OF LIABILITIES- 0.1% | | | | | | | 4,940,764 | |
| | | | | NET ASSETS - 100.0% | | | | | | $ | 3,349,337,130 | |
| ADR | - American Depositary Receipt |
| | |
| CVR | - Contingent Value Rights |
| | |
| LTD | - Limited Company |
| | |
| NV | - Naamioze Vennootschap |
| | |
| PIPE | - Private Investment in Public Equity |
| | |
| PLC | - Public Limited Company |
| (a) | Non-income producing security. |
| (b) | Affiliated Company – Eventide Gilead Fund holds in excess of 5% of outstanding voting securities of this security. |
| (c) | Illiquid security. The total fair value of these securities as of June 30, 2024 was $91,383,488, representing 2.7% of net assets. |
| (d) | The value of this security has been determined in good faith under policies of the Board of Trustees. |
| (f) | Restricted security. See Note 6 for additional details. |
| (g) | Rate disclosed is the seven day effective yield as of June 30, 2024. |
See accompanying notes to financial statements.
| EVENTIDE HEALTHCARE & LIFE SCIENCES FUND |
| SCHEDULE OF INVESTMENTS |
| June 30, 2024 |
| Shares | | | | | Fair Value | |
| | | | | COMMON STOCKS — 88.9% | | | | |
| | | | | BIOTECH & PHARMA – 74.6% | | | | |
| | 881,157 | | | 4D Molecular Therapeutics, Inc.(a) | | $ | 18,495,485 | |
| | 87,000 | | | Alnylam Pharmaceuticals, Inc.(a) | | | 21,141,000 | |
| | 568,324 | | | AnaptysBio, Inc.(a) | | | 14,242,199 | |
| | 209,794 | | | Apellis Pharmaceuticals, Inc.(a) | | | 8,047,698 | |
| | 4,087,881 | | | Ardelyx, Inc.(a) | | | 30,291,198 | |
| | 63,059 | | | Argenx S.E. - ADR(a) | | | 27,117,893 | |
| | 463,894 | | | Arrowhead Pharmaceuticals, Inc.(a) | | | 12,056,605 | |
| | 5,802,682 | | | Aura Biosciences, Inc.(a),(b) | | | 43,868,276 | |
| | 375,924 | | | Avidity Biosciences, Inc.(a) | | | 15,356,495 | |
| | 497,354 | | | Axsome Therapeutics, Inc.(a) | | | 40,036,997 | |
| | 634,664 | | | Biohaven Ltd.(a) | | | 22,029,187 | |
| | 231,685 | | | Blueprint Medicines Corporation(a) | | | 24,971,009 | |
| | 579,414 | | | Bridgebio Pharma, Inc.(a) | | | 14,676,557 | |
| | 1,560,598 | | | Celldex Therapeutics, Inc.(a) | | | 57,757,731 | |
| | 490,000 | | | Cerevel Therapeutics Holdings, Inc.(a) | | | 20,036,100 | |
| | 1,398,992 | | | Cogent Biosciences, Inc.(a) | | | 11,793,503 | |
| | 1,285,217 | | | Collegium Pharmaceutical, Inc.(a) | | | 41,383,987 | |
| | 735,088 | | | Crinetics Pharmaceuticals, Inc.(a) | | | 32,924,592 | |
| | 254,148 | | | Cytokinetics, Inc.(a) | | | 13,769,739 | |
| | 1,585,771 | | | Dynavax Technologies Corporation(a) | | | 17,808,208 | |
| | 485,000 | | | Dyne Therapeutics, Inc.(a) | | | 17,115,650 | |
| | 6,356,182 | | | Geron Corporation(a) | | | 26,950,212 | |
| | 1,452,334 | | | Guardant Health, Inc.(a) | | | 41,943,406 | |
| | 335,000 | | | Ideaya Biosciences, Inc.(a) | | | 11,761,850 | |
| | 3,936,220 | | | Inozyme Pharma, Inc.(a),(b) | | | 17,555,541 | |
| | 675,185 | | | Insmed, Inc.(a) | | | 45,237,395 | |
| | 499,208 | | | Keros Therapeutics, Inc.(a) | | | 22,813,806 | |
| | 160,047 | | | Korro Bio, Inc.(a) | | | 5,420,792 | |
| | 136,485 | | | Krystal Biotech, Inc.(a) | | | 25,064,105 | |
| | 462,099 | | | Kymera Therapeutics, Inc.(a) | | | 13,793,655 | |
See accompanying notes to financial statements.
| EVENTIDE HEALTHCARE & LIFE SCIENCES FUND |
| SCHEDULE OF INVESTMENTS (Continued) |
| June 30, 2024 |
| Shares | | | | | Fair Value | |
| | | | | COMMON STOCKS — 88.9% (Continued) | | | | |
| | | | | BIOTECH & PHARMA – 74.6% (Continued) | | | | |
| | 2,081,301 | | | Lexeo Therapeutics, Inc.(a),(b) | | $ | 33,384,068 | |
| | 133,333 | | | Metagenomi, Inc.(a) | | | 543,999 | |
| | 1,684,814 | | | Mirum Pharmaceuticals, Inc.(a) | | | 57,603,790 | |
| | 7,529,096 | | | Nektar Therapeutics(a) | | | 9,336,079 | |
| | 2,378 | | | Ocular Therapeutix, Inc.(a) | | | 16,266 | |
| | 50,000 | | | Rapport Therapeutics, Inc.(a) | | | 1,163,000 | |
| | 650,826 | | | REVOLUTION Medicines, Inc.(a) | | | 25,258,557 | |
| | 770,691 | | | Rocket Pharmaceuticals, Inc.(a) | | | 16,592,977 | |
| | 228,529 | | | Sarepta Therapeutics, Inc.(a) | | | 36,107,582 | |
| | 1,686,602 | | | Scholar Rock Holding Corporation(a) | | | 14,049,395 | |
| | 718,814 | | | TG Therapeutics, Inc.(a) | | | 12,787,701 | |
| | 214,000 | | | TransMedics Group, Inc.(a) | | | 32,232,680 | |
| | 458,317 | | | Turnstone Biologics Corporation(a) | | | 1,200,791 | |
| | 67,825 | | | United Therapeutics Corporation(a) | | | 21,605,654 | |
| | 739,153 | | | Vaxcyte, Inc.(a) | | | 55,813,443 | |
| | 527,781 | | | Verona Pharma plc - ADR(a) | | | 7,631,713 | |
| | 252,969 | | | Viking Therapeutics, Inc.(a) | | | 13,409,887 | |
| | 4,948,595 | | | Zentalis Pharmaceuticals, Inc.(a),(b) | | | 20,239,754 | |
| | | | | | | | 1,074,438,207 | |
| | | | | MEDICAL EQUIPMENT & DEVICES - 11.1% | | | | |
| | 1,535,000 | | | Celcuity, Inc.(a) | | | 25,143,300 | |
| | 565,546 | | | Exact Sciences Corporation(a) | | | 23,894,319 | |
| | 63,542 | | | Glaukos Corporation(a) | | | 7,520,196 | |
| | 619,649 | | | Inari Medical, Inc.(a) | | | 29,836,098 | |
| | 125,090 | | | Inspire Medical Systems, Inc.(a) | | | 16,740,795 | |
| | 272,092 | | | iRhythm Technologies, Inc.(a) | | | 29,287,983 | |
| | 119,000 | | | Repligen Corporation(a) | | | 15,001,140 | |
| | 564,000 | | | Veracyte, Inc.(a) | | | 12,221,880 | |
| | | | | | | | 159,645,711 | |
See accompanying notes to financial statements.
| EVENTIDE HEALTHCARE & LIFE SCIENCES FUND |
| SCHEDULE OF INVESTMENTS (Continued) |
| June 30, 2024 |
| Shares | | | | | Fair Value | |
| | | | | COMMON STOCKS — 88.9% (Continued) | | | | |
| | | | | SOFTWARE - 3.2% | | | | |
| | 1,445,064 | | | Evolent Health, Inc., Class A(a) | | $ | 27,629,623 | |
| | 76,207 | | | Privia Health Group, Inc.(a) | | | 1,324,478 | |
| | 1,375,980 | | | R1 RCM, Inc.(a) | | | 17,282,309 | |
| | | | | | | | 46,236,410 | |
| | | | | | | | | |
| | | | | TOTAL COMMON STOCKS (Cost $1,150,698,424) | | | 1,280,320,328 | |
| | | | | | | | | |
| Shares | | | | | Fair Value | |
| | | | | CONTINGENT VALUE RIGHTS — 0.1% | | | | |
| | | | | BIOTECH & PHARMA - 0.1% | | | | |
| | 1,528,871 | | | Peloton Therapeutics, Inc. - CVR(a),(c),(d),(e),(f) | | | 1,291,743 | |
| | | | | | | | | |
| | | | | TOTAL CONTINGENT VALUE RIGHTS (Cost $–) | | | 1,291,743 | |
| | | | | | | | | |
| Shares | | | | | Fair Value | |
| | | | | PRIVATE INVESTMENTS — 7.2% | | | | |
| | | | | BIOTECH & PHARMA — 5.7% | | | | |
| | 4,643,043 | | | Arch Oncology, Inc. Series C1(a),(c),(d),(e),(f) | | | 128,798 | |
| | 20,482,289 | | | Avalyn Pharma Inc. Series C1(a),(c),(d),(e),(f) | | | 15,000,000 | |
| | 295,276 | | | BioSplice Therapeutics, Inc. Series B-1(a),(c),(d),(e),(f) | | | — | |
| | 137,513 | | | Bridgebio Pharma Inc. PIPE(a),(c),(e),(f),(g) | | | 3,483,204 | |
| | 5,000,000 | | | Casma Therapeutics, Inc. Series B1(a),(b),(c),(d),(e),(f) | | | 1,046,500 | |
| | 5,000,000 | | | Casma Therapeutics, Inc. Series B2(a),(b),(c),(d),(e),(f) | | | 1,046,500 | |
| | 1,820,413 | | | Casma Therapeutics, Inc. Series C1(a),(b),(c),(d),(e),(f) | | | 381,013 | |
| | 1,979,882 | | | Casma Therapeutics, Inc. Series C2(a),(b),(c),(d),(e),(f) | | | 414,389 | |
| | 1,017,770 | | | Evida BioSciences, Inc.(a),(b),(c),(d),(e),(f) | | | 702,261 | |
| | 1,097,561 | | | Flare Therapeutics, Inc. Series A(a),(c),(d),(e),(f) | | | 1,320,366 | |
| | 902,439 | | | Flare Therapeutics, Inc. Series A2(a),(c),(d),(e),(f) | | | 1,085,634 | |
| | 1,952,962 | | | Flare Therapeutics, Inc. Series B(a),(c),(d),(e),(f) | | | 2,349,413 | |
| | 930,436 | | | Freenome Holdings, Inc. Series D(a),(c),(d),(e),(f) | | | 1,526,101 | |
| | 133,941 | | | Freenome Holdings, Inc. Series F(a),(c),(d),(e),(f) | | | 219,690 | |
| | 5,000,000 | | | Goldfinch Biopharma, Inc. Series A(a),(b),(c),(d),(e),(f) | | | — | |
| | 8,474,576 | | | Goldfinch Biopharma, Inc. Series B(a),(b),(c),(d),(e),(f) | | | — | |
| | 4,237,288 | | | Goldfinch Biopharma, Inc. Series B2(a),(b),(c),(d),(e),(f) | | | — | |
See accompanying notes to financial statements.
| EVENTIDE HEALTHCARE & LIFE SCIENCES FUND |
| SCHEDULE OF INVESTMENTS (Continued) |
| June 30, 2024 |
| Shares | | | | | | | | | Fair Value | |
| | | | | PRIVATE INVESTMENTS — 7.2% (Continued) | | | | | | | | |
| | | | | BIOTECH & PHARMA — 5.7% (Continued) | | | | | | | | |
| | 763,319 | | | Kojin Therapeutics, Inc. Series A-1(a),(c),(d),(e),(f) | | | | | | $ | 467,228 | |
| | 763,319 | | | Kojin Therapeutics, Inc. Series A-2(a),(c),(d),(e),(f) | | | | | | | 467,228 | |
| | 369,108 | | | Korro Bio, Inc.(a),(b),(c),(f) | | | | | | | 12,501,688 | |
| | 1,287,846 | | | Lexeo Therapeutics, Inc.(a),(b),(c),(f) | | | | | | | 20,657,050 | |
| | 449,708 | | | Metagenomi, Inc.(a),(c),(f) | | | | | | | 1,834,809 | |
| | 152,381 | | | Mirum Pharmaceuticals, Inc. PIPE(a),(b),(c),(e),(f) | | | | | | | 5,209,906 | |
| | 1,489,958 | | | Shoreline Biosciences Series B(a),(c),(d),(e),(f) | | | | | | | 12,673,435 | |
| | | | | | | | | | | | 82,515,213 | |
| | | | | MEDICAL EQUIPMENT & DEVICES — 1.5% | | | | | | | | |
| | 940,660 | | | Beta Bionics, Inc. Series B(a),(b),(c),(d),(e),(f) | | | | | | | 7,036,136 | |
| | 809,360 | | | Beta Bionics, Inc. Series B2(a),(b),(c),(d),(e),(f) | | | | | | | 6,159,230 | |
| | 482,026 | | | Beta Bionics, Inc. Series C(a),(b),(c),(d),(e),(f) | | | | | | | 3,566,992 | |
| | 476,190 | | | Beta Bionics, Inc. Series D(a),(b),(c),(d),(e),(f) | | | | | | | 4,414,281 | |
| | | | | | | | | | | | 21,176,639 | |
| | | | | TOTAL PRIVATE INVESTMENTS (Cost $181,463,490) | | | | | | | 103,691,852 | |
| | | | | | | | | | | | | |
| Principal | | | | | Coupon Rate | | | | | | |
| Amount ($) | | | | | (%) | | Maturity | | Fair Value | |
| | | | | CONVERTIBLE BONDS — 0.0%(h) | | | | | | | | |
| | | | | BIOTECH & PHARMA — 0.0%(h) | | | | | | | | |
| | 3,500,000 | | | Biosplice Therapeutics, Inc. Series C PIK(c),(d),(e),(f) | | 1.0500 | | 03/12/25 | | | 394,520 | |
| | | | | | | | | | | | | |
| | | | | TOTAL CONVERTIBLE BONDS (Cost $3,500,000) | | | | | | | 394,520 | |
| | | | | | | | | | | | | |
| Shares | | | | | | | | | Fair Value | |
| | | | | WARRANT — 0.2% | | | | | | | | |
| | | | | BIOTECH & PHARMA - 0.0%(h) | | | | | | | | |
| | 103,150 | | | Biosplice Therapeutics, Inc. Series C Warrant(a),(c),(d),(e),(f) | | | | | | | — | |
See accompanying notes to financial statements.
| EVENTIDE HEALTHCARE & LIFE SCIENCES FUND |
| SCHEDULE OF INVESTMENTS (Continued) |
| June 30, 2024 |
| Shares | | | | | Fair Value | |
| | | | | WARRANT — 0.2% (Continued) | | | | |
| | | | | MEDICAL EQUIPMENT & DEVICES - 0.2% | | | | |
| | 120,500 | | | Beta Bionics, Inc. Series C Warrant(a),(b),(c),(d),(e),(f) | | $ | 891,700 | |
| | 333,333 | | | Beta Bionics, Inc. Series D Warrant(a),(b),(c),(d),(e),(f) | | | 2,233,331 | |
| | | | | | | | 3,125,031 | |
| | | | | | | | | |
| | | | | TOTAL WARRANT (Cost $–) | | | 3,125,031 | |
| | | | | | | | | |
| | | | | SHORT-TERM INVESTMENTS — 0.3% | | | | |
| | | | | MONEY MARKET FUNDS – 0.3% | | | | |
| | 3,394,275 | | | Fidelity Money Market Government Portfolio, Class I, 5.20%(i) (Cost $3,394,275) | | | 3,394,275 | |
| | | | | | | | | |
| | | | | TOTAL INVESTMENTS – 96.7% (Cost $1,339,056,189) | | $ | 1,392,217,749 | |
| | | | | OTHER ASSETS IN EXCESS OF LIABILITIES- 3.3% | | | 47,698,000 | |
| | | | | NET ASSETS - 100.0% | | $ | 1,439,915,749 | |
| ADR | - American Depositary Receipt |
| | |
| CVR | - Contingent Value Rights |
| | |
| LLC | - Limited Liability Company |
| | |
| LTD | - Limited Company |
| | |
| PIK | - Payment in Kind |
| | |
| PIPE | - Private Investment in Public Equity |
| | |
| PLC | - Public Limited Company |
| (a) | Non-income producing security. |
| (b) | Affiliated Company – Eventide Healthcare & Life Sciences Fund holds in excess of 5% of outstanding voting securities of this security. |
| (c) | Illiquid security. The total fair value of these securities as of June 30, 2024 was $108,503,146, representing 7.5% of net assets. |
| (d) | The value of this security has been determined in good faith under policies of the Board of Trustees. |
| (f) | Restricted security. See Note 6 for additional details. |
| (g) | Security exempt from registration under Rule 144A or Section 4(2) of the Securities Act of 1933. The security may be resold in transactions exempt from registration, normally to qualified institutional buyers. As of June 30, 2024 the total market value of 144A securities is $3,483,204 or 0.2% of net assets. |
| (h) | Percentage rounds to less than 0.1%. |
| (i) | Rate disclosed is the seven day effective yield as of June 30, 2024. |
See accompanying notes to financial statements.
| EVENTIDE LARGE CAP FOCUS FUND |
| SCHEDULE OF INVESTMENTS |
| June 30, 2024 |
| Shares | | | | | Fair Value | |
| | | | | COMMON STOCKS — 96.8% | | | | |
| | | | | ADVERTISING & MARKETING - 1.7% | | | | |
| | 18,781 | | | Trade Desk, Inc. (The), Class A(a) | | $ | 1,834,340 | |
| | | | | | | | | |
| | | | | BIOTECH & PHARMA - 6.2% | | | | |
| | 7,150 | | | Amgen, Inc. | | | 2,234,018 | |
| | 1,180 | | | Eli Lilly & Company | | | 1,068,348 | |
| | 122,989 | | | Royalty Pharma plc, Class A | | | 3,243,220 | |
| | | | | | | | 6,545,586 | |
| | | | | CHEMICALS - 8.8% | | | | |
| | 13,363 | | | Linde plc | | | 5,863,818 | |
| | 11,842 | | | Sherwin-Williams Company (The) | | | 3,534,008 | |
| | | | | | | | 9,397,826 | |
| | | | | COMMERCIAL SUPPORT SERVICES - 1.5% | | | | |
| | 8,124 | | | Republic Services, Inc. | | | 1,578,818 | |
| | | | | | | | | |
| | | | | CONTAINERS & PACKAGING - 0.9% | | | | |
| | 22,018 | | | International Paper Company | | | 950,077 | |
| | | | | | | | | |
| | | | | ELECTRIC UTILITIES - 6.0% | | | | |
| | 6,474 | | | Constellation Energy Corporation | | | 1,296,548 | |
| | 22,140 | | | Public Service Enterprise Group, Inc. | | | 1,631,718 | |
| | 44,200 | | | Southern Company (The) | | | 3,428,594 | |
| | | | | | | | 6,356,860 | |
| | | | | ELECTRICAL EQUIPMENT - 5.6% | | | | |
| | 30,420 | | | Otis Worldwide Corporation | | | 2,928,229 | |
| | 9,077 | | | Trane Technologies PLC | | | 2,985,697 | |
| | | | | | | | 5,913,926 | |
| | | | | HOME CONSTRUCTION - 3.2% | | | | |
| | 24,279 | | | DR Horton, Inc. | | | 3,421,639 | |
| | | | | | | | | |
| | | | | INDUSTRIAL SUPPORT SERVICES - 3.4% | | | | |
| | 18,835 | | | Ferguson PLC | | | 3,647,398 | |
See accompanying notes to financial statements.
| EVENTIDE LARGE CAP FOCUS FUND |
| SCHEDULE OF INVESTMENTS (Continued) |
| June 30, 2024 |
| Shares | | | | | Fair Value | |
| | | | | COMMON STOCKS — 96.8% (Continued) | | | | |
| | | | | INSTITUTIONAL FINANCIAL SERVICES - 2.3% | | | | |
| | 18,211 | | | Houlihan Lokey, Inc. | | $ | 2,455,935 | |
| | | | | | | | | |
| | | | | INSURANCE - 1.9% | | | | |
| | 7,931 | | | Arthur J Gallagher & Company | | | 2,056,588 | |
| | | | | | | | | |
| | | | | MEDICAL EQUIPMENT & DEVICES - 2.3% | | | | |
| | 1,781 | | | Mettler-Toledo International, Inc.(a) | | | 2,489,108 | |
| | | | | | | | | |
| | | | | OIL & GAS PRODUCERS - 5.8% | | | | |
| | 21,238 | | | EOG Resources, Inc. | | | 2,673,227 | |
| | 81,412 | | | Williams Companies, Inc. (The) | | | 3,460,010 | |
| | | | | | | | 6,133,237 | |
| | | | | RETAIL - DISCRETIONARY - 9.6% | | | | |
| | 5,955 | | | Group 1 Automotive, Inc. | | | 1,770,302 | |
| | 5,267 | | | Home Depot, Inc. (The) | | | 1,813,112 | |
| | 5,338 | | | Lithia Motors, Inc. | | | 1,347,578 | |
| | 7,991 | | | Lowe’s Companies, Inc. | | | 1,761,696 | |
| | 3,282 | | | O’Reilly Automotive, Inc.(a) | | | 3,465,990 | |
| | | | | | | | 10,158,678 | |
| | | | | SEMICONDUCTORS - 14.2% | | | | |
| | 2,547 | | | KLA Corporation | | | 2,100,027 | |
| | 5,010 | | | Lam Research Corporation | | | 5,334,899 | |
| | 8,482 | | | Micron Technology, Inc. | | | 1,115,637 | |
| | 17,819 | | | NVIDIA Corporation | | | 2,201,359 | |
| | 24,688 | | | Taiwan Semiconductor Manufacturing Company Ltd. - ADR | | | 4,291,021 | |
| | | | | | | | 15,042,943 | |
| | | | | SOFTWARE - 13.5% | | | | |
| | 15,183 | | | Datadog, Inc., Class A(a) | | | 1,969,083 | |
| | 3,573 | | | Intuit, Inc. | | | 2,348,211 | |
| | 35,717 | | | Nutanix, Inc., Class A(a) | | | 2,030,511 | |
| | 5,751 | | | Roper Technologies, Inc. | | | 3,241,610 | |
| | 2,117 | | | ServiceNow, Inc.(a) | | | 1,665,380 | |
| | 2,412 | | | Synopsys, Inc.(a) | | | 1,435,285 | |
See accompanying notes to financial statements.
| EVENTIDE LARGE CAP FOCUS FUND |
| SCHEDULE OF INVESTMENTS (Continued) |
| June 30, 2024 |
| Shares | | | | | Fair Value | |
| | | | | COMMON STOCKS — 96.8% (Continued) | | | | |
| | | | | SOFTWARE - 13.5% (Continued) | | | | |
| | 7,112 | | | Workday, Inc., Class A(a) | | $ | 1,589,959 | |
| | | | | | | | 14,280,039 | |
| | | | | TECHNOLOGY HARDWARE - 2.0% | | | | |
| | 16,400 | | | NetApp, Inc. | | | 2,112,320 | |
| | | | | | | | | |
| | | | | TECHNOLOGY SERVICES - 5.6% | | | | |
| | 4,477 | | | CDW Corporation | | | 1,002,132 | |
| | 11,146 | | | S&P Global, Inc. | | | 4,971,116 | |
| | | | | | | | 5,973,248 | |
| | | | | TRANSPORTATION & LOGISTICS - 2.3% | | | | |
| | 5,349 | | | Old Dominion Freight Line, Inc. | | | 944,633 | |
| | 6,628 | | | Union Pacific Corporation | | | 1,499,652 | |
| | | | | | | | 2,444,285 | |
| | | | | | | | | |
| | | | | TOTAL COMMON STOCKS (Cost $95,268,290) | | | 102,792,851 | |
| | | | | | | | | |
| Shares | | | | | Fair Value | |
| | | | | WARRANT — 0.0%(b) | | | | |
| | | | | SOFTWARE - 0.0% (b) | | | | |
| | 252 | | | Constellation Software, Inc. (Canada) (a),(c),(d) | | | — | |
| | | | | | | | | |
| | | | | TOTAL WARRANT (Cost $–) | | | — | |
| | | | | | | | | |
| | | | | TOTAL INVESTMENTS - 96.8% (Cost $95,268,290) | | $ | 102,792,851 | |
| | | | | OTHER ASSETS IN EXCESS OF LIABILITIES- 3.2% | | | 3,390,332 | |
| | | | | NET ASSETS - 100.0% | | $ | 106,183,183 | |
| ADR | - American Depositary Receipt |
| | |
| LTD | - Limited Company |
| | |
| PLC | - Public Limited Company |
| (a) | Non-income producing security. |
| (b) | Percentage rounds to less than 0.1%. |
| (c) | Illiquid security. The total fair value of these securities as of June 30, 2024, was $0, representing 0.0% of net assets. |
| (d) | The value of this security has been determined in good faith under policies of the Board of Trustees. |
See accompanying notes to financial statements.
| EVENTIDE LIMITED-TERM BOND FUND |
| SCHEDULE OF INVESTMENTS |
| June 30, 2024 |
| Principal | | | | | | | Coupon Rate | | | | | |
| Amount ($) | | | | | Spread | | (%) | | Maturity | | Fair Value | |
| | | | | ASSET BACKED SECURITIES — 4.7% | | | | | | | | | | |
| | | | | AUTO LOAN — 3.3% | | | | | | | | | | |
| | 2,600,000 | | | CarMax Auto Owner Trust Series 2020-4 C | | | | 1.3000 | | 08/17/26 | | $ | 2,545,766 | |
| | 1,000,000 | | | CarMax Auto Owner Trust Series 2021-2 C | | | | 1.3400 | | 02/16/27 | | | 959,894 | |
| | 1,500,000 | | | CarMax Auto Owner Trust Series 2021-2 D | | | | 1.5500 | | 10/15/27 | | | 1,438,868 | |
| | | | | | | | | | | | | | 4,944,528 | |
| | | | | OTHER ABS — 1.4% | | | | | | | | | | |
| | 1,975,000 | | | PFS Financing Corporation Series C A(a),(b) | | SOFR30A + 0.800% | | 6.1330 | | 04/17/28 | | | 1,978,437 | |
| | | | | | | | | | | | | | | |
| | | | | TOTAL ASSET BACKED SECURITIES (Cost $7,085,146) | | | | | | | | | 6,922,965 | |
| | | | | | | | | | | | | | | |
| Principal | | | | | | | Coupon Rate | | | | | | |
| Amount ($) | | | | | Spread | | (%) | | Maturity | | | Fair Value | |
| | | | | CORPORATE BONDS — 63.0% | | | | | | | | | | |
| | | | | AUTOMOTIVE — 1.8% | | | | | | | | | | |
| | 1,250,000 | | | Dana, Inc. | | | | 4.2500 | | 09/01/30 | | | 1,092,228 | |
| | 1,500,000 | | | Honda Motor Company Ltd. | | | | 2.2710 | | 03/10/25 | | | 1,467,233 | |
| | | | | | | | | | | | | | 2,559,461 | |
| | | | | BANKING — 5.9% | | | | | | | | | | |
| | 3,000,000 | | | Bank of America Corporation Series N(b) | | TSFR3M + 1.132% | | 2.4560 | | 10/22/25 | | | 2,969,129 | |
| | 2,975,000 | | | JPMorgan Chase & Company(b) | | SOFRRATE + 1.330% | | 6.0700 | | 10/22/27 | | | 3,027,722 | |
| | 2,750,000 | | | Royal Bank of Canada | | | | 1.1500 | | 07/14/26 | | | 2,535,245 | |
| | | | | | | | | | | | | | 8,532,096 | |
| | | | | BIOTECH & PHARMA — 1.3% | | | | | | | | | | |
| | 2,000,000 | | | Zoetis, Inc. | | | | 3.9000 | | 08/20/28 | | | 1,911,116 | |
| | | | | | | | | | | | | | | |
| | | | | CONSTRUCTION MATERIALS — 0.9% | | | | | | | | | | |
| | 1,350,000 | | | Advanced Drainage Systems, Inc.(a) | | | | 5.0000 | | 09/30/27 | | | 1,321,812 | |
| | | | | | | | | | | | | | | |
| | | | | ELECTRIC UTILITIES — 11.4% | | | | | | | | | | |
| | 2,000,000 | | | AES Corporation (The) | | | | 1.3750 | | 01/15/26 | | | 1,874,887 | |
| | 1,500,000 | | | Avangrid, Inc. | | | | 3.1500 | | 12/01/24 | | | 1,483,702 | |
| | 2,000,000 | | | Constellation Energy Generation, LLC | | | | 5.6000 | | 03/01/28 | | | 2,027,490 | |
| | 2,500,000 | | | Duke Energy Florida, LLC | | | | 2.5000 | | 12/01/29 | | | 2,208,733 | |
| | 1,525,000 | | | Georgia Power Company Series 2016-A | | | | 3.2500 | | 04/01/26 | | | 1,474,713 | |
| | 2,650,000 | | | MidAmerican Energy Company | | | | 3.1000 | | 05/01/27 | | | 2,529,189 | |
See accompanying notes to financial statements.
| EVENTIDE LIMITED-TERM BOND FUND |
| SCHEDULE OF INVESTMENTS (Continued) |
| June 30, 2024 |
| Principal | | | | | | | Coupon Rate | | | | | |
| Amount ($) | | | | | Spread | | (%) | | Maturity | | Fair Value | |
| | | | | CORPORATE BONDS — 63.0% (Continued) | | | | | | | | | | |
| | | | | ELECTRIC UTILITIES — 11.4% (Continued) | | | | | | | | | | |
| | 2,500,000 | | | National Rural Utilities Cooperative Finance | | | | 4.8500 | | 02/07/29 | | $ | 2,486,943 | |
| | 1,000,000 | | | NextEra Energy Capital Holdings, Inc. | | | | 4.9000 | | 02/28/28 | | | 991,214 | |
| | 1,650,000 | | | NextEra Energy Capital Holdings, Inc.(b) | | US0003M + 2.409% | | 4.8000 | | 12/01/77 | | | 1,530,155 | |
| | | | | | | | | | | | | | 16,607,026 | |
| | | | | ELECTRICAL EQUIPMENT — 1.6% | | | | | | | | | | |
| | 2,350,000 | | | Lennox International, Inc. | | | | 5.5000 | | 09/15/28 | | | 2,378,926 | |
| | | | | | | | | | | | | | | |
| | | | | ENGINEERING & CONSTRUCTION — 3.7% | | | | | | | | | | |
| | 1,425,000 | | | Installed Building Products, Inc.(a) | | | | 5.7500 | | 02/01/28 | | | 1,394,881 | |
| | 1,850,000 | | | MasTec, Inc.(a) | | | | 4.5000 | | 08/15/28 | | | 1,766,018 | |
| | 1,500,000 | | | Quanta Services, Inc. | | | | 0.9500 | | 10/01/24 | | | 1,480,822 | |
| | 825,000 | | | Quanta Services, Inc. | | | | 2.9000 | | 10/01/30 | | | 727,928 | |
| | | | | | | | | | | | | | 5,369,649 | |
| | | | | FORESTRY, PAPER & WOOD PRODUCTS — 0.9% | | | | | | | | | | |
| | 1,375,000 | | | Louisiana-Pacific Corporation(a) | | | | 3.6250 | | 03/15/29 | | | 1,248,943 | |
| | | | | | | | | | | | | | | |
| | | | | HOME & OFFICE PRODUCTS — 0.8% | | | | | | | | | | |
| | 1,250,000 | | | Tempur Sealy International, Inc.(a) | | | | 4.0000 | | 04/15/29 | | | 1,129,106 | |
| | | | | | | | | | | | | | | |
| | | | | HOME CONSTRUCTION — 1.0% | | | | | | | | | | |
| | 1,500,000 | | | M/I Homes, Inc. | | | | 4.9500 | | 02/01/28 | | | 1,448,084 | |
| | | | | | | | | | | | | | | |
| | | | | INDUSTRIAL SUPPORT SERVICES — 0.9% | | | | | | | | | | |
| | 1,450,000 | | | United Rentals North America, Inc. | | | | 3.8750 | | 11/15/27 | | | 1,370,919 | |
| | | | | | | | | | | | | | | |
| | | | | INSTITUTIONAL FINANCIAL SERVICES — 3.8% | | | | | | | | | | |
| | 3,000,000 | | | Morgan Stanley(b) | | SOFRRATE + 0.745% | | 0.8640 | | 10/21/25 | | | 2,953,878 | |
| | 2,500,000 | | | Nasdaq, Inc. | | | | 5.3500 | | 06/28/28 | | | 2,524,877 | |
| | | | | | | | | | | | | | 5,478,755 | |
| | | | | INSURANCE — 4.2% | | | | | | | | | | |
| | 2,750,000 | | | Aflac, Inc. | | | | 1.1250 | | 03/15/26 | | | 2,568,873 | |
| | 2,300,000 | | | Brown & Brown, Inc. | | | | 4.2000 | | 09/15/24 | | | 2,290,535 | |
See accompanying notes to financial statements.
| EVENTIDE LIMITED-TERM BOND FUND |
| SCHEDULE OF INVESTMENTS (Continued) |
| June 30, 2024 |
| Principal | | | | | | | Coupon Rate | | | | | |
| Amount ($) | | | | | Spread | | (%) | | Maturity | | Fair Value | |
| | | | | CORPORATE BONDS — 63.0% (Continued) | | | | | | | | | | |
| | | | | INSURANCE — 4.2% (Continued) | | | | | | | | | | |
| | 1,425,000 | | | Pacific Life Global Funding II(a) | | | | 1.3750 | | 04/14/26 | | $ | 1,331,617 | |
| | | | | | | | | | | | | | 6,191,025 | |
| | | | | | | | | | | | | | | |
| | | | | MACHINERY — 2.3% | | | | | | | | | | |
| | 1,500,000 | | | Mueller Water Products, Inc.(a) | | | | 4.0000 | | 06/15/29 | | | 1,374,815 | |
| | 2,250,000 | | | Xylem, Inc./NY | | | | 1.9500 | | 01/30/28 | | | 2,020,998 | |
| | | | | | | | | | | | | | 3,395,813 | |
| | | | | OIL & GAS PRODUCERS — 3.9% | | | | | | | | | | |
| | 2,200,000 | | | Cheniere Energy Partners, L.P. | | | | 4.5000 | | 10/01/29 | | | 2,097,253 | |
| | 2,400,000 | | | Diamondback Energy, Inc. | | | | 3.5000 | | 12/01/29 | | | 2,215,667 | |
| | 1,400,000 | | | EQT Corporation | | | | 5.7000 | | 04/01/28 | | | 1,414,734 | |
| | | | | | | | | | | | | | 5,727,654 | |
| | | | | REAL ESTATE INVESTMENT TRUSTS — 6.5% | | | | | | | | | | |
| | 1,675,000 | | | Alexandria Real Estate Equities, Inc. | | | | 3.8000 | | 04/15/26 | | | 1,628,395 | |
| | 2,000,000 | | | American Tower Corporation | | | | 5.2500 | | 07/15/28 | | | 1,997,634 | |
| | 2,250,000 | | | Equinix, Inc. | | | | 1.5500 | | 03/15/28 | | | 1,969,432 | |
| | 1,650,000 | | | HAT Holdings I, LLC / HAT Holdings II, LLC(a) | | | | 3.3750 | | 06/15/26 | | | 1,558,381 | |
| | 2,500,000 | | | Welltower OP, LLC | | | | 2.7000 | | 02/15/27 | | | 2,357,109 | |
| | | | | | | | | | | | | | 9,510,951 | |
| | | | | RETAIL - DISCRETIONARY — 5.5% | | | | | | | | | | |
| | 1,500,000 | | | Asbury Automotive Group, Inc. | | | | 4.5000 | | 03/01/28 | | | 1,423,398 | |
| | 2,500,000 | | | AutoZone, Inc. | | | | 4.5000 | | 02/01/28 | | | 2,446,812 | |
| | 1,500,000 | | | Builders FirstSource, Inc.(a) | | | | 5.0000 | | 03/01/30 | | | 1,421,002 | |
| | 1,650,000 | | | Home Depot, Inc. (The) | | | | 4.8750 | | 06/25/27 | | | 1,647,418 | |
| | 1,000,000 | | | Patrick Industries, Inc.(a) | | | | 7.5000 | | 10/15/27 | | | 1,011,028 | |
| | | | | | | | | | | | | | 7,949,658 | |
| | | | | SEMICONDUCTORS — 2.0% | | | | | | | | | | |
| | 1,725,000 | | | NXP BV / NXP Funding, LLC / NXP USA, Inc. | | | | 2.5000 | | 05/11/31 | | | 1,449,039 | |
| | 1,625,000 | | | Synaptics, Inc.(a) | | | | 4.0000 | | 06/15/29 | | | 1,475,237 | |
| | | | | | | | | | | | | | 2,924,276 | |
| | | | | SOFTWARE — 3.0% | | | | | | | | | | |
| | 2,550,000 | | | Roper Technologies, Inc. | | | | 4.2000 | | 09/15/28 | | | 2,467,099 | |
| | 2,000,000 | | | Workday, Inc. | | | | 3.5000 | | 04/01/27 | | | 1,914,154 | |
| | | | | | | | | | | | | | 4,381,253 | |
See accompanying notes to financial statements.
| EVENTIDE LIMITED-TERM BOND FUND |
| SCHEDULE OF INVESTMENTS (Continued) |
| June 30, 2024 |
| Principal | | | | | | | Coupon Rate | | | | | |
| Amount ($) | | | | | Spread | | (%) | | Maturity | | Fair Value | |
| | | | | CORPORATE BONDS — 63.0% (Continued) | | | | | | | | | | |
| | | | | TECHNOLOGY SERVICES — 0.2% | | | | | | | | | | |
| | 281,000 | | | Verisk Analytics, Inc. | | | | 4.0000 | | 06/15/25 | | $ | 276,456 | |
| | | | | | | | | | | | | | | |
| | | | | WHOLESALE - CONSUMER STAPLES — 1.4% | | | | | | | | | | |
| | 1,000,000 | | | Sysco Corporation | | | | 3.7500 | | 10/01/25 | | | 979,246 | |
| | 1,250,000 | | | Sysco Corporation | | | | 2.4000 | | 02/15/30 | | | 1,084,453 | |
| | | | | | | | | | | | | | 2,063,699 | |
| | | | | TOTAL CORPORATE BONDS (Cost $93,860,673) | | | | | | | | | 91,776,678 | |
| | | | | | | | | | | | | | | |
| Principal | | | | | | | Coupon Rate | | | | | | |
| Amount ($) | | | | | | | (%) | | Maturity | | Fair Value | |
| | | | | MUNICIPAL BONDS — 7.9% | | | | | | | | | | |
| | | | | COMBINED UTILITIES — 1.1% | | | | | | | | | | |
| | 1,525,000 | | | City of Tacoma, WA Electric System Revenue | | | | 5.6410 | | 01/01/27 | | | 1,540,139 | |
| | | | | | | | | | | | | | | |
| | | | | COUNTY — 0.7% | | | | | | | | | | |
| | 1,115,000 | | | City & County of Honolulu, HI | | | | 2.5180 | | 10/01/26 | | | 1,060,211 | |
| | | | | | | | | | | | | | | |
| | | | | MISCELLANEOUS TAX — 1.4% | | | | | | | | | | |
| | 2,050,000 | | | Commonwealth of Massachusetts | | | | 3.6390 | | 07/15/24 | | | 2,048,552 | |
| | | | | | | | | | | | | | | |
| | | | | MULTI-FAMILY HOUSING — 0.2% | | | | | | | | | | |
| | 250,000 | | | New York State Housing Finance Agency | | | | 2.2000 | | 11/01/24 | | | 247,300 | |
| | | | | | | | | | | | | | | |
| | | | | SINGLE-FAMILY HOUSING — 2.7% | | | | | | | | | | |
| | 305,000 | | | Illinois Housing Development Authority | | | | 5.0940 | | 04/01/30 | | | 306,657 | |
| | 1,000,000 | | | Illinois Housing Development Authority | | | | 5.2440 | | 04/01/31 | | | 1,008,384 | |
| | 35,000 | | | Maryland Community Development Administration | | | | 3.2420 | | 09/01/48 | | | 34,124 | |
| | 2,150,000 | | | Virginia Housing Development Authority | | | | 4.8570 | | 10/01/29 | | | 2,138,999 | |
| | 500,000 | | | Virginia Housing Development Authority | | | | 4.9140 | | 04/01/30 | | | 497,632 | |
| | | | | | | | | | | | | | 3,985,796 | |
| | | | | STATE — 0.5% | | | | | | | | | | |
| | 500,000 | | | State of Oregon | | | | 0.8120 | | 11/01/24 | | | 492,510 | |
| | 300,000 | | | State of Oregon | | | | 0.8950 | | 05/01/25 | | | 289,527 | |
| | | | | | | | | | | | | | 782,037 | |
See accompanying notes to financial statements.
| EVENTIDE LIMITED-TERM BOND FUND |
| SCHEDULE OF INVESTMENTS (Continued) |
| June 30, 2024 |
| Principal | | | | | | | Coupon Rate | | | | | |
| Amount ($) | | | | | | | (%) | | Maturity | | Fair Value | |
| | | | | MUNICIPAL BONDS — 7.9% (Continued) | | | | | | | | | | |
| | | | | WATER AND SEWER — 1.3% | | | | | | | | | | |
| | 2,000,000 | | | Boston Water & Sewer Commission | | | | 0.9650 | | 11/01/25 | | $ | 1,895,288 | |
| | | | | | | | | | | | | | | |
| | | | | TOTAL MUNICIPAL BONDS (Cost $11,866,163) | | | | | | | | | 11,559,323 | |
| | | | | | | | | | | | | | | |
| Principal | | | | | | | Coupon Rate | | | | | | |
| Amount ($) | | | | | Spread | | (%) | | Maturity | | Fair Value | |
| | | | | U.S. GOVERNMENT & AGENCIES — 21.7% | | | | | | | | | | |
| | | | | AGENCY FIXED RATE — 4.6% | | | | | | | | | | |
| | 2,048,428 | | | Fannie Mae Pool MA4805 | | | | 4.5000 | | 11/01/52 | | | 1,936,187 | |
| | 1,591,358 | | | Freddie Mac Pool SD8237 | | | | 4.0000 | | 08/01/52 | | | 1,459,724 | |
| | 2,322,881 | | | Freddie Mac Pool SD8258 | | | | 5.0000 | | 10/01/52 | | | 2,254,576 | |
| | 1,138,408 | | | Ginnie Mae II Pool MA7107 | | | | 2.5000 | | 01/20/36 | | | 1,032,584 | |
| | | | | | | | | | | | | | 6,683,071 | |
| | | | | AGENCY HYBRID ARMS — 0.0%(c) | | | | | | | | | | |
| | 5,804 | | | Ginnie Mae II Pool 82903(b) | | H15T1Y + 1.500% | | 3.6250 | | 08/20/41 | | | 5,803 | |
| | | | | | | | | | | | | | | |
| | | | | ARMS — 0.0%(d) | | | | | | | | | | |
| | 1,652 | | | Fannie Mae Pool 791573(b) | | H15T1Y + 2.170% | | 6.1700 | | 08/01/34 | | | 1,678 | |
| | 26 | | | Ginnie Mae II Pool 8502(b) | | H15T1Y + 1.500% | | 3.6250 | | 09/20/24 | | | 26 | |
| | 35 | | | Ginnie Mae II Pool 8503(b) | | H15T1Y + 1.500% | | 3.6250 | | 09/20/24 | | | 35 | |
| | 81 | | | Ginnie Mae II Pool 8565(b) | | H15T1Y + 1.500% | | 4.0000 | | 12/20/24 | | | 81 | |
| | 242 | | | Ginnie Mae II Pool 8567(b) | | H15T1Y + 1.500% | | 4.5000 | | 12/20/24 | | | 241 | |
| | 686 | | | Ginnie Mae II Pool 8595(b) | | H15T1Y + 1.500% | | 4.6250 | | 02/20/25 | | | 681 | |
| | 253 | | | Ginnie Mae II Pool 8660(b) | | H15T1Y + 1.500% | | 3.6250 | | 07/20/25 | | | 251 | |
| | 10,709 | | | Ginnie Mae II Pool 80569(b) | | H15T1Y + 1.500% | | 4.6250 | | 01/20/32 | | | 10,645 | |
| | 1,414 | | | Ginnie Mae II Pool 80659(b) | | H15T1Y + 1.500% | | 3.7500 | | 12/20/32 | | | 1,397 | |
| | | | | | | | | | | | | | 15,035 | |
| | | | | GOVERNMENT OWNED, NO GUARANTEE — 9.8% | | | | | | | | | | |
| | 1,500,000 | | | Federal Home Loan Mortgage Corporation | | | | 5.2500 | | 12/09/24 | | | 1,497,219 | |
| | 1,250,000 | | | Federal Home Loan Mortgage Corporation | | | | 5.6000 | | 03/06/26 | | | 1,249,499 | |
| | 2,000,000 | | | Federal Home Loan Mortgage Corporation | | | | 5.3750 | | 04/09/26 | | | 1,996,723 | |
| | 2,000,000 | | | Federal Home Loan Mortgage Corporation | | | | 5.5000 | | 04/08/27 | | | 1,996,343 | |
| | 1,500,000 | | | Federal Home Loan Mortgage Corporation | | | | 5.6250 | | 06/11/27 | | | 1,500,581 | |
| | 1,250,000 | | | Federal Home Loan Mortgage Corporation | | | | 5.0000 | | 09/18/28 | | | 1,242,869 | |
See accompanying notes to financial statements.
| EVENTIDE LIMITED-TERM BOND FUND |
| SCHEDULE OF INVESTMENTS (Continued) |
| June 30, 2024 |
| Principal | | | | | | | Coupon Rate | | | | | |
| Amount ($) | | | | | Spread | | (%) | | Maturity | | Fair Value | |
| | | | | U.S. GOVERNMENT & AGENCIES — 21.7% (Continued) | | | | | | | | | | |
| | | | | GOVERNMENT OWNED, NO GUARANTEE — 9.8% (Continued) | | | | | | | | | | |
| | 2,000,000 | | | Federal National Mortgage Association | | | | 4.1250 | | 08/28/25 | | $ | 1,980,280 | |
| | 2,575,000 | | | Federal National Mortgage Association | | | | 6.2500 | | 05/15/29 | | | 2,785,327 | |
| | | | | | | | | | | | | | 14,248,841 | |
| | | | | GOVERNMENT SPONSORED — 7.3% | | | | | | | | | | |
| | 2,250,000 | | | Federal Farm Credit Banks Funding Corporation | | | | 5.2300 | | 05/20/26 | | | 2,250,072 | |
| | 1,500,000 | | | Federal Farm Credit Banks Funding Corporation | | | | 5.3000 | | 10/19/26 | | | 1,495,739 | |
| | 1,750,000 | | | Federal Farm Credit Banks Funding Corporation | | | | 4.5000 | | 03/26/27 | | | 1,746,769 | |
| | 2,250,000 | | | Federal Farm Credit Banks Funding Corporation | | | | 4.3750 | | 02/28/28 | | | 2,241,909 | |
| | 1,500,000 | | | Federal Farm Credit Banks Funding Corporation | | | | 3.7800 | | 06/08/28 | | | 1,450,837 | |
| | 1,500,000 | | | Federal Farm Credit Banks Funding Corporation | | | | 4.2500 | | 12/15/28 | | | 1,490,918 | |
| | | | | | | | | | | | | | 10,676,244 | |
| | | | | TOTAL U.S. GOVERNMENT & AGENCIES (Cost $31,889,825) | | | | | | | | | 31,628,994 | |
| | | | | | | | | | | | | | | |
| | | | | TOTAL INVESTMENTS - 97.3% (Cost $144,701,807) | | | | | | | | $ | 141,887,960 | |
| | | | | OTHER ASSETS IN EXCESS OF LIABILITIES- 2.7% | | | | | | | | | 3,937,579 | |
| | | | | NET ASSETS - 100.0% | | | | | | | | $ | 145,825,539 | |
| LLC | - Limited Liability Company |
| | |
| LP | - Limited Partnership |
| | |
| LTD | - Limited Company |
| | |
| H15T1Y | US Treasury Yield Curve Rate T Note Constant Maturity 1 Year |
| | |
| SOFR30A | United States 30 Day Average SOFR Secured Overnight Financing Rate |
| | |
| SOFRRATE | United States SOFR Secured Overnight Financing Rate |
| | |
| TSFR3M | CME Term SOFR 3 Month |
| | |
| US0003M | ICE LIBOR USD 3 Month |
| (a) | Security exempt from registration under Rule 144A or Section 4(2) of the Securities Act of 1933. The security may be resold in transactions exempt from registration, normally to qualified institutional buyers. As of June 30, 2024 the total market value of 144A securities is $17,011,277 or 11.7% of net assets. |
| (b) | Variable or floating rate security, the interest rate of which adjusts periodically based on changes in current interest rates and prepayments on the underlying pool of assets. |
| (c) | Percentage rounds to less than 0.1%. |
See accompanying notes to financial statements.
| Eventide Funds |
| STATEMENTS OF ASSETS AND LIABILITIES |
| June 30, 2024 |
| | | | | | Eventide | | | Eventide | | | Eventide | | | | |
| | | Eventide | | | Core Bond | | | Dividend | | | Exponential | | | Eventide | |
| | | Balanced | | | Fund | | | Opportunities Fund | | | Technologies Fund | | | Gilead Fund | |
| ASSETS | | | | | | | | | | | | | | | | | | | | |
| Investment securities: | | | | | | | | | | | | | | | | | | | | |
| Unaffiliated investments at cost | | $ | 330,892,091 | | | $ | 139,132,890 | | | $ | 674,572,301 | | | $ | 83,891,927 | | | $ | 1,904,951,716 | |
| Affiliated investments at cost | | | — | | | | — | | | | — | | | | — | | | | 237,433,515 | |
| Total Investments at cost | | | 330,892,091 | | | | 139,132,890 | | | | 674,572,301 | | | | 83,891,927 | | | | 2,142,385,231 | |
| Unaffiliated investments at value | | $ | 372,988,478 | | | $ | 133,539,852 | | | $ | 849,482,764 | | | $ | 110,107,624 | | | $ | 3,219,529,025 | |
| Affiliated investments at value | | | — | | | | — | | | | — | | | | — | | | | 124,867,341 | |
| Total investments at value | | | 372,988,478 | | | | 133,539,852 | | | | 849,482,764 | | | | 110,107,624 | | | | 3,344,396,366 | |
| Cash held at custodian | | | 7,277,373 | | | | 5,209,554 | | | | 13,911,906 | | | | 5,298,307 | | | | 11,911,477 | |
| Cash held at broker | | | 111,764 | | | | — | | | | 107,871 | | | | 256,352 | | | | 165,237 | |
| Receivable for Fund shares sold | | | 357,216 | | | | 80,294 | | | | 2,246,670 | | | | 95,216 | | | | 1,568,125 | |
| Dividends and interest receivable | | | 1,551,956 | | | | 1,162,295 | | | | 788,907 | | | | 44,835 | | | | 1,158,948 | |
| Prepaid expenses and other assets | | | 73,592 | | | | 1,314 | | | | 113,803 | | | | 40,200 | | | | 206,009 | |
| TOTAL ASSETS | | | 382,360,379 | | | | 139,993,309 | | | | 866,651,921 | | | | 115,842,534 | | | | 3,359,406,162 | |
| | | | | | | | | | | | | | | | | | | | | |
| LIABILITIES | | | | | | | | | | | | | | | | | | | | |
| Payable for investments purchased | | | 1,991,608 | | | | 2,509,353 | | | | 992,081 | | | | — | | | | — | |
| Payable for Fund shares repurchased | | | 320,358 | | | | 122,642 | | | | 907,257 | | | | 189,037 | | | | 6,222,417 | |
| Advisory fees payable | | | 207,736 | | | | 3,349 | | | | 437,594 | | | | 83,361 | | | | 2,708,645 | |
| Distribution (12b-1) fees payable | | | 85,533 | | | | 8,579 | | | | 124,611 | | | | 31,121 | | | | 85,406 | |
| Payable to related parties | | | 103,863 | | | | 17,503 | | | | 113,564 | | | | 13,668 | | | | 372,663 | |
| Accrued expenses and other liabilities | | | 131,499 | | | | 26,991 | | | | 163,144 | | | | 38,841 | | | | 679,901 | |
| TOTAL LIABILITIES | | | 2,840,597 | | | | 2,688,417 | | | | 2,738,251 | | | | 356,028 | | | | 10,069,032 | |
| NET ASSETS | | $ | 379,519,782 | | | $ | 137,304,892 | | | $ | 863,913,670 | | | $ | 115,486,506 | | | $ | 3,349,337,130 | |
| | | | | | | | | | | | | | | | | | | | | |
| Composition of Net Assets: | | | | | | | | | | | | | | | | | | | | |
| Paid in capital | | $ | 348,154,578 | | | $ | 156,700,975 | | | $ | 719,115,243 | | | $ | 148,039,352 | | | $ | 2,234,462,249 | |
| Accumulated earnings (losses) | | | 31,365,204 | | | | (19,396,083 | ) | | | 144,798,427 | | | | (32,552,846 | ) | | | 1,114,874,881 | |
| NET ASSETS | | $ | 379,519,782 | | | $ | 137,304,892 | | | $ | 863,913,670 | | | $ | 115,486,506 | | | $ | 3,349,337,130 | |
See accompanying notes to financial statements.
| Eventide Funds |
| STATEMENTS OF ASSETS AND LIABILITIES (Continued) |
| June 30, 2024 |
| | | | | | Eventide | | | Eventide | | | Eventide | | | | |
| | | Eventide | | | Core Bond | | | Dividend | | | Exponential | | | Eventide | |
| | | Balanced | | | Fund | | | Opportunities Fund | | | Technologies Fund | | | Gilead Fund | |
| Net Asset Value Per Share: | | | | | | | | | | | | | | | | | | | | |
| Class N Shares: | | | | | | | | | | | | | | | | | | | | |
| Net Assets | | $ | 22,307,683 | | | $ | 35,466,640 | | | $ | 87,873,034 | | | $ | 19,201,126 | | | $ | 427,767,621 | |
| Shares of beneficial interest outstanding (a) | | | 1,619,083 | | | | 4,387,636 | | | | 4,958,310 | | | | 1,604,843 | | | | 8,884,473 | |
| Net asset value (Net Assets ÷ Shares Outstanding), offering price, and redemption price per share | | $ | 13.78 | | | $ | 8.08 | | | $ | 17.72 | | | $ | 11.96 | | | $ | 48.15 | |
| | | | | | | | | | | | | | | | | | | | | |
| Class A Shares: | | | | | | | | | | | | | | | | | | | | |
| Net Assets | | $ | 30,175,063 | | | $ | 607,819 | | | $ | 50,563,172 | | | $ | 8,420,726 | | | $ | 320,982,747 | |
| Shares of beneficial interest outstanding (a) | | | 2,185,751 | | | | 74,876 | | | | 2,851,251 | | | | 704,003 | | | | 6,715,500 | |
| Net asset value (Net Assets ÷ Shares Outstanding) and redemption price per share | | $ | 13.81 | | | $ | 8.12 | | | $ | 17.73 | | | $ | 11.96 | | | $ | 47.80 | |
| Maximum offering price per share (net asset value plus maximum sales charge of 5.75%) | | $ | 14.65 | | | $ | 8.62 | | | $ | 18.81 | | | $ | 12.69 | | | $ | 50.72 | |
| | | | | | | | | | | | | | | | | | | | | |
| Class C Shares: | | | | | | | | | | | | | | | | | | | | |
| Net Assets | | $ | 16,019,944 | | | $ | 492,228 | | | $ | 19,564,095 | | | $ | 2,549,521 | | | $ | 166,155,034 | |
| Shares of beneficial interest outstanding (a) | | | 1,169,322 | | | | 61,261 | | | | 1,116,858 | | | | 219,649 | | | | 3,983,444 | |
| Net asset value (Net Assets ÷ Shares Outstanding), offering price, and redemption price per share | | $ | 13.70 | | | $ | 8.03 | | | $ | 17.52 | | | $ | 11.61 | | | $ | 41.71 | |
| | | | | | | | | | | | | | | | | | | | | |
| Class I Shares: | | | | | | | | | | | | | | | | | | | | |
| Net Assets | | $ | 311,017,092 | | | $ | 100,738,205 | | | $ | 705,913,369 | | | $ | 85,315,133 | | | $ | 2,434,431,728 | |
| Shares of beneficial interest outstanding (a) | | | 22,569,529 | | | | 12,461,634 | | | | 39,794,478 | | | | 7,069,477 | | | | 48,881,636 | |
| Net asset value (Net Assets ÷ Shares Outstanding), offering price, and redemption price per share | | $ | 13.78 | | | $ | 8.08 | | | $ | 17.74 | | | $ | 12.07 | | | $ | 49.80 | |
| (a) | Unlimited number of shares of beneficial interest authorized, no par value. |
See accompanying notes to financial statements.
| Eventide Funds |
| STATEMENTS OF ASSETS AND LIABILITIES (Continued) |
| June 30, 2024 |
| | | Eventide | | | Eventide | | | Eventide | |
| | | Healthcare & | | | Large Cap | | | Limited-Term | |
| | | Life Sciences Fund | | | Focus Fund | | | Bond Fund | |
| ASSETS | | | | | | | | | | | | |
| Investment securities: | | | | | | | | | | | | |
| Unaffiliated investments at cost | | $ | 1,042,769,725 | | | $ | 95,268,290 | | | $ | 144,701,807 | |
| Affiliated investments at cost | | | 296,286,464 | | | | — | | | | — | |
| Investments at cost | | | 1,339,056,189 | | | | 95,268,290 | | | | 144,701,807 | |
| Unaffiliated investments at value | | $ | 1,210,909,133 | | | $ | 102,792,851 | | | $ | 141,887,960 | |
| Affiliated investments at value | | | 181,308,616 | | | | — | | | | — | |
| Total investments at value | | | 1,392,217,749 | | | | 102,792,851 | | | | 141,887,960 | |
| Cash held at custodian | | | 60,855,823 | | | | 3,934,741 | | | | 2,699,553 | |
| Cash held at broker | | | 116,470 | | | | — | | | | — | |
| Receivable for Fund shares sold | | | 1,469,791 | | | | 238,852 | | | | 214,002 | |
| Dividends and interest receivable | | | 611,682 | | | | 54,474 | | | | 1,293,116 | |
| Prepaid expenses and other assets | | | 105,690 | | | | 66,875 | | | | 45,057 | |
| TOTAL ASSETS | | | 1,455,377,205 | | | | 107,087,793 | | | | 146,139,688 | |
| | | | | | | | | | | | | |
| LIABILITIES | | | | | | | | | | | | |
| Payable for investments purchased | | | 10,813,492 | | | | 756,004 | | | | — | |
| Payable for Fund shares repurchased | | | 2,760,867 | | | | 99,198 | | | | 100,238 | |
| Advisory fees payable | | | 1,298,739 | | | | 39,539 | | | | 73,470 | |
| Distribution (12b-1) fees payable | | | 90,738 | | | | — | | | | 2,390 | |
| Payable to related parties | | | 165,566 | | | | 3,114 | | | | 71,558 | |
| Accrued expenses and other liabilities | | | 332,054 | | | | 6,755 | | | | 66,493 | |
| TOTAL LIABILITIES | | | 15,461,456 | | | | 904,610 | | | | 314,149 | |
| NET ASSETS | | $ | 1,439,915,749 | | | $ | 106,183,183 | | | $ | 145,825,539 | |
| | | | | | | | | | | | | |
| Composition of Net Assets: | | | | | | | | | | | | |
| Paid in capital | | $ | 1,421,894,332 | | | $ | 95,317,684 | | | $ | 157,158,771 | |
| Accumulated earnings (losses) | | | 18,021,417 | | | | 10,865,499 | | | | (11,333,232 | ) |
| NET ASSETS | | $ | 1,439,915,749 | | | $ | 106,183,183 | | | $ | 145,825,539 | |
See accompanying notes to financial statements.
| Eventide Funds |
| STATEMENTS OF ASSETS AND LIABILITIES (Continued) |
| June 30, 2024 |
| | | Eventide | | | Eventide | | | Eventide | |
| | | Healthcare & | | | Large Cap | | | Limited-Term | |
| | | Life Sciences Fund | | | Focus Fund | | | Bond Fund | |
| Net Asset Value Per Share: | | | | | | | | | | | | |
| Class N Shares: | | | | | | | | | | | | |
| Net Assets | | $ | 93,026,982 | | | $ | 13,096,696 | | | $ | 17,948,798 | |
| Shares of beneficial interest outstanding (a) | | | 2,793,716 | | | | 934,677 | | | | 1,815,024 | |
| Net asset value (Net Assets ÷ Shares Outstanding), offering price, and redemption price per share | | $ | 33.30 | | | $ | 14.01 | | | $ | 9.89 | |
| | | | | | | | | | | | | |
| Class A Shares: | | | | | | | | | | | | |
| Net Assets | | $ | 122,422,635 | | | $ | 1,835,642 | | | $ | 4,611,924 | |
| Shares of beneficial interest outstanding (a) | | | 3,705,496 | | | | 131,244 | | | | 465,212 | |
| Net asset value (Net Assets ÷ Shares Outstanding) and redemption price per share | | $ | 33.04 | | | $ | 13.99 | | | $ | 9.91 | |
| Maximum offering price per share (net asset value plus maximum sales charge of 5.75%) | | $ | 35.06 | | | $ | 14.84 | | | $ | 10.51 | |
| | | | | | | | | | | | | |
| Class C Shares: | | | | | | | | | | | | |
| Net Assets | | $ | 55,660,694 | | | $ | 292,203 | | | $ | 1,563,685 | |
| Shares of beneficial interest outstanding (a) | | | 1,848,407 | | | | 21,183 | | | | 158,859 | |
| Net asset value (Net Assets ÷ Shares Outstanding), offering price, and redemption price per share | | $ | 30.11 | | | $ | 13.79 | | | $ | 9.84 | |
| | | | | | | | | | | | | |
| Class I Shares: | | | | | | | | | | | | |
| Net Assets | | $ | 1,168,805,438 | | | $ | 90,958,642 | | | $ | 121,701,132 | |
| Shares of beneficial interest outstanding (a) | | | 34,285,245 | | | | 6,476,960 | | | | 11,988,852 | |
| Net asset value (Net Assets ÷ Shares Outstanding), offering price, and redemption price per share | | $ | 34.09 | | | $ | 14.04 | | | $ | 10.15 | |
| | | | | | | | | | | | | |
| (a) | Unlimited number of shares of beneficial interest authorized, no par value. |
See accompanying notes to financial statements.
| Eventide Funds |
| STATEMENTS OF OPERATIONS |
| For the Year Ended June 30, 2024 |
| | | | | | Eventide | | | Eventide | | | Eventide | | | | |
| | | Eventide | | | Core Bond | | | Dividend | | | Exponential | | | Eventide | |
| | | Balanced | | | Fund | | | Opportunities Fund | | | Technologies Fund | | | Gilead Fund | |
| INVESTMENT INCOME | | | | | | | | | | | | | | | | | | | | |
| Dividend income | | $ | 2,592,564 | | | $ | — | | | $ | 9,580,578 | | | $ | 128,816 | | | $ | 13,102,859 | |
| Interest | | | 6,211,262 | | | | 4,542,298 | | | | 1,044,018 | | | | 195,142 | | | | 7,865,582 | |
| Less: Foreign dividend withholding taxes | | | — | | | | — | | | | (149 | ) | | | (1,208 | ) | | | (406,650 | ) |
| TOTAL INVESTMENT INCOME | | | 8,803,826 | | | | 4,542,298 | | | | 10,624,447 | | | | 322,750 | | | | 20,561,791 | |
| | | | | | | | | | | | | | | | | | | | | |
| EXPENSES | | | | | | | | | | | | | | | | | | | | |
| Investment advisory fees | | | 2,076,679 | | | | 357,352 | | | | 4,974,202 | | | | 1,314,480 | | | | 35,349,592 | |
| Distribution (12b-1) fees: | | | | | | | | | | | | | | | | | | | | |
| Class N | | | 55,029 | | | | 70,040 | | | | 179,530 | | | | 43,010 | | | | 980,046 | |
| Class A | | | 66,748 | | | | 1,008 | | | | 106,232 | | | | 21,675 | | | | 860,598 | |
| Class C | | | 157,808 | | | | 2,535 | | | | 164,320 | | | | 27,085 | | | | 1,912,191 | |
| Shareholder servicing fees | | | 398,937 | | | | 118,068 | | | | 794,673 | | | | 164,657 | | | | 3,834,102 | |
| Printing and postage expenses | | | 129,932 | | | | 27,595 | | | | 157,369 | | | | 39,705 | | | | 368,639 | |
| Financial administration/fund accounting fees | | | 132,355 | | | | 53,769 | | | | 195,182 | | | | 49,994 | | | | 1,023,544 | |
| Registration fees | | | 100,650 | | | | 67,710 | | | | 110,750 | | | | 70,024 | | | | 146,450 | |
| Legal administration/management services fees | | | 71,477 | | | | 21,649 | | | | 140,604 | | | | 24,657 | | | | 753,401 | |
| Transfer agent fees | | | 46,072 | | | | 17,223 | | | | 67,779 | | | | 33,001 | | | | 309,461 | |
| Custodian fees | | | 23,395 | | | | 6,540 | | | | 38,550 | | | | 15,678 | | | | 205,809 | |
| Legal fees | | | 23,404 | | | | 21,112 | | | | 21,860 | | | | 20,714 | | | | 31,826 | |
| Compliance officer fees | | | 17,132 | | | | 11,304 | | | | 23,545 | | | | 9,813 | | | | 99,011 | |
| Audit fees | | | 22,982 | | | | 16,288 | | | | 19,000 | | | | 12,829 | | | | 45,001 | |
| Trustees fees and expenses | | | 15,598 | | | | 15,637 | | | | 15,611 | | | | 15,598 | | | | 15,698 | |
| Insurance expense | | | 12,810 | | | | 3,660 | | | | 15,450 | | | | 2,568 | | | | 109,850 | |
| Other expenses | | | 4,457 | | | | 4,002 | | | | 3,897 | | | | 3,944 | | | | 4,503 | |
| TOTAL EXPENSES | | | 3,355,465 | | | | 815,492 | | | | 7,028,554 | | | | 1,869,432 | | | | 46,049,722 | |
| Less: Fees waived/reimbursed by the Advisor | | | (236,729 | ) | | | (131,361 | ) | | | (97,498 | ) | | | (68,862 | ) | | | — | |
| NET EXPENSES | | | 3,118,736 | | | | 684,131 | | | | 6,931,056 | | | | 1,800,570 | | | | 46,049,722 | |
| NET INVESTMENT INCOME (LOSS) | | | 5,685,090 | | | | 3,858,167 | | | | 3,693,391 | | | | (1,477,820 | ) | | | (25,487,931 | ) |
| | | | | | | | | | | | | | | | | | | | | |
| REALIZED AND UNREALIZED GAIN (LOSS) FROM INVESTMENTS | | | | | | | | | | | | | | | | | | | | |
| Net realized gain (loss) from: | | | | | | | | | | | | | | | | | | | | |
| Unaffiliated investments | | | 3,359,942 | | | | (2,770,122 | ) | | | 14,015,615 | | | | (1,693,620 | ) | | | 43,126,125 | |
| Affiliated investments (See Note 5) | | | — | | | | — | | | | — | | | | — | | | | (55,517,695 | ) |
| Securities sold short | | | — | | | | — | | | | — | | | | (478,620 | ) | | | (753,126 | ) |
| Foreign currency transactions | | | — | | | | — | | | | — | | | | (1,910 | ) | | | (12,798 | ) |
| Distributions of long term capital gains from underlying investment companies | | | 2,982 | | | | — | | | | 68,490 | | | | — | | | | — | |
| Net realized gain (loss): | | | 3,362,924 | | | | (2,770,122 | ) | | | 14,084,105 | | | | (2,174,150 | ) | | | (13,157,494 | ) |
| Net change in unrealized appreciation on: | | | | | | | | | | | | | | | | | | | | |
| Unaffiliated investments | | | 32,146,544 | | | | 2,371,706 | | | | 117,234,972 | | | | 3,599,272 | | | | 83,517,835 | |
| Affiliated investments (See Note 5) | | | — | | | | — | | | | — | | | | — | | | | (55,980,935 | ) |
| Net change in unrealized appreciation: | | | 32,146,544 | | | | 2,371,706 | | | | 117,234,972 | | | | 3,599,272 | | | | 27,536,900 | |
| | | | | | | | | | | | | | | | | | | | | |
| NET REALIZED AND UNREALIZED GAIN (LOSS) FROM INVESTMENTS | | | 35,509,468 | | | | (398,416 | ) | | | 131,319,077 | | | | 1,425,122 | | | | 14,379,406 | |
| | | | | | | | | | | | | | | | | | | | | |
| NET INCREASE (DECREASE) IN NET ASSETS RESULTING FROM OPERATIONS | | $ | 41,194,558 | | | $ | 3,459,751 | | | $ | 135,012,468 | | | $ | (52,698 | ) | | $ | (11,108,525 | ) |
See accompanying notes to financial statements.
| Eventide Funds |
| STATEMENTS OF OPERATIONS (Continued) |
| For Year Ended June 30, 2024 |
| | | Eventide | | | Eventide | | | Eventide | |
| | | Healthcare & | | | Large Cap | | | Limited-Term | |
| | | Life Sciences Fund | | | Focus Fund | | | Bond Fund | |
| INVESTMENT INCOME | | | | | | | | | | | | |
| Dividend income | | $ | — | | | $ | 386,143 | | | $ | — | |
| Interest | | | 4,473,968 | | | | 134,747 | | | | 4,951,366 | |
| Less: Foreign dividend withholding taxes | | | (45,115 | ) | | | (6,575 | ) | | | — | |
| TOTAL INVESTMENT INCOME | | | 4,428,853 | | | | 514,315 | | | | 4,951,366 | |
| | | | | | | | | | | | | |
| EXPENSES | | | | | | | | | | | | |
| Investment advisory fees | | | 17,506,668 | | | | 319,467 | | | | 422,673 | |
| Distribution (12b-1) fees: | | | | | | | | | | | | |
| Class N | | | 222,274 | | | | 12,769 | | | | 35,466 | |
| Class A | | | 340,157 | | | | 1,865 | | | | 27,175 | |
| Class C | | | 644,059 | | | | 1,009 | | | | 14,455 | |
| Shareholder servicing fees | | | 1,724,492 | | | | 35,285 | | | | 179,197 | |
| Financial administration/fund accounting fees | | | 472,135 | | | | 22,501 | | | | 80,849 | |
| Legal administration/management services fees | | | 328,420 | | | | 8,996 | | | | 28,166 | |
| Transfer agent fees | | | 195,414 | | | | 15,480 | | | | 24,818 | |
| Printing and postage expenses | | | 290,408 | | | | 8,059 | | | | 65,954 | |
| Registration fees | | | 128,100 | | | | 36,750 | | | | 65,920 | |
| Audit fees | | | 91,940 | | | | 13,579 | | | | 17,051 | |
| Custodian fees | | | 101,247 | | | | 12,061 | | | | 9,152 | |
| Insurance expense | | | 53,070 | | | | 370 | | | | 5,490 | |
| Compliance officer fees | | | 47,437 | | | | 7,789 | | | | 11,994 | |
| Legal fees | | | 25,278 | | | | 15,215 | | | | 22,058 | |
| Trustees fees and expenses | | | 15,602 | | | | 15,603 | | | | 15,597 | |
| Other expenses | | | 3,981 | | | | 4,014 | | | | 3,596 | |
| TOTAL EXPENSES | | | 22,190,682 | | | | 530,812 | | | | 1,029,611 | |
| Less: Fees waived/reimbursed by the Advisor | | | — | | | | (101,331 | ) | | | (202,441 | ) |
| NET EXPENSES | | | 22,190,682 | | | | 429,481 | | | | 827,170 | |
| | | | | | | | | | | | | |
| NET INVESTMENT INCOME (LOSS) | | | (17,761,829 | ) | | | 84,834 | | | | 4,124,196 | |
| | | | | | | | | | | | | |
| REALIZED AND UNREALIZED GAIN (LOSS) FROM INVESTMENTS | | | | | | | | | | | | |
| Net realized gain (loss) from: | | | | | | | | | | | | |
| Unaffiliated investments | | | 79,239,923 | | | | 3,919,159 | | | | (995,253 | ) |
| Affiliated investments (See Note 5) | | | (50,453,063 | ) | | | — | | | | — | |
| Net realized gain (loss): | | | 28,786,860 | | | | 3,919,159 | | | | (995,253 | ) |
| Net change in unrealized appreciation (depreciation) on: | | | | | | | | | | | | |
| Unaffiliated investments | | | (69,227,944 | ) | | | 5,840,777 | | | | 3,826,483 | |
| Affiliated investments (See Note 5) | | | (102,478,691 | ) | | | — | | | | — | |
| Net change in unrealized appreciation (depreciation): | | | (171,706,635 | ) | | | 5,840,777 | | | | 3,826,483 | |
| | | | | | | | | | | | | |
| NET REALIZED AND UNREALIZED GAIN (LOSS) FROM INVESTMENTS | | | (142,919,775 | ) | | | 9,759,936 | | | | 2,831,230 | |
| | | | | | | | | | | | | |
| NET INCREASE (DECREASE) IN NET ASSETS RESULTING FROM OPERATIONS | | $ | (160,681,604 | ) | | $ | 9,844,770 | | | $ | 6,955,426 | |
See accompanying notes to financial statements.
| Eventide Balanced Fund |
| STATEMENTS OF CHANGES IN NET ASSETS |
| | | For the | | | For the | |
| | | Year Ended | | | Year Ended | |
| | | June 30, 2024 | | | June 30, 2023 | |
| FROM OPERATIONS | | | | | | | | |
| Net investment income | | $ | 5,685,090 | | | $ | 5,151,980 | |
| Net realized gain (loss) | | | 3,359,942 | | | | (14,479,724 | ) |
| Distributions of long term capital gains from underlying investment companies | | | 2,982 | | | | — | |
| Net change in unrealized appreciation | | | 32,146,544 | | | | 26,607,153 | |
| Net increase in net assets resulting from operations | | | 41,194,558 | | | | 17,279,409 | |
| | | | | | | | | |
| DISTRIBUTIONS TO SHAREHOLDERS | | | | | | | | |
| From Accumulated Earnings | | | | | | | | |
| Class N | | | (422,597 | ) | | | (1,025,429 | ) |
| Class A | | | (408,420 | ) | | | (587,205 | ) |
| Class C | | | (129,472 | ) | | | (258,344 | ) |
| Class I | | | (4,928,123 | ) | | | (6,650,735 | ) |
| Return of Capital | | | | | | | | |
| Class N | | | — | | | | (123,456 | ) |
| Class A | | | — | | | | (77,622 | ) |
| Class C | | | — | | | | (50,944 | ) |
| Class I | | | — | | | | (787,757 | ) |
| Total distributions to shareholders | | | (5,888,612 | ) | | | (9,561,492 | ) |
| | | | | | | | | |
| FROM SHARES OF BENEFICIAL INTEREST | | | | | | | | |
| Proceeds from shares sold: | | | | | | | | |
| Class N | | | 9,079,352 | | | | 49,176,092 | |
| Class A | | | 7,382,970 | | | | 4,205,289 | |
| Class C | | | 2,465,144 | | | | 2,132,876 | |
| Class I | | | 99,214,636 | | | | 75,332,706 | |
| Net asset value of shares issued in reinvestment of distributions: | | | | | | | | |
| Class N | | | 399,727 | | | | 1,104,953 | |
| Class A | | | 363,434 | | | | 591,647 | |
| Class C | | | 120,546 | | | | 289,078 | |
| Class I | | | 4,513,376 | | | | 6,830,607 | |
| Payments for shares repurchased: | | | | | | | | |
| Class N | | | (20,672,373 | ) | | | (54,627,872 | ) |
| Class A | | | (5,867,639 | ) | | | (5,644,099 | ) |
| Class C | | | (4,339,723 | ) | | | (4,809,955 | ) |
| Class I | | | (81,509,861 | ) | | | (97,402,343 | ) |
| Net increase (decrease) in net assets from shares of beneficial interest | | | 11,149,589 | | | | (22,821,021 | ) |
| | | | | | | | | |
| TOTAL INCREASE (DECREASE) IN NET ASSETS | | | 46,455,535 | | | | (15,103,104 | ) |
| | | | | | | | | |
| NET ASSETS | | | | | | | | |
| Beginning of Year | | | 333,064,247 | | | | 348,167,351 | |
| End of Year | | $ | 379,519,782 | | | $ | 333,064,247 | |
See accompanying notes to financial statements.
| Eventide Balanced Fund |
| STATEMENTS OF CHANGES IN NET ASSETS (Continued) |
| | | For the | | | For the | |
| | | Year Ended | | | Year Ended | |
| | | June 30, 2024 | | | June 30, 2023 | |
| SHARE ACTIVITY | | | | | | | | |
| Class N: | | | | | | | | |
| Shares Sold | | | 702,251 | | | | 4,036,342 | |
| Shares Reinvested | | | 30,806 | | | | 91,129 | |
| Shares Repurchased | | | (1,575,339 | ) | | | (4,542,574 | ) |
| Net decrease in shares of beneficial interest outstanding | | | (842,282 | ) | | | (415,103 | ) |
| | | | | | | | | |
| Class A: | | | | | | | | |
| Shares Sold | | | 556,790 | | | | 342,410 | |
| Shares Reinvested | | | 27,746 | | | | 48,591 | |
| Shares Repurchased | | | (450,768 | ) | | | (459,232 | ) |
| Net increase (decrease) in shares of beneficial interest outstanding | | | 133,768 | | | | (68,231 | ) |
| | | | | | | | | |
| Class C: | | | | | | | | |
| Shares Sold | | | 189,180 | | | | 175,582 | |
| Shares Reinvested | | | 9,284 | | | | 23,934 | |
| Shares Repurchased | | | (336,562 | ) | | | (397,078 | ) |
| Net decrease in shares of beneficial interest outstanding | | | (138,098 | ) | | | (197,562 | ) |
| | | | | | | | | |
| Class I: | | | | | | | | |
| Shares Sold | | | 7,563,324 | | | | 6,177,662 | |
| Shares Reinvested | | | 345,405 | | | | 561,831 | |
| Shares Repurchased | | | (6,292,309 | ) | | | (8,014,650 | ) |
| Net increase (decrease) in shares of beneficial interest outstanding | | | 1,616,420 | | | | (1,275,157 | ) |
See accompanying notes to financial statements.
| Eventide Core Bond Fund |
| STATEMENTS OF CHANGES IN NET ASSETS |
| | | For the | | | For the | |
| | | Year Ended | | | Year Ended | |
| | | June 30, 2024 | | | June 30, 2023 | |
| FROM OPERATIONS | | | | | | | | |
| Net investment income | | $ | 3,858,167 | | | $ | 1,497,137 | |
| Net realized loss | | | (2,770,122 | ) | | | (3,797,575 | ) |
| Net change in unrealized appreciation | | | 2,371,706 | | | | 1,383,710 | |
| Net increase (decrease) in net assets resulting from operations | | | 3,459,751 | | | | (916,728 | ) |
| | | | | | | | | |
| DISTRIBUTIONS TO SHAREHOLDERS | | | | | | | | |
| From Accumulated Earnings | | | | | | | | |
| Class N | | | (1,109,828 | ) | | | (791,346 | ) |
| Class A | | | (14,181 | ) | | | (6,663 | ) |
| Class C | | | (7,752 | ) | | | (3,378 | ) |
| Class I | | | (2,637,606 | ) | | | (735,595 | ) |
| Total distributions to shareholders | | | (3,769,367 | ) | | | (1,536,982 | ) |
| | | | | | | | | |
| FROM SHARES OF BENEFICIAL INTEREST | | | | | | | | |
| Proceeds from shares sold: | | | | | | | | |
| Class N | | | 7,288,166 | | | | 19,475,162 | |
| Class A | | | 392,447 | | | | 246,372 | |
| Class C | | | 324,177 | | | | 34,274 | |
| Class I | | | 96,894,042 | | | | 34,388,084 | |
| Net asset value of shares issued in reinvestment of distributions: | | | | | | | | |
| Class N | | | 1,106,587 | | | | 790,735 | |
| Class A | | | 14,053 | | | | 6,663 | |
| Class C | | | 7,478 | | | | 3,364 | |
| Class I | | | 1,570,467 | | | | 615,819 | |
| Payments for shares repurchased: | | | | | | | | |
| Class N | | | (10,033,040 | ) | | | (39,413,830 | ) |
| Class A | | | (206,432 | ) | | | (30,999 | ) |
| Class C | | | (57,303 | ) | | | (33,678 | ) |
| Class I | | | (37,064,233 | ) | | | (8,715,146 | ) |
| Net increase in net assets from shares of beneficial interest | | | 60,236,409 | | | | 7,366,820 | |
| | | | | | | | | |
| TOTAL INCREASE IN NET ASSETS | | | 59,926,793 | | | | 4,913,110 | |
| | | | | | | | | |
| NET ASSETS | | | | | | | | |
| Beginning of Year | | | 77,378,099 | | | | 42,646,989 | |
| End of Year | | $ | 137,304,892 | | | $ | 77,378,099 | |
See accompanying notes to financial statements.
| Eventide Core Bond Fund |
| STATEMENTS OF CHANGES IN NET ASSETS (Continued) |
| | | For the | | | For the | |
| | | Year Ended | | | Year Ended | |
| | | June 30, 2024 | | | June 30, 2023 | |
| SHARE ACTIVITY | | | | | | | | |
| Class N: | | | | | | | | |
| Shares Sold | | | 896,472 | | | | 2,362,456 | |
| Shares Reinvested | | | 136,943 | | | | 97,444 | |
| Shares Repurchased | | | (1,241,562 | ) | | | (4,782,659 | ) |
| Net decrease in shares of beneficial interest outstanding | | | (208,147 | ) | | | (2,322,759 | ) |
| | | | | | | | | |
| Class A: | | | | | | | | |
| Shares Sold | | | 47,998 | | | | 29,981 | |
| Shares Reinvested | | | 1,728 | | | | 816 | |
| Shares Repurchased | | | (25,196 | ) | | | (3,796 | ) |
| Net increase in shares of beneficial interest outstanding | | | 24,530 | | | | 27,001 | |
| | | | | | | | | |
| Class C: | | | | | | | | |
| Shares Sold | | | 40,205 | | | | 4,110 | |
| Shares Reinvested | | | 929 | | | | 416 | |
| Shares Repurchased | | | (7,073 | ) | | | (4,147 | ) |
| Net increase in shares of beneficial interest outstanding | | | 34,061 | | | | 379 | |
| | | | | | | | | |
| Class I: | | | | | | | | |
| Shares Sold | | | 12,040,793 | | | | 4,159,816 | |
| Shares Reinvested | | | 193,765 | | | | 75,784 | |
| Shares Repurchased | | | (4,596,461 | ) | | | (1,062,677 | ) |
| Net increase in shares of beneficial interest outstanding | | | 7,638,097 | | | | 3,172,923 | |
See accompanying notes to financial statements.
| Eventide Dividend Opportunities Fund |
| STATEMENTS OF CHANGES IN NET ASSETS |
| | | For the | | | For the | |
| | | Year Ended | | | Year Ended | |
| | | June 30, 2024 | | | June 30, 2023 | |
| FROM OPERATIONS | | | | | | | | |
| Net investment income | | $ | 3,693,391 | | | $ | 4,442,752 | |
| Net realized gain (loss) | | | 14,015,615 | | | | (44,373,084 | ) |
| Distributions of long term capital gains from underlying investment companies | | | 68,490 | | | | — | |
| Net change in unrealized appreciation | | | 117,234,972 | | | | 90,497,053 | |
| Net increase in net assets resulting from operations | | | 135,012,468 | | | | 50,566,721 | |
| | | | | | | | | |
| DISTRIBUTIONS TO SHAREHOLDERS | | | | | | | | |
| From Accumulated Earnings | | | | | | | | |
| Class N | | | (334,756 | ) | | | (1,203,965 | ) |
| Class A | | | (147,401 | ) | | | (378,484 | ) |
| Class C | | | — | | | | (76,849 | ) |
| Class I | | | (3,216,856 | ) | | | (5,200,706 | ) |
| Return of Capital | | | | | | | | |
| Class N | | | — | | | | (92,962 | ) |
| Class A | | | — | | | | (102,479 | ) |
| Class C | | | — | | | | (9,900 | ) |
| Class I | | | — | | | | (908,635 | ) |
| Total distributions to shareholders | | | (3,699,013 | ) | | | (7,973,980 | ) |
| | | | | | | | | |
| FROM SHARES OF BENEFICIAL INTEREST | | | | | | | | |
| Proceeds from shares sold: | | | | | | | | |
| Class N | | | 29,519,252 | | | | 42,168,215 | |
| Class A | | | 12,265,171 | | | | 13,780,142 | |
| Class C | | | 5,169,491 | | | | 6,546,046 | |
| Class I | | | 334,215,421 | | | | 232,281,533 | |
| Net asset value of shares issued in reinvestment of distributions: | | | | | | | | |
| Class N | | | 324,923 | | | | 1,267,578 | |
| Class A | | | 141,369 | | | | 463,082 | |
| Class C | | | — | | | | 84,188 | |
| Class I | | | 2,894,360 | | | | 5,504,373 | |
| Payments for shares repurchased: | | | | | | | | |
| Class N | | | (50,762,173 | ) | | | (33,157,570 | ) |
| Class A | | | (6,831,786 | ) | | | (9,749,781 | ) |
| Class C | | | (3,551,445 | ) | | | (2,812,230 | ) |
| Class I | | | (164,593,403 | ) | | | (145,117,850 | ) |
| Net increase in net assets from shares of beneficial interest | | | 158,791,180 | | | | 111,257,726 | |
| | | | | | | | | |
| TOTAL INCREASE IN NET ASSETS | | | 290,104,635 | | | | 153,850,467 | |
| | | | | | | | | |
| NET ASSETS | | | | | | | | |
| Beginning of Year | | | 573,809,035 | | | | 419,958,568 | |
| End of Year | | $ | 863,913,670 | | | $ | 573,809,035 | |
See accompanying notes to financial statements.
| Eventide Dividend Opportunities Fund |
| STATEMENTS OF CHANGES IN NET ASSETS (Continued) |
| | | For the | | | For the | |
| | | Year Ended | | | Year Ended | |
| | | June 30, 2024 | | | June 30, 2023 | |
| SHARE ACTIVITY | | | | | | | | |
| Class N: | | | | | | | | |
| Shares Sold | | | 1,807,676 | | | | 3,006,122 | |
| Shares Reinvested | | | 19,929 | | | | 92,382 | |
| Shares Repurchased | | | (3,142,435 | ) | | | (2,406,922 | ) |
| Net increase (decrease) in shares of beneficial interest outstanding | | | (1,314,830 | ) | | | 691,582 | |
| | | | | | | | | |
| Class A: | | | | | | | | |
| Shares Sold | | | 762,040 | | | | 985,242 | |
| Shares Reinvested | | | 8,574 | | | | 33,666 | |
| Shares Repurchased | | | (424,470 | ) | | | (691,004 | ) |
| Net increase in shares of beneficial interest outstanding | | | 346,144 | | | | 327,904 | |
| | | | | | | | | |
| Class C: | | | | | | | | |
| Shares Sold | | | 319,457 | | | | 475,330 | |
| Shares Reinvested | | | — | | | | 6,152 | |
| Shares Repurchased | | | (226,340 | ) | | | (205,600 | ) |
| Net increase in shares of beneficial interest outstanding | | | 93,117 | | | | 275,882 | |
| | | | | | | | | |
| Class I: | | | | | | | | |
| Shares Sold | | | 20,550,743 | | | | 16,642,155 | |
| Shares Reinvested | | | 174,089 | | | | 400,250 | |
| Shares Repurchased | | | (10,273,314 | ) | | | (10,457,863 | ) |
| Net increase in shares of beneficial interest outstanding | | | 10,451,518 | | | | 6,584,542 | |
See accompanying notes to financial statements.
| Eventide Exponential Technologies Fund |
| STATEMENTS OF CHANGES IN NET ASSETS |
| | | For the | | | For the | |
| | | Year Ended | | | Year Ended | |
| | | June 30, 2024 | | | June 30, 2023 | |
| FROM OPERATIONS | | | | | | | | |
| Net investment loss | | $ | (1,477,820 | ) | | $ | (1,082,795 | ) |
| Net realized loss | | | (2,174,150 | ) | | | (25,591,542 | ) |
| Net change in unrealized appreciation | | | 3,599,272 | | | | 35,911,605 | |
| Net increase (decrease) in net assets resulting from operations | | | (52,698 | ) | | | 9,237,268 | |
| | | | | | | | | |
| FROM SHARES OF BENEFICIAL INTEREST | | | | | | | | |
| Proceeds from shares sold: | | | | | | | | |
| Class N | | | 6,027,041 | | | | 13,244,258 | |
| Class A | | | 1,869,118 | | | | 1,781,643 | |
| Class C | | | 542,067 | | | | 628,624 | |
| Class I | | | 32,629,726 | | | | 47,180,850 | |
| Redemption fee proceeds: | | | | | | | | |
| Class N | | | — | | | | 17,663 | |
| Class A | | | — | | | | 9,414 | |
| Class C | | | — | | | | 3,021 | |
| Class I | | | — | | | | 92,427 | |
| Payments for shares repurchased: | | | | | | | | |
| Class N | | | (8,987,032 | ) | | | (5,852,092 | ) |
| Class A | | | (1,673,077 | ) | | | (1,638,384 | ) |
| Class C | | | (611,792 | ) | | | (627,686 | ) |
| Class I | | | (30,069,547 | ) | | | (43,109,040 | ) |
| Net increase (decrease) in net assets from shares of beneficial interest | | | (273,496 | ) | | | 11,730,698 | |
| | | | | | | | | |
| TOTAL INCREASE (DECREASE) IN NET ASSETS | | | (326,194 | ) | | | 20,967,966 | |
| | | | | | | | | |
| NET ASSETS | | | | | | | | |
| Beginning of Year | | | 115,812,700 | | | | 94,844,734 | |
| End of Year | | $ | 115,486,506 | | | $ | 115,812,700 | |
See accompanying notes to financial statements.
| Eventide Exponential Technologies Fund |
| STATEMENTS OF CHANGES IN NET ASSETS (Continued) |
| | | For the | | | For the | |
| | | Year Ended | | | Year Ended | |
| | | June 30, 2024 | | | June 30, 2023 | |
| SHARE ACTIVITY | | | | | | | | |
| Class N: | | | | | | | | |
| Shares Sold | | | 488,743 | | | | 1,258,489 | |
| Shares Repurchased | | | (732,729 | ) | | | (551,922 | ) |
| Net increase (decrease) in shares of beneficial interest outstanding | | | (243,986 | ) | | | 706,567 | |
| | | | | | | | | |
| Class A: | | | | | | | | |
| Shares Sold | | | 152,030 | | | | 162,981 | |
| Shares Repurchased | | | (135,986 | ) | | | (149,936 | ) |
| Net increase in shares of beneficial interest outstanding | | | 16,044 | | | | 13,045 | |
| | | | | | | | | |
| Class C: | | | | | | | | |
| Shares Sold | | | 45,554 | | | | 58,336 | |
| Shares Repurchased | | | (50,461 | ) | | | (58,741 | ) |
| Net decrease in shares of beneficial interest outstanding | | | (4,907 | ) | | | (405 | ) |
| | | | | | | | | |
| Class I: | | | | | | | | |
| Shares Sold | | | 2,640,341 | | | | 4,159,896 | |
| Shares Repurchased | | | (2,419,872 | ) | | | (3,923,676 | ) |
| Net increase in shares of beneficial interest outstanding | | | 220,469 | | | | 236,220 | |
See accompanying notes to financial statements.
| Eventide Gilead Fund |
| STATEMENTS OF CHANGES IN NET ASSETS |
| | | For the | | | For the | |
| | | Year Ended | | | Year Ended | |
| | | June 30, 2024 | | | June 30, 2023 | |
| FROM OPERATIONS | | | | | | | | |
| Net investment loss | | $ | (25,487,931 | ) | | $ | (18,202,004 | ) |
| Net realized loss | | | (13,157,494 | ) | | | (50,832,143 | ) |
| Net change in unrealized appreciation | | | 27,536,900 | | | | 575,636,075 | |
| Net increase (decrease) in net assets resulting from operations | | | (11,108,525 | ) | | | 506,601,928 | |
| | | | | | | | | |
| DISTRIBUTIONS TO SHAREHOLDERS | | | | | | | | |
| Class N | | | — | | | | (26,502,428 | ) |
| Class A | | | — | | | | (15,537,719 | ) |
| Class C | | | — | | | | (13,038,729 | ) |
| Class I | | | — | | | | (117,168,110 | ) |
| Total distributions to shareholders | | | — | | | | (172,246,986 | ) |
| | | | | | | | | |
| FROM SHARES OF BENEFICIAL INTEREST | | | | | | | | |
| Proceeds from shares sold: | | | | | | | | |
| Class N | | | 73,774,173 | | | | 88,745,999 | |
| Class A | | | 43,406,603 | | | | 55,727,869 | |
| Class C | | | 10,231,757 | | | | 14,904,069 | |
| Class I | | | 642,713,540 | | | | 640,408,718 | |
| Net asset value of shares issued in reinvestment of distributions: | | | | | | | | |
| Class N | | | — | | | | 25,204,656 | |
| Class A | | | — | | | | 14,252,437 | |
| Class C | | | — | | | | 12,562,355 | |
| Class I | | | — | | | | 103,966,493 | |
| Payments for shares repurchased: | | | | | | | | |
| Class N | | | (172,318,771 | ) | | | (163,362,221 | ) |
| Class A | | | (73,157,162 | ) | | | (50,748,542 | ) |
| Class C | | | (60,256,585 | ) | | | (61,602,217 | ) |
| Class I | | | (864,585,791 | ) | | | (730,773,548 | ) |
| Net decrease in net assets from shares of beneficial interest | | | (400,192,236 | ) | | | (50,713,932 | ) |
| | | | | | | | | |
| TOTAL INCREASE (DECREASE) IN NET ASSETS | | | (411,300,761 | ) | | | 283,641,010 | |
| | | | | | | | | |
| NET ASSETS | | | | | | | | |
| Beginning of Year | | | 3,760,637,891 | | | | 3,476,996,881 | |
| End of Year | | $ | 3,349,337,130 | | | $ | 3,760,637,891 | |
See accompanying notes to financial statements.
| Eventide Gilead Fund |
| STATEMENTS OF CHANGES IN NET ASSETS (Continued) |
| | | For the | | | For the | |
| | | Year Ended | | | Year Ended | |
| | | June 30, 2024 | | | June 30, 2023 | |
| SHARE ACTIVITY | | | | | | | | |
| Class N: | | | | | | | | |
| Shares Sold | | | 1,518,597 | | | | 1,959,635 | |
| Shares Reinvested | | | — | | | | 594,029 | |
| Shares Repurchased | | | (3,552,489 | ) | | | (3,651,814 | ) |
| Net decrease in shares of beneficial interest outstanding | | | (2,033,892 | ) | | | (1,098,150 | ) |
| | | | | | | | | |
| Class A: | | | | | | | | |
| Shares Sold | | | 908,469 | | | | 1,244,030 | |
| Shares Reinvested | | | — | | | | 338,136 | |
| Shares Repurchased | | | (1,533,665 | ) | | | (1,135,497 | ) |
| Net increase (decrease) in shares of beneficial interest outstanding | | | (625,196 | ) | | | 446,669 | |
| | | | | | | | | |
| Class C: | | | | | | | | |
| Shares Sold | | | 243,481 | | | | 372,502 | |
| Shares Reinvested | | | — | | | | 337,607 | |
| Shares Repurchased | | | (1,439,695 | ) | | | (1,566,252 | ) |
| Net decrease in shares of beneficial interest outstanding | | | (1,196,214 | ) | | | (856,143 | ) |
| | | | | | | | | |
| Class I: | | | | | | | | |
| Shares Sold | | | 12,826,677 | | | | 13,786,761 | |
| Shares Reinvested | | | — | | | | 2,376,377 | |
| Shares Repurchased | | | (17,409,071 | ) | | | (15,809,021 | ) |
| Net increase (decrease) in shares of beneficial interest outstanding | | | (4,582,394 | ) | | | 354,117 | |
See accompanying notes to financial statements.
| Eventide Healthcare & Life Sciences Fund |
| STATEMENTS OF CHANGES IN NET ASSETS |
| | | For the | | | For the | |
| | | Year Ended | | | Year Ended | |
| | | June 30, 2024 | | | June 30, 2023 | |
| FROM OPERATIONS | | | | | | | | |
| Net investment loss | | $ | (17,761,829 | ) | | $ | (16,468,559 | ) |
| Net realized gain | | | 28,786,860 | | | | 87,672,175 | |
| Net change in unrealized appreciation (depreciation) | | | (171,706,635 | ) | | | 429,893,252 | |
| Net increase (decrease) in net assets resulting from operations | | | (160,681,604 | ) | | | 501,096,868 | |
| | | | | | | | | |
| FROM SHARES OF BENEFICIAL INTEREST | | | | | | | | |
| Proceeds from shares sold: | | | | | | | | |
| Class N | | | 27,610,590 | | | | 24,795,762 | |
| Class A | | | 18,327,882 | | | | 24,063,154 | |
| Class C | | | 5,931,902 | | | | 6,812,105 | |
| Class I | | | 338,891,051 | | | | 410,248,708 | |
| Payments for shares repurchased: | | | | | | | | |
| Class N | | | (56,522,523 | ) | | | (48,550,846 | ) |
| Class A | | | (33,663,932 | ) | | | (30,091,421 | ) |
| Class C | | | (19,891,812 | ) | | | (19,599,460 | ) |
| Class I | | | (483,248,261 | ) | | | (387,178,463 | ) |
| Net decrease in net assets from shares of beneficial interest | | | (202,565,103 | ) | | | (19,500,461 | ) |
| | | | | | | | | |
| TOTAL INCREASE (DECREASE) IN NET ASSETS | | | (363,246,707 | ) | | | 481,596,407 | |
| | | | | | | | | |
| NET ASSETS | | | | | | | | |
| Beginning of Year | | | 1,803,162,456 | | | | 1,321,566,049 | |
| End of Year | | $ | 1,439,915,749 | | | $ | 1,803,162,456 | |
See accompanying notes to financial statements.
| Eventide Healthcare & Life Sciences Fund |
| STATEMENTS OF CHANGES IN NET ASSETS (Continued) |
| | | For the | | | For the | |
| | | Year Ended | | | Year Ended | |
| | | June 30, 2024 | | | June 30, 2023 | |
| SHARE ACTIVITY | | | | | | | | |
| Class N: | | | | | | | | |
| Shares Sold | | | 808,352 | | | | 761,278 | |
| Shares Repurchased | | | (1,645,670 | ) | | | (1,502,705 | ) |
| Net decrease in shares of beneficial interest outstanding | | | (837,318 | ) | | | (741,427 | ) |
| | | | | | | | | |
| Class A: | | | | | | | | |
| Shares Sold | | | 533,812 | | | | 747,325 | |
| Shares Repurchased | | | (1,004,391 | ) | | | (923,751 | ) |
| Net decrease in shares of beneficial interest outstanding | | | (470,579 | ) | | | (176,426 | ) |
| | | | | | | | | |
| Class C: | | | | | | | | |
| Shares Sold | | | 189,732 | | | | 232,446 | |
| Shares Repurchased | | | (643,139 | ) | | | (661,200 | ) |
| Net decrease in shares of beneficial interest outstanding | | | (453,407 | ) | | | (428,754 | ) |
| | | | | | | | | |
| Class I: | | | | | | | | |
| Shares Sold | | | 9,731,634 | | | | 12,546,799 | |
| Shares Repurchased | | | (13,939,231 | ) | | | (11,930,781 | ) |
| Net increase (decrease) in shares of beneficial interest outstanding | | | (4,207,597 | ) | | | 616,018 | |
See accompanying notes to financial statements.
| Eventide Large Cap Focus Fund |
| STATEMENT OF CHANGES IN NET ASSETS |
| | | For the | | | For the | |
| | | Year Ended | | | Year Ended | |
| | | June 30, 2024 | | | June 30, 2023 (1) | |
| FROM OPERATIONS | | | | | | | | |
| Net investment income | | $ | 84,834 | | | $ | 4,324 | |
| Net realized gain (loss) | | | 3,919,159 | | | | (308,679 | ) |
| Net change in unrealized appreciation | | | 5,840,777 | | | | 1,683,784 | |
| Net increase in net assets resulting from operations | | | 9,844,770 | | | | 1,379,429 | |
| | | | | | | | | |
| DISTRIBUTIONS TO SHAREHOLDERS | | | | | | | | |
| From Accumulated Earnings | | | | | | | | |
| Class I | | | — | | | | (4,107 | ) |
| Return of Capital | | | | | | | | |
| Class N | | | — | | | | (35 | ) |
| Class A | | | — | | | | (36 | ) |
| Class I | | | — | | | | (5,720 | ) |
| Total distributions to shareholders | | | — | | | | (9,898 | ) |
| | | | | | | | | |
| FROM SHARES OF BENEFICIAL INTEREST | | | | | | | | |
| Proceeds from shares sold: | | | | | | | | |
| Class N | | | 13,208,513 | | | | 524,748 | |
| Class A | | | 1,618,697 | | | | 249,063 | |
| Class C | | | 250,508 | | | | 24,480 | |
| Class I | | | 80,767,005 | | | | 15,266,218 | |
| Net asset value of shares issued in reinvestment of distributions: | | | | | | | | |
| Class N | | | — | | | | 27 | |
| Class A | | | — | | | | 36 | |
| Class I | | | — | | | | 9,440 | |
| Payments for shares repurchased: | | | | | | | | |
| Class N | | | (2,227,146 | ) | | | (224,466 | ) |
| Class A | | | (129,860 | ) | | | (79,745 | ) |
| Class C | | | (2,696 | ) | | | — | |
| Class I | | | (10,501,346 | ) | | | (3,784,594 | ) |
| Net increase in net assets from shares of beneficial interest | | | 82,983,675 | | | | 11,985,207 | |
| | | | | | | | | |
| TOTAL INCREASE IN NET ASSETS | | | 92,828,445 | | | | 13,354,738 | |
| | | | | | | | | |
| NET ASSETS | | | | | | | | |
| Beginning of Period/Year | | | 13,354,738 | | | | — | |
| End of Period/Year | | $ | 106,183,183 | | | $ | 13,354,738 | |
| (1) | Eventide Large Cap Focus Fund commenced operations on June 30, 2022. |
See accompanying notes to financial statements.
| Eventide Large Cap Focus Fund |
| STATEMENT OF CHANGES IN NET ASSETS (Continued) |
| | | For the | | | For the | |
| | | Year Ended | | | Year Ended | |
| | | June 30, 2024 | | | June 30, 2023 (1) | |
| SHARE ACTIVITY | | | | | | | | |
| Class N: | | | | | | | | |
| Shares Sold | | | 1,073,482 | | | | 50,682 | |
| Shares Reinvested | | | — | | | | 3 | |
| Shares Repurchased | | | (167,698 | ) | | | (21,792 | ) |
| Net increase in shares of beneficial interest outstanding | | | 905,784 | | | | 28,893 | |
| | | | | | | | | |
| Class A: | | | | | | | | |
| Shares Sold | | | 124,512 | | | | 24,367 | |
| Shares Reinvested | | | — | | | | 3 | |
| Shares Repurchased | | | (9,870 | ) | | | (7,768 | ) |
| Net increase in shares of beneficial interest outstanding | | | 114,642 | | | | 16,602 | |
| | | | | | | | | |
| Class C: | | | | | | | | |
| Shares Sold | | | 19,051 | | | | 2,338 | |
| Shares Repurchased | | | (206 | ) | | | — | |
| Net increase in shares of beneficial interest outstanding | | | 18,845 | | | | 2,338 | |
| | | | | | | | | |
| Class I: | | | | | | | | |
| Shares Sold | | | 6,219,032 | | | | 1,487,132 | |
| Shares Reinvested | | | — | | | | 923 | |
| Shares Repurchased | | | (861,446 | ) | | | (368,681 | ) |
| Net increase in shares of beneficial interest outstanding | | | 5,357,586 | | | | 1,119,374 | |
| (1) | Eventide Large Cap Focus Fund commenced operations on June 30, 2022. |
See accompanying notes to financial statements.
| Eventide Limited-Term Bond Fund |
| STATEMENTS OF CHANGES IN NET ASSETS |
| | | For the | | | For the | |
| | | Year Ended | | | Year Ended | |
| | | June 30, 2024 | | | June 30, 2023 | |
| FROM OPERATIONS | | | | | | | | |
| Net investment income | | $ | 4,124,196 | | | $ | 2,571,717 | |
| Net realized loss | | | (995,253 | ) | | | (5,299,246 | ) |
| Net change in unrealized appreciation | | | 3,826,483 | | | | 4,451,387 | |
| Net increase in net assets resulting from operations | | | 6,955,426 | | | | 1,723,858 | |
| | | | | | | | | |
| DISTRIBUTIONS TO SHAREHOLDERS | | | | | | | | |
| From Accumulated Earnings | | | | | | | | |
| Class N | | | (515,651 | ) | | | (283,263 | ) |
| Class A | | | (282,483 | ) | | | (302,006 | ) |
| Class C | | | (30,364 | ) | | | (15,268 | ) |
| Class I | | | (3,275,627 | ) | | | (2,074,932 | ) |
| Return of Capital | | | | | | | | |
| Class N | | | — | | | | (4,462 | ) |
| Class A | | | — | | | | (5,259 | ) |
| Class C | | | — | | | | (487 | ) |
| Class I | | | — | | | | (32,214 | ) |
| Total distributions to shareholders | | | (4,104,125 | ) | | | (2,717,891 | ) |
| | | | | | | | | |
| FROM SHARES OF BENEFICIAL INTEREST | | | | | | | | |
| Proceeds from shares sold: | | | | | | | | |
| Class N | | | 5,325,751 | | | | 21,519,104 | |
| Class A | | | 5,593,337 | | | | 9,487,414 | |
| Class C | | | 517,636 | | | | 1,005,560 | |
| Class I | | | 71,435,949 | | | | 73,533,124 | |
| Net asset value of shares issued in reinvestment of distributions: | | | | | | | | |
| Class N | | | 514,104 | | | | 286,917 | |
| Class A | | | 278,766 | | | | 304,810 | |
| Class C | | | 30,364 | | | | 15,678 | |
| Class I | | | 3,066,017 | | | | 1,847,368 | |
| Payments for shares repurchased: | | | | | | | | |
| Class N | | | (5,935,269 | ) | | | (9,928,344 | ) |
| Class A | | | (20,858,904 | ) | | | (12,462,801 | ) |
| Class C | | | (632,265 | ) | | | (1,078,599 | ) |
| Class I | | | (43,733,461 | ) | | | (138,219,235 | ) |
| Net increase (decrease) in net assets from shares of beneficial interest | | | 15,602,025 | | | | (53,689,004 | ) |
| | | | | | | | | |
| TOTAL INCREASE (DECREASE) IN NET ASSETS | | | 18,453,326 | | | | (54,683,037 | ) |
| | | | | | | | | |
| NET ASSETS | | | | | | | | |
| Beginning of Year | | | 127,372,213 | | | | 182,055,250 | |
| End of Year | | $ | 145,825,539 | | | $ | 127,372,213 | |
See accompanying notes to financial statements.
| Eventide Limited-Term Bond Fund |
| STATEMENTS OF CHANGES IN NET ASSETS (Continued) |
| | | For the | | | For the | |
| | | Year Ended | | | Year Ended | |
| | | June 30, 2024 | | | June 30, 2023 | |
| SHARE ACTIVITY | | | | | | | | |
| Class N: | | | | | | | | |
| Shares Sold | | | 540,489 | | | | 2,245,504 | |
| Shares Reinvested | | | 52,457 | | | | 29,697 | |
| Shares Repurchased | | | (605,720 | ) | | | (1,025,667 | ) |
| Net increase (decrease) in shares of beneficial interest outstanding | | | (12,774 | ) | | | 1,249,534 | |
| | | | | | | | | |
| Class A: | | | | | | | | |
| Shares Sold | | | 572,186 | | | | 979,448 | |
| Shares Reinvested | | | 28,422 | | | | 31,459 | |
| Shares Repurchased | | | (2,133,393 | ) | | | (1,291,906 | ) |
| Net decrease in shares of beneficial interest outstanding | | | (1,532,785 | ) | | | (280,999 | ) |
| | | | | | | | | |
| Class C: | | | | | | | | |
| Shares Sold | | | 52,892 | | | | 105,013 | |
| Shares Reinvested | | | 3,112 | | | | 1,629 | |
| Shares Repurchased | | | (64,985 | ) | | | (112,068 | ) |
| Net decrease in shares of beneficial interest outstanding | | | (8,981 | ) | | | (5,426 | ) |
| | | | | | | | | |
| Class I: | | | | | | | | |
| Shares Sold | | | 7,107,542 | | | | 7,407,748 | |
| Shares Reinvested | | | 304,804 | | | | 186,484 | |
| Shares Repurchased | | | (4,351,992 | ) | | | (13,969,448 | ) |
| Net increase (decrease) in shares of beneficial interest outstanding | | | 3,060,354 | | | | (6,375,216 | ) |
See accompanying notes to financial statements.
| Eventide Balanced Fund |
| FINANCIAL HIGHLIGHTS |
| |
| Per Share Data and Ratios for a Share of Beneficial Interest Outstanding Throughout Each of the Years Presented |
| | | Class N | |
| | | Year Ended | | | Year Ended | | | Year Ended | | | Year Ended | | | Year Ended | |
| | | June 30, 2024 | | | June 30, 2023 | | | June 30, 2022 | | | June 30, 2021 | | | June 30, 2020 | |
| Net asset value, beginning of year | | $ | 12.44 | | | $ | 12.12 | | | $ | 14.21 | | | $ | 11.38 | | | $ | 10.90 | |
| Activity from investment operations: | | | | | | | | | | | | | | | | | | | | |
| Net investment income (1) | | | 0.19 | | | | 0.16 | | | | 0.10 | | | | 0.08 | | | | 0.16 | |
| Net realized and unrealized gain (loss) on investments | | | 1.35 | | | | 0.47 | | | | (1.35 | ) | | | 2.95 | | | | 0.60 | |
| Total from investment operations | | | 1.54 | | | | 0.63 | | | | (1.25 | ) | | | 3.03 | | | | 0.76 | |
| Less distributions from: | | | | | | | | | | | | | | | | | | | | |
| Net investment income | | | (0.20 | ) | | | (0.15 | ) | | | (0.21 | ) | | | (0.18 | ) | | | (0.14 | ) |
| Net realized gains | | | — | | | | (0.12 | ) | | | (0.63 | ) | | | (0.02 | ) | | | — | |
| Return of capital | | | — | | | | (0.04 | ) | | | — | | | | — | | | | (0.14 | ) |
| Total distributions | | | (0.20 | ) | | | (0.31 | ) | | | (0.84 | ) | | | (0.20 | ) | | | (0.28 | ) |
| Net asset value, end of year | | $ | 13.78 | | | $ | 12.44 | | | $ | 12.12 | | | $ | 14.21 | | | $ | 11.38 | |
| Total return (2) | | | 12.52 | % | | | 5.35 | % | | | (9.58 | )% | | | 26.81 | % | | | 7.03 | % |
| Net assets, at end of year (000s) | | $ | 22,308 | | | $ | 30,618 | | | $ | 34,856 | | | $ | 39,947 | | | $ | 19,454 | |
| Ratio of gross expenses to average net assets before expense reimbursement/recapture (3)(4) | | | 1.09 | % | | | 1.10 | % | | | 1.01 | % | | | 1.05 | % | | | 1.19 | % |
| Ratio of net expenses to average net assets after expense reimbursement/recapture (4) | | | 1.02 | % | | | 1.02 | % | | | 1.02 | % | | | 1.02 | % | | | 1.10 | % |
| Ratio of net investment income to average net assets (4)(5) | | | 1.51 | % | | | 1.34 | % | | | 0.69 | % | | | 0.59 | % | | | 1.44 | % |
| Portfolio Turnover Rate | | | 43 | % | | | 48 | % | | | 66 | % | | | 73 | % | | | 107 | % |
| (1) | Per share amounts calculated using the average shares method. |
| (2) | Total return in the above table is historical in nature and represents the rate that the investor would have earned or lost on an investment in the Fund assuming reinvestment of dividends and capital gain distributions, if any. Had the advisor not waived a portion of the Fund’s expenses in certain periods, total returns would have been lower. |
| (3) | Represents the ratio of expenses to average net assets absent fee waivers and/or expense reimbursements/recapture by the advisor. |
| (4) | The ratios of expenses to average net assets and net investment income to average net assets do not reflect the expenses of the underlying investment companies in which the Fund invests. |
| (5) | Recognition of net investment income is affected by the timing and declaration of dividends by the underlying investment companies in which the Fund invests. |
See accompanying notes to financial statements.
| Eventide Balanced Fund |
| FINANCIAL HIGHLIGHTS |
| |
| Per Share Data and Ratios for a Share of Beneficial Interest Outstanding Throughout Each of the Years Presented |
| | | Class A | |
| | | Year Ended | | | Year Ended | | | Year Ended | | | Year Ended | | | Year Ended | |
| | | June 30, 2024 | | | June 30, 2023 | | | June 30, 2022 | | | June 30, 2021 | | | June 30, 2020 | |
| Net asset value, beginning of year | | $ | 12.46 | | | $ | 12.14 | | | $ | 14.22 | | | $ | 11.38 | | | $ | 10.89 | |
| Activity from investment operations: | | | | | | | | | | | | | | | | | | | | |
| Net investment income (1) | | | 0.19 | | | | 0.16 | | | | 0.09 | | | | 0.07 | | | | 0.15 | |
| Net realized and unrealized gain (loss) on investments | | | 1.36 | | | | 0.47 | | | | (1.33 | ) | | | 2.96 | | | | 0.61 | |
| Total from investment operations | | | 1.55 | | | | 0.63 | | | | (1.24 | ) | | | 3.03 | | | | 0.76 | |
| Less distributions from: | | | | | | | | | | | | | | | | | | | | |
| Net investment income | | | (0.20 | ) | | | (0.15 | ) | | | (0.21 | ) | | | (0.17 | ) | | | (0.13 | ) |
| Net realized gains | | | — | | | | (0.12 | ) | | | (0.63 | ) | | | (0.02 | ) | | | — | |
| Return of capital | | | — | | | | (0.04 | ) | | | — | | | | — | | | | (0.14 | ) |
| Total distributions | | | (0.20 | ) | | | (0.31 | ) | | | (0.84 | ) | | | (0.19 | ) | | | (0.27 | ) |
| Net asset value, end of year | | $ | 13.81 | | | $ | 12.46 | | | $ | 12.14 | | | $ | 14.22 | | | $ | 11.38 | |
| Total return (2) | | | 12.53 | % (6) | | | 5.29 | % | | | (9.55 | )% | | | 26.84 | % | | | 7.07 | % |
| Net assets, at end of year (000s) | | $ | 30,175 | | | $ | 25,577 | | | $ | 25,744 | | | $ | 23,139 | | | $ | 10,659 | |
| Ratio of gross expenses to average net assets before expense reimbursement/recapture (3)(4) | | | 1.14 | % | | | 1.15 | % | | | 1.06 | % | | | 1.10 | % | | | 1.24 | % |
| Ratio of net expenses to average net assets after expense reimbursement/recapture (4) | | | 1.07 | % | | | 1.07 | % | | | 1.07 | % | | | 1.07 | % | | | 1.15 | % |
| Ratio of net investment income to average net assets (4)(5) | | | 1.47 | % | | | 1.32 | % | | | 0.65 | % | | | 0.55 | % | | | 1.39 | % |
| Portfolio Turnover Rate | | | 43 | % | | | 48 | % | | | 66 | % | | | 73 | % | | | 107 | % |
| (1) | Per share amounts calculated using the average shares method. |
| (2) | Total return in the above table is historical in nature and represents the rate that the investor would have earned or lost on an investment in the Fund assuming reinvestment of dividends and capital gain distributions, if any and does not reflect the impact of sales charges. Had the advisor not waived a portion of the Fund’s expenses in certain periods, total returns would have been lower. |
| (3) | Represents the ratio of expenses to average net assets absent fee waivers and/or expense reimbursements/recapture by the advisor. |
| (4) | The ratios of expenses to average net assets and net investment income to average net assets do not reflect the expenses of the underlying investment companies in which the Fund invests. |
| (5) | Recognition of net investment income is affected by the timing and declaration of dividends by the underlying investment companies in which the Fund invests. |
| (6) | Includes adjustments in accordance with accounting principles generally accepted in the United States of America and, consequently, the net asset values for financial reporting purposes and the returns based upon those net asset values may differ from the net asset values and returns for shareholder transactions. |
See accompanying notes to financial statements.
| Eventide Balanced Fund |
| FINANCIAL HIGHLIGHTS |
| |
| Per Share Data and Ratios for a Share of Beneficial Interest Outstanding Throughout Each of the Years Presented |
| | | Class C | |
| | | Year Ended | | | Year Ended | | | Year Ended | | | Year Ended | | | Year Ended | |
| | | June 30, 2024 | | | June 30, 2023 | | | June 30, 2022 | | | June 30, 2021 | | | June 30, 2020 | |
| Net asset value, beginning of year | | $ | 12.38 | | | $ | 12.06 | | | $ | 14.15 | | | $ | 11.34 | | | $ | 10.86 | |
| Activity from investment operations: | | | | | | | | | | | | | | | | | | | | |
| Net investment income (loss) (1) | | | 0.09 | | | | 0.07 | | | | (0.01 | ) | | | (0.03 | ) | | | 0.07 | |
| Net realized and unrealized gain (loss) on investments | | | 1.34 | | | | 0.47 | | | | (1.35 | ) | | | 2.95 | | | | 0.60 | |
| Total from investment operations | | | 1.43 | | | | 0.54 | | | | (1.36 | ) | | | 2.92 | | | | 0.67 | |
| Less distributions from: | | | | | | | | | | | | | | | | | | | | |
| Net investment income | | | (0.11 | ) | | | (0.06 | ) | | | (0.10 | ) | | | (0.09 | ) | | | (0.09 | ) |
| Net realized gains | | | — | | | | (0.12 | ) | | | (0.63 | ) | | | (0.02 | ) | | | — | |
| Return of capital | | | — | | | | (0.04 | ) | | | — | | | | — | | | | (0.10 | ) |
| Total distributions | | | (0.11 | ) | | | (0.22 | ) | | | (0.73 | ) | | | (0.11 | ) | | | (0.19 | ) |
| Net asset value, end of year | | $ | 13.70 | | | $ | 12.38 | | | $ | 12.06 | | | $ | 14.15 | | | $ | 11.34 | |
| Total return (2) | | | 11.58 | % | | | 4.54 | % | | | (10.33 | )% | | | 25.85 | % | | | 6.23 | % |
| Net assets, at end of year (000s) | | $ | 16,020 | | | $ | 16,181 | | | $ | 18,146 | | | $ | 18,883 | | | $ | 8,091 | |
| Ratio of gross expenses to average net assets before expense reimbursement/recapture (3)(4) | | | 1.89 | % | | | 1.90 | % | | | 1.81 | % | | | 1.85 | % | | | 1.99 | % |
| Ratio of net expenses to average net assets after expense reimbursement/recapture (4) | | | 1.82 | % | | | 1.82 | % | | | 1.82 | % | | | 1.82 | % | | | 1.90 | % |
| Ratio of net investment income (loss) to average net assets (4)(5) | | | 0.72 | % | | | 0.56 | % | | | (0.10 | )% | | | (0.21 | )% | | | 0.64 | % |
| Portfolio Turnover Rate | | | 43 | % | | | 48 | % | | | 66 | % | | | 73 | % | | | 107 | % |
| (1) | Per share amounts calculated using the average shares method. |
| (2) | Total return in the above table is historical in nature and represents the rate that the investor would have earned or lost on an investment in the Fund assuming reinvestment of dividends and capital gain distributions, if any. Had the advisor not waived a portion of the Fund’s expenses in certain periods, total returns would have been lower. |
| (3) | Represents the ratio of expenses to average net assets absent fee waivers and/or expense reimbursements/recapture by the advisor. |
| (4) | The ratios of expenses to average net assets and net investment income (loss) to average net assets do not reflect the expenses of the underlying investment companies in which the Fund invests. |
| (5) | Recognition of net investment income (loss) is affected by the timing and declaration of dividends by the underlying investment companies in which the Fund invests. |
See accompanying notes to financial statements.
| Eventide Balanced Fund |
| FINANCIAL HIGHLIGHTS |
| |
| Per Share Data and Ratios for a Share of Beneficial Interest Outstanding Throughout Each of the Years Presented |
| | | Class I | |
| | | Year Ended | | | Year Ended | | | Year Ended | | | Year Ended | | | Year Ended | |
| | | June 30, 2024 | | | June 30, 2023 | | | June 30, 2022 | | | June 30, 2021 | | | June 30, 2020 | |
| Net asset value, beginning of year | | $ | 12.44 | | | $ | 12.12 | | | $ | 14.22 | | | $ | 11.38 | | | $ | 10.90 | |
| Activity from investment operations: | | | | | | | | | | | | | | | | | | | | |
| Net investment income (1) | | | 0.22 | | | | 0.19 | | | | 0.12 | | | | 0.11 | | | | 0.18 | |
| Net realized and unrealized gain (loss) on investments | | | 1.35 | | | | 0.47 | | | | (1.35 | ) | | | 2.95 | | | | 0.60 | |
| Total from investment operations | | | 1.57 | | | | 0.66 | | | | (1.23 | ) | | | 3.06 | | | | 0.78 | |
| Less distributions from: | | | | | | | | | | | | | | | | | | | | |
| Net investment income | | | (0.23 | ) | | | (0.18 | ) | | | (0.24 | ) | | | (0.20 | ) | | | (0.15 | ) |
| Net realized gains | | | — | | | | (0.12 | ) | | | (0.63 | ) | | | (0.02 | ) | | | — | |
| Return of capital | | | — | | | | (0.04 | ) | | | — | | | | — | | | | (0.15 | ) |
| Total distributions | | | (0.23 | ) | | | (0.34 | ) | | | (0.87 | ) | | | (0.22 | ) | | | (0.30 | ) |
| Net asset value, end of year | | $ | 13.78 | | | $ | 12.44 | | | $ | 12.12 | | | $ | 14.22 | | | $ | 11.38 | |
| Total return (2) | | | 12.75 | % | | | 5.57 | % | | | (9.46 | )% | | | 27.12 | % | | | 7.23 | % |
| Net assets, at end of year (000s) | | $ | 311,017 | | | $ | 260,688 | | | $ | 269,421 | | | $ | 279,142 | | | $ | 110,295 | |
| Ratio of gross expenses to average net assets before expense reimbursement/recapture (3)(4) | | | 0.89 | % | | | 0.90 | % | | | 0.81 | % | | | 0.85 | % | | | 0.99 | % |
| Ratio of net expenses to average net assets after expense reimbursement/recapture (4) | | | 0.82 | % | | | 0.82 | % | | | 0.82 | % | | | 0.82 | % | | | 0.90 | % |
| Ratio of net investment income to average net assets (4)(5) | | | 1.72 | % | | | 1.57 | % | | | 0.90 | % | | | 0.81 | % | | | 1.65 | % |
| Portfolio Turnover Rate | | | 43 | % | | | 48 | % | | | 66 | % | | | 73 | % | | | 107 | % |
| (1) | Per share amounts calculated using the average shares method. |
| (2) | Total return in the above table is historical in nature and represents the rate that the investor would have earned or lost on an investment in the Fund assuming reinvestment of dividends and capital gain distributions, if any. Had the advisor not waived a portion of the Fund’s expenses in certain periods, total returns would have been lower. |
| (3) | Represents the ratio of expenses to average net assets absent fee waivers and/or expense reimbursements/recapture by the advisor. |
| (4) | The ratios of expenses to average net assets and net investment income to average net assets do not reflect the expenses of the underlying investment companies in which the Fund invests. |
| (5) | Recognition of net investment income is affected by the timing and declaration of dividends by the underlying investment companies in which the Fund invests. |
See accompanying notes to financial statements.
| Eventide Core Bond Fund |
| FINANCIAL HIGHLIGHTS |
| |
| Per Share Data and Ratios for a Share of Beneficial Interest Outstanding Throughout Each of the Periods or Years Presented |
| | | Class N | |
| | | Year Ended | | | Year Ended | | | Year Ended | | | Period Ended | |
| | | June 30, 2024 | | | June 30, 2023 | | | June 30, 2022 | | | June 30, 2021 * | |
| Net asset value, beginning of period/year | | $ | 8.15 | | | $ | 8.41 | | | $ | 9.66 | | | $ | 10.00 | |
| Activity from investment operations: | | | | | | | | | | | | | | | | |
| Net investment income (1) | | | 0.28 | | | | 0.17 | | | | 0.08 | | | | 0.05 | |
| Net realized and unrealized gain (loss) on investments | | | (0.09 | ) | | | (0.25 | ) | | | (1.20 | ) | | | (0.29 | ) |
| Total from investment operations | | | 0.19 | | | | (0.08 | ) | | | (1.12 | ) | | | (0.24 | ) |
| Less distributions from: | | | | | | | | | | | | | | | | |
| Net investment income | | | (0.26 | ) | | | (0.18 | ) | | | (0.11 | ) | | | (0.05 | ) |
| Return of capital | | | — | | | | — | | | | (0.02 | ) | | | (0.05 | ) |
| Total distributions | | | (0.26 | ) | | | (0.18 | ) | | | (0.13 | ) | | | (0.10 | ) |
| Net asset value, end of period/year | | $ | 8.08 | | | $ | 8.15 | | | $ | 8.41 | | | $ | 9.66 | |
| Total return (2) | | | 2.34 | % | | | (0.89 | )% | | | (11.69 | )% | | | (2.39 | )% (6) |
| Net assets, at end of period/year (000s) | | $ | 35,467 | | | $ | 37,445 | | | $ | 58,166 | | | $ | 56,644 | |
| Ratio of gross expenses to average net assets before expense reimbursement (3)(4) | | | 0.90 | % | | | 1.01 | % | | | 0.96 | % | | | 0.89 | % (7) |
| Ratio of net expenses to average net assets after expense reimbursement (4) | | | 0.78 | % | | | 0.78 | % | | | 0.78 | % | | | 0.78 | % (7) |
| Ratio of net investment income to average net assets (4)(5) | | | 3.46 | % | | | 2.09 | % | | | 0.88 | % | | | 0.53 | % (7) |
| Portfolio Turnover Rate | | | 33 | % | | | 57 | % | | | 56 | % | | | 52 | % (6) |
| * | Eventide Core Bond Fund commenced operations on July 31, 2020. |
| (1) | Per share amounts calculated using the average shares method. |
| (2) | Total return in the above table is historical in nature and represents the rate that the investor would have earned or lost on an investment in the Fund assuming reinvestment of dividends and capital gain distributions, if any. Had the advisor not waived a portion of the Fund’s expenses in certain periods, total returns would have been lower. |
| (3) | Represents the ratio of expenses to average net assets absent fee waivers and/or expense reimbursements by the advisor. |
| (4) | The ratios of expenses to average net assets and net investment income to average net assets do not reflect the expenses of the underlying investment companies in which the Fund invests. |
| (5) | Recognition of net investment income is affected by the timing and declaration of dividends by the underlying investment companies in which the Fund invests. |
See accompanying notes to financial statements.
| Eventide Core Bond Fund |
| FINANCIAL HIGHLIGHTS |
| |
| Per Share Data and Ratios for a Share of Beneficial Interest Outstanding Throughout Each of the Periods or Years Presented |
| | | Class A | |
| | | Year Ended | | | Year Ended | | | Year Ended | | | Period Ended | |
| | | June 30, 2024 | | | June 30, 2023 | | | June 30, 2022 | | | June 30, 2021 * | |
| Net asset value, beginning of year/period | | $ | 8.18 | | | $ | 8.44 | | | $ | 9.71 | | | $ | 10.00 | |
| Activity from investment operations: | | | | | | | | | | | | | | | | |
| Net investment income (1) | | | 0.28 | | | | 0.18 | | | | 0.07 | | | | 0.05 | |
| Net realized and unrealized gain (loss) on investments | | | (0.09 | ) | | | (0.26 | ) | | | (1.22 | ) | | | (0.27 | ) |
| Total from investment operations | | | 0.19 | | | | (0.08 | ) | | | (1.15 | ) | | | (0.22 | ) |
| Less distributions from: | | | | | | | | | | | | | | | | |
| Net investment income | | | (0.25 | ) | | | (0.18 | ) | | | (0.10 | ) | | | (0.02 | ) |
| Return of capital | | | — | | | | — | | | | (0.02 | ) | | | (0.05 | ) |
| Total distributions | | | (0.25 | ) | | | (0.18 | ) | | | (0.12 | ) | | | (0.07 | ) |
| Net asset value, end of year/period | | $ | 8.12 | | | $ | 8.18 | | | $ | 8.44 | | | $ | 9.71 | |
| Total return (2) | | | 2.42 | % | | | (0.90 | )% | | | (11.91 | )% | | | (2.28 | )% (6) |
| Net assets, at end of year/period (000s) | | $ | 608 | | | $ | 412 | | | $ | 197 | | | $ | 384 | |
| Ratio of gross expenses to average net assets before expense reimbursement (3)(4) | | | 0.95 | % | | | 1.06 | % | | | 1.01 | % | | | 0.94 | % (7) |
| Ratio of net expenses to average net assets after expense reimbursement (4) | | | 0.83 | % | | | 0.83 | % | | | 0.83 | % | | | 0.83 | % (7) |
| Ratio of net investment income to average net assets (4)(5) | | | 3.47 | % | | | 2.19 | % | | | 0.78 | % | | | 0.51 | % (7) |
| Portfolio Turnover Rate | | | 33 | % | | | 57 | % | | | 56 | % | | | 52 | % (6) |
| * | Eventide Core Bond Fund commenced operations on July 31, 2020. |
| (1) | Per share amounts calculated using the average shares method. |
| (2) | Total return in the above table is historical in nature and represents the rate that the investor would have earned or lost on an investment in the Fund assuming reinvestment of dividends and capital gain distributions, if any and does not reflect the impact of sales charges. Had the advisor not waived a portion of the Fund’s expenses in certain periods, total returns would have been lower. |
| (3) | Represents the ratio of expenses to average net assets absent fee waivers and/or expense reimbursements by the advisor. |
| (4) | The ratios of expenses to average net assets and net investment income to average net assets do not reflect the expenses of the underlying investment companies in which the Fund invests. |
| (5) | Recognition of net investment income is affected by the timing and declaration of dividends by the underlying investment companies in which the Fund invests. |
See accompanying notes to financial statements.
| Eventide Core Bond Fund |
| FINANCIAL HIGHLIGHTS |
| |
| Per Share Data and Ratios for a Share of Beneficial Interest Outstanding Throughout Each of the Periods or Years Presented |
| | | Class C | |
| | | Year Ended | | | Year Ended | | | Year Ended | | | Period Ended | |
| | | June 30, 2024 | | | June 30, 2023 | | | June 30, 2022 | | | June 30, 2021 * | |
| Net asset value, beginning of year/period | | $ | 8.11 | | | $ | 8.37 | | | $ | 9.63 | | | $ | 10.00 | |
| Activity from investment operations: | | | | | | | | | | | | | | | | |
| Net investment income (loss) (1) | | | 0.22 | | | | 0.11 | | | | 0.01 | | | | (0.02 | ) |
| Net realized and unrealized gain (loss) on investments | | | (0.09 | ) | | | (0.25 | ) | | | (1.20 | ) | | | (0.28 | ) |
| Total from investment operations | | | 0.13 | | | | (0.14 | ) | | | (1.19 | ) | | | (0.30 | ) |
| Less distributions from: | | | | | | | | | | | | | | | | |
| Net investment income | | | (0.21 | ) | | | (0.12 | ) | | | (0.06 | ) | | | (0.02 | ) |
| Return of capital | | | — | | | | — | | | | (0.01 | ) | | | (0.05 | ) |
| Total distributions | | | (0.21 | ) | | | (0.12 | ) | | | (0.07 | ) | | | (0.07 | ) |
| Net asset value, end of year/period | | $ | 8.03 | | | $ | 8.11 | | | $ | 8.37 | | | $ | 9.63 | |
| Total return (2) | | | 1.53 | % | | | (1.67 | )% | | | (12.37 | )% | | | (3.02 | )% (6) |
| Net assets, at end of year/period (000s) | | $ | 492 | | | $ | 221 | | | $ | 224 | | | $ | 163 | |
| Ratio of gross expenses to average net assets before expense reimbursement (3)(4) | | | 1.70 | % | | | 1.81 | % | | | 1.76 | % | | | 1.69 | % (7) |
| Ratio of net expenses to average net assets after expense reimbursement (4) | | | 1.58 | % | | | 1.58 | % | | | 1.58 | % | | | 1.58 | % (7) |
| Ratio of net investment income (loss) to average net assets (4)(5) | | | 2.74 | % | | | 1.35 | % | | | 0.09 | % | | | (0.20 | )% (7) |
| Portfolio Turnover Rate | | | 33 | % | | | 57 | % | | | 56 | % | | | 52 | % (6) |
| * | Eventide Core Bond Fund commenced operations on July 31, 2020. |
| (1) | Per share amounts calculated using the average shares method. |
| (2) | Total return in the above table is historical in nature and represents the rate that the investor would have earned or lost on an investment in the Fund assuming reinvestment of dividends and capital gain distributions, if any. Had the advisor not waived a portion of the Fund’s expenses in certain periods, total returns would have been lower. |
| (3) | Represents the ratio of expenses to average net assets absent fee waivers and/or expense reimbursements by the advisor. |
| (4) | The ratios of expenses to average net assets and net investment income/(loss) to average net assets do not reflect the expenses of the underlying investment companies in which the Fund invests. |
| (5) | Recognition of net investment income (loss) is affected by the timing and declaration of dividends by the underlying investment companies in which the Fund invests. |
See accompanying notes to financial statements.
| Eventide Core Bond Fund |
| FINANCIAL HIGHLIGHTS |
| |
| Per Share Data and Ratios for a Share of Beneficial Interest Outstanding Throughout Each of the Periods or Years Presented |
| | | Class I | |
| | | Year Ended | | | Year Ended | | | Year Ended | | | Period Ended | |
| | | June 30, 2024 | | | June 30, 2023 | | | June 30, 2022 | | | June 30, 2021 * | |
| Net asset value, beginning of year/period | | $ | 8.15 | | | $ | 8.41 | | | $ | 9.66 | | | $ | 10.00 | |
| Activity from investment operations: | | | | | | | | | | | | | | | | |
| Net investment income (1) | | | 0.30 | | | | 0.20 | | | | 0.09 | | | | 0.07 | |
| Net realized and unrealized gain (loss) on investments | | | (0.10 | ) | | | (0.26 | ) | | | (1.19 | ) | | | (0.29 | ) |
| Total from investment operations | | | 0.20 | | | | (0.06 | ) | | | (1.10 | ) | | | (0.22 | ) |
| Less distributions from: | | | | | | | | | | | | | | | | |
| Net investment income | | | (0.27 | ) | | | (0.20 | ) | | | (0.13 | ) | | | (0.07 | ) |
| Return of capital | | | — | | | | — | | | | (0.02 | ) | | | (0.05 | ) |
| Total distributions | | | (0.27 | ) | | | (0.20 | ) | | | (0.15 | ) | | | (0.12 | ) |
| Net asset value, end of year/period | | $ | 8.08 | | | $ | 8.15 | | | $ | 8.41 | | | $ | 9.66 | |
| Total return (2) | | | 2.54 | % | | | (0.67 | )% | | | (11.51 | )% | | | (2.24 | )% (6) |
| Net assets, at end of year/period (000s) | | $ | 100,738 | | | $ | 39,300 | | | $ | 13,877 | | | $ | 64,377 | |
| Ratio of gross expenses to average net assets before expense reimbursement (3)(4) | | | 0.70 | % | | | 0.81 | % | | | 0.76 | % | | | 0.69 | % (7) |
| Ratio of net expenses to average net assets after expense reimbursement (4) | | | 0.58 | % | | | 0.58 | % | | | 0.58 | % | | | 0.58 | % (7) |
| Ratio of net investment income to average net assets (4)(5) | | | 3.77 | % | | | 2.45 | % | | | 1.00 | % | | | 0.80 | % (7) |
| Portfolio Turnover Rate | | | 33 | % | | | 57 | % | | | 56 | % | | | 52 | % (6) |
| * | Eventide Core Bond Fund commenced operations on July 31, 2020. |
| (1) | Per share amounts calculated using the average shares method. |
| (2) | Total return in the above table is historical in nature and represents the rate that the investor would have earned or lost on an investment in the Fund assuming reinvestment of dividends and capital gain distributions, if any. Had the advisor not waived a portion of the Fund’s expenses in certain periods, total returns would have been lower. |
| (3) | Represents the ratio of expenses to average net assets absent fee waivers and/or expense reimbursements by the advisor. |
| (4) | The ratios of expenses to average net assets and net investment income to average net assets do not reflect the expenses of the underlying investment companies in which the Fund invests. |
| (5) | Recognition of net investment income is affected by the timing and declaration of dividends by the underlying investment companies in which the Fund invests. |
See accompanying notes to financial statements.
| Eventide Dividend Opportunities Fund |
| FINANCIAL HIGHLIGHTS |
| |
| Per Share Data and Ratios for a Share of Beneficial Interest Outstanding Throughout Each of the Years Presented |
| | | Class N | |
| | | Year Ended | | | Year Ended | | | Year Ended | | | Year Ended | | | Year Ended | |
| | | June 30, 2024 | | | June 30, 2023 | | | June 30, 2022 | | | June 30, 2021 | | | June 30, 2020 | |
| Net asset value, beginning of year | | $ | 14.65 | | | $ | 13.43 | | | $ | 15.86 | | | $ | 10.88 | | | $ | 10.37 | |
| Activity from investment operations: | | | | | | | | | | | | | | | | | | | | |
| Net investment income (1) | | | 0.06 | | | | 0.11 | | | | 0.05 | | | | 0.04 | | | | 0.11 | |
| Net realized and unrealized gain (loss) on investments | | | 3.07 | | | | 1.31 | | | | (2.01 | ) | | | 5.08 | | | | 0.57 | |
| Total from investment operations | | | 3.13 | | | | 1.42 | | | | (1.96 | ) | | | 5.12 | | | | 0.68 | |
| Less distributions from: | | | | | | | | | | | | | | | | | | | | |
| Net investment income | | | (0.06 | ) | | | (0.10 | ) | | | (0.18 | ) | | | (0.14 | ) | | | (0.10 | ) |
| Net realized gains | | | — | | | | (0.09 | ) | | | (0.29 | ) | | | — | | | | — | |
| Return of capital | | | — | | | | (0.01 | ) | | | — | | | | — | | | | (0.07 | ) |
| Total distributions | | | (0.06 | ) | | | (0.20 | ) | | | (0.47 | ) | | | (0.14 | ) | | | (0.17 | ) |
| Net asset value, end of year | | $ | 17.72 | | | $ | 14.65 | | | $ | 13.43 | | | $ | 15.86 | | | $ | 10.88 | |
| Total return (2) | | | 21.40 | % | | | 10.66 | % | | | (12.90 | )% | | | 47.21 | % | | | 6.60 | % |
| Net assets, at end of year (000s) | | $ | 87,873 | | | $ | 91,912 | | | $ | 74,940 | | | $ | 70,566 | | | $ | 18,576 | |
| Ratio of gross expenses to average net assets before expense reimbursement/recapture (3)(4) | | | 1.16 | % | | | 1.23 | % | | | 1.14 | % | | | 1.19 | % | | | 1.50 | % |
| Ratio of net expenses to average net assets after expense reimbursement/recapture (4) | | | 1.15 | % | | | 1.15 | % | | | 1.15 | % | | | 1.15 | % | | | 1.15 | % |
| Ratio of net investment income to average net assets (4)(5) | | | 0.40 | % | | | 0.75 | % | | | 0.34 | % | | | 0.27 | % | | | 1.01 | % |
| Portfolio Turnover Rate | | | 38 | % | | | 50 | % | | | 50 | % | | | 35 | % | | | 90 | % |
| | | | | | | | | | | | | | | | | | | | | |
| (1) | Per share amounts calculated using the average shares method. |
| (2) | Total return in the above table is historical in nature and represents the rate that the investor would have earned or lost on an investment in the Fund assuming reinvestment of dividends and capital gain distributions, if any. Had the advisor not waived or recaptured a portion of the Fund’s expenses in certain periods, total returns would have been lower/higher. |
| (3) | Represents the ratio of expenses to average net assets absent fee waivers and/or expense reimbursements/recapture by the advisor. |
| (4) | The ratios of expenses to average net assets and net investment income to average net assets do not reflect the expenses of the underlying investment companies in which the Fund invests. |
| (5) | Recognition of net investment income is affected by the timing and declaration of dividends by the underlying investment companies in which the Fund invests. |
See accompanying notes to financial statements.
| Eventide Dividend Opportunities Fund |
| FINANCIAL HIGHLIGHTS |
| |
| Per Share Data and Ratios for a Share of Beneficial Interest Outstanding Throughout Each of the Years Presented |
| | | Class A | |
| | | Year Ended | | | Year Ended | | | Year Ended | | | Year Ended | | | Year Ended | |
| | | June 30, 2024 | | | June 30, 2023 | | | June 30, 2022 | | | June 30, 2021 | | | June 30, 2020 | |
| Net asset value, beginning of year | | $ | 14.66 | | | $ | 13.43 | | | $ | 15.85 | | | $ | 10.87 | | | $ | 10.36 | |
| Activity from investment operations: | | | | | | | | | | | | | | | | | | | | |
| Net investment income (1) | | | 0.05 | | | | 0.10 | | | | 0.05 | | | | 0.03 | | | | 0.10 | |
| Net realized and unrealized gain (loss) on investments | | | 3.07 | | | | 1.32 | | | | (2.01 | ) | | | 5.08 | | | | 0.57 | |
| Total from investment operations | | | 3.12 | | | | 1.42 | | | | (1.96 | ) | | | 5.11 | | | | 0.67 | |
| Less distributions from: | | | | | | | | | | | | | | | | | | | | |
| Net investment income | | | (0.05 | ) | | | (0.06 | ) | | | (0.17 | ) | | | (0.13 | ) | | | (0.09 | ) |
| Net realized gains | | | — | | | | (0.09 | ) | | | (0.29 | ) | | | — | | | | — | |
| Return of capital | | | — | | | | (0.04 | ) | | | — | | | | — | | | | (0.07 | ) |
| Total distributions | | | (0.05 | ) | | | (0.19 | ) | | | (0.46 | ) | | | (0.13 | ) | | | (0.16 | ) |
| Net asset value, end of year | | $ | 17.73 | | | $ | 14.66 | | | $ | 13.43 | | | $ | 15.85 | | | $ | 10.87 | |
| Total return (2) | | | 21.35 | % | | | 10.68 | % | | | (12.88 | )% | | | 47.22 | % | | | 6.55 | % |
| Net assets, at end of year (000s) | | $ | 50,563 | | | $ | 36,722 | | | $ | 29,243 | | | $ | 17,865 | | | $ | 3,184 | |
| Ratio of gross expenses to average net assets before expense reimbursement/recapture (3)(4) | | | 1.21 | % | | | 1.28 | % | | | 1.19 | % | | | 1.24 | % | | | 1.55 | % |
| Ratio of net expenses to average net assets after expense reimbursement/recapture (4) | | | 1.20 | % | | | 1.20 | % | | | 1.20 | % | | | 1.20 | % | | | 1.20 | % |
| Ratio of net investment income to average net assets (4)(5) | | | 0.34 | % | | | 0.69 | % | | | 0.31 | % | | | 0.22 | % | | | 0.89 | % |
| Portfolio Turnover Rate | | | 38 | % | | | 50 | % | | | 50 | % | | | 35 | % | | | 90 | % |
| (1) | Per share amounts calculated using the average shares method. |
| (2) | Total return in the above table is historical in nature and represents the rate that the investor would have earned or lost on an investment in the Fund assuming reinvestment of dividends and capital gain distributions, if any and does not reflect the impact of sales charges. Had the advisor not waived or recaptured a portion of the Fund’s expenses in certain periods, total returns would have been lower/higher. |
| (3) | Represents the ratio of expenses to average net assets absent fee waivers and/or expense reimbursements/recapture by the advisor. |
| (4) | The ratios of expenses to average net assets and net investment income to average net assets do not reflect the expenses of the underlying investment companies in which the Fund invests. |
| (5) | Recognition of net investment income is affected by the timing and declaration of dividends by the underlying investment companies in which the Fund invests. |
See accompanying notes to financial statements.
| Eventide Dividend Opportunities Fund |
| FINANCIAL HIGHLIGHTS |
| |
| Per Share Data and Ratios for a Share of Beneficial Interest Outstanding Throughout Each of the Years Presented |
| | | Class C | |
| | | Year Ended | | | Year Ended | | | Year Ended | | | Year Ended | | | Year Ended | |
| | | June 30, 2024 | | | June 30, 2023 | | | June 30, 2022 | | | June 30, 2021 | | | June 30, 2020 | |
| Net asset value, beginning of year | | $ | 14.54 | | | $ | 13.34 | | | $ | 15.77 | | | $ | 10.86 | | | $ | 10.35 | |
| Activity from investment operations: | | | | | | | | | | | | | | | | | | | | |
| Net investment income (loss) (1) | | | (0.06 | ) (6) | | | (0.01 | ) | | | (0.07 | ) | | | (0.08 | ) | | | 0.03 | |
| Net realized and unrealized gain (loss) on investments | | | 3.04 | | | | 1.31 | | | | (2.00 | ) | | | 5.06 | | | | 0.56 | |
| Total from investment operations | | | 2.98 | | | | 1.30 | | | | (2.07 | ) | | | 4.98 | | | | 0.59 | |
| Less distributions from: | | | | | | | | | | | | | | | | | | | | |
| Net investment income | | | — | | | | — | | | | (0.07 | ) | | | (0.07 | ) | | | (0.05 | ) |
| Net realized gains | | | — | | | | (0.09 | ) | | | (0.29 | ) | | | — | | | | — | |
| Return of capital | | | — | | | | (0.01 | ) | | | — | | | | — | | | | (0.03 | ) |
| Total distributions | | | — | | | | (0.10 | ) | | | (0.36 | ) | | | (0.07 | ) | | | (0.08 | ) |
| Net asset value, end of year | | $ | 17.52 | | | $ | 14.54 | | | $ | 13.34 | | | $ | 15.77 | | | $ | 10.86 | |
| Total return (2) | | | 20.50 | % | | | 9.78 | % | | | (13.57 | )% | | | 45.93 | % | | | 5.78 | % |
| Net assets, at end of year (000s) | | $ | 19,564 | | | $ | 14,889 | | | $ | 9,975 | | | $ | 4,508 | | | $ | 824 | |
| Ratio of gross expenses to average net assets before expense reimbursement/recapture (3)(4) | | | 1.96 | % | | | 2.03 | % | | | 1.94 | % | | | 1.99 | % | | | 2.30 | % |
| Ratio of net expenses to average net assets after expense reimbursement/recapture (4) | | | 1.95 | % | | | 1.95 | % | | | 1.95 | % | | | 1.95 | % | | | 1.95 | % |
| Ratio of net investment income (loss) to average net assets (4)(5) | | | (0.40 | )% | | | (0.05 | )% | | | (0.42 | )% | | | (0.53 | )% | | | 0.25 | % |
| Portfolio Turnover Rate | | | 38 | % | | | 50 | % | | | 50 | % | | | 35 | % | | | 90 | % |
| (1) | Per share amounts calculated using the average shares method. |
| (2) | Total return in the above table is historical in nature and represents the rate that the investor would have earned or lost on an investment in the Fund assuming reinvestment of dividends and capital gain distributions, if any. Had the advisor not waived or recaptured a portion of the Fund’s expenses in certain periods, total returns would have been lower/higher. |
| (3) | Represents the ratio of expenses to average net assets absent fee waivers and/or expense reimbursements/recapture by the advisor. |
| (4) | The ratios of expenses to average net assets and net investment income/(loss) to average net assets do not reflect the expenses of the underlying investment companies in which the Fund invests. |
| (5) | Recognition of net investment income (loss) is affected by the timing and declaration of dividends by the underlying investment companies in which the Fund invests. |
| (6) | As required by SEC standard per share data calculation methodology, this represents a balancing figure derived from the other amounts in the financial highlights tables that captures all other changes affecting net asset value per share. This per share loss amount does not correlate to the aggregate of the net investment income in the Statement of Operations for the year ended June 30, 2024, primarily due to the timing of sales and repurchases of the Fund’s shares in relation to underlying income. |
See accompanying notes to financial statements.
| Eventide Dividend Opportunities Fund |
| FINANCIAL HIGHLIGHTS |
| |
| Per Share Data and Ratios for a Share of Beneficial Interest Outstanding Throughout Each of the Years Presented |
| | | Class I | |
| | | Year Ended | | | Year Ended | | | Year Ended | | | Year Ended | | | Year Ended | |
| | | June 30, 2024 | | | June 30, 2023 | | | June 30, 2022 | | | June 30, 2021 | | | June 30, 2020 | |
| Net asset value, beginning of year | | $ | 14.66 | | | $ | 13.44 | | | $ | 15.87 | | | $ | 10.88 | | | $ | 10.37 | |
| Activity from investment operations: | | | | | | | | | | | | | | | | | | | | |
| Net investment income (1) | | | 0.09 | | | | 0.13 | | | | 0.09 | | | | 0.07 | | | | 0.12 | |
| Net realized and unrealized gain (loss) on investments | | | 3.08 | | | | 1.32 | | | | (2.02 | ) | | | 5.07 | | | | 0.57 | |
| Total from investment operations | | | 3.17 | | | | 1.45 | | | | (1.93 | ) | | | 5.14 | | | | 0.69 | |
| Less distributions from: | | | | | | | | | | | | | | | | | | | | |
| Net investment income | | | (0.09 | ) | | | (0.11 | ) | | | (0.21 | ) | | | (0.15 | ) | | | (0.10 | ) |
| Net realized gains | | | — | | | | (0.09 | ) | | | (0.29 | ) | | | — | | | | — | |
| Return of capital | | | — | | | | (0.03 | ) | | | — | | | | — | | | | (0.08 | ) |
| Total distributions | | | (0.09 | ) | | | (0.23 | ) | | | (0.50 | ) | | | (0.15 | ) | | | (0.18 | ) |
| Net asset value, end of year | | $ | 17.74 | | | $ | 14.66 | | | $ | 13.44 | | | $ | 15.87 | | | $ | 10.88 | |
| Total return (2) | | | 21.70 | % | | | 10.87 | % | | | (12.72 | )% | | | 47.49 | % | | | 6.79 | % |
| Net assets, at end of year (000s) | | $ | 705,913 | | | $ | 430,286 | | | $ | 305,801 | | | $ | 237,256 | | | $ | 45,034 | |
| Ratio of gross expenses to average net assets before expense reimbursement/recapture (3)(4) | | | 0.96 | % | | | 1.03 | % | | | 0.94 | % | | | 0.99 | % | | | 1.30 | % |
| Ratio of net expenses to average net assets after expense reimbursement/recapture (4) | | | 0.95 | % | | | 0.95 | % | | | 0.95 | % | | | 0.95 | % | | | 0.95 | % |
| Ratio of net investment income to average net assets (4)(5) | | | 0.61 | % | | | 0.96 | % | | | 0.55 | % | | | 0.48 | % | | | 1.16 | % |
| Portfolio Turnover Rate | | | 38 | % | | | 50 | % | | | 50 | % | | | 35 | % | | | 90 | % |
| (1) | Per share amounts calculated using the average shares method. |
| (2) | Total return in the above table is historical in nature and represents the rate that the investor would have earned or lost on an investment in the Fund assuming reinvestment of dividends and capital gain distributions, if any. Had the advisor not waived or recaptured a portion of the Fund’s expenses in certain periods, total returns would have been lower/higher. |
| (3) | Represents the ratio of expenses to average net assets absent fee waivers and/or expense reimbursements/recapture by the advisor. |
| (4) | The ratios of expenses to average net assets and net investment income to average net assets do not reflect the expenses of the underlying investment companies in which the Fund invests. |
| (5) | Recognition of net investment income is affected by the timing and declaration of dividends by the underlying investment companies in which the Fund invests. |
See accompanying notes to financial statements.
| Eventide Exponential Technologies Fund |
| FINANCIAL HIGHLIGHTS |
| |
| Per Share Data and Ratios for a Share of Beneficial Interest Outstanding Throughout Each of the Period or Years Presented |
| | | Class N | |
| | | Year Ended | | | Year Ended | | | Year Ended | | | Year Ended | |
| | | June 30, 2024 | | | June 30, 2023 | | | June 30, 2022 | | | June 30, 2021 * | |
| Net asset value, beginning of period/year | | $ | 12.00 | | | $ | 10.92 | | | $ | 19.08 | | | $ | 10.00 | |
| Activity from investment operations: | | | | | | | | | | | | | | | | |
| Net investment loss (1) | | | (0.17 | ) | | | (0.13 | ) | | | (0.25 | ) | | | (0.25 | ) |
| Net realized and unrealized gain (loss) on investments | | | 0.13 | | | | 1.20 | | | | (7.69 | ) | | | 9.33 | |
| Total from investment operations | | | (0.04 | ) | | | 1.07 | | | | (7.94 | ) | | | 9.08 | |
| Less distributions from: | | | | | | | | | | | | | | | | |
| Net realized gains | | | — | | | | — | | | | (0.23 | ) | | | (0.02 | ) |
| Total distributions | | | — | | | | — | | | | (0.23 | ) | | | (0.02 | ) |
| Paid-in-capital from redemption fees (1) | | | — | | | | 0.01 | | | | 0.01 | | | | 0.02 | |
| Net asset value, end of period/year | | $ | 11.96 | | | $ | 12.00 | | | $ | 10.92 | | | $ | 19.08 | |
| Total return (2) | | | (0.33 | )% | | | 9.89 | % | | | (42.00 | )% | | | 91.00 | % |
| Net assets, at end of period/year (000s) | | $ | 19,201 | | | $ | 22,186 | | | $ | 12,479 | | | $ | 15,730 | |
| Ratio of gross expenses to average net assets before expense reimbursement (3)(4) | | | 1.69 | % | | | 1.70 | % | | | 1.63 | % | | | 1.73 | % |
| Ratio of net expenses to average net assets after expense reimbursement (4) | | | 1.63 | % | | | 1.63 | % | | | 1.63 | % | | | 1.63 | % |
| Ratio of net investment loss to average net assets (4)(5) | | | (1.36 | )% | | | (1.23 | )% | | | (1.54 | )% | | | (1.50 | )% |
| Portfolio Turnover Rate | | | 70 | % | | | 80 | % | | | 69 | % | | | 60 | % |
| * | Eventide Exponential Technologies Fund commenced operations on June 30, 2020. |
| (1) | Per share amounts calculated using the average shares method. |
| (2) | Total return in the above table is historical in nature and represents the rate that the investor would have earned or lost on an investment in the Fund assuming reinvestment of dividends and capital gain distributions, if any. Had the advisor not waived a portion of the Fund’s expenses in certain periods, total returns would have been lower. |
| (3) | Represents the ratio of expenses to average net assets absent fee waivers and/or expense reimbursements by the advisor. |
| (4) | The ratios of expenses to average net assets and net investment loss to average net assets do not reflect the expenses of the underlying investment companies in which the Fund invests. |
| (5) | Recognition of net investment loss is affected by the timing and declaration of dividends by the underlying investment companies in which the Fund invests. |
See accompanying notes to financial statements.
| Eventide Exponential Technologies Fund |
| FINANCIAL HIGHLIGHTS |
| |
| Per Share Data and Ratios for a Share of Beneficial Interest Outstanding Throughout Each of the Period or Years Presented |
| | | Class A | |
| | | Year Ended | | | Year Ended | | | Year Ended | | | Year Ended | |
| | | June 30, 2024 | | | June 30, 2023 | | | June 30, 2022 | | | June 30, 2021 * | |
| Net asset value, beginning of period/year | | $ | 12.00 | | | $ | 10.93 | | | $ | 19.08 | | | $ | 10.00 | |
| Activity from investment operations: | | | | | | | | | | | | | | | | |
| Net investment loss (1) | | | (0.17 | ) | | | (0.14 | ) | | | (0.25 | ) | | | (0.26 | ) |
| Net realized and unrealized gain (loss) on investments | | | 0.13 | | | | 1.20 | | | | (7.68 | ) | | | 9.34 | |
| Total from investment operations | | | (0.04 | ) | | | 1.06 | | | | (7.93 | ) | | | 9.08 | |
| Less distributions from: | | | | | | | | | | | | | | | | |
| Net realized gains | | | — | | | | — | | | | (0.23 | ) | | | (0.02 | ) |
| Total distributions | | | — | | | | — | | | | (0.23 | ) | | | (0.02 | ) |
| Paid-in-capital from redemption fees (1) | | | — | | | | 0.01 | | | | 0.01 | | | | 0.02 | |
| Net asset value, end of period/year | | $ | 11.96 | | | $ | 12.00 | | | $ | 10.93 | | | $ | 19.08 | |
| Total return (2) | | | (0.33 | )% | | | 9.79 | % | | | (41.95 | )% | | | 91.00 | % |
| Net assets, at end of period/year (000s) | | $ | 8,421 | | | $ | 8,257 | | | $ | 7,377 | | | $ | 7,662 | |
| Ratio of gross expenses to average net assets before expense reimbursement (3)(4) | | | 1.74 | % | | | 1.75 | % | | | 1.68 | % | | | 1.78 | % |
| Ratio of net expenses to average net assets after expense reimbursement (4) | | | 1.68 | % | | | 1.68 | % | | | 1.68 | % | | | 1.68 | % |
| Ratio of net investment loss to average net assets (4)(5) | | | (1.41 | )% | | | (1.28 | )% | | | (1.58 | )% | | | (1.55 | )% |
| Portfolio Turnover Rate | | | 70 | % | | | 80 | % | | | 69 | % | | | 60 | % |
| * | Eventide Exponential Technologies Fund commenced operations on June 30, 2020. |
| (1) | Per share amounts calculated using the average shares method. |
| (2) | Total return in the above table is historical in nature and represents the rate that the investor would have earned or lost on an investment in the Fund assuming reinvestment of dividends and capital gain distributions, if any and does not reflect the impact of sales charges. Had the advisor not waived a portion of the Fund’s expenses in certain periods, total returns would have been lower. |
| (3) | Represents the ratio of expenses to average net assets absent fee waivers and/or expense reimbursements by the advisor. |
| (4) | The ratios of expenses to average net assets and net investment loss to average net assets do not reflect the expenses of the underlying investment companies in which the Fund invests. |
| (5) | Recognition of net investment loss is affected by the timing and declaration of dividends by the underlying investment companies in which the Fund invests. |
See accompanying notes to financial statements.
| Eventide Exponential Technologies Fund |
| FINANCIAL HIGHLIGHTS |
| |
| Per Share Data and Ratios for a Share of Beneficial Interest Outstanding Throughout Each of the Period or Years Presented |
| | | Class C | |
| | | Year Ended | | | Year Ended | | | Year Ended | | | Year Ended | |
| | | June 30, 2024 | | | June 30, 2023 | | | June 30, 2022 | | | June 30, 2021 * | |
| Net asset value, beginning of period/year | | $ | 11.74 | | | $ | 10.77 | | | $ | 18.96 | | | $ | 10.00 | |
| Activity from investment operations: | | | | | | | | | | | | | | | | |
| Net investment loss (1) | | | (0.25 | ) | | | (0.21 | ) | | | (0.37 | ) | | | (0.38 | ) |
| Net realized and unrealized gain (loss) on investments | | | 0.12 | | | | 1.17 | | | | (7.60 | ) | | | 9.35 | |
| Total from investment operations | | | (0.13 | ) | | | 0.96 | | | | (7.97 | ) | | | 8.97 | |
| Less distributions from: | | | | | | | | | | | | | | | | |
| Net realized gains | | | — | | | | — | | | | (0.23 | ) | | | (0.02 | ) |
| Total distributions | | | — | | | | — | | | | (0.23 | ) | | | (0.02 | ) |
| Paid-in-capital from redemption fees (1) | | | — | | | | 0.01 | | | | 0.01 | | | | 0.01 | |
| Net asset value, end of period/year | | $ | 11.61 | | | $ | 11.74 | | | $ | 10.77 | | | $ | 18.96 | |
| Total return (2) | | | (1.11 | )% | | | 9.01 | % | | | (42.43 | )% | | | 89.80 | % |
| Net assets, at end of period/year (000s) | | $ | 2,550 | | | $ | 2,635 | | | $ | 2,422 | | | $ | 2,065 | |
| Ratio of gross expenses to average net assets before expense reimbursement (3)(4) | | | 2.49 | % | | | 2.50 | % | | | 2.43 | % | | | 2.53 | % |
| Ratio of net expenses to average net assets after expense reimbursement (4) | | | 2.43 | % | | | 2.43 | % | | | 2.43 | % | | | 2.43 | % |
| Ratio of net investment loss to average net assets (4)(5) | | | (2.16 | )% | | | (2.03 | )% | | | (2.33 | )% | | | (2.30 | )% |
| Portfolio Turnover Rate | | | 70 | % | | | 80 | % | | | 69 | % | | | 60 | % |
| * | Eventide Exponential Technologies Fund commenced operations on June 30, 2020. |
| (1) | Per share amounts calculated using the average shares method. |
| (2) | Total return in the above table is historical in nature and represents the rate that the investor would have earned or lost on an investment in the Fund assuming reinvestment of dividends and capital gain distributions, if any. Had the advisor not waived a portion of the Fund’s expenses in certain periods, total returns would have been lower. |
| (3) | Represents the ratio of expenses to average net assets absent fee waivers and/or expense reimbursements by the advisor. |
| (4) | The ratios of expenses to average net assets and net investment loss to average net assets do not reflect the expenses of the underlying investment companies in which the Fund invests. |
| (5) | Recognition of net investment loss is affected by the timing and declaration of dividends by the underlying investment companies in which the Fund invests. |
See accompanying notes to financial statements.
| Eventide Exponential Technologies Fund |
| FINANCIAL HIGHLIGHTS |
| |
| Per Share Data and Ratios for a Share of Beneficial Interest Outstanding Throughout Each of the Period or Years Presented |
| | | Class I | |
| | | Year Ended | | | Year Ended | | | Year Ended | | | Year Ended | |
| | | June 30, 2024 | | | June 30, 2023 | | | June 30, 2022 | | | June 30, 2021 * | |
| Net asset value, beginning of period/year | | $ | 12.08 | | | $ | 10.97 | | | $ | 19.12 | | | $ | 10.00 | |
| Activity from investment operations: | | | | | | | | | | | | | | | | |
| Net investment loss (1) | | | (0.14 | ) | | | (0.11 | ) | | | (0.22 | ) | | | (0.22 | ) |
| Net realized and unrealized gain (loss) on investments | | | 0.13 | | | | 1.21 | | | | (7.71 | ) | | | 9.34 | |
| Total from investment operations | | | (0.01 | ) | | | 1.10 | | | | (7.93 | ) | | | 9.12 | |
| Less distributions from: | | | | | | | | | | | | | | | | |
| Net realized gains | | | — | | | | — | | | | (0.23 | ) | | | (0.02 | ) |
| Total distributions | | | — | | | | — | | | | (0.23 | ) | | | (0.02 | ) |
| Paid-in-capital from redemption fees (1) | | | — | | | | 0.01 | | | | 0.01 | | | | 0.02 | |
| Net asset value, end of period/year | | $ | 12.07 | | | $ | 12.08 | | | $ | 10.97 | | | $ | 19.12 | |
| Total return (2) | | | (0.08 | )% | | | 10.12 | % | | | (41.86 | )% | | | 91.40 | % |
| Net assets, at end of period/year (000s) | | $ | 85,315 | | | $ | 82,735 | | | $ | 72,567 | | | $ | 96,821 | |
| Ratio of gross expenses to average net assets before expense reimbursement (3)(4) | | | 1.49 | % | | | 1.50 | % | | | 1.43 | % | | | 1.53 | % |
| Ratio of net expenses to average net assets after expense reimbursement (4) | | | 1.43 | % | | | 1.43 | % | | | 1.43 | % | | | 1.43 | % |
| Ratio of net investment loss to average net assets (4)(5) | | | (1.16 | )% | | | (1.02 | )% | | | (1.33 | )% | | | (1.30 | )% |
| Portfolio Turnover Rate | | | 70 | % | | | 80 | % | | | 69 | % | | | 60 | % |
| * | Eventide Exponential Technologies Fund commenced operations on June 30, 2020. |
| (1) | Per share amounts calculated using the average shares method. |
| (2) | Total return in the above table is historical in nature and represents the rate that the investor would have earned or lost on an investment in the Fund assuming reinvestment of dividends and capital gain distributions, if any. Had the advisor not waived a portion of the Fund’s expenses in certain periods, total returns would have been lower. |
| (3) | Represents the ratio of expenses to average net assets absent fee waivers and/or expense reimbursements by the advisor. |
| (4) | The ratios of expenses to average net assets and net investment loss to average net assets do not reflect the expenses of the underlying investment companies in which the Fund invests. |
| (5) | Recognition of net investment loss is affected by the timing and declaration of dividends by the underlying investment companies in which the Fund invests. |
See accompanying notes to financial statements.
| Eventide Gilead Fund |
| FINANCIAL HIGHLIGHTS |
| |
| Per Share Data and Ratios for a Share of Beneficial Interest Outstanding Throughout Each of the Years Presented |
| | | Class N | |
| | | Year Ended | | | Year Ended | | | Year Ended | | | Year Ended | | | Year Ended | |
| | | June 30, 2024 | | | June 30, 2023 | | | June 30, 2022 | | | June 30, 2021 | | | June 30, 2020 | |
| Net asset value, beginning of year | | $ | 48.25 | | | $ | 44.10 | | | $ | 69.91 | | | $ | 47.16 | | | $ | 41.75 | |
| Activity from investment operations: | | | | | | | | | | | | | | | | | | | | |
| Net investment loss (1) | | | (0.38 | ) | | | (0.27 | ) | | | (0.53 | ) | | | (0.51 | ) | | | (0.25 | ) |
| Net realized and unrealized gain (loss) on investments | | | 0.28 | | | | 6.70 | | | | (21.01 | ) | | | 23.77 | | | | 6.98 | |
| Total from investment operations | | | (0.10 | ) | | | 6.43 | | | | (21.54 | ) | | | 23.26 | | | | 6.73 | |
| Less distributions from: | | | | | | | | | | | | | | | | | | | | |
| Net realized gains | | | — | | | | (2.28 | ) | | | (4.27 | ) | | | (0.51 | ) | | | (1.32 | ) |
| Total distributions | | | — | | | | (2.28 | ) | | | (4.27 | ) | | | (0.51 | ) | | | (1.32 | ) |
| Net asset value, end of year | | $ | 48.15 | | | $ | 48.25 | | | $ | 44.10 | | | $ | 69.91 | | | $ | 47.16 | |
| Total return (2) | | | (0.21 | )% (5) | | | 15.29 | % (5) | | | (32.65 | )% | | | 49.43 | % | | | 16.66 | % |
| Net assets, at end of year (000s) | | $ | 427,768 | | | $ | 526,825 | | | $ | 529,869 | | | $ | 827,811 | | | $ | 549,944 | |
| Ratio of net expenses to average net assets (3) | | | 1.36 | % | | | 1.38 | % | | | 1.31 | % | | | 1.31 | % | | | 1.38 | % |
| Ratio of net investment loss to average net assets (3)(4) | | | (0.79 | )% | | | (0.59 | )% | | | (0.86 | )% | | | (0.85 | )% | | | (0.63 | )% |
| Portfolio Turnover Rate | | | 36 | % | | | 34 | % | | | 27 | % | | | 19 | % | | | 35 | % |
| (1) | Per share amounts calculated using the average shares method. |
| (2) | Total return in the above table is historical in nature and represents the rate that the investor would have earned or lost on an investment in the Fund assuming reinvestment of dividends and capital gain distributions, if any. |
| (3) | The ratios of expenses to average net assets and net investment loss to average net assets do not reflect the expenses of the underlying investment companies in which the Fund invests. |
| (4) | Recognition of net investment loss is affected by the timing and declaration of dividends by the underlying investment companies in which the Fund invests. |
| (5) | Includes adjustments in accordance with accounting principles generally accepted in the United States of America and, consequently, the net asset values for financial reporting purposes and the returns based upon those net asset values may differ from the net asset values and returns for shareholder transactions. |
See accompanying notes to financial statements.
| Eventide Gilead Fund |
| FINANCIAL HIGHLIGHTS |
| |
| Per Share Data and Ratios for a Share of Beneficial Interest Outstanding Throughout Each of the Years Presented |
| | | Class A | |
| | | Year Ended | | | Year Ended | | | Year Ended | | | Year Ended | | | Year Ended | |
| | | June 30, 2024 | | | June 30, 2023 | | | June 30, 2022 | | | June 30, 2021 | | | June 30, 2020 | |
| Net asset value, beginning of year | | $ | 47.94 | | | $ | 43.83 | | | $ | 69.53 | | | $ | 46.92 | | | $ | 41.57 | |
| Activity from investment operations: | | | | | | | | | | | | | | | | | | | | |
| Net investment loss (1) | | | (0.41 | ) | | | (0.29 | ) | | | (0.55 | ) | | | (0.54 | ) | | | (0.27 | ) |
| Net realized and unrealized gain (loss) on investments | | | 0.27 | | | | 6.68 | | | | (20.88 | ) | | | 23.66 | | | | 6.94 | |
| Total from investment operations | | | (0.14 | ) | | | 6.39 | | | | (21.43 | ) | | | 23.12 | | | | 6.67 | |
| Less distributions from: | | | | | | | | | | | | | | | | | | | | |
| Net realized gains | | | — | | | | (2.28 | ) | | | (4.27 | ) | | | (0.51 | ) | | | (1.32 | ) |
| Total distributions | | | — | | | | (2.28 | ) | | | (4.27 | ) | | | (0.51 | ) | | | (1.32 | ) |
| Net asset value, end of year | | $ | 47.80 | | | $ | 47.94 | | | $ | 43.83 | | | $ | 69.53 | | | $ | 46.92 | |
| Total return (2) | | | (0.29 | )% (5) | | | 15.30 | % (5) | | | (32.67 | )% | | | 49.39 | % | | | 16.58 | % |
| Net assets, at end of year (000s) | | $ | 320,983 | | | $ | 351,924 | | | $ | 302,171 | | | $ | 458,726 | | | $ | 301,013 | |
| Ratio of net expenses to average net assets (3) | | | 1.41 | % | | | 1.43 | % | | | 1.36 | % | | | 1.36 | % | | | 1.43 | % |
| Ratio of net investment loss to average net assets (3)(4) | | | (0.85 | )% | | | (0.65 | )% | | | (0.91 | )% | | | (0.91 | )% | | | (0.69 | )% |
| Portfolio Turnover Rate | | | 36 | % | | | 34 | % | | | 27 | % | | | 19 | % | | | 35 | % |
| (1) | Per share amounts calculated using the average shares method. |
| (2) | Total return in the above table is historical in nature and represents the rate that the investor would have earned or lost on an investment in the Fund assuming reinvestment of dividends and capital gain distributions, if any and does not reflect the impact of sales charges. |
| (3) | The ratios of expenses to average net assets and net investment loss to average net assets do not reflect the expenses of the underlying investment companies in which the Fund invests. |
| (4) | Recognition of net investment loss is affected by the timing and declaration of dividends by the underlying investment companies in which the Fund invests. |
| (5) | Includes adjustments in accordance with accounting principles generally accepted in the United States of America and, consequently, the net asset values for financial reporting purposes and the returns based upon those net asset values may differ from the net asset values and returns for shareholder transactions. |
See accompanying notes to financial statements.
| Eventide Gilead Fund |
| FINANCIAL HIGHLIGHTS |
| |
| Per Share Data and Ratios for a Share of Beneficial Interest Outstanding Throughout Each of the Years Presented |
| | | Class C | |
| | | Year Ended | | | Year Ended | | | Year Ended | | | Year Ended | | | Year Ended | |
| | | June 30, 2024 | | | June 30, 2023 | | | June 30, 2022 | | | June 30, 2021 | | | June 30, 2020 | |
| Net asset value, beginning of year | | $ | 42.13 | | | $ | 39.09 | | | $ | 62.97 | | | $ | 42.86 | | | $ | 38.37 | |
| Activity from investment operations: | | | | | | | | | | | | | | | | | | | | |
| Net investment loss (1) | | | (0.67 | ) | | | (0.55 | ) | | | (0.91 | ) | | | (0.89 | ) | | | (0.53 | ) |
| Net realized and unrealized gain (loss) on investments | | | 0.25 | | | | 5.87 | | | | (18.70 | ) | | | 21.51 | | | | 6.34 | |
| Total from investment operations | | | (0.42 | ) | | | 5.32 | | | | (19.61 | ) | | | 20.62 | | | | 5.81 | |
| Less distributions from: | | | | | | | | | | | | | | | | | | | | |
| Net realized gains | | | — | | | | (2.28 | ) | | | (4.27 | ) | | | (0.51 | ) | | | (1.32 | ) |
| Total distributions | | | — | | | | (2.28 | ) | | | (4.27 | ) | | | (0.51 | ) | | | (1.32 | ) |
| Net asset value, end of year | | $ | 41.71 | | | $ | 42.13 | | | $ | 39.09 | | | $ | 62.97 | | | $ | 42.86 | |
| Total return (2) | | | (1.00 | )% (5) | | | 14.38 | % (5) | | | (33.21 | )% | | | 48.23 | % | | | 15.71 | % |
| Net assets, at end of year (000s) | | $ | 166,155 | | | $ | 218,201 | | | $ | 235,967 | | | $ | 404,272 | | | $ | 289,242 | |
| Ratio of net expenses to average net assets (3) | | | 2.16 | % | | | 2.18 | % | | | 2.11 | % | | | 2.11 | % | | | 2.18 | % |
| Ratio of net investment loss to average net assets (3)(4) | | | (1.59 | )% | | | (1.40 | )% | | | (1.67 | )% | | | (1.65 | )% | | | (1.43 | )% |
| Portfolio Turnover Rate | | | 36 | % | | | 34 | % | | | 27 | % | | | 19 | % | | | 35 | % |
| (1) | Per share amounts calculated using the average shares method. |
| (2) | Total return in the above table is historical in nature and represents the rate that the investor would have earned or lost on an investment in the Fund assuming reinvestment of dividends and capital gain distributions, if any. |
| (3) | The ratios of expenses to average net assets and net investment loss to average net assets do not reflect the expenses of the underlying investment companies in which the Fund invests. |
| (4) | Recognition of net investment loss is affected by the timing and declaration of dividends by the underlying investment companies in which the Fund invests. |
| (5) | Includes adjustments in accordance with accounting principles generally accepted in the United States of America and, consequently, the net asset values for financial reporting purposes and the returns based upon those net asset values may differ from the net asset values and returns for shareholder transactions. |
See accompanying notes to financial statements.
| Eventide Gilead Fund |
| FINANCIAL HIGHLIGHTS |
| |
| Per Share Data and Ratios for a Share of Beneficial Interest Outstanding Throughout Each of the Years Presented |
| | | Class I | |
| | | Year Ended | | | Year Ended | | | Year Ended | | | Year Ended | | | Year Ended | |
| | | June 30, 2024 | | | June 30, 2023 | | | June 30, 2022 | | | June 30, 2021 | | | June 30, 2020 | |
| Net asset value, beginning of year | | $ | 49.82 | | | $ | 45.36 | | | $ | 71.65 | | | $ | 48.22 | | | $ | 42.59 | |
| Activity from investment operations: | | | | | | | | | | | | | | | | | | | | |
| Net investment loss (1) | | | (0.30 | ) | | | (0.19 | ) | | | (0.41 | ) | | | (0.40 | ) | | | (0.18 | ) |
| Net realized and unrealized gain (loss) on investments | | | 0.28 | | | | 6.93 | | | | (21.61 | ) | | | 24.34 | | | | 7.13 | |
| Total from investment operations | | | (0.02 | ) | | | 6.74 | | | | (22.02 | ) | | | 23.94 | | | | 6.95 | |
| Less distributions from: | | | | | | | | | | | | | | | | | | | | |
| Net realized gains | | | — | | | | (2.28 | ) | | | (4.27 | ) | | | (0.51 | ) | | | (1.32 | ) |
| Total distributions | | | — | | | | (2.28 | ) | | | (4.27 | ) | | | (0.51 | ) | | | (1.32 | ) |
| Net asset value, end of year | | $ | 49.80 | | | $ | 49.82 | | | $ | 45.36 | | | $ | 71.65 | | | $ | 48.22 | |
| Total return (2) | | | (0.04 | )% (5) | | | 15.56 | % (5) | | | (32.52 | )% | | | 49.76 | % | | | 16.85 | % |
| Net assets, at end of year (000s) | | $ | 2,434,432 | | | $ | 2,663,688 | | | $ | 2,408,991 | | | $ | 3,522,353 | | | $ | 1,997,163 | |
| Ratio of net expenses to average net assets (3) | | | 1.16 | % | | | 1.18 | % | | | 1.11 | % | | | 1.11 | % | | | 1.18 | % |
| Ratio of net investment loss to average net assets (3)(4) | | | (0.60 | )% | | | (0.40 | )% | | | (0.66 | )% | | | (0.65 | )% | | | (0.43 | )% |
| Portfolio Turnover Rate | | | 36 | % | | | 34 | % | | | 27 | % | | | 19 | % | | | 35 | % |
| (1) | Per share amounts calculated using the average shares method. |
| (2) | Total return in the above table is historical in nature and represents the rate that the investor would have earned or lost on an investment in the Fund assuming reinvestment of dividends and capital gain distributions, if any. |
| (3) | The ratios of expenses to average net assets and net investment loss to average net assets do not reflect the expenses of the underlying investment companies in which the Fund invests. |
| (4) | Recognition of net investment loss is affected by the timing and declaration of dividends by the underlying investment companies in which the Fund invests. |
| (5) | Includes adjustments in accordance with accounting principles generally accepted in the United States of America and, consequently, the net asset values for financial reporting purposes and the returns based upon those net asset values may differ from the net asset values and returns for shareholder transactions. |
See accompanying notes to financial statements.
| Eventide Healthcare & Life Sciences Fund |
| FINANCIAL HIGHLIGHTS |
| |
| Per Share Data and Ratios for a Share of Beneficial Interest Outstanding Throughout Each of the Years Presented |
| | | Class N | |
| | | Year Ended | | | Year Ended | | | Year Ended | | | Year Ended | | | Year Ended | |
| | | June 30, 2024 | | | June 30, 2023 | | | June 30, 2022 | | | June 30, 2021 | | | June 30, 2020 | |
| Net asset value, beginning of year | | $ | 36.63 | | | $ | 26.52 | | | $ | 46.19 | | | $ | 43.33 | | | $ | 35.51 | |
| Activity from investment operations: | | | | | | | | | | | | | | | | | | | | |
| Net investment loss (1) | | | (0.42 | ) | | | (0.37 | ) | | | (0.57 | ) | | | (0.72 | ) | | | (0.52 | ) |
| Net realized and unrealized gain (loss) on investments | | | (2.91 | ) | | | 10.48 | | | | (14.74 | ) | | | 5.52 | | | | 9.19 | |
| Total from investment operations | | | (3.33 | ) | | | 10.11 | | | | (15.31 | ) | | | 4.80 | | | | 8.67 | |
| Less distributions from: | | | | | | | | | | | | | | | | | | | | |
| Net investment income | | | — | | | | — | | | | (0.63 | ) | | | — | | | | — | |
| Net realized gains | | | — | | | | — | | | | (3.73 | ) | | | (1.94 | ) | | | (0.87 | ) |
| Total distributions | | | — | | | | — | | | | (4.36 | ) | | | (1.94 | ) | | | (0.87 | ) |
| Paid-in-capital from redemption fees (1) | | | — | | | | — | | | | — | | | | 0.00 | (5) | | | 0.02 | |
| Net asset value, end of year | | $ | 33.30 | | | $ | 36.63 | | | $ | 26.52 | | | $ | 46.19 | | | $ | 43.33 | |
| Total return (2) | | | (9.09 | )% (6) | | | 38.12 | % (6) | | | (35.99 | )% (6) | | | 10.34 | % | | | 24.68 | % |
| Net assets, at end of year (000s) | | $ | 93,027 | | | $ | 133,006 | | | $ | 115,954 | | | $ | 227,441 | | | $ | 231,460 | |
| Ratio of net expenses to average net assets (3) | | | 1.52 | % | | | 1.50 | % | | | 1.50 | % | | | 1.48 | % | | | 1.50 | % |
| Ratio of net investment loss to average net assets (3)(4) | | | (1.24 | )% | | | (1.14 | )% | | | (1.49 | )% | | | (1.47 | )% | | | (1.44 | )% |
| Portfolio Turnover Rate | | | 71 | % | | | 79 | % | | | 59 | % | | | 62 | % | | | 33 | % |
| (1) | Per share amounts calculated using the average shares method. |
| (2) | Total return in the above table is historical in nature and represents the rate that the investor would have earned or lost on an investment in the Fund assuming reinvestment of dividends and capital gain distributions, if any. |
| (3) | The ratios of expenses to average net assets and net investment loss to average net assets do not reflect the expenses of the underlying investment companies in which the Fund invests. |
| (4) | Recognition of net investment loss is affected by the timing and declaration of dividends by the underlying investment companies in which the Fund invests. |
| (5) | Amount represents less than $0.01 per share. |
| (6) | Includes adjustments in accordance with accounting principles generally accepted in the United States of America and, consequently, the net asset values for financial reporting purposes and the returns based upon those net asset values may differ from the net asset values and returns for shareholder transactions. |
See accompanying notes to financial statements.
| Eventide Healthcare & Life Sciences Fund |
| FINANCIAL HIGHLIGHTS |
| |
| Per Share Data and Ratios for a Share of Beneficial Interest Outstanding Throughout Each of the Years Presented |
| | | Class A | |
| | | Year Ended | | | Year Ended | | | Year Ended | | | Year Ended | | | Year Ended | |
| | | June 30, 2024 | | | June 30, 2023 | | | June 30, 2022 | | | June 30, 2021 | | | June 30, 2020 | |
| Net asset value, beginning of year | | $ | 36.37 | | | $ | 26.34 | | | $ | 45.91 | | | $ | 43.10 | | | $ | 35.33 | |
| Activity from investment operations: | | | | | | | | | | | | | | | | | | | | |
| Net investment loss (1) | | | (0.44 | ) | | | (0.38 | ) | | | (0.58 | ) | | | (0.74 | ) | | | (0.53 | ) |
| Net realized and unrealized gain (loss) on investments | | | (2.89 | ) | | | 10.41 | | | | (14.64 | ) | | | 5.49 | | | | 9.15 | |
| Total from investment operations | | | (3.33 | ) | | | 10.03 | | | | (15.22 | ) | | | 4.75 | | | | 8.62 | |
| Less distributions from: | | | | | | | | | | | | | | | | | | | | |
| Net investment income | | | — | | | | — | | | | (0.62 | ) | | | — | | | | — | |
| Net realized gains | | | — | | | | — | | | | (3.73 | ) | | | (1.94 | ) | | | (0.87 | ) |
| Total distributions | | | — | | | | — | | | | (4.35 | ) | | | (1.94 | ) | | | (0.87 | ) |
| Paid-in-capital from redemption fees (1) | | | — | | | | — | | | | — | | | | 0.00 | (5) | | | 0.02 | |
| Net asset value, end of year | | $ | 33.04 | | | $ | 36.37 | | | $ | 26.34 | | | $ | 45.91 | | | $ | 43.10 | |
| Total return (2) | | | (9.16 | )% (6) | | | 38.08 | % (6) | | | (36.02 | )% (6) | | | 10.28 | % | | | 24.67 | % |
| Net assets, at end of year (000s) | | $ | 122,423 | | | $ | 151,885 | | | $ | 114,642 | | | $ | 191,709 | | | $ | 175,151 | |
| Ratio of net expenses to average net assets (3) | | | 1.57 | % | | | 1.55 | % | | | 1.55 | % | | | 1.53 | % | | | 1.55 | % |
| Ratio of net investment loss to average net assets (3)(4) | | | (1.29 | )% | | | (1.19 | )% | | | (1.54 | )% | | | (1.52 | )% | | | (1.49 | )% |
| Portfolio Turnover Rate | | | 71 | % | | | 79 | % | | | 59 | % | | | 62 | % | | | 33 | % |
| | | | | | | | | | | | | | | | | | | | | |
| (1) | Per share amounts calculated using the average shares method. |
| (2) | Total return in the above table is historical in nature and represents the rate that the investor would have earned or lost on an investment in the Fund assuming reinvestment of dividends and capital gain distributions, if any and does not reflect the impact of sales charges. |
| (3) | The ratios of expenses to average net assets and net investment loss to average net assets do not reflect the expenses of the underlying investment companies in which the Fund invests. |
| (4) | Recognition of net investment loss is affected by the timing and declaration of dividends by the underlying investment companies in which the Fund invests. |
| (5) | Amount represents less than $0.01 per share. |
| (6) | Includes adjustments in accordance with accounting principles generally accepted in the United States of America and, consequently, the net asset values for financial reporting purposes and the returns based upon those net asset values may differ from the net asset values and returns for shareholder transactions. |
See accompanying notes to financial statements.
| Eventide Healthcare & Life Sciences Fund |
| FINANCIAL HIGHLIGHTS |
| |
| Per Share Data and Ratios for a Share of Beneficial Interest Outstanding Throughout Each of the Years Presented |
| | | Class C | |
| | | Year Ended | | | Year Ended | | | Year Ended | | | Year Ended | | | Year Ended | |
| | | June 30, 2024 | | | June 30, 2023 | | | June 30, 2022 | | | June 30, 2021 | | | June 30, 2020 | |
| Net asset value, beginning of year | | $ | 33.39 | | | $ | 24.37 | | | $ | 42.78 | | | $ | 40.56 | | | $ | 33.54 | |
| Activity from investment operations: | | | | | | | | | | | | | | | | | | | | |
| Net investment loss (1) | | | (0.63 | ) | | | (0.57 | ) | | | (0.80 | ) | | | (1.04 | ) | | | (0.76 | ) |
| Net realized and unrealized gain (loss) on investments | | | (2.65 | ) | | | 9.59 | | | | (13.60 | ) | | | 5.20 | | | | 8.63 | |
| Total from investment operations | | | (3.28 | ) | | | 9.02 | | | | (14.40 | ) | | | 4.16 | | | | 7.87 | |
| Less distributions from: | | | | | | | | | | | | | | | | | | | | |
| Net investment income | | | — | | | | — | | | | (0.28 | ) | | | — | | | | — | |
| Net realized gains | | | — | | | | — | | | | (3.73 | ) | | | (1.94 | ) | | | (0.87 | ) |
| Total distributions | | | — | | | | — | | | | (4.01 | ) | | | (1.94 | ) | | | (0.87 | ) |
| Paid-in-capital from redemption fees (1) | | | — | | | | — | | | | — | | | | 0.00 | (5) | | | 0.02 | |
| Net asset value, end of year | | $ | 30.11 | | | $ | 33.39 | | | $ | 24.37 | | | $ | 42.78 | | | $ | 40.56 | |
| Total return (2) | | | (9.82 | )% (6) | | | 37.01 | % (6) | | | (36.51 | )% (6) | | | 9.45 | % | | | 23.73 | % |
| Net assets, at end of year (000s) | | $ | 55,661 | | | $ | 76,849 | | | $ | 66,540 | | | $ | 120,351 | | | $ | 104,202 | |
| Ratio of net expenses to average net assets (3 | | | 2.32 | % | | | 2.30 | % | | | 2.30 | % | | | 2.28 | % | | | 2.30 | % |
| Ratio of net investment loss to average net assets (3)(4) | | | (2.04 | )% | | | (1.94 | )% | | | (2.29 | )% | | | (2.27 | )% | | | (2.23 | )% |
| Portfolio Turnover Rate | | | 71 | % | | | 79 | % | | | 59 | % | | | 62 | % | | | 33 | % |
| | | | | | | | | | | | | | | | | | | | | |
| (1) | Per share amounts calculated using the average shares method. |
| (2) | Total return in the above table is historical in nature and represents the rate that the investor would have earned or lost on an investment in the Fund assuming reinvestment of dividends and capital gain distributions, if any. |
| (3) | The ratios of expenses to average net assets and net investment loss to average net assets do not reflect the expenses of the underlying investment companies in which the Fund invests. |
| (4) | Recognition of net investment loss is affected by the timing and declaration of dividends by the underlying investment companies in which the Fund invests. |
| (5) | Amount represents less than $0.01 per share. |
| (6) | Includes adjustments in accordance with accounting principles generally accepted in the United States of America and, consequently, the net asset values for financial reporting purposes and the returns based upon those net asset values may differ from the net asset values and returns for shareholder transactions. |
See accompanying notes to financial statements.
| Eventide Healthcare & Life Sciences Fund |
| FINANCIAL HIGHLIGHTS |
| |
| Per Share Data and Ratios for a Share of Beneficial Interest Outstanding Throughout Each of the Years Presented |
| | | Class I | |
| | | Year Ended | | | Year Ended | | | Year Ended | | | Year Ended | | | Year Ended | |
| | | June 30, 2024 | | | June 30, 2023 | | | June 30, 2022 | | | June 30, 2021 | | | June 30, 2020 | |
| Net asset value, beginning of year | | $ | 37.45 | | | $ | 27.05 | | | $ | 47.04 | | | $ | 44.02 | | | $ | 35.98 | |
| Activity from investment operations: | | | | | | | | | | | | | | | | | | | | |
| Net investment loss (1) | | | (0.37 | ) | | | (0.31 | ) | | | (0.49 | ) | | | (0.64 | ) | | | (0.46 | ) |
| Net realized and unrealized gain (loss) on investments | | | (2.99 | ) | | | 10.71 | | | | (15.03 | ) | | | 5.60 | | | | 9.35 | |
| Total from investment operations | | | (3.36 | ) | | | 10.40 | | | | (15.52 | ) | | | 4.96 | | | | 8.89 | |
| Less distributions from: | | | | | | | | | | | | | | | | | | | | |
| Net investment income | | | — | | | | — | | | | (0.74 | ) | | | — | | | | — | |
| Net realized gains | | | — | | | | — | | | | (3.73 | ) | | | (1.94 | ) | | | (0.87 | ) |
| Total distributions | | | — | | | | — | | | | (4.47 | ) | | | (1.94 | ) | | | (0.87 | ) |
| Paid-in-capital from redemption fees (1) | | | — | | | | — | | | | — | | | | 0.00 | (5) | | | 0.02 | |
| Net asset value, end of year | | $ | 34.09 | | | $ | 37.45 | | | $ | 27.05 | | | $ | 47.04 | | | $ | 44.02 | |
| Total return (2) | | | (8.97 | )% (6) | | | 38.45 | % (6) | | | (35.85 | )% (6) | | | 10.54 | % | | | 24.97 | % |
| Net assets, at end of year (000s) | | $ | 1,168,805 | | | $ | 1,441,422 | | | $ | 1,024,430 | | | $ | 1,573,091 | | | $ | 1,120,862 | |
| Ratio of net expenses to average net assets (3) | | | 1.32 | % | | | 1.30 | % | | | 1.30 | % | | | 1.28 | % | | | 1.30 | % |
| Ratio of net investment loss to average net assets (3)(4) | | | (1.04 | )% | | | (0.94 | )% | | | (1.29 | )% | | | (1.28 | )% | | | (1.24 | )% |
| Portfolio Turnover Rate | | | 71 | % | | | 79 | % | | | 59 | % | | | 62 | % | | | 33 | % |
| | | | | | | | | | | | | | | | | | | | | |
| (1) | Per share amounts calculated using the average shares method. |
| (2) | Total return in the above table is historical in nature and represents the rate that the investor would have earned or lost on an investment in the Fund assuming reinvestment of dividends and capital gain distributions, if any. |
| (3) | The ratios of expenses to average net assets and net investment loss to average net assets do not reflect the expenses of the underlying investment companies in which the Fund invests. |
| (4) | Recognition of net investment loss is affected by the timing and declaration of dividends by the underlying investment companies in which the Fund invests. |
| (5) | Amount represents less than $0.01 per share. |
| (6) | Includes adjustments in accordance with accounting principles generally accepted in the United States of America and, consequently, the net asset values for financial reporting purposes and the returns based upon those net asset values may differ from the net asset values and returns for shareholder transactions. |
See accompanying notes to financial statements.
| Eventide Large Cap Focus Fund |
| FINANCIAL HIGHLIGHTS |
| |
| Per Share Data and Ratios for a Share of Beneficial Interest Outstanding Throughout the Period or Year Presented |
| | | Class N | |
| | | Year Ended | | | Year Ended | |
| | | June 30, 2024 | | | June 30, 2023 * | |
| Net asset value, beginning of period/year | | $ | 11.44 | | | $ | 10.00 | |
| Activity from investment operations: | | | | | | | | |
| Net investment loss (1) | | | (0.00 | ) (6)(7) | | | (0.01 | ) |
| Net realized and unrealized gain on investments | | | 2.57 | | | | 1.45 | |
| Total from investment operations | | | 2.57 | | | | 1.44 | |
| Less distributions from: | | | | | | | | |
| Return of capital | | | — | | | | (0.00 | ) (6) |
| Total distributions | | | — | | | | (0.00 | ) (6) |
| Net asset value, end of period/year | | $ | 14.01 | | | $ | 11.44 | |
| Total return (2) | | | 22.47 | % | | | 14.43 | % |
| Net assets, at end of period/year (000s) | | $ | 13,097 | | | $ | 330 | |
| Ratio of gross expenses to average net assets before expense reimbursement (3)(4) | | | 1.38 | % | | | 2.84 | % (8) |
| Ratio of net expenses to average net assets after expense reimbursement (4) | | | 1.14 | % | | | 1.15 | % (8) |
| Ratio of net investment loss to average net assets (4)(5) | | | (0.02 | )% | | | (0.15 | )% |
| Portfolio Turnover Rate | | | 101 | % | | | 48 | % |
| | | | | | | | | |
| * | Eventide Large Cap Focus Fund Class N commenced operations on June 30, 2022. |
| (1) | Per share amounts calculated using the average shares method. |
| (2) | Total return in the above table is historical in nature and represents the rate that the investor would have earned or lost on an investment in the Fund assuming reinvestment of dividends and capital gain distributions, if any. Had the advisor not waived a portion of the Fund’s expenses in certain periods, total returns would have been lower. |
| (3) | Represents the ratio of expenses to average net assets absent fee waivers and/or expense reimbursements by the advisor. |
| (4) | The ratios of expenses to average net assets and net investment loss to average net assets do not reflect the expenses of the underlying investment companies in which the Fund invests. |
| (5) | Recognition of net investment loss is affected by the timing and declaration of dividends by the underlying investment companies in which the Fund invests. |
| (6) | Amount represents less than $0.01 per share. |
| (7) | As required by SEC standard per share data calculation methodology, this represents a balancing figure derived from the other amounts in the financial highlights tables that captures all other changes affecting net asset value per share. This per share loss amount does not correlate to the aggregate of the net investment income in the Statement of Operations for the year ended June 30, 2024, primarily due to the timing of sales and repurchases of the Fund’s shares in relation to underlying income. |
| (8) | The ratio includes 0.01% for the year ended June 30, 2023 attributed to line of credit fees. |
See accompanying notes to financial statements.
| Eventide Large Cap Focus Fund |
| FINANCIAL HIGHLIGHTS |
| |
| Per Share Data and Ratios for a Share of Beneficial Interest Outstanding Throughout the Period or Year Presented |
| | | Class A | |
| | | Year Ended | | | Year Ended | |
| | | June 30, 2024 | | | June 30, 2023 * | |
| Net asset value, beginning of period/year | | $ | 11.42 | | | $ | 10.00 | |
| Activity from investment operations: | | | | | | | | |
| Net investment loss (1) | | | (0.00 | ) (6)(7) | | | (0.00 | ) (6) |
| Net realized and unrealized gain on investments | | | 2.57 | | | | 1.43 | |
| Total from investment operations | | | 2.57 | | | | 1.43 | |
| Less distributions from: | | | | | | | | |
| Return of capital | | | — | | | | (0.01 | ) |
| Total distributions | | | — | | | | (0.01 | ) |
| Net asset value, end of period/year | | $ | 13.99 | | | $ | 11.42 | |
| Total return (2) | | | 22.50 | % (8) | | | 14.26 | % |
| Net assets, at end of period/year (000s) | | $ | 1,836 | | | $ | 190 | |
| Ratio of gross expenses to average net assets before expense reimbursement (3)(4) | | | 1.43 | % | | | 2.89 | % (9) |
| Ratio of net expenses to average net assets after expense reimbursement (4) | | | 1.19 | % | | | 1.20 | % (9) |
| Ratio of net investment loss to average net assets (4)(5) | | | (0.03 | )% | | | (0.25 | )% |
| Portfolio Turnover Rate | | | 101 | % | | | 48 | % |
| | | | | | | | | |
| * | Eventide Large Cap Focus Fund Class N commenced operations on June 30, 2022. |
| (1) | Per share amounts calculated using the average shares method. |
| (2) | Total return in the above table is historical in nature and represents the rate that the investor would have earned or lost on an investment in the Fund assuming reinvestment of dividends and capital gain distributions, if any and does not reflect the impact of sales charges. Had the advisor not waived a portion of the Fund’s expenses in certain periods, total returns would have been lower. |
| (3) | Represents the ratio of expenses to average net assets absent fee waivers and/or expense reimbursements by the advisor. |
| (4) | The ratios of expenses to average net assets and net investment loss to average net assets do not reflect the expenses of the underlying investment companies in which the Fund invests. |
| (5) | Recognition of net investment loss is affected by the timing and declaration of dividends by the underlying investment companies in which the Fund invests. |
| (6) | Amount represents less than $0.01 per share. |
| (7) | As required by SEC standard per share data calculation methodology, this represents a balancing figure derived from the other amounts in the financial highlights tables that captures all other changes affecting net asset value per share. This per share loss amount does not correlate to the aggregate of the net investment income in the Statement of Operations for the year ended June 30, 2024, primarily due to the timing of sales and repurchases of the Fund’s shares in relation to underlying income. |
| (8) | Includes adjustments in accordance with accounting principles generally accepted in the United States of America and, consequently, the net asset values for financial reporting purposes and the returns based upon those net asset values may differ from the net asset values and returns for shareholder transactions. |
| (9) | The ratio includes 0.01% for the year ended June 30, 2023 attributed to line of credit fees. |
See accompanying notes to financial statements.
| Eventide Large Cap Focus Fund |
| FINANCIAL HIGHLIGHTS |
| |
| Per Share Data and Ratios for a Share of Beneficial Interest Outstanding Throughout the Period or Year Presented |
| | | Class C | |
| | | Year Ended | | | Year Ended | |
| | | June 30, 2024 | | | June 30, 2023 * | |
| Net asset value, beginning of period/year | | $ | 11.36 | | | $ | 10.00 | |
| Activity from investment operations: | | | | | | | | |
| Net investment loss (1) | | | (0.09 | ) (6) | | | (0.09 | ) |
| Net realized and unrealized gain on investments | | | 2.52 | | | | 1.45 | |
| Total from investment operations | | | 2.43 | | | | 1.36 | |
| Net asset value, end of period/year | | $ | 13.79 | | | $ | 11.36 | |
| Total return (2) | | | 21.39 | % | | | 13.60 | % |
| Net assets, at end of period/year (000s) | | $ | 292 | | | $ | 27 | |
| Ratio of gross expenses to average net assets before expense reimbursement (3)(4) | | | 2.18 | % | | | 3.64 | % (7) |
| Ratio of net expenses to average net assets after expense reimbursement (4) | | | 1.94 | % | | | 1.95 | % (7) |
| Ratio of net investment loss to average net assets (4)(5) | | | (0.68 | )% | | | (0.93 | )% |
| Portfolio Turnover Rate | | | 101 | % | | | 48 | % |
| | | | | | | | | |
| * | Eventide Large Cap Focus Fund Class N commenced operations on June 30, 2022. |
| (1) | Per share amounts calculated using the average shares method. |
| (2) | Total return in the above table is historical in nature and represents the rate that the investor would have earned or lost on an investment in the Fund assuming reinvestment of dividends and capital gain distributions, if any. Had the advisor not waived a portion of the Fund’s expenses in certain periods, total returns would have been lower. |
| (3) | Represents the ratio of expenses to average net assets absent fee waivers and/or expense reimbursements/recapture by the advisor. |
| (4) | The ratios of expenses to average net assets and net investment loss to average net assets do not reflect the expenses of the underlying investment companies in which the Fund invests. |
| (5) | Recognition of net investment loss is affected by the timing and declaration of dividends by the underlying investment companies in which the Fund invests. |
| (6) | As required by SEC standard per share data calculation methodology, this represents a balancing figure derived from the other amounts in the financial highlights tables that captures all other changes affecting net asset value per share. This per share loss amount does not correlate to the aggregate of the net investment income in the Statement of Operations for the year ended June 30, 2024, primarily due to the timing of sales and repurchases of the Fund’s shares in relation to underlying income. |
| (7) | The ratio includes 0.01% for the year ended June 30, 2023 attributed to line of credit fees. |
See accompanying notes to financial statements.
| Eventide Large Cap Focus Fund |
| FINANCIAL HIGHLIGHTS |
| |
| Per Share Data and Ratios for a Share of Beneficial Interest Outstanding Throughout the Period or Year Presented |
| | | Class I | |
| | | Year Ended | | | Year Ended | |
| | | June 30, 2024 | | | June 30, 2023 * | |
| Net asset value, beginning of period/year | | $ | 11.44 | | | $ | 10.00 | |
| Activity from investment operations: | | | | | | | | |
| Net investment income (1) | | | 0.03 | | | | 0.01 | |
| Net realized and unrealized gain on investments | | | 2.57 | | | | 1.44 | |
| Total from investment operations | | | 2.60 | | | | 1.45 | |
| Less distributions from: | | | | | | | | |
| Net investment income | | | — | | | | (0.00 | ) (6) |
| Return of capital | | | — | | | | (0.01 | ) |
| Total distributions | | | — | | | | (0.01 | ) |
| Net asset value, end of period/year | | $ | 14.04 | | | $ | 11.44 | |
| Total return (2) | | | 22.73 | % | | | 14.55 | % |
| Net assets, at end of period/year (000s) | | $ | 90,959 | | | $ | 12,808 | |
| Ratio of gross expenses to average net assets before expense reimbursement (3)(4) | | | 1.18 | % | | | 2.64 | % (7) |
| Ratio of net expenses to average net assets after expense reimbursement (4) | | | 0.94 | % | | | 0.95 | % (7) |
| Ratio of net investment income (loss) to average net assets (4)(5) | | | 0.24 | % | | | 0.08 | % |
| Portfolio Turnover Rate | | | 101 | % | | | 48 | % |
| | | | | | | | | |
| * | Eventide Large Cap Focus Fund Class N commenced operations on June 30, 2022. |
| (1) | Per share amounts calculated using the average shares method. |
| (2) | Total return in the above table is historical in nature and represents the rate that the investor would have earned or lost on an investment in the Fund assuming reinvestment of dividends and capital gain distributions, if any. Had the advisor not waived a portion of the Fund’s expenses in certain periods, total returns would have been lower. |
| (3) | Represents the ratio of expenses to average net assets absent fee waivers and/or expense reimbursements by the advisor. |
| (4) | The ratios of expenses to average net assets and net investment income to average net assets do not reflect the expenses of the underlying investment companies in which the Fund invests. |
| (5) | Recognition of net investment income is affected by the timing and declaration of dividends by the underlying investment companies in which the Fund invests. |
| (6) | Amount represents less than $0.01 per share. |
| (7) | The ratio includes 0.01% for the year ended June 30, 2023 attributed to line of credit fees. |
See accompanying notes to financial statements.
| Eventide Limited-Term Bond Fund |
| FINANCIAL HIGHLIGHTS |
| |
| Per Share Data and Ratios for a Share of Beneficial Interest Outstanding Throughout Each of the Years Presented |
| | | Class N | |
| | | Year Ended | | | Year Ended | | | Year Ended | | | Year Ended | | | Year Ended | |
| | | June 30, 2024 | | | June 30, 2023 | | | June 30, 2022 | | | June 30, 2021 | | | June 30, 2020 | |
| Net asset value, beginning of year | | $ | 9.68 | | | $ | 9.72 | | | $ | 10.49 | | | $ | 10.62 | | | $ | 10.38 | |
| Activity from investment operations: | | | | | | | | | | | | | | | | | | | | |
| Net investment income (1) | | | 0.28 | | | | 0.16 | | | | 0.04 | | | | 0.06 | | | | 0.15 | |
| Net realized and unrealized gain (loss) on investments | | | 0.22 | | | | (0.04 | ) | | | (0.69 | ) | | | (0.01 | ) | | | 0.30 | |
| Total from investment operations | | | 0.50 | | | | 0.12 | | | | (0.65 | ) | | | 0.05 | | | | 0.45 | |
| Less distributions from: | | | | | | | | | | | | | | | | | | | | |
| Net investment income | | | (0.29 | ) | | | (0.16 | ) | | | (0.07 | ) | | | (0.07 | ) | | | (0.19 | ) |
| Net realized gains | | | — | | | | — | | | | — | | | | (0.07 | ) | | | — | |
| Return of capital | | | — | | | | (0.00 | ) (6) | | | (0.05 | ) | | | (0.04 | ) | | | (0.02 | ) |
| Total distributions | | | (0.29 | ) | | | (0.16 | ) | | | (0.12 | ) | | | (0.18 | ) | | | (0.21 | ) |
| Net asset value, end of year | | $ | 9.89 | | | $ | 9.68 | | | $ | 9.72 | | | $ | 10.49 | | | $ | 10.62 | |
| Total return (2) | | | 5.18 | % | | | 1.29 | % | | | (6.26 | )% | | | 0.48 | % | | | 4.37 | % |
| Net assets, at end of year (000s) | | $ | 17,949 | | | $ | 17,698 | | | $ | 5,622 | | | $ | 6,906 | | | $ | 37,973 | |
| Ratio of gross expenses to average net assets before expense reimbursement (3)(4) | | | 0.89 | % | | | 0.91 | % | | | 0.84 | % | | | 0.86 | % | | | 1.11 | % |
| Ratio of net expenses to average net assets after expense reimbursement (4) | | | 0.75 | % | | | 0.75 | % | | | 0.75 | % | | | 0.75 | % | | | 0.75 | % |
| Ratio of net investment income to average net assets (4)(5) | | | 2.87 | % | | | 1.66 | % | | | 0.42 | % | | | 0.54 | % | | | 1.44 | % |
| Portfolio Turnover Rate | | | 33 | % | | | 34 | % | | | 48 | % | | | 72 | % | | | 71 | % |
| | | | | | | | | | | | | | | | | | | | | |
| (1) | Per share amounts calculated using the average shares method. |
| (2) | Total return in the above table is historical in nature and represents the rate that the investor would have earned or lost on an investment in the Fund assuming reinvestment of dividends and capital gain distributions, if any. Had the advisor not waived a portion of the Fund’s expenses in certain periods, total returns would have been lower. |
| (3) | Represents the ratio of expenses to average net assets absent fee waivers and/or expense reimbursements by the advisor. |
| (4) | The ratios of expenses to average net assets and net investment income to average net assets do not reflect the expenses of the underlying investment companies in which the Fund invests. |
| (5) | Recognition of net investment income is affected by the timing and declaration of dividends by the underlying investment companies in which the Fund invests. |
| (6) | Amount represents less than $0.01 per share. |
See accompanying notes to financial statements.
| Eventide Limited-Term Bond Fund |
| FINANCIAL HIGHLIGHTS |
| |
| Per Share Data and Ratios for a Share of Beneficial Interest Outstanding Throughout Each of the Years Presented |
| | | Class A | |
| | | Year Ended | | | Year Ended | | | Year Ended | | | Year Ended | | | Year Ended | |
| | | June 30, 2024 | | | June 30, 2023 | | | June 30, 2022 | | | June 30, 2021 | | | June 30, 2020 | |
| Net asset value, beginning of year | | $ | 9.70 | | | $ | 9.75 | | | $ | 10.51 | | | $ | 10.65 | | | $ | 10.41 | |
| Activity from investment operations: | | | | | | | | | | | | | | | | | | | | |
| Net investment income (1) | | | 0.27 | | | | 0.14 | | | | 0.04 | | | | 0.03 | | | | 0.17 | |
| Net realized and unrealized gain (loss) on investments | | | 0.22 | | | | (0.03 | ) | | | (0.69 | ) | | | 0.01 (6) | | | | 0.27 | |
| Total from investment operations | | | 0.49 | | | | 0.11 | | | | (0.65 | ) | | | 0.04 | | | | 0.44 | |
| Less distributions from: | | | | | | | | | | | | | | | | | | | | |
| Net investment income | | | (0.28 | ) | | | (0.16 | ) | | | (0.06 | ) | | | (0.07 | ) | | | (0.18 | ) |
| Net realized gains | | | — | | | | — | | | | — | | | | (0.07 | ) | | | — | |
| Return of capital | | | — | | | | (0.00 | ) (7) | | | (0.05 | ) | | | (0.04 | ) | | | (0.02 | ) |
| Total distributions | | | (0.28 | ) | | | (0.16 | ) | | | (0.11 | ) | | | (0.18 | ) | | | (0.20 | ) |
| Paid-in-capital from redemption fees (1) | | | — | | | | — | | | | — | | | | — | | | | — | |
| Net asset value, end of year | | $ | 9.91 | | | $ | 9.70 | | | $ | 9.75 | | | $ | 10.51 | | | $ | 10.65 | |
| Total return (2) | | | 5.09 | % | | | 1.14 | % | | | (6.20 | )% | | | 0.45 | % | | | 4.30 | % |
| Net assets, at end of year (000s) | | $ | 4,612 | | | $ | 19,390 | | | $ | 22,210 | | | $ | 29,596 | | | $ | 12,873 | |
| Ratio of gross expenses to average net assets before expense reimbursement (3)(4) | | | 0.94 | % | | | 0.96 | % | | | 0.89 | % | | | 0.91 | % | | | 1.16 | % |
| Ratio of net expenses to average net assets after expense reimbursement (4) | | | 0.80 | % | | | 0.80 | % | | | 0.80 | % | | | 0.80 | % | | | 0.80 | % |
| Ratio of net investment income to average net assets (4)(5) | | | 2.70 | % | | | 1.47 | % | | | 0.37 | % | | | 0.27 | % | | | 1.63 | % |
| Portfolio Turnover Rate | | | 33 | % | | | 34 | % | | | 48 | % | | | 72 | % | | | 71 | % |
| | | | | | | | | | | | | | | | | | | | | |
| (1) | Per share amounts calculated using the average shares method. |
| (2) | Total return in the above table is historical in nature and represents the rate that the investor would have earned or lost on an investment in the Fund assuming reinvestment of dividends and capital gain distributions, if any and does not reflect the impact of sales charges. Had the advisor not waived a portion of the Fund’s expenses in certain periods, total returns would have been lower. |
| (3) | Represents the ratio of expenses to average net assets absent fee waivers and/or expense reimbursements by the advisor. |
| (4) | The ratios of expenses to average net assets and net investment income to average net assets do not reflect the expenses of the underlying investment companies in which the Fund invests. |
| (5) | Recognition of net investment income is affected by the timing and declaration of dividends by the underlying investment companies in which the Fund invests. |
| (6) | Due to the timing of shareholder transactions, and allocations of expenses among share classes, the per unit amounts presented may not coincide with the aggregate presentation on the Statements of Operations. |
| (7) | Amount represents less than $0.01 per share. |
See accompanying notes to financial statements.
| Eventide Limited-Term Bond Fund |
| FINANCIAL HIGHLIGHTS |
| |
| Per Share Data and Ratios for a Share of Beneficial Interest Outstanding Throughout Each of the Years Presented |
| | | Class C | |
| | | Year Ended | | | Year Ended | | | Year Ended | | | Year Ended | | | Year Ended | |
| | | June 30, 2024 | | | June 30, 2023 | | | June 30, 2022 | | | June 30, 2021 | | | June 30, 2020 | |
| Net asset value, beginning of year | | $ | 9.64 | | | $ | 9.68 | | | $ | 10.44 | | | $ | 10.60 | | | $ | 10.37 | |
| Activity from investment operations: | | | | | | | | | | | | | | | | | | | | |
| Net investment income (loss) (1) | | | 0.20 | | | | 0.07 | | | | (0.04 | ) | | | (0.05 | ) | | | (0.01 | ) |
| Net realized and unrealized gain (loss) on investments | | | 0.21 | | | | (0.02 | ) | | | (0.68 | ) | | | 0.01 (6) | | | | 0.37 | |
| Total from investment operations | | | 0.41 | | | | 0.05 | | | | (0.72 | ) | | | (0.04 | ) | | | 0.36 | |
| Less distributions from: | | | | | | | | | | | | | | | | | | | | |
| Net investment income | | | (0.21 | ) | | | (0.09 | ) | | | (0.02 | ) | | | (0.01 | ) | | | (0.10 | ) |
| Net realized gains | | | — | | | | — | | | | — | | | | (0.07 | ) | | | — | |
| Return of capital | | | — | | | | (0.00 | ) (7) | | | (0.02 | ) | | | (0.04 | ) | | | (0.03 | ) |
| Total distributions | | | (0.21 | ) | | | (0.09 | ) | | | (0.04 | ) | | | (0.12 | ) | | | (0.13 | ) |
| Net asset value, end of year | | $ | 9.84 | | | $ | 9.64 | | | $ | 9.68 | | | $ | 10.44 | | | $ | 10.60 | |
| Total return (2) | | | 4.26 | % | | | 0.49 | % | | | (6.94 | )% | | | (0.38 | )% | | | 3.50 | % |
| Net assets, at end of year (000s) | | $ | 1,564 | | | $ | 1,618 | | | $ | 1,678 | | | $ | 1,545 | | | $ | 401 | |
| Ratio of gross expenses to average net assets before expense reimbursement (3)(4) | | | 1.69 | % | | | 1.71 | % | | | 1.64 | % | | | 1.66 | % | | | 1.91 | % |
| Ratio of net expenses to average net assets after expense reimbursement (4) | | | 1.55 | % | | | 1.55 | % | | | 1.55 | % | | | 1.55 | % | | | 1.55 | % |
| Ratio of net investment income (loss) to average net assets (4)(5) | | | 2.05 | % | | | 0.74 | % | | | (0.37 | )% | | | (0.50 | )% | | | (0.08 | )% |
| Portfolio Turnover Rate | | | 33 | % | | | 34 | % | | | 48 | % | | | 72 | % | | | 71 | % |
| | | | | | | | | | | | | | | | | | | | | |
| (1) | Per share amounts calculated using the average shares method. |
| (2) | Total return in the above table is historical in nature and represents the rate that the investor would have earned or lost on an investment in the Fund assuming reinvestment of dividends and capital gain distributions, if any. Had the advisor not waived a portion of the Fund’s expenses in certain periods, total returns would have been lower. |
| (3) | Represents the ratio of expenses to average net assets absent fee waivers and/or expense reimbursements/recapture by the advisor. |
| (4) | The ratios of expenses to average net assets and net investment income to average net assets do not reflect the expenses of the underlying investment companies in which the Fund invests. |
| (5) | Recognition of net investment income (loss) is affected by the timing and declaration of dividends by the underlying investment companies in which the Fund invests. |
| (6) | Due to the timing of shareholder transactions, and allocations of expenses among share classes, the per unit amounts presented may not coincide with the aggregate presentation on the Statements of Operations. |
| (7) | Amount represents less than $0.01 per share. |
See accompanying notes to financial statements.
| Eventide Limited-Term Bond Fund |
| FINANCIAL HIGHLIGHTS |
| |
| Per Share Data and Ratios for a Share of Beneficial Interest Outstanding Throughout Each of the Years Presented |
| | | Class I | |
| | | Year Ended | | | Year Ended | | | Year Ended | | | Year Ended | | | Year Ended | |
| | | June 30, 2024 | | | June 30, 2023 | | | June 30, 2022 | | | June 30, 2021 | | | June 30, 2020 | |
| Net asset value, beginning of year | | $ | 9.93 | | | $ | 9.97 | | | $ | 10.75 | | | $ | 10.89 | | | $ | 10.64 | |
| Activity from investment operations: | | | | | | | | | | | | | | | | | | | | |
| Net investment income (1) | | | 0.31 | | | | 0.16 | | | | 0.07 | | | | 0.05 | | | | 0.17 | |
| Net realized and unrealized gain (loss) on investments | | | 0.22 | | | | (0.02 | ) | | | (0.71 | ) | | | 0.01 | (6) | | | 0.31 | |
| Total from investment operations | | | 0.53 | | | | 0.14 | | | | (0.64 | ) | | | 0.06 | | | | 0.48 | |
| Less distributions from: | | | | | | | | | | | | | | | | | | | | |
| Net investment income | | | (0.31 | ) | | | (0.18 | ) | | | (0.08 | ) | | | (0.09 | ) | | | (0.21 | ) |
| Net realized gains | | | — | | | | — | | | | — | | | | (0.07 | ) | | | — | |
| Return of capital | | | — | | | | (0.00 | ) (7) | | | (0.06 | ) | | | (0.04 | ) | | | (0.02 | ) |
| Total distributions | | | (0.31 | ) | | | (0.18 | ) | | | (0.14 | ) | | | (0.20 | ) | | | (0.23 | ) |
| Paid-in-capital from redemption fees (1) | | | — | | | | — | | | | — | | | | — | | | | — | |
| Net asset value, end of year | | $ | 10.15 | | | $ | 9.93 | | | $ | 9.97 | | | $ | 10.75 | | | $ | 10.89 | |
| Total return (2) | | | 5.35 | % | | | 1.46 | % | | | (6.02 | )% | | | 0.65 | % | | | 4.58 | % |
| Net assets, at end of year (000s) | | $ | 121,701 | | | $ | 88,666 | | | $ | 152,546 | | | $ | 144,089 | | | $ | 28,847 | |
| Ratio of gross expenses to average net assets before expense reimbursement (3)(4) | | | 0.69 | % | | | 0.71 | % | | | 0.64 | % | | | 0.66 | % | | | 0.91 | % |
| Ratio of net expenses to average net assets after expense reimbursement (4) | | | 0.55 | % | | | 0.55 | % | | | 0.55 | % | | | 0.55 | % | | | 0.55 | % |
| Ratio of net investment income to average net assets (4)(5) | | | 3.10 | % | | | 1.68 | % | | | 0.64 | % | | | 0.49 | % | | | 1.58 | % |
| Portfolio Turnover Rate | | | 33 | % | | | 34 | % | | | 48 | % | | | 72 | % | | | 71 | % |
| | | | | | | | | | | | | | | | | | | | | |
| (1) | Per share amounts calculated using the average shares method. |
| (2) | Total return in the above table is historical in nature and represents the rate that the investor would have earned or lost on an investment in the Fund assuming reinvestment of dividends and capital gain distributions, if any. Had the advisor not waived a portion of the Fund’s expenses in certain periods, total returns would have been lower. |
| (3) | Represents the ratio of expenses to average net assets absent fee waivers and/or expense reimbursements by the advisor. |
| (4) | The ratios of expenses to average net assets and net investment income to average net assets do not reflect the expenses of the underlying investment companies in which the Fund invests. |
| (5) | Recognition of net investment income is affected by the timing and declaration of dividends by the underlying investment companies in which the Fund invests. |
| (6) | Due to the timing of shareholder transactions, and allocations of expenses among share classes, the per unit amounts presented may not coincide with the aggregate presentation on the Statements of Operations. |
| (7) | Amount represents less than $0.01 per share. |
See accompanying notes to financial statements.
| Eventide Funds |
| NOTES TO FINANCIAL STATEMENTS |
| June 30, 2024 |
| (1) | ORGANIZATION AND SIGNIFICANT ACCOUNTING POLICIES |
Mutual Fund Series Trust (the “Trust”), was organized as an Ohio business trust on February 27, 2006. The Trust is registered as an open-end management investment company under the Investment Company Act of 1940, as amended (“1940 Act”). The Trust currently consists of thirty-five series. These financial statements include the following series: Eventide Balanced Fund (formerly Eventide Multi-Asset Income Fund), Eventide Core Bond Fund, Eventide Dividend Opportunities Fund, Eventide Exponential Technologies Fund, Eventide Gilead Fund, Eventide Healthcare & Life Sciences Fund, Eventide Large Cap Focus Fund and the Eventide Limited-Term Bond Fund (each a “Fund” or collectively the “Funds”). Each Fund except Eventide Exponential Technologies Fund and Eventide Large Cap Focus Fund is a diversified series of the Trust. Eventide Exponential Technologies Fund and Eventide Large Cap Focus Fund are non-diversified series of the Trust. The Funds’ investment advisor is Eventide Asset Management, LLC (the “Advisor”).
Eventide Balanced Fund commenced operations on July 15, 2015. The Fund’s investment objective is current income while maintaining the potential for capital appreciation.
Eventide Core Bond Fund commenced operations on July 31, 2020. The Fund’s investment objective is total return consistent with income generation.
Eventide Dividend Opportunities Fund commenced operations on September 29, 2017. The Fund’s investment objectives are dividend income and long-term capital appreciation. The Fund’s secondary objective is dividend growth.
Eventide Exponential Technologies Fund commenced operations on June 30, 2020. The Fund’s investment objective is long-term capital appreciation.
Eventide Gilead Fund commenced operations on July 8, 2008. The Fund’s investment objective is long-term capital appreciation.
Eventide Healthcare & Life Sciences Fund commenced operations on December 27, 2012. The Fund’s investment objective is long-term capital appreciation.
Eventide Large Cap Focus Fund commenced operations on June 30, 2022. The Fund’s investment objective is long-term capital appreciation.
Eventide Limited-Term Bond Fund (formerly Epiphany FFV Strategic Income Fund) Class A and Class I shares commenced operations on July 28, 2010. On March 29, 2017, the Board of Trustees of Epiphany Funds voted to reclassify (the “Conversion”) all outstanding Class C Shares of the Epiphany FFV Strategic Income Fund to Class I shares to be effective on May 30, 2017 (the “Conversion Date”). On the Conversion Date, each Class C share was reclassified as a Class I shares equal in value to the Class C shares owned by that shareholder. The Eventide Limited-Term Bond Fund’s Class N and Class C shares commenced operations December 14, 2018. The Fund changed its fiscal year end from October 31 to June 30. The Fund’s investment objective is income.
Each Fund offers four classes of shares, Class N, Class A, Class C and Class I. Each class differs as to sales and redemption charges and ongoing fees.
The following is a summary of significant accounting policies consistently followed by the Funds and are in accordance with accounting principles generally accepted in the United States of America (“GAAP”). The Funds are investment companies and accordingly follow the investment company accounting and reporting guidance of the Financial Accounting Standards Board (FASB) Accounting Standards Codification Topic 946 “Financial Services – Investment Companies” including Accounting Standards Update 2013-08.
| Eventide Funds |
| NOTES TO FINANCIAL STATEMENTS (Continued) |
| June 30, 2024 |
a) Securities Valuation – Securities listed on an exchange are valued at the last reported sale price at the close of the regular trading session of the exchange on the business day the value is being determined, or in the case of securities listed on NASDAQ, at the NASDAQ Official Closing Price (“NOCP”). In the absence of a sale, such securities shall be valued at the last bid price on the day of valuation. Debt securities (other than short-term obligations) are valued each day by an independent pricing service approved by the Board of Trustees (the “Board”) using methods which include current market quotations from a major market maker in the securities and based on methods which include the consideration of yields or prices of securities of comparable quality, coupon, maturity and type. The Funds may invest in portfolios of open-end or closed-end investment companies (the “underlying funds”). Open-end investment companies are valued at their respective net asset values as reported by such investment companies. The underlying funds value securities in their portfolios for which market quotations are readily available at their market values (generally the last reported sale price) and all other securities and assets at their fair value by the methods established by the boards of trustees of the underlying funds. The shares of many closed-end investment companies, after their initial public offering, frequently trade at a price per share, which is different than the net asset value per share. The difference represents a market premium or market discount of such shares. There can be no assurances that the market discount or market premium on shares of any -closed-end investment company purchased by the Funds will not-change. The independent pricing service does not distinguish between smaller sized bond positions known as “odd lots” and larger institutional sized bond positions known as “round lots”. The Funds may fair value a particular bond if the Advisor does not believe that the round lot value provided by the independent pricing service reflects fair value of the Fund’s holding. Short term debt obligations having 60 days or less remaining until maturity, at time of purchase, may be valued at amortized cost, provided each such valuations represent fair value. Options are valued at their closing price on the exchange they are traded on. When no closing price is available, options are valued at their mean price.
The Fund may hold investments, such as private investments, interests in commodity pools, other non-traded securities or temporarily illiquid securities, for which market quotations are not readily available or are determined to be unreliable. These securities are valued using the “fair value” procedures approved by the Board. The Board has designated the Advisor as its valuation designee (the “Valuation Designee”) to execute these procedures. The Board may also enlist third party consultants such a valuation specialist at a public accounting firm, valuation consultant or financial officer of a security issuer on an as -needed basis to assist the Valuation Designee in determining a security -specific fair value. The Board is responsible for reviewing and approving fair value methodologies utilized by the Valuation Designee, approval of which shall be based upon whether the Valuation Designee followed the valuation procedures established by the Board.
The Funds utilize various methods to measure the fair value of most of their investments on a recurring basis. GAAP establishes a hierarchy that prioritizes inputs to valuation methods. The three levels of input are:
Level 1 – Unadjusted quoted prices in active markets for identical assets and liabilities that the Funds have the ability to access.
Level 2 – Observable inputs other than quoted prices included in Level 1 that are observable for the asset or liability, either directly or indirectly. These inputs may include quoted prices for the identical instrument in an inactive market, prices for similar instruments, interest rates, prepayment speeds, credit risk, yield curves, default rates and similar data.
Level 3 – Unobservable inputs for the asset or liability, to the extent relevant observable inputs are not available, representing the Funds’ own assumptions about the assumptions a market participant would use in valuing the asset or liability, and would be based on the best information available.
The availability of observable inputs can vary from security to security and is affected by a wide variety of factors, including, for example, the type of security, whether the security is new and not yet established in the marketplace, the liquidity of markets, and other characteristics particular to the security. To the extent that valuation is based on models or inputs that are less observable or unobservable in the market, the determination of fair value requires more judgment. Accordingly, the degree of judgment exercised in determining fair value is greatest for instruments categorized in Level 3.
The inputs used to measure fair value may fall into different levels of the fair value hierarchy. In such cases, for disclosure purposes, the level in the fair value hierarchy within which the fair value measurement falls in its entirety, is determined based on the lowest level input that is significant to the fair value measurement in its entirety.
| Eventide Funds |
| NOTES TO FINANCIAL STATEMENTS (Continued) |
| June 30, 2024 |
The inputs or methodology used for valuing securities are not necessarily an indication of the risk associated with investing in those securities.
The following tables summarize the inputs used as of June 30, 2024 for the Funds’ assets measured at fair value:
| Eventide Balanced Fund | | | | | | | | | | | | |
| | | | | | | | | | | | | |
| Assets | | | | | | | | | | | | |
| Security Classifications | | Level 1 | | | Level 2 | | | Level 3 | | | Totals | |
| Common Stocks (a) | | $ | 201,369,881 | | | $ | — | | | $ | — | | | $ | 201,369,881 | |
| Asset Backed Securities (a) | | | — | | | | 6,058,130 | | | | — | | | | 6,058,130 | |
| Collateralized Mortgage Obligations (a) | | | — | | | | 1,823,998 | | | | — | | | | 1,823,998 | |
| Convertible Bonds (a) | | | — | | | | 1,277,156 | | | | — | | | | 1,277,156 | |
| Corporate Bonds (a) | | | — | | | | 78,264,016 | | | | — | | | | 78,264,016 | |
| Municipal Bonds (a) | | | — | | | | 16,180,027 | | | | — | | | | 16,180,027 | |
| U.S. Government & Agencies (a) | | | — | | | | 67,903,979 | | | | — | | | | 67,903,979 | |
| Short-Term Investments | | | 111,291 | | | | — | | | | — | | | | 111,291 | |
| Total | | $ | 201,481,172 | | | $ | 171,507,306 | | | $ | — | | | $ | 372,988,478 | |
| | | | | | | | | | | | | | | | | |
| Eventide Core Bond Fund | | | | | | | | | | | | |
| | | | | | | | | | | | | |
| Assets | | | | | | | | | | | | |
| Security Classifications | | Level 1 | | | Level 2 | | | Level 3 | | | Totals | |
| Asset Backed Securities (a) | | $ | — | | | $ | 4,084,302 | | | $ | — | | | $ | 4,084,302 | |
| Corporate Bonds (a) | | | — | | | | 62,117,315 | | | | — | | | | 62,117,315 | |
| Municipal Bonds (a) | | | — | | | | 13,173,734 | | | | — | | | | 13,173,734 | |
| U.S. Government & Agencies (a) | | | — | | | | 54,164,501 | | | | — | | | | 54,164,501 | |
| Total | | $ | — | | | $ | 133,539,852 | | | $ | — | | | $ | 133,539,852 | |
| | | | | | | | | | | | | | | | | |
| Eventide Dividend Opportunities Fund | | | | | | | | | | | | |
| | | | | | | | | | | | | |
| Assets | | | | | | | | | | | | |
| Security Classifications | | Level 1 | | | Level 2 | | | Level 3 | | | Totals | |
| Common Stocks (a) | | $ | 846,156,449 | | | $ | — | | | $ | — | | | $ | 846,156,449 | |
| Corporate Bonds (a) | | | — | | | | 3,214,663 | | | | — | | | | 3,214,663 | |
| Short-Term Investments | | | 111,652 | | | | — | | | | — | | | | 111,652 | |
| Total | | $ | 846,268,101 | | | $ | 3,214,663 | | | $ | — | | | $ | 849,482,764 | |
| | | | | | | | | | | | | | | | | |
| Eventide Exponential Technologies Fund | | | | | | | | | | | | |
| | | | | | | | | | | | | |
| Assets | | | | | | | | | | | | |
| Security Classifications | | Level 1 | | | Level 2 | | | Level 3 | | | Totals | |
| Common Stocks (a) | | $ | 109,349,262 | | | $ | — | | | $ | — | | | $ | 109,349,262 | |
| Corporate Bonds (a) | | | — | | | | 741,845 | | | | — | | | | 741,845 | |
| Warrant (a) | | | — | | | | — | | | | — | | | | — | |
| Short-Term Investments | | | 12,517 | | | | — | | | | — | | | | 12,517 | |
| Equity Options Purchased | | | 4,000 | | | | — | | | | — | | | | 4,000 | |
| Total | | $ | 109,365,779 | | | $ | 741,845 | | | $ | — | | | $ | 110,107,624 | |
| Eventide Funds |
| NOTES TO FINANCIAL STATEMENTS (Continued) |
| June 30, 2024 |
| Eventide Gilead Fund | | | | | | | | | | | | |
| | | | | | | | | | | | | |
| Assets | | | | | | | | | | | | |
| Security Classifications | | Level 1 | | | Level 2 | | | Level 3 | | | Totals | |
| Common Stocks (a) | | $ | 3,247,815,258 | | | $ | — | | | $ | — | | | $ | 3,247,815,258 | |
| Contingent Value Rights (a) | | | — | | | | — | | | | 3,365,186 | | | | 3,365,186 | |
| Private Investments (a) | | | 7,814,877 | | | | — | | | | 32,891,954 | | | | 40,706,831 | |
| Corporate Bonds (a) | | | — | | | | 42,177,975 | | | | — | | | | 42,177,975 | |
| Warrant (a) | | | — | | | | — | | | | 5,133,496 | | | | 5,133,496 | |
| Short-Term Investments | | | 5,197,620 | | | | — | | | | — | | | | 5,197,620 | |
| Total | | $ | 3,260,827,755 | | | $ | 42,177,975 | | | $ | 41,390,636 | | | $ | 3,344,396,366 | |
| | | | | | | | | | | | | | | | | |
| Eventide Healthcare & Life Sciences Fund | | | | | | | | | | | | |
| | | | | | | | | | | | | |
| Assets | | | | | | | | | | | | |
| Security Classifications | | Level 1 | | | Level 2 | | | Level 3 | | | Totals | |
| Common Stocks (a) | | $ | 1,280,320,328 | | | $ | — | | | $ | — | | | $ | 1,280,320,328 | |
| Contingent Value Rights (a) | | | — | | | | — | | | | 1,291,743 | | | | 1,291,743 | |
| Private Investments (a) | | | 43,686,657 | | | | — | | | | 60,005,195 | | | | 103,691,852 | |
| Convertible Bonds (a) | | | — | | | | — | | | | 394,520 | | | | 394,520 | |
| Warrant (a) | | | — | | | | — | | | | 3,125,031 | | | | 3,125,031 | |
| Short-Term Investments | | | 3,394,275 | | | | — | | | | — | | | | 3,394,275 | |
| Total | | $ | 1,327,401,260 | | | $ | — | | | $ | 64,816,489 | | | $ | 1,392,217,749 | |
| | | | | | | | | | | | | | | | | |
| Eventide Large Cap Focus Fund | | | | | | | | | | | | |
| | | | | | | | | | | | | |
| Assets | | | | | | | | | | | | |
| Security Classifications | | Level 1 | | | Level 2 | | | Level 3 | | | Totals | |
| Common Stocks (a) | | $ | 102,792,851 | | | $ | — | | | $ | — | | | $ | 102,792,851 | |
| Warrant (a) | | | — | | | | — | | | | — | | | | — | |
| Total | | $ | 102,792,851 | | | $ | — | | | $ | — | | | $ | 102,792,851 | |
| | | | | | | | | | | | | | | | | |
| Eventide Limited-Term Bond Fund | | | | | | | | | | | | |
| | | | | | | | | | | | | |
| Assets | | | | | | | | | | | | |
| Security Classifications | | Level 1 | | | Level 2 | | | Level 3 | | | Totals | |
| Asset Backed Securities (a) | | $ | — | | | $ | 6,922,965 | | | $ | — | | | $ | 6,922,965 | |
| Corporate Bonds (a) | | | — | | | | 91,776,678 | | | | — | | | | 91,776,678 | |
| Municipal Bonds (a) | | | — | | | | 11,559,323 | | | | — | | | | 11,559,323 | |
| U.S. Government & Agencies (a) | | | — | | | | 31,628,994 | | | | — | | | | 31,628,994 | |
| Total | | $ | — | | | $ | 141,887,960 | | | $ | — | | | $ | 141,887,960 | |
| (a) | For a detailed break-out of investments by security classification, please refer to the Schedule of Investments. |
| Eventide Funds |
| NOTES TO FINANCIAL STATEMENTS (Continued) |
| June 30, 2024 |
The following is a reconciliation of assets in which level 3 inputs were used in determining value:
| Eventide Balanced Fund | |
| | | Corporate Bonds | | | Total | | | | | | | | | | |
| Beginning balance 6/30/2023 | | $ | 3,800,000 | | | $ | 3,800,000 | | | | | | | | | | | | | |
| Total realized gain (loss) | | | — | | | | — | | | | | | | | | | | | | |
| Change in unrealized appreciation (depreciation) | | | (60,504 | ) | | | (60,504 | ) | | | | | | | | | | | | |
| Cost of purchases | | | — | | | | — | | | | | | | | | | | | | |
| Proceeds from sales | | | — | | | | — | | | | | | | | | | | | | |
| Net transfers in/out of level 3* | | | (3,739,496 | ) | | | (3,739,496 | ) | | | | | | | | | | | | |
| Ending balance 6/30/2024 | | $ | — | | | $ | — | | | | | | | | | | | | | |
| | | | | | | | | | | | | | | | | | | | | |
| Eventide Dividend Opportunities Fund | |
| | | Corporate Bonds | | | Total | | | | | | | | | | |
| Beginning balance 6/30/2023 | | $ | 2,000,000 | | | $ | 2,000,000 | | | | | | | | | | | | | |
| Total realized gain (loss) | | | — | | | | — | | | | | | | | | | | | | |
| Change in unrealized appreciation (depreciation) | | | (35,337 | ) | | | (35,337 | ) | | | | | | | | | | | | |
| Cost of purchases | | | 3,250,000 | | | | 3,250,000 | | | | | | | | | | | | | |
| Proceeds from sales | | | (2,000,000 | ) | | | (2,000,000 | ) | | | | | | | | | | | | |
| Corporate action | | | — | | | | — | | | | | | | | | | | | | |
| Net transfers in/out of level 3* | | | (3,214,663 | ) | | | (3,214,663 | ) | | | | | | | | | | | | |
| Ending balance 6/30/2024 | | $ | — | | | $ | — | | | | | | | | | | | | | |
| | | | | | | | | | | | | | | | | | | | | |
| Eventide Exponential Technologies Fund | |
| | | Corporate Bonds | | | Warrant | | | Total | | | | | | | |
| Beginning balance 6/30/2023 | | $ | — | | | $ | — | | | $ | — | | | | | | | | | |
| Total realized gain (loss) | | | — | | | | — | | | | — | | | | | | | | | |
| Change in unrealized appreciation (depreciation) | | | (8,155 | ) | | | — | | | | (8,155 | ) | | | | | | | | |
| Cost of purchases | | | 750,000 | | | | — | | | | 750,000 | | | | | | | | | |
| Proceeds from sales | | | — | | | | — | | | | — | | | | | | | | | |
| Net transfers in/out of level 3* | | | (741,845 | ) | | | — | | | | (741,845 | ) | | | | | | | | |
| Ending balance 6/30/2024 | | $ | — | | | $ | — | | | $ | — | | | | | | | | | |
| | | | | | | | | | | | | | | | | | | | | |
| Eventide Gilead Fund | |
| | | Contingent | | | Private | | | | | | | | | | |
| | | Value Rights | | | Investments | | | Corporate Bonds | | | Warrant | | | Total | |
| Beginning balance 6/30/2023 | | $ | 3,197,106 | | | $ | 18,653,578 | | | $ | 27,000,000 | | | $ | 1,274,958 | | | $ | 50,125,642 | |
| Total realized gain (loss) | | | — | | | | — | | | | — | | | | — | | | | — | |
| Change in unrealized appreciation (depreciation) | | | 168,080 | | | | 8,238,374 | | | | (690,567 | ) | | | 3,858,538 | | | | 11,574,425 | |
| Cost of purchases | | | — | | | | 6,000,002 | | | | 9,000,000 | | | | — | | | | 15,000,002 | |
| Proceeds from sales | | | — | | | | — | | | | (7,000,000 | ) | | | — | | | | (7,000,000 | ) |
| Net transfers in/out of level 3* | | | — | | | | — | | | | (28,309,433 | ) | | | — | | | | (28,309,433 | ) |
| Ending balance 6/30/2024 | | $ | 3,365,186 | | | $ | 32,891,954 | | | $ | — | | | $ | 5,133,496 | | | $ | 41,390,636 | |
| | | | | | | | | | | | | | | | | | | | | |
| Eventide Healthcare & Life Sciences Fund | |
| | | Contingent | | | Private | | | Convertible | | | | | | | |
| | | Value Rights | | | Investments | | | Bonds | | | Warrants | | | Total | |
| Beginning balance 6/30/2023 | | $ | 1,227,225 | | | $ | 93,230,465 | | | $ | 2,818,000 | | | $ | 708,377 | | | $ | 97,984,067 | |
| Total realized gain (loss) | | | — | | | | (16 | ) | | | — | | | | — | | | | (16 | ) |
| Change in unrealized appreciation (depreciation) | | | 64,518 | | | | 824,706 | | | | (3,423,480 | ) | | | 2,416,654 | | | | (117,602 | ) |
| Cost of purchases | | | — | | | | 20,340,980 | | | | 1,000,000 | | | | — | | | | 21,340,980 | |
| Proceeds from sales | | | — | | | | (54,390,940 | ) | | | — | | | | — | | | | (54,390,940 | ) |
| Net transfers in/out of level 3 | | | — | | | | — | | | | — | | | | — | | | | — | |
| Ending balance 6/30/2024 | | $ | 1,291,743 | | | $ | 60,005,195 | | | $ | 394,520 | | | $ | 3,125,031 | | | $ | 64,816,489 | |
| * | Transferred from Level 3 to Level 2 because observable market data became available for the investments. |
| Eventide Funds |
| NOTES TO FINANCIAL STATEMENTS (Continued) |
| June 30, 2024 |
The significant unobservable inputs used in the fair value measurement of the Funds’ Level 3 private investments were as follows:
| | | | | | Impact to |
| | | Valuation | Unobservable | | Valuation from an |
| Fund | Description | Technique(s) | Input | Input | increase in InputA |
| Eventide Healthcare & Life Sciences Fund | Arch Oncology, Inc. Series C1 | Residual Value | Net assets | $540K | Increase |
| Eventide Healthcare & Life Sciences Fund | Avalyn Pharma Inc. Series C1 | Market Approach | Recent transaction price | $0.73 | Increase |
Eventide Healthcare &
Life Sciences Fund,
Eventide Gilead Fund | Beta Bionics, Inc. Series B,
Beta Bionics, Inc. Series B2,
Beta Bionics, Inc. Series C,
Beta Bionics, Inc. Series C Warrant,
Beta Bionics, Inc. Series D,
Beta Bionics, Inc. Series D Warrant | Probability-Weighted
Expected Return
Method | Revenue,
Revenue multiple,
Recovery multiple,
Strategic sale,
IPO,
Downside,
Dissolution | $75.1M,
7.00-8.00x,
0.50x,
30% probability weight,
45% probability weight,
15% probability weight,
10% probability weight | Increase,
Increase,
Increase,
Increase,
Increase,
Decrease,
Decrease |
| Eventide Healthcare & Life Sciences Fund | BioSplice Therapeutics, Inc. Series B-1 | Cash Value | Cash | $14.2M | Increase |
| Eventide Healthcare & Life Sciences Fund | BioSplice Therapeutics, Inc. Series C Warrant | Cash Value | Cash | $14.2M | Increase |
| Eventide Healthcare & Life Sciences Fund | BioSplice Therapeutics, Inc. Series C PIK | Cash Value | Cash | $14.2M | Increase |
Eventide Healthcare &
Life Sciences Fund | Casma Therapeutics, Inc. Series B1,
Casma Therapeutics, Inc. Series B2,
Casma Therapeutics, Inc. Series C1,
Casma Therapeutics, Inc. Series C2,
Casma Therapeutics, Inc. Series C2
Extenstion | Discount | Discount,
Recent transaction
price | 54.5%,
$0.46 | Decrease,
Increase |
Eventide Healthcare &
Life Sciences Fund | Flare Therapeutics, Inc. Series A,
Flare Therapeutics, Inc. Series A2,
Flare Therapeutics, Inc. Series B | Market Approach | Recent transaction
price | $1.20 | Increase |
Eventide Healthcare &
Life Sciences Fund | Freenome Holdings, Inc. Series D,
Freenome Holdings, Inc. Series F | Cash Value | Cash | $482M | Increase |
Eventide Healthcare &
Life Sciences Fund | Goldfinch Biopharma, Inc. Series A,
Goldfinch Biopharma, Inc. Series B,
Goldfinch Biopharma, Inc. Series B2 | Residual Value | Net assets | $0 | Increase |
Eventide Healthcare &
Life Sciences Fund | Kojin Therapeutics, Inc. Series A-1,
Kojin Therapeutics, Inc. Series A-2 | Residual Value | Net assets | $19M | Increase |
Eventide Healthcare &
Life Sciences Fund | Peloton Therapeutics, Inc. - CRV | Present Value | Discount rate,
Probability of
success,
Milestone payments, | 10%,
2.5%-75%,
$50M-$1.1B | Decrease,
Increase,
Increase,
Decrease |
Eventide Healthcare &
Life Sciences Fund | Evida BioSciences, Inc. | Market Approach | Recent transaction
price | $0.69 | Increase |
Eventide Healthcare &
Life Sciences Fund | Shoreline Biosciences Series B | Option Pricing
Model/Back solve | Risk free rate,
Time to expiration,
Volatility,
Market Equity
Adjustment | 1.01% -4.30%,
4.19 years,
75.64% - 77.54%,
-15.91% | Decrease,
Increase,
Increase,
Increase |
| A | Represents the directional change in the fair value of the Level 3 investments that could have resulted from an increase in the corresponding input as of period end. A decrease to the unobservable input would have had the opposite effect. Significant changes in these inputs may have resulted in a significantly higher or lower fair value measurement at period end. |
| Eventide Funds |
| NOTES TO FINANCIAL STATEMENTS (Continued) |
| June 30, 2024 |
The total change in unrealized appreciation or depreciation included in the Statements of Operations attributable to Level 3 investments still held at June 30, 2024 was $0, $0, $0, $12,264,972 and $(3,551,01) for the Eventide Balanced Fund, Eventide Dividend Opportunities Fund, Eventide Exponential Technologies Fund, Eventide Gilead Fund and Eventide Healthcare & Life Sciences Fund, respectively.
b) Accounting for Options – When the Funds write an option, an amount equal to the premium received by the Funds is recorded as a liability and is subsequently adjusted to the current fair value of the option written. Premiums received from writing options that expire unexercised are treated by the Funds on the expiration date as realized gains from investments. The difference between the premium and the amount paid on effecting a closing purchase transaction, including brokerage commissions, is also treated as a realized gain, or, if the premium is less than the amount paid for the closing purchase transaction, as a realized loss. If a call option is exercised, the premium is added to the proceeds from the sale of the underlying security or currency in determining whether the Funds have realized gains or losses. If a put option is exercised, the premium reduces the cost basis of the securities purchased by the Funds.
The Advisor may use options strategies, such as puts and covered calls on individual securities, as well as options on securities indices, to generate income, to reduce portfolio volatility, or to reduce downside risk when the manager believes adverse market, political or other conditions are likely. The Advisor may also utilize a combination of puts and/or calls regarding the same security (sometimes referred to as “straddles,” “collars” or “spreads”) or utilize puts and calls on related securities. The Funds may purchase a call option on a stock (including securities of exchange traded funds (“ETFs”)) it may purchase at some point in the future. When the Funds purchase an option, the premium paid is recorded as an asset. Each day the option contract is valued in accordance with the procedures for security valuation discussed above. When an offsetting option is written (a closing transaction) or the option contract expires, the Funds realize a gain or loss and the asset representing such option contract is eliminated. When a put option is exercised, the Funds realize a gain or loss from the sale of the underlying security and the proceeds of the sale are decreased by the premiums originally paid. When a call option is exercised, the Funds purchase the underlying security and the cost basis of such purchase is increased by the premium originally paid.
The notional value of the derivative instruments outstanding as of June 30, 2024 as disclosed in the Schedules of Investments and the amounts realized and changes in unrealized gains and losses on derivative instruments during the year as disclosed above and within the Statements of Operations serve as indicators of the volume of derivative activity of the Funds.
The effect of derivative instruments on the Statements of Assets & Liabilities for the year ended June 30, 2024 was as follows:
Eventide Exponential Technologies Fund
| | | | | Location of Derivative on Statements of Assets | | Fair Value of Asset | |
| Derivative | | Primary Risk Exposure | | and Liabilities | | Derivative | |
| Call Options Purchased | | Equity Risk | | Unaffiliated investments at value | | $ | 4,000 | |
| Total | | | | | | $ | 4,000 | |
The effect of derivative instruments on the Statements of Operations for the year ended June 30, 2024 was as follows:
Eventide Exponential Technologies Fund
| | | | | | | Realized and | |
| Derivatives Not | | | | | | Unrealized Gain | |
| Accounted for as | | | | | | (Loss) on Asset | |
| Hedging Instruments | | | | Location of Gain (Loss) on Derivatives | | Derivatives | |
| under GAAP | | Primary Risk Exposure | | Recognized in Statements of Operations | | Recognized in Income | |
| Options Purchased | | Equity Risk | | Net realized loss from unaffiliated investments | | $ | 13,411 | |
| Options Purchased | | Equity Risk | | Net change in unrealized appreciation on unaffiliated investments | | | (139,936 | ) |
| Total | | | | | | $ | (126,525 | ) |
| Eventide Funds |
| NOTES TO FINANCIAL STATEMENTS (Continued) |
| June 30, 2024 |
c) Short Sales – The Funds may sell securities short. A short sale is a transaction in which the Funds sell securities they do not own in anticipation of a decline in the market price of the securities. To deliver the securities to the buyer, the Funds must arrange through a broker to borrow the securities and, in so doing, the Funds become obligated to replace the securities borrowed at their market price at the time of replacement, whatever that price may be. The Funds will make a profit or incur a loss as a result of a short sale depending on whether the price of the securities decrease or increase between the date of the short sale and the date on which the Funds purchased the securities to replace the borrowed securities that have been sold.
d) Federal Income Tax – The Funds have qualified and intend to continue to qualify as regulated investment companies and to comply with the applicable provisions of the Internal Revenue Code of 1986, as amended, and to distribute substantially all of their taxable income to their shareholders. Therefore, no federal income or excise tax provisions are required.
As of and during the year ended June 30, 2024, the Funds did not have a liability for any unrecognized tax expense. The Funds recognize interest and penalties, if any, related to unrecognized tax expense as income tax expense in the Statements of Operations. As of June 30, 2024, the Funds did not incur any interest or penalties. The Trust’s officers have analyzed the Funds’ tax positions and has concluded that no liability for unrecognized tax benefits should be recorded related to uncertain tax positions taken on returns filed for open tax years ended June 30, 2021, to June 30, 2023, or expected to be taken in the Funds’ June 30, 2024, year-end tax return.
e) Distributions to Shareholders – Distributions to shareholders, which are determined in accordance with income tax regulations and may differ from GAAP, are recorded on the ex-dividend date. Each Fund typically distributes substantially all of its net investment income in the form of dividends, interest and taxable capital gains to its shareholders. These distributions are automatically reinvested in the Fund unless you request cash distributions on your application or through a written request to the Fund. Each Fund expects that its distributions will consist of both capital gains, interest and dividend income. Each Fund may make distributions of its net realized capital gains (after any reductions for capital loss carry forwards) annually except for the Balanced Fund which is monthly. The Funds intend to make quarterly distributions if applicable.
f) Multiple Class Allocations – Income, non-class specific expenses and realized/unrealized gains or losses are allocated to each class based on relative net assets. Distribution fees are charged to each respective share class in accordance with the distribution plan. Expenses of the Trust that are directly identifiable to a specific fund are charged to that fund. Expenses which are not readily identifiable to a specific fund, are allocated in such a manner as deemed equitable, taking into consideration the nature and type of expense and the relative sizes of the funds in the Trust.
g) Security Transactions and Investment Income – Investment and shareholder transactions are recorded on the trade date. The Funds determine the gain or loss realized from the investment transactions by comparing the specific identified cost of the security lot sold with the net sales proceeds. Dividend income is recognized on the ex-dividend date or as soon as information is available to the Funds and interest income is recognized on an accrual basis. Discounts and premiums on debt securities are amortized over their respective lives using the effective interest method, except certain callable debt securities that are held at premium and will be amortized to the earliest call date. Withholding taxes on foreign dividends have been provided for in accordance with the Funds’ understanding of the applicable country’s tax rules and rates. Distributions received from a Fund’s investments in MLPs generally are comprised of income and return of capital. The Funds record these distributions as investment income and subsequently adjusts these distributions within the components of net assets based upon their tax treatment when the information becomes available. Distribution from REITs are initially recorded as dividend income and, to the extent such represent a return of capital or capital gain for tax purposes, are reclassified when such information becomes available.
h) Use of Estimates – The preparation of financial statements in conformity with GAAP requires management to make estimates and assumptions that affect the reported amounts of assets and liabilities and disclosure of contingent assets and liabilities at the date of the financial statements and the reported amounts of revenues and expenses during the reporting period. Actual results could differ from those estimates.
i) Indemnification – The Trust indemnifies its officers and Trustees for certain liabilities that may arise from the performance of their duties to the Trust. In the normal course of business, the Trust may enter into contracts that contain a variety of representations and warranties and provide general indemnifications. The Funds’ maximum exposure under these arrangements is dependent on future claims that may be made against the Funds and, therefore, cannot be estimated; however, management considers the risk of loss from such claims to be remote.
| Eventide Funds |
| NOTES TO FINANCIAL STATEMENTS (Continued) |
| June 30, 2024 |
j) Redemption Fees and Sales Charges (loads) – A $15 fee may be charged for redemptions made by wire. A maximum sales charge of 5.75% is imposed on Class A shares of the Funds. The maximum deferred sales charge of 1.00% on Class A shares applies only to purchases of $1 million or more made without an initial sales charge and applies to shares sold within 18 months of purchase. The maximum deferred sales charge of 1.00% on Class C shares applies to shares sold within 12 months of purchase. The respective shareholders pay such CDSC charges, which are not an expense of the Funds. For the year ended June 30, 2024, there were the following redemption fees paid to the Funds and CDSC fees paid to the distributor:
| | | | | | CDSC Fees | |
| Fund | | Redemption Fees | | | Class A | | | Class C | |
| Eventide Balanced Fund | | $ | — | | | $ | — | | | $ | 200 | |
| Eventide Core Bond Fund | | | — | | | | — | | | | 30 | |
| Eventide Dividend Opportunities Fund | | | — | | | | — | | | | 4,167 | |
| Eventide Exponential Technologies Fund | | | — | | | | — | | | | 29 | |
| Eventide Gilead Fund | | | — | | | | 1,415 | | | | 2,066 | |
| Eventide Healthcare & Life Sciences Fund | | | — | | | | — | | | | 471 | |
| Eventide Large Cap Focus Fund | | | — | | | | — | | | | 8 | |
| Eventide Limited-Term Bond Fund | | | — | | | | — | | | | 131 | |
k) Cash and cash equivalents – Cash and cash equivalents are held with a financial institution. Cash and cash equivalents of the Funds may be placed in deposit accounts at U.S. banks and such deposits generally exceed Federal Deposit Insurance Corporation (“FDIC”) insurance limits. The FDIC insures deposit accounts up to $250,000 for each accountholder. The counterparty is generally a single bank rather than a group of financial institutions; thus there may be a greater counterparty credit risk. The Funds place deposits only with those counterparties which are believed to be creditworthy and there has been no history of loss.
| (2) | INVESTMENT TRANSACTIONS |
For the year ended June 30, 2024, aggregate purchases and proceeds from sales of investment securities (excluding short-term investments) for the Funds were as follows:
| Eventide Balanced Fund | | | | |
| | | | | |
| Purchases | | | Sales | |
| $ | 173,752,372 | | | $ | 162,512,863 | |
| | | | | | | |
| Eventide Core Bond Fund | | | | |
| | | | | |
| Purchases | | | Sales | |
| $ | 97,392,549 | | | $ | 39,231,139 | |
| | | | | | | |
| Eventide Dividend Opportunities Fund | | | | |
| | | | | |
| Purchases | | | Sales | |
| $ | 426,298,730 | | | $ | 258,647,533 | |
| | | | | | | |
| Eventide Exponential Technologies Fund | | | | |
| | | | | |
| Purchases | | | Sales | |
| $ | 82,067,200 | | | $ | 83,931,002 | |
| | | | | | | |
| Eventide Gilead Fund | | | | |
| | | | | |
| Purchases | | | Sales | |
| $ | 1,282,739,032 | | | $ | 1,582,936,830 | |
| Eventide Funds |
| NOTES TO FINANCIAL STATEMENTS (Continued) |
| June 30, 2024 |
| Eventide Healthcare & Life Sciences Fund | | | | |
| | | | | |
| Purchases | | | Sales | |
| $ | 1,138,494,960 | | | $ | 1,265,849,410 | |
| | | | | | | |
| Eventide Large Cap Focus Fund | | | | |
| | | | | |
| Purchases | | | Sales | |
| $ | 123,965,482 | | | $ | 43,633,846 | |
| | | | | | | |
| Eventide Limited-Term Bond Fund | | | | |
| | | | | |
| Purchases | | | Sales | |
| $ | 59,283,909 | | | $ | 45,464,348 | |
| (3) | INVESTMENT ADVISORY AGREEMENT AND TRANSACTIONS WITH RELATED PARTIES |
Eventide Asset Management, LLC acts as investment manager to the Funds pursuant to the terms of an investment advisory agreement between the Advisor and the Trust (the “Advisory Agreement”). Boyd Watterson Asset Management, LLC serves as sub-adviser to the Eventide Limited-Term Bond Fund, the Eventide Core Bond Fund, and a portion of the Eventide Balanced Fund’s portfolio. Under the terms of the Advisory Agreement, the Advisor manages the investment operations of the Funds in accordance with the Funds’ investment policies and restrictions. The Advisor provides the Funds with investment advice and supervision and furnishes an investment program for the Funds. The fees paid by the Funds to the Advisor are described in greater detail below. The Advisor pays expenses incurred by it in connection with acting as investment manager to the Funds other than costs (including taxes and brokerage commissions, borrowing costs, costs of investing in underlying funds and extraordinary expenses, if any) of securities purchased for the Funds and certain other expenses paid by the Funds (as detailed in the Advisory Agreement). The Advisor pays for all employees, office space and facilities required by it to provide services under the Advisory Agreement, with the exception of specific items of expense (as detailed in the Advisory Agreement). For the year ended June 30, 2024, advisory fees of $2,076,679, $357,352, $4,974,202, $1,314,480, $35,349,592, $17,506,668, $319,467 and $422,673 were incurred by the Eventide Balanced Fund, Eventide Core Bond Fund, Eventide Dividend Opportunities Fund, Eventide Exponential Technologies Fund, Eventide Gilead Fund, Eventide Healthcare & Life Sciences Fund, Eventide Large Cap Focus Fund and Eventide Limited-Term Bond Fund, respectively, before the waivers and reimbursements described below.
Each Fund is authorized to pay the Advisor an annual fee based on its average daily net assets. The advisory fee is paid monthly. The Advisor has contractually agreed to waive fees and/or reimburse expenses, but only to the extent necessary to maintain each Fund’s total annual operating expenses (excluding front-end or contingent deferred loads, taxes, leverage interest, brokerage commissions, expenses incurred in connection with any merger or reorganization, dividend expenses on securities sold short, underlying fund fees and expenses or extraordinary expenses such as litigation) at a certain level through October 31, 2024. This agreement may be terminated by the Board only on 60 days’ written notice to the Advisor and upon the termination of the Advisory Agreement between the Trust and the Advisor. Fee waivers and expense reimbursements are subject to possible recoupment by the Advisor from the Funds in future years on a rolling three-year basis (within the three years after the fees have been waived or reimbursed) if, after the recoupment is taken into account, such recoupment can be achieved within the lesser of the expense limitation in place at the time of waiver/reimbursement and the expense limitation in place at the time of recapture. Each waiver or reimbursement by the Advisor is subject to repayment by the Fund within the three years following the year in which that particular expense is incurred, if the Fund is able to make the repayment without exceeding the expense limitation in effect at that time and the repayment is approved by the Board.
| Eventide Funds |
| NOTES TO FINANCIAL STATEMENTS (Continued) |
| June 30, 2024 |
The following table lists the contractual advisory fee and the expense limitation for each Fund.
| Fund | | Contractual Advisory Fee | | Expense Limitation |
| Eventide Balanced Fund | | 0.60% | | Class N: | | 1.02% |
| | | | | Class A: | | 1.07% |
| | | | | Class C: | | 1.82% |
| | | | | Class I: | | 0.82% |
| | | | | | | |
| Eventide Core Bond Fund | | 0.34% * | | Class N: | | 0.78% |
| | | | | Class A: | | 0.83% |
| | | | | Class C: | | 1.58% |
| | | | | Class I: | | 0.58% |
| | | | | | | |
| Eventide Dividend Opportunities Fund | | 0.73% | | Class N: | | 1.15% |
| | | | | Class A: | | 1.20% |
| | | | | Class C: | | 1.95% |
| | | | | Class I: | | 0.95% |
| | | | | | | |
| Eventide Exponential Technologies Fund | | 1.10% | | Class N: | | 1.63% |
| | | | | Class A: | | 1.68% |
| | | | | Class C: | | 2.43% |
| | | | | Class I: | | 1.43% |
| | | | | | | |
| Eventide Gilead Fund | | 1.00% of the first $2 billion; | | Class N: | | 1.62% |
| | | 0.95% on the next $1 billion; | | Class A: | | 1.67% |
| | | 0.90% on the next $1 billion; | | Class C: | | 2.42% |
| | | and 0.85% thereafter | | Class I: | | 1.42% |
| | | | | | | |
| Eventide Healthcare & Life Sciences Fund | | 1.10% | | Class N: | | 1.63% |
| | | | | Class A: | | 1.68% |
| | | | | Class C: | | 2.43% |
| | | | | Class I: | | 1.43% |
| | | | | | | |
| | | | | | | |
| Eventide Large Cap Focus Fund | | 0.73% | | Class N: | | 1.14% |
| | | | | Class A: | | 1.19% |
| | | | | Class C: | | 1.94% |
| | | | | Class I: | | 0.94% |
| | | | | | | |
| Eventide Limited-Term Bond Fund | | 0.31% * | | Class N: | | 0.75% |
| | | | | Class A: | | 0.80% |
| | | | | Class C: | | 1.55% |
| | | | | Class I: | | 0.55% |
| * | Effective May 31, 2023, the contractual advisory fees of Eventide Core Bond Fund and Eventide Limited-Term Bond Fund were reduced from 0.36% to 0.34% and 0.33% to 0.31%, respectively. |
| Eventide Funds |
| NOTES TO FINANCIAL STATEMENTS (Continued) |
| June 30, 2024 |
For the year ended June 30, 2024, the Manager waived no advisory fees from Eventide Gilead Fund and Eventide Healthcare & Life Sciences Fund and waived fees of $236,729, $131,361, $97,498, $68,862, $101,331 and $202,441 from the Eventide Balanced Fund, Eventide Core Bond Fund, Eventide Dividend Opportunities Fund, Exponential Technologies Fund, Eventide Large Cap Focus Fund and Eventide Limited-Term Bond Fund, respectively. As of June 30, 2024, the Advisor has waived/reimbursed expenses that may be recovered no later than June 30 of the years indicated below:
| | | 2025 | | | 2026 | | | 2027 | |
| Eventide Balanced Fund | | $ | — | | | $ | 276,044 | | | $ | 236,729 | |
| Eventide Core Bond Fund | | | 201,020 | | | | 164,775 | | | | 131,361 | |
| Eventide Dividend Opportunities Fund | | | — | | | | 391,061 | | | | 97,498 | |
| Eventide Exponential Technologies Fund | | | — | | | | 69,721 | | | | 68,862 | |
| Eventide Large Cap Focus Fund | | | — | | | | 107,732 | | | | 101,331 | |
| Eventide Limited-Term Bond Fund | | | 165,476 | | | | 243,710 | | | | 202,441 | |
The Eventide Gilead Fund and Eventide Healthcare & Life Sciences Fund do not have any expenses previously waived by the Advisor that are subject to recapture and did not waive any further expenses during the year ended June 30, 2024.
Pursuant to the Management Services Agreement between the Trust and MFund Services, LLC (“MFund”), MFund provides the Funds with management and legal administrative services (the “Management Services Agreement”). For these services, the Funds pay MFund an annual asset-based fee in accordance with the following schedule applied at the Fund family level (i.e., all the Funds in the Trust advised by the Advisor): 0.10% of net assets up to $50 million; 0.07% of net assets from $50 million to $100 million; 0.05% of net assets from $100 million to $250 million; 0.04% of net assets from $250 million to $500 million; 0.03% of net assets from $500 million to $1 billion; 0.02% of net assets from $1 billion to $5 billion; and 0.01% of assets from $5 billion and above. In addition, the Funds reimburse MFund for any reasonable out-of-pocket expenses incurred in the performance of its duties under the Management Services Agreement. The amounts due to MFund for the Management Services Agreement are listed in the Statements of Assets and Liabilities under “Payable to related parties” and the amounts accrued for the year are shown in the Statements of Operations under “Legal administration fees/Management service fees.”
Pursuant to the Compliance Services Agreement, MFund provides chief compliance officer services to the Funds. For these services, the Funds pay MFund $1,200 per month for the first fund in the fund family and $400 each additional fund; $400 for each adviser and sub-adviser; and ..0025% of the assets of each Fund. In addition, the Funds reimburse MFund for any reasonable out-of-pocket expenses incurred in the performance of its duties under the Compliance Services Agreement.
There are no amounts due to MFund for chief compliance officer services as of June 30, 2024 and the amounts accrued for the year are shown in the Statements of Operations under “Compliance officer fees.”
A trustee of the Trust is also the controlling member of MFund and the investment advisers to other series of the Trust and is not paid any fees directly by the Trust for serving in such capacities. Trustees who are not “interested persons” as that term is defined in the 1940 Act, are paid a quarterly retainer and receive compensation for each special Board meeting and Risk and Compliance Committee meeting attended. The fees paid to the Independent Trustees for attendance at a meeting will be shared equally by the funds of the Trust in which the meeting relates. The Lead Independent Trustee of the Trust, the Chairman of the Trust’s Audit Committee and the Chairman of the Risk and Compliance Committee receive an additional quarterly retainer. The “interested persons” of the Trust receive no compensation from the Funds. The Trust reimburses each Trustee and Officer for his or her travel and other expenses related to attendance at such meetings.
Ultimus Fund Solutions, LLC (“UFS”), an affiliate of the distributor, provides administrative, fund accounting, and transfer agency services to the Funds pursuant to agreements with the Trust, for which it receives from each Fund: (i) basis points in decreasing amounts as assets reach certain breakpoints; and (ii) any related out-of-pocket expenses.
Blu Giant, LLC (“Blu Giant” ), an affiliate of UFS and the distributor, provides EDGAR conversion and filing services as well as print management services for the Funds on an ad-hoc basis. For the provision of these services, Blu Giant receives customary fees from the Funds.
The Trust’s officers are not paid any fees directly by the Trust for serving in such capacity except for the chief compliance officer.
| Eventide Funds |
| NOTES TO FINANCIAL STATEMENTS (Continued) |
| June 30, 2024 |
The Trust has adopted a Master Distribution Plan Pursuant to Rule 12b-1 (the “Plan”) under the 1940 Act for each class of shares except Class I, that allows the Funds to pay distribution and shareholder servicing expenses of up to 0.25% per annum for the Class N shares, up to 0.50% per annum for the Class A shares and up to 1.00% for the Class C shares based on average daily net assets of each class. The Class N shares are currently paying 0.20% per annum of 12b-1 fees, Class A shares are currently paying 0.25% per annum of 12b-1 fees and Class C shares are currently paying 1.00% per annum of 12b-1 fees.
The 12b-1 fees may be used for a variety of purposes, including compensating dealers and other financial service organizations for eligible services provided by those parties to the Funds and their shareholders and to reimburse Northern Lights Distributors, LLC (the “Distributor”) and the Manager for distribution related expenses.
For the year ended June 30, 2024, the Distributor received $43,616, $1,911, $53,742, $11,798, $125,122, $50,717, $6,656 and $2,416 in underwriter commissions from the sale of Class A shares of the Eventide Balanced Fund, Eventide Core Bond Fund, Eventide Dividend Opportunities Fund, Eventide Exponential Technologies Fund, Eventide Gilead Fund, Eventide Healthcare & Life Sciences Fund, Eventide Large Cap Focus Fund and Eventide Limited-Term Bond Fund, respectively.
| (4) | DISTRIBUTIONS TO SHAREHOLDERS AND TAX COMPONENTS OF CAPITAL |
The following table represents aggregate cost for federal tax purposes, including options written, for the Funds as of June 30, 2024 and differs from market value by net unrealized appreciation/depreciation which consisted of:
| | | Cost for | | | | | | | | | Tax Net | |
| | | Federal Tax | | | Unrealized | | | Unrealized | | | Unrealized | |
| Fund | | purposes | | | Appreciation | | | Depreciation | | | App/Dep | |
| Eventide Balanced Fund | | $ | 330,964,579 | | | $ | 55,495,744 | | | $ | (13,471,845 | ) | | $ | 42,023,899 | |
| Eventide Core Bond Fund | | | 139,317,627 | | | | 368,275 | | | | (6,146,050 | ) | | | (5,777,775 | ) |
| Eventide Dividend Opportunities Fund | | | 674,720,709 | | | | 187,409,140 | | | | (12,647,085 | ) | | | 174,762,055 | |
| Eventide Exponential Technologies Fund | | | 84,437,961 | | | | 34,142,335 | | | | (8,472,672 | ) | | | 25,669,663 | |
| Eventide Gilead Fund | | | 2,165,398,812 | | | | 1,418,361,141 | | | | (239,363,587 | ) | | | 1,178,997,554 | |
| Eventide Healthcare & Life Sciences Fund | | | 1,339,550,210 | | | | 293,302,143 | | | | (240,634,604 | ) | | | 52,667,539 | |
| Eventide Large Cap Focus Fund | | | 95,561,821 | | | | 9,583,156 | | | | (2,352,126 | ) | | | 7,231,030 | |
| Eventide Limited-Term Bond Fund | | | 144,701,807 | | | | 273,054 | | | | (3,086,901 | ) | | | (2,813,847 | ) |
| Eventide Funds |
| NOTES TO FINANCIAL STATEMENTS (Continued) |
| June 30, 2024 |
The tax character of fund distributions for the years ended June 30, 2024, and June 30, 2023, was as follows:
| For the year ended June 30, 2024: |
| |
| | | Ordinary | | | Long-Term | | | Return of | | | | |
| Fund | | Income | | | Capital Gains | | | Capital | | | Total | |
| Eventide Balanced Fund | | $ | 5,888,612 | | | $ | — | | | $ | — | | | $ | 5,888,612 | |
| Eventide Core Bond Fund | | | 3,769,367 | | | | — | | | | — | | | | 3,769,367 | |
| Eventide Dividend Opportunities Fund | | | 3,699,013 | | | | — | | | | — | | | | 3,699,013 | |
| Eventide Limited-Term Bond Fund | | | 4,104,125 | | | | — | | | | — | | | | 4,104,125 | |
| | | | | | | | | | | | | | | | | |
| For the year ended June 30, 2023: |
| |
| | | Ordinary | | | Long-Term | | | Return of | | | | |
| Fund | | Income | | | Capital Gains | | | Capital | | | Total | |
| Eventide Balanced Fund | | $ | 4,832,162 | | | $ | 3,689,551 | | | $ | 1,039,779 | | | $ | 9,561,492 | |
| Eventide Core Bond Fund | | | 1,536,982 | | | | — | | | | — | | | | 1,536,982 | |
| Eventide Dividend Opportunities Fund | | | 3,346,718 | | | | 3,513,286 | | | | 1,113,976 | | | | 7,973,980 | |
| Eventide Gilead Fund | | | — | | | | 172,246,986 | | | | — | | | | 172,246,986 | |
| Eventide Large Cap Focus Fund | | | 4,107 | | | | — | | | | 5,791 | | | | 9,898 | |
| Eventide Limited-Term Bond Fund | | | 2,675,469 | | | | — | | | | 42,422 | | | | 2,717,891 | |
As of June 30, 2024, the components of accumulated earnings/(losses) on a tax basis were as follows:
| | | Undistributed | | | Undistributed | | | Post October Loss | | | Capital Loss | | | Other | | | Unrealized | | | Total | |
| | | Ordinary | | | Long-Term | | | and | | | Carry | | | Book/Tax | | | Appreciation/ | | | Accumulated | |
| Fund | | Income | | | Capital Gains | | | Late Year Loss | | | Forwards | | | Differences | | | (Depreciation) | | | Earnings/(Losses) | |
| Eventide Balanced Fund | | $ | — | | | $ | — | | | $ | — | | | $ | (10,658,695 | ) | | $ | — | | | $ | 42,023,899 | | | $ | 31,365,204 | |
| Eventide Core Bond Fund | | | 134,336 | | | | — | | | | (1,684,290 | ) | | | (12,068,354 | ) | | | — | | | | (5,777,775 | ) | | | (19,396,083 | ) |
| Eventide Dividend Opportunities Fund | | | — | | | | — | | | | — | | | | (29,963,628 | ) | | | — | | | | 174,762,055 | | | | 144,798,427 | |
| Eventide Exponential Technologies Fund | | | — | | | | — | | | | (4,059,785 | ) | | | (54,162,724 | ) | | | — | | | | 25,669,663 | | | | (32,552,846 | ) |
| Eventide Gilead Fund | | | — | | | | — | | | | (26,704,302 | ) | | | (37,418,371 | ) | | | — | | | | 1,178,997,554 | | | | 1,114,874,881 | |
| Eventide Healthcare & Life Sciences Fund | | | — | | | | — | | | | (6,684,024 | ) | | | (27,962,098 | ) | | | — | | | | 52,667,539 | | | | 18,021,417 | |
| Eventide Large Cap Focus Fund | | | 1,254,858 | | | | 2,379,611 | | | | — | | | | — | | | | — | | | | 7,231,030 | | | | 10,865,499 | |
| Eventide Limited-Term Bond Fund | | | 42,977 | | | | — | | | | (739,165 | ) | | | (7,823,197 | ) | | | — | | | | (2,813,847 | ) | | | (11,333,232 | ) |
The difference between book basis and tax basis undistributed net investment income/(loss), accumulated net realized gain/(loss), and unrealized appreciation/(depreciation) from investments is primarily attributable to the tax deferral of losses on wash sales, mark-to-market on passive foreign investment companies and adjustments for C-Corporation return of capital.
Late year losses incurred after December 31 within the fiscal year are deemed to arise on the first business day of the following fiscal year for tax purposes. The Funds incurred and elected to defer such late year losses as follows:
| | | Late Year | |
| Fund | | Losses | |
| Eventide Exponential Technologies Fund | | $ | 765,745 | |
| Eventide Gilead Fund | | | 13,609,786 | |
| Eventide Healthcare & Life Sciences Fund | | | 6,684,024 | |
| Eventide Funds |
| NOTES TO FINANCIAL STATEMENTS (Continued) |
| June 30, 2024 |
Capital losses incurred after October 31 within the fiscal year are deemed to arise on the first business day of the following fiscal year for tax purposes. The Funds incurred and elected to defer such capital losses as follows:
| | | Post October | |
| Fund | | Losses | |
| Eventide Core Bond Fund | | $ | 1,684,290 | |
| Eventide Exponential Technologies Fund | | | 3,294,040 | |
| Eventide Gilead Fund | | | 13,094,516 | |
| Eventide Limited-Term Bond Fund | | | 739,165 | |
At June 30, 2024, the Funds had capital loss carry forwards for federal income tax purposes available to offset future capital gains and utilized prior year capital loss carry forwards, as follows:
| | | Non-Expiring | | | | | | | |
| | | | | | | | | | | | CLCF | |
| Fund | | Short-Term | | | Long-Term | | | Total | | | Utilized | |
| Eventide Balanced Fund | | $ | 6,503,285 | | | $ | 4,155,410 | | | $ | 10,658,695 | | | $ | — | |
| Eventide Core Bond Fund | | | 4,065,397 | | | | 8,002,957 | | | | 12,068,354 | | | | — | |
| Eventide Dividend Opportunities Fund | | | 23,505,416 | | | | 6,458,212 | | | | 29,963,628 | | | | — | |
| Eventide Exponential Technologies Fund | | | 34,530,996 | | | | 19,631,728 | | | | 54,162,724 | | | | — | |
| Eventide Gilead Fund | | | 37,418,371 | | | | — | | | | 37,418,371 | | | | — | |
| Eventide Healthcare & Life Sciences Fund | | | 27,962,098 | | | | — | | | | 27,962,098 | | | | 26,883,914 | |
| Eventide Large Cap Focus Fund | | | — | | | | — | | | | — | | | | 8,133 | |
| Eventide Limited-Term Bond Fund | | | 1,876,557 | | | | 5,946,640 | | | | 7,823,197 | | | | — | |
During the fiscal year ended June 30, 2024, the Eventide Large Cap Focus Fund utilized tax equalization which is the use of earnings and profits distributions to shareholders on redemption of shares as part of the dividends paid deduction for income tax purposes. Permanent book and tax differences, primarily attributable to the book/tax basis treatment of net operating losses, distributions in excess, and use of tax equalization credits, resulted in reclassifications for the Funds for the fiscal year ended June 30, 2024, as follows:
| | | Paid | | | | |
| | | In | | | Accumulated | |
| Fund | | Capital | | | Earnings (Losses) | |
| Eventide Balanced Fund | | $ | (132,077 | ) | | $ | 132,077 | |
| Eventide Dividend Opportunities Fund | | | (5,622 | ) | | | 5,622 | |
| Eventide Exponential Technologies Fund | | | (1,216,276 | ) | | | 1,216,276 | |
| Eventide Gilead Fund | | | (25,143,436 | ) | | | 25,143,436 | |
| Eventide Healthcare & Life Sciences Fund | | | (17,141,800 | ) | | | 17,141,800 | |
| Eventide Large Cap Focus Fund | | | 354,593 | | | | (354,593 | ) |
| Eventide Funds |
| NOTES TO FINANCIAL STATEMENTS (Continued) |
| June 30, 2024 |
| (5) | INVESTMENTS IN AFFILIATED COMPANIES |
An affiliated company is a company in which the Fund has ownership of at least 5% of the voting securities. Companies which are affiliates of the Eventide Gilead Fund and Eventide Healthcare & Life Sciences Fund at June 30, 2024 are noted in the Funds’ Schedule of Investments. Transactions during the year with companies which are affiliates are as follows:
Eventide Gilead Fund
| | | | | | | | | | | | | | | | | | | | | Net Increase/ | | | | | | | | | | |
| | | | | | Share Balance | | | | | | | | | | | | Dividends | | | Decrease in | | | | | | | | | Share Balance | |
| | | Market Value at | | | at June 30, | | | | | | | | | Corporate | | | Credited to | | | Appreciation | | | Realized Gains | | | Market Value at | | | at June 30, | |
| Description | | June 30, 2023 | | | 2023 | | | Purchases | | | Sales Proceeds | | | Actions | | | Income | | | (Depreciation) | | | (Losses) | | | June 30, 2024 | | | 2024 | |
| Beta Bionics, Inc. Series B | | $ | 10,046,265 | | | | 139,527 | | | $ | — | | | $ | — | | | $ | — | | | $ | — | | | $ | 4,026,016 | | | $ | — | | | $ | 14,072,281 | | | | 1,881,321 | |
| Beta Bionics, Inc. Series B2 | | | 3,613,527 | | | | 48,872 | | | | — | | | | — | | | | — | | | | — | | | | 1,450,730 | | | | — | | | | 5,064,257 | | | | 665,474 | |
| Beta Bionics, Inc. Series C | | | 4,993,786 | | | | 71,900 | | | | — | | | | — | | | | — | | | | — | | | | 2,140,199 | | | | — | | | | 7,133,985 | | | | 964,052 | |
| Beta Bionics, Inc. Series D | | | — | | | | — | | | | 6,000,002 | | | | — | | | | — | | | | — | | | | 621,429 | | | | — | | | | 6,621,431 | | | | 714,286 | |
| Beta Bionics, Inc. Series C Warrants | | | 1,274,958 | | | | 17,975 | | | | — | | | | — | | | | — | | | | — | | | | 508,538 | | | | — | | | | 1,783,496 | | | | 241,013 | |
| Beta Bionics, Inc. Series D Warrants | | | — | | | | — | | | | — | | | | — | | | | — | | | | — | | | | 3,350,000 | | | | — | | | | 3,350,000 | | | | 500,000 | |
| Mirum Pharmaceuticals, Inc. PIPE | | | — | | | | — | | | | 6,000,015 | | | | — | | | | — | | | | — | | | | 1,814,862 | | | | — | | | | 7,814,877 | | | | 228,572 | |
| Xometry, Inc. 1 | | | 62,908,624 | | | | 2,970,190 | | | | 55,046,876 | | | | (19,636,919 | ) | | | — | | | | — | | | | (9,965,297 | ) | | | (23,986,094 | ) | | | 64,367,190 | | | | 5,568,096 | |
| Zentalis Pharmaceuticals, Inc. 1 | | | 81,161,129 | | | | 2,877,034 | | | | 31,299,055 | | | | (6,341,347 | ) | | | — | | | | — | | | | (59,927,412 | ) | | | (31,531,601 | ) | | | 14,659,824 | | | | 3,584,309 | |
| Total | | $ | 163,998,289 | | | | 6,125,498 | | | $ | 98,345,948 | | | $ | (25,978,266 | ) | | $ | — | | | $ | — | | | $ | (55,980,935 | ) | | $ | (55,517,695 | ) | | $ | 124,867,341 | | | | 14,347,123 | |
| 1. | Not affiliated June 30, 2023. |
| Eventide Funds |
| NOTES TO FINANCIAL STATEMENTS (Continued) |
| June 30, 2024 |
Eventide Healthcare & Life Sciences Fund
| | | | | | | | | | | | | | | | | | | | | Net Increase/ | | | | | | | | | | |
| | | | | | Share Balance | | | | | | | | | | | | Dividends | | | Decrease in | | | | | | | | | Share Balance | |
| | | Market Value at | | | at June 30, | | | | | | | | | Corporate | | | Credited | | | Appreciation | | | Realized Gains | | | Market Value at | | | at June 30, | |
| Description | | June 30, 2023 | | | 2023 | | | Purchases | | | Sales Proceeds | | | Actions | | | to Income | | | (Depreciation) | | | (Losses) | | | June 30, 2024 | | | 2024 | |
| Aura Biosciences, Inc. | | $ | 36,253,660 | | | | 2,935,519 | | | $ | 25,888,469 | | | $ | — | | | $ | — | | | $ | — | | | $ | (18,273,853 | ) | | $ | — | | | $ | 43,868,276 | | | | 5,802,682 | |
| Inozyme Pharma, Inc. | | | — | | | | — | | | | 18,423,540 | | | | — | | | | — | | | | — | | | | (867,999 | ) | | | — | | | | 17,555,541 | | | | 3,936,220 | |
| Beta Bionics, Inc. Series B 1 | | | 5,023,096 | | | | 69,763 | | | | — | | | | — | | | | — | | | | — | | | | 2,013,050 | | | | (10 | ) | | | 7,036,136 | | | | 940,660 | |
| Beta Bionics, Inc. Series B2 1 | | | 4,394,836 | | | | 59,439 | | | | — | | | | — | | | | — | | | | — | | | | 1,764,400 | | | | (6 | ) | | | 6,159,230 | | | | 809,360 | |
| Beta Bionics, Inc. Series C 1 | | | 2,496,893 | | | | 35,950 | | | | — | | | | — | | | | — | | | | — | | | | 1,070,099 | | | | — | | | | 3,566,992 | | | | 482,026 | |
| Beta Bionics, Inc. Series D 1 | | | — | | | | — | | | | 3,999,996 | | | | — | | | | — | | | | — | | | | 414,285 | | | | — | | | | 4,414,281 | | | | 476,190 | |
| Beta Bionics, Inc. Series C Warrant 1 | | | 637,443 | | | | 8,987 | | | | — | | | | — | | | | — | | | | — | | | | 254,257 | | | | — | | | | 891,700 | | | | 120,500 | |
| Beta Bionics, Inc. Series D Warrants | | | — | | | | — | | | | — | | | | — | | | | — | | | | — | | | | 2,233,331 | | | | — | | | | 2,233,331 | | | | 333,333 | |
| Casma Therapeutics, Inc. Series B1 | | | 2,185,000 | | | | 5,000,000 | | | | — | | | | — | | | | — | | | | — | | | | (1,138,500 | ) | | | — | | | | 1,046,500 | | | | 5,000,000 | |
| Casma Therapeutics,Inc. Series B2 | | | 2,185,000 | | | | 5,000,000 | | | | — | | | | — | | | | — | | | | — | | | | (1,138,500 | ) | | | — | | | | 1,046,500 | | | | 5,000,000 | |
| Casma Therapeutics, Inc. Series C1 | | | 795,520 | | | | 1,820,413 | | | | — | | | | — | | | | — | | | | — | | | | (414,507 | ) | | | — | | | | 381,013 | | | | 1,820,413 | |
| Casma Therapeutics, Inc. Series C2 | | | 532,709 | | | | 1,219,013 | | | | 350,000 | | | | — | | | | — | | | | — | | | | (468,320 | ) | | | — | | | | 414,389 | | | | 1,979,882 | |
| Goldfinch Biopharma, Inc. Series A | | | — | | | | 5,000,000 | | | | — | | | | — | | | | — | | | | — | | | | — | | | | — | | | | — | | | | 5,000,000 | |
| Goldfinch Biopharma, Inc. Series B | | | — | | | | 8,474,576 | | | | — | | | | — | | | | — | | | | — | | | | — | | | | — | | | | — | | | | 8,474,576 | |
| Goldfinch Biopharma, Inc. Series B2 | | | — | | | | 4,237,288 | | | | — | | | | — | | | | — | | | | — | | | | — | | | | — | | | | — | | | | 4,237,288 | |
| Korro Bio, Inc. 2 | | | — | | | | — | | | | — | | | | (9,921,131 | ) | | | 29,999,999 | | | | — | | | | (8,074,844 | ) | | | 497,664 | | | | 12,501,688 | | | | 369,108 | |
| Lexeo Therapeutics, Inc. 2 | | | — | | | | — | | | | 4,999,996 | | | | — | | | | 14,999,999 | | | | — | | | | 657,055 | | | | — | | | | 20,657,050 | | | | 1,287,846 | |
| Lexeo Therapeutics, Inc. 2 | | | — | | | | — | | | | 23,108,959 | | | | — | | | | — | | | | — | | | | 10,275,109 | | | | — | | | | 33,384,068 | | | | 2,081,301 | |
| Mirum Pharmaceuticals, Inc.PIPE | | | — | | | | — | | | | 4,000,001 | | | | — | | | | — | | | | — | | | | 1,209,905 | | | | — | | | | 5,209,906 | | | | 152,381 | |
| Evida BioSciences,Inc. | | | 667,148 | | | | 1,017,770 | | | | — | | | | — | | | | — | | | | — | | | | 35,113 | | | | — | | | | 702,261 | | | | 1,017,770 | |
| Zentalis Pharmaceuticals, Inc. | | | 112,840,001 | | | | 4,000,000 | | | | 47,498,996 | | | | (7,422,726 | ) | | | — | | | | — | | | | (84,104,182 | ) | | | (48,572,335 | ) | | | 20,239,754 | | | | 4,948,595 | |
| TOTAL | | $ | 168,011,306 | | | | 38,878,718 | | | $ | 128,269,957 | | | $ | (17,343,857 | ) | | $ | 44,999,998 | | | $ | — | | | $ | (94,554,101 | ) | | $ | (48,074,687 | ) | | $ | 181,308,616 | | | | 54,270,131 | |
| Eventide Funds |
| NOTES TO FINANCIAL STATEMENTS (Continued) |
| June 30, 2024 |
Eventide Healthcare & Life Sciences Fund (Continued)
Investments no longer affiliated as of June 30, 2024
| | | | | | | | | | | | | | | | | | | | | Net Increase/ | | | | | | | | | | |
| | | | | | Share Balance | | | | | | | | | | | | Dividends | | | Decrease in | | | | | | | | | Share Balance | |
| | | Market Value at | | | at June 30, | | | | | | | | | Corporate | | | Credited to | | | Appreciation | | | Realized Gains | | | Market Value at | | | at June 30, | |
| Description | | June 30, 2023 | | | 2023 | | | Purchases | | | Sales Proceeds | | | Actions | | | Income | | | (Depreciation) | | | (Losses) | | | June 30, 2024 | | | 2024 | |
| Korro Bio, Inc. Series B1 2 | | $ | 10,118,775 | | | | 3,831,418 | | | $ | — | | | $ | — | | | $ | (10,000,001 | ) | | $ | — | | | $ | (118,774 | ) | | $ | — | | | $ | — | | | | — | |
| Korro Bio, Inc. Series B2 2 | | | 9,499,999 | | | | 3,597,122 | | | | — | | | | — | | | | (9,999,999 | ) | | | — | | | | 500,000 | | | | — | | | | — | | | | — | |
| LEXEO Therapeutics Series B 2 | | | 14,250,300 | | | | 8,718,446 | | | | — | | | | — | | | | (14,999,999 | ) | | | — | | | | 749,699 | | | | — | | | | — | | | | — | |
| Marinus Pharmaceuticals, Inc. | | | 34,460,919 | | | | 3,173,197 | | | | 10,013,184 | | | | (25,196,981 | ) | | | — | | | | — | | | | (19,385,992 | ) | | | 108,870 | | | | — | | | | — | |
| Mirum Pharmaceuticals, Inc. | | | 53,271,530 | | | | 2,059,201 | | | | 28,399,140 | | | | (43,165,596 | ) | | | — | | | | — | | | | 7,810,476 | | | | 11,288,240 | | | | 57,603,790 | | | | 1,684,814 | |
| Reneo Pharmaceuticals, Inc. | | | 11,480,000 | | | | 1,750,000 | | | | 3,422,079 | | | | (3,646,593 | ) | | | — | | | | — | | | | 2,520,000 | | | | (13,775,486 | ) | | | — | | | | — | |
| Total | | $ | 133,081,523 | | | | 23,129,384 | | | $ | 41,834,403 | | | $ | (72,009,170 | ) | | $ | (34,999,999 | ) | | $ | — | | | $ | (7,924,591 | ) | | $ | (2,378,376 | ) | | $ | 57,603,790 | | | | 1,684,814 | |
| | | $ | 301,092,829 | | | | 62,008,102 | | | $ | 170,104,360 | | | $ | (89,353,027 | ) | | $ | 9,999,999 | | | $ | — | | | $ | (102,478,692 | ) | | $ | (50,453,063 | ) | | $ | 238,912,406 | | | | 55,954,945 | |
| 1. | Not affiliated June 30, 2023. |
| (6) | INVESTMENT IN RESTRICTED SECURITIES |
Restricted securities include securities that have not been registered under the Securities Act of 1933, as amended, and securities that are subject to restrictions on resale. Each Fund may invest in restricted securities that are consistent with the Fund’s investment objectives and investment strategies. A Fund will not invest in a restricted security if, immediately after and as a result of the investment in such security, more than 15% of the Fund’s net assets would be invested in illiquid securities. In some cases, the issuer of restricted securities has agreed to register such securities for resale, at the issuer’s expense either upon demand by the Funds or in connection with another registered offering of the securities. Investments in restricted securities are valued at fair value as determined in good faith in accordance with procedures adopted by the Board. It is possible that the estimated value may differ significantly from the amount that might ultimately be realized in the near term, and the difference could be material.
As of June 30, 2024, the Eventide Balanced Fund, Eventide Dividend Opportunities Fund, Eventide Exponential Technologies Fund, Eventide Gilead Fund and Eventide Healthcare & Life Sciences Fund were invested in the following restricted securities:
Eventide Balanced Fund
| | | | Initial | | | | | | | | | | | | | |
| Security | | | Acquisition Date | | | Shares | | | Cost | | | Value | | | % of Net Assets | |
| Vision Fund International, 3.7250%, 2/24/25 | | | 2/25/2022 | | | | 3,800,000 | | | $ | 3,800,000 | | | $ | 3,739,496 | | | 1.0% | |
Eventide Dividend Opportunities Fund
| | | | Initial | | | | | | | | | | | | | |
| | | | Acquisition | | | | | | | | | | | | | |
| Security | | | Date | | | Shares | | | Cost | | | Value | | | % of Net Assets | |
| Vision Fund International, 5.2600%, 11/30/25 | | | 12/1/2023 | | | | 3,250,000 | | | $ | 3,250,000 | | | $ | 3,214,663 | | | 0.4% | |
| Eventide Funds |
| NOTES TO FINANCIAL STATEMENTS (Continued) |
| June 30, 2024 |
Eventide Exponential Technologies Fund
| | | | Initial | | | | | | | | | | | | | |
| | | | Acquisition | | | | | | | | | | | | | |
| Security | | | Date | | | Shares | | | Cost | | | Value | | | % of Net Assets | |
| Vision Fund International, 5.2600%, 11/30/25 | | | 12/1/2023 | | | | 750,000 | | | $ | 750,000 | | | $ | 741,845 | | | 0.6% | |
| | | | | | | | | | | | | | | | | | | | |
| Eventide Gilead Fund |
| |
| | | | Initial | | | | | | | | | | | | | |
| | | | Acquisition | | | | | | | | | | | | | |
| Security | | | Date | | | Shares | | | Cost | | | Value | | | % of Net Assets | |
| Beta Bionics, Inc. Series B | | | 8/31/2018 | | | | 1,881,321 | | | $ | 20,000,022 | | | $ | 14,072,281 | | | 0.4% | |
| Beta Bionics, Inc. Series B2 | | | 6/27/2019 | | | | 665,474 | | | | 7,399,998 | | | | 5,064,257 | | | 0.2% | |
| Beta Bionics, Inc. Series C | | | 2/16/2022 | | | | 964,052 | | | | 9,999,867 | | | | 7,133,985 | | | 0.2% | |
| Beta Bionics, Inc. Series D | | | 8/29/2023 | | | | 714,286 | | | | 6,000,002 | | | | 6,621,431 | | | 0.2% | |
| Beta Bionics, Inc. Series C Warrant | | | 2/16/2022 | | | | 241,013 | | | | — | | | | 1,783,496 | | | 0.1% | |
| Beta Bionics, Inc. Series D Warrant | | | 8/29/2023 | | | | 500,000 | | | | — | | | | 3,350,000 | | | 0.1% | |
| Hope Global International, 4.0000%, 01/07/28 | | | 12/28/2023 | | | | 2,000,000 | | | | 2,000,000 | | | | 1,868,542 | | | 0.1% | |
| Mirum Pharmaceuticals, Inc. PIPE | | | 7/18/2023 | | | | 228,572 | | | | 6,000,015 | | | | 7,814,877 | | | 0.2% | |
| Peloton Therapeutics, Inc. - CVR | | | 2/14/2019 | | | | 3,982,940 | | | | — | | | | 3,365,186 | | | 0.1% | |
| Vision Fund International, 3.1500%, 12/15/25 | | | 12/16/2021 | | | | 5,000,000 | | | | 5,000,000 | | | | 4,796,460 | | | 0.1% | |
| Vision Fund International, 3.2230%, 12/15/26 | | | 12/16/2021 | | | | 5,000,000 | | | | 5,000,000 | | | | 4,681,510 | | | 0.1% | |
| Vision Fund International, 4.7400%, 05/16/25 | | | 5/18/2022 | | | | 5,000,000 | | | | 5,000,000 | | | | 4,941,120 | | | 0.1% | |
| Vision Fund International, 5.9030%, 09/19/25 | | | 9/21/2022 | | | | 5,000,000 | | | | 5,000,000 | | | | 4,988,200 | | | 0.1% | |
| Vision Fund International, 5.2600%, 11/30/25 | | | 12/1/2023 | | | | 9,000,000 | | | | 9,000,000 | | | | 8,902,143 | | | 0.3% | |
| | | | | | | | | | | | | | | | | | | | |
| Eventide Healthcare & Life Sciences Fund |
| |
| | | | Initial | | | | | | | | | | | | | |
| | | | Acquisition | | | | | | | | | | | | | |
| Security | | | Date | | | Shares | | | Cost | | | Value | | | % of Net Assets | |
| Arch Oncology, Inc. Series C1 | | | 4/26/2021 | | | | 4,643,043 | | | $ | 5,952,381 | | | $ | 128,798 | | | 0.0% | |
| Avalyn Pharma Inc. Series C1 | | | 9/25/2023 | | | | 20,482,289 | | | | 15,000,000 | | | | 15,000,000 | | | 1.0% | |
| Beta Bionics, Inc. Series B | | | 8/31/2018 | | | | 940,660 | | | | 10,000,006 | | | | 7,036,136 | | | 0.5% | |
| Beta Bionics, Inc. Series B2 | | | 6/27/2019 | | | | 809,360 | | | | 8,999,994 | | | | 6,159,230 | | | 0.4% | |
| Beta Bionics, Inc. Series C | | | 2/16/2022 | | | | 482,026 | | | | 4,999,933 | | | | 3,566,992 | | | 0.3% | |
| Beta Bionics, Inc. Series D | | | 8/29/2023 | | | | 476,190 | | | | 3,999,996 | | | | 4,414,281 | | | 0.3% | |
| Beta Bionics, Inc. Series C Warrant | | | 2/16/2022 | | | | 120,500 | | | | — | | | | 891,700 | | | 0.1% | |
| Beta Bionics, Inc. Series D Warrant | | | 8/29/2023 | | | | 333,333 | | | | — | | | | 2,233,331 | | | 0.1% | |
| Eventide Funds |
| NOTES TO FINANCIAL STATEMENTS (Continued) |
| June 30, 2024 |
Eventide Healthcare & Life Sciences Fund (Continued)
| | | | Initial | | | | | | | | | | | | | |
| Security | | | Acquisition Date | | | Shares | | | Cost | | | Value | | | % of Net Assets | |
| BioSplice Therapeutics, Inc. Series B-1 | | | 3/5/2021 | | | | 295,276 | | | $ | 15,000,021 | | | $ | — | | | 0.0% | |
| BioSplice Therapeutics, Inc. Series C PIK, 10.5000%, 03/12/25 | | | 5/2/2023 | | | | 3,500,000 | | | | 3,500,000 | | | | 394,520 | | | 0.0% | |
| Biosplice Therapeutics, Inc. Series C Warrant | | | 5/2/2023 | | | | 103,150 | | | | — | | | | — | | | 0.0% | |
| Bridgebio Pharma, Inc. PIPE | | | 9/28/2023 | | | | 137,513 | | | | 3,749,979 | | | | 3,483,204 | | | 0.2% | |
| Casma Therapeutics, Inc. Series B1 | | | 8/26/2020 | | | | 5,000,000 | | | | 3,750,000 | | | | 1,046,500 | | | 0.1% | |
| Casma Therapeutics, Inc. Series B2 | | | 6/7/2021 | | | | 5,000,000 | | | | 3,750,000 | | | | 1,046,500 | | | 0.1% | |
| Casma Therapeutics, Inc. Series C1 | | | 7/6/2022 | | | | 1,820,413 | | | | 837,390 | | | | 381,013 | | | 0.0% | |
| Casma Therapeutics, Inc. Series C2 | | | 1/31/2023 | | | | 1,979,882 | | | | 910,746 | | | | 414,389 | | | 0.0% | |
| Flare Therapeutics, Inc. Series A | | | 4/22/2021 | | | | 1,097,561 | | | | 1,097,561 | | | | 1,320,366 | | | 0.1% | |
| Flare Therapeutics, Inc. Series A2 | | | 5/31/2022 | | | | 902,439 | | | | 902,439 | | | | 1,085,634 | | | 0.1% | |
| Flare Therapeutics, Inc. Series B | | | 2/1/2023 | | | | 1,952,962 | | | | 2,349,999 | | | | 2,349,413 | | | 0.2% | |
| Freenome Holdings, Inc. Series D | | | 11/22/2021 | | | | 930,436 | | | | 6,999,994 | | | | 1,526,101 | | | 0.1% | |
| Freenome Holdings, Inc. Series F | | | 1/26/2024 | | | | 133,941 | | | | 990,984 | | | | 219,690 | | | 0.0% | |
| Goldfinch Biopharma, Inc. Series A | | | 3/15/2019 | | | | 5,000,000 | | | | 5,000,000 | | | | — | | | 0.0% | |
| Goldfinch Biopharma, Inc. Series B | | | 6/29/2020 | | | | 8,474,576 | | | | 10,000,000 | | | | — | | | 0.0% | |
| Goldfinch Biopharma, Inc. Series B2 | | | 3/21/2022 | | | | 4,237,288 | | | | 5,000,000 | | | | — | | | 0.0% | |
| Kojin Therapeutics, Inc. Series A-1 | | | 6/2/2021 | | | | 763,319 | | | | 1,499,998 | | | | 467,228 | | | 0.0% | |
| Kojin Therapeutics, Inc. Series A-2 | | | 1/28/2022 | | | | 763,319 | | | | 1,499,998 | | | | 467,228 | | | 0.0% | |
| Korro Bio, Inc. | | | 11/27/2023 | | | | 369,108 | | | | 20,078,868 | | | | 12,501,688 | | | 0.9% | |
| Lexeo Therapeutics, Inc. | | | 11/27/2023 | | | | 1,287,846 | | | | 19,999,995 | | | | 20,657,050 | | | 1.4% | |
| Metagenomi, Inc. | | | 12/20/2022 | | | | 449,708 | | | | 9,390,942 | | | | 1,834,809 | | | 0.1% | |
| Mirum Pharmaceuticals, Inc. PIPE | | | 7/18/2023 | | | | 152,381 | | | | 4,000,001 | | | | 5,209,906 | | | 0.4% | |
| Peloton Therapeutics, Inc. - CVR | | | 2/14/2019 | | | | 1,528,871 | | | | — | | | | 1,291,743 | | | 0.1% | |
| Evida BioSciences, Inc. | | | 12/31/2020 | | | | 1,017,770 | | | | 702,262 | | | | 702,261 | | | 0.1% | |
| Shoreline Biosciences Series B | | | 10/28/2021 | | | | 1,489,958 | | | | 15,000,003 | | | | 12,673,435 | | | 0.9% | |
The Eventide Exponential Technologies Fund invests primarily in equity and equity-related securities of companies that the Adviser believes are participating in and benefitting from technologies, innovations, technology themes, or technology trends. The types of companies represented in the Fund’s portfolio include, but are not limited to, companies falling within the information technology, e-commerce discretionary, internet media and services, healthcare technology, healthcare devices, or transaction and payment processing services industries. Because of its focus on technology companies, the Eventide Exponential Technologies Fund’s investment performance will be closely tied to many factors which affect those companies. As a result, the Eventide Exponential Technologies Fund’s net asset value is more likely to have greater fluctuations than that of a fund which invests in other industries.
The Eventide Healthcare & Life Sciences Fund invests primarily in equity and equity-related securities of companies in the healthcare and life sciences sectors that derive or are expected to derive 50% or more of their revenue from healthcare and life science products and services including, but not limited to, biotechnology, pharmaceuticals, diagnostics, life science tools, medical devices, healthcare information technology, healthcare services, synthetic biology, agricultural and environmental management, and pharmaceutical manufacturing products and services. Because of its focus on healthcare and life science companies, the Eventide Healthcare & Life Sciences Fund’s investment performance will be closely tied to many factors which affect those companies. As a result, the Eventide Healthcare & Life Sciences Fund’s net asset value is more likely to have greater fluctuations than that of a fund which invests in other industries.
| Eventide Funds |
| NOTES TO FINANCIAL STATEMENTS (Continued) |
| June 30, 2024 |
There are risks associated with the sale and purchase of call and put options. The seller (writer) of a call option which is covered (e.g., the writer holds the underlying security) assumes the risk of a decline in the market price of an underlying security below the purchase price of an underlying security less the premium received, and gives up the opportunity for gain on the underlying security above the exercise price of the option. The seller of an uncovered call option assumes the risk of a theoretical unlimited increase in the market price of an underlying security above the exercise price of the option. The securities necessary to satisfy the exercise of the call option may be unavailable for purchase except at much higher prices. Purchasing securities to satisfy the exercise of the call option can itself cause the price of securities to rise further, sometimes by a significant amount, thereby exacerbating the loss. The buyer of a call option assumes the risk of losing its entire premium invested in the call option. The seller (writer) of a put option which is covered (e.g., the writer has a short position in the underlying security) assumes the risk of an increase in the market price of the underlying security above the sales price (in establishing the short position) of the underlying security plus the premium received, and gives up the opportunity for gain on the underlying security below the exercise price of the option. The seller of an uncovered put option assumes the risk of a decline in the market price of the underlying security below the exercise price of the option. The buyer of a put option assumes the risk of losing his entire premium invested in the put option.
Overall market risks may also affect the value of the Funds. The market values of securities or other investments owned by the Funds will go up or down, sometimes rapidly or unpredictably. Factors such as economic growth and market conditions, interest rate levels, exchange rates and political events affect the securities markets. Changes in market conditions and interest rates generally do not have the same impact on all types of securities and instruments. Unexpected local, regional or global events and their aftermath, such as war; acts of terrorism; financial, political or social disruptions; natural, environmental or man-made disasters; climate-change and climate-related events; the spread of infectious illnesses or other public health issues; recessions and depressions; or other tragedies, catastrophes and events could have a significant impact on the Funds and their investments and could result in increased premiums or discounts to a Fund’s net asset value, and may impair market liquidity, thereby increasing liquidity risk. Such events can cause investor fear and panic, which can adversely affect the economies of many companies, sectors, nations, regions and the market in general, in ways that cannot necessarily be foreseen. The Funds could lose money over short periods due to short-term market movements and over longer periods during more prolonged market downturns. During a general market downturn, multiple asset classes may be negatively affected. In times of severe market disruptions you could lose your entire investment.
Effective January 24, 2024, the Eventide Funds have a $150,000,000 uncommitted line of credit provided by U.S. Bank National Association (the “Bank”) under an agreement (the “Uncommitted Line”), that is set to expire on January 22, 2025. Borrowings under the Uncommitted Line bear an interest at Prime Rate minus 0% per month. Any advance under the Uncommitted Line is contemplated primarily for temporary or emergency purposes, including the meeting of redemption requests that otherwise might require the untimely disposition of securities. Interest on borrowings is payable on an annualized basis. The Uncommitted Line is not a “committed” line of credit, which is to say that the Bank is not obligated to lend money to the Funds. Accordingly, it is possible that Funds may wish to borrow money for a temporary or emergency purpose but may not be able to do so. During the year ended June 30, 2024, none of the Eventide Funds accessed the line of credit.
The beneficial ownership, either directly or indirectly, of more than 25% of the voting securities of a fund creates a presumption of control of the fund, under Section 2(a)(9) of the 1940 Act. As of June 30, 2024, Charles Schwab & Co, Inc. Special Custody Account for the Exclusive Benefit of Customers held 37.31%, 28.74%, 40.09%, 31.98% and 28.90% of the Eventide Core Bond Fund, Eventide Dividend Opportunities Fund, Eventide Exponential Technologies Fund, Eventide Large Cap Focus Fund and Eventide Limited-Term Bond Fund, respectively. As of June 30, 2024, National Financial Services LLC held 41.28% and 28.83% of the Eventide Core Bond Fund and Eventide Large Cap Focus Fund, respectively. As of June 30, 2024, American Enterprise Investment Services held 29.88% of the Eventide Limited-Term Bond Fund.
Subsequent events after the date of the Statements of Assets and Liabilities have been evaluated through the date the financial statements were issued. Management has determined that no events or transactions occurred requiring adjustment or disclosure in the financial statements.

REPORT OF INDEPENDENT REGISTERED PUBLIC ACCOUNTING FIRM
To the Shareholders of Eventide Balanced Fund, Eventide Core Bond Fund, Eventide Dividend Opportunities Fund, Eventide Exponential Technologies Fund, Eventide Gilead Fund, Eventide Healthcare & Life Sciences Fund, Eventide Large Cap Focus Fund, and Eventide Limited-Term Bond Fund and Board of Trustees of Mutual Fund Series Trust
Opinion on the Financial Statements
We have audited the accompanying statements of assets and liabilities, including the schedules of investments, of Eventide Balanced Fund (formerly, Eventide Multi-Asset Income Fund), Eventide Core Bond Fund, Eventide Dividend Opportunities Fund, Eventide Exponential Technologies Fund, Eventide Gilead Fund, Eventide Healthcare & Life Sciences Fund, Eventide Large Cap Focus Fund, and Eventide Limited-Term Bond Fund (the “Funds”), each a series of Mutual Fund Series Trust, as of June 30, 2024, the related statements of operations for the year then ended, the statements of changes in net assets and the financial highlights for each of the two years in the period then ended, and the related notes (collectively referred to as the “financial statements”). In our opinion, the financial statements present fairly, in all material respects, the financial position of the Funds as of June 30, 2024, the results of their operations for the year then ended, the changes in net assets and the financial highlights for each of the two years in the period then ended, in conformity with accounting principles generally accepted in the United States of America.
The Funds’ financial highlights for the years and periods ended June 30, 2022, and prior, were audited by other auditors whose report dated August 29, 2022, expressed an unqualified opinion on those financial highlights.
Basis for Opinion
These financial statements are the responsibility of the Funds’ management. Our responsibility is to express an opinion on the Funds’ financial statements based on our audits. We are a public accounting firm registered with the Public Company Accounting Oversight Board (United States) (“PCAOB”) and are required to be independent with respect to the Funds in accordance with the U.S. federal securities laws and the applicable rules and regulations of the Securities and Exchange Commission and the PCAOB.
We conducted our audits in accordance with the standards of the PCAOB. Those standards require that we plan and perform the audits to obtain reasonable assurance about whether the financial statements are free of material misstatement whether due to error or fraud.
Our audits included performing procedures to assess the risks of material misstatement of the financial statements, whether due to error or fraud, and performing procedures that respond to those risks. Such procedures included examining, on a test basis, evidence regarding the amounts and disclosures in the financial statements. Our procedures included confirmation of securities owned as of June 30, 2024, by correspondence with the custodian, issuers, and brokers; when replies were not received from issuers and brokers, we performed other auditing procedures. Our audits also included evaluating the accounting principles used and significant estimates made by management, as well as evaluating the overall presentation of the financial statements. We believe that our audits provide a reasonable basis for our opinion.
We have served as the Funds’ auditor since 2023.

COHEN & COMPANY, LTD.
Philadelphia, Pennsylvania
August 29, 2024
COHEN & COMPANY, LTD.
800.229.1099 | 866.818.4538 fax | cohencpa.com
Registered with the Public Company Accounting Oversight Board
| Eventide Funds |
| Consideration and Renewal of Management Agreement |
| June 30, 2024 |
Consideration and Renewal of Management Agreement between Mutual Fund Series Trust and Eventide Asset Management, LLC with respect to Eventide Gilead Fund, Eventide Healthcare and Life Sciences Fund, Eventide Balanced, Eventide Dividend Opportunities Fund, Eventide Limited-Term Bond Fund, Eventide Exponential Technologies Fund, Eventide Core Bond Fund and Eventide Large Cap Focus Fund.
In connection with a meeting held on May 8, 9 and 28, 2024, the Board of Trustees (the “Board”) of Mutual Fund Series Trust (the “Trust”), including a majority of the Trustees who are not “interested persons” as that term is defined in the Investment Company Act of 1940, as amended, discussed the renewal of the advisory agreement (the “Eventide Agreement”) between the Trust and Eventide Asset Management, LLC (“Eventide”) with respect to Eventide Gilead Fund (“Eventide Gilead”), Eventide Healthcare and Life Sciences Fund (“Eventide HLS”), Eventide Balanced Fund (“Balanced”), Eventide Dividend Opportunities Fund (“Eventide DO”), Eventide Limited-Term Bond Fund (“Eventide LTB”), Eventide Exponential Technologies Fund (“Eventide ET”), Eventide Core Bond Fund (“Eventide CB”) and Eventide Large Cap Focus Fund (“Eventide LCF”) (collectively, the “Eventide Funds”)
The Board examined Eventide’s responses to a series of questions regarding, among other things, its advisory services provided to the Eventide Funds, comparative fee and expense information, and profitability from managing the Eventide Funds. The Board was assisted by legal counsel throughout the review process and relied upon the advice of legal counsel and its own business judgment in determining the material factors to be considered in evaluating the Eventide Agreement and the weight to be given to each factor considered. The conclusions reached by the Board were based on a comprehensive evaluation of all of the information provided and were not the result of any one factor. Moreover, each Trustee may have afforded different weight to the various factors in reaching his conclusions with respect to the renewal of the Eventide Agreement.
Nature, Extent and Quality of Services. The Board reviewed the key personnel and noted that Eventide hired additional analysts in the prior year. The Board discussed Eventide’s service to the Eventide Funds, noting Eventide provided continuous portfolio management services including making investment decisions and security selection consistent with the values principals articulated in each Eventide Fund’s prospectus. The Board noted that Eventide had strong internal research capabilities and utilized this research in serving the Eventide Funds. The Board recognized that Eventide provided continuous oversight and compliance services to the Eventide Funds that are sub-advised by Boyd Watterson Asset Management LLC (“Boyd Watterson”). The Board noted that Eventide used a third-party compliance service to monitor compliance with Fund investment restrictions on a pre-and post-trade basis. The Board recognized that Eventide increased security and adopted new security procedures in the prior year, noting that there were no material compliance issues reported. The Board concluded it expected Eventide to continue providing high quality service to each Eventide Fund and its shareholders.
Performance. The Board reviewed the performance of each Eventide Fund relative to its peer group and Morningstar category.
Eventide Gilead: The Board observed that the Fund underperformed its peer group average and Russell Mid Cap Growth Index for all time periods and Mid Cap Growth Morningstar category for the 1-, 3-, and 5- year periods. The Board noted that Eventide explained that the Fund differed from its peer group because it was consistently overweight in small-cap biotechnology stocks. The Board noted that Eventide remained confident in the Fund’s investment strategy and explained that the Fund had experienced higher relative volatility based on a smaller number of holdings.
Eventide HLS: The Board noted the Fund underperformed its peer group average, US Fund Health Morningstar category and S&P Biotechnology Selected Industry TR Index for the 1- year period. The Board discussed that Eventide HLS underperformed its peer group average and Morningstar category for 3-year and 5-year periods but outperformed the benchmark index for the 3-year and 5-year periods and outperformed all benchmarks for the 10-year period.
Balanced: The Board discussed that the Fund underperformed its peer group average and Morningstar category for the 1- and 3-year periods but outperformed the benchmark index for all time periods and the peer group and Morningstar category for 5-year and since inception periods. The Board noted that Eventide explained that the Fund unperformed the Morningstar category due to less exposure to equity markets.
Eventide DO: The Board observed that the Fund outperformed the peer group average, US Fund Mid-cap Blend Morningstar category and Russell Mid Cap TR Index for all time periods. The Board noted that Eventide referenced the Fund’s focus on investing in well-positioned and professionally managed securities.
| Eventide Funds |
| Consideration and Renewal of Management Agreement (Continued) |
| June 30, 2024 |
Eventide LTB: The Board discussed that the Fund outperformed its peer group average and benchmark index for the 1-year and 10-year periods. The Board noted the Fund underperformed its peer group average and Morningstar category for the 3- and 5-year periods. The Board recognized that corporate bonds contributed the most to the Fund’s performance, but that Eventide explained that the long-term bond mandate led to the underperformance related to the Morningstar category.
Eventide ET: The Board observed the Fund outperformed the benchmark index for the 1-year period but underperformed its peer group average and Morningstar category for the 1-, 3-year and since inception periods. The Board recognized that Eventide explained the Fund’s underperformance was due to the Fund’s focus on small-cap stocks while the peer group, Morningstar category and benchmark index benefited from the growth in large-cap stocks.
Eventide CB: The Board discussed that the Eventide CB trailed its peer group average, Morningstar category and benchmark index for all time periods. The Board noted that Eventide explained the underperformance related to the benchmark index was related to the timing of the Fund’s launch in a higher interest rate environment. The Board recognized that Eventide CB had less exposure to US Treasuries and longer duration than funds in the peer group which led to underperformance.
Eventide LCF: The Board commented that the Fund outperformed its peer group average and Morningstar category for the 1-year and since inception periods and outperformed the S&P 500 TR Index for the 1-year period. The Board acknowledged that Eventide explained the Fund’s performance was due to strong stock selection and portfolio allocation in the consumer staples and industrials sectors.
After discussion, the Board concluded that the performance of each Eventide Fund was acceptable.
Fees and Expenses. The Board discussed the advisory fee for each Eventide Fund compared to the average fees charged by each Eventide Fund’s peer group and Morningstar category. The Board considered the soft dollar benefits received by Eventide; the sub-advisory fees paid with respect to certain Eventide Funds along with the indirect benefits of Rule 12b-1 fees received by Eventide with respect to the distribution of the Eventide Funds. The Board noted Eventide’s belief that the advisory fees were reasonable given its expertise in technical research, dividend stock selection, specific ethical screening and active management of the Eventide Funds. The Board concluded that the advisory fee for each Eventide Fund was not unreasonable.
Eventide Gilead: The Board noted the advisory fee and net expense ratio were above the medians and averages for the peer group and Morningstar category but was well within the ranges for both.
Eventide HLS: The Board observed that the advisory fee was above the median and average for the peer group and Morningstar category but were below the highs. The Board noted that the net expense ratio was above the median and average for the peer group and Morningstar category but was well below the highs for each. The Board considered that the Fund’s portfolio had a significantly lower average market capitalization than the peer group and Morningstar category funds, indicative of the specialized focus of the strategy.
Balanced: The Board discussed that the advisory fee and net expense ratio was in line with the medians and averages for the peer group and the advisory fee was below the peer group after the fee waiver. The Board noted that the advisory fee and net expense ratio was above the median and average for the Morningstar category but were both significantly below the highs.
Eventide DO: The Board noted Eventide DO’s advisory fee was below the median and average for the peer group and in line with the with Morningstar category. The Board further noted the net expense ratio below the average for the peer group and in line with the median and average for the Morningstar category.
Eventide LTB: The Board commented that the advisory fee was below the median and average of the peer group and Morningstar category. The Board noted the net expense ratio was equal to the peer group average and above the Morningstar category median and average but well below the high. The Board further noted that Eventide had agreed to reduce its advisory fee by two basis points in the prior year.
Eventide ET: The Board observed the advisory fee and net expense ratio for the Fund were above the medians and averages for the peer group and Morningstar category but were below the highs for both.
| Eventide Funds |
| Consideration and Renewal of Management Agreement (Continued) |
| June 30, 2024 |
Eventide CB: The Board acknowledged the advisory fee was below the median and average for the peer group and Morningstar category. The Board noted the net expense ratio was above the peer group and Morningstar category average and median but was in line with and below the highs for both. The Board noted that Eventide had agreed to a reduce its advisory fee by two basis points in the prior year.
Eventide LCF: The Board noted the Eventide LCF advisory fee and net expense ratio were above the peer group and Morningstar category medians and averages but significantly below the highs.
The Board concluded that the advisory fee paid by each of the Eventide Funds to Eventide was not unreasonable.
Profitability. The Board reviewed the financial information provided by Eventide and discussed Eventide’s profitability from its services to each of the Eventide Funds. The Board noted that some of Eventide’s senior personnel received compensation in the form of ownership distributions that, if included as an operating expense in Eventide’s calculations, would reduce the estimated profit levels. The Board observed that Eventide did not earn a profit from advising Eventide LTB, Eventide CB and Eventide LCF and earned a reasonable profit from Eventide Gilead, Eventide HLS, Balanced, Eventide DO, and Eventide ET. The Board considered the soft dollar benefits received by Eventide. The Board determined excess profitability was not a concern at this time.
Economies of Scale. The Board discussed potential breakpoints for the Eventide Funds, noting that the Eventide Fund’s shareholders benefited from each Fund’s expense cap. The Board discussed the impact of sub-adviser fee breakpoints on adviser economies. The Board recognized that Eventide had lowered its advisory fee for Eventide CB and Eventide LTB in 2023. The Board determined it would discuss breakpoints with Eventide in the future as the Eventide Funds increased AUM.
Conclusion. Having requested and received such information from Eventide as the Board believed to be reasonably necessary to evaluate the terms of the Eventide Agreement, and as assisted by the advice of counsel, the Board concluded that renewal of the Eventide Agreement was in the best interests of each Eventide Renewal Fund and its respective shareholders.
| Eventide Funds |
| Consideration and Renewal of Management Agreement (Continued) |
| June 30, 2024 |
Consideration and Renewal of the Sub-Advisory Agreements between Eventide Asset Management, LLC and Boyd Watterson Asset Management LLC with respect to Eventide Core Bond Fund, Eventide Limited-Term Bond Fund and Eventide Balanced Fund
In connection with a meeting held on May 8, 9 and 28, 2024, the Board of Trustees (the “Board”) of Mutual Fund Series Trust (the “Trust”), including a majority of the Trustees who are not “interested persons” as that term is defined in the Investment Company Act of 1940, as amended, discussed the renewal of the sub-advisory agreements (the “BW Agreement”) between Eventide Asset Management, LLC (“Eventide”) and Boyd Watterson Asset Management LLC (“Boyd Watterson”) with respect to Eventide Core Bond Fund (“Eventide CB”); Eventide Limited-Term Bond Fund (“Eventide LTB”) and Eventide Balanced Fund (“Balanced”).
The Board examined Boyd Watterson’s responses to a series of questions regarding, among other things, its sub-advisory services provided to Eventide CB, Eventide LTB and Balanced, comparative fee and expense information, and profitability from sub-advising Eventide CB, Eventide LTB and Balanced. The Board was assisted by legal counsel throughout the review process and relied upon the advice of legal counsel and its own business judgment in determining the material factors to be considered in evaluating the Boyd Agreements and the weight to be given to each factor considered. The conclusions reached by the Board were based on a comprehensive evaluation of all of the information provided and were not the result of any one factor. Moreover, each Trustee may have afforded different weight to the various factors in reaching his conclusions with respect to renewal of the BW Agreement.
Nature, Extent and Quality of Services. The Board reviewed the changes in the key personnel servicing the Eventide Sub-Advised Funds, noting that a new position of COO had been created and filled. The Board agreed that the key personnel at Boyd Watterson had extensive experience in developing and operating fixed income strategies. The Board discussed that Boyd Watterson provided full portfolio investment management services to Eventide LTB and Eventide CB and managed the fixed income strategy portfolio of Eventide Balanced. The Board reviewed that Boyd Watterson utilized multiple committees and review processes along with a model-based approach to operate the Eventide Sub-Advised Funds’ investment strategies. The Board noted that Boyd Watterson used a bottom-up approach in selecting securities with a focus on income, consistency, and risk mitigation. The Board discussed that Boyd Watterson used a proprietary IT system to ensure compliance with investment restrictions for each of the Boyd Watterson Funds. The Board noted that the sub-adviser reported no material compliance issues or material litigation. The Board agreed that Boyd Watterson could be expected to continue providing quality services to the Eventide Sub-Advised Funds.
Performance. The Board reviewed the performance of each Eventide Sub-Advised Fund relative to its benchmarks.
Eventide CB: The Board discussed that Eventide CB trailed the peer group average, Morningstar category and benchmark index for all time periods. The Board noted that Boyd Watterson explained the underperformance related to the benchmark index was due to the timing of the Fund’s launch into a higher interest rate environment. The Board recognized that the Eventide CB has less exposure to US Treasuries and longer duration than other funds in the peer group which led to the underperformance.
Eventide LTB: The Board observed the Eventide LTB outperformed the peer group average and benchmark index for the 1-year and 10-year periods. The Board noted Eventide LTB underperformed the peer group average and Morningstar category for the 3- and 5-year periods. The Board recognized that corporate bonds contributed the most to Eventide LTB’s performance, but Boyd Watterson explained that the long-term bond mandate led to the underperformance related to the Morningstar category.
Balanced: The Board reviewed that Eventide Balanced underperformed the peer group average and Morningstar category for the 1-year and 3-year periods but outperformed the benchmark index for all time periods and the peer group and Morningstar category for the 5-year and since inception periods. The Board noted that Eventide explained that the Fund unperformed the Morningstar category due to less exposure to the equity markets than other funds in the category.
After discussion, the Board concluded that the performance of each Eventide Sub-Advised Fund was acceptable.
| Eventide Funds |
| Consideration and Renewal of Management Agreement (Continued) |
| June 30, 2024 |
Fees and Expenses. The Board reviewed the tiered structure to the sub-advisory fee for each of the Eventide Sub-Advised Funds. The Board discussed that Boyd Watterson received 0.15% sub-advisory fee for assets of $100 million and under, 0.07% sub-advisory fee for assets over $100 million and a sub-advisory fee of 0.06% for assets above $500 million for the aggregate asset level of the Boyd Watterson Funds. The Board discussed the allocation of fees between Eventide and Boyd Watterson, given their respective duties and other factors and considering the fee breakpoints. The Board determined that the sub-advisory fees for the Eventide Sub-Advised Funds and the allocation between Eventide and Boyd Watterson were not unreasonable.
Profitability. The Board observed that Boyd Watterson earned a modest profit from sub-advising the Boyd Watterson Funds. The Board concluded excessive profitability was not a concern at this time.
Economies of Scale. The Board discussed whether the Boyd Watterson Funds had reached the size where Boyd Watterson benefited from economies of scale. The Board acknowledged economies of scale, including the impact of the current sub-advisory fee breakpoints, was an issue primarily considered by the Board when evaluating the advisory agreement with Eventide.
Conclusion. Having requested and received such information from Boyd Watterson as the Board believed to be reasonably necessary to evaluate the terms of the BW Agreement, and as assisted by the advice of counsel, the Board concluded that renewal of the BW Agreement was in the best interests of each of the Eventide Sub-Advised Funds and their respective shareholders.
PRIVACY NOTICE
Mutual Fund Series Trust
Rev. June 2011
| FACTS | WHAT DOES MUTUAL FUND SERIES TRUST DO WITH YOUR PERSONAL INFORMATION? |
| | |
| Why? | Financial companies choose how they share your personal information. Federal law gives consumers the right to limit some, but not all sharing. Federal law also requires us to tell you how we collect, share, and protect your personal information. Please read this notice carefully to understand what we do. |
| What? | The types of personal information we collect and share depends on the product or service that you have with us. This information can include: ● Social Security number and wire transfer instructions ● account transactions and transaction history ● investment experience and purchase history When you are no longer our customer, we continue to share your information as described in this notice. |
| How? | All financial companies need to share customers’ personal information to run their everyday business. In the section below, we list the reasons financial companies can share their customers’ personal information; the reasons Mutual Fund Series Trust chooses to share; and whether you can limit this sharing. |
| Reasons we can share your personal information: | Does Mutual Fund Series
Trust share information? | Can you limit this
sharing? |
| For our everyday business purposes - such as to process your transactions, maintain your account(s), respond to court orders and legal investigations, or report to credit bureaus. | YES | NO |
| For our marketing purposes - to offer our products and services to you. | NO | We don’t share |
| For joint marketing with other financial companies. | NO | We don’t share |
| For our affiliates’ everyday business purposes - information about your transactions and records. | NO | We don’t share |
| For our affiliates’ everyday business purposes - information about your credit worthiness. | NO | We don’t share |
| For our affiliates to market to you | NO | We don’t share |
| For non-affiliates to market to you | NO | We don’t share |
| QUESTIONS? | Call 1-866-447-4228 |
PRIVACY NOTICE
Mutual Fund Series Trust
| What we do: |
How does Mutual Fund Series Trust protect my personal information? | To protect your personal information from unauthorized access and use, we use security measures that comply with federal law. These measures include computer safeguards and secured files and buildings. Our service providers are held accountable for adhering to strict policies and procedures to prevent any misuse of your nonpublic personal information. |
How does Mutual Fund Series Trust collect my personal information? | We collect your personal information, for example, when you: ● open an account or deposit money ● direct us to buy securities or direct us to sell your securities ● seek advice about your investments We also collect your personal information from others, such as credit bureaus, affiliates, or other companies. |
Why can’t I limit all sharing? | Federal law gives you the right to limit only: ● sharing for affiliates’ everyday business purposes – information about your creditworthiness. ● affiliates from using your information to market to you. ● sharing for non-affiliates to market to you. State laws and individual companies may give you additional rights to limit sharing. |
| Definitions |
| Affiliates | Companies related by common ownership or control. They can be financial and non-financial companies. ● Mutual Fund Series Trust has no affiliates. |
| Non-affiliates | Companies not related by common ownership or control. They can be financial and non-financial companies. ● Mutual Fund Series Trust does not share with non-affiliates so they can market to you. |
| Joint marketing | A formal agreement between nonaffiliated financial companies that together market financial products or services to you. ● Mutual Fund Series Trust does not jointly market. |
| |
| |
| |
| |
| |
| Mutual Fund Series Trust |
| 4221 North 203rd Street, Suite 100 |
| Elkhorn, NE 68022 |
| |
| ADVISOR |
| Eventide Asset Management, LLC |
| One International Place, Suite 4210 |
| Boston, MA 02110 |
| |
| ADMINISTRATOR |
| Ultimus Fund Solutions, LLC |
| 225 Pictoria Drive, Suite 450 |
| Cincinnati, OH 45246 |
| |
| TRANSFER AGENT |
| Ultimus Fund Solutions, LLC |
| 225 Pictoria Drive, Suite 450 |
| Cincinnati, OH 45246 |
| |
| INDEPENDENT REGISTERED PUBLIC ACCOUNTING FIRM |
| Cohen & Company, Ltd. |
| 1835 Market Street, Suite 310 |
| Philadelphia, PA 19103 |
| |
| LEGAL COUNSEL |
| Thompson Hine LLP |
| 41 South High Street, Suite 1700 |
| Columbus, OH 43215 |
| |
| CUSTODIAN BANK |
| U.S. Bank |
| 1555 N. Rivercenter Drive, Suite 302 |
| Milwaukee, WI 53212 |
| |
| |
| |
| |
| |
| |
| |
| |
| |
| |
Item 8. Changes in and Disagreements with Accountants for Open-End Management Investment Companies.
Not applicable
Item 9. Proxy Disclosures for Open-End Management Investment Companies.
Not applicable
Item 10. Remuneration Paid to Directors, Officers, and Others of Open-End Management Investment Companies.
Included under Item 7
Item 11. Statement Regarding Basis for Approval of Investment Advisory Contract.
Included under Item 7
Item 12. Disclosure of Proxy Voting Policies and Procedures for Closed-End Management Investment Companies.
Not applicable
Item 13. Portfolio Managers of Closed-End Management Investment Companies.
Not applicable
Item 14. Purchases of Equity Securities by Closed-End Management Investment Company and Affiliated Purchasers.
Not applicable
Item 15. Submission of Matters to a Vote of Security Holders.
None
Item 16. Controls and Procedures
(a) The registrant’s Principal Executive Officer and Principal Financial Officer have concluded that the registrant’s disclosure controls and procedures (as defined in Rule 30a-3(c) under the Act) are effective in design and operation and are sufficient to form the basis of the certifications required by Rule 30a-(2) under the Act, based on their evaluation of these disclosure controls and procedures as of a date within 90 days of this report on Form N-CSR.
(b) There were no changes in the registrant’s internal control over financial reporting (as defined in Rule 30a-3(d) under the Act) during the period covered by this report that have materially affected, or are reasonably likely to materially affect, the registrant’s internal control over financial reporting.
Item 17. Disclosure of Securities Lending Activities for Closed-End Management Investment Companies.
Not applicable
Item 18. Recovery of Erroneously Awarded Compensation.
(a) Not applicable
(b) Not applicable
Item 19. Exhibits.
(a)(1) Code of Ethics for Principal Executive and Senior Financial Officers.
(a)(2) Not applicable
(a)(3) A separate certification for each principal executive officer and principal financial officer of the registrant as required by Rule 30a-2(a) under the Act (17 CFR 270.30a-2(a)): Attached hereto.
(a)(4) Not applicable
(b) Certifications required by Rule 30a-2(b) under the Act (17 CFR 270.30a-2(b)): Attached hereto.
SIGNATURES
Pursuant to the requirements of the Securities Exchange Act of 1934 and the Investment Company Act of 1940, the registrant has duly caused this report to be signed on its behalf by the undersigned, thereunto duly authorized.
Mutual Fund Series Trust
| By /s/ Michael Schoonover | |
| Michael Schoonover | |
| Principal Executive Officer |
| Date: 8/30/2024 | |
Pursuant to the requirements of the Securities Exchange Act of 1934 and the Investment Company Act of 1940, this report has been signed below by the following persons on behalf of the registrant and in the capacities and on the dates indicated.
| By /s/ Michael Schoonover | |
| Michael Schoonover | |
| Principal Executive Officer |
| Date: 8/30/2024 | |
| By /s/ Erik Naviloff | |
| Erik Naviloff | |
| Principal Financial Officer |
| Date: 8/30/2024 | |