united states
securities and exchange commission
washington, d.c. 20549
form n-csr
certified shareholder report of registered management
investment companies
Investment Company Act file number 811-21872
Mutual Fund Series Trust
(Exact name of registrant as specified in charter)
4221 North 203rd Street, Suite 100 Elkhorn, Nebraska 68022-3474
(Address of principal executive offices) (Zip code)
Ultimus Fund Solutions ___
80 Arkay Drive, Suite 110, Hauppauge, NY 11788
(Name and address of agent for service)
Registrant's telephone number, including area code: 402-895-1600
Date of fiscal year end: 3/31
Date of reporting period: 3/31/24
Explanatory Note: The registrant is filing this amendment to its filing on Form N-CSR for the year ended March 31, 2024, which was originally filed with the Securities and Exchange Commission on June 11, 2024 (Accession Number 0001580642-24-003144), solely to correct the title of Michael Schoonover and Erik Naviloff to reflect as Principal Executive Officer and Principal Financial Officer and update Items 11a and 11b to reflect the internal control impact of the material weakness on Form N-CSR.
ITEM 1. REPORTS TO SHAREHOLDERS.

Annual Report
AlphaCentric Income Opportunities Fund
Class A: IOFAX Class C: IOFCX Class I: IOFIX
AlphaCentric Premium Opportunity Fund
Class A: HMXAX Class C: HMXCX Class I: HMXIX
AlphaCentric Robotics and Automation Fund
Class A: GNXAX Class C: GNXCX Class I: GNXIX
AlphaCentric Symmetry Strategy Fund
Class A: SYMAX Class C: SYMCX Class I: SYMIX
AlphaCentric LifeSci Healthcare Fund
Class A: LYFAX Class C: LYFCX Class I: LYFIX
AlphaCentric Strategic Income Fund
Class A: SIIAX Class C: SIICX Class I: SIIIX
March 31, 2024
AlphaCentric Advisors LLC
53 Palmeras Street, Suite 601
San Juan, PR 00901
1-844-223-8637

March 31, 2024
AlphaCentric Income Opportunities Fund (IOFIX | IOFAX | IOFCX) (unaudited)
Dear Shareholders:
We hope this letter finds you navigating the most recent bout of “surprise” well – a lot has changed in the last year. We believe markets are finally starting to feel better, a welcome change.
The Federal Reserve’s efforts painted a better picture and began stages of a recovery, although the Fund returned -3.61% (Class I) versus 1.70% for the Bloomberg US Aggregate for the period 3/31/2023 – 3/31/2024.
Fed Chair Powell’s pause in July of 2023 allowed the markets to breathe half a sigh of relief, and yet inflation remained an overhanging issue. His comments at the end of 2023 led to a more positive market tone heading into 2024, but the market perhaps got ahead of itself in forecasting as many as six Fed Funds cuts. Those hopes were successively dashed with Q1 reports revealing sticky prices and continued strength in wages, and some even suggesting that a hike might be on the table. This of course kept investors “on the sidelines” and willing to stay in higher-interest money market funds, trying to avoid duration calls until clearer signals arrive.
Revisions in jobs data imply emerging softness in labor, which could be a component of the Fed’s dual mandate despite inflation/pricing data having received most of the headline emphasis. We feel that conditions are supportive of no further hikes at the very least and believe that cuts will be the next step although “data dependent,” as Chair Powell likes to say. And along those lines we continue to be firmly convinced of the Fund’s portfolio and positioning, as the Fund’s sector remains cheap relative to other asset classes and offers potentially higher upside with solid collateral characteristics. As mentioned in the past, housing fundamentals and mortgage borrower profiles, in particular for the seasoned, legacy securities emphasized in the Fund, have kept improving.
As always, thank you for your support and best wishes for the year!
Sincerely,
Garrison Point Fund Management Team
This report is intended for the Fund’s shareholders. It may not be distributed to prospective investors unless it is preceded or accompanied by the current Fund prospectus. To obtain a prospectus or other information about the Fund, please visit www.AlphaCentricFunds.com or call 844-ACFUNDS (844-223-8637). Please read the prospectus carefully before investing.
The Fund’s returns for the fiscal year ended 3/31/24 and for the period since inception through 3/31/24, as compared to the Benchmark Index, were as follows:
| | | Since Inception |
| | Fiscal Year Ended 3/31/2024 | 5/28/2015 |
| Class I | -3.61 | 2.32 |
| | | |
| Class A | -3.86 | 2.06 |
| | | |
| Class A w/ Sales Charge | -8.39 | 1.50 |
| | | |
| Class C | -4.62 | 1.30 |
| | | |
| Bloomberg US Agg Bond Index (1) | 1.70 | 1.20 |
| (1) | Bloomberg US Aggregate Bond Index: A market capitalization-weighted index that is designed to measure the performance of the U.S. investment grade bond market with maturities of more than one year. Investors cannot invest directly in an index. |

The Fund’s maximum sales charge for Class “A” shares is 4.75%. Performance is historic and does not guarantee future results. Investment return and principal value will fluctuate with changing market conditions so that when redeemed, shares may be worth more or less than their original cost. Current performance may be lower or higher than the performance data quoted. To obtain the most recent month end performance information or the Fund’s prospectus please call the Fund, toll free at 1-844-ACFUNDS (844-223-8637). You can also obtain a prospectus at www.AlphaCentricFunds.com. 5412-NLD-5/14/2024.
AlphaCentric Income Opportunities Fund
PORTFOLIO REVIEW (Unaudited)
March 31, 2024
The Fund’s performance figures* for the periods ended March 31, 2024, compared to its benchmark:
| | | Annualized | Annualized | Annualized |
| | One Year | Three Years | Five Years | Since Inception+ |
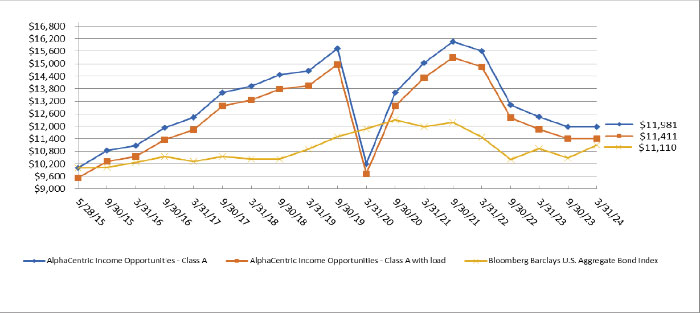
| Class A (IOFAX) | (3.86)% | (7.32)% | (3.95)% | 2.06% |
| Class A (IOFAX) with 4.75% load | (8.39)% | (8.80)% | (4.88)% | 1.50% |
| Class C (IOFCX) | (4.62)% | (8.02)% | (4.69)% | 1.30% |
| Class I (IOFIX) | (3.61)% | (7.07)% | (3.72)% | 2.32% |
| Bloomberg U.S. Aggregate Bond Index ** | 1.70% | (2.46)% | 0.36% | 1.20% |
| * | The performance data quoted here represents past performance. Current performance may be lower or higher than the performance data quoted above. Investment return and principal value will fluctuate, so that shares, when redeemed, may be worth more or less than their original cost. Class A is subject to a maximum applicable sales charge of 4.75% and a maximum deferred sales charge of 1.00% on investments at or above the $1 million breakpoint (where you do not pay a sales charge) on shares redeemed within 18 months of purchase. Total returns are calculated using the net asset value (“NAV”) on March 28, 2024. The returns shown do not reflect the deduction of taxes that a shareholder would pay on Fund distributions or on the redemptions of Fund shares. Past performance is no guarantee of future results. Performance figures for periods greater than 1 year are annualized. The Fund’s adviser has contractually agreed to reduce its fees and/or absorb expenses of the Fund, at least until July 31, 2024, to ensure that the net annual fund operating expenses (excluding brokerage costs; borrowing costs, such as (a) interest and (b) dividends on securities sold short; taxes; costs of investing in underlying funds and extraordinary expenses) will not exceed 1.74%, 2.49% and 1.49% for the Fund’s Class A, Class C, and Class I shares, respectively, subject to possible recoupment from the Fund in future years. Fee waivers and expense reimbursements are subject to possible recoupment by the adviser from the Fund in future years on a rolling three-year basis (within three years after the fees have been waived or reimbursed) if such recoupment can be achieved within the foregoing expense limits and any expense limits in place at the time of recoupment. Without these waivers, the Fund’s total annual operating expenses as shown in the August 1, 2023 prospectus were 2.18%, 2.93% and 1.93% for the Fund’s Class A, Class C, and Class I shares, respectively. After fee waivers, the Fund’s total annual operating expenses as shown in the August 1, 2023 prospectus were 1.90%, 2.65% and 1.65% for the Fund’s Class A, Class C, and Class I shares, respectively. Please review the Fund’s most recent prospectus for more detail on the expense waiver. For more current information on the Fund’s expense ratio, please see the Financial Highlights. For performance information current to the most recent month-end, please call toll-free 1-844-223-8637. |
| ** | The Bloomberg U.S. Aggregate Bond Index is commonly used as a benchmark by both passive and active investors to measure portfolio performance relative to the U.S. dollar-denominated investment grade fixed-rate taxable bond market. It is also an informational measure of broad market returns commonly applied to fixed income instruments. Investors cannot invest directly in an index. |
| + | The AlphaCentric Income Opportunities Fund commenced operations on May 28, 2015. |
Comparison of the Change in value of a $10,000 investment
| Holdings by Security Type | | % of Net Assets | |
| Non-Agency Residential Mortgage Backed Securities | | | 105.1 | % |
| Short Term Investment | | | 0.0 | % * |
| Liabilities In Excess Of Other Assets | | | (5.1 | )% |
| | | | 100.0 | % |
Please refer to the Schedule of Investments in this Annual Report for a detailed listing of the Fund’s holdings.
March 31, 2024
AlphaCentric Premium Opportunity Fund (HMXIX | HMXAX | HMXCX) (unaudited)
Dear Shareholders:
We are pleased to provide our Annual Letter to Shareholders. Thank you for your support and for being an investor in the Fund.
Investment Strategy
The portfolio strategy utilized by the Fund seeks to achieve capital appreciation with lower overall volatility than the equity market. The strategy attempts to achieve its objective by investing in a systematically managed portfolio of long and short call and put options and futures on the Standard & Poor’s 500 Index (the “Index”) and/or other securities that represent the return of the Index (such as exchange traded funds), as well as investments tied to measures of market volatility such as volatility exchange traded funds and futures on the VIX Index, which reflect the market’s expected fluctuation (volatility).
In addition to option strategies such as call ratios, strangles and straddles, the strategy uses futures, options on futures, and a variety of derivative instruments in an attempt to achieve capital efficiency. Relying on the embedded leverage of these markets, the Fund aims to hold between 70% and 85% of assets in U.S. Treasury bills or similar investments. Treasury bills act as a source of defense as well as potential upside, aligning with the overall dual mandate of balancing offense and defense. The income they generate, especially in a higher rate environment, helps enhance risk-adjusted returns for investors.
Fund Performance
For the fiscal year ended March 31, 2024, the Fund returned +14.17% (Class I shares). This return represented 48% of the S&P 500 total return.
Several quarters during the fiscal year acted as great examples of the Fund’s multiple return streams and ability to shift and react dynamically to different market environments. The second quarter of 2023 highlighted the Fund’s ability to capture returns from option strategies not related to the market’s upside or downside; earning 0.68% in May 2023.
The third quarter of 2023 highlighted the Fund’s ability to truncate the downside, with a loss of 0.57%. And the fourth quarter of 2023 highlighted the Fund’s ability to participate in the market’s upside, with a gain for the Fund of 5.77%.
On the flip side, October 2023 and Q1 of 2024 were more difficult periods. In October 2023, with our models shifting into defense mode as the S&P teetered on the edge of a -10% correction, only to see the market rally strongly into the end of the year. While we can look back now and lament that our downside defense cost the Fund from capturing more of the market’s upside, it sure felt good to have that defense on as the market stared a full-blown correction in the face.
Q1 2024 was different. Without volatility falling to new all-time lows as the S&P hit new all-time highs, the Fund’s option strategies capped the upside capture of the Fund somewhat, providing a slight headwind even as we participated meaningfully in the upside.
With the Fund participating in market upside both through direct exposure in S&P futures markets, and through the capture of volatility erosion as markets rise in price, the removal of one of those legs can lessen the Fund’s participation some.
Market Outlook
Looking out into the year ahead, it really feels like a reset and start of a new market regime that could last multiple years. Sort of like a new football season after living through the drama, wins and losses of the year before, but this ’season’ having been the entire post-COVID period, and the new ’season’ perhaps lasting several years.
Markets are essentially in a neutral stance, at or close to all-time highs as of the end of March 2024, but with valuations (Shiller CAPE Ratio) about midway between 2020 lows and 2021 highs. Bond and interest rate markets look set to normalize, with potential delays in easing, but the likelihood of further hikes much diminished.
Meanwhile, volatility has erased the echo of the COVID spike and become much more of a two-way market with volatility sellers and volatility downside reintroduced to the market. Meanwhile, volatility does remain low, and markedly lower than the bulk of the past three years. This allows the Fund to more cheaply invest in structures which potentially increase in value as the market decreases.
Sincerely,
Russell Kellites
Portfolio Manager
This report is intended for the Fund’s shareholders. It may not be distributed to prospective investors unless it is preceded or accompanied by the current Fund prospectus. To obtain a prospectus or other information about the Fund, please visit www.AlphaCentricFunds.com or call 844-ACFUNDS (844-223-8637). Please read the prospectus carefully before investing.
The Fund’s returns for the fiscal year ended 3/31/24 and for the period since inception through 3/31/24, as compared to the Benchmark Index, were as follows:
| | Fiscal Year Ended 3/31/2024 | Since Inception* |
| Class A | 13.83 | 7.12 |
| | | |
| Class A with Sales Charge | 7.31 | 6.28 |
| | | |
| Class C | 12.98 | 6.42 |
| | | |
| S&P 500 TR Index1 | 29.88 | 14.56 |
| | | |
| Class I | 14.17 | 9.41 |
| | | |
| S&P 500 TR Index1 | 29.88 | 14.50 |
| * | Fund Inception: 9/1/2011 (Class I) & 9/30/2016 (Class A & C). The Performance shown before September 30, 2016, is for the Fund’s Predecessor Fund (Theta Funds, L.P.) The Fund’s management practices, investment goals, policies, objectives, guidelines and restrictions are, in all material respects, equivalent to the predecessor limited partnership. From its inception date, the predecessor limited partnership was not subject to certain investment restrictions, diversification requirements and other restrictions of the Investment Company Act of 1940, as amended, if they had been applicable, it might have adversely affected its performance. In addition, the predecessor limited partnership was not subject to sales loads that would have adversely affected performance. Performance of the predecessor fund is not an indicator of future results. |
The Fund’s maximum sales charge for Class “A” shares is 5.75%. Dividends are not assured. Investments in mutual funds involve risks. Performance is historic and does not guarantee future results. Investment return and principal value will fluctuate with changing market conditions so that when redeemed, shares may be worth more or less than their original cost. Current performance may be lower or higher than the performance data quoted. To obtain the most recent month end performance information or the Fund’s prospectus please call the Fund, toll free at 844-ACFUNDS (844-223-8637). You can also obtain a prospectus at www.AlphaCentricFunds.com.
3374-NLD-05/14/2024
| 1 | The S&P 500 Total Return Index by Standard & Poor’s Corp. is a capitalization-weighted index comprising 500 widely held common stocks listed on various exchanges, representing the performance of the stock market generally. Please note that indices do not take into account any fees and expenses of investing in the individual securities that they track, and individuals cannot invest directly in any index, although individuals may invest in exchange traded funds or other investment vehicles that attempt to track the performance of an index. The Fund may or may not purchase the types of securities represented by the S&P 500 Total Return Index. Investors cannot invest directly in an index. |
AlphaCentric Premium Opportunity Fund
PORTFOLIO REVIEW (Unaudited)
March 31, 2024
The Fund’s performance figures* for the periods ended March 31, 2024, compared to its benchmark:
| | | Annualized | Annualized | Annualized | Annualized | Annualized |
| | One Year | Three Years | Five Years | Ten Years | Since Inception+ | Since Inception++ |
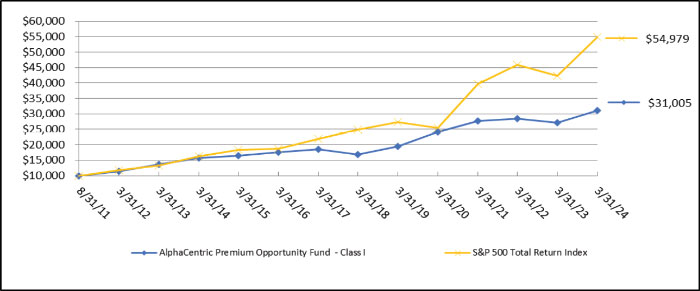
| Class A (HMXAX) without load | 13.83% | 3.57% | 9.42% | — | 7.12% | — |
| Class A (HMXAX) with 5.75% load | 7.31% | 1.55% | 8.13% | — | 6.28% | — |
| Class C (HMXCX) | 12.98% | 2.79% | 8.71% | — | 6.42% | — |
| Class I (HMXIX) +++ | 14.17% | 3.84% | 9.69% | 7.04% | — | 9.41% |
| S&P 500 Total Return Index ** | 29.88% | 11.49% | 15.05% | 12.96% | 14.56% | 14.50% |
| * | The performance data quoted here represents past performance. Current performance may be lower or higher than the performance data quoted above. Investment return and principal value will fluctuate, so that shares, when redeemed, may be worth more or less than their original cost. Class A is subject to a maximum applicable sales charge of 5.75% and a maximum deferred sales charge of 1.00% on investments at or above the $1 million breakpoint (where you do not pay a sales charge) on shares redeemed within 18 months of purchase. Total returns are calculated using the net asset value (“NAV”) on March 28, 2024. The returns shown do not reflect the deduction of taxes that a shareholder would pay on Fund distributions or on the redemptions of Fund shares. Past performance is no guarantee of future results. Performance figures for periods greater than 1 year are annualized. The Fund’s adviser has contractually agreed to reduce its fees and/or absorb expenses of the Fund, at least until July 31, 2024, to ensure that the net annual fund operating expenses (excluding brokerage costs; borrowing costs, such as (a) interest and (b) dividends on securities sold short; taxes; costs of investing in underlying funds and extraordinary expenses) will not exceed 2.24%, 2.99% and 1.99% for the Fund’s Class A, Class C and Class I shares, respectively, subject to possible recoupment from the Fund in future years. Fee waivers and expense reimbursements are subject to possible recoupment by the adviser from the Fund in future years on a rolling three-year basis (within three years after the fees have been waived or reimbursed) if such recoupment can be achieved within the foregoing expense limits and any expense limits in place at the time of recoupment. Without these waivers, the Fund’s total annual operating expenses as shown in the August 1, 2023 prospectus were 2.45%, 3.20% and 2.20% for the Fund’s Class A, Class C and Class I shares, respectively. After fee waivers, the Fund’s total annual operating expenses as shown in the August 1, 2023 prospectus were 2.32%, 3.07%, and 2.07% for the Fund’s Class A, Class C and Class I shares, respectively. Please review the Fund’s most recent prospectus for more detail on the expense waiver. For more current information on the Fund’s expense ratio, please see the Financial Highlights. For performance information current to the most recent month-end, please call toll-free 1-844-223-8637. |
| ** | The S&P 500 Total Return Index, a registered trademark of McGraw-Hill Co., Inc., is a market capitalization-weighted index of 500 widely held common stocks. Investors cannot invest directly in an index. |
| + | The AlphaCentric Premium Opportunity Fund Class A and Class C commenced operations on September 30, 2016. |
| ++ | The AlphaCentric Premium Opportunity Fund Class I, formerly a private fund, commenced operations on August 31, 2011. |
| +++ | The Fund acquired all of the assets and liabilities of Theta Funds, L.P. (the “Predecessor Fund”) in a tax-free reorganization on September 30, 2016. In connection with this acquisition, shares of the Predecessor Fund were exchanged for Class I shares of the Fund, so the Predecessor Fund became the Class I shares of the Fund. The Fund’s investment objective, policies and guidelines are, in all material respects, equivalent to the Predecessor Fund’s investment objectives, policies and guidelines. The Predecessor Fund commenced operations on August 31, 2011. Updated performance information will be available at no cost by calling 1-844-ACFUNDS (844-223-8637) or visiting the Fund’s website at www.AlphaCentricFunds.com. |
Comparison of the Change in value of a $10,000 investment
| Holdings by Security Type ** | | % of Net Assets | |
| U.S. Government & Agencies | | | 33.1 | % |
| Short-Term Investments | | | 24.1 | % |
| Future Options Purchased | | | 1.1 | % |
| Index Options Purchased | | | 0.1 | % |
| Written Future Options | | | (0.9 | )% |
| Other Assets in Excess of Liabilities | | | 42.5 | % |
| | | | 100.0 | % |
| ** | - Does not include derivative investments. |
Please refer to the Schedule of Investments in this Annual Report for a detailed listing of the Fund’s holdings.
March 31, 2024
Dear AlphaCentric Robotics and Automation Fund (the “Fund”) Investor:
The narrative of the past year has been dominated by two major themes, but just seven major stocks. The first major theme was underscored by the view that artificial intelligence (AI) would usher in a new era – similar to the advent of the internet, or electricity – according to some vocal pundits. Seven stocks, including Microsoft, Apple, Nvidia, Alphabet, Amazon, Meta, and Tesla became widely regarded as the leaders in the race to AI supremacy. As we write, the dominance of the so-called “Magnificent Seven” has become so extreme that they collectively account for nearly 30% of the market-cap of the S&P 500. The second major theme was the indication by the Federal Reserve Board that they were done raising rates, and that they would likely begin “normalizing” rates with at least three cuts before year-end 2024. Of course, the street initially took that to mean seven rate cuts over the next year. The street has subsequently trimmed that expectation to just one cut in September as inflation continues to run too hot.
March 31, 2024 marked the end of the fiscal year for the Fund. Since the end of the last fiscal year, the Fund posted a 5.85% total return (Class I share). The S&P 500 TR Index recorded a gain of 29.88% during the same period. A bifurcation of returns between the Magnificent Seven described above and the average S&P 500 stock significantly distorted and exaggerated the performance of the major cap-weighted indexes. Since the Fund did not own any of these seven overvalued and overhyped stocks, the Fund experienced a relative performance deficit over the past 12-month period versus the benchmark index.
Geopolitical developments in the Middle East between Israel and its adversaries – Hamas, Hezbollah, Houthis, and Iran – specifically with respect to the shipping routes that pass through the Red Sea and the Suez Canal, have put pressure on energy prices and have negatively impacted supply chains since October 7th. The evidence continues to suggest that capital expenditures spending priorities have resumed their focus on robotics and automation solutions, but there has been a notable impact on the timing of new projects and initiatives. Nevertheless, it remains our view that the mandate to improve operational efficiencies will remain foremost as companies large and small adapt to the new realities of the post-COVID world.
While mergers and acquisitions (M&A) have helped the Fund’s performance in previous years, the termination of the iRobot acquisition by Amazon has many small-cap companies in the space rethinking their timelines for profitability. Our strategy of focusing on leading-edge technologies and the core end-market beneficiaries of the automation theme has benefitted from M&A activity in the past, but it has never been dependent upon M&A for success. Indeed, we engaged in a culling of certain profitless growth stories from the Fund’s holdings in 1Q24. This portfolio management action has allowed us to further consolidate the Fund around the strongest fundamental growth stories in the robotics and automation universe – those which are generating high free cash flow growth – and with which we currently maintain the highest conviction.
During the past year, the Fund’s top performing position was Doosan Robotics, up 115% during the period. The company is a leading provider of advanced industrial robots for production process automation based in South Korea. Their products are used primarily for precision assembly tasks in the automotive, consumer electronics, healthcare and food & beverage industries. A new addition in 2023, automated voice pioneer, SoundHound AI, was the second largest contributor to the Fund’s results last year. The stock gained 83% year-over-year. The company’s proprietary independent voice AI platform allows its customers across the automotive, hospitality, entertainment, and electronics industries to voice-enable their products and services. Procept BioRobotics, the Fund’s fourth largest holding, logged the number three performance rank last year, posting an annual total return of 79%. The maker of the AQUABEAM advanced, image-guided, surgical robotic system is setting new standards in safety and efficacy for the treatment of BHP.
While these examples were important to the Fund’s fiscal year results, they simply represent the broad array of companies and technologies that populate the Fund’s holdings. The Fund remains laser-focused on identifying and capitalizing upon advances and innovative technologies that are changing the world by investing in the companies that are driving this change.
Thank you for your support and participation in the Fund.
Sincerely,
Brian Gahsman, Portfolio Manager
This report is intended for the Fund’s shareholders. It may not be distributed to prospective investors unless it is preceded or accompanied by the current Fund prospectus. To obtain a prospectus or other information about the Fund, please visit www.AlphaCentricFunds.com or call 844-ACFUNDS (844-223-8637). Please read the prospectus carefully before investing.
The Fund’s returns for the fiscal year ended 3/31/24 and for the period since inception through 3/31/24, as compared to the Benchmark Index, were as follows:
| | Fiscal Year Ended | Since Inception |
| | 3/31/2024 | 5/31/17 |
| Class I | 5.85 | 5.49 |
| | | |
| Class A | 5.60 | 5.23 |
| | | |
| Class A w/Sales Charge | -0.49 | 4.32 |
| | | |
| Class C | 4.79 | 4.44 |
| | | |
| S&P 500 Total Return Index1 | 29.88 | 14.05 |
| | | |
| MSCI AC World Index TR Gross2 | 23.81 | 10.44 |
| + | The AlphaCentric Robotics and Automation Fund Class A, Class C and Class I commenced operations on May 31, 2017. |
The Fund’s maximum sales charge for Class “A” shares is 5.75%. Performance is historic and does not guarantee future results. Investment return and principal value will fluctuate with changing market conditions so that when redeemed, shares may be worth more or less than their original cost. Current performance may be lower or higher than the performance data quoted. To obtain the most recent month end performance information or the Fund’s prospectus please call the Fund, toll free at 1-844-ACFUNDS (844-223-8637). You can also obtain a prospectus at www.AlphaCentricFunds.com.
3353-NLD-05022024
| 1 | The S&P 500 Total Return Index, a registered trademark of McGraw-Hill Co., Inc., is a market capitalization-weighted index of 500 widely held common stocks. |
| 2 | The MSCI AC World Index TR Gross represents the Modern Index Strategy and captures all sources of equity returns in 23 developed and 24 emerging markets. |
AlphaCentric Robotics and Automation Fund
PORTFOLIO REVIEW (Unaudited)
March 31, 2024
The Fund’s performance figures* for the periods ended March 31, 2024, compared to its benchmarks:
| | | | Annualized | Annualized | Annualized |
| | | One Year | Three Years | Five Years | Since Inception+ |
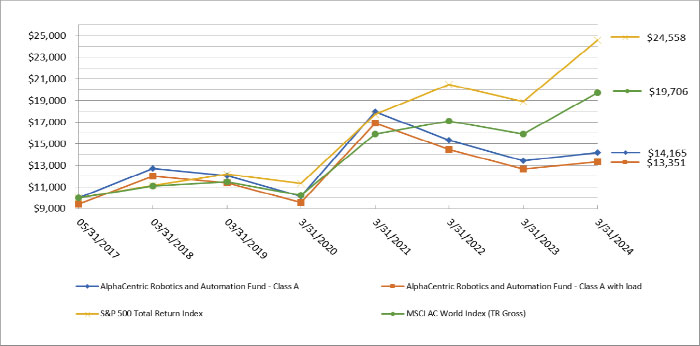
| | Class A (GNXAX) without load | 5.60% | (7.58)% | 3.27% | 5.23% |
| | Class A (GNXAX) with 5.75% load | (0.49)% | (9.38)% | 2.05% | 4.32% |
| | Class C (GNXCX) | 4.79% | (8.28)% | 2.50% | 4.44% |
| | Class I (GNXIX) | 5.85% | (7.37)% | 3.52% | 5.49% |
| | S&P 500 Total Return Index ** | 29.88% | 11.49% | 15.05% | 14.05% |
| | MSCI AC World Index (TR Gross) *** | 23.81% | 7.46% | 11.45% | 10.44% |
| * | The performance data quoted here represents past performance. Current performance may be lower or higher than the performance data quoted above. Investment return and principal value will fluctuate, so that shares, when redeemed, may be worth more or less than their original cost. Class A is subject to a maximum applicable sales charge of 5.75% and a maximum deferred sales charge of 1.00% on investments at or above the $1 million breakpoint (where you do not pay a sales charge) on shares redeemed within 18 months of purchase. Total returns are calculated using the net asset value (“NAV”) on March 28, 2024. The returns shown do not reflect the deduction of taxes that a shareholder would pay on Fund distributions or on the redemptions of Fund shares. Past performance is no guarantee of future results. Performance figures for periods greater than 1 year are annualized. The Fund’s adviser has contractually agreed to reduce its fees and/or absorb expenses of the Fund, at least until July 31, 2024, to ensure that the net annual fund operating expenses (excluding brokerage costs; borrowing costs, such as (a) interest and (b) dividends on securities sold short; taxes; costs of investing in underlying funds and extraordinary expenses) will not exceed 1.65%, 2.40% and 1.40% for the Fund’s Class A, Class C, and Class I shares, respectively, subject to possible recoupment from the Fund in future years. Fee waivers and expense reimbursements are subject to possible recoupment by the adviser from the Fund in future years on a rolling three-year basis (within three years after the fees have been waived or reimbursed) if such recoupment can be achieved within the foregoing expense limits and any expense limits in place at the time of recoupment. Without these waivers, the Fund’s total annual operating expenses as shown in the August 1, 2023 prospectus for the Fund’s period of operation are 2.31%, 3.06% and 2.06% for the Fund’s Class A, Class C and Class I shares, respectively. After fee waivers, the Fund’s total annual operating expenses shown in the August 1, 2023 prospectus for the Fund’s period of operation are 1.65%, 2.40% and 1.40% for the Fund’s Class A, Class C and Class I shares, respectively. Please review the Fund’s most recent prospectus for more detail on the expense waiver. For more current information on the Fund’s expense ratio, please see the Financial Highlights. For performance information current to the most recent month-end, please call toll-free 1-844-223-8637. |
| ** | The S&P 500 Total Return Index, a registered trademark of McGraw-Hill Co., Inc., is a market capitalization-weighted index of 500 widely held common stocks. Investors cannot invest directly in an index. |
| *** | The MSCI AC World Index (TR Gross) represents the Modern Index Strategy and captures all sources of equity returns in 23 developed and 24 emerging markets. Investors cannot invest directly in an index. |
| + | The AlphaCentric Robotics and Automation Fund Class A, Class C and Class I commenced operations on May 31, 2017. |
Comparison of the Change in value of a $10,000 investment
| Holdings by Security Type | | % of Net Assets | |
| Common Stocks | | | 98.7 | % |
| Investment Purchased as Securities Lending Collateral | | | 26.6 | % |
| Money Market Fund | | | 2.3 | % |
| Liabilities In Excess Of Other Assets | | | (27.6 | )% |
| | | | 100.0 | % |
Please refer to the Schedule of Investments in this Annual Report for a detailed listing of the Fund’s holdings.
March 31, 2024
AlphaCentric Symmetry Strategy Fund (SYMIX | SYMAX | SYMCX) (unaudited)
Dear Shareholders:
The Fund returned 9.57% (Class I shares) for fiscal year 2024, while the blended MSCI World/U.S. Aggregate Bond Blended Index (“Benchmark”) returned 14.23%. The traditional portfolio, which invests in stocks and credit, contributed the bulk of the gains as equity markets broadly increased and credit spreads tightened. The alternative portfolio, which invests in commodities, fixed income and currencies, detracted a little with commodity positions generating positive returns that were offset by losses in fixed income and currency markets. This is largely the mirror image of last year, and that diversification is at the heart of the strategy, resulting in a return of 6.03% annually over the last three years compared to 3.28% annually for the Benchmark.
The past year was characterized by the continued bumpy drop in inflation which, using the headline Consumer Price Index (CPI) number, peaked at 9% in the summer of 2022. A year later it hit 3% and since then has bounced around somewhat stubbornly just north of that level. Core CPI has had a similar trajectory. Inflation falling and the end point for rate rises coming into clearer view was supportive for equity valuations and credit spreads, particularly as the feared recession that rate rises would cause failed to materialize. Indeed, the unemployment rate in the US has been 4% or less since January 2022. Remarkable resilience. Equity and credit exposures remained at the upper end of the target ranges after being rebuilt in the early part of 2023 and stayed high through the year. The strategy holds positions in several industrials that continue to perform well, beneficiaries of the infrastructure and fiscal packages passed through Congress during this administration. It takes time for the legislation to filter its way through to the real economy and be spent, we are seeing it now and it will continue for the next few years. United Rentals and Paccar Inc. are good examples of this type of business, both reported strong fundamentals in the most recent quarter and are leaders in the spaces in which they operate. Although at the index level the equity markets look expensive, under the surface there are many companies at much cheaper valuations executing on their business consistently.
As the inflationary panic subsided somewhat, the alternative side that tends to thrive on panics and volatility did its job, contributing through the first part of the year before seeing some losses as many of the trends that have done so well over the past few years began to subside. The nature of trend following is that one is always positioned at the end of trends. As rate hike fears subsided and markets moved to price rate cuts (too many too quickly as it turned out) the alternative side reduced short, fixed income positions. This is why we rebalance religiously between the elements of the strategy, maintaining the symmetry.
As we look ahead over the next 12 months, we believe the outlook for the US economy remains fairly upbeat. As we noted briefly above, the fiscal packages will likely support growth over the rest of the year. Alongside that, assuming the inflation story doesn’t lead central banks to restart hikes, a gradual easing of policy as inflation continues to normalize should help support the interest rate sensitive sectors of the economy, some of which have been struggling. The US economy has under produced housing for years leading to construction continuing apace on the residential side, and a newly reinvigorated industrial policy around key industries of the future has led to a boom in manufacturing construction. Throw in some AI based activity as companies compete to not get left behind in the brave new world and some higher commodity prices helping the oil space and the economy looks in fine shape for now.
One thing to note, we think monetary policy at this juncture has the potential to be powerful if the economy were to slow and inflation comes down. Generally speaking, it has been the interest rate sensitive sectors that have slowed. If the Federal Reserve reduces rates in response to a slowing economy, we could see a wave of refinancing and pent-up activity coming back quite quickly. For all the talk of homeowners being locked into their 3% rates, life has been continuing apace. People have families and get new jobs. Home sales are down some 25% from pre pandemic levels – there is still a lot of activity in the 75% that are moving. They will refinance mortgages quickly, and at some point, other borrowers may tap the increased equity in their homes for consumption as well. Housing equity is at record levels. The Fed looks less stuck than it has for a while – again assuming inflation cooperates.
As it relates to the strategy, the key areas where we see risks of derailment are in the areas where the alternative side can potentially shine brightest. Oil and copper price spikes setting off inflation again could be a real worry for the stock market, the strategy can take direct exposures there. A generally stickier inflation path may challenge equity valuations, the ability to participate in rising bond yields through shorts in bond markets and longs in the USD also allows flexibility
to adapt to what may be ahead. Being able to adapt to changing times and take long and short positions in a broader range of markets is at the core of the strategy approach.
Thank you for your support, and we hope that you stay healthy and safe in 2024.
Sincerely,
Mount Lucas Management LP Team
This report is intended for the Fund’s shareholders. It may not be distributed to prospective investors unless it is preceded or accompanied by the current Fund prospectus. To obtain a prospectus or other information about the Fund, please visit www.AlphaCentricFunds.com or call 844-ACFUNDS (844-223-8637). Please read the prospectus carefully before investing.
The Fund’s returns for the fiscal year ended 3/31/24 and for the period since inception through 3/31/24, as compared to the Benchmark Index, were as follows:
| | Fiscal Year | |
| | Ended | |
| | 3/31/2024 | Since Inception* |
| Class A | 9.28 | 4.86 |
| | | |
| Class A w/ Sales Charge | 3.00 | 3.53 |
| | | |
| Class C | 8.46 | 4.06 |
| | | |
| BofA Merrill Lynch 3-Month U.S. Treasury Bill Index (1) | 5.27 | 1.99 |
| | | |
| MSCI World/Bloomberg U.S. Aggregate Bond Blended Index (2) | 14.23 | 6.33 |
| | | |
| Class I | 9.57 | 3.74 |
| | | |
| BofA Merrill Lynch 3-Month U.S. Treasury Bill Index (1) | 5.27 | 1.44 |
| | | |
MSCI World/Bloomberg U.S. Aggregate Bond Blended Index (2) | 14.23 | 5.13 |
| * | Inception (annualized): 9/1/14 (I Share) | 8/9/19 (A & C Shares) |
The Fund acquired all of the assets and liabilities of MLM Symmetry Fund, LP (the “Predecessor Fund”) in a tax-free reorganization on August 9, 2019. In connection with this acquisition, shares of the Predecessor Fund were exchanged for Class I shares of the Fund. The Fund’s investment objectives, policies, restrictions, and guidelines are, in all material respects, equivalent to the Predecessor Fund’s investment objectives, policies, restrictions, and guidelines. The Fund’s sub-advisor was the adviser to the Predecessor Fund.
| (1) | BofA Merrill Lynch 3-Month U.S. Treasury Bill Index is an unmanaged market index of U.S. Treasury securities maturing in 90 days that assumes reinvestment of all income. Investors cannot invest directly in an index. |
| (2) | MSCI World Index is a broad global equity index that represents large and mid-cap equity performance across all 23 developed markets countries. It covers approximately 85% of the free float-adjusted market capitalization in each country. The Bloomberg U.S. Aggregate Bond index is a broad-based benchmark that measures the investment grade, U.S. dollar-denominated, fixed-rate taxable bond market, including Treasuries, government-related and corporate securities, MBS (agency fixed-rate and hybrid ARM pass-throughs), ABS, and CMBS. Investors cannot invest directly in an index. |
The Fund’s maximum sales charge for Class “A” shares is 5.75%. Dividends are not assured. Investments in mutual funds involve risks. Performance is historic and does not guarantee future results. Investment return and principal value will fluctuate with changing market conditions so that when redeemed, shares may be worth more or less than their original cost. Current performance may be lower or higher than the performance data quoted. To obtain the most recent month end performance information or the Fund’s prospectus please call the Fund, toll free at 844-ACFUNDS (844-223-8637). You can also obtain a prospectus at www.AlphaCentricFunds.com. 5411-NLD-5/14/2024
AlphaCentric Symmetry Strategy Fund
PORTFOLIO REVIEW (Unaudited)
March 31, 2024
The Fund’s performance figures* for the periods ended March 31, 2024, compared to its benchmarks:
| | | Annualized | Annualized | Annualized | Annualized |
| | One Year | Three Years | Five Years | Since Inception+ | Since Inception++ |
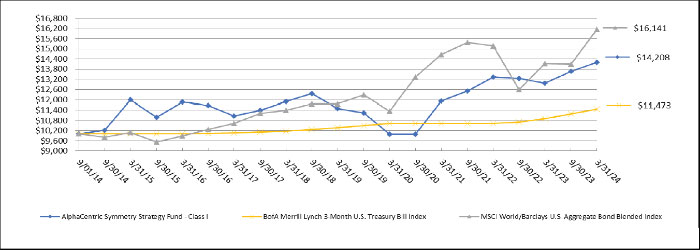
| Class A (SYMAX) without load | 9.28% | 5.80% | — | 4.86% | — |
| Class A (SYMAX) with 5.75% load | 3.00% | 3.73% | — | 3.53% | — |
| Class C (SYMCX) | 8.46% | 4.98% | — | 4.06% | — |
| Class I (SYMIX) +++ | 9.57% | 6.03% | 4.34% | — | 3.74% |
| BofA Merrill Lynch 3-Month U.S. Treasury Bill Index ** | 5.27% | 2.60% | 2.03% | 1.99% | 1.44% |
| MSCI World/Bloomberg U.S. Aggregate Bond Blended Index *** | 14.23% | 3.28% | 6.53% | 6.33% | 5.13% |
| * | The performance data quoted here represents past performance. Current performance may be lower or higher than the performance data quoted above. Investment return and principal value will fluctuate, so that shares, when redeemed, may be worth more or less than their original cost. Class A is subject to a maximum applicable sales charge of 5.75% and a maximum deferred sales charge of 1.00% on investments at or above the $1 million breakpoint (where you do not pay a sales charge) on shares redeemed within 18 months of purchase. Total returns are calculated using the net asset value (“NAV”) on March 28, 2024. The returns shown do not reflect the deduction of taxes that a shareholder would pay on Fund distributions or on the redemptions of Fund shares. Past performance is no guarantee of future results. Performance figures for periods greater than 1 year are annualized. The Fund’s adviser has contractually agreed to reduce its fees and/or absorb expenses of the Fund, at least until July 31, 2024, to ensure that the net annual fund operating expenses (excluding brokerage costs; borrowing costs, such as (a) interest and (b) dividends on securities sold short; taxes; costs of investing in underlying funds and extraordinary expenses) will not exceed 1.85%, 2.60% and 1.60% for the Fund’s Class A, Class C, and Class I shares, respectively, subject to possible recoupment from the Fund in future years. Fee waivers and expense reimbursements are subject to possible recoupment by the adviser from the Fund in future years on a rolling three-year basis (within three years after the fees have been waived or reimbursed) if such recoupment can be achieved within the foregoing expense limits and any expense limits in place at the time of recoupment. Without these waivers, the Fund’s total annual operating expenses as shown in the August 1, 2023 prospectus are 2.03%, 2.78% and 1.78% for the Fund’s Class A, Class C and Class I shares, respectively. After fee waivers, the Fund’s total annual operating expenses shown in the August 1, 2023 prospectus are 1.93%, 2.68% and 1.68% for the Fund’s Class A, Class C and Class I shares, respectively. Please review the Fund’s most recent prospectus for more detail on the expense waiver. For more current information on the Fund’s expense ratio, please see the Financial Highlights. For performance information current to the most recent month-end, please call toll-free 1-844-223-8637. |
| ** | BofA Merrill Lynch 3-Month U.S. Treasury Bill Index tracks the performance of the U.S. dollar denominated U.S. Treasury Bills publicly issued in the U.S. domestic market with a remaining term to final maturity of less than 3 months. Investors cannot invest directly in an index. |
| *** | MSCI World/Bloomberg U.S. Aggregate Bond Blended Index reflects an unmanaged portfolio of 60% of the MSCI World Index and 40% of the Bloomberg U.S. Aggregate Bond Index. Investors cannot invest directly in an index. |
| + | The AlphaCentric Symmetry Strategy Fund Class A, Class C commenced operations on August 8, 2019. |
| ++ | The AlphaCentric Symmetry Strategy Fund Class I, formerly a private fund, commenced operations on September 1, 2014. |
| +++ | The Fund acquired all of the assets and liabilities of MLM Symmetry Fund, LP (the “Predecessor Fund”) in a tax-free reorganization on August 9, 2019. In connection with this acquisition, shares of the Predecessor Fund were exchanged for Class I shares of the Fund. The Fund’s investment objectives, policies, restrictions, and guidelines are, in all material respects, equivalent to the Predecessor Fund’s investment objectives, policies, restrictions, and guidelines. The Fund’s sub-advisor was the adviser to the Predecessor Fund. The financial statements for the Predecessor Fund can be found in the Fund’s SAI. The performance information set forth below reflects the historical performance of the Predecessor Fund shares. Updated performance information will be available at no cost by calling 1-844-ACFUNDS (844-223-8637) or visiting the Fund’s website at www.AlphaCentricFunds.com |
Comparison of the Change in value of a $10,000 investment
| Holdings by Security Type * | | % of Net Assets | |
| Exchange-Traded Funds | | | 34.9 | % |
| Common Stocks | | | 30.4 | % |
| U.S. Government & Agencies | | | 19.6 | % |
| Short-term Investment | | | 13.1 | % |
| Other Assets in Excess of Liabilities | | | 2.0 | % |
| | | | 100.0 | % |
| * | Does not include derivative investments. |
Please refer to the Schedule of Investments in this Annual Report for a detailed listing of the Fund’s holdings.
March 31, 2024
AlphaCentric LifeSci Healthcare Fund (LYFIX | LYFAX | LYFCX) (unaudited)
Dear Shareholders:
Performance
The Fund experienced fits and starts for the fiscal year ended March 31, 2024 as fundamental, thesis-driven stock picking took a back seat to macro considerations. Waxing and waning expectations for rate cuts from the Federal Reserve drove volatility in the S&P Biotechnology Select Index (“Index”) which was inversely correlated to the 10-year treasury yield. The Fund created alpha from holdings benefiting from Mergers & Acquisitions (M&A) transactions, favorable earnings announcements, positive fundamental company-specific news and avoidance of negative clinical or regulatory developments through October before the fed “pivot party” strongly increased select risk asset prices through the end of March. October was a tough month for the Index with >80% of the components in the red, with more than half of these down over 10%. Remarkably, before the rally, a record >30% of the entire biotech universe was trading below cash value, and more than 70% had an enterprise value below $100 million. The momentum factor had been the primary driver of returns in the last few months of the fiscal year, with many depressed biotech companies not participating in the rally – particularly small-cap commercial companies. The Fund did not attempt to chase momentum names that were bid up and held a number of value-oriented commercial companies that appeared to be mispriced. The Fund remains nimble and continues to seek asymmetric risk/reward opportunities for the portfolio that are poised to create potential value regardless of the trajectory of the broader economic environment.
Market Overview
The fiscal year ended with the Financial Times reporting US small-cap stocks had the worst performance run versus large cap peers in more than 20 years. Expectations are growing among strategists that the Fed intends to enact a soft removal of the 2% inflation target with Powell's comments that the goal will be reached "over time." The Index remains in the midst of the longest and deepest bear market in its history. We believe this should eventually be a tailwind for the many biotech stocks that remain left for dead, especially small-cap commercial companies. The Fed may be further motivated to start cutting rates despite some hotter economic data, due to the $1.1 trillion in interest payments on US government debt made in the past 12 months. Additionally, government spending is now growing at ~10% year-over-year, adding ~$1.0 trillion to the debt every 100 days. Although uncertainty remains regarding the timing and magnitude of potential interest rate cuts, US 2-Year/10-Year Spreads have been inverted for a record >625 days (prior record was 624 in August ’78) and it appears we are closer to the end of the interest rate cycle than the beginning.
Following half a decade of consecutive outperformance from 2011-2015, biotech has underperformed the Nasdaq from 2016-2023 for 8 years and the S&P 500 for 5 of those 8 years. Expectations for lower interest rates, sustained biotech M&A activity, continued new approvals of cutting-edge new therapies, and resurgent capital markets activity appear to be converging to potentially reverse biotech’s record relative underperformance. To be sure, the Federal Trade Commission’s defeat at blocking Amgen's (AMGN) ~$28 billion acquisition of Horizon Therapeutics (HZNP) bolstered expectations for sustained deal activity. Pharma drug sales were +3% in 2023 and are forecasted to grow 7% compounded through 2028 setting the backdrop sustained demand for new innovations.
The Food and Drug Administration (FDA) remained constructive in the fiscal year, given that 2023 was a banner year for new pharmaceutical products with 55 approvals, more than all prior years but two since 1985 (59 new drug approvals in 2018 and 1996). Included was the landmark approval of the first medicine incorporating gene editing technology. Crisper Therapeutics' (CRSP) Casgevy was approved for Sickle Cell Disease (SCD) and will be priced at $2.2 million per treatment. BioMarin (BMRN) continued the streak of high-profile regulatory approvals with FDA clearance of the first gene therapy for hemophilia A. BMRN plans to price Roctavian at $2.9 million per patient. FDA approved another gene therapy by giving the nod to Krystal Biotech's (KRYS) Vyjuvek for patients with dystrophic epidermolysis bullosa (DEB) with mutation(s) in the collagen type VII alpha 1 chain (COL7A1) gene. List price equates to >$1 million per patient per year for induction and ~$600k for maintenance use, leading KRYS to estimate a >$750 million global market opportunity despite there being only ~3000 DEB patients in the US. Finally, Seres Therapeutics (MCRB) announced the watershed regulatory approval oral microbiome therapy Vowst for the prevention of recurrence of C. difficile infection. The therapy will be priced at $17.5K per course and is the first microbiome therapy approval by the agency. Investor sentiment for
an accommodative FDA has become sanguine to the point where new approvals are even expected for certain drugs that fail to meet prespecified clinical criteria.
Fund Overview
The Fund benefited from M&A activity during the fiscal year with exposure to Cymabay Therapeutics (CBAY), NuVation Bio (NUVB), Immunogen (IMGN), Karuna Therapeutics (KRTX), Mirati Therapeutics (MRTX) and Point Biopharma (PNT). Gilead (GILD) announced the acquisition of CBAY for $4.3 billion representing a ~25% premium to prior close. The deal was generally well-received and values the company at 4-8x peak sales of lead drug seladelpar for primary biliary cirrhosis (PBC). The deal emphasizes pharma's seemingly insatiable appetite for differentiated assets. The Fund also benefited from the all-stock merger of NuVation Bio (NUVB) with AnHeart Therapeutics (private). The acquisition adds taletrectinib, a next-generation, potentially best-in-class ROS1 inhibitor with Breakthrough Therapy Designations currently enrolling two pivotal studies for the treatment of patients with ROS1-positive NSCLC. NUVB had been trading at a negative enterprise value and rallied on the news of the deal. Abbvie (ABBV) announced the acquisition of IMGN for a total equity value of approximately $10.1 billion, representing a 95% premium to the prior closing price. Valuation was ~5.5x consensus 2030 revenue estimates, in line with other recent oncology deals such as Pfizer's (PFE) purchase of Seagen (SGEN).
Bristol Myers (BMY) announced plans to acquire Karuna Therapeutics (KRTX) for $330 per share in an all-cash deal representing a 53% premium and $14 billion in value. The deal emphasized the value for novel mechanisms in established CNS indications such as schizophrenia. Bristol Myers (BMY) also announced the acquisition of Mirati Therapeutics (MRTX) for $4.9 billion cash upfront plus a contingent value right (CVR) for an additional $1 billion. Eli Lilly (LLY) stepped in front of pivotal data with the $1.4 billion purchase on PNT. The deal was an 87% premium to the prior close. Curiously, the announcement came ahead of PNT2002's Phase III SPLASH dataset in Q4 for pre-chemo prostate cancer. It turned out the SPLASH data came in below expectations and PNT would likely have faced a significant drawdown if it were not for the pending acquisition. The Fund was fortunate to benefit from LLY’s apparent strategic interest in acquiring a radiopharmaceutical platform and manufacturing assets regardless of the outcome of the SPLASH trial. The Fund continues to strive to increase exposure to holdings that might benefit from M&A transactions.
The Fund participated in a number of primary share transactions providing capital to directly fund R&D initiatives during the year. Specifically, the Fund participated in the $87 million private placement in Perspective therapeutics (CATX). The deal helped enable the company to advance its radiopharmaceutical pipeline focused on the alpha emitting isotope PB-212. The transaction was priced at $0.37 and shares closed the fiscal year at $1.19. Likewise, the Fund participated in an $88 million private placement for Vyne Therapeutics (VYNE). Prior to the deal, VYNE was trading at a depressed valuation of only ~$7 million market cap and the financing provides the company with ample runway to reach the next set of clinical milestones. The Fund also joined the syndicate for Abivax’s (ABVX) $236 million US NASDAQ IPO. The deal was intended to fund the company through phase 3 clinical data for lead inflammatory drug obefazimod in Ulcerative colitis. The Fund continues to look for primary share purchase opportunities that provide capital to allow companies to get through key development goals and potentially unlock value in the process.
The Fund’s companies with robust revenue and cash flow growth profiles continued to execute, but operational progress has not consistently translated into favorable share price performance as many SMID cap commercial companies remain under macro pressure. The Fund also benefited from shareholder capital return initiatives. For example, United Therapeutics (UTHR) announced a $1 billion accelerated share repurchase program (~9% of shares outstanding).
Outlook
The biotech bear market has been around quite a while, after completing its twelfth quarter to end the fiscal year. Signs of life are abounding as the Relative Strength Index for the Index went from 25 to 75 in less than four months to end the fiscal year, taking less than half the time as the last such move from the pandemic lockdowns. Many companies remain at depressed valuations, having yet to participate in the broader risk asset rally setting up for a long-anticipated reversal of the record relative underperformance. We continue to expect sustained biotech M&A activity, new approvals of cutting edge novel therapies and resurgent capital markets activity to create value in the sector. Of course, the ultimate realization of lower interest rates has the potential to position the risk for biotech to the upside once again.
Sincerely,
Mark Charest, Ph.D.
Founding Partner and Portfolio Manager
LifeSci Fund Management
This report is intended for the Fund’s shareholders. It may not be distributed to prospective investors unless it is preceded or accompanied by the current Fund prospectus. To obtain a prospectus or other information about the Fund, please visit www.AlphaCentricFunds.com or call 844-ACFUNDS (844-223-8637). Please read the prospectus carefully before investing.
The Fund’s returns for the fiscal year ended 3/31/24 and for the period since inception through 3/31/24, as compared to the Benchmark Index, were as follows:
| | Fiscal Year Ended 3/31/2024 | Since Inception 11/29/2019 |
| Class I | -0.56 | 11.39 |
| Class A | -0.79 | 11.16 |
| Class A w/ Sales Charge | -6.47 | 9.65 |
| Class C | -1.50 | 10.53 |
| S&P Biotechnology Select Industry Index1 | 25.67 | 0.56 |
| S&P 500 Total Return Index2 | 29.88 | 14.44 |
The Fund’s maximum sales charge for Class “A” shares is 5.75%. Performance is historic and does not guarantee future results. Investment return and principal value will fluctuate with changing market conditions so that when redeemed, shares may be worth more or less than their original cost. Current performance may be lower or higher than the performance data quoted. To obtain the most recent month end performance information or the Fund’s prospectus please call the Fund, toll free at 1-844-ACFUNDS (844-223-8637). You can also obtain a prospectus at www.AlphaCentricFunds.com.
5410-NLD-5/14/2024
1 The S&P Biotechnology Select Industry Index represents the biotechnology sub-industry portion of the S&P Total Markets Index (S&P TMI). The S&P TMI tracks all the U.S. common stocks listed on the NYSE, NYSE American, NASDAQ National Market and NASDAQ Small Cap exchanges. The S&P Biotechnology Select Industry Index is a modified equal weight index and typically consists of approximately 70 companies. Investors cannot invest directly in an index.
2 The S&P 500 Total Return Index is a widely recognized, unmanaged index of the approximately 500 largest companies in the United States as measured by market capitalization.
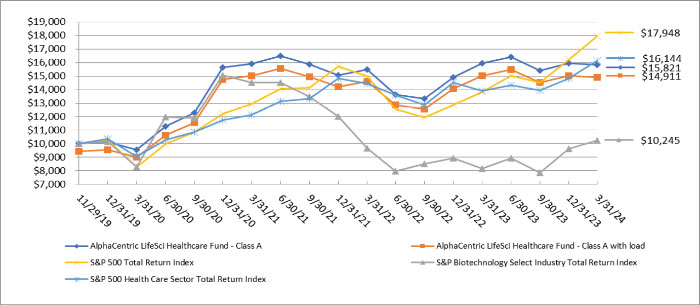
AlphaCentric LifeSci Healthcare Fund
PORTFOLIO REVIEW (Unaudited)
March 31, 2024
The Fund’s performance figures* for the periods ended March 31, 2024, compared to its benchmarks:
| | | Annualized | Annualized |
| | One Year | Three Years | Since Inception+ |
| Class A (LYFAX) without load | (0.79)% | (0.21)% | 11.16% |
| Class A (LYFAX) with 5.75% load | (6.47)% | (2.16)% | 9.65% |
| Class C (LYFCX) | (1.50)% | (0.96)% | 10.53% |
| Class I (LYFIX) | (0.56)% | 0.04% | 11.39% |
| S&P 500 Total Return Index ** | 29.88% | 11.49% | 14.44% |
| S&P Biotechnology Select Industry Total Return Index *** | 25.67% | (11.00)% | 0.56% |
| S&P 500 Health Care Sector Total Return Index **** | 16.09% | 10.01% | 11.68% |
| * | The performance data quoted here represents past performance. Current performance may be lower or higher than the performance data quoted above. Investment return and principal value will fluctuate, so that shares, when redeemed, may be worth more or less than their original cost. Class A is subject to a maximum applicable sales charge of 5.75% and a maximum deferred sales charge of 1.00% on investments at or above the $1 million breakpoint (where you do not pay a sales charge) on shares redeemed within 18 months of purchase. Total returns are calculated using the net asset value (“NAV”) on March 28, 2024. The returns shown do not reflect the deduction of taxes that a shareholder would pay on Fund distributions or on the redemptions of Fund shares. Past performance is no guarantee of future results. Performance figures for periods greater than 1 year are annualized. The Fund’s adviser has contractually agreed to reduce its fees and/or absorb expenses of the Fund, at least until July 31, 2024, to ensure that the net annual fund operating expenses (excluding brokerage costs; borrowing costs, such as (a) interest and (b) dividends on securities sold short; taxes; costs of investing in underlying funds and extraordinary expenses) will not exceed 1.65%, 2.40% and 1.40% for the Fund’s Class A, Class C, and Class I shares, respectively, subject to possible recoupment from the Fund in future years. Fee waivers and expense reimbursements are subject to possible recoupment by the adviser from the Fund in future years on a rolling three-year basis (within three years after the fees have been waived or reimbursed) if such recoupment can be achieved within the foregoing expense limits and any expense limits in place at the time of recoupment. Without these waivers, the Fund’s total annual operating expenses as shown in the August 1, 2023 prospectus are 2.00%, 2.75% and 1.75% for the Fund’s Class A, Class C and Class I shares, respectively. After fee waivers, the Fund’s total annual operating expenses as shown in the August 1, 2023 prospectus are 1.65%, 2.40% and 1.40% for the Fund’s Class A, Class C and Class I shares, respectively. Please review the Fund’s most recent prospectus for more detail on the expense waiver. For more current information on the Fund’s expense ratio, please see the Financial Highlights. For performance information current to the most recent month-end, please call toll-free 1-844-223-8637. |
| ** | The S&P 500 Total Return Index, a registered trademark of McGraw-Hill Co., Inc., is a market capitalization-weighted index of 500 widely held common stocks. Investors cannot invest directly in an index. |
| *** | S&P Biotechnology Select Industry Total Return Index is designed to measure the performance of narrow GICS® sub-industries. The Index comprises stocks in the S&P Total Market Index that are classified in the GICS biotechnology sub-industry. Investors cannot invest directly in an index. |
| **** | S&P 500 Health Care Sector Total Return Index is designed to measure the performance of narrow GICS® health care sub-industries. The Index comprises stocks in the S&P Total Market Index that are classified in the GICS health care sub-industry. Investors cannot invest directly in an index. |
| + | The AlphaCentric LifeSci Healthcare Fund Class A, Class C and Class I commenced operations on November 29, 2019. |
Comparison of the Change in value of a $10,000 investment
| Holdings by Security Type | | % of Net Assets | |
| Common Stocks | | | 93.8 | % |
| Short-term Investments | | | 6.2 | % |
| Liabilities in Excess of Other Assets | | | (0.0 | )% * |
| | | | 100.0 | % |
Please refer to the Schedule of Investments in this Annual Report for a detailed listing of the Fund’s holdings.
March 31, 2024
Dear AlphaCentric Strategic Income Fund (“the Fund”) Investor:
The Fund’s performance for the year ended March 31, 2024, was 18.00% (for the Class I Shares) versus 10.36% for the S&P U.S. REIT Index and 1.39% for the Bloomberg Barclays U.S. Mortgage-Backed Securities Index. The Fund also outperformed most other funds in Morningstar’s Real Estate Fund category for the same period.
Typical real estate funds continue to take predominantly equity type risk in commercial real estate by virtue of their extensive holdings of common shares in equity REITs. On the contrary, typical mortgage bond funds are hamstrung by their inability to take advantage of tangential opportunities in the equity market. We believe the Fund’s flexibility to invest “across the capital structure” differentiates it from most funds in the space and enables it to construct a portfolio capable of producing attractive risk-adjusted returns.
As financial pundits look back at 2023 and summarize economic and market developments, there is one common theme – surprise. While the twists and turns of markets throughout the year were somewhat unpredictable, by the end of the year, investors were generally rewarded for taking risk and resisting the allure of 5% money market rates. While depleted asset values at poorly hedged banks were unsurprising to us given our involvement in the mortgage bond market, the prospect of financial market contagion and a potential credit crunch became a significant risk in 2023. As we discussed at the time, tightening financial conditions stemming from the bank turmoil also ironically had the potential to be the knockout punch in the fight against inflation. While inflation wasn’t knocked out in 2023, as the year progressed upward, consumer price pressure increasingly appeared to be “on the ropes.” However, the market rebound in the middle of the year proved to be short-lived as rates sold off sharply in the August-October period. Inflation and jobs numbers moderated again in November and market sentiment sharply shifted in the context of a more highly probable “soft landing.” Although the “Magnificent 7” were responsible for almost half of the U.S. equity market gains by the end of the year, the rally in 4Q2023 put most parts of the market into positive territory for 2023.
The main theme of the Fund continued to play off the strength in the U.S. residential housing market. The Fund continued to be overweight in subsectors tied to residential mortgage credit – ranging from residential mortgage REITs to RMBS bonds. We believe when there is discernable fundamental strength in one part of the market, investors are apt to invest lower down in the capital structure to find the best risk/reward. Despite a historic rise in interest rates in 2022, as we anticipated, housing data remained relatively resilient throughout 2023. Low housing supply and ample mortgage borrower equity continued to be the drivers of strength in the housing market and correspondingly low residential mortgage defaults.
The rally across risk assets at the end of 2023 spilled over into 1Q2024 as many equities continued to march higher. Once a pipe dream, the “soft landing” scenario became the base case for many market participants. However, “animal spirits” were less present in real estate-related equities in 1Q2024 as REIT indices underperformed the broader market. This underperformance was mainly a result of the markets’ recognition that stubbornly high interest rates will likely continue to be a headwind for commercial property valuations. Most regional bank stocks, unsurprisingly to us, and an area of the market where the Fund has no exposure, also posted losses for 1Q2024 as commercial real estate woes, depleted asset prices, and deposit flight risk remain unresolved issues.
Yields across our target markets remain elevated and support the Fund’s managed monthly distribution of nine cents per share. This is the equivalent of an annualized yield of 6.58% based on the March 31, 2024 NAV.
In our opinion, the recent underperformance of residential mortgage equities and some parts of the structured credit market has presented an attractive opportunity. Looking ahead to the remainder of 2024, we believe many mortgage-related equities which are trading at unusually large discounts to book value are poised to generate attractive total returns. We also see deep value opportunities in certain parts of the structured (RMBS and CMBS) and corporate credit markets.
We believe the Fund is we are well-positioned for 2024 as it is focused on deep value opportunities in fundamentally sound parts of the real estate market. As fundamentals and market pricing evolve, we will aim to make use of the Fund’s flexibility and take advantage of dislocations in different parts of the real estate/mortgage markets.
We thank you for your investment and remind you that we are also investors in the Fund. Have a happy and healthy 2024!
Sincerely,
David Gregory
Portfolio Manager
This report is intended for the Fund’s shareholders. It may not be distributed to prospective investors unless it is preceded or accompanied by the current Fund prospectus. To obtain a prospectus or other information about the Fund, please visit www.AlphaCentricFunds.com or call 844-ACFUNDS (844-223-8637). Please read the prospectus carefully before investing.
The Fund’s returns for the fiscal year ended 3/31/24 and for the period since inception through 3/31/24, as compared to the Benchmark Index, were as follows:
| | Fiscal Year Ended | |
| | 3/31/2024 | Since Inception* |
| Class I | 18.00 | 11.39 |
| | | |
| S&P US REIT Index1 | 10.36 | 7.29 |
| | | |
| Bloomberg U.S. Mortgage Backed Securities Index USD2 | 1.39 | 1.27 |
| | | |
| Class A | 17.77 | 1.84 |
| | | |
| Class A w/ Sales Charge | 12.18 | 0.12 |
| | | |
| Class C | 16.88 | 1.08 |
| | | |
| S&P US REIT Index1 | 10.36 | 1.21 |
| | | |
| Bloomberg U.S. Mortgage Backed Securities Index USD2 | 1.39 | -3.12 |
| | | |
| Class I 30-Day SEC Yield – Subsidized | 6.22% | |
| | | |
| Class I 30-Day SEC Yield – Un-Subsidized | 5.44% | |
| * | Inception (annualized): 8/1/2011 (I Share) | 5/28/2021 (A & C Shares) |
Performance before May 28, 2021 is for the Fund’s Predecessor Fund (Strategos Deep Value Fund LP). The prior performance is net of management fees and other expenses including the effect of the performance fee. The Predecessor Fund had an investment objective and strategies that were, in all material respects, the same as those of the Fund, and was managed in a manner that, in all material respects, complied with the investment guidelines and restrictions of the Fund. From its inception to May 28, 2021, the Predecessor Fund was not subject to certain investment restrictions, diversification requirements and other restrictions of the Investment Company Act of 1940 or the Internal Revenue Code, which if they had been applicable, might have adversely affected its performance. In addition, the Predecessor Fund was not subject to sales loads that would have adversely affected performance. Performance of the Predecessor Fund is not an indicator of future results.
The 30-Day SEC Yield represents net investment income earned by the Fund over the 30-day period ending 3/31/2024, expressed as an annual percentage rate based on the Fund’s share price at the end of the 30-day period. Subsidized SEC 30-Day Yield reflects fee waivers and/or expense reimbursements during the period.
| 1 | The Bloomberg U.S. Mortgage Backed Securities Index tracks fixed-rate agency mortgage backed pass-through securities guaranteed by Ginnie Mae, Fannie Mae, and Freddie Mac. Investors cannot invest directly in an index. |
| 2 | The S&P U.S. States REIT Index defines and measures the investable universe of publicly traded real estate investment trusts domiciled in the United States. Investors cannot invest directly in an index. |
The Fund’s maximum sales charge for Class “A” shares is 4.75%. Performance is historic and does not guarantee future results. Investment return and principal value will fluctuate with changing market conditions so that when redeemed, shares may be worth more or less than their original cost. Current performance may be lower or higher than the performance data quoted. To obtain the most recent month end performance information or the Fund’s prospectus please call the Fund, toll free at 1-844-ACFUNDS (844-223-8637). You can also obtain a prospectus at www.AlphaCentricFunds.com. 3354-NLD-05/06/2024
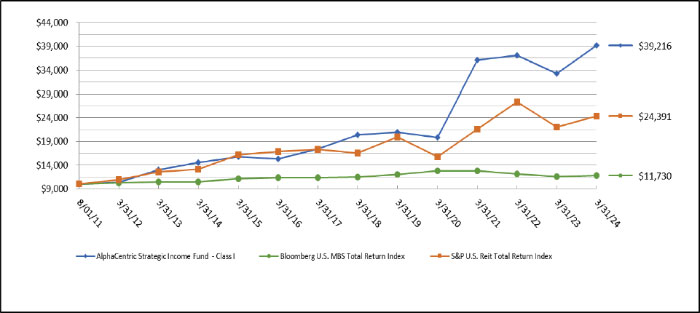
AlphaCentric Strategic Income Fund
PORTFOLIO REVIEW (Unaudited)
March 31, 2024
The Fund’s performance figures* for the periods ended March 31, 2024, compared to its benchmarks:
| | | Annualized | Annualized | Annualized | Annualized | Annualized |
| | One Year | Three Years | Five Years | Ten Years | Since Inception+ | Since Inception++ |
| Class A (SIIAX) | 17.77% | — | — | — | 1.84% | — |
| Class A (SIIAX) with 4.75% load | 12.18% | — | — | — | 0.12% | — |
| Class C (SIICX) | 16.88% | — | — | — | 1.08% | — |
| Class I (SIIIX) +++ | 18.00% | 2.76% | 13.41% | 10.46% | — | 11.39% |
| Bloomberg U.S. MBS Total Return Index ** | 1.39% | (2.84)% | (0.39)% | 1.12% | (3.12)% | 1.27% |
| S&P U.S. REIT Index Total Return *** | 10.36% | 4.10% | 4.04% | 6.45% | 1.21% | 7.29% |
| * | The performance data quoted here represents past performance. Current performance may be lower or higher than the performance data quoted above. Investment return and principal value will fluctuate, so that shares, when redeemed, may be worth more or less than their original cost. Class A is subject to a maximum applicable sales charge of 4.75% and a maximum deferred sales charge of 1.00% on investments at or above the $1 million breakpoint (where you do not pay a sales charge) on shares redeemed within 18 months of purchase. Total returns are calculated using the net asset value (“NAV”) on March 28, 2024. The returns shown do not reflect the deduction of taxes that a shareholder would pay on Fund distributions or on the redemptions of Fund shares. Past performance is no guarantee of future results. Performance figures for periods greater than 1 year are annualized. The Fund’s adviser has contractually agreed to reduce its fees and/or absorb expenses of the Fund, at least until July 31, 2024, to ensure that the net annual fund operating expenses (excluding brokerage costs; borrowing costs, such as (a) interest and (b) dividends on securities sold short; taxes; costs of investing in underlying funds and extraordinary expenses) will not exceed 1.74%, 2.49% and 1.49% for the Fund’s Class A, Class C, and Class I shares, respectively, subject to possible recoupment from the Fund in future years. Fee waivers and expense reimbursements are subject to possible recoupment by the adviser from the Fund in future years on a rolling three-year basis (within three years after the fees have been waived or reimbursed) if such recoupment can be achieved within the foregoing expense limits and any expense limits in place at the time of recoupment. Without these waivers, the Fund’s estimated total annual operating expenses as shown in the August 1, 2023 prospectus for the Fund’s initial fiscal period are 2.38%, 3.13% and 2.13% for the Fund’s Class A, Class C and Class I shares, respectively. After fee waivers, the Fund’s total annual operating expenses shown in the August 1, 2023 prospectus for the Fund’s initial fiscal period are 1.75%, 2.50% and 1.50% for the Fund’s Class A, Class C and Class I shares, respectively. Please review the Fund’s most recent prospectus for more detail on the expense waiver. For more current information on the Fund’s expense ratio, please see the Financial Highlights. For performance information current to the most recent month-end, please call toll-free 1-844-223-8637. |
| ** | The Bloomberg U.S. MBS Total Return Index tracks fixed-rate agency mortgage backed pass-through securities guaranteed by Ginnie Mae (GNMA), Fannie Mae (FNMA), and Freddie Mac (FHLMC). Investors cannot invest directly in an index. |
| *** | The S&P U.S. REIT Index Total Return defines and measures the investable universe of publicly traded real estate investment trusts domiciled in the United States.. Investors cannot invest directly in an index or benchmark. |
| + | The AlphaCentric Strategic Income Fund Class A and Class C commenced operations on May 28, 2021. |
| ++ | The AlphaCentric Strategic Income Fund Class I commenced operations on April 1, 2011. |
| +++ | The Fund acquired all of the assets and liabilities of Strategos Deep Value Fund LP (the “Predecessor Fund”) in a tax-free reorganization on May 28, 2021. In connection with this acquisition, shares of the Predecessor Fund were exchanged for Class I shares of the Fund. The Fund’s investment objectives, policies, restrictions, and guidelines are, in all material respects, equivalent to the Predecessor Fund’s investment objectives, policies, restrictions, and guidelines. The Fund’s sub-advisor is Goshen Rock Capital, LLC (“GRC”). GRC is an SEC registered investment advisor founded in 2021. The financial statements for the Predecessor Fund can be found in the Fund’s SAI. The performance information set forth below reflects the historical performance of the Predecessor Fund shares. Updated performance information will be available at no cost by calling 1-844-ACFUNDS (844-223-8637) or visiting the Fund’s website at www.AlphaCentricFunds.com |
Comparison of the Change in value of a $10,000 investment
| Holdings by Security Type | | % of Net Assets | |
| Common Stocks | | | 41.4 | % |
| Preferred Stocks | | | 14.5 | % |
| Asset Backed Securities | | | 12.4 | % |
| Convertible Bonds | | | 12.2 | % |
| Short-Term Investment | | | 9.2 | % |
| Corporate Bonds | | | 4.2 | % |
| U.S. Government & Agencies | | | 2.5 | % |
| Collateralized Mortgage Obligations | | | 2.1 | % |
| Exchange-Traded Fund | | | 0.8 | % |
| Other Assets in Excess of Liabilities | | | 0.7 | % |
| | | | 100.0 | % |
Please refer to the Schedule of Investments in this Annual Report for a detailed listing of the Fund’s holdings.
| ALPHACENTRIC INCOME OPPORTUNITIES FUND (IOFAX, IOFCX, IOFIX) |
| SCHEDULE OF INVESTMENTS |
| March 31, 2024 |
| Principal | | | | | | | Coupon | | | | | |
| Amount ($) | | | | | Spread | | Rate (%) | | Maturity | | Fair Value | |
| | | | | NON-AGENCY RESIDENTIAL MORTGAGE BACKED SECURITIES — 105.1% | | | | | |
| | 14,189,000 | | | ABFC 2007-NC1 Trust Series 2007-NC1 M1(a),(b) | | TSFR1M + 1.114% | | 0.1880 | | 05/25/37 | | $ | 9,355,166 | |
| | 1,401,326 | | | ABFS Mortgage Loan Trust 2003-2 Series 2003-2 B(a),(c) | | | | 6.1830 | | 04/25/34 | | | 669,288 | |
| | 678,000 | | | ACE Securities Corp Home Equity Loan Trust Series 2004-SD1 M4(b) | | TSFR1M + 4.239% | | 4.3750 | | 11/25/33 | | | 653,980 | |
| | 79,701 | | | ACE Securities Corp Home Equity Loan Trust Series 2004-FM2 M3(b) | | TSFR1M + 2.139% | | 3.6910 | | 06/25/34 | | | 64,671 | |
| | 339,176 | | | ACE Securities Corp Home Equity Loan Trust Series 2004-RM2 M4(b) | | TSFR1M + 1.434% | | 3.4720 | | 01/25/35 | | | 314,545 | |
| | 4,459,090 | | | ACE Securities Corp Home Equity Loan Trust Series 2005-HE2 M7(b) | | TSFR1M + 1.959% | | 0.7390 | | 04/25/35 | | | 2,933,630 | |
| | 4,812,091 | | | ACE Securities Corp Home Equity Loan Trust Series 2006-ASP4 M1(b) | | TSFR1M + 0.549% | | 3.0080 | | 08/25/36 | | | 4,324,534 | |
| | 5,786,266 | | | Adjustable Rate Mortgage Trust 2005-2 Series 2005-2 6M3(b) | | TSFR1M + 1.464% | | 6.7900 | | 06/25/35 | | | 4,274,077 | |
| | 89,487 | | | Adjustable Rate Mortgage Trust 2005-3 Series 2005-3 1A2(c) | | | | 4.9320 | | 07/25/35 | | | 84,734 | |
| | 1,269,009 | | | Alternative Loan Trust 2006-OA22 Series 2006-OA22 A3(b) | | TSFR1M + 0.594% | | 4.6320 | | 02/25/47 | | | 1,095,936 | |
| | 4,963,302 | | | American Home Mortgage Investment Trust 2006-1 Series 2006-1 1A2(b) | | TSFR1M + 0.494% | | 5.4280 | | 03/25/46 | | | 4,277,836 | |
| | 1,037,239 | | | Ameriquest Mort Sec Inc Ass Bk Pas Thr Certs Ser Series 2002-2 M4(b) | | TSFR1M + 3.414% | | 1.8390 | | 08/25/32 | | | 920,072 | |
| | 3,488,649 | | | Ameriquest Mortgage Securities Asset-Backed Series 2005-R5 M7(b) | | TSFR1M + 1.944% | | 4.4400 | | 07/25/35 | | | 3,377,608 | |
| | 1,291,665 | | | Ameriquest Mortgage Securities Asset-Backed Series 2005-R10 M7(b) | | TSFR1M + 2.289% | | 4.1200 | | 01/25/36 | | | 1,153,059 | |
| | 2,788 | | | Amresco Residential Securities Corp Mort Loan Series 1999-1 M2(b) | | TSFR1M + 1.464% | | 7.2900 | | 11/25/29 | | | 2,517 | |
| | 2,435,160 | | | Banc of America Mortgage 2004-K Trust Series 2004-K B1(c) | | | | 5.3100 | | 12/25/34 | | | 1,884,393 | |
| | 373,100 | | | Bear Stearns ALT-A Trust Series 2004-7 1A1(c) | | | | 2.6250 | | 10/25/34 | | | 253,487 | |
| | 1,290,235 | | | Bear Stearns ALT-A Trust 2004-11 Series 2004-11 1M2(b) | | TSFR1M + 1.689% | | 4.9450 | | 11/25/34 | | | 1,194,442 | |
| | 22,423 | | | Bear Stearns ARM Trust 2003-8 Series 2003-8 1A2(c) | | | | 6.3180 | | 01/25/34 | | | 20,531 | |
| | 1,753,121 | | | Bear Stearns Asset Backed Securities I Trust Series 2007-HE7 M2(b) | | TSFR1M + 1.864% | | 4.5800 | | 10/25/37 | | | 1,563,981 | |
| | 45,368,500 | | | Carrington Mortgage Loan Trust Series 2006-FRE1 Series 2006-FRE1 M1(b) | | TSFR1M + 0.414% | | 3.5970 | | 07/25/36 | | | 34,088,472 | |
| | 8,790,607 | | | Carrington Mortgage Loan Trust Series 2006-NC4 Series 2006-NC4 M1(b) | | TSFR1M + 0.414% | | 5.7400 | | 10/25/36 | | | 4,982,450 | |
| | 8,852,459 | | | Carrington Mortgage Loan Trust Series 2006-RFC1 Series 2006-RFC1 M2(b) | | TSFR1M + 0.549% | | 3.8260 | | 05/25/36 | | | 7,615,123 | |
| | 13,774,911 | | | Carrington Mortgage Loan Trust Series 2007-RFC1 Series 2007-RFC1 M1(b) | | TSFR1M + 0.374% | | 5.7000 | | 12/25/36 | | | 11,085,469 | |
| | 58,269 | | | Centex Home Equity Loan Trust 2004-B Series 2004-B M7(b) | | TSFR1M + 2.439% | | 5.7190 | | 03/25/34 | | | 2,743 | |
| | 159,734 | | | CHL Mortgage Pass-Through Trust 2004-6 Series 2004-6 M(c) | | | | 11.2520 | | 05/25/34 | | | 162,909 | |
| | 14,454,834 | | | CIT Mortgage Loan Trust 2007-1 Series 2007-1 2M3(a),(b) | | TSFR1M + 1.864% | | 4.7910 | | 10/25/37 | | | 10,072,940 | |
| | 42,560,754 | | | CIT Mortgage Loan Trust 2007-1 Series 2007-1 1M3(a),(b) | | TSFR1M + 1.864% | | 5.2030 | | 10/25/37 | | | 30,892,052 | |
| | 4,849,862 | | | Citigroup Mortgage Loan Trust 2006-WMC1 Series 2006-WMC1 M2(b) | | TSFR1M + 0.729% | | 2.6690 | | 12/25/35 | | | 3,213,217 | |
| | | | | | | | | | | | | | | |
See accompanying notes to financial statements.
| ALPHACENTRIC INCOME OPPORTUNITIES FUND (IOFAX, IOFCX, IOFIX) |
| SCHEDULE OF INVESTMENTS (Continued) |
| March 31, 2024 |
| Principal | | | | | | | Coupon | | | | | |
| Amount ($) | | | | | Spread | | Rate (%) | | Maturity | | Fair Value | |
| | | | | NON-AGENCY RESIDENTIAL MORTGAGE BACKED SECURITIES — 105.1% (Continued) | | | | | |
| | 10,805,790 | | | Citigroup Mortgage Loan Trust 2007-AHL1 Series 2007-AHL1 M2(b) | | TSFR1M + 0.519% | | 2.3610 | | 12/25/36 | | $ | 10,650,757 | |
| | 606,844 | | | Citigroup Mortgage Loan Trust, Inc. Series 2005-OPT1 M8(b) | | TSFR1M + 2.049% | | 3.8562 | | 02/25/35 | | | 489,501 | |
| | 133,646 | | | Countrywide Asset-Backed Certificates Series 2003-SD2 B1(a),(b) | | TSFR1M + 5.739% | | 4.9240 | | 10/25/32 | | | 161,945 | |
| | 2,489,511 | | | Countrywide Asset-Backed Certificates Series 2004-11 M6(b) | | TSFR1M + 2.739% | | 2.7540 | | 11/25/34 | | | 1,384,848 | |
| | 2,672,847 | | | Countrywide Asset-Backed Certificates Series 2006-2 M3(b) | | TSFR1M + 0.774% | | 4.4240 | | 06/25/36 | | | 2,555,014 | |
| | 3,683,313 | | | Countrywide Asset-Backed Certificates Series 2007-BC2 M1(b) | | TSFR1M + 0.454% | | 4.5400 | | 06/25/37 | | | 2,072,690 | |
| | 4,128,129 | | | Countrywide Asset-Backed Certificates Series 2007-2 M1(b) | | TSFR1M + 0.334% | | 3.8900 | | 08/25/37 | | | 3,401,121 | |
| | 1,346,837 | | | Credit Suisse First Boston Mortgage Securities Series 2001-HE22 M1(b) | | TSFR1M + 1.614% | | 6.3522 | | 02/25/32 | | | 2,161,532 | |
| | 1,238,572 | | | Credit Suisse First Boston Mortgage Securities Series 2004-FRE1 B4(b) | | TSFR1M + 3.964% | | 9.2220 | | 04/25/34 | | | 772,064 | |
| | 1,672,937 | | | Credit-Based Asset Servicing and Securitization, Series 2003-RP1 M2(a),(b) | | TSFR1M + 4.614% | | 0.1449 | | 03/25/33 | | | 1,208,380 | |
| | 3,629,519 | | | Credit-Based Asset Servicing and Securitization, Series 2007-SP2 M7(a),(d) | | | | 3.9500 | | 03/25/46 | | | 1,130,997 | |
| | 1,397,836 | | | Delta Funding Home Equity Loan Trust 1997-3 Series 1997-3 B1F | | | | 2.7520 | | 10/25/28 | | | 1,331,208 | |
| | 1,188,267 | | | Delta Funding Home Equity Loan Trust 1998-1 Series 1998-1 M1F(b) | | TSFR1M + 0.939% | | 3.3430 | | 05/25/30 | | | 1,027,233 | |
| | 907,375 | | | Delta Funding Home Equity Loan Trust 1999-1 Series 1999-1 B(c) | | | | 4.4520 | | 03/15/28 | | | 788,289 | |
| | 1,720,412 | | | Delta Funding Home Equity Loan Trust 1999-2 Series 1999-2 M1 | | | | 2.9240 | | 08/15/30 | | | 1,357,136 | |
| | 5,665,499 | | | EMC Mortgage Loan Trust 2005-B Series 2005-B M2(a),(b) | | TSFR1M + 2.364% | | 6.0800 | | 04/25/42 | | | 5,406,472 | |
| | 1,724,282 | | | Finance America Mortgage Loan Trust 2004-3 Series 2004-3 M5(b) | | TSFR1M + 1.764% | | 3.4418 | | 11/25/34 | | | 1,294,866 | |
| | 2,068,002 | | | First Franklin Mortgage Loan Trust 2003-FF4 Series 2003-FF4 M2(b) | | TSFR1M + 2.590% | | 7.9100 | | 10/25/33 | | | 1,773,897 | |
| | 3,934,331 | | | First Franklin Mortgage Loan Trust 2005-FF5 Series 2005-FF5 M5(b) | | TSFR1M + 1.314% | | 3.6190 | | 05/25/35 | | | 3,312,045 | |
| | 2,960,758 | | | First Franklin Mortgage Loan Trust 2006-FF7 Series 2006-FF7 M1(b) | | TSFR1M + 0.489% | | 5.8100 | | 05/25/36 | | | 2,263,400 | |
| | 7,865,477 | | | First Franklin Mortgage Loan Trust 2006-FF9 Series 2006-FF9 M1(b) | | TSFR1M + 0.489% | | 5.2750 | | 06/25/36 | | | 6,373,196 | |
| | 1,436,727 | | | First Franklin Mortgage Loan Trust2006-FF3 Series 2006-FF3 M2(b) | | TSFR1M + 0.699% | | 3.9140 | | 02/25/36 | | | 1,183,237 | |
| | 1,975,222 | | | Fremont Home Loan Trust 2004-3 Series 2004-3 M5(b) | | TSFR1M + 1.989% | | 7.3100 | | 11/25/34 | | | 1,348,158 | |
| | 2,045,674 | | | GSAA Home Equity Trust 2005-4 Series 2005-4 B1(b) | | TSFR1M + 1.839% | | 2.5800 | | 03/25/35 | | | 1,595,668 | |
| | 7,366 | | | GSR Mortgage Loan Trust 2005-7F Series 2005-7F 3A1(b) | | TSFR1M + 0.614% | | 5.9350 | | 09/25/35 | | | 7,214 | |
| | 971,577 | | | GSRPM Mortgage Loan Trust Series 2004-1 Series 2004-1 B2(a),(b) | | TSFR1M + 5.364% | | 3.6930 | | 09/25/42 | | | 897,634 | |
| | 1,197,775 | | | HarborView Mortgage Loan Trust 2006-12 Series 2006-12 2A2B(b) | | TSFR1M + 0.614% | | 3.5530 | | 01/19/38 | | | 1,770,343 | |
| | 2,276,918 | | | Home Equity Asset Trust 2005-6 Series 2005-6 M6(b) | | TSFR1M + 1.179% | | 3.8100 | | 12/25/35 | | | 2,923,844 | |
| | 137,218 | | | Impac CMB Trust Series 2004-10 Series 2004-10 3M1(b) | | TSFR1M + 0.969% | | 5.8710 | | 03/25/35 | | | 127,568 | |
| | 19,100 | | | IndyMac INDX Mortgage Loan Trust 2004-AR6 Series 2004-AR6 6A2(c) | | | | 5.2930 | | 10/25/34 | | | 17,504 | |
| | 1,009,772 | | | IXIS Real Estate Capital Trust 2005-HE2 Series 2005-HE2 M6(b) | | TSFR1M + 1.149% | | 6.4700 | | 09/25/35 | | | 1,168,551 | |
| | 11,158,493 | | | Long Beach Mortgage Loan Trust 2005-3 Series 2005-3 M1(b) | | TSFR1M + 0.819% | | 1.2732 | | 08/25/45 | | | 9,181,652 | |
| | 300,857 | | | MAFI II Remic Trust 1998-A Series 1998-AX B2 | | | | 6.0000 | | 02/20/27 | | | 265,128 | |
| | | | | | | | | | | | | | | |
See accompanying notes to financial statements.
| ALPHACENTRIC INCOME OPPORTUNITIES FUND (IOFAX, IOFCX, IOFIX) |
| SCHEDULE OF INVESTMENTS (Continued) |
| March 31, 2024 |
| Principal | | | | | | | Coupon | | | | | |
| Amount ($) | | | | | Spread | | Rate (%) | | Maturity | | Fair Value | |
| | | | | NON-AGENCY RESIDENTIAL MORTGAGE BACKED SECURITIES — 105.1% (Continued) | | | | | |
| | 335,913 | | | MASTR Alternative Loan Trust 2002-2 Series 2002-2 B3(c) | | | | 7.1600 | | 10/25/32 | | $ | 3 | |
| | 1,497,751 | | | Mastr Asset Backed Securities Trust 2004-HE1 Series 2004-HE1 M10(b) | | TSFR1M + 5.364% | | 10.1400 | | 09/25/34 | | | 1,246,761 | |
| | 4,741,554 | | | Mastr Asset Backed Securities Trust 2007-HE1 Series 2007-HE1 M1(b) | | TSFR1M + 0.414% | | 0.2680 | | 05/25/37 | | | 3,831,107 | |
| | 1,462,000 | | | Mastr Specialized Loan Trust Series 2005-3 M2(a),(b) | | TSFR1M + 1.989% | | 3.6361 | | 11/25/35 | | | 947,164 | |
| | 6,357,309 | | | Mastr Specialized Loan Trust Series 2006-1 M2(a),(b) | | TSFR1M + 2.514% | | 3.4310 | | 01/25/36 | | | 4,142,158 | |
| | 1,228,134 | | | Meritage Mortgage Loan Trust 2004-2 Series 2004-2 M4(b) | | TSFR1M + 1.839% | | 4.3940 | | 01/25/35 | | | 1,022,582 | |
| | 17,459 | | | Merrill Lynch Mortgage Investors Trust MLMI Series 2003-A1 2A(b) | | TSFR12M + 2.340% | | 6.5500 | | 12/25/32 | | | 16,574 | |
| | 51,359 | | | Merrill Lynch Mortgage Investors Trust MLMI Series 2003-A2 2A2(b) | | TSFR6M + 1.928% | | 5.9750 | | 02/25/33 | | | 48,229 | |
| | 203,740 | | | Merrill Lynch Mortgage Investors Trust Series MLCC Series 2005-A B2(b) | | TSFR1M + 1.119% | | 6.4400 | | 03/25/30 | | | 144,464 | |
| | 3,091,519 | | | Merrill Lynch Mortgage Investors Trust Series MLCC Series 2006-1 M1(c) | | | | 5.2680 | | 02/25/36 | | | 2,245,172 | |
| | 313,695 | | | Morgan Stanley A.B.S Capital I Inc Trust 2004-WMC3 Series 2004-WMC3 M6(b) | | TSFR1M + 1.764% | | 4.0700 | | 01/25/35 | | | 379,270 | |
| | 6,067,036 | | | Morgan Stanley A.B.S Capital I Inc Trust 2005-WMC5 Series 2005-WMC5 B1(b) | | TSFR1M + 1.914% | | 0.2414 | | 06/25/35 | | | 4,477,791 | |
| | 4,502,362 | | | Morgan Stanley A.B.S Capital I Inc Trust 2007-HE6 Series 2007-HE6 M1(b) | | TSFR1M + 0.374% | | 5.7000 | | 05/25/37 | | | 6,488,355 | |
| | 39,187 | | | Morgan Stanley Mortgage Loan Trust 2004-7AR Series 2004-7AR 2A7(c) | | | | 5.7890 | | 09/25/34 | | | 38,233 | |
| | 6,790,533 | | | Nationstar Home Equity Loan Trust 2007-B Series 2007-B M2(b) | | TSFR1M + 0.584% | | 4.5680 | | 04/25/37 | | | 7,829,002 | |
| | 332,437 | | | New Century Home Equity Loan Trust Series 2004-A M2(c) | | | | 2.9845 | | 08/25/34 | | | 332,808 | |
| | 3,710,846 | | | New Century Home Equity Loan Trust 2006-2 Series 2006-2 M1(b) | | TSFR1M + 0.579% | | 4.9000 | | 08/25/36 | | | 2,799,058 | |
| | 11,684,000 | | | New Residential Mortgage Loan Trust 2019-RPL3 Series RPL3 B1(a),(c) | | | | 4.0060 | | 07/25/59 | | | 9,936,273 | |
| | 16,451 | | | Nomura Asset Acceptance Corp Alternative Loan Series 2003-A1 A5 | | | | 7.0000 | | 04/25/33 | | | 16,452 | |
| | 4,360 | | | Nomura Asset Acceptance Corp Alternative Loan Series 2003-A1 A2 | | | | 6.0000 | | 05/25/33 | | | 4,255 | |
| | 3,126,335 | | | NovaStar Mortgage Funding Trust Series 2003-1 Series 2003-1 M2(b) | | TSFR1M + 3.114% | | 4.0300 | | 05/25/33 | | | 2,577,025 | |
| | 2,963,818 | | | Option One Mortgage Loan Trust 2005-5 Series 2005-5 M4(b) | | TSFR1M + 0.984% | | 3.5630 | | 12/25/35 | | | 2,554,984 | |
| | 14,911,279 | | | Option One Mortgage Loan Trust 2007-CP1 Series 2007-CP1 M1(b) | | TSFR1M + 0.414% | | 5.7400 | | 03/25/37 | | | 13,236,014 | |
| | 3,575,428 | | | Park Place Securities Inc Asset-Backed Series 2004-WHQ2 M7(b) | | TSFR1M + 2.739% | | 3.9450 | | 02/25/35 | | | 2,332,270 | |
| | 3,769,072 | | | Park Place Securities Inc Asset-Backed Series 2005-WHQ3 M7(b) | | TSFR1M + 1.914% | | 3.2330 | | 06/25/35 | | | 3,015,858 | |
| | 4,220,998 | | | RAAC Series 2006-RP2 Trust Series 2006-RP2 M2(a),(b) | | TSFR1M + 1.635% | | 6.6940 | | 02/25/37 | | | 3,497,541 | |
| | 12,973,800 | | | RAAC Series 2007-SP3 Trust Series 2007-SP3 M1(b) | | TSFR1M + 2.364% | | 7.1730 | | 09/25/47 | | | 8,458,836 | |
| | 1,811,398 | | | RASC Series 2005-EMX1 Trust Series 2005-EMX1 B(a),(b) | | TSFR1M + 4.614% | | 5.6020 | | 03/25/35 | | | 1,346,635 | |
| | 1,408,255 | | | RASC Series 2005-KS2 Trust Series 2005-KS2 M3(b) | | TSFR1M + 0.884% | | 5.2000 | | 03/25/35 | | | 1,222,652 | |
| | 2,985,889 | | | RASC Series 2006-EMX1 Trust Series 2006-EMX1 M3(b) | | TSFR1M + 0.584% | | 5.4389 | | 01/25/36 | | | 2,135,028 | |
| | | | | | | | | | | | | | | |
See accompanying notes to financial statements.
| ALPHACENTRIC INCOME OPPORTUNITIES FUND (IOFAX, IOFCX, IOFIX) |
| SCHEDULE OF INVESTMENTS (Continued) |
| March 31, 2024 |
| Principal | | | | | | | Coupon | | | | | |
| Amount ($) | | | | | Spread | | Rate (%) | | Maturity | | Fair Value | |
| | | | | NON-AGENCY RESIDENTIAL MORTGAGE BACKED SECURITIES — 105.1% (Continued) | | | | | |
| | 1,714,212 | | | Renaissance Home Equity Loan Trust 2002-1 Series 2002-1 M2(b) | | TSFR1M + 3.039% | | 4.8730 | | 06/25/32 | | $ | 1,316,307 | |
| | 1,229,306 | | | Renaissance Home Equity Loan Trust 2002-2 Series 2002-2 M2(b) | | TSFR1M + 2.364% | | 3.1450 | | 08/25/32 | | | 1,028,037 | |
| | 383,018 | | | Renaissance Home Equity Loan Trust 2003-2 Series 2003-2 M2F(d) | | | | 4.0110 | | 08/25/33 | | | 320,224 | |
| | 7,918,513 | | | Renaissance Home Equity Loan Trust 2005-1 Series 2005-1 M2(d) | | | | 5.9050 | | 05/25/35 | | | 1,053,445 | |
| | 6,367,529 | | | Renaissance Home Equity Loan Trust 2005-2 Series 2005-2 M2(d) | | | | 5.6010 | | 08/25/35 | | | 1,533,132 | |
| | 150,578 | | | SASCO Mortgage Loan Trust 2003-GEL1 Series 2003-GEL1 M3(b) | | TSFR1M + 4.614% | | 4.4080 | | 10/25/33 | | | 138,678 | |
| | 11,209,621 | | | Saxon Asset Securities Trust 2006-2 Series 2006-2 M3(b) | | TSFR1M + 0.594% | | 1.2770 | | 09/25/36 | | | 8,641,297 | |
| | 4,768,938 | | | Saxon Asset Securities Trust 2007-3 Series 2007-3 1M2(b) | | TSFR1M + 1.014% | | 3.4430 | | 09/25/47 | | | 4,768,932 | |
| | 35,155,573 | | | Seasoned Credit Risk Transfer Trust Series 2018-3 Series 3 BX(c) | | | | 0.7970 | | 08/25/57 | | | 12,443,662 | |
| | 7,677,182 | | | Sequoia Mortgage Trust 2004-10 Series 2004-10 XA(c) | | | | 0.0001 | | 11/20/34 | | | 77 | |
| | 847,891 | | | Sequoia Mortgage Trust 2004-10 Series 2004-10 B1(b) | | TSFR1M + 0.864% | | 5.5520 | | 11/20/34 | | | 569,029 | |
| | 476,498 | | | Soundview Home Loan Trust 2005-A Series 2005-A M6(b) | | TSFR1M + 1.464% | | 5.3820 | | 04/25/35 | | | 478,777 | |
| | 5,321,456 | | | Soundview Home Loan Trust 2005-OPT1 Series 2005-OPT1 M5(b) | | TSFR1M + 1.164% | | 3.7560 | | 06/25/35 | | | 3,650,188 | |
| | 9,005,546 | | | Soundview Home Loan Trust 2006-OPT2(b) | | TSFR1M + 0.565% | | 3.1980 | | 05/25/36 | | | 7,257,502 | |
| | 2,776,596 | | | Structured Asset Investment Loan Trust 2004-10 Series 2004-10 M7(b) | | TSFR1M + 3.864% | | 3.8190 | | 11/25/34 | | | 2,877,489 | |
| | 2,208,315 | | | Structured Asset Investment Loan Trust 2005-HE3 Series 2005-HE3 M3(b) | | TSFR1M + 0.909% | | 3.5900 | | 09/25/35 | | | 1,474,330 | |
| | 96,003 | | | Structured Asset Mortgage Investments II Trust Series 2004-AR5 1A2(c) | | | | 4.0840 | | 10/19/34 | | | 81,464 | |
| | 719,795 | | | Structured Asset Mortgage Investments Trust Series 2002-AR4 A2(b) | | TSFR1M + 0.939% | | 6.2600 | | 02/19/33 | | | 564,945 | |
| | 211,232 | | | Thornburg Mortgage Securities Trust 2004-2 Series 2004-2 B2(b) | | TSFR1M + 1.114% | | 4.9540 | | 06/25/44 | | | 162,540 | |
| | 16,964,000 | | | Towd Point Mortgage Trust 2019-4(a),(c) | | | | 4.1630 | | 10/25/59 | | | 12,703,874 | |
| | 757,000 | | | Truman Capital Mortgage Loan Trust Series 2005-1 M3(a),(b) | | TSFR1M + 5.364% | | 4.2910 | | 03/25/37 | | | 668,868 | |
| | 421,026 | | | WaMu Mortgage Pass-Through Certificates Series 2003-AR10 B2(c) | | | | 5.8729 | | 10/25/33 | | | 306,287 | |
| | 104,292 | | | WaMu Mortgage Pass-Through Certificates Series 2002-AR17 2B1(b) | | COF 11 + 1.250% | | 4.6000 | | 11/25/42 | | | 93,289 | |
| | | | | TOTAL NON-AGENCY RESIDENTIAL MORTGAGE BACKED SECURITIES (Cost $291,781,817) | | | 360,391,881 | |
| | | | | | | | | | | | | | | |
See accompanying notes to financial statements.
| ALPHACENTRIC INCOME OPPORTUNITIES FUND (IOFAX, IOFCX, IOFIX) |
| SCHEDULE OF INVESTMENTS (Continued) |
| March 31, 2024 |
| Shares | | | | | Fair Value | |
| | | | | SHORT-TERM INVESTMENT — 0.0%(e) | | | | |
| | | | | MONEY MARKET FUND - 0.0% (e) | | | | |
| | 757 | | | First American Treasury Obligations Fund, Class X, 5.22%(f) (Cost $757) | | $ | 757 | |
| | | | | | | | | |
| | | | | TOTAL INVESTMENTS - 105.1% (Cost $291,782,574) | | $ | 360,392,638 | |
| | | | | LIABILITIES IN EXCESS OF OTHER ASSETS - (5.1)% | | | (17,376,625 | ) |
| | | | | NET ASSETS - 100.0% | | $ | 343,016,013 | |
| REMIC | - Real Estate Mortgage Investment Conduit |
| | |
| COF 11 | - Cost of Funds for the 11th District of San Francisco |
| | |
| TSFR1M | - Term Secured Overnight Financing Rate (SOFR) 1 month |
| | |
| TSFR6M | - Term Secured Overnight Financing Rate (SOFR) 6 month |
| | |
| TSFR12M | - Term Secured Overnight Financing Rate (SOFR) 12 month |
| (a) | Security exempt from registration under Rule 144A or Section 4(2) of the Securities Act of 1933. The security may be resold in transactions exempt from registration, normally to qualified institutional buyers. As of March 31, 2024 the total market value of 144A securities is $93,037,387 or 27.2% of net assets. |
| (b) | Floating rate security, the interest rate of which adjusts periodically based on changes in current interest rates and prepayments on the underlying pool of assets. |
| (c) | Variable rate security; the rate shown represents the rate on March 31, 2024. |
| (d) | Step bond. Coupon rate is fixed rate that changes on a specified date. The rate shown is the current rate at March 31, 2024. |
| (e) | Percentage rounds to less than 0.1%. |
| (f) | Rate disclosed is the seven day effective yield as of March 31, 2024. |
See accompanying notes to financial statements.
| ALPHACENTRIC PREMIUM OPPORTUNITY FUND (HMXAX, HMXCX, HMXIX) |
| SCHEDULE OF INVESTMENTS |
| March 31, 2024 |
| Principal | | | | | Coupon Rate | | | | | |
| Amount ($) | | | | | (%) | | Maturity | | Fair Value | |
| | | | | U.S. GOVERNMENT & AGENCIES — 33.1% | | | | | | | | |
| | | | | U.S. TREASURY BILLS — 19.8% | | | | | | | | |
| | 5,000,000 | | | United States Treasury Bill(a) | | 0.0000 | | 04/18/24 | | $ | 4,987,584 | |
| | 10,000,000 | | | United States Treasury Bill(a) | | 0.0000 | | 11/29/24 | | | 9,672,929 | |
| | | | | | | | | | | | 14,660,513 | |
| | | | | U.S. TREASURY NOTES — 13.3% | | | | | | | | |
| | 5,000,000 | | | United States Treasury Note | | 0.3750 | | 04/15/24 | | | 4,990,485 | |
| | 2,500,000 | | | United States Treasury Note | | 0.3750 | | 09/15/24 | | | 2,445,709 | |
| | 2,500,000 | | | United States Treasury Note | | 2.8750 | | 06/15/25 | | | 2,440,088 | |
| | | | | | | | | | | | 9,876,282 | |
| | | | | TOTAL U.S. GOVERNMENT & AGENCIES (Cost $24,561,501) | | | | | | | 24,536,795 | |
| | | | | | | | | | | | | |
| Shares | | | | | | | | | | | |
| | | | | SHORT-TERM INVESTMENTS — 24.1% | | | | | | | | |
| | | | | MONEY MARKET FUNDS - 24.1% | | | | | | | | |
| | 4,176,179 | | | Fidelity Government Portfolio, Class I, 5.21%(b)(i) | | | | | | | 4,176,179 | |
| | 13,684,381 | | | First American Treasury Obligations Fund, Class X, 5.22%(b) | | | | | | | 13,684,381 | |
| | | | | TOTAL SHORT TERM INVESTMENTS (Cost $17,860,560) | | | | | | | 17,860,560 | |
| Contracts(c) | | | | | Broker/
Counterparty | | Expiration
Date | | Exercise
Price | | | Notional
Value | | | Fair Value | |
| | | | | INDEX OPTIONS PURCHASED - 0.1% | | | | | | | | | | | | | | | | |
| | | | | CALL OPTIONS PURCHASED - 0.1% | | | | | | | | | | | | | | | | |
| | 500 | | | Chicago Board Options Exchange VIX(h) | | IB | | 04/17/2024 | | $ | 17 | | | $ | 850,000 | | | $ | 18,749 | |
| | 600 | | | Chicago Board Options Exchange VIX(h) | | IB | | 04/17/2024 | | | 18 | | | | 1,080,000 | | | | 18,300 | |
| | 1 | | | Chicago Board Options Exchange VIX(h) | | IB | | 04/17/2024 | | | 20 | | | | 2,000 | | | | 22 | |
| | 1 | | | Chicago Board Options Exchange VIX(h) | | IB | | 05/22/2024 | | | 17 | | | | 1,700 | | | | 118 | |
| | 1 | | | Chicago Board Options Exchange VIX(h) | | IB | | 05/22/2024 | | | 18 | | | | 1,800 | | | | 102 | |
| | 1 | | | Chicago Board Options Exchange VIX(h) | | IB | | 05/22/2024 | | | 19 | | | | 1,900 | | | | 89 | |
| | | | | TOTAL CALL OPTIONS PURCHASED (Cost - $105,923) | | | | | 37,380 | |
| | | | | | | | | | | | | | | | | | | | | |
| | | | | TOTAL INDEX OPTIONS PURCHASED (Cost - $105,923) | | | | | | 37,380 | |
| | | | | | | | | | | | | | | | | | | | | |
See accompanying notes to financial statements.
| ALPHACENTRIC PREMIUM OPPORTUNITY FUND (HMXAX, HMXCX, HMXIX) |
| SCHEDULE OF INVESTMENTS (Continued) |
| March 31, 2024 |
| Contracts(d) | | | | | Broker/
Counterparty | | Expiration
Date | | Exercise
Price | | | Notional
Value | | | Fair Value | |
| | | | | FUTURE OPTIONS PURCHASED - 1.1% | | | | | | | | | | | | | | | | |
| | | | | CALL OPTIONS PURCHASED - 1.1% | | | | | | | | | | | | | | | | |
| | 15 | | | Emini SP M Week Option | | SXM | | 04/01/2024 | | $ | 5,320 | | | $ | 3,990,000 | | | $ | 5,363 | |
| | 75 | | | S&P Emini 3rd Week | | SXM | | 04/19/2024 | | | 5,350 | | | | 20,062,500 | | | | 125,625 | |
| | 150 | | | S&P Emini 3rd Week | | SXM | | 05/17/2024 | | | 5,425 | | | | 40,687,500 | | | | 286,874 | |
| | 75 | | | S&P500 Emini Option | | SXM | | 04/30/2024 | | | 5,400 | | | | 20,250,000 | | | | 104,063 | |
| | 75 | | | S&P500 Emini Option | | SXM | | 06/21/2024 | | | 5,600 | | | | 21,000,000 | | | | 80,625 | |
| | 150 | | | S&P500 Emini Option | | SXM | | 05/31/2024 | | | 5,475 | | | | 41,062,500 | | | | 260,625 | |
| | | | | TOTAL CALL OPTIONS PURCHASED (Cost - $773,838) | | | | | 863,175 | |
| | | | | | | | | | | | | | | | | | | | | |
| | | | | PUT OPTIONS PURCHASED - 0.0%(e) | | | | | | | | | | | | | | | | |
| | 15 | | | Emini SP M Week Option | | SXM | | 04/01/2024 | | $ | 5,300 | | | $ | 3,975,000 | | | $ | 6,675 | |
| | | | | | | | | | | | | | | | | | | | | |
| | | | | TOTAL PUT OPTIONS PURCHASED (Cost - $5,400) | | | | | | |
| | | | | | | | | | | | | | | | | | | | | |
| | | | | TOTAL FUTURE OPTIONS PURCHASED (Cost - $779,238) | | | | | 869,850 | |
| | | | | | | | | | | | | | | | | | | | | |
| | | | | TOTAL INVESTMENTS - 58.4% (Cost $43,307,222) | | | | $ | 43,304,585 | |
| | | | | CALL OPTIONS WRITTEN - (0.9)% (Proceeds- $721,898) | | | | | (691,800 | ) |
| | | | | | | | | | | | | | | | | | | | | |
| | | | | PUT OPTIONS WRITTEN – (0.0)%(f) (Proceeds - $30,832) | | | | | (22,580 | ) |
| | | | | OTHER ASSETS IN EXCESS OF LIABILITIES - 42.5% | | | | | 31,577,367 | |
| | | | | NET ASSETS - 100.0% | | | | $ | 74,167,572 | |
| | | | | | | | | | | | | | | | | | | | | |
| Contracts(c) | | | | | Counterparty | | Expiration
Date | | Exercise
Price | | | Notional
Value | | | Fair Value | |
| | | | | WRITTEN INDEX OPTIONS – (0.0)% (f) | | | | | | | | | | | | | | | | |
| | | | | CALL OPTIONS WRITTEN – (0.0)%(f) | | | | | | | | | | | | | | | | |
| | 1 | | | Chicago Board Options Exchange VIX(h) | | IB | | 04/17/2024 | | $ | 19 | | | $ | 1,900 | | | $ | 25 | |
| | | | | | | | | | | | | | | | | | | | | |
| | | | | TOTAL CALL OPTIONS WRITTEN (Proceeds - $80) | | | | | | |
| | | | | | | | | | | | | | | | | | | | | |
| | | | | TOTAL INDEX OPTIONS WRITTEN (Proceeds - $80) | | | | $ | 25 | |
| | | | | | | | | | | | | | | | | | | | | |
| Contracts(d) | | | | | Counterparty | | Expiration
Date | | Exercise
Price | | | Notional
Value | | | Fair Value | |
| | | | | WRITTEN FUTURE OPTIONS - (0.9)% | | | | | | | | | | | | | | | | |
| | | | | CALL OPTIONS WRITTEN - (0.9)% | | | | | | | | | | | | | | | | |
| | 30 | | | Emini SP M Week Option | | SXM | | 04/01/2024 | | $ | 5,340 | | | $ | 8,010,000 | | | $ | 2,850 | |
See accompanying notes to financial statements.
| ALPHACENTRIC PREMIUM OPPORTUNITY FUND (HMXAX, HMXCX, HMXIX) |
| SCHEDULE OF INVESTMENTS (Continued) |
| March 31, 2024 |
| | | | | | | | | | | | | | | | | |
Contracts(d)
(continued) | | | | | Counterparty | | Expiration
Date | | Exercise
Price | | | Notional
Value | | | Fair Value | |
| | | | | WRITTEN FUTURE OPTIONS - (0.9)% | | | | | | | | | | | | | | | | |
| | | | | CALL OPTIONS WRITTEN - (0.9)% (Continued) | | | | | | | | | | | | | | | | |
| | 150 | | | Emini SP M Week Option | | SXM | | 04/01/2024 | | $ | 5,395 | | | $ | 40,462,500 | | | $ | 375 | |
| | 150 | | | Emini SP M Week Option | | SXM | | 04/01/2024 | | | 5,425 | | | | 40,687,500 | | | | 375 | |
| | 150 | | | Emini SP M Week Option | | SXM | | 04/03/2024 | | | 5,405 | | | | 40,537,500 | | | | 1,875 | |
| | 250 | | | S&P Emini 1st Week | | SXM | | 04/05/2024 | | | 5,445 | | | | 68,062,500 | | | | 5,000 | |
| | 155 | | | S&P Emini 3rd Week | | SXM | | 04/19/2024 | | | 5,450 | | | | 42,237,500 | | | | 60,450 | |
| | 310 | | | S&P Emini 3rd Week | | SXM | | 05/17/2024 | | | 5,525 | | | | 85,637,500 | | | | 244,125 | |
| | 50 | | | S&P EMINI Thurs Week | | SXM | | 04/04/2024 | | | 5,415 | | | | 13,537,500 | | | | 875 | |
| | 50 | | | S&P EMINI Tues Week | | SXM | | 04/02/2024 | | | 5,375 | | | | 13,437,500 | | | | 1,375 | |
| | 155 | | | S&P500 Emini Option | | SXM | | 04/30/2024 | | | 5,500 | | | | 42,625,000 | | | | 61,225 | |
| | 150 | | | S&P500 Emini Option | | SXM | | 06/21/2024 | | | 5,700 | | | | 42,750,000 | | | | 76,875 | |
| | 310 | | | S&P500 Emini Option | | SXM | | 05/31/2024 | | | 5,575 | | | | 86,412,500 | | | | 236,375 | |
| | | | | TOTAL CALL OPTIONS WRITTEN (Proceeds - $721,818) | | | | | 691,775 | |
| | | | | | | | | | | | | | | | | | | | | |
| | | | | PUT OPTIONS WRITTEN – (0.0)%(f) | | | | | | | | | | | | | | | | |
| | 150 | | | Emini SP M Week Option | | SXM | | 04/01/2024 | | $ | 4,875 | | | $ | 36,562,500 | | | $ | 750 | |
| | 150 | | | Emini SP M Week Option | | SXM | | 04/01/2024 | | | 5,085 | | | | 38,137,500 | | | | 1,500 | |
| | 30 | | | Emini SP M Week Option | | SXM | | 04/01/2024 | | | 5,280 | | | | 7,920,000 | | | | 5,550 | |
| | 50 | | | Emini SP W Week | | SXM | | 04/03/2024 | | | 5,050 | | | | 12,625,000 | | | | 1,000 | |
| | 150 | | | Emini SP W Week | | SXM | | 04/03/2024 | | | 5,125 | | | | 38,437,500 | | | | 4,125 | |
| | 251 | | | S&P Emini 1st Week | | SXM | | 04/05/2024 | | | 4,975 | | | | 62,436,250 | | | | 7,530 | |
| | 50 | | | S&P EMINI Thurs Week | | SXM | | 04/04/2024 | | | 5,075 | | | | 12,687,500 | | | | 1,500 | |
| | 50 | | | S&P EMINI Tues Week | | SXM | | 04/02/2024 | | | 5,000 | | | | 12,500,000 | | | | 625 | |
| | | | | TOTAL PUT OPTIONS WRITTEN (Proceeds - $30,832) | | | | | 22,580 | |
| | | | | | | | | | | | | | | | | | | | | |
| | | | | TOTAL FUTURE OPTIONS WRITTEN (Proceeds - $752,650) | | | | $ | 714,355 | |
| OPEN FUTURES CONTRACTS | |
| Number of | | | | | | | | | | Value and Unrealized | |
| Contracts | | | Open Long Futures Contracts | | Expiration | | Notional Amount(g) | | | Appreciation | |
| | 4 | | | CME E-Mini NASDAQ 100 Index Future | | 06/21/2024 | | $ | 1,478,000 | | | $ | 29,360 | |
| | 19 | | | CME E-Mini Russell 2000 Index Futures | | 06/21/2024 | | | 2,038,605 | | | | 79,420 | |
| | 135 | | | CME E-Mini Standard & Poor’s 500 Index Future | | 06/21/2024 | | | 35,832,376 | | | | 435,750 | |
| | | | | TOTAL OPEN LONG FUTURES CONTRACTS | | | | | | | | $ | 544,530 | |
| | | | | | | | | | | | | | | |
See accompanying notes to financial statements.
| ALPHACENTRIC PREMIUM OPPORTUNITY FUND (HMXAX, HMXCX, HMXIX) |
| SCHEDULE OF INVESTMENTS (Continued) |
| March 31, 2024 |
| OPEN FUTURES CONTRACTS | |
| Number of | | | | | | | | | | Value and Unrealized | |
| Contracts | | | Open Short Futures Contracts | | Expiration | | Notional Amount(g) | | | Appreciation | |
| | 171 | | | CBOE Volatility Index Future | | 04/17/2024 | | $ | 2,457,048 | | | $ | 25,552 | |
| | 1 | | | CBOE Volatility Index Future | | 05/22/2024 | | | 15,419 | | | | 132 | |
| | | | | TOTAL OPEN SHORT FUTURES CONTRACTS | | | | | | | | $ | 25,684 | |
| | | | | | | | | | | | | | | |
| | | | | TOTAL FUTURES CONTRACTS | | | | | | | | $ | 570,214 | |
| IB | Interactive Brokers |
| | |
| SXM | StoneX Financial Inc. |
| (b) | Rate disclosed is the seven day effective yield as of March 31, 2024. |
| (c) | Each option contract allows the holder of the option to purchase or sell 100 shares of the underlying security. |
| (d) | Each contract is equivalent to one futures contract. |
| (e) | Percentage rounds to less than 0.1%. |
| (f) | Percentage rounds to greater than (0.1)%. |
| (g) | The amounts shown are the underlying reference notional amounts to stock exchange indices and equities upon which the fair value of the futures contracts held by the Fund are based. Notional values do not represent the current fair value of, and are not necessarily indicative of the future cash flows of the Fund’s futures contracts. Further, the underlying price changes in relation to the variables specified by the notional values affects the fair value of these derivative financial instruments. The notional values as set forth within this schedule do not purport to represent economic value at risk to the Fund. |
| (h) | Illiquid security. Total illiquid securities represents 0.1% of net assets as of March 31, 2024. |
| (i) | All or a portion of this investment is segregated as collateral for option contracts and future contracts. |
See accompanying notes to financial statements.
| ALPHACENTRIC ROBOTICS AND AUTOMATION FUND (GNXAX, GNXCX, GNXIX) |
| SCHEDULE OF INVESTMENTS |
| March 31, 2024 |
| Shares | | | | | Fair Value | |
| | | | | COMMON STOCKS — 98.7% | | | | |
| | | | | AEROSPACE & DEFENSE - 8.1% | | | | |
| | 8,000 | | | AeroVironment, Inc.(a) | | $ | 1,226,240 | |
| | 150,000 | | | Intuitive Machines, Inc.(a),(b) | | | 937,500 | |
| | | | | | | | 2,163,740 | |
| | | | | ELECTRICAL EQUIPMENT - 3.3% | | | | |
| | 25,000 | | | Allient, Inc. | | | 892,000 | |
| | | | | | | | | |
| | | | | MACHINERY - 48.8% | | | | |
| | 25,000 | | | ATS Corporation(a) | | | 841,320 | |
| | 15,000 | | | Doosan Robotics, Inc.(a) | | | 981,802 | |
| | 25,000 | | | FANUC Corporation | | | 696,880 | |
| | 22,000 | | | GEA Group AG | | | 930,076 | |
| | 4,000 | | | Kardex Holding A.G. | | | 1,122,150 | |
| | 2,500 | | | Keyence Corporation | | | 1,157,449 | |
| | 21,000 | | | KION Group A.G. | | | 1,105,049 | |
| | 500,000 | | | Kraken Robotics, Inc.(a) | | | 406,078 | |
| | 10,000 | | | Krones A.G. | | | 1,323,624 | |
| | 5,000 | | | Rainbow Robotics(a) | | | 687,150 | |
| | 5,000 | | | Regal Rexnord Corporation(b) | | | 900,500 | |
| | 350,000 | | | Scott Technology Ltd. | | | 585,564 | |
| | 20,000 | | | Shibaura Machine Company Ltd. | | | 481,541 | |
| | 25,000 | | | Symbotic, Inc.(a),(b) | | | 1,125,000 | |
| | 15,000 | | | Yaskawa Electric Corporation | | | 634,524 | |
| | | | | | | | 12,978,707 | |
| | | | | MEDICAL EQUIPMENT & DEVICES - 21.5% | | | | |
| | 350,000 | | | Accuray, Inc.(a) | | | 864,500 | |
| | 250,000 | | | Asensus Surgical, Inc.(a),(b) | | | 57,500 | |
| | 12,500 | | | Globus Medical, Inc., Class A(a) | | | 670,500 | |
| | 3,000 | | | Intuitive Surgical, Inc.(a),(b) | | | 1,197,270 | |
| | 100,000 | | | Microbot Medical, Inc.(a) | | | 123,000 | |
| | 25,000 | | | PROCEPT BioRobotics Corporation(a),(b) | | | 1,235,500 | |
| | 600,000 | | | Stereotaxis, Inc.(a),(b) | | | 1,566,000 | |
| | | | | | | | 5,714,270 | |
| | | | | | | | | |
See accompanying notes to financial statements.
| ALPHACENTRIC ROBOTICS AND AUTOMATION FUND (GNXAX, GNXCX, GNXIX) |
| SCHEDULE OF INVESTMENTS (Continued) |
| March 31, 2024 |
| Shares | | | | | Fair Value | |
| | | | | COMMON STOCKS — 98.7% (Continued) | | | | |
| | | | | SEMICONDUCTORS - 3.8% | | | | |
| | 30,000 | | | Infineon Technologies A.G. | | $ | 1,019,903 | |
| | | | | | | | | |
| | | | | SOFTWARE - 9.8% | | | | |
| | 200,000 | | | SoundHound AI, Inc.(a),(b) | | | 1,178,000 | |
| | 2,500 | | | Synopsys, Inc.(a),(b) | | | 1,428,750 | |
| | | | | | | | 2,606,750 | |
| | | | | TECHNOLOGY HARDWARE - 3.4% | | | | |
| | 100,000 | | | Nano Dimension Ltd. - ADR(a),(b) | | | 278,500 | |
| | 15,000 | | | Nidec Corporation | | | 616,689 | |
| | | | | | | | 895,189 | |
| | | | | | | | | |
| | | | | TOTAL COMMON STOCKS (Cost $21,368,056) | | | 26,270,559 | |
| | | | | | | | | |
| | | | | SHORT-TERM INVESTMENTS — 28.9% | | | | |
| | | | | INVESTMENT PURCHASED AS SECURITIES LENDING COLLATERAL – 26.6% | | | | |
| | 7,079,739 | | | Mount Vernon Liquid Assets Portfolio, 5.44%(c)(d) | | | 7,079,739 | |
| | | | | | | | | |
| | | | | MONEY MARKET FUND – 2.3% | | | | |
| | 610,128 | | | First American Treasury Obligations Fund, Class X, 5.22%(d) | | | 610,128 | |
| | | | | | | | | |
| | | | | TOTAL SHORT-TERM INVESTMENTS (Cost $7,689,867) | | | 7,689,867 | |
| | | | | | | | | |
| | | | | TOTAL INVESTMENTS - 127.6% (Cost $29,057,923) | | $ | 33,960,426 | |
| | | | | LIABILITIES IN EXCESS OF OTHER ASSETS - (27.6)% | | | (7,343,903 | ) |
| | | | | NET ASSETS - 100.0% | | $ | 26,616,523 | |
| ADR | - American Depositary Receipt |
| | |
| LTD | - Limited Company |
| (a) | Non-income producing security. |
| (b) | All or a portion of the security is on loan. The total value of the securities on loan was $6,659,624, which included loaned securities with a value of $22,931 that have been sold and are pending settlement as of March 31, 2024. The total value of securities on loan excluding these pending sales was $6,636,693 as of March 31, 2024. |
| (c) | Security was purchased with cash received as collateral for securities on loan at March 31, 2024. Total collateral had a value of $7,079,739 at March 31, 2024. |
| (d) | Rate disclosed is the seven day effective yield as of March 31, 2024. |
See accompanying notes to financial statements.
| ALPHACENTRIC SYMMETRY STRATEGY FUND (SYMAX, SYMCX, SYMIX) |
| CONSOLIDATED SCHEDULE OF INVESTMENTS |
| March 31, 2024 |
| Shares | | | | | Fair Value | |
| | | | | COMMON STOCKS — 30.4% | | | | |
| | | | | ADVERTISING & MARKETING - 0.1% | | | | |
| | 467 | | | Trade Desk, Inc. (The), Class A(a) | | $ | 40,825 | |
| | | | | | | | | |
| | | | | APPAREL & TEXTILE PRODUCTS - 0.2% | | | | |
| | 2,035 | | | Tapestry, Inc. | | | 96,622 | |
| | | | | | | | | |
| | | | | ASSET MANAGEMENT - 0.3% | | | | |
| | 975 | | | Apollo Global Management, Inc. | | | 109,639 | |
| | | | | | | | | |
| | | | | AUTOMOTIVE - 1.0% | | | | |
| | 1,742 | | | BorgWarner, Inc. | | | 60,517 | |
| | 15,834 | | | Ford Motor Company | | | 210,275 | |
| | 2,534 | | | General Motors Company | | | 114,917 | |
| | 353 | | | Phinia, Inc. | | | 13,566 | |
| | | | | | | | 399,275 | |
| | | | | BANKING - 0.9% | | | | |
| | 46 | | | First Citizens BancShares, Inc., Class A | | | 75,210 | |
| | 969 | | | JPMorgan Chase & Company | | | 194,091 | |
| | 1,946 | | | Wells Fargo & Company | | | 112,790 | |
| | | | | | | | 382,091 | |
| | | | | BEVERAGES - 0.4% | | | | |
| | 3,010 | | | Monster Beverage Corporation(a) | | | 178,433 | |
| | | | | | | | | |
| | | | | BIOTECH & PHARMA - 0.1% | | | | |
| | 269 | | | Sarepta Therapeutics, Inc.(a) | | | 34,825 | |
| | | | | | | | | |
| | | | | CABLE & SATELLITE - 0.4% | | | | |
| | 242 | | | Charter Communications, Inc., Class A(a) | | | 70,332 | |
| | 2,130 | | | Comcast Corporation, Class A | | | 92,336 | |
| | | | | | | | 162,668 | |
| | | | | CHEMICALS - 0.2% | | | | |
| | 633 | | | Celanese Corporation | | | 108,787 | |
| | | | | | | | | |
See accompanying notes to financial statements.
| ALPHACENTRIC SYMMETRY STRATEGY FUND (SYMAX, SYMCX, SYMIX) |
| CONSOLIDATED SCHEDULE OF INVESTMENTS (Continued) |
| March 31, 2024 |
| Shares | | | | | Fair Value | |
| | | | | COMMON STOCKS — 30.4% (Continued) | | | | |
| | | | | COMMERCIAL SUPPORT SERVICES - 0.5% | | | | |
| | 1,159 | | | Republic Services, Inc. | | $ | 221,879 | |
| | | | | | | | | |
| | | | | E-COMMERCE DISCRETIONARY - 0.5% | | | | |
| | 4,337 | | | Coupang, Inc.(a) | | | 77,155 | |
| | 77 | | | MercadoLibre, Inc.(a) | | | 116,421 | |
| | | | | | | | 193,576 | |
| | | | | ELECTRICAL EQUIPMENT - 0.3% | | | | |
| | 1,393 | | | Vertiv Holdings Company | | | 113,766 | |
| | | | | | | | | |
| | | | | ENTERTAINMENT CONTENT - 0.1% | | | | |
| | 5,421 | | | Warner Bros Discovery, Inc.(a) | | | 47,325 | |
| | | | | | | | | |
| | | | | FOOD - 1.5% | | | | |
| | 672 | | | Hershey Company (The) | | | 130,704 | |
| | 1,196 | | | JM Smucker Co./The | | | 150,541 | |
| | 1,600 | | | Lamb Weston Holdings, Inc. | | | 170,448 | |
| | 2,335 | | | Mondelez International, Inc., Class A | | | 163,450 | |
| | | | | | | | 615,143 | |
| | | | | HEALTH CARE FACILITIES & SERVICES - 3.1% | | | | |
| | 4,546 | | | Cardinal Health, Inc. | | | 508,697 | |
| | 328 | | | Cigna Group (The) | | | 119,126 | |
| | 828 | | | DaVita, Inc.(a) | | | 114,305 | |
| | 654 | | | HCA Healthcare, Inc. | | | 218,129 | |
| | 297 | | | Humana, Inc. | | | 102,976 | |
| | 205 | | | McKesson Corporation | | | 110,054 | |
| | 882 | | | Tenet Healthcare Corporation(a) | | | 92,707 | |
| | | | | | | | 1,265,994 | |
| | | | | HOME CONSTRUCTION - 1.3% | | | | |
| | 757 | | | Lennar Corporation, Class A | | | 130,189 | |
| | 3,132 | | | PulteGroup, Inc. | | | 377,782 | |
| | | | | | | | 507,971 | |
| | | | | INDUSTRIAL SUPPORT SERVICES - 0.7% | | | | |
| | 425 | | | United Rentals, Inc. | | | 306,472 | |
| | | | | | | | | |
See accompanying notes to financial statements.
| ALPHACENTRIC SYMMETRY STRATEGY FUND (SYMAX, SYMCX, SYMIX) |
| CONSOLIDATED SCHEDULE OF INVESTMENTS (Continued) |
| March 31, 2024 |
| Shares | | | | | Fair Value | |
| | | | | COMMON STOCKS — 30.4% (Continued) | | | | |
| | | | | INSTITUTIONAL FINANCIAL SERVICES - 1.2% | | | | |
| | 1,830 | | | Bank of New York Mellon Corporation (The) | | $ | 105,445 | |
| | 1,049 | | | Cboe Global Markets, Inc. | | | 192,733 | |
| | 905 | | | CME Group, Inc. | | | 194,837 | |
| | | | | | | | 493,015 | |
| | | | | INSURANCE - 3.4% | | | | |
| | 2,995 | | | Arch Capital Group Ltd.(a) | | | 276,857 | |
| | 777 | | | Arthur J Gallagher & Company | | | 194,281 | |
| | 533 | | | Assurant, Inc. | | | 100,332 | |
| | 645 | | | Everest Re Group Ltd. | | | 256,388 | |
| | 2,331 | | | Hartford Financial Services Group, Inc. (The) | | | 240,210 | |
| | 4,013 | | | Loews Corporation | | | 314,177 | |
| | | | | | | | 1,382,245 | |
| | | | | INTERNET MEDIA & SERVICES - 0.6% | | | | |
| | 327 | | | DoorDash, Inc., Class A(a) | | | 45,034 | |
| | 2,649 | | | Uber Technologies, Inc.(a) | | | 203,947 | |
| | | | | | | | 248,981 | |
| | | | | LEISURE FACILITIES & SERVICES - 3.1% | | | | |
| | 8,856 | | | Carnival Corporation(a) | | | 144,707 | |
| | 3,254 | | | DraftKings, Inc., Class A(a) | | | 147,764 | |
| | 592 | | | Hyatt Hotels Corporation, Class A | | | 94,495 | |
| | 1,191 | | | Las Vegas Sands Corporation | | | 61,575 | |
| | 619 | | | McDonald’s Corporation | | | 174,527 | |
| | 5,231 | | | MGM Resorts International(a) | | | 246,956 | |
| | 7,310 | | | Norwegian Cruise Line Holdings Ltd.(a) | | | 152,998 | |
| | 1,299 | | | Royal Caribbean Cruises Ltd.(a) | | | 180,574 | |
| | 672 | | | Wynn Resorts Ltd. | | | 68,699 | |
| | | | | | | | 1,272,295 | |
| | | | | MEDICAL EQUIPMENT & DEVICES - 0.7% | | | | |
| | 3,337 | | | Boston Scientific Corporation(a) | | | 228,551 | |
| | 120 | | | Shockwave Medical, Inc.(a) | | | 39,076 | |
| | | | | | | | 267,627 | |
| | | | | METALS & MINING - 0.2% | | | | |
| | 11,022 | | | Kinross Gold Corporation | | | 67,565 | |
| | | | | | | | | |
See accompanying notes to financial statements.
| ALPHACENTRIC SYMMETRY STRATEGY FUND (SYMAX, SYMCX, SYMIX) |
| CONSOLIDATED SCHEDULE OF INVESTMENTS (Continued) |
| March 31, 2024 |
| Shares | | | | | Fair Value | |
| | | | | COMMON STOCKS — 30.4% (Continued) | | | | |
| | | | | OIL & GAS PRODUCERS - 0.5% | | | | |
| | 2,240 | | | EQT Corporation | | $ | 83,037 | |
| | 7,485 | | | Permian Resources Corporation | | | 132,185 | |
| | | | | | | | 215,222 | |
| | | | | OIL & GAS SERVICES & EQUIPMENT - 0.2% | | | | |
| | 3,311 | | | TechnipFMC plc | | | 83,139 | |
| | | | | | | | | |
| | | | | RETAIL - CONSUMER STAPLES - 0.6% | | | | |
| | 313 | | | Costco Wholesale Corporation | | | 229,313 | |
| | | | | | | | | |
| | | | | RETAIL - DISCRETIONARY - 1.1% | | | | |
| | 72 | | | AutoZone, Inc.(a) | | | 226,918 | |
| | 186 | | | O’Reilly Automotive, Inc.(a) | | | 209,972 | |
| | | | | | | | 436,890 | |
| | | | | SEMICONDUCTORS - 0.1% | | | | |
| | 68 | | | NVIDIA Corporation | | | 61,442 | |
| | | | | | | | | |
| | | | | SOFTWARE - 1.1% | | | | |
| | 1,000 | | | Confluent, Inc., Class A(a) | | | 30,520 | |
| | 271 | | | Datadog, Inc., Class A(a) | | | 33,496 | |
| | 514 | | | Fortinet, Inc.(a) | | | 35,111 | |
| | 60 | | | HubSpot, Inc.(a) | | | 37,594 | |
| | 93 | | | MongoDB, Inc.(a) | | | 33,354 | |
| | 349 | | | Roper Technologies, Inc. | | | 195,732 | |
| | 371 | | | Snowflake, Inc.(a) | | | 59,954 | |
| | 150 | | | Zscaler, Inc.(a) | | | 28,895 | |
| | | | | | | | 454,656 | |
| | | | | SPECIALTY FINANCE - 0.3% | | | | |
| | 2,541 | | | Synchrony Financial | | | 109,568 | |
| | | | | | | | | |
| | | | | TECHNOLOGY HARDWARE - 0.5% | | | | |
| | 363 | | | Arista Networks, Inc.(a) | | | 105,263 | |
| | 736 | | | Jabil, Inc. | | | 98,587 | |
| | | | | | | | 203,850 | |
| | | | | | | | | |
See accompanying notes to financial statements.
| ALPHACENTRIC SYMMETRY STRATEGY FUND (SYMAX, SYMCX, SYMIX) |
| CONSOLIDATED SCHEDULE OF INVESTMENTS (Continued) |
| March 31, 2024 |
| Shares | | | | | Fair Value | |
| | | | | COMMON STOCKS — 30.4% (Continued) | | | | |
| | | | | TECHNOLOGY SERVICES - 1.0% | | | | |
| | 980 | | | Broadridge Financial Solutions, Inc. | | $ | 200,763 | |
| | 732 | | | Visa, Inc., Class A | | | 204,286 | |
| | | | | | | | 405,049 | |
| | | | | TRANSPORTATION & LOGISTICS - 2.3% | | | | |
| | 10,404 | | | American Airlines Group, Inc.(a) | | | 159,701 | |
| | 7,932 | | | Delta Air Lines, Inc. | | | 379,705 | |
| | 1,084 | | | GXO Logistics, Inc.(a) | | | 58,276 | |
| | 6,828 | | | United Airlines Holdings, Inc.(a) | | | 326,925 | |
| | | | | | | | 924,607 | |
| | | | | TRANSPORTATION EQUIPMENT - 1.3% | | | | |
| | 4,146 | | | PACCAR, Inc. | | | 513,648 | |
| | | | | | | | | |
| | | | | WHOLESALE - DISCRETIONARY - 0.6% | | | | |
| | 3,945 | | | Copart, Inc.(a) | | | 228,494 | |
| | | | | | | | | |
| | | | | TOTAL COMMON STOCKS (Cost $10,509,947) | | | 12,382,897 | |
| | | | | | | | | |
| | | | | EXCHANGE-TRADED FUNDS — 34.9% | | | | |
| | | | | EQUITY - 23.3% | | | | |
| | 3,085 | | | Global X MSCI Greece ETF | | | 123,431 | |
| | 2,740 | | | Invesco Nasdaq 100 ETF | | | 500,571 | |
| | 1,128 | | | Invesco QQQ Trust Series 1 | | | 500,843 | |
| | 16,127 | | | Invesco S&P 500 BuyWrite ETF | | | 362,535 | |
| | 17,834 | | | Invesco S&P 500 Pure Value ETF | | | 1,577,238 | |
| | 15,954 | | | iShares Mortgage Real Estate ETF | | | 370,771 | |
| | 20,694 | | | iShares MSCI Australia ETF | | | 510,314 | |
| | 5,328 | | | iShares MSCI Austria ETF | | | 115,717 | |
| | 3,749 | | | iShares MSCI Brazil ETF | | | 121,543 | |
| | 2,736 | | | iShares MSCI France ETF | | | 113,298 | |
| | 3,590 | | | iShares MSCI Germany ETF | | | 113,983 | |
| | 2,419 | | | iShares MSCI India ETF | | | 124,796 | |
| | 3,951 | | | iShares MSCI Indonesia ETF | | | 89,016 | |
| | | | | | | | | |
See accompanying notes to financial statements.
| ALPHACENTRIC SYMMETRY STRATEGY FUND (SYMAX, SYMCX, SYMIX) |
| CONSOLIDATED SCHEDULE OF INVESTMENTS (Continued) |
| March 31, 2024 |
| Shares | | | | | Fair Value | |
| | | | | EXCHANGE-TRADED FUNDS — 34.9% (Continued) | | | | |
| | | | | EQUITY - 23.3% (Continued) | | | | |
| | 3,087 | | | iShares MSCI Italy ETF | | $ | 116,442 | |
| | 5,695 | | | iShares MSCI Malaysia ETF | | | 124,094 | |
| | 1,897 | | | iShares MSCI Mexico ETF | | | 131,481 | |
| | 2,304 | | | iShares MSCI Netherlands ETF | | | 114,002 | |
| | 3,521 | | | iShares MSCI Peru and Global Exposure ETF | | | 137,918 | |
| | 4,507 | | | iShares MSCI Philippines ETF | | | 124,528 | |
| | 5,309 | | | iShares MSCI Poland ETF | | | 125,239 | |
| | 1,930 | | | iShares MSCI South Korea ETF | | | 129,522 | |
| | 3,759 | | | iShares MSCI Spain ETF | | | 120,927 | |
| | 2,782 | | | iShares MSCI Sweden ETF | | | 111,169 | |
| | 2,350 | | | iShares MSCI Switzerland ETF | | | 111,860 | |
| | 2,671 | | | iShares MSCI Taiwan ETF | | | 130,024 | |
| | 3,301 | | | iShares MSCI Turkey ETF | | | 118,638 | |
| | 3,359 | | | iShares MSCI United Kingdom ETF | | | 114,911 | |
| | 8,671 | | | iShares Russell 1000 Value ETF | | | 1,553,063 | |
| | 8,747 | | | JPMorgan BetaBuilders Japan ETF | | | 512,137 | |
| | 10,316 | | | SPDR S&P International Dividend ETF | | | 362,607 | |
| | 4,430 | | | Vanguard Global ex-U.S. Real Estate ETF | | | 186,680 | |
| | 3,088 | | | Vanguard High Dividend Yield ETF | | | 373,617 | |
| | 2,083 | | | Vanguard Real Estate ETF | | | 180,138 | |
| | | | | | | | 9,503,053 | |
| | | | | FIXED INCOME - 11.6% | | | | |
| | 5,802 | | | FlexShrs High Yield Value-Scored Bond Index Fund | | | 238,520 | |
| | 16,875 | | | Invesco Senior Loan ETF | | | 356,906 | |
| | 5,605 | | | iShares 0-5 Year High Yield Corporate Bond ETF | | | 238,493 | |
| | 5,458 | | | iShares 1-3 Year Treasury Bond ETF | | | 446,356 | |
| | 3,242 | | | iShares 3-7 Year Treasury Bond ETF | | | 375,456 | |
| | 3,220 | | | iShares 7-10 Year Treasury Bond ETF | | | 304,805 | |
| | 8,953 | | | iShares Fallen Angels USD Bond ETF | | | 240,478 | |
| | 920 | | | iShares iBoxx $ Investment Grade Corporate Bond ETF | | | 100,206 | |
| | 9,669 | | | iShares J.P. Morgan EM High Yield Bond ETF | | | 362,201 | |
| | 4,036 | | | iShares J.P. Morgan USD Emerging Markets Bond ETF | | | 361,908 | |
| | 917 | | | iShares National Muni Bond ETF | | | 98,669 | |
| | 11,075 | | | iShares Preferred and Income Securities ETF | | | 356,947 | |
| | | | | | | | | |
See accompanying notes to financial statements.
| ALPHACENTRIC SYMMETRY STRATEGY FUND (SYMAX, SYMCX, SYMIX) |
| CONSOLIDATED SCHEDULE OF INVESTMENTS (Continued) |
| March 31, 2024 |
| Shares | | | | | | | | | Fair Value | |
| | | | | EXCHANGE-TRADED FUNDS — 34.9% (Continued) | | | | | | |
| | | | | FIXED INCOME - 11.6% (Continued) | | | | | | | | |
| | 1,939 | | | iShares Trust iShares 1-5 Year Investment Grade | | | | | | $ | 99,432 | |
| | 5,415 | | | iShares US & International High Yield Corp Bond | | | | | | | 239,072 | |
| | 1,912 | | | Schwab US TIPS ETF | | | | | | | 99,730 | |
| | 3,213 | | | SPDR Blbg Investment Grade Floating Rate ETF | | | | | | | 99,057 | |
| | 4,972 | | | SPDR Bloomberg Convertible Securities ETF | | | | | | | 363,155 | |
| | 2,511 | | | SPDR Bloomberg High Yield Bond ETF | | | | | | | 239,047 | |
| | 2,481 | | | SPDR FTSE International Government | | | | | | | 99,190 | |
| | | | | | | | | | | | 4,719,628 | |
| | | | | | | | | | | | | |
| | | | | TOTAL EXCHANGE-TRADED FUNDS (Cost $13,641,305) | | | | | 14,222,681 | |
| | | | | | | | | | | | | |
| Principal | | | | | Coupon | | | | | | |
| Amount ($) | | | | | Rate (%) | | Maturity | | Fair Value | |
| | | | | U.S. GOVERNMENT & AGENCIES — 19.6% | | | | | | | | |
| | | | | U.S. TREASURY BILLS — 19.6% | | | | | | | | |
| | 2,000,000 | | | United States Treasury Bill(b) | | 4.8300 | | 04/11/24 | | | 1,997,092 | |
| | 1,500,000 | | | United States Treasury Bill(b) | | 5.1700 | | 04/30/24 | | | 1,493,653 | |
| | 2,000,000 | | | United States Treasury Bill(b) | | 5.2000 | | 05/02/24 | | | 1,990,916 | |
| | 2,500,000 | | | United States Treasury Bill(b) | | 5.2900 | | 05/30/24 | | | 2,478,459 | |
| | | | | TOTAL U.S. GOVERNMENT & AGENCIES (Cost $7,960,267) | | | | | 7,960,120 | |
| | | | | | | | | | | | | |
| Shares | | | | | | | | | Fair Value | |
| | | | | SHORT-TERM INVESTMENT — 13.1% | | | | | | | | |
| | | | | MONEY MARKET FUND - 13.1% | | | | | | | | |
| | 5,338,437 | | | First American Treasury Obligations Fund, Class X, 5.22%(c)(e) (Cost $5,338,437) | | | 5,338,437 | |
| | | | | | | | | | | | | |
| | | | | TOTAL INVESTMENTS - 98.0% (Cost $37,449,956) | | | | | | $ | 39,904,135 | |
| | | | | OTHER ASSETS IN EXCESS OF LIABILITIES - 2.0% | | | 807,947 | |
| | | | | NET ASSETS - 100.0% | | | | | | $ | 40,712,082 | |
| | | | | | | | | | | | | |
See accompanying notes to financial statements.
| ALPHACENTRIC SYMMETRY STRATEGY FUND (SYMAX, SYMCX, SYMIX) |
| CONSOLIDATED SCHEDULE OF INVESTMENTS (Continued) |
| March 31, 2024 |
| OPEN FUTURES CONTRACTS | |
Number of
Contracts | | | Open Long Futures Contracts | | Expiration | | Notional Amount(d) | | | Value and Unrealized
Appreciation (Depreciation) | |
| | 24 | | | 3 Month Euro Euribor Future | | 03/17/2025 | | $ | 6,292,233 | | | $ | 5,886 | |
| | 24 | | | 3 Month Euro Euribor Future | | 06/16/2025 | | | 6,304,531 | | | | (15,152 | ) |
| | 24 | | | 3 Month Euro Euribor Future | | 09/15/2025 | | | 6,313,269 | | | | 13,129 | |
| | 23 | | | 3 Month Euro Euribor Future | | 03/16/2026 | | | 6,058,279 | | | | (311 | ) |
| | 41 | | | CME British Pound Currency Future | | 06/17/2024 | | | 3,235,669 | | | | (44,656 | ) |
| | 1 | | | CME E Mini Consumer Discretionary Select Sector | | 06/21/2024 | | | 188,080 | | | | 2,480 | |
| | 2 | | | CME E Mini Consumer Staples Select Sector Futures | | 06/21/2024 | | | 155,660 | | | | 2,000 | |
| | 2 | | | CME E Mini Energy Select Sector Futures | | 06/21/2024 | | | 200,080 | | | | 9,970 | |
| | 1 | | | CME E Mini Financial Select Sector Futures | | 06/21/2024 | | | 131,413 | | | | 4,088 | |
| | 1 | | | CME E Mini Health Care Select Sector Futures | | 06/21/2024 | | | 151,130 | | | | 960 | |
| | 1 | | | CME E Mini Industrial Select Sector Futures | | 06/21/2024 | | | 128,490 | | | | 3,920 | |
| | 2 | | | CME E Mini Materials Select Sector Futures | | 06/21/2024 | | | 199,260 | | | | 5,520 | |
| | 1 | | | CME E Mini Technology Select Sector Futures | | 06/21/2024 | | | 212,680 | | | | (2,710 | ) |
| | 15 | | | CME Live Cattle Future(e) | | 06/28/2024 | | | 1,081,500 | | | | (15,540 | ) |
| | 8 | | | CME Live Cattle Future(e) | | 08/30/2024 | | | 570,240 | | | | 4,880 | |
| | 7 | | | COMEX Copper Future(e) | | 07/29/2024 | | | 706,825 | | | | (3,150 | ) |
| | 7 | | | COMEX Gold 100 Troy Ounces Future(e) | | 06/26/2024 | | | 1,566,880 | | | | 78,330 | |
| | 2 | | | E-mini S&P Communication Services Select Sector(f) | | 06/21/2024 | | | 216,175 | | | | 3,875 | |
| | 4 | | | E-mini S&P Real Estate Select Sector Stock Index | | 06/21/2024 | | | 195,300 | | | | (1,050 | ) |
| | 2 | | | Eurex 10 Year Euro BUND Future | | 06/06/2024 | | | 287,767 | | | | 11 | |
| | 37 | | | Long Gilt Future | | 06/26/2024 | | | 4,666,970 | | | | 33,530 | |
| | 35 | | | Montreal Exchange 3 Month Canadian Bank Acceptance | | 09/17/2025 | | | 6,204,501 | | | | 517 | |
| | 22 | | | NYBOT CSC Number 11 World Sugar Future(e) | | 06/28/2024 | | | 545,776 | | | | (4,726 | ) |
| | 18 | | | NYMEX Light Sweet Crude Oil Future(e) | | 05/21/2024 | | | 1,483,560 | | | | 99,070 | |
| | 7 | | | NYMEX Light Sweet Crude Oil Future(e) | | 08/20/2024 | | | 560,630 | | | | 39,240 | |
| | 13 | | | NYMEX NY Harbor ULSD Futures(e) | | 05/31/2024 | | | 1,430,356 | | | | 19,837 | |
| | 13 | | | NYMEX Reformulated Gasoline Blendstock for Oxygen(e) | | 05/31/2024 | | | 1,467,921 | | | | 89,548 | |
| | 5 | | | NYMEX Reformulated Gasoline Blendstock for Oxygen(e) | | 08/30/2024 | | | 529,662 | | | | 32,302 | |
| | 21 | | | Three Month SONIA Index Futures | | 09/16/2025 | | | 6,364,962 | | | | 15,903 | |
| | 21 | | | Three Month SONIA Index Futures | | 12/16/2025 | | | 6,374,900 | | | | 37,011 | |
| | 20 | | | Three Month SONIA Index Futures | | 03/17/2026 | | | 6,078,591 | | | | 563 | |
| | 20 | | | Three Month SONIA Index Futures | | 06/16/2026 | | | 6,083,639 | | | | 873 | |
| | 5 | | | TSE Japanese 10 Year Bond Futures | | 06/13/2024 | | | 4,818,052 | | | | 10,608 | |
| | | | | TOTAL OPEN LONG FUTURES CONTRACTS | | | | | $ | 426,756 | |
| | | | | | | | | | | | | | | |
| OPEN FUTURES CONTRACTS | |
Number of
Contracts | | | Open Short Futures Contracts | | Expiration | | Notional Amount(d) | | | Value and Unrealized
Appreciation (Depreciation) | |
| | 63 | | | CBOT Corn Future(e) | | 05/14/2024 | | $ | 1,392,300 | | | $ | (40,387 | ) |
| | 24 | | | CBOT Corn Future(e) | | 07/12/2024 | | | 545,400 | | | | (17,500 | ) |
| | 24 | | | CBOT Soybean Future(e) | | 05/14/2024 | | | 1,429,800 | | | | (32,075 | ) |
| | 9 | | | CBOT Soybean Future(e) | | 07/12/2024 | | | 542,363 | | | | (22,275 | ) |
| | 47 | | | CBOT Wheat Future(e) | | 05/14/2024 | | | 1,316,587 | | | | 15,350 | |
| | 19 | | | CBOT Wheat Future(e) | | 07/12/2024 | | | 546,963 | | | | (16,625 | ) |
| | 40 | | | CME Australian Dollar Currency Future | | 06/17/2024 | | | 2,613,200 | | | | 44,322 | |
| | 39 | | | CME Canadian Dollar Currency Future | | 06/18/2024 | | | 2,883,660 | | | | 2,072 | |
| | | | | | | | | | | | | | | |
See accompanying notes to financial statements.
| ALPHACENTRIC SYMMETRY STRATEGY FUND (SYMAX, SYMCX, SYMIX) |
| CONSOLIDATED SCHEDULE OF INVESTMENTS (Continued) |
| March 31, 2024 |
| OPEN FUTURES CONTRACTS (Continued) | |
Number of
Contracts | | | Open Short Futures Contracts | | Expiration | | Notional Amount(d) | | | Value and
Unrealized
Appreciation
(Depreciation) | |
| | 17 | | | CME Euro Foreign Exchange Currency Future | | 06/17/2024 | | $ | 2,299,569 | | | $ | 36,828 | |
| | 38 | | | CME Japanese Yen Currency Future | | 06/17/2024 | | | 3,175,613 | | | | 87,120 | |
| | 23 | | | CME Swiss Franc Currency Future | | 06/17/2024 | | | 3,214,825 | | | | 92,018 | |
| | 52 | | | Montreal Exchange 10 Year Canadian Bond Future | | 06/19/2024 | | | 4,620,192 | | | | (1,479 | ) |
| | 56 | | | NYBOT CSC Number 11 World Sugar Future(e) | | 04/30/2024 | | | 1,412,454 | | | | 26,712 | |
| | 60 | | | NYMEX Henry Hub Natural Gas Futures(e) | | 05/29/2024 | | | 1,198,200 | | | | (10,790 | ) |
| | 22 | | | NYMEX Henry Hub Natural Gas Futures(e) | | 08/28/2024 | | | 536,140 | | | | 33,550 | |
| | 44 | | | Ultra 10-Year US Treasury Note Futures | | 06/18/2024 | | | 5,042,813 | | | | (30,656 | ) |
| | | | | TOTAL OPEN SHORT FUTURES CONTRACTS | | | | | | | | $ | 166,185 | |
| | | | | | | | | | | | | | | |
| | | | | TOTAL FUTURES CONTRACTS | | | | | | | | $ | 592,941 | |
CREDIT DEFAULT SWAPS
| | | | | | | | | | | | | | | | | | | | | Upfront | | | | |
| | | | | | | Fixed | | Implied | | Frequency | | | | | | | | | | Premiums | | | Unrealized | |
| | | | | Buy/Sell | | Rate | | Credit | | of | | Expiration | | Notional | | | | | | Paid/ | | | Appreciation/ | |
| Counterparty | | Index | | Protection | | Received | | Spread | | Payments | | Date | | Amount | | | Value | | | (Received) | | | (Depreciation) | |
| SOC | | Markit CDX North America High Yield Index | | Sell | | 5.00% | | 329.39% | | Quarterly | | 6/20/2029 | | $ | 495,000 | | | $ | 35,681 | | | $ | 34,308 | | | $ | 1,373 | |
| SOC | | Markit CDX North America Investment Grade Index | | Sell | | 1.00% | | 51.53% | | Quarterly | | 6/20/2029 | | | 495,000 | | | | 11,181 | | | | 10,806 | | | | 375 | |
| SOC | | Markit iTraxx Europe Index(f) | | Sell | | 1.00% | | 54.20% | | Quarterly | | 6/20/2029 | | | 458,000 | | | | 10,897 | | | | 10,709 | | | | 188 | |
| SOC | | Markit iTraxx Europe Crossover Index(f) | | Sell | | 5.00% | | 296.86% | | Quarterly | | 6/20/2029 | | | 458,000 | | | | 43,567 | | | | 45,174 | | | | (1,607 | ) |
| | | Net Unrealized Appreciation on Swap Contracts | | | $ | 100,997 | | | $ | 329 | |
| ETF | - Exchange-Traded Fund |
| | |
| LTD | - Limited Company |
| | |
| MSCI | - Morgan Stanley Capital International |
| | |
| PLC | - Public Limited Company |
| | |
| SPDR | - Standard & Poor’s Depositary Receipt |
| | |
| SOC | - Societe Generale |
| (a) | Non-income producing security. |
| (c) | Rate disclosed is the seven day effective yield as of March 31, 2024. |
| (d) | The amounts shown are the underlying reference notional amounts to stock exchange indices and equities upon which the fair value of the futures contracts held by the Fund are based. Notional values do not represent the current fair value of, and are not necessarily indicative of the future cash flows of the Fund’s futures contracts. Further, the underlying price changes in relation to the variables specified by the notional values affects the fair value of these derivative financial instruments. The notional values as set forth within this schedule do not purport to represent economic value at risk to the Fund. |
| (e) | All or a portion of this investment is a holding of the ACSSF Fund Limited. |
| (f) | Illiquid security. Total illiquid securities represents 0.0% of net assets as of March 31, 2024. |
See accompanying notes to financial statements.
| ALPHACENTRIC LIFESCI HEALTHCARE FUND (LYFAX, LYFCX, LYFIX) |
| SCHEDULE OF INVESTMENTS |
| March 31, 2024 |
| Shares | | | | | Fair Value | |
| | | | | COMMON STOCKS — 93.8% | | | | |
| | | | | BIOTECH & PHARMA - 83.3% | | | | |
| | 45,000 | | | ACADIA Pharmaceuticals, Inc.(a) | | $ | 832,050 | |
| | 175,000 | | | Amicus Therapeutics, Inc.(a) | | | 2,061,500 | |
| | 8,000 | | | Argenx S.E. - ADR(a) | | | 3,149,760 | |
| | 83,000 | | | ArriVent Biopharma, Inc.(a) | | | 1,482,380 | |
| | 42,500 | | | Astellas Pharma, Inc. - ADR | | | 456,875 | |
| | 80,000 | | | Aurinia Pharmaceuticals, Inc.(a) | | | 400,800 | |
| | 32,500 | | | Axsome Therapeutics, Inc.(a) | | | 2,593,500 | |
| | 16,750 | | | BeiGene Ltd. - ADR(a) | | | 2,619,533 | |
| | 60,000 | | | Bicycle Therapeutics plc - ADR(a) | | | 1,494,000 | |
| | 675,000 | | | BioCryst Pharmaceuticals, Inc.(a) | | | 3,429,000 | |
| | 15,500 | | | BioMarin Pharmaceutical, Inc.(a) | | | 1,353,770 | |
| | 65,000 | | | Cabaletta Bio, Inc.(a) | | | 1,108,900 | |
| | 38,500 | | | Celldex Therapeutics, Inc.(a) | | | 1,615,845 | |
| | 42,500 | | | Cerevel Therapeutics Holdings, Inc.(a) | | | 1,796,475 | |
| | 1,000 | | | CG oncology, Inc.(a) | | | 43,900 | |
| | 1,000,000 | | | Coherus Biosciences, Inc.(a) | | | 2,390,000 | |
| | 85,000 | | | Corcept Therapeutics, Inc.(a) | | | 2,141,150 | |
| | 60,000 | | | Deciphera Pharmaceuticals, Inc.(a) | | | 943,800 | |
| | 122,500 | | | Dynavax Technologies Corporation(a) | | | 1,520,225 | |
| | 20,000 | | | Dyne Therapeutics, Inc.(a) | | | 567,800 | |
| | 105,000 | | | Galapagos N.V. - ADR(a) | | | 3,380,999 | |
| | 3,500 | | | Gilead Sciences, Inc. | | | 256,375 | |
| | 35,000 | | | GSK plc - ADR | | | 1,500,450 | |
| | 122,000 | | | Harmony Biosciences Holdings, Inc.(a) | | | 4,096,760 | |
| | 17,500 | | | Immatics N.V.(a) | | | 183,925 | |
| | 38,000 | | | Immunovant, Inc.(a) | | | 1,227,780 | |
| | 20,000 | | | Intra-Cellular Therapies, Inc.(a) | | | 1,384,000 | |
| | 8,500 | | | Jazz Pharmaceuticals plc(a) | | | 1,023,570 | |
| | 130,000 | | | KalVista Pharmaceuticals, Inc.(a) | | | 1,541,800 | |
| | 1,125,000 | | | Karyopharm Therapeutics, Inc.(a) | | | 1,698,750 | |
| | 94,000 | | | Mirum Pharmaceuticals, Inc.(a) | | | 2,361,280 | |
| | 7,000 | | | Neurocrine Biosciences, Inc.(a) | | | 965,440 | |
| | 135,000 | | | Nuvation Bio, Inc.(a) | | | 491,400 | |
| | 117,500 | | | Pacira BioSciences, Inc.(a) | | | 3,433,350 | |
| | | | | | | | | |
See accompanying notes to financial statements.
| ALPHACENTRIC LIFESCI HEALTHCARE FUND (LYFAX, LYFCX, LYFIX) |
| SCHEDULE OF INVESTMENTS (Continued) |
| March 31, 2024 |
| Shares | | | | | Fair Value | |
| | | | | COMMON STOCKS — 93.8% (Continued) | | | | |
| | | | | BIOTECH & PHARMA - 83.3% (Continued) | | | | |
| | 1,756,756 | | | Perspective Therapeutics, Inc.(a) | | $ | 2,090,540 | |
| | 175,000 | | | Pfizer, Inc. | | | 4,856,250 | |
| | 25,000 | | | Protagonist Therapeutics, Inc.(a) | | | 723,250 | |
| | 245,000 | | | Revance Therapeutics, Inc.(a) | | | 1,205,400 | |
| | 54,500 | | | Roche Holding A.G. - ADR | | | 1,739,640 | |
| | 90,000 | | | Roivant Sciences Ltd.(a) | | | 948,600 | |
| | 60,000 | | | Royalty Pharma plc, Class A | | | 1,822,200 | |
| | 185,000 | | | Sagimet Biosciences, Inc.(a) | | | 1,002,700 | |
| | 15,000 | | | Sanofi - ADR | | | 729,000 | |
| | 27,500 | | | Structure Therapeutics, Inc. - ADR(a) | | | 1,178,650 | |
| | 61,100 | | | Tourmaline Bio, Inc. | | | 1,399,190 | |
| | 460,000 | | | uniQure N.V.(a) | | | 2,392,000 | |
| | 16,000 | | | United Therapeutics Corporation(a) | | | 3,675,520 | |
| | 143,898 | | | UroGen Pharma Ltd.(a) | | | 2,158,470 | |
| | 62,004 | | | Valneva S.E. - ADR(a) | | | 495,412 | |
| | 10,000 | | | Ventyx Biosciences, Inc.(a) | | | 55,000 | |
| | 56,000 | | | Verona Pharma plc - ADR(a) | | | 901,040 | |
| | 18,000 | | | Viking Therapeutics, Inc.(a) | | | 1,476,000 | |
| | 6,000 | | | Viridian Therapeutics, Inc.(a) | | | 105,060 | |
| | 445,000 | | | VYNE Therapeutics, Inc.(a) | | | 1,366,150 | |
| | | | | | | | 85,867,214 | |
| | | | | HEALTH CARE FACILITIES & SERVICES - 2.5% | | | | |
| | 650,000 | | | DocGo, Inc.(a) | | | 2,626,000 | |
| | | | | | | | | |
| | | | | MEDICAL EQUIPMENT & DEVICES - 8.0% | | | | |
| | 111,500 | | | Embecta Corporation | | | 1,479,605 | |
| | 29,000 | | | Exact Sciences Corporation(a) | | | 2,002,740 | |
| | 63,000 | | | Inari Medical, Inc.(a) | | | 3,022,740 | |
| | 20,500 | | | Medtronic PLC | | | 1,786,575 | |
| | | | | | | | 8,291,660 | |
| | | | | | | | | |
| | | | | TOTAL COMMON STOCKS (Cost $104,127,247) | | | 96,784,874 | |
| | | | | | | | | |
See accompanying notes to financial statements.
| ALPHACENTRIC LIFESCI HEALTHCARE FUND (LYFAX, LYFCX, LYFIX) |
| SCHEDULE OF INVESTMENTS (Continued) |
| March 31, 2024 |
| Shares | | | | | Fair Value | |
| | | | | SHORT-TERM INVESTMENTS — 6.2% | | | | |
| | | | | MONEY MARKET FUNDS - 6.2% | | | | |
| | 1 | | | Fidelity Government Portfolio, Class I, 5.21%(b) | | $ | 1 | |
| | 6,377,858 | | | First American Treasury Obligations Fund, Class X, 5.22%(b) | | | 6,377,858 | |
| | | | | TOTAL SHORT TERM INVESTMENTS (Cost $6,377,859) | | | 6,377,859 | |
| | | | | | | | | |
| | | | | TOTAL INVESTMENTS - 100.0% (Cost $110,505,106) | | $ | 103,162,733 | |
| | | | | LIABILITIES IN EXCESS OF OTHER ASSETS – (0.0)%(c) | | | (25,594 | ) |
| | | | | NET ASSETS - 100.0% | | $ | 103,137,139 | |
| ADR | - American Depositary Receipt |
| | |
| LTD | - Limited Company |
| | |
| NV | - Naamioze Vennootschap |
| | |
| PLC | - Public Limited Company |
| (a) | Non-income producing security. |
| (b) | Rate disclosed is the seven day effective yield as of March 31, 2024. |
| (c) | Percentage rounds to greater than (0.1)%. |
See accompanying notes to financial statements.
| ALPHACENTRIC STRATEGIC INCOME FUND (SIIAX, SIICX, SIIIX) |
| SCHEDULE OF INVESTMENTS |
| March 31, 2024 |
| Shares | | | | | Fair Value | |
| | | | | COMMON STOCKS — 41.4% | | | | |
| | | | | ASSET MANAGEMENT - 0.2% | | | | |
| | 7,744 | | | Star Holdings(a) | | $ | 100,052 | |
| | | | | | | | | |
| | | | | MORTGAGE FINANCE - 4.0% | | | | |
| | 181,492 | | | Dynex Capital, Inc.(h) | | | 2,259,575 | |
| | | | | | | | | |
| | | | | MORTGAGE REITS - 25.7% | | | | |
| | 208,879 | | | AG Mortgage Investment Trust, Inc. (h) | | | 1,278,339 | |
| | 84,646 | | | AGNC Investment Corporation(h) | | | 837,995 | |
| | 221,602 | | | Ellington Financial, Inc. (h) | | | 2,617,120 | |
| | 167,725 | | | MFA Financial, Inc. (h) | | | 1,913,742 | |
| | 200,963 | | | New York Mortgage Trust, Inc. (h) | | | 1,446,934 | |
| | 288,343 | | | Redwood Trust, Inc. (h) | | | 1,836,745 | |
| | 420,966 | | | Rithm Capital Corporation(h) | | | 4,697,982 | |
| | | | | | | | 14,628,857 | |
| | | | | MULTI ASSET CLASS REIT - 0.4% | | | | |
| | 11,972 | | | Safehold, Inc. (h) | | | 246,623 | |
| | | | | | | | | |
| | | | | RESIDENTIAL REIT - 2.4% | | | | |
| | 20,611 | | | Equity LifeStyle Properties, Inc. (h) | | | 1,327,349 | |
| | | | | | | | | |
| | | | | SPECIALTY FINANCE - 8.7% | | | | |
| | 42,367 | | | Enact Holdings, Inc. | | | 1,321,003 | |
| | 114,379 | | | MGIC Investment Corporation | | | 2,557,515 | |
| | 4,931 | | | Mr. Cooper Group, Inc.(a) | | | 384,371 | |
| | 25,567 | | | Ocwen Financial Corporation(a) | | | 690,565 | |
| | | | | | | | 4,953,454 | |
| | | | | | | | | |
| | | | | TOTAL COMMON STOCKS (Cost $23,783,783) | | | 23,515,910 | |
| | | | | | | | | |
See accompanying notes to financial statements.
| ALPHACENTRIC STRATEGIC INCOME FUND (SIIAX, SIICX, SIIIX) |
| SCHEDULE OF INVESTMENTS (Continued) |
| March 31, 2024 |
| Shares | | | | | Fair Value | |
| | | | | EXCHANGE-TRADED FUND — 0.8% | | | | |
| | | | | FIXED INCOME - 0.8% | | | | |
| | 5,000 | | | iShares MBS ETF (Cost $464,600) | | $ | 462,100 | |
| | | | | | | | | |
| | | | | PREFERRED STOCKS — 14.5% | | | | |
| | | | | SPECIALTY FINANCE — 14.5% | | | | |
| | 19,450 | | | AG Mortgage Investment Trust, Inc. - Series C (d)(h) | | | 460,576 | |
| | 5,000 | | | AG Mortgage Investment Trust, Inc. - Series A (h) | | | 126,500 | |
| | 59,964 | | | AGNC Investment Corporation - Series F (d)(h) | | | 1,376,774 | |
| | 10,000 | | | Arbor Realty Trust, Inc. - Series E (h) | | | 195,000 | |
| | 20,000 | | | Arbor Realty Trust, Inc. - Series D (h) | | | 391,200 | |
| | 63,126 | | | Arbor Realty Trust, Inc. - Series F (d)(h) | | | 1,278,933 | |
| | 28,308 | | | Chimera Investment Corporation - Series B (d)(h) | | | 697,792 | |
| | 7,881 | | | Chimera Investment Corporation - Series C (d)(h) | | | 161,561 | |
| | 36,754 | | | Granite Point Mortgage Trust, Inc. - Series A (d)(h) | | | 667,085 | |
| | 22,335 | | | KKR Real Estate Finance Trust, Inc. - Series A (h) | | | 393,766 | |
| | 11,272 | | | MFA Financial, Inc. - Series C (d)(h) | | | 250,013 | |
| | 10,773 | | | New Residential Investment Corporation - Series C (d)(h) | | | 243,685 | |
| | 22,500 | | | New York Mortgage Trust, Inc. - Series F (d)(h) | | | 452,475 | |
| | 37,930 | | | Rithm Capital Corporation - Series D (d)(h) | | | 852,666 | |
| | 9,000 | | | Two Harbors Investment Corporation - Series A (d)(h) | | | 206,280 | |
| | 20,472 | | | Two Harbors Investment Corporation - Series C (d)(h) | | | 467,785 | |
| | | | | TOTAL PREFERRED STOCKS (Cost $9,148,187) | | | 8,222,091 | |
| Principal | | | | | | | Coupon | | | | | |
| Amount ($) | | | | | Spread | | Rate (%) | | Maturity | | Fair Value | |
| | | | | ASSET BACKED SECURITIES — 12.4% | | | | | | | | | | |
| | | | | CLO — 2.7% | | | | | | | | | | |
| | 218,311 | | | ACRES Commercial Realty 2021-FL1 Ltd. Series FL1 A(b),(c) | | TSFR1M + 1.314% | | 6.6400 | | 06/15/36 | | | 213,942 | |
| | 1,000,000 | | | ACRES Commercial Realty 2021-FL1 Ltd. Series FL1 C(b),(c),(g) | | TSFR1M + 2.114% | | 7.4400 | | 06/15/36 | | | 947,772 | |
| | 300,000 | | | Arbor Realty Commercial Real Estate Notes 2022-FL2 Series FL2 E(b),(c) | | TSFR1M + 5.000% | | 10.3250 | | 05/15/37 | | | 288,748 | |
| | | | | | | | | | | | | | | |
See accompanying notes to financial statements.
| ALPHACENTRIC STRATEGIC INCOME FUND (SIIAX, SIICX, SIIIX) |
| SCHEDULE OF INVESTMENTS (Continued) |
| March 31, 2024 |
| Principal | | | | | | | Coupon | | | | | |
| Amount ($) | | | | | Spread | | Rate (%) | | Maturity | | Fair Value | |
| | | | | ASSET BACKED SECURITIES — 12.4% (Continued) | | | | | | | | | | |
| | | | | CLO — 2.7% (Continued) | | | | | | | | | | |
| | 100,000 | | | TRTX 2021-FL4 Issuer Ltd. Series FL4 AS(b),(c) | | TSFR1M + 1.514% | | 6.8400 | | 03/15/38 | | $ | 97,833 | |
| | | | | | | | | | | | | | 1,548,295 | |
| | | | | | | | | | | | | | | |
| | | | | COLLATERALIZED MORTGAGE OBLIGATIONS — 3.0% | | | | | | | | | | |
| | 39,628 | | | Adjustable Rate Mortgage Trust 2007-1 Series 2007-1 1A1(d) | | | | 5.3510 | | 03/25/37 | | | 31,941 | |
| | 493,033 | | | Alternative Loan Trust 2005-11CB Series 2005-11CB 3A2(c) | | TSFR1M + 0.615% | | 5.5000 | | 06/25/35 | | | 358,130 | |
| | 226,381 | | | Alternative Loan Trust 2005-J6 Series 2005-J6 1A5(c) | | TSFR1M + 0.615% | | 5.5000 | | 07/25/35 | | | 180,093 | |
| | 422,788 | | | Impac CMB Trust Series 2005-2 Series 2005-2 1M2(c) | | TSFR1M + 0.850% | | 6.1790 | | 04/25/35 | | | 385,504 | |
| | 72,619 | | | MFA 2020-NQM2 Trust Series NQM2 A3(b),(d) | | | | 1.9470 | | 04/25/65 | | | 67,668 | |
| | 566,858 | | | New Residential Mortgage Loan Trust 2021-NQM1R Series NQ1R A1(b),(d) | | | | 0.9430 | | 07/25/55 | | | 496,164 | |
| | 216,697 | | | Washington Mutual Mortgage Pass-Through Series 2007-HY1 A2A(c) | | TSFR1M + 0.435% | | 5.7640 | | 02/25/37 | | | 162,219 | |
| | | | | | | | | | | | | | 1,681,719 | |
| | | | | HOME EQUITY — 0.3% | | | | | | | | | | |
| | 194,831 | | | Terwin Mortgage Trust 2004-7HE Series 7HE A3(b),(c) | | TSFR1M + 1.515% | | 6.8440 | | 07/25/34 | | | 185,372 | |
| | | | | | | | | | | | | | | |
| | | | | NON AGENCY CMBS — 5.1% | | | | | | | | | | |
| | 150,000 | | | Citigroup Commercial Mortgage Trust 2016-C2 Series 2016-C2 B | | | | 3.1760 | | 08/10/49 | | | 133,221 | |
| | 115,000 | | | Citigroup Commercial Mortgage Trust 2017-C4 Series C4 AS | | | | 3.7640 | | 10/12/50 | | | 104,246 | |
| | 100,000 | | | COMM 2013-CCRE6 Mortgage Trust Series 2013-CR6 F (b),(d) | | | | 3.8590 | | 03/10/46 | | | 46,949 | |
| | 115,000 | | | COMM 2015-CCRE25 Mortgage Trust Series CR25 D(d) | | | | 3.7660 | | 08/10/48 | | | 101,886 | |
| | 10,000 | | | COMM 2015-DC1 Mortgage Trust Series 2015-DC1 C(d) | | | | 4.2740 | | 02/10/48 | | | 9,098 | |
| | 81,000 | | | COMM 2015-LC19 Mortgage Trust Series 2015-LC19 D (b) | | | | 2.8670 | | 02/10/48 | | | 70,702 | |
| | 20,000 | | | COMM 2015-LC23 Mortgage Trust Series LC23 C(d) | | | | 4.5450 | | 10/10/48 | | | 18,894 | |
| | 33,371 | | | CSAIL 2016-C5 Commercial Mortgage Trust Series 2016-C5 C(d) | | | | 4.6420 | | 11/15/48 | | | 31,152 | |
| | 100,000 | | | CSAIL 2016-C6 Commercial Mortgage Trust Series C6 B(d) | | | | 3.9240 | | 01/15/49 | | | 89,487 | |
| | 120,000 | | | CSAIL 2016-C6 Commercial Mortgage Trust Series C6 C(d) | | | | 4.9190 | | 01/15/49 | | | 106,517 | |
| | 2,889,802 | | | GS Mortgage Securities Trust 2014-GC26 Series GC26 XA(d),(e) | | | | 0.8980 | | 11/10/47 | | | 6,881 | |
| | 89,938 | | | JP Morgan Chase Commercial Mortgage Securities | | | | 3.2160 | | 04/15/46 | | | 83,282 | |
| | 60,000 | | | JP Morgan Chase Commercial Mortgage Securities Series LC11 B | | | | 3.4990 | | 04/15/46 | | | 52,465 | |
| | 100,000 | | | JPMBB Commercial Mortgage Securities Trust Series C19 B(d) | | | | 4.3940 | | 04/15/47 | | | 99,187 | |
| | 45,000 | | | JPMBB Commercial Mortgage Securities Trust Series 2015-C30 B(d) | | | | 4.2290 | | 07/15/48 | | | 41,373 | |
| | 10,000 | | | JPMBB Commercial Mortgage Securities Trust Series 2015-C28 C(d) | | | | 4.1330 | | 10/15/48 | | | 9,312 | |
| | 150,000 | | | JPMDB Commercial Mortgage Securities Trust 2016-C2 Series C2 AS | | | | 3.4840 | | 06/15/49 | | | 140,240 | |
| | 145,000 | | | JPMDB Commercial Mortgage Securities Trust 2017-C7 Series C7 B | | | | 3.9850 | | 10/15/50 | | | 129,554 | |
| | | | | | | | | | | | | | | |
See accompanying notes to financial statements.
| ALPHACENTRIC STRATEGIC INCOME FUND (SIIAX, SIICX, SIIIX) |
| SCHEDULE OF INVESTMENTS (Continued) |
| March 31, 2024 |
| Principal | | | | | | | Coupon | | | | | |
| Amount ($) | | | | | Spread | | Rate (%) | | Maturity | | Fair Value | |
| | | | | ASSET BACKED SECURITIES — 12.4% (Continued) | | | | | | | | | | |
| | | | | NON AGENCY CMBS — 5.1% (Continued) | | | | | | | | | | |
| | 15,000 | | | Morgan Stanley Bank of America Merrill Lynch Trust Series 2013-C12 C(d) | | | | 6.0490 | | 10/15/46 | | $ | 13,901 | |
| | 450,000 | | | Morgan Stanley Bank of America Merrill Lynch Trust Series C28 C(d) | | | | 4.5960 | | 01/15/49 | | | 380,855 | |
| | 210,000 | | | Morgan Stanley Capital I Trust 2017-H1 Series H1 B | | | | 4.0750 | | 06/15/50 | | | 190,223 | |
| | 1,858,181 | | | SG Commercial Mortgage Securities Trust 2016-C5 Series C5 XA(d),(e) | | | | 1.8510 | | 10/10/48 | | | 52,469 | |
| | 215,000 | | | SG Commercial Mortgage Securities Trust 2016-C5 Series C5 B | | | | 3.9330 | | 10/10/48 | | | 192,955 | |
| | 220,000 | | | UBS Commercial Mortgage Trust 2018-C13 Series C13 B(d) | | | | 4.7860 | | 10/15/51 | | | 200,696 | |
| | 20,781 | | | Wells Fargo Commercial Mortgage Trust 2014-LC16 Series LC16 A5 | | | | 3.8170 | | 08/15/50 | | | 20,646 | |
| | 40,000 | | | Wells Fargo Commercial Mortgage Trust 2015-C26 Series C26 C(d) | | | | 4.0710 | | 02/15/48 | | | 38,148 | |
| | 25,000 | | | Wells Fargo Commercial Mortgage Trust 2015-C27 Series 2015-C27 B(d) | | | | 4.1390 | | 02/15/48 | | | 23,738 | |
| | 75,000 | | | Wells Fargo Commercial Mortgage Trust 2015-NXS1 Series 2015-NXS1 D(d) | | | | 4.1400 | | 05/15/48 | | | 64,675 | |
| | 100,000 | | | Wells Fargo Commercial Mortgage Trust 2016-NXS6 Series 2016-NXS6 B | | | | 3.8110 | | 11/15/49 | | | 93,624 | |
| | 160,000 | | | WFRBS Commercial Mortgage Trust 2013-C15 Series 2013-C15 C(d) | | | | 4.1890 | | 08/15/46 | | | 124,874 | |
| | 270,000 | | | WFRBS Commercial Mortgage Trust 2013-C15 Series 2013-C15 B(d) | | | | 4.1890 | | 08/15/46 | | | 228,949 | |
| | 15,000 | | | WFRBS Commercial Mortgage Trust 2014-C24 Series 2014-C24 B(d) | | | | 4.2040 | | 11/15/47 | | | 13,957 | |
| | | | | | | | | | | | | | 2,914,156 | |
| | | | | RESIDENTIAL MORTGAGE — 1.3% | | | | | | | | | | |
| | 499,725 | | | Ellington Loan Acquisition Trust 2007-2 Series 2007-2 M2B(b),(c) | | TSFR1M + 1.815% | | 7.1440 | | 05/25/37 | | | 294,862 | |
| | 1,226,102 | | | Washington Mutual Asset-Backed Certificates WMABS Series 2006-HE5 2A1(c) | | TSFR1M + 0.235% | | 4.4850 | | 10/25/36 | | | 439,123 | |
| | | | | | | | | | | | | | 733,985 | |
| | | | | TOTAL ASSET BACKED SECURITIES (Cost $7,286,219) | | | | | | | 7,063,527 | |
| | | | | | | | | | | | | | | |
| | | | | COLLATERALIZED MORTGAGE OBLIGATIONS — 2.1% | | | | | | | | |
| | | | | CMBS — 2.0% | | | | | | | | | | |
| | 1,000,000 | | | Freddie Mac Multifamily Structured Pass Through Series K126 X3(d),(e) | | | | 2.6290 | | 01/25/49 | | | 141,987 | |
| | 1,921,553 | | | Government National Mortgage Association(d),(e) | | | | 0.7250 | | 03/16/58 | | | 56,762 | |
| | 4,646,744 | | | Government National Mortgage Association Series 2017-171 IO(d),(e) | | | | 0.6540 | | 09/16/59 | | | 158,612 | |
| | 2,428,096 | | | Government National Mortgage Association Series 110 IO(d),(e) | | | | 0.6040 | | 01/16/60 | | | 105,243 | |
| | 11,551,391 | | | Government National Mortgage Association Series 165 IO(d),(e) | | | | 0.4830 | | 11/16/60 | | | 427,491 | |
| | 1,176,741 | | | Government National Mortgage Association Series 2019-81 IO(d),(e) | | | | 0.8710 | | 02/16/61 | | | 63,271 | |
See accompanying notes to financial statements.
| ALPHACENTRIC STRATEGIC INCOME FUND (SIIAX, SIICX, SIIIX) |
| SCHEDULE OF INVESTMENTS (Continued) |
| March 31, 2024 |
| Principal | | | | | | | Coupon | | | | | |
| Amount ($) | | | | | Spread | | Rate (%) | | Maturity | | Fair Value | |
| | | | | COLLATERALIZED MORTGAGE OBLIGATIONS — 2.1% (Continued) | | | | | | | | |
| | | | | CMBS — 2.0% (Continued) | | | | | | | | | | |
| | 3,666,903 | | | Government National Mortgage Association Series 34 IO(d),(e) | | | | 0.7220 | | 03/16/61 | | $ | 184,611 | |
| | | | | | | | | | | | | | 1,137,977 | |
| | | | | COLLATERALIZED MORTGAGE OBLIGATIONS — 0.1% | | | | | | | |
| | 721,101 | | | Government National Mortgage Association Series 2019-110 SE(c),(e) | | TSFR1M - 5.986% | | 0.6570 | | 09/20/49 | | | 73,258 | |
| | | | | | | | | | | | | | | |
| | | | | TOTAL COLLATERALIZED MORTGAGE OBLIGATIONS (Cost $1,374,201) | | | | | 1,211,235 | |
| | | | | | | | | | | | | | | |
| | | | | CONVERTIBLE BONDS — 12.2% | | | | | | | | | | |
| | | | | ASSET MANAGEMENT — 1.7% | | | | | | | | | | |
| | 1,000,000 | | | RWT Holdings, Inc. | | | | 5.7500 | | 10/01/25 | | | 970,048 | |
| | | | | | | | | | | | | | | |
| | | | | MORTGAGE REITS — 0.8% | | | | | | | | | | |
| | 500,000 | | | Redwood Trust, Inc. | | | | 7.7500 | | 06/15/27 | | | 481,250 | |
| | | | | | | | | | | | | | | |
| | | | | SPECIALTY FINANCE — 9.7% | | | | | | | | | | |
| | 1,965,000 | | | PennyMac Corporation | | | | 5.5000 | | 11/01/24 | | | 1,942,894 | |
| | 3,205,000 | | | Two Harbors Investment Corporation | | | | 6.2500 | | 01/15/26 | | | 3,044,749 | |
| | 500,000 | | | Western Asset Mortgage Capital Corporation | | | | 6.7500 | | 09/15/24 | | | 497,468 | |
| | | | | | | | | | | | | | 5,485,111 | |
| | | | | TOTAL CONVERTIBLE BONDS (Cost $6,601,034) | | | | | | | | | 6,936,409 | |
| | | | �� | | | | | | | | | | | |
| | | | | CORPORATE BONDS — 4.2% | | | | | | | | | | |
| | | | | SPECIALTY FINANCE — 4.2% | | | | | | | | | | |
| | 1,559,000 | | | PHH Mortgage Corporation(b) | | | | 7.8750 | | 03/15/26 | | | 1,512,303 | |
| | 888,000 | | | Rithm Capital Corporation(b) | | | | 8.0000 | | 04/01/29 | | | 862,539 | |
| | | | | TOTAL CORPORATE BONDS (Cost $2,311,579) | | | | | | | | | 2,374,842 | |
| | | | | | | | | | | | | | | |
See accompanying notes to financial statements.
| ALPHACENTRIC STRATEGIC INCOME FUND (SIIAX, SIICX, SIIIX) |
| SCHEDULE OF INVESTMENTS (Continued) |
| March 31, 2024 |
| Principal | | | | | Coupon | | | | | |
| Amount ($) | | | | | Rate (%) | | Maturity | | Fair Value | |
| | | | | U.S. GOVERNMENT & AGENCIES — 2.5% | | | | | | | | |
| | | | | AGENCY FIXED RATE — 1.1% | | | | | | | | |
| | 798,547 | | | Fannie Mae Pool BQ4516 | | 2.0000 | | 02/01/51 | | $ | 637,441 | |
| | | | | | | | | | | | | |
| | | | | AGENCY MBS OTHER — 1.4% | | | | | | | | |
| | 361,350 | | | Ginnie Mae II Pool MA8867 | | 5.5000 | | 05/20/53 | | | 358,454 | |
| | 399,624 | | | Ginnie Mae II Pool MA9007 | | 6.5000 | | 07/20/53 | | | 404,021 | |
| | | | | | | | | | | | 762,475 | |
| | | | | TOTAL U.S. GOVERNMENT & AGENCIES (Cost $1,434,892) | | | | | | | 1,399,916 | |
| | | | | | | | | | | | | |
| Shares | | | | | | | | | | Fair Value | |
| | | | | SHORT-TERM INVESTMENT — 9.2% | | | | | | | | |
| | | | | MONEY MARKET FUND - 9.2% | | | | | | | | |
| | 5,229,133 | | | First American Treasury Obligations Fund, Class X, 5.22%(f) (Cost $5,229,133) | | | 5,229,133 | |
| | | | | | | | | | | | | |
| | | | | TOTAL INVESTMENTS - 99.3% (Cost $57,633,628) | | | | | | $ | 56,415,163 | |
| | | | | OTHER ASSETS IN EXCESS OF LIABILITIES - 0.7% | | | | | | | 399,955 | |
| | | | | NET ASSETS - 100.0% | | | | | | $ | 56,815,118 | |
| ETF | - Exchange-Traded Fund |
| | |
| LTD | - Limited Company |
| | |
| REIT | - Real Estate Investment Trust |
| | |
| TSFR1M | - Term Secured Overnight Financing Rate (SOFR) 1 month |
| (a) | Non-income producing security. |
| (b) | Security exempt from registration under Rule 144A or Section 4(2) of the Securities Act of 1933. The security may be resold in transactions exempt from registration, normally to qualified institutional buyers. As of March 31, 2024 the total market value of 144A securities is $5,084,854 or 8.9% of net assets. |
| (c) | Floating rate security, the interest rate of which adjusts periodically based on changes in current interest rates and prepayments on the underlying pool of assets. |
| (d) | Variable rate security; the rate shown represents the rate on March 31, 2024. |
| (e) | Interest only securities. |
| (f) | Rate disclosed is the seven day effective yield as of March 31, 2024. |
| (g) | Illiquid security. Total illiquid securities represents 1.7% of net assets as of March 31, 2024. |
| (h) | REIT – Real Estate Investment Trust. |
See accompanying notes to financial statements.
| AlphaCentric Funds |
| STATEMENTS OF ASSETS AND LIABILITIES |
| March 31, 2024 |
| | | | | | | | | | | | AlphaCentric | |
| | | AlphaCentric Income | | | AlphaCentric Premium | | | AlphaCentric Robotics | | | Symmetry Strategy | |
| | | Opportunities Fund | | | Opportunity Fund | | | and Automation Fund | | | Fund (Consolidated) | |
| ASSETS | | | | | | | | | | | | | | | | |
| Investment securities: | | | | | | | | | | | | | | | | |
| Investments, at cost | | $ | 291,782,574 | | | $ | 43,307,222 | | | $ | 29,057,923 | | | $ | 37,449,956 | |
| Investments, at value (including collateral for loaned securities $0, $0, $7,079,739, $0) | | $ | 360,392,638 | | | $ | 43,304,585 | | | $ | 33,960,426 | | | $ | 39,904,135 | |
| Cash & Cash Equivalents | | | — | | | | 2,987,150 | | | | — | | | | 432 | |
| Deposit with brokers for futures and swaps | | | — | | | | 28,220,534 | | | | — | | | | 2,599,315 | |
| Receivable for securities sold | | | — | | | | — | | | | — | | | | 35,728 | |
| Receivable for fund shares sold | | | 2,356 | | | | 53,320 | | | | 504 | | | | — | |
| Dividends and interest receivable | | | 470,938 | | | | 126,884 | | | | 98,645 | | | | 26,017 | |
| Upfront payment on swap | | | — | | | | — | | | | — | | | | 100,997 | |
| Unrealized appreciation on open futures contracts | | | — | | | | 570,214 | | | | — | | | | 852,023 | |
| Unrealized appreciation on swap contracts | | | — | | | | — | | | | — | | | | 1,936 | |
| Prepaid expenses and other assets | | | 148,568 | | | | 41,014 | | | | 14,037 | | | | 35,339 | |
| Due from insurance | | | 806,726 | | | | — | | | | — | | | | — | |
| TOTAL ASSETS | | | 361,821,226 | | | | 75,303,701 | | | | 34,073,612 | | | | 43,555,922 | |
| | | | | | | | | | | | | | | | | |
| LIABILITIES | | | | | | | | | | | | | | | | |
| Options Written (Proceeds $752,730) | | | — | | | | 714,380 | | | | — | | | | — | |
| Payable upon return of line of credit | | | 17,532,000 | | | | — | | | | — | | | | — | |
| Payable for investments purchased | | | — | | | | — | | | | — | | | | 2,514,380 | |
| Unrealized depreciation on swap contracts | | | — | | | | — | | | | — | | | | 1,607 | |
| Payable upon return of securities loaned | | | — | | | | — | | | | 7,079,739 | | | | — | |
| Due to custodian | | | 4 | | | | — | | | | — | | | | — | |
| Unrealized depreciation on open futures contracts | | | — | | | | — | | | | — | | | | 259,082 | |
| Payable for fund shares repurchased | | | 228,698 | | | | 260,416 | | | | 314,796 | | | | — | |
| Management fees payable | | | 480,774 | | | | 96,005 | | | | 17,337 | | | | 30,648 | |
| Distribution (12b-1) fees payable | | | 521 | | | | — | | | | 519 | | | | — | |
| Payable to related parties | | | 14,863 | | | | 15,951 | | | | 265 | | | | 412 | |
| Administration fees payable | | | 150,736 | | | | 8,206 | | | | 6,541 | | | | 8,028 | |
| Accrued expenses and other liabilities | | | 397,617 | | | | 41,171 | | | | 37,892 | | | | 29,683 | |
| TOTAL LIABILITIES | | | 18,805,213 | | | | 1,136,129 | | | | 7,457,089 | | | | 2,843,840 | |
| NET ASSETS | | $ | 343,016,013 | | | $ | 74,167,572 | | | $ | 26,616,523 | | | $ | 40,712,082 | |
| | | | | | | | | | | | | | | | | |
| Composition of Net Assets: | | | | | | | | | | | | | | | | |
| Paid in capital | | $ | 617,131,883 | | | $ | 75,693,885 | | | $ | 27,585,185 | | | $ | 41,540,965 | |
| Accumulated loss | | | (274,115,870 | ) | | | (1,526,313 | ) | | | (968,662 | ) | | | (828,883 | ) |
| NET ASSETS | | $ | 343,016,013 | | | $ | 74,167,572 | | | $ | 26,616,523 | | | $ | 40,712,082 | |
| | | | | | | | | | | | | | | | | |
| Net Asset Value Per Share: | | | | | | | | | | | | | | | | |
| Class A Shares (IOFAX, HMXAX, GNXAX, SYMAX): | | | | | | | | | | | | | | | | |
| Net Assets | | $ | 34,189,928 | | | $ | 4,314,112 | | | $ | 2,988,309 | | | $ | 188,710 | |
| Shares of beneficial interest outstanding (a) | | | 4,386,267 | | | | 157,867 | | | | 243,676 | | | | 15,485 | |
| Net asset value (Net Assets ÷ Shares Outstanding) and redemption price per share | | $ | 7.79 | (d) | | $ | 27.33 | (d) | | $ | 12.26 | | | $ | 12.19 | |
| | | | | | | | | | | | | | | | | |
| Maximum offering price per share | | $ | 8.18 | (c)(d) | | $ | 29.00 | (b)(d) | | $ | 13.01 | (b) | | $ | 12.93 | (b) |
| | | | | | | | | | | | | | | | | |
| Class C Shares (IOFCX, HMXCX, GNXCX, SYMCX): | | | | | | | | | | | | | | | | |
| Net Assets | | $ | 24,330,351 | | | $ | 1,646,340 | | | $ | 535,930 | | | $ | 738,729 | |
| Shares of beneficial interest outstanding (a) | | | 3,134,948 | | | | 63,444 | | | | 46,192 | | | | 61,877 | |
| Net asset value (Net Assets ÷ Shares Outstanding) offering price and redemption price per share | | $ | 7.76 | (d) | | $ | 25.95 | (d) | | $ | 11.60 | | | $ | 11.94 | |
| | | | | | | | | | | | | | | | | |
| Class I Shares (IOFIX, HMXIX, GNXIX, SYMIX): | | | | | | | | | | | | | | | | |
| Net Assets | | $ | 284,495,734 | | | $ | 68,207,120 | | | $ | 23,092,284 | | | $ | 39,784,643 | |
| Shares of beneficial interest outstanding (a) | | | 36,454,854 | | | | 2,432,260 | | | | 1,847,293 | | | | 3,280,441 | |
| Net asset value (Net Assets ÷ Shares Outstanding) offering price and redemption price per share | | $ | 7.80 | (d) | | $ | 28.04 | | | $ | 12.50 | (d) | | $ | 12.13 | |
| (a) | Unlimited number of shares of beneficial interest authorized, no par value. |
| (b) | Net asset value plus maximum sales charge of 5.75% |
| (c) | Net asset value plus maximum sales charge of 4.75% |
| (d) | The Net Asset Value (“NAV”) and offering price shown above differs from the traded NAV on March 28, 2024 due to financial statement rounding and/or financial statement adjustments. |
See accompanying notes to financial statements.
| AlphaCentric Funds |
| STATEMENTS OF ASSETS AND LIABILITIES (Continued) |
| March 31, 2024 |
| | | AlphaCentric LifeSci | | | AlphaCentric Strategic | |
| | | Healthcare Fund | | | Income Fund | |
| ASSETS | | | | | | | | |
| Investment securities: | | | | | | | | |
| Investments, at cost | | $ | 110,505,106 | | | $ | 57,633,628 | |
| Investments, at value | | $ | 103,162,733 | | | $ | 56,415,163 | |
| Foreign currency (Cost $35,207, $0) | | | 34,871 | | | | — | |
| Receivable for securities sold | | | 563,096 | | | | — | |
| Receivable for fund shares sold | | | 38,817 | | | | 15,455 | |
| Dividends and interest receivable | | | 139,854 | | | | 592,689 | |
| Prepaid expenses and other assets | | | 45,691 | | | | 41,036 | |
| TOTAL ASSETS | | | 103,985,062 | | | | 57,064,343 | |
| | | | | | | | | |
| LIABILITIES | | | | | | | | |
| Payable for investments purchased | | | 612,301 | | | | — | |
| Payable for fund shares repurchased | | | 134,910 | | | | 192,819 | |
| Management fees payable | | | 75,197 | | | | 33,846 | |
| Distribution (12b-1) fees payable | | | 459 | | | | — | |
| Payable to related parties | | | 843 | | | | 858 | |
| Administration fees payable | | | 11,444 | | | | 9,907 | |
| Accrued expenses and other liabilities | | | 12,769 | | | | 11,795 | |
| TOTAL LIABILITIES | | | 847,923 | | | | 249,225 | |
| NET ASSETS | | $ | 103,137,139 | | | $ | 56,815,118 | |
| | | | | | | | | |
| Composition of Net Assets: | | | | | | | | |
| Paid in capital | | $ | 112,584,613 | | | $ | 58,059,488 | |
| Accumulated loss | | | (9,447,474 | ) | | | (1,244,370 | ) |
| NET ASSETS | | $ | 103,137,139 | | | $ | 56,815,118 | |
| | | | | | | | | |
| Net Asset Value Per Share: | | | | | | | | |
| Class A Shares (LYFAX,SIIAX): | | | | | | | | |
| Net Assets | | $ | 6,622,194 | | | $ | 1,257,466 | |
| Shares of beneficial interest outstanding (a) | | | 520,099 | | | | 76,781 | |
| Net asset value (Net Assets ÷ Shares Outstanding) and redemption price per share | | $ | 12.73 | | | $ | 16.38 | |
| | | | | | | | | |
| Maximum offering price per share | | $ | 13.51 | (b) | | $ | 17.20 | (c) |
| | | | | | | | | |
| Class C Shares (LYFCX,SIICX): | | | | | | | | |
| Net Assets | | $ | 2,157,437 | | | $ | 1,849,639 | |
| Shares of beneficial interest outstanding (a) | | | 173,046 | | | | 113,190 | |
| Net asset value (Net Assets ÷ Shares Outstanding) offering price and redemption price per share | | $ | 12.47 | | | $ | 16.34 | |
| | | | | | | | | |
| Class I Shares (LYFIX,SIIIX): | | | | | | | | |
| Net Assets | | $ | 94,357,508 | | | $ | 53,708,013 | |
| Shares of beneficial interest outstanding (a) | | | 7,352,368 | | | | 3,272,243 | |
| Net asset value (Net Assets ÷ Shares Outstanding) offering price and redemption price per share | | $ | 12.83 | | | $ | 16.41 | |
| (a) | Unlimited number of shares of beneficial interest authorized, no par value. |
| (b) | Net asset value plus maximum sales charge of 5.75% |
| (c) | Net asset value plus maximum sales charge of 4.75% |
See accompanying notes to financial statements.
| AlphaCentric Funds |
| STATEMENTS OF OPERATIONS |
| For the Year Ended March 31, 2024 |
| | | | | | AlphaCentric | | | | | | AlphaCentric | |
| | | | | | Premium | | | AlphaCentric | | | Symmetry Strategy | |
| | | AlphaCentric Income | | | Opportunity | | | Robotics and | | | Fund | |
| | | Opportunities Fund | | | Fund | | | Automation Fund | | | (Consolidated) | |
| INVESTMENT INCOME | | | | | | | | | | | | | | | | |
| Dividends (ARAF and ASSF: Net of tax witholding of $22,649 and $6,011, respectively) | | $ | — | | | $ | — | | | $ | 129,586 | | | $ | 878,734 | |
| Interest | | | 24,838,238 | | | | 3,036,918 | | | | 39,119 | | | | 677,185 | |
| Securities lending income | | | — | | | | — | | | | 219,614 | | | | — | |
| TOTAL INVESTMENT INCOME | | | 24,838,238 | | | | 3,036,918 | | | | 388,319 | | | | 1,555,919 | |
| | | | | | | | | | | | | | | | | |
| EXPENSES | | | | | | | | | | | | | | | | |
| Investment advisory fees | | | 5,912,023 | | | | 1,428,092 | | | | 362,541 | | | | 588,127 | |
| Distribution (12b-1) fees: | | | | | | | | | | | | | | | | |
| Class A | | | 99,731 | | | | 16,816 | | | | 8,223 | | | | 938 | |
| Class C | | | 340,042 | | | | 18,296 | | | | 6,112 | | | | 8,713 | |
| Legal fees | | | 1,161,345 | * | | | 18,608 | | | | 20,130 | | | | 28,608 | |
| Line of credit fees | | | 763,859 | | | | — | | | | 858 | | | | 1,121 | |
| Financial administration/fund accounting fees | | | 498,709 | | | | 86,021 | | | | 44,454 | | | | 72,481 | |
| Shareholder servicing fees | | | 430,119 | | | | 91,979 | | | | 36,597 | | | | 15,335 | |
| Legal administration/management services fees | | | 199,843 | | | | 40,130 | | | | 12,035 | | | | 18,898 | |
| Printing and postage expenses | | | 183,563 | | | | 15,056 | | | | 19,501 | | | | 3,771 | |
| Registration fees | | | 82,604 | | | | 46,179 | | | | 45,152 | | | | 37,014 | |
| Custodian fees | | | 28,355 | | | | 5,534 | | | | 15,212 | | | | 22,922 | |
| Audit fees | | | 27,070 | | | | 14,120 | | | | 16,721 | | | | 19,003 | |
| Insurance expense | | | 22,475 | | | | 3,217 | | | | 1,102 | | | | 1,802 | |
| Compliance officer fees | | | 21,054 | | | | 8,969 | | | | 13,621 | | | | 9,691 | |
| Trustees fees and expenses | | | 15,765 | | | | 15,932 | | | | 16,370 | | | | 13,929 | |
| Interest expense | | | — | | | | 914 | | | | — | | | | — | |
| Other expenses | | | 5,125 | | | | 2,318 | | | | 2,305 | | | | 3,731 | |
| TOTAL EXPENSES | | | 9,791,682 | | | | 1,812,181 | | | | 620,934 | | | | 846,084 | |
| Less: Fees waived by the Adviser | | | (686,763 | ) | | | (153,036 | ) | | | (199,793 | ) | | | (138,723 | ) |
| Less: Expenses reimbursed by insurance | | | (785,807 | ) | | | — | | | | — | | | | — | |
| NET EXPENSES | | | 8,319,112 | | | | 1,659,145 | | | | 421,141 | | | | 707,361 | |
| | | | | | | | | | | | | | | | | |
| NET INVESTMENT INCOME (LOSS) | | | 16,519,126 | | | | 1,377,773 | | | | (32,822 | ) | | | 848,558 | |
| | | | | | | | | | | | | | | | | |
| REALIZED AND UNREALIZED GAIN (LOSS) FROM INVESTMENTS | | | | | | | | | | | | | | | | |
| Net realized gain (loss) from: | | | | | | | | | | | | | | | | |
| Investments | | | 27,915,351 | | | | 3,819,940 | | | | (3,226,590 | ) | | | 1,266,065 | |
| Distributions of capital gains from underlying investment companies | | | — | | | | — | | | | — | | | | 9,036 | |
| Foreign Currencies Translation | | | — | | | | (20 | ) | | | (29,420 | ) | | | (1,562 | ) |
| Futures Contracts | | | — | | | | 10,686,409 | | | | — | | | | (876,039 | ) |
| Options Written | | | — | | | | (3,562,444 | ) | | | — | | | | — | |
| Swap Contracts | | | — | | | | — | | | | — | | | | 64,132 | |
| | | | 27,915,351 | | | | 10,943,885 | | | | (3,256,010 | ) | | | 461,632 | |
| Net change in unrealized appreciation (depreciation) on: | | | | | | | | | | | | | | | | |
| Investments | | | (62,412,233 | ) | | | (273,769 | ) | | | 4,599,479 | | | | 2,075,627 | |
| Foreign Currencies Translation | | | — | | | | — | | | | (179 | ) | | | 2,867 | |
| Futures Contracts | | | — | | | | (1,463,904 | ) | | | — | | | | 516,302 | |
| Options Written | | | — | | | | 23,505 | | | | — | | | | — | |
| Swap Contracts | | | — | | | | — | | | | — | | | | (3,257 | ) |
| | | | (62,412,233 | ) | | | (1,714,168 | ) | | | 4,599,300 | | | | 2,591,539 | |
| | | | | | | | | | | | | | | | | |
| NET REALIZED AND UNREALIZED GAIN (LOSS) FROM INVESTMENTS | | | (34,496,882 | ) | | | 9,229,717 | | | | 1,343,290 | | | | 3,053,171 | |
| | | | | | | | | | | | | | | | | |
| NET INCREASE (DECREASE) IN NET ASSETS RESULTING FROM OPERATIONS | | $ | (17,977,756 | ) | | $ | 10,607,490 | | | $ | 1,310,468 | | | $ | 3,901,729 | |
| * | Includes legal fees that are extraordinary expenses that are outside the expense limitation. |
See accompanying notes to financial statements.
| AlphaCentric Funds |
| STATEMENTS OF OPERATIONS (Continued) |
| For the Year Ended March 31, 2024 |
| | | AlphaCentric | | | AlphaCentric | |
| | | LifeSci Healthcare | | | Strategic Income | |
| | | Fund | | | Fund | |
| INVESTMENT INCOME | | | | | | | | |
| Dividends (ALHF: Net of tax witholding of $20,175) | | $ | 449,362 | | | $ | 2,181,351 | |
| Interest | | | 545,234 | | | | 1,609,709 | |
| TOTAL INVESTMENT INCOME | | | 994,596 | | | | 3,791,060 | |
| | | | | | | | | |
| EXPENSES | | | | | | | | |
| Investment advisory fees | | | 1,240,802 | | | | 836,842 | |
| Distribution (12b-1) fees: | | | | | | | | |
| Class A | | | 15,182 | | | | 2,178 | |
| Class C | | | 13,284 | | | | 14,713 | |
| Shareholder servicing fees | | | 112,409 | | | | 50,872 | |
| Financial administration/fund accounting fees | | | 101,614 | | | | 91,744 | |
| Registration fees | | | 45,152 | | | | 42,178 | |
| Legal administration/management services fees | | | 43,980 | | | | 22,316 | |
| Legal fees | | | 18,261 | | | | 21,922 | |
| Audit fees | | | 15,620 | | | | 11,166 | |
| Trustees fees and expenses | | | 15,427 | | | | 15,155 | |
| Compliance officer fees | | | 14,158 | | | | 10,294 | |
| Custodian fees | | | 14,155 | | | | 4,453 | |
| Printing and postage expenses | | | 10,490 | | | | 16,868 | |
| Insurance expense | | | 2,101 | | | | 1,601 | |
| Line of credit fees | | | — | | | | 736 | |
| Other expenses | | | 2,923 | | | | 2,305 | |
| TOTAL EXPENSES | | | 1,665,558 | | | | 1,145,343 | |
| Less: Fees waived by the Adviser | | | (245,808 | ) | | | (296,073 | ) |
| NET EXPENSES | | | 1,419,750 | | | | 849,270 | |
| | | | | | | | | |
| NET INVESTMENT INCOME (LOSS) | | | (425,154 | ) | | | 2,941,790 | |
| | | | | | | | | |
| REALIZED AND UNREALIZED GAIN (LOSS) FROM INVESTMENTS | | | | | | | | |
| Net realized gain from: | | | | | | | | |
| Investments | | | 2,990,059 | | | | 835,826 | |
| | | | 2,990,059 | | | | 835,826 | |
| Net change in unrealized appreciation (depreciation) on: | | | | | | | | |
| Investments | | | (4,727,673 | ) | | | 5,066,385 | |
| Foreign Currency Translation | | | 102 | | | | — | |
| | | | (4,727,571 | ) | | | 5,066,385 | |
| | | | | | | | | |
| NET REALIZED AND UNREALIZED GAIN (LOSS) FROM INVESTMENTS | | | (1,737,512 | ) | | | 5,902,211 | |
| | | | | | | | | |
| NET INCREASE (DECREASE) IN NET ASSETS RESULTING FROM OPERATIONS | | $ | (2,162,666 | ) | | $ | 8,844,001 | |
See accompanying notes to financial statements.
| AlphaCentric Income Opportunities Fund |
| STATEMENTS OF CHANGES IN NET ASSETS |
| | | Year Ended | | | Year Ended | |
| | | March 31, 2024 | | | March 31, 2023 | |
| FROM OPERATIONS | | | | | | | | |
| Net investment income | | $ | 16,519,126 | | | $ | 27,891,169 | |
| Net realized gain from investments | | | 27,915,351 | | | | 157,063,493 | |
| Net change in unrealized depreciation on investments | | | (62,412,233 | ) | | | (530,834,259 | ) |
| Net decrease in net assets resulting from operations | | | (17,977,756 | ) | | | (345,879,597 | ) |
| | | | | | | | | |
| DISTRIBUTIONS TO SHAREHOLDERS | | | | | | | | |
| From return of capital: | | | | | | | | |
| Class A (IOFAX) | | | (1,622,530 | ) | | | (2,390,279 | ) |
| Class C (IOFCX) | | | (1,241,809 | ) | | | (1,841,953 | ) |
| Class I (IOFIX) | | | (15,731,709 | ) | | | (34,902,633 | ) |
| From distributable earnings: | | | | | | | | |
| Class A (IOFAX) | | | (1,165,894 | ) | | | (1,022,781 | ) |
| Class C (IOFCX) | | | (850,032 | ) | | | (936,282 | ) |
| Class I (IOFIX) | | | (11,348,898 | ) | | | (13,874,753 | ) |
| Total distributions to shareholders | | | (31,960,872 | ) | | | (54,968,681 | ) |
| | | | | | | | | |
| FROM SHARES OF BENEFICIAL INTEREST | | | | | | | | |
| Proceeds from shares sold: | | | | | | | | |
| Class A (IOFAX) | | | 10,527,300 | | | | 12,270,446 | |
| Class C (IOFCX) | | | 408,041 | | | | 1,725,448 | |
| Class I (IOFIX) | | | 95,824,674 | | | | 239,909,400 | |
| Net asset value of shares issued in reinvestment of distributions: | | | | | | | | |
| Class A (IOFAX) | | | 2,540,582 | | | | 3,104,924 | |
| Class C (IOFCX) | | | 1,945,455 | | | | 2,612,328 | |
| Class I (IOFIX) | | | 22,747,343 | | | | 39,393,370 | |
| Payments for shares repurchased: | | | | | | | | |
| Class A (IOFAX) | | | (18,823,941 | ) | | | (91,588,892 | ) |
| Class C (IOFCX) | | | (20,283,519 | ) | | | (38,281,062 | ) |
| Class I (IOFIX) | | | (321,353,075 | ) | | | (1,585,150,298 | ) |
| Net decrease in net assets from shares of beneficial interest | | | (226,467,140 | ) | | | (1,416,004,336 | ) |
| | | | | | | | | |
| TOTAL DECREASE IN NET ASSETS | | | (276,405,768 | ) | | | (1,816,852,614 | ) |
| | | | | | | | | |
| NET ASSETS | | | | | | | | |
| Beginning of Year | | | 619,421,781 | | | | 2,436,274,395 | |
| End of Year | | $ | 343,016,013 | | | $ | 619,421,781 | |
| | | | | | | | | |
| SHARE ACTIVITY | | | | | | | | |
| Class A (IOFAX): | | | | | | | | |
| Shares Sold | | | 1,286,639 | | | | 1,280,165 | |
| Shares Reinvested | | | 312,476 | | | | 325,343 | |
| Shares Repurchased | | | (2,345,044 | ) | | | (9,208,368 | ) |
| Net decrease in shares of beneficial interest outstanding | | | (745,929 | ) | | | (7,602,860 | ) |
| | | | | | | | | |
| Class C (IOFCX): | | | | | | | | |
| Shares Sold | | | 48,477 | | | | 179,313 | |
| Shares Reinvested | | | 239,237 | | | | 277,465 | |
| Shares Repurchased | | | (2,482,686 | ) | | | (3,944,135 | ) |
| Net decrease in shares of beneficial interest outstanding | | | (2,194,972 | ) | | | (3,487,357 | ) |
| | | | | | | | | |
| Class I (IOFIX): | | | | | | | | |
| Shares Sold | | | 11,875,945 | | | | 24,341,874 | |
| Shares Reinvested | | | 2,786,459 | | | | 4,115,225 | |
| Shares Repurchased | | | (39,042,425 | ) | | | (158,104,387 | ) |
| Net decrease in shares of beneficial interest outstanding | | | (24,380,021 | ) | | | (129,647,288 | ) |
See accompanying notes to financial statements.
| AlphaCentric Premium Opportunity Fund |
| STATEMENTS OF CHANGES IN NET ASSETS |
| | | Year Ended | | | Year Ended | |
| | | March 31, 2024 | | | March 31, 2023 | |
| FROM OPERATIONS | | | | | | | | |
| Net investment income (loss) | | $ | 1,377,773 | | | $ | (409,250 | ) |
| Net realized gain (loss) from investments, future contracts and options written | | | 10,943,885 | | | | (8,399,119 | ) |
| Net change in unrealized depreciation on investments, future contracts and options written | | | (1,714,168 | ) | | | (619,745 | ) |
| Net increase (decrease) in net assets resulting from operations | | | 10,607,490 | | | | (9,428,114 | ) |
| | | | | | | | | |
| FROM SHARES OF BENEFICIAL INTEREST | | | | | | | | |
| Proceeds from shares sold: | | | | | | | | |
| Class A (HMXAX) | | | 842,644 | | | | 3,030,670 | |
| Class C (HMXCX) | | | 291,648 | | | | 325,945 | |
| Class I (HMXIX) | | | 16,514,676 | | | | 33,030,617 | |
| Payments for shares repurchased: | | | | | | | | |
| Class A (HMXAX) | | | (4,816,502 | ) | | | (1,490,953 | ) |
| Class C (HMXCX) | | | (650,689 | ) | | | (1,979,796 | ) |
| Class I (HMXIX) | | | (37,834,728 | ) | | | (111,799,837 | ) |
| Net decrease in net assets from shares of beneficial interest | | | (25,652,951 | ) | | | (78,883,354 | ) |
| | | | | | | | | |
| TOTAL DECREASE IN NET ASSETS | | | (15,045,461 | ) | | | (88,311,468 | ) |
| | | | | | | | | |
| NET ASSETS | | | | | | | | |
| Beginning of Year | | | 89,213,033 | | | | 177,524,501 | |
| End of Year | | $ | 74,167,572 | | | $ | 89,213,033 | |
| | | | | | | | | |
| SHARE ACTIVITY | | | | | | | | |
| Class A (HMXAX): | | | | | | | | |
| Shares Sold | | | 33,881 | | | | 128,113 | |
| Shares Repurchased | | | (186,557 | ) | | | (63,622 | ) |
| Net increase (decrease) in shares of beneficial interest outstanding | | | (152,676 | ) | | | 64,491 | |
| | | | | | | | | |
| Class C (HMXCX): | | | | | | | | |
| Shares Sold | | | 12,402 | | | | 14,329 | |
| Shares Repurchased | | | (26,613 | ) | | | (87,342 | ) |
| Net decrease in shares of beneficial interest outstanding | | | (14,211 | ) | | | (73,013 | ) |
| | | | | | | | | |
| Class I (HMXIX): | | | | | | | | |
| Shares Sold | | | 637,575 | | | | 1,356,731 | |
| Shares Repurchased | | | (1,461,551 | ) | | | (4,632,238 | ) |
| Net decrease in shares of beneficial interest outstanding | | | (823,976 | ) | | | (3,275,507 | ) |
See accompanying notes to financial statements.
| AlphaCentric Robotics and Automation Fund |
| STATEMENTS OF CHANGES IN NET ASSETS |
| | | Year Ended | | | Year Ended | |
| | | March 31, 2024 | | | March 31, 2023 | |
| FROM OPERATIONS | | | | | | | | |
| Net investment loss | | $ | (32,822 | ) | | $ | (7,745 | ) |
| Net realized loss from investments and foreign currencies translation | | | (3,256,010 | ) | | | (2,542,486 | ) |
| Net change in unrealized appreciation (depreciation) on investments and foreign currencies translation | | | 4,599,300 | | | | (2,469,105 | ) |
| Net increase (decrease) in net assets resulting from operations | | | 1,310,468 | | | | (5,019,336 | ) |
| | | | | | | | | |
| DISTRIBUTIONS TO SHAREHOLDERS | | | | | | | | |
| From distributable earnings: | | | | | | | | |
| Class A (GNXAX) | | | — | | | | (190,967 | ) |
| Class C (GNXCX) | | | — | | | | (39,354 | ) |
| Class I (GNXIX) | | | — | | | | (1,308,689 | ) |
| Total distributions to shareholders | | | — | | | | (1,539,010 | ) |
| | | | | | | | | |
| FROM SHARES OF BENEFICIAL INTEREST | | | | | | | | |
| Proceeds from shares sold: | | | | | | | | |
| Class A (GNXAX) | | | 255,659 | | | | 228,324 | |
| Class C (GNXCX) | | | 25,326 | | | | 590,745 | |
| Class I (GNXIX) | | | 7,598,050 | | | | 9,730,408 | |
| Net asset value of shares issued in reinvestment of distributions: | | | | | | | | |
| Class A (GNXAX) | | | — | | | | 175,548 | |
| Class C (GNXCX) | | | — | | | | 37,983 | |
| Class I (GNXIX) | | | — | | | | 1,021,076 | |
| Payments for shares repurchased: | | | | | | | | |
| Class A (GNXAX) | | | (1,145,814 | ) | | | (1,535,007 | ) |
| Class C (GNXCX) | | | (185,585 | ) | | | (986,251 | ) |
| Class I (GNXIX) | | | (12,954,575 | ) | | | (10,391,213 | ) |
| Net decrease in net assets from shares of beneficial interest | | | (6,406,939 | ) | | | (1,128,387 | ) |
| | | | | | | | | |
| TOTAL DECREASE IN NET ASSETS | | | (5,096,471 | ) | | | (7,686,733 | ) |
| | | | | | | | | |
| NET ASSETS | | | | | | | | |
| Beginning of Year | | | 31,712,994 | | | | 39,399,727 | |
| End of Year | | $ | 26,616,523 | | | $ | 31,712,994 | |
| | | | | | | | | |
| SHARE ACTIVITY | | | | | | | | |
| Class A (GNXAX): | | | | | | | | |
| Shares Sold | | | 22,385 | | | | 19,516 | |
| Shares Reinvested | | | — | | | | 15,858 | |
| Shares Repurchased | | | (99,783 | ) | | | (132,789 | ) |
| Net decrease in shares of beneficial interest outstanding | | | (77,398 | ) | | | (97,415 | ) |
| | | | | | | | | |
| Class C (GNXCX): | | | | | | | | |
| Shares Sold | | | 2,463 | | | | 58,395 | |
| Shares Reinvested | | | — | | | | 3,593 | |
| Shares Repurchased | | | (17,295 | ) | | | (94,397 | ) |
| Net decrease in shares of beneficial interest outstanding | | | (14,832 | ) | | | (32,409 | ) |
| | | | | | | | | |
| Class I (GNXIX): | | | | | | | | |
| Shares Sold | | | 656,068 | | | | 818,422 | |
| Shares Reinvested | | | — | | | | 90,843 | |
| Shares Repurchased | | | (1,121,664 | ) | | | (874,531 | ) |
| Net increase (decrease) in shares of beneficial interest outstanding | | | (465,596 | ) | | | 34,734 | |
See accompanying notes to financial statements.
| AlphaCentric Symmetry Strategy Fund |
| CONSOLIDATED STATEMENTS OF CHANGES IN NET ASSETS |
| | | Year Ended | | | Year Ended | |
| | | March 31, 2024 | | | March 31, 2023 | |
| FROM OPERATIONS | | | | | | | | |
| Net investment income | | $ | 848,558 | | | $ | 326,189 | |
| Net realized gain (loss) from investments, foreign currencies translation, futures contracts and swap contracts | | | 452,596 | | | | (547,755 | ) |
| Distributions of capital gains from underlying investment companies | | | 9,036 | | | | — | |
| Net change in unrealized appreciation (depreciation) on investments, foreign currencies translation, futures contracts and swap contracts | | | 2,591,539 | | | | (1,687,778 | ) |
| Net increase (decrease) in net assets resulting from operations | | | 3,901,729 | | | | (1,909,344 | ) |
| | | | | | | | | |
| DISTRIBUTIONS TO SHAREHOLDERS | | | | | | | | |
| From distributable earnings: | | | | | | | | |
| Class A (SYMAX) | | | (2,237 | ) | | | (50,614 | ) |
| Class C (SYMCX) | | | (7,088 | ) | | | (71,984 | ) |
| Class I (SYMIX) | | | (782,964 | ) | | | (4,629,201 | ) |
| Total distributions to shareholders | | | (792,289 | ) | | | (4,751,799 | ) |
| | | | | | | | | |
| FROM SHARES OF BENEFICIAL INTEREST | | | | | | | | |
| Proceeds from shares sold: | | | | | | | | |
| Class A (SYMAX) | | | 15,582 | | | | 872,238 | |
| Class C (SYMCX) | | | 9,460 | | | | 1,117,443 | |
| Class I (SYMIX) | | | 2,331,934 | | | | 25,514,484 | |
| Net asset value of shares issued in reinvestment of distributions: | | | | | | | | |
| Class A (SYMAX) | | | 2,237 | | | | 35,927 | |
| Class C (SYMCX) | | | 6,778 | | | | 71,886 | |
| Class I (SYMIX) | | | 721,381 | | | | 4,172,379 | |
| Payments for shares repurchased: | | | | | | | | |
| Class A (SYMAX) | | | (718,592 | ) | | | (191,747 | ) |
| Class C (SYMCX) | | | (291,177 | ) | | | (137,756 | ) |
| Class I (SYMIX) | | | (15,248,186 | ) | | | (9,138,073 | ) |
| Net increase (decrease) in net assets from shares of beneficial interest | | | (13,170,583 | ) | | | 22,316,781 | |
| | | | | | | | | |
| TOTAL INCREASE (DECREASE) IN NET ASSETS | | | (10,061,143 | ) | | | 15,655,638 | |
| | | | | | | | | |
| NET ASSETS | | | | | | | | |
| Beginning of Year | | | 50,773,225 | | | | 35,117,587 | |
| End of Year | | $ | 40,712,082 | | | $ | 50,773,225 | |
| | | | | | | | | |
| SHARE ACTIVITY | | | | | | | | |
| Class A (SYMAX): | | | | | | | | |
| Shares Sold | | | 1,304 | | | | 71,906 | |
| Shares Reinvested | | | 196 | | | | 3,116 | |
| Shares Repurchased | | | (61,941 | ) | | | (15,632 | ) |
| Net increase (decrease) in shares of beneficial interest outstanding | | | (60,441 | ) | | | 59,390 | |
| | | | | | | | | |
| Class C (SYMCX): | | | | | | | | |
| Shares Sold | | | 826 | | | | 90,532 | |
| Shares Reinvested | | | 604 | | | | 6,328 | |
| Shares Repurchased | | | (25,397 | ) | | | (11,738 | ) |
| Net increase (decrease) in shares of beneficial interest outstanding | | | (23,967 | ) | | | 85,122 | |
| | | | | | | | | |
| Class I (SYMIX): | | | | | | | | |
| Shares Sold | | | 200,997 | | | | 2,018,139 | |
| Shares Reinvested | | | 63,502 | | | | 361,872 | |
| Shares Repurchased | | | (1,315,186 | ) | | | (785,934 | ) |
| Net increase (decrease) in shares of beneficial interest outstanding | | | (1,050,687 | ) | | | 1,594,077 | |
See accompanying notes to financial statements.
| AlphaCentric LifeSci Healthcare Fund |
| STATEMENTS OF CHANGES IN NET ASSETS |
| | | Year Ended | | | Year Ended | |
| | | March 31, 2024 | | | March 31, 2023 | |
| FROM OPERATIONS | | | | | | | | |
| Net investment loss | | $ | (425,154 | ) | | $ | (230,930 | ) |
| Net realized gain from investments | | | 2,990,059 | | | | 596,506 | |
| Net change in unrealized appreciation (depreciation) on investments and foreign currency translation | | | (4,727,571 | ) | | | 857,030 | |
| Net increase (decrease) in net assets resulting from operations | | | (2,162,666 | ) | | | 1,222,606 | |
| | | | | | | | | |
| DISTRIBUTIONS TO SHAREHOLDERS | | | | | | | | |
| From distributable earnings: | | | | | | | | |
| Class A (LYFAX) | | | (176,739 | ) | | | (84,977 | ) |
| Class C (LYFCX) | | | (48,424 | ) | | | (15,109 | ) |
| Class I (LYFIX) | | | (2,467,967 | ) | | | (2,098,747 | ) |
| Total distributions to shareholders | | | (2,693,130 | ) | | | (2,198,833 | ) |
| | | | | | | | | |
| FROM SHARES OF BENEFICIAL INTEREST | | | | | | | | |
| Proceeds from shares sold: | | | | | | | | |
| Class A (LYFAX) | | | 5,892,313 | | | | 3,088,160 | |
| Class C (LYFCX) | | | 1,589,653 | | | | 496,202 | |
| Class I (LYFIX) | | | 64,946,055 | | | | 57,979,380 | |
| Net asset value of shares issued in reinvestment of distributions: | | | | | | | | |
| Class A (LYFAX) | | | 172,476 | | | | 69,852 | |
| Class C (LYFCX) | | | 47,614 | | | | 14,303 | |
| Class I (LYFIX) | | | 2,069,949 | | | | 1,722,708 | |
| Payments for shares repurchased: | | | | | | | | |
| Class A (LYFAX) | | | (2,805,913 | ) | | | (1,071,666 | ) |
| Class C (LYFCX) | | | (158,332 | ) | | | (89,040 | ) |
| Class I (LYFIX) | | | (43,276,729 | ) | | | (13,317,881 | ) |
| Net increase in net assets from shares of beneficial interest | | | 28,477,086 | | | | 48,892,018 | |
| | | | | | | | | |
| TOTAL INCREASE IN NET ASSETS | | | 23,621,290 | | | | 47,915,791 | |
| | | | | | | | | |
| NET ASSETS | | | | | | | | |
| Beginning of Year | | | 79,515,849 | | | | 31,600,058 | |
| End of Year | | $ | 103,137,139 | | | $ | 79,515,849 | |
| | | | | | | | | |
| SHARE ACTIVITY | | | | | | | | |
| Class A (LYFAX): | | | | | | | | |
| Shares Sold | | | 439,166 | | | | 232,845 | |
| Shares Reinvested | | | 13,754 | | | | 5,802 | |
| Shares Repurchased | | | (220,086 | ) | | | (87,030 | ) |
| Net increase in shares of beneficial interest outstanding | | | 232,834 | | | | 151,617 | |
| | | | | | | | | |
| Class C (LYFCX): | | | | | | | | |
| Shares Sold | | | 127,015 | | | | 37,659 | |
| Shares Reinvested | | | 3,868 | | | | 1,201 | |
| Shares Repurchased | | | (12,382 | ) | | | (6,962 | ) |
| Net increase in shares of beneficial interest outstanding | | | 118,501 | | | | 31,898 | |
| | | | | | | | | |
| Class I (LYFIX): | | | | | | | | |
| Shares Sold | | | 4,881,707 | | | | 4,414,786 | |
| Shares Reinvested | | | 163,891 | | | | 142,373 | |
| Shares Repurchased | | | (3,356,199 | ) | | | (1,091,546 | ) |
| Net increase in shares of beneficial interest outstanding | | | 1,689,399 | | | | 3,465,613 | |
See accompanying notes to financial statements.
| AlphaCentric Strategic Income Fund |
| STATEMENTS OF CHANGES IN NET ASSETS |
| | | Year Ended | | | Year Ended | |
| | | March 31, 2024 | | | March 31, 2023 | |
| FROM OPERATIONS | | | | | | | | |
| Net investment income | | $ | 2,941,790 | | | $ | 1,765,914 | |
| Net realized gain from investments | | | 835,826 | | | | 409,394 | |
| Net change in unrealized appreciation (depreciation) on investments | | | 5,066,385 | | | | (7,127,240 | ) |
| Net increase (decrease) in net assets resulting from operations | | | 8,844,001 | | | | (4,951,932 | ) |
| | | | | | | | | |
| DISTRIBUTIONS TO SHAREHOLDERS | | | | | | | | |
| From return of capital: | | | | | | | | |
| Class A (SIIAX) | | | — | | | | (4,931 | ) |
| Class C (SIICX) | | | — | | | | (11,890 | ) |
| Class I (SIIIX) | | | — | | | | (693,518 | ) |
| From distributable earnings: | | | | | | | | |
| Class A (SIIAX) | | | (59,336 | ) | | | (11,026 | ) |
| Class C (SIICX) | | | (87,689 | ) | | | (33,781 | ) |
| Class I (SIIIX) | | | (3,656,492 | ) | | | (2,130,505 | ) |
| Total distributions to shareholders | | | (3,803,517 | ) | | | (2,885,651 | ) |
| | | | | | | | | |
| FROM SHARES OF BENEFICIAL INTEREST | | | | | | | | |
| Proceeds from shares sold: | | | | | | | | |
| Class A (SIIAX) | | | 795,213 | | | | 253,527 | |
| Class C (SIICX) | | | 889,609 | | | | 652,544 | |
| Class I (SIIIX) | | | 28,850,469 | | | | 17,696,460 | |
| Net asset value of shares issued in reinvestment of distributions: | | | | | | | | |
| Class A (SIIAX) | | | 56,834 | | | | 15,957 | |
| Class C (SIICX) | | | 81,045 | | | | 43,414 | |
| Class I (SIIIX) | | | 2,627,713 | | | | 1,861,561 | |
| Payments for shares repurchased: | | | | | | | | |
| Class A (SIIAX) | | | (137,785 | ) | | | (12,039 | ) |
| Class C (SIICX) | | | (245,794 | ) | | | (164,451 | ) |
| Class I (SIIIX) | | | (29,103,103 | ) | | | (10,896,446 | ) |
| Net increase in net assets from shares of beneficial interest | | | 3,814,201 | | | | 9,450,527 | |
| | | | | | | | | |
| TOTAL INCREASE IN NET ASSETS | | | 8,854,685 | | | | 1,612,944 | |
| | | | | | | | | |
| NET ASSETS | | | | | | | | |
| Beginning of Year | | | 47,960,433 | | | | 46,347,489 | |
| End of Year | | $ | 56,815,118 | | | $ | 47,960,433 | |
| | | | | | | | | |
| SHARE ACTIVITY | | | | | | | | |
| Class A (SIIAX): | | | | | | | | |
| Shares Sold | | | 50,383 | | | | 17,251 | |
| Shares Reinvested | | | 3,600 | | | | 1,027 | |
| Shares Repurchased | | | (8,615 | ) | | | (794 | ) |
| Net increase in shares of beneficial interest outstanding | | | 45,368 | | | | 17,484 | |
| | | | | | | | | |
| Class C (SIICX): | | | | | | | | |
| Shares Sold | | | 57,657 | | | | 42,263 | |
| Shares Reinvested | | | 5,149 | | | | 2,800 | |
| Shares Repurchased | | | (15,877 | ) | | | (10,704 | ) |
| Net increase in shares of beneficial interest outstanding | | | 46,929 | | | | 34,359 | |
| | | | | | | | | |
| Class I (SIIIX): | | | | | | | | |
| Shares Sold | | | 1,825,740 | | | | 1,114,416 | |
| Shares Reinvested | | | 166,606 | | | | 119,010 | |
| Shares Repurchased | | | (1,844,799 | ) | | | (683,237 | ) |
| Net increase in shares of beneficial interest outstanding | | | 147,547 | | | | 550,189 | |
See accompanying notes to financial statements.
| AlphaCentric Income Opportunities Fund |
| FINANCIAL HIGHLIGHTS |
Per Share Data and Ratios for a Share of Beneficial Interest Outstanding Throughout Each Year Presented
| | | Year Ended | | | Year Ended | | | Year Ended | | | Year Ended | | | Year Ended | |
| | | March 31, | | | March 31, | | | March 31, | | | March 31, | | | March 31, | |
| Class A (IOFAX) | | 2024 | | | 2023 | | | 2022 | | | 2021 | | | 2020 | |
| Net asset value, beginning of year | | $ | 8.68 | | | $ | 11.48 | | | $ | 11.50 | | | $ | 8.15 | | | $ | 12.28 | |
| Activity from investment operations: | | | | | | | | | | | | | | | | | | | | |
| Net investment income (1) | | | 0.28 | | | | 0.22 | | | | 0.13 | | | | 0.19 | | | | 0.46 | |
| Net realized and unrealized gain (loss) on investments | | | (0.60 | ) | | | (2.52 | ) | | | 0.30 | | | | 3.62 | | | | (4.02 | ) |
| Total from investment operations | | | (0.32 | ) | | | (2.30 | ) | | | 0.43 | | | | 3.81 | | | | (3.56 | ) |
| Less distributions from: | | | | | | | | | | | | | | | | | | | | |
| Net investment income | | | (0.25 | ) | | | (0.19 | ) | | | (0.26 | ) | | | (0.21 | ) | | | (0.48 | ) |
| Return of capital | | | (0.32 | ) | | | (0.31 | ) | | | (0.19 | ) | | | (0.25 | ) | | | (0.09 | ) |
| Total distributions | | | (0.57 | ) | | | (0.50 | ) | | | (0.45 | ) | | | (0.46 | ) | | | (0.57 | ) |
| Net asset value, end of year | | $ | 7.79 | | | $ | 8.68 | | | $ | 11.48 | | | $ | 11.50 | | | $ | 8.15 | |
| Total return (2) | | | (3.63 | )% (10) | | | (20.20 | )% | | | 3.68 | % | | | 47.64 | % | | | (30.45 | )% |
| Net assets, at end of year (000s) | | $ | 34,190 | | | $ | 44,561 | | | $ | 146,192 | | | $ | 221,961 | | | $ | 152,646 | |
| Ratio of gross expenses to average net assets before expense reimbursement (3) | | | 2.31 | % (9) | | | 2.18 | % (8) | | | 1.95 | % (7) | | | 1.97 | % (6) | | | 1.93 | % (5) |
| Ratio of net expenses to average net assets after expense reimbursement | | | 1.99 | % (9) | | | 1.90 | % (8) | | | 1.76 | % (7) | | | 1.75 | % (6) | | | 1.75 | % (5) |
| Ratio of net investment income to average net assets (4) | | | 3.46 | % (9) | | | 2.32 | % (8) | | | 1.09 | % (7) | | | 1.83 | % (6) | | | 3.67 | % (5) |
| Portfolio Turnover Rate | | | 15 | % | | | 0 | % | | | 14 | % | | | 3 | % | | | 54 | % |
| | | | | | | | | | | | | | | | | | | | | |
| (1) | Per share amounts calculated using the average shares method. |
| (2) | Total return in the above table is historical in nature and represents the rate that the investor would have earned or lost on an investment in the Fund assuming reinvestment of dividends and capital gain distributions, if any, and does not reflect the impact of sales charges. Had the adviser not waived a portion of the Fund’s expenses, total returns would have been lower. |
| (3) | Represents the ratio of expenses to average net assets absent fee waivers and/or expense reimbursements by the adviser. |
| (4) | Recognition of net investment income (loss) is affected by the timing and declaration of dividends by the underlying investment companies in which the Fund invests. |
| (5) | Includes 0.01% for the year ended March 31, 2020 attributed to line of credit fees which are not subject to waiver by the adviser. |
| (6) | Includes 0.01% for the year ended March 31, 2021 attributed to borrowing costs (line of credit fees) and extraordinary expenses which are not subject to waiver by the adviser. |
| (7) | Includes 0.02% for the year ended March 31, 2022 attributed to borrowing costs (line of credit fees) and extraordinary expenses which are not subject to waiver by the adviser. |
| (8) | Includes 0.16% for the year ended March 31, 2023 attributed to borrowing costs (line of credit fees) and extraordinary expenses which are not subject to waiver by the adviser. |
| (9) | Includes 0.25% for the year ended March 31, 2024 attributed to borrowing costs (line of credit fees) and extraordinary expenses which are not subject to waiver by the adviser. |
| (10) | Includes adjustments in accordance with accounting principles generally accepted in the United States of America and, consequently, the net asset value for financial reporting purposes and the returns based upon those net asset values may differ from the net asset values and returns for shareholder transactions. |
See accompanying notes to financial statements.
| AlphaCentric Income Opportunities Fund |
| FINANCIAL HIGHLIGHTS |
Per Share Data and Ratios for a Share of Beneficial Interest Outstanding Throughout Each Year Presented
| | | Year Ended | | | Year Ended | | | Year Ended | | | Year Ended | | | Year Ended | |
| | | March 31, | | | March 31, | | | March 31, | | | March 31, | | | March 31, | |
| Class C (IOFCX) | | 2024 | | | 2023 | | | 2022 | | | 2021 | | | 2020 | |
| Net asset value, beginning of year | | $ | 8.65 | | | $ | 11.43 | | | $ | 11.45 | | | $ | 8.12 | | | $ | 12.24 | |
| Activity from investment operations: | | | | | | | | | | | | | | | | | | | | |
| Net investment income (1) | | | 0.23 | | | | 0.16 | | | | 0.04 | | | | 0.11 | | | | 0.37 | |
| Net realized and unrealized gain (loss) on investments | | | (0.60 | ) | | | (2.51 | ) | | | 0.30 | | | | 3.61 | | | | (4.01 | ) |
| Total from investment operations | | | (0.37 | ) | | | (2.35 | ) | | | 0.34 | | | | 3.72 | | | | (3.64 | ) |
| Less distributions from: | | | | | | | | | | | | | | | | | | | | |
| Net investment income | | | (0.23 | ) | | | (0.17 | ) | | | (0.21 | ) | | | (0.14 | ) | | | (0.41 | ) |
| Return of capital | | | (0.29 | ) | | | (0.26 | ) | | | (0.15 | ) | | | (0.25 | ) | | | (0.07 | ) |
| Total distributions | | | (0.52 | ) | | | (0.43 | ) | | | (0.36 | ) | | | (0.39 | ) | | | (0.48 | ) |
| Net asset value, end of year | | $ | 7.76 | | | $ | 8.65 | | | $ | 11.43 | | | $ | 11.45 | | | $ | 8.12 | |
| Total return (2) | | | (4.37 | )% (10) | | | (20.74 | )% | | | 2.92 | % | | | 46.47 | % | | | (30.98 | )% |
| Net assets, at end of year (000s) | | $ | 24,330 | | | $ | 46,084 | | | $ | 100,794 | | | $ | 118,599 | | | $ | 87,724 | |
| Ratio of gross expenses to average net assets before expense reimbursement (3) | | | 3.06 | % (9) | | | 2.93 | % (8) | | | 2.71 | % (7) | | | 2.72 | % (6) | | | 2.68 | % (5) |
| Ratio of net expenses to average net assets after expense reimbursement | | | 2.74 | % (9) | | | 2.65 | % (8) | | | 2.51 | % (7) | | | 2.50 | % (6) | | | 2.50 | % (5) |
| Ratio of net investment income to average net assets (4) | | | 2.74 | % (9) | | | 1.66 | % (8) | | | 0.34 | % (7) | | | 1.08 | % (6) | | | 2.95 | % (5) |
| Portfolio Turnover Rate | | | 15 | % | | | 0 | % | | | 14 | % | | | 3 | % | | | 54 | % |
| | | | | | | | | | | | | | | | | | | | | |
| (1) | Per share amounts calculated using the average shares method. |
| (2) | Total return in the above table is historical in nature and represents the rate that the investor would have earned or lost on an investment in the Fund assuming reinvestment of dividends and capital gain distributions, if any, and does not reflect the impact of sales charges. Had the adviser not waived a portion of the Fund’s expenses, total returns would have been lower. |
| (3) | Represents the ratio of expenses to average net assets absent fee waivers and/or expense reimbursements by the adviser. |
| (4) | Recognition of net investment income (loss) is affected by the timing and declaration of dividends by the underlying investment companies in which the Fund invests. |
| (5) | Includes 0.01% for the year ended March 31, 2020 attributed to line of credit fees which are not subject to waiver by the adviser. |
| (6) | Includes 0.01% for the year ended March 31, 2021 attributed to borrowing costs (line of credit fees) and extraordinary expenses which are not subject to waiver by the adviser. |
| (7) | Includes 0.02% for the year ended March 31, 2022 attributed to borrowing costs (line of credit fees) and extraordinary expenses which are not subject to waiver by the adviser. |
| (8) | Includes 0.16% for the year ended March 31, 2023 attributed to borrowing costs (line of credit fees) and extraordinary expenses which are not subject to waiver by the adviser. |
| (9) | Includes 0.25% for the year ended March 31, 2024 attributed to borrowing costs (line of credit fees) and extraordinary expenses which are not subject to waiver by the adviser. |
| (10) | Includes adjustments in accordance with accounting principles generally accepted in the United States and consequently the net asset value for financial reporting purposes and the returns based upon those net asset values may differ from the net asset values and returns for shareholder transactions. |
See accompanying notes to financial statements.
| AlphaCentric Income Opportunities Fund |
| FINANCIAL HIGHLIGHTS |
Per Share Data and Ratios for a Share of Beneficial Interest Outstanding Throughout Each Year Presented
| | | Year Ended | | | Year Ended | | | Year Ended | | | Year Ended | | | Year Ended | |
| | | March 31, | | | March 31, | | | March 31, | | | March 31, | | | March 31, | |
| Class I (IOFIX) | | 2024 | | | 2023 | | | 2022 | | | 2021 | | | 2020 | |
| Net asset value, beginning of year | | $ | 8.69 | | | $ | 11.49 | | | $ | 11.51 | | | $ | 8.16 | | | $ | 12.30 | |
| Activity from investment operations: | | | | | | | | | | | | | | | | | | | | |
| Net investment income (1) | | | 0.31 | | | | 0.25 | | | | 0.16 | | | | 0.22 | | | | 0.50 | |
| Net realized and unrealized gain (loss) on investments | | | (0.60 | ) | | | (2.52 | ) | | | 0.30 | | | | 3.63 | | | | (4.03 | ) |
| Total from investment operations | | | (0.29 | ) | | | (2.27 | ) | | | 0.46 | | | | 3.85 | | | | (3.53 | ) |
| Less distributions from: | | | | | | | | | | | | | | | | | | | | |
| Net investment income | | | (0.26 | ) | | | (0.20 | ) | | | (0.28 | ) | | | (0.23 | ) | | | (0.52 | ) |
| Return of capital | | | (0.34 | ) | | | (0.33 | ) | | | (0.20 | ) | | | (0.27 | ) | | | (0.09 | ) |
| Total distributions | | | (0.60 | ) | | | (0.53 | ) | | | (0.48 | ) | | | (0.50 | ) | | | (0.61 | ) |
| Net asset value, end of year | | $ | 7.80 | | | $ | 8.69 | | | $ | 11.49 | | | $ | 11.51 | | | $ | 8.16 | |
| Total return (2) | | | (3.38 | )% (10) | | | (19.99 | )% | | | 3.93 | % | | | 47.94 | % | | | (30.29 | )% |
| Net assets, at end of year (000s) | | $ | 284,496 | | | $ | 528,778 | | | $ | 2,189,289 | | | $ | 3,315,245 | | | $ | 1,515,562 | |
| Ratio of gross expenses to average net assets before expense reimbursement (3) | | | 2.06 | % (9) | | | 1.93 | % (8) | | | 1.70 | % (7) | | | 1.72 | % (6) | | | 1.68 | % (5) |
| Ratio of net expenses to average net assets after expense reimbursement | | | 1.74 | % (9) | | | 1.65 | % (8) | | | 1.51 | % (7) | | | 1.50 | % (6) | | | 1.50 | % (5) |
| Ratio of net investment income to average net assets (4) | | | 3.74 | % (9) | | | 2.56 | % (8) | | | 1.34 | % (7) | | | 2.07 | % (6) | | | 3.91 | % (5) |
| Portfolio Turnover Rate | | | 15 | % | | | 0 | % | | | 14 | % | | | 3 | % | | | 54 | % |
| | | | | | | | | | | | | | | | | | | | | |
| (1) | Per share amounts calculated using the average shares method. |
| (2) | Total return in the above table is historical in nature and represents the rate that the investor would have earned or lost on an investment in the Fund assuming reinvestment of dividends and capital gain distributions, if any, and does not reflect the impact of sales charges. Had the adviser not waived a portion of the Fund’s expenses, total returns would have been lower. |
| (3) | Represents the ratio of expenses to average net assets absent fee waivers and/or expense reimbursements by the adviser. |
| (4) | Recognition of net investment income (loss) is affected by the timing and declaration of dividends by the underlying investment companies in which the Fund invests. |
| (5) | Includes 0.01% for the year ended March 31, 2020 attributed to line of credit fees which are not subject to waiver by the adviser. |
| (6) | Includes 0.01% for the year ended March 31, 2021 attributed to borrowing costs (line of credit fees) and extraordinary expenses which are not subject to waiver by the adviser. |
| (7) | Includes 0.02% for the year ended March 31, 2022 attributed to borrowing costs (line of credit fees) and extraordinary expenses which are not subject to waiver by the adviser. |
| (8) | Includes 0.16% for the year ended March 31, 2023 attributed to borrowing costs (line of credit fees) and extraordinary expenses which are not subject to waiver by the adviser. |
| (9) | Includes 0.25% for the year ended March 31, 2024 attributed to borrowing costs (line of credit fees) and extraordinary expenses which are not subject to waiver by the adviser. |
| (10) | Includes adjustments in accordance with accounting principles generally accepted in the United States of America and, consequently, the net asset value for financial reporting purposes and the returns based upon those net asset values may differ from the net asset values and returns for shareholder transactions. |
See accompanying notes to financial statements.
| AlphaCentric Premium Opportunity Fund |
| FINANCIAL HIGHLIGHTS |
Per Share Data and Ratios for a Share of Beneficial Interest Outstanding Throughout Each Year Presented
| | | Year Ended | | | Year Ended | | | Year Ended | | | Year Ended | | | Year Ended | |
| | | March 31, | | | March 31, | | | March 31, | | | March 31, | | | March 31, | |
| Class A (HMXAX) | | 2024 | | | 2023 | | | 2022 | | | 2021 | | | 2020 | |
| Net asset value, beginning of year | | $ | 24.00 | | | $ | 25.14 | | | $ | 25.80 | | | $ | 23.12 | | | $ | 18.70 | |
| Activity from investment operations: | | | | | | | | | | | | | | | | | | | | |
| Net investment income (loss) (1) | | | 0.37 | | | | (0.07 | ) | | | (0.58 | ) | | | (0.53 | ) | | | (0.06 | ) |
| Net realized and unrealized gain (loss) on investments | | | 2.96 | | | | (1.07 | ) | | | 1.19 | | | | 3.79 | | | | 4.48 | |
| Total from investment operations | | | 3.33 | | | | (1.14 | ) | | | 0.61 | | | | 3.26 | | | | 4.42 | |
| Less distributions from: | | | | | | | | | | | | | | | | | | | | |
| Net realized gains | | | — | | | | — | | | | (1.27 | ) | | | (0.58 | ) | | | — | |
| Total distributions | | | — | | | | — | | | | (1.27 | ) | | | (0.58 | ) | | | — | |
| Net asset value, end of year | | $ | 27.33 | | | $ | 24.00 | | | $ | 25.14 | | | $ | 25.80 | | | $ | 23.12 | |
| Total return (2) | | | 13.88 | % (7) | | | (4.53 | )% | | | 2.24 | % | | | 14.17 | % | | | 23.64 | % |
| Net assets, at end of year (000s) | | $ | 4,314 | | | $ | 7,452 | | | $ | 6,187 | | | $ | 6,455 | | | $ | 1,722 | |
| Ratio of gross expenses to average net assets before expense reimbursement (3) | | | 2.43 | % | | | 2.37 | % | | | 2.25 | % | | | 2.31 | % (6) | | | 3.19 | % (5) |
| Ratio of net expenses to average net assets after expense reimbursement | | | 2.24 | % | | | 2.24 | % | | | 2.24 | % | | | 2.25 | % (6) | | | 2.33 | % (5) |
| Ratio of net investment income (loss) to average net assets | | | 1.48 | % | | | (0.31 | )% | | | (2.22 | )% | | | (2.11 | )% (6) | | | (0.31 | )% (5) |
| Portfolio Turnover Rate (4) | | | 0 | % | | | 0 | % | | | 0 | % | | | 9 | % | | | 0 | % |
| | | | | | | | | | | | | | | | | | | | | |
| (1) | Per share amounts calculated using the average shares method. |
| (2) | Total return in the above table is historical in nature and represents the rate that the investor would have earned or lost on an investment in the Fund assuming reinvestment of dividends and capital gain distributions, if any, and does not reflect the impact of sales charges. Had the adviser not waived a portion of the Fund’s expenses, total returns would have been lower. |
| (3) | Represents the ratio of expenses to average net assets absent fee waivers and/or expense reimbursements by the adviser. |
| (4) | All securities whose maturity or expiration date at the time of acquisition were one year or less are excluded from the portfolio turnover calculation. |
| (5) | Includes 0.09% for the year ended March 31, 2020 attributable to margin expense on short sales, which is not subject to waiver by the adviser. |
| (6) | Includes 0.01% for the year ended March 31, 2021 attributable to margin expense on short sales, which is not subject to waiver by the adviser. |
| (7) | Includes adjustments in accordance with accounting principles generally accepted in the United States of America and, consequently, the net asset value for financial reporting purposes and the returns based upon those net asset values may differ from the net asset values and returns for shareholder transactions. |
See accompanying notes to financial statements.
| AlphaCentric Premium Opportunity Fund |
| FINANCIAL HIGHLIGHTS |
Per Share Data and Ratios for a Share of Beneficial Interest Outstanding Throughout Each Year Presented
| | | Year Ended | | | Year Ended | | | Year Ended | | | Year Ended | | | Year Ended | |
| | | March 31, | | | March 31, | | | March 31, | | | March 31, | | | March 31, | |
| Class C (HMXCX) | | 2024 | | | 2023 | | | 2022 | | | 2021 | | | 2020 | |
| Net asset value, beginning of year | | $ | 22.96 | | | $ | 24.24 | | | $ | 25.10 | | | $ | 22.68 | | | $ | 18.38 | |
| Activity from investment operations: | | | | | | | | | | | | | | | | | | | | |
| Net investment income (loss) (1) | | | 0.18 | | | | (0.29 | ) | | | (0.75 | ) | | | (0.71 | ) | | | (0.25 | ) |
| Net realized and unrealized gain (loss) on investments | | | 2.81 | | | | (0.99 | ) | | | 1.16 | | | | 3.71 | | | | 4.55 | |
| Total from investment operations | | | 2.99 | | | | (1.28 | ) | | | 0.41 | | | | 3.00 | | | | 4.30 | |
| Less distributions from: | | | | | | | | | | | | | | | | | | | | |
| Net realized gains | | | — | | | | — | | | | (1.27 | ) | | | (0.58 | ) | | | — | |
| Total distributions | | | — | | | | — | | | | (1.27 | ) | | | (0.58 | ) | | | — | |
| Net asset value, end of year | | $ | 25.95 | | | $ | 22.96 | | | $ | 24.24 | | | $ | 25.10 | | | $ | 22.68 | |
| Total return (2) | | | 13.02 | % (7) | | | (5.28 | )% | | | 1.50 | % | | | 13.29 | % | | | 23.40 | % |
| Net assets, at end of year (000s) | | $ | 1,646 | | | $ | 1,783 | | | $ | 3,652 | | | $ | 2,079 | | | $ | 164 | |
| Ratio of gross expenses to average net assets before expense reimbursement (3) | | | 3.18 | % | | | 3.12 | % | | | 3.00 | % | | | 3.06 | % (6) | | | 3.94 | % (5) |
| Ratio of net expenses to average net assets after expense reimbursement | | | 2.99 | % | | | 2.99 | % | | | 2.99 | % | | | 3.00 | % (6) | | | 3.04 | % (5) |
| Ratio of net investment income (loss) to average net assets | | | 0.73 | % | | | (1.30 | )% | | | (2.97 | )% | | | (2.88 | )% (6) | | | (1.23 | )% (5) |
| Portfolio Turnover Rate (4) | | | 0 | % | | | 0 | % | | | 0 | % | | | 9 | % | | | 0 | % |
| | | | | | | | | | | | | | | | | | | | | |
| (1) | Per share amounts calculated using the average shares method. |
| (2) | Total return in the above table is historical in nature and represents the rate that the investor would have earned or lost on an investment in the Fund assuming reinvestment of dividends and capital gain distributions, if any, and does not reflect the impact of sales charges. Had the adviser not waived a portion of the Fund’s expenses, total returns would have been lower. |
| (3) | Represents the ratio of expenses to average net assets absent fee waivers and/or expense reimbursements by the adviser. |
| (4) | All securities whose maturity or expiration date at the time of acquisition were one year or less are excluded from the portfolio turnover calculation. |
| (5) | Includes 0.05% for the year ended March 31, 2020 attributable to margin expense on short sales, which is not subject to waiver by the adviser. |
| (6) | Includes 0.01% for the year ended March 31, 2021 attributable to margin expense on short sales, which is not subject to waiver by the adviser. |
| (7) | Includes adjustments in accordance with accounting principles generally accepted in the United States of America and, consequently, the net asset value for financial reporting purposes and the returns based upon those net asset values may differ from the net asset values and returns for shareholder transactions. |
See accompanying notes to financial statements.
| AlphaCentric Premium Opportunity Fund |
| FINANCIAL HIGHLIGHTS |
Per Share Data and Ratios for a Share of Beneficial Interest Outstanding Throughout Each Year Presented
| | | Year Ended | | | Year Ended | | | Year Ended | | | Year Ended | | | Year Ended | |
| | | March 31, | | | March 31, | | | March 31, | | | March 31, | | | March 31, | |
| Class I (HMXIX) | | 2024 | | | 2023 | | | 2022 | | | 2021 | | | 2020 | |
| Net asset value, beginning of year | | $ | 24.56 | | | $ | 25.67 | | | $ | 26.25 | | | $ | 23.46 | | | $ | 18.93 | |
| Activity from investment operations: | | | | | | | | | | | | | | | | | | | | |
| Net investment income (loss) (1) | | | 0.45 | | | | (0.07 | ) | | | (0.52 | ) | | | (0.48 | ) | | | (0.03 | ) |
| Net realized and unrealized gain (loss) on investments | | | 3.03 | | | | (1.04 | ) | | | 1.21 | | | | 3.85 | | | | 4.56 | |
| Total from investment operations | | | 3.48 | | | | (1.11 | ) | | | 0.69 | | | | 3.37 | | | | 4.53 | |
| Less distributions from: | | | | | | | | | | | | | | | | | | | | |
| Net realized gains | | | — | | | | — | | | | (1.27 | ) | | | (0.58 | ) | | | — | |
| Total distributions | | | — | | | | — | | | | (1.27 | ) | | | (0.58 | ) | | | — | |
| Net asset value, end of year | | $ | 28.04 | | | $ | 24.56 | | | $ | 25.67 | | | $ | 26.25 | | | $ | 23.46 | |
| Total return (2) | | | 14.17 | % | | | (4.32 | )% | | | 2.51 | % | | | 14.43 | % | | | 23.93 | % |
| Net assets, at end of year (000s) | | $ | 68,207 | | | $ | 79,979 | | | $ | 167,686 | | | $ | 93,490 | | | $ | 26,792 | |
| Ratio of gross expenses to average net assets before expense reimbursement (3) | | | 2.18 | % | | | 2.12 | % | | | 2.01 | % | | | 2.06 | % (6) | | | 2.94 | % (5) |
| Ratio of net expenses to average net assets after expense reimbursement | | | 1.99 | % | | | 1.99 | % | | | 1.99 | % | | | 2.00 | % (6) | | | 2.05 | % (5) |
| Ratio of net investment income (loss) to average net assets | | | 1.73 | % | | | (0.30 | )% | | | (1.97 | )% | | | (1.87 | )% (6) | | | (0.13 | )% (5) |
| Portfolio Turnover Rate (4) | | | 0 | % | | | 0 | % | | | 0 | % | | | 9 | % | | | 0 | % |
| | | | | | | | | | | | | | | | | | | | | |
| (1) | Per share amounts calculated using the average shares method. |
| (2) | Total return in the above table is historical in nature and represents the rate that the investor would have earned or lost on an investment in the Fund assuming reinvestment of dividends and capital gain distributions, if any, and does not reflect the impact of sales charges. Had the adviser not waived a portion of the Fund’s expenses, total returns would have been lower. |
| (3) | Represents the ratio of expenses to average net assets absent fee waivers and/or expense reimbursements by the adviser. |
| (4) | All securities whose maturity or expiration date at the time of acquisition were one year or less are excluded from the portfolio turnover calculation. |
| (5) | Includes 0.06% for the year ended March 31, 2020 attributable to margin expense on short sales, which is not subject to waiver by the adviser. |
| (6) | Includes 0.01% for the year ended March 31, 2021 attributable to margin expense on short sales, which is not subject to waiver by the adviser. |
See accompanying notes to financial statements.
| AlphaCentric Robotics and Automation Fund |
| FINANCIAL HIGHLIGHTS |
Per Share Data and Ratios for a Share of Beneficial Interest Outstanding Throughout Each Year Presented
| | | Year Ended | | | Year Ended | | | Year Ended | | | Year Ended | | | Year Ended | |
| | | March 31, | | | March 31, | | | March 31, | | | March 31, | | | March 31, | |
| Class A (GNXAX) | | 2024 | | | 2023 | | | 2022 | | | 2021 | | | 2020 | |
| Net asset value, beginning of year | | $ | 11.61 | | | $ | 13.99 | | | $ | 17.06 | | | $ | 9.63 | | | $ | 11.46 | |
| Activity from investment operations: | | | | | | | | | | | | | | | | | | | | |
| Net investment loss (1) | | | (0.04 | ) | | | (0.02 | ) | | | (0.14 | ) | | | (0.14 | ) | | | (0.08 | ) |
| Net realized and unrealized gain (loss) on investments | | | 0.69 | | | | (1.78 | ) | | | (2.20 | ) | | | 7.57 | | | | (1.75 | ) |
| Total from investment operations | | | 0.65 | | | | (1.80 | ) | | | (2.34 | ) | | | 7.43 | | | | (1.83 | ) |
| Less distributions from: | | | | | | | | | | | | | | | | | | | | |
| Net realized gains | | | — | | | | (0.58 | ) | | | (0.73 | ) | | | — | | | | — | |
| Total distributions | | | — | | | | (0.58 | ) | | | (0.73 | ) | | | — | | | | — | |
| Net asset value, end of year | | $ | 12.26 | | | $ | 11.61 | | | $ | 13.99 | | | $ | 17.06 | | | $ | 9.63 | |
| Total return (2) | | | 5.60 | % | | | (12.70 | )% | | | (14.41 | )% | | | 77.15 | % | | | (15.97 | )% |
| Net assets, at end of year (000s) | | $ | 2,988 | | | $ | 3,729 | | | $ | 5,853 | | | $ | 7,796 | | | $ | 4,711 | |
| Ratio of gross expenses to average net assets before expense reimbursement (3) | | | 2.34 | % (4) | | | 2.31 | % | | | 2.02 | % | | | 2.10 | % | | | 2.18 | % |
| Ratio of net expenses to average net assets after expense reimbursement | | | 1.65 | % (4) | | | 1.65 | % | | | 1.65 | % | | | 1.65 | % | | | 1.65 | % |
| Ratio of net investment loss to average net assets | | | (0.32) | % (4) | | | (0.20 | )% | | | (0.85 | )% | | | (0.96 | )% | | | (0.69 | )% |
| Portfolio Turnover Rate | | | 54 | % | | | 38 | % | | | 73 | % | | | 125 | % | | | 315 | % |
| | | | | | | | | | | | | | | | | | | | | |
| (1) | Per share amounts calculated using the average shares method. |
| (2) | Total return in the above table is historical in nature and represents the rate that the investor would have earned or lost on an investment in the Fund assuming reinvestment of dividends and capital gain distributions, if any, and does not reflect the impact of sales charges. Had the adviser not waived a portion of the Fund’s expenses, total returns would have been lower. |
| (3) | Represents the ratio of expenses to average net assets absent fee waivers and/or expense reimbursements by the adviser. |
| (4) | Includes 0.00% for the year ended March 31, 2024 attributed to borrowing costs (line of credit fees) which are not subject to waiver by the adviser. |
See accompanying notes to financial statements.
| AlphaCentric Robotics and Automation Fund |
| FINANCIAL HIGHLIGHTS |
Per Share Data and Ratios for a Share of Beneficial Interest Outstanding Throughout Each Year Presented
| | | Year Ended | | | Year Ended | | | Year Ended | | | Year Ended | | | Year Ended | |
| | | March 31, | | | March 31, | | | March 31, | | | March 31, | | | March 31, | |
| Class C (GNXCX) | | 2024 | | | 2023 | | | 2022 | | | 2021 | | | 2020 | |
| Net asset value, beginning of year | | $ | 11.07 | | | $ | 13.47 | | | $ | 16.57 | | | $ | 9.43 | | | $ | 11.30 | |
| Activity from investment operations: | | | | | | | | | | | | | | | | | | | | |
| Net investment loss (1) | | | (0.11 | ) | | | (0.10 | ) | | | (0.26 | ) | | | (0.24 | ) | | | (0.16 | ) |
| Net realized and unrealized gain (loss) on investments | | | 0.64 | | | | (1.72 | ) | | | (2.11 | ) | | | 7.38 | | | | (1.71 | ) |
| Total from investment operations | | | 0.53 | | | | (1.82 | ) | | | (2.37 | ) | | | 7.14 | | | | (1.87 | ) |
| Less distributions from: | | | | | | | | | | | | | | | | | | | | |
| Net realized gains | | | — | | | | (0.58 | ) | | | (0.73 | ) | | | — | | | | — | |
| Total distributions | | | — | | | | (0.58 | ) | | | (0.73 | ) | | | — | | | | — | |
| Net asset value, end of year | | $ | 11.60 | | | $ | 11.07 | | | $ | 13.47 | | | $ | 16.57 | | | $ | 9.43 | |
| Total return (2) | | | 4.79 | % | | | (13.34 | )% | | | (15.03 | )% | | | 75.72 | % | | | (16.55 | )% |
| Net assets, at end of year (000s) | | $ | 536 | | | $ | 676 | | | $ | 1,258 | | | $ | 1,258 | | | $ | 828 | |
| Ratio of gross expenses to average net assets before expense reimbursement (3) | | | 3.09 | % (4) | | | 3.06 | % | | | 2.78 | % | | | 2.85 | % | | | 2.93 | % |
| Ratio of net expenses to average net assets after expense reimbursement | | | 2.40 | % (4) | | | 2.40 | % | | | 2.40 | % | | | 2.40 | % | | | 2.40 | % |
| Ratio of net investment loss to average net assets | | | (1.07 | )% (4) | | | (0.96 | )% | | | (1.61 | )% | | | (1.71 | )% | | | (1.47 | )% |
| Portfolio Turnover Rate | | | 54 | % | | | 38 | % | | | 73 | % | | | 125 | % | | | 315 | % |
| | | | | | | | | | | | | | | | | | | | | |
| (1) | Per share amounts calculated using the average shares method. |
| (2) | Total return in the above table is historical in nature and represents the rate that the investor would have earned or lost on an investment in the Fund assuming reinvestment of dividends and capital gain distributions, if any, and does not reflect the impact of sales charges. Had the adviser not waived a portion of the Fund’s expenses, total returns would have been lower. |
| (3) | Represents the ratio of expenses to average net assets absent fee waivers and/or expense reimbursements by the adviser. |
| (4) | Includes 0.00% for the year ended March 31, 2024 attributed to borrowing costs (line of credit fees) which are not subject to waiver by the adviser. |
See accompanying notes to financial statements.
| AlphaCentric Robotics and Automation Fund |
| FINANCIAL HIGHLIGHTS |
Per Share Data and Ratios for a Share of Beneficial Interest Outstanding Throughout Each Year Presented
| | | | | | | | | | | | | | | | |
| | | Year Ended | | | Year Ended | | | Year Ended | | | Year Ended | | | Year Ended | |
| | | March 31, | | | March 31, | | | March 31, | | | March 31, | | | March 31, | |
| Class I (GNXIX) | | 2024 | | | 2023 | | | 2022 | | | 2021 | | | 2020 | |
| Net asset value, beginning of year | | $ | 11.81 | | | $ | 14.17 | | | $ | 17.23 | | | $ | 9.71 | | | $ | 11.52 | |
| Activity from investment operations: | | | | | | | | | | | | | | | | | | | | |
| Net investment income (loss) (1) | | | (0.01 | ) | | | 0.01 | (4) | | | (0.10 | ) | | | (0.10 | ) | | | (0.05 | ) |
| Net realized and unrealized gain (loss) on investments | | | 0.70 | | | | (1.79 | ) | | | (2.23 | ) | | | 7.62 | | | | (1.76 | ) |
| Total from investment operations | | | 0.69 | | | | (1.78 | ) | | | (2.33 | ) | | | 7.52 | | | | (1.81 | ) |
| Less distributions from: | | | | | | | | | | | | | | | | | | | | |
| Net realized gains | | | — | | | | (0.58 | ) | | | (0.73 | ) | | | — | | | | — | |
| Total distributions | | | — | | | | (0.58 | ) | | | (0.73 | ) | | | — | | | | — | |
| Net asset value, end of year | | $ | 12.50 | | | $ | 11.81 | | | $ | 14.17 | | | $ | 17.23 | | | $ | 9.71 | |
| Total return (2) | | | 5.84 | % (5) | | | (12.39 | )% | | | (14.21 | )% | | | 77.45 | % | | | (15.71 | )% |
| Net assets, at end of year (000s) | | $ | 23,092 | | | $ | 27,309 | | | $ | 32,289 | | | $ | 34,754 | | | $ | 20,392 | |
| Ratio of gross expenses to average net assets before expense reimbursement (3) | | | 2.09 | % (6) | | | 2.06 | % | | | 1.78 | % | | | 1.85 | % | | | 1.93 | % |
| Ratio of net expenses to average net assets after expense reimbursement | | | 1.40 | % (6) | | | 1.40 | % | | | 1.40 | % | | | 1.40 | % | | | 1.40 | % |
| Ratio of net investment income (loss) to average net assets | | | (0.07 | )% (6) | | | 0.03 | % | | | (0.60 | )% | | | (0.70 | )% | | | (0.46 | )% |
| Portfolio Turnover Rate | | | 54 | % | | | 38 | % | | | 73 | % | | | 125 | % | | | 315 | % |
| | | | | | | | | | | | | | | | | | | | | |
| (1) | Per share amounts calculated using the average shares method. |
| (2) | Total return in the above table is historical in nature and represents the rate that the investor would have earned or lost on an investment in the Fund assuming reinvestment of dividends and capital gain distributions, if any, and does not reflect the impact of sales charges. Had the adviser not waived a portion of the Fund’s expenses, total returns would have been lower. |
| (3) | Represents the ratio of expenses to average net assets absent fee waivers and/or expense reimbursements by the adviser. |
| (4) | Net investment income (loss) per share are balancing amounts necessary to reconcile the change in net asset value per share for the period, and may not accord with the aggregate gains and losses in the Statement of Operations due to share transactions for the period. |
| (5) | Includes adjustments in accordance with accounting principles generally accepted in the United States of America and, consequently, the net asset value for financial reporting purposes and the returns based upon those net asset values may differ from the net asset values and returns for shareholder transactions. |
| (6) | Includes 0.00% for the year ended March 31, 2024 attributed to borrowing costs (line of credit fees) which are not subject to waiver by the adviser. |
See accompanying notes to financial statements.
| AlphaCentric Symmetry Strategy Fund |
| CONSOLIDATED FINANCIAL HIGHLIGHTS |
Per Share Data and Ratios for a Share of Beneficial Interest Outstanding Throughout Each Period Presented
| | | Year Ended | | | Year Ended | | | Year Ended | | | Year Ended | | | Period Ended | |
| | | March 31, | | | March 31, | | | March 31, | | | March 31, | | | March 31, | |
| Class A (SYMAX) | | 2024 | | | 2023 | | | 2022 | | | 2021 | | | 2020 (1) | |
| Net asset value, beginning of period | | $ | 11.30 | | | $ | 12.76 | | | $ | 11.46 | | | $ | 9.75 | | | $ | 11.28 | |
| Activity from investment operations: | | | | | | | | | | | | | | | | | | | | |
| Net investment income (loss) (2) | | | 0.19 | | | | 0.08 | | | | (0.08 | ) | | | (0.04 | ) | | | 0.05 | |
| Net realized and unrealized gain (loss) on investments | | | 0.85 | | | | (0.43 | ) | | | 1.40 | | | | 1.89 | | | | (1.33 | ) (8) |
| Total from investment operations | | | 1.04 | | | | (0.35 | ) | | | 1.32 | | | | 1.85 | | | | (1.28 | ) |
| Less distributions from: | | | | | | | | | | | | | | | | | | | | |
| Net investment income | | | (0.15 | ) | | | (0.98 | ) | | | (0.02 | ) | | | (0.14 | ) | | | (0.25 | ) |
| Net realized gains | | | — | | | | (0.13 | ) | | | — | | | | — | | | | — | |
| Total distributions | | | (0.15 | ) | | | (1.11 | ) | | | (0.02 | ) | | | (0.14 | ) | | | (0.25 | ) |
| Net asset value, end of period | | $ | 12.19 | | | $ | 11.30 | | | $ | 12.76 | | | $ | 11.46 | | | $ | 9.75 | |
| Total return (3)(6) | | | 9.28 | % | | | (2.86 | )% | | | 11.57 | % | | | 19.11 | % | | | (11.64 | )% |
| Net assets, at end of period (000s) | | $ | 189 | | | $ | 858 | | | $ | 211 | | | $ | 1,016 | (7) | | $ | 865 | (7) |
| Ratio of gross expenses to average net assets before expense reimbursement (4)(5) | | | 2.17 | % (12) | | | 1.95 | % | | | 2.38 | % (11) | | | 2.63 | % (10) | | | 2.51 | % (9) |
| Ratio of net expenses to average net assets after expense reimbursement (5) | | | 1.85 | % (12) | | | 1.85 | % | | | 2.01 | % (11) | | | 2.26 | % (10) | | | 2.25 | % (9) |
| Ratio of net investment income (loss) to average net assets (5) | | | 1.63 | % (12) | | | 0.65 | % | | | (0.54 | )% (11) | | | (0.45 | )% (10) | | | 0.38 | % (9) |
| Portfolio Turnover Rate (6) | | | 329 | % | | | 362 | % | | | 189 | % | | | 121 | % | | | 133 | % |
| | | | | | | | | | | | | | | | | | | | | |
| (1) | AlphaCentric Symmetry Strategy Fund Class A commenced operations on August 8, 2019. |
| (2) | Per share amounts calculated using the average shares method. |
| (3) | Total return in the above table is historical in nature and represents the rate that the investor would have earned or lost on an investment in the Fund assuming reinvestment of dividends and capital gain distributions, if any, and does not reflect the impact of sales charges. Had the adviser not waived a portion of the Fund’s expenses, total returns would have been lower. |
| (4) | Represents the ratio of expenses to average net assets absent fee waivers and/or expense reimbursements by the adviser. |
| (5) | Annualized for periods less than one year. |
| (6) | Not annualized for periods less than one year. |
| (7) | Actual net assets, not truncated. |
| (8) | As required by SEC standard per share calculation methodology, this represents a rebalancing figure derived from other amounts in the financial highlights tables that captures all other changes affecting net asset value per share. This per share gain amount does not correlate to the aggregate of the net realized and unrealized loss in the Statement of Operations for the period ended March 31, 2020, primarily due to the timing of sales and repurchases of the Fund’s shares in relation to fluctuating market values of the Fund’s portfolio. |
| (9) | Includes 0.01% for the period ended March 31, 2020 attributable to margin expense on futures, which is not subject to waiver by the adviser. |
| (10) | Includes 0.02% for the year ended March 31, 2021 attributable to margin expense on futures, which is not subject to waiver by the adviser. |
| (11) | Includes 0.02% for the year ended March 31, 2022 attributable to margin expense on futures, which is not subject to waiver by the adviser. |
| (12) | Includes 0.00% for the year ended March 31, 2024 attributed to borrowing costs (line of credit fees) which are not subject to waiver by the adviser. |
See accompanying notes to financial statements.
| AlphaCentric Symmetry Strategy Fund |
| CONSOLIDATED FINANCIAL HIGHLIGHTS |
Per Share Data and Ratios for a Share of Beneficial Interest Outstanding Throughout Each Period Presented
| | | Year Ended | | | Year Ended | | | Year Ended | | | Year Ended | | | Period Ended | |
| | | March 31, | | | March 31, | | | March 31, | | | March 31, | | | March 31, | |
| Class C (SYMCX) | | 2024 | | | 2023 | | | 2022 | | | 2021 | | | 2020 (1) | |
| Net asset value, beginning of period | | $ | 11.11 | | | $ | 12.63 | | | $ | 11.42 | | | $ | 9.75 | | | $ | 11.28 | |
| Activity from investment operations: | | | | | | | | | | | | | | | | | | | | |
| Net investment income (loss) (2) | | | 0.11 | | | | 0.01 | | | | (0.15 | ) | | | (0.12 | ) | | | (0.00 | ) (7) |
| Net realized and unrealized gain (loss) on investments | | | 0.82 | | | | (0.44 | ) | | | 1.36 | | | | 1.88 | | | | (1.33 | ) (9) |
| Total from investment operations | | | 0.93 | | | | (0.43 | ) | | | 1.21 | | | | 1.76 | | | | (1.33 | ) |
| Less distributions from: | | | | | | | | | | | | | | | | | | | | |
| Net investment income | | | (0.10 | ) | | | (0.96 | ) | | | — | | | | (0.09 | ) | | | (0.20 | ) |
| Net realized gains | | | — | | | | (0.13 | ) | | | — | | | | — | | | | — | |
| Total distributions | | | (0.10 | ) | | | (1.09 | ) | | | — | | | | (0.09 | ) | | | (0.20 | ) |
| Net asset value, end of period | | $ | 11.94 | | | $ | 11.11 | | | $ | 12.63 | | | $ | 11.42 | | | $ | 9.75 | |
| Total return (3)(6) | | | 8.46 | % | | | (3.53 | )% | | | 10.60 | % | | | 18.10 | % | | | (11.97 | )% |
| Net assets, at end of period (000s) | | $ | 739 | | | $ | 954 | | | $ | 9 | | | $ | 1,013 | (8) | | $ | 864 | (8) |
| Ratio of gross expenses to average net assets before expense reimbursement (4)(5) | | | 2.92 | % (13) | | | 2.70 | % | | | 3.12 | % (12) | | | 3.37 | % (11) | | | 3.26 | % (10) |
| Ratio of net expenses to average net assets after expense reimbursement (5) | | | 2.60 | % (13) | | | 2.60 | % | | | 2.76 | % (12) | | | 3.01 | % (11) | | | 3.00 | % (10) |
| Ratio of net investment income (loss) to average net assets (5) | | | 0.98 | % (13) | | | 0.06 | % | | | (1.29 | )% (12) | | | (1.20 | )% (11) | | | (0.16) | % (10) |
| Portfolio Turnover Rate (6) | | | 329 | % | | | 362 | % | | | 189 | % | | | 121 | % | | | 133 | % |
| | | | | | | | | | | | | | | | | | | | | |
| (1) | AlphaCentric Symmetry Strategy Fund Class C commenced operations on August 8, 2019. |
| (2) | Per share amounts calculated using the average shares method. |
| (3) | Total return in the above table is historical in nature and represents the rate that the investor would have earned or lost on an investment in the Fund assuming reinvestment of dividends and capital gain distributions, if any, and does not reflect the impact of sales charges. Had the adviser not waived a portion of the Fund’s expenses, total returns would have been lower. |
| (4) | Represents the ratio of expenses to average net assets absent fee waivers and/or expense reimbursements by the adviser. |
| (5) | Annualized for periods less than one year. |
| (6) | Not annualized for periods less than one year. |
| (8) | Actual net assets, not truncated. |
| (9) | As required by SEC standard per share calculation methodology, this represents a rebalancing figure derived from other amounts in the financial highlights tables that captures all other changes affecting net asset value per share. This per share gain amount does not correlate to the aggregate of the net realized and unrealized loss in the Statement of Operations for the period ended March 31, 2020, primarily due to the timing of sales and repurchases of the Fund’s shares in relation to fluctuating market values of the Fund’s portfolio. |
| (10) | Includes 0.01% for the period ended March 31, 2020 attributable to margin expense on futures, which is not subject to waiver by the adviser. |
| (11) | Includes 0.02% for the year ended March 31, 2021 attributable to margin expense on futures, which is not subject to waiver by the adviser. |
| (12) | Includes 0.02% for the year ended March 31, 2022 attributable to margin expense on futures, which is not subject to waiver by the adviser. |
| (13) | Includes 0.00% for the year ended March 31, 2024 attributed to borrowing costs (line of credit fees) which are not subject to waiver by the adviser. |
See accompanying notes to financial statements.
| AlphaCentric Symmetry Strategy Fund |
| CONSOLIDATED FINANCIAL HIGHLIGHTS |
Per Share Data and Ratios for a Share of Beneficial Interest Outstanding Throughout Each Period Presented
| | | Year Ended | | | Year Ended | | | Year Ended | | | Year Ended | | | Period Ended | |
| | | March 31, | | | March 31, | | | March 31, | | | March 31, | | | March 31, | |
| Class I (SYMIX) | | 2024 | | | 2023 | | | 2022 | | | 2021 | | | 2020 (1) | |
| Net asset value, beginning of period | | $ | 11.30 | | | $ | 12.75 | | | $ | 11.44 | | | $ | 9.75 | | | $ | 11.28 | |
| Activity from investment operations: | | | | | | | | | | | | | | | | | | | | |
| Net investment income (loss) (2) | | | 0.23 | | | | 0.08 | | | | (0.04 | ) | | | (0.02 | ) | | | 0.07 | |
| Net realized and unrealized gain (loss) on investments | | | 0.84 | | | | (0.40 | ) | | | 1.38 | | | | 1.89 | | | | (1.33) | (7) |
| Total from investment operations | | | 1.07 | | | | (0.32 | ) | | | 1.34 | | | | 1.87 | | | | (1.26 | ) |
| Less distributions from: | | | | | | | | | | | | | | | | | | | | |
| Net investment income | | | (0.24 | ) | | | (1.00 | ) | | | (0.03 | ) | | | (0.18 | ) | | | (0.27 | ) |
| Net realized gains | | | — | | | | (0.13 | ) | | | — | | | | — | | | | — | |
| Total distributions | | | (0.24 | ) | | | (1.13 | ) | | | (0.03 | ) | | | (0.18 | ) | | | (0.27 | ) |
| Net asset value, end of period | | $ | 12.13 | | | $ | 11.30 | | | $ | 12.75 | | | $ | 11.44 | | | $ | 9.75 | |
| Total return (3)(6) | | | 9.57 | % | | | (2.65 | )% | | | 11.74 | % | | | 19.37 | % | | | (11.47 | )% |
| Net assets, at end of period (000s) | | $ | 39,785 | | | $ | 48,961 | | | $ | 34,898 | | | $ | 36,619 | | | $ | 30,845 | |
| Ratio of gross expenses to average net assets before expense reimbursement (4)(5) | | | 1.92 | % (11) | | | 1.70 | % | | | 2.12 | % (10) | | | 2.38 | % (9) | | | 2.26 | % (8) |
| Ratio of net expenses to average net assets after expense reimbursement (5) | | | 1.60 | % (11) | | | 1.60 | % | | | 1.76 | % (10) | | | 2.01 | % (9) | | | 2.00 | % (8) |
| Ratio of net investment income (loss) to average net assets (5) | | | 1.98 | % (11) | | | 0.71 | % | | | (0.29 | )% (10) | | | (0.21 | )% (9) | | | 0.96 | % (8) |
| Portfolio Turnover Rate (6) | | | 329 | % | | | 362 | % | | | 189 | % | | | 121 | % | | | 133 | % |
| | | | | | | | | | | | | | | | | | | | | |
| (1) | AlphaCentric Symmetry Strategy Fund Class I commenced operations on September 1, 2014 and does not include performance prior to August 8, 2019 when Class I shares were previously shares of a private fund. |
| (2) | Per share amounts calculated using the average shares method. |
| (3) | Total return in the above table is historical in nature and represents the rate that the investor would have earned or lost on an investment in the Fund assuming reinvestment of dividends and capital gain distributions, if any, and does not reflect the impact of sales charges. Had the adviser not waived a portion of the Fund’s expenses, total returns would have been lower. |
| (4) | Represents the ratio of expenses to average net assets absent fee waivers and/or expense reimbursements by the adviser. |
| (5) | Annualized for periods less than one year. |
| (6) | Not annualized for periods less than one year. |
| (7) | As required by SEC standard per share calculation methodology, this represents a rebalancing figure derived from other amounts in the financial highlights tables that captures all other changes affecting net asset value per share. This per share gain amount does not correlate to the aggregate of the net realized and unrealized loss in the Statement of Operations for the period ended March 31, 2020, primarily due to the timing of sales and repurchases of the Fund’s shares in relation to fluctuating market values of the Fund’s portfolio. |
| (8) | Includes 0.01% for the period ended March 31, 2020 attributable to margin expense on futures, which is not subject to waiver by the adviser. |
| (9) | Includes 0.02% for the year ended March 31, 2021 attributable to margin expense on futures, which is not subject to waiver by the adviser. |
| (10) | Includes 0.02% for the year ended March 31, 2022 attributable to margin expense on futures, which is not subject to waiver by the adviser. |
| (11) | Includes 0.00% for the year ended March 31, 2024 attributed to borrowing costs (line of credit fees) which are not subject to waiver by the adviser. |
See accompanying notes to financial statements.
| AlphaCentric LifeSci Healthcare Fund |
| FINANCIAL HIGHLIGHTS |
Per Share Data and Ratios for a Share of Beneficial Interest Outstanding Throughout Each Period Presented
| | | Year Ended | | | Year Ended | | | Year Ended | | | Year Ended | | | Period Ended | |
| | | March 31, | | | March 31, | | | March 31, | | | March 31, | | | March 31, | |
| Class A (LYFAX) | | 2024 | | | 2023 | | | 2022 | | | 2021 | | | 2020 (1) | |
| Net asset value, beginning of period | | $ | 13.18 | | | $ | 13.38 | | | $ | 15.56 | | | $ | 9.55 | | | $ | 10.00 | |
| Activity from investment operations: | | | | | | | | | | | | | | | | | | | | |
| Net investment loss (2) | | | (0.08 | ) | | | (0.09 | ) | | | (0.21 | ) | | | (0.19 | ) | | | (0.04 | ) |
| Net realized and unrealized gain (loss) on investments | | | (0.03 | ) | | | 0.44 | | | | (0.32 | ) | | | 6.55 | | | | (0.41 | ) |
| Total from investment operations | | | (0.11 | ) | | | 0.35 | | | | (0.53 | ) | | | 6.36 | | | | (0.45 | ) |
| Less distributions from: | | | | | | | | | | | | | | | | | | | | |
| Net investment income | | | — | | | | — | | | | (0.07 | ) | | | — | | | | — | |
| Net realized gains | | | (0.34 | ) | | | (0.55 | ) | | | (1.58 | ) | | | (0.35 | ) | | | — | |
| Total distributions | | | (0.34 | ) | | | (0.55 | ) | | | (1.65 | ) | | | (0.35 | ) | | | — | |
| Net asset value, end of period | | $ | 12.73 | | | $ | 13.18 | | | $ | 13.38 | | | $ | 15.56 | | | $ | 9.55 | |
| Total return (3)(6) | | | (0.79 | )% | | | 3.00 | % | | | (2.74 | )% | | | 66.70 | % | | | (4.50 | )% |
| Net assets, at end of period (000s) | | $ | 6,622 | | | $ | 3,786 | | | $ | 1,815 | | | $ | 1,300 | | | $ | 10 | (7) |
| Ratio of gross expenses to average net assets before expense reimbursement (4)(5) | | | 1.90 | % | | | 2.00 | % (10) | | | 2.11 | % (9) | | | 2.78 | % (8) | | | 24.39 | % |
| Ratio of net expenses to average net assets after expense reimbursement (5) | | | 1.65 | % | | | 1.65 | % (10) | | | 1.66 | % (9) | | | 1.66 | % (8) | | | 1.65 | % |
| Ratio of net investment loss to average net assets (5) | | | (0.62 | )% | | | (0.71 | )% (10) | | | (1.46 | )% (9) | | | (1.21 | )% (8) | | | (0.48 | )% |
| Portfolio Turnover Rate (6) | | | 134 | % | | | 142 | % | | | 167 | % | | | 141 | % | | | 215 | % |
| | | | | | | | | | | | | | | | | | | | | |
| (1) | The AlphaCentric LifeSci Healthcare Fund Class A commenced operations on November 29, 2019. |
| (2) | Per share amounts calculated using the average shares method. |
| (3) | Total return in the above table is historical in nature and represents the rate that the investor would have earned or lost on an investment in the Fund assuming reinvestment of dividends and capital gain distributions, if any, and does not reflect the impact of sales charges. Had the adviser not waived and reimbursed a portion of the Fund’s expenses, total returns would have been lower. |
| (4) | Represents the ratio of expenses to average net assets absent fee waivers and/or expense reimbursements by the adviser. |
| (5) | Annualized for periods less than one year. |
| (6) | Not annualized for periods less than one year. |
| (7) | Actual net assets, not truncated. |
| (8) | Includes 0.01% for the year ended March 31, 2021 attributable to extraordinary expenses which are not subject to waiver by the adviser. |
| (9) | Includes 0.01% for the year ended March 31, 2022 attributed to line of credit fees which are not subject to waiver by the adviser. |
| (10) | Includes 0.00% for the year ended March 31, 2023 attributed to line of credit fees which are not subject to waiver by the adviser. |
See accompanying notes to financial statements.
| AlphaCentric LifeSci Healthcare Fund |
| FINANCIAL HIGHLIGHTS |
Per Share Data and Ratios for a Share of Beneficial Interest Outstanding Throughout Each Period Presented
| | | Year Ended | | | Year Ended | | | Year Ended | | | Year Ended | | | Period Ended | |
| | | March 31, | | | March 31, | | | March 31, | | | March 31, | | | March 31, | |
| Class C (LYFCX) | | 2024 | | | 2023 | | | 2022 | | | 2021 | | | 2020 (1) | |
| Net asset value, beginning of period | | $ | 13.01 | | | $ | 13.31 | | | $ | 15.53 | | | $ | 9.55 | | | $ | 10.00 | |
| Activity from investment operations: | | | | | | | | | | | | | | | | | | | | |
| Net investment loss (2) | | | (0.16 | ) | | | (0.18 | ) | | | (0.32 | ) | | | (0.32 | ) | | | (0.06 | ) |
| Net realized and unrealized gain (loss) on investments | | | (0.04 | ) | | | 0.43 | | | | (0.32 | ) | | | 6.65 | | | | (0.39 | ) |
| Total from investment operations | | | (0.20 | ) | | | 0.25 | | | | (0.64 | ) | | | 6.33 | | | | (0.45 | ) |
| Less distributions from: | | | | | | | | | | | | | | | | | | | | |
| Net realized gains | | | (0.34 | ) | | | (0.55 | ) | | | (1.58 | ) | | | (0.35 | ) | | | — | |
| Total distributions | | | (0.34 | ) | | | (0.55 | ) | | | (1.58 | ) | | | (0.35 | ) | | | — | |
| Net asset value, end of period | | $ | 12.47 | | | $ | 13.01 | | | $ | 13.31 | | | $ | 15.53 | | | $ | 9.55 | |
| Total return (3)(6) | | | (1.50 | )% | | | 2.26 | % | | | (3.54 | )% | | | 66.38 | % | | | (4.50 | )% |
| Net assets, at end of period (000s) | | $ | 2,157 | | | $ | 709 | | | $ | 302 | | | $ | 215 | | | $ | 10 | (7) |
| Ratio of gross expenses to average net assets before expense reimbursement (4)(5) | | | 2.65 | % | | | 2.75 | % (10) | | | 2.86 | % (9) | | | 3.53 | % (8) | | | 25.14 | % |
| Ratio of net expenses to average net assets after expense reimbursement (5) | | | 2.40 | % | | | 2.40 | % (10) | | | 2.41 | % (9) | | | 2.41 | % (8) | | | 2.40 | % |
| Ratio of net investment loss to average net assets (5) | | | (1.30 | )% | | | (1.49 | )% (10) | | | (2.21 | )% (9) | | | (1.96 | )% (8) | | | (1.23 | )% |
| Portfolio Turnover Rate (6) | | | 134 | % | | | 142 | % | | | 167 | % | | | 141 | % | | | 215 | % |
| | | | | | | | | | | | | | | | | | | | | |
| (1) | The AlphaCentric LifeSci Healthcare Fund Class C commenced operations on November 29, 2019. |
| (2) | Per share amounts calculated using the average shares method. |
| (3) | Total return in the above table is historical in nature and represents the rate that the investor would have earned or lost on an investment in the Fund assuming reinvestment of dividends and capital gain distributions, if any, and does not reflect the impact of sales charges. Had the adviser not waived and reimbursed a portion of the Fund’s expenses, total returns would have been lower. |
| (4) | Represents the ratio of expenses to average net assets absent fee waivers and/or expense reimbursements by the adviser. |
| (5) | Annualized for periods less than one year. |
| (6) | Not annualized for periods less than one year. |
| (7) | Actual net assets, not truncated. |
| (8) | Includes 0.01% for the year ended March 31, 2021 attributable to extraordinary expenses which are not subject to waiver by the adviser. |
| (9) | Includes 0.01% for the year ended March 31, 2022 attributed to line of credit fees which are not subject to waiver by the adviser. |
| (10) | Includes 0.00% for the year ended March 31, 2023 attributed to line of credit fees which are not subject to waiver by the adviser. |
See accompanying notes to financial statements.
| AlphaCentric LifeSci Healthcare Fund |
| FINANCIAL HIGHLIGHTS |
Per Share Data and Ratios for a Share of Beneficial Interest Outstanding Throughout Each Period Presented
| | | Year Ended | | | Year Ended | | | Year Ended | | | Year Ended | | | Period Ended | |
| | | March 31, | | | March 31, | | | March 31, | | | March 31, | | | March 31, | |
| Class I (LYFIX) | | 2024 | | | 2023 | | | 2022 | | | 2021 | | | 2020 (1) | |
| Net asset value, beginning of period | | $ | 13.25 | | | $ | 13.42 | | | $ | 15.59 | | | $ | 9.55 | | | $ | 10.00 | |
| Activity from investment operations: | | | | | | | | | | | | | | | | | | | | |
| Net investment loss (2) | | | (0.06 | ) | | | (0.06 | ) | | | (0.18 | ) | | | (0.14 | ) | | | (0.01 | ) |
| Net realized and unrealized gain (loss) on investments | | | (0.02 | ) | | | 0.44 | | | | (0.31 | ) | | | 6.53 | | | | (0.44 | ) |
| Total from investment operations | | | (0.08 | ) | | | 0.38 | | | | (0.49 | ) | | | 6.39 | | | | (0.45 | ) |
| Less distributions from: | | | | | | | | | | | | | | | | | | | | |
| Net investment income | | | — | | | | — | | | | (0.10 | ) | | | (0.00 | ) (7) | | | — | |
| Net realized gains | | | (0.34 | ) | | | (0.55 | ) | | | (1.58 | ) | | | (0.35 | ) | | | — | |
| Total distributions | | | (0.34 | ) | | | (0.55 | ) | | | (1.68 | ) | | | (0.35 | ) | | | — | |
| Net asset value, end of period | | $ | 12.83 | | | $ | 13.25 | | | $ | 13.42 | | | $ | 15.59 | | | $ | 9.55 | |
| Total return (3)(6) | | | (0.56 | )% | | | 3.22 | % | | | (2.47 | )% | | | 67.02 | % | | | (4.50 | )% |
| Net assets, at end of period (000s) | | $ | 94,358 | | | $ | 75,021 | | | $ | 29,483 | | | $ | 26,404 | | | $ | 1,601 | |
| Ratio of gross expenses to average net assets before expense reimbursement (4)(5) | | | 1.65 | % | | | 1.75 | % (10) | | | 1.86 | % (9) | | | 2.53 | % (8) | | | 24.14 | % |
| Ratio of net expenses to average net assets after expense reimbursement (5) | | | 1.40 | % | | | 1.40 | % (10) | | | 1.41 | % (9) | | | 1.41 | % (8) | | | 1.40 | % |
| Ratio of net investment loss to average net assets (5) | | | (0.40 | )% | | | (0.47 | )% (10) | | | (1.21 | )% (9) | | | (0.96 | )% (8) | | | (0.23 | )% |
| Portfolio Turnover Rate (6) | | | 134 | % | | | 142 | % | | | 167 | % | | | 141 | % | | | 215 | % |
| | | | | | | | | | | | | | | | | | | | | |
| (1) | The AlphaCentric LifeSci Healthcare Fund Class I commenced operations on November 29, 2019. |
| (2) | Per share amounts calculated using the average shares method. |
| (3) | Total return in the above table is historical in nature and represents the rate that the investor would have earned or lost on an investment in the Fund assuming reinvestment of dividends and capital gain distributions, if any, and does not reflect the impact of sales charges. Had the adviser not waived and reimbursed a portion of the Fund’s expenses, total returns would have been lower. |
| (4) | Represents the ratio of expenses to average net assets absent fee waivers and/or expense reimbursements by the adviser. |
| (5) | Annualized for periods less than one year. |
| (6) | Not annualized for periods less than one year. |
| (8) | Includes 0.01% for the year ended March 31, 2021 attributable to extraordinary expenses which are not subject to waiver by the adviser. |
| (9) | Includes 0.01% for the year ended March 31, 2022 attributed to line of credit fees which are not subject to waiver by the adviser. |
| (10) | Includes 0.00% for the year ended March 31, 2023 attributed to line of credit fees which are not subject to waiver by the adviser. |
See accompanying notes to financial statements.
| AlphaCentric Strategic Income Fund |
| FINANCIAL HIGHLIGHTS |
Per Share Data and Ratios for a Share of Beneficial Interest Outstanding Throughout Each Period Presented
| | | Year Ended | | | Year Ended | | | Period Ended | |
| | | March 31, | | | March 31, | | | March 31, | |
| Class A (SIIAX) | | 2024 | | | 2023 | | | 2022 (1) | |
| Net asset value, beginning of period | | $ | 14.86 | | | $ | 17.67 | | | $ | 18.48 | |
| Activity from investment operations: | | | | | | | | | | | | |
| Net investment income (2) | | | 0.83 | | | | 0.70 | | | | 0.40 | |
| Net realized and unrealized gain (loss) on investments | | | 1.73 | | | | (2.54 | ) | | | (0.38 | ) (8) |
| Total from investment operations | | | 2.56 | | | | (1.84 | ) | | | 0.02 | |
| Less distributions from: | | | | | | | | | | | | |
| Net investment income | | | (1.04 | ) | | | (0.75 | ) | | | (0.55 | ) |
| Net realized gains | | | — | | | | — | | | | (0.18 | ) |
| Return of capital | | | — | | | | (0.22 | ) | | | (0.10 | ) |
| Total distributions | | | (1.04 | ) | | | (0.97 | ) | | | (0.83 | ) |
| Net asset value, end of period | | $ | 16.38 | | | $ | 14.86 | | | $ | 17.67 | |
| Total return (3)(7) | | | 17.77 | % | | | (10.58 | )% | | | 0.02 | % |
| Net assets, at end of period (000s) | | $ | 1,257 | | | $ | 467 | | | $ | 246 | |
| Ratio of gross expenses to average net assets before expense reimbursement (4)(5)(6) | | | 2.27 | % (10) | | | 2.37 | % | | | 2.37 | % (9) |
| Ratio of net expenses to average net assets after expense reimbursement (5)(6) | | | 1.74 | % (10) | | | 1.74 | % | | | 1.75 | % (9) |
| Ratio of net investment income to average net assets (5)(6) | | | 5.21 | % (10) | | | 4.42 | % | | | 2.64 | % (9) |
| Portfolio Turnover Rate (7) | | | 44 | % | | | 22 | % | | | 20 | % |
| | | | | | | | | | | | | |
| (1) | The AlphaCentric Strategic Income Fund Class A commenced operations on May 28, 2021. |
| (2) | Per share amounts calculated using the average shares method. |
| (3) | Total return in the above table is historical in nature and represents the rate that the investor would have earned or lost on an investment in the Fund assuming reinvestment of dividends and capital gain distributions, if any, and does not reflect the impact of sales charges. Had the adviser not waived and reimbursed a portion of the Fund’s expenses, total returns would have been lower. |
| (4) | Represents the ratio of expenses to average net assets absent fee waivers and/or expense reimbursements by the adviser. |
| (5) | Does not include the expenses of other investment companies in which the Fund invests. |
| (6) | Annualized for periods less than one year. |
| (7) | Not annualized for periods less than one year. |
| (8) | The amount of net realized and unrealized gain on investments per share does not accord with the amounts in the Statements of Operations due to the timing of shareholder subscriptions and redemptions relative to fluctuating net asset values during the year. |
| (9) | Includes 0.01% for the period ended March 31, 2022 attributed to line of credit fees which are not subject to waiver by the adviser. |
| (10) | Includes 0.00% for the year ended March 31, 2024 attributed to borrowing costs (line of credit fees) which are not subject to waiver by the adviser. |
See accompanying notes to financial statements.
| AlphaCentric Strategic Income Fund |
| FINANCIAL HIGHLIGHTS |
Per Share Data and Ratios for a Share of Beneficial Interest Outstanding Throughout Each Period Presented
| | | Year Ended | | | Year Ended | | | Period Ended | |
| | | March 31, | | | March 31, | | | March 31, | |
| Class C (SIICX) | | 2024 | | | 2023 | | | 2022 (1) | |
| Net asset value, beginning of period | | $ | 14.83 | | | $ | 17.64 | | | $ | 18.48 | |
| Activity from investment operations: | | | | | | | | | | | | |
| Net investment income (2) | | | 0.68 | | | | 0.51 | | | | 0.21 | |
| Net realized and unrealized gain (loss) on investments | | | 1.76 | | | | (2.47 | ) | | | (0.31 | ) (8) |
| Total from investment operations | | | 2.44 | | | | (1.96 | ) | | | (0.10 | ) |
| Less distributions from: | | | | | | | | | | | | |
| Net investment income | | | (0.93 | ) | | | (0.65 | ) | | | (0.47 | ) |
| Net realized gains | | | — | | | | — | | | | (0.18 | ) |
| Return of capital | | | — | | | | (0.20 | ) | | | (0.09 | ) |
| Total distributions | | | (0.93 | ) | | | (0.85 | ) | | | (0.74 | ) |
| Net asset value, end of period | | $ | 16.34 | | | $ | 14.83 | | | $ | 17.64 | |
| Total return (3)(7) | | | 16.88 | % | | | (11.24 | )% | | | (0.61 | )% |
| Net assets, at end of period (000s) | | $ | 1,850 | | | $ | 983 | | | $ | 563 | |
| Ratio of gross expenses to average net assets before expense reimbursement(4)(5)(6) | | | 3.02 | % (10) | | | 3.12 | % | | | 3.12 | % (9) |
| Ratio of net expenses to average net assets after expense reimbursement (5)(6) | | | 2.49 | % (10) | | | 2.49 | % | | | 2.50 | % (9) |
| Ratio of net investment income to average net assets (5)(6) | | | 4.35 | % (10) | | | 3.26 | % | | | 1.41 | % (9) |
| Portfolio Turnover Rate (7) | | | 44 | % | | | 22 | % | | | 20 | % |
| | | | | | | | | | | | | |
| (1) | The AlphaCentric Strategic Income Fund Class C commenced operations on May 28, 2021. |
| (2) | Per share amounts calculated using the average shares method. |
| (3) | Total return in the above table is historical in nature and represents the rate that the investor would have earned or lost on an investment in the Fund assuming reinvestment of dividends and capital gain distributions, if any, and does not reflect the impact of sales charges. Had the adviser not waived and reimbursed a portion of the Fund’s expenses, total returns would have been lower. |
| (4) | Represents the ratio of expenses to average net assets absent fee waivers and/or expense reimbursements by the adviser. |
| (5) | Does not include the expenses of other investment companies in which the Fund invests. |
| (6) | Annualized for periods less than one year. |
| (7) | Not annualized for periods less than one year. |
| (8) | The amount of net realized and unrealized gain on investments per share does not accord with the amounts in the Statements of Operations due to the timing of shareholder subscriptions and redemptions relative to fluctuating net asset values during the year. |
| (9) | Includes 0.01% for the period ended March 31, 2022 attributed to line of credit fees which are not subject to waiver by the adviser. |
| (10) | Includes 0.00% for the year ended March 31, 2024 attributed to borrowing costs (line of credit fees) which are not subject to waiver by the adviser. |
See accompanying notes to financial statements.
| AlphaCentric Strategic Income Fund |
| FINANCIAL HIGHLIGHTS |
Per Share Data and Ratios for a Share of Beneficial Interest Outstanding Throughout Each Period Presented
| | | Year Ended | | | Year Ended | | | Period Ended | |
| | | March 31, | | | March 31, | | | March 31, | |
| Class I (SIIIX) | | 2024 | | | 2023 | | | 2022 (1) | |
| Net asset value, beginning of period | | $ | 14.89 | | | $ | 17.69 | | | $ | 18.48 | |
| Activity from investment operations: | | | | | | | | | | | | |
| Net investment income (2) | | | 0.83 | | | | 0.62 | | | | 0.35 | |
| Net realized and unrealized gain (loss) on investments | | | 1.77 | | | | (2.42 | ) | | | (0.29 | ) (8) |
| Total from investment operations | | | 2.60 | | | | (1.80 | ) | | | 0.06 | |
| Less distributions from: | | | | | | | | | | | | |
| Net investment income | | | (1.08 | ) | | | (0.77 | ) | | | (0.56 | ) |
| Net realized gains | | | — | | | | — | | | | (0.18 | ) |
| Return of capital | | | — | | | | (0.23 | ) | | | (0.11 | ) |
| Total distributions | | | (1.08 | ) | | | (1.00 | ) | | | (0.85 | ) |
| Net asset value, end of period | | $ | 16.41 | | | $ | 14.89 | | | $ | 17.69 | |
| Total return (3)(7) | | | 18.00 | % | | | (10.29 | )% | | | 0.23 | % |
| Net assets, at end of period (000s) | | $ | 53,708 | | | $ | 46,511 | | | $ | 45,539 | |
| Ratio of gross expenses to average net assets before expense reimbursement (4)(5)(6) | | | 2.02 | % (10) | | | 2.12 | % | | | 2.12 | % (9) |
| Ratio of net expenses to average net assets after expense reimbursement (5)(6) | | | 1.49 | % (10) | | | 1.49 | % | | | 1.50 | % (9) |
| Ratio of net investment income to average net assets (5)(6) | | | 5.30 | % (10) | | | 3.91 | % | | | 2.25 | % (9) |
| Portfolio Turnover Rate (7) | | | 44 | % | | | 22 | % | | | 20 | % |
| | | | | | | | | | | | | |
| (1) | The AlphaCentric Strategic Income Fund Class I commenced operations on August 1, 2011 and financial highlights above does not include performance prior to May 28, 2021 when Class I shares were previously shares of a private fund. |
| (2) | Per share amounts calculated using the average shares method. |
| (3) | Total return in the above table is historical in nature and represents the rate that the investor would have earned or lost on an investment in the Fund assuming reinvestment of dividends and capital gain distributions, if any, and does not reflect the impact of sales charges. Had the adviser not waived and reimbursed a portion of the Fund’s expenses, total returns would have been lower. |
| (4) | Represents the ratio of expenses to average net assets absent fee waivers and/or expense reimbursements by the adviser. |
| (5) | Does not include the expenses of other investment companies in which the Fund invests. |
| (6) | Annualized for periods less than one year. |
| (7) | Not annualized for periods less than one year. |
| (8) | The amount of net realized and unrealized gain on investments per share does not accord with the amounts in the Statements of Operations due to the timing of shareholder subscriptions and redemptions relative to fluctuating net asset values during the year. |
| (9) | Includes 0.01% for the period ended March 31, 2022 attributed to line of credit fees which are not subject to waiver by the adviser. |
| (10) | Includes 0.00% for the year ended March 31, 2024 attributed to borrowing costs (line of credit fees) which are not subject to waiver by the adviser. |
See accompanying notes to financial statements.
| AlphaCentric Funds |
| NOTES TO CONSOLIDATED FINANCIAL STATEMENTS |
| March 31, 2024 |
| (1) | ORGANIZATION AND SIGNIFICANT ACCOUNTING POLICIES |
Mutual Fund Series Trust (the “Trust”), was organized as an Ohio business trust on February 27, 2006. The Trust is registered as an open-end investment management company under the Investment Company Act of 1940, as amended (“1940 Act”). The Trust currently consists of thirty-five series. These financial statements include the following series: AlphaCentric Income Opportunities Fund, AlphaCentric Premium Opportunity Fund, AlphaCentric Robotics and Automation Fund, AlphaCentric Symmetry Strategy Fund, AlphaCentric LifeSci Healthcare Fund and AlphaCentric Strategic Income Fund. Each series is individually referred to as a “Fund” or collectively as the “Funds” throughout these financial statements. The AlphaCentric Symmetry Strategy Fund is registered as a non-diversified series of the Trust. The AlphaCentric Income Opportunities Fund, AlphaCentric Premium Opportunity Fund, AlphaCentric Robotics and Automation Fund, AlphaCentric LifeSci Healthcare Fund and AlphaCentric Strategic Income Fund are diversified series of the Trust. The Funds’ investment adviser is AlphaCentric Advisors, LLC (the “Adviser” or “AlphaCentric”).
AlphaCentric Income Opportunities Fund (“AIOF”), commenced operations on May 28, 2015. AIOF’s investment objective is current income. The Fund’s sub-advisor is Garrison Point Capital, LLC.
AlphaCentric Premium Opportunity Fund (“APOF”) , commenced operations as a series of the Trust on September 30, 2016. The predecessor fund of APOF Class I commenced operations on August 31, 2011, as a private investment fund. APOF’s investment objective is long-term capital appreciation.
AlphaCentric Robotics and Automation Fund (“ARAF”), commenced operations on May 31, 2017. ARAF’s investment objective is long-term capital appreciation. Effective December 1, 2018, the Fund’s sub-advisor is Contego Capital Group, Inc.
AlphaCentric Symmetry Strategy Fund (“ASSF”), class A and C commenced operations on August 8, 2019, and Class I commenced operations on September 1, 2014. ASSF’s investment objective is capital appreciation. The Fund’s sub-advisor is Mount Lucas Management LP.
AlphaCentric LifeSci Healthcare Fund (“ALHF”), commenced operations on November 29, 2019. ALHF’s investment objective is long-term capital appreciation. The Fund’s sub-advisor is LifeSci Fund Management LLC.
AlphaCentric Strategic Income Fund (“ASIF”), commenced operations on May 28, 2021. ASIF’s investment objective is total return through current income and capital appreciation. The Fund’s sub-advisor is Goshen Rock Capital, LLC.
Each Fund offers three classes of shares, Class A, Class C and Class I. Each share class represents an interest in the same assets of the respective Fund, has the same rights and is identical in all material respects except that (i) each class of shares may bear different distribution fees; (ii) each class of shares may be subject to different (or no) sales charges; (iii) certain other class specific expenses borne solely by the class to which such expenses are attributable; and (iv) each class has exclusive voting rights with respect to matters relating to its own distribution arrangements.
The following is a summary of significant accounting policies consistently followed by the Funds and are in accordance with accounting principles generally accepted in the United States of America (“GAAP”). Each Fund is an investment company and accordingly follows the investment company accounting and reporting guidance of the Financial Accounting Standards Board (“FASB”) Accounting Standards Codification Topic 946 - Financial Services – Investment Companies including FASB Accounting Standards Update (“ASU”) 2013-08.
a) Securities Valuation – Securities listed on an exchange are valued at the last reported sale price at the close of the regular trading session of the exchange on the business day the value is being determined, or in the case of securities listed on NASDAQ, at the NASDAQ Official Closing Price (“NOCP”). In the absence of a sale, such securities shall be valued at the last bid price on the day of valuation. Debt securities (other than short-term obligations) are valued each day by an independent pricing service approved by the Board of Trustees (the “Board”) using methods which include current market quotations from a major market maker in the securities and based on methods which include the consideration of yields or prices of securities of comparable quality, coupon, maturity and type. The Funds may invest in portfolios of open-end or closed-end investment companies (the “underlying funds”). Open-end funds are valued at their respective net asset values as reported by such investment companies. The underlying funds value securities in their portfolios for which market quotations are readily available at their market values (generally the last reported sale price) and all other securities and assets at their fair value by the methods established by the boards of the underlying funds. The shares of many closed-end investment companies, after their initial public offering, frequently trade at a price per share, which is different than the net asset value per share. The difference represents a market premium or market discount of such shares. There can be no assurances that the market discount or market premium on shares of any closed-end investment company purchased by the Funds will not change. The independent pricing service does not distinguish between smaller-sized bond positions known as “odd lots” and larger institutional-sized bond positions known as “round lots”. A Fund may fair value a particular bond if the Adviser does not believe that the round lot value provided by the independent pricing service reflects fair value of the Fund’s holding. Short-term debt obligations having 60 days or less remaining until maturity, at time of purchase, may be valued at amortized cost, provided each such valuation represent fair value. Investments in total return swap contracts are priced daily based on the underlying equity securities held in the
| AlphaCentric Funds |
| NOTES TO CONSOLIDATED FINANCIAL STATEMENTS (Continued) |
| March 31, 2024 |
swap. Futures and future options are valued at the final settled price or, in the absence of a settled price, at the last sale price on the day of valuation. Options are valued at their closing price on the exchange they are traded on. When no closing price is available, options are valued at their mean price. Swap transactions are valued through an independent pricing service or at fair value based on daily price reporting from the swap counterparty issuing the swap.
Securities traded on a foreign exchange which has not closed by the valuation time or for which the official closing prices are not available at the time the net asset value (“NAV”) is determined will be valued using alternative market prices provided by a pricing service.
In certain circumstances, instead of valuing securities in the usual manner, the Funds may value securities at “fair value” as determined in good faith by the Board, pursuant to the procedures (the “Procedures”) approved by the Board. The Procedures consider, among others, the following factors to determine a security’s fair value: the nature and pricing history (if any) of the security; whether any dealer quotations for the security are available; and possible valuation methodologies that could be used to determine the fair value of the security. Fair value may also be used by the Board if extraordinary events occur after the close of the relevant world market but prior to the New York Stock Exchange close.
Exchange Traded Funds – The Funds may invest in exchange traded funds (“ETFs”). ETFs are a type of fund bought and sold on a securities exchange. An ETF trades like common stock and represents a fixed portfolio of securities. The risks of owning an ETF generally reflect the risks of owning the underlying securities they are designed to track, although the potential lack of liquidity on an ETF could result in it being more volatile. Additionally, ETFs have fees and expenses that reduce their value.
The Funds utilize various methods to measure the fair value of most of their investments on a recurring basis. GAAP establishes a hierarchy that prioritizes inputs to valuation methods. The three levels of input are:
Level 1 – Unadjusted quoted prices in active markets for identical assets and liabilities that the Funds have the ability to access.
Level 2 – Observable inputs other than quoted prices included in Level 1 that are observable for the asset or liability, either directly or indirectly. These inputs may include quoted prices for the identical instrument in an inactive market, prices for similar instruments, interest rates, prepayment speeds, credit risk, yield curves, default rates and similar data.
Level 3 – Unobservable inputs for the asset or liability, to the extent relevant observable inputs are not available, representing the Funds’ own assumptions about the assumptions a market participant would use in valuing the asset or liability, and would be based on the best information available.
The availability of observable inputs can vary from security to security and is affected by a wide variety of factors, including, for example, the type of security, whether the security is new and not yet established in the marketplace, the liquidity of markets, and other characteristics particular to the security. To the extent that valuation is based on models or inputs that are less observable or unobservable in the market, the determination of fair value requires more judgment. Accordingly, the degree of judgment exercised in determining fair value is greatest for instruments categorized in Level 3.
The inputs used to measure fair value may fall into different levels of the fair value hierarchy. In such cases, for disclosure purposes, the level in the fair value hierarchy within which the fair value measurement falls in its entirety, is determined based on the lowest level input that is significant to the fair value measurement in its entirety.
The inputs or methodology used for valuing securities are not necessarily an indication of the risk associated with investing in those securities.
| AlphaCentric Funds |
| NOTES TO CONSOLIDATED FINANCIAL STATEMENTS (Continued) |
| March 31, 2024 |
The following tables summarize the inputs used as of March 31, 2024 for the Funds’ assets and liabilities measured at fair value:
| AIOF | | | | | | | | | | | | |
| | | | | | | | | | | | | |
| Assets | | | | | | | | | | | | |
| | | | | | Level 2 | | | Level 3 | | | | |
| | | Level 1 | | | (Other Significant | | | (Unobservable | | | | |
| Security Classifications + | | (Quoted Prices) | | | Observable Inputs) | | | Inputs) | | | Totals | |
| Non-Agency Residential Mortgage Backed Securities | | $ | — | | | $ | 360,391,881 | | | $ | — | | | $ | 360,391,881 | |
| Short-Term Investment | | | 757 | | | | — | | | | — | | | | 757 | |
| Total | | $ | 757 | | | $ | 360,391,881 | | | $ | — | | | $ | 360,392,638 | |
| | | | | | | | | | | | | | | | | |
| APOF | | | | | | | | | | | | |
| | | | | | | | | | | | | |
| Assets | | | | | | | | | | | | |
| | | | | | Level 2 | | | Level 3 | | | | |
| | | Level 1 | | | (Other Significant | | | (Unobservable | | | | |
| Security Classifications + * | | (Quoted Prices) | | | Observable Inputs) | | | Inputs) | | | Totals | |
| U.S. Government & Agencies | | $ | — | | | $ | 24,536,795 | | | $ | — | | | $ | 24,536,795 | |
| Short-Term Investments | | | 17,860,560 | | | | — | | | | — | | | | 17,860,560 | |
| Call Options Purchased | | | 900,555 | | | | — | | | | — | | | | 900,555 | |
| Put Options Purchased | | | 6,675 | | | | — | | | | — | | | | 6,675 | |
| Unrealized Appreciation on Open Futures Contracts | | | 570,214 | | | | — | | | | — | | | | 570,214 | |
| Total | | $ | 19,338,004 | | | $ | 24,536,795 | | | $ | — | | | $ | 43,874,799 | |
| | | | | | | | | | | | | | | | | |
| Liabilities | | | | | | | | | | | | |
| | | | | | Level 2 | | | Level 3 | | | | |
| | | Level 1 | | | (Other Significant | | | (Unobservable | | | | |
| Security Classifications + * | | (Quoted Prices) | | | Observable Inputs) | | | Inputs) | | | Totals | |
| Call Options Written | | $ | 691,800 | | | $ | — | | | $ | — | | | $ | 691,800 | |
| Put Options Written | | | 22,580 | | | | — | | | | — | | | | 22,580 | |
| Total | | $ | 714,380 | | | $ | — | | | $ | — | | | $ | 714,380 | |
| | | | | | | | | | | | | | | | | |
| | | | | | | | | | | | | | | | | |
| ARAF | | | | | | | | | | | | |
| | | | | | | | | | | | | |
| Assets | | | | | | | | | | | | |
| | | | | | Level 2 | | | Level 3 | | | | |
| | | Level 1 | | | (Other Significant | | | (Unobservable | | | | |
| Security Classifications + | | (Quoted Prices) | | | Observable Inputs) | | | Inputs) | | | Totals | |
| Common Stocks | | $ | 26,270,559 | | | $ | — | | | $ | — | | | $ | 26,270,559 | |
| Investment Purchased as Securities Lending Collateral (b) | | | — | | | | — | | | | — | | | | 7,079,739 | |
| Money Market Fund | | | 610,128 | | | | — | | | | — | | | | 610,128 | |
| Total | | $ | 26,880,687 | | | $ | — | | | $ | — | | | $ | 33,960,426 | |
| | | | | | | | | | | | | | | | | |
| ASSF | | | | | | | | | | | | |
| | | | | | | | | | | | | |
| Assets | | | | | | | | | | | | |
| | | | | | Level 2 | | | Level 3 | | | | |
| | | Level 1 | | | (Other Significant | | | (Unobservable | | | | |
| Security Classifications (a) + * | | (Quoted Prices) | | | Observable Inputs) | | | Inputs) | | | Totals | |
| Common Stocks | | $ | 12,382,897 | | | $ | — | | | $ | — | | | $ | 12,382,897 | |
| Exchange-Traded Funds | | | 14,222,681 | | | | — | | | | — | | | | 14,222,681 | |
| U.S. Government & Agencies | | | — | | | | 7,960,120 | | | | — | | | | 7,960,120 | |
| Short-Term Investment | | | 5,338,437 | | | | — | | | | — | | | | 5,338,437 | |
| Unrealized Appreciation on Open Futures Contracts | | | 852,023 | | | | — | | | | — | | | | 852,023 | |
| Unrealized Appreciation on Swap Contracts | | | — | | | | 1,936 | | | | — | | | | 1,936 | |
| Total | | $ | 32,796,038 | | | $ | 7,962,056 | | | $ | — | | | $ | 40,758,094 | |
| AlphaCentric Funds |
| NOTES TO CONSOLIDATED FINANCIAL STATEMENTS (Continued) |
| March 31, 2024 |
| ASSF | | | | | | | | | | | | |
| | | | | | | | | | | | | |
| Liabilities | | | | | | | | | | | | |
| | | | | | Level 2 | | | Level 3 | | | | |
| | | Level 1 | | | (Other Significant | | | (Unobservable | | | | |
| Security Classifications + * | | (Quoted Prices) | | | Observable Inputs) | | | Inputs) | | | Totals | |
| Unrealized Depreciation on Open Futures Contracts | | $ | 259,082 | | | $ | — | | | $ | — | | | $ | 259,082 | |
| Unrealized Depreciation on Swap Contracts | | | — | | | | 1,607 | | | | — | | | | 1,607 | |
| Total | | $ | 259,082 | | | $ | 1,607 | | | $ | — | | | $ | 260,689 | |
| | | | | | | | | | | | | | | | | |
| ALHF | | | | | | | | | | | | |
| | | | | | | | | | | | | |
| Assets | | | | | | | | | | | | |
| | | | | | Level 2 | | | Level 3 | | | | |
| | | Level 1 | | | (Other Significant | | | (Unobservable | | | | |
| Security Classifications + | | (Quoted Prices) | | | Observable Inputs) | | | Inputs) | | | Totals | |
| Common Stocks | | $ | 96,784,874 | | | $ | — | | | $ | — | | | $ | 96,784,874 | |
| Short-Term Investments | | | 6,377,859 | | | | — | | | | — | | | | 6,377,859 | |
| Total | | $ | 103,162,733 | | | $ | — | | | $ | — | | | $ | 103,162,733 | |
| | | | | | | | | | | | | | | | | |
| ASIF | | | | | | | | | | | | |
| | | | | | | | | | | | | |
| Assets | | | | | | | | | | | | |
| | | | | | Level 2 | | | Level 3 | | | | |
| | | Level 1 | | | (Other Significant | | | (Unobservable | | | | |
| Security Classifications + | | (Quoted Prices) | | | Observable Inputs) | | | Inputs) | | | Totals | |
| Common Stocks | | $ | 23,515,910 | | | $ | — | | | $ | — | | | $ | 23,515,910 | |
| Exchange-Traded Fund | | | 462,100 | | | | — | | | | — | | | | 462,100 | |
| Preferred Stocks | | | 8,222,091 | | | | — | | | | — | | | | 8,222,091 | |
| Asset Backed Securities | | | — | | | | 7,063,527 | | | | — | | | | 7,063,527 | |
| Collateralized Mortgage Obligations | | | — | | | | 1,211,235 | | | | — | | | | 1,211,235 | |
| Convertible Bonds | | | — | | | | 6,936,409 | | | | — | | | | 6,936,409 | |
| Corporate Bonds | | | — | | | | 2,374,842 | | | | — | | | | 2,374,842 | |
| U.S. Government & Agencies | | | — | | | | 1,399,916 | | | | — | | | | 1,399,916 | |
| Short-Term Investment | | | 5,229,133 | | | | — | | | | — | | | | 5,229,133 | |
| Total | | $ | 37,429,234 | | | $ | 18,985,929 | | | $ | — | | | $ | 56,415,163 | |
| (a) | All ETFs held in the Fund are Level 1 securities. For a detailed break-out of ETFs by major index classification, please refer to the Schedules of Investments. |
| (b) | In accordance with Subtopic 820-10, certain investments that are measured at fair value using the net asset value per share (or its equivalent) have not been classified in the fair value hierarchy. The fair value amount presented in this table is intended to permit reconciliation of the fair value hierarchy to the amounts presented in the Statements of Assets and Liabilities. |
| + | See Schedules of Investments for industry classification. |
| * | Derivative instruments include cumulative net unrealized appreciation (depreciation) on futures contracts open as of March 31, 2024. |
Forward Foreign Currency Contracts – As foreign securities are purchased, a Fund generally enters into forward foreign currency exchange contracts in order to hedge against foreign currency exchange rate risks. The market value of the contract fluctuates with changes in currency exchange rates. The contract is marked-to-market daily and the change in market value is recorded by the Fund as an unrealized gain or loss. As foreign currency contracts are sold, a portion of the contract is generally closed and the Fund records a realized gain or loss equal to the difference between the value of the contract at the time it was opened and the value at the time it was closed. Realized gains and losses from contract transactions are included as a component of net realized gains (losses) from foreign currency contracts in the Statements of Operations.
Foreign Currency – Investment securities and other assets and liabilities denominated in foreign currencies are translated into U.S. dollar amounts at the date of valuation. Purchases and sales of investment securities and income and expense items denominated in foreign currencies are translated into U.S. dollar amounts on the respective dates of such transactions. Each Fund does not isolate that portion of the results of operations resulting from changes in foreign exchange rates on investments from the fluctuations arising from changes in market prices of securities held. Such fluctuations are included with the net realized and unrealized gain or loss from investments. Reported net realized foreign exchange gains or losses arise from sales of foreign currencies, currency gains or losses realized between the trade and settlement dates on securities transactions, and the difference between the amounts of dividends, interest, and foreign withholding taxes recorded on the Funds’
| AlphaCentric Funds |
| NOTES TO CONSOLIDATED FINANCIAL STATEMENTS (Continued) |
| March 31, 2024 |
books and the U.S. dollar equivalent of the amounts actually received or paid. Net unrealized foreign exchange gains and losses arise from changes in the fair values of assets and liabilities, other than investments in securities at fiscal period-end, resulting from changes in exchange rates.
Futures Contracts – Each Fund may purchase and sell futures contracts. A Fund may use futures contracts to gain exposure to, or hedge against changes in the value of equities, interest rates or foreign currencies. Upon entering into a contract, a Fund deposits and maintains as collateral such initial margin as required by the exchange on which the transaction is affected. Pursuant to the contract, the Fund agrees to receive from or pay to the broker an amount of cash equal to the daily fluctuation in value of the contract. Such receipts or payments are known as “variation margin” and are recorded by the Fund as unrealized gains and losses. When the contract is closed, the Fund records a realized gain or loss equal to the difference between the value of the contract at the time it was opened and the value at the time it was closed. For the year ended March 31, 2024, APOF and ASSF invested in futures contracts.
Swap Agreements – The Funds that invest in swaps are subject to equity price risk, interest rate risk, credit risk, currency risk, counterparty risk and/or commodity risk in the normal course of pursuing their investment objective. The Funds may enter into various swap transactions for investment purposes or to manage interest rate, equity, foreign exchange (currency), or credit risk. These would be two-party contracts entered into primarily to exchange the returns (or differentials in rates of returns) earned or realized on particular pre-determined investments or instruments.
The gross returns to be exchanged or “swapped” between parties are calculated with respect to a notional amount, i.e., the return on or increase in value of a particular dollar amount invested at a particular interest rate, in a particular foreign currency, or in a “basket” of securities representing a particular index or market segment. Changes in the value of swap agreements are recognized as unrealized gains or losses in the Statements of Operations by “marking to market” on a daily basis to reflect the value of the swap agreement at the end of each trading day. Payments received or paid at the beginning of the agreement are reflected as such on the Statements of Assets and Liabilities and may be referred to as upfront payments. The Funds amortize upfront payments and/or accrue for the fixed payment stream on swap agreements on a daily basis with the net amount recorded as a component of unrealized gain or loss on the Statements of Operations. Periodic payments and receipts and liquidation payments received or made at the termination of the swap agreement are recorded as realized gains or losses on the Statements of Operations. Entering into these agreements involves, to varying degrees, lack of liquidity and elements of credit, market, and counterparty risk in excess of amounts recognized on the Statements of Assets and Liabilities. A Fund’s maximum risk of loss from counterparty credit risk is the discounted net value of the cash flows to be received from the counterparty over the contract’s remaining life, to the extent that that amount is positive. For the year ended March 31, 2024 only ASSF invested in swap contracts.
Accounting for Options – The Funds are subject to equity price risks in the normal course of pursuing their investment objective and may purchase or sell options to help hedge against risk. When the Funds write a call or put option, an amount equal to the premium received is included in the Statements of Assets and Liabilities as a liability. The amount of the liability is subsequently marked- to-market to reflect the current market value of the option. If an option expires on its stipulated expiration date or if the Funds enter into a closing purchase transaction, a gain or loss is realized. If a written put option is exercised, the purchase cost of the underlying security is reduced by the premium originally received. If a written call option is exercised, a gain or loss is realized for the sale of the underlying security and the proceeds from the sale are increased by the premium originally received. As writer of an option, the Funds have no control over whether the option will be exercised and, as a result, retain the market risk of an unfavorable change in the price of the security underlying the written option.
Certain Funds may purchase put and call options. Put options are purchased to hedge against a decline in the value of securities held in a Fund’s portfolio. If such a decline occurs, the put options will permit the Funds to sell the securities underlying such options at the exercise price, or to close out the options at a profit. The premium paid for a put or call option plus any transaction costs will reduce the benefit, if any, realized by the Funds upon exercise of the option, and, unless the price of the underlying security rises or declines sufficiently, the option may expire worthless to the Funds. In addition, in the event that the price of the security in connection with which an option was purchased moves in a direction favorable to the Funds, the benefits realized by the Funds as a result of such favorable movement will be reduced by the amount of the premium paid for the option and related transaction costs. Written and purchased options are non-income producing securities. With purchased options, there is minimal counterparty risk to the Funds since these options are exchange traded and the exchange’s clearinghouse, as counterparty to all exchange traded options, guarantees against a possible default. Initial margin deposits required upon entering into options contracts are satisfied by the deposits of cash as collateral for the account of the broker (the Funds’ agent in acquiring the options). For the year ended March 31, 2024, APOF invested in options.
| AlphaCentric Funds |
| NOTES TO CONSOLIDATED FINANCIAL STATEMENTS (Continued) |
| March 31, 2024 |
The derivatives are not accounted for as hedging instruments under GAAP. The effect of derivative instruments on the Statements of Assets and Liabilities at March 31, 2024 was as follows:
| | | | | | | Location of derivatives on Statement of | | Fair value of asset/liability | |
| Fund | | Derivative | | Risk Type | | Assets and Liabilities | | derivatives | |
| APOF | | | | | | | | | | |
| | | Future Contracts | | Equity | | Unrealized appreciation on open futures contracts | | $ | 570,214 | |
| | | | | | | Total | | $ | 570,214 | |
| | | | | | | | | | | |
| | | Options Purchased | | Equity | | Investments, At Value | | | 907,230 | |
| | | | | | | Total | | $ | 907,230 | |
| | | | | | | | | | | |
| | | Options Written | | Equity | | Options Written | | | 714,380 | |
| | | | | | | Total | | $ | 714,380 | |
| | | | | | | | | | | |
| | | | | | | Location of derivatives on Statement of
Assets and Liabilities | | Fair value of asset/liability | |
| Fund | | Derivative | | Risk Type | | (Consolidated) | | derivatives | |
| ASSF | | | | | | | | | | |
| | | Credit Default Swap Contracts | | Equity | | Unrealized appreciation on swap contracts | | $ | 1,936 | |
| | | Credit Default Swap Contracts | | Equity | | Unrealized depreciation on swap contracts | | $ | (1,607 | ) |
| | | | | | | Total | | $ | 329 | |
| | | | | | | | | | | |
| | | Future Contracts | | Commodity | | Unrealized appreciation on open futures contracts | | $ | 438,819 | |
| | | | | Currency | | Unrealized appreciation on open futures contracts | | | 262,360 | |
| | | | | Equity | | Unrealized appreciation on open futures contracts | | | 32,813 | |
| | | | | Interest | | Unrealized appreciation on open futures contracts | | | 118,031 | |
| | | Future Contracts | | Commodity | | Unrealized depreciation on open futures contracts | | | (163,069 | ) |
| | | | | Currency | | Unrealized depreciation on open futures contracts | | | (44,656 | ) |
| | | | | Equity | | Unrealized depreciation on open futures contracts | | | (3,760 | ) |
| | | | | Interest | | Unrealized depreciation on open futures contracts | | | (47,597 | ) |
| | | | | | | Total | | $ | 592,941 | |
| | | | | | | | | | | |
| The effect of derivative instruments on the Statements of Operations for the year ended March 31, 2024 were as follows: |
| | | | | | | | | | | |
| | | | | | | | | Realized and unrealized | |
| Fund | | Derivative | | Risk Type | | Location of gain (loss) on derivatives | | gain (loss) on derivatives | |
| APOF | | | | | | | | | | |
| | | Future Contracts | | Equity | | Net realized gain (loss) from Futures Contracts | | $ | 10,686,409 | |
| | | Future Contracts | | Equity | | Net change in unrealized appreciation (depreciation) on Futures Contracts | | | (1,463,904 | ) |
| | | | | | | Total | | $ | 9,222,505 | |
| | | | | | | | | | | |
| | | Options Purchased | | Equity | | Net realized gain (loss) from Investments | | $ | 3,819,940 | |
| | | Options Purchased | | Equity | | Net change in unrealized appreciation (depreciation) on Investments | | | (121,829 | ) |
| | | | | | | Total | | $ | 3,698,111 | |
| | | | | | | | | | | |
| | | Options Written | | Equity | | Net realized gain (loss) from Options Written | | $ | (3,562,444 | ) |
| | | Options Written | | Equity | | Net change in unrealized appreciation (depreciation) on Options Written | | | 23,505 | |
| | | | | | | Total | | $ | (3,538,939 | ) |
| AlphaCentric Funds |
| NOTES TO CONSOLIDATED FINANCIAL STATEMENTS (Continued) |
| March 31, 2024 |
| | | | | | | Location of gain (loss) on | | Realized and unrealized | |
| Fund | | Derivative | | Risk Type | | derivatives (Consolidated) | | gain (loss) on derivatives | |
| ASSF | | | | | | | | | | |
| | | Credit Default Swap Contracts | | Equity | | Net realized gain (loss) from Swap Contracts | | $ | 64,132 | |
| | | Credit Default Swap Contracts | | Equity | | Net change in unrealized appreciation (depreciation) on Swap Contracts | | | (3,257 | ) |
| | | | | | | Total | | $ | 60,875 | |
| | | | | | | | | | | |
| | | Future Contracts | | Commodity | | Net realized gain (loss) from Futures Contracts | | $ | 1,279,295 | |
| | | | | Currency | | Net realized gain (loss) from Futures Contracts | | | (690,324 | ) |
| | | | | Equity | | Net realized gain (loss) from Futures Contracts | | | 114,492 | |
| | | | | Interest | | Net realized gain (loss) from Futures Contracts | | | (1,579,502 | ) |
| | | | | | | Total | | $ | (876,039 | ) |
| | | | | | | | | | | |
| | | Future Contracts | | Commodity | | Net change in unrealized appreciation (depreciation) on Futures Contracts | | $ | (439,448 | ) |
| | | | | Currency | | Net change in unrealized appreciation (depreciation) on Futures Contracts | | | 261,671 | |
| | | | | Equity | | Net change in unrealized appreciation (depreciation) on Futures Contracts | | | 8,543 | |
| | | | | Interest | | Net change in unrealized appreciation (depreciation) on Futures Contracts | | | 685,536 | |
| | | | | | | Total | | $ | 516,302 | |
| | | | | | | Total | | $ | (359,737 | ) |
During the year ended March 31, 2024, APOF was subject to a master netting arrangement for the futures. The following table shows additional information regarding the offsetting of assets and liabilities at March 31, 2024.
| | | | | | | | | | | | | | Gross Amounts of Assets and Liabilities Not Offset in | |
| | | | | | | | | | | | | | the Statement of Assets and Liabilities | |
| | | | | Gross Amounts | | | Gross Amounts | | | | | | | | | | | | | |
| | | | | Recognized in | | | Offset in the | | | Net Amounts | | | | | | | | | | |
| | | | | the Statements | | | Statements of | | | Presented in the | | | | | | | | | | |
| | | | | of Assets and | | | Assets and | | | Statements of Assets | | | Financial | | | Cash Collateral | | | | |
| Assets: | | Counterparty | | Liabilities | | | Liabilities | | | and Liabilities | | | Instruments | | | Pledged/Received (1) | | | Net Amount | |
| Futures Contracts | | StoneX Financial Inc. | | $ | 570,214 | | | $ | — | | | $ | 570,214 | | | $ | — | | | $ | — | | | $ | 570,214 | |
| Total | | | | $ | 570,214 | | | $ | — | | | $ | 570,214 | | | $ | — | | | $ | — | | | $ | 570,214 | |
| | | | | | | | | | | | | | | | | | | | | | | | | | | |
| (1) | Collateral pledged is limited to the net outstanding amount due to/from one individual counterparty. The actual collateral amounts pledged may exceed these amounts and fluctuate in value. |
During the year ended March 31, 2024, ASSF was subject to a master netting arrangement for the futures and swaps. The following table shows additional information regarding the offsetting of assets and liabilities at March 31, 2024.
| | | | | | | | | | | | | | Gross Amounts of Assets and Liabilities Not Offset in | |
| | | | | | | | | | | | | | the Consolidated Statement of Assets and Liabilities | |
| | | | | Gross Amounts | | | | | | | | | | | | | | | | |
| | | | | Recognized in | | | Gross Amounts | | | | | | | | | | | | | |
| | | | | the | | | Offset in the | | | Net Amounts | | | | | | | | | | |
| | | | | Consolidated | | | Consolidated | | | Presented in the | | | | | | | | | | |
| | | | | Statements of | | | Statements of | | | Consolidated | | | | | | | | | | |
| | | | | Assets and | | | Assets and | | | Statements of Assets | | | Financial | | | Cash Collateral | | | | |
| Assets: | | Counterparty | | Liabilities | | | Liabilities | | | and Liabilities | | | Instruments | | | Pledged/Received (1) | | | Net Amount | |
| Futures Contracts | | Societe Generale | | $ | 852,023 | | | $ | — | | | $ | 852,023 | | | $ | (259,082 | ) | | $ | — | | | $ | 592,941 | |
| Swap Contracts | | Societe Generale | | | 1,936 | | | | — | | | | 1,936 | | | | (1,607 | ) | | | — | | | | 329 | |
| Total | | | | $ | 853,959 | | | $ | — | | | $ | 853,959 | | | $ | (260,689 | ) | | $ | — | | | $ | 593,270 | (2) |
| | | | | | | | | | | | | | | | | | | | | | | | | | | |
| Liabilities: | | | | | | | | | | | | | | | | | | | | | | | | | | |
| Futures Contracts | | Societe Generale | | $ | 259,082 | | | $ | — | | | $ | 259,082 | | | $ | (259,082 | ) | | $ | — | | | $ | — | |
| Swap Contracts | | Societe Generale | | | 1,607 | | | | — | | | | 1,607 | | | | (1,607 | ) | | | — | | | | — | |
| Total | | | | $ | 260,689 | | | $ | — | | | $ | 260,689 | | | $ | (260,689 | ) | | $ | — | | | $ | — | (2) |
| (1) | Collateral pledged is limited to the net outstanding amount due to/from one individual counterparty. The actual collateral amounts pledged may exceed these amounts and fluctuate in value. |
| (2) | Total reflects net amount offset with Societe Generale. |
| AlphaCentric Funds |
| NOTES TO CONSOLIDATED FINANCIAL STATEMENTS (Continued) |
| March 31, 2024 |
The value of derivative instruments outstanding as of March 31, 2024 as disclosed in the Schedules of Investments and the amounts realized and changes in unrealized gains and losses on derivative instruments during the year ended March 31, 2024, as disclosed above and within the Statements of Operations serve as indicators of the volume of derivative activity for the APOF and ASSF.
b) Federal Income Tax – The Funds qualify as regulated investment companies and to comply with the applicable provisions of the Internal Revenue Code of 1986, as amended, and to distribute substantially all of their taxable income to their shareholders. Therefore, no federal income or excise tax provisions are required.
During the year ended March 31, 2024, the Funds did not have a liability for any unrecognized tax expense. The Funds recognize interest and penalties, if any, related to unrecognized tax expense as income tax expense in the Statements of Operations as incurred. As of March 31, 2024, the Funds did not incur any interest or penalties. The Trust’s officers have analyzed the Fund’s tax positions and has concluded that no liability for unrecognized tax benefits should be recorded related to uncertain tax positions taken on returns filed for open tax years ended March 31, 2021 to March 31, 2023, or expected to be taken in the Funds’ March 31, 2024 year-end tax returns.
c) Distribution to Shareholders – Distributions to shareholders, which are determined in accordance with income tax regulations and may differ from GAAP, are recorded on the ex-dividend date. Dividends from net investment income, if any, are declared and paid at least annually for APOF, ARAF, ASSF and ALHF. AIOF and ASIF make monthly dividend distributions from net investment income. Distributable net realized gains, if any, are declared and distributed annually.
d) Multiple Class Allocations – Income, non-class specific expenses and realized/unrealized gains or losses are allocated to each class based on relative net assets. Expenses of the Trust that are directly identifiable to a specific Fund are charged to that Fund. Expenses, which are not readily identifiable to a specific Fund, are allocated in such a manner as deemed equitable, taking into consideration the nature and type of expense and the relative sizes of the Funds in the Trust. Distribution fees are charged to each respective share class in accordance with the distribution plan.
e) Other – Investment and shareholder transactions are recorded on the trade date. Interest income is recognized on an accrual basis. Discounts are accreted and premiums are amortized on securities purchased over the lives of the respective securities utilizing the effective interest method. Dividend income is recorded on the ex-dividend date. Realized gains or losses from sales of securities are determined by comparing the identified cost of the security lot sold with the net sales proceeds. Withholding taxes and capital gains on foreign dividends have been provided for in accordance with the Funds’ understanding of the applicable country’s tax rules and rates.
f) Use of Estimates – The preparation of financial statements in conformity with GAAP requires management to make estimates and assumptions that affect the reported amounts of assets and liabilities and disclosure of contingent assets and liabilities at the date of the financial statements and the reported amounts of increases and decreases in net assets resulting from operations during the reporting period. Actual results could differ from those estimates.
g) Commitments and Contingencies – In the normal course of business, the Trust may enter into contracts that contain a variety of representations and warranties and provide general indemnifications. The Funds’ maximum exposure under these arrangements is dependent on future claims that may be made against the Funds and, therefore, cannot be estimated; however, management considers the risk of loss from such claims to be remote.
h) Sales charges (loads) – A maximum sales charge of 5.75% is imposed on Class A shares of the APOF, ARAF, ASSF, and ALHF. A maximum sales charge of 4.75% is imposed on Class A shares of AIOF and ASIF. Investments in Class A shares in all Funds made at or above $1 million breakpoint are not subject to an initial sales charge and may be subject to a 1.00% contingent deferred sales charge (“CDSC”) on shares redeemed within 18 months of purchase (excluding shares purchased with reinvested dividends and/or distributions). The respective shareholders pay such CDSC charges, which are not an expense of the Fund. For year ended March 31, 2024, there were $0 CDSC fees paid.
i) Short Sales – The Funds may sell securities short. A short sale is a transaction in which the Funds sell securities they do not own in anticipation of a decline in the market price of the securities. To deliver the securities to the buyer, the Funds must arrange through a broker to borrow the securities and, in so doing, the Funds become obligated to replace the securities borrowed at their market price at the time of replacement, whatever that price may be. The Funds will make a profit or incur a loss as a result of a short sale depending on whether the price of the securities decrease or increase between the date of the short sale and the date on which the Funds purchased the securities to replace the borrowed securities that have been sold.
j) Cash and Cash Equivalents – The Funds consider their investment in a Federal Deposit Insurance Corporation (“FDIC”) insured interest bearing savings account to be cash. The Funds maintain cash balances, which, at times, may exceed federally insured limits. The Funds maintain these balances with a high quality financial institution.
| AlphaCentric Funds |
| NOTES TO CONSOLIDATED FINANCIAL STATEMENTS (Continued) |
| March 31, 2024 |
Consolidation of Subsidiaries – ACSSF Fund Limited (“ASSF-CFC”) – The Consolidated Financial Statements of ASSF include the accounts of ASSF-CFC, which is a wholly-owned and controlled foreign subsidiary. ASSF consolidates the results of subsidiaries in which ASSF holds a controlling economic interest. Controlling economic interest is generally deemed to exist with investment interests comprising greater than 50% of the net asset value of the subsidiary. However, ASSF may also consider qualitative aspects of control in determining if a controlling economic interest exists. These qualitative control considerations include the nature and organizational structure of the investment, as well as ASSF’s ability to control the circumstances leading to majority ownership. All inter-company accounts and transactions have been eliminated in consolidation.
ASSF may invest up to 25% of its total assets in ASSF-CFC, which acts as an investment vehicle in order to effect certain investments consistent with ASSF’s investment objectives and policies.
A summary of ASSF’s investments in ASSF-CFC is as follows:
| | | | | Inception | | | | | | | |
| | | | | Date of | | | ASSF-CFC’s Net Assets at | | | % of Net Assets at | |
| | | | | ASSF-CFC | | | March 31, 2024 | | | March 31, 2024 | |
| | ASSF-CFC | | | 8/8/2019 | | | $3,809,058 | | | 9.36% | |
ASSF-CFC utilizes commodity-based derivative products to facilitate ASSF’s pursuit of its investment objectives. In accordance with its investment objectives and through their exposure to the aforementioned commodity-based derivative products, ASSF may have increased or decreased exposure to one or more of the following risk factors defined below:
Taxation Risk – By investing in commodities indirectly through ASSF-CFC, ASSF obtains exposure to the commodities markets within the federal tax requirements that apply to ASSF.
For tax purposes, ASSF-CFC is an exempted Cayman investment company. ASSF-CFC has received an undertaking from the Government of the Cayman Islands exempting it from all local income, profits and capital gains taxes. No such taxes are levied in the Cayman Islands at the present time. For U.S. income tax purposes, ASSF-CFC is a controlled foreign corporation which generates and is allocated no income which is considered effectively connected with U.S. trade or business and as such is not subject to U.S. income tax. However, as a wholly-owned controlled foreign corporation, ASSF-CFC’s net income and capital gain, to the extent of its earnings and profits, will be included each year in the ASSF’s investment company taxable income.
| (2) | INVESTMENT TRANSACTIONS |
For the year ended March 31, 2024, aggregate cost of purchases and proceeds from sales of investment securities (excluding short-term investments) for the Funds were as follows:
| Fund | | Purchases | | | Sales | |
| AIOF | | $ | 69,286,961 | | | $ | 340,489,569 | |
| APOF | | $ | — | | | $ | — | |
| ARAF | | $ | 15,184,221 | | | $ | 21,161,722 | |
| ASSF | | $ | 93,421,292 | | | $ | 103,192,360 | |
| ALHF | | $ | 143,466,748 | | | $ | 119,382,274 | |
| ASIF | | $ | 27,020,660 | | | $ | 20,852,899 | |
| (3) | INVESTMENT ADVISORY AGREEMENT AND OTHER RELATED PARTY TRANSACTIONS |
AlphaCentric acts as investment adviser to the Funds pursuant to the terms of the investment advisory agreement (the “Advisory Agreement”) with the Trust. Under the terms of the Advisory Agreement, the Adviser manages the investment operations of the Funds in accordance with the Funds’ investment policies and restrictions. The investment sub-advisers are responsible for the day-to-day management of their Fund’s portfolios. The Adviser provides the Funds with investment advice and supervision and furnishes an investment program for the Funds. For its investment advisory services, the Funds pay to the Adviser, as of the last day of each month, an annualized fee detailed in the table below. Such fees are computed daily based upon daily average net assets of the respective Fund. The Adviser pays expenses incurred by it in connection with acting as investment adviser to the Funds other than costs (including taxes and brokerage commissions, borrowing costs, costs of investing in underlying funds and extraordinary expenses, if any) of securities purchased for the Funds and certain other expenses paid by the Funds (as detailed in the Advisory Agreement).
| AlphaCentric Funds |
| NOTES TO CONSOLIDATED FINANCIAL STATEMENTS (Continued) |
| March 31, 2024 |
The Adviser and the Trust, with respect to the Funds, have entered into Expense Limitation Agreements (the “Limitation”), approved annually, under which the Adviser has contractually agreed to waive fees and/or reimburse expenses to the extent necessary to maintain total annual operating expenses (excluding brokerage costs; borrowing costs, such as (a) interest and (b) dividends on securities sold short; taxes; costs of investing in underlying funds; and extraordinary expenses) that do not exceed the expense limitation shown in the table below, which is based on each Fund’s average daily net assets.
| | | | | | | | Expense Limitation | | | | | | | | | | |
| | | | | | | | | | | | | | | | | | | | | | | Advisory Fees | |
| | | | | Advisory | | | | | | | | | | | | | | | | | | Waived/ Expenses | |
| | Fund | | | Agreement | | | Class A | | | Class C | | | Class I | | | Expires | | | Total Advisory fee | | | Reimbursed | |
| | AIOF | | | 1.30% | | | 1.74% | | | 2.49% | | | 1.49% | | | July 31, 2024 | | | $ | 5,912,023 | | | $ | 686,763 | |
| | APOF | | | 1.75% | | | 2.24% | | | 2.99% | | | 1.99% | | | July 31, 2024 | | | | 1,428,092 | | | | 153,036 | |
| | ARAF | | | 1.25% | | | 1.65% | | | 2.40% | | | 1.40% | | | July 31, 2024 | | | | 362,541 | | | | 199,793 | |
| | ASSF | | | 1.35% | | | 1.85% | | | 2.60% | | | 1.60% | | | July 31, 2024 | | | | 588,127 | | | | 138,723 | |
| | ALHF | | | 1.25% | | | 1.65% | | | 2.40% | | | 1.40% | | | July 31, 2024 | | | | 1,240,802 | | | | 245,808 | |
| | ASIF | | | 1.50% | | | 1.74% | | | 2.49% | | | 1.49% | | | July 31, 2024 | | | | 836,842 | | | | 296,073 | |
For the year ended March 31, 2024, the Adviser waived management fees and reimbursed expenses. The Adviser may recapture a portion of the waived and/or reimbursed amounts. The Adviser may seek reimbursement only for fees waived or expenses reimbursed by a Fund within the three years following the date the waiver and/or reimbursement was incurred if the Fund is able to make the repayment without exceeding the limitation in effect at that time of the waiver and the Limitation in effect at the time of recoupment, no later than the dates as stated below:
| Fund | | 2025 | | | 2026 | | | 2027 | |
| AIOF | | $ | 7,341,886 | | | $ | 3,130,818 | | | $ | 686,763 | |
| APOF | | $ | 30,209 | | | $ | 164,482 | | | $ | 153,036 | |
| ARAF | | $ | 170,674 | | | $ | 211,574 | | | $ | 199,793 | |
| ASSF | | $ | 132,579 | | | $ | 48,215 | | | $ | 138,723 | |
| ALHF | | $ | 148,768 | | | $ | 165,498 | | | $ | 245,808 | |
| ASIF | | $ | 132,356 | | | $ | 287,380 | | | $ | 296,073 | |
Pursuant to the Management Services Agreement between the Trust and Mfund Services LLC (“Mfund”), an affiliate of the Adviser, MFund provides the Funds with various management and legal administrative services (the “Management Services Agreement”). For these services, the Funds pay MFund an annual asset-based fee in accordance with the following schedule applied at the Fund family level (i.e., all the Funds in the Trust advised by the Advisor): 0.10% of net assets up to $50 million; 0.07% of net assets from $50 million to $100 million; 0.05% of net assets from $100 million to $250 million; 0.04% of net assets from $250 million to $500 million; 0.03% of net assets from $500 million to $1 billion; 0.02% of net assets from $1 billion to $5 billion; and 0.01% of assets from $5 billion and above. In addition, the Funds reimburse MFund for any reasonable out of pocket expenses incurred in the performance of its duties under the Management Services Agreement. The amounts due to MFund for the Management Services Agreement are listed in the Statements of Assets and Liabilities under “Payable to related parties” and the amounts accrued for the year are shown in the Statements of Operations under “Legal administration/management services fees.”
Pursuant to the Compliance Services Agreement, MFund provides chief compliance officer services to the Funds. For these services, the Funds pay MFund $1,200 per month for the first fund in the fund family and $400 for each additional fund; $400 for each adviser and sub-adviser; and .0025% of the assets of each Fund. In addition, the Funds reimburse MFund for any reasonable out-of-pocket expenses incurred in the performance of its duties under the Compliance Services Agreement. The amounts due to MFund for chief compliance officer services are listed in the Statements of Assets and Liabilities under “Payable to related parties” and the amounts accrued for the year are shown in the Statements of Operations under “Compliance officer fees.”
A trustee of the Trust is also the controlling member of MFund, the Adviser and Catalyst Capital Advisors, LLC (an investment adviser to other series of the Trust) and is not paid any fees directly by the Trust for serving in such capacities.
Trustees who are not “interested persons” as that term is defined in the 1940 Act (the “Independent Trustees”), are paid a quarterly retainer and receive compensation for each special board meeting and risk and compliance committee meeting. The fees paid to the Independent Trustees for their attendance at a meeting will be shared equally by the funds of the Trust in which the meeting relates. The Lead Independent Trustee of the Trust and the Chairmen of the Trust’s Audit Committee and Risk and Compliance Committee receive an additional quarterly retainer. The “interested persons” of the Trust receive no compensation from the Funds. The Trust reimburses each trustee and officer for his or her travel and other expenses related to attendance at such meetings.
| AlphaCentric Funds |
| NOTES TO CONSOLIDATED FINANCIAL STATEMENTS (Continued) |
| March 31, 2024 |
Ultimus Fund Solutions, LLC (“UFS”) provides financial administration, fund accounting, and transfer agency services to the Funds pursuant to agreements with the Trust, for which it receives from each Fund: (i) basis points in decreasing amounts as assets reach certain breakpoints; and (ii) any related out-of-pocket expenses.
Certain officers of the Trust are also employees of UFS and MFund, and are not paid any fees directly by the Trust for serving in such capacity.
The Trust has adopted a Master Distribution Plan pursuant to rule 12b-1 under the 1940 Act for each class of shares, that allows the Funds to pay distribution and shareholder servicing expenses of up to 0.50% per annum for the Class A shares and up to 1.00% for the Class C shares based on average daily net assets of each class. Class A shares are currently paying 0.25% per annum of 12b-1 fees and Class C shares are currently paying 1.00% per annum of 12b-1 fees. The fee may be used for a variety of purposes, including compensating dealers and other financial service organizations for eligible services provided by those parties to the Funds and their shareholders and to reimburse Northern Lights Distributors, LLC (“NLD”) and the Adviser for distribution related expenses. Brokers may receive a 1.00% commission from NLD for the sale of Class C shares.
For the year ended March 31, 2024, the Distributor received the following in underwriter commissions from the sale of Class A shares of the Funds:
| | | Underwriter | |
| Fund | | Commissions | |
| AIOF | | $ | 32,699 | |
| APOF | | $ | 5,991 | |
| ARAF | | $ | 7,353 | |
| ASSF | | $ | 441 | |
| ALHF | | $ | 182,670 | |
| ASIF | | $ | 21,932 | |
Effective January 25, 2023, the trust amended the Revolving Credit Agreement and entered into a new revolving, uncommitted $125,000,000 line of credit with U.S. Bank National Association (the “2023 Revolving Credit Agreement”) that applies to all of the Funds, that expired on January 24, 2024. Borrowings under the 2023 Revolving Credit Agreement bear an interest at Prime Rate minus 1% per month. There are no fees charged on the unused portion of the line of credit. For the period January 25, 2023 through January 24, 2024, amounts outstanding to Funds under the credit facility at no time were permitted to exceed in the aggregate the lessor of (a) $125,000,000; (b) 15% gross market value of AIOF, APOF, ARAF, ASSF, ALHF and ASIF; or (c) 33.33% of a Fund’s daily market value.
Effective January 24, 2024, the trust amended the Revolving Credit Agreement and entered into a new revolving, uncommitted $100,000,000 line of credit with U.S. Bank National Association (the “2024 Revolving Credit Agreement”) that applies to all of the Funds, that is set to expire on January 22, 2025. Borrowings under the 2024 Revolving Credit Agreement bear an interest at Prime Rate minus 1% per month. There are no fees charged on the unused portion of the line of credit. For the period January 24, 2024 through March 31, 2024, amounts outstanding to Funds under the credit facility at no time were permitted to exceed in the aggregate the lessor of (a) $100,000,000; (b) 15% gross market value of AIOF, APOF, ARAF, ASSF, ALHF and ASIF; or (c) 33.33% of a Fund’s daily market value. APOF and ALHF did not borrow during the year ended March 31, 2024. For the year ended March 31, 2024, amounts outstanding to AIOF, ARAF, ASSF and ASIF were as follows:
| | | | | Periods the line of credit | | | Interest | | | Outstanding | | | Average | | | Average | | | Maximum | | | Maximum | |
| | Fund | | | was drawn on: | | | Expense | | | Borrowings | | | Borrowings | | | Borrowings Rate | | | Borrowings | | | Borrowings Rate | |
| | AIOF | | | 3/31/2023 - 3/31/2024 | | | $ | 763,859 | | | $ | 17,532,000 | | | $ | 14,326,668 | | | 7.37% | | | $ | 51,646,000 | | | 7.50% | |
| | ARAF | | | 9/8/2023 - 3/27/2024 | | | | 858 | | | | — | | | | 72,438 | | | 7.50% | | | | 264,000 | | | 7.50% | |
| | ASSF | | | 10/11/23 - 10/12/2023 | | | | 1,121 | | | | — | | | | 2,427,000 | | | 7.50% | | | | 2,427,000 | | | 7.50% | |
| | ASIF | | | 7/19/23-7/20/23 | | | | 736 | | | | — | | | | 600,000 | | | 7.25% | | | | 600,000 | | | 7.25% | |
| AlphaCentric Funds |
| NOTES TO CONSOLIDATED FINANCIAL STATEMENTS (Continued) |
| March 31, 2024 |
The beneficial ownership, either directly or indirectly, of more than 25% of the voting securities of a Fund creates presumption of the control of the Fund, under section 2(a)(9) of the 1940 Act. As of March 31, 2024, Charles Schwab owned 37.0% of AIOF. National Financial Services LLC and LPL Financial owned 27.6% and 25.0%, respectively of APOF. Charles Schwab and National Financial Services LLC owned 40.6% and 30.8%, respectively of ARAF. Hartz Capital Investments LLC owned 68.8% of ASSF. Charles Schwab owned 36.2% of ALHF. The Trust has no knowledge as to whether all or any portion of the shares owned of record by Hartz Capital Investments LLC, Charles Schwab & Co. Inc., and National Financial Services LLC are also owned beneficially.
| (6) | DISTRIBUTIONS TO SHAREHOLDERS AND TAX COMPONENTS TO CAPITAL |
The tax character of fund distributions paid for the period ended March 31, 2024 (for the tax period-ended November 30, 2023 for the AlphaCentric Income Opportunities Fund) and March 31, 2023 (for the tax period-ended November 30, 2022 for the AlphaCentric Income Opportunities Fund) was as follows:
| For the period ended March 31, 2024: |
| | | Ordinary | | | Long-Term | | | Return | | | Tax-Exempt | | | | |
| Portfolio | | Income | | | Capital Gains | | | of Capital | | | Income | | | Total | |
| AlphaCentric Income Opportunities Fund | | $ | 19,949,538 | | | $ | — | | | $ | 18,596,048 | | | $ | — | | | $ | 38,545,586 | |
| AlphaCentric Premium Opportunity Fund | | | — | | | | — | | | | — | | | | — | | | | — | |
| AlphaCentric Robotics and Automation Fund | | | — | | | | — | | | | — | | | | — | | | | — | |
| AlphaCentric Symmetry Strategy Fund | | | 792,289 | | | | — | | | | — | | | | — | | | | 792,289 | |
| AlphaCentric LifeSci Healthcare Fund | | | 2,693,130 | | | | — | | | | — | | | | — | | | | 2,693,130 | |
| AlphaCentric Strategic Income Fund | | | 2,952,718 | | | | 850,799 | | | | — | | | | — | | | | 3,803,517 | |
| | | | | | | | | | | | | | | | | | | | | |
| For the period ended March 31, 2023: |
| | | Ordinary | | | Long-Term | | | Return | | | Tax-Exempt | | | | |
| Portfolio | | Income | | | Capital Gains | | | of Capital | | | Income | | | Total | |
| AlphaCentric Income Opportunities Fund | | $ | 47,153,857 | | | $ | — | | | $ | 40,594,714 | | | $ | — | | | $ | 87,748,571 | |
| AlphaCentric Premium Opportunity Fund | | | — | | | | — | | | | — | | | | — | | | | — | |
| AlphaCentric Robotics and Automation Fund | | | — | | | | 1,539,010 | | | | — | | | | — | | | | 1,539,010 | |
| AlphaCentric Symmetry Strategy Fund | | | 4,190,411 | | | | 561,388 | | | | — | | | | — | | | | 4,751,799 | |
| AlphaCentric LifeSci Healthcare Fund | | | 2,198,833 | | | | — | | | | — | | | | — | | | | 2,198,833 | |
| AlphaCentric Strategic Income Fund | | | 1,811,372 | | | | 363,940 | | | | 710,339 | | | | — | | | | 2,885,651 | |
As of each Fund’s tax year-ended of March 31, 2024 (for the tax period-ended November 30, 2023, for the AlphaCentric Income Opportunities Fund), the components of accumulated earnings/(deficit) on a tax basis were as follows:
| | | Undistributed | | | Undistributed | | | Undistributed | | | Post October Loss | | | Capital Loss | | | Other | | | Unrealized | | | Total | |
| | | Ordinary | | | Ordinary | | | Long-Term | | | and | | | Carry | | | Book/Tax | | | Appreciation/ | | | Accumulated | |
| Portfolio | | Tax-Exempt Income | | | Income | | | Capital Gains | | | Late Year Loss | | | Forwards | | | Differences | | | (Depreciation) | | | Earnings/(Deficits) | |
| AlphaCentric Income Opportunities Fund | | $ | — | | | $ | — | | | $ | — | | | $ | — | | | $ | (340,976,531 | ) | | $ | — | | | $ | 50,850,974 | | | $ | (290,125,557 | ) |
| AlphaCentric Premium Opportunity Fund | | | — | | | | 1,377,753 | | | | — | | | | — | | | | (3,024,578 | ) | | | — | | | | 120,512 | | | | (1,526,313 | ) |
| AlphaCentric Robotics and Automation Fund | | | — | | | | — | | | | — | | | | (1,559,877 | ) | | | (4,299,806 | ) | | | — | | | | 4,891,021 | | | | (968,662 | ) |
| AlphaCentric Symmetry Strategy Fund | | | — | | | | — | | | | — | | | | (222,586 | ) | | | (3,310,262 | ) | | | 275,750 | | | | 2,428,215 | | | | (828,883 | ) |
| AlphaCentric LifeSci Healthcare Fund | | | — | | | | — | | | | — | | | | (1,842,585 | ) | | | — | | | | — | | | | (7,604,889 | ) | | | (9,447,474 | ) |
| AlphaCentric Strategic Income Fund | | | — | | | | — | | | | — | | | | (8,012 | ) | | | — | | | | — | | | | (1,236,358 | ) | | | (1,244,370 | ) |
The difference between book basis and tax basis undistributed net investment income, accumulated net realized gains, and unrealized appreciation(depreciation) from investments is primarily attributable to the tax deferral of losses on wash sales, mark-to-market on open 1256 futures and options, swaps, and passive foreign investment companies, and adjustments for partnerships, and the ASSF Fund’s wholly owned subsidiary.
The unrealized appreciation in the table above includes unrealized foreign currency gains (losses) of $340, $(714) and $(336) for AlphaCentric Robotics and Automation Fund, AlphaCentric Symmetry Strategy Fund and AlphaCentric LifeSci Healthcare Fund, respectively.
| AlphaCentric Funds |
| NOTES TO CONSOLIDATED FINANCIAL STATEMENTS (Continued) |
| March 31, 2024 |
Late year losses incurred after December 31 within the fiscal year are deemed to arise on the first business day of the following fiscal year for tax purposes. The Funds incurred and elected to defer such late year losses as follows:
| | | Late Year | |
| Portfolio | | Losses | |
| AlphaCentric Income Opportunities Fund | | $ | — | |
| AlphaCentric Premium Opportunity Fund | | | — | |
| AlphaCentric Robotics and Automation Fund | | | 112 | |
| AlphaCentric Symmetry Strategy Fund | | | 222,586 | |
| AlphaCentric LifeSci Healthcare Fund | | | 63,689 | |
| AlphaCentric Strategic Income Fund | | | 8,012 | |
Capital losses incurred after October 31 within the fiscal year are deemed to arise on the first business day of the following fiscal year for tax purposes. The Funds incurred and elected to defer such capital losses as follows:
| | | Post October | |
| Portfolio | | Losses | |
| AlphaCentric Income Opportunities Fund | | $ | — | |
| AlphaCentric Premium Opportunity Fund | | | — | |
| AlphaCentric Robotics and Automation Fund | | | 1,559,765 | |
| AlphaCentric Symmetry Strategy Fund | | | — | |
| AlphaCentric LifeSci Healthcare Fund | | | 1,778,896 | |
| AlphaCentric Strategic Income Fund | | | — | |
At March 31, 2024, the Funds (for the tax period-ended November 30, 2023, for the AlphaCentric Income Opportunities Fund) had capital loss carry forwards for federal income tax purposes available to offset future capital gains and capital loss carry forwards utilized as follows:
| Portfolio | | Short-Term | | | Long-Term | | | Total | | | CLCF Utilized | |
| AlphaCentric Income Opportunities Fund | | $ | 340,976,531 | | | $ | — | | | $ | 340,976,531 | | | $ | 28,112,858 | |
| AlphaCentric Premium Opportunity Fund | | | 1,288,851 | | | | 1,735,727 | | | | 3,024,578 | | | | 9,236,458 | |
| AlphaCentric Robotics and Automation Fund | | | 3,404,941 | | | | 894,865 | | | | 4,299,806 | | | | — | |
| AlphaCentric Symmetry Strategy Fund | | | 702,356 | | | | 2,607,906 | | | | 3,310,262 | | | | — | |
| AlphaCentric LifeSci Healthcare Fund | | | — | | | | — | | | | — | | | | — | |
| AlphaCentric Strategic Income Fund | | | — | | | | — | | | | — | | | | — | |
Permanent book and tax differences, primarily attributable to the book/tax basis treatment of net operating losses, distributions in excess, and the ASSF Fund’s wholly owned subsidiary, resulted in reclassifications for the Funds for the year ended March 31, 2024 (except for the AlphaCentric Income Opportunities Fund in which its tax period-ended November 30, 2023 has been adjusted for March 31, 2024 activity) as follows:
| | | Paid | | | | |
| | | In | | | Accumulated | |
| Portfolio | | Capital | | | Earnings (Losses) | |
| AlphaCentric Income Opportunities Fund | | $ | (10,443,844 | ) | | $ | 10,443,844 | |
| AlphaCentric Premium Opportunity Fund | | | — | | | | — | |
| AlphaCentric Robotics and Automation Fund | | | (66,164 | ) | | | 66,164 | |
| AlphaCentric Symmetry Strategy Fund | | | 433,669 | | | | (433,669 | ) |
| AlphaCentric LifeSci Healthcare Fund | | | (121,518 | ) | | | 121,518 | |
| AlphaCentric Strategic Income Fund | | | — | | | | — | |
| AlphaCentric Funds |
| NOTES TO CONSOLIDATED FINANCIAL STATEMENTS (Continued) |
| March 31, 2024 |
| (7) | AGGREGATE UNREALIZED APPRECIATION AND DEPRECIATION – TAX BASIS |
The Funds for the year ended March 31, 2024 (except for the AlphaCentric Income Opportunities Fund in which its tax period-ended November 30, 2023 cost has been adjusted for March 31, 2024 activity)
| | | Cost for | | | | | | | | | Tax Net | |
| | | Federal Tax | | | Unrealized | | | Unrealized | | | Unrealized | |
| Portfolio | | purposes | | | Appreciation | | | Depreciation | | | App/Dep | |
| AlphaCentric Income Opportunities Fund | | $ | 291,782,574 | | | $ | 95,930,797 | | | $ | (27,320,733 | ) | | $ | 68,610,064 | |
| AlphaCentric Premium Opportunity Fund | | | 43,039,907 | | | | 145,218 | | | | (24,706 | ) | | | 120,512 | |
| AlphaCentric Robotics and Automation Fund | | | 29,069,745 | | | | 7,525,920 | | | | (2,635,239 | ) | | | 4,890,681 | |
| AlphaCentric Symmetry Strategy Fund | | | 38,169,473 | | | | 2,772,107 | | | | (343,178 | ) | | | 2,428,929 | |
| AlphaCentric LifeSci Healthcare Fund | | | 110,767,286 | | | | 8,523,987 | | | | (16,128,540 | ) | | | (7,604,553 | ) |
| AlphaCentric Strategic Income Fund | | | 57,651,521 | | | | 4,323,431 | | | | (5,559,789 | ) | | | (1,236,358 | ) |
The Funds in the normal course of business make investments in financial instruments and derivatives where the risk of potential loss exists due to changes in the market or failure or inability of the counterparty to a transaction to perform. See below for a detailed description of select principal risks.
Each underlying fund, including each ETF, is subject to specific risks, depending on the nature of the underlying fund. These risks could include liquidity risk, sector risk, foreign and related currency risk, as well as risks associated with real estate investments and commodities. Investors in the Funds will indirectly bear fees and expenses charged by the underlying investment companies in which the Funds invest in addition to the Funds’ direct fees and expenses.
Wholly-Owned Subsidiary Risk: ASSF-CFC is not registered under the 1940 Act and is not be subject to all of the investor protections of the 1940 Act. Changes in the laws of the United States and/or the Cayman Islands, under which ASSF and ASSF-CFC, respectively, are organized, could result in the inability of ASSF and/or ASSF-CFC to operate as described in the Prospectus and could negatively affect ASSF and their shareholders. Your cost of investing in ASSF will be higher because you indirectly bear the expenses of ASSF-CFC.
Credit Risk: There is a risk that issuers and counterparties will not make payments on securities and other investments held by a Fund, resulting in losses to the Fund. In addition, the credit quality of securities held by a Fund may be lowered if an issuer’s financial condition changes. Lower credit quality may lead to greater volatility in the price of a security and in shares of the Fund. Lower credit quality also may affect liquidity and make it difficult for a Fund to sell the security. The Funds may invest, directly or indirectly, in high yield fixed-income securities (also known as “junk bonds”), which are considered speculative with respect to the issuer’s capacity to pay interest and repay principal in accordance with the terms of the obligations. This means that, compared to issuers of higher rated securities, issuers of medium and lower rated securities are less likely to have the capacity to pay interest and repay principal when due in the event of adverse business, financial or economic conditions and/or may be in default or not current in the payment of interest or principal. The market values of medium- and lower-rated securities tend to be more sensitive to company-specific developments and changes in economic conditions than higher-rated securities. The companies that issue these securities often are highly leveraged, and their ability to service their debt obligations during an economic downturn or periods of rising interest rates may be impaired. In addition, these companies may not have access to more traditional methods of financing, and may be unable to repay debt at maturity by refinancing. The risk of loss due to default in payment of interest or principal by these issuers is significantly greater than with higher-rated securities because medium- and lower-rated securities generally are unsecured and subordinated to senior debt. Default, or the market’s perception that an issuer is likely to default, could reduce the value and liquidity of securities held by a Fund. In addition, default may cause a Fund to incur expenses in seeking recovery of principal or interest on its portfolio holdings.
Swap Counterparty Credit Risk: The Funds are subject to credit risk on the amount the Funds expect to receive from swap agreement counterparties. With certain exchange traded credit default swaps, there is minimal counterparty risk to a Fund in that the exchanges, clearinghouse, as counter party, guarantees against default.
Commodity Risk: Investing in the commodities markets may subject the Funds to greater volatility than investments in traditional securities. Commodity prices may be influenced by unfavorable weather, animal and plant disease, geologic and environmental factors as well as changes in government regulation such as tariffs, embargoes or burdensome production rules and restrictions.
| AlphaCentric Funds |
| NOTES TO CONSOLIDATED FINANCIAL STATEMENTS (Continued) |
| March 31, 2024 |
Foreign Currency Risk: Currency trading risks include market risk, credit risk and country risk. Market risk results from adverse changes in exchange rates in the currencies the Fund is long or short. Credit risk results because a currency-trade counterparty may default. Country risk arises because a government may interfere with transactions in its currency.
Foreign Exchanges Risk: A portion of the derivatives trades made by the Funds may take place on foreign markets. Neither existing CFTC regulations nor regulations of any other U.S. governmental agency apply to transactions on foreign markets. Some of these foreign markets, in contrast to U.S. exchanges, are so -called principals’ markets in which performance is the responsibility only of the individual counterparty with whom the trader has entered into a commodity interest transaction and not of the exchange or clearing corporation. In these kinds of markets, there is risk of bankruptcy or other failure or refusal to perform by the counterparty.
Fixed Income Risk: When the Funds invest in fixed income securities, the value of your investment in each will fluctuate with changes in interest rates. Typically, a rise in interest rates causes a decline in the value of fixed income securities owned by the Funds. In general, the market price of fixed income securities with longer maturities will increase or decrease more in response to changes in interest rates than shorter-term securities. Other risk factors include credit risk (the debtor may default) and prepayment risk (the debtor may pay its obligation early, reducing the amount of interest payments). If the U.S. Federal Reserve’s Federal Open Market Committee (“FOMC”) raises the federal funds interest rate target, interest rates across the U.S. financial system may rise. However, the magnitude of rate changes across maturities and borrower sectors is uncertain. Rising rates may decrease liquidity and increase volatility, which may make portfolio management more difficult and costly to each Fund and its shareholders. Additionally, default risk increases if issuers must borrow at higher rates. These risks could affect the value of a particular investment by each Fund, possibly causing the Fund’s share price and total return to be reduced and fluctuate more than other types of investments.
Futures and Forwards Contract Risk: For APOF and ASSF the successful use of futures contracts draws upon the Adviser’s skill and experience with respect to such instruments and are subject to special risk considerations. The primary risks associated with the use of futures contracts are (a) the imperfect correlation between the change in market value of the instruments held by the Fund and the price of the forward or futures contract; (b) possible lack of a liquid secondary market for a forward or futures contract and the resulting inability to close a forward or futures contract when desired; (c) losses caused by unanticipated market movements, which are potentially unlimited; (d) the Adviser’s inability to predict correctly the direction of securities prices, interest rates, currency exchange rates and other economic factors; (e) the possibility that the counterparty will default in the performance of its obligations; and (f) if the Fund has insufficient cash, it may have to sell securities from its portfolio to meet daily variation margin requirements, and the Fund may have to sell securities at a time when it may be disadvantageous to do so.
Derivatives Risk: APOF and ASSF may use derivatives (including options, futures, forwards, swaps and options on futures) to enhance returns or hedge against market declines. Each Fund’s use of derivative instruments involves risks different from, or possibly greater than, the risks associated with investing directly in securities and other traditional investments. These risks include (i) the risk that the counterparty to a derivative transaction may not fulfill its contractual obligations; (ii) risk of mispricing or improper valuation; and (iii) the risk that changes in the value of the derivative may not correlate perfectly with the underlying asset, rate or index. Derivative prices are highly volatile and may fluctuate substantially during a short period of time. Such prices are influenced by numerous factors that affect the markets, including, but not limited to: changing supply and demand relationships; government programs and policies; national and international political and economic events, changes in interest rates, inflation and deflation and changes in supply and demand relationships.
Options Risk: There are risks associated with the sale and purchase of call and put options. As the seller (writer) of a covered call option, APOF assumes the risk of a decline in the market price of the underlying security below the purchase price of the underlying security less the premium received, and gives up the opportunity for gain on the underlying security above the exercise option price. As the buyer of a put or call option, the Fund risks losing the entire premium invested in the option if the Fund does not exercise the option. As a seller (writer) of a put option, the Fund will lose money if the value of the security falls below the strike price. If unhedged, the Fund’s written calls exposes it to potentially unlimited losses.
Market Risk: Overall market risks may also affect the value of the Funds. The market values of securities or other investments owned by the Funds will go up or down, sometimes rapidly or unpredictably. Factors such as economic growth and market conditions, interest rate levels, exchange rates and political events affect the securities markets. Changes in market conditions and interest rates generally do not have the same impact on all types of securities and instruments. Unexpected local, regional or global events and their aftermath, such as war; acts of terrorism; financial, political or social disruptions; natural, environmental or man-made disasters; climate-change or climate-related events; the spread of infectious illnesses or other public health issues; recessions and depressions; or other tragedies, catastrophes and events could have a significant impact on the Funds and their investments and could result in increased premiums or discounts to a Fund’s net asset value, and may impair market liquidity, thereby increasing liquidity risk. Such events can cause investor fear and panic, which can adversely affect the economies of many companies, sectors, nations, regions and the market in general, in ways that cannot necessarily be foreseen. The Funds could lose money over short periods due to short-term market movements and over longer periods during more prolonged market downturns. During a general market downturn, multiple asset classes may be negatively affected. In times of severe market disruptions, you could lose your entire investment.
| AlphaCentric Funds |
| NOTES TO CONSOLIDATED FINANCIAL STATEMENTS (Continued) |
| March 31, 2024 |
Please refer to each Fund’s prospectus for a full listing of risks associated with the investments.
ARAF has entered into a Securities Lending Agreement with the US Bank NA (“US Bank”). ARAF can lend its securities to brokers, dealers and other financial institutions approved by the Board to earn additional income. The cash collateral is invested in short-term investments as noted in the ARAF’s Schedule of Investments. ARAF also continues to receive interest or dividends on the securities loaned. Loans are collateralized at a value at least equal to 105% of the then current market value of any loaned security that are foreign, or 102% of the then current market value of any other loaned security. All interest and dividend payments received on securities which are held on loan, provided that there is no material default, will be paid to ARAF. A portion of the income generated by the investment in ARAF’s collateral, net of any rebates paid by US Bank to the borrowers is remitted to US Bank as lending agent and the remainder is paid to ARAF.
Although risk is mitigated by the collateral, the ARAF could experience a delay in recovering their securities and possible loss of income or value if the borrower fails to return them. Should the borrower of the securities fail financially, ARAF has the right to repurchase the securities using the collateral in the open market.
ARAF receives cash as collateral in return for securities lent as part of the securities lending program. The collateral is invested in the Mount Vernon Liquid Assets Portfolio, LLC of which the investment objective is to seek to maximize current income to the extent with the preservation of capital and liquidity and maintain a stable NAV of $1.00 per unit. ARAF held $7,079,739 as of March 31, 2024. The remaining contractual maturity of all securities lending transactions is overnight and continuous. ARAF is not subject to a master netting agreement with respect to securities lending; therefore no additional disclosures are required. The income earned by ARAF on investments of cash collateral received from borrowers for the securities loaned to them are reflected in the ARAF’s Statement of Operations.
The following table is a summary of the Funds’ securities loaned and related collateral which are subject to a netting agreement as of March 31, 2024:
| | | | | | | | | | | | | | | Gross Amounts Not Offset in the | |
| | | | | | | | | | | | | | | Statement of Assets & Liabilities | |
| | | | | | | | | Net Amounts of | | | | | | | | | | |
| | | | | | Gross Amounts | | | Assets | | | | | | | | | | |
| | | | | | Offset in the | | | Presented in the | | | | | | | | | | |
| | | Gross Amounts | | | Statement of | | | Statement of | | | Financial | | | Non-Cash | | | | |
| | | of Recognized | | | Assets & | | | Assets & | | | Instruments | | | Collateral | | | Net Amount of | |
| Assets: | | Assets | | | Liabilities | | | Liabilities | | | Pledged | | | Received * | | | Assets | |
| ARAF | | | | | | | | | | | | | | | | | | | | | | | | |
| Description: | | | | | | | | | | | | | | | | | | | | | | | | |
| Securities Loaned | | $ | 6,659,624 | | | $ | — | | | $ | 6,659,624 | | | $ | — | | | | 6,659,624* | | | $ | — | |
| Total | | $ | 6,659,624 | | | $ | — | | | $ | 6,659,624 | | | $ | — | | | $ | 6,659,624 | | | $ | — | |
| * | The amount is limited to the asset balance and accordingly does not include excess collateral pledged. |
The fair value of the securities loaned for ARAF totaled $6,659,624, which included loaned securities with a value of $22,931 that have been sold and are pending settlement as of March 31, 2024. The total value of securities on loan excluding these pending sales was $6,636,693 as of March 31, 2024. The securities loaned are noted in the Schedule of Investments. The fair value of the “Collateral for Securities Loaned” on the Schedule of Investments includes cash collateral received and reinvested that totaled $7,079,739 for ARAF at March 31, 2024. This amount is offset by a liability recorded as “Payable upon return of securities loaned.” The contractual maturity of securities lending transactions is on an overnight and continuous basis. The Funds cannot pledge or resell the collateral.
On July 30, 2020, an investor in AIOF filed a putative class action in Florida state court, naming the adviser, the Trust, and others as defendants. Plaintiff alleges that AIOF misrepresented that it held no more than 15% of its assets in illiquid securities, among other things, and asserts violations of Sections I I, 12(a)(2) and 15 of the Securities Act of 1933. The Florida action was dismissed it prejudice on September 22, 2021.
On October 14, 2020, the same. Plaintiff filed a nearly identical putative class action in New York State Court against the same defendants. That complaint was amended on February 26, 2021, which added two additional defendants, including sub-advisor Garrison Point LLC. On February 16, 2023, the New York court dismissed all but one claim for failure to state a claim. The defendants believe the remaining claim is meritless and intend to contest it vigorously. An estimated $806,726 that is subject to insurance reimbursement in connection with this action is listed in the Statement of Assets and Liabilities for AIOF under “Due from insurance”.
| AlphaCentric Funds |
| NOTES TO CONSOLIDATED FINANCIAL STATEMENTS (Continued) |
| March 31, 2024 |
On January 24, 2023, the SEC adopted rule and form amendments to require mutual funds and ETFs to transmit concise and visually engaging streamlined annual and semiannual reports to shareholders that highlight key information. Other information, including financial statements, will not appear in a streamlined shareholder report but must be available online, delivered free of charge upon request, and filed on a semiannual basis on Form N-CSR. The rule and form amendments have a compliance date of July 24, 2024. At this time, management is evaluating the impact of these amendments on the shareholder reports for the Funds.
Subsequent events after the date of the Statements of Assets and Liabilities have been evaluated through the date the financial statements were issued. Management has determined that no events or transactions occurred requiring adjustment or disclosure in the financial statements.

REPORT OF INDEPENDENT REGISTERED PUBLIC ACCOUNTING FIRM
To the Shareholders of AlphaCentric Income Opportunities Fund, AlphaCentric Premium Opportunity Fund, AlphaCentric Robotics and Automation Fund, AlphaCentric Symmetry Strategy Fund, AlphaCentric LifeSci Healthcare Fund, and AlphaCentric Strategic Income Fund and
Board of Trustees of Mutual Fund Series Trust
Opinion on the Financial Statements
We have audited the accompanying statements of assets and liabilities, including the schedules of investments, of the funds listed below (the “Funds”), each a series of Mutual Fund Series Trust, as of March 31, 2024, the related statements of operations, the statements of changes in net assets, and the financial highlights for each of the periods indicated below (collectively referred to as the “financial statements”), and the related notes. In our opinion, the financial statements present fairly, in all material respects, the financial position of each of the Funds as of March 31, 2024, the results of their operations, the changes in net assets, and the financial highlights for each of the periods indicated below, in conformity with accounting principles generally accepted in the United States of America.
| Fund Name | Statements of
Operations | Statements of
Changes in Net
Assets | Financial Highlights |
| AlphaCentric Income Opportunities Fund, AlphaCentric Premium Opportunity Fund, and AlphaCentric Robotics and Automation Fund | For the year ended March 31, 2024 | For the years ended March 31, 2024 and 2023 | For the years ended March 31, 2024, 2023, 2022, 2021, and 2020 |
| AlphaCentric Symmetry Strategy Fund* | For the year ended March 31, 2024 | For the years ended March 31, 2024 and 2023 | For the years ended March 31, 2024, 2023, 2022, 2021, and for the period from August 8, 2019 (commencement of operations) through March 31, 2020 |
| AlphaCentric LifeSci Healthcare Fund | For the year ended March 31, 2024 | For the years ended March 31, 2024 and 2023 | For the years ended March 31, 2024, 2023, 2022, 2021, and for the period from November 29, 2019 (commencement of operations) through March 31, 2020 |
| AlphaCentric Strategic Income Fund | For the year ended March 31, 2024 | For the years ended March 31, 2024 and 2023 | For the years ended March 31, 2024, 2023, and for the period from May 28, 2021 (commencement of operations) through March 31, 2022 |
| * | The financial statements referred to above are Consolidated Financial Statements. |
Basis for Opinion
These financial statements are the responsibility of the Funds’ management. Our responsibility is to express an opinion on the Funds’ financial statements based on our audits. We are a public accounting firm registered with the Public Company Accounting Oversight Board (United States) (“PCAOB”) and are required to be independent with respect to the Funds in accordance with the U.S. federal securities laws and the applicable rules and regulations of the Securities and Exchange Commission and the PCAOB.
We conducted our audits in accordance with the standards of the PCAOB. Those standards require that we plan and perform the audits to obtain reasonable assurance about whether the financial statements are free of material misstatement whether due to error or fraud.
Our audits included performing procedures to assess the risks of material misstatement of the financial statements, whether due to error or fraud, and performing procedures that respond to those risks. Such procedures included examining, on a test basis, evidence regarding the amounts and disclosures in the financial statements. Our procedures included confirmation of securities owned as of March 31, 2024, by correspondence with the custodians and brokers; when replies were not received from brokers, we performed other auditing procedures. Our audits also included evaluating the accounting principles used and significant estimates made by management, as well as evaluating the overall presentation of the financial statements. We believe that our audits provide a reasonable basis for our opinion.
We have served as the Funds’ auditor since 2015.

COHEN & COMPANY, LTD.
Philadelphia, Pennsylvania
May 30, 2024
COHEN & COMPANY, LTD.
800.229.1099 | 866.818.4538 fax | cohencpa.com
Registered with the Public Company Accounting Oversight Board
| AlphaCentric Funds |
| EXPENSE EXAMPLES (Unaudited) |
| March 31, 2024 |
As a shareholder of one or more of the AlphaCentric Funds, you incur two types of costs: (1) transaction costs, including sales charges (loads) on purchases of Class A shares; (2) ongoing costs, including management fees; distribution and/or service (12b-1) fees; and other Fund expenses. This example is intended to help you understand your ongoing costs (in dollars) of investing in a Fund and to compare these costs with the ongoing costs of investing in other mutual funds.
The example is based on an investment of $1,000 invested at the beginning of the period and held for the entire period from October 1, 2023 through March 31, 2024.
Actual Expenses
The “Actual” columns in the table below provide information about actual account values and actual expenses. You may use the information below, together with the amount you invested, to estimate the expenses that you paid over the period. Simply divide your account value by $1,000 (for example, an $8,600 account value divided by $1,000 = 8.6), then multiply the result by the number in the table under the heading entitled “Expenses Paid During Period” to estimate the expenses you paid on your account during this period.
Hypothetical Example for Comparison Purposes
The “Hypothetical” columns in the table below provide information about hypothetical account values and hypothetical expenses based on the AlphaCentric Funds’ actual expense ratio and an assumed rate of return of 5% per year before expenses, which is not either Fund’s actual return. The hypothetical account values and expenses may not be used to estimate the actual ending account balances or expenses you paid for the period. You may use this information to compare this 5% hypothetical example with the 5% hypothetical examples that appear in the shareholder reports of other funds.
Please note that the expenses shown in the table are meant to highlight your ongoing costs only and do not reflect any transactional costs, such as sales charges (loads), or redemption fees. Therefore, the table is useful in comparing ongoing costs only, and will not help you determine the relative total costs of owning different funds. In addition, if these transactional costs were included, your costs would have been higher.
| | | | | | | | | | | Hypothetical | |
| | | | | | | Actual | | (5% return before expenses) | |
| | | Fund’s | | Beginning | | Ending | | Expenses | | Ending | | Expenses | |
| | | Annualized | | Account Value | | Account Value | | Paid During | | Account Value | | Paid During | |
| | | Expense Ratio | | 10/1/2023 | | 3/31/2024 | | Period * | | 3/31/2024 | | Period ** | |
| | | | | | | | | | | | | | |
| AlphaCentric Income Opportunities Fund – Class A | | 1.99% | | $1,000.00 | | $1,000.50 | | $9.95 | | $1,015.05 | | $10.02 | |
| AlphaCentric Income Opportunities Fund – Class C | | 2.74% | | $1,000.00 | | $995.40 | | $13.68 | | $1,011.29 | | $13.79 | |
| AlphaCentric Income Opportunities Fund – Class I | | 1.74% | | $1,000.00 | | $1,001.80 | | $8.72 | | $1,016.28 | | $8.79 | |
| | | | | | | | | | | | | | |
| AlphaCentric Premium Opportunity Fund – Class A | | 2.24% | | $1,000.00 | | $1,108.30 | | $11.81 | | $1,013.80 | | $11.28 | |
| AlphaCentric Premium Opportunity Fund – Class C | | 2.99% | | $1,000.00 | | $1,104.30 | | $15.74 | | $1,010.04 | | $15.03 | |
| AlphaCentric Premium Opportunity Fund – Class I | | 1.99% | | $1,000.00 | | $1,110.10 | | $10.50 | | $1,015.04 | | $10.03 | |
| | | | | | | | | | | | | | |
| AlphaCentric Robotics and Automation Fund – Class A | | 1.65% | | $1,000.00 | | $1,182.30 | | $9.02 | | $1,016.73 | | $8.34 | |
| AlphaCentric Robotics and Automation Fund – Class C | | 2.40% | | $1,000.00 | | $1,177.70 | | $13.08 | | $1,012.98 | | $12.09 | |
| AlphaCentric Robotics and Automation Fund – Class I | | 1.40% | | $1,000.00 | | $1,182.80 | | $7.66 | | $1,017.98 | | $7.08 | |
| | | | | | | | | | | | | | |
| AlphaCentric Symmetry Strategy Fund – Class A | | 1.85% | | $1,000.00 | | $1,038.60 | | $9.44 | | $1,015.74 | | $9.33 | |
| AlphaCentric Symmetry Strategy Fund – Class C | | 2.60% | | $1,000.00 | | $1,034.30 | | $13.24 | | $1,011.99 | | $13.09 | |
| AlphaCentric Symmetry Strategy Fund – Class I | | 1.60% | | $1,000.00 | | $1,039.60 | | $8.17 | | $1,016.99 | | $8.08 | |
| AlphaCentric Funds |
| EXPENSE EXAMPLES (Unaudited)(Continued) |
| March 31, 2024 |
| | | | | | | | | | | Hypothetical | |
| | | | | | | Actual | | (5% return before expenses) | |
| | | Fund’s | | Beginning | | Ending | | Expenses | | Ending | | Expenses | |
| | | Annualized | | Account Value | | Account Value | | Paid During | | Account Value | | Paid During | |
| | | Expense Ratio | | 10/1/2023 | | 3/31/2024 | | Period * | | 3/31/2024 | | Period ** | |
| | | | | | | | | | | | | | |
| AlphaCentric LifeSci Healthcare Fund – Class A | | 1.65% | | $1,000.00 | | $1,026.30 | | $8.36 | | $1,016.75 | | $8.32 | |
| AlphaCentric LifeSci Healthcare Fund – Class C | | 2.40% | | $1,000.00 | | $1,022.70 | | $12.15 | | $1,012.99 | | $12.09 | |
| AlphaCentric LifeSci Healthcare Fund – Class I | | 1.40% | | $1,000.00 | | $1,026.90 | | $7.10 | | $1,018.00 | | $7.07 | |
| | | | | | | | | | | | | | |
| AlphaCentric Strategic Income Fund – Class A | | 1.74% | | $1,000.00 | | $1,094.70 | | $9.12 | | $1,016.29 | | $8.78 | |
| AlphaCentric Strategic Income Fund – Class C | | 2.49% | | $1,000.00 | | $1,090.20 | | $13.02 | | $1,012.54 | | $12.54 | |
| AlphaCentric Strategic Income Fund – Class I | | 1.49% | | $1,000.00 | | $1,095.80 | | $7.81 | | $1,017.54 | | $7.52 | |
| * | Expenses are equal to the average account value over the period, multiplied by the Funds’ annualized expense ratio, multiplied by the number of days in the period (183) divided by the number of days in the fiscal year (366). |
| ** | Hypothetical” expense information is presented on the basis of the full one-half year period to enable comparison to other funds. It is based on assuming the same net expense ratio and average account value over the period, but is multiplied by 183/366 (to reflect the full half-year period). |
| AlphaCentric Funds |
| Additional Information (Unaudited) |
| March 31, 2024 |
Approval of the Renewal of the Management Agreement between the Mutual Fund Series Trust and AlphaCentric Advisors, LLC with respect to the AlphaCentric Income Opportunities Fund, AlphaCentric LifeSci Healthcare Fund, AlphaCentric SWBC Municipal Opportunities Fund, AlphaCentric Premium Opportunity Fund, AlphaCentric Robotics and Automation Fund, AlphaCentric Symmetry Strategy Fund and AlphaCentric Strategic Income Fund
At a meeting held on November 6 and 20, 2023, the Board of Trustees (the “Board”) of Mutual Fund Series Trust (the “Trust”), including a majority of the Trustees who are not “interested persons” as that term is defined in the Investment Company Act of 1940, as amended, (each an “Independent Trustee,” and collectively the “Independent Trustees”) discussed the renewal of the management agreement (the “Management Agreement”) between the Trust and AlphaCentric Advisors LLC (“AlphaCentric”) with respect to the AlphaCentric Income Opportunities Fund (“AlphaCentric IO”), AlphaCentric LifeSci Healthcare Fund, (“AlphaCentric LH”), AlphaCentric Premium Opportunity Fund, (“AlphaCentric PO”), AlphaCentric Robotics and Automation Fund, (“AlphaCentric RA”), AlphaCentric Symmetry Strategy Fund (“AlphaCentric SS”) and AlphaCentric Strategic Income Fund (“AlphaCentric SI”) (collectively, the “AlphaCentric Funds”)
The Board examined AlphaCentric’s responses to a series of questions regarding, among other things, its management services provided to the AlphaCentric Funds, comparative fee and expense information, and AlphaCentric’s profitability from managing the AlphaCentric Funds. The Board was assisted by legal counsel throughout the review process and relied upon the advice of legal counsel and its own business judgment in determining the material factors to be considered in evaluating the Management Agreement and the weight to be given to each factor considered. The conclusions reached by the Board were based on a comprehensive evaluation of all of the information provided and were not the result of any one factor. Moreover, each Trustee may have afforded different weight to the various factors in reaching his conclusions with respect to renewal of the Management Agreement.
Nature, Extent and Quality of Services The Board reviewed AlphaCentric’s corporate structure, officers, and compliance record. The Board considered that AlphaCentric provided continuous oversight of the sub-advisors for AlphaCentric IO, AlphaCentric LH, AlphaCentric RA, AlphaCentric SS, and AlphaCentric SI. The Board noted that AlphaCentric was responsible for managing AlphaCentric PO on a day-to-day basis, which included the selection of securities. The Board discussed the fundamental and technical analysis performed by AlphaCentric and discussed its ongoing research and quantitative modeling to monitor and improve AlphaCentric Fund strategies. The Board discussed the experience of AlphaCentric’s personnel and its satisfaction with its access to senior management. A representative of AlphaCentric discussed the risk management process and procedures which were aimed at mitigating risk while maintaining returns. The Board agreed that AlphaCentric was appropriately focused on risk management, which was beneficial to the AlphaCentric Funds and shareholders. The Board discussed AlphaCentric’s compliance program, and the Trust’s chief compliance officer confirmed that AlphaCentric had appropriate procedures in place that were reasonably designed to prevent violations of the federal securities laws. The Board concluded that AlphaCentric’s services to the AlphaCentric Funds were in line with the Board’s expectations.
Performance. The Board reviewed the performance of each AlphaCentric Fund relative to its peer group, Morningstar category and benchmark index.
AlphaCentric IO The Board observed that the AlphaCentric IO trailed its peer group average, Morningstar categories, and benchmark index for both the 1-year and 5-year periods. The Board also noted AlphaCentric IO underperformed the peer group average and Morningstar categories for the 3-year period. The Board discussed that since inception however, AlphaCentric IO outperformed the peer group average, Morningstar categories and the benchmark index. The Board discussed that AlphaCentric noted the tough bond environment in recent years and that AlphaCentric IO’s strategy was aimed at a long-term investment horizon. The Board recognized that AlphaCentric IO outperformed its benchmark index in up markets and underperformed in down markets.
AlphaCentric LH The Board discussed that AlphaCentric LH had performed well over the 1-year period and noted that it significantly outperformed the peer group average, Morningstar category and benchmark indexes, with exception of the S&P 500 TR. The Board noted that AlphaCentric LH outperformed the benchmark indexes, Morningstar category, and peer group average for the 3-year period and since inception. The Board noted that the AlphaCentric indicated AlphaCentric LH’s performance was driven by fundamental thesis-driven stock picking and benefited from gains in a few stocks over the year.
AlphaCentric PO The Board observed that AlphaCentric PO outperformed it peer group average for the 1-year, 5-year and 10-year periods. The Board observed that AlphaCentric PO underperformed its Morningstar category and benchmark index for the 1-year and 3-year periods but outperformed the Morningstar category and benchmark index for the 5-year and 10-year
| AlphaCentric Funds |
| Additional Information (Unaudited)(Continued) |
| March 31, 2024 |
periods. The Board mentioned that the AlphaCentric noted AlphaCentric PO was not designed to match the S&P 500 index in bull markets but allow for some gains while providing positive returns in down markets.
AlphaCentric RA The Board commented that AlphaCentric RA underperformed the peer group average, Morningstar category and benchmark indexes across all periods. The Board discussed AlphaCentric’s assertion that performance was hindered by underperformance in small and mid-cap stocks along with robotic stocks and that AlphaCentric RA did not have exposure to the big technology companies that have propelled the S&P 500 index. The Board noted that AlphaCentric RA’s sub-advisor believed that performance would improve once the Federal Reserve stopped increasing interest rates.
AlphaCentric SS The Board noted that AlphaCentric SS underperformed its peer group average, Morningstar category and benchmark indexes for the 1-year period but outperformed the peer group average, Morningstar category and benchmark indexes for the 3-year period. The Board observed that AlphaCentric SS underperformed the peer group average and Morningstar category for the 5-year period. The Board mentioned that since inception AlphaCentric SS had outperformed all of its benchmarks except for the MSCI world Bloomberg Aggregate Bond Blended Index.
AlphaCentric SI The Board commented that AlphaCentric SI significantly outperformed its peer group, Real Estate category and benchmark index for the 1-year, 3-year, 5-year and 10-year periods. The Board observed that AlphaCentric SI had also outperformed the nontraditional bond category.
After discussion, the Board concluded that the performance of each AlphaCentric Fund was acceptable.
Fees and Expenses. The Board discussed the advisory fee paid by each of the AlphaCentric Funds to the adviser and compared it to the fees charged to the peer group funds, and funds in each of the AlphaCentric Funds’ Morningstar category. The Board reviewed the allocation of fees between AlphaCentric and the various sub-advisers, based on the sub-advisory fees paid to the subadvisors for the applicable funds by the adviser, in comparison to the level of service provided by AlphaCentric and each sub-adviser. The Board noted that the agreement between AlphaCentric and each sub-adviser was the product of an arm’s length negotiation.
AlphaCentric IO The Board discussed that AlphaCentric had recently lowered the fees for AlphaCentric IO. The Board noted that the fee was still higher than the high in the peer group but that it was lower than the high in the Multisector Bond category and Nontraditional Bond category. The Board acknowledged that AlphaCentric explained the fee was higher because AlphaCentric IO’s strategy was more complex than the peer group funds, and AlphaCentric IO invested in mezzanine debt which required great degrees of analysis.
AlphaCentric LH The Board observed that AlphaCentric LH’s advisory fee was equal to the high in the peer group and Morningstar category. The Board recognized that the net expense ratio of 1.40% was far below the high for the peer group and Morningstar category of 2.50%. The Board recognized AlphaCentric’s explanation that the unique experiences and resources required to effectively operate AlphaCentric LH’s specialized strategy justified the higher advisory fees.
AlphaCentric PO The Board discussed that AlphaCentric PO’s advisory fee was tied for the high in both AlphaCentric LH’s peer group and Morningstar category. The Board noted that the AlphaCentric had explained the option trading Morningstar category was a “catchall” category and included just two other funds with relatively similar strategies to AlphaCentric PO. The Board recognized that AlphaCentric noted that AlphaCentric PO had the same advisory fee as the other two funds in the Morningstar category.
AlphaCentric RA The Board observed that AlphaCentric RA’s advisory fee was tied for the highest in both its peer group and Morningstar category at 1.25%. The Board noted that that net expense ratio of 1.40% was above the average but within the range for both the peer group and Morningstar category. The Board discussed the complex strategy involved with AlphaCentric RA and noted that AlphaCentric RA also had a sub-adviser.
AlphaCentric SS The Board acknowledged that AlphaCentric had lowered the advisory fee for AlphaCentric SS to 1.35%. The Board recognized that the advisory fee was still above the median and average for both the peer group and Morningstar category but that it was well below the high for each. The Board noted the net expense ratio was below the median for both its peer group and Morningstar category.
| AlphaCentric Funds |
| Additional Information (Unaudited)(Continued) |
| March 31, 2024 |
AlphaCentric SI The Board observed that the advisory fee for AlphaCentric SI was at the high end of the peer group and above the average advisory fee but that it was within the range. The Board discussed that the advisory fee was tied with the highest in the Real Estate category and was at the high end of the Nontraditional Bond category but was also within the range. The Board discussed that the net advisory fee after waivers was 0.86% which was below the average for the peer group, but still above the benchmarks. The Board noted that the adviser justified the fees because of the specialized nature of AlphaCentric SI’s strategy.
The Board concluded that the advisory fee paid by each of the AlphaCentric Funds to AlphaCentric was not unreasonable.
Profitability. The Board reviewed the financial information provided by AlphaCentric. The Board discussed AlphaCentric’s profitability from its services to each of the AlphaCentric Funds and noted that AlphaCentric operated AlphaCentric SS and AlphaCentric LH at a loss, while the other AlphaCentric Funds generated profits that the Board determined were not excessive.
Economies of Scale. The Board recognized that AlphaCentric had lowered the advisory fee for certain AlphaCentric Funds in the last year. The Board also acknowledged that there had been a drop in assets of a number of the AlphaCentric Funds and, therefore, the benefits of economies of scale had not improved for the adviser over the last year.
Conclusion. Having requested and received such information from AlphaCentric as the Board believed to be reasonably necessary to evaluate the terms of the Management Agreement, and as assisted by the advice of counsel, the Board concluded that renewal of the Management Agreement was in the best interests of each AlphaCentric Fund and its respective shareholders.
| AlphaCentric Funds |
| Additional Information (Unaudited)(Continued) |
| March 31, 2024 |
Approval of a Sub-Advisory Agreement between AlphaCentric Advisors, LLC and Garrison Point Capital Management, LLC with respect to AlphaCentric Income Opportunities Fund
At a meeting held on November 6 and 20, 2023, the Board of Trustees (the “Board”) of Mutual Fund Series Trust (the “Trust”), including a majority of the Trustees who are not “interested persons” as that term is defined in the Investment Company Act of 1940, as amended, (each an “Independent Trustee,” and collectively the “Independent Trustees”) discussed the renewal of the sub-advisory agreement (the “Sub-Advisory Agreement”) between AlphaCentric Advisors, LLC (“AlphaCentric”) and Garrison Point Capital Management, LLC (“Garrison Point”) with respect to the AlphaCentric Income Opportunities Fund (“AlphaCentric IO”).
The Board examined Garrison Point’s responses to a series of questions regarding, among other things, its sub-advisory services provided to AlphaCentric IO, comparative fee and expense information, and Garrison Point’s profitability from sub-advising AlphaCentric IO. The Board was assisted by legal counsel throughout the review process and relied upon the advice of legal counsel and its own business judgment in determining the material factors to be considered in evaluating the Sub-Advisory Agreement and the weight to be given to each factor considered. The conclusions reached by the Board were based on a comprehensive evaluation of all of the information provided and were not the result of any one factor. Moreover, each Trustee may have afforded different weight to the various factors in reaching his conclusions with respect to approval of the Sub-Advisory Agreement.
Nature, Extent and Quality of Services. The Board reviewed the credentials of Garrison Point’s key personnel involved in AlphaCentric IO. The Board noted that there were no changes in key personnel for Garrison Point. The Board reviewed the services provided by Garrison Point to AlphaCentric IO and noted that Garrison Point operated the investment strategy and determined assets that provided the best risk-adjusted value for AlphaCentric IO. The Board discussed that Garrison Point executed transactions on behalf of AlphaCentric IO and maintained records related to decisions and transactions to ensure compliance with applicable investment limits. The Board noted there was no ongoing SEC examinations but discussed the ongoing class action lawsuit. The Board acknowledged that the AlphaCentric had recommended continuing the Sub-Advisory Agreement with Garrison Point. The Board concluded that the nature, extent and quality of services provided by Garrison Point were satisfactory.
Performance. The Board observed that AlphaCentric IO underperformed its benchmark index for both the 1-year and 5-year periods. The Board recognized that for the 3-year and since inception periods AlphaCentric IO outperformed the benchmark index. The Board noted that Garrison Point discussed the difficult market for bonds in recent years and that AlphaCentric IO’s strategy was aimed at a long-term investment horizon. The Board recognized that AlphaCentric IO outperformed its benchmark index in up markets and underperformed in down markets and concluded that performance was acceptable.
Fees and Expenses. The Board observed that Garrison Point received 50% of the net advisory fees earned by the AlphaCentric, with a maximum annual fee of 0.65% of average net assets. The Board discussed the allocation of fees between AlphaCentric and Garrison Point in relation to their respective responsibilities and believed the allocation was appropriate. The Board concluded that the sub advisory fee received by Garrison Point for AlphaCentric IO was not unreasonable.
Profitability. The Board discussed that Garrison Point earned a profit from sub-advising AlphaCentric IO. The Board noted that Garrison Point’s profit analysis included the annual base salary and benefits paid to the portfolio managers and managing director for their services to AlphaCentric IO. The Board recognized that AlphaCentric IO’s strategy was complex, and a specific expertise was required to effectively execute the strategy. The Board concluded that Garrison Point’s profits were not excessive.
Economies of Scale. The Board considered whether AlphaCentric IO had reached the size where Garrison Point was benefit from economies of scale. They noted the substantial fall in AlphaCentric IO’s assets over the last years, and that the benefits of scale to the Sub-Adviser had fallen.
Conclusion. Having requested and received such information from Garrison Point as the Board believed to be reasonably necessary to evaluate the terms of the Sub-Advisory Agreement, and as assisted by the advice and guidance of counsel, the Board concluded that renewal of the Sub-Advisory Agreement was in the best interests of AlphaCentric IO and its shareholders.
| AlphaCentric Funds |
| Additional Information (Unaudited)(Continued) |
| March 31, 2024 |
Approval of the Renewal of the Sub-Advisory Agreement between AlphaCentric Advisors LLC and Contego Capital Group, Inc. with respect to AlphaCentric Robotics & Automation Fund
At a meeting held on November 6 and 20, 2023, the Board of Trustees (the “Board”) of Mutual Fund Series Trust (the “Trust”), including a majority of the Trustees who are not “interested persons” as that term is defined in the Investment Company Act of 1940, as amended, (each an “Independent Trustee”, and collectively the “Independent Trustees”) discussed the renewal of the sub-advisory agreement (the “Sub-Advisory Agreement”) between AlphaCentric Advisors LLC (“AlphaCentric”) and Contego Capital Group, Inc. (“Contego”) with respect to the AlphaCentric Robotics & Automation Fund (“AlphaCentric RA”).
The Board examined Contego’s responses to a series of questions regarding, among other things, its sub-advisory services provided to AlphaCentric RA, comparative fee and expense information, and Contego’s profitability from sub-advising AlphaCentric RA. The Board was assisted by legal counsel throughout the review process and relied upon the advice of legal counsel and its own business judgment in determining the material factors to be considered in evaluating the Sub-Advisory Agreement and the weight to be given to each factor considered. The conclusions reached by the Board were based on a comprehensive evaluation of all of the information provided and were not the result of any one factor. Moreover, each Trustee may have afforded different weight to the various factors in reaching his conclusions with respect to renewal of the Sub-Advisory Agreement.
Nature, Extent and Quality of Services. The Board reviewed the experience of the key personnel at the Contego and noted there were no changes in the prior year. The Board discussed Contego’s efforts in relation to AlphaCentric RA and recognized that Contego provided AlphaCentric RA investment decisions, managed the AlphaCentric RA’s investment policies and risk, and provided reports related to the AlphaCentric RA’s investments. The Board discussed that Contego provided the research and analysis for investment decisions and executed trades on behalf of AlphaCentric RA. The Board discussed that Contego operated the controls and compliance procedures for AlphaCentric RA to ensure AlphaCentric RA remained in compliance with investment restrictions and limitations. The Board also noted that the AlphaCentric had recommended that the sub-advisory agreement be continued. The Board concluded that the services provided by Contego were in line with its expectations and could be expected to continue providing quality service to AlphaCentric RA and its shareholders.
Performance. The Board observed that AlphaCentric RA underperformed the benchmark index across all time periods. The Board discussed that Contego explained the underperformance was due to the sell-off in small- and mid-cap growth stocks which made up most of the AlphaCentric RA’s portfolio. The Board noted that Contego believed the AlphaCentric RA’s investment thesis was valid, that AlphaCentric RA provided investors with exposure to a specific strategy, and that performance would improve when small- and mid-cap stocks improved. The Board concluded that the performance of AlphaCentric RA was acceptable.
Fees and Expenses. The Board discussed that Contego’s maximum annual sub-advisory fee was 0.625% of AlphaCentric RA’s daily asset value. The Board noted that this was lower than the fee Contego charged for other similar accounts. The Board determined that the sub-advisory fee was not unreasonable.
Profitability. The Board recognized that Contego did not make a profit from AlphaCentric RA. As such, the Board concluded that excessive profitability was not an issue for Contego at this time.
Economies of Scale. The Board considered whether AlphaCentric RA had reached the size where Contego would benefit from economies of scale. The Board acknowledged that this was generally an advisor issue and noted that it should be considered in terms of the Advisory Agreement and its potential impact on Contego’s expenses.
Conclusion. Having requested and received such information from Contego as the Board believed to be reasonably necessary to evaluate the terms of the Sub-Advisory Agreement between AlphaCentric and Contego, and as assisted by the advice and guidance of counsel, the Board concluded that renewal of the Sub-Advisory Agreement was in the best interests of AlphaCentric RA and its shareholders.
| AlphaCentric Funds |
| Additional Information (Unaudited)(Continued) |
| March 31, 2024 |
Approval of the Renewal of the Sub-Advisory Agreement between AlphaCentric Advisors LLC and Mount Lucas Management LP with respect to AlphaCentric Symmetry Strategy Fund.
At a meeting held on November 6 and 20, 2023, the Board of Trustees (the “Board”) of Mutual Fund Series Trust (the “Trust”), including a majority of the Trustees who are not “interested persons” as that term is defined in the Investment Company Act of 1940, as amended, (each an “Independent Trustee,” and collectively the “Independent Trustees”) discussed the renewal of the sub-advisory agreement (the “Sub-Advisory Agreement”) between AlphaCentric Advisors, LLC (“AlphaCentric”) and Mount Lucas Management LP (“Mount Lucas”) with respect to the AlphaCentric Symmetry Strategy Fund (“AlphaCentric SS”).
The Board examined Mount Lucas’s responses to a series of questions regarding, among other things, its sub-advisory services provided to AlphaCentric SS, comparative fee and expense information, and Mount Lucas’s profitability from sub-advising AlphaCentric SS. The Board was assisted by legal counsel throughout the review process and relied upon the advice of legal counsel and its own business judgment in determining the material factors to be considered in evaluating the Sub-Advisory Agreement and the weight to be given to each factor considered. The conclusions reached by the Board were based on a comprehensive evaluation of all of the information provided and were not the result of any one factor. Moreover, each Trustee may have afforded different weight to the various factors in reaching his conclusions with respect to the renewal of the Sub-Advisory Agreement.
Nature, Extent and Quality of Services. The Board discussed the services provided to AlphaCentric SS by Mount Lucas. The Board reviewed the key personnel involved with AlphaCentric SS and recognized that Mount Lucas personnel had an expertise in designing and utilizing an investment system that monitored investment decisions and compliance procedures. The Board reviewed Mount Lucas’s compliance monitoring practices, noting that Mount Lucas reported no material compliance issues. The Board recognized that Mount Lucas provided extensive compliance services to AlphaCentric SS, necessitated by the complex investment strategy. The Board noted that the AlphaCentric had recommended continuing the Sub -Advisory agreement with Mount Lucas. The Board agreed that Mount Lucas had the experience and resources necessary to continue providing quality services to AlphaCentric SS.
Performance. The Board observed that AlphaCentric SS underperformed its peer group average, Morningstar category and benchmark indexes for the 1-year period but outperformed the peer group average, Morningstar category and benchmark indexes for the 3-year period. The Board considered that since inception AlphaCentric SS had outperformed all of its benchmarks except for the MSCI world Bloomberg Aggregate Bond Blended Index, and overall performance was in line with the Board’s expectations. After discussion, the Board concluded that the performance of AlphaCentric SS was acceptable.
Fees and Expenses. The Board reviewed the fees being paid to Mount Lucas and discussed the allocation of fees between Mount Lucas and AlphaCentric relative to their respective duties and other factors. The Board acknowledged that the allocation of fees between the AlphaCentric and Mount Lucas was the product of an arm’s length negotiation. The Board concluded that the sub-advisory fees received by Mount Lucas from AlphaCentric for AlphaCentric SS were not unreasonable.
Profitability. The Board reviewed Mount Lucas’ profitability from sub-advising AlphaCentric SS. The Board recognized that Mount Lucas sub-advised AlphaCentric SS at a loss.
Economies of Scale. The Board considered whether AlphaCentric SS had reached the size where Mount Lucas would benefit from economies of scale. The Board acknowledged that this was primarily an advisor issue but agreed to reevaluate if AlphaCentric SS materially increases its assets.
Conclusion. Having requested and received such information from Mount Lucas as the Board believed to be reasonably necessary to evaluate the terms of the Sub-Advisory Agreement between AlphaCentric and Mount Lucas, and as assisted by the advice and guidance of counsel, the Board concluded that the renewal of the Sub-Advisory Agreement was in the best interests of AlphaCentric SS and its shareholders.
| AlphaCentric Funds |
| Additional Information (Unaudited)(Continued) |
| March 31, 2024 |
Approval of the Renewal of the Sub-Advisory Agreement between AlphaCentric Advisors, LLC and LifeSci Fund Management, LLC with respect to AlphaCentric LifeSci Healthcare Fund.
At a meeting held on November 6 and 20, 2023, the Board of Trustees (the “Board”) of Mutual Fund Series Trust (the “Trust”), including a majority of the Trustees who are not “interested persons” as that term is defined in the Investment Company Act of 1940, as amended, (each an “Independent Trustee,” and collectively the “Independent Trustees”) discussed the renewal of the sub-advisory agreement (the “Sub-Advisory Agreement”) between AlphaCentric Advisors, LLC (“AlphaCentric”) and LifeSci Fund Management, LLC (“LifeSci”) with respect to the AlphaCentric LifeSci Healthcare Fund (“AlphaCentric LH”).
The Board examined LifeSci’s responses to a series of questions regarding, among other things, its sub-advisory services provided to AlphaCentric LH, comparative fee and expense information, and LifeSci’s profitability from sub-advising AlphaCentric LH. The Board was assisted by legal counsel throughout the review process and relied upon the advice of legal counsel and its own business judgment in determining the material factors to be considered in evaluating the Sub-Advisory Agreement and the weight to be given to each factor considered. The conclusions reached by the Board were based on a comprehensive evaluation of all of the information provided and were not the result of any one factor. Moreover, each Trustee may have afforded different weight to the various factors in reaching his conclusions with respect to renewal of the Sub-Advisory Agreement.
Nature, Extent and Quality of Services. The Board reviewed the professional and educational credentials for the key LifeSci personnel. The Board discussed that there had not been any changes in personnel involved with AlphaCentric LH. They observed that LifeSci made all investment decisions for AlphaCentric LH and provided fundamental research to identify investable securities. The Board commented on LifeSci’s compliance program, which included documentation and review of daily portfolio transactions and monitoring of investment limitations. The Board discussed that LifeSci selected broker-dealers to conduct portfolio transactions and LifeSci’s policies for selecting broker dealers. The Board noted that AlphaCentric had recommended continuing the Sub-Advisory Agreement with LifeSci. After further discussion, the Board concluded that LifeSci could continue to provide high quality service to AlphaCentric LH and its shareholders.
Performance. The Board recalled its discussion that AlphaCentric LH had performed well over the 1-year period, significantly outperforming the peer group average, Morningstar category and benchmark indexes, with the exception of the S&P 500 TR. The Board noted that AlphaCentric LH had significantly outperformed the benchmark index for all time periods. The Board agreed that LifeSci’s fundamental thesis-driven stock picking had benefited AlphaCentric LH and its shareholders.
Fees and Expenses. The Board observed that LifeSci’s maximum sub-advisory fee was 0.625% or 50% of the net advisory fee paid to AlphaCentric. The Board discussed the fee split between AlphaCentric and LifeSci in relation to the responsibilities of each party. The Board concluded that the sub-advisory fee received by LifeSci for AlphaCentric LH was not unreasonable.
Profitability. The Board reviewed the financial information provided by LifeSci and noted that LifeSci sub-advised AlphaCentric LH at a loss. The Board concluded, therefore, that excessive profitability was not an issue for LifeSci at this time.
Economies of Scale. The Board considered whether the Fund had reached the size where LifeSci would benefit from economies of scale. The Board acknowledged that this was generally an advisor issue, that neither the AlphaCentric nor LifeSci were earning the full fee and noted that economies should be considered in terms of the Advisory Agreement and the impact of the LifeSci expense on AlphaCentric’s profits.
Conclusion. Having requested and received such information from LifeSci as the Board believed to be reasonably necessary to evaluate the terms of the Sub-Advisory Agreement between AlphaCentric and LifeSci, and as assisted by the advice and guidance of counsel, the Board concluded that renewal of the Sub-Advisory Agreement was in the best interests of AlphaCentric LH and its shareholders.
| AlphaCentric Funds |
| Additional Information (Unaudited)(Continued) |
| March 31, 2024 |
Approval of the Renewal of the Sub-Advisory Agreement between AlphaCentric Advisors, LLC and Goshen Rock Capital, LLC with respect to AlphaCentric Strategic Income Fund
At a meeting held on November 6 and 20, 2023, the Board of Trustees (the “Board”) of Mutual Fund Series Trust (the “Trust”), including a majority of the Trustees who are not “interested persons” as that term is defined in the Investment Company Act of 1940, as amended, (each an “Independent Trustee,” and collectively the “Independent Trustees”) discussed the renewal of the sub-advisory agreement (the “Sub-Advisory Agreement”) between AlphaCentric Advisors, LLC (“AlphaCentric”) and Goshen Rock Capital, LLC (“GRC”) with respect to the AlphaCentric Strategic Income Fund (“AlphaCentric SI”).
The Board examined GRC’s responses to a series of questions regarding, among other things, its sub-advisory services provided to AlphaCentric SI, comparative fee and expense information, and GRC’s profitability from sub-advising AlphaCentric SI. The Board was assisted by legal counsel throughout the review process and relied upon the advice of legal counsel and its own business judgment in determining the material factors to be considered in evaluating the Sub-Advisory Agreement and the weight to be given to each factor considered. The conclusions reached by the Board were based on a comprehensive evaluation of all of the information provided and were not the result of any one factor. Moreover, each Trustee may have afforded different weight to the various factors in reaching his conclusions with respect to the renewal of the Sub-Advisory Agreement.
Nature, Extent and Quality of Services. The Board reviewed the professional and educational credentials of GRC’s key personnel. The Board observed that GRC conducted fundamental investment research for AlphaCentric SI along with security selection, execution, and other portfolio management services. The Board acknowledged the work of GRC’s risk management committee. The Board discussed that GRC selected broker-dealers and focused on the ability complete the transaction based on availability of the securities and the price. After further discussion, the Board concluded that GRC could continue providing quality service to AlphaCentric SI and its shareholders.
Performance. The Board observed that AlphaCentric SI outperformed the Bloomberg U.S. Mortgage-Backed Securities Index and S&P U.S. REIT NTR Indexes for the 1-year, 3-year, 5-year and 10-year periods. The Board concluded that Fund performance was strong.
Fees and Expenses. The Board observed that GRC received 50% of the net advisory fee paid to AlphaCentric with a maximum sub-advisory fee of 0.75%. The Board noted this compared favorably to the fees charged by GRC for accounts with a strategy similar to AlphaCentric SI. The Board discussed the fees allocated to GRC in relation to its responsibilities in sub-advising AlphaCentric SI and believed the allocation was acceptable. The Board concluded that based on all of the information provided, the sub-advisory fee was not unreasonable.
Profitability. The Board observed that GRC sub-advised AlphaCentric SI at a loss and thus excessive profitability was not a concern.
Economies of Scale. The Board considered whether AlphaCentric SI had reached the size where GRC would benefit from economies of scale and concluded this was unlikely based on the size of the Fund. The Board acknowledged economies of scale was an issue primarily considered by the Board when evaluating the advisory agreement.
Conclusion. Having requested and received such information from GRC as the Board believed to be reasonably necessary to evaluate the terms of the Sub-Advisory Agreement between AlphaCentric and GRC, and as assisted by the advice and guidance of counsel, the Board concluded that renewal of the Sub-Advisory Agreement was in the best interests of AlphaCentric SI and its shareholders.
| AlphaCentric Funds |
| ADDITIONAL INFORMATION (Unaudited)(Continued) |
| March 31, 2024 |
Independent Trustees
Name, Address Year of Birth | Position(s) Held with Registrant | Term and Length Served* | Principal Occupation(s) During Past 5 Years | Number of Portfolios Overseen in the Fund Complex** | Other Directorships Held During Past 5 Years |
Tobias Caldwell
c/o Mutual Fund Series
Trust
36 N. New York
Avenue, Huntington,
NY 11743
Year of Birth: 1967 | Lead Trustee, Chairman of the Audit Committee and Nominating Committee | Since 6/2006 | Manager, Genovese Family Enterprises, LLC (and affiliates, family office) 1999-present, Managing Member, Bear Properties, LLC (real estate firm) (2006-present). | 51 | Chairman of the Board, Mutual Fund and Variable Insurance Trust since 2016; Chairman of the Board, Strategy Shares since 2016; Trustee, IDX Funds Trust (formerly, M3Sixty Funds Trust) since 2016; Chairman of the Board, Catalyst Strategic Income Opportunities Fund since April 2024; Chairman of the Board of AlphaCentric Prime Meridian Income Fund from 2018 to August 2023. |
Stephen P. Lachenauer
c/o Mutual Fund Series
Trust
36 N. New York
Avenue, Huntington,
NY 11743
Year of Birth: 1967 | Trustee | Since 4/2022 | Attorney, private practice since 2010. | 51 | Trustee and Chair of the Audit and Risk and Compliance Committees since 2016, and Chair of the Investment Committee since November 2020, Mutual Fund and Variable Insurance Trust; Trustee and Chair of the Audit and Risk and Compliance Committees since 2016, and Chair of the Investment Committee since November 2020, Strategy Shares; Trustee and Chair of the Audit and Risk and Compliance Committees from 2018 to 2023, and Chair of the Investment Committee from 2020 to 2023, AlphaCentric Prime Meridian Income Fund. |
| | | | | | |
Tiberiu Weisz
c/o Mutual Fund Series
Trust
36 N. New York
Avenue, Huntington,
NY 11743
Year of Birth: 1949 | Trustee, Chairman of the Risk and Compliance Committee | Since 6/2006 | Attorney since 1982. | 35 | None |
| AlphaCentric Funds |
| ADDITIONAL INFORMATION (Unaudited)(Continued) |
| March 31, 2024 |
Interested Trustee*** and Officers
Name, Address,
Year of Birth | Position(s)
Held
with
Registrant | Term and
Length
Served* | Principal Occupation(s)
During Past 5 Years | Number of
Portfolios
Overseen In
The Fund
Complex** | Other
Directorships
Held
During
Past 5
Years |
Jerry Szilagyi
53 Palmeras St. Suite
601
San Juan, PR 00901
Year of Birth: 1962 | Chairman of the Board | Trustee since 7/2006; President 2/2012-3/2022 | President of the Trust, 2/2012—3/2022; President, Rational Advisors, Inc., since 2016; Chief Executive Officer, Catalyst Capital Advisors LLC, since 2006; Member, AlphaCentric Advisors LLC, since 2014 ; Managing Member, MFund Distributors LLC, since 2012; Managing Member, MFund Services LLC, since 2012; CEO, Catalyst International Advisors LLC, since 2019; CEO, Insights Media LLC, since 2019; CEO, MFund Management LLC, since 2019. | 35 | None |
Michael Schoonover
53 Palmeras St. Suite
601
San Juan, PR 00901
Year of Birth: 1983 | President | Since 3/2022 | Vice President of the Trust, 2018-2022; Chief Operating Officer, Catalyst Capital Advisors LLC and Rational Advisors, Inc., since 2017; Portfolio Manager, Catalyst Capital Advisors LLC 12/2013 to 5/2021; Portfolio Manager, Rational Advisors, Inc. 1/2016 to 5/2018; President, MFund Distributors LLC, since 2020; COO, Catalyst International Advisors LLC, since 2019; COO, Insights Media LLC, since 2019; COO, MFund Management LLC, since 2019; COO, AlphaCentric Advisors LLC, since 2021. | N/A | N/A |
Alex Merino
53 Palmeras St. Suite
601
San Juan, PR 00901
Year of Birth: 1985 | Vice President | Since 3/2022 | Investment Operations Manager, MFund Management LLC, since 2022; Investment Operations Analyst, MFund Management LLC, 9/2020 to 12/2021; Tax Senior Associate, PwC Asset & Wealth Management NY Metro, 7/2016-6/2019. | N/A | N/A |
Erik Naviloff
4221 North 203rd
Street, Suite 100,
Elkhorn, Nebraska,
68022
Year of Birth: 1968 | Treasurer | Since 4/2012 | Vice President – Fund Administration, Ultimus Fund Solutions, LLC, since 2011. | N/A | N/A |
Brian Curley
4221 North 203rd
Street, Suite 100,
Elkhorn, Nebraska,
68022
Year of Birth: 1970 | Assistant Treasurer | Since 11/2013 | Vice President – Fund Administration, Ultimus Fund Solutions, LLC since 2015. | N/A | N/A |
Sam Singh
4221 North 203rd
Street, Suite 100,
Elkhorn, Nebraska,
68022
Year of Birth: 1976 | Assistant Treasurer | Since 2/2015 | Vice President – Fund Administration, Ultimus Fund Solutions, LLC since 2015. | N/A | N/A |
Frederick J. Schmidt
36 N. New York
Avenue
Huntington, NY
11743
Year of Birth: 1959 | Chief Compliance Officer | Since 5/2015 | Director of Compliance Services, MFund Services LLC since 2015. | N/A | N/A |
Jennifer A. Bailey
36 N. New York
Avenue
Huntington, NY
11743
Year of Birth: 1968 | Secretary | Since 4/2014 | Director of Legal Services, MFund Services LLC, since 2012. | N/A | N/A |
| * | The term of office of each Trustee is indefinite. |
| ** | The ‘Fund Complex’ includes the Trust, Mutual Fund and Variable Insurance Trust, and Strategy Shares, each a registered investment company. |
| *** | The Trustee who is an “interested person” of the Trust as defined in the 1940 Act is an interested person by virtue of being an officer of the advisor to certain series of the Trust. |
The Funds’ SAI includes additional information about the Trustees and is available, free of charge, by calling toll-free 1-844-223-8637.
| AlphaCentric Funds |
| Additional Information (Unaudited) |
| March 31, 2024 |
Reference is made to the Prospectus and the Statement of Additional Information for more detailed descriptions of the Advisory Agreement, Management Services Agreement and Distribution and/or Service (12b-1) Plan, tax aspects of the Funds and the calculation of the net asset value of shares of the Funds.
The Funds file their complete schedules of portfolio holdings with the Securities and Exchange Commission (the “Commission”) for the first and third quarters of each fiscal year as an exhibit to its reports on Form N-PORT. The Funds��� Forms N-PORT are available on the Commission’s website at http://www.sec.gov. The Funds’ Forms N-PORT may be obtained by calling 1-800-SEC-0330.
A description of the policies and procedures that the Funds use to determine how to vote proxies relating to portfolio securities is available without charge, upon request, by calling 1-844-223-8637; and on the Commission’s website at http://www.sec.gov.
Information regarding how the Funds voted proxies relating to portfolio securities during the most recent 12-month period ended June 30 is available without charge, upon request, by calling 1-844-223-8637; and on the Commission’s website at http://www.sec.gov.
PRIVACY NOTICE
Mutual Fund Series Trust
Rev. August 2021
| FACTS | WHAT DOES MUTUAL FUND SERIES TRUST DO WITH YOUR PERSONAL INFORMATION? |
| | |
| Why? | Financial companies choose how they share your personal information. Federal law gives consumers the right to limit some, but not all sharing. Federal law also requires us to tell you how we collect, share, and protect your personal information. Please read this notice carefully to understand what we do. |
| | |
| What? | The types of personal information we collect and share depends on the product or service that you have with us. This information can include: ● Social Security number and wire transfer instructions ● account transactions and transaction history ● investment experience and purchase history When you are no longer our customer, we continue to share your information as described in this notice. |
| | |
| How? | All financial companies need to share customers’ personal information to run their everyday business. In the section below, we list the reasons financial companies can share their customers’ personal information; the reasons Mutual Fund Series Trust chooses to share; and whether you can limit this sharing. |
Reasons we can share your
personal information: | Does Mutual Fund Series Trust
share information? | Can you limit this sharing? |
For our everyday business purposes - such as to process your transactions, maintain your account(s), respond to court orders and legal investigations, or report to credit bureaus. | YES | NO |
For our marketing purposes - to offer our products and services to you. | NO | We don’t share |
| For joint marketing with other financial companies. | NO | We don’t share |
For our affiliates’ everyday business purposes - information about your transactions and records. | NO | We don’t share |
For our affiliates’ everyday business purposes - information about your credit worthiness. | NO | We don’t share |
| For our affiliates to market to you | NO | We don’t share |
| For non-affiliates to market to you | NO | We don’t share |
PRIVACY NOTICE
Mutual Fund Series Trust
| What we do: |
| How does Mutual Fund Series Trust protect my personal information? | To protect your personal information from unauthorized access and use, we use security measures that comply with federal law. These measures include computer safeguards and secured files and buildings. Our service providers are held accountable for adhering to strict policies and procedures to prevent any misuse of your nonpublic personal information. |
| How does Mutual Fund Series Trust collect my personal information? | We collect your personal information, for example, when you: ● open an account or deposit money ● direct us to buy securities or direct us to sell your securities ● seek advice about your investments We also collect your personal information from others, such as credit bureaus, affiliates, or other companies. |
| Why can’t I limit all sharing? | Federal law gives you the right to limit only: ● sharing for affiliates’ everyday business purposes – information about your creditworthiness. ● affiliates from using your information to market to you. ● sharing for non-affiliates to market to you. State laws and individual companies may give you additional rights to limit sharing. |
| | |
| Definitions |
| Affiliates | Companies related by common ownership or control. They can be financial and non-financial companies. ● Mutual Fund Series Trust does not share with affiliates. |
| Non-affiliates | Companies not related by common ownership or control. They can be financial and non-financial companies. ● Mutual Fund Series Trust doesn’t share with non-affiliates so they can market to you. |
| Joint marketing | A formal agreement between nonaffiliated financial companies that together market financial products or services to you. ● Mutual Fund Series Trust doesn’t jointly market. |
| | Alpha Centric | 844-223-8637 |
| QUESTIONS? | Catalyst | 866-447-4228 |
| CALL | Empiric | 888-839-7424 |
| | Eventide | 877-771-3836 |
| | JAG | 855-552-4596 |
Mutual Fund Series Trust
4221 North 203rd Street, Suite 100
Elkhorn, NE 68022
ADVISER
AlphaCentric Advisors, LLC
53 Palmeras Street, Suite 601
San Juan, PR 00901
ADMINISTRATOR
Ultimus Fund Solutions, LLC
225 Pictoria Drive, Suite 450
Cincinnati, OH 45246
TRANSFER AGENT
Ultimus Fund Solutions, LLC
225 Pictoria Drive, Suite 450
Cincinnati, OH 45246
INDEPENDENT REGISTERED PUBLIC ACCOUNTING FIRM
Cohen & Company, Ltd.
1835 Market St.
Suite 310
Philadelphia, PA 19103
LEGAL COUNSEL
Thompson Hine LLP
41 South High Street Suite 1700
Columbus, OH 43215
CUSTODIAN BANK
U.S. Bank
1555 N. Rivercenter Drive. Suite 302
Milwaukee, WI 53212
ALPHA-AR24
ITEM 2. CODE OF ETHICS.
| (a) | The registrant has, as of the end of the period covered by this report, adopted a code of ethics that applies to the registrant's principal executive officer, principal financial officer, and principal accounting officer or controller, or persons performing similar functions, regardless of whether these individuals are employed by the registrant or a third party. |
| (b) | During the period covered by this report, there were no amendments to any provision of the code of ethics. |
| (c) | During the period covered by this report, there were no waivers or implicit waivers of a provision of the code of ethics. |
ITEM 3. AUDIT COMMITTEE FINANCIAL EXPERT.
| | The registrant’s Board of Trustees has determined that it does not have an audit committee financial expert serving on its audit committee. At this time, the registrant believes that the experience provided by each member of the audit committee together offer the registrant adequate oversight for the registrant’s level of financial complexity. |
ITEM 4. PRINCIPAL ACCOUNTANT FEES AND SERVICES.
| (a) | Audit Fees. The aggregate fees billed for each of the last two fiscal years for professional services rendered by the registrant's principal accountant for the audit of the registrant's annual financial statements or services that are normally provided by the accountant in connection with statutory and regulatory filings or engagements for the fiscal year is as follows: |
| Trust Series | 2024 | 2023 |
| AlphaCentric Income Opportunities Fund | $35,000 | $49,000 |
| AlphaCentric Premium Opportunity Fund | $12,500 | $11,500 |
| AlphaCentric Robotics and Automation Fund | $14,000 | $13,500 |
| AlphaCentric Symmetry Strategy Fund | $15,500 | $14,000 |
| AlphaCentric LifeSci Healthcare Fund | $12,000 | $12,000 |
| AlphaCentric Strategic Income Fund | $13,000 | $12,000 |
| (b) | Audit-Related Fees. There were no fees billed in each of the last two fiscal years for assurances and related services by the principal accountant that are reasonably related to the performance of the audit of the registrant’s financial statements and are not reported under paragraph (a) of this item. |
| (c) | Tax Fees. The aggregate fees billed in each of the last two fiscal years for professional services rendered by the principal accountant for tax compliance are as follows: |
| Trust Series | 2024 | 2023 |
| AlphaCentric Income Opportunities Fund | $4,500 | $4,100 |
| AlphaCentric Premium Opportunity Fund | $3,500 | $2,600 |
| AlphaCentric Robotics and Automation Fund | $3,500 | $3,100 |
| AlphaCentric Symmetry Strategy Fund | $4,000 | $3,500 |
| AlphaCentric LifeSci Healthcare Fund | $3,500 | $2,600 |
| AlphaCentric Strategic Income Fund | $3,500 | $2,600 |
| (d) | All Other Fees. The aggregate fees billed in each of the last two fiscal years for products and services provided by the registrant’s principal accountant, other than the services reported in paragraphs (a) through (c) of this item were $0 for the fiscal year ended March 31, 2023 and 2024. |
| (e)(1) | The audit committee does not have pre-approval policies and procedures. Instead, the audit committee or audit committee chairman approves on a case-by-case basis each audit or non-audit service before the principal accountant is engaged by the registrant. |
| (e)(2) | There were no services described in each of paragraphs (b) through (d) of this Item that were approved by the audit committee pursuant to paragraph (c)(7)(i)(C) of Rule 2-01 of Regulation S-X. |
| f) | Not applicable. The percentage of hours expended on the principal accountant's engagement to audit the registrant's financial statements for the most recent fiscal year that were attributed to work performed by persons other than the principal accountant's full-time, permanent employees was zero percent (0%). |
| (g) | All non-audit fees billed by the registrant's principal accountant for services rendered to the registrant for the fiscal year ended March 31, 2024, and are disclosed in (b)-(d) above. There were no audit or non-audit services performed by the registrant's principal accountant for the registrant's adviser. |
| (h) | The registrant's audit committee has considered whether the provision of non-audit services to the registrant's investment adviser (not including any sub-adviser whose role is primarily portfolio management and is subcontracted with or overseen by another investment adviser), and any entity controlling, controlled by, or under common control with the investment adviser that provides ongoing services to the registrant, that were not pre-approved pursuant to paragraph (c)(7)(ii) of Rule 2-01 of Regulation S-X, is compatible with maintaining the principal accountant's independence. |
(i) Not applicable.
(j) Not applicable.
ITEM 5. AUDIT COMMITTEE OF LISTED REGISTRANTS.
Not applicable
ITEM 6. SCHEDULE OF INVESTMENT
Included in annual report to shareholders filed under item 1 of this form.
ITEM 7. DISCLOSURE OF PROXY VOTING POLICIES AND PROCEDURES FOR CLOSED-END MANAGEMENT INVESTMENT COMPANIES.
Not applicable Fund is an open-end management investment company
ITEM 8. PORTFOLIO MANAGERS OF CLOSED-END MANAGEMENT INVESTMENT COMPANIES
Not applicable Fund is an open-end management investment company
ITEM 9. PURCHASES OF EQUITY SECURITIES BY CLOSED-END MANAGEMENT INVESTMENT COMPANY AND AFFILIATED PURCHASERS.
Not applicable Fund is an open-end management investment company
ITEM 10. SUBMISSION OF MATTERS TO A VOTE OF SECURITY HOLDERS.
Not applicable at this time.
ITEM 11. CONTROLS AND PROCEDURES.
| (a) | Based on an evaluation of the registrant’s disclosure controls and procedures (as defined in Rule 30a-3(c) under the 1940 Act, as of a date within 90 days of the filing date of this Form N-CSR, the principal executive officer and principal financial officer of the registrant have concluded that the disclosure controls and procedures were not effective due to a material weakness in the design of procedures supporting the controls for overrides of pricing vendor valuations by the Valuation Designee. |
The registrant has implemented enhancements to its procedures supporting the control to remediate the material weakness described above.
| (b) | Other than the enhancements to controls noted above that will be implemented to remediate the material weakness, there were no changes in the registrant’s internal control over financial reporting (as defined in Rule 30a-3(d) under the 1940 Act) that occurred during the period covered by this report that have materially affected, or are reasonably likely to materially affect, the registrant’s internal control over financial reporting. |
ITEM 12. Disclosure of Securities Lending Activities for Closed-End Management Investment Companies. Not applicable to open-end investment companies.
ITEM 13. EXHIBITS
(a)(1) Code of Ethics for Principal Executive and Senior Financial Officers is attached hereto.
(a)(2) Certifications required by Section 302 of the Sarbanes-Oxley Act of 2002 (and Item 13(a)(2) of Form N-CSR) are filed herewith.
(a)(3) Not applicable.
(b) Certifications required by Section 906 of the Sarbanes-Oxley Act of 2002 (and Item 13(b) of Form N-CSR) are filed herewith.
SIGNATURES
Pursuant to the requirements of the Securities Exchange Act of 1934 and the Investment Company Act of 1940, the registrant has duly caused this report to be signed on its behalf by the undersigned, thereunto duly authorized.
Mutual Fund Series Trust
| By Michael Schoonover | /s/ Michael Schoonover __________ |
| Principal Executive Officer/President |
| Date: November 19, 2024 | |
Pursuant to the requirements of the Securities Exchange Act of 1934 and the Investment Company Act of 1940, this report has been signed below by the following person on behalf of the registrant and in the capacities and on the date indicated.
| By Erik Naviloff | /s/ Erik Naviloff_____________ |
| Principal Financial Officer/Treasurer |
| Date: November 19, 2024 | |