united states
securities and exchange commission
washington, d.c. 20549
form n-csr
certified shareholder report of registered management
investment companies
Investment Company Act file number 811-21872
Mutual Fund Series Trust
(Exact name of registrant as specified in charter)
225 Pictoria Drive, Suite 450, Cincinnati, OH 45246
(Address of principal executive offices) (Zip code)
CT CORPORATION SYSTEM
1300 EAST NINTH STREET, CLEVELAND, OH 44114
(Name and address of agent for service)
Registrant's telephone number, including area code: 631-490-4300
Date of fiscal year end: 9/30
Date of reporting period: 9/30/23
ITEM 1. REPORTS TO SHAREHOLDERS.
| | |
| | |
| | |
| | |
| | |
 |
| | |
| | |
| | |
| | |
| | |
| ANNUAL REPORT |
| | |
| | |
| | |
| | |
| | |
| | |
| | |
| | |
| | |
| | |
| JAG Large Cap Growth Fund |
| | |
| September 30, 2023 |
| | |
| | |
| | |
| | |
| | |
| | |
| | |
| | |
| | |
| | |
| | |
| | |
| | |
| | |
| | |
| | |
| | |
| | |
| | |
| | |
| JAG Capital Management LLC |
| 9841 Clayton Road |
| St. Louis, MO 63124 |
| | |
| | |
| www.JAGCapitalFunds.com | 855-552-4596 |

Annual Shareholder Letter
September 30, 2023
Dear Shareholder:
Consistent with our longstanding investment philosophy and process, substantially all the Fund’s assets are invested in a focused but diversified portfolio of companies which we believe possess strong growth characteristics, fundamental strength, and compelling long-term price appreciation potential.
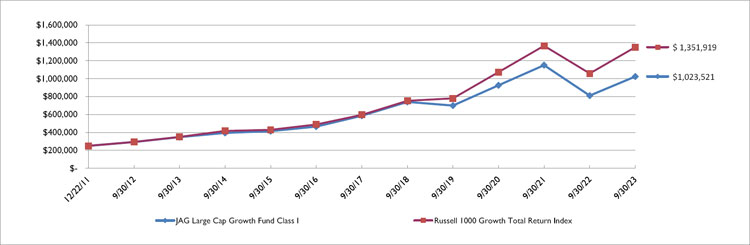
During the Reporting Period, the Fund’s Class A, R, and I shares generated cumulative total returns, without sales charges, of 26.0%, 26.7%, and 26.2%, respectively. These returns compare to the cumulative 27.7% total return of the Fund’s benchmark, the Russell 1000 Growth Total Return Index and 21.6% for the S&P 500 Total Return Index.
The Fund’s performance slightly lagged the Russell 1000 Growth Total Return Index over the past year while generating strong absolute returns amidst a strong rally for the broader equity market. Holdings in the Information Technology, Communication Services, and Consumer Discretionary sectors were the biggest contributors to the Fund’s total returns, although our underweight stance to shares of mega-cap Information Technology stocks represented the biggest headwind to our relative performance versus the Russell 1000 Growth.
Two different significantly disruptive themes have dominated the equity market over the past year. The rise of Artificial Intelligence (AI) has created much investor enthusiasm for the transformative potential of this revolutionary technology. We believe the emergence of AI could rival the Internet itself in terms of its impact on our economy and society. If we are correct, the ultimate winners and losers will be determined in the coming months and years.
Similarly, the rise of GLP-1 treatments like Ozempic, Wegovy, and Mounjaro have potentially significant investment implications. These treatments have been highly effective in treating both Type 2 diabetes and obesity. More recently, results from a new study have further invigorated interest in these game-changing medicines and created ripple effects across the Health Care sector and the broader financial markets. On August 8th, Novo Nordisk announced preliminary results from their SELECT study, which demonstrated a 20% reduction in the risk of major cardiovascular events for patients taking their GLP-1 drug, compared to a similar group of patients in the placebo group. We believe these remarkable results are likely to drive broader coverage of GLP-1 drugs among payers and accelerate the adoption curve among patients with Type 2 diabetes and/or obesity.
The perceived winners in the wake of the SELECT study have been a narrow group of companies that develop, produce, and distribute GLP-1s, including portfolio holding LLY (the maker of Mounjaro). On the other hand, a much broader cohort of potentially disrupted companies have experienced deep share price corrections. This includes producers of cardiovascular devices and tools for managing diabetes, fast food restaurants, snack food manufacturers, and the packaged container companies that serve these markets. Indeed, two of our bottom five portfolio contributors last quarter experienced price corrections which we attribute to the potentially disruptive effects of anti-obesity treatments.
| 9841 Clayton Road St. Louis, MO 63124 | 3530-NLD-11/02/2023 |
| toll-free 800.966.4596 314.997.1277 jagcapitalfunds.com |
Regarding the disruptive impact of both AI and anti-obesity breakthroughs, we believe the tangible effects on the revenue and earnings of the affected companies may not be evident for months or even years. However, financial markets are a discounting mechanism. Therefore, short-term stock price movements tend to be impacted by emotion and are often characterized by over- and under-reactions to long-term changes in fundamentals. By the time the actual financial results of the companies inflect negatively (for the disrupted) or positively (for the disruptors), markets will have already delivered their verdict. We will be closely monitoring the first- and second-order effects of AI and GLP-1s on companies in many industries and sectors in the coming months. In the process, we expect to identify both risks and opportunities.
As we have noted in the past, the Fund employs an active approach to portfolio management. We focus intently on the Fund’s goal of delivering long-term excess returns, after all expenses, when compared to the Russell 1000 Growth Total Return Index and the S&P 500 Total Return Index.
Far from mirroring the indexes, we seek to build a focused but diversified portfolio of 30-40 individual common stocks which we believe have the potential to reward shareholders with outsized returns over the intermediate and long term. Our commitment to owning such a focused group of stocks dictates that we also employ strong risk management techniques. There are many definitions of “risk” in our industry, but for us it is best defined as the potential for permanent loss of capital. Short-term price volatility — the daily, weekly, and monthly fluctuations in securities prices — is interesting and sometimes exciting, but these zigs and zags are ultimately meaningless to long-term investors. We are willing to accept moderate amounts of volatility in the prices of the Fund’s investment positions, but we work very hard to avoid exposing the Fund’s investors to investment propositions which threaten permanent destruction of capital.
As is almost always the case, our portfolio composition varies significantly from that of the broader market. From time to time, this has historically left the Fund vulnerable to periods of short- and intermediate-term underperformance. Regardless, we will continue to adhere to our time-tested process as 2024 approaches.
“If I can be optimistic when I’m nearly dead, surely the rest of you can handle a little inflation.”
-Charlie Munger
Comments during Berkshire Hathaway’s May 2010 Annual Meeting
As Mr. Munger reminds us, in both life and investing, it is important to maintain perspective. This can be easier said than done, especially when we all have 24/7 access to all manner of news, newly minted expert opinions, and threats via the never-ending flood of online and social media. It is worth noting that Charlie made these comments in May 2010, when the wounds of the Great Financial Crisis were still all too fresh. Incidentally, his optimism was well-placed, as the S&P 500 has produced an annualized average return of 12.9% from 5/31/2010 through 9/30/23.
From our perspective, the biggest known risks for investors center on the future paths of interest rates, the shape of the yield curve in terms of short-term versus long-term yields, and inflation expectations. Of course, these risks are somewhat interdependent. While inflation has been moderating at a steady if uneven pace this year, any sign that it is re-heating could compel the Fed to raise rates more than currently expected. Similarly, with 30-year mortgage rates breaching 8%, pockets
| 9841 Clayton Road St. Louis, MO 63124 | 3530-NLD-11/02/2023 |
| toll-free 800.966.4596 314.997.1277 jagcapitalfunds.com |
of the residential housing market are paralyzed. As of August 2023, Existing Home Sales were at nearly 13-year lows. Homeowners who were lucky enough to lock in mortgages at less than 4% between 2019 and 2021 are now generally uninterested in selling—because the costs of financing another home are prohibitive. Single-family home prices remain firm in many geographies, reflecting the limited supply of homes for sale. But firm real estate prices do little to unfreeze the market because many first-time home buyers simply cannot afford the current cost of financing. If these conditions persist into late 2024 or 2025, they could eventually drive rents higher. Ironically, since rents are a significant input into government inflation data, higher-for-longer mortgage rates could themselves contribute to stickier inflation.
The investment implications of higher interest rates are playing out in real time. Part of the challenge here is a gap in our collective memory. Interest rates have not been “normal” since 2007. Although 16 years is but a blink in the long march of history, it is long enough that most of us may have forgotten what it is like to live, work, and invest in a world in which very low-cost capital is not abundantly available. Within our investment team, we are avoiding investing in businesses that might have a particularly tough time navigating a more normalized rate environment.
As has always been the case, we favor industry-leading companies with superior growth potential and manageable debt loads. We tend to avoid companies whose business models are dependent upon debt financing, and we think over-leveraged balance sheets are likely to be the source of many of the worst stock-specific headlines that will emerge over the next couple of years. To put a finer point on this, we continue to be cautious about the banking industry. Remember that bank profitability stems from the ability to “borrow short” (from depositors) and “lend long” (to borrowers), thereby capturing a spread. Higher rates have run-on effects for bank profitability because most banks cannot afford to offer their depositors money-market equivalent yields. At the same time, bank balance sheets hold hundreds of billions of dollars of commercial real estate loans and long-term bonds on their books. Given the fact that most of these assets were acquired at much lower interest rates, their market values are lower today than they were previously. In addition, although there are notable exceptions, the broader commercial real estate industry is under obvious and likely long-term pressure, especially within office buildings. In sum, we continue to believe the banking industry is facing exceptional headwinds, and we are generally avoiding investing in shares of banks for now.
Much has been written since early 2022 discussing the implications of the so -called “inverted yield curve.” This is a complicated way of saying that shorter-term interest rates have been higher than long-term interest rates, which is a relatively rare occurrence over the past 100+ years. Normally, investors demand higher rates of interest to lend their capital to borrowers for longer periods of time. This was caused in large part by the Fed’s all-out assault on inflation, which led to it raising the Fed Funds rate from 0.25% to 5.50% in the span of roughly 18 months. However, in recent weeks, longer-rates have risen faster than short-term rates. This means that the yield curve is de-inverting, which is contributing to more volatility and pain in asset prices in recent months. We expect to see this volatility continue in the near term, given the current geopolitical turmoil and fluctuations in economic statistics, interest rates, and FOMC policy.
The biggest unquantifiable risks remain as they have for many decades, simmering for years in the background before occasionally storming into the foreground. Geopolitical, economic, and social tensions exist in many parts of the developed and developing world, but prudent and flexible governments will continue to make great advances over time. Similarly, environmental impact from natural geological forces and humanity continue to place strain on resources, but creative and determined societies, corporations, and individuals will work to create solutions in the coming decades.
| 9841 Clayton Road St. Louis, MO 63124 | 3530-NLD-11/02/2023 |
| toll-free 800.966.4596 314.997.1277 jagcapitalfunds.com |
Within this context of uncertainty, we continue to invest with a focus on managing risks and capitalizing on attractive investment opportunities.
Best regards,

Norman B. Conley III
Portfolio Manager
| * | The Russell 1000 Growth Index is an unmanaged index that measures the performance of the largest 1000 securities in the Russell 3000 with higher price-to-book ratios and higher forecasted growth values. It is generally representative of the large-cap growth segment of the U.S. equity market. |
The S&P 500® Index is an unmanaged composite of 500 large capitalization companies. This index is widely used by professional investors as a performance benchmark for large-cap stocks. You cannot invest directly in an index and unmanaged index returns do not reflect any fees, expenses, or sales charges.
| 9841 Clayton Road St. Louis, MO 63124 | 3530-NLD-11/02/2023 |
| toll-free 800.966.4596 314.997.1277 jagcapitalfunds.com |
JAG Large Cap Growth Fund
PORTFOLIO REVIEW (Unaudited)
September 30, 2023
Average Annual Total Return through September 30, 2023* as compared to its benchmarks:
| | 1 Year Return | 3 Year Return | 5 Year Return | 10 Year Return | Since Inception(a) | Since Inception(b) |
| Class A | 25.98% | 3.15% | 6.40% | 11.13% | 12.44% | N/A |
| Class A with 5.75% load | 18.75% | 1.15% | 5.15% | 10.48% | 11.88% | N/A |
| Class I | 26.21% | 3.40% | 6.66% | 11.40% | 12.72% | N/A |
| Class R | 26.72% | 3.78% | N/A | N/A | N/A | 8.37% |
| Russell 1000 Growth Total Return Index(c) | 27.72% | 7.97% | 12.42% | 14.48% | 15.41% | 11.98% |
| S&P 500 Total Return Index (d) | 21.62% | 10.15% | 9.92% | 11.91% | 13.38% | 9.66% |
| * | The performance data quoted here represents past performance. Current performance may be lower or higher than the performance data quoted above. Investment return and principal value will fluctuate, so that shares, when redeemed, may be worth more or less than their original cost. The returns shown do not reflect the deduction of taxes that a shareholder would pay on Fund distributions or on the redemptions of Fund shares. Past performance is no guarantee of future results. The adviser and the Trust, with respect to the Fund, have entered into an Expense Limitation Agreement under which the adviser has contractually agreed to waive fees and/or reimburse expenses but only to the extent necessary to maintain total annual operating expenses (excluding brokerage costs; borrowing and liquidy costs such as interest and dividends on securites sold short; taxes; underlying/acquired fund expenses; and extraordinary expenses) at 1.50%, 1.25% and 0.90% of the Fund’s average daily net assets through January 31, 2024, for Class A, Class I and Class R shares, respectively. Each waiver or reimbursement by the adviser is subject to repayment by the Fund within three years after the fees have been waived or reimbursed if the Fund is able to make the repayment without exceeding the lesser of the expense limitation in place at the time of waiver or reimbursement and the expense limitation in effect at that time. Without these waivers, the Fund’s total annual operating expenses would have been 1.61%, 1.36% and 1.01% for the Fund’s Class A, Class I and Class R shares, per the latest prospectus, respectively. Class A shares are subject to a maximum sales charge imposed on purchases of 5.75% and a maximum deferred sales charge of 1.00%. Please review the Fund’s most recent prospectus for more detail on the expense waiver. For performance information current to the most recent month-end, please call toll-free 1-855-552-4596. |
| (a) | Class A and Class I commenced operations on December 22, 2011. |
| (b) | Class R commenced operations on February 3, 2020. |
| (c) | The Russell 1000 Growth Total Return Index represents an unmanaged portfolio of those Russell 1000 Index companies with higher price-to-book ratios and higher forecasted growth values. Investors cannot invest directly in an index or benchmark. |
| (d) | The S&P 500 Total Return Index is a market capitalization-weighted index of 500 widely held common stocks. Investors cannot invest directly in an index or benchmark. |
Comparison of the Change in Value of a $250,000 Investment
| Top Holdings by Industry | | % of Net Assets | |
| Software | | | 15.7 | % |
| Internet Media & Services | | | 15.1 | % |
| Semiconductors | | | 11.8 | % |
| E-Commerce Discretionary | | | 6.8 | % |
| Biotech & Pharma | | | 6.2 | % |
| Retail - Discretionary | | | 6.2 | % |
| Technology Services | | | 5.5 | % |
| Technology Hardware | | | 4.4 | % |
| Insurance | | | 4.1 | % |
| Apparel & Textile Products | | | 3.9 | % |
| Medical Equipment & Devices | | | 3.9 | % |
| Other / Cash & Cash Equivalents | | | 16.4 | % |
| | | | 100.0 | % |
Please refer to the Schedule of Investments in this annual report for a detailed listing of the Fund’s holdings.
| JAG LARGE CAP GROWTH FUND |
| SCHEDULE OF INVESTMENTS |
| September 30, 2023 |
| Shares | | | | | Fair Value | |
| | | | | COMMON STOCKS — 98.9% | | | | |
| | | | | ADVERTISING & MARKETING - 3.4% | | | | |
| | 16,599 | | | Trade Desk, Inc. (The), Class A(a) | | $ | 1,297,212 | |
| | | | | | | | | |
| | | | | APPAREL & TEXTILE PRODUCTS - 3.9% | | | | |
| | 2,968 | | | Deckers Outdoor Corporation(a) | | | 1,525,819 | |
| | | | | | | | | |
| | | | | AUTOMOTIVE - 1.9% | | | | |
| | 2,913 | | | Tesla, Inc.(a) | | | 728,891 | |
| | | | | | | | | |
| | | | | BIOTECH & PHARMA - 6.2% | | | | |
| | 2,545 | | | Eli Lilly and Company | | | 1,366,996 | |
| | 2,947 | | | Vertex Pharmaceuticals, Inc.(a) | | | 1,024,790 | |
| | | | | | | | 2,391,786 | |
| | | | | CHEMICALS - 2.2% | | | | |
| | 2,256 | | | New Linde plc | | | 840,022 | |
| | | | | | | | | |
| | | | | E-COMMERCE DISCRETIONARY - 6.8% | | | | |
| | 20,582 | | | Amazon.com, Inc.(a) | | | 2,616,384 | |
| | | | | | | | | |
| | | | | ENGINEERING & CONSTRUCTION – 1.9% | | | | |
| | 4,024 | | | Quanta Services, Inc. | | | 752,770 | |
| | | | | | | | | |
| | | | | INSURANCE - 4.1% | | | | |
| | 1,090 | | | Markel Group, Inc.(a) | | | 1,605,014 | |
| | | | | | | | | |
| | | | | INTERNET MEDIA & SERVICES - 15.1% | | | | |
| | 11,554 | | | Alphabet, Inc., Class A(a) | | | 1,511,956 | |
| | 5,887 | | | Meta Platforms, Inc., Class A(a) | | | 1,767,336 | |
| | 2,949 | | | Netflix, Inc.(a) | | | 1,113,542 | |
| | 32,024 | | | Uber Technologies, Inc.(a) | | | 1,472,784 | |
| | | | | | | | 5,865,618 | |
| | | | | MEDICAL EQUIPMENT & DEVICES - 3.9% | | | | |
| | 5,196 | | | Intuitive Surgical, Inc.(a) | | | 1,518,739 | |
| | | | | | | | | |
See accompanying notes to financial statements.
| JAG LARGE CAP GROWTH FUND |
| SCHEDULE OF INVESTMENTS (Continued) |
| September 30, 2023 |
| Shares | | | | | Fair Value | |
| | | | | COMMON STOCKS — 98.9% (Continued) | | | | |
| | | | | RETAIL - CONSUMER STAPLES - 3.4% | | | | |
| | 2,314 | | | Costco Wholesale Corporation | | $ | 1,307,317 | |
| | | | | | | | | |
| | | | | RETAIL - DISCRETIONARY - 6.2% | | | | |
| | 3,409 | | | Lululemon Athletica, Inc.(a) | | | 1,314,545 | |
| | 1,182 | | | O’Reilly Automotive, Inc.(a) | | | 1,074,273 | |
| | | | | | | | 2,388,818 | |
| | | | | SEMICONDUCTORS - 11.8% | | | | |
| | 10,346 | | | Advanced Micro Devices, Inc.(a) | | | 1,063,776 | |
| | 2,028 | | | Broadcom, Inc. | | | 1,684,416 | |
| | 2,155 | | | NVIDIA Corporation | | | 937,403 | |
| | 9,606 | | | ON Semiconductor Corporation(a) | | | 892,878 | |
| | | | | | | | 4,578,473 | |
| | | | | SOFTWARE - 15.7% | | | | |
| | 4,086 | | | Cadence Design Systems, Inc.(a) | | | 957,350 | |
| | 6,932 | | | Microsoft Corporation | | | 2,188,779 | |
| | 7,532 | | | Oracle Corporation | | | 797,789 | |
| | 2,616 | | | ServiceNow, Inc.(a) | | | 1,462,239 | |
| | 12,452 | | | Shopify, Inc., Class A(a) | | | 679,506 | |
| | | | | | | | 6,085,663 | |
| | | | | TECHNOLOGY HARDWARE - 4.4% | | | | |
| | 9,930 | | | Apple, Inc. | | | 1,700,115 | |
| | | | | | | | | |
| | | | | TECHNOLOGY SERVICES - 5.5% | | | | |
| | 983 | | | Fair Isaac Corporation(a) | | | 853,765 | |
| | 3,263 | | | Mastercard, Inc., Class A | | | 1,291,854 | |
| | | | | | | | 2,145,619 | |
| | | | | WHOLESALE - DISCRETIONARY - 2.5% | | | | |
| | 22,376 | | | Copart, Inc.(a) | | | 964,182 | |
| | | | | | | | | |
| | | | | | | | | |
| | | | | TOTAL COMMON STOCKS (Cost $30,886,261) | | | 38,312,442 | |
| | | | | | | | | |
See accompanying notes to financial statements.
| JAG LARGE CAP GROWTH FUND |
| SCHEDULE OF INVESTMENTS (Continued) |
| September 30, 2023 |
| Shares | | | | | Fair Value | |
| | | | | SHORT-TERM INVESTMENTS — 0.7% | | | | |
| | | | | MONEY MARKET FUNDS - 0.7% | | | | |
| | 285,409 | | | First American Treasury Obligations Fund, Class Z, 5.22% (Cost $285,409)(b) | | $ | 285,409 | |
| | | | | | | | | |
| | | | | TOTAL INVESTMENTS - 99.6% (Cost $31,171,670) | | $ | 38,597,851 | |
| | | | | OTHER ASSETS IN EXCESS OF LIABILITIES- 0.4% | | | 162,460 | |
| | | | | NET ASSETS - 100.0% | | $ | 38,760,311 | |
| PLC | - Public Limited Company |
| (a) | Non-income producing security. |
| (b) | Rate disclosed is the seven day effective yield as of September 30, 2023. |
See accompanying notes to financial statements.
| JAG Large Cap Growth Fund |
| STATEMENT OF ASSETS AND LIABILITIES |
| September 30, 2023 |
| ASSETS | | | | |
| Investment securities: | | | | |
| At cost | | $ | 31,171,670 | |
| At fair value | | $ | 38,597,851 | |
| Receivable for Fund shares sold | | | 183,000 | |
| Dividends and interest receivable | | | 1,971 | |
| Prepaid expenses | | | 24,962 | |
| TOTAL ASSETS | | | 38,807,784 | |
| | | | | |
| LIABILITIES | | | | |
| Payable for Fund shares redeemed | | | 504 | |
| Investment advisory fees payable | | | 17,756 | |
| Distribution (12b-1) fees payable | | | 70 | |
| Payable to related parties | | | 9,804 | |
| Compliance officer fees payable | | | — | |
| Accrued expenses and other liabilities | | | 19,339 | |
| TOTAL LIABILITIES | | | 47,473 | |
| NET ASSETS | | $ | 38,760,311 | |
| | | | | |
| Composition of Net Assets: | | | | |
| Paid in capital | | $ | 28,387,636 | |
| Accumulated earnings | | | 10,372,675 | |
| NET ASSETS | | $ | 38,760,311 | |
| | | | | |
| Net Asset Value Per Share: | | | | |
| Class A Shares: | | | | |
| Net Assets | | $ | 131,975 | |
| Shares of beneficial interest outstanding (a) | | | 8,101 | |
| Net asset value (Net Assets ÷ Shares Outstanding) and redemption price per share (b) | | $ | 16.29 | |
| Maximum offering price per share (net asset value plus maximum sales charge of 5.75%) | | $ | 17.28 | |
| | | | | |
| Class I Shares: | | | | |
| Net Assets | | $ | 16,023,181 | |
| Shares of beneficial interest outstanding (a) | | | 934,689 | |
| Net asset value (Net Assets ÷ Shares Outstanding), offering price and redemption price per share | | $ | 17.14 | |
| | | | | |
| Class R Shares: | | | | |
| Net Assets | | $ | 22,605,155 | |
| Shares of beneficial interest outstanding (a) | | | 1,299,504 | |
| Net asset value (Net Assets ÷ Shares Outstanding), offering price and redemption price per share | | $ | 17.40 | |
| (a) | Unlimited number of shares of beneficial interest authorized, no par value. |
| (b) | Investments in Class A shares made at or above the $1 million breakpoint are not subject to an initial sales charge but may be subject to a 1.00% contingent deferred sales charge (“CDSC”) on shares redeemed within 18 months after the date of purchase (excluding shares purchased with reinvested dividends and/or distributions). |
See accompanying notes to financial statements.
| JAG Large Cap Growth Fund |
| STATEMENT OF OPERATIONS |
| For the Year Ended September 30, 2023 |
| INVESTMENT INCOME | | | | |
| Dividends (net of foreign withholding taxes of $2,333) | | $ | 169,739 | |
| Interest | | | 24,445 | |
| TOTAL INVESTMENT INCOME | | | 194,184 | |
| | | | | |
| EXPENSES | | | | |
| Investment advisory fees | | | 336,195 | |
| Distribution (12b-1) fees: | | | | |
| Class A | | | 264 | |
| Financial administration/fund accounting fees | | | 80,202 | |
| Registration fees | | | 52,560 | |
| Legal administration/management services fees | | | 42,843 | |
| Compliance officer fees | | | 21,222 | |
| Legal fees | | | 20,350 | |
| Shareholder service fees | | | 18,478 | |
| Trustees fees and expenses | | | 15,003 | |
| Audit fees | | | 13,600 | |
| Printing and postage expenses | | | 4,956 | |
| Custody overdraft fees | | | 3,668 | |
| Custodian fees | | | 3,604 | |
| Insurance expense | | | 1,825 | |
| Other expenses | | | 2,493 | |
| TOTAL EXPENSES | | | 617,263 | |
| | | | | |
| Less: Fees waived by the adviser | | | (167,676 | ) |
| NET EXPENSES | | | 449,587 | |
| | | | | |
| NET INVESTMENT LOSS | | | (255,403 | ) |
| | | | | |
| REALIZED AND UNREALIZED GAIN FROM INVESTMENTS | | | | |
| Net realized gain from: | | | | |
| Investments and foreign currency transactions | | | 3,450,245 | |
| Net change in unrealized appreciation on: | | | | |
| Investments | | | 7,137,919 | |
| | | | | |
| NET REALIZED AND UNREALIZED GAIN FROM INVESTMENTS | | | 10,588,164 | |
| | | | | |
| NET INCREASE IN NET ASSETS RESULTING FROM OPERATIONS | | $ | 10,332,761 | |
See accompanying notes to financial statements.
| JAG Large Cap Growth Fund |
| STATEMENTS OF CHANGES IN NET ASSETS |
| | | For the | | | For the | |
| | | Year Ended | | | Year Ended | |
| | | September 30, 2023 | | | September 30, 2022 | |
| FROM OPERATIONS | | | | | | | | |
| Net investment loss | | $ | (255,403 | ) | | $ | (391,997 | ) |
| Net realized gain from investments and foreign currency transactions | | | 3,450,245 | | | | 1,973,866 | |
| Net change in unrealized appreciation (depreciation) on investments and foreign currency transactions | | | 7,137,919 | | | | (19,466,673 | ) |
| Net increase (decrease) in net assets resulting from operations | | | 10,332,761 | | | | (17,884,804 | ) |
| | | | | | | | | |
| DISTRIBUTIONS TO SHAREHOLDERS | | | | | | | | |
| Total Distributions Paid | | | | | | | | |
| Class A | | | (1,314 | ) | | | (38,585 | ) |
| Class I | | | (297,752 | ) | | | (9,514,267 | ) |
| Class R | | | (311,161 | ) | | | (2,206,301 | ) |
| Net decrease in net assets from distributions to shareholders | | | (610,227 | ) | | | (11,759,153 | ) |
| | | | | | | | | |
| FROM SHARES OF BENEFICIAL INTEREST | | | | | | | | |
| Proceeds from shares sold: | | | | | | | | |
| Class A | | | 47,410 | | | | 58,655 | |
| Class I | | | 412,190 | | | | 2,637,085 | |
| Class R | | | 15,960,213 | | | | 2,552,821 | |
| Net asset value of shares issued in reinvestment of distributions: | | | | | | | | |
| Class A | | | 1,314 | | | | 38,585 | |
| Class I | | | 223,481 | | | | 4,606,116 | |
| Class R | | | 163,478 | | | | 2,206,301 | |
| Payments for shares redeemed: | | | | | | | | |
| Class A | | | (112,009 | ) | | | (33,831 | ) |
| Class I | | | (18,331,879 | ) | | | (11,173,944 | ) |
| Class R | | | (9,192,812 | ) | | | (1,764,086 | ) |
| Net decrease in net assets from shares of beneficial interest | | | (10,828,614 | ) | | | (872,298 | ) |
| | | | | | | | | |
| TOTAL DECREASE IN NET ASSETS | | | (1,106,080 | ) | | | (30,516,255 | ) |
| | | | | | | | | |
| NET ASSETS | | | | | | | | |
| Beginning of Year | | | 39,866,391 | | | | 70,382,646 | |
| End of Year | | $ | 38,760,311 | | | $ | 39,866,391 | |
See accompanying notes to financial statements.
| JAG Large Cap Growth Fund |
| STATEMENTS OF CHANGES IN NET ASSETS (Continued) |
| | | For the | | | For the | |
| | | Year Ended | | | Year Ended | |
| | | September 30, 2023 | | | September 30, 2022 | |
| SHARE ACTIVITY | | | | | | | | |
| Class A: | | | | | | | | |
| Shares Sold | | | 2,938 | | | | 3,373 | |
| Shares Reinvested | | | 97 | | | | 2,014 | |
| Shares Redeemed | | | (8,124 | ) | | | (2,010 | ) |
| Net increase (decrease) in shares of beneficial interest outstanding | | | (5,089 | ) | | | 3,377 | |
| | | | | | | | | |
| Class I: | | | | | | | | |
| Shares Sold | | | 28,375 | | | | 146,984 | |
| Shares Reinvested | | | 15,694 | | | | 229,617 | |
| Shares Redeemed | | | (1,230,479 | ) | | | (663,620 | ) |
| Net decrease in shares of beneficial interest outstanding | | | (1,186,410 | ) | | | (287,019 | ) |
| | | | | | | | | |
| Class R: | | | | | | | | |
| Shares Sold | | | 1,097,352 | | | | 154,537 | |
| Shares Reinvested | | | 11,345 | | | | 109,115 | |
| Shares Redeemed | | | (558,444 | ) | | | (89,892 | ) |
| Net increase in shares of beneficial interest outstanding | | | 550,253 | | | | 173,760 | |
See accompanying notes to financial statements.
| JAG Large Cap Growth Fund |
| FINANCIAL HIGHLIGHTS |
Per Share Data and Ratios for a Share of Beneficial Interest Outstanding Throughout each Year Presented
| | | Class A | |
| | | Year Ended | | | Year Ended | | | Year Ended | | | Year Ended | | | Year Ended | |
| | | September 30, | | | September 30, | | | September 30, | | | September 30, | | | September 30, | |
| | | 2023 | | | 2022 | | | 2021 | | | 2020 | | | 2019 | |
| Net asset value, beginning of year | | $ | 13.14 | | | $ | 22.62 | | | $ | 20.73 | | | $ | 17.17 | | | $ | 20.94 | |
| Income (loss) from investment operations: | | | | | | | | | | | | | | | | | | | | |
| Net investment loss (1) | | | (0.16 | ) | | | (0.17 | ) | | | (0.23 | ) | | | (0.16 | ) | | | (0.08 | ) (6) |
| Net realized and unrealized gain (loss) on investments | | | 3.53 | | | | (5.29 | ) | | | 4.90 | | | | 5.24 | | | | (1.44 | ) |
| Total from investment operations | | | 3.37 | | | | (5.46 | ) | | | 4.67 | | | | 5.08 | | | | (1.52 | ) |
| Less distributions from: | | | | | | | | | | | | | | | | | | | | |
| Net realized gains | | | (0.22 | ) | | | (4.02 | ) | | | (2.78 | ) | | | (1.52 | ) | | | (2.25 | ) |
| Total distributions | | | (0.22 | ) | | | (4.02 | ) | | | (2.78 | ) | | | (1.52 | ) | | | (2.25 | ) |
| Net asset value, end of year | | $ | 16.29 | | | $ | 13.14 | | | $ | 22.62 | | | $ | 20.73 | | | $ | 17.17 | |
| Total return (2) | | | 25.98 | % | | | (29.72 | )% | | | 23.97 | % | | | 31.81 | % | | | (5.74 | )% |
| Net assets, at end of year (000s) | | $ | 132 | | | $ | 173 | | | $ | 222 | | | $ | 2,206 | | | $ | 2,553 | |
| Ratio of gross expenses to average net assets (3)(4)(7) | | | 1.73 | % | | | 1.61 | % | | | 1.59 | % | | | 1.67 | % | | | 1.73 | % |
| Ratio of net expenses to average net assets (4)(7) | | | 1.51 | % | | | 1.51 | % | | | 1.51 | % | | | 1.51 | % | | | 1.50 | % |
| Ratio of net investment loss to average net assets (4)(5)(7) | | | (1.06 | )% | | | (1.04 | )% | | | (1.13 | )% | | | (0.91 | )% | | | (0.48 | )% |
| Portfolio Turnover Rate | | | 73 | % | | | 78 | % | | | 72 | % | | | 113 | % | | | 129 | % |
| (1) | Per share amounts calculated using the average shares method, which more appropriately presents the per share data for the year. |
| (2) | Total return in the above table is historical in nature and represents the rate that the investor would have earned or lost on an investment in the Fund assuming reinvestment of dividends and capital gains distributions, if any, and does not reflect the impact of sales charges. Had the adviser not waived a portion of the Fund’s expenses, total returns would have been lower. |
| (3) | Represents the ratio of expenses to average net assets absent fee waivers and/or expense reimbursements by the adviser. |
| (4) | The ratios of expenses to average net assets and net investment loss to average net assets do not reflect the expenses of the underlying investment companies in which the Fund invests. |
| (5) | Recognition of net investment loss is affected by the timing and declaration of dividends by the underlying investment companies in which the Fund invests. |
| (6) | As required by SEC standard per share data calculation methodology, this represents a balancing figure derived from the other amounts in the financial highlights tables that captures all other changes affecting net asset value per share. This per share gain amount does not correlate to the aggregate of the net realized and unrealized gain (loss) in the Statement of Operations for the year ended September 30, 2019, primarily due to the timing of sales and repurchases of the Fund’s shares in relation to fluctuating market values of the Fund’s portfolio. |
| (7) | Excluding interest expense, the following ratios would have been: |
| | | September 30, | | September 30, | | September 30, | | September 30, | | September 30, |
| | | 2023 | | 2022 | | 2021 | | 2020 | | 2019 |
| Gross expenses to average net assets | | 1.72% | | 1.60% | | 1.58% | | 1.66% | | 1.74% |
| Net expenses to average net assets | | 1.50% | | 1.50% | | 1.50% | | 1.50% | | 1.50% |
| Net investment loss to average net assets | | (1.05)% | | (1.03)% | | (1.12)% | | (0.90)% | | (0.48)% |
See accompanying notes to financial statements.
| JAG Large Cap Growth Fund |
| FINANCIAL HIGHLIGHTS |
Per Share Data and Ratios for a Share of Beneficial Interest Outstanding Throughout each Year Presented
| | | Class I | |
| | | Year Ended | | | Year Ended | | | Year Ended | | | Year Ended | | | Year Ended | |
| | | September 30, | | | September 30, | | | September 30, | | | September 30, | | | September 30, | |
| | | 2023 | | | 2022 | | | 2021 | | | 2020 | | | 2019 | |
| Net asset value, beginning of year | | $ | 13.79 | | | $ | 23.49 | | | $ | 21.38 | | | $ | 17.62 | | | $ | 21.37 | |
| Income (loss) from investment operations: | | | | | | | | | | | | | | | | | | | | |
| Net investment loss (1) | | | (0.13 | ) | | | (0.14 | ) | | | (0.20 | ) | | | (0.12 | ) | | | (0.04 | ) |
| Net realized and unrealized gain (loss) on investments | | | 3.70 | | | | (5.54 | ) | | | 5.09 | | | | 5.40 | | | | (1.46 | ) |
| Total from investment operations | | | 3.57 | | | | (5.68 | ) | | | 4.89 | | | | 5.28 | | | | (1.50 | ) |
| Less distributions from: | | | | | | | | | | | | | | | | | | | | |
| Net realized gains | | | (0.22 | ) | | | (4.02 | ) | | | (2.78 | ) | | | (1.52 | ) | | | (2.25 | ) |
| Total distributions | | | (0.22 | ) | | | (4.02 | ) | | | (2.78 | ) | | | (1.52 | ) | | | (2.25 | ) |
| Net asset value, end of year | | $ | 17.14 | | | $ | 13.79 | | | $ | 23.49 | | | $ | 21.38 | | | $ | 17.62 | |
| Total return (2) | | | 26.21 | % | | | (29.52 | )% | | | 24.30 | % | | | 32.15 | % | | | (5.51 | )% |
| Net assets, at end of year (000s) | | $ | 16,023 | | | $ | 29,248 | | | $ | 56,561 | | | $ | 50,990 | | | $ | 59,517 | |
| Ratio of gross expenses to average net assets (3)(4)(6) | | | 1.48 | % | | | 1.36 | % | | | 1.34 | % | | | 1.42 | % | | | 1.48 | % |
| Ratio of net expenses to average net assets (4)(6) | | | 1.26 | % | | | 1.26 | % | | | 1.26 | % | | | 1.26 | % | | | 1.25 | % |
| Ratio of net investment loss to average net assets (4)(5)(6) | | | (0.81 | )% | | | (0.79 | )% | | | (0.88 | )% | | | (0.66 | )% | | | (0.20 | )% |
| Portfolio Turnover Rate | | | 73 | % | | | 78 | % | | | 72 | % | | | 113 | % | | | 129 | % |
| (1) | Per share amounts calculated using the average shares method, which more appropriately presents the per share data for the year. |
| (2) | Total return in the above table is historical in nature and represents the rate that the investor would have earned or lost on an investment in the Fund assuming reinvestment of dividends and capital gains distributions, if any, and does not reflect the impact of sales charges. Had the adviser not waived a portion of the Fund’s expenses, total returns would have been lower. |
| (3) | Represents the ratio of expenses to average net assets absent fee waivers and/or expense reimbursements by the adviser. |
| (4) | The ratios of expenses to average net assets and net investment loss to average net assets do not reflect the expenses of the underlying investment companies in which the Fund invests. |
| (5) | Recognition of net investment loss is affected by the timing and declaration of dividends by the underlying investment companies in which the Fund invests. |
| (6) | Excluding interest expense, the following ratios would have been: |
| | | September 30, | | September 30, | | September 30, | | September 30, | | September 30, |
| | | 2023 | | 2022 | | 2021 | | 2020 | | 2019 |
| Gross expenses to average net assets | | 1.47% | | 1.35% | | 1.33% | | 1.41% | | 1.49% |
| Net expenses to average net assets | | 1.25% | | 1.25% | | 1.25% | | 1.25% | | 1.25% |
| Net investment loss to average net assets | | (0.80)% | | (0.78)% | | (0.87)% | | (0.65)% | | (0.20)% |
See accompanying notes to financial statements.
| JAG Large Cap Growth Fund |
| FINANCIAL HIGHLIGHTS |
Per Share Data and Ratios for a Share of Beneficial Interest Outstanding Throughout each Year/Period Presented
| | | Class R | |
| | | Year Ended | | | Year Ended | | | Year Ended | | | Period Ended | |
| | | September 30, | | | September 30, | | | September 30, | | | September 30, | |
| | | 2023 | | | 2022 | | | 2021 | | | 2020 (1) | |
| Net asset value, beginning of year/period | | $ | 13.94 | | | $ | 23.63 | | | $ | 21.43 | | | $ | 17.85 | |
| Income (loss) from investment operations: | | | | | | | | | | | | | | | | |
| Net investment loss (2) | | | (0.07 | ) | | | (0.08 | ) | | | (0.12 | ) | | | (0.04 | ) |
| Net realized and unrealized gain (loss) on investments | | | 3.75 | | | | (5.59 | ) | | | 5.10 | | | | 3.62 | |
| Total from investment operations | | | 3.68 | | | | (5.67 | ) | | | 4.98 | | | | 3.58 | |
| Less distributions from: | | | | | | | | | | | | | | | | |
| Net realized gains | | | (0.22 | ) | | | (4.02 | ) | | | (2.78 | ) | | | — | |
| Total distributions | | | (0.22 | ) | | | (4.02 | ) | | | (2.78 | ) | | | — | |
| Net asset value, end of year/period | | $ | 17.40 | | | $ | 13.94 | | | $ | 23.63 | | | $ | 21.43 | |
| Total return (3) | | | 26.72 | % | | | (29.27 | )% | | | 24.70 | % | | | 20.06 | % (9) |
| Net assets, at end of year/period (000s) | | $ | 22,605 | | | $ | 10,445 | | | $ | 13,599 | | | $ | 9,158 | |
| Ratio of gross expenses to average net assets (4)(5)(7) | | | 1.13 | % | | | 1.02 | % | | | 0.99 | % | | | 1.07 | % (8) |
| Ratio of net expenses to average net assets (5)(7) | | | 0.91 | % | | | 0.91 | % | | | 0.91 | % | | | 0.91 | % (8) |
| Ratio of net investment loss to average net assets (5)(6)(7) | | | (0.46 | )% | | | (0.42 | )% | | | (0.53 | )% | | | (0.31 | )% (8) |
| Portfolio Turnover Rate | | | 73 | % | | | 78 | % | | | 72 | % | | | 113 | % (9) |
| (1) | Class R shares commenced operations on February 3, 2020. |
| (2) | Per share amounts calculated using the average shares method, which more appropriately presents the per share data for the year. |
| (3) | Total return in the above table is historical in nature and represents the rate that the investor would have earned or lost on an investment in the Fund assuming reinvestment of dividends and capital gains distributions, if any, and does not reflect the impact of sales charges. Had the adviser not waived a portion of the Fund’s expenses, total returns would have been lower. |
| (4) | Represents the ratio of expenses to average net assets absent fee waivers and/or expense reimbursements by the adviser. |
| (5) | The ratios of expenses to average net assets and net investment loss to average net assets do not reflect the expenses of the underlying investment companies in which the Fund invests. |
| (6) | Recognition of net investment loss is affected by the timing and declaration of dividends by the underlying investment companies in which the Fund invests. |
| (7) | Excluding interest expense, the following ratios would have been: |
| | | September 30, | | September 30, | | September 30, | | September 30, |
| | | 2023 | | 2022 | | 2021 | | 2020 |
| Gross expenses to average net assets | | 1.12% | | 1.01% | | 0.98% | | 1.06% |
| Net expenses to average net assets | | 0.90% | | 0.90% | | 0.90% | | 0.90% |
| Net investment loss to average net assets | | (0.45)% | | (0.41)% | | (0.52)% | | (0.30)% |
See accompanying notes to financial statements.
| JAG Large Cap Growth Fund |
| NOTES TO FINANCIAL STATEMENTS |
| September 30, 2023 |
| (1) | ORGANIZATION AND SIGNIFICANT ACCOUNTING POLICIES |
Mutual Fund Series Trust (the “Trust”), was organized as an Ohio business trust on February 27, 2006. The Trust is registered as an open-end management investment company under the Investment Company Act of 1940, as amended, (“1940 Act”). The Trust currently consists of thirty-six series. These financial statements pertain to the following series: JAG Large Cap Growth Fund (the “Fund”). The Fund is a separate diversified series of the Trust. JAG Capital Management LLC (the “Adviser”), acts as adviser to the Fund.
The Fund currently offers three classes of shares: Class A, Class I and Class R shares. Each share class represents an interest in the same assets of the Fund, has the same rights and is identical in all material respects except that (i) each class of shares may bear different distribution fees; (ii) each class of shares may be subject to different (or no) sales charges; (iii) certain other class specific expenses will be borne solely by the class to which such expenses are attributable; and (iv) each class has exclusive voting rights with respect to matters relating to its own distribution arrangements. Class A and Class I shares commenced operations on December 22, 2011. Class R shares commenced operations on February 3, 2020. The Fund’s investment objective is capital appreciation.
The following is a summary of significant accounting policies consistently followed by the Fund which are in accordance with accounting principles generally accepted in the United States of America (“GAAP”). The Fund is an investment company and accordingly follows the Investment Company accounting and reporting guidance of the Financial Accounting Standards Board (“FASB”) Accounting Standards Codification Topic 946, Financial Services - Investment Companies, including FASB Accounting Standards Update (“ASU”) 2013-08.
a) Securities Valuation – Securities listed on an exchange are valued at the last reported sale price at the close of the regular trading session of the exchange on the business day the value is being determined, or in the case of securities listed on NASDAQ, at the NASDAQ Official Closing Price (“NOCP”). In the absence of a sale, such securities shall be valued at the last bid price on the day of valuation. The Fund may invest in portfolios of open-end or closed-end investment companies and exchange traded funds (the “underlying funds”). Open-end funds are valued at their respective net asset values as reported by such investment companies. The underlying funds value securities in their portfolios for which market quotations are readily available at their market values (generally the last reported sale price) and all other securities and assets at their fair value by the methods established by the boards of the underlying funds. The shares of many closed-end investment companies and exchange traded funds, after their initial public offering, frequently trade at a price per share, which is different than the net asset value per share. The difference represents a market premium or market discount of such shares. There can be no assurances that the market discount or market premium on shares of any closed-end investment company or exchange traded fund purchased by the Fund will not change. Short-term debt obligations having 60 days or less remaining until maturity, at time of purchase, may be valued at amortized cost, provided such valuations represent fair value.
In unusual circumstances, instead of valuing securities in the usual manner, the Fund may value securities at “fair value” as determined in good faith by the Board, pursuant to the procedures (the “Procedures”) approved by the Board. The Board has designated the adviser as its valuation designee (the “Valuation Designee”) to execute these procedures. The Procedures consider, among others, the following factors to determine a security’s fair value: the nature and pricing history (if any) of the security; whether any dealer quotations for the security are available; and possible valuation methodologies that could be used to determine the fair value of the security. Fair value may also be used by the Board if extraordinary events occur after the close of the relevant world market but prior to the New York Stock Exchange close. The Board may also enlist third party consultants such a valuation specialist at a public accounting firm, valuation consultant or financial officer of a security issuer on an as-needed basis to assist the Valuation Designee in determining a security-specific fair value. The Board is responsible for reviewing and approving fair value methodologies utilized by the Valuation Designee, approval of which shall be based upon whether the Valuation Designee followed the Procedures.
| JAG Large Cap Growth Fund |
| NOTES TO FINANCIAL STATEMENTS (Continued) |
| September 30, 2023 |
The Fund utilizes various methods to measure the fair value of its investments on a recurring basis. GAAP establishes a hierarchy that prioritizes inputs to valuation methods. The three levels of input are:
Level 1 – Unadjusted quoted prices in active markets for identical assets and liabilities that the Fund has the ability to access.
Level 2 – Observable inputs other than quoted prices included in Level 1 that are observable for the asset or liability, either directly or indirectly. These inputs may include quoted prices for the identical instrument in an inactive market, prices for similar instruments, interest rates, prepayment speeds, credit risk, yield curves, default rates and similar data.
Level 3 – Unobservable inputs for the asset or liability, to the extent relevant observable inputs are not available, representing the Fund’s own assumptions about the assumptions a market participant would use in valuing the asset or liability, and would be based on the best information available.
The availability of observable inputs can vary from security to security and is affected by a wide variety of factors, including, for example, the type of security, whether the security is new and not yet established in the marketplace, the liquidity of markets, and other characteristics particular to the security. To the extent that valuation is based on models or inputs that are less observable or unobservable in the market, the determination of fair value requires more judgment. Accordingly, the degree of judgment exercised in determining fair value is greatest for instruments categorized in Level 3.
The inputs used to measure fair value may fall into different levels of the fair value hierarchy. In such cases, for disclosure purposes, the level in the fair value hierarchy within which the fair value measurement falls in its entirety, is determined based on the lowest level input that is significant to the fair value measurement in its entirety.
The inputs or methodology used for valuing securities are not necessarily an indication of the risk associated with investing in those securities. The following table summarizes the inputs used as of September 30, 2023, for the Fund’s assets and liabilities measured at fair value:
| Assets | | | | | | | | | | | | |
| | | | | | | | | | | | | |
| Security | | | | | | | | | | | | |
| Classifications (a) | | Level 1 | | | Level 2 | | | Level 3 | | | Totals | |
| Common Stocks | | $ | 38,312,442 | | | $ | — | | | $ | — | | | $ | 38,312,442 | |
| Short-Term Investment | | | 285,409 | | | | — | | | | — | | | | 285,409 | |
| Total | | $ | 38,597,851 | | | $ | — | | | $ | — | | | $ | 38,597,851 | |
| (a) | As of and during the year ended September 30, 2023, the Fund held no securities that were considered to be “Level 3” securities. Therefore, a reconciliation of assets in which significant unobservable inputs (Level 3) were used in determining fair value is not applicable. |
b) Federal Income Tax – The Fund has qualified and intends to continue to qualify as a regulated investment company and to comply with the applicable provisions of the Internal Revenue Code of 1986, as amended, and to distribute substantially all of its taxable income to its shareholders. Therefore, no federal income or excise tax provisions are required.
As of and during the year ended September 30, 2023, the Fund did not have a liability for any unrecognized tax expense. The Fund recognizes interest and penalties, if any, related to unrecognized tax expense as income tax expense in the Statement of Operations. As of September 30, 2023, the Fund did not incur any interest or penalties. Management has analyzed the Fund’s tax positions and has concluded that no liability for unrecognized tax benefits should be recorded related to uncertain tax positions taken on returns filed for open tax years ended September 30, 2020 – September 30, 2022 or expected to be taken in the Fund’s September 30, 2023 tax returns. The tax filings are open for examination by applicable taxing authorities, U.S. federal, Ohio, and foreign jurisdictions. No examination of the Fund’s tax returns is presently in progress.
| JAG Large Cap Growth Fund |
| NOTES TO FINANCIAL STATEMENTS (Continued) |
| September 30, 2023 |
c) Distribution to Shareholders – Distributions of net investment income and capital gains to shareholders, which are determined in accordance with income tax regulations and may differ from GAAP, are recorded on the ex-dividend date and distributed on an annual basis.
d) Multiple Class Allocations – Income, non-class specific expenses and realized/unrealized gains or losses are allocated to each class based on relative net assets. Distribution fees are charged to each respective share class in accordance with the distribution plan. Expenses of the Trust that are directly identifiable to a specific fund are charged to that fund. Expenses, which are not readily identifiable to a specific fund, are allocated in such a manner as deemed equitable, taking into consideration the nature and type of expense and the relative sizes of the funds in the Trust.
e) Other – Investment and shareholder transactions are recorded on the trade date. Interest income is recognized on an accrual basis. Discounts are accreted and premiums are amortized on debt securities using the effective interest method. Withholding taxes on foreign dividends have been provided for in accordance with the Fund’s understanding of the applicable country’s tax rules and rates. Dividend income is recorded on the ex-dividend date. Realized gains or losses from sales of securities are determined by comparing the identified cost of the security lot sold with the net sales proceeds.
f) Use of Estimates – The preparation of financial statements in conformity with GAAP requires management to make estimates and assumptions that affect the reported amounts of assets and liabilities and disclosure of contingent assets and liabilities at the date of the financial statements and the reported amounts of increases and decreases in net assets from operations during the reporting period. Actual results could differ from those estimates.
g) Indemnification – The Trust indemnifies its Officers and Trustees for certain liabilities that may arise from the performance of their duties to the Trust. Additionally, in the normal course of business, the Fund enters into contracts that contain a variety of representations and warranties and which provide general indemnities. The Fund’s maximum exposure under these arrangements is unknown, as this would involve future claims that may be made against the Fund that have not yet occurred. However, based on experience, the risk of loss due to these warranties and indemnities appears to be remote.
h) Sales Charges (loads) – A maximum sales charge of 5.75% is imposed on Class A shares of the Fund. Investments in Class A shares made at or above the $1 million breakpoint are not subject to an initial sales charge and may be subject to a 1% contingent deferred sales charge (“CDSC”) on shares redeemed within 18 months of purchase (excluding shares purchased with reinvested dividends and/or distributions). The respective shareholders pay such CDSC charges, which are not an expense of the Fund. For the year ended September 30, 2023, there were no CDSC fees paid.
i) Foreign Currency – Investment securities and other assets and liabilities denominated in foreign currencies are translated into U.S. dollar amounts at the date of valuation. Purchases and sales of investment securities and income and expense items denominated in foreign currencies are translated into U.S. dollar amounts on the respective dates as such transactions.
The Fund does not isolate that portion of the results of operations resulting from changes in foreign exchange rates on investments from the fluctuations arising from changes in market prices of securities held. Such fluctuations are included with the net realized and unrealized gain or loss from investments.
Reported net realized foreign exchange gains or losses arise from sales of foreign currencies, currency gains or losses realized between the trade and settlement dates on securities transactions, and the difference between the amounts of dividends, interest, and foreign withholding taxes recorded on the Fund’s books and the U.S. dollar equivalent of the amounts actually received or paid. Net unrealized foreign exchange gains and losses arise from changes in the fair values of assets and liabilities, other than investments in securities at fiscal period-end, resulting from changes in exchange rates.
j) Cash and cash equivalents – The Fund considers its investment in a Federal Deposit Insurance Corporation (“FDIC”) insured interest bearing savings account to be cash. The Fund maintains cash balances, which, at times, may exceed federally insured limits. The Fund maintains these balances with a high quality financial institution.
| JAG Large Cap Growth Fund |
| NOTES TO FINANCIAL STATEMENTS (Continued) |
| September 30, 2023 |
| (2) | INVESTMENT TRANSACTIONS |
For the year ended September 30, 2023, aggregate purchases and proceeds from sales of investment securities (excluding short-term investments) for the Fund were as follows:
| Purchases | | | Sales | |
| $ | 30,713,090 | | | $ | 41,937,909 | |
| (3) | INVESTMENT ADVISORY AGREEMENT AND TRANSACTIONS WITH RELATED PARTIES |
JAG Capital Management LLC acts as investment adviser to the Fund pursuant to the terms of an advisory agreement (the “Advisory Agreement”) with the Trust on behalf of the Fund. Under the terms of the Advisory Agreement, the Adviser manages the investment operations of the Fund in accordance with the Fund’s investment policies and restrictions. The Adviser provides the Fund with investment advice and supervision and furnishes an investment program for the Fund. For its investment management services, the Fund pays to the Adviser, as of the last day of each month, an annualized fee equal to 0.80% of average net assets, such fee to be computed daily based upon daily net assets of the Fund. The Adviser pays for all employees, office space and facilities required by it to provide services under the Advisory Agreement, with the exception of specific items of expense (as detailed in the Advisory Agreement). For the year ended September 30, 2023, the investment advisory fees of $336,195 were incurred by the Fund, before the waiver and reimbursement described below.
The Adviser and the Trust, with respect to the Fund, have entered into an expense limitation agreement under which the Adviser has contractually agreed to waive fees and/or reimburse expenses but only to the extent necessary to maintain total annual operating expenses (excluding brokerage costs; borrowing and liquidity costs such as interest and dividends on securities sold short; taxes; underlying/acquired fund expenses; and extraordinary expenses) at 1.50%, 1.25% and 0.90% for Classes A, I and R, respectively, of the Fund’s average daily net assets through January 31, 2024 (the “Expense Limitation Agreement”). Each waiver or reimbursement by the Adviser is subject to recoupment within three years after the fees have been waived or reimbursed, if such recoupment may be achieved without exceeding the lesser of the expense limitation in place at the time of waiver or reimbursement and the expense limitation in effect at that time.
For the year ended September 30, 2023, the Adviser waived advisory fees in the amount of $167,676. As of September 30, 2023, the Adviser may recapture $90,068 before September 30, 2024, $104,529 before September 30, 2025, and $167,676 before September 30, 2026, subject to the terms of the Expense Limitation Agreement.
Pursuant to the Management Services Agreement between the Trust and MFund Services LLC (‘Mfund”), MFund provides the Fund with various management and legal administrative services (the “Management Services Agreement”). For these services, the Fund pays MFund as of the last day of each month an annualized asset-based fee which scales downward based upon net assets. In addition, the Fund reimburses MFund for any reasonable out-of-pocket expenses incurred in the performance of its duties under the Management Services Agreement. The amount due to MFund for the Management Services Agreement is listed in the Statement of Assets and Liabilities under “Payable to related parties” and the amount accrued for the year is shown in the Statement of Operations under “Legal administration/management service fees.”
Pursuant to the Compliance Services Agreement, MFund provides chief compliance officer services to the Fund. For these services, the Fund pays MFund as of the last day of each month annualized base fees plus an annualized asset-based fee based upon net assets. In addition, the Fund reimburses MFund for any reasonable out- of-pocket expenses incurred in the performance of its duties under the Compliance Services Agreement. The amount due to MFund for chief compliance officer services is listed in the Statement of Assets and Liabilities under “Compliance officer fees payable” and the amount accrued for the year is shown in the Statement of Operations under “Compliance officer fees.”
| JAG Large Cap Growth Fund |
| NOTES TO FINANCIAL STATEMENTS (Continued) |
| September 30, 2023 |
A trustee is the controlling member of MFund and of AlphaCentric Advisors LLC and Catalyst Capital Advisors LLC (investments advisers to other series of the Trust) and is not paid any fees directly by the Trust for serving in such capacities. Trustees who are not “interested persons” as that term is defined in the 1940 Act, are paid a quarterly retainer and receive compensation for each special Board meeting and Risk and Compliance Committee meeting. The fees paid to the Independent Trustees for their attendance at a meeting will be shared equally by the funds of the Trust in which the meeting relates. The Lead Independent Trustee of the Trust and the Chairmen of the Trust’s Audit Committee and Risk and Compliance Committee receive an additional quarterly retainer. The “interested persons” of the Trust receive no compensation from the Fund. The Trust reimburses each Trustee and Officer for his or her travel and other expenses related to attendance at such meetings.
Northern Lights Distributors, LLC, (“Distributor”) serves as the principal underwriter and national distributor for the shares of the Fund pursuant to an Underwriting Agreement with the Trust. For the year ended September 30, 2023, the Distributor received $269 in underwriter commissions from the sale of Class A shares and Class R shares of the Fund.
Ultimus Fund Solutions, LLC (“UFS “), an affiliate of the Distributor, provides administrative, fund accounting, and transfer agency services to the Fund pursuant to agreements with the Trust, for which it receives from the Fund: (i) basis points in decreasing amounts as assets reach certain breakpoints; and (ii) any related out-of-pocket expenses.
Blu Giant, LLC (“Blu Giant” ) – Blu Giant, an affiliate of the Distributor and UFS, provides EDGAR conversion and filing services as well as print management services for the Funds on an ad-hoc basis. For the provision of these services, Blu Giant receives customary fees from the Funds.
The Trust has adopted a Distribution Plan pursuant to Rule 12b-1(the “Plan”), under the 1940 Act for Class A shares and Class R shares that allows the Fund to pay distribution and shareholder servicing expenses of up to 0.50% per annum for the Class A shares and Class R shares, based on average daily net assets of each class. Class A shares and Class R shares are currently paying 0.25% and 0.00% per annum of 12b-1 fees, respectively. The Trust has not adopted a plan for Class I. The fee may be used for a variety of purposes, including compensating dealers and other financial service organizations for eligible services provided by those parties to the Fund and its shareholders and to reimburse the Distributor and the Adviser for distribution related expenses.
| (4) | TAX COMPONENTS OF CAPITAL |
The Statement of Assets and Liabilities represents cost for financial reporting purposes. Aggregate cost for federal tax purposes is $31,339,979 for the Fund and differs from fair value by net unrealized appreciation (depreciation) of securities as follows:
| Unrealized appreciation: | | $ | 7.725,403 | |
| Unrealized depreciation: | | | (467,531 | ) |
| Net unrealized appreciation: | | $ | 7,257,872 | |
The tax character of fund distributions paid for the year ended September 30, 2023 and September 30, 2022 was as follows:
| | | Fiscal Year Ended | | | Fiscal Year Ended | |
| | | September 30, 2023 | | | September 30, 2022 | |
| Ordinary Income | | $ | — | | | $ | 3,019,609 | |
| Long-Term Capital Gain | | | 610,227 | | | | 8,739,544 | |
| Return of Capital | | | — | | | | — | |
| | | $ | 610,227 | | | $ | 11,759,153 | |
| JAG Large Cap Growth Fund |
| NOTES TO FINANCIAL STATEMENTS (Continued) |
| September 30, 2023 |
As of September 30, 2023, the components of accumulated earnings on a tax basis were as follows:
| Undistributed | | | Undistributed | | | Post October Loss | | | Capital Loss | | | Other | | | Unrealized | | | Total | |
| Ordinary | | | Long-Term | | | and | | | Carry | | | Book/Tax | | | Appreciation/ | | | Distributable Earnings | |
| Income | | | Gains | | | Late Year Loss | | | Forwards | | | Differences | | | (Depreciation) | | | /(Accumulated Deficit) | |
| $ | 14,014 | | | $ | 3,100,789 | | | $ | — | | | $ | — | | | $ | — | | | $ | 7,257,872 | | | $ | 10,372,675 | |
The difference between book basis and tax basis undistributed net investment income, accumulated net realized gain, and unrealized appreciation from investments is primarily attributable to attributable to the tax deferral of losses on wash sales.
The beneficial ownership either directly or indirectly, of more than 25% of voting securities of a fund creates a presumption of control of the fund, under Section 2(a)(9) of the 1940 Act. As of September 30, 2023 the shareholders listed below held more than 25% of the Fund and may be deemed to control the Fund.
| Owner | | |
| National Financial Services LLC (1) | | 39% |
| Pershing LLC (1) | | 38% |
| (1) | These owners are comprised of multiple investors and accounts. |
Sector exposure risk is the possibility that securities within the same sector will decline in price due to sector-specific market or economic developments. If the Fund invests more heavily in a particular sector, the value of its shares may be especially sensitive to factors and economic risks that specifically affect that sector. As a result, the Fund’s share price may fluctuate more widely than the value of shares of a mutual fund that invests in a broader range of sectors. Additionally, some sectors could be subject to greater government regulation than other sectors. Therefore, changes in regulatory policies for those sectors may have a material effect on the value of securities issued by companies in those sectors.
| (7) | RECENT REGULATORY UPDATES |
On January 24, 2023, the SEC adopted rule and form amendments to require mutual funds and ETFs to transmit concise and visually engaging streamlined annual and semiannual reports to shareholders that highlight key information. Other information, including financial statements, will not appear in a streamlined shareholder report but must be available online, delivered free of charge upon request, and filed on a semiannual basis on Form N-CSR. The rule and form amendments have a compliance date of July 24, 2024. At this time, management is evaluating the impact of these amendments on the shareholder reports for the Fund.
Subsequent events occurring after the date of the Statement of Assets and Liabilities have been evaluated through the date the financial statements were issued. Management has determined that no events or transactions occurred requiring adjustment or disclosure in the financial statements.

REPORT OF INDEPENDENT REGISTERED PUBLIC ACCOUNTING FIRM
To the Shareholders of JAG Large Cap Growth Fund and
Board of Trustees of Mutual Fund Series Trust
Opinion on the Financial Statements
We have audited the accompanying statement of assets and liabilities, including the schedule of investments, of JAG Large Cap Growth Fund (the “Fund”), a series of Mutual Fund Series Trust, as of September 30, 2023, the related statement of operations for the year then ended, the statements of changes in net assets for each of the two years in the period then ended, the related notes, and the financial highlights for each of the five years in the period then ended (collectively referred to as the “financial statements”). In our opinion, the financial statements present fairly, in all material respects, the financial position of the Fund as of September 30, 2023, the results of its operations for the year then ended, the changes in net assets for each of the two years in the period then ended, and the financial highlights for each of the five years in the period then ended, in conformity with accounting principles generally accepted in the United States of America.
Basis for Opinion
These financial statements are the responsibility of the Fund’s management. Our responsibility is to express an opinion on the Fund’s financial statements based on our audits. We are a public accounting firm registered with the Public Company Accounting Oversight Board (United States) (“PCAOB”) and are required to be independent with respect to the Fund in accordance with the U.S. federal securities laws and the applicable rules and regulations of the Securities and Exchange Commission and the PCAOB.
We conducted our audits in accordance with the standards of the PCAOB. Those standards require that we plan and perform the audit to obtain reasonable assurance about whether the financial statements are free of material misstatement whether due to error or fraud.
Our audits included performing procedures to assess the risks of material misstatement of the financial statements, whether due to error or fraud, and performing procedures that respond to those risks. Such procedures included examining, on a test basis, evidence regarding the amounts and disclosures in the financial statements. Our procedures included confirmation of securities owned as of September 30, 2023, by correspondence with the custodian. Our audits also included evaluating the accounting principles used and significant estimates made by management, as well as evaluating the overall presentation of the financial statements. We believe that our audits provide a reasonable basis for our opinion.
We have served as the Fund’s auditor since 2018.

COHEN & COMPANY, LTD.
Cleveland, Ohio
November 29, 2023
COHEN & COMPANY, LTD.
800.229.1099 | 866.818.4538 fax | cohencpa.com
Registered with the Public Company Accounting Oversight Board
| JAG Large Cap Growth Fund |
| EXPENSE EXAMPLE (Unaudited) |
| September 30, 2023 |
As a shareholder of the Fund, you incur two types of costs: (1) transaction costs, including sales charges (loads) on purchases of Class A shares; (2) ongoing costs, including management fees; distribution and/or service (12b-1) fees; and other Fund expenses. This example is intended to help you understand your ongoing costs (in dollars) of investing in the Fund and to compare these costs with the ongoing costs of investing in other mutual funds.
The example is based on an investment of $1,000 invested at the beginning of the period and held for the entire period from April 1, 2023 through September 30, 2023.
Actual Expenses
The “Actual” table below provides information about actual account values and actual expenses. You may use the information below together with the amount you invested, to estimate the expenses that you paid over the period. Simply divide your account value by $1,000 (for example, an $8,600 account value divided by $1,000 = 8.6), then multiply the result by the number in the table under the heading entitled “Expenses Paid During Period” to estimate the expenses you paid on your account during this period.
Hypothetical Example for Comparison Purposes
The “Hypothetical” table below provides information about hypothetical account values and hypothetical expenses based on the Fund’s actual expense ratio and an assumed rate of return of 5% per year before expenses, which is not the Fund’s actual return. The hypothetical account values and expenses may not be used to estimate the actual ending account balances or expenses you paid for the period. You may use this information to compare this 5% hypothetical example with the 5% hypothetical examples that appear in the shareholder reports of other funds.
Please note that the expenses shown in the table are meant to highlight your ongoing costs only and do not reflect any transactional costs, such as sales charges (loads) . Therefore, the table is useful in comparing ongoing costs only, and will not help you determine the relative total costs of owning different funds. In addition, if these transactional costs were included, your costs would have been higher.
| | | Beginning | | Ending | | Expenses Paid | | Expense Ratio |
| | | Account Value | | Account Value | | During Period* | | During Period** |
| Actual | | 4/1/23 | | 9/30/23 | | 4/1/23 – 9/30/23 | | 4/1/23 – 9/30/23 |
| Class A | | $1,000.00 | | $1,108.90 | | $7.99 | | 1.51% |
| Class I | | 1,000.00 | | 1,110.10 | | 6.67 | | 1.26% |
| Class R | | 1,000.00 | | 1,112.50 | | 4.82 | | 0.91% |
| | | | | | | | | |
| | | Beginning | | Ending | | Expenses Paid | | Expense Ratio |
| Hypothetical | | Account Value | | Account Value | | During Period* | | During Period** |
| (5% return before expenses) | | 4/1/23 | | 9/30/23 | | 4/1/23– 9/30/23 | | 4/1/23– 9/30/23 |
| Class A | | $1,000.00 | | $1,017.49 | | $7.64 | | 1.51% |
| Class I | | 1,000.00 | | 1,018.75 | | 6.38 | | 1.26% |
| Class R | | 1,000.00 | | 1,020.51 | | 4.61 | | 0.91% |
| * | Expenses are equal to the average account value over the period, multiplied by the Fund’s annualized expense ratio, multiplied by the number of days in the period (183) divided by the number of days in the fiscal year (365). |
| JAG Large Cap Growth Fund |
| ADDITIONAL INFORMATION (Unaudited) |
| September 30, 2023 |
LIQUIDITY RISK MANAGEMENT PROGRAM
The Fund has adopted and implemented a written liquidity risk management program as required by Rule 22e-4 (the “Liquidity Rule”) under the 1940 Act. The program is reasonably designed to assess and manage the Fund’s liquidity risk, taking into consideration, among other factors, the Fund’s investment strategies and the liquidity of its portfolio investments during normal and reasonably foreseeable stressed conditions; its short and long-term cash flow projections; and its cash holdings and access to other funding sources.
During the year ended September 30, 2023, the Board and the Trust’s Liquidity Risk Management Program Committee (the “Committee”) reviewed the Fund’s investments and they determined that the Fund held adequate levels of cash and highly liquid investments to meet shareholder redemption activities in accordance with applicable requirements. Accordingly, the Board and Committee concluded that (i) the Fund’s liquidity risk management program is reasonably designed to prevent violations of the Liquidity Rule and (ii) the Fund’s liquidity risk management program has been effectively implemented.
| JAG Large Cap Growth Fund |
| ADDITIONAL INFORMATION (Unaudited) (Continued) |
| September 30, 2023 |
Proxy Voting Policy and Portfolio Holdings
Reference is made to the Prospectus and the Statement of Additional Information for more detailed descriptions of the Management Agreement, Services Agreement and Distribution and/or Service (12b-1) Plan, tax aspects of the Fund and the calculation of the net asset value of shares of the Fund.
The Fund files its complete schedule of portfolio holdings with the Securities and Exchange Commission (the “Commission”) for the first and third quarters of each fiscal year as an exhibit to its reports on Form N-PORT, within sixty days after the end of the period. The Fund’s Form N-PORT is available on the Commission’s website at http://www.sec.gov.
Information regarding how the Fund voted proxies relating to portfolio securities during the twelve month period ended June 30 as well as a description of the policies and procedures that the Fund uses to determine how to vote proxies relating to portfolio securities is available without charge, upon request, by calling 1-855-552-4596; and on the Commission’s website at http://www.sec.gov.
| JAG Large Cap Growth Fund |
| TRUSTEES AND OFFICERS (Unaudited) |
| September 30, 2023 |
Independent Trustees
Name, Address
Year of Birth | Position(s) Held
with Registrant | Term and
Length
Served1 | Principal Occupation(s)
During Past 5 Years | Number of
Portfolios
Overseen in
the Fund
Complex2 | Other Directorships Held
During Past 5 Years |
Tobias Caldwell
c/o Mutual Fund
Series Trust
36 N. New York
Avenue, Huntington,
NY 11743
Year of Birth: 1967 | Lead Trustee, Chairman of the Audit Committee and Nominating Committee | Since 6/2006 | Manager of Genovese Family Enterprises LLC & affiliates, the Genovese family office, since 1999; Managing Member of Bear Properties, LLC, a real estate management firm, since 2006; Managing Member of PTL Real Estate LLC, from 2000 until 2019. | 52 | Trustee of Variable Insurance Trust since 2010; Chairman of the Board of Mutual Fund and Variable Insurance Trust since 2016; Chairman of the Board of Strategy Shares since 2016; Trustee of IDX Funds Trust since 2016; Chairman of the Board of AlphaCentric Prime Meridian Income Fund ( 2018- 2023) |
| | | | | | |
Tiberiu Weisz
c/o Mutual Fund
Series Trust
36 N. New York
Avenue, Huntington,
NY 11743
Year of Birth: 1949 | Trustee, Chairman of the Risk and Compliance Committee | Since 6/2006 | Attorney since 1982. | 36 | Trustee of Variable Insurance Trust since 2010 |
| | | | | | |
Stephen P.Lachenauer
c/o Mutual Fund
Series Trust
36 N. New York
Avenue, Huntington,
NY 11743
Year of Birth: 1967 | Trustee | Since 4/2022 | Attorney, private practice since 2010 | 52 | Trustee and Chair of the Audit and Risk and Compliance Committees since 2016, and Chair of the Investment Committee since November 2020, Mutual Fund and Variable Insurance Trust; Trustee and Chair of the Audit and Risk and Compliance Committees since 2016, and Chair of the Investment Committee since November 2020, Strategy Shares; Chairman of the Board, TCG Financial Series Trusts I-X since 2015; Trustee and Chair of the Audit and Risk and Compliance Committees (2018- 2023), and Chair of the Investment Committee (2020-2023), AlphaCentric Prime Meridian Income Fund. |
| JAG Large Cap Growth Fund |
| TRUSTEES AND OFFICERS (Unaudited) (Continued) |
| September 30, 2023 |
Interested Trustee3
Name, Address,
Year of Birth | Position(s)
Held
with
Registrant | Term and
Length
Served1 | Principal Occupation(s)
During Past 5 Years | Number of
Portfolios
Overseen
In The
Fund
Complex2 | Other Directorships Held
During Past 5 Years |
Jerry Szilagyi
53 Palmeras St.
Suite 601
San Juan, PR
00901
Year of Birth: 1962 | Chairman of the Board | Trustee since 7/2006; President 2/2012- 3/2022 | President of the Trust, 2/2012– 3/2022; President, Rational Advisors, Inc., 1/2016–present; Chief Executive Officer, Catalyst Capital Advisors LLC, 1/2006– present; Member, AlphaCentric Advisors LLC, 2/2014–present; Managing Member, MFund Distributors LLC, 10/2012– present; Managing Member, MFund Services LLC, 1/2012– present; CEO, Catalyst International Advisors LLC, 11/2019–present; CEO, Insights Media LLC, 11/2019–present; CEO, MFund Management LLC, 11/2019–present. | 36 | Variable Insurance Trust since 2010 |
| JAG Large Cap Growth Fund |
| TRUSTEES AND OFFICERS (Unaudited) (Continued) |
| September 30, 2023 |
Officers
Name, Address,
Year of Birth | Position(s)
Held
with
Registrant | Term and
Length
Served1 | Principal Occupation(s)
During Past 5 Years | Number of
Portfolios
Overseen In
The Fund
Complex2 | Other Directorships Held
During Past 5 Years |
Michael Schoonover
53 Palmeras St. Suite
601
San Juan, PR 00901
Year of Birth: 1983 | President | Since 3/2022 | Vice President of the Trust, 2018– 2022; Chief Operating Officer, Catalyst Capital Advisors LLC and Rational Advisors, Inc., 6/2017– present; Portfolio Manager, Catalyst Capital Advisors LLC 12/2013–5/2021; Portfolio Manager, Rational Advisors, Inc. 1/2016–5/2018; President, MFund Distributors LLC, 1/2020– present; COO, Catalyst International Advisors LLC, 11/2019–present; COO, Insights Media LLC, 11/2019–present; COO, MFund Management LLC, 11/2019–present; COO, AlphaCentric Advisors LLC, since 1/2021. | N/A | N/A |
| | | | | | |
Alex Merino
53 Palmeras St. Suite
601
San Juan, PR 00901
Year of Birth: 1985 | Vice President | Since 3/2022 | Investment Operations Manager, MFund Management LLC, 1/2022– present; Investment Operations Analyst, MFund Management LLC, 9/2020–12/2021; Tax Senior Associate, PwC Asset & Wealth Management NY Metro, 7/2016– 6/2019. | N/A | N/A |
| | | | | | |
Erik Naviloff
4221 North 203rd
Street, Suite 100,
Elkhorn, Nebraska,
68022
Year of Birth: 1968 | Treasurer | Since 4/2012 | Vice President – Fund Administration, Ultimus Fund Solutions, LLC, since 2011. | N/A | N/A |
| | | | | | |
Brian Curley
4221 North 203rd
Street, Suite 100,
Elkhorn, Nebraska,
68022
Year of Birth: 1970 | Assistant Treasurer | Since 11/2013 | Vice President – Fund Administration, Ultimus Fund Solutions, LLC since 1/2015. | N/A | N/A |
| | | | | | |
Sam Singh
4221 North 203rd
Street, Suite 100,
Elkhorn, Nebraska,
68022
Year of Birth: 1976 | Assistant Treasurer | Since 2/2015 | Vice President – Fund Administration, Ultimus Fund Solutions, LLC since 1/2015. | N/A | N/A |
| | | | | | |
Frederick J. Schmidt
36 N. New York
Avenue
Huntington, NY
11743
Year of Birth: 1959 | Chief Compliance Officer | Since 5/2015 | Director of Compliance Services, MFund Services LLC since 5/2015. | N/A | N/A |
| | | | | | |
Jennifer A. Bailey
36 N. New York
Avenue
Huntington, NY
11743
Year of Birth: 1968 | Secretary | Since 4/2014 | Director of Legal Services, MFund Services LLC, since 2012. | N/A | N/A |
| 1. | The term of office of each Trustee is indefinite. |
| 2. | The ‘Fund Complex’ includes the Trust, Variable Insurance Trust, Mutual Fund and Variable Insurance Trust, and Strategy Shares, each a registered investment company. |
| 3. | The Trustee who is an “interested person” of the Trust as defined in the 1940 Act is an interested person by virtue of being an officer of the advisor to certain series of the Trust. |
The Fund’s SAI includes additional information about the Trustees and is available, free of charge, by calling toll-free 1-877-771-2836.
PRIVACY NOTICE
Mutual Fund Series Trust
Rev. August 2021
| FACTS | WHAT DOES MUTUAL FUND SERIES TRUST DO WITH YOUR PERSONAL INFORMATION? |
| | |
| Why? | Financial companies choose how they share your personal information. Federal law gives consumers the right to limit some, but not all sharing. Federal law also requires us to tell you how we collect, share, and protect your personal information. Please read this notice carefully to understand what we do. |
| | |
| What? | The types of personal information we collect and share depends on the product or service that you have with us. This information can include: ● Social Security number and wire transfer instructions ● account transactions and transaction history ● investment experience and purchase history When you are no longer our customer, we continue to share your information as described in this notice. |
| | |
| How? | All financial companies need to share customers’ personal information to run their everyday business. In the section below, we list the reasons financial companies can share their customers’ personal information; the reasons Mutual Fund Series Trust chooses to share; and whether you can limit this sharing. |
Reasons we can share your
personal information: | Does Mutual Fund Series
Trust share information? | Can you limit this
sharing? |
For our everyday business purposes - such as to process your transactions, maintain your account(s), respond to court orders and legal investigations, or report to credit bureaus. | YES | NO |
For our marketing purposes - to offer our products and services to you. | NO | We don’t share |
| For joint marketing with other financial companies. | NO | We don’t share |
For our affiliates’ everyday business purposes - information about your transactions and records. | NO | We don’t share |
For our affiliates’ everyday business purposes - information about your credit worthiness. | NO | We don’t share |
| For our affiliates to market to you | NO | We don’t share |
| For non-affiliates to market to you | NO | We don’t share |
PRIVACY NOTICE
Mutual Fund Series Trust
| What we do: |
| How does Mutual Fund Series Trust protect my personal information? | To protect your personal information from unauthorized access and use, we use security measures that comply with federal law. These measures include computer safeguards and secured files and buildings. Our service providers are held accountable for adhering to strict policies and procedures to prevent any misuse of your nonpublic personal information. |
| How does Mutual Fund Series Trust collect my personal information? | We collect your personal information, for example, when you: ● open an account or deposit money ● direct us to buy securities or direct us to sell your securities ● seek advice about your investments We also collect your personal information from others, such as credit bureaus, affiliates, or other companies. |
| Why can’t I limit all sharing? | Federal law gives you the right to limit only: ● sharing for affiliates’ everyday business purposes – information about your creditworthiness. ● affiliates from using your information to market to you. ● sharing for non-affiliates to market to you. State laws and individual companies may give you additional rights to limit sharing. |
| | |
| Definitions |
| Affiliates | Companies related by common ownership or control. They can be financial and non-financial companies. ● Mutual Fund Series Trust does not share with affiliates. |
| Non-affiliates | Companies not related by common ownership or control. They can be financial and non-financial companies. ● Mutual Fund Series Trust doesn’t share with non-affiliates so they can market to you. |
| Joint marketing | A formal agreement between nonaffiliated financial companies that together market financial products or services to you. ● Mutual Fund Series Trust doesn’t jointly market. |
| | Alpha Centric | 844-223-8637 |
| | Catalyst | 866-447-4228 |
| QUESTIONS? | Day Hagan | 877-329-4246 |
| CALL | Empiric | 888-839-7424 |
| | Eventide | 877-771-3836 |
| | JAG | 855-552-4596 |
| |
| |
| |
| |
| Mutual Fund Series Trust |
| 4221 North 203rd Street, Suite 100 |
| Elkhorn, NE 68022 |
| |
| Adviser |
| JAG Capital Management LLC |
| 9841 Clayton Road |
| St. Louis, MO 63124 |
| |
| ADMINISTRATOR |
| Ultimus Fund Solutions, LLC |
| 225 Pictoria Drive, Suite 450 |
| Cincinnati, OH 45246 |
| |
| TRANSFER AGENT |
| Ultimus Fund Solutions, LLC |
| 225 Pictoria Drive, Suite 450 |
| Cincinnati, OH 45246 |
| |
| DISTRIBUTOR |
| Northern Lights Distributors, LLC |
| 4221 North 203rd Street, Suite 100 |
| Elkhorn, NE 68022 |
| |
| INDEPENDENT REGISTERED PUBLIC ACCOUNTING FIRM |
| Cohen & Company, Ltd. |
| 1350 Euclid Ave., |
| Suite 800 |
| Cleveland, OH 44115 |
| |
| LEGAL COUNSEL |
| Thompson Hine LLP |
| 41 South High Street |
| Suite 1700 |
| Columbus, OH 43215 |
| |
| CUSTODIAN BANK |
| U.S. Bank |
| 1555 N. Rivercenter Dr. |
| Milwaukee, WI 53212 |
| |
| |
| |
| |
| |
| |
| |
| |
| |
| |
| JAG-AR23 |
| |
(b) Not applicable
ITEM 2. CODE OF ETHICS.
| (a) | The registrant has, as of the end of the period covered by this report, adopted a code of ethics that applies to the registrant's principal executive officer, principal financial officer, and principal accounting officer or controller, or persons performing similar functions, regardless of whether these individuals are employed by the registrant or a third party. |
| (b) | During the period covered by this report, there were no amendments to any provision of the code of ethics. |
| (c) | During the period covered by this report, there were no waivers or implicit waivers of a provision of the code of ethics. |
ITEM 3. AUDIT COMMITTEE FINANCIAL EXPERT.
| | The registrant’s Board of Trustees has determined that it does not have an audit committee financial expert serving on its audit committee. At this time, the registrant believes that the experience provided by each member of the audit committee together offer the registrant adequate oversight for the registrant’s level of financial complexity. |
ITEM 4. PRINCIPAL ACCOUNTANT FEES AND SERVICES.
| (a) | Audit Fees. The aggregate fees billed for each of the last two fiscal years for professional services rendered by the registrant's principal accountant for the audit of the registrant's annual financial statements or services that are normally provided by the accountant in connection with statutory and regulatory filings or engagements for those fiscal years are as follows: |
| Trust Series | 2023 | 2022 |
| JAG Large Cap Growth Fund | 12,000 | 11,000 |
| | | | |
| (b) | Audit-Related Fees. There were no fees billed in each of the last two fiscal years for assurances and related services by the principal accountant that are reasonably related to the performance of the audit of the registrant’s financial statements and are not reported under paragraph (a) of this item. |
| (c) | Tax Fees. The aggregate fees billed in each of the last two fiscal years for professional services rendered by the principal accountant for tax compliance are as follows: |
| Trust Series | 2023 | 2022 |
| JAG Large Cap Growth Fund | 3,000 | 2,600 |
| (d) | All Other Fees. The aggregate fees billed in each of the last two fiscal years for products and services provided by the registrant’s principal accountant, other than the services reported in paragraphs (a) through (c) of this item were $0 and $0 for the fiscal years ended September 30, 2023 and 2022 respectively. |
| (e)(1) | The audit committee does not have pre-approval policies and procedures. Instead, the audit committee or audit committee chairman approves on a case-by-case basis each audit or non-audit service before the principal accountant is engaged by the registrant. |
| (e)(2) | There were no services described in each of paragraphs (b) through (d) of this Item that were approved by the audit committee pursuant to paragraph (c)(7)(i)(C) of Rule 2-01 of Regulation S-X. |
| (f) | Not applicable. The percentage of hours expended on the principal accountant's engagement to audit the registrant's financial statements for the most recent fiscal year that were attributed to work performed by persons other than the principal accountant's full-time, permanent employees was zero percent (0%). |
| (g) | All non-audit fees billed by the registrant's principal accountant for services rendered to the registrant for the fiscal years ended September 30, 2023 and 2022 respectively are disclosed in (b)-(d) above. There were no audit or non-audit services performed by the registrant's principal accountant for the registrant's adviser. |
| (h) | Not applicable. The registrant's audit committee has considered whether the provision of non-audit services to the registrant's investment adviser (not including any sub-adviser whose role is primarily portfolio management and is subcontracted with or overseen by another investment adviser), and any entity controlling, controlled by, or under common control with the investment adviser that provides ongoing services to the registrant, that were not pre-approved pursuant to paragraph (c)(7)(ii) of Rule 2-01 of Regulation S-X, is compatible with maintaining the principal accountant's independence. |
| (i) | Not applicable. |
| (j) | Not applicable. |
ITEM 5. AUDIT COMMITTEE OF LISTED REGISTRANTS.
Not applicable
ITEM 6. SCHEDULE OF INVESTMENT
Included in annual report to shareholders filed under item 1 of this form.
ITEM 7. DISCLOSURE OF PROXY VOTING POLICIES AND PROCEDURES FOR CLOSED-END MANAGEMENT INVESTMENT COMPANIES.
Not applicable Fund is an open-end management investment company
ITEM 8. PORTFOLIO MANAGERS OF CLOSED-END MANAGEMENT INVESTMENT COMPANIES
Not applicable Fund is an open-end management investment company
ITEM 9. PURCHASES OF EQUITY SECURITIES BY CLOSED-END MANAGEMENT INVESTMENT COMPANY AND AFFILIATED PURCHASERS.
Not applicable Fund is an open-end management investment company
ITEM 10. SUBMISSION OF MATTERS TO A VOTE OF SECURITY HOLDERS.
Not applicable at this time.
ITEM 11. CONTROLS AND PROCEDURES.
(a) The registrant's principal executive and principal financial officers, or persons performing similar functions, have concluded that the registrant's disclosure controls and procedures (as defined in Rule 30a-3(c) under the 1940 Act, are effective, as of a date within 90 days of the filing date of this report, based on the evaluation of these controls and procedures required by Rule 30a-3(b) under the 1940 Act and Rule 15d-15(b) under the Securities Exchange Act of 1934, as amended.
(b) There were no significant changes in the Registrant’s internal control over financial reporting that occurred during the period covered by this report that have materially affected, or are reasonably likely to materially affect, the Registrant’s internal control over financial reporting.
ITEM 12. Disclosure of Securities Lending Activities for Closed-End Management Investment Companies.
Not applicable Fund is an open-end management investment company
ITEM 13. EXHIBITS
(1) Code of Ethics for Principal Executive and Senior Financial Officers is attached hereto.
(2) Certifications pursuant to Section 302 of the Sarbanes-Oxley Act of 2002 are filed herewith.
(3) Certifications pursuant to Section 906 of the Sarbanes-Oxley Act of 2002 are filed herewith.
SIGNATURES
Pursuant to the requirements of the Securities Exchange Act of 1934 and the Investment Company Act of 1940, the registrant has duly caused this report to be signed on its behalf by the undersigned, thereunto duly authorized.
Mutual Fund Series Trust
| By Michael Schoonover | /s/ Michael Schoonover |
| Principal Executive Officer/President |
| Date: December 6, 2023 | |
Pursuant to the requirements of the Securities Exchange Act of 1934 and the Investment Company Act of 1940, this report has been signed below by the following person on behalf of the registrant and in the capacities and on the date indicated.
| By Michael Schoonover | /s/ Michael Schoonover ___________ |
| Principal Executive Officer/President |
| Date: December 6, 2023 | |
Pursuant to the requirements of the Securities Exchange Act of 1934 and the Investment Company Act of 1940, this report has been signed below by the following person on behalf of the registrant and in the capacities and on the date indicated.
| By Erik Naviloff | /s/ Erik Naviloff_____________ |
| Principal Financial Officer/Treasurer |
| Date: December 6, 2023 | |