united states
securities and exchange commission
washington, d.c. 20549
form n-csr
certified shareholder report of registered management
investment companies
Investment Company Act file number 811-21872
Mutual Fund Series Trust
(Exact name of registrant as specified in charter)
225 Pictoria Drive, Suite 450, Cincinnati, OH 45246
(Address of principal executive offices) (Zip code)
CT CORPORATION SYSTEM
1300 EAST NINTH STREET, CLEVELAND, OH 44114
(Name and address of agent for service)
Registrant's telephone number, including area code: 631-470-2600
Date of fiscal year end: 6/30
Date of reporting period: 6/30/2023
ITEM 1. REPORTS TO SHAREHOLDERS.

| Annual Report | June 30, 2023 |
| | |
| | |
| | Eventide Core Bond Fund Eventide Dividend Opportunities Fund Eventide Exponential Technologies Fund Eventide Gilead Fund Eventide Healthcare & Life Sciences Fund Eventide Large Cap Focus Fund Eventide Limited-Term Bond Fund Eventide Multi-Asset Income Fund |
| | |
| | |
| | |
| | |
| | |
| | |
| | |
| | |
| | |
| | |
| | |
| | |
| | |
| | |
| | |
| | |
| | |
| | |
| | |
| | |
| | Eventide Asset Management, LLC One International Place, Suite 4210 Boston, MA 02110 1-877-771-3836 |
| | |
| | |
| | |
| | |
| A N N U A L R E P O R T | June 30, 2023 |
| Annual Shareholder Letter 2023 (Unaudited) |
PREAMBLE
Both in investing and in other aspects of life, it can be easier to act virtuously when circumstances are smooth than when they are difficult or unpredictable. You often see someone’s true character in how they handle difficult times more than in how they act when things are easy. The past three years have tested the character of many investors as each quarter has been marked by a sensational headline encouraging dramatic investor behavior.
Something about our human nature seems to draw us to sensational headlines— and currently, it seems apparent that we’re especially drawn to negative sensational headlines. As humans, we long to feel something and it can be easier to create headlines that cause others to feel fearful, envious, or angry than it is to encourage them to feel hopeful, confident, or joyful.
At Eventide, we consider this in how we promote ourselves and our investing process. Our recent cultural environment has been polarized by hot takes. In our view, it’s cheap and easy to gain a following by inciting a group of people to become judgmental and angry at another group of people. It’s a way to prey on our complex desires as humans and exploit some of our ugly inclinations.
On the other hand, it’s also easy to retreat from the conversation completely and take a “to each their own” approach, even on very consequential topics. While this approach appeals to our virtuous desires for peace, it can become a crutch to not speak about injustices impacting vulnerable people.
We started Eventide with strong convictions about how we wanted to impact other people. We have a belief that businesses should be blessings to their customers, employees, suppliers, their communities, the environment, and society as a whole. Being a blessing includes valuing all human lives at any stage, promoting strong families and communities, addressing injustices to any people group, and caring for the environment.
Along with this conviction about what businesses should be doing comes a strong conviction about what they should not be doing: they shouldn’t be harming people, they shouldn’t be exploiting people’s addictions, they shouldn’t be creating products that are mainly used for the destruction of life and they shouldn’t be encouraging people through their products or messaging to pursue a path that leads to a life that isn’t flourishing.
Our impact not only comes from us doing what we believe is right and good but encouraging others to join us. This leaves us with a difficult question: Since we know that hot takes gain attention and a “to each their own” passivity keeps us out of the negative press, how do we faithfully pursue our mission in a way that appeals to the brighter side of our human nature?
In a polarized climate, marked by anger and fear, we seek to be both bold and inspiring.
Being bold involves having strong convictions based on enduring values, and being willing to voice our convictions even when they aren’t popular. Being inspiring means being deeply empathetic to those who may not agree with us and being winsome in our actions and communications with a goal of bringing people together rather than tearing them apart.
| A N N U A L R E P O R T | June 30, 2023 |
Just like a volatile market tests the character of investors—forcing them to choose between remaining faithful to their guiding virtues or abandoning them to respond to the fear or greed enticed by headlines, so it is that a polarized cultural climate tests the character of all of us engaged with our society— it forces us to choose between gaining a following with quick, easy, and angry hot-takes, completely retreating, or being faithfully bold and inspirational.
Thank you for your trust.
Robin John
Finny Kuruvilla, MD, PhD
Dolores Bamford, CFA
Anant Goel
Chris Grogan, CFA
Andrew Singer, CFA
 | To stay tuned in throughout the year to bold, inspiring stories of what your investments are doing in the world, subscribe to Eventide. |
| A N N U A L R E P O R T | June 30, 2023 |
| Fund Returns (Unaudited) | | | | | | | | |
| as of 6/30/2023 | | | | | | | | |
| Eventide Core Bond Fund | YTD | 3-month | 1-year | 3-year | 5-year | 10-year | Inception | Inception Date |
| Class I | 1.89 | -0.44 | -0.67 | — | — | — | -5.07 | 07/31/2020 |
| Class A without load | 1.78 | -0.62 | -0.90 | — | — | — | -5.31 | 07/31/2020 |
| Class A with 5.75% load | -4.12 | -6.39 | -6.55 | — | — | — | -7.21 | 07/31/2020 |
| Class C | 1.51 | -0.71 | -1.67 | — | — | — | -5.97 | 07/31/2020 |
| Class N | 1.92 | -0.49 | -0.89 | — | — | — | -5.26 | 07/31/2020 |
| Benchmark | | | | | | | | |
| Bloomberg U.S. Aggregate Bond Index | 2.09 | -0.84 | -0.94 | — | — | — | -4.56 | 07/31/2020 |
| | | | | | | | |
| Eventide Dividend Opportunities Fund | YTD | 3-month | 1-year | 3-year | 5-year | 10-year | Inception | Inception Date |
| Class I | 8.44 | 5.78 | 10.87 | 12.59 | 10.77 | — | 8.98 | 09/29/2017 |
| Class A without load | 8.39 | 5.71 | 10.68 | 12.39 | 10.55 | — | 8.73 | 09/29/2017 |
| Class A with 5.75% load | 2.14 | -0.38 | 4.31 | 10.20 | 9.24 | — | 7.61 | 09/29/2017 |
| Class C | 7.94 | 5.52 | 9.78 | 11.46 | 9.67 | — | 7.91 | 09/29/2017 |
| Class N | 8.34 | 5.73 | 10.66 | 12.37 | 10.56 | — | 8.76 | 09/29/2017 |
| Benchmarks | | | | | | | | |
| Russell Midcap Index | 9.01 | 4.76 | 14.92 | 12.50 | 8.46 | — | 8.86 | 09/29/2017 |
| Russell Midcap Value Index | 5.23 | 3.86 | 10.50 | 15.04 | 6.84 | — | 6.88 | 09/29/2017 |
| | | | | | | | | |
| Eventide Exponential Technologies Fund | YTD | 3-month | 1-year | 3-year | 5-year | 10-year | Inception | Inception Date |
| Class I | 21.77 | 9.32 | 10.12 | 7.01 | — | — | 7.01 | 06/30/2020 |
| Class A without load | 21.58 | 9.29 | 9.79 | 6.78 | — | — | 6.78 | 06/30/2020 |
| Class A with 5.75% load | 14.61 | 3.00 | 3.45 | 4.69 | — | — | 4.69 | 06/30/2020 |
| Class C | 21.28 | 9.11 | 9.01 | 6.00 | — | — | 6.00 | 06/30/2020 |
| Class N | 21.58 | 9.29 | 9.89 | 6.78 | — | — | 6.78 | 06/30/2020 |
| Benchmarks | | | | | | | | |
| S&P North American Technology Sector Index | 40.57 | 15.74 | 33.71 | 13.05 | — | — | 13.05 | 06/30/2020 |
| S&P 500 Total Return Index | 16.89 | 8.74 | 19.59 | 14.60 | — | — | 14.60 | 06/30/2020 |
| | | | | | | | | |
| Eventide Gilead Fund | YTD | 3-month | 1-year | 3-year | 5-year | 10-year | Inception | Inception Date |
| Class I | 17.56 | 8.15 | 16.00 | 5.44 | 9.83 | 12.92 | 14.08 | 02/02/2010 |
| Class A without load | 17.42 | 8.09 | 15.73 | 5.19 | 9.57 | 12.65 | 15.00 | 10/28/2009 |
| Class A with 5.75% load | 10.67 | 1.86 | 9.08 | 3.14 | 8.27 | 11.99 | 14.50 | 10/28/2009 |
| Class C | 16.98 | 7.91 | 14.87 | 4.38 | 8.73 | 11.79 | 14.12 | 10/28/2009 |
| Class N | 17.45 | 8.12 | 15.77 | 5.23 | 9.61 | 12.69 | 13.44 | 07/08/2008 |
| Benchmarks | | | | | | | | |
| Russell Midcap Growth Index | 15.94 | 6.23 | 23.13 | 7.63 | 9.71 | 11.53 | 10.46 | 07/08/2008 |
| S&P 500 Total Return Index | 16.89 | 8.74 | 19.59 | 14.60 | 12.31 | 12.86 | 10.93 | 07/08/2008 |
| A N N U A L R E P O R T | June 30, 2023 |
| Fund Returns (Unaudited) (Continued) | | | | | | | | |
| as of 6/30/2023 | | | | | | | | |
| Eventide Healthcare & Life Sciences Fund | YTD | 3-month | 1-year | 3-year | 5-year | 10-year | Inception | Inception Date |
| Class I | 13.08 | 14.90 | 39.11 | -0.39 | 6.46 | 14.61 | 16.30 | 12/27/2012 |
| Class A without load | 12.92 | 14.83 | 38.71 | -0.64 | 6.19 | 14.31 | 16.00 | 12/27/2012 |
| Class A with 5.75% load | 6.42 | 8.22 | 30.74 | -2.58 | 4.94 | 13.64 | 15.35 | 12/27/2012 |
| Class C | 12.47 | 14.62 | 37.71 | -1.39 | 5.39 | 13.46 | 15.14 | 12/27/2012 |
| Class N | 12.95 | 14.85 | 38.83 | -0.58 | 6.25 | 14.38 | 16.08 | 12/27/2012 |
| Benchmarks | | | | | | | | |
| S&P Biotechnology Select Industry Index | 0.08 | 9.61 | 12.13 | -9.33 | -2.55 | 9.26 | 10.66 | 12/27/2012 |
| S&P 500 Total Return Index | 16.89 | 8.74 | 19.59 | 14.60 | 12.31 | 12.86 | 13.66 | 12/27/2012 |
| | | | | | | | | |
| Eventide Large Cap Focus Fund | YTD | 3-month | 1-year | 3-year | 5-year | 10-year | Inception | Inception Date |
| Class I | 17.66 | 7.52 | 14.55 | — | — | — | 14.55 | 6/30/2022 |
| Class A without load | 17.40 | 7.43 | 14.26 | — | — | — | 14.26 | 6/30/2022 |
| Class A with 5.75% load | 10.69 | 1.24 | 7.69 | — | — | — | 7.69 | 6/30/2022 |
| Class C | 17.11 | 7.37 | 13.60 | — | — | — | 13.60 | 6/30/2022 |
| Class N | 17.60 | 7.52 | 14.43 | — | — | — | 14.43 | 6/30/2022 |
| Benchmarks | | | | | | | | |
| S&P Biotechnology Select Industry Index | 16.89 | 8.74 | 19.59 | — | — | — | 19.59 | 6/30/2022 |
| | | | | | | | | |
| Eventide Limited-Term Bond Fund | YTD | 3-month | 1-year | 3-year | 5-year | 10-year | Inception | Inception Date |
| Class I | 1.69 | 0.17 | 1.46 | -1.36 | 1.04 | 1.06 | 1.58 | 07/28/2010 |
| Class A without load | 1.61 | 0.11 | 1.14 | -1.60 | 0.78 | 1.18 | 1.88 | 07/28/2010 |
| Class A with 5.75% load | -4.25 | -5.61 | -4.64 | -3.52 | -0.40 | 0.58 | 1.41 | 07/28/2010 |
| Class C | 1.23 | -0.08 | 0.49 | -2.33 | — | — | 0.11 | 12/14/2018 |
| Class N | 1.63 | 0.12 | 1.29 | -1.56 | — | — | 0.91 | 12/14/2018 |
| Benchmarks | | | | | | | | |
| Bloomberg 1-5 Year Government/Credit Index | 1.19 | -0.62 | 0.19 | -1.57 | 1.15 | 1.14 | 1.30 | 07/28/2010 |
| Bloomberg U.S. Intermediate Aggregate Bond Index | 1.62 | -0.75 | -0.60 | -2.89 | 0.83 | 1.33 | 1.67 | 7/28/2010 |
| | | | | | | | | |
| Eventide Multi-Asset Income Fund | YTD | 3-month | 1-year | 3-year | 5-year | 10-year | Inception | Inception Date |
| Class I | 5.06 | 2.62 | 5.57 | 6.71 | 6.83 | — | 6.27 | 07/15/2015 |
| Class A without load | 4.92 | 2.47 | 5.29 | 6.50 | 6.63 | — | 6.03 | 07/15/2015 |
| Class A with 5.75% load | -1.11 | -3.39 | -0.76 | 4.43 | 5.38 | — | 5.24 | 07/15/2015 |
| Class C | 4.56 | 2.38 | 4.54 | 5.66 | 5.79 | — | 5.22 | 07/15/2015 |
| Class N | 4.95 | 2.57 | 5.35 | 6.50 | 6.63 | — | 6.06 | 07/15/2015 |
| Benchmark | | | | | | | | |
| Multi-Asset Income Blend | 5.41 | 2.07 | 7.34 | 4.92 | 5.14 | — | 5.22 | 07/15/2015 |
| Benchmark Components | | | | | | | | |
| Russell Midcap Total Return Index | 9.01 | 4.76 | 14.92 | 12.50 | 8.46 | — | 8.76 | 07/15/2015 |
| Bloomberg U.S. Intermediate Aggregate Bond Index | 1.62 | -0.75 | -0.60 | -2.89 | 0.83 | — | 0.98 | 07/15/2015 |
| A N N U A L R E P O R T | June 30, 2023 |
EXPENSES AND DISCLOSURES (UNAUDITED)
Performance is historical and does not guarantee future results. Investment return and principal value will fluctuate with changing market conditions so that when redeemed, shares may be worth more or less than their original cost. Current performance may be lower or higher than the data quoted. Investors cannot directly invest in an index, and unmanaged index returns do not reflect any fees, expenses, or sales charges. The volatility of an index may be materially different than that of the Fund, and investors should not expect the Fund to achieve the same results as a listed index. Performance data current to the most recent month-end may be obtained by calling 1-877-771-EVEN (3836).
Eventide Core Bond Fund
Expenses: Class I, Gross Expenses 0.74%, Net Expenses 0.58%; Class A, Gross Expenses 0.99%, Net Expenses 0.83%; Class C, Gross Expenses 1.74%, Net Expenses 1.58%; Class N, Gross Expenses 0.94%, Net Expenses 0.78%. The adviser has contractually agreed to waive fees and/or reimburse expenses of the Fund through 10/31/2023. The agreement may be terminated by the Fund’s Board of Trustees only on 60 days’ written notice. Class A is subject to a maximum sales charge of 5.75% and a maximum deferred sales charge of 1.00%. The Bloomberg U.S. Aggregate Bond Index is a broad based benchmark that measures the investment-grade, U.S. dollar-denominated, fixed-rate taxable bond market. This includes Treasuries, government-related and corporate securities, mortgage backed securities, asset-backed securities and collateralized mortgage-backed securities. The benchmark is not an investment product. The returns shown do not reflect the deduction of taxes that a shareholder would pay on fund distributions or on the redemption of fund shares. Because of ongoing market volatility, fund performance may be subject to substantial short-term changes.
Eventide Dividend Opportunities Fund
Expenses: Class I, Gross Expenses 0.95%, Net Expenses 0.95%; Class A, Gross Expenses 1.20%, Net Expenses 1.20%; Class C, Gross Expenses 1.95%, Net Expenses 1.95%; Class N, Gross Expenses 1.15%, Net Expenses 1.15%. The adviser has contractually agreed to waive fees and/or reimburse expenses of the Fund through 10/31/2023. The agreement may be terminated by the Fund’s Board of Trustees only on 60 days’ written notice. Class A is subject to a maximum sales charge of 5.75% and a maximum deferred sales charge of 1.00%. The Russell Midcap Index measures the performance of the mid-cap segment of the U.S. equity universe. The Russell Midcap Value Index measures the performance of the U.S. equity mid-cap value segment. Neither benchmark is an investment product. The returns shown do not reflect the deduction of taxes that a shareholder would pay on fund distributions or on the redemption of fund shares. Because of ongoing market volatility, fund performance may be subject to substantial short-term changes.
Eventide Exponential Technologies Fund
Expenses: Class I, Gross Expenses 1.43%, Net Expenses 1.43%; Class A, Gross Expenses 1.68%, Net Expenses 1.68%; Class C, Gross Expenses 2.43%, Net Expenses 2.43%; Class N, Gross Expenses 1.63%, Net Expenses 1.63%. Class A is subject to a maximum sales charge of 5.75% and a maximum deferred sales charge of 1.00%. The S&P North American Technology Sector Index represents U.S. securities classified under the GICS® information technology sector as well as the internet & direct marketing retail, interactive home entertainment, and interactive media & services sub-industries. The S&P 500 is an index created by Standard & Poor’s of American stocks with the largest market capitalization. Neither benchmark is an investment product. The returns shown do not reflect the deduction of taxes that a shareholder would pay on fund distributions or on the redemption of fund shares. Because of ongoing market volatility, fund performance may be subject to substantial short-term changes.
Eventide Gilead Fund
Total annual fund operating expenses: Class I: 1.11%; Class A: 1.36%; Class C: 2.11%; Class N: 1.31%. Class A is subject to a maximum sales charge of 5.75% and a maximum deferred sales charge of 1.00%. The Fund’s share classes have different inception dates. Class N has an inception date of 07/08/2008. Class A and Class C have an inception date of 10/28/2009. Class I has an inception date of 02/02/2010. The indices assume an inception date of 07/08/2008. The Russell Midcap Growth Index measures the performance of the U.S. equity mid-cap growth segment. The S&P 500 is an index created by Standard & Poor’s of American stocks with the largest market capitalization. Neither benchmark is an investment product. The returns shown do not reflect the deduction of taxes that a shareholder would pay on fund distributions or on the redemption of fund shares. Because of ongoing market volatility, fund performance may be subject to substantial short-term changes.
Eventide Healthcare & Life Sciences Fund
Total annual fund operating expenses: Class I: 1.31%; Class A: 1.56%; Class C: 2.31%; Class N: 1.51%. Class A is subject to a maximum sales charge of 5.75% and a maximum deferred sales charge of 1.00%. The S&P Biotechnology Select Industry Index represents the biotechnology sub-industry portion of the S&P Total Markets Index. The S&P 500 is an index created by Standard & Poor’s of American stocks with the largest market capitalization. Neither benchmark is an investment product. The returns shown do not reflect the deduction of taxes that a shareholder would pay on fund distributions or on the redemption of fund shares. Because of ongoing market volatility, fund performance may be subject to substantial short-term changes.
| A N N U A L R E P O R T | June 30, 2023 |
EXPENSES AND DISCLOSURES (UNAUDITED) (CONTINUED)
Eventide Large Cap Focus Fund
Expenses: Class I, Gross Expenses 1.21%, Net Expenses 0.94%; Class A, Gross Expenses 1.46%, Net Expenses 1.19%; Class C, Gross Expenses 2.21%, Net Expenses 1.94%; Class N, Gross Expenses 1.41%, Net Expenses 1.14%. The adviser has contractually agreed to waive fees and/or reimburse expenses of the Fund through 10/31/2023. The agreement may be terminated by the Fund’s Board of Trustees only on 60 days’ written notice. The S&P 500 is an index created by Standard & Poor’s of American stocks with the largest market capitalization. The benchmark is not an investment product. The returns shown do not reflect the deduction of taxes that a shareholder would pay on fund distributions or on the redemption of fund shares. Because of ongoing market volatility, fund performance may be subject to substantial short-term changes.
Eventide Limited-Term Bond Fund
Expenses: Class I, Gross Expenses 0.62%, Net Expenses 0.55%; Class A, Gross Expenses 0.87%, Net Expenses 0.80%; Class C, Gross Expenses 1.62%, Net Expenses 1.55%; Class N, Gross Expenses 0.82%, Net Expenses 0.75%. The adviser has contractually agreed to waive fees and/or reimburse expenses of the Fund through 10/31/2023. The agreement may only be terminated by the Fund’s Board of Trustees on 60 days’ written notice. Class A is subject to a maximum sales charge of 5.75% and a maximum deferred sales charge of 1.00%. The Fund acquired the assets and liabilities of the Epiphany FFV Strategic Income Fund (“Predecessor Fund”) on 12/14/2018. The Predecessor Fund’s Class A shares were reclassified from Class N shares on 06/01/2015 and its Class I shares were reclassified from Class C shares on 05/30/2017, and the fee structure was different. The Fund’s share classes have different inception dates. Annualized since inception returns assume the Predecessor Fund’s inception date of 07/28/2010 unless otherwise noted. The Bloomberg 1-5 Year Government/Credit Index includes investment-grade, U.S. dollar-denominated, fixed-rate treasuries, government-related and corporate securities that have a remaining maturity of greater than or equal to one year and less than five years. The Bloomberg U.S. Intermediate Aggregate Bond Index is a market capitalization-weighted index, meaning the securities in the index are weighted according to the market size of each bond type. Most U.S.-traded investment-grade bonds are represented. Municipal bonds and Treasury Inflation-Protected Securities are excluded. The index includes Treasury securities, Government agency bonds, mortgage-backed bonds, corporate bonds, and a small amount of foreign bonds traded in the U.S. Neither benchmark is an investment product. The returns shown do not reflect the deduction of taxes that a shareholder would pay on fund distributions or on the redemption of fund shares. Because of ongoing market volatility, fund performance may be subject to substantial short-term changes.
Eventide Multi-Asset Income Fund
Expenses: Class I, Gross Expenses 0.82%, Net Expenses 0.82%; Class A, Gross Expenses 1.07%, Net Expenses 1.07%; Class C, Gross Expenses 1.82%, Net Expenses 1.82%; Class N, Gross Expenses 1.02%, Net Expenses 1.02%. The adviser has contractually agreed to waive fees and/or reimburse expenses of the Fund through 10/31/2023. The agreement may be terminated by the Fund’s Board of Trustees only on 60 days’ written notice. Class A is subject to a maximum sales charge of 5.75% and a maximum deferred sales charge of 1.00%. The Multi-Asset Income Blend is a proprietary Eventide benchmark composed of 50% Russell Midcap Index and 50% Bloomberg U.S. Intermediate Aggregate Bond Index. Prior to 12/30/2022, it was composed of 50% Russell Midcap Value Index and 50% Bloomberg U.S. Intermediate Aggregate Bond Index. The benchmark’s composition was updated because the Fund’s Adviser believes it is more reflective of the Fund’s portfolio. The Russell Midcap Index measures the performance of the mid-cap segment of the U.S. equity universe. The Bloomberg U.S. Intermediate Aggregate Bond Index is a market capitalization-weighted index, meaning the securities in the index are weighted according to the market size of each bond type. Most U.S.-traded investment-grade bonds are represented. Municipal bonds and Treasury Inflation-Protected Securities are excluded. The index includes Treasury securities, Government agency bonds, mortgage-backed bonds, corporate bonds, and a small amount of foreign bonds traded in the U.S. The Russell Midcap Value Index measures the performance of the U.S. equity mid-cap value segment. Please refer to the Fund’s Prospectus for additional index details. The benchmark is not an investment product. The returns shown do not reflect the deduction of taxes that a shareholder would pay on fund distributions or on the redemption of fund shares. Because of ongoing market volatility, fund performance may be subject to substantial short-term changes.
| A N N U A L R E P O R T | June 30, 2023 |
FUND REVIEWS (UNAUDITED)
Eventide Core Bond Fund
The Eventide Core Bond Fund (Class I) posted a total return of -0.67% for the 12 months ended 06/30/2023 compared to the Bloomberg U.S. Aggregate Bond Index of -0.94%.
Interest rates experienced heightened volatility for the period as the capital markets continued to anticipate and react to Federal Open Market Committee (“FOMC”) interest rate policy action. As the FOMC began to downshift the pace of interest rates hikes and macroeconomic data began to show the deflationary effects of previous hikes, credit spreads remained very resilient which benefited the portfolio’s positions in both investment grade and high yield credit sectors.
Interest rate volatility is expected to remain elevated, despite a resolution to the debt ceiling and stabilization in the banking sector. The market’s focus has now turned to the resiliency of the economy, stickiness of inflation, and the response from the Federal Reserve (“Fed”). While the yield curve could flatten further over the near term, a steepening trend may emerge later this year as the FOMC likely nears the end of their tightening cycle. Corporate bonds have been resilient in the face of a highly uncertain economic outlook. While we recognize the recent spread tightening tilts the risk/reward profile somewhat less favorably looking forward, we are reluctant to reduce corporate exposure further as recession odds have become milder than previously thought. Our preference on the security selection side is centered on credit exposures more at the front end of the curve with a greater emphasis on higher quality and lower beta in intermediate and longer-term maturities. We have become more constructive on the agency mortgage-backed sector given its underperformance over the last few years. The relative cheapness of the sector combined with limited origination may offset the bank-related selling pressures and the fact that the Fed is no longer an indiscriminate buyer of mortgages.
Eventide Dividend Opportunities Fund
The Eventide Dividend Opportunities Fund (Class I) reported a total return of 10.87% for the 12-month period ended 06/30/2023, leading the Russell Midcap® Value Index (+10.50%) and lagging the Russell Midcap Index (+14.92%).
The Fund’s trailing 12-month performance relative to the Russell Midcap Index derived largely from underperformance among higher-quality and interest rate-sensitive stocks amid unprecedented policy tightening and surging interest rates over the past year. The Fund’s higher-quality, dividend-growth positioning helped the Fund outperform its secondary benchmark, the Russell Midcap Value Index during this period. Among sectors for the 12-month period, the Fund enjoyed particularly strong relative results in the Information Technology, Industrials, and Materials sectors, partially offset by underperformance, as mentioned, in more interest rate sensitive sectors, as Utilities and Financials. Overweights to Semiconductors, Software, Industrials, and Energy positioned the Fund well in relationship to key secular growth themes in technology, electrification, supply chain resiliency, energy efficiency, and energy infrastructure. The Fund avoids areas with high leverage, high and rising costs of financing, and high exposure to external financing. The Fund remains focused on pursuing companies we see as resilient, well-managed, and well-positioned in long-term secular growth themes of human flourishing. The resilience we seek includes generation of robust free cash flow, self-financing, attractive dividend growth, and strong execution through volatile macroeconomic and market environments. For the Eventide Dividend Opportunities Fund, we continue to see many opportunities for investing in companies that we believe have this resilience to ride out the macro and market storms and can achieve attractive long-term
| A N N U A L R E P O R T | June 30, 2023 |
FUND REVIEWS (UNAUDITED)
Eventide Dividend Opportunities Fund (Continued)
capital appreciation and dividend growth for our clients, and have a positive impact on the world and well-being. The Fund’s 3-year and 5-year performance ended 6/30/2023 remains strong at 12.59%and 10.77% versus 12.50% and 8.46% for its primary benchmark, the Russell Midcap Index.
Contributors
nVent Electric plc,1 a company that offers electrical connection and protection solutions, outperformed due to strong trends in electrification for data centers, utilities, and industrials. Palo Alto Networks Inc.,2 a company that provides integrated cloud and network security solutions, benefited from continued demand for cybersecurity solutions, coupled with customers consolidating spending to platforms over solutions built to solve a single problem. Trane Technologies plc,3 a company that supplies HVAC systems for energy efficiency and reduced greenhouse emissions, reported strong results in its commercial HVAC business. KLA Corporation,4 a company that provides semiconductors and semiconductor assembly solutions, benefitted from the increasing importance of semiconductor fabrication at new technology nodes as well as a likely bottoming of the business cycle. Old Dominion Freight Line, Inc.,5 an inter-regional and multi-regional motor carrier known for exceptional employment practices, gained market share–despite a soft freight market–because of its strong customer service and ability to hire drivers.
Detractors
Baxter International Inc.,6 a company that provides essential healthcare products such as dialysis therapies and infusion devices, posted disappointing results due to supply chain pressures. Crown Castle International Corp.,7 a company that provides wireless infrastructure in the U.S., was negatively impacted by a slowdown in tower leasing activity and services. NextEra Energy Partners, LP,8 a company that contracts clean energy projects, including wind and solar, was negatively impacted by higher financing costs and a financing structure that was not well received by investors. Royalty Pharma plc,9 a leader in acquiring royalty interests in late-stage biopharmaceutical products, was negatively impacted by a higher cost of capital and selling by pre-IPO investors. First Republic Bank,10 a commercial bank offering private banking and wealth management, was negatively impacted by margin pressure from higher interest rates and contagion from the regional banking crisis.
Eventide Exponential Technologies Fund
The Eventide Exponential Technologies Fund (Class I) posted a total return of 10.12% for the 12-month period ended 06/30/2023, compared with the S&P North American Technology Sector Index return of 33.71% and the S&P 500 Total Return Index return of 19.59%.
| A N N U A L R E P O R T | June 30, 2023 |
FUND REVIEWS (UNAUDITED)
Eventide Exponential Technologies Fund (Continued)
The Fund underperformed its benchmark largely due to its greater-than benchmark exposures to small- and mid-cap high-growth stocks. Indeed, our data shows that for Q2 2023, five mega-cap stocks accounted for roughly 25% of the S&P market capitalization. Further, for the first half of 2023, roughly 90% of the S&P 500’s return was attributable to the S&P’s top seven stocks, with a similar dynamic seen for the NASDAQ. We note this to put Fund performance in context.
The past year continued to see unprecedented challenges for small- and mid-cap growth investing. This has been particularly evident in the technology space where the spread between the largest and smaller companies reached historical levels. This meant that the Fund lagged popular technology benchmarks and peers in the technology category that invest the vast majority of their funds in the largest technology companies. The market saw challenges like continued persistence of higher inflation led by sticky wage growth in a resilient labor market, expectations of higher for longer interest rates, the regional banking crisis, quantitative tightening, and de-globalization trends for economic self-sufficiency. These multifaceted factors have limited historical proxies, and the uncertainty led the market to sell small- and mid-cap growth technology companies versus their large-cap peers. Looking forward, we have now been able to upgrade the portfolio to include what we believe to be the best growth Business 360® investment opportunities. We believe these companies are in attractive industries, possess strong and growing moats, are well capitalized, have longer-term-focused, stakeholder-oriented, and high-quality-incentivized management teams who are likely to take advantage of the economic turbulence to improve their competitive positions. While these types of sell-offs can lead to significant short-termism among investors, history has shown that patient longer-term-oriented investors will likely be rewarded positively over time when owning portfolios of outstanding companies. We are excited for the journey ahead.
Contributors
Palo Alto Networks Inc.,11 a company that provides integrated cloud and network security solutions, benefited from continued demand for cybersecurity solutions, coupled with customers consolidating spending to platforms over solutions built to solve a single problem. Flywire Corporation,12 a company that offers global payments enablement software focusing on education and healthcare, benefited from resilient demand and profitability improvement trends as a key payments solutions provider to the education, healthcare, and business services sectors. Lattice Semiconductor Corporation,13 a company that designs semiconductor devices, benefitted from significant new product ramps, relative end market resilience, and industry cyclicality. Synopsys, Inc.,14 a company that provides design technologies to creators of electronic systems, benefitted from a significant surge in demand custom silicon to support applications such as Artificial Intelligence (“AI”). Lam Research Corporation,15 a company that supplies semiconductor wafer fabrication equipment, benefitted from the increasing importance of semiconductor fabrication at new technology nodes as well as a likely bottoming of the business cycle.
| A N N U A L R E P O R T | June 30, 2023 |
FUND REVIEWS (UNAUDITED)
Eventide Exponential Technologies Fund (Continued)
Detractors
MongoDB, Inc.,16 a company that develops database software, saw challenges in consumption trends as the company experienced a slowdown in demand across their platform in 2022. Bill.com Holdings, Inc.,17 a company that provides small and midsize business (SMB) back-office software to enable digital bill and expense management, saw challenges in SMB spend in 2022, which hurt revenue growth and profitability. Five9, Inc.,18 a company that provides cloud-based contact center software, saw investor sentiment tilt negatively as contact center software was generally classified as an AI-loser; this perception has since changed. Xometry Inc,19 a company that offers an AI-enabled marketplace for on-demand manufacturing, suffered through faulty execution in Q4 which hurt top and bottom line and had investors questioning their business model; we believe this perception should change over the coming quarters. dLocal Ltd20, a company that serves a worldwide customer base with a payment solutions platform, suffered from multiple short report attacks that hurt the stock price, which we believe provides compelling opportunity, should they continue clean execution over the coming quarters.
Eventide Gilead Fund
The Eventide Gilead Fund (Class I) posted a total return of 16.00% for the 12-month period ended 06/30/2023, while the Russell Midcap Growth Index returned 23.13% and the S&P 500 Total Return Index, 19.59%.
Underperformance relative to the primary benchmark was primarily due to weak stock selection within the Information Technology, Utilities, and Consumer Discretionary sectors. Cash allocation was also a drag on relative returns. These weaknesses were largely offset by strong performance from the Fund’s investments in the Healthcare sector, with Biotechnology stocks leading to the upside after emerging from a period of weak performance. Many of the detractors from relative performance in the last half of 2022 became relative performance contributors in the first half of 2023 as market dynamics and industry leadership shifted. Despite concerns of stock market valuation and concentration, looking forward we are finding opportunities to invest in companies whose valuations remain depressed, particularly within the small and mid-cap areas of the market.
Contributors
Palo Alto Networks Inc.,21 a company that provides integrated cloud and network security solutions, benefited from continued demand for cybersecurity solutions, coupled with customers consolidating spending to platforms over solutions built to solve a single problem. Exact Sciences Corporation,22 a molecular diagnostics company that provides non-invasive molecular screening for colorectal cancer, benefited from end-market cancer
| A N N U A L R E P O R T | June 30, 2023 |
FUND REVIEWS (UNAUDITED)
Eventide Gilead Fund (Continued)
screening tailwinds and profitability inflection. Global-E Online Ltd.,23 a company that develops end-to-end cross-border platforms for eBusiness, benefited from continued growth of their best-in-class cross-border e-commerce platform despite consumer macro headwinds. Old Dominion Freight Line, Inc.,24 an inter-regional and multi-regional motor carrier known for exceptional employment practices, gained market share–despite a soft freight market–because of its strong customer service and ability to hire drivers. HubSpot, Inc.,25 a company that offers an inbound marketing, sales, and customer service software platform, benefited from continued share gains through consolidation of spend across key platforms like Hubspot.
Detractors
MongoDB, Inc.,26 a company that develops database software, saw challenges in consumption trends as the company experienced a slowdown in demand across their platform in 2022. ZoomInfo Technologies Inc.,27 a company that provides marketing solutions to customers worldwide, saw challenges in churn and upsell. Their seat-based platform experienced headwinds to growth as 40% of their customer base was in software-based businesses that had sales count reductions near year-end 2022. Five9, Inc.,28 a company that provides cloud-based contact center software, saw investor sentiment tilt negatively as contact center software was generally classified as an AI-loser; this perception has since changed. Xometry Inc,29 a company that offers an AI-enabled marketplace for on-demand manufacturing, suffered through faulty execution in Q4 which hurt top and bottom line and had investors questioning their business model; we believe this perception should change over the coming quarters. dLocal Ltd,30 a company that serves a worldwide customer base with a payment solutions platform, suffered from multiple short report attacks that hurt the stock price, which we believe provides compelling opportunity, should they continue clean execution over the coming quarters.
Eventide Healthcare and Life Sciences Fund
The Eventide Healthcare and Life Sciences Fund (Class I) posted a total return of 39.11% for the 12-month period ended 06/30/2023, compared with the S&P Biotechnology Select Industry Index of 12.13% and the S&P 500 Total Return Index total return of 19.59%.
The Fund’s outperformance compared to the primary benchmark was primarily due to strong stock selection within the Biotechnology and Medical Technology sector. This was during a period when there was a high degree of performance disparity between the winners and losers within the benchmark. M&A activity continued to pick up during the period, which benefited the portfolio as multiple investments experienced outsized price appreciation due to M&A. The field also benefited from higher-profile approvals in Alzheimer’s disease and greater investor attention in large markets like diabetes and obesity. Looking forward, we believe that there are
| A N N U A L R E P O R T | June 30, 2023 |
FUND REVIEWS (UNAUDITED)
Eventide Healthcare and Life Sciences Fund (Continued)
many opportunities to invest in high quality assets with depressed valuations. As macro fears subside, generalist attention could return to the space and cause valuations to normalize.
Contributors
Prometheus Biosciences,31 a biopharma company focused on gastroenterology and autoimmune diseases, benefited from exceptional Phase 2 data in ulcerative colitis. It was ultimately acquired during the year by Merck for ~$11B. Immunovant, Inc.,32 a biotech company developing drugs for patients with autoimmune diseases, benefited from positive tailwinds surrounding its novel mechanism of action for the treatment of various autoimmune diseases. Exact Sciences Corporation,33 a molecular diagnostics company providing non-invasive molecular screening for colorectal cancer, benefited from end market cancer screening tailwinds and profitability inflection. Karuna Therapeutics, Inc.,34 a clinical-stage biopharmaceutical company developing novel therapies for disabling neuropsychiatric disorders and pain, benefited from positive Phase 3 trials for the treatment of schizophrenia. VectivBio Holding AG,35 a global biotechnology company focused on rare diseases, was acquired by Ironwood Pharmaceuticals.
Detractors
Amylyx Pharmaceuticals Inc,36 a biopharmaceutical company marketing a novel drug for Lou Gehrig’s disease and developing novel therapies for rare neurological disorders, was negatively impacted following an adverse approval decision from Europe’s Committee for Medicinal Products for Human Use (CHMP), despite a strong US launch. ADC Therapeutics SA,37 a clinical stage biotechnology company focused on oncology drug discovery and development, was negatively impacted as the market ascribed lower valuations across oncology over the course of the last year. FibroGen, Inc,38 a biopharmaceutical company developing medicines for the treatment of anemia, fibrotic disease, and cancer, was negatively impacted by a Phase 3 trial failure in fibrotic lung disease. GoldFinch Bio,39 a biopharma company focused on kidney disease treatments, was negatively impacted by mixed Phase 2 trial data that forced the company to stop development and divest its lead asset to Karuna Therapeutics. 908 Devices Inc.,40 a medical device manufacturer for chemical and biomolecular analysis, was negatively impacted by bioprocessing headwinds and rotation away from small cap, technical life science tools.
Eventide Large Cap Focus Fund
The Eventide Large Cap Focus Fund (Class I) posted a total return of 14.55% for the 12-month period ended 06/30/2023, compared with the S&P 500 Total Return Index result of 19.59%.
| A N N U A L R E P O R T | June 30, 2023 |
FUND REVIEWS (UNAUDITED)
Eventide Large Cap Focus Fund (Continued)
The underperformance relative to the primary benchmark was primarily from stock selection, where not owning megacaps such as Apple, Microsoft, and Meta proved to be a headwind, while we also saw some negative selection effects in financials and information technology (partly due to this lack of exposure). This was partially offset by positive stock selection in consumer discretionary and an overweight in information technology.
The Fund seeks high active share and is a concentrated portfolio of high conviction holdings. We seek to invest in companies that can achieve or sustain leadership in secular growth industries, while also creating compelling value for society. Examples of themes we invest in include cybersecurity, life sciences innovation, and energy efficiency.
We are confident that our portfolio companies are well-positioned for the long-term, with strong fundamentals and attractive valuations. Even in a volatile economic environment, we believe that our companies create intrinsic (long-term) value every day by providing innovative products and services to solve their customers’ most challenging problems and by creating a strong culture for employees. As the stock market has continued to concentrate the large cap space into a few megacap names, we are excited to provide our investors with a large cap fund that contains high quality companies that fit our Business 360® framework, while also being high conviction, concentrated, and high active share without owning most of the well-known megacaps.
Contributors
Palo Alto Networks Inc.,41 a company that provides integrated cloud and network security solutions, benefited from continued demand for cybersecurity solutions, coupled with customers consolidating spending to platforms over solutions built to solve a single problem. Workday, Inc.,42 a company that serves enterprises with human capital and financial management software, benefited from continued demand for its critical enterprise solutions. Constellation Software Inc.,43 a company that provides mission-critical software for use in various industries, benefitted from end market resilience as well as continued execution as the acquirer of choice for owner-operated vertical market software. NVIDIA Corporation,44 a company that designs and supplies specialized processors and software for AI and graphics visualization, benefitted from a significant surge in demand to support AI applications such as those based on large language models. Synopsys, Inc.,45 a company that provides design technologies to creators of electronic systems, benefitted from a significant surge in demand for custom silicon to support applications such as AI.
Detractors
CrowdStrike Holdings, Inc.,46 a technology company offering an enterprise cybersecurity platform to prevent endpoint attacks, was negatively impacted during a period where the market was skeptical around the company’s
| A N N U A L R E P O R T | June 30, 2023 |
FUND REVIEWS (UNAUDITED)
Eventide Large Cap Focus Fund (Continued)
competitive position, which has since reversed. Royalty Pharma plc,47 a leader in acquiring royalty interests in late-stage biopharmaceutical products, was negatively impacted by a higher cost of capital and selling by pre-IPO investors. ZoomInfo Technologies Inc.,48 a company that provides marketing solutions to customers worldwide, saw challenges in churn and upsell. Their seat-based platform experienced headwinds to growth as 40% of their customer base was in software-based businesses that had sales count reductions near year-end 2022. First Republic Bank,49 a commercial bank offering private banking and wealth management, was negatively impacted by margin pressure from higher interest rates and contagion from the regional banking crisis. dLocal Ltd,50 a company that serves a worldwide customer base with a payment solutions platform, suffered from multiple short report attacks that hurt the stock price, which we believe provides compelling opportunity, should they continue clean execution over the coming quarters.
Eventide Limited-Term Bond Fund
The Eventide Limited-Term Bond Fund (Class I) posted a total return of 1.46% for the 12-month period ended 06/30/2023 compared to the Bloomberg 1-5 Year Government/Credit Index of 0.19% and the Bloomberg U.S. Intermediate Aggregate Bond Index of -0.60%.
Interest rates experienced heightened volatility for the period as the capital markets continued to anticipate and react to FOMC interest rate policy action. As the FOMC began to downshift the pace of interest rates hikes and macroeconomic data began to show the deflationary effects of previous hikes, credit spreads remained very resilient which benefited the portfolio’s positions in both investment grade and high yield credit sectors.
Interest rate volatility is expected to remain elevated, despite a resolution to the debt ceiling and stabilization in the banking sector. The market’s focus has now turned to the resiliency of the economy, stickiness of inflation, and the response from the Fed. While the yield curve could flatten further over the near term, a steepening trend may emerge later this year as the FOMC likely nears the end of their tightening cycle. Corporate bonds have been resilient in the face of a highly uncertain economic outlook. While we recognize the recent spread tightening tilts the risk/reward profile somewhat less favorably looking forward, we are reluctant to reduce corporate exposure further as recession odds have become milder than previously thought. Our preference on the security selection side is centered on credit exposures more at the front end of the curve with a greater emphasis on higher quality and lower beta in intermediate and longer-term maturities. We have become more constructive on the agency mortgage-backed sector given its underperformance over the last few years. The relative cheapness of the sector combined with limited origination may offset the bank-related selling pressures and the fact that the Fed is no longer an indiscriminate buyer of mortgages.
| A N N U A L R E P O R T | June 30, 2023 |
FUND REVIEWS (UNAUDITED)
Eventide Multi-Asset Income Fund
The Eventide Multi-Asset Income Fund (Class I) reported a total return of 5.57% for the 12-month period ended 06/30/2023, compared with the 7.34% gain of its 50/50 custom Multi-Asset Income Blend benchmark.
The Fund’s fixed income positions posted strong outperformance compared to its fixed income benchmark for the 12-month period ended 6/30/2023. The Fund’s fixed income outperformance was primarily due to both an overweight allocation to corporate bonds and positive selection within credit sectors. Within the benchmark, corporate bonds outperformed treasuries as both high yield and investment grade credit spreads stabilized during this period after rising sharply off of the lows of 2021.
The Fund’s equity positions trailed their equity benchmark, Russell Midcap Index, largely from underperformance among higher-quality and interest rate-sensitive stocks amid unprecedented policy tightening and surging interest rates over the past year. Among sectors for the 12-month period, the Fund enjoyed particularly strong relative results in the Information Technology, Industrials, and Materials sectors, partially offset by underperformance, as mentioned, in more interest rate sensitive sectors, such as Utilities and Financials. Overweights to Semiconductors, Software, Industrials, and Energy positioned the Fund well in relationship to key secular growth themes in technology, electrification, supply chain resiliency, energy efficiency, and energy infrastructure. The Fund avoids areas with high leverage, high and rising costs of financing, and high exposure to external financing. The Fund remains focused on pursuing companies we see as resilient, well-managed, and well-positioned in long-term secular growth themes of human flourishing. The resilience we seek includes generation of robust free cash flow, self-financing, attractive dividend growth, and strong execution through volatile macroeconomic and market environments. For the Eventide Multi-Asset Income Fund, we continue to see many opportunities for investing in companies that we believe have this resilience to ride out the macro and market storms, can achieve attractive long-term capital appreciation and income for our clients, and have a positive impact on the world and well-being. The Fund’s 3-year and 5-year performance ending 6/30/2023 remains strong at 6.71% and 6.83% versus 4.92% and 5.14% for its custom 50%/50% equity/fixed income benchmark.
Contributors
nVent Electric plc,51 a company that provides electrical connection and protection solutions, outperformed due to strong trends in electrification for data centers, utilities, and industrials. Palo Alto Networks Inc.,52 a company that provides integrated cloud and network security solutions, benefited from continued demand for cybersecurity solutions, coupled with customers consolidating spending to platforms over solutions built to solve a single problem. KLA Corporation,53 a company that provides semiconductors and semiconductor assembly solutions, benefitted from the increasing importance of semiconductor fabrication at new technology nodes as well as a likely bottoming of the cycle. Trane Technologies plc,54 a company that supplies HVAC systems for
| A N N U A L R E P O R T | June 30, 2023 |
FUND REVIEWS (UNAUDITED)
Eventide Multi-Asset Income Fund (Continued)
energy efficiency and reduced greenhouse emissions, reported strong results in its commercial HVAC business. Old Dominion Freight Line, Inc.,55 an inter-regional and multi-regional motor carrier known for exceptional employment practices, gained market share–despite a soft freight market–because of its strong customer service and ability to hire drivers.
Detractors
EQT Corporation,56 the USA’s largest natural gas producer serving customers in the USA and oversees, was negatively impacted by rapidly falling natural gas prices in the U.S. Royalty Pharma plc,57 a leader in acquiring royalty interests in late-stage biopharmaceutical products, was negatively impacted by a higher cost of capital and selling by pre-IPO investors. NextEra Energy Partners, LP,58 a utility company that contracts clean energy projects including wind and solar, was negatively impacted by higher financing costs and a financing structure that was not well received by investors. Crown Castle International Corp.,59 a company that provides wireless infrastructure in the U.S., was negatively impacted by a slowdown in tower leasing activity and services. First Republic Bank,60 a commercial bank offering private banking and wealth management, was negatively impacted by margin pressure from higher interest rates and contagion from the regional banking crisis.
CIO OUTLOOK (UNAUDITED)
Several quarters of recession calls from economists and market pundits have caused many investors to be too defensively postured in a surprisingly strong market. The economy and stock market have been more resilient than anticipated in the face of higher Fed interest rates, a regional bank crisis, and weak leading indicators. The weaker leading indicators have manifested as a set of “rolling recessions” rather than a single, broad-based recession. As the Fed has successfully cooled inflation, markets remain uncertain if there is “another shoe to drop” or if there is a light at the end of the tunnel. A few strategies we’ve employed to weather this environment are investing into companies that are currently pricing in a slowdown or recession and thus offer a potential margin of safety, or investing in companies whose outcomes are less or not macro-sensitive. While mega cap tech-stocks have been the most recent beneficiaries of this perceived change in regime, they have become expensive. In contrast, there are many attractive valuations in small and mid-cap stocks. When fears subside, we believe these companies should do well.
While there is much to consider on the macro front, we do not use our macro view as a market timing tool, but rather as another lens to view our companies as we work to build our long-term conviction from a bottom-up perspective. We seek to be long-term investors in companies that create compelling value for their stakeholders, operate in attractive industries, exhibit excellent management teams, and trade at reasonable valuations. We believe this approach will produce strong returns for our clients over the long-term.
| A N N U A L R E P O R T | June 30, 2023 |
CIO OUTLOOK (UNAUDITED) (CONTINUED)
Many of the headwinds we had experienced heading into 2023 have now become short-term tailwinds for the themes, sectors, industries, and styles we invest in. However, this does not deter us from seeking to find companies that have resilient, self-funding business models or companies whose outcome is less dependent on capital markets, especially as the risk of an economic slowdown remains. Our investments in the Biotechnology sector are a prime example of companies whose stock prices had suffered in recent years because of the market environment, but whose outcomes are less macro-sensitive but tied to the success of their drugs and therapies.
We would like to thank our investors who have participated with us through strong markets and weak markets. It is during weak markets like we have recently experienced where investment conviction is often tested. We believe our disciplined approach, informed by value creation, helps fight the tendency to make poor investment decisions informed by emotion. It is our hope that our investors are encouraged as we humbly continue to seek to invest in a way that makes the world rejoice!
DISCLAIMERS (UNAUDITED)
The opinions expressed herein are those of the Fund’s portfolio management team as of 06/30/2023 and are subject to change. There is no guarantee that such views are correct or that the outlook opinions will come to pass. Specific companies mentioned are for performance attribution informational purposes only and should not be construed as buy or sell advice. Reliance upon the views expressed herein is at the sole discretion of the reader. Mutual funds involve risk including the possible loss of principal. Past performance does not guarantee future results. The Fund’s ethical values screening criteria could cause it to under-perform similar funds that do not have such screening criteria.
Investors in the Eventide Core Bond Fund should be aware that interest rates may change at any time based on government policy. In general, the price of a fixed income security falls when interest rates rise. Longer term securities may be more sensitive to changes in interest rates. A rise in interest rates may result in volatility and increased redemptions, which in turn could result in the Fund being forced to liquidate portfolio securities at disadvantageous prices. Interest rates are sensitive to changes in inflation, and investing in bonds exposes investors to inflation risk. Bonds may be subject to default, causing loss of invested capital. Fixed income investments may be of any maturity or credit quality, but the Fund’s weighted average effective portfolio duration will be between three years and nine years. The Fund may invest, directly or indirectly, in “junk bonds.” Such securities are speculative investments that carry greater risks than higher quality debt securities. The Fund can invest in smaller-sized companies which may experience higher failure rates than larger companies and normally have a lower trading volume than larger companies. There are unique risks associated with asset backed securities, convertible securities, credit, duration, extension, foreign securities, income, mortgage back securities, municipal bonds, preferred stocks, pre-payment securities, sovereign debt, and U.S. Agency securities that are covered in the Fund’s prospectus and SAI. The Fund has no history of operations prior to its inception date.
The Eventide Dividend Opportunities Fund can have risk related to option investing. Companies in the Utilities sector are subject to interest rate risk and cash flow risk. Companies in the technology industries have different risks including but not limited to products becoming obsolete, and entrance of competing products. Companies in the Industrial Sector carry various risks including, but not limited to, risk related to debt loads, intense competition, and sensitivity to economic cycles. The Fund can invest in smaller-sized companies which may experience higher failure rates than larger companies and normally have a lower trading volume than larger companies. There are unique risks associated with convertible securities, foreign securities, hedging, MLPs, preferred stocks, REITs, securities, and yieldcos that are covered in the Fund’s prospectus and SAI.
The Eventide Exponential Technologies Fund typically invests at least 80% of its net assets in companies that the Adviser believes are participating in and benefiting from technologies, innovations, technology themes, or technology trends which can include information technology, e-commerce discretionary, internet media and services, healthcare technology, healthcare devices, or transaction & payment processing services industries. The term “exponential” means the potential for accelerated advancements in underlying technologies that can positively impact capabilities and development cycles of a company’s products and services. Not every company in the Fund’s portfolio will experience exponential growth, and the
| A N N U A L R E P O R T | June 30, 2023 |
DISCLAIMERS (UNAUDITED) (CONTINUED)
Fund is not expected to deliver exponential returns. The Fund can invest in smaller-sized companies which may experience higher failure rates than larger companies and normally have a lower trading volume than larger companies. The Fund may experience higher volatility than the general market due to being concentrated in the technology industries. Companies in the technology industries have different risks including but not limited to products becoming obsolete, and entrance of competing products. Communications companies may underperform due to legislative or increased competition. Internet and Direct Marketing Retail companies may underperform due to legislative or increased government supervision. Healthcare Technology and Devices Companies may be heavily dependent on clinical trials with uncertain outcomes and decisions made by the governments and regulatory authorities. Further, these companies are dependent on patent protection. The Fund has non-diversification risk as a high percentage of Fund assets may be invested in a limited number of companies. The Fund can have risk related to option investing. There are special risks associated with investments in foreign companies including exposure to currency fluctuations, less efficient trading markets, political instability and differing auditing and legal standards. The Fund can invest in private companies. Private investments include various risks including but not limited to lack of liquidity, capital commitment risk, and valuation risk. Private companies may not be financially profitable and have uncertain futures, subjecting them to additional risks. The Fund has no history of operations prior to its inception date.
The Eventide Gilead Fund can invest in smaller-sized companies which may experience higher failure rates than larger companies and normally have a lower trading volume than larger companies. The Fund can have risk associated with the biotechnology and pharmaceutical industry in which these companies may be heavily dependent on clinical trials with uncertain outcomes and decisions made by the U.S. Food and Drug Administration.
Companies in the technology industries have different risks including but not limited to products becoming obsolete, and entrance of competing products. Companies in the Industrial Sector carry various risks including, but not limited to, risk related to debt loads, intense competition, and sensitivity to economic cycles. The Fund can have risk related to option investing. There are special risks associated with investments in foreign companies including exposure to currency fluctuations, less efficient trading markets, political instability and differing auditing and legal standards. The Fund can invest in private companies. Private investments include various risks including but not limited to lack of liquidity, capital commitment risk, and valuation risk. Private companies may not be financially profitable and have uncertain futures, subjecting them to additional risks.
The Eventide Healthcare & Life Sciences Fund can invest in smaller-sized companies which may experience higher failure rates than larger companies and normally have a lower trading volume than larger companies. The Fund can have risk associated with the biotechnology and pharmaceutical industry in which these companies may be heavily dependent on clinical trials with uncertain outcomes and decisions made by the U.S. Food and Drug Administration. The Fund can have risk related to option investing. There are special risks associated with investments in foreign companies including exposure to currency fluctuations, less efficient trading markets, political instability and differing auditing and legal standards. The Fund can invest in private companies. Private investments include various risks including but not limited to lack of liquidity, capital commitment risk, and valuation risk. Private companies may not be financially profitable and have uncertain futures, subjecting them to additional risks.
Investors in the Eventide Limited-Term Bond Fund should be aware that interest rates may change at any time based on government policy. In general, the price of a fixed income security falls when interest rates rise. A rise in interest rates may result in volatility and increased redemptions, which in turn could result in the Fund being forced to liquidate portfolio securities at disadvantageous prices. Longer term securities may be more sensitive to changes in interest rates. Interest rates are sensitive to changes in inflation, and investing in bonds exposes investors to inflation risk. Bonds may be subject to default, causing loss of invested capital. Fixed income investments may be of any maturity or credit quality, but the Fund’s weighted average effective portfolio duration will not exceed five years. The Fund may invest, directly or indirectly, in “junk bonds.” Such securities are speculative investments that carry greater risks than higher quality debt securities. The Fund can invest in smaller-sized companies which may experience higher failure rates than larger companies and normally have a lower trading volume than larger companies. There are unique risks associated with asset-backed securities, convertible securities, credit, foreign securities, income, interest rates, mortgage-backed securities, municipal bonds, preferred stocks, prepayment, securities, sovereign debt, and U.S. Agency securities that are covered in the Fund’s prospectus and SAI.
| A N N U A L R E P O R T | June 30, 2023 |
DISCLAIMERS (UNAUDITED) (CONTINUED)
The Eventide Multi-Asset Income Fund can have risk related to option investing. Investors in the Fund should be aware that interest rates may change at any time based on government policy. In general, the price of a fixed income security falls when interest rates rise. Longer term securities may be more sensitive to changes in interest rates. The intermediate-term bond portion of the Fund’s portfolio may represent 0% to 100% of the Fund’s portfolio with an average duration of between two and eight years. The Fund may invest, directly or indirectly, in “junk bonds.” Such securities are speculative investments that carry greater risks than higher quality debt securities. The Fund can invest in smaller-sized companies which may experience higher failure rates than larger companies and normally have a lower trading volume than larger companies. There are unique risks associated with asset-backed securities, convertible securities, credit, foreign securities, hedging, income, MLPs, mortgage-backed securities, preferred stocks, prepayment, REITs, securities, U.S. Agency securities, and yieldcos that are covered in the Fund’s prospectus and SAI.
Investors should consider a fund’s investment objectives, risks, charges and expenses carefully before investing or sending money. This and other important information can be found in the prospectus, which can be obtained at https://www.eventidefunds.com/prospectus or by calling 1-877-771-EVEN (3836). Please read the prospectus carefully before investing. Eventide Mutual Funds are distributed by Northern Lights Distributors, LLC, Member FINRA/SIPC, which is not affiliated with Eventide Asset Management, LLC.
5579-NLD-7/31/2023
| A N N U A L R E P O R T | June 30, 2023 |
| Eventide Core Bond Fund | |
| Portfolio Review (Unaudited) | June 30, 2023 |
Average Annual Total Return through June 30, 20231, as compared to its benchmark:
| | | Since |
| | 1 Year Return | Inception 3 |
| Class N | -0.89% | -5.26% |
| Class A without load | -0.90% | -5.31% |
| Class A with 5.75% load | -6.55% | -7.21% |
| Class C | -1.67% | -5.97% |
| Class I | -0.67% | -5.07% |
| Bloomberg U.S. Aggregate Bond Index 2 | -0.94% | -4.56% |
| 1. | The performance data quoted here represents past performance. Current performance may be lower or higher than the performance data quoted above. Investment return and principal value will fluctuate, so that shares, when redeemed, may be worth more or less than their original cost. The returns shown do not reflect the deduction of taxes that a shareholder would pay on Fund distributions or on the redemptions of Fund shares. Total returns would have been lower absent the manager’s fee waiver. Past performance is no guarantee of future results. Performance figures for periods greater than 1 year are annualized. The Fund’s manager has contractually agreed to waive fees and/or reimburse expenses of the Fund to the extent necessary to limit operating expenses (excluding front-end or contingent deferred loads, taxes, leverage interest, brokerage commissions, expenses incurred in connection with any merger or reorganization, dividend expenses on securities sold short, underlying fund fees and expenses or extraordinary expenses such as litigation) at 0.83%, 1.58%, 0.78% and 0.58% for Class A shares, Class C shares, Class N shares and Class I shares, respectively, through October 31, 2023. Per the Fund’s most recent prospectus as supplemented, total annual Fund expenses before waiver are 0.99%, 1.74%, 0.94% and 0.74% for Class A shares, Class C shares, Class N shares and Class I shares, respectively. Class A shares are subject to a maximum sales charge of 5.75% imposed on purchases and have a maximum deferred sales charge of 1.00% on purchases of $1 million or more made without an initial sales charge and applies to shares sold within 18 months. Class C shares are subject to a maximum deferred sales charge of 1.00% on shares sold within 12 months. A $15 fee may be charged for redemptions made by wire. For performance information current to the most recent month-end, please call toll-free 1-877-771-3836. |
| 2. | The Bloomberg U.S. Aggregate Bond Index is a broad-based flagship benchmark that measures the investment grade, US dollar-denominated, fixed-rate taxable bond market. The index includes Treasuries, government-related and corporate securities, MBS (agency fixed-rate pass-throughs), ABS and CMBS (agency and non-agency). Investors cannot invest directly in an index. |
| 3. | Eventide Core Bond Fund commenced operations on July 31, 2020. |
| Comparison of the Change in Value of a $100,000 Investment | | Comparison of the Change in Value of a $10,000 Investment |
| | | |
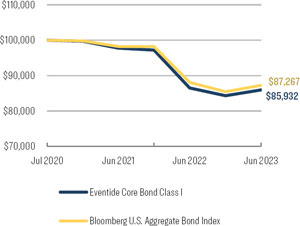 | | 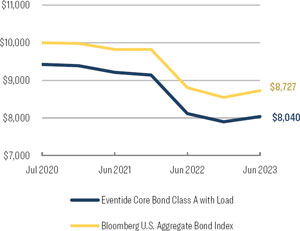 |
| A N N U A L R E P O R T | June 30, 2023 |
| Eventide Core Bond Fund | |
| Portfolio Review (Unaudited) (Continued) | June 30, 2023 |
| Holdings by Industry or Asset Class | | % of Net Assets | |
| Agency Fixed Rate | | | 23.6 | % |
| Electric Utilities | | | 14.5 | % |
| Government Sponsored | | | 11.6 | % |
| Banking | | | 5.4 | % |
| Real Estate Investment Trusts | | | 3.8 | % |
| Institutional Financial Services | | | 3.5 | % |
| Engineering & Construction | | | 3.2 | % |
| Auto Loan | | | 2.8 | % |
| Oil & Gas Producers | | | 2.5 | % |
| Insurance | | | 2.5 | % |
| Other / Cash & Cash Equivalents | | | 26.6 | % |
| | | | 100.0 | % |
| | | | | |
| Please refer to the Schedule of Investments in this annual report for a detailed listing of the Fund’s holdings. |
| A N N U A L R E P O R T | June 30, 2023 |
| Eventide Dividend Opportunities Fund | |
| Portfolio Review (Unaudited) | June 30, 2023 |
Average Annual Total Return through June 30, 20231, as compared to its benchmarks:
| | | | Since |
| | 1 Year Return | 5 Year Return | Inception 4 |
| Class N | 10.66% | 10.56% | 8.76% |
| Class A without load | 10.68% | 10.55% | 8.73% |
| Class A with 5.75% load | 4.31% | 9.24% | 7.61% |
| Class C | 9.78% | 9.67% | 7.91% |
| Class I | 10.87% | 10.77% | 8.98% |
| Russell Midcap Total Return Index 2 | 14.92% | 8.46% | 8.86% |
| Russell Midcap Value Index 3 | 10.50% | 6.84% | 6.88% |
| 1. | The performance data quoted here represents past performance. Current performance may be lower or higher than the performance data quoted above. Investment return and principal value will fluctuate, so that shares, when redeemed, may be worth more or less than their original cost. The returns shown do not reflect the deduction of taxes that a shareholder would pay on Fund distributions or on the redemptions of Fund shares. Past performance is no guarantee of future results. Performance figures for periods greater than 1 year are annualized. The Fund’s manager has contractually agreed to waive fees and/or reimburse expenses of the Fund to the extent necessary to limit operating expenses (excluding front-end or contingent deferred loads, taxes, leverage interest, brokerage commissions, expenses incurred in connection with any merger or reorganization, dividend expenses on securities sold short, underlying fund fees and expenses or extraordinary expenses such as litigation) at 1.20%, 1.95%, 1.15% and 0.95% for Class A shares, Class C shares, Class N shares and Class I shares, respectively, through October 31, 2023. Class A shares are subject to a maximum sales charge of 5.75% imposed on purchases and have a maximum deferred sales charge of 1.00% on purchases of $1 million or more made without an initial sales charge and applies to shares sold within 18 months. Class C shares are subject to a maximum deferred sales charge of 1.00% on shares sold within 12 months. A $15 fee may be charged for redemptions made by wire. For performance information current to the most recent month-end, please call toll-free 1-877-771-3836. |
| 2. | The Russell Midcap Total Return Index measures the performance of the mid-cap segment of the US equity universe. It is a subset of the Russell 1000 Index. It includes approximately 800 of the smallest securities based on a combination of their market cap and current index membership, representing approximately 31% of the total market capitalization of the Russell 1000 companies. It is constructed to provide a comprehensive and unbiased barometer for the mid-cap segment. The index is completely reconstituted annually to ensure larger stocks do not distort the performance and characteristics of the true mid-cap opportunity set. Investors cannot invest directly in an index. |
| 3. | The Russell Midcap Value Index measures the performance of the mid-capitalization U.S. equities that exhibit value characteristics. It includes those Russell Midcap Index companies with relatively lower price-to-book ratios, lower I/B/E/S forecast medium term (2 year) growth and lower sales per share historical growth (5 years). Investors cannot invest directly in an index. |
| 4. | Eventide Dividend Opportunities Fund commenced operations on September 29, 2017. |
| Comparison of the Change in Value of a $100,000 Investment | | Comparison of the Change in Value of a $10,000 Investment |
| | | |
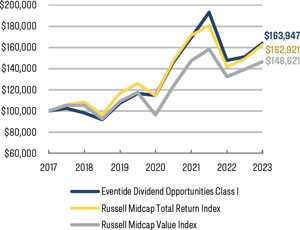 | | 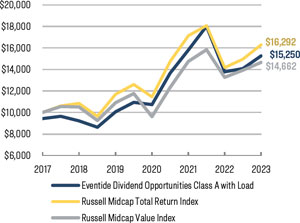 |
| A N N U A L R E P O R T | June 30, 2023 |
| Eventide Dividend Opportunities Fund | |
| Portfolio Review (Unaudited) (Continued) | June 30, 2023 |
| Holdings by Industry or Asset Class | | % of Net Assets | |
| Electrical Equipment | | | 15.0 | % |
| Oil & Gas Producers | | | 10.0 | % |
| Technology Services | | | 8.0 | % |
| Medical Equipment & Devices | | | 7.4 | % |
| Software | | | 7.0 | % |
| Chemicals | | | 5.2 | % |
| Semiconductors | | | 4.9 | % |
| Electric Utilities | | | 4.4 | % |
| Industrial REIT | | | 4.0 | % |
| Retail - Discretionary | | | 3.2 | % |
| Transportation & Logistics | | | 3.2 | % |
| Other / Cash & Cash Equivalents | | | 27.7 | % |
| | | | 100.0 | % |
| | | | | |
| Please refer to the Schedule of Investments in this annual report for a detailed listing of the Fund’s holdings. |
| A N N U A L R E P O R T | June 30, 2023 |
| Eventide Exponential Technologies Fund | |
| Portfolio Review (Unaudited) | June 30, 2023 |
Average Annual Total Return through June 30, 20231, as compared to its benchmarks:
| | | Since |
| | 1 Year Return | Inception 5 |
| Class N | 9.89% | 6.78% |
| Class A without load | 9.79% | 6.78% |
| Class A with 5.75% load | 3.45% | 4.69% |
| Class C | 9.01% | 6.00% |
| Class I | 10.12% | 7.01% |
| S&P North American Technology Sector Industry Index 2 | 33.71% | 13.05% |
| S&P 500 Total Return Index 3 | 19.59% | 14.60% |
| Exponential Technologies Blended Index 4 | 33.37% | 12.92% |
| 1. | The performance data quoted here represents past performance. Current performance may be lower or higher than the performance data quoted above. Investment return and principal value will fluctuate, so that shares, when redeemed, may be worth more or less than their original cost. The returns shown do not reflect the deduction of taxes that a shareholder would pay on Fund distributions or on the redemptions of Fund shares. Past performance is no guarantee of future results. Performance figures for periods greater than 1 year are annualized. The Fund’s manager has contractually agreed to waive fees and/or reimburse expenses of the Fund to the extent necessary to limit operating expenses (excluding front-end or contingent deferred loads, taxes, leverage interest, brokerage commissions, expenses incurred in connection with any merger or reorganization, dividend expenses on securities sold short, underlying fund fees and expenses or extraordinary expenses such as litigation) at 1.68%, 2.43%, 1.63% and 1.43% for Class A shares, Class C shares, Class N shares and Class I shares, respectively, through October 31, 2023. Per the Fund’s most recent prospectus, total annual Fund expenses before waiver are 1.68%, 2.43%, 1.63% and 1.43% for Class A shares, Class C shares, Class N shares and Class I shares, respectively. Class A shares are subject to a maximum sales charge of 5.75% imposed on purchases and have a maximum deferred sales charge of 1.00% on purchases of $1 million or more made without an initial sales charge and applies to shares sold within 18 months. Class C shares are subject to a maximum deferred sales charge of 1.00% on shares sold within 12 months. Redemptions within 180 days of purchase were subject to a redemption fee of 1.00%, effective until June 26, 2023. A $15 fee may be charged for redemptions made by wire. For performance information current to the most recent month-end, please call toll-free 1-877-771-3836. |
| 2. | The S&P North American Technology Sector Industry Index provides investors with a benchmark that represents U.S. securities classified under the GICS® information technology sector as well as the internet & direct marketing retail, interactive home entertainment, and interactive media & services sub-industries. Investors cannot invest directly in an index. |
| 3. | The S&P 500 Total Return Index, a registered trademark of McGraw-Hill Co., Inc., is a market capitalization-weighted index of 500 widely held common stocks. Investors cannot invest directly in an index. |
| 4. | The Exponential Technologies Blended Index is comprised of 50% of the S&P North American Technology Software Index, 20% of the S&P Technology Hardware Select Industry Index, 20% of the Philadelphia Stock Exchange Semiconductor Index and 10% of the S&P 500 Communications Services Sector. The Eventide Exponential Technologies Blended Index rebalances its weightings on a monthly frequency. Investors cannot invest directly in an index. |
| 5. | Eventide Exponential Technologies Fund commenced operations on June 30, 2020. |
| Comparison of the Change in Value of a $100,000 Investment | | Comparison of the Change in Value of a $10,000 Investment |
| | | |
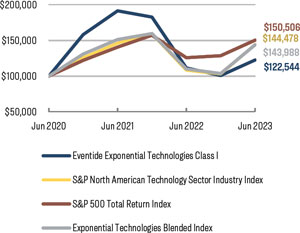 | | 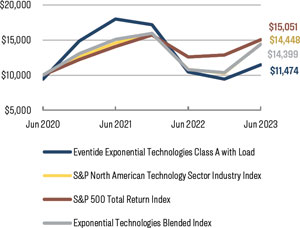 |
| A N N U A L R E P O R T | June 30, 2023 |
| Eventide Exponential Technologies Fund |
| Portfolio Review (Unaudited) (Continued) | June 30, 2023 |
| Holdings by Industry or Asset Class | | % of Net Assets | |
| Software | | | 56.8 | % |
| Semiconductors | | | 14.3 | % |
| Renewable Energy | | | 4.0 | % |
| Technology Hardware & Equipment | | | 4.0 | % |
| Technology Services | | | 2.9 | % |
| Biotech & Pharma | | | 2.6 | % |
| Advertising & Marketing | | | 2.5 | % |
| Medical Equipment & Devices | | | 2.0 | % |
| Retail - Consumer Staples | | | 2.0 | % |
| Consumer Services | | | 1.8 | % |
| Other / Cash & Cash Equivalents | | | 7.1 | % |
| | | | 100.0 | % |
| | | | | |
| Please refer to the Schedule of Investments in this annual report for a detailed listing of the Fund’s holdings. |
| |
| A N N U A L R E P O R T | June 30, 2023 |
| Eventide Gilead Fund | |
| Portfolio Review (Unaudited) | June 30, 2023 |
Average Annual Total Return through June 30, 20231, as compared to its benchmarks:
| | | | 10 Year | Since | Since | Since |
| | 1 Year Return | 5 Year Return | Return | Inception 4 | Inception 5 | Inception 6 |
| Class N | 15.77% | 9.61% | 12.69% | 13.44% | N/A | N/A |
| Class A without load | 15.73% | 9.57% | 12.65% | N/A | 15.00% | N/A |
| Class A with 5.75% load | 9.08% | 8.27% | 11.99% | N/A | 14.50% | N/A |
| Class C | 14.87% | 8.73% | 11.79% | N/A | 14.12% | N/A |
| Class I | 16.00% | 9.83% | 12.92% | N/A | N/A | 14.08% |
| Russell Midcap Growth Index 2 | 23.13% | 9.71% | 11.53% | 10.46% | 13.18% | 12.68% |
| S&P 500 Total Return Index 3 | 19.59% | 12.31% | 12.86% | 10.93% | 13.41% | 13.17% |
| 1. | The performance data quoted here represents past performance. Current performance may be lower or higher than the performance data quoted above. Investment return and principal value will fluctuate, so that shares, when redeemed, may be worth more or less than their original cost. The returns shown do not reflect the deduction of taxes that a shareholder would pay on Fund distributions or on the redemptions of Fund shares. Past performance is no guarantee of future results. Performance figures for periods greater than 1 year are annualized. Per the Fund’s most recent prospectus, total annual Fund expenses are 1.36%, 2.11%, 1.31%, and 1.11% for Class A shares, Class C shares, Class N shares and Class I shares, respectively. Class A shares are subject to a maximum sales charge of 5.75% imposed on purchases and have a maximum deferred sales charge of 1.00% on purchases of $1 million or more made without an initial sales charge and applies to shares sold within 18 months. Class C shares are subject to a maximum deferred sales charge of 1.00% on shares sold within 12 months. A $15 fee may be charged for redemptions made by wire. For performance information current to the most recent month-end, please call toll-free 1-877-771-3836. |
| 2. | The Russell Midcap Growth Index measures the performance of the mid-cap growth segment of the U.S. equity universe. It includes those Russell Midcap Index companies with higher price-to-book ratios and higher forecasted growth values. Investors cannot invest directly in an index. |
| 3. | The S&P 500 Total Return Index, a registered trademark of McGraw-Hill Co., Inc., is a market capitalization-weighted index of 500 widely held common stocks. Investors cannot invest directly in an index. |
| 4. | Class N commenced operations on July 8, 2008. |
| 5. | Class A and Class C commenced operations on October 28, 2009. |
| 6. | Class I commenced operations on February 2, 2010. |
| Comparison of the Change in Value of a $100,000 Investment | | Comparison of the Change in Value of a $10,000 Investment |
| | | |
| | | |
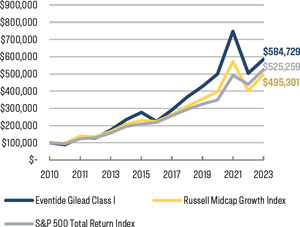 | | 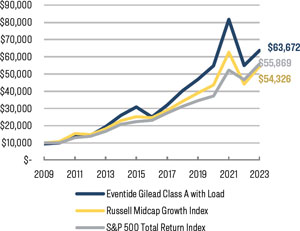 |
| A N N U A L R E P O R T | June 30, 2023 |
| Eventide Gilead Fund |
| Portfolio Review (Unaudited) (Continued) | June 30, 2023 |
| Holdings by Industry or Asset Class | | % of Net Assets | |
| Software | | | 26.3 | % |
| Biotech & Pharma | | | 12.2 | % |
| Medical Equipment & Devices | | | 10.5 | % |
| Semiconductors | | | 6.7 | % |
| Electric Equipment | | | 5.8 | % |
| Retail - Discretionary | | | 4.7 | % |
| Transportation & Logistics | | | 4.1 | % |
| Electric Utilities | | | 4.0 | % |
| Commercial Support Services | | | 3.0 | % |
| Wholesale - Discretionary | | | 2.4 | % |
| Other / Cash & Cash Equivalents | | | 20.3 | % |
| | | | 100.0 | % |
| | | | | |
| Please refer to the Schedule of Investments in this annual report for a detailed listing of the Fund’s holdings. |
| A N N U A L R E P O R T | June 30, 2023 |
| Eventide Healthcare & Life Sciences Fund | |
| Portfolio Review (Unaudited) | June 30, 2023 |
Average Annual Total Return through June 30, 20231, as compared to its benchmarks:
| | | | 10 Year | Since |
| | 1 Year Return | 5 Year Return | Return | Inception 4 |
| Class N | 38.83% | 6.25% | 14.38% | 16.08% |
| Class A without load | 38.71% | 6.19% | 14.31% | 16.00% |
| Class A with 5.75% load | 30.74% | 4.94% | 13.64% | 15.35% |
| Class C | 37.71% | 5.39% | 13.46% | 15.14% |
| Class I | 39.11% | 6.46% | 14.61% | 16.30% |
| S&P Biotechnology Select Industry Index 2 | 12.13% | -2.55% | 9.26% | 10.66% |
| S&P 500 Total Return Index 3 | 19.59% | 12.31% | 12.86% | 13.66% |
| 1. | The performance data quoted here represents past performance. Current performance may be lower or higher than the performance data quoted above. Investment return and principal value will fluctuate, so that shares, when redeemed, may be worth more or less than their original cost. The returns shown do not reflect the deduction of taxes that a shareholder would pay on Fund distributions or on the redemptions of Fund shares. Past performance is no guarantee of future results. Performance figures for periods greater than 1 year are annualized. Per the Fund’s most recent prospectus, total annual Fund expenses, including acquired fund fees, are 1.56%, 2.31%, 1.51% and 1.31% for Class A shares, Class C shares, Class N shares and Class I shares, respectively. Class A shares are subject to a maximum sales charge of 5.75% imposed on purchases and have a maximum deferred sales charge of 1.00% on purchases of $1 million or more made without an initial sales charge and applies to shares sold within 18 months. Class C shares are subject to a maximum deferred sales charge of 1.00% on shares sold within 12 months. A $15 fee may be charged for redemptions made by wire. For performance information current to the most recent month-end, please call toll-free 1-877-771-3836. |
| 2. | The S&P Biotechnology Select Industry Index is designed to measure the performance of narrow GICS® sub-industries and is comprised of stock in the S&P Total Market Index that are classified in the GICS biotechnology sub-industry. Investors cannot invest directly in an index. |
| 3. | The S&P 500 Total Return Index, a registered trademark of McGraw-Hill Co., Inc., is a market capitalization-weighted index of 500 widely held common stocks. Investors cannot invest directly in an index. |
| 4. | Eventide Healthcare & Life Sciences Fund commenced operations on December 27, 2012. |
| Comparison of the Change in Value of a $100,000 Investment | | Comparison of the Change in Value of a $10,000 Investment |
| | | |
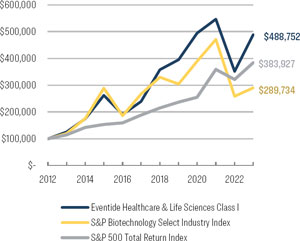 | | 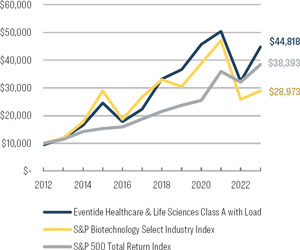 |
| A N N U A L R E P O R T | June 30, 2023 |
| Eventide Healthcare & Life Sciences Fund | |
| Portfolio Review (Unaudited) (Continued) | June 30, 2023 |
| Holdings by Industry or Asset Class | | % of Net Assets | |
| Biotech & Pharma | | | 69.7 | % |
| Medical Equipment & Devices | | | 16.7 | % |
| Short-Term Investments | | | 8.0 | % |
| Software | | | 5.7 | % |
| Other / Cash & Cash Equivalents | | | (0.1 | )% |
| | | | 100.0 | % |
| | | | | |
| Please refer to the Schedule of Investments in this annual report for a detailed listing of the Fund’s holdings. |
| A N N U A L R E P O R T | June 30, 2023 |
| Eventide Large Cap Focus Fund | |
| Portfolio Review (Unaudited) | June 30, 2023 |
Average Annual Total Return through June 30, 20231, as compared to its benchmark:
| | | Since |
| | 1 Year Return | Inception 1 |
| Class N | 14.43% | 14.43% |
| Class A without load | 14.26% | 14.26% |
| Class A with 5.75% load | 7.69% | 7.69% |
| Class C | 13.60% | 13.60% |
| Class I | 14.55% | 14.55% |
| S&P 500 Total Return Index 2 | 19.59% | 19.59% |
| 1. | The performance data quoted here represents past performance. Current performance may be lower or higher than the performance data quoted above. Investment return and principal value will fluctuate, so that shares, when redeemed, may be worth more or less than their original cost. The returns shown do not reflect the deduction of taxes that a shareholder would pay on Fund distributions or on the redemptions of Fund shares. Total returns would have been lower absent the manager’s fee waiver. Past performance is no guarantee of future results. Performance figures for periods greater than 1 year are annualized. The Fund’s manager has contractually agreed to waive fees and/or reimburse expenses of the Fund to the extent necessary to limit operating expenses (excluding front-end or contingent deferred loads, taxes, leverage interest, brokerage commissions, expenses incurred in connection with any merger or reorganization, dividend expenses on securities sold short, underlying fund fees and expenses or extraordinary expenses such as litigation) at 1.19%, 1.94%, 1.14% and 0.94% for Class A shares, Class C shares, Class N shares and Class I shares, respectively, through October 31, 2023. Per the Fund’s most recent prospectus as supplemented, total annual Fund estimated expenses before waiver are 1.46%, 2.21%, 1.41% and 1.21% for Class A shares, Class C shares, Class N shares and Class I shares, respectively. Class A shares are subject to a maximum sales charge of 5.75% imposed on purchases and have a maximum deferred sales charge of 1.00% on purchases of $1 million or more made without an initial sales charge and applies to shares sold within 18 months. Class C shares are subject to a maximum deferred sales charge of 1.00% on shares sold within 12 months. A $15 fee may be charged for redemptions made by wire. For performance information current to the most recent month-end, please call toll-free 1-877-771-3836. |
| 2. | The S&P 500 Total Return Index, a registered trademark of McGraw-Hill Co., Inc., is a market capitalization-weighted index of 500 widely held common stocks. Investors cannot invest directly in an index. |
| 3. | Eventide Large Cap Focus Fund commenced operations on June 30, 2022. |
| Comparison of the Change in Value of a $100,000 Investment | | Comparison of the Change in Value of a $10,000 Investment |
| | | |
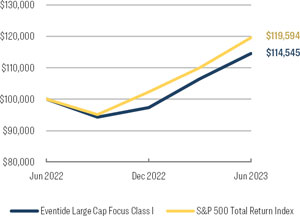 | | 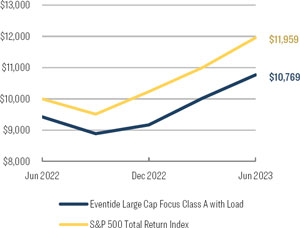 |
| A N N U A L R E P O R T | June 30, 2023 |
| Eventide Large Cap Focus Fund | |
| Portfolio Review (Unaudited) (Continued) | June 30, 2023 |
| Holdings by Industry or Asset Class | | % of Net Assets | |
| Software | | | 31.4 | % |
| Medical Equipment & Devices | | | 15.4 | % |
| Semiconductors | | | 13.2 | % |
| Retail - Discretionary | | | 6.2 | % |
| Technology Services | | | 5.6 | % |
| Commercial Support Services | | | 5.4 | % |
| Electrical Equipment | | | 4.5 | % |
| Biotech & Pharma | | | 3.2 | % |
| Chemicals | | | 3.0 | % |
| Short-Term Investments | | | 6.6 | % |
| Other / Cash & Cash Equivalents | | | 5.5 | % |
| | | | 100.0 | % |
| | | | | |
| Please refer to the Schedule of Investments in this annual report for a detailed listing of the Fund’s holdings. |
| A N N U A L R E P O R T | June 30, 2023 |
| Eventide Limited-Term Bond Fund |
| Portfolio Review (Unaudited) | June 30, 2023 |
Average Annual Total Return through June 30, 20231, as compared to its benchmarks:
| | | | 10 Year | Since | Since |
| | 1 Year Return | 5 Year Return | Return | Inception 4 | Inception 5 |
| Class N | 1.29% | N/A | N/A | N/A | 0.91% |
| Class A without load | 1.14% | 0.78% | 1.18% | 1.88% | N/A |
| Class A with 5.75% load | -4.64% | -0.40% | 0.58% | 1.41% | N/A |
| Class C | 0.49% | N/A | N/A | N/A | 0.11% |
| Class I | 1.46% | 1.04% | 1.06% | 1.58% | N/A |
| Bloomberg 1-5 Year Government/Credit Index 2 | 0.19% | 1.15% | 1.14% | 1.30% | 1.04% |
| Bloomberg U.S. Intermediate Aggregate Bond Index 3 | -0.60% | 0.83% | 1.33% | 1.67% | 0.69% |
| 1. | The performance data quoted here represents past performance. Current performance may be lower or higher than the performance data quoted above. Investment return and principal value will fluctuate, so that shares, when redeemed, may be worth more or less than their original cost. The returns shown do not reflect the deduction of taxes that a shareholder would pay on Fund distributions or on the redemptions of Fund shares. Total returns would have been lower absent the manager’s fee waiver. Past performance is no guarantee of future results. Performance figures for periods greater than 1 year are annualized. The Fund’s manager has contractually agreed to waive fees and/or reimburse expenses of the Fund to the extent necessary to limit operating expenses (excluding front-end or contingent deferred loads, taxes, leverage interest, brokerage commissions, expenses incurred in connection with any merger or reorganization, dividend expenses on securities sold short, underlying fund fees and expenses or extraordinary expenses such as litigation) at 0.80%, 1.55%, 0.75% and 0.55% for Class A shares, Class C shares, Class N shares and Class I shares, respectively, through October 31, 2023. Per the Fund’s most recent prospectus as supplemented, total annual Fund expenses before waiver are 0.87%, 1.62%, 0.82% and 0.62% for Class A shares, Class C shares, Class N shares and Class I shares, respectively. Class A shares are subject to a maximum sales charge of 5.75% imposed on purchases and have a maximum deferred sales charge of 1.00% on purchases of $1 million or more made without an initial sales charge and applies to shares sold within 18 months. Class C shares are subject to a maximum deferred sales charge of 1.00% on shares sold within 12 months. A $15 fee may be charged for redemptions made by wire. For performance information current to the most recent month-end, please call toll-free 1-877-771-3836. |
| 2. | The Bloomberg 1-5 Year Government/Credit Index measures the performance of U.S. dollar-denominated U.S. Treasury bonds, government related bonds (i.e., U.S. and non-U.S. agencies, sovereign, quasi-sovereign, supranational and local authority debt) and investment grade U.S. corporate bonds that have a remaining maturity of greater than or equal to one year and less than five years. Investors cannot invest directly in an index. |
| 3. | The Bloomberg U.S. Intermediate Aggregate Bond Index is a market capitalization-weighted index, meaning the securities in the index are weighted according to the market size of each bond type. Most U.S. traded investment grade bonds are represented. Municipal bonds, and Treasury Inflation-Protected Securities are excluded, due to tax treatment issues. The index includes Treasury securities, government agency bonds, mortgage-backed bonds, corporate bonds, and a small amount of foreign bonds traded in U.S. Investors cannot invest directly in an index. |
| 4. | Class A and Class I commenced operations on July 28, 2010. |
| 5. | Class N and Class C commenced operations on December 14, 2018. |
| Comparison of the Change in Value of a $100,000 Investment | | Comparison of the Change in Value of a $10,000 Investment |
| | | |
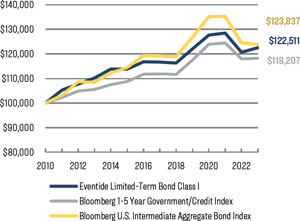 | | 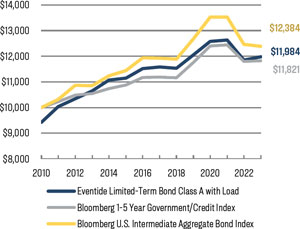 |
| A N N U A L R E P O R T | June 30, 2023 |
| Eventide Limited-Term Bond Fund |
| Portfolio Review (Unaudited) (Continued) | June 30, 2023 |
| Holdings by Industry or Asset Class | | % of Net Assets | |
| Government Sponsored | | | 17.6 | % |
| Electric Utilities | | | 14.2 | % |
| Banking | | | 9.0 | % |
| Real Estate Investment Trusts | | | 7.5 | % |
| Government Owned, No Guarantee | | | 6.0 | % |
| Insurance | | | 4.9 | % |
| Auto Loan | | | 3.6 | % |
| Institutional Financial Services | | | 3.2 | % |
| Engineering & Construction | | | 3.0 | % |
| Machinery | | | 2.6 | % |
| Other / Cash & Cash Equivalents | | | 28.4 | % |
| | | | 100.0 | % |
| | | | | |
| Please refer to the Schedule of Investments in this annual report for a detailed listing of the Fund’s holdings. |
| A N N U A L R E P O R T | June 30, 2023 |
| Eventide Multi-Asset Income Fund |
| Portfolio Review (Unaudited) | June 30, 2023 |
Average Annual Total Return through June 30, 20231, as compared to its benchmarks:
| | | | Since |
| | 1 Year Return | 5 Year Return | Inception 6 |
| Class N | 5.35% | 6.63% | 6.06% |
| Class A without load | 5.29% | 6.63% | 6.03% |
| Class A with 5.75% load | -0.76% | 5.38% | 5.24% |
| Class C | 4.54% | 5.79% | 5.22% |
| Class I | 5.57% | 6.83% | 6.27% |
| Russell Midcap Total Return Index 2 | 14.92% | 8.46% | 8.76% |
| Bloomberg U.S. Intermediate Aggregate Bond Index 3 | -0.60% | 0.83% | 0.98% |
| Multi-Asset Income Blended Index 4 | 7.34% | 5.14% | 5.22% |
| Russell Midcap Value Index 5 | 10.50% | 6.84% | 7.50% |
| 1. | The performance data quoted here represents past performance. Current performance may be lower or higher than the performance data quoted above. Investment return and principal value will fluctuate, so that shares, when redeemed, may be worth more or less than their original cost. The returns shown do not reflect the deduction of taxes that a shareholder would pay on Fund distributions or on the redemptions of Fund shares. Past performance is no guarantee of future results. Performance figures for periods greater than 1 year are annualized. The Fund’s manager has contractually agreed to waive fees and/or reimburse expenses of the Fund to the extent necessary to limit operating expenses (excluding front-end or contingent deferred loads, taxes, leverage interest, brokerage commissions, expenses incurred in connection with any merger or reorganization, dividend expenses on securities sold short, underlying fund fees and expenses or extraordinary expenses such as litigation) at 1.07%, 1.82%, 1.02% and 0.82% for Class A shares, Class C shares, Class N shares and Class I shares, respectively, through October 31, 2023. Per the Fund’s most recent prospectus, total annual Fund expenses before waiver are 1.07%, 1.82%, 1.02% and 0.82% for Class A shares, Class C shares, Class N shares and Class I shares, respectively. Class A shares are subject to a maximum sales charge of 5.75% imposed on purchases and have a maximum deferred sales charge of 1.00% on purchases of $1 million or more made without an initial sales charge and applies to shares sold within 18 months. Class C shares are subject to a maximum deferred sales charge of 1.00% on shares sold within 12 months. A $15 fee may be charged for redemptions made by wire. For performance information current to the most recent month-end, please call toll-free 1-877-771-3836. |
| 2. | The Russell Midcap Total Return Index measures the performance of the mid-cap segment of the US equity universe. It is a subset of the Russell 1000 Index. It includes approximately 800 of the smallest securities based on a combination of their market cap and current index membership, representing approximately 31% of the total market capitalization of the Russell 1000 companies. It is constructed to provide a comprehensive and unbiased barometer for the mid-cap segment. The index is completely reconstituted annually to ensure larger stocks do not distort the performance and characteristics of the true mid-cap opportunity set. Investors cannot invest directly in an index. |
| 3. | The Bloomberg U.S. Intermediate Aggregate Bond Index is a market capitalization-weighted index, meaning the securities in the index are weighted according to the market size of each bond type. Most U.S. traded investment grade bonds are represented. Municipal bonds, and Treasury Inflation-Protected Securities are excluded, due to tax treatment issues. The index includes Treasury securities, government agency bonds, mortgage-backed bonds, corporate bonds, and a small amount of foreign bonds traded in U.S. Investors cannot invest directly in an index. |
| 4. | The Multi-Asset Income Blended Index is comprised of 50% of the Russell Midcap Total Return Index and 50% of the Bloomberg U.S. Intermediate Aggregate Bond Index. The Eventide Multi-Asset Income Blended Index rebalances its weightings on a monthly frequency. Investors cannot invest directly in an index. |
| 5. | The Russell Midcap Value Index measures the performance of the mid-capitalization U.S. equities that exhibit value characteristics. It includes those Russell Midcap Index companies with relatively lower price-to-book ratios, lower I/B/E/S forecast medium term (2 year) growth and lower sales per share historical growth (5 years). Investors cannot invest directly in an index. |
| 6. | Eventide Multi-Asset Income Fund commenced operations on July 15, 2015. |
| Comparison of the Change in Value of a $100,000 Investment | | Comparison of the Change in Value of a $10,000 Investment |
| | | |
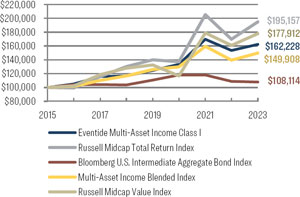 | | 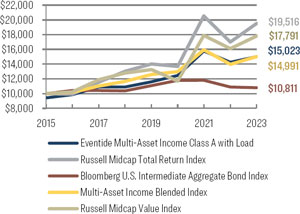 |
| A N N U A L R E P O R T | June 30, 2023 |
| Eventide Multi-Asset Income Fund | |
| Portfolio Review (Unaudited) (Continued) | June 30, 2023 |
| Holdings by Industry or Asset Class | | % of Net Assets | |
| Agency Fixed Rate | | | 12.3 | % |
| Electric Utilities | | | 8.2 | % |
| Electric Equipment | | | 7.7 | % |
| Oil & Gas Producers | | | 5.6 | % |
| Semiconductors | | | 4.1 | % |
| Government Sponsored | | | 4.0 | % |
| Technology Services | | | 3.9 | % |
| Medical Equipment & Devices | | | 3.7 | % |
| Software | | | 3.6 | % |
| Real Estate Investment Trusts | | | 3.6 | % |
| Other / Cash & Cash Equivalents | | | 43.3 | % |
| | | | 100.0 | % |
| | | | | |
| Please refer to the Schedule of Investments in this annual report for a detailed listing of the Fund’s holdings. |
| A N N U A L R E P O R T | June 30, 2023 |
| Eventide Core Bond Fund | |
| SCHEDULE OF INVESTMENTS | June 30, 2023 |
Principal
Amount ($) | | | | | | | Coupon
Rate (%) | | Maturity | | Fair Value | |
| | | | | ASSET BACKED SECURITIES — 4.5% | | | | | | | | | | |
| | | | | AUTO LOAN — 2.8% | | | | | | | | | | |
| | 1,375,000 | | | CarMax Auto Owner Trust Series 2020-4 C | | | | 1.3000 | | 08/17/26 | | $ | 1,278,252 | |
| | 1,000,000 | | | CarMax Auto Owner Trust Series 2021-2 C | | | | 1.3400 | | 02/16/27 | | | 914,768 | |
| | | | | | | | | | | | | | 2,193,020 | |
| | | | | OTHER ABS — 1.7% | | | | | | | | | | |
| | 1,350,000 | | | PFS Financing Corporation Series 2020-G A1 | | | | 0.9700 | | 02/15/26 | | | 1,306,510 | |
| | | | | | | | | | | | | | | |
| | | | | TOTAL ASSET BACKED SECURITIES (Cost $3,736,515) | | | | | | | | | 3,499,530 | |
| | | | | | | | | | | | | | | |
Principal
Amount ($) | | | | | Spread | | Coupon
Rate (%) | | Maturity | | Fair Value | |
| | | | | CORPORATE BONDS — 47.2% | | | | | | | | | | |
| | | | | AUTOMOTIVE — 0.5% | | | | | | | | | | |
| | 500,000 | | | Dana, Inc. | | | | 4.2500 | | 09/01/30 | | | 416,717 | |
| | | | | | | | | | | | | | | |
| | | | | BANKING — 5.4% | | | | | | | | | | |
| | 1,575,000 | | | Bank of America Corporation Series N2 | | US0003M + 0.870% | | 2.4560 | | 10/22/25 | | | 1,504,138 | |
| | 1,550,000 | | | JPMorgan Chase & Company2 | | SOFRRATE + 0.600% | | 0.6530 | | 09/16/24 | | | 1,531,993 | |
| | 1,200,000 | | | National Bank of Canada2 | | H15T1Y + 0.400% | | 0.5500 | | 11/15/24 | | | 1,175,008 | |
| | | | | | | | | | | | | | 4,211,139 | |
| | | | | COMMERCIAL SUPPORT SERVICES — 1.5% | | | | | | | | | | |
| | 1,350,000 | | | Waste Management, Inc. | | | | 4.1500 | | 07/15/49 | | | 1,185,706 | |
| | | | | | | | | | | | | | | |
| | | | | ELEC & GAS MARKETING & TRADING — 0.7% | | | | | | | | | | |
| | 700,000 | | | Consolidated Edison Company of New York, Inc. | | | | 3.9500 | | 04/01/50 | | | 572,563 | |
| | | | | | | | | | | | | | | |
| | | | | ELECTRIC UTILITIES — 14.5% | | | | | | | | | | |
| | 1,125,000 | | | Ameren Illinois Company | | | | 5.9000 | | 12/01/52 | | | 1,227,343 | |
| | 500,000 | | | CenterPoint Energy, Inc.2 | | SOFRRATE + 0.650% | | 5.7220 | | 05/13/24 | | | 499,547 | |
| | 1,425,000 | | | DTE Electric Company | | | | 3.9500 | | 03/01/49 | | | 1,173,267 | |
| | 1,250,000 | | | Duke Energy Florida, LLC | | | | 2.5000 | | 12/01/29 | | | 1,080,019 | |
| | 650,000 | | | Interstate Power and Light Company | | | | 3.5000 | | 09/30/49 | | | 474,479 | |
| | 1,325,000 | | | MidAmerican Energy Company | | | | 4.2500 | | 07/15/49 | | | 1,127,263 | |
| | 1,400,000 | | | National Rural Utilities Cooperative Finance Corporation | | | | 1.3500 | | 03/15/31 | | | 1,068,590 | |
See accompanying notes to financial statements.
| A N N U A L R E P O R T | June 30, 2023 |
| Eventide Core Bond Fund | |
| SCHEDULE OF INVESTMENTS (Continued) | June 30, 2023 |
Principal
Amount ($) | | | | | Spread | | Coupon
Rate (%) | | Maturity | | Fair Value | |
| | | | | CORPORATE BONDS — 47.2% (Continued) | | | | | | | | | | |
| | | | | ELECTRIC UTILITIES — 14.5% (Continued) | | | | | | | | | | |
| | 675,000 | | | NextEra Energy Capital Holdings, Inc. | | | | 5.0500 | | 02/28/33 | | $ | 664,647 | |
| | 500,000 | | | NextEra Energy Capital Holdings, Inc.2 | | US0003M + 2.409% | | 4.8000 | | 12/01/77 | | | 440,023 | |
| | 1,825,000 | | | Northern States Power Company | | | | 2.9000 | | 03/01/50 | | | 1,257,724 | |
| | 1,450,000 | | | Public Service Company of Oklahoma | | | | 3.1500 | | 08/15/51 | | | 961,690 | |
| | 1,750,000 | | | Wisconsin Public Service Corporation | | | | 2.8500 | | 12/01/51 | | | 1,155,205 | |
| | | | | | | | | | | | | | 11,129,797 | |
| | | | | ENGINEERING & CONSTRUCTION — 3.2% | | | | | | | | | | |
| | 600,000 | | | Installed Building Products, Inc.1 | | | | 5.7500 | | 02/01/28 | | | 566,184 | |
| | 800,000 | | | MasTec, Inc.1 | | | | 4.5000 | | 08/15/28 | | | 738,298 | |
| | 1,400,000 | | | Quanta Services, Inc. Class B | | | | 2.9000 | | 10/01/30 | | | 1,186,001 | |
| | | | | | | | | | | | | | 2,490,483 | |
| | | | | INSTITUTIONAL FINANCIAL SERVICES — 3.5% | | | | | | | | | | |
| | 1,625,000 | | | Morgan Stanley2 | | SOFRRATE + 0.745% | | 0.8640 | | 10/21/25 | | | 1,511,703 | |
| | 1,825,000 | | | Nasdaq, Inc. | | | | 3.2500 | | 04/28/50 | | | 1,232,657 | |
| | | | | | | | | | | | | | 2,744,360 | |
| | | | | INSURANCE — 2.5% | | | | | | | | | | |
| | 1,000,000 | | | Aflac, Inc. | | | | 1.1250 | | 03/15/26 | | | 895,473 | |
| | 1,125,000 | | | Pacific Life Global Funding II1 | | | | 1.3750 | | 04/14/26 | | | 1,005,520 | |
| | | | | | | | | | | | | | 1,900,993 | |
| | | | | MACHINERY — 1.9% | | | | | | | | | | |
| | 650,000 | | | Mueller Water Products, Inc.1 | | | | 4.0000 | | 06/15/29 | | | 576,973 | |
| | 1,000,000 | | | Xylem, Inc./NY | | | | 1.9500 | | 01/30/28 | | | 877,676 | |
| | | | | | | | | | | | | | 1,454,649 | |
| | | | | OIL & GAS PRODUCERS — 2.5% | | | | | | | | | | |
| | 1,000,000 | | | Cheniere Energy Partners, L.P. | | | | 4.5000 | | 10/01/29 | | | 918,477 | |
| | 1,150,000 | | | Diamondback Energy, Inc. | | | | 3.5000 | | 12/01/29 | | | 1,034,234 | |
| | | | | | | | | | | | | | 1,952,711 | |
| | | | | REAL ESTATE INVESTMENT TRUSTS — 3.8% | | | | | | | | | | |
| | 750,000 | | | Alexandria Real Estate Equities, Inc. | | | | 4.7500 | | 04/15/35 | | | 696,410 | |
| | 500,000 | | | AvalonBay Communities, Inc. | | | | 2.0500 | | 01/15/32 | | | 400,182 | |
| | 700,000 | | | HAT Holdings I, LLC/HAT Holdings II, LLC1 | | | | 3.3750 | | 06/15/26 | | | 628,045 | |
| | 1,180,000 | | | Public Storage2 | | SOFRRATE + 0.470% | | 5.5000 | | 04/23/24 | | | 1,179,478 | |
| | | | | | | | | | | | | | 2,904,115 | |
See accompanying notes to financial statements.
| A N N U A L R E P O R T | June 30, 2023 |
| Eventide Core Bond Fund | |
| SCHEDULE OF INVESTMENTS (Continued) | June 30, 2023 |
Principal
Amount ($) | | | | | Spread | | Coupon
Rate (%) | | Maturity | | Fair Value | |
| | | | | CORPORATE BONDS — 47.2% (Continued) | | | | | | | | | | |
| | | | | RETAIL - DISCRETIONARY — 1.5% | | | | | | | | | | |
| | 1,150,000 | | | AutoZone, Inc. | | | | 4.7500 | | 02/01/33 | | $ | 1,101,666 | |
| | | | | | | | | | | | | | | |
| | | | | SEMICONDUCTORS — 1.6% | | | | | | | | | | |
| | 500,000 | | | NVIDIA Corporation | | | | 3.5000 | | 04/01/50 | | | 406,583 | |
| | 1,000,000 | | | NXP BV/NXP Funding, LLC/NXP USA, Inc. | | | | 2.5000 | | 05/11/31 | | | 815,189 | |
| | | | | | | | | | | | | | 1,221,772 | |
| | | | | SOFTWARE — 1.2% | | | | | | | | | | |
| | 1,000,000 | | | Workday, Inc. | | | | 3.8000 | | 04/01/32 | | | 900,250 | |
| | | | | | | | | | | | | | | |
| | | | | TECHNOLOGY SERVICES — 1.3% | | | | | | | | | | |
| | 750,000 | | | Verisk Analytics, Inc. | | | | 5.7500 | | 04/01/33 | | | 785,672 | |
| | 250,000 | | | Verisk Analytics, Inc. | | | | 5.5000 | | 06/15/45 | | | 237,918 | |
| | | | | | | | | | | | | | 1,023,590 | |
| | | | | WHOLESALE - CONSUMER STAPLES — 1.6% | | | | | | | | | | |
| | 1,475,000 | | | Sysco Corporation | | | | 2.4000 | | 02/15/30 | | | 1,257,016 | |
| | | | | | | | | | | | | | | |
| | | | | TOTAL CORPORATE BONDS (Cost $41,396,789) | | | | | | | | | 36,467,527 | |
| | | | | | | | | | | | | | | |
Principal
Amount ($) | | | | | | | Coupon
Rate (%) | | Maturity | | Fair Value | |
| | | | | MUNICIPAL BONDS — 7.3% | | | | | | | | | | |
| | | | | COMBINED UTILITIES — 1.3% | | | | | | | | | | |
| | 1,000,000 | | | City of Tacoma, WA Electric System Revenue | | | | 5.6410 | | 01/01/27 | | | 1,021,428 | |
| | | | | | | | | | | | | | | |
| | | | | MISCELLANEOUS TAX — 1.1% | | | | | | | | | | |
| | 900,000 | | | Commonwealth of Massachusetts | | | | 3.6390 | | 07/15/24 | | | 882,045 | |
| | | | | | | | | | | | | | | |
| | | | | MULTI-FAMILY HOUSING — 1.0% | | | | | | | | | | |
| | 250,000 | | | Maine State Housing Authority | | | | 0.4000 | | 11/15/24 | | | 239,303 | |
| | 500,000 | | | New York City Housing Development Corporation | | | | 0.6500 | | 11/01/25 | | | 466,736 | |
| | 100,000 | | | New York State Housing Finance Agency | | | | 0.7000 | | 11/01/25 | | | 93,458 | |
| | | | | | | | | | | | | | 799,497 | |
| | | | | SINGLE-FAMILY HOUSING — 1.1% | | | | | | | | | | |
| | 420,855 | | | Minnesota Housing Finance Agency | | | | 1.5800 | | 02/01/51 | | | 335,524 | |
See accompanying notes to financial statements.
| A N N U A L R E P O R T | June 30, 2023 |
| Eventide Core Bond Fund | |
| SCHEDULE OF INVESTMENTS (Continued) | June 30, 2023 |
Principal
Amount ($) | | | | | Coupon
Rate (%) | | Maturity | | Fair Value | |
| | | | | MUNICIPAL BONDS — 7.3% (Continued) | | | | | | | | |
| | | | | SINGLE-FAMILY HOUSING — 1.1% (Continued) | | | | | | | | |
| | 480,000 | | | Texas Department of Housing & Community Affairs | | 0.5000 | | 07/01/24 | | $ | 465,335 | |
| | | | | | | | | | | | 800,859 | |
| | | | | STATE — 1.3% | | | | | | | | |
| | 1,250,000 | | | State of Oregon | | 2.3370 | | 11/01/33 | | | 1,016,821 | |
| | | | | | | | | | | | | |
| | | | | WATER AND SEWER — 1.5% | | | | | | | | |
| | 1,500,000 | | | City of Aurora, CO Water Revenue | | 2.6260 | | 08/01/41 | | | 1,108,569 | |
| | | | | | | | | | | | | |
| | | | | TOTAL MUNICIPAL BONDS (Cost $6,563,535) | | | | | | | 5,629,219 | |
| | | | | | | | | | | | | |
Principal
Amount ($) | | | | | Coupon
Rate (%) | | Maturity | | | Fair Value | |
| | | | | U.S. GOVERNMENT & AGENCIES — 38.9% | | | | | | | | |
| | | | | AGENCY FIXED RATE — 23.6% | | | | | | | | |
| | 898,963 | | | Fannie Mae Pool BO9355 | | 3.0000 | | 03/01/50 | | | 798,179 | |
| | 890,689 | | | Fannie Mae Pool BP5878 | | 2.5000 | | 06/01/50 | | | 760,496 | |
| | 759,892 | | | Fannie Mae Pool FM4720 | | 3.0000 | | 10/01/50 | | | 674,463 | |
| | 749,471 | | | Fannie Mae Pool CA8256 | | 2.5000 | | 12/01/50 | | | 638,186 | |
| | 713,118 | | | Fannie Mae Pool MA4307 | | 3.0000 | | 04/01/51 | | | 630,791 | |
| | 1,696,603 | | | Fannie Mae Pool MA4379 | | 2.5000 | | 07/01/51 | | | 1,444,880 | |
| | 1,584,575 | | | Fannie Mae Pool MA4625 | | 3.5000 | | 06/01/52 | | | 1,445,561 | |
| | 948,338 | | | Fannie Mae Pool MA4655 | | 4.0000 | | 07/01/52 | | | 890,991 | |
| | 1,098,916 | | | Fannie Mae Pool MA4700 | | 4.0000 | | 08/01/52 | | | 1,032,122 | |
| | 1,266,939 | | | Fannie Mae Pool MA4916 | | 4.0000 | | 02/01/53 | | | 1,189,605 | |
| | 1,029,215 | | | Freddie Mac Pool SD8090 | | 2.0000 | | 09/01/50 | | | 847,784 | |
| | 911,430 | | | Freddie Mac Pool SD8128 | | 2.0000 | | 02/01/51 | | | 748,697 | |
| | 661,298 | | | Freddie Mac Pool SD8129 | | 2.5000 | | 02/01/51 | | | 564,596 | |
| | 1,056,548 | | | Freddie Mac Pool RA5696 | | 2.5000 | | 08/01/51 | | | 898,756 | |
| | 1,633,820 | | | Freddie Mac Pool SD8206 | | 3.0000 | | 04/01/52 | | | 1,440,364 | |
| | 1,666,761 | | | Freddie Mac Pool RA7587 | | 3.5000 | | 06/01/52 | | | 1,521,169 | |
| | 622,141 | | | Freddie Mac Pool SD8237 | | 4.0000 | | 08/01/52 | | | 584,455 | |
| | 1,530,686 | | | Freddie Mac Pool SD8238 | | 4.5000 | | 08/01/52 | | | 1,473,411 | |
| | 728,186 | | | Freddie Mac Pool SD8288 | | 5.0000 | | 01/01/53 | | | 714,284 | |
| | | | | | | | | | | | 18,298,790 | |
See accompanying notes to financial statements.
| A N N U A L R E P O R T | June 30, 2023 |
| Eventide Core Bond Fund | |
| SCHEDULE OF INVESTMENTS (Continued) | June 30, 2023 |
Principal
Amount ($) | | | | | Coupon
Rate (%) | | Maturity | | Fair Value | |
| | | | | U.S. GOVERNMENT & AGENCIES — 38.9% (Continued) | | | | | | | | |
| | | | | AGENCY MBS OTHER — 1.9% | | | | | | | | |
| | 1,518,348 | | | Fannie Mae Pool MA4805 | | 4.5000 | | 11/01/52 | | $ | 1,461,180 | |
| | | | | | | | | | | | | |
| | | | | GOVERNMENT OWNED, NO GUARANTEE — 1.8% | | | | | | | | |
| | 1,200,000 | | | Federal National Mortgage Association | | 5.6250 | | 07/15/37 | | | 1,376,187 | |
| | | | | | | | | | | | | |
| | | | | GOVERNMENT SPONSORED — 11.6% | | | | | | | | |
| | 1,000,000 | | | Federal Farm Credit Banks Funding Corporation | | 4.1250 | | 01/11/29 | | | 987,116 | |
| | 1,425,000 | | | Federal Farm Credit Banks Funding Corporation | | 4.5000 | | 03/09/29 | | | 1,443,054 | |
| | 1,550,000 | | | Federal Farm Credit Banks Funding Corporation | | 2.0400 | | 09/24/29 | | | 1,363,904 | |
| | 1,250,000 | | | Federal Farm Credit Banks Funding Corporation | | 1.7300 | | 09/22/31 | | | 1,012,374 | |
| | 1,100,000 | | | Federal Farm Credit Banks Funding Corporation | | 4.0000 | | 02/09/33 | | | 1,076,024 | |
| | 1,500,000 | | | Federal Farm Credit Banks Funding Corporation | | 4.3750 | | 03/03/33 | | | 1,501,412 | |
| | 1,000,000 | | | Federal Home Loan Mortgage Corporation | | 5.2000 | | 05/17/24 | | | 994,788 | |
| | 600,000 | | | Federal Home Loan Mortgage Corporation | | 5.2500 | | 12/09/24 | | | 595,447 | |
| | | | | | | | | | | | 8,974,119 | |
| | | | | TOTAL U.S. GOVERNMENT & AGENCIES (Cost $31,974,457) | | | | | | | 30,110,276 | |
| | | | | | | | | | | | | |
| Shares | | | | | | | | | Fair Value | |
| | | | | SHORT-TERM INVESTMENTS — 1.0% | | | | | | | | |
| | | | | MONEY MARKET FUNDS — 1.0% | | | | | | | | |
| | 800,919 | | | First American Government Obligations Fund, Class U, 5.03%3 (Cost $800,919) | | | | | | | 800,919 | |
| | | | | | | | | | | | | |
| | | | | TOTAL INVESTMENTS — 98.9% (Cost $84,472,215) | | | | | | $ | 76,507,471 | |
| | | | | OTHER ASSETS IN EXCESS OF LIABILITIES- 1.1% | | | | | | | 870,628 | |
| | | | | NET ASSETS — 100.0% | | | | | | $ | 77,378,099 | |
| LLC | - Limited Liability Company |
| L.P. | - Limited Partnership |
| H15T1Y | US Treasury Yield Curve Rate T Note Constant Maturity 1 Year |
| SOFRRATE | United States SOFR Secured Overnight Financing Rate |
| US0003M | ICE LIBOR USD 3 Month |
| 1. | Security exempt from registration under Rule 144A or Section 4(2) of the Securities Act of 1933. The security may be resold in transactions exempt from registration, normally to qualified institutional buyers. As of June 30, 2023 the total market value of 144A securities is $4,821,530 or 6.2% of net assets. |
| 2. | Variable or floating rate security, the interest rate of which adjusts periodically based on changes in current interest rates and prepayments on the underlying pool of assets. |
| 3. | Rate disclosed is the seven day effective yield as of June 30, 2023. |
See accompanying notes to financial statements.
| A N N U A L R E P O R T | June 30, 2023 |
| Eventide Dividend Opportunities Fund | |
| SCHEDULE OF INVESTMENTS | June 30, 2023 |
| Shares | | | | | Fair Value | |
| | | | | COMMON STOCKS — 95.7% | | | | |
| | | | | AUTOMOTIVE — 1.2% | | | | |
| | 67,213 | | | Aptiv PLC1 | | $ | 6,861,724 | |
| | | | | | | | | |
| | | | | BIOTECH & PHARMA — 2.6% | | | | |
| | 476,007 | | | Royalty Pharma plc, Class A | | | 14,632,455 | |
| | | | | | | | | |
| | | | | CHEMICALS — 5.2% | | | | |
| | 598,608 | | | Element Solutions, Inc. | | | 11,493,274 | |
| | 69,679 | | | Sherwin-Williams Company (The) | | | 18,501,168 | |
| | | | | | | | 29,994,442 | |
| | | | | DATA CENTER REIT — 1.0% | | | | |
| | 7,322 | | | Equinix, Inc. | | | 5,740,009 | |
| | | | | | | | | |
| | | | | DIVERSIFIED INDUSTRIALS — 2.9% | | | | |
| | 256,166 | | | Pentair PLC | | | 16,548,324 | |
| | | | | | | | | |
| | | | | ELECTRIC UTILITIES — 4.4% | | | | |
| | 256,358 | | | CMS Energy Corporation | | | 15,061,032 | |
| | 172,676 | | | NextEra Energy Partners, L.P. | | | 10,125,721 | |
| | | | | | | | 25,186,753 | |
| | | | | ELECTRICAL EQUIPMENT — 15.0% | | | | |
| | 611,190 | | | nVent Electric PLC | | | 31,580,187 | |
| | 60,043 | | | Roper Technologies, Inc. | | | 28,868,674 | |
| | 135,085 | | | Trane Technologies PLC | | | 25,836,357 | |
| | | | | | | | 86,285,218 | |
| | | | | HEALTH CARE FACILITIES & SERVICES — 1.6% | | | | |
| | 138,000 | | | Encompass Health Corporation | | | 9,343,980 | |
| | | | | | | | | |
| | | | | HOME CONSTRUCTION — 1.4% | | | | |
| | 66,013 | | | DR Horton, Inc. | | | 8,033,122 | |
| | | | | | | | | |
| | | | | INDUSTRIAL REIT — 4.0% | | | | |
| | 33,255 | | | EastGroup Properties, Inc. | | | 5,773,068 | |
| | 140,256 | | | Prologis, Inc. | | | 17,199,593 | |
| | | | | | | | 22,972,661 | |
See accompanying notes to financial statements.
| A N N U A L R E P O R T | June 30, 2023 |
| Eventide Dividend Opportunities Fund | |
| SCHEDULE OF INVESTMENTS (Continued) | June 30, 2023 |
| Shares | | | | | Fair Value | |
| | | | | COMMON STOCKS — 95.7% (Continued) | | | | |
| | | | | INSTITUTIONAL FINANCIAL SERVICES — 1.2% | | | | |
| | 139,895 | | | Nasdaq, Inc. | | $ | 6,973,766 | |
| | | | | | | | | |
| | | | | INSURANCE — 2.9% | | | | |
| | 74,842 | | | Arthur J Gallagher & Company | | | 16,433,058 | |
| | | | | | | | | |
| | | | | MACHINERY — 1.9% | | | | |
| | 50,357 | | | IDEX Corporation | | | 10,839,848 | |
| | | | | | | | | |
| | | | | MEDICAL EQUIPMENT & DEVICES — 7.4% | | | | |
| | 169,280 | | | Bruker Corporation | | | 12,513,178 | |
| | 8,480 | | | Mettler-Toledo International, Inc.1 | | | 11,122,707 | |
| | 85,255 | | | STERIS plc | | | 19,180,670 | |
| | | | | | | | 42,816,555 | |
| | | | | OIL & GAS PRODUCERS — 10.0% | | | | |
| | 87,248 | | | Diamondback Energy, Inc. | | | 11,460,897 | |
| | 301,630 | | | Targa Resources Corporation | | | 22,954,044 | |
| | 697,280 | | | Williams Companies, Inc. (The) | | | 22,752,246 | |
| | | | | | | | 57,167,187 | |
| | | | | RESIDENTIAL REIT — 2.3% | | | | |
| | 197,811 | | | Equity LifeStyle Properties, Inc. | | | 13,231,578 | |
| | | | | | | | | |
| | | | | RETAIL - DISCRETIONARY — 3.2% | | | | |
| | 60,920 | | | Lithia Motors, Inc. | | | 18,526,382 | |
| | | | | | | | | |
| | | | | SEMICONDUCTORS — 4.9% | | | | |
| | 68,293 | | | Entegris, Inc. | | | 7,568,230 | |
| | 41,979 | | | KLA Corporation | | | 20,360,655 | |
| | | | | | | | 27,928,885 | |
| | | | | SOFTWARE — 7.0% | | | | |
| | 69,205 | | | Palo Alto Networks, Inc.1 | | | 17,682,569 | |
| | 38,748 | | | Synopsys, Inc.1 | | | 16,871,267 | |
| | 25,603 | | | Workday, Inc., Class A1 | | | 5,783,462 | |
| | | | | | | | 40,337,298 | |
See accompanying notes to financial statements.
| A N N U A L R E P O R T | June 30, 2023 |
| Eventide Dividend Opportunities Fund | |
| SCHEDULE OF INVESTMENTS (Continued) | June 30, 2023 |
| Shares | | | | | | | | | Fair Value | |
| | | | | COMMON STOCKS — 95.7% (Continued) | | | | | | | | |
| | | | | TECHNOLOGY SERVICES — 8.0% | | | | | | | | |
| | 130,515 | | | CDW Corporation | | | | | | $ | 23,949,503 | |
| | 22,679 | | | MSCI, Inc. | | | | | | | 10,643,028 | |
| | 50,046 | | | Verisk Analytics, Inc. | | | | | | | 11,311,897 | |
| | | | | | | | | | | | 45,904,428 | |
| | | | | TRANSPORTATION & LOGISTICS — 3.2% | | | | | | | | |
| | 49,200 | | | Old Dominion Freight Line, Inc. | | | | | | | 18,191,699 | |
| | | | | | | | | | | | | |
| | | | | WHOLESALE - CONSUMER STAPLES — 1.9% | | | | | | | | |
| | 148,366 | | | Sysco Corporation | | | | | | | 11,008,757 | |
| | | | | | | | | | | | | |
| | | | | WHOLESALE - DISCRETIONARY — 2.5% | | | | | | | | |
| | 37,610 | | | Pool Corporation | | | | | | | 14,090,210 | |
| | | | | | | | | | | | | |
| | | | | TOTAL COMMON STOCKS (Cost $492,432,978) | | | | | | | 549,048,339 | |
| | | | | | | | | | | | | |
Principal
Amount ($) | | | | | Coupon
Rate (%) | | Maturity | | | Fair Value | |
| | | | | CORPORATE BONDS — 0.7% | | | | | | | | |
| | | | | ASSET MANAGEMENT — 0.7% | | | | | | | | |
| | 2,000,000 | | | Calvert Impact Capital, Inc.2 | | 1.0000 | | 11/15/23 | | | 2,000,300 | |
| | 2,000,000 | | | Vision Fund International2,3,4,5 | | 2.6110 | | 11/30/23 | | | 2,000,000 | |
| | | | | TOTAL CORPORATE BONDS (Cost $4,000,000) | | | | | | | 4,000,300 | |
| | | | | | | | | | | | | |
| Shares | | | | | | | | | Fair Value | |
| | | | | SHORT-TERM INVESTMENTS — 2.8% | | | | | | | | |
| | | | | MONEY MARKET FUNDS — 2.8% | | | | | | | | |
| | 106,027 | | | Fidelity Government Portfolio, Class I, 4.98%6 | | | | | | | 106,027 | |
| | 15,922,090 | | | First American Government Obligations Fund, Class U, 5.03%6 | | | | | | | 15,922,089 | |
| | | | | TOTAL MONEY MARKET FUNDS (Cost $16,028,116) | | | | | | | 16,028,116 | |
| | | | | | | | | | | | | |
| | | | | TOTAL SHORT-TERM INVESTMENTS (Cost $16,028,116) | | | | | | | 16,028,116 | |
See accompanying notes to financial statements.
| A N N U A L R E P O R T | June 30, 2023 |
| Eventide Dividend Opportunities Fund | |
| SCHEDULE OF INVESTMENTS (Continued) | June 30, 2023 |
| | | | | | Fair Value | |
| | | | | TOTAL INVESTMENTS — 99.2% (Cost $512,461,094) | | $ | 569,076,755 | |
| | | | | OTHER ASSETS IN EXCESS OF LIABILITIES- 0.8% | | | 4,732,280 | |
| | | | | NET ASSETS — 100.0% | | $ | 573,809,035 | |
| L.P. | - Limited Partnership |
| PLC | - Public Limited Company |
| REIT | - Real Estate Investment Trust |
| 1. | Non-income producing security. |
| 2. | Illiquid security. The total fair value of these securities as of June 30, 2023 was $4,000,300, representing 0.7% of net assets. |
| 3. | The value of this security has been determined in good faith under policies of the Board of Trustees. |
| 4. | Restricted security. See Note 6 for additional details. |
| 6. | Rate disclosed is the seven day effective yield as of June 30, 2023. |
See accompanying notes to financial statements.
| A N N U A L R E P O R T | June 30, 2023 |
| Eventide Exponential Technologies Fund | |
| SCHEDULE OF INVESTMENTS | June 30, 2023 |
| Shares | | | | | Fair Value | |
| | | | | COMMON STOCKS — 94.2% | | | | |
| | | | | ADVERTISING & MARKETING — 2.5% | | | | |
| | 37,022 | | | Trade Desk, Inc. (The), Class A1 | | $ | 2,858,839 | |
| | | | | | | | | |
| | | | | BIOTECH & PHARMA — 2.6% | | | | |
| | 36,225 | | | TransMedics Group, Inc.1 | | | 3,042,175 | |
| | | | | | | | | |
| | | | | CONSUMER SERVICES — 1.8% | | | | |
| | 160,533 | | | Coursera, Inc.1 | | | 2,090,140 | |
| | | | | | | | | |
| | | | | MEDICAL EQUIPMENT & DEVICES — 2.0% | | | | |
| | 8,180 | | | Shockwave Medical, Inc.1 | | | 2,334,654 | |
| | | | | | | | | |
| | | | | REAL ESTATE SERVICES — 0.1% | | | | |
| | 17,266 | | | Compass, Inc.1 | | | 60,431 | |
| | | | | | | | | |
| | | | | RENEWABLE ENERGY — 4.0% | | | | |
| | 181,955 | | | Shoals Technologies Group, Inc., Class A1 | | | 4,650,770 | |
| | | | | | | | | |
| | | | | RETAIL - CONSUMER STAPLES — 2.0% | | | | |
| | 92,499 | | | HelloFresh S.E.1 | | | 2,281,184 | |
| | | | | | | | | |
| | | | | SEMICONDUCTORS — 14.3% | | | | |
| | 27,356 | | | Entegris, Inc. | | | 3,031,592 | |
| | 5,560 | | | KLA Corporation | | | 2,696,711 | |
| | 6,800 | | | Lam Research Corporation | | | 4,371,448 | |
| | 30,323 | | | Lattice Semiconductor Corporation1 | | | 2,913,131 | |
| | 6,493 | | | Monolithic Power Systems, Inc. | | | 3,507,713 | |
| | | | | | | | 16,520,595 | |
| | | | | SOFTWARE — 56.8% | | | | |
| | 398,774 | | | Arteris, Inc.1 | | | 2,719,639 | |
| | 1,934 | | | Constellation Software, Inc. | | | 4,027,826 | |
| | 20,003 | | | Crowdstrike Holdings, Inc., Class A1 | | | 2,937,841 | |
| | 26,504 | | | Datadog, Inc., Class A1 | | | 2,607,464 | |
| | 478,884 | | | Dlocal Ltd./Uruguay1 | | | 5,844,778 | |
| | 83,220 | | | DoubleVerify Holdings, Inc.1 | | | 3,238,922 | |
See accompanying notes to financial statements.
| A N N U A L R E P O R T | June 30, 2023 |
| Eventide Exponential Technologies Fund | |
| SCHEDULE OF INVESTMENTS (Continued) | June 30, 2023 |
| Shares | | | | | | | | | Fair Value | |
| | | | | COMMON STOCKS — 94.2% (Continued) | | | | | | | | |
| | | | | SOFTWARE — 56.8% (Continued) | | | | | | | | |
| | 102,728 | | | Doximity, Inc.1 | | | | | | $ | 3,494,807 | |
| | 28,562 | | | Five9, Inc.1 | | | | | | | 2,354,937 | |
| | 291,345 | | | Flywire Corporation1 | | | | | | | 9,043,349 | |
| | 98,431 | | | Global-e Online Ltd.1 | | | | | | | 4,029,765 | |
| | 89,962 | | | HashiCorp, Inc.1 | | | | | | | 2,355,205 | |
| | 6,000 | | | HubSpot, Inc.1 | | | | | | | 3,192,540 | |
| | 37,115 | | | Palo Alto Networks, Inc.1 | | | | | | | 9,483,253 | |
| | 63,954 | | | Sprout Social, Inc., Class A1 | | | | | | | 2,952,117 | |
| | 12,955 | | | Synopsys, Inc.1 | | | | | | | 5,640,737 | |
| | 8,004 | | | Workday, Inc., Class A1 | | | | | | | 1,808,024 | |
| | | | | | | | | | | | 65,731,204 | |
| | | | | SPECIALTY FINANCE — 1.2% | | | | | | | | |
| | 150,000 | | | NerdWallet, Inc.1 | | | | | | | 1,411,500 | |
| | | | | | | | | | | | | |
| | | | | TECHNOLOGY HARDWARE & EQUIPMENT — 4.0% | | | | | | | | |
| | 219,391 | | | Xometry, Inc.1 | | | | | | | 4,646,701 | |
| | | | | | | | | | | | | |
| | | | | TECHNOLOGY SERVICES — 2.9% | | | | | | | | |
| | 150,318 | | | Toast, Inc., Class A1 | | | | | | | 3,392,677 | |
| | | | | | | | | | | | | |
| | | | | TOTAL COMMON STOCKS (Cost $86,404,580) | | | | | | | 109,020,870 | |
| | | | | | | | | | | | | |
Principal
Amount ($) | | | | | Coupon
Rate (%) | | Maturity | | Fair Value | |
| | | | | CORPORATE BONDS — 0.8% | | | | | | | | |
| | | | | ASSET MANAGEMENT — 0.8% | | | | | | | | |
| | 900,000 | | | Calvert Impact Capital, Inc.2 | | 1.0000 | | 11/15/23 | | | 900,135 | |
| | | | | | | | | | | | | |
| | | | | TOTAL CORPORATE BONDS (Cost $900,000) | | | | | | | 900,135 | |
| | | | | | | | | | | | | |
| Shares | | | | | | | | | Fair Value | |
| | | | | SHORT-TERM INVESTMENTS — 4.8% | | | | | | | | |
| | | | | MONEY MARKET FUNDS — 4.8% | | | | | | | | |
| | 11,886 | | | Fidelity Government Portfolio, Class I, 4.98%3 | | | | | | | 11,886 | |
See accompanying notes to financial statements.
| A N N U A L R E P O R T | June 30, 2023 |
| Eventide Exponential Technologies Fund | |
| SCHEDULE OF INVESTMENTS (Continued) | June 30, 2023 |
| Shares | | | | | Fair Value | |
| | | | | SHORT-TERM INVESTMENTS — 4.8% (Continued) | | | | |
| | | | | MONEY MARKET FUNDS — 4.8% (Continued) | | | | |
| | 5,591,887 | | | First American Government Obligations Fund, Class U, 5.03%3 | | $ | 5,591,887 | |
| | | | | TOTAL MONEY MARKET FUNDS (Cost $5,603,773) | | | 5,603,773 | |
| | | | | | | | | |
| | | | | TOTAL SHORT-TERM INVESTMENTS (Cost $5,603,773) | | | 5,603,773 | |
| | | | | | | | | |
| | | | | TOTAL INVESTMENTS — 99.8% (Cost $92,908,353) | | $ | 115,524,778 | |
| | | | | OTHER ASSETS IN EXCESS OF LIABILITIES- 0.2% | | | 287,922 | |
| | | | | NET ASSETS — 100.0% | | $ | 115,812,700 | |
| 1. | Non-income producing security. |
| 2. | Illiquid security. The total fair value of these securities as of June 30, 2023 was $900,135, representing 0.8% of net assets. |
| 3. | Rate disclosed is the seven day effective yield as of June 30, 2023. |
See accompanying notes to financial statements.
| A N N U A L R E P O R T | June 30, 2023 |
| Eventide Gilead Fund | |
| SCHEDULE OF INVESTMENTS | June 30, 2023 |
| Shares | | | | | Fair Value | |
| | | | | COMMON STOCKS — 94.8% | | | | |
| | | | | ADVERTISING & MARKETING — 2.0% | | | | |
| | 968,934 | | | Trade Desk, Inc. (The), Class A1 | | $ | 74,821,084 | |
| | | | | | | | | |
| | | | | AUTOMOTIVE — 2.0% | | | | |
| | 719,700 | | | Aptiv PLC1 | | | 73,474,173 | |
| | | | | | | | | |
| | | | | BIOTECH & PHARMA — 12.1% | | | | |
| | 191,382 | | | Argenx S.E. — ADR1 | | | 74,587,307 | |
| | 358,000 | | | Ascendis Pharma A/S — ADR1 | | | 31,951,500 | |
| | 1,344,376 | | | Collegium Pharmaceutical, Inc.1 | | | 28,890,640 | |
| | 2,962,657 | | | Guardant Health, Inc.1 | | | 106,063,120 | |
| | 540,910 | | | Horizon Therapeutics plc1 | | | 55,632,594 | |
| | 1,400,000 | | | Mirum Pharmaceuticals, Inc.1 | | | 36,218,000 | |
| | 412,913 | | | Royalty Pharma plc, Class A | | | 12,692,946 | |
| | 130,876 | | | Seagen, Inc.1 | | | 25,188,395 | |
| | 20,485 | | | TransMedics Group, Inc.1 | | | 1,720,330 | |
| | 2,877,034 | | | Zentalis Pharmaceuticals, Inc.1 | | | 81,161,129 | |
| | | | | | | | 454,105,961 | |
| | | | | COMMERCIAL SUPPORT SERVICES — 3.0% | | | | |
| | 804,000 | | | Waste Connections, Inc. | | | 114,915,720 | |
| | | | | | | | | |
| | | | | CONSUMER SERVICES — 1.1% | | | | |
| | 3,239,179 | | | Coursera, Inc.1 | | | 42,174,111 | |
| | | | | | | | | |
| | | | | ELECTRIC UTILITIES — 4.0% | | | | |
| | 775,019 | | | Brookfield Renewable Corporation | | | 24,428,599 | |
| | 1,236,000 | | | Brookfield Renewable Partners, L.P. | | | 36,449,640 | |
| | 740,862 | | | Clearway Energy, Inc. | | | 21,159,019 | |
| | 1,151,500 | | | NextEra Energy Partners, L.P. | | | 67,523,960 | |
| | | | | | | | 149,561,218 | |
| | | | | ELECTRICAL EQUIPMENT — 5.8% | | | | |
| | 125,900 | | | Novanta, Inc.1 | | | 23,178,190 | |
| | 159,400 | | | Roper Technologies, Inc. | | | 76,639,520 | |
| | 613,600 | | | Trane Technologies PLC | | | 117,357,136 | |
| | | | | | | | 217,174,846 | |
See accompanying notes to financial statements.
| A N N U A L R E P O R T | June 30, 2023 |
| Eventide Gilead Fund | |
| SCHEDULE OF INVESTMENTS (Continued) | June 30, 2023 |
| Shares | | | | | Fair Value | |
| | | | | COMMON STOCKS — 94.8% (Continued) | | | | |
| | | | | FORESTRY, PAPER & WOOD PRODUCTS — 1.5% | | | | |
| | 882,000 | | | Trex Company, Inc.1 | | $ | 57,823,920 | |
| | | | | | | | | |
| | | | | HOME CONSTRUCTION — 2.0% | | | | |
| | 622,000 | | | DR Horton, Inc. | | | 75,691,180 | |
| | | | | | | | | |
| | | | | MEDICAL EQUIPMENT & DEVICES — 10.0% | | | | |
| | 1,020,700 | | | Exact Sciences Corporation1 | | | 95,843,730 | |
| | 222,138 | | | IDEXX Laboratories, Inc.1 | | | 111,564,368 | |
| | 75,000 | | | Intuitive Surgical, Inc.1 | | | 25,645,500 | |
| | 98,329 | | | Mettler-Toledo International, Inc.1 | | | 128,972,250 | |
| | 52,897 | | | Shockwave Medical, Inc.1 | | | 15,097,333 | |
| | | | | | | | 377,123,181 | |
| | | | | OIL & GAS PRODUCERS — 1.2% | | | | |
| | 301,000 | | | Cheniere Energy, Inc. | | | 45,860,360 | |
| | | | | | | | | |
| | | | | REAL ESTATE SERVICES — 0.0%2 | | | | |
| | 111,613 | | | Compass, Inc.1 | | | 390,646 | |
| | | | | | | | | |
| | | | | RENEWABLE ENERGY — 1.5% | | | | |
| | 2,272,922 | | | Shoals Technologies Group, Inc., Class A1 | | | 58,095,886 | |
| | | | | | | | | |
| | | | | RETAIL - CONSUMER STAPLES — 0.9% | | | | |
| | 1,309,414 | | | HelloFresh S.E.1 | | | 32,292,401 | |
| | | | | | | | | |
| | | | | RETAIL - DISCRETIONARY — 4.7% | | | | |
| | 171,076 | | | Lithia Motors, Inc. | | | 52,025,922 | |
| | 421,500 | | | Lowe’s Companies, Inc. | | | 95,132,550 | |
| | 30,033 | | | O’Reilly Automotive, Inc.1 | | | 28,690,525 | |
| | | | | | | | 175,848,997 | |
| | | | | SEMICONDUCTORS — 6.7% | | | | |
| | 69,000 | | | ASML Holding N.V. | | | 50,007,750 | |
| | 397,941 | | | Entegris, Inc. | | | 44,099,822 | |
| | 108,100 | | | Lam Research Corporation | | | 69,493,166 | |
| | 397,403 | | | Lattice Semiconductor Corporation1 | | | 38,178,506 | |
See accompanying notes to financial statements.
| A N N U A L R E P O R T | June 30, 2023 |
| Eventide Gilead Fund | |
| SCHEDULE OF INVESTMENTS (Continued) | June 30, 2023 |
| Shares | | | | | Fair Value | |
| | | | | COMMON STOCKS — 94.8% (Continued) | | | | |
| | | | | SEMICONDUCTORS — 6.7% (Continued) | | | | |
| | 90,818 | | | Monolithic Power Systems, Inc. | | $ | 49,062,608 | |
| | | | | | | | 250,841,852 | |
| | | | | SOFTWARE — 26.3% | | | | |
| | 475,426 | | | Crowdstrike Holdings, Inc., Class A1 | | | 69,825,817 | |
| | 466,619 | | | Datadog, Inc., Class A1 | | | 45,905,977 | |
| | 5,186,803 | | | Dlocal Ltd./Uruguay1 | | | 63,304,931 | |
| | 1,800,728 | | | DoubleVerify Holdings, Inc.1 | | | 70,084,334 | |
| | 3,082,476 | | | Doximity, Inc.1 | | | 104,865,833 | |
| | 1,339,339 | | | Evolent Health, Inc., Class A1 | | | 40,581,972 | |
| | 664,271 | | | Five9, Inc.1 | | | 54,769,144 | |
| | 3,777,381 | | | Flywire Corporation1 | | | 117,249,906 | |
| | 2,363,795 | | | Global-e Online Ltd.1 | | | 96,773,767 | |
| | 659,160 | | | HashiCorp, Inc.1 | | | 17,256,809 | |
| | 172,331 | | | HubSpot, Inc.1 | | | 91,695,602 | |
| | 579,924 | | | Palo Alto Networks, Inc.1 | | | 148,176,380 | |
| | 938,204 | | | Sprout Social, Inc., Class A1 | | | 43,307,497 | |
| | 15,909 | | | Synopsys, Inc.1 | | | 6,926,938 | |
| | 89,331 | | | Workday, Inc., Class A1 | | | 20,178,980 | |
| | | | | | | | 990,903,887 | |
| | | | | SPECIALTY REIT — 0.9% | | | | |
| | 1,377,403 | | | Hannon Armstrong Sustainable Infrastructure Capital, Inc. | | | 34,435,075 | |
| | | | | | | | | |
| | | | | TECHNOLOGY HARDWARE & EQUIPMENT — 1.7% | | | | |
| | 2,970,190 | | | Xometry, Inc.1 | | | 62,908,624 | |
| | | | | | | | | |
| | | | | TECHNOLOGY SERVICES — 0.9% | | | | |
| | 1,453,548 | | | Toast, Inc., Class A1 | | | 32,806,578 | |
| | | | | | | | | |
| | | | | TRANSPORTATION & LOGISTICS — 4.1% | | | | |
| | 220,000 | | | GXO Logistics, Inc.1 | | | 13,820,400 | |
| | 378,000 | | | Old Dominion Freight Line, Inc. | | | 139,765,500 | |
| | | | | | | | 153,585,900 | |
See accompanying notes to financial statements.
| A N N U A L R E P O R T | June 30, 2023 |
| Eventide Gilead Fund | |
| SCHEDULE OF INVESTMENTS (Continued) | June 30, 2023 |
| Shares | | | | | | | | | Fair Value | |
| | | | | COMMON STOCKS — 94.8% (Continued) | | | | | | | | |
| | | | | WHOLESALE - DISCRETIONARY — 2.4% | | | | | | | | |
| | 237,000 | | | Pool Corporation | | | | | | $ | 88,789,680 | |
| | | | | | | | | | | | | |
| | | | | TOTAL COMMON STOCKS (Cost $2,396,507,224) | | | | | | | 3,563,625,280 | |
| | | | | | | | | | | | | |
| Shares | | | | | | | | | Fair Value | |
| | | | | CONTINGENT VALUE RIGHTS — 0.1% | | | | | | | | |
| | | | | BIOTECH & PHARMA — 0.1% | | | | | | | | |
| | 3,982,940 | | | Peloton Therapeutics, Inc. — CVR1,4,5,6,7 | | | | | | | 3,197,106 | |
| | | | | | | | | | | | | |
| | | | | TOTAL CONTINGENT VALUE RIGHTS (Cost $–) | | | | | | | 3,197,106 | |
| | | | | | | | | | | | | |
| Shares | | | | | | | | | Fair Value | |
| | | | | PRIVATE INVESTMENTS — 0.5% | | | | | | | | |
| | | | | MEDICAL EQUIPMENT & DEVICES — 0.5% | | | | | | | | |
| | 139,527 | | | Beta Bionics, Inc. Series B1,3,4,5,6,7 | | | | | | | 10,046,265 | |
| | 48,872 | | | Beta Bionics, Inc. Series B21,3,4,5,6,7 | | | | | | | 3,613,527 | |
| | 71,900 | | | Beta Bionics, Inc. Series C1,3,4,5,6,7 | | | | | | | 4,993,786 | |
| | | | | TOTAL PRIVATE INVESTMENTS (Cost $37,399,898) | | | | | | | 18,653,578 | |
| | | | | | | | | | | | | |
| | Principal
Amount ($) | | | | | Coupon
Rate (%) | | Maturity | | | Fair Value | |
| | | | | CORPORATE BONDS — 1.4% | | | | | | | | |
| | | | | ASSET MANAGEMENT — 1.4% | | | | | | | | |
| | 12,000,000 | | | Calvert Impact Capital, Inc.4 | | 1.0000 | | 11/15/23 | | | 12,001,800 | |
| | 12,000,000 | | | Calvert Impact Capital, Inc.4 | | 1.5000 | | 11/15/24 | | | 12,000,000 | |
| | 7,000,000 | | | Vision Fund International4,5,6,7 | | 2.6110 | | 11/30/23 | | | 7,000,000 | |
| | 5,000,000 | | | Vision Fund International4,5,6,7 | | 4.7400 | | 06/16/25 | | | 5,000,000 | |
| | 5,000,000 | | | Vision Fund International4,5,6,7 | | 5.9030 | | 09/19/25 | | | 5,000,000 | |
| | 5,000,000 | | | Vision Fund International4,5,6,7 | | 3.1500 | | 12/15/25 | | | 5,000,000 | |
| | 5,000,000 | | | Vision Fund International4,5,6,7 | | 3.2230 | | 12/15/26 | | | 5,000,000 | |
See accompanying notes to financial statements.
| A N N U A L R E P O R T | June 30, 2023 |
| Eventide Gilead Fund | |
| SCHEDULE OF INVESTMENTS (Continued) | June 30, 2023 |
Principal
Amount ($) | | | | | Coupon
Rate (%) | | Maturity | | Fair Value | |
| | | | | CORPORATE BONDS — 1.4% (Continued) | | | | | | | | |
| | | | | ASSET MANAGEMENT — 1.4% (Continued) | | | | | | | | |
| | | | | TOTAL CORPORATE BONDS (Cost $51,000,000) | | | | | | $ | 51,001,800 | |
| | | | | | | | | | | | | |
| Shares | | | | | | | | | Fair Value | |
| | | | | WARRANT — 0.0%2 | | | | | | | | |
| | | | | MEDICAL EQUIPMENT & DEVICES — 0.0%2 | | | | | | | | |
| | 17,975 | | | Beta Bionics, Inc. Series C Warrant1,3,4,5,6,7 | | | | | | | 1,274,958 | |
| | | | | | | | | | | | | |
| | | | | TOTAL WARRANT (Cost $–) | | | | | | | 1,274,958 | |
| | | | | | | | | | | | | |
| Shares | | | | | | | | | Fair Value | |
| | | | | SHORT-TERM INVESTMENTS — 3.1% | | | | | | | | |
| | | | | MONEY MARKET FUNDS — 3.1% | | | | | | | | |
| | 34,119,954 | | | Fidelity Government Portfolio, Class I, 4.98%8 | | | | | | | 34,119,954 | |
| | 83,794,224 | | | First American Government Obligations Fund, Class U, 5.03%8 | | | | | | | 83,794,224 | |
| | | | | TOTAL MONEY MARKET FUNDS (Cost $117,914,178) | | | | | | | 117,914,178 | |
| | | | | | | | | | | | | |
| | | | | TOTAL SHORT-TERM INVESTMENTS (Cost $117,914,178) | | | | | | | 117,914,178 | |
| | | | | | | | | | | | | |
| | | | | TOTAL INVESTMENTS — 99.9% (Cost $2,602,821,300) | | | | | | $ | 3,755,666,900 | |
| | | | | OTHER ASSETS IN EXCESS OF LIABILITIES- 0.1% | | | | | | | 4,970,991 | |
| | | | | NET ASSETS — 100.0% | | | | | | $ | 3,760,637,891 | |
| ADR | - American Depositary Receipt |
| CVR | - Contingent Value Rights |
| L.P. | - Limited Partnership |
| N.V. | - Naamioze Vennootschap |
| PLC | - Public Limited Company |
| REIT | - Real Estate Investment Trust |
| 1. | Non-income producing security. |
| 2. | Percentage rounds to less than 0.1%. |
| 3. | Affiliated Company – Eventide Gilead Fund holds in excess of 5% of outstanding voting securities of this security. |
| 4. | Illiquid security. The total fair value of these securities as of June 30, 2023 was $74,127,442, representing 2.0% of net assets. |
| 5. | The value of this security has been determined in good faith under policies of the Board of Trustees. |
| 7. | Restricted security. See Note 6 for additional details. |
| 8. | Rate disclosed is the seven day effective yield as of June 30, 2023. |
See accompanying notes to financial statements.
| A N N U A L R E P O R T | June 30, 2023 |
| Eventide Healthcare & Life Sciences Fund | |
| SCHEDULE OF INVESTMENTS | June 30, 2023 |
| Shares | | | | | Fair Value | |
| | | | | COMMON STOCKS — 86.6% | | | | |
| | | | | BIOTECH & PHARMA — 64.9% | | | | |
| | 642,073 | | | 89bio, Inc.1 | | $ | 12,167,283 | |
| | 379,120 | | | Akero Therapeutics, Inc.1 | | | 17,701,113 | |
| | 562,233 | | | Alkermes plc1 | | | 17,597,893 | |
| | 1,116,837 | | | Amylyx Pharmaceuticals, Inc.1 | | | 24,090,174 | |
| | 397,141 | | | Apellis Pharmaceuticals, Inc.1 | | | 36,179,545 | |
| | 240,000 | | | Arcus Biosciences, Inc.1 | | | 4,874,400 | |
| | 137,000 | | | Argenx S.E. — ADR1 | | | 53,393,010 | |
| | 217,000 | | | Ascendis Pharma A/S — ADR1 | | | 19,367,250 | |
| | 2,935,519 | | | Aura Biosciences, Inc.1,2 | | | 36,253,660 | |
| | 459,203 | | | Beam Therapeutics, Inc.1 | | | 14,662,352 | |
| | 1,970,000 | | | BioCryst Pharmaceuticals, Inc.1 | | | 13,868,800 | |
| | 164,299 | | | BioMarin Pharmaceutical, Inc.1 | | | 14,241,437 | |
| | 438,500 | | | Blueprint Medicines Corporation1 | | | 27,713,200 | |
| | 941,176 | | | Bridgebio Pharma, Inc.1 | | | 16,188,227 | |
| | 1,377,740 | | | Celldex Therapeutics, Inc.1 | | | 46,746,718 | |
| | 490,000 | | | Cerevel Therapeutics Holdings, Inc.1 | | | 15,577,100 | |
| | 1,927,000 | | | Chinook Therapeutics, Inc.1 | | | 74,035,341 | |
| | 3,440,796 | | | Cogent Biosciences, Inc.1 | | | 40,739,025 | |
| | 1,285,217 | | | Collegium Pharmaceutical, Inc.1 | | | 27,619,313 | |
| | 434,768 | | | Crinetics Pharmaceuticals, Inc.1 | | | 7,834,519 | |
| | 556,000 | | | Cytokinetics, Inc.1 | | | 18,136,720 | |
| | 313,407 | | | Denali Therapeutics, Inc.1 | | | 9,248,641 | |
| | 1,026,086 | | | Dynavax Technologies Corporation1 | | | 13,257,031 | |
| | 1,044,332 | | | Guardant Health, Inc.1 | | | 37,387,086 | |
| | 148,798 | | | Horizon Therapeutics plc1 | | | 15,303,874 | |
See accompanying notes to financial statements.
| A N N U A L R E P O R T | June 30, 2023 |
| Eventide Healthcare & Life Sciences Fund | |
| SCHEDULE OF INVESTMENTS (Continued) | June 30, 2023 |
| Shares | | | | | Fair Value | |
| | | | | COMMON STOCKS — 86.6% (Continued) | | | | |
| | | | | BIOTECH & PHARMA — 64.9% (Continued) | | | | |
| | 1,300,000 | | | ImmunoGen, Inc.1 | | $ | 24,531,000 | |
| | 912,103 | | | Insmed, Inc.1 | | | 19,245,373 | |
| | 493,222 | | | Intellia Therapeutics, Inc.1 | | | 20,113,593 | |
| | 110,000 | | | Ionis Pharmaceuticals, Inc.1 | | | 4,513,300 | |
| | 339,840 | | | Karuna Therapeutics, Inc.1 | | | 73,694,304 | |
| | 580,000 | | | Keros Therapeutics, Inc.1 | | | 23,304,400 | |
| | 3,173,197 | | | Marinus Pharmaceuticals, Inc.1,2 | | | 34,460,919 | |
| | 600,000 | | | Mirati Therapeutics, Inc.1 | | | 21,678,000 | |
| | 2,059,201 | | | Mirum Pharmaceuticals, Inc.1,2 | | | 53,271,530 | |
| | 135,000 | | | Neurocrine Biosciences, Inc.1 | | | 12,730,500 | |
| | 320,000 | | | Protagonist Therapeutics, Inc.1 | | | 8,838,400 | |
| | 445,155 | | | Prothena Corp plc1 | | | 30,395,183 | |
| | 1,750,000 | | | Reneo Pharmaceuticals, Inc.1,2 | | | 11,480,000 | |
| | 360,635 | | | REVOLUTION Medicines, Inc.1 | | | 9,646,986 | |
| | 898,000 | | | Rocket Pharmaceuticals, Inc.1 | | | 17,843,260 | |
| | 1,690,300 | | | Roivant Sciences Ltd.1 | | | 17,038,224 | |
| | 122,643 | | | Sarepta Therapeutics, Inc.1 | | | 14,045,076 | |
| | 10,751 | | | TransMedics Group, Inc.1 | | | 902,869 | |
| | 359,000 | | | Ultragenyx Pharmaceutical, Inc.1 | | | 16,560,670 | |
| | 750,000 | | | Viking Therapeutics, Inc.1 | | | 12,157,500 | |
| | 413,906 | | | Xenon Pharmaceuticals, Inc.1 | | | 15,935,381 | |
| | 4,000,000 | | | Zentalis Pharmaceuticals, Inc.1,2 | | | 112,840,001 | |
| | | | | | | | 1,169,410,181 | |
| | | | | | | | | |
| | | | | MEDICAL EQUIPMENT & DEVICES — 16.0% | | | | |
| | 1,430,995 | | | 908 Devices, Inc.1 | | | 9,816,626 | |
| | 846,665 | | | Exact Sciences Corporation1 | | | 79,501,843 | |
| | 17,300 | | | IDEXX Laboratories, Inc.1 | | | 8,688,579 | |
| | 512,914 | | | Inari Medical, Inc.1 | | | 29,820,820 | |
| | 108,220 | | | Inspire Medical Systems, Inc.1 | | | 35,132,541 | |
| | 239,135 | | | iRhythm Technologies, Inc.1 | | | 24,946,563 | |
| | 10,500 | | | Mettler-Toledo International, Inc.1 | | | 13,772,220 | |
| | 119,000 | | | Repligen Corporation1 | | | 16,833,740 | |
| | 181,380 | | | Shockwave Medical, Inc.1 | | | 51,767,666 | |
See accompanying notes to financial statements.
| A N N U A L R E P O R T | June 30, 2023 |
| Eventide Healthcare & Life Sciences Fund | |
| SCHEDULE OF INVESTMENTS (Continued) | June 30, 2023 |
| Shares | | | | | Fair Value | |
| | | | | COMMON STOCKS — 86.6% (Continued) | | | | |
| | | | | MEDICAL EQUIPMENT & DEVICES — 16.0% (Continued) | | | | |
| | 732,000 | | | Veracyte, Inc.1 | | $ | 18,644,040 | |
| | | | | | | | 288,924,638 | |
| | | | | SOFTWARE — 5.7% | | | | |
| | 697,862 | | | Doximity, Inc.1 | | | 23,741,265 | |
| | 1,298,805 | | | Evolent Health, Inc., Class A1 | | | 39,353,791 | |
| | 1,000,000 | | | Privia Health Group, Inc.1 | | | 26,110,000 | |
| | 735,705 | | | R1 RCM, Inc.1 | | | 13,573,757 | |
| | | | | | | | 102,778,813 | |
| | | | | | | | | |
| | | | | TOTAL COMMON STOCKS (Cost $1,273,435,824) | | | 1,561,113,632 | |
| | | | | | | | | |
| Shares | | | | | Fair Value | |
| | | | | CONTINGENT VALUE RIGHTS — 0.1% | | | | |
| | | | | BIOTECH & PHARMA — 0.1% | | | | |
| | 1,528,871 | | | Peloton Therapeutics, Inc. — CVR1,3,4,5,6 | | | 1,227,225 | |
| | | | | | | | | |
| | | | | TOTAL CONTINGENT VALUE RIGHTS (Cost $–) | | | 1,227,225 | |
| | | | | | | | | |
| Shares | | | | | Fair Value | |
| | | | | PRIVATE INVESTMENTS — 5.2% | | | | |
| | | | | BIOTECH & PHARMA — 4.5% | | | | |
| | 4,643,043 | | | Arch Oncology, Inc. Series C11,3,4,5,6 | | | 565,523 | |
| | 295,276 | | | BioSplice Therapeutics, Inc. Series B-11,3,4,5,6 | | | 1,470,475 | |
| | 5,000,000 | | | Casma Therapeutics, Inc. Series B11,2,3,4,5,6 | | | 2,185,000 | |
| | 5,000,000 | | | Casma Therapeutics, Inc. Series B21,2,3,4,5,6 | | | 2,185,000 | |
| | 1,820,413 | | | Casma Therapeutics, Inc. Series C11,2,3,4,5,6 | | | 795,520 | |
| | 1,219,013 | | | Casma Therapeutics, Inc. Series C21,2,3,4,5,6 | | | 532,709 | |
| | 1,097,561 | | | Flare Therapeutics, Inc. Series A1,3,4,5,6 | | | 1,254,622 | |
| | 902,439 | | | Flare Therapeutics, Inc. Series A21,3,4,5,6 | | | 1,031,578 | |
| | 1,952,962 | | | Flare Therapeutics, Inc. Series B1,3,4,5,6 | | | 2,232,431 | |
| | 928,098 | | | Freenome Holdings, Inc. Series D1,3,4,5,6 | | | 4,807,548 | |
| | 5,000,000 | | | Goldfinch Biopharma, Inc. Series A1,2,3,4,5,6 | | | — | |
| | 8,474,576 | | | Goldfinch Biopharma, Inc. Series B1,2,3,4,5,6 | | | — | |
See accompanying notes to financial statements.
| A N N U A L R E P O R T | June 30, 2023 |
| Eventide Healthcare & Life Sciences Fund | |
| SCHEDULE OF INVESTMENTS (Continued) | June 30, 2023 |
| Shares | | | | | | | | | Fair Value | |
| | | | | PRIVATE INVESTMENTS — 5.2% (Continued) | | | | | | | | |
| | | | | BIOTECH & PHARMA — 4.5% (Continued) | | | | | | | | |
| | 4,237,288 | | | Goldfinch Biopharma, Inc. Series B21,2,3,4,5,6 | | | | | | $ | — | |
| | 763,319 | | | Kojin Therapeutics, Inc. Series A-11,3,4,5,6 | | | | | | | 1,424,998 | |
| | 763,319 | | | Kojin Therapeutics, Inc. Series A-21,3,4,5,6 | | | | | | | 1,424,998 | |
| | 3,831,418 | | | Korro Bio, Inc. Series B11,2,3,4,5,6 | | | | | | | 10,118,775 | |
| | 3,597,122 | | | Korro Bio, Inc. Series B21,2,3,4,5,6 | | | | | | | 9,499,999 | |
| | 8,718,446 | | | LEXEO Therapeutics Series B1,2,3,4,5,6 | | | | | | | 14,250,300 | |
| | 686,724 | | | Metagenomi Technologies, LLC Series B1,3,4,5,6 | | | | | | | 9,177,586 | |
| | 98,875 | | | Metagenomi Technologies, LLC Series B-11,3,4,5,6 | | | | | | | 1,321,395 | |
| | 1,017,770 | | | Prometheus Laboratories, Inc.1,2,3,4,5,6 | | | | | | | 667,148 | |
| | 1,489,958 | | | Shoreline Biosciences Series B1,3,4,5,6 | | | | | | | 9,780,829 | |
| | 3,660,670 | | | Turnstone Biologics, Inc. Series D1,3,4,5,6 | | | | | | | 6,589,206 | |
| | | | | | | | | | | | 81,315,640 | |
| | | | | MEDICAL EQUIPMENT & DEVICES — 0.7% | | | | | | | | |
| | 69,763 | | | Beta Bionics, Inc. Series B1,3,4,5,6 | | | | | | | 5,023,096 | |
| | 59,439 | | | Beta Bionics, Inc. Series B21,3,4,5,6 | | | | | | | 4,394,836 | |
| | 35,950 | | | Beta Bionics, Inc. Series C1,3,4,5,6 | | | | | | | 2,496,893 | |
| | | | | | | | | | | | 11,914,825 | |
| | | | | TOTAL PRIVATE INVESTMENTS (Cost $158,293,680) | | | | | | | 93,230,465 | |
| | | | | | | | | | | | | |
Principal
Amount ($) | | | | | Coupon
Rate (%) | | Maturity | | Fair Value | |
| | | | | CONVERTIBLE BONDS — 0.2% | | | | | | | | |
| | | | | BIOTECH & PHARMA — 0.2% | | | | | | | | |
| | 2,500,000 | | | Biosplice Therapeutics, Inc. Series C PIK 3,4,5,6 | | 7.5000 | | 03/12/25 | | | 2,818,000 | |
| | | | | | | | | | | | | |
| | | | | TOTAL CONVERTIBLE BONDS (Cost $2,500,000) | | | | | | | 2,818,000 | |
| | | | | | | | | | | | | |
| Shares | | | | | | | | | Fair Value | |
| | | | | WARRANTS — 0.0% 7 | | | | | | | | |
| | | | | BIOTECH & PHARMA — 0.0% 7 | | | | | | | | |
| | 72,382 | | | Biosplice Therapeutics, Inc. Series C Warrant1,3,4,5,6 | | | | | | | 70,934 | |
| | | | | | | | | | | | | |
| | | | | MEDICAL EQUIPMENT & DEVICES — 0.0% 7 | | | | | | | | |
| | 8,987 | | | Beta Bionics, Inc. Series C Warrant1,3,4,5,6 | | | | | | | 637,443 | |
See accompanying notes to financial statements.
| A N N U A L R E P O R T | June 30, 2023 |
| Eventide Healthcare & Life Sciences Fund | |
| SCHEDULE OF INVESTMENTS (Continued) | June 30, 2023 |
| Shares | | | | | Fair Value | |
| | | | | WARRANTS — 0.0%7 (Continued) | | | | |
| | | | | | | | | |
| | | | | TOTAL WARRANTS (Cost $–) | | $ | 708,377 | |
| | | | | | | | | |
| Shares | | | | | Fair Value | |
| | | | | SHORT-TERM INVESTMENTS — 8.0% | | | | |
| | | | | MONEY MARKET FUNDS — 8.0% | | | | |
| | 3,223,273 | | | Fidelity Government Portfolio, Class I, 4.98%8 | | | 3,223,273 | |
| | 142,170,571 | | | First American Government Obligations Fund, Class U, 5.03%8 | | | 142,170,571 | |
| | | | | TOTAL MONEY MARKET FUNDS (Cost $145,393,844) | | | 145,393,844 | |
| | | | | | | | | |
| | | | | TOTAL SHORT-TERM INVESTMENTS (Cost $145,393,844) | | | 145,393,844 | |
| | | | | | | | | |
| | | | | TOTAL INVESTMENTS — 100.1% (Cost $1,579,623,348) | | $ | 1,804,491,543 | |
| | | | | LIABILITIES IN EXCESS OF OTHER ASSETS — (0.1)% | | | (1,329,087 | ) |
| | | | | NET ASSETS — 100.0% | | $ | 1,803,162,456 | |
| ADR | - American Depositary Receipt |
| CVR | - Contingent Value Rights |
| LLC | - Limited Liability Company |
| PLC | - Public Limited Company |
| 1. | Non-income producing security. |
| 2. | Affiliated Company – Eventide Healthcare & Life Sciences Fund holds in excess of 5% of outstanding voting securities of this security. |
| 3. | Illiquid security. The total fair value of these securities as of June 30, 2023 was $97,984,067, representing 5.4% of net assets. |
| 4. | The value of this security has been determined in good faith under policies of the Board of Trustees. |
| 6. | Restricted security. See Note 6 for additional details. |
| 7. | Percentage rounds to less than 0.1%. |
| 8. | Rate disclosed is the seven day effective yield as of June 30, 2023. |
See accompanying notes to financial statements.
| A N N U A L R E P O R T | June 30, 2023 |
| Eventide Large Cap Focus Fund | |
| SCHEDULE OF INVESTMENTS | June 30, 2023 |
| Shares | | | | | Fair Value | |
| | | | | COMMON STOCKS — 95.2% | | | | |
| | | | | AUTOMOTIVE — 2.9% | | | | |
| | 3,842 | | | Aptiv PLC1 | | $ | 392,230 | |
| | | | | | | | | |
| | | | | BIOTECH & PHARMA — 3.2% | | | | |
| | 580 | | | Argenx S.E. — ADR1 | | | 226,043 | |
| | 1,141 | | | Zoetis, Inc. | | | 196,492 | |
| | | | | | | | 422,535 | |
| | | | | CHEMICALS — 3.0% | | | | |
| | 1,521 | | | Sherwin-Williams Company (The) | | | 403,856 | |
| | | | | | | | | |
| | | | | COMMERCIAL SUPPORT SERVICES — 5.4% | | | | |
| | 5,079 | | | Waste Connections, Inc. | | | 725,942 | |
| | | | | | | | | |
| | | | | ELECTRIC UTILITIES — 1.8% | | | | |
| | 3,163 | | | NextEra Energy, Inc. | | | 234,695 | |
| | | | | | | | | |
| | | | | ELECTRICAL EQUIPMENT — 4.5% | | | | |
| | 549 | | | Roper Technologies, Inc. | | | 263,959 | |
| | 1,735 | | | Trane Technologies PLC | | | 331,836 | |
| | | | | | | | 595,795 | |
| | | | | MEDICAL EQUIPMENT & DEVICES — 15.4% | | | | |
| | 1,178 | | | Align Technology, Inc.1 | | | 416,588 | |
| | 5,108 | | | Edwards Lifesciences Corporation1 | | | 481,838 | |
| | 1,081 | | | IDEXX Laboratories, Inc.1 | | | 542,910 | |
| | 473 | | | Mettler-Toledo International, Inc.1 | | | 620,405 | |
| | | | | | | | 2,061,741 | |
| | | | | RETAIL - DISCRETIONARY — 6.2% | | | | |
| | 1,994 | | | Lowe’s Companies, Inc. | | | 450,046 | |
| | 391 | | | O’Reilly Automotive, Inc.1 | | | 373,522 | |
| | | | | | | | 823,568 | |
| | | | | SEMICONDUCTORS — 13.2% | | | | |
| | 249 | | | ASML Holding N.V. | | | 180,463 | |
| | 545 | | | KLA Corporation | | | 264,336 | |
| | 718 | | | Lam Research Corporation | | | 461,574 | |
| | 1,229 | | | NVIDIA Corporation | | | 519,892 | |
See accompanying notes to financial statements.
| A N N U A L R E P O R T | June 30, 2023 |
| Eventide Large Cap Focus Fund | |
| SCHEDULE OF INVESTMENTS (Continued) | June 30, 2023 |
| Shares | | | | | Fair Value | |
| | | | | COMMON STOCKS — 95.2% (Continued) | | | | |
| | | | | SEMICONDUCTORS — 13.2% (Continued) | | | | |
| | 3,439 | | | Taiwan Semiconductor Manufacturing Company Ltd. — ADR | | $ | 347,064 | |
| | | | | | | | 1,773,329 | |
| | | | | SOFTWARE — 31.4% | | | | |
| | 185 | | | Constellation Software, Inc. | | | 385,288 | |
| | 1,646 | | | Crowdstrike Holdings, Inc., Class A1 | | | 241,748 | |
| | 2,535 | | | Datadog, Inc., Class A1 | | | 249,393 | |
| | 30,434 | | | Dlocal Ltd./Uruguay1 | | | 371,447 | |
| | 9,407 | | | Doximity, Inc.1 | | | 320,026 | |
| | 3,226 | | | Palo Alto Networks, Inc.1 | | | 824,275 | |
| | 906 | | | ServiceNow, Inc.1 | | | 509,145 | |
| | 1,398 | | | Synopsys, Inc.1 | | | 608,703 | |
| | 2,991 | | | Workday, Inc., Class A1 | | | 675,637 | |
| | | | | | | | 4,185,662 | |
| | | | | TECHNOLOGY SERVICES — 5.6% | | | | |
| | 21,631 | | | Adyen N.V. — ADR1 | | | 374,000 | |
| | 796 | | | MSCI, Inc. | | | 373,555 | |
| | | | | | | | 747,555 | |
| | | | | TRANSPORTATION & LOGISTICS — 2.6% | | | | |
| | 955 | | | Old Dominion Freight Line, Inc. | | | 353,111 | |
| | | | | | | | | |
| | | | | TOTAL COMMON STOCKS (Cost $11,036,235) | | | 12,720,019 | |
| | | | | | | | | |
| Shares | | | | | Fair Value | |
| | | | | SHORT-TERM INVESTMENTS — 6.6% | | | | |
| | | | | MONEY MARKET FUNDS — 6.6% | | | | |
| | 876,190 | | | First American Government Obligations Fund, Class U, 5.03%2 (Cost $876,190) | | | 876,190 | |
| | | | | | | | | |
| | | | | TOTAL INVESTMENTS — 101.8% (Cost $11,912,425) | | $ | 13,596,209 | |
| | | | | LIABILITIES IN EXCESS OF OTHER ASSETS — (1.8)% | | | (241,471 | ) |
| | | | | NET ASSETS — 100.0% | | $ | 13,354,738 | |
| ADR | - American Depositary Receipt |
| N.V. | - Naamioze Vennootschap |
| PLC | - Public Limited Company |
| 1. | Non-income producing security. |
| 2. | Rate disclosed is the seven day effective yield as of June 30, 2023. |
See accompanying notes to financial statements.
| A N N U A L R E P O R T | June 30, 2023 |
| Eventide Limited-Term Bond Fund | |
| SCHEDULE OF INVESTMENTS | June 30, 2023 |
Principal
Amount ($) | | | | | | | Coupon
Rate (%) | | Maturity | | Fair Value | |
| | | | | ASSET BACKED SECURITIES — 5.5% | | | | | | | | | | |
| | | | | AUTO LOAN — 3.6% | | | | | | | | | | |
| | 2,600,000 | | | CarMax Auto Owner Trust Series 2020-4 C | | | | 1.3000 | | 08/17/26 | | $ | 2,417,057 | |
| | 1,000,000 | | | CarMax Auto Owner Trust Series 2021-2 C | | | | 1.3400 | | 02/16/27 | | | 914,768 | |
| | 1,500,000 | | | CarMax Auto Owner Trust Series 2021-2 D | | | | 1.5500 | | 10/15/27 | | | 1,364,765 | |
| | | | | | | | | | | | | | 4,696,590 | |
| | | | | OTHER ABS — 1.9% | | | | | | | | | | |
| | 2,450,000 | | | PFS Financing Corporation Series 2020-G A1 | | | | 0.9700 | | 02/15/26 | | | 2,371,074 | |
| | | | | | | | | | | | | | | |
| | | | | TOTAL ASSET BACKED SECURITIES (Cost $7,570,584) | | | | | | | | | 7,067,664 | |
| | | | | | | | | | | | | | | |
Principal
Amount ($) | | | | | Spread | | Coupon
Rate (%) | | Maturity | | Fair Value | |
| | | | | CORPORATE BONDS — 59.3% | | | | | | | | | | |
| | | | | AUTOMOTIVE — 1.1% | | | | | | | | | | |
| | 1,500,000 | | | Honda Motor Company Ltd. | | | | 2.2710 | | 03/10/25 | | | 1,427,191 | |
| | | | | | | | | | | | | | | |
| | | | | BANKING — 9.0% | | | | | | | | | | |
| | 3,000,000 | | | Bank of America Corporation Series N2 | | US0003M + 0.870% | | 2.4560 | | 10/22/25 | | | 2,865,025 | |
| | 2,650,000 | | | JPMorgan Chase & Company2 | | SOFRRATE + 0.600% | | 0.6530 | | 09/16/24 | | | 2,619,213 | |
| | 2,000,000 | | | National Bank of Canada2 | | H15T1Y + 0.400% | | 0.5500 | | 11/15/24 | | | 1,958,347 | |
| | 3,000,000 | | | Royal Bank of Canada | | | | 1.1500 | | 07/14/26 | | | 2,655,386 | |
| | 1,450,000 | | | Toronto-Dominion Bank (The) | | | | 1.2500 | | 12/13/24 | | | 1,365,101 | |
| | | | | | | | | | | | | | 11,463,072 | |
| | | | | ELEC & GAS MARKETING & TRADING — 1.1% | | | | | | | | | | |
| | 1,500,000 | | | Southern Power Company | | | | 0.9000 | | 01/15/26 | | | 1,344,600 | |
| | | | | | | | | | | | | | | |
| | | | | ELECTRIC UTILITIES — 14.2% | | | | | | | | | | |
| | 1,550,000 | | | AES Corporation (The) | | | | 1.3750 | | 01/15/26 | | | 1,384,995 | |
| | 2,700,000 | | | Avangrid, Inc. | | | | 3.1500 | | 12/01/24 | | | 2,590,798 | |
| | 2,720,000 | | | CenterPoint Energy, Inc.2 | | SOFRRATE + 0.650% | | 5.7220 | | 05/13/24 | | | 2,717,533 | |
| | 2,250,000 | | | CMS Energy Corporation | | | | 3.8750 | | 03/01/24 | | | 2,218,421 | |
| | 1,250,000 | | | Duke Energy Florida, LLC | | | | 2.5000 | | 12/01/29 | | | 1,080,019 | |
| | 1,275,000 | | | Georgia Power Company | | | | 3.2500 | | 04/01/26 | | | 1,209,045 | |
| | 3,000,000 | | | MidAmerican Energy Company | | | | 3.1000 | | 05/01/27 | | | 2,804,917 | |
See accompanying notes to financial statements.
| A N N U A L R E P O R T | June 30, 2023 |
| Eventide Limited-Term Bond Fund | |
| SCHEDULE OF INVESTMENTS (Continued) | June 30, 2023 |
Principal
Amount ($) | | | | | Spread | | Coupon
Rate (%) | | Maturity | | Fair Value | |
| | | | | CORPORATE BONDS — 59.3% (Continued) | | | | | | | | | | |
| | | | | ELECTRIC UTILITIES — 14.2% (Continued) | | | | | | | | | | |
| | 2,200,000 | | | National Rural Utilities Cooperative Finance | | | | 3.4000 | | 11/15/23 | | $ | 2,181,080 | |
| | 2,000,000 | | | NextEra Energy Capital Holdings, Inc. | | | | 4.9000 | | 02/28/28 | | | 1,981,669 | |
| | | | | | | | | | | | | | 18,168,477 | |
| | | | | ELECTRICAL EQUIPMENT — 1.6% | | | | | | | | | | |
| | 2,000,000 | | | Roper Technologies, Inc. | | | | 3.6500 | | 09/15/23 | | | 1,991,333 | |
| | | | | | | | | | | | | | | |
| | | | | ENGINEERING & CONSTRUCTION — 3.0% | | | | | | | | | | |
| | 1,000,000 | | | Installed Building Products, Inc.1 | | | | 5.7500 | | 02/01/28 | | | 943,640 | |
| | 1,375,000 | | | MasTec, Inc.1 | | | | 4.5000 | | 08/15/28 | | | 1,268,949 | |
| | 1,750,000 | | | Quanta Services, Inc. | | | | 0.9500 | | 10/01/24 | | | 1,645,081 | |
| | | | | | | | | | | | | | 3,857,670 | |
| | | | | FORESTRY, PAPER & WOOD PRODUCTS — 0.7% | | | | | | | | | | |
| | 1,000,000 | | | Louisiana-Pacific Corporation1 | | | | 3.6250 | | 03/15/29 | | | 876,425 | |
| | | | | | | | | | | | | | | |
| | | | | HOME & OFFICE PRODUCTS — 0.8% | | | | | | | | | | |
| | 1,250,000 | | | Tempur Sealy International, Inc.1 | | | | 4.0000 | | 04/15/29 | | | 1,076,598 | |
| | | | | | | | | | | | | | | |
| | | | | HOME CONSTRUCTION — 0.8% | | | | | | | | | | |
| | 1,000,000 | | | Patrick Industries, Inc.1 | | | | 7.5000 | | 10/15/27 | | | 968,400 | |
| | | | | | | | | | | | | | | |
| | | | | INDUSTRIAL SUPPORT SERVICES — 1.0% | | | | | | | | | | |
| | 1,350,000 | | | United Rentals North America, Inc. | | | | 3.8750 | | 11/15/27 | | | 1,257,582 | |
| | | | | | | | | | | | | | | |
| | | | | INSTITUTIONAL FINANCIAL SERVICES — 3.2% | | | | | | | | | | |
| | 3,000,000 | | | Morgan Stanley2 | | SOFRRATE + 0.745% | | 0.8640 | | 10/21/25 | | | 2,790,837 | |
| | 1,250,000 | | | Nasdaq, Inc. | | | | 5.3500 | | 06/28/28 | | | 1,252,385 | |
| | | | | | | | | | | | | | 4,043,222 | |
| | | | | INSURANCE — 4.9% | | | | | | | | | | |
| | 3,000,000 | | | Aflac, Inc. | | | | 1.1250 | | 03/15/26 | | | 2,686,419 | |
| | 2,300,000 | | | Brown & Brown, Inc. | | | | 4.2000 | | 09/15/24 | | | 2,246,861 | |
| | 1,425,000 | | | Pacific Life Global Funding II1 | | | | 1.3750 | | 04/14/26 | | | 1,273,658 | |
| | | | | | | | | | | | | | 6,206,938 | |
See accompanying notes to financial statements.
| A N N U A L R E P O R T | June 30, 2023 |
| Eventide Limited-Term Bond Fund | |
| SCHEDULE OF INVESTMENTS (Continued) | June 30, 2023 |
Principal
Amount ($) | | | | | Spread | | Coupon
Rate (%) | | Maturity | | Fair Value | |
| | | | | CORPORATE BONDS — 59.3% (Continued) | | | | | | | | | | |
| | | | | MACHINERY — 2.6% | | | | | | | | | | |
| | 1,500,000 | | | Mueller Water Products, Inc.1 | | | | 4.0000 | | 06/15/29 | | $ | 1,331,477 | |
| | 2,250,000 | | | Xylem, Inc./NY | | | | 1.9500 | | 01/30/28 | | | 1,974,771 | |
| | | | | | | | | | | | | | 3,306,248 | |
| | | | | OIL & GAS PRODUCERS — 2.0% | | | | | | | | | | |
| | 1,500,000 | | | Cheniere Energy Partners, L.P. | | | | 4.5000 | | 10/01/29 | | | 1,377,715 | |
| | 1,250,000 | | | Diamondback Energy, Inc. | | | | 3.5000 | | 12/01/29 | | | 1,124,167 | |
| | | | | | | | | | | | | | 2,501,882 | |
| | | | | REAL ESTATE INVESTMENT TRUSTS — 7.5% | | | | | | | | | | |
| | 1,675,000 | | | Alexandria Real Estate Equities, Inc. | | | | 3.8000 | | 04/15/26 | | | 1,602,149 | |
| | 1,750,000 | | | American Tower Corporation | | | | 3.3750 | | 05/15/24 | | | 1,713,753 | |
| | 1,400,000 | | | HAT Holdings I, LLC/HAT Holdings II, LLC1 | | | | 3.3750 | | 06/15/26 | | | 1,256,091 | |
| | 2,700,000 | | | Public Storage2 | | SOFRRATE + 0.470% | | 5.5000 | | 04/23/24 | | | 2,698,805 | |
| | 2,500,000 | | | Welltower, Inc. | | | | 2.7000 | | 02/15/27 | | | 2,263,926 | |
| | | | | | | | | | | | | | 9,534,724 | |
| | | | | RETAIL - DISCRETIONARY — 2.4% | | | | | | | | | | |
| | 700,000 | | | Asbury Automotive Group, Inc. | | | | 4.5000 | | 03/01/28 | | | 642,499 | |
| | 2,500,000 | | | AutoZone, Inc. | | | | 4.5000 | | 02/01/28 | | | 2,437,128 | |
| | | | | | | | | | | | | | 3,079,627 | |
| | | | | SEMICONDUCTORS — 1.0% | | | | | | | | | | |
| | 1,450,000 | | | Synaptics, Inc.1 | | | | 4.0000 | | 06/15/29 | | | 1,218,847 | |
| | | | | | | | | | | | | | | |
| | | | | SOFTWARE — 1.0% | | | | | | | | | | |
| | 1,500,000 | | | Workday, Inc. | | | | 3.5000 | | 04/01/27 | | | 1,422,209 | |
| | | | | | | | | | | | | | | |
| | | | | TECHNOLOGY SERVICES — 0.6% | | | | | | | | | | |
| | 750,000 | | | Verisk Analytics, Inc. | | | | 4.0000 | | 06/15/25 | | | 728,193 | |
| | | | | | | | | | | | | | | |
| | | | | WHOLESALE - CONSUMER STAPLES — 0.8% | | | | | | | | | | |
| | 1,000,000 | | | Sysco Corporation | | | | 3.7500 | | 10/01/25 | | | 966,899 | |
| | | | | | | | | | | | | | | |
| | | | | TOTAL CORPORATE BONDS (Cost $80,189,178) | | | | | | | | | 75,440,137 | |
See accompanying notes to financial statements.
| A N N U A L R E P O R T | June 30, 2023 |
| Eventide Limited-Term Bond Fund | |
| SCHEDULE OF INVESTMENTS (Continued) | June 30, 2023 |
Principal
Amount ($) | | | | | | | Coupon
Rate (%) | | Maturity | | Fair Value | |
| | | | | MUNICIPAL BONDS — 7.2% | | | | | | | | | | |
| | | | | COMBINED UTILITIES — 1.2% | | | | | | | | | | |
| | 1,525,000 | | | City of Tacoma, WA Electric System Revenue | | | | 5.6410 | | 01/01/27 | | $ | 1,557,678 | |
| | | | | | | | | | | | | | | |
| | | | | COUNTY — 0.8% | | | | | | | | | | |
| | 1,115,000 | | | City & County of Honolulu, HI | | | | 2.5180 | | 10/01/26 | | | 1,040,990 | |
| | | | | | | | | | | | | | | |
| | | | | MISCELLANEOUS TAX — 1.6% | | | | | | | | | | |
| | 2,050,000 | | | Commonwealth of Massachusetts | | | | 3.6390 | | 07/15/24 | | | 2,009,103 | |
| | | | | | | | | | | | | | | |
| | | | | MULTI-FAMILY HOUSING — 0.9% | | | | | | | | | | |
| | 250,000 | | | Maine State Housing Authority | | | | 0.3000 | | 11/15/23 | | | 247,102 | |
| | 500,000 | | | New York City Housing Development Corporation | | | | 1.9300 | | 02/01/25 | | | 469,597 | |
| | 100,000 | | | New York State Housing Finance Agency | | | | 0.5000 | | 05/01/24 | | | 97,472 | |
| | 250,000 | | | New York State Housing Finance Agency | | | | 2.2000 | | 11/01/24 | | | 238,434 | |
| | | | | | | | | | | | | | 1,052,605 | |
| | | | | SINGLE-FAMILY HOUSING — 0.5% | | | | | | | | | | |
| | 55,000 | | | Maryland Community Development Administration | | | | 3.2420 | | 09/01/48 | | | 53,053 | |
| | 45,000 | | | Massachusetts Housing Finance Agency | | | | 4.0000 | | 06/01/39 | | | 44,580 | |
| | 600,000 | | | Texas Department of Housing & Community Affairs | | | | 0.3500 | | 07/01/23 | | | 600,000 | |
| | | | | | | | | | | | | | 697,633 | |
| | | | | STATE — 0.8% | | | | | | | | | | |
| | 300,000 | | | State of Oregon | | | | 0.7950 | | 05/01/24 | | | 288,668 | |
| | 500,000 | | | State of Oregon | | | | 0.8120 | | 11/01/24 | | | 471,095 | |
| | 300,000 | | | State of Oregon | | | | 0.8950 | | 05/01/25 | | | 277,614 | |
| | | | | | | | | | | | | | 1,037,377 | |
| | | | | WATER AND SEWER — 1.4% | | | | | | | | | | |
| | 2,000,000 | | | Boston Water & Sewer Commission | | | | 0.9650 | | 11/01/25 | | | 1,818,993 | |
| | | | | | | | | | | | | | | |
| | | | | TOTAL MUNICIPAL BONDS (Cost $9,749,961) | | | | | | | | | 9,214,379 | |
| | | | | | | | | | | | | | | |
Principal
Amount ($) | | | | | Spread | | Coupon
Rate (%) | | Maturity | | Fair Value | |
| | | | | U.S. GOVERNMENT & AGENCIES — 25.6% | | | | | | | | | | |
| | | | | AGENCY FIXED RATE — 2.0% | | | | | | | | | | |
| | 1,465,010 | | | Freddie Mac Pool RD5050 | | | | 2.0000 | | 02/01/31 | | | 1,343,426 | |
See accompanying notes to financial statements.
| A N N U A L R E P O R T | June 30, 2023 |
| Eventide Limited-Term Bond Fund | |
| SCHEDULE OF INVESTMENTS (Continued) | June 30, 2023 |
Principal
Amount ($) | | | | | Spread | | Coupon
Rate (%) | | Maturity | | Fair Value | |
| | | | | U.S. GOVERNMENT & AGENCIES — 25.6% (Continued) | | | | | | | | | | |
| | | | | AGENCY FIXED RATE — 2.0% (Continued) | | | | | | | | | | |
| | 2 | | | Ginnie Mae I Pool 352081 | | | | 7.0000 | | 09/15/23 | | $ | 2 | |
| | 1,298,805 | | | Ginnie Mae II Pool MA7107 | | | | 2.5000 | | 01/20/36 | | | 1,182,456 | |
| | | | | | | | | | | | | | 2,525,884 | |
| | | | | AGENCY HYBRID ARMS — 0.0%3 | | | | | | | | | | |
| | 6,585 | | | Ginnie Mae II Pool 829032 | | H15T1Y + 1.500% | | 2.6250 | | 08/20/41 | | | 6,377 | |
| | | | | | | | | | | | | | | |
| | | | | ARMS — 0.0%3 | | | | | | | | | | |
| | 1,770 | | | Fannie Mae Pool 7915732 | | H15T1Y + 2.170% | | 4.1700 | | 08/01/34 | | | 1,749 | |
| | 150 | | | Freddie Mac Non Gold Pool 8455902 | | H15T1Y + 2.159% | | 4.2500 | | 01/01/24 | | | 149 | |
| | 70 | | | Freddie Mac Non Gold Pool 8459652 | | H15T1Y + 2.421% | | 4.3660 | | 01/01/24 | | | 69 | |
| | 3 | | | Ginnie Mae II Pool 82282 | | H15T1Y + 1.500% | | 2.6250 | | 07/20/23 | | | 3 | |
| | 19 | | | Ginnie Mae II Pool 82592 | | H15T1Y + 1.500% | | 2.6250 | | 08/20/23 | | | 19 | |
| | 148 | | | Ginnie Mae II Pool 83752 | | H15T1Y + 1.500% | | 3.6250 | | 02/20/24 | | | 147 | |
| | 170 | | | Ginnie Mae II Pool 83952 | | H15T1Y + 1.500% | | 3.6250 | | 03/20/24 | | | 169 | |
| | 66 | | | Ginnie Mae II Pool 84102 | | H15T1Y + 1.500% | | 2.8750 | | 04/20/24 | | | 65 | |
| | 244 | | | Ginnie Mae II Pool 84212 | | H15T1Y + 1.500% | | 2.8750 | | 05/20/24 | | | 243 | |
| | 501 | | | Ginnie Mae II Pool 85032 | | H15T1Y + 1.500% | | 2.6250 | | 09/20/24 | | | 495 | |
| | 293 | | | Ginnie Mae II Pool 85022 | | H15T1Y + 1.500% | | 2.6250 | | 09/20/24 | | | 289 | |
| | 407 | | | Ginnie Mae II Pool 85652 | | H15T1Y + 1.500% | | 3.0000 | | 12/20/24 | | | 401 | |
| | 1,014 | | | Ginnie Mae II Pool 85672 | | H15T1Y + 1.500% | | 3.5000 | | 12/20/24 | | | 999 | |
| | 2,206 | | | Ginnie Mae II Pool 85952 | | H15T1Y + 1.500% | | 3.6250 | | 02/20/25 | | | 2,159 | |
| | 579 | | | Ginnie Mae II Pool 86602 | | H15T1Y + 1.500% | | 2.6250 | | 07/20/25 | | | 568 | |
| | 12,721 | | | Ginnie Mae II Pool 805692 | | H15T1Y + 1.500% | | 3.6250 | | 01/20/32 | | | 12,539 | |
| | 1,656 | | | Ginnie Mae II Pool 806592 | | H15T1Y + 1.500% | | 2.7500 | | 12/20/32 | | | 1,589 | |
| | | | | | | | | | | | | | 21,652 | |
| | | | | | | | | | | | | | | |
| | | | | GOVERNMENT OWNED, NO GUARANTEE — 6.0% | | | | | | | | | | |
| | 3,000,000 | | | Federal Home Loan Mortgage Corporation | | | | 3.0500 | | 05/12/25 | | | 2,891,487 | |
| | 2,000,000 | | | Federal Home Loan Mortgage Corporation | | | | 0.8000 | | 10/27/26 | | | 1,772,292 | |
| | 3,000,000 | | | Federal National Mortgage Association | | | | 4.1250 | | 08/28/25 | | | 2,932,311 | |
| | | | | | | | | | | | | | 7,596,090 | |
| | | | | GOVERNMENT SPONSORED — 17.6% | | | | | | | | | | |
| | 3,000,000 | | | Federal Farm Credit Banks Funding Corporation | | | | 3.6250 | | 03/06/24 | | | 2,962,958 | |
| | 3,000,000 | | | Federal Farm Credit Banks Funding Corporation | | | | 4.3400 | | 09/19/24 | | | 2,955,278 | |
| | 2,500,000 | | | Federal Farm Credit Banks Funding Corporation | | | | 4.5000 | | 01/10/25 | | | 2,474,662 | |
See accompanying notes to financial statements.
| A N N U A L R E P O R T | June 30, 2023 |
| Eventide Limited-Term Bond Fund | |
| SCHEDULE OF INVESTMENTS (Continued) | June 30, 2023 |
Principal
Amount ($) | | | | | Spread | | Coupon
Rate (%) | | Maturity | | Fair Value | |
| | | | | U.S. GOVERNMENT & AGENCIES — 25.6% (Continued) | | | | | | | | | | |
| | | | | GOVERNMENT SPONSORED — 17.6% (Continued) | | | | | | | | | | |
| | 1,500,000 | | | Federal Farm Credit Banks Funding Corporation | | | | 4.0000 | | 01/13/26 | | $ | 1,474,393 | |
| | 3,000,000 | | | Federal Farm Credit Banks Funding Corporation | | | | 2.9200 | | 04/29/26 | | | 2,844,164 | |
| | 1,500,000 | | | Federal Farm Credit Banks Funding Corporation | | | | 5.3000 | | 10/19/26 | | | 1,485,537 | |
| | 1,000,000 | | | Federal Farm Credit Banks Funding Corporation | | | | 3.8750 | | 02/14/28 | | | 986,712 | |
| | 1,000,000 | | | Federal Farm Credit Banks Funding Corporation | | | | 4.3750 | | 03/10/28 | | | 1,006,269 | |
| | 1,000,000 | | | Federal Farm Credit Banks Funding Corporation | | | | 3.5000 | | 04/12/28 | | | 970,987 | |
| | 1,250,000 | | | Federal Farm Credit Banks Funding Corporation | | | | 3.6250 | | 07/24/28 | | | 1,216,321 | |
| | 1,600,000 | | | Federal Farm Credit Banks Funding Corporation | | | | 4.5000 | | 03/09/29 | | | 1,620,272 | |
| | 1,000,000 | | | Federal Home Loan Mortgage Corporation | | | | 5.2000 | | 05/17/24 | | | 994,788 | |
| | 1,500,000 | | | Federal Home Loan Mortgage Corporation | | | | 5.2500 | | 12/09/24 | | | 1,488,618 | |
| | | | | | | | | | | | | | 22,480,959 | |
| | | | | TOTAL U.S. GOVERNMENT & AGENCIES (Cost $33,483,749) | | | | | | | | | 32,630,962 | |
| | | | | | | | | | | | | | | |
| Shares | | | | | | | | | | | Fair Value | |
| | | | | SHORT-TERM INVESTMENTS — 1.3% | | | | | | | | | | |
| | | | | MONEY MARKET FUNDS — 1.3% | | | | | | | | | | |
| | 1,606,256 | | | First American Government Obligations Fund, Class U, 5.03%4 (Cost $1,606,256) | | | | | | | | | 1,606,256 | |
| | | | | | | | | | | | | | | |
| | | | | TOTAL INVESTMENTS — 98.9% (Cost $132,599,728) | | | | | | | | $ | 125,959,398 | |
| | | | | OTHER ASSETS IN EXCESS OF LIABILITIES- 1.1% | | | | | | | | | 1,412,815 | |
| | | | | NET ASSETS — 100.0% | | | | | | | | $ | 127,372,213 | |
| LLC | - Limited Liability Company |
| L.P. | - Limited Partnership |
| H15T1Y | US Treasury Yield Curve Rate T Note Constant Maturity 1 Year |
| SOFRRATE | United States SOFR Secured Overnight Financing Rate |
| US0003M | ICE LIBOR USD 3 Month |
| 1. | Security exempt from registration under Rule 144A or Section 4(2) of the Securities Act of 1933. The security may be resold in transactions exempt from registration, normally to qualified institutional buyers. As of June 30, 2023 the total market value of 144A securities is $12,585,159 or 9.9% of net assets. |
| 2. | Variable or floating rate security, the interest rate of which adjusts periodically based on changes in current interest rates and prepayments on the underlying pool of assets. |
| 3. | Percentage rounds to less than 0.1%. |
| 4. | Rate disclosed is the seven day effective yield as of June 30, 2023. |
See accompanying notes to financial statements.
| A N N U A L R E P O R T | June 30, 2023 |
| Eventide Multi-Asset Income Fund | |
| SCHEDULE OF INVESTMENTS | June 30, 2023 |
| Shares | | | | | Fair Value | |
| | | | | COMMON STOCKS — 47.3% | | | | |
| | | | | AUTOMOTIVE — 0.5% | | | | |
| | 17,206 | | | Aptiv PLC1 | | $ | 1,756,601 | |
| | | | | | | | | |
| | | | | BIOTECH & PHARMA — 1.4% | | | | |
| | 150,798 | | | Royalty Pharma plc, Class A | | | 4,635,531 | |
| | | | | | | | | |
| | | | | CHEMICALS — 1.7% | | | | |
| | 20,905 | | | Sherwin-Williams Company (The) | | | 5,550,696 | |
| | | | | | | | | |
| | | | | DATA CENTER REIT — 0.5% | | | | |
| | 2,202 | | | Equinix, Inc. | | | 1,726,236 | |
| | | | | | | | | |
| | | | | DIVERSIFIED INDUSTRIALS — 1.4% | | | | |
| | 74,041 | | | Pentair PLC | | | 4,783,049 | |
| | | | | | | | | |
| | | | | ELECTRIC UTILITIES — 2.3% | | | | |
| | 29,893 | | | Clearway Energy, Inc. | | | 853,744 | |
| | 64,956 | | | CMS Energy Corporation | | | 3,816,165 | |
| | 52,329 | | | NextEra Energy Partners, L.P. | | | 3,068,573 | |
| | | | | | | | 7,738,482 | |
| | | | | ELECTRICAL EQUIPMENT — 7.7% | | | | |
| | 191,313 | | | nVent Electric PLC | | | 9,885,142 | |
| | 16,726 | | | Roper Technologies, Inc. | | | 8,041,861 | |
| | 38,624 | | | Trane Technologies PLC | | | 7,387,226 | |
| | | | | | | | 25,314,229 | |
| | | | | HEALTH CARE FACILITIES & SERVICES — 1.1% | | | | |
| | 51,979 | | | Encompass Health Corporation | | | 3,519,498 | |
| | | | | | | | | |
| | | | | INDUSTRIAL REIT — 1.9% | | | | |
| | 52,000 | | | Prologis, Inc. | | | 6,376,760 | |
| | | | | | | | | |
| | | | | INSTITUTIONAL FINANCIAL SERVICES — 0.6% | | | | |
| | 42,813 | | | Nasdaq, Inc. | | | 2,134,228 | |
See accompanying notes to financial statements.
| A N N U A L R E P O R T | June 30, 2023 |
| Eventide Multi-Asset Income Fund | |
| SCHEDULE OF INVESTMENTS (Continued) | June 30, 2023 |
| Shares | | | | | Fair Value | |
| | | | | COMMON STOCKS — 47.3% (Continued) | | | | |
| | | | | INSURANCE — 1.5% | | | | |
| | 22,757 | | | Arthur J Gallagher & Company | | $ | 4,996,755 | |
| | | | | | | | | |
| | | | | MACHINERY — 0.7% | | | | |
| | 10,797 | | | IDEX Corporation | | | 2,324,162 | |
| | | | | | | | | |
| | | | | MEDICAL EQUIPMENT & DEVICES — 3.7% | | | | |
| | 51,523 | | | Bruker Corporation | | | 3,808,580 | |
| | 2,074 | | | Mettler-Toledo International, Inc.1 | | | 2,720,341 | |
| | 26,391 | | | STERIS plc | | | 5,937,447 | |
| | | | | | | | 12,466,368 | |
| | | | | OIL & GAS PRODUCERS — 5.1% | | | | |
| | 26,505 | | | Diamondback Energy, Inc. | | | 3,481,697 | |
| | 90,139 | | | Targa Resources Corporation | | | 6,859,578 | |
| | 201,027 | | | Williams Companies, Inc. (The) | | | 6,559,511 | |
| | | | | | | | 16,900,786 | |
| | | | | RESIDENTIAL REIT — 1.0% | | | | |
| | 48,926 | | | Equity LifeStyle Properties, Inc. | | | 3,272,660 | |
| | | | | | | | | |
| | | | | RETAIL - DISCRETIONARY — 2.8% | | | | |
| | 12,205 | | | Lithia Motors, Inc. | | | 3,711,663 | |
| | 24,811 | | | Lowe’s Companies, Inc. | | | 5,599,842 | |
| | | | | | | | 9,311,505 | |
| | | | | SEMICONDUCTORS — 2.6% | | | | |
| | 13,780 | | | Entegris, Inc. | | | 1,527,100 | |
| | 12,620 | | | KLA Corporation | | | 6,120,952 | |
| | 1,703 | | | Lam Research Corporation | | | 1,094,791 | |
| | | | | | | | 8,742,843 | |
| | | | | SOFTWARE — 3.3% | | | | |
| | 20,917 | | | Palo Alto Networks, Inc.1 | | | 5,344,503 | |
| | 9,201 | | | Synopsys, Inc.1 | | | 4,006,207 | |
| | 7,784 | | | Workday, Inc., Class A1 | | | 1,758,328 | |
| | | | | | | | 11,109,038 | |
| | | | | TECHNOLOGY SERVICES — 3.9% | | | | |
| | 39,280 | | | CDW Corporation | | | 7,207,879 | |
See accompanying notes to financial statements.
| A N N U A L R E P O R T | June 30, 2023 |
| Eventide Multi-Asset Income Fund | |
| SCHEDULE OF INVESTMENTS (Continued) | June 30, 2023 |
| Shares | | | | | | | | | Fair Value | |
| | | | | COMMON STOCKS — 47.3% (Continued) | | | | | | | | |
| | | | | TECHNOLOGY SERVICES — 3.9% (Continued) | | | | | | | | |
| | 6,940 | | | MSCI, Inc. | | | | | | $ | 3,256,873 | |
| | 10,942 | | | Verisk Analytics, Inc. | | | | | | | 2,473,220 | |
| | | | | | | | | | | | 12,937,972 | |
| | | | | TRANSPORTATION & LOGISTICS — 1.8% | | | | | | | | |
| | 16,561 | | | Old Dominion Freight Line, Inc. | | | | | | | 6,123,430 | |
| | | | | | | | | | | | | |
| | | | | WHOLESALE - CONSUMER STAPLES — 1.0% | | | | | | | | |
| | 42,967 | | | Sysco Corporation | | | | | | | 3,188,151 | |
| | | | | | | | | | | | | |
| | | | | WHOLESALE - DISCRETIONARY — 0.8% | | | | | | | | |
| | 7,131 | | | Pool Corporation | | | | | | | 2,671,558 | |
| | | | | | | | | | | | | |
| | | | | TOTAL COMMON STOCKS (Cost $130,566,144) | | | | | | | 157,580,538 | |
| | | | | | | | | | | | | |
Principal
Amount ($) | | | | | Coupon
Rate (%) | | Maturity | | Fair Value | |
| | | | | ASSET BACKED SECURITIES — 1.6% | | | | | | | | |
| | | | | AUTO LOAN — 1.1% | | | | | | | | |
| | 3,150,000 | | | CarMax Auto Owner Trust Series 2020-4 C | | 1.3000 | | 08/17/26 | | | 2,928,359 | |
| | 750,000 | | | CarMax Auto Owner Trust Series 2021-2 C | | 1.3400 | | 02/16/27 | | | 686,076 | |
| | | | | | | | | | | | 3,614,435 | |
| | | | | OTHER ABS — 0.5% | | | | | | | | |
| | 1,700,000 | | | PFS Financing Corporation Series 2020-G A2 | | 0.9700 | | 02/15/26 | | | 1,645,235 | |
| | | | | | | | | | | | | |
| | | | | | | | | | | | | |
| | | | | TOTAL ASSET BACKED SECURITIES (Cost $5,618,454) | | | | | | | 5,259,670 | |
| | | | | | | | | | | | | |
Principal
Amount ($) | | | | | Coupon
Rate (%) | | Maturity | | Fair Value | |
| | | | | COLLATERALIZED MORTGAGE OBLIGATIONS — 0.5% | | | | | | | | |
| | | | | CMBS — 0.5% | | | | | | | | |
| | 1,000,000 | | | Freddie Mac Multifamily Structured Pass Through Certificates Series KG01 A10 | | 2.9390 | | 04/25/29 | | | 911,704 | |
| | 1,000,000 | | | Freddie Mac Multifamily Structured Pass Through Certificates Series KG02 A2 | | 2.4120 | | 08/25/29 | | | 886,859 | |
See accompanying notes to financial statements.
| A N N U A L R E P O R T | June 30, 2023 |
| Eventide Multi-Asset Income Fund | |
| SCHEDULE OF INVESTMENTS (Continued) | June 30, 2023 |
Principal
Amount ($) | | | | | | | Coupon
Rate (%) | | Maturity | | Fair Value | |
| | | | | COLLATERALIZED MORTGAGE OBLIGATIONS — 0.5% (Continued) | | | | | | | | | | |
| | | | | CMBS — 0.5% (Continued) | | | | | | | | | | |
| | | | | TOTAL COLLATERALIZED MORTGAGE OBLIGATIONS (Cost $2,037,982) | | | | | | | | $ | 1,798,563 | |
| | | | | | | | | | | | | | | |
Principal
Amount ($) | | | | | | | Coupon
Rate (%) | | Maturity | | Fair Value | |
| | | | | CONVERTIBLE BONDS — 1.0% | | | | | | | | | | |
| | | | | BIOTECH & PHARMA — 0.5% | | | | | | | | | | |
| | 1,400,000 | | | Mirum Pharmaceuticals, Inc.2 | | | | 4.0000 | | 05/01/29 | | | 1,577,100 | |
| | | | | | | | | | | | | | | |
| | | | | TECHNOLOGY HARDWARE & EQUIPMENT — 0.5% | | | | | | | | | | |
| | 2,100,000 | | | Xometry, Inc. | | | | 1.0000 | | 02/01/27 | | | 1,588,650 | |
| | | | | | | | | | | | | | | |
| | | | | TOTAL CONVERTIBLE BONDS (Cost $3,180,753) | | | | | | | | | 3,165,750 | |
| | | | | | | | | | | | | | | |
Principal
Amount ($) | | | | | Spread | | Coupon
Rate (%) | | Maturity | | Fair Value | |
| | | | | CORPORATE BONDS — 25.3% | | | | | | | | | | |
| | | | | ASSET MANAGEMENT — 1.1% | | | | | | | | | | |
| | 3,800,000 | | | Vision Fund International3,4,5,6 | | | | 3.7250 | | 02/24/25 | | | 3,800,000 | |
| | | | | | | | | | | | | | | |
| | | | | AUTOMOTIVE — 0.5% | | | | | | | | | | |
| | 2,025,000 | | | Dana, Inc. | | | | 4.2500 | | 09/01/30 | | | 1,687,705 | |
| | | | | | | | | | | | | | | |
| | | | | BANKING — 3.4% | | | | | | | | | | |
| | 3,725,000 | | | Bank of America Corporation Series N7 | | US0003M + 0.870% | | 2.4560 | | 10/22/25 | | | 3,557,405 | |
| | 3,425,000 | | | JPMorgan Chase & Company7 | | SOFRRATE + 0.600% | | 0.6530 | | 09/16/24 | | | 3,385,210 | |
| | 2,800,000 | | | National Bank of Canada7 | | H15T1Y + 0.400% | | 0.5500 | | 11/15/24 | | | 2,741,686 | |
| | 1,865,000 | | | Royal Bank of Canada | | | | 1.1500 | | 07/14/26 | | | 1,650,765 | |
| | | | | | | | | | | | | | 11,335,066 | |
| | | | | CONSTRUCTION MATERIALS — 0.3% | | | | | | | | | | |
| | 1,300,000 | | | Advanced Drainage Systems, Inc.2 | | | | 5.0000 | | 09/30/27 | | | 1,231,509 | |
| | | | | | | | | | | | | | | |
| | | | | CONTAINERS & PACKAGING — 0.3% | | | | | | | | | | |
| | 1,000,000 | | | TriMas Corporation2 | | | | 4.1250 | | 04/15/29 | | | 892,060 | |
See accompanying notes to financial statements.
| A N N U A L R E P O R T | June 30, 2023 |
| Eventide Multi-Asset Income Fund | |
| SCHEDULE OF INVESTMENTS (Continued) | June 30, 2023 |
Principal
Amount ($) | | | | | Spread | | Coupon
Rate (%) | | Maturity | | Fair Value | |
| | | | | CORPORATE BONDS — 25.3% (Continued) | | | | | | | | | | |
| | | | | ELEC & GAS MARKETING & TRADING — 0.6% | | | | | | | | | | |
| | 2,250,000 | | | Southern Power Company | | | | 0.9000 | | 01/15/26 | | $ | 2,016,900 | |
| | | | | | | | | | | | | | | |
| | | | | ELECTRIC UTILITIES — 5.9% | | | | | | | | | | |
| | 1,235,000 | | | AES Corporation (The) | | | | 1.3750 | | 01/15/26 | | | 1,103,528 | |
| | 1,850,000 | | | Avangrid, Inc. | | | | 3.1500 | | 12/01/24 | | | 1,775,176 | |
| | 3,266,000 | | | CenterPoint Energy, Inc.7 | | SOFRRATE + 0.650% | | 5.7220 | | 05/13/24 | | | 3,263,038 | |
| | 3,000,000 | | | Dominion Energy, Inc. | | | | 2.2500 | | 08/15/31 | | | 2,419,350 | |
| | 600,000 | | | Duke Energy Florida, LLC | | | | 2.5000 | | 12/01/29 | | | 518,409 | |
| | 1,225,000 | | | MidAmerican Energy Company | | | | 3.1000 | | 05/01/27 | | | 1,145,341 | |
| | 3,475,000 | | | National Rural Utilities Cooperative Finance Corporation | | | | 1.3500 | | 03/15/31 | | | 2,652,392 | |
| | 3,850,000 | | | NextEra Energy Capital Holdings, Inc. | | | | 1.9000 | | 06/15/28 | | | 3,299,574 | |
| | 1,250,000 | | | Tucson Electric Power Company | | | | 1.5000 | | 08/01/30 | | | 987,569 | |
| | 3,303,000 | | | Wisconsin Power and Light Company | | | | 1.9500 | | 09/16/31 | | | 2,625,658 | |
| | | | | | | | | | | | | | 19,790,035 | |
| | | | | ENGINEERING & CONSTRUCTION — 1.0% | | | | | | | | | | |
| | 1,435,000 | | | Installed Building Products, Inc.2 | | | | 5.7500 | | 02/01/28 | | | 1,354,123 | |
| | 2,000,000 | | | MasTec, Inc.2 | | | | 4.5000 | | 08/15/28 | | | 1,845,744 | |
| | | | | | | | | | | | | | 3,199,867 | |
| | | | | FORESTRY, PAPER & WOOD PRODUCTS — 0.3% | | | | | | | | | | |
| | 1,000,000 | | | Louisiana-Pacific Corporation2 | | | | 3.6250 | | 03/15/29 | | | 876,425 | |
| | | | | | | | | | | | | | | |
| | | | | HOME & OFFICE PRODUCTS — 0.5% | | | | | | | | | | |
| | 1,910,000 | | | Tempur Sealy International, Inc.2 | | | | 4.0000 | | 04/15/29 | | | 1,645,042 | |
| | | | | | | | | | | | | | | |
| | | | | HOME CONSTRUCTION — 0.8% | | | | | | | | | | |
| | 1,750,000 | | | M/I Homes, Inc. | | | | 3.9500 | | 02/15/30 | | | 1,494,255 | |
| | 1,000,000 | | | Patrick Industries, Inc.2 | | | | 7.5000 | | 10/15/27 | | | 968,400 | |
| | | | | | | | | | | | | | 2,462,655 | |
| | | | | INDUSTRIAL SUPPORT SERVICES — 0.4% | | | | | | | | | | |
| | 1,500,000 | | | United Rentals North America, Inc. | | | | 4.8750 | | 01/15/28 | | | 1,428,806 | |
See accompanying notes to financial statements.
| A N N U A L R E P O R T | June 30, 2023 |
| Eventide Multi-Asset Income Fund | |
| SCHEDULE OF INVESTMENTS (Continued) | June 30, 2023 |
Principal
Amount ($) | | | | | Spread | | Coupon
Rate (%) | | Maturity | | Fair Value | |
| | | | | CORPORATE BONDS — 25.3% (Continued) | | | | | | | | | | |
| | | | | INSTITUTIONAL FINANCIAL SERVICES — 1.1% | | | | | | | | | | |
| | 3,875,000 | | | Morgan Stanley7 | | SOFRRATE + 0.745% | | 0.8640 | | 10/21/25 | | $ | 3,604,831 | |
| | | | | | | | | | | | | | | |
| | | | | INSURANCE — 0.8% | | | | | | | | | | |
| | 1,015,000 | | | Aflac, Inc. | | | | 1.1250 | | 03/15/26 | | | 908,905 | |
| | 2,000,000 | | | Pacific Life Global Funding II2 | | | | 1.3750 | | 04/14/26 | | | 1,787,591 | |
| | | | | | | | | | | | | | 2,696,496 | |
| | | | | MACHINERY — 1.0% | | | | | | | | | | |
| | 1,750,000 | | | Mueller Water Products, Inc.2 | | | | 4.0000 | | 06/15/29 | | | 1,553,389 | |
| | 1,875,000 | | | Xylem, Inc. | | | | 1.9500 | | 01/30/28 | | | 1,645,643 | |
| | | | | | | | | | | | | | 3,199,032 | |
| | | | | OIL & GAS PRODUCERS — 0.5% | | | | | | | | | | |
| | 1,250,000 | | | Cheniere Energy Partners, L.P. | | | | 4.5000 | | 10/01/29 | | | 1,148,096 | |
| | 550,000 | | | Diamondback Energy, Inc. | | | | 3.5000 | | 12/01/29 | | | 494,634 | |
| | | | | | | | | | | | | | 1,642,730 | |
| | | | | REAL ESTATE INVESTMENT TRUSTS — 3.6% | | | | | | | | | | |
| | 1,675,000 | | | Alexandria Real Estate Equities, Inc. | | | | 3.8000 | | 04/15/26 | | | 1,602,149 | |
| | 1,500,000 | | | American Tower Corporation | | | | 4.0500 | | 03/15/32 | | | 1,367,893 | |
| | 2,850,000 | | | AvalonBay Communities, Inc. | | | | 2.0500 | | 01/15/32 | | | 2,281,039 | |
| | 1,750,000 | | | HAT Holdings I, LLC/HAT Holdings II, LLC2 | | | | 3.3750 | | 06/15/26 | | | 1,570,113 | |
| | 1,985,000 | | | Prologis, L.P. | | | | 1.2500 | | 10/15/30 | | | 1,534,238 | |
| | 2,210,000 | | | Public Storage7 | | SOFRRATE + 0.470% | | 5.5000 | | 04/23/24 | | | 2,209,022 | |
| | 1,500,000 | | | Welltower, Inc. | | | | 2.7000 | | 02/15/27 | | | 1,358,356 | |
| | | | | | | | | | | | | | 11,922,810 | |
| | | | | RETAIL - DISCRETIONARY — 0.5% | | | | | | | | | | |
| | 1,000,000 | | | Asbury Automotive Group, Inc. | | | | 4.5000 | | 03/01/28 | | | 917,855 | |
| | 1,000,000 | | | Builders FirstSource, Inc.2 | | | | 4.2500 | | 02/01/32 | | | 871,240 | |
| | | | | | | | | | | | | | 1,789,095 | |
| | | | | SEMICONDUCTORS — 1.5% | | | | | | | | | | |
| | 1,185,000 | | | Amkor Technology, Inc.2 | | | | 6.6250 | | 09/15/27 | | | 1,188,192 | |
| | 2,800,000 | | | NXP BV/NXP Funding, LLC/NXP USA, Inc. | | | | 2.5000 | | 05/11/31 | | | 2,282,528 | |
| | 1,925,000 | | | Synaptics, Inc.2 | | | | 4.0000 | | 06/15/29 | | | 1,618,124 | |
| | | | | | | | | | | | | | 5,088,844 | |
See accompanying notes to financial statements.
| A N N U A L R E P O R T | June 30, 2023 |
| Eventide Multi-Asset Income Fund | |
| SCHEDULE OF INVESTMENTS (Continued) | June 30, 2023 |
Principal
Amount ($) | | | | | Spread | | Coupon
Rate (%) | | Maturity | | Fair Value | |
| | | | | CORPORATE BONDS — 25.3% (Continued) | | | | | | | | | | |
| | | | | SOFTWARE — 0.3% | | | | | | | | | | |
| | 1,000,000 | | | Workday, Inc. | | | | 3.8000 | | 04/01/32 | | $ | 900,250 | |
| | | | | | | | | | | | | | | |
| | | | | TECHNOLOGY SERVICES — 0.2% | | | | | | | | | | |
| | 750,000 | | | Visa, Inc. | | | | 0.7500 | | 08/15/27 | | | 650,332 | |
| | | | | | | | | | | | | | | |
| | | | | WHOLESALE - CONSUMER STAPLES — 0.7% | | | | | | | | | | |
| | 2,775,000 | | | Sysco Corporation | | | | 2.4000 | | 02/15/30 | | | 2,364,894 | |
| | | | | | | | | | | | | | | |
| | | | | TOTAL CORPORATE BONDS (Cost $94,183,188) | | | | | | | | | 84,225,384 | |
| | | | | | | | | | | | | | | |
Principal
Amount ($) | | | | | | | Coupon
Rate (%) | | Maturity | | Fair Value | |
| | | | | MUNICIPAL BONDS — 2.2% | | | | | | | | | | |
| | | | | COMBINED UTILITIES — 0.5% | | | | | | | | | | |
| | 1,475,000 | | | City of Tacoma, WA Electric System Revenue | | | | 5.6410 | | 01/01/27 | | | 1,506,606 | |
| | | | | | | | | | | | | | | |
| | | | | COUNTY — 0.0%7 | | | | | | | | | | |
| | 150,000 | | | City & County of Honolulu, HI | | | | 2.5180 | | 10/01/26 | | | 140,044 | |
| | | | | | | | | | | | | | | |
| | | | | MISCELLANEOUS TAX — 0.6% | | | | | | | | | | |
| | 2,050,000 | | | Commonwealth of Massachusetts | | | | 3.6390 | | 07/15/24 | | | 2,009,103 | |
| | | | | | | | | | | | | | | |
| | | | | MULTI-FAMILY HOUSING — 0.2% | | | | | | | | | | |
| | 500,000 | | | New York City Housing Development Corporation | | | | 1.3500 | | 11/01/26 | | | 466,882 | |
| | 100,000 | | | New York State Housing Finance Agency | | | | 0.6500 | | 05/01/25 | | | 94,636 | |
| | | | | | | | | | | | | | 561,518 | |
| | | | | RESOURCE RECOVERY — 0.0%8 | | | | | | | | | | |
| | 100,000 | | | City of Napa, CA Solid Waste Revenue | | | | 2.3300 | | 08/01/25 | | | 94,241 | |
| | | | | | | | | | | | | | | |
| | | | | SINGLE-FAMILY HOUSING — 0.1% | | | | | | | | | | |
| | 505,000 | | | Texas Department of Housing & Community Affairs | | | | 0.4500 | | 01/01/24 | | | 497,018 | |
| | | | | | | | | | | | | | | |
| | | | | STATE — 0.3% | | | | | | | | | | |
| | 200,000 | | | State of Oregon | | | | 0.8950 | | 05/01/25 | | | 185,076 | |
See accompanying notes to financial statements.
| A N N U A L R E P O R T | June 30, 2023 |
| Eventide Multi-Asset Income Fund | |
| SCHEDULE OF INVESTMENTS (Continued) | June 30, 2023 |
Principal
Amount ($) | | | | | Coupon
Rate (%) | | Maturity | | Fair Value | |
| | | | | MUNICIPAL BONDS — 2.2% (Continued) | | | | | | | | |
| | | | | STATE — 0.3% (Continued) | | | | | | | | |
| | 250,000 | | | State of Oregon | | 1.1850 | | 05/01/26 | | $ | 225,755 | |
| | 500,000 | | | State of Oregon | | 1.3150 | | 05/01/27 | | | 441,556 | |
| | | | | | | | | | | | 852,387 | |
| | | | | WATER AND SEWER — 0.5% | | | | | | | | |
| | 2,000,000 | | | City of Aurora, CO Water Revenue | | 2.0980 | | 08/01/34 | | | 1,559,031 | |
| | 200,000 | | | City of Los Angeles, CA Wastewater System Revenue | | 3.6940 | | 06/01/32 | | | 183,460 | |
| | | | | | | | | | | | 1,742,491 | |
| | | | | TOTAL MUNICIPAL BONDS (Cost $8,272,808) | | | | | | | 7,403,408 | |
| | | | | | | | | | | | | |
Principal
Amount ($) | | | | | Coupon
Rate (%) | | Maturity | | Fair Value | |
| | | | | U.S. GOVERNMENT & AGENCIES — 20.2% | | | | | | | | |
| | | | | AGENCY FIXED RATE — 12.3% | | | | | | | | |
| | 265,135 | | | Fannie Mae Pool MA2915 | | 3.0000 | | 02/01/27 | | | 255,532 | |
| | 926,657 | | | Fannie Mae Pool MA4263 | | 1.5000 | | 02/01/31 | | | 838,832 | |
| | 974,682 | | | Fannie Mae Pool MA4284 | | 1.5000 | | 03/01/31 | | | 881,838 | |
| | 660,347 | | | Fannie Mae Pool FM3333 | | 2.0000 | | 06/01/35 | | | 589,730 | |
| | 494,201 | | | Fannie Mae Pool MA4095 | | 2.0000 | | 08/01/35 | | | 441,359 | |
| | 445,204 | | | Fannie Mae Pool BM5466 | | 2.5000 | | 10/01/43 | | | 384,620 | |
| | 430,700 | | | Fannie Mae Pool BM5975 | | 3.0000 | | 12/01/45 | | | 389,230 | |
| | 371,848 | | | Fannie Mae Pool MA2806 | | 3.0000 | | 11/01/46 | | | 334,324 | |
| | 389,161 | | | Fannie Mae Pool BM5976 | | 3.0000 | | 02/01/47 | | | 351,724 | |
| | 935,979 | | | Fannie Mae Pool BP5878 | | 2.5000 | | 06/01/50 | | | 799,165 | |
| | 1,341,917 | | | Fannie Mae Pool MA4096 | | 2.5000 | | 08/01/50 | | | 1,147,838 | |
| | 1,543,245 | | | Fannie Mae Pool MA4306 | | 2.5000 | | 04/01/51 | | | 1,316,223 | |
| | 1,551,623 | | | Fannie Mae Pool MA4326 | | 2.5000 | | 05/01/51 | | | 1,322,398 | |
| | 1,773,525 | | | Fannie Mae Pool MA4327 | | 3.0000 | | 05/01/51 | | | 1,567,754 | |
| | 1,859,117 | | | Fannie Mae Pool MA4356 | | 2.5000 | | 06/01/51 | | | 1,583,308 | |
| | 2,264,883 | | | Fannie Mae Pool MA4379 | | 2.5000 | | 07/01/51 | | | 1,928,844 | |
| | 3,621,790 | | | Fannie Mae Pool CB2661 | | 3.0000 | | 01/01/52 | | | 3,203,283 | |
| | 3,467,693 | | | Fannie Mae Pool MA4600 | | 3.5000 | | 05/01/52 | | | 3,163,471 | |
| | 3,240,101 | | | Fannie Mae Pool MA4625 | | 3.5000 | | 06/01/52 | | | 2,955,848 | |
| | 2,607,929 | | | Fannie Mae Pool MA4655 | | 4.0000 | | 07/01/52 | | | 2,450,224 | |
| | 3,021,163 | | | Fannie Mae Pool MA4916 | | 4.0000 | | 02/01/53 | | | 2,836,750 | |
See accompanying notes to financial statements.
| A N N U A L R E P O R T | June 30, 2023 |
| Eventide Multi-Asset Income Fund | |
| SCHEDULE OF INVESTMENTS (Continued) | June 30, 2023 |
Principal
Amount ($) | | | | | Coupon
Rate (%) | | Maturity | | Fair Value | |
| | | | | U.S. GOVERNMENT & AGENCIES — 20.2% (Continued) | | | | | | | | |
| | | | | AGENCY FIXED RATE — 12.3% (Continued) | | | | | | | | |
| | 772,610 | | | Freddie Mac Pool ZS9163 | | 3.0000 | | 09/01/33 | | $ | 723,309 | |
| | 670,996 | | | Freddie Mac Pool ZS9382 | | 3.0000 | | 09/01/43 | | | 606,395 | |
| | 620,810 | | | Freddie Mac Pool SD8089 | | 2.5000 | | 07/01/50 | | | 530,565 | |
| | 1,350,469 | | | Freddie Mac Pool SD8122 | | 2.5000 | | 01/01/51 | | | 1,153,031 | |
| | 1,843,779 | | | Freddie Mac Pool RA5696 | | 2.5000 | | 08/01/51 | | | 1,568,417 | |
| | 3,047,801 | | | Freddie Mac Pool SD8214 | | 3.5000 | | 05/01/52 | | | 2,780,419 | |
| | 1,412,941 | | | Freddie Mac Pool SD8238 | | 4.5000 | | 08/01/52 | | | 1,360,071 | |
| | 2,912,744 | | | Freddie Mac Pool SD8288 | | 5.0000 | | 01/01/53 | | | 2,857,135 | |
| | 349,056 | | | Ginnie Mae II Pool MA3375 | | 3.0000 | | 01/20/46 | | | 318,480 | |
| | | | | | | | | | | | 40,640,117 | |
| | | | | AGENCY MBS OTHER — 0.9% | | | | | | | | |
| | 3,157,199 | | | Fannie Mae Pool MA4805 | | 4.5000 | | 11/01/52 | | | 3,038,327 | |
| | | | | | | | | | | | | |
| | | | | GOVERNMENT OWNED, NO GUARANTEE — 3.0% | | | | | | | | |
| | 1,250,000 | | | Federal Home Loan Mortgage Corporation | | 0.8000 | | 10/28/26 | | | 1,107,594 | |
| | 2,500,000 | | | Federal Home Loan Mortgage Corporation | | 6.2500 | | 07/15/32 | | | 2,904,977 | |
| | 1,500,000 | | | Federal National Mortgage Association | | 0.8750 | | 12/18/26 | | | 1,315,868 | |
| | 4,350,000 | | | Federal National Mortgage Association | | 0.8750 | | 08/05/30 | | | 3,497,670 | |
| | 1,000,000 | | | Federal National Mortgage Association | | 5.6250 | | 07/15/37 | | | 1,146,822 | |
| | | | | | | | | | | | 9,972,931 | |
| | | | | GOVERNMENT SPONSORED — 4.0% | | | | | | | | |
| | 1,000,000 | | | Federal Farm Credit Banks Funding Corporation | | 3.1250 | | 04/26/30 | | | 931,084 | |
| | 1,250,000 | | | Federal Farm Credit Banks Funding Corporation | | 1.7300 | | 09/22/31 | | | 1,012,374 | |
| | 3,250,000 | | | Federal Farm Credit Banks Funding Corporation | | 3.2500 | | 07/28/32 | | | 2,992,510 | |
| | 1,750,000 | | | Federal Farm Credit Banks Funding Corporation | | 1.4700 | | 10/15/32 | | | 1,344,328 | |
| | 1,000,000 | | | Federal Farm Credit Banks Funding Corporation | | 4.0000 | | 02/09/33 | | | 978,204 | |
| | 2,000,000 | | | Federal Farm Credit Banks Funding Corporation | | 4.3750 | | 03/03/33 | | | 2,001,882 | |
| | 2,500,000 | | | Federal Home Loan Mortgage Corporation | | 5.2000 | | 05/17/24 | | | 2,486,971 | |
| | 1,750,000 | | | Federal Home Loan Mortgage Corporation | | 5.2500 | | 12/09/24 | | | 1,736,722 | |
| | | | | | | | | | | | 13,484,075 | |
| | | | | TOTAL U.S. GOVERNMENT & AGENCIES (Cost $73,123,873) | | | | | | | 67,135,450 | |
See accompanying notes to financial statements.
| A N N U A L R E P O R T | June 30, 2023 |
| Eventide Multi-Asset Income Fund | |
| SCHEDULE OF INVESTMENTS (Continued) | June 30, 2023 |
| Shares | | | | | Fair Value | |
| | | | | SHORT-TERM INVESTMENTS — 0.9% | | | | |
| | | | | MONEY MARKET FUNDS — 0.9% | | | | |
| | 105,563 | | | Fidelity Government Portfolio, Class I, 4.98%9 | | $ | 105,563 | |
| | 2,942,908 | | | First American Government Obligations Fund, Class U, 5.03%9 | | | 2,942,908 | |
| | | | | TOTAL MONEY MARKET FUNDS (Cost $3,048,471) | | | 3,048,471 | |
| | | | | | | | | |
| | | | | TOTAL SHORT-TERM INVESTMENTS (Cost $3,048,471) | | | 3,048,471 | |
| | | | | | | | | |
| | | | | TOTAL INVESTMENTS — 99.0% (Cost $320,031,673) | | $ | 329,617,234 | |
| | | | | OTHER ASSETS IN EXCESS OF LIABILITIES- 1.0% | | | 3,447,013 | |
| | | | | NET ASSETS — 100.0% | | $ | 333,064,247 | |
| LLC | - Limited Liability Company |
| L.P. | - Limited Partnership |
| MSCI | - Morgan Stanley Capital International |
| PLC | - Public Limited Company |
| REIT | - Real Estate Investment Trust |
| H15T1Y | US Treasury Yield Curve Rate T Note Constant Maturity 1 Year |
| SOFRRATE | United States SOFR Secured Overnight Financing Rate |
| US0003M | ICE LIBOR USD 3 Month |
| 1. | Non-income producing security. |
| 2. | Security exempt from registration under Rule 144A or Section 4(2) of the Securities Act of 1933. The security may be resold in transactions exempt from registration, normally to qualified institutional buyers. As of June 30, 2023 the total market value of 144A securities is $20,624,287 or 6.2% of net assets. |
| 3. | Illiquid security. The total fair value of these securities as of June 30, 2023 was $3,800,000, representing 1.1% of net assets. |
| 4. | The value of this security has been determined in good faith under policies of the Board of Trustees. |
| 5. | Restricted security. See Note 6 for additional details. |
| 7. | Variable or floating rate security, the interest rate of which adjusts periodically based on changes in current interest rates and prepayments on the underlying pool of assets. |
| 8. | Percentage rounds to less than 0.1%. |
| 9. | Rate disclosed is the seven day effective yield as of June 30, 2023. |
See accompanying notes to financial statements.
| A N N U A L R E P O R T | June 30, 2023 |
| Eventide Funds | |
| STATEMENTS OF ASSETS AND LIABILITIES | June 30, 2023 |
| | | Eventide | | | Eventide | | | Eventide | | | | | | Eventide | |
| | | Core Bond | | | Dividend | | | Exponential | | | Eventide | | | Healthcare & | |
| | | Fund | | | Opportunities Fund | | | Technologies Fund | | | Gilead Fund | | | Life Sciences Fund | |
| ASSETS | | | | | | | | | | | | | | | | | | | | |
| Investment securities: | | | | | | | | | | | | | | | | | | | | |
| Unaffiliated investments at cost | | $ | 84,472,215 | | | $ | 512,461,094 | | | $ | 92,908,353 | | | $ | 2,565,421,402 | | | $ | 1,306,774,836 | |
| Affiliated investments at cost | | | — | | | | — | | | | — | | | | 37,399,898 | | | | 272,848,512 | |
| Total Investments at cost | | | 84,472,215 | | | | 512,461,094 | | | | 92,908,353 | | | | 2,602,821,300 | | | | 1,579,623,348 | |
| Unaffiliated investments at value | | $ | 76,507,471 | | | $ | 569,076,755 | | | $ | 115,524,778 | | | $ | 3,735,738,364 | | | $ | 1,515,950,982 | |
| Affiliated investments at value | | | — | | | | — | | | | — | | | | 19,928,536 | | | | 288,540,561 | |
| Total investments at value | | | 76,507,471 | | | | 569,076,755 | | | | 115,524,778 | | | | 3,755,666,900 | | | | 1,804,491,543 | |
| Cash held at custodian | | | 385,000 | | | | 1,375,050 | | | | 225,000 | | | | 7,968,216 | | | | — | |
| Cash held at broker | | | — | | | | 103,229 | | | | 101,620 | | | | 118,531 | | | | 111,420 | |
| Receivable for securities sold | | | — | | | | 5,147,666 | | | | — | | | | — | | | | — | |
| Receivable for Fund shares sold | | | 46,315 | | | | 739,305 | | | | 135,897 | | | | 2,572,123 | | | | 1,199,196 | |
| Dividends and interest receivable | | | 622,781 | | | | 246,400 | | | | 44,066 | | | | 1,089,650 | | | | 535,653 | |
| Prepaid expenses and other assets | | | 7,169 | | | | 91,749 | | | | 36,025 | | | | 201,397 | | | | 127,786 | |
| TOTAL ASSETS | | | 77,568,736 | | | | 576,780,154 | | | | 116,067,386 | | | | 3,767,616,817 | | | | 1,806,465,598 | |
| | | | | | | | | | | | | | | | | | | | | |
| LIABILITIES | | | | | | | | | | | | | | | | | | | | |
| Payable for investments purchased | | | — | | | | 1,546,757 | | | | 4,502 | | | | 29,140 | | | | — | |
| Payable for Fund shares repurchased | | | 117,847 | | | | 796,070 | | | | 98,280 | | | | 3,022,931 | | | | 1,149,107 | |
| Management fees payable | | | 12,600 | | | | 346,754 | | | | 90,321 | | | | 2,902,860 | | | | 1,659,719 | |
| Distribution (12b-1) fees payable | | | 10,272 | | | | 89,566 | | | | 16,756 | | | | 49,498 | | | | 79,082 | |
| Compliance officer fees payable | | | 1 | | | | — | | | | — | | | | — | | | | — | |
| Payable to related parties | | | 16,655 | | | | 64,035 | | | | 12,916 | | | | 280,514 | | | | 85,333 | |
| Accrued expenses and other liabilities | | | 33,262 | | | | 127,937 | | | | 31,911 | | | | 693,983 | | | | 329,901 | |
| TOTAL LIABILITIES | | | 190,637 | | | | 2,971,119 | | | | 254,686 | | | | 6,978,926 | | | | 3,303,142 | |
| NET ASSETS | | $ | 77,378,099 | | | $ | 573,809,035 | | | $ | 115,812,700 | | | $ | 3,760,637,891 | | | $ | 1,803,162,456 | |
| | | | | | | | | | | | | | | | | | | | | |
| Composition of Net Assets: | | | | | | | | | | | | | | | | | | | | |
| Paid in capital | | $ | 96,464,566 | | | $ | 560,329,685 | | | $ | 149,529,124 | | | $ | 2,659,797,921 | | | $ | 1,641,601,235 | |
| Accumulated earnings (losses) | | | (19,086,467 | ) | | | 13,479,350 | | | | (33,716,424 | ) | | | 1,100,839,970 | | | | 161,561,221 | |
| NET ASSETS | | $ | 77,378,099 | | | $ | 573,809,035 | | | $ | 115,812,700 | | | $ | 3,760,637,891 | | | $ | 1,803,162,456 | |
| | | | | | | | | | | | | | | | | | | | | |
See accompanying notes to financial statements.
| A N N U A L R E P O R T | June 30, 2023 |
| Eventide Funds | |
| STATEMENTS OF ASSETS AND LIABILITIES (Continued) | June 30, 2023 |
| | | Eventide | | | Eventide | | | Eventide | | | | | | Eventide | |
| | | Core Bond | | | Dividend | | | Exponential | | | Eventide | | | Healthcare & | |
| | | Fund | | | Opportunities Fund | | | Technologies Fund | | | Gilead Fund | | | Life Sciences Fund | |
| Net Asset Value Per Share: | | | | | | | | | | | | | | | | | | | | |
| Class N Shares: | | | | | | | | | | | | | | | | | | | | |
| Net Assets | | $ | 37,445,327 | | | $ | 91,912,019 | | | $ | 22,185,698 | | | $ | 526,824,586 | | | $ | 133,006,359 | |
| Shares of beneficial interest outstanding 1 | | | 4,595,783 | | | | 6,273,140 | | | | 1,848,829 | | | | 10,918,365 | | | | 3,631,034 | |
| Net asset value (Net Assets ÷ Shares Outstanding), offering price, and redemption price per share | | $ | 8.15 | | | $ | 14.65 | | | $ | 12.00 | | | $ | 48.25 | | | $ | 36.63 | |
| | | | | | | | | | | | | | | | | | | | | |
| Class A Shares: | | | | | | | | | | | | | | | | | | | | |
| Net Assets | | $ | 411,943 | | | $ | 36,721,547 | | | $ | 8,257,238 | | | $ | 351,923,598 | | | $ | 151,885,327 | |
| Shares of beneficial interest outstanding 1 | | | 50,346 | | | | 2,505,107 | | | | 687,959 | | | | 7,340,696 | | | | 4,176,075 | |
| Net asset value (Net Assets ÷ Shares Outstanding) and redemption price per share | | $ | 8.18 | | | $ | 14.66 | | | $ | 12.00 | | | $ | 47.94 | | | $ | 36.37 | |
| | | | | | | | | | | | | | | | | | | | | |
| Maximum offering price per share (net asset value plus maximum sales charge of 5.75%) | | $ | 8.68 | | | $ | 15.55 | | | $ | 12.73 | | | $ | 50.86 | | | $ | 38.59 | |
| | | | | | | | | | | | | | | | | | | | | |
| Class C Shares: | | | | | | | | | | | | | | | | | | | | |
| Net Assets | | $ | 220,511 | | | $ | 14,889,097 | | | $ | 2,635,210 | | | $ | 218,201,463 | | | $ | 76,848,957 | |
| Shares of beneficial interest outstanding 1 | | | 27,200 | | | | 1,023,741 | | | | 224,556 | | | | 5,179,658 | | | | 2,301,814 | |
| Net asset value (Net Assets ÷ Shares Outstanding), offering price, and redemption price per share | | $ | 8.11 | | | $ | 14.54 | | | $ | 11.74 | | | $ | 42.13 | | | $ | 33.39 | |
| | | | | | | | | | | | | | | | | | | | | |
| Class I Shares: | | | | | | | | | | | | | | | | | | | | |
| Net Assets | | $ | 39,300,318 | | | $ | 430,286,372 | | | $ | 82,734,554 | | | $ | 2,663,688,244 | | | $ | 1,441,421,813 | |
| Shares of beneficial interest outstanding 1 | | | 4,823,537 | | | | 29,342,960 | | | | 6,849,008 | | | | 53,464,030 | | | | 38,492,842 | |
| Net asset value (Net Assets ÷ Shares Outstanding), offering price, and redemption price per share | | $ | 8.15 | | | $ | 14.66 | | | $ | 12.08 | | | $ | 49.82 | | | $ | 37.45 | |
| | | | | | | | | | | | | | | | | | | | | |
| 1. | Unlimited number of shares of beneficial interest authorized, no par value. |
See accompanying notes to financial statements.
| A N N U A L R E P O R T | June 30, 2023 |
| Eventide Funds | |
| STATEMENTS OF ASSETS AND LIABILITIES (Continued) | June 30, 2023 |
| | | Eventide | | | Eventide | | | Eventide | |
| | | Large Cap | | | Limited-Term | | | Multi-Asset | |
| | | Focus Fund | | | Bond Fund | | | Income Fund | |
| ASSETS | | | | | | | | | | | | |
| Investment securities: | | | | | | | | | | | | |
| Unaffiliated investments at cost | | $ | 11,912,425 | | | $ | 132,599,728 | | | $ | 320,031,673 | |
| Unaffiliated investments at value | | $ | 13,596,209 | | | $ | 125,959,398 | | | $ | 329,617,234 | |
| Cash held at custodian | | | 25,000 | | | | 630,000 | | | | 825,040 | |
| Cash held at broker | | | — | | | | — | | | | 106,937 | |
| Receivable for securities sold | | | — | | | | 37 | | | | 1,482,357 | |
| Receivable for Fund shares sold | | | 25 | | | | 62,338 | | | | 189,327 | |
| Dividends and interest receivable | | | 5,072 | | | | 1,011,853 | | | | 1,273,865 | |
| Due from Management | | | 6,401 | | | | — | | | | — | |
| Prepaid expenses and other assets | | | 27,424 | | | | 42,375 | | | | 75,927 | |
| TOTAL ASSETS | | | 13,660,131 | | | | 127,706,001 | | | | 333,570,687 | |
| | | | | | | | | | | | | |
| LIABILITIES | | | | | | | | | | | | |
| Payable for investments purchased | | | 278,280 | | | | — | | | | — | |
| Payable for Fund shares repurchased | | | 940 | | | | 221,675 | | | | 173,491 | |
| Management fees payable | | | — | | | | 20,060 | | | | 129,548 | |
| Distribution (12b-1) fees payable | | | — | | | | 6,395 | | | | 78,860 | |
| Compliance officer fees payable | | | 11 | | | | 139 | | | | 210 | |
| Payable to related parties | | | 4,045 | | | | 31,910 | | | | 34,487 | |
| Accrued expenses and other liabilities | | | 22,117 | | | | 53,609 | | | | 89,844 | |
| TOTAL LIABILITIES | | | 305,393 | | | | 333,788 | | | | 506,440 | |
| NET ASSETS | | $ | 13,354,738 | | | $ | 127,372,213 | | | $ | 333,064,247 | |
| | | | | | | | | | | | | |
| Composition of Net Assets: | | | | | | | | | | | | |
| Paid in capital | | $ | 11,979,416 | | | $ | 141,556,746 | | | $ | 337,137,066 | |
| Accumulated earnings (losses) | | | 1,375,322 | | | | (14,184,533 | ) | | | (4,072,819 | ) |
| NET ASSETS | | $ | 13,354,738 | | | $ | 127,372,213 | | | $ | 333,064,247 | |
| | | | | | | | | | | | | |
See accompanying notes to financial statements.
| A N N U A L R E P O R T | June 30, 2023 |
| Eventide Funds | |
| STATEMENTS OF ASSETS AND LIABILITIES (Continued) | June 30, 2023 |
| | | Eventide | | | Eventide | | | Eventide | |
| | | Large Cap | | | Limited-Term | | | Multi-Asset | |
| | | Focus Fund | | | Bond Fund | | | Income Fund | |
| Net Asset Value Per Share: | | | | | | | | | | | | |
| Class N Shares: | | | | | | | | | | | | |
| Net Assets | | $ | 330,410 | | | $ | 17,697,639 | | | $ | 30,618,412 | |
| Shares of beneficial interest outstanding 1 | | | 28,893 | | | | 1,827,798 | | | | 2,461,365 | |
| Net asset value (Net Assets ÷ Shares Outstanding), offering price, and redemption price per share | | $ | 11.44 | | | $ | 9.68 | | | $ | 12.44 | |
| | | | | | | | | | | | | |
| Class A Shares: | | | | | | | | | | | | |
| Net Assets | | $ | 189,671 | | | $ | 19,390,480 | | | $ | 25,576,823 | |
| Shares of beneficial interest outstanding 1 | | | 16,602 | | | | 1,997,997 | | | | 2,051,983 | |
| Net asset value (Net Assets ÷ Shares Outstanding) and redemption price per share | | $ | 11.42 | | | $ | 9.70 | | | $ | 12.46 | |
| | | | | | | | | | | | | |
| Maximum offering price per share (net asset value plus maximum sales charge of 5.75%) | | $ | 12.12 | | | $ | 10.29 | | | $ | 13.22 | |
| | | | | | | | | | | | | |
| Class C Shares: | | | | | | | | | | | | |
| Net Assets | | $ | 26,554 | | | $ | 1,618,207 | | | $ | 16,180,597 | |
| Shares of beneficial interest outstanding 1 | | | 2,338 | | | | 167,840 | | | | 1,307,420 | |
| Net asset value (Net Assets ÷ Shares Outstanding), offering price, and redemption price per share | | $ | 11.36 | | | $ | 9.64 | | | $ | 12.38 | |
| | | | | | | | | | | | | |
| Class I Shares: | | | | | | | | | | | | |
| Net Assets | | $ | 12,808,103 | | | $ | 88,665,887 | | | $ | 260,688,415 | |
| Shares of beneficial interest outstanding 1 | | | 1,119,374 | | | | 8,928,498 | | | | 20,953,109 | |
| Net asset value (Net Assets ÷ Shares Outstanding), offering price, and redemption price per share | | $ | 11.44 | | | $ | 9.93 | | | $ | 12.44 | |
| | | | | | | | | | | | | |
| 1. | Unlimited number of shares of beneficial interest authorized, no par value. |
See accompanying notes to financial statements.
| A N N U A L R E P O R T | June 30, 2023 |
| Eventide Funds | |
| STATEMENTS OF OPERATIONS | For the Year Ended June 30, 2023 |
| | | Eventide | | | Eventide | | | Eventide | | | | | | Eventide | |
| | | Core Bond | | | Dividend | | | Exponential | | | Eventide | | | Healthcare & | |
| | | Fund | | | Opportunities Fund | | | Technologies Fund | | | Gilead Fund | | | Life Sciences Fund | |
| INVESTMENT INCOME | | | | | | | | | | | | | | | | | | | | |
| Dividend income | | $ | — | | | $ | 8,647,652 | | | $ | 210,393 | | | $ | 20,617,043 | | | $ | 1,007,074 | |
| Interest | | | 1,969,421 | | | | 1,012,255 | | | | 191,667 | | | | 7,706,707 | | | | 4,961,225 | |
| Less: Foreign dividend withholding taxes | | | — | | | | (1,250 | ) | | | (1,058 | ) | | | (619,048 | ) | | | (107,945 | ) |
| TOTAL INVESTMENT INCOME | | | 1,969,421 | | | | 9,658,657 | | | | 401,002 | | | | 27,704,702 | | | | 5,860,354 | |
| | | | | | | | | | | | | | | | | | | | | |
| EXPENSES | | | | | | | | | | | | | | | | | | | | |
| Management fees | | | 239,959 | | | | 3,688,377 | | | | 1,085,748 | | | | 34,478,771 | | | | 17,709,516 | |
| Distribution (12b-1) fees: | | | | | | | | | | | | | | | | | | | | |
| Class N | | | 79,988 | | | | 178,805 | | | | 27,676 | | | | 1,046,068 | | | | 253,337 | |
| Class A | | | 675 | | | | 84,579 | | | | 19,009 | | | | 793,586 | | | | 347,776 | |
| Class C | | | 2,346 | | | | 125,450 | | | | 24,307 | | | | 2,293,489 | | | | 749,565 | |
| Shareholder servicing fees | | | 90,522 | | | | 749,418 | | | | 139,494 | | | | 4,231,121 | | | | 1,820,693 | |
| Registration fees | | | 62,985 | | | | 108,975 | | | | 69,715 | | | | 155,400 | | | | 127,750 | |
| Administrative fees | | | 34,656 | | | | 153,774 | | | | 37,555 | | | | 888,850 | | | | 404,871 | |
| Printing and postage expenses | | | 23,413 | | | | 228,609 | | | | 24,420 | | | | 436,963 | | | | 162,218 | |
| Legal fees | | | 19,608 | | | | 14,544 | | | | 14,622 | | | | 14,962 | | | | 15,772 | |
| Transfer agent fees | | | 15,340 | | | | 59,777 | | | | 29,310 | | | | 324,989 | | | | 183,290 | |
| Trustees fees and expenses | | | 15,193 | | | | 15,193 | | | | 15,193 | | | | 15,193 | | | | 15,193 | |
| Audit fees | | | 14,750 | | | | 13,000 | | | | 12,750 | | | | 32,000 | | | | 21,999 | |
| Management services fees | | | 14,211 | | | | 107,060 | | | | 20,891 | | | | 752,676 | | | | 340,987 | |
| Compliance officer fees | | | 10,575 | | | | 19,292 | | | | 9,247 | | | | 95,111 | | | | 46,067 | |
| Custodian fees | | | 4,812 | | | | 27,092 | | | | 12,824 | | | | 166,462 | | | | 65,433 | |
| Insurance expense | | | 3,650 | | | | 12,775 | | | | 2,555 | | | | 143,900 | | | | 45,925 | |
| Line of credit fees | | | 489 | | | | 489 | | | | 489 | | | | 489 | | | | 489 | |
| Line of credit interest | | | 70 | | | | — | | | | — | | | | — | | | | — | |
| Other expenses | | | 3,817 | | | | 19,757 | | | | 7,713 | | | | 36,676 | | | | 18,032 | |
| TOTAL EXPENSES | | | 637,059 | | | | 5,606,966 | | | | 1,553,518 | | | | 45,906,706 | | | | 22,328,913 | |
| | | | | | | | | | | | | | | | | | | | | |
| Less: Fees waived/reimbursed by the Manager | | | (164,775 | ) | | | (391,061 | ) | | | (69,721 | ) | | | — | | | | — | |
| NET EXPENSES | | | 472,284 | | | | 5,215,905 | | | | 1,483,797 | | | | 45,906,706 | | | | 22,328,913 | |
| | | | | | | | | | | | | | | | | | | | | |
| NET INVESTMENT INCOME (LOSS) | | | 1,497,137 | | | | 4,442,752 | | | | (1,082,795 | ) | | | (18,202,004 | ) | | | (16,468,559 | ) |
| REALIZED AND UNREALIZED GAIN (LOSS) FROM INVESTMENTS | | | | | | | | | | | | | | | | | | | | |
| Net realized gain (loss) from: | | | | | | | | | | | | | | | | | | | | |
| Unaffiliated investments | | | (3,797,575 | ) | | | (44,373,084 | ) | | | (25,590,050 | ) | | | (52,524,751 | ) | | | (17,230,836 | ) |
| Affiliated investments (See Note 5) | | | — | | | | — | | | | — | | | | 1,684,920 | | | | 104,903,011 | |
| Foreign currency transactions | | | — | | | | — | | | | (1,492 | ) | | | 7,688 | | | | — | |
| Net realized gain (loss) | | | (3,797,575 | ) | | | (44,373,084 | ) | | | (25,591,542 | ) | | | (50,832,143 | ) | | | 87,672,175 | |
| Net change in unrealized appreciation on: | | | | | | | | | | | | | | | | | | | | |
| Unaffiliated investments | | | 1,383,710 | | | | 90,497,053 | | | | 35,911,605 | | | | 559,686,692 | | | | 207,421,753 | |
| Affiliated investments (See Note 5) | | | — | | | | — | | | | — | | | | 15,949,383 | | | | 222,471,499 | |
| Net change in unrealized appreciation | | | 1,383,710 | | | | 90,497,053 | | | | 35,911,605 | | | | 575,636,075 | | | | 429,893,252 | |
| | | | | | | | | | | | | | | | | | | | | |
| NET REALIZED AND UNREALIZED GAIN (LOSS) FROM INVESTMENTS | | | (2,413,865 | ) | | | 46,123,969 | | | | 10,320,063 | | | | 524,803,932 | | | | 517,565,427 | |
| | | | | | | | | | | | | | | | | | | | | |
| NET INCREASE (DECREASE) IN NET ASSETS RESULTING FROM OPERATIONS | | $ | (916,728 | ) | | $ | 50,566,721 | | | $ | 9,237,268 | | | $ | 506,601,928 | | | $ | 501,096,868 | |
| | | | | | | | | | | | | | | | | | | | | |
See accompanying notes to financial statements.
| A N N U A L R E P O R T | June 30, 2023 |
| Eventide Funds | |
| STATEMENTS OF OPERATIONS (Continued) | For the Year Ended June 30, 2023 |
| | | Eventide | | | Eventide | | | Eventide | |
| | | Large Cap | | | Limited-Term | | | Multi-Asset | |
| | | Focus Fund1 | | | Bond Fund | | | Income Fund | |
| INVESTMENT INCOME | | | | | | | | | | | | |
| Dividend income | | $ | 44,542 | | | $ | — | | | $ | 3,393,388 | |
| Interest | | | 22,190 | | | | 3,534,217 | | | | 4,979,525 | |
| Less: Foreign dividend withholding taxes | | | (1,389 | ) | | | — | | | | (320 | ) |
| TOTAL INVESTMENT INCOME | | | 65,343 | | | | 3,534,217 | | | | 8,372,593 | |
| | | | | | | | | | | | | |
| EXPENSES | | | | | | | | | | | | |
| Management fees | | | 46,365 | | | | 514,006 | | | | 2,107,840 | |
| Distribution (12b-1) fees: | | | | | | | | | | | | |
| Class N | | | 252 | | | | 32,258 | | | | 83,328 | |
| Class A | | | 146 | | | | 47,717 | | | | 65,694 | |
| Class C | | | 86 | | | | 17,551 | | | | 171,237 | |
| Legal fees | | | 14,339 | | | | 13,977 | | | | 13,987 | |
| Audit fees | | | 13,500 | | | | 17,002 | | | | 17,002 | |
| Transfer agent fees | | | 13,204 | | | | 24,915 | | | | 39,506 | |
| Registration fees | | | 12,647 | | | | 65,700 | | | | 91,600 | |
| Administrative fees | | | 11,917 | | | | 71,712 | | | | 124,443 | |
| Trustees fees and expenses | | | 11,354 | | | | 15,193 | | | | 15,193 | |
| Custodian fees | | | 10,667 | | | | 8,134 | | | | 17,486 | |
| Printing and postage expenses | | | 10,135 | | | | 80,702 | | | | 153,078 | |
| Shareholder servicing fees | | | 9,861 | | | | 237,174 | | | | 482,427 | |
| Compliance officer fees | | | 6,968 | | | | 12,993 | | | | 17,894 | |
| Management services fees | | | 1,343 | | | | 33,223 | | | | 74,475 | |
| Line of credit fees | | | 489 | | | | 489 | | | | 489 | |
| Insurance expense | | | 297 | | | | 4,425 | | | | 11,020 | |
| Line of credit interest | | | — | | | | 3,983 | | | | 1,286 | |
| Other expenses | | | 5,181 | | | | 5,056 | | | | 8,672 | |
| TOTAL EXPENSES | | | 168,751 | | | | 1,206,210 | | | | 3,496,657 | |
| | | | | | | | | | | | | |
| Less: Fees waived/reimbursed by the Manager | | | (107,732 | ) | | | (243,710 | ) | | | (276,044 | ) |
| NET EXPENSES | | | 61,019 | | | | 962,500 | | | | 3,220,613 | |
| | | | | | | | | | | | | |
| NET INVESTMENT INCOME | | | 4,324 | | | | 2,571,717 | | | | 5,151,980 | |
| | | | | | | | | | | | | |
| REALIZED AND UNREALIZED GAIN (LOSS) FROM INVESTMENTS | | | | | | | | | | | | |
| Net realized loss from: | | | | | | | | | | | | |
| Investments | | | (308,666 | ) | | | (5,299,246 | ) | | | (14,479,724 | ) |
| Foreign currency transactions | | | (13 | ) | | | — | | | | — | |
| Net realized loss | | | (308,679 | ) | | | (5,299,246 | ) | | | (14,479,724 | ) |
| Net change in unrealized appreciation on: | | | | | | | | | | | | |
| Investments | | | 1,683,784 | | | | 4,451,387 | | | | 26,607,153 | |
| Net change in unrealized appreciation on: | | | 1,683,784 | | | | 4,451,387 | | | | 26,607,153 | |
| | | | | | | | | | | | | |
| NET REALIZED AND UNREALIZED GAIN (LOSS) FROM INVESTMENTS | | | 1,375,105 | | | | (847,859 | ) | | | 12,127,429 | |
| | | | | | | | | | | | | |
| NET INCREASE IN NET ASSETS RESULTING FROM OPERATIONS | | $ | 1,379,429 | | | $ | 1,723,858 | | | $ | 17,279,409 | |
| | | | | | | | | | | | | |
| 1. | Eventide Large Cap Focus Fund commenced on June 30, 2022. |
See accompanying notes to financial statements.
| A N N U A L R E P O R T | June 30, 2023 |
| Eventide Core Bond Fund |
| STATEMENTS OF CHANGES IN NET ASSETS |
| | | For the | | | For the | |
| | | Year Ended | | | Year Ended | |
| | | June 30, 2023 | | | June 30, 2022 | |
| FROM OPERATIONS | | | | | | | | |
| Net investment income | | $ | 1,497,137 | | | $ | 1,073,033 | |
| Net realized loss from investments | | | (3,797,575 | ) | | | (6,461,166 | ) |
| Net change in unrealized appreciation (depreciation) on investments | | | 1,383,710 | | | | (8,302,256 | ) |
| Net decrease in net assets resulting from operations | | | (916,728 | ) | | | (13,690,389 | ) |
| | | | | | | | | |
| DISTRIBUTIONS TO SHAREHOLDERS | | | | | | | | |
| From Accumulated Earnings | | | | | | | | |
| Class N | | | (791,346 | ) | | | (729,933 | ) |
| Class A | | | (6,663 | ) | | | (3,145 | ) |
| Class C | | | (3,378 | ) | | | (1,363 | ) |
| Class I | | | (735,595 | ) | | | (574,609 | ) |
| Return of Capital | | | | | | | | |
| Class N | | | — | | | | (109,235 | ) |
| Class A | | | — | | | | (366 | ) |
| Class C | | | — | | | | (219 | ) |
| Class I | | | — | | | | (42,656 | ) |
| Total distributions to shareholders | | | (1,536,982 | ) | | | (1,461,526 | ) |
| | | | | | | | | |
| FROM SHARES OF BENEFICIAL INTEREST | | | | | | | | |
| Proceeds from shares sold: | | | | | | | | |
| Class N | | | 19,475,162 | | | | 19,899,042 | |
| Class A | | | 246,372 | | | | 135,918 | |
| Class C | | | 34,274 | | | | 211,387 | |
| Class I | | | 34,388,084 | | | | 23,817,414 | |
| Net asset value of shares issued in reinvestment of distributions: | | | | | | | | |
| Class N | | | 790,735 | | | | 838,996 | |
| Class A | | | 6,663 | | | | 3,469 | |
| Class C | | | 3,364 | | | | 1,583 | |
| Class I | | | 615,819 | | | | 590,448 | |
| Payments for shares repurchased: | | | | | | | | |
| Class N | | | (39,413,830 | ) | | | (10,625,350 | ) |
| Class A | | | (30,999 | ) | | | (294,028 | ) |
| Class C | | | (33,678 | ) | | | (131,770 | ) |
| Class I | | | (8,715,146 | ) | | | (68,398,673 | ) |
| Net increase (decrease) in net assets from shares of beneficial interest | | | 7,366,820 | | | | (33,951,564 | ) |
| | | | | | | | | |
| TOTAL INCREASE (DECREASE) IN NET ASSETS | | | 4,913,110 | | | | (49,103,479 | ) |
| | | | | | | | | |
| NET ASSETS | | | | | | | | |
| Beginning of Year | | | 72,464,989 | | | | 121,568,468 | |
| End of Year | | $ | 77,378,099 | | | $ | 72,464,989 | |
| | | | | | | | | |
See accompanying notes to financial statements.
| A N N U A L R E P O R T | June 30, 2023 |
| Eventide Core Bond Fund |
| STATEMENTS OF CHANGES IN NET ASSETS (Continued) |
| | | For the | | | For the | |
| | | Year Ended | | | Year Ended | |
| | | June 30, 2023 | | | June 30, 2022 | |
| SHARE ACTIVITY | | | | | | | | |
| Class N: | | | | | | | | |
| Shares Sold | | | 2,362,456 | | | | 2,119,735 | |
| Shares Reinvested | | | 97,444 | | | �� | 94,241 | |
| Shares Repurchased | | | (4,782,659 | ) | | | (1,156,503 | ) |
| Net increase (decrease) in shares of beneficial interest outstanding | | | (2,322,759 | ) | | | 1,057,473 | |
| | | | | | | | | |
| Class A: | | | | | | | | |
| Shares Sold | | | 29,981 | | | | 14,231 | |
| Shares Reinvested | | | 816 | | | | 382 | |
| Shares Repurchased | | | (3,796 | ) | | | (30,806 | ) |
| Net increase (decrease) in shares of beneficial interest outstanding | | | 27,001 | | | | (16,193 | ) |
| | | | | | | | | |
| Class C: | | | | | | | | |
| Shares Sold | | | 4,110 | | | | 23,636 | |
| Shares Reinvested | | | 416 | | | | 181 | |
| Shares Repurchased | | | (4,147 | ) | | | (13,937 | ) |
| Net increase in shares of beneficial interest outstanding | | | 379 | | | | 9,880 | |
| | | | | | | | | |
| Class I: | | | | | | | | |
| Shares Sold | | | 4,159,816 | | | | 2,561,464 | |
| Shares Reinvested | | | 75,784 | | | | 63,677 | |
| Shares Repurchased | | | (1,062,677 | ) | | | (7,637,167 | ) |
| Net increase (decrease) in shares of beneficial interest outstanding | | | 3,172,923 | | | | (5,012,026 | ) |
| | | | | | | | | |
| | | | | | | | | |
See accompanying notes to financial statements.
| A N N U A L R E P O R T | June 30, 2023 |
| Eventide Dividend Opportunities Fund |
| STATEMENTS OF CHANGES IN NET ASSETS |
| | | For the | | | For the | |
| | | Year Ended | | | Year Ended | |
| | | June 30, 2023 | | | June 30, 2022 | |
| FROM OPERATIONS | | | | | | | | |
| Net investment income | | $ | 4,442,752 | | | $ | 2,168,413 | |
| Net realized gain (loss) from investments | | | (44,373,084 | ) | | | 13,552,049 | |
| Net change in unrealized appreciation (depreciation) on investments | | | 90,497,053 | | | | (89,452,647 | ) |
| Net increase (decrease) in net assets resulting from operations | | | 50,566,721 | | | | (73,732,185 | ) |
| | | | | | | | | |
| DISTRIBUTIONS TO SHAREHOLDERS | | | | | | | | |
| From Accumulated Earnings | | | | | | | | |
| Class N | | | (1,203,965 | ) | | | (2,519,406 | ) |
| Class A | | | (378,484 | ) | | | (839,193 | ) |
| Class C | | | (76,849 | ) | | | (227,687 | ) |
| Class I | | | (5,200,706 | ) | | | (10,661,211 | ) |
| Return of Capital | | | | | | | | |
| Class N | | | (92,962 | ) | | | — | |
| Class A | | | (102,479 | ) | | | — | |
| Class C | | | (9,900 | ) | | | — | |
| Class I | | | (908,635 | ) | | | — | |
| Total distributions to shareholders | | | (7,973,980 | ) | | | (14,247,497 | ) |
| | | | | | | | | |
| FROM SHARES OF BENEFICIAL INTEREST | | | | | | | | |
| Proceeds from shares sold: | | | | | | | | |
| Class N | | | 42,168,215 | | | | 56,461,865 | |
| Class A | | | 13,780,142 | | | | 27,762,830 | |
| Class C | | | 6,546,046 | | | | 9,864,580 | |
| Class I | | | 232,281,533 | | | | 344,005,015 | |
| Net asset value of shares issued in reinvestment of distributions: | | | | | | | | |
| Class N | | | 1,267,578 | | | | 2,359,627 | |
| Class A | | | 463,082 | | | | 792,135 | |
| Class C | | | 84,188 | | | | 221,407 | |
| Class I | | | 5,504,373 | | | | 10,078,130 | |
| Payments for shares repurchased: | | | | | | | | |
| Class N | | | (33,157,570 | ) | | | (40,190,024 | ) |
| Class A | | | (9,749,781 | ) | | | (10,920,219 | ) |
| Class C | | | (2,812,230 | ) | | | (2,404,711 | ) |
| Class I | | | (145,117,850 | ) | | | (220,287,662 | ) |
| Net increase in net assets from shares of beneficial interest | | | 111,257,726 | | | | 177,742,973 | |
| | | | | | | | | |
| TOTAL INCREASE IN NET ASSETS | | | 153,850,467 | | | | 89,763,291 | |
| | | | | | | | | |
| NET ASSETS | | | | | | | | |
| Beginning of Year | | | 419,958,568 | | | | 330,195,277 | |
| End of Year | | $ | 573,809,035 | | | $ | 419,958,568 | |
| | | | | | | | | |
See accompanying notes to financial statements.
| A N N U A L R E P O R T | June 30, 2023 |
| Eventide Dividend Opportunities Fund |
| STATEMENTS OF CHANGES IN NET ASSETS (Continued) |
| | | For the | | | For the | |
| | | Year Ended | | | Year Ended | |
| | | June 30, 2023 | | | June 30, 2022 | |
| SHARE ACTIVITY | | | | | | | | |
| Class N: | | | | | | | | |
| Shares Sold | | | 3,006,122 | | | | 3,486,424 | |
| Shares Reinvested | | | 92,382 | | | | 142,270 | |
| Shares Repurchased | | | (2,406,922 | ) | | | (2,496,966 | ) |
| Net increase in shares of beneficial interest outstanding | | | 691,582 | | | | 1,131,728 | |
| | | | | | | | | |
| Class A: | | | | | | | | |
| Shares Sold | | | 985,242 | | | | 1,707,341 | |
| Shares Reinvested | | | 33,666 | | | | 47,967 | |
| Shares Repurchased | | | (691,004 | ) | | | (705,272 | ) |
| Net increase in shares of beneficial interest outstanding | | | 327,904 | | | | 1,050,036 | |
| | | | | | | | | |
| Class C: | | | | | | | | |
| Shares Sold | | | 475,330 | | | | 604,239 | |
| Shares Reinvested | | | 6,152 | | | | 13,203 | |
| Shares Repurchased | | | (205,600 | ) | | | (155,395 | ) |
| Net increase in shares of beneficial interest outstanding | | | 275,882 | | | | 462,047 | |
| | | | | | | | | |
| Class I: | | | | | | | | |
| Shares Sold | | | 16,642,155 | | | | 21,354,456 | |
| Shares Reinvested | | | 400,250 | | | | 609,287 | |
| Shares Repurchased | | | (10,457,863 | ) | | | (14,155,468 | ) |
| Net increase in shares of beneficial interest outstanding | | | 6,584,542 | | | | 7,808,275 | |
| | | | | | | | | |
| | | | | | | | | |
See accompanying notes to financial statements.
| A N N U A L R E P O R T | June 30, 2023 |
| Eventide Exponential Technologies Fund |
| STATEMENTS OF CHANGES IN NET ASSETS |
| | | For the | | | For the | |
| | | Year Ended | | | Year Ended | |
| | | June 30, 2023 | | | June 30, 2022 | |
| FROM OPERATIONS | | | | | | | | |
| Net investment loss | | $ | (1,082,795 | ) | | $ | (1,843,408 | ) |
| Net realized loss from investments, securities sold short and foreign currency transactions | | | (25,591,542 | ) | | | (29,183,178 | ) |
| Net change in unrealized appreciation (depreciation) on investments | | | 35,911,605 | | | | (38,234,099 | ) |
| Net increase (decrease) in net assets resulting from operations | | | 9,237,268 | | | | (69,260,685 | ) |
| | | | | | | | | |
| DISTRIBUTIONS TO SHAREHOLDERS | | | | | | | | |
| Class N | | | — | | | | (255,449 | ) |
| Class A | | | — | | | | (126,950 | ) |
| Class C | | | — | | | | (41,959 | ) |
| Class I | | | — | | | | (1,482,367 | ) |
| Total distributions to shareholders | | | — | | | | (1,906,725 | ) |
| | | | | | | | | |
| FROM SHARES OF BENEFICIAL INTEREST | | | | | | | | |
| Proceeds from shares sold: | | | | | | | | |
| Class N | | | 13,244,258 | | | | 12,127,019 | |
| Class A | | | 1,781,643 | | | | 6,263,795 | |
| Class C | | | 628,624 | | | | 2,958,436 | |
| Class I | | | 47,180,850 | | | | 71,123,517 | |
| Net asset value of shares issued in reinvestment of distributions: | | | | | | | | |
| Class N | | | — | | | | 226,434 | |
| Class A | | | — | | | | 119,077 | |
| Class C | | | — | | | | 40,806 | |
| Class I | | | — | | | | 1,436,229 | |
| Redemption fee proceeds: | | | | | | | | |
| Class N | | | 17,663 | | | | 7,981 | |
| Class A | | | 9,414 | | | | 4,019 | |
| Class C | | | 3,021 | | | | 1,370 | |
| Class I | | | 92,427 | | | | 55,043 | |
| Payments for shares repurchased: | | | | | | | | |
| Class N | | | (5,852,092 | ) | | | (6,089,688 | ) |
| Class A | | | (1,638,384 | ) | | | (1,682,918 | ) |
| Class C | | | (627,686 | ) | | | (953,062 | ) |
| Class I | | | (43,109,040 | ) | | | (41,904,207 | ) |
| Net increase in net assets from shares of beneficial interest | | | 11,730,698 | | | | 43,733,851 | |
| | | | | | | | | |
| TOTAL INCREASE (DECREASE) IN NET ASSETS | | | 20,967,966 | | | | (27,433,559 | ) |
| | | | | | | | | |
| NET ASSETS | | | | | | | | |
| Beginning of Year | | | 94,844,734 | | | | 122,278,293 | |
| End of Year | | $ | 115,812,700 | | | $ | 94,844,734 | |
| | | | | | | | | |
See accompanying notes to financial statements.
| A N N U A L R E P O R T | June 30, 2023 |
| Eventide Exponential Technologies Fund |
| STATEMENTS OF CHANGES IN NET ASSETS (Continued) |
| | |
| | | For the | | | For the | |
| | | Year Ended | | | Year Ended | |
| | | June 30, 2023 | | | June 30, 2022 | |
| SHARE ACTIVITY | | | | | | | | |
| Class N: | | | | | | | | |
| Shares Sold | | | 1,258,489 | | | | 721,035 | |
| Shares Reinvested | | | — | | | | 13,359 | |
| Shares Repurchased | | | (551,922 | ) | | | (416,618 | ) |
| Net increase in shares of beneficial interest outstanding | | | 706,567 | | | | 317,776 | |
| | | | | | | | | |
| Class A: | | | | | | | | |
| Shares Sold | | | 162,981 | | | | 375,322 | |
| Shares Reinvested | | | — | | | | 7,025 | |
| Shares Repurchased | | | (149,936 | ) | | | (109,002 | ) |
| Net increase in shares of beneficial interest outstanding | | | 13,045 | | | | 273,345 | |
| | | | | | | | | |
| Class C: | | | | | | | | |
| Shares Sold | | | 58,336 | | | | 172,387 | |
| Shares Reinvested | | | — | | | | 2,433 | |
| Shares Repurchased | | | (58,741 | ) | | | (58,818 | ) |
| Net increase (decrease) in shares of beneficial interest outstanding | | | (405 | ) | | | 116,002 | |
| | | | | | | | | |
| Class I: | | | | | | | | |
| Shares Sold | | | 4,159,896 | | | | 4,328,347 | |
| Shares Reinvested | | | — | | | | 84,434 | |
| Shares Repurchased | | | (3,923,676 | ) | | | (2,862,825 | ) |
| Net increase in shares of beneficial interest outstanding | | | 236,220 | | | | 1,549,956 | |
| | | | | | | | | |
| | | | | | | | | |
See accompanying notes to financial statements.
| A N N U A L R E P O R T | June 30, 2023 |
| Eventide Gilead Fund |
| STATEMENTS OF CHANGES IN NET ASSETS |
| | | For the | | | For the | |
| | | Year Ended | | | Year Ended | |
| | | June 30, 2023 | | | June 30, 2022 | |
| FROM OPERATIONS | | | | | | | | |
| Net investment loss | | $ | (18,202,004 | ) | | $ | (37,833,295 | ) |
| Net realized gain (loss) from investments and foreign currency transactions | | | (50,832,143 | ) | | | 324,733,387 | |
| Net change in unrealized appreciation (depreciation) on investments | | | 575,636,075 | | | | (2,034,275,508 | ) |
| Net increase (decrease) in net assets resulting from operations | | | 506,601,928 | | | | (1,747,375,416 | ) |
| | | | | | | | | |
| DISTRIBUTIONS TO SHAREHOLDERS | | | | | | | | |
| Class N | | | (26,502,428 | ) | | | (50,029,637 | ) |
| Class A | | | (15,537,719 | ) | | | (28,422,072 | ) |
| Class C | | | (13,038,729 | ) | | | (26,952,726 | ) |
| Class I | | | (117,168,110 | ) | | | (222,170,791 | ) |
| Total distributions to shareholders | | | (172,246,986 | ) | | | (327,575,226 | ) |
| | | | | | | | | |
| FROM SHARES OF BENEFICIAL INTEREST | | | | | | | | |
| Proceeds from shares sold: | | | | | | | | |
| Class N | | | 88,745,999 | | | | 166,322,263 | |
| Class A | | | 55,727,869 | | | | 162,435,956 | |
| Class C | | | 14,904,069 | | | | 107,364,226 | |
| Class I | | | 640,408,718 | | | | 1,036,497,941 | |
| Net asset value of shares issued in reinvestment of distributions: | | | | | | | | |
| Class N | | | 25,204,656 | | | | 46,771,045 | |
| Class A | | | 14,252,437 | | | | 25,974,652 | |
| Class C | | | 12,562,355 | | | | 25,761,719 | |
| Class I | | | 103,966,493 | | | | 193,528,454 | |
| Payments for shares repurchased: | | | | | | | | |
| Class N | | | (163,362,221 | ) | | | (198,598,681 | ) |
| Class A | | | (50,748,542 | ) | | | (167,012,421 | ) |
| Class C | | | (61,602,217 | ) | | | (149,099,850 | ) |
| Class I | | | (730,773,548 | ) | | | (911,160,701 | ) |
| Net increase (decrease) in net assets from shares of beneficial interest | | | (50,713,932 | ) | | | 338,784,603 | |
| | | | | | | | | |
| TOTAL INCREASE (DECREASE) IN NET ASSETS | | | 283,641,010 | | | | (1,736,166,039 | ) |
| | | | | | | | | |
| NET ASSETS | | | | | | | | |
| Beginning of Year | | | 3,476,996,881 | | | | 5,213,162,920 | |
| End of Year | | $ | 3,760,637,891 | | | $ | 3,476,996,881 | |
| | | | | | | | | |
See accompanying notes to financial statements.
| A N N U A L R E P O R T | June 30, 2023 |
| Eventide Gilead Fund |
| STATEMENTS OF CHANGES IN NET ASSETS (Continued) |
| | | For the | | | For the | |
| | | Year Ended | | | Year Ended | |
| | | June 30, 2023 | | | June 30, 2022 | |
| SHARE ACTIVITY | | | | | | | | |
| Class N: | | | | | | | | |
| Shares Sold | | | 1,959,635 | | | | 2,800,311 | |
| Shares Reinvested | | | 594,029 | | | | 741,808 | |
| Shares Repurchased | | | (3,651,814 | ) | | | (3,366,988 | ) |
| Net increase (decrease) in shares of beneficial interest outstanding | | | (1,098,150 | ) | | | 175,131 | |
| | | | | | | | | |
| Class A: | | | | | | | | |
| Shares Sold | | | 1,244,030 | | | | 2,529,402 | |
| Shares Reinvested | | | 338,136 | | | | 414,401 | |
| Shares Repurchased | | | (1,135,497 | ) | | | (2,647,269 | ) |
| Net increase in shares of beneficial interest outstanding | | | 446,669 | | | | 296,534 | |
| | | | | | | | | |
| Class C: | | | | | | | | |
| Shares Sold | | | 372,502 | | | | 1,773,495 | |
| Shares Reinvested | | | 337,607 | | | | 458,834 | |
| Shares Repurchased | | | (1,566,252 | ) | | | (2,616,327 | ) |
| Net decrease in shares of beneficial interest outstanding | | | (856,143 | ) | | | (383,998 | ) |
| | | | | | | | | |
| Class I: | | | | | | | | |
| Shares Sold | | | 13,786,761 | | | | 16,796,336 | |
| Shares Reinvested | | | 2,376,377 | | | | 2,986,985 | |
| Shares Repurchased | | | (15,809,021 | ) | | | (15,837,222 | ) |
| Net increase in shares of beneficial interest outstanding | | | 354,117 | | | | 3,946,099 | |
| | | | | | | | | |
| | | | | | | | | |
See accompanying notes to financial statements.
| A N N U A L R E P O R T | June 30, 2023 |
| Eventide Healthcare & Life Sciences Fund |
| STATEMENTS OF CHANGES IN NET ASSETS |
| | | For the | | | For the | |
| | | Year Ended | | | Year Ended | |
| | | June 30, 2023 | | | June 30, 2022 | |
| FROM OPERATIONS | | | | | | | | |
| Net investment loss | | $ | (16,468,559 | ) | | $ | (24,994,050 | ) |
| Net realized gain (loss) from investments | | | 87,672,175 | | | | (42,052,079 | ) |
| Net change in unrealized appreciation (depreciation) on investments | | | 429,893,252 | | | | (677,637,461 | ) |
| Net increase (decrease) in net assets resulting from operations | | | 501,096,868 | | | | (744,683,590 | ) |
| | | | | | | | | |
| DISTRIBUTIONS TO SHAREHOLDERS | | | | | | | | |
| Class N | | | — | | | | (18,248,290 | ) |
| Class A | | | — | | | | (17,603,937 | ) |
| Class C | | | — | | | | (10,868,612 | ) |
| Class I | | | — | | | | (145,913,984 | ) |
| Total distributions to shareholders | | | — | | | | (192,634,823 | ) |
| | | | | | | | | |
| FROM SHARES OF BENEFICIAL INTEREST | | | | | | | | |
| Proceeds from shares sold: | | | | | | | | |
| Class N | | | 24,795,762 | | | | 57,285,702 | |
| Class A | | | 24,063,154 | | | | 57,861,212 | |
| Class C | | | 6,812,105 | | | | 34,729,716 | |
| Class I | | | 410,248,708 | | | | 793,174,870 | |
| Net asset value of shares issued in reinvestment of distributions: | | | | | | | | |
| Class N | | | — | | | | 17,652,005 | |
| Class A | | | — | | | | 14,878,863 | |
| Class C | | | — | | | | 10,395,415 | |
| Class I | | | — | | | | 105,640,209 | |
| Payments for shares repurchased: | | | | | | | | |
| Class N | | | (48,550,846 | ) | | | (99,392,035 | ) |
| Class A | | | (30,091,421 | ) | | | (65,373,637 | ) |
| Class C | | | (19,599,460 | ) | | | (47,488,416 | ) |
| Class I | | | (387,178,463 | ) | | | (733,072,589 | ) |
| Net increase (decrease) in net assets from shares of beneficial interest | | | (19,500,461 | ) | | | 146,291,315 | |
| | | | | | | | | |
| TOTAL INCREASE (DECREASE) IN NET ASSETS | | | 481,596,407 | | | | (791,027,098 | ) |
| | | | | | | | | |
| NET ASSETS | | | | | | | | |
| Beginning of Year | | | 1,321,566,049 | | | | 2,112,593,147 | |
| End of Year | | $ | 1,803,162,456 | | | $ | 1,321,566,049 | |
| | | | | | | | | |
See accompanying notes to financial statements.
| A N N U A L R E P O R T | June 30, 2023 |
| Eventide Healthcare & Life Sciences Fund |
| STATEMENTS OF CHANGES IN NET ASSETS (Continued) |
| | | For the | | | For the | |
| | | Year Ended | | | Year Ended | |
| | | June 30, 2023 | | | June 30, 2022 | |
| SHARE ACTIVITY | | | | | | | | |
| Class N: | | | | | | | | |
| Shares Sold | | | 761,278 | | | | 1,575,629 | |
| Shares Reinvested | | | — | | | | 464,771 | |
| Shares Repurchased | | | (1,502,705 | ) | | | (2,591,532 | ) |
| Net decrease in shares of beneficial interest outstanding | | | (741,427 | ) | | | (551,132 | ) |
| | | | | | | | | |
| Class A: | | | | | | | | |
| Shares Sold | | | 747,325 | | | | 1,538,348 | |
| Shares Reinvested | | | — | | | | 394,351 | |
| Shares Repurchased | | | (923,751 | ) | | | (1,756,110 | ) |
| Net increase (decrease) in shares of beneficial interest outstanding | | | (176,426 | ) | | | 176,589 | |
| | | | | | | | | |
| Class C: | | | | | | | | |
| Shares Sold | | | 232,446 | | | | 993,106 | |
| Shares Reinvested | | | — | | | | 296,588 | |
| Shares Repurchased | | | (661,200 | ) | | | (1,372,431 | ) |
| Net decrease in shares of beneficial interest outstanding | | | (428,754 | ) | | | (82,737 | ) |
| | | | | | | | | |
| Class I: | | | | | | | | |
| Shares Sold | | | 12,546,799 | | | | 22,293,426 | |
| Shares Reinvested | | | — | | | | 2,730,427 | |
| Shares Repurchased | | | (11,930,781 | ) | | | (20,587,267 | ) |
| Net increase in shares of beneficial interest outstanding | | | 616,018 | | | | 4,436,586 | |
| | | | | | | | | |
| | | | | | | | | |
See accompanying notes to financial statements.
| A N N U A L R E P O R T | June 30, 2023 |
| Eventide Large Cap Focus Fund |
| STATEMENT OF CHANGES IN NET ASSETS |
| | | For the | |
| | | Year Ended | |
| | | June 30, 2023 1 | |
| FROM OPERATIONS | | | | |
| Net investment income | | $ | 4,324 | |
| Net realized loss from investments and foreign currency transactions | | | (308,679 | ) |
| Net change in unrealized appreciation on investments | | | 1,683,784 | |
| Net increase in net assets resulting from operations | | | 1,379,429 | |
| | | | | |
| DISTRIBUTIONS TO SHAREHOLDERS | | | | |
| From Accumulated Earnings | | | | |
| Class I | | | (4,107 | ) |
| Return of Capital | | | | |
| Class N | | | (35 | ) |
| Class A | | | (36 | ) |
| Class I | | | (5,720 | ) |
| Total distributions to shareholders | | | (9,898 | ) |
| | | | | |
| FROM SHARES OF BENEFICIAL INTEREST | | | | |
| Proceeds from shares sold: | | | | |
| Class N | | | 524,748 | |
| Class A | | | 249,063 | |
| Class C | | | 24,480 | |
| Class I | | | 15,266,218 | |
| Net asset value of shares issued in reinvestment of distributions: | | | | |
| Class N | | | 27 | |
| Class A | | | 36 | |
| Class I | | | 9,440 | |
| Payments for shares repurchased: | | | | |
| Class N | | | (224,466 | ) |
| Class A | | | (79,745 | ) |
| Class I | | | (3,784,594 | ) |
| Net increase in net assets from shares of beneficial interest | | | 11,985,207 | |
| | | | | |
| TOTAL INCREASE IN NET ASSETS | | | 13,354,738 | |
| | | | | |
| NET ASSETS | | | | |
| Beginning of Year | | | — | |
| End of Year | | $ | 13,354,738 | |
| | | | | |
| 1. | Eventide Large Cap Focus Fund commenced on June 30, 2022. |
See accompanying notes to financial statements.
| A N N U A L R E P O R T | June 30, 2023 |
| Eventide Large Cap Focus Fund |
| STATEMENT OF CHANGES IN NET ASSETS (Continued) |
| | | For the | |
| | | Year Ended | |
| | | June 30, 2023 1 | |
| SHARE ACTIVITY | | | | |
| Class N: | | | | |
| Shares Sold | | | 50,682 | |
| Shares Reinvested | | | 3 | |
| Shares Repurchased | | | (21,792 | ) |
| Net increase in shares of beneficial interest outstanding | | | 28,893 | |
| | | | | |
| Class A: | | | | |
| Shares Sold | | | 24,367 | |
| Shares Reinvested | | | 3 | |
| Shares Repurchased | | | (7,768 | ) |
| Net increase in shares of beneficial interest outstanding | | | 16,602 | |
| | | | | |
| Class C: | | | | |
| Shares Sold | | | 2,338 | |
| Net increase in shares of beneficial interest outstanding | | | 2,338 | |
| | | | | |
| Class I: | | | | |
| Shares Sold | | | 1,487,132 | |
| Shares Reinvested | | | 923 | |
| Shares Repurchased | | | (368,681 | ) |
| Net increase in shares of beneficial interest outstanding | | | 1,119,374 | |
| | | | | |
| 1. | Eventide Large Cap Focus Fund commenced on June 30, 2022. |
See accompanying notes to financial statements.
| A N N U A L R E P O R T | June 30, 2023 |
| Eventide Limited-Term Bond Fund |
| STATEMENTS OF CHANGES IN NET ASSETS |
| | | For the | | | For the | |
| | | Year Ended | | | Year Ended | |
| | | June 30, 2023 | | | June 30, 2022 | |
| FROM OPERATIONS | | | | | | | | |
| Net investment income | | $ | 2,571,717 | | | $ | 1,123,079 | |
| Net realized loss from investments | | | (5,299,246 | ) | | | (1,842,031 | ) |
| Net change in unrealized appreciation (depreciation) on investments | | | 4,451,387 | | | | (11,453,973 | ) |
| Net increase (decrease) in net assets resulting from operations | | | 1,723,858 | | | | (12,172,925 | ) |
| | | | | | | | | |
| DISTRIBUTIONS TO SHAREHOLDERS | | | | | | | | |
| From Accumulated Earnings | | | | | | | | |
| Class N | | | (283,263 | ) | | | (45,786 | ) |
| Class A | | | (302,006 | ) | | | (167,972 | ) |
| Class C | | | (15,268 | ) | | | (2,773 | ) |
| Class I | | | (2,074,932 | ) | | | (1,134,005 | ) |
| Return of Capital | | | | | | | | |
| Class N | | | (4,462 | ) | | | (31,408 | ) |
| Class A | | | (5,259 | ) | | | (118,494 | ) |
| Class C | | | (487 | ) | | | (3,171 | ) |
| Class I | | | (32,214 | ) | | | (936,564 | ) |
| Total distributions to shareholders | | | (2,717,891 | ) | | | (2,440,173 | ) |
| | | | | | | | | |
| FROM SHARES OF BENEFICIAL INTEREST | | | | | | | | |
| Proceeds from shares sold: | | | | | | | | |
| Class N | | | 21,519,104 | | | | 6,269,296 | |
| Class A | | | 9,487,414 | | | | 14,052,234 | |
| Class C | | | 1,005,560 | | | | 1,052,949 | |
| Class I | | | 73,533,124 | | | | 113,802,147 | |
| Net asset value of shares issued in reinvestment of distributions: | | | | | | | | |
| Class N | | | 286,917 | | | | 76,046 | |
| Class A | | | 304,810 | | | | 283,529 | |
| Class C | | | 15,678 | | | | 5,863 | |
| Class I | | | 1,847,368 | | | | 1,812,738 | |
| Payments for shares repurchased: | | | | | | | | |
| Class N | | | (9,928,344 | ) | | | (7,137,893 | ) |
| Class A | | | (12,462,801 | ) | | | (19,743,210 | ) |
| Class C | | | (1,078,599 | ) | | | (801,836 | ) |
| Class I | | | (138,219,235 | ) | | | (95,139,344 | ) |
| Net increase (decrease) in net assets from shares of beneficial interest | | | (53,689,004 | ) | | | 14,532,519 | |
| | | | | | | | | |
| TOTAL DECREASE IN NET ASSETS | | | (54,683,037 | ) | | | (80,579 | ) |
| | | | | | | | | |
| NET ASSETS | | | | | | | | |
| Beginning of Year | | | 182,055,250 | | | | 182,135,829 | |
| End of Year | | $ | 127,372,213 | | | $ | 182,055,250 | |
| | | | | | | | | |
See accompanying notes to financial statements.
| A N N U A L R E P O R T | June 30, 2023 |
| Eventide Limited-Term Bond Fund |
| STATEMENTS OF CHANGES IN NET ASSETS (Continued) |
| | | For the | | | For the | |
| | | Year Ended | | | Year Ended | |
| | | June 30, 2023 | | | June 30, 2022 | |
| SHARE ACTIVITY | | | | | | | | |
| Class N: | | | | | | | | |
| Shares Sold | | | 2,245,504 | | | | 604,525 | |
| Shares Reinvested | | | 29,697 | | | | 7,479 | |
| Shares Repurchased | | | (1,025,667 | ) | | | (692,333 | ) |
| Net increase (decrease) in shares of beneficial interest outstanding | | | 1,249,534 | | | | (80,329 | ) |
| | | | | | | | | |
| Class A: | | | | | | | | |
| Shares Sold | | | 979,448 | | | | 1,367,565 | |
| Shares Reinvested | | | 31,459 | | | | 27,833 | |
| Shares Repurchased | | | (1,291,906 | ) | | | (1,931,999 | ) |
| Net decrease in shares of beneficial interest outstanding | | | (280,999 | ) | | | (536,601 | ) |
| | | | | | | | | |
| Class C: | | | | | | | | |
| Shares Sold | | | 105,013 | | | | 103,863 | |
| Shares Reinvested | | | 1,629 | | | | 585 | |
| Shares Repurchased | | | (112,068 | ) | | | (79,079 | ) |
| Net increase (decrease) in shares of beneficial interest outstanding | | | (5,426 | ) | | | 25,369 | |
| | | | | | | | | |
| Class I: | | | | | | | | |
| Shares Sold | | | 7,407,748 | | | | 10,908,339 | |
| Shares Reinvested | | | 186,484 | | | | 174,506 | |
| Shares Repurchased | | | (13,969,448 | ) | | | (9,184,513 | ) |
| Net increase (decrease) in shares of beneficial interest outstanding | | | (6,375,216 | ) | | | 1,898,332 | |
| | | | | | | | | |
| | | | | | | | | |
See accompanying notes to financial statements.
| A N N U A L R E P O R T | June 30, 2023 |
| Eventide Multi-Asset Income Fund |
| STATEMENTS OF CHANGES IN NET ASSETS |
| | | For the | | | For the | |
| | | Year Ended | | | Year Ended | |
| | | June 30, 2023 | | | June 30, 2022 | |
| FROM OPERATIONS | | | | | | | | |
| Net investment income | | $ | 5,151,980 | | | $ | 3,259,284 | |
| Net realized gain (loss) from investments and foreign currency transactions | | | (14,479,724 | ) | | | 12,373,588 | |
| Net change in unrealized appreciation (depreciation) on investments and foreign currency translations | | | 26,607,153 | | | | (56,988,661 | ) |
| Net increase (decrease) in net assets resulting from operations | | | 17,279,409 | | | | (41,355,789 | ) |
| | | | | | | | | |
| DISTRIBUTIONS TO SHAREHOLDERS | | | | | | | | |
| From Accumulated Earnings | | | | | | | | |
| Class N | | | (1,025,429 | ) | | | (2,564,067 | ) |
| Class A | | | (587,205 | ) | | | (1,586,555 | ) |
| Class C | | | (258,344 | ) | | | (1,068,493 | ) |
| Class I | | | (6,650,735 | ) | | | (19,496,798 | ) |
| Return of Capital | | | | | | | | |
| Class N | | | (123,456 | ) | | | — | |
| Class A | | | (77,622 | ) | | | — | |
| Class C | | | (50,944 | ) | | | — | |
| Class I | | | (787,757 | ) | | | — | |
| Total distributions to shareholders | | | (9,561,492 | ) | | | (24,715,913 | ) |
| | | | | | | | | |
| FROM SHARES OF BENEFICIAL INTEREST | | | | | | | | |
| Proceeds from shares sold: | | | | | | | | |
| Class N | | | 49,176,092 | | | | 21,618,583 | |
| Class A | | | 4,205,289 | | | | 14,677,481 | |
| Class C | | | 2,132,876 | | | | 7,579,621 | |
| Class I | | | 75,332,706 | | | | 132,340,650 | |
| Net asset value of shares issued in reinvestment of distributions: | | | | | | | | |
| Class N | | | 1,104,953 | | | | 2,432,723 | |
| Class A | | | 591,647 | | | | 1,478,839 | |
| Class C | | | 289,078 | | | | 981,945 | |
| Class I | | | 6,830,607 | | | | 18,045,148 | |
| Payments for shares repurchased: | | | | | | | | |
| Class N | | | (54,627,872 | ) | | | (22,348,326 | ) |
| Class A | | | (5,644,099 | ) | | | (8,906,607 | ) |
| Class C | | | (4,809,955 | ) | | | (5,981,374 | ) |
| Class I | | | (97,402,343 | ) | | | (108,791,176 | ) |
| Net increase (decrease) in net assets from shares of beneficial interest | | | (22,821,021 | ) | | | 53,127,507 | |
| | | | | | | | | |
| TOTAL DECREASE IN NET ASSETS | | | (15,103,104 | ) | | | (12,944,195 | ) |
| | | | | | | | | |
| NET ASSETS | | | | | | | | |
| Beginning of Year | | | 348,167,351 | | | | 361,111,546 | |
| End of Year | | $ | 333,064,247 | | | $ | 348,167,351 | |
| | | | | | | | | |
See accompanying notes to financial statements.
| A N N U A L R E P O R T | June 30, 2023 |
| Eventide Multi-Asset Income Fund |
| STATEMENTS OF CHANGES IN NET ASSETS (Continued) |
| | | For the | | | For the | |
| | | Year Ended | | | Year Ended | |
| | | June 30, 2023 | | | June 30, 2022 | |
| SHARE ACTIVITY | | | | | | | | |
| Class N: | | | | | | | | |
| Shares Sold | | | 4,036,342 | | | | 1,536,893 | |
| Shares Reinvested | | | 91,129 | | | | 171,600 | |
| Shares Repurchased | | | (4,542,574 | ) | | | (1,642,775 | ) |
| Net increase (decrease) in shares of beneficial interest outstanding | | | (415,103 | ) | | | 65,718 | |
| | | | | | | | | |
| Class A: | | | | | | | | |
| Shares Sold | | | 342,410 | | | | 1,037,604 | |
| Shares Reinvested | | | 48,591 | | | | 104,231 | |
| Shares Repurchased | | | (459,232 | ) | | | (648,352 | ) |
| Net increase (decrease) in shares of beneficial interest outstanding | | | (68,231 | ) | | | 493,483 | |
| | | | | | | | | |
| Class C: | | | | | | | | |
| Shares Sold | | | 175,582 | | | | 537,741 | |
| Shares Reinvested | | | 23,934 | | | | 69,409 | |
| Shares Repurchased | | | (397,078 | ) | | | (436,807 | ) |
| Net increase (decrease) in shares of beneficial interest outstanding | | | (197,562 | ) | | | 170,343 | |
| | | | | | | | | |
| Class I: | | | | | | | | |
| Shares Sold | | | 6,177,662 | | | | 9,464,878 | |
| Shares Reinvested | | | 561,831 | | | | 1,274,539 | |
| Shares Repurchased | | | (8,014,650 | ) | | | (8,146,723 | ) |
| Net increase (decrease) in shares of beneficial interest outstanding | | | (1,275,157 | ) | | | 2,592,694 | |
| | | | | | | | | |
| | | | | | | | | |
See accompanying notes to financial statements.
| A N N U A L R E P O R T | June 30, 2023 |
| Eventide Core Bond Fund |
| FINANCIAL HIGHLIGHTS |
| |
Per Share Data and Ratios for a Share of Beneficial Interest Outstanding Throughout Each of the Years or Period Presented
| | | Class N | |
| | | Year Ended | | | Year Ended | | | Period Ended | |
| | | June 30, 2023 | | | June 30, 2022 | | | June 30, 2021 * | |
| Net asset value, beginning of year/period | | $ | 8.41 | | | $ | 9.66 | | | $ | 10.00 | |
| Activity from investment operations: | | | | | | | | | | | | |
| Net investment income 1 | | | 0.17 | | | | 0.08 | | | | 0.05 | |
| Net realized and unrealized loss on investments | | | (0.25 | ) | | | (1.20 | ) | | | (0.29 | ) |
| Total from investment operations | | | (0.08 | ) | | | (1.12 | ) | | | (0.24 | ) |
| | | | | | | | | | | | | |
| Less distributions from: | | | | | | | | | | | | |
| Net investment income | | | (0.18 | ) | | | (0.11 | ) | | | (0.05 | ) |
| Return of capital | | | — | | | | (0.02 | ) | | | (0.05 | ) |
| Total distributions | | | (0.18 | ) | | | (0.13 | ) | | | (0.10 | ) |
| | | | | | | | | | | | | |
| Net asset value, end of year/period | | $ | 8.15 | | | $ | 8.41 | | | $ | 9.66 | |
| | | | | | | | | | | | | |
| Total return 2 | | | (0.89 | )% | | | (11.69 | )% | | | (2.39 | )% 6 |
| | | | | | | | | | | | | |
| Net assets, at end of year/period (000s) | | $ | 37,445 | | | $ | 58,166 | | | $ | 56,644 | |
| | | | | | | | | | | | | |
| Ratio of gross expenses to average net assets before expense reimbursement 3, 4 | | | 1.01 | % | | | 0.96 | % | | | 0.89 | % 7 |
| Ratio of net expenses to average net assets after expense reimbursement 4 | | | 0.78 | % | | | 0.78 | % | | | 0.78 | % 7 |
| Ratio of net investment income to average net assets 4, 5 | | | 2.09 | % | | | 0.88 | % | | | 0.53 | % 7 |
| Portfolio Turnover Rate | | | 57 | % | | | 56 | % | | | 52 | % 6 |
| | | | | | | | | | | | | |
| * | Eventide Core Bond Fund commenced on July 31, 2020. |
| 1. | Per share amounts calculated using the average shares method. |
| 2. | Total return in the above table is historical in nature and represents the rate that the investor would have earned or lost on an investment in the Fund assuming reinvestment of dividends and capital gain distributions, if any. Had the manager not waived a portion of the Fund’s expenses in certain periods, total returns would have been lower. |
| 3. | Represents the ratio of expenses to average net assets absent fee waivers and/or expense reimbursements by the manager. |
| 4. | The ratios of expenses to average net assets and net investment income to average net assets do not reflect the expenses of the underlying investment companies in which the Fund invests. |
| 5. | Recognition of net investment income is affected by the timing and declaration of dividends by the underlying investment companies in which the Fund invests. |
See accompanying notes to financial statements.
| A N N U A L R E P O R T | June 30, 2023 |
| Eventide Core Bond Fund |
| FINANCIAL HIGHLIGHTS |
| |
Per Share Data and Ratios for a Share of Beneficial Interest Outstanding Throughout Each of the Years or Period Presented
| | | Class A | |
| | | Year Ended | | | Year Ended | | | Period Ended | |
| | | June 30, 2023 | | | June 30, 2022 | | | June 30, 2021 * | |
| Net asset value, beginning of year/period | | $ | 8.44 | | | $ | 9.71 | | | $ | 10.00 | |
| Activity from investment operations: | | | | | | | | | | | | |
| Net investment income 1 | | | 0.18 | | | | 0.07 | | | | 0.05 | |
| Net realized and unrealized loss on investments | | | (0.26 | ) | | | (1.22 | ) | | | (0.27 | ) |
| Total from investment operations | | | (0.08 | ) | | | (1.15 | ) | | | (0.22 | ) |
| | | | | | | | | | | | | |
| Less distributions from: | | | | | | | | | | | | |
| Net investment income | | | (0.18 | ) | | | (0.10 | ) | | | (0.02 | ) |
| Return of capital | | | — | | | | (0.02 | ) | | | (0.05 | ) |
| Total distributions | | | (0.18 | ) | | | (0.12 | ) | | | (0.07 | ) |
| | | | | | | | | | | | | |
| Net asset value, end of year/period | | $ | 8.18 | | | $ | 8.44 | | | $ | 9.71 | |
| | | | | | | | | | | | | |
| Total return 2 | | | (0.90 | )% | | | (11.91 | )% | | | (2.28 | )% 6 |
| | | | | | | | | | | | | |
| Net assets, at end of year/period (000s) | | $ | 412 | | | $ | 197 | | | $ | 384 | |
| | | | | | | | | | | | | |
| Ratio of gross expenses to average net assets before expense reimbursement 3, 4 | | | 1.06 | % | | | 1.01 | % | | | 0.94 | % 7 |
| Ratio of net expenses to average net assets after expense reimbursement 4 | | | 0.83 | % | | | 0.83 | % | | | 0.83 | % 7 |
| Ratio of net investment income to average net assets 4, 5 | | | 2.19 | % | | | 0.78 | % | | | 0.51 | % 7 |
| Portfolio Turnover Rate | | | 57 | % | | | 56 | % | | | 52 | % 6 |
| | | | | | | | | | | | | |
| * | Eventide Core Bond Fund commenced on July 31, 2020. |
| 1. | Per share amounts calculated using the average shares method. |
| 2. | Total return in the above table is historical in nature and represents the rate that the investor would have earned or lost on an investment in the Fund assuming reinvestment of dividends and capital gain distributions, if any and does not reflect the impact of sales charges. Had the manager not waived a portion of the Fund’s expenses in certain periods, total returns would have been lower. |
| 3. | Represents the ratio of expenses to average net assets absent fee waivers and/or expense reimbursements by the manager. |
| 4. | The ratios of expenses to average net assets and net investment income to average net assets do not reflect the expenses of the underlying investment companies in which the Fund invests. |
| 5. | Recognition of net investment income is affected by the timing and declaration of dividends by the underlying investment companies in which the Fund invests. |
See accompanying notes to financial statements.
| A N N U A L R E P O R T | June 30, 2023 |
| Eventide Core Bond Fund |
| FINANCIAL HIGHLIGHTS |
| |
Per Share Data and Ratios for a Share of Beneficial Interest Outstanding Throughout Each of the Years or Period Presented
| | | Class C | |
| | | Year Ended | | | Year Ended | | | Period Ended | |
| | | June 30, 2023 | | | June 30, 2022 | | | June 30, 2021 * | |
| Net asset value, beginning of year/period | | $ | 8.37 | | | $ | 9.63 | | | $ | 10.00 | |
| Activity from investment operations: | | | | | | | | | | | | |
| Net investment income (loss) 1 | | | 0.11 | | | | 0.01 | | | | (0.02 | ) |
| Net realized and unrealized loss on investments | | | (0.25 | ) | | | (1.20 | ) | | | (0.28 | ) |
| Total from investment operations | | | (0.14 | ) | | | (1.19 | ) | | | (0.30 | ) |
| | | | | | | | | | | | | |
| Less distributions from: | | | | | | | | | | | | |
| Net investment income | | | (0.12 | ) | | | (0.06 | ) | | | (0.02 | ) |
| Return of capital | | | — | | | | (0.01 | ) | | | (0.05 | ) |
| Total distributions | | | (0.12 | ) | | | (0.07 | ) | | | (0.07 | ) |
| | | | | | | | | | | | | |
| Net asset value, end of year/period | | $ | 8.11 | | | $ | 8.37 | | | $ | 9.63 | |
| | | | | | | | | | | | | |
| Total return 2 | | | (1.67 | )% | | | (12.37 | )% | | | (3.02 | )% 6 |
| | | | | | | | | | | | | |
| Net assets, at end of year/period (000s) | | $ | 221 | | | $ | 224 | | | $ | 163 | |
| | | | | | | | | | | | | |
| Ratio of gross expenses to average net assets before expense reimbursement 3, 4 | | | 1.81 | % | | | 1.76 | % | | | 1.69 | % 7 |
| Ratio of net expenses to average net assets after expense reimbursement 4 | | | 1.58 | % | | | 1.58 | % | | | 1.58 | % 7 |
| Ratio of net investment income (loss) to average net assets 4, 5 | | | 1.35 | % | | | 0.09 | % | | | (0.20 | )% 7 |
| Portfolio Turnover Rate | | | 57 | % | | | 56 | % | | | 52 | % 6 |
| | | | | | | | | | | | | |
| * | Eventide Core Bond Fund commenced on July 31, 2020. |
| 1. | Per share amounts calculated using the average shares method. |
| 2. | Total return in the above table is historical in nature and represents the rate that the investor would have earned or lost on an investment in the Fund assuming reinvestment of dividends and capital gain distributions, if any. Had the manager not waived a portion of the Fund’s expenses in certain periods, total returns would have been lower. |
| 3. | Represents the ratio of expenses to average net assets absent fee waivers and/or expense reimbursements by the manager. |
| 4. | The ratios of expenses to average net assets and net investment income/(loss) to average net assets do not reflect the expenses of the underlying investment companies in which the Fund invests. |
| 5. | Recognition of net investment income (loss) is affected by the timing and declaration of dividends by the underlying investment companies in which the Fund invests. |
See accompanying notes to financial statements.
| A N N U A L R E P O R T | June 30, 2023 |
| Eventide Core Bond Fund |
| FINANCIAL HIGHLIGHTS |
| |
Per Share Data and Ratios for a Share of Beneficial Interest Outstanding Throughout Each of the Years or Period Presented
| | | Class I | |
| | | Year Ended | | | Year Ended | | | Period Ended | |
| | | June 30, 2023 | | | June 30, 2022 | | | June 30, 2021 * | |
| Net asset value, beginning of year/period | | $ | 8.41 | | | $ | 9.66 | | | $ | 10.00 | |
| Activity from investment operations: | | | | | | | | | | | | |
| Net investment income 1 | | | 0.20 | | | | 0.09 | | | | 0.07 | |
| Net realized and unrealized loss on investments | | | (0.26 | ) | | | (1.19 | ) | | | (0.29 | ) |
| Total from investment operations | | | (0.06 | ) | | | (1.10 | ) | | | (0.22 | ) |
| | | | | | | | | | | | | |
| Less distributions from: | | | | | | | | | | | | |
| Net investment income | | | (0.20 | ) | | | (0.13 | ) | | | (0.07 | ) |
| Return of capital | | | — | | | | (0.02 | ) | | | (0.05 | ) |
| Total distributions | | | (0.20 | ) | | | (0.15 | ) | | | (0.12 | ) |
| | | | | | | | | | | | | |
| Net asset value, end of year/period | | $ | 8.15 | | | $ | 8.41 | | | $ | 9.66 | |
| | | | | | | | | | | | | |
| Total return 2 | | | (0.67 | )% | | | (11.51 | )% | | | (2.24 | )% 6 |
| | | | | | | | | | | | | |
| Net assets, at end of year/period (000s) | | $ | 39,300 | | | $ | 13,877 | | | $ | 64,377 | |
| | | | | | | | | | | | | |
| Ratio of gross expenses to average net assets before expense reimbursement 3, 4 | | | 0.81 | % | | | 0.76 | % | | | 0.69 | % 7 |
| Ratio of net expenses to average net assets after expense reimbursement 4 | | | 0.58 | % | | | 0.58 | % | | | 0.58 | % 7 |
| Ratio of net investment income to average net assets 4, 5 | | | 2.45 | % | | | 1.00 | % | | | 0.80 | % 7 |
| Portfolio Turnover Rate | | | 57 | % | | | 56 | % | | | 52 | % 6 |
| | | | | | | | | | | | | |
| * | Eventide Core Bond Fund commenced on July 31, 2020. |
| 1. | Per share amounts calculated using the average shares method. |
| 2. | Total return in the above table is historical in nature and represents the rate that the investor would have earned or lost on an investment in the Fund assuming reinvestment of dividends and capital gain distributions, if any. Had the manager not waived a portion of the Fund’s expenses in certain periods, total returns would have been lower. |
| 3. | Represents the ratio of expenses to average net assets absent fee waivers and/or expense reimbursements by the manager. |
| 4. | The ratios of expenses to average net assets and net investment income to average net assets do not reflect the expenses of the underlying investment companies in which the Fund invests. |
| 5. | Recognition of net investment income is affected by the timing and declaration of dividends by the underlying investment companies in which the Fund invests. |
See accompanying notes to financial statements.
| A N N U A L R E P O R T | June 30, 2023 |
| Eventide Dividend Opportunities Fund |
| FINANCIAL HIGHLIGHTS |
| |
Per Share Data and Ratios for a Share of Beneficial Interest Outstanding Throughout Each of the Years Presented
| | | Class N | |
| | | Year Ended | | | Year Ended | | | Year Ended | | | Year Ended | | | Year Ended | |
| | | June 30, 2023 | | | June 30, 2022 | | | June 30, 2021 | | | June 30, 2020 | | | June 30, 2019 | |
| Net asset value, beginning of year | | $ | 13.43 | | | $ | 15.86 | | | $ | 10.88 | | | $ | 10.37 | | | $ | 9.66 | |
| Activity from investment operations: | | | | | | | | | | | | | | | | | | | | |
| Net investment income 1 | | | 0.11 | | | | 0.05 | | | | 0.04 | | | | 0.11 | | | | 0.22 | |
| Net realized and unrealized gain (loss) on investments | | | 1.31 | | | | (2.01 | ) | | | 5.08 | | | | 0.57 | | | | 0.66 | |
| Total from investment operations | | | 1.42 | | | | (1.96 | ) | | | 5.12 | | | | 0.68 | | | | 0.88 | |
| | | | | | | | | | | | | | | | | | | | | |
| Less distributions from: | | | | | | | | | | | | | | | | | | | | |
| Net investment income | | | (0.10 | ) | | | (0.18 | ) | | | (0.14 | ) | | | (0.10 | ) | | | (0.16 | ) |
| Net realized gains | | | (0.09 | ) | | | (0.29 | ) | | | — | | | | — | | | | — | |
| Return of capital | | | (0.01 | ) | | | — | | | | — | | | | (0.07 | ) | | | (0.01 | ) |
| Total distributions | | | (0.20 | ) | | | (0.47 | ) | | | (0.14 | ) | | | (0.17 | ) | | | (0.17 | ) |
| | | | | | | | | | | | | | | | | | | | | |
| Net asset value, end of year | | $ | 14.65 | | | $ | 13.43 | | | $ | 15.86 | | | $ | 10.88 | | | $ | 10.37 | |
| | | | | | | | | | | | | | | | | | | | | |
| Total return 2 | | | 10.66 | % | | | (12.90 | )% | | | 47.21 | % | | | 6.60 | % | | | 9.20 | % |
| | | | | | | | | | | | | | | | | | | | | |
| Net assets, at end of year (000s) | | $ | 91,912 | | | $ | 74,940 | | | $ | 70,566 | | | $ | 18,576 | | | $ | 7,254 | |
| | | �� | | | | | | | | | | | | | | | | | | |
| Ratio of gross expenses to average net assets before expense reimbursement/recapture3, 4 | | | 1.23 | % | | | 1.14 | % | | | 1.19 | % | | | 1.50 | % | | | 2.00 | % |
| Ratio of net expenses to average net assets after expense reimbursement/recapture 4 | | | 1.15 | % | | | 1.15 | % | | | 1.15 | % | | | 1.15 | % | | | 1.15 | % |
| Ratio of net investment income to average net assets 4, 5 | | | 0.75 | % | | | 0.34 | % | | | 0.27 | % | | | 1.01 | % | | | 2.25 | % |
| Portfolio Turnover Rate | | | 50 | % | | | 50 | % | | | 35 | % | | | 90 | % | | | 50 | % |
| | | | | | | | | | | | | | | | | | | | | |
| 1. | Per share amounts calculated using the average shares method. |
| 2. | Total return in the above table is historical in nature and represents the rate that the investor would have earned or lost on an investment in the Fund assuming reinvestment of dividends and capital gain distributions, if any. Had the manager not waived or recaptured a portion of the Fund’s expenses in certain periods, total returns would have been lower/higher. |
| 3. | Represents the ratio of expenses to average net assets absent fee waivers and/or expense reimbursements/recapture by the manager. |
| 4. | The ratios of expenses to average net assets and net investment income to average net assets do not reflect the expenses of the underlying investment companies in which the Fund invests. |
| 5. | Recognition of net investment income is affected by the timing and declaration of dividends by the underlying investment companies in which the Fund invests. |
See accompanying notes to financial statements.
| A N N U A L R E P O R T | June 30, 2023 |
| Eventide Dividend Opportunities Fund |
| FINANCIAL HIGHLIGHTS |
| |
Per Share Data and Ratios for a Share of Beneficial Interest Outstanding Throughout Each of the Years Presented
| | | Class A | |
| | | Year Ended | | | Year Ended | | | Year Ended | | | Year Ended | | | Year Ended | |
| | | June 30, 2023 | | | June 30, 2022 | | | June 30, 2021 | | | June 30, 2020 | | | June 30, 2019 | |
| Net asset value, beginning of year | | $ | 13.43 | | | $ | 15.85 | | | $ | 10.87 | | | $ | 10.36 | | | $ | 9.65 | |
| Activity from investment operations: | | | | | | | | | | | | | | | | | | | | |
| Net investment income 1 | | | 0.10 | | | | 0.05 | | | | 0.03 | | | | 0.10 | | | | 0.22 | |
| Net realized and unrealized gain (loss) on investments | | | 1.32 | | | | (2.01 | ) | | | 5.08 | | | | 0.57 | | | | 0.65 | |
| Total from investment operations | | | 1.42 | | | | (1.96 | ) | | | 5.11 | | | | 0.67 | | | | 0.87 | |
| | | | | | | | | | | | | | | | | | | | | |
| Less distributions from: | | | | | | | | | | | | | | | | | | | | |
| Net investment income | | | (0.06 | ) | | | (0.17 | ) | | | (0.13 | ) | | | (0.09 | ) | | | (0.15 | ) |
| Net realized gains | | | (0.09 | ) | | | (0.29 | ) | | | — | | | | — | | | | — | |
| Return of capital | | | (0.04 | ) | | | — | | | | — | | | | (0.07 | ) | | | (0.01 | ) |
| Total distributions | | | (0.19 | ) | | | (0.46 | ) | | | (0.13 | ) | | | (0.16 | ) | | | (0.16 | ) |
| | | | | | | | | | | | | | | | | | | | | |
| Net asset value, end of year | | $ | 14.66 | | | $ | 13.43 | | | $ | 15.85 | | | $ | 10.87 | | | $ | 10.36 | |
| | | | | | | | | | | | | | | | | | | | | |
| Total return 2 | | | 10.68 | % | | | (12.88 | )% | | | 47.22 | % | | | 6.55 | % | | | 9.15 | % |
| | | | | | | | | | | | | | | | | | | | | |
| Net assets, at end of year (000s) | | $ | 36,722 | | | $ | 29,243 | | | $ | 17,865 | | | $ | 3,184 | | | $ | 957 | |
| | | | | | | | | | | | | | | | | | | | | |
| Ratio of gross expenses to average net assets expense reimbursement/recapture3, 4 | | | 1.28 | % | | | 1.19 | % | | | 1.24 | % | | | 1.55 | % | | | 2.05 | % |
| Ratio of net expenses to average net assets after expense reimbursement/recapture 4 | | | 1.20 | % | | | 1.20 | % | | | 1.20 | % | | | 1.20 | % | | | 1.20 | % |
| Ratio of net investment income to average net assets 4, 5 | | | 0.69 | % | | | 0.31 | % | | | 0.22 | % | | | 0.89 | % | | | 2.28 | % |
| Portfolio Turnover Rate | | | 50 | % | | | 50 | % | | | 35 | % | | | 90 | % | | | 50 | % |
| | | | | | | | | | | | | | | | | | | | | |
| 1. | Per share amounts calculated using the average shares method. |
| 2. | Total return in the above table is historical in nature and represents the rate that the investor would have earned or lost on an investment in the Fund assuming reinvestment of dividends and capital gain distributions, if any and does not reflect the impact of sales charges. Had the manager not waived or recaptured a portion of the Fund’s expenses in certain periods, total returns would have been lower/higher. |
| 3. | Represents the ratio of expenses to average net assets absent fee waivers and/or expense reimbursements/recapture by the manager. |
| 4. | The ratios of expenses to average net assets and net investment income to average net assets do not reflect the expenses of the underlying investment companies in which the Fund invests. |
| 5. | Recognition of net investment income is affected by the timing and declaration of dividends by the underlying investment companies in which the Fund invests. |
See accompanying notes to financial statements.
| A N N U A L R E P O R T | June 30, 2023 |
| Eventide Dividend Opportunities Fund |
| FINANCIAL HIGHLIGHTS |
| |
Per Share Data and Ratios for a Share of Beneficial Interest Outstanding Throughout Each of the Years Presented
| | | Class C | |
| | | Year Ended | | | Year Ended | | | Year Ended | | | Year Ended | | | Year Ended | |
| | | June 30, 2023 | | | June 30, 2022 | | | June 30, 2021 | | | June 30, 2020 | | | June 30, 2019 | |
| Net asset value, beginning of year | | $ | 13.34 | | | $ | 15.77 | | | $ | 10.86 | | | $ | 10.35 | | | $ | 9.66 | |
| Activity from investment operations: | | | | | | | | | | | | | | | | | | | | |
| Net investment income (loss) 1 | | | (0.01 | ) | | | (0.07 | ) | | | (0.08 | ) | | | 0.03 | | | | 0.15 | |
| Net realized and unrealized gain (loss) on investments | | | 1.31 | | | | (2.00 | ) | | | 5.06 | | | | 0.56 | | | | 0.65 | |
| Total from investment operations | | | 1.30 | | | | (2.07 | ) | | | 4.98 | | | | 0.59 | | | | 0.80 | |
| | | | | | | | | | | | | | | | | | | | | |
| Less distributions from: | | | | | | | | | | | | | | | | | | | | |
| Net investment income | | | — | | | | (0.07 | ) | | | (0.07 | ) | | | (0.05 | ) | | | (0.10 | ) |
| Net realized gains | | | (0.09 | ) | | | (0.29 | ) | | | — | | | | — | | | | — | |
| Return of capital | | | (0.01 | ) | | | — | | | | — | | | | (0.03 | ) | | | (0.01 | ) |
| Total distributions | | | (0.10 | ) | | | (0.36 | ) | | | (0.07 | ) | | | (0.08 | ) | | | (0.11 | ) |
| | | | | | | | | | | | | | | | | | | | | |
| Net asset value, end of year | | $ | 14.54 | | | $ | 13.34 | | | $ | 15.77 | | | $ | 10.86 | | | $ | 10.35 | |
| | | | | | | | | | | | | | | | | | | | | |
| Total return 2 | | | 9.78 | % | | | (13.57 | )% | | | 45.93 | % | | | 5.78 | % | | | 8.34 | % |
| | | | | | | | | | | | | | | | | | | | | |
| Net assets, at end of year (000s) | | $ | 14,889 | | | $ | 9,975 | | | $ | 4,508 | | | $ | 824 | | | $ | 541 | |
| | | | | | | | | | | | | | | | | | | | | |
| Ratio of gross expenses to average net assets before expense reimbursement/recapture3, 4 | | | 2.03 | % | | | 1.94 | % | | | 1.99 | % | | | 2.30 | % | | | 2.80 | % |
| Ratio of net expenses to average net assets after expense reimbursement/recapture 4 | | | 1.95 | % | | | 1.95 | % | | | 1.95 | % | | | 1.95 | % | | | 1.95 | % |
| Ratio of net investment income (loss) to average net assets 4, 5 | | | (0.05 | )% | | | (0.42 | )% | | | (0.53 | )% | | | 0.25 | % | | | 1.53 | % |
| Portfolio Turnover Rate | | | 50 | % | | | 50 | % | | | 35 | % | | | 90 | % | | | 50 | % |
| | | | | | | | | | | | | | | | | | | | | |
| 1. | Per share amounts calculated using the average shares method. |
| 2. | Total return in the above table is historical in nature and represents the rate that the investor would have earned or lost on an investment in the Fund assuming reinvestment of dividends and capital gain distributions, if any. Had the manager not waived or recaptured a portion of the Fund’s expenses in certain periods, total returns would have been lower/higher. |
| 3. | Represents the ratio of expenses to average net assets absent fee waivers and/or expense reimbursements/recapture by the manager. |
| 4. | The ratios of expenses to average net assets and net investment income/(loss) to average net assets do not reflect the expenses of the underlying investment companies in which the Fund invests. |
| 5. | Recognition of net investment income (loss) is affected by the timing and declaration of dividends by the underlying investment companies in which the Fund invests. |
See accompanying notes to financial statements.
| A N N U A L R E P O R T | June 30, 2023 |
| Eventide Dividend Opportunities Fund |
| FINANCIAL HIGHLIGHTS |
| |
Per Share Data and Ratios for a Share of Beneficial Interest Outstanding Throughout Each of the Years Presented
| | | Class I | |
| | | Year Ended | | | Year Ended | | | Year Ended | | | Year Ended | | | Year Ended | |
| | | June 30, 2023 | | | June 30, 2022 | | | June 30, 2021 | | | June 30, 2020 | | | June 30, 2019 | |
| Net asset value, beginning of year | | $ | 13.44 | | | $ | 15.87 | | | $ | 10.88 | | | $ | 10.37 | | | $ | 9.67 | |
| Activity from investment operations: | | | | | | | | | | | | | | | | | | | | |
| Net investment income 1 | | | 0.13 | | | | 0.09 | | | | 0.07 | | | | 0.12 | | | | 0.24 | |
| Net realized and unrealized gain (loss) on investments | | | 1.32 | | | | (2.02 | ) | | | 5.07 | | | | 0.57 | | | | 0.66 | |
| Total from investment operations | | | 1.45 | | | | (1.93 | ) | | | 5.14 | | | | 0.69 | | | | 0.90 | |
| | | | | | | | | | | | | | | | | | | | | |
| Less distributions from: | | | | | | | | | | | | | | | | | | | | |
| Net investment income | | | (0.11 | ) | | | (0.21 | ) | | | (0.15 | ) | | | (0.10 | ) | | | (0.19 | ) |
| Net realized gains | | | (0.09 | ) | | | (0.29 | ) | | | — | | | | — | | | | — | |
| Return of capital | | | (0.03 | ) | | | — | | | | — | | | | (0.08 | ) | | | (0.01 | ) |
| Total distributions | | | (0.23 | ) | | | (0.50 | ) | | | (0.15 | ) | | | (0.18 | ) | | | (0.20 | ) |
| | | | | | | | | | | | | | | | | | | | | |
| Net asset value, end of year | | $ | 14.66 | | | $ | 13.44 | | | $ | 15.87 | | | $ | 10.88 | | | $ | 10.37 | |
| | | | | | | | | | | | | | | | | | | | | |
| Total return 2 | | | 10.87 | % | | | (12.72 | )% | | | 47.49 | % | | | 6.79 | % | | | 9.40 | % |
| | | | | | | | | | | | | | | | | | | | | |
| Net assets, at end of year (000s) | | $ | 430,286 | | | $ | 305,801 | | | $ | 237,256 | | | $ | 45,034 | | | $ | 7,892 | |
| | | | | | | | | | | | | | | | | | | | | |
| Ratio of gross expenses to average net assets before expense reimbursement/recapture3, 4 | | | 1.03 | % | | | 0.94 | % | | | 0.99 | % | | | 1.30 | % | | | 1.80 | % |
| Ratio of net expenses to average net assets after expense reimbursement/recapture 4 | | | 0.95 | % | | | 0.95 | % | | | 0.95 | % | | | 0.95 | % | | | 0.95 | % |
| Ratio of net investment income to average net assets 4, 5 | | | 0.96 | % | | | 0.55 | % | | | 0.48 | % | | | 1.16 | % | | | 2.47 | % |
| Portfolio Turnover Rate | | | 50 | % | | | 50 | % | | | 35 | % | | | 90 | % | | | 50 | % |
| | | | | | | | | | | | | | | | | | | | | |
| 1. | Per share amounts calculated using the average shares method. |
| 2. | Total return in the above table is historical in nature and represents the rate that the investor would have earned or lost on an investment in the Fund assuming reinvestment of dividends and capital gain distributions, if any. Had the manager not waived or recaptured a portion of the Fund’s expenses in certain periods, total returns would have been lower/higher. |
| 3. | Represents the ratio of expenses to average net assets absent fee waivers and/or expense reimbursements/recapture by the manager. |
| 4. | The ratios of expenses to average net assets and net investment income to average net assets do not reflect the expenses of the underlying investment companies in which the Fund invests. |
| 5. | Recognition of net investment income is affected by the timing and declaration of dividends by the underlying investment companies in which the Fund invests. |
See accompanying notes to financial statements.
| A N N U A L R E P O R T | June 30, 2023 |
| Eventide Exponential Technologies Fund |
| FINANCIAL HIGHLIGHTS |
| |
Per Share Data and Ratios for a Share of Beneficial Interest Outstanding Throughout Each of the Years Presented
| | | Class N | |
| | | Year Ended | | | Year Ended | | | Year Ended | |
| | | June 30, 2023 | | | June 30, 2022 | | | June 30, 2021 * | |
| Net asset value, beginning of year | | $ | 10.92 | | | $ | 19.08 | | | $ | 10.00 | |
| Activity from investment operations: | | | | | | | | | | | | |
| Net investment loss 1 | | | (0.13 | ) | | | (0.25 | ) | | | (0.25 | ) |
| Net realized and unrealized gain (loss) on investments | | | 1.20 | | | | (7.69 | ) | | | 9.33 | |
| Total from investment operations | | | 1.07 | | | | (7.94 | ) | | | 9.08 | |
| | | | | | | | | | | | | |
| Less distributions from: | | | | | | | | | | | | |
| Net realized gains | | | — | | | | (0.23 | ) | | | (0.02 | ) |
| Total distributions | | | — | | | | (0.23 | ) | | | (0.02 | ) |
| | | | | | | | | | | | | |
| Paid-in-capital from redemption fees 1 | | | 0.01 | | | | 0.01 | | | | 0.02 | |
| | | | | | | | | | | | | |
| Net asset value, end of year | | $ | 12.00 | | | $ | 10.92 | | | $ | 19.08 | |
| | | | | | | | | | | | | |
| Total return 2 | | | 9.89 | % | | | (42.00 | )% | | | 91.00 | % |
| | | | | | | | | | | | | |
| Net assets, at end of year (000s) | | $ | 22,186 | | | $ | 12,479 | | | $ | 15,730 | |
| | | | | | | | | | | | | |
| Ratio of gross expenses to average net assets before expense reimbursement 3, 4 | | | 1.70 | % | | | 1.63 | % | | | 1.73 | % |
| Ratio of net expenses to average net assets after expense reimbursement 4 | | | 1.63 | % | | | 1.63 | % | | | 1.63 | % |
| Ratio of net investment loss to average net assets 4, 5 | | | (1.23 | )% | | | (1.54 | )% | | | (1.50 | )% |
| Portfolio Turnover Rate | | | 81 | % | | | 69 | % | | | 60 | % |
| | | | | | | | | | | | | |
| * | Eventide Exponential Technologies Fund commenced on June 30, 2020. |
| 1. | Per share amounts calculated using the average shares method. |
| 2. | Total return in the above table is historical in nature and represents the rate that the investor would have earned or lost on an investment in the Fund assuming reinvestment of dividends and capital gain distributions, if any. Had the manager not waived a portion of the Fund’s expenses in certain periods, total returns would have been lower. |
| 3. | Represents the ratio of expenses to average net assets absent fee waivers and/or expense reimbursements by the manager. |
| 4. | The ratios of expenses to average net assets and net investment loss to average net assets do not reflect the expenses of the underlying investment companies in which the Fund invests. |
| 5. | Recognition of net investment loss is affected by the timing and declaration of dividends by the underlying investment companies in which the Fund invests. |
See accompanying notes to financial statements.
| A N N U A L R E P O R T | June 30, 2023 |
| Eventide Exponential Technologies Fund |
| FINANCIAL HIGHLIGHTS |
| |
Per Share Data and Ratios for a Share of Beneficial Interest Outstanding Throughout Each of the Years Presented
| | | Class A | |
| | | Year Ended | | | Year Ended | | | Year Ended | |
| | | June 30, 2023 | | | June 30, 2022 | | | June 30, 2021 * | |
| Net asset value, beginning of year | | $ | 10.93 | | | $ | 19.08 | | | $ | 10.00 | |
| Activity from investment operations: | | | | | | | | | | | | |
| Net investment loss 1 | | | (0.14 | ) | | | (0.25 | ) | | | (0.26 | ) |
| Net realized and unrealized gain (loss) on investments | | | 1.20 | | | | (7.68 | ) | | | 9.34 | |
| Total from investment operations | | | 1.06 | | | | (7.93 | ) | | | 9.08 | |
| | | | | | | | | | | | | |
| Less distributions from: | | | | | | | | | | | | |
| Net realized gains | | | — | | | | (0.23 | ) | | | (0.02 | ) |
| Total distributions | | | — | | | | (0.23 | ) | | | (0.02 | ) |
| | | | | | | | | | | | | |
| Paid-in-capital from redemption fees 1 | | | 0.01 | | | | 0.01 | | | | 0.02 | |
| | | | | | | | | | | | | |
| Net asset value, end of year | | $ | 12.00 | | | $ | 10.93 | | | $ | 19.08 | |
| | | | | | | | | | | | | |
| Total return 2 | | | 9.79 | % | | | (41.95 | )% | | | 91.00 | % |
| | | | | | | | | | | | | |
| Net assets, at end of year (000s) | | $ | 8,257 | | | $ | 7,377 | | | $ | 7,662 | |
| | | | | | | | | | | | | |
| Ratio of gross expenses to average net assets before expense reimbursement 3, 4 | | | 1.75 | % | | | 1.68 | % | | | 1.78 | % |
| Ratio of net expenses to average net assets after expense reimbursement 4 | | | 1.68 | % | | | 1.68 | % | | | 1.68 | % |
| Ratio of net investment loss to average net assets 4, 5 | | | (1.28 | )% | | | (1.58 | )% | | | (1.55 | )% |
| Portfolio Turnover Rate | | | 81 | % | | | 69 | % | | | 60 | % |
| | | | | | | | | | | | | |
| * | Eventide Exponential Technologies Fund commenced on June 30, 2020. |
| 1. | Per share amounts calculated using the average shares method. |
| 2. | Total return in the above table is historical in nature and represents the rate that the investor would have earned or lost on an investment in the Fund assuming reinvestment of dividends and capital gain distributions, if any and does not reflect the impact of sales charges. Had the manager not waived a portion of the Fund’s expenses in certain periods, total returns would have been lower. |
| 3. | Represents the ratio of expenses to average net assets absent fee waivers and/or expense reimbursements by the manager. |
| 4. | The ratios of expenses to average net assets and net investment loss to average net assets do not reflect the expenses of the underlying investment companies in which the Fund invests. |
| 5. | Recognition of net investment loss is affected by the timing and declaration of dividends by the underlying investment companies in which the Fund invests. |
See accompanying notes to financial statements.
| A N N U A L R E P O R T | June 30, 2023 |
| Eventide Exponential Technologies Fund |
| FINANCIAL HIGHLIGHTS |
| |
Per Share Data and Ratios for a Share of Beneficial Interest Outstanding Throughout Each of the Years Presented
| | | Class C | |
| | | Year Ended | | | Year Ended | | | Year Ended | |
| | | June 30, 2023 | | | June 30, 2022 | | | June 30, 2021 * | |
| Net asset value, beginning of year | | $ | 10.77 | | | $ | 18.96 | | | $ | 10.00 | |
| Activity from investment operations: | | | | | | | | | | | | |
| Net investment loss 1 | | | (0.21 | ) | | | (0.37 | ) | | | (0.38 | ) |
| Net realized and unrealized gain (loss) on investments | | | 1.17 | | | | (7.60 | ) | | | 9.35 | |
| Total from investment operations | | | 0.96 | | | | (7.97 | ) | | | 8.97 | |
| | | | | | | | | | | | | |
| Less distributions from: | | | | | | | | | | | | |
| Net realized gains | | | — | | | | (0.23 | ) | | | (0.02 | ) |
| Total distributions | | | — | | | | (0.23 | ) | | | (0.02 | ) |
| | | | | | | | | | | | | |
| Paid-in-capital from redemption fees 1 | | | 0.01 | | | | 0.01 | | | | 0.01 | |
| | | | | | | | | | | | | |
| Net asset value, end of year | | $ | 11.74 | | | $ | 10.77 | | | $ | 18.96 | |
| | | | | | | | | | | | | |
| Total return 2 | | | 9.01 | % | | | (42.43 | )% | | | 89.80 | % |
| | | | | | | | | | | | | |
| Net assets, at end of year (000s) | | $ | 2,635 | | | $ | 2,422 | | | $ | 2,065 | |
| | | | | | | | | | | | | |
| Ratio of gross expenses to average net assets before expense reimbursement 3, 4 | | | 2.50 | % | | | 2.43 | % | | | 2.53 | % |
| Ratio of net expenses to average net assets after expense reimbursement 4 | | | 2.43 | % | | | 2.43 | % | | | 2.43 | % |
| Ratio of net investment loss to average net assets 4, 5 | | | (2.03 | )% | | | (2.33 | )% | | | (2.30 | )% |
| Portfolio Turnover Rate | | | 81 | % | | | 69 | % | | | 60 | % |
| | | | | | | | | | | | | |
| * | Eventide Exponential Technologies Fund commenced on June 30, 2020. |
| 1. | Per share amounts calculated using the average shares method. |
| 2. | Total return in the above table is historical in nature and represents the rate that the investor would have earned or lost on an investment in the Fund assuming reinvestment of dividends and capital gain distributions, if any. Had the manager not waived a portion of the Fund’s expenses in certain periods, total returns would have been lower. |
| 3. | Represents the ratio of expenses to average net assets absent fee waivers and/or expense reimbursements by the manager. |
| 4. | The ratios of expenses to average net assets and net investment loss to average net assets do not reflect the expenses of the underlying investment companies in which the Fund invests. |
| 5. | Recognition of net investment loss is affected by the timing and declaration of dividends by the underlying investment companies in which the Fund invests. |
See accompanying notes to financial statements.
| A N N U A L R E P O R T | June 30, 2023 |
| Eventide Exponential Technologies Fund |
| FINANCIAL HIGHLIGHTS |
| |
Per Share Data and Ratios for a Share of Beneficial Interest Outstanding Throughout Each of the Years Presented
| | | Class I | |
| | | Year Ended | | | Year Ended | | | Year Ended | |
| | | June 30, 2023 | | | June 30, 2022 | | | June 30, 2021 * | |
| Net asset value, beginning of year | | $ | 10.97 | | | $ | 19.12 | | | $ | 10.00 | |
| Activity from investment operations: | | | | | | | | | | | | |
| Net investment loss 1 | | | (0.11 | ) | | | (0.22 | ) | | | (0.22 | ) |
| Net realized and unrealized gain (loss) on investments | | | 1.21 | | | | (7.71 | ) | | | 9.34 | |
| Total from investment operations | | | 1.10 | | | | (7.93 | ) | | | 9.12 | |
| | | | | | | | | | | | | |
| Less distributions from: | | | | | | | | | | | | |
| Net realized gains | | | — | | | | (0.23 | ) | | | (0.02 | ) |
| Total distributions | | | — | | | | (0.23 | ) | | | (0.02 | ) |
| | | | | | | | | | | | | |
| Paid-in-capital from redemption fees 1 | | | 0.01 | | | | 0.01 | | | | 0.02 | |
| | | | | | | | | | | | | |
| Net asset value, end of year | | $ | 12.08 | | | $ | 10.97 | | | $ | 19.12 | |
| | | | | | | | | | | | | |
| Total return 2 | | | 10.12 | % | | | (41.86 | )% | | | 91.40 | % |
| | | | | | | | | | | | | |
| Net assets, at end of year (000s) | | $ | 82,735 | | | $ | 72,567 | | | $ | 96,821 | |
| | | | | | | | | | | | | |
| Ratio of gross expenses to average net assets before expense reimbursement 3, 4 | | | 1.50 | % | | | 1.43 | % | | | 1.53 | % |
| Ratio of net expenses to average net assets after expense reimbursement 4 | | | 1.43 | % | | | 1.43 | % | | | 1.43 | % |
| Ratio of net investment loss to average net assets 4, 5 | | | (1.02 | )% | | | (1.33 | )% | | | (1.30 | )% |
| Portfolio Turnover Rate | | | 81 | % | | | 69 | % | | | 60 | % |
| | | | | | | | | | | | | |
| * | Eventide Exponential Technologies Fund commenced on June 30, 2020. |
| 1. | Per share amounts calculated using the average shares method. |
| 2. | Total return in the above table is historical in nature and represents the rate that the investor would have earned or lost on an investment in the Fund assuming reinvestment of dividends and capital gain distributions, if any. Had the manager not waived a portion of the Fund’s expenses in certain periods, total returns would have been lower. |
| 3. | Represents the ratio of expenses to average net assets absent fee waivers and/or expense reimbursements by the manager. |
| 4. | The ratios of expenses to average net assets and net investment loss to average net assets do not reflect the expenses of the underlying investment companies in which the Fund invests. |
| 5. | Recognition of net investment loss is affected by the timing and declaration of dividends by the underlying investment companies in which the Fund invests. |
See accompanying notes to financial statements.
| A N N U A L R E P O R T | June 30, 2023 |
| Eventide Gilead Fund |
| FINANCIAL HIGHLIGHTS |
| |
Per Share Data and Ratios for a Share of Beneficial Interest Outstanding Throughout Each of the Years Presented
| | | Class N | |
| | | Year Ended | | | Year Ended | | | Year Ended | | | Year Ended | | | Year Ended | |
| | | June 30, 2023 | | | June 30, 2022 | | | June 30, 2021 | | | June 30, 2020 | | | June 30, 2019 | |
| Net asset value, beginning of year | | $ | 44.10 | | | $ | 69.91 | | | $ | 47.16 | | | $ | 41.75 | | | $ | 37.80 | |
| Activity from investment operations: | | | | | | | | | | | | | | | | | | | | |
| Net investment loss 1 | | | (0.27 | ) | | | (0.53 | ) | | | (0.51 | ) | | | (0.25 | ) | | | (0.14 | ) |
| Net realized and unrealized gain (loss) on investments | | | 6.70 | | | | (21.01 | ) | | | 23.77 | | | | 6.98 | | | | 5.80 | |
| Total from investment operations | | | 6.43 | | | | (21.54 | ) | | | 23.26 | | | | 6.73 | | | | 5.66 | |
| | | | | | | | | | | | | | | | | | | | | |
| Less distributions from: | | | | | | | | | | | | | | | | | | | | |
| Net realized gains | | | (2.28 | ) | | | (4.27 | ) | | | (0.51 | ) | | | (1.32 | ) | | | (1.71 | ) |
| Total distributions | | | (2.28 | ) | | | (4.27 | ) | | | (0.51 | ) | | | (1.32 | ) | | | (1.71 | ) |
| | | | | | | | | | | | | | | | | | | | | |
| Net asset value, end of year | | $ | 48.25 | | | $ | 44.10 | | | $ | 69.91 | | | $ | 47.16 | | | $ | 41.75 | |
| | | | | | | | | | | | | | | | | | | | | |
| Total return 2 | | | 15.29 | % 5 | | | (32.65 | )% | | | 49.43 | % | | | 16.66 | % | | | 16.41 | % |
| | | | | | | | | | | | | | | | | | | | | |
| Net assets, at end of year (000s) | | $ | 526,825 | | | $ | 529,869 | | | $ | 827,811 | | | $ | 549,944 | | | $ | 639,372 | |
| Ratio of net expenses to average net assets 3 | | | 1.38 | % | | | 1.31 | % | | | 1.31 | % | | | 1.38 | % | | | 1.39 | % |
| Ratio of net investment loss to average net assets 3, 4 | | | (0.59 | )% | | | (0.86 | )% | | | (0.85 | )% | | | (0.63 | )% | | | (0.37 | )% |
| Portfolio Turnover Rate | | | 34 | % | | | 27 | % | | | 19 | % | | | 35 | % | | | 38 | % |
| | | | | | | | | | | | | | | | | | | | | |
| 1. | Per share amounts calculated using the average shares method. |
| 2. | Total return in the above table is historical in nature and represents the rate that the investor would have earned or lost on an investment in the Fund assuming reinvestment of dividends and capital gain distributions, if any. |
| 3. | The ratios of expenses to average net assets and net investment loss to average net assets do not reflect the expenses of the underlying investment companies in which the Fund invests. |
| 4. | Recognition of net investment loss is affected by the timing and declaration of dividends by the underlying investment companies in which the Fund invests. |
| 5. | Includes adjustments in accordance with accounting principles generally accepted in the United States of America and, consequently, the net asset value for financial reporting purposes and the returns based upon those net asset values may differ from the net asset values and returns for shareholder transactions. |
See accompanying notes to financial statements.
| A N N U A L R E P O R T | June 30, 2023 |
| Eventide Gilead Fund |
| FINANCIAL HIGHLIGHTS |
| |
Per Share Data and Ratios for a Share of Beneficial Interest Outstanding Throughout Each of the Years Presented
| | | Class A | |
| | | Year Ended | | | Year Ended | | | Year Ended | | | Year Ended | | | Year Ended | |
| | | June 30, 2023 | | | June 30, 2022 | | | June 30, 2021 | | | June 30, 2020 | | | June 30, 2019 | |
| Net asset value, beginning of year | | $ | 43.83 | | | $ | 69.53 | | | $ | 46.92 | | | $ | 41.57 | | | $ | 37.66 | |
| Activity from investment operations: | | | | | | | | | | | | | | | | | | | | |
| Net investment loss 1 | | | (0.29 | ) | | | (0.55 | ) | | | (0.54 | ) | | | (0.27 | ) | | | (0.16 | ) |
| Net realized and unrealized gain (loss) on investments | | | 6.68 | | | | (20.88 | ) | | | 23.66 | | | | 6.94 | | | | 5.78 | |
| Total from investment operations | | | 6.39 | | | | (21.43 | ) | | | 23.12 | | | | 6.67 | | | | 5.62 | |
| | | | | | | | | | | | | | | | | | | | | |
| Less distributions from: | | | | | | | | | | | | | | | | | | | | |
| Net realized gains | | | (2.28 | ) | | | (4.27 | ) | | | (0.51 | ) | | | (1.32 | ) | | | (1.71 | ) |
| Total distributions | | | (2.28 | ) | | | (4.27 | ) | | | (0.51 | ) | | | (1.32 | ) | | | (1.71 | ) |
| | | | | | | | | | | | | | | | | | | | | |
| Net asset value, end of year | | $ | 47.94 | | | $ | 43.83 | | | $ | 69.53 | | | $ | 46.92 | | | $ | 41.57 | |
| | | | | | | | | | | | | | | | | | | | | |
| Total return 2 | | | 15.30 | % 5 | | | (32.67 | )% | | | 49.39 | % | | | 16.58 | % | | | 16.36 | % |
| | | | | | | | | | | | | | | | | | | | | |
| Net assets, at end of year (000s) | | $ | 351,924 | | | $ | 302,171 | | | $ | 458,726 | | | $ | 301,013 | | | $ | 274,059 | |
| Ratio of net expenses to average net assets 3 | | | 1.43 | % | | | 1.36 | % | | | 1.36 | % | | | 1.43 | % | | | 1.44 | % |
| Ratio of net investment loss to average net assets 3, 4 | | | (0.65 | )% | | | (0.91 | )% | | | (0.91 | )% | | | (0.69 | )% | | | (0.44 | )% |
| Portfolio Turnover Rate | | | 34 | % | | | 27 | % | | | 19 | % | | | 35 | % | | | 38 | % |
| | | | | | | | | | | | | | | | | | | | | |
| 1. | Per share amounts calculated using the average shares method. |
| 2. | Total return in the above table is historical in nature and represents the rate that the investor would have earned or lost on an investment in the Fund assuming reinvestment of dividends and capital gain distributions, if any and does not reflect the impact of sales charges. |
| 3. | The ratios of expenses to average net assets and net investment loss to average net assets do not reflect the expenses of the underlying investment companies in which the Fund invests. |
| 4. | Recognition of net investment loss is affected by the timing and declaration of dividends by the underlying investment companies in which the Fund invests. |
| 5. | Includes adjustments in accordance with accounting principles generally accepted in the United States of America and, consequently, the net asset value for financial reporting purposes and the returns based upon those net asset values may differ from the net asset values and returns for shareholder transactions. |
See accompanying notes to financial statements.
| A N N U A L R E P O R T | June 30, 2023 |
| Eventide Gilead Fund |
| FINANCIAL HIGHLIGHTS |
| |
Per Share Data and Ratios for a Share of Beneficial Interest Outstanding Throughout Each of the Years Presented
| | | Class C | |
| | | Year Ended | | | Year Ended | | | Year Ended | | | Year Ended | | | Year Ended | |
| | | June 30, 2023 | | | June 30, 2022 | | | June 30, 2021 | | | June 30, 2020 | | | June 30, 2019 | |
| Net asset value, beginning of year | | $ | 39.09 | | | $ | 62.97 | | | $ | 42.86 | | | $ | 38.37 | | | $ | 35.16 | |
| Activity from investment operations: | | | | | | | | | | | | | | | | | | | | |
| Net investment loss 1 | | | (0.55 | ) | | | (0.91 | ) | | | (0.89 | ) | | | (0.53 | ) | | | (0.41 | ) |
| Net realized and unrealized gain (loss) on investments | | | 5.87 | | | | (18.70 | ) | | | 21.51 | | | | 6.34 | | | | 5.33 | |
| Total from investment operations | | | 5.32 | | | | (19.61 | ) | | | 20.62 | | | | 5.81 | | | | 4.92 | |
| | | | | | | | | | | | | | | | | | | | | |
| Less distributions from: | | | | | | | | | | | | | | | | | | | | |
| Net realized gains | | | (2.28 | ) | | | (4.27 | ) | | | (0.51 | ) | | | (1.32 | ) | | | (1.71 | ) |
| Total distributions | | | (2.28 | ) | | | (4.27 | ) | | | (0.51 | ) | | | (1.32 | ) | | | (1.71 | ) |
| | | | | | | | | | | | | | | | | | | | | |
| Net asset value, end of year | | $ | 42.13 | | | $ | 39.09 | | | $ | 62.97 | | | $ | 42.86 | | | $ | 38.37 | |
| | | | | | | | | | | | | | | | | | | | | |
| Total return 2 | | | 14.38 | % 5 | | | (33.21 | )% | | | 48.23 | % | | | 15.71 | % | | | 15.51 | % |
| | | | | | | | | | | | | | | | | | | | | |
| Net assets, at end of year (000s) | | $ | 218,201 | | | $ | 235,967 | | | $ | 404,272 | | | $ | 289,242 | | | $ | 266,001 | |
| Ratio of net expenses to average net assets 3 | | | 2.18 | % | | | 2.11 | % | | | 2.11 | % | | | 2.18 | % | | | 2.19 | % |
| Ratio of net investment loss to average net assets 3, 4 | | | (1.40 | )% | | | (1.67 | )% | | | (1.65 | )% | | | (1.43 | )% | | | (1.17 | )% |
| Portfolio Turnover Rate | | | 34 | % | | | 27 | % | | | 19 | % | | | 35 | % | | | 38 | % |
| | | | | | | | | | | | | | | | | | | | | |
| 1. | Per share amounts calculated using the average shares method. |
| 2. | Total return in the above table is historical in nature and represents the rate that the investor would have earned or lost on an investment in the Fund assuming reinvestment of dividends and capital gain distributions, if any. |
| 3. | The ratios of expenses to average net assets and net investment loss to average net assets do not reflect the expenses of the underlying investment companies in which the Fund invests. |
| 4. | Recognition of net investment loss is affected by the timing and declaration of dividends by the underlying investment companies in which the Fund invests. |
| 5. | Includes adjustments in accordance with accounting principles generally accepted in the United States of America and, consequently, the net asset value for financial reporting purposes and the returns based upon those net asset values may differ from the net asset values and returns for shareholder transactions. |
See accompanying notes to financial statements.
| A N N U A L R E P O R T | June 30, 2023 |
| Eventide Gilead Fund |
| FINANCIAL HIGHLIGHTS |
| |
Per Share Data and Ratios for a Share of Beneficial Interest Outstanding Throughout Each of the Years Presented
| | | Class I | |
| | | Year Ended | | | Year Ended | | | Year Ended | | | Year Ended | | | Year Ended | |
| | | June 30, 2023 | | | June 30, 2022 | | | June 30, 2021 | | | June 30, 2020 | | | June 30, 2019 | |
| Net asset value, beginning of year | | $ | 45.36 | | | $ | 71.65 | | | $ | 48.22 | | | $ | 42.59 | | | $ | 38.44 | |
| Activity from investment operations: | | | | | | | | | | | | | | | | | | | | |
| Net investment loss 1 | | | (0.19 | ) | | | (0.41 | ) | | | (0.40 | ) | | | (0.18 | ) | | | (0.07 | ) |
| Net realized and unrealized gain (loss) on investments | | | 6.93 | | | | (21.61 | ) | | | 24.34 | | | | 7.13 | | | | 5.93 | |
| Total from investment operations | | | 6.74 | | | | (22.02 | ) | | | 23.94 | | | | 6.95 | | | | 5.86 | |
| | | | | | | | | | | | | | | | | | | | | |
| Less distributions from: | | | | | | | | | | | | | | | | | | | | |
| Net realized gains | | | (2.28 | ) | | | (4.27 | ) | | | (0.51 | ) | | | (1.32 | ) | | | (1.71 | ) |
| Total distributions | | | (2.28 | ) | | | (4.27 | ) | | | (0.51 | ) | | | (1.32 | ) | | | (1.71 | ) |
| | | | | | | | | | | | | | | | | | | | | |
| Net asset value, end of year | | $ | 49.82 | | | $ | 45.36 | | | $ | 71.65 | | | $ | 48.22 | | | $ | 42.59 | |
| | | | | | | | | | | | | | | | | | | | | |
| Total return 2 | | | 15.56 | % 5 | | | (32.52 | )% | | | 49.76 | % | | | 16.85 | % | | | 16.66 | % |
| | | | | | | | | | | | | | | | | | | | | |
| Net assets, at end of year (000s) | | $ | 2,663,688 | | | $ | 2,408,991 | | | $ | 3,522,353 | | | $ | 1,997,163 | | | $ | 1,475,489 | |
| | | | | | | | | | | | | | | | | | | | | |
| Ratio of net expenses to average net assets 3 | | | 1.18 | % | | | 1.11 | % | | | 1.11 | % | | | 1.18 | % | | | 1.19 | % |
| Ratio of net investment loss to average net assets 3, 4 | | | (0.40 | )% | | | (0.66 | )% | | | (0.65 | )% | | | (0.43 | )% | | | (0.17 | )% |
| Portfolio Turnover Rate | | | 34 | % | | | 27 | % | | | 19 | % | | | 35 | % | | | 38 | % |
| | | | | | | | | | | | | | | | | | | | | |
| 1. | Per share amounts calculated using the average shares method. |
| 2. | Total return in the above table is historical in nature and represents the rate that the investor would have earned or lost on an investment in the Fund assuming reinvestment of dividends and capital gain distributions, if any. |
| 3. | The ratios of expenses to average net assets and net investment loss to average net assets do not reflect the expenses of the underlying investment companies in which the Fund invests. |
| 4. | Recognition of net investment loss is affected by the timing and declaration of dividends by the underlying investment companies in which the Fund invests. |
| 5. | Includes adjustments in accordance with accounting principles generally accepted in the United States of America and, consequently, the net asset value for financial reporting purposes and the returns based upon those net asset values may differ from the net asset values and returns for shareholder transactions. |
See accompanying notes to financial statements.
| A N N U A L R E P O R T | June 30, 2023 |
| Eventide Healthcare & Life Sciences Fund |
| FINANCIAL HIGHLIGHTS |
| |
Per Share Data and Ratios for a Share of Beneficial Interest Outstanding Throughout Each of the Years Presented
| | | Class N | |
| | | Year Ended | | | Year Ended | | | Year Ended | | | Year Ended | | | Year Ended | |
| | | June 30, 2023 | | | June 30, 2022 | | | June 30, 2021 | | | June 30, 2020 | | | June 30, 2019 | |
| Net asset value, beginning of year | | $ | 26.52 | | | $ | 46.19 | | | $ | 43.33 | | | $ | 35.51 | | | $ | 34.52 | |
| Activity from investment operations: | | | | | | | | | | | | | | | | | | | | |
| Net investment loss 1 | | | (0.37 | ) | | | (0.57 | ) | | | (0.72 | ) | | | (0.52 | ) | | | (0.46 | ) |
| Net realized and unrealized gain (loss) on investments | | | 10.48 | | | | (14.74 | ) | | | 5.52 | | | | 9.19 | | | | 3.39 | |
| Total from investment operations | | | 10.11 | | | | (15.31 | ) | | | 4.80 | | | | 8.67 | | | | 2.93 | |
| | | | | | | | | | | | | | | | | | | | | |
| Less distributions from: | | | | | | | | | | | | | | | | | | | | |
| Net investment income | | | — | | | | (0.63 | ) | | | — | | | | — | | | | — | |
| Net realized gains | | | — | | | | (3.73 | ) | | | (1.94 | ) | | | (0.87 | ) | | | (1.98 | ) |
| Total distributions | | | — | | | | (4.36 | ) | | | (1.94 | ) | | | (0.87 | ) | | | (1.98 | ) |
| | | | | | | | | | | | | | | | | | | | | |
| Paid-in-capital from redemption fees 1 | | | — | | | | — | | | | 0.00 | 5 | | | 0.02 | | | | 0.04 | |
| | | | | | | | | | | | | | | | | | | | | |
| Net asset value, end of year | | $ | 36.63 | | | $ | 26.52 | | | $ | 46.19 | | | $ | 43.33 | | | $ | 35.51 | |
| | | | | | | | | | | | | | | | | | | | | |
| Total return 2 | | | 38.12 | % 6 | | | (35.99 | )% 6 | | | 10.34 | % | | | 24.68 | % | | | 10.38 | % 6 |
| | | | | | | | | | | | | | | | | | | | | |
| Net assets, at end of year (000s) | | $ | 133,006 | | | $ | 115,954 | | | $ | 227,441 | | | $ | 231,460 | | | $ | 147,468 | |
| Ratio of net expenses to average net assets 3 | | | 1.50 | % | | | 1.50 | % | | | 1.48 | % | | | 1.50 | % | | | 1.49 | % |
| Ratio of net investment loss to average net assets 3, 4 | | | (1.14 | )% | | | (1.49 | )% | | | (1.47 | )% | | | (1.44 | )% | | | (1.38 | )% |
| Portfolio Turnover Rate | | | 79 | % | | | 59 | % | | | 62 | % | | | 33 | % | | | 53 | % |
| | | | | | | | | | | | | | | | | | | | | |
| 1. | Per share amounts calculated using the average shares method. |
| 2. | Total return in the above table is historical in nature and represents the rate that the investor would have earned or lost on an investment in the Fund assuming reinvestment of dividends and capital gain distributions, if any. |
| 3. | The ratios of expenses to average net assets and net investment loss to average net assets do not reflect the expenses of the underlying investment companies in which the Fund invests. |
| 4. | Recognition of net investment loss is affected by the timing and declaration of dividends by the underlying investment companies in which the Fund invests. |
| 5. | Amount represents less than $0.01 per share. |
| 6. | Includes adjustments in accordance with accounting principles generally accepted in the United States of America and, consequently, the net asset value for financial reporting purposes and the returns based upon those net asset values may differ from the net asset values and returns for shareholder transactions. |
See accompanying notes to financial statements.
| A N N U A L R E P O R T | June 30, 2023 |
| Eventide Healthcare & Life Sciences Fund |
| FINANCIAL HIGHLIGHTS |
| |
Per Share Data and Ratios for a Share of Beneficial Interest Outstanding Throughout Each of the Years Presented
| | | Class A | |
| | | Year Ended | | | Year Ended | | | Year Ended | | | Year Ended | | | Year Ended | |
| | | June 30, 2023 | | | June 30, 2022 | | | June 30, 2021 | | | June 30, 2020 | | | June 30, 2019 | |
| Net asset value, beginning of year | | $ | 26.34 | | | $ | 45.91 | | | $ | 43.10 | | | $ | 35.33 | | | $ | 34.40 | |
| Activity from investment operations: | | | | | | | | | | | | | | | | | | | | |
| Net investment loss 1 | | | (0.38 | ) | | | (0.58 | ) | | | (0.74 | ) | | | (0.53 | ) | | | (0.48 | ) |
| Net realized and unrealized gain (loss) on investments | | | 10.41 | | | | (14.64 | ) | | | 5.49 | | | | 9.15 | | | | 3.35 | |
| Total from investment operations | | | 10.03 | | | | (15.22 | ) | | | 4.75 | | | | 8.62 | | | | 2.87 | |
| | | | | | | | | | | | | | | | | | | | | |
| Less distributions from: | | | | | | | | | | | | | | | | | | | | |
| Net investment income | | | — | | | | (0.62 | ) | | | — | | | | — | | | | — | |
| Net realized gains | | | — | | | | (3.73 | ) | | | (1.94 | ) | | | (0.87 | ) | | | (1.98 | ) |
| Total distributions | | | — | | | | (4.35 | ) | | | (1.94 | ) | | | (0.87 | ) | | | (1.98 | ) |
| | | | | | | | | | | | | | | | | | | | | |
| Paid-in-capital from redemption fees 1 | | | — | | | | — | | | | 0.00 | 5 | | | 0.02 | | | | 0.04 | |
| | | | | | | | | | | | | | | | | | | | | |
| Net asset value, end of year | | $ | 36.37 | | | $ | 26.34 | | | $ | 45.91 | | | $ | 43.10 | | | $ | 35.33 | |
| | | | | | | | | | | | | | | | | | | | | |
| Total return 2 | | | 38.08 | % 6 | | | (36.02 | )% 6 | | | 10.28 | % | | | 24.67 | % | | | 10.24 | % 6 |
| | | | | | | | | | | | | | | | | | | | | |
| Net assets, at end of year (000s) | | $ | 151,885 | | | $ | 114,642 | | | $ | 191,709 | | | $ | 175,151 | | | $ | 143,407 | |
| Ratio of net expenses to average net assets 3 | | | 1.55 | % | | | 1.55 | % | | | 1.53 | % | | | 1.55 | % | | | 1.54 | % |
| Ratio of net investment loss to average net assets 3, 4 | | | (1.19 | )% | | | (1.54 | )% | | | (1.52 | )% | | | (1.49 | )% | | | (1.43 | )% |
| Portfolio Turnover Rate | | | 79 | % | | | 59 | % | | | 62 | % | | | 33 | % | | | 53 | % |
| | | | | | | | | | | | | | | | | | | | | |
| 1. | Per share amounts calculated using the average shares method. |
| 2. | Total return in the above table is historical in nature and represents the rate that the investor would have earned or lost on an investment in the Fund assuming reinvestment of dividends and capital gain distributions, if any and does not reflect the impact of sales charges. |
| 3. | The ratios of expenses to average net assets and net investment loss to average net assets do not reflect the expenses of the underlying investment companies in which the Fund invests. |
| 4. | Recognition of net investment loss is affected by the timing and declaration of dividends by the underlying investment companies in which the Fund invests. |
| 5. | Amount represents less than $0.01 per share. |
| 6. | Includes adjustments in accordance with accounting principles generally accepted in the United States of America and, consequently, the net asset value for financial reporting purposes and the returns based upon those net asset values may differ from the net asset values and returns for shareholder transactions. |
See accompanying notes to financial statements.
| A N N U A L R E P O R T | June 30, 2023 |
| Eventide Healthcare & Life Sciences Fund |
| FINANCIAL HIGHLIGHTS |
| |
Per Share Data and Ratios for a Share of Beneficial Interest Outstanding Throughout Each of the Years Presented
| | | Class C | |
| | | Year Ended | | | Year Ended | | | Year Ended | | | Year Ended | | | Year Ended | |
| | | June 30, 2023 | | | June 30, 2022 | | | June 30, 2021 | | | June 30, 2020 | | | June 30, 2019 | |
| Net asset value, beginning of year | | $ | 24.37 | | | $ | 42.78 | | | $ | 40.56 | | | $ | 33.54 | | | $ | 33.00 | |
| Activity from investment operations: | | | | | | | | | | | | | | | | | | | | |
| Net investment loss 1 | | | (0.57 | ) | | | (0.80 | ) | | | (1.04 | ) | | | (0.76 | ) | | | (0.69 | ) |
| Net realized and unrealized gain (loss) on investments | | | 9.59 | | | | (13.60 | ) | | | 5.20 | | | | 8.63 | | | | 3.17 | |
| Total from investment operations | | | 9.02 | | | | (14.40 | ) | | | 4.16 | | | | 7.87 | | | | 2.48 | |
| | | | | | | | | | | | | | | | | | | | | |
| Less distributions from: | | | | | | | | | | | | | | | | | | | | |
| Net investment income | | | — | | | | (0.28 | ) | | | — | | | | — | | | | — | |
| Net realized gains | | | — | | | | (3.73 | ) | | | (1.94 | ) | | | (0.87 | ) | | | (1.98 | ) |
| Total distributions | | | — | | | | (4.01 | ) | | | (1.94 | ) | | | (0.87 | ) | | | (1.98 | ) |
| | | | | | | | | | | | | | | | | | | | | |
| Paid-in-capital from redemption fees 1 | | | — | | | | — | | | | 0.00 | 5 | | | 0.02 | | | | 0.04 | |
| | | | | | | | | | | | | | | | | | | | | |
| Net asset value, end of year | | $ | 33.39 | | | $ | 24.37 | | | $ | 42.78 | | | $ | 40.56 | | | $ | 33.54 | |
| | | | | | | | | | | | | | | | | | | | | |
| Total return 2 | | | 37.01 | % 6 | | | (36.51 | )% 6 | | | 9.45 | % | | | 23.73 | % | | | 9.50 | % 6 |
| | | | | | | | | | | | | | | | | | | | | |
| Net assets, at end of year (000s) | | $ | 76,849 | | | $ | 66,540 | | | $ | 120,351 | | | $ | 104,202 | | | $ | 87,773 | |
| Ratio of net expenses to average net assets 3 | | | 2.30 | % | | | 2.30 | % | | | 2.28 | % | | | 2.30 | % | | | 2.29 | % |
| Ratio of net investment loss to average net assets 3, 4 | | | (1.94 | )% | | | (2.29 | )% | | | (2.27 | )% | | | (2.23 | )% | | | (2.18 | )% |
| Portfolio Turnover Rate | | | 79 | % | | | 59 | % | | | 62 | % | | | 33 | % | | | 53 | % |
| | | | | | | | | | | | | | | | | | | | | |
| 1. | Per share amounts calculated using the average shares method. |
| 2. | Total return in the above table is historical in nature and represents the rate that the investor would have earned or lost on an investment in the Fund assuming reinvestment of dividends and capital gain distributions, if any. |
| 3. | The ratios of expenses to average net assets and net investment loss to average net assets do not reflect the expenses of the underlying investment companies in which the Fund invests. |
| 4. | Recognition of net investment loss is affected by the timing and declaration of dividends by the underlying investment companies in which the Fund invests. |
| 5. | Amount represents less than $0.01 per share. |
| 6. | Includes adjustments in accordance with accounting principles generally accepted in the United States of America and, consequently, the net asset value for financial reporting purposes and the returns based upon those net asset values may differ from the net asset values and returns for shareholder transactions. |
See accompanying notes to financial statements.
| A N N U A L R E P O R T | June 30, 2023 |
| Eventide Healthcare & Life Sciences Fund |
| FINANCIAL HIGHLIGHTS |
| |
Per Share Data and Ratios for a Share of Beneficial Interest Outstanding Throughout Each of the Years Presented
| | | Class I | |
| | | Year Ended | | | Year Ended | | | Year Ended | | | Year Ended | | | Year Ended | |
| | | June 30, 2023 | | | June 30, 2022 | | | June 30, 2021 | | | June 30, 2020 | | | June 30, 2019 | |
| Net asset value, beginning of year | | $ | 27.05 | | | $ | 47.04 | | | $ | 44.02 | | | $ | 35.98 | | | $ | 34.88 | |
| Activity from investment operations: | | | | | | | | | | | | | | | | | | | | |
| Net investment loss 1 | | | (0.31 | ) | | | (0.49 | ) | | | (0.64 | ) | | | (0.46 | ) | | | (0.40 | ) |
| Net realized and unrealized gain (loss) on investments | | | 10.71 | | | | (15.03 | ) | | | 5.60 | | | | 9.35 | | | | 3.44 | |
| Total from investment operations | | | 10.40 | | | | (15.52 | ) | | | 4.96 | | | | 8.89 | | | | 3.04 | |
| | | | | | | | | | | | | | | | | | | | | |
| Less distributions from: | | | | | | | | | | | | | | | | | | | | |
| Net investment income | | | — | | | | (0.74 | ) | | | — | | | | — | | | | — | |
| Net realized gains | | | — | | | | (3.73 | ) | | | (1.94 | ) | | | (0.87 | ) | | | (1.98 | ) |
| Total distributions | | | — | | | | (4.47 | ) | | | (1.94 | ) | | | (0.87 | ) | | | (1.98 | ) |
| | | | | | | | | | | | | | | | | | | | | |
| Paid-in-capital from redemption fees 1 | | | — | | | | — | | | | 0.00 | 5 | | | 0.02 | | | | 0.04 | |
| | | | | | | | | | | | | | | | | | | | | |
| Net asset value, end of year | | $ | 37.45 | | | $ | 27.05 | | | $ | 47.04 | | | $ | 44.02 | | | $ | 35.98 | |
| | | | | | | | | | | | | | | | | | | | | |
| Total return 2 | | | 38.45 | % 6 | | | (35.85 | )% 6 | | | 10.54 | % | | | 24.97 | % | | | 10.60 | % 6 |
| | | | | | | | | | | | | | | | | | | | | |
| Net assets, at end of year (000s) | | $ | 1,441,422 | | | $ | 1,024,430 | | | $ | 1,573,091 | | | $ | 1,120,862 | | | $ | 705,159 | |
| Ratio of net expenses to average net assets 3 | | | 1.30 | % | | | 1.30 | % | | | 1.28 | % | | | 1.30 | % | | | 1.29 | % |
| Ratio of net investment loss to average net assets 3, 4 | | | (0.94 | )% | | | (1.29 | )% | | | (1.28 | )% | | | (1.24 | )% | | | (1.19 | )% |
| Portfolio Turnover Rate | | | 79 | % | | | 59 | % | | | 62 | % | | | 33 | % | | | 53 | % |
| | | | | | | | | | | | | | | | | | | | | |
| 1. | Per share amounts calculated using the average shares method. |
| 2. | Total return in the above table is historical in nature and represents the rate that the investor would have earned or lost on an investment in the Fund assuming reinvestment of dividends and capital gain distributions, if any. |
| 3. | The ratios of expenses to average net assets and net investment loss to average net assets do not reflect the expenses of the underlying investment companies in which the Fund invests. |
| 4. | Recognition of net investment loss is affected by the timing and declaration of dividends by the underlying investment companies in which the Fund invests. |
| 5. | Amount represents less than $0.01 per share. |
| 6. | Includes adjustments in accordance with accounting principles generally accepted in the United States of America and, consequently, the net asset value for financial reporting purposes and the returns based upon those net asset values may differ from the net asset values and returns for shareholder transactions. |
See accompanying notes to financial statements.
| A N N U A L R E P O R T | June 30, 2023 |
| Eventide Large Cap Focus Fund |
| FINANCIAL HIGHLIGHTS |
| |
Per Share Data and Ratios for a Share of Beneficial Interest Outstanding Throughout the Year Presented
| | | Class N | |
| | | Year Ended | |
| | | June 30, 2023 * | |
| Net asset value, beginning of year | | $ | 10.00 | |
| | | | | |
| Activity from investment operations: | | | | |
| Net investment loss 1 | | | (0.01 | ) |
| Net realized and unrealized gain on investments | | | 1.45 | |
| Total from investment operations | | | 1.44 | |
| | | | | |
| Less distributions from: | | | | |
| Return of capital | | | (0.00 | ) 7 |
| Total distributions | | | (0.00 | ) 7 |
| | | | | |
| Net asset value, end of year | | $ | 11.44 | |
| | | | | |
| Total return 2 | | | 14.43 | % |
| | | | | |
| Net assets, at end of year (000s) | | $ | 330 | |
| | | | | |
| Ratio of gross expenses to average net assets before expense reimbursement 3, 4, 5 | | | 2.84 | % |
| Ratio of net expenses to average net assets after expense reimbursement 4, 5 | | | 1.15 | % |
| Ratio of net investment loss to average net assets 4,6 | | | (0.15 | )% |
| Portfolio Turnover Rate | | | 48 | % |
| | | | | |
| * | Eventide Large Cap Focus Fund Class N commenced on June 30, 2022. |
| 1. | Per share amounts calculated using the average shares method. |
| 2. | Total return in the above table is historical in nature and represents the rate that the investor would have earned or lost on an investment in the Fund assuming reinvestment of dividends and capital gain distributions, if any. Had the manager not waived a portion of the Fund’s expenses in certain periods, total returns would have been lower. |
| 3. | Represents the ratio of expenses to average net assets absent fee waivers and/or expense reimbursements by the manager. |
| 4. | The ratios of expenses to average net assets and net investment loss to average net assets do not reflect the expenses of the underlying investment companies in which the Fund invests. |
| 5. | The ratio includes 0.01% for the year ended June 30, 2023 attributed to line of credit fees. |
| 6. | Recognition of net investment loss is affected by the timing and declaration of dividends by the underlying investment companies in which the Fund invests. |
| 7. | Amount represents less than $0.01 per share. |
See accompanying notes to financial statements.
| A N N U A L R E P O R T | June 30, 2023 |
| Eventide Large Cap Focus Fund |
| FINANCIAL HIGHLIGHTS |
| |
Per Share Data and Ratios for a Share of Beneficial Interest Outstanding Throughout the Year Presented
| | | Class A | |
| | | Year Ended | |
| | | June 30, 2023 * | |
| Net asset value, beginning of year | | $ | 10.00 | |
| | | | | |
| Activity from investment operations: | | | | |
| Net investment loss 1 | | | (0.00 | ) 7 |
| Net realized and unrealized gain on investments | | | 1.43 | |
| Total from investment operations | | | 1.43 | |
| | | | | |
| Less distributions from: | | | | |
| Return of capital | | | (0.01 | ) |
| Total distributions | | | (0.01 | ) |
| | | | | |
| Net asset value, end of year | | $ | 11.42 | |
| | | | | |
| Total return 2 | | | 14.26 | % |
| | | | | |
| Net assets, at end of year (000s) | | $ | 190 | |
| | | | | |
| Ratio of gross expenses to average net assets before expense reimbursement 3, 4, 5 | | | 2.89 | % |
| Ratio of net expenses to average net assets after expense reimbursement 4, 5 | | | 1.20 | % |
| Ratio of net investment loss to average net assets 4, 6 | | | (0.25 | )% |
| Portfolio Turnover Rate | | | 48 | % |
| | | | | |
| * | Eventide Large Cap Focus Fund Class N commenced on June 30, 2022. |
| 1. | Per share amounts calculated using the average shares method. |
| 2. | Total return in the above table is historical in nature and represents the rate that the investor would have earned or lost on an investment in the Fund assuming reinvestment of dividends and capital gain distributions, if any and does not reflect the impact of sales charges. Had the manager not waived a portion of the Fund’s expenses in certain periods, total returns would have been lower. |
| 3. | Represents the ratio of expenses to average net assets absent fee waivers and/or expense reimbursements by the manager. |
| 4. | The ratios of expenses to average net assets and net investment loss to average net assets do not reflect the expenses of the underlying investment companies in which the Fund invests. |
| 5. | The ratio includes 0.01% for the year ended June 30, 2023 attributed to line of credit fees. |
| 6. | Recognition of net investment loss is affected by the timing and declaration of dividends by the underlying investment companies in which the Fund invests. |
| 7. | Amount represents less than $0.01 per share. |
See accompanying notes to financial statements.
| A N N U A L R E P O R T | June 30, 2023 |
| Eventide Large Cap Focus Fund |
| FINANCIAL HIGHLIGHTS |
| |
Per Share Data and Ratios for a Share of Beneficial Interest Outstanding Throughout the Year Presented
| | | Class C | |
| | | Year Ended | |
| | | June 30, 2023 * | |
| Net asset value, beginning of year | | $ | 10.00 | |
| | | | | |
| Activity from investment operations: | | | | |
| Net investment loss 1 | | | (0.09 | ) |
| Net realized and unrealized gain on investments | | | 1.45 | |
| Total from investment operations | | | 1.36 | |
| | | | | |
| Net asset value, end of year | | $ | 11.36 | |
| | | | | |
| Total return 2 | | | 13.60 | % |
| | | | | |
| Net assets, at end of year (000s) | | $ | 27 | |
| | | | | |
| Ratio of gross expenses to average net assets before expense reimbursement 3, 4, 5 | | | 3.64 | % |
| Ratio of net expenses to average net assets after expense reimbursement 4, 5 | | | 1.95 | % |
| Ratio of net investment loss to average net assets 4,6 | | | (0.93 | )% |
| Portfolio Turnover Rate | | | 48 | % |
| | | | | |
| * | Eventide Large Cap Focus Fund Class N commenced on June 30, 2022. |
| 1. | Per share amounts calculated using the average shares method. |
| 2. | Total return in the above table is historical in nature and represents the rate that the investor would have earned or lost on an investment in the Fund assuming reinvestment of dividends and capital gain distributions, if any. Had the manager not waived a portion of the Fund’s expenses in certain periods, total returns would have been lower. |
| 3. | Represents the ratio of expenses to average net assets absent fee waivers and/or expense reimbursements/recapture by the manager. |
| 4. | The ratios of expenses to average net assets and net investment loss to average net assets do not reflect the expenses of the underlying investment companies in which the Fund invests. |
| 5. | The ratio includes 0.01% for the year ended June 30, 2023 attributed to line of credit fees. |
| 6. | Recognition of net investment loss is affected by the timing and declaration of dividends by the underlying investment companies in which the Fund invests. |
See accompanying notes to financial statements.
| A N N U A L R E P O R T | June 30, 2023 |
| Eventide Large Cap Focus Fund |
| FINANCIAL HIGHLIGHTS |
| |
Per Share Data and Ratios for a Share of Beneficial Interest Outstanding Throughout the Year Presented
| | | Class I | |
| | | Year Ended | |
| | | June 30, 2023 * | |
| Net asset value, beginning of year | | $ | 10.00 | |
| | | | | |
| Activity from investment operations: | | | | |
| Net investment income 1 | | | 0.01 | |
| Net realized and unrealized gain on investments | | | 1.44 | |
| Total from investment operations | | | 1.45 | |
| | | | | |
| Less distributions from: | | | | |
| Net investment income | | | (0.00 | ) 7 |
| Return of capital | | | (0.01 | ) |
| Total distributions | | | (0.01 | ) |
| | | | | |
| Net asset value, end of year | | $ | 11.44 | |
| | | | | |
| Total return 2 | | | 14.55 | % |
| | | | | |
| Net assets, at end of year (000s) | | $ | 12,808 | |
| | | | | |
| Ratio of gross expenses to average net assets before expense reimbursement 3, 4, 5 | | | 2.64 | % |
| Ratio of net expenses to average net assets after expense reimbursement 4, 5 | | | 0.95 | % |
| Ratio of net investment income to average net assets 4,6 | | | 0.08 | % |
| Portfolio Turnover Rate | | | 48 | % |
| | | | | |
| * | Eventide Large Cap Focus Fund Class N commenced on June 30, 2022. |
| 1. | Per share amounts calculated using the average shares method. |
| 2. | Total return in the above table is historical in nature and represents the rate that the investor would have earned or lost on an investment in the Fund assuming reinvestment of dividends and capital gain distributions, if any. Had the manager not waived a portion of the Fund’s expenses in certain periods, total returns would have been lower. |
| 3. | Represents the ratio of expenses to average net assets absent fee waivers and/or expense reimbursements by the manager. |
| 4. | The ratios of expenses to average net assets and net investment income to average net assets do not reflect the expenses of the underlying investment companies in which the Fund invests. |
| 5. | The ratio includes 0.01% for the year ended June 30, 2023 attributed to line of credit fees. |
| 6. | Recognition of net investment income is affected by the timing and declaration of dividends by the underlying investment companies in which the Fund invests. |
| 7. | Amount represents less than $0.01 per share. |
See accompanying notes to financial statements.
| A N N U A L R E P O R T | June 30, 2023 |
| Eventide Limited-Term Bond Fund |
| FINANCIAL HIGHLIGHTS |
| |
Per Share Data and Ratios for a Share of Beneficial Interest Outstanding Throughout Each of the Years or Period Presented
| | | Class N | |
| | | Year Ended | | | Year Ended | | | Year Ended | | | Year Ended | | | Period Ended | |
| | | June 30, 2023 | | | June 30, 2022 | | | June 30, 2021 | | | June 30, 2020 | | | June 30, 2019 * | |
| Net asset value, beginning of year/period | | $ | 9.72 | | | $ | 10.49 | | | $ | 10.62 | | | $ | 10.38 | | | $ | 10.03 | |
| Activity from investment operations: | | | | | | | | | | | | | | | | | | | | |
| Net investment income 1 | | | 0.16 | | | | 0.04 | | | | 0.06 | | | | 0.15 | | | | 0.12 | |
| Net realized and unrealized gain (loss) on investments | | | (0.04 | ) | | | (0.69 | ) | | | (0.01 | ) | | | 0.30 | | | | 0.34 | |
| Total from investment operations | | | 0.12 | | | | (0.65 | ) | | | 0.05 | | | | 0.45 | | | | 0.46 | |
| | | | | | | | | | | | | | | | | | | | | |
| Less distributions from: | | | | | | | | | | | | | | | | | | | | |
| Net investment income | | | (0.16 | ) | | | (0.07 | ) | | | (0.07 | ) | | | (0.19 | ) | | | (0.11 | ) |
| Net realized gains | | | — | | | | — | | | | (0.07 | ) | | | — | | | | — | |
| Return of capital | | | (0.00 | ) 5 | | | (0.05 | ) | | | (0.04 | ) | | | (0.02 | ) | | | — | |
| Total distributions | | | (0.16 | ) | | | (0.12 | ) | | | (0.18 | ) | | | (0.21 | ) | | | (0.11 | ) |
| | | | | | | | | | | | | | | | | | | | | |
| Net asset value, end of year/period | | $ | 9.68 | | | $ | 9.72 | | | $ | 10.49 | | | $ | 10.62 | | | $ | 10.38 | |
| | | | | | | | | | | | | | | | | | | | | |
| Total return 2 | | | 1.29 | % | | | (6.26 | )% | | | 0.48 | % | | | 4.37 | % | | | 4.64 | % 6 |
| | | | | | | | | | | | | | | | | | | | | |
| Net assets, at end of year/period (000s) | | $ | 17,698 | | | $ | 5,622 | | | $ | 6,906 | | | $ | 37,973 | | | $ | 1,680 | |
| | | | | | | | | | | | | | | | | | | | | |
| Ratio of gross expenses to average net assets before expense reimbursement 3 | | | 0.91 | % | | | 0.84 | % | | | 0.86 | % | | | 1.11 | % | | | 2.41 | % 7 |
| Ratio of net expenses to average net assets after expense reimbursement | | | 0.75 | % | | | 0.75 | % | | | 0.75 | % | | | 0.75 | % | | | 0.98 | % 7 |
| Ratio of net investment income to average net assets 4 | | | 1.66 | % | | | 0.42 | % | | | 0.54 | % | | | 1.44 | % | | | 2.20 | % 7 |
| Portfolio Turnover Rate | | | 34 | % | | | 48 | % | | | 72 | % | | | 71 | % | | | 60 | % 6 |
| | | | | | | | | | | | | | | | | | | | | |
| * | Eventide Limited-Term Bond Fund Class N commenced on December 14, 2018. |
| 1. | Per share amounts calculated using the average shares method. |
| 2. | Total return in the above table is historical in nature and represents the rate that the investor would have earned or lost on an investment in the Fund assuming reinvestment of dividends and capital gain distributions, if any. Had the manager not waived a portion of the Fund’s expenses in certain periods, total returns would have been lower. |
| 3. | Represents the ratio of expenses to average net assets absent fee waivers and/or expense reimbursements by the manager. |
| 4. | Recognition of net investment income is affected by the timing and declaration of dividends by the underlying investment companies in which the Fund invests. |
| 5. | Amount represents less than $0.01 per share. |
See accompanying notes to financial statements.
| A N N U A L R E P O R T | June 30, 2023 |
| Eventide Limited-Term Bond Fund |
| FINANCIAL HIGHLIGHTS |
| |
Per Share Data and Ratios for a Share of Beneficial Interest Outstanding Throughout Each of the Years or Period Presented
| | | Class A | |
| | | Year | | | Year | | | Year | | | Year | | | Period | | | Year | |
| | | Ended | | | Ended | | | Ended | | | Ended | | | Ended | | | Ended | |
| | | June 30, | | | June 30, | | | June 30, | | | June 30, | | | June 30, | | | October 31, | |
| | | 2023 | | | 2022 | | | 2021 | | | 2020 | | | 2019* | | | 2018 | |
| Net asset value, beginning of year/period | | $ | 9.75 | | | $ | 10.51 | | | $ | 10.65 | | | $ | 10.41 | | | $ | 10.06 | | | $ | 10.44 | |
| Activity from investment operations: | | | | | | | | | | | | | | | | | | | | | | | | |
| Net investment income 1 | | | 0.14 | | | | 0.04 | | | | 0.03 | | | | 0.17 | | | | 0.14 | | | | 0.19 | |
| Net realized and unrealized gain (loss) on investments | | | (0.03 | ) | | | (0.69 | ) | | | 0.01 | 5 | | | 0.27 | | | | 0.37 | | | | (0.35 | ) |
| Total from investment operations | | | 0.11 | | | | (0.65 | ) | | | 0.04 | | | | 0.44 | | | | 0.51 | | | | (0.16 | ) |
| | | | | | | | | | | | | | | | | | | | | | | | | |
| Less distributions from: | | | | | | | | | | | | | | | | | | | | | | | | |
| Net investment income | | | (0.16 | ) | | | (0.06 | ) | | | (0.07 | ) | | | (0.18 | ) | | | (0.16 | ) | | | (0.20 | ) |
| Net realized gains | | | — | | | | — | | | | (0.07 | ) | | | — | | | | — | | | | (0.02 | ) |
| Return of capital | | | (0.00 | ) 6 | | | (0.05 | ) | | | (0.04 | ) | | | (0.02 | ) | | | — | | | | — | |
| Total distributions | | | (0.16 | ) | | | (0.11 | ) | | | (0.18 | ) | | | (0.20 | ) | | | (0.16 | ) | | | (0.22 | ) |
| | | | | | | | | | | | | | | | | | | | | | | | | |
| Paid-in-capital from redemption fees 1 | | | — | | | | — | | | | — | | | | — | | | | — | | | | 0.00 | 6 |
| | | | | | | | | | | | | | | | | | | | | | | | | |
| Net asset value, end of year/period | | $ | 9.70 | | | $ | 9.75 | | | $ | 10.51 | | | $ | 10.65 | | | $ | 10.41 | | | $ | 10.06 | |
| | | | | | | | | | | | | | | | | | | | | | | | | |
| Total return 2 | | | 1.14 | % | | | (6.20 | )% | | | 0.45 | % | | | 4.30 | % | | | 5.08 | % 7 | | | (1.52 | )% |
| | | | | | | | | | | | | | | | | | | | | | | | | |
| Net assets, at end of year/period (000s) | | $ | 19,390 | | | $ | 22,210 | | | $ | 29,596 | | | $ | 12,873 | | | $ | 13,977 | | | $ | 17,191 | |
| | | | | | | | | | | | | | | | | | | | | | | | | |
| Ratio of gross expenses to average net assets before expense reimbursement 3 | | | 0.96 | % | | | 0.89 | % | | | 0.91 | % | | | 1.16 | % | | | 2.09 | % 8 | | | 1.62 | % |
| Ratio of net expenses to average net assets after expense reimbursement | | | 0.80 | % | | | 0.80 | % | | | 0.80 | % | | | 0.80 | % | | | 1.08 | % 8 | | | 1.25 | % |
| Ratio of net investment income to average net assets 4 | | | 1.47 | % | | | 0.37 | % | | | 0.27 | % | | | 1.63 | % | | | 2.05 | % 8 | | | 1.89 | % |
| Portfolio Turnover Rate | | | 34 | % | | | 48 | % | | | 72 | % | | | 71 | % | | | 60 | % 7 | | | 27 | % |
| | | | | | | | | | | | | | | | | | | | | | | | | |
| * | Represents the period November 1, 2018 through June 30, 2019. See Note 1. |
| 1. | Per share amounts calculated using the average shares method. |
| 2. | Total return in the above table is historical in nature and represents the rate that the investor would have earned or lost on an investment in the Fund assuming reinvestment of dividends and capital gain distributions, if any and does not reflect the impact of sales charges. Had the manager not waived a portion of the Fund’s expenses in certain periods, total returns would have been lower. |
| 3. | Represents the ratio of expenses to average net assets absent fee waivers and/or expense reimbursements by the manager. |
| 4. | Recognition of net investment income is affected by the timing and declaration of dividends by the underlying investment companies in which the Fund invests. |
| 5. | Due to the timing of shareholder transactions, and allocations of expenses among share classes, the per unit amounts presented may not coincide with the aggregate presentation on the Statements of Operations. |
| 6. | Amount represents less than $0.01 per share. |
See accompanying notes to financial statements.
| A N N U A L R E P O R T | June 30, 2023 |
| Eventide Limited-Term Bond Fund |
| FINANCIAL HIGHLIGHTS |
| |
Per Share Data and Ratios for a Share of Beneficial Interest Outstanding Throughout Each of the Years or Period Presented
| | | Class C | |
| | | Year Ended | | | Year Ended | | | Year Ended | | | Year Ended | | | Period Ended | |
| | | June 30, 2023 | | | June 30, 2022 | | | June 30, 2021 | | | June 30, 2020 | | | June 30, 2019 * | |
| Net asset value, beginning of year/period | | $ | 9.68 | | | $ | 10.44 | | | $ | 10.60 | | | $ | 10.37 | | | $ | 10.03 | |
| Activity from investment operations: | | | | | | | | | | | | | | | | | | | | |
| Net investment income (loss) 1 | | | 0.07 | | | | (0.04 | ) | | | (0.05 | ) | | | (0.01 | ) | | | 0.07 | |
| Net realized and unrealized gain (loss) on investments | | | (0.02 | ) | | | (0.68 | ) | | | 0.01 | 5 | | | 0.37 | | | | 0.35 | |
| Total from investment operations | | | 0.05 | | | | (0.72 | ) | | | (0.04 | ) | | | 0.36 | | | | 0.42 | |
| | | | | | | | | | | | | | | | | | | | | |
| Less distributions from: | | | | | | | | | | | | | | | | | | | | |
| Net investment income | | | (0.09 | ) | | | (0.02 | ) | | | (0.01 | ) | | | (0.10 | ) | | | (0.08 | ) |
| Net realized gains | | | — | | | | — | | | | (0.07 | ) | | | — | | | | — | |
| Return of capital | | | (0.00 | ) 6 | | | (0.02 | ) | | | (0.04 | ) | | | (0.03 | ) | | | — | |
| Total distributions | | | (0.09 | ) | | | (0.04 | ) | | | (0.12 | ) | | | (0.13 | ) | | | (0.08 | ) |
| | | | | | | | | | | | | | | | | | | | | |
| Net asset value, end of year/period | | $ | 9.64 | | | $ | 9.68 | | | $ | 10.44 | | | $ | 10.60 | | | $ | 10.37 | |
| | | | | | | | | | | | | | | | | | | | | |
| Total return 2 | | | 0.49 | % | | | (6.94 | )% | | | (0.38 | )% | | | 3.50 | % | | | 4.24 | % 7 |
| | | | | | | | | | | | | | | | | | | | | |
| Net assets, at end of year/period (000s) | | $ | 1,618 | | | $ | 1,678 | | | $ | 1,545 | | | $ | 401 | | | $ | 72 | |
| | | | | | | | | | | | | | | | | | | | | |
| Ratio of gross expenses to average net assets before expense reimbursement 3 | | | 1.71 | % | | | 1.64 | % | | | 1.66 | % | | | 1.91 | % | | | 3.21 | % 8 |
| Ratio of net expenses to average net assets after expense reimbursement | | | 1.55 | % | | | 1.55 | % | | | 1.55 | % | | | 1.55 | % | | | 1.78 | % 8 |
| Ratio of net investment income (loss) to average net assets 4 | | | 0.74 | % | | | (0.37 | )% | | | (0.50 | )% | | | (0.08 | )% | | | 1.45 | % 8 |
| Portfolio Turnover Rate | | | 34 | % | | | 48 | % | | | 72 | % | | | 71 | % | | | 60 | % 7 |
| | | | | | | | | | | | | | | | | | | | | |
| * | Eventide Limited-Term Bond Fund Class C commenced on December 14, 2018. |
| 1. | Per share amounts calculated using the average shares method. |
| 2. | Total return in the above table is historical in nature and represents the rate that the investor would have earned or lost on an investment in the Fund assuming reinvestment of dividends and capital gain distributions, if any. Had the manager not waived a portion of the Fund’s expenses in certain periods, total returns would have been lower. |
| 3. | Represents the ratio of expenses to average net assets absent fee waivers and/or expense reimbursements/recapture by the manager. |
| 4. | Recognition of net investment income (loss) is affected by the timing and declaration of dividends by the underlying investment companies in which the Fund invests. |
| 5. | Due to the timing of shareholder transactions, and allocations of expenses among share classes, the per unit amounts presented may not coincide with the aggregate presentation on the Statements of Operations. |
| 6. | Amount represents less than $0.01 per share. |
See accompanying notes to financial statements.
| A N N U A L R E P O R T | June 30, 2023 |
| Eventide Limited-Term Bond Fund |
| FINANCIAL HIGHLIGHTS |
| |
Per Share Data and Ratios for a Share of Beneficial Interest Outstanding Throughout Each of the Years or Period Presented
| | | Class I | |
| | | Year | | | Year | | | Year | | | Year | | | Period | | | Year | |
| | | Ended | | | Ended | | | Ended | | | Ended | | | Ended | | | Ended | |
| | | June 30, | | | June 30, | | | June 30, | | | June 30, | | | June 30, | | | October 31, | |
| | | 2023 | | | 2022 | | | 2021 | | | 2020 | | | 2019* | | | 2018 | |
| Net asset value, beginning of year/period | | $ | 9.97 | | | $ | 10.75 | | | $ | 10.89 | | | $ | 10.64 | | | $ | 10.27 | | | $ | 10.63 | |
| Activity from investment operations: | | | | | | | | | | | | | | | | | | | | | | | | |
| Net investment income 1 | | | 0.16 | | | | 0.07 | | | | 0.05 | | | | 0.17 | | | | 0.16 | | | | 0.22 | |
| Net realized and unrealized gain (loss) on investments | | | (0.02 | ) | | | (0.71 | ) | | | 0.01 | 5 | | | 0.31 | | | | 0.38 | | | | (0.36 | ) |
| Total from investment operations | | | 0.14 | | | | (0.64 | ) | | | 0.06 | | | | 0.48 | | | | 0.54 | | | | (0.14 | ) |
| | | | | | | | | | | | | | | | | | | | | | | | | |
| Less distributions from: | | | | | | | | | | | | | | | | | | | | | | | | |
| Net investment income | | | (0.18 | ) | | | (0.08 | ) | | | (0.09 | ) | | | (0.21 | ) | | | (0.17 | ) | | | (0.20 | ) |
| Net realized gains | | | — | | | | — | | | | (0.07 | ) | | | — | | | | — | | | | (0.02 | ) |
| Return of capital | | | (0.00 | ) 6 | | | (0.06 | ) | | | (0.04 | ) | | | (0.02 | ) | | | — | | | | — | |
| Total distributions | | | (0.18 | ) | | | (0.14 | ) | | | (0.20 | ) | | | (0.23 | ) | | | (0.17 | ) | | | (0.22 | ) |
| | | | | | | | | | | | | | | | | | | | | | | | | |
| Paid-in-capital from redemption fees 1 | | | — | | | | — | | | | — | | | | — | | | | — | | | | (0.00 | ) 6 |
| | | | | | | | | | | | | | | | | | | | | | | | | |
| Net asset value, end of year/period | | $ | 9.93 | | | $ | 9.97 | | | $ | 10.75 | | | $ | 10.89 | | | $ | 10.64 | | | $ | 10.27 | |
| | | | | | | | | | | | | | | | | | | | | | | | | |
| Total return 2 | | | 1.46 | % | | | (6.02 | )% | | | 0.65 | % | | | 4.58 | % | | | 5.30 | % 7 | | | (1.31 | )% |
| | | | | | | | | | | | | | | | | | | | | | | | | |
| Net assets, at end of year/period (000s) | | $ | 88,666 | | | $ | 152,546 | | | $ | 144,089 | | | $ | 28,847 | | | $ | 3,230 | | | $ | 1,030 | |
| | | | | | | | | | | | | | | | | | | | | | | | | |
| Ratio of gross expenses to average net assets before expense reimbursement 3 | | | 0.71 | % | | | 0.64 | % | | | 0.66 | % | | | 0.91 | % | | | 1.97 | % 8 | | | 1.38 | % |
| Ratio of net expenses to average net assets after expense reimbursement | | | 0.55 | % | | | 0.55 | % | | | 0.55 | % | | | 0.55 | % | | | 0.81 | % 8 | | | 1.00 | % |
| Ratio of net investment income to average net assets 4 | | | 1.68 | % | | | 0.64 | % | | | 0.49 | % | | | 1.58 | % | | | 2.30 | % 8 | | | 2.10 | % |
| Portfolio Turnover Rate | | | 34 | % | | | 48 | % | | | 72 | % | | | 71 | % | | | 60 | % 7 | | | 27 | % |
| | | | | | | | | | | | | | | | | | | | | | | | | |
| * | Represents the period November 1, 2018 through June 30, 2019. See Note 1. |
| 1. | Per share amounts calculated using the average shares method. |
| 2. | Total return in the above table is historical in nature and represents the rate that the investor would have earned or lost on an investment in the Fund assuming reinvestment of dividends and capital gain distributions, if any. Had the manager not waived a portion of the Fund’s expenses in certain periods, total returns would have been lower. |
| 3. | Represents the ratio of expenses to average net assets absent fee waivers and/or expense reimbursements by the manager. |
| 4. | Recognition of net investment income is affected by the timing and declaration of dividends by the underlying investment companies in which the Fund invests. |
| 5. | Due to the timing of shareholder transactions, and allocations of expenses among share classes, the per unit amounts presented may not coincide with the aggregate presentation on the Statements of Operations. |
| 6. | Amount represents less than $0.01 per share. |
See accompanying notes to financial statements.
| A N N U A L R E P O R T | June 30, 2023 |
| Eventide Multi-Asset Income Fund |
| FINANCIAL HIGHLIGHTS |
| |
Per Share Data and Ratios for a Share of Beneficial Interest Outstanding Throughout Each of the Years Presented
| | | Class N | |
| | | Year Ended | | | Year Ended | | | Year Ended | | | Year Ended | | | Year Ended | |
| | | June 30, 2023 | | | June 30, 2022 | | | June 30, 2021 | | | June 30, 2020 | | | June 30, 2019 | |
| Net asset value, beginning of year | | $ | 12.12 | | | $ | 14.21 | | | $ | 11.38 | | | $ | 10.90 | | | $ | 10.58 | |
| Activity from investment operations: | | | | | | | | | | | | | | | | | | | | |
| Net investment income 1 | | | 0.16 | | | | 0.10 | | | | 0.08 | | | | 0.16 | | | | 0.28 | |
| Net realized and unrealized gain (loss) on investments | | | 0.47 | | | | (1.35 | ) | | | 2.95 | | | | 0.60 | | | | 0.39 | |
| Total from investment operations | | | 0.63 | | | | (1.25 | ) | | | 3.03 | | | | 0.76 | | | | 0.67 | |
| | | | | | | | | | | | | | | | | | | | | |
| Less distributions from: | | | | | | | | | | | | | | | | | | | | |
| Net investment income | | | (0.15 | ) | | | (0.21 | ) | | | (0.18 | ) | | | (0.14 | ) | | | (0.22 | ) |
| Net realized gains | | | (0.12 | ) | | | (0.63 | ) | | | (0.02 | ) | | | — | | | | (0.03 | ) |
| Return of capital | | | (0.04 | ) | | | — | | | | — | | | | (0.14 | ) | | | (0.10 | ) |
| Total distributions | | | (0.31 | ) | | | (0.84 | ) | | | (0.20 | ) | | | (0.28 | ) | | | (0.35 | ) |
| | | | | | | | | | | | | | | | | | | | | |
| Net asset value, end of year | | $ | 12.44 | | | $ | 12.12 | | | $ | 14.21 | | | $ | 11.38 | | | $ | 10.90 | |
| | | | | | | | | | | | | | | | | | | | | |
| Total return 2 | | | 5.35 | % | | | (9.58 | )% | | | 26.81 | % | | | 7.03 | % | | | 6.61 | % |
| | | | | | | | | | | | | | | | | | | | | |
| Net assets, at end of year (000s) | | $ | 30,618 | | | $ | 34,856 | | | $ | 39,947 | | | $ | 19,454 | | | $ | 17,104 | |
| | | | | | | | | | | | | | | | | | | | | |
| Ratio of gross expenses to average net assets before expense reimbursement/recapture 3, 4 | | | 1.10 | % | | | 1.01 | % | | | 1.05 | % | | | 1.19 | % | | | 1.30 | % |
| Ratio of net expenses to average net assets after expense reimbursement/recapture 4 | | | 1.02 | % | | | 1.02 | % | | | 1.02 | % | | | 1.10 | % | | | 1.15 | % |
| Ratio of net investment income to average net assets 4, 5 | | | 1.34 | % | | | 0.69 | % | | | 0.59 | % | | | 1.44 | % | | | 2.71 | % |
| Portfolio Turnover Rate | | | 48 | % | | | 66 | % | | | 73 | % | | | 107 | % | | | 79 | % |
| | | | | | | | | | | | | | | | | | | | | |
| 1. | Per share amounts calculated using the average shares method. |
| 2. | Total return in the above table is historical in nature and represents the rate that the investor would have earned or lost on an investment in the Fund assuming reinvestment of dividends and capital gain distributions, if any. Had the manager not waived a portion of the Fund’s expenses in certain periods, total returns would have been lower. |
| 3. | Represents the ratio of expenses to average net assets absent fee waivers and/or expense reimbursements/recapture by the manager. |
| 4. | The ratios of expenses to average net assets and net investment income to average net assets do not reflect the expenses of the underlying investment companies in which the Fund invests. |
| 5. | Recognition of net investment income is affected by the timing and declaration of dividends by the underlying investment companies in which the Fund invests. |
See accompanying notes to financial statements.
| A N N U A L R E P O R T | June 30, 2023 |
| Eventide Multi-Asset Income Fund |
| FINANCIAL HIGHLIGHTS |
| |
Per Share Data and Ratios for a Share of Beneficial Interest Outstanding Throughout Each of the Years Presented
| | | Class A | |
| | | Year Ended | | | Year Ended | | | Year Ended | | | Year Ended | | | Year Ended | |
| | | June 30, 2023 | | | June 30, 2022 | | | June 30, 2021 | | | June 30, 2020 | | | June 30, 2019 | |
| Net asset value, beginning of year | | $ | 12.14 | | | $ | 14.22 | | | $ | 11.38 | | | $ | 10.89 | | | $ | 10.57 | |
| Activity from investment operations: | | | | | | | | | | | | | | | | | | | | |
| Net investment income 1 | | | 0.16 | | | | 0.09 | | | | 0.07 | | | | 0.15 | | | | 0.28 | |
| Net realized and unrealized gain (loss) on investments | | | 0.47 | | | | (1.33 | ) | | | 2.96 | | | | 0.61 | | | | 0.39 | |
| Total from investment operations | | | 0.63 | | | | (1.24 | ) | | | 3.03 | | | | 0.76 | | | | 0.67 | |
| | | | | | | | | | | | | | | | | | | | | |
| Less distributions from: | | | | | | | | | | | | | | | | | | | | |
| Net investment income | | | (0.15 | ) | | | (0.21 | ) | | | (0.17 | ) | | | (0.13 | ) | | | (0.22 | ) |
| Net realized gains | | | (0.12 | ) | | | (0.63 | ) | | | (0.02 | ) | | | — | | | | (0.03 | ) |
| Return of capital | | | (0.04 | ) | | | — | | | | — | | | | (0.14 | ) | | | (0.10 | ) |
| Total distributions | | | (0.31 | ) | | | (0.84 | ) | | | (0.19 | ) | | | (0.27 | ) | | | (0.35 | ) |
| | | | | | | | | | | | | | | | | | | | | |
| Net asset value, end of year | | $ | 12.46 | | | $ | 12.14 | | | $ | 14.22 | | | $ | 11.38 | | | $ | 10.89 | |
| | | | | | | | | | | | | | | | | | | | | |
| Total return 2 | | | 5.29 | % | | | (9.55 | )% | | | 26.84 | % | | | 7.07 | % | | | 6.56 | % |
| | | | | | | | | | | | | | | | | | | | | |
| Net assets, at end of year (000s) | | $ | 25,577 | | | $ | 25,744 | | | $ | 23,139 | | | $ | 10,659 | | | $ | 8,817 | |
| | | | | | | | | | | | | | | | | | | | | |
| Ratio of gross expenses to average net assets before expense reimbursement/recapture 3, 4 | | | 1.15 | % | | | 1.06 | % | | | 1.10 | % | | | 1.24 | % | | | 1.35 | % |
| Ratio of net expenses to average net assets after expense reimbursement/recapture 4 | | | 1.07 | % | | | 1.07 | % | | | 1.07 | % | | | 1.15 | % | | | 1.20 | % |
| Ratio of net investment income to average net assets 4, 5 | | | 1.32 | % | | | 0.65 | % | | | 0.55 | % | | | 1.39 | % | | | 2.63 | % |
| Portfolio Turnover Rate | | | 48 | % | | | 66 | % | | | 73 | % | | | 107 | % | | | 79 | % |
| | | | | | | | | | | | | | | | | | | | | |
| 1. | Per share amounts calculated using the average shares method. |
| 2. | Total return in the above table is historical in nature and represents the rate that the investor would have earned or lost on an investment in the Fund assuming reinvestment of dividends and capital gain distributions, if any and does not reflect the impact of sales charges. Had the manager not waived a portion of the Fund’s expenses in certain periods, total returns would have been lower. |
| 3. | Represents the ratio of expenses to average net assets absent fee waivers and/or expense reimbursements/recapture by the manager. |
| 4. | The ratios of expenses to average net assets and net investment income to average net assets do not reflect the expenses of the underlying investment companies in which the Fund invests. |
| 5. | Recognition of net investment income is affected by the timing and declaration of dividends by the underlying investment companies in which the Fund invests. |
See accompanying notes to financial statements.
| A N N U A L R E P O R T | June 30, 2023 |
| Eventide Multi-Asset Income Fund |
| FINANCIAL HIGHLIGHTS |
| |
Per Share Data and Ratios for a Share of Beneficial Interest Outstanding Throughout Each of the Years Presented
| | | Class C | |
| | | Year Ended | | | Year Ended | | | Year Ended | | | Year Ended | | | Year Ended | |
| | | June 30, 2023 | | | June 30, 2022 | | | June 30, 2021 | | | June 30, 2020 | | | June 30, 2019 | |
| Net asset value, beginning of year | | $ | 12.06 | | | $ | 14.15 | | | $ | 11.34 | | | $ | 10.86 | | | $ | 10.55 | |
| Activity from investment operations: | | | | | | | | | | | | | | | | | | | | |
| Net investment income (loss) 1 | | | 0.07 | | | | (0.01 | ) | | | (0.03 | ) | | | 0.07 | | | | 0.20 | |
| Net realized and unrealized gain (loss) on investments | | | 0.47 | | | | (1.35 | ) | | | 2.95 | | | | 0.60 | | | | 0.38 | |
| Total from investment operations | | | 0.54 | | | | (1.36 | ) | | | 2.92 | | | | 0.67 | | | | 0.58 | |
| | | | | | | | | | | | | | | | | | | | | |
| Less distributions from: | | | | | | | | | | | | | | | | | | | | |
| Net investment income | | | (0.06 | ) | | | (0.10 | ) | | | (0.09 | ) | | | (0.09 | ) | | | (0.16 | ) |
| Net realized gains | | | (0.12 | ) | | | (0.63 | ) | | | (0.02 | ) | | | — | | | | (0.03 | ) |
| Return of capital | | | (0.04 | ) | | | — | | | | — | | | | (0.10 | ) | | | (0.08 | ) |
| Total distributions | | | (0.22 | ) | | | (0.73 | ) | | | (0.11 | ) | | | (0.19 | ) | | | (0.27 | ) |
| | | | | | | | | | | | | | | | | | | | | |
| Net asset value, end of year | | $ | 12.38 | | | $ | 12.06 | | | $ | 14.15 | | | $ | 11.34 | | | $ | 10.86 | |
| | | | | | | | | | | | | | | | | | | | | |
| Total return 2 | | | 4.54 | % | | | (10.33 | )% | | | 25.85 | % | | | 6.23 | % | | | 5.73 | % |
| | | | | | | | | | | | | | | | | | | | | |
| Net assets, at end of year (000s) | | $ | 16,181 | | | $ | 18,146 | | | $ | 18,883 | | | $ | 8,091 | | | $ | 6,194 | |
| | | | | | | | | | | | | | | | | | | | | |
| Ratio of gross expenses to average net assets before expense reimbursement/recapture 3, 4 | | | 1.90 | % | | | 1.81 | % | | | 1.85 | % | | | 1.99 | % | | | 2.10 | % |
| Ratio of net expenses to average net assets after expense reimbursement/recapture 4 | | | 1.82 | % | | | 1.82 | % | | | 1.82 | % | | | 1.90 | % | | | 1.95 | % |
| Ratio of net investment income (loss) to average net assets 4, 5 | | | 0.56 | % | | | (0.10 | )% | | | (0.21 | )% | | | 0.64 | % | | | 1.90 | % |
| Portfolio Turnover Rate | | | 48 | % | | | 66 | % | | | 73 | % | | | 107 | % | | | 79 | % |
| | | | | | | | | | | | | | | | | | | | | |
| 1. | Per share amounts calculated using the average shares method. |
| 2. | Total return in the above table is historical in nature and represents the rate that the investor would have earned or lost on an investment in the Fund assuming reinvestment of dividends and capital gain distributions, if any. Had the manager not waived a portion of the Fund’s expenses in certain periods, total returns would have been lower. |
| 3. | Represents the ratio of expenses to average net assets absent fee waivers and/or expense reimbursements/recapture by the manager. |
| 4. | The ratios of expenses to average net assets and net investment income (loss) to average net assets do not reflect the expenses of the underlying investment companies in which the Fund invests. |
| 5. | Recognition of net investment income (loss) is affected by the timing and declaration of dividends by the underlying investment companies in which the Fund invests. |
See accompanying notes to financial statements.
| A N N U A L R E P O R T | June 30, 2023 |
| Eventide Multi-Asset Income Fund |
| FINANCIAL HIGHLIGHTS |
| |
Per Share Data and Ratios for a Share of Beneficial Interest Outstanding Throughout Each of the Years Presented
| | | Class I | |
| | | Year Ended | | | Year Ended | | | Year Ended | | | Year Ended | | | Year Ended | |
| | | June 30, 2023 | | | June 30, 2022 | | | June 30, 2021 | | | June 30, 2020 | | | June 30, 2019 | |
| Net asset value, beginning of year | | $ | 12.12 | | | $ | 14.22 | | | $ | 11.38 | | | $ | 10.90 | | | $ | 10.58 | |
| | | | | | | | | | | | | | | | | | | | | |
| Activity from investment operations: | | | | | | | | | | | | | | | | | | | | |
| Net investment income 1 | | | 0.19 | | | | 0.12 | | | | 0.11 | | | | 0.18 | | | | 0.31 | |
| Net realized and unrealized gain (loss) on investments | | | 0.47 | | | | (1.35 | ) | | | 2.95 | | | | 0.60 | | | | 0.38 | |
| Total from investment operations | | | 0.66 | | | | (1.23 | ) | | | 3.06 | | | | 0.78 | | | | 0.69 | |
| | | | | | | | | | | | | | | | | | | | | |
| Less distributions from: | | | | | | | | | | | | | | | | | | | | |
| Net investment income | | | (0.18 | ) | | | (0.24 | ) | | | (0.20 | ) | | | (0.15 | ) | | | (0.23 | ) |
| Net realized gains | | | (0.12 | ) | | | (0.63 | ) | | | (0.02 | ) | | | — | | | | (0.03 | ) |
| Return of capital | | | (0.04 | ) | | | — | | | | — | | | | (0.15 | ) | | | (0.11 | ) |
| Total distributions | | | (0.34 | ) | | | (0.87 | ) | | | (0.22 | ) | | | (0.30 | ) | | | (0.37 | ) |
| | | | | | | | | | | | | | | | | | | | | |
| Net asset value, end of year | | $ | 12.44 | | | $ | 12.12 | | | $ | 14.22 | | | $ | 11.38 | | | $ | 10.90 | |
| | | | | | | | | | | | | | | | | | | | | |
| Total return 2 | | | 5.57 | % | | | (9.46 | )% | | | 27.12 | % | | | 7.23 | % | | | 6.81 | % |
| | | | | | | | | | | | | | | | | | | | | |
| Net assets, at end of year (000s) | | $ | 260,688 | | | $ | 269,421 | | | $ | 279,142 | | | $ | 110,295 | | | $ | 79,513 | |
| | | | | | | | | | | | | | | | | | | | | |
| Ratio of gross expenses to average net assets before expense reimbursement/recapture 3, 4 | | | 0.90 | % | | | 0.81 | % | | | 0.85 | % | | | 0.99 | % | | | 1.10 | % |
| Ratio of net expenses to average net assets after expense reimbursement/recapture 4 | | | 0.82 | % | | | 0.82 | % | | | 0.82 | % | | | 0.90 | % | | | 0.95 | % |
| Ratio of net investment income to average net assets 4, 5 | | | 1.57 | % | | | 0.90 | % | | | 0.81 | % | | | 1.65 | % | | | 2.92 | % |
| Portfolio Turnover Rate | | | 48 | % | | | 66 | % | | | 73 | % | | | 107 | % | | | 79 | % |
| | | | | | | | | | | | | | | | | | | | | |
| 1. | Per share amounts calculated using the average shares method. |
| 2. | Total return in the above table is historical in nature and represents the rate that the investor would have earned or lost on an investment in the Fund assuming reinvestment of dividends and capital gain distributions, if any. Had the manager not waived a portion of the Fund’s expenses in certain periods, total returns would have been lower. |
| 3. | Represents the ratio of expenses to average net assets absent fee waivers and/or expense reimbursements/recapture by the manager. |
| 4. | The ratios of expenses to average net assets and net investment income to average net assets do not reflect the expenses of the underlying investment companies in which the Fund invests. |
| 5. | Recognition of net investment income is affected by the timing and declaration of dividends by the underlying investment companies in which the Fund invests. |
See accompanying notes to financial statements.
| A N N U A L R E P O R T | June 30, 2023 |
| Eventide Funds | |
| Notes to Financial Statements | June 30, 2023 |
1. ORGANIZATION AND SIGNIFICANT ACCOUNTING POLICIES
Mutual Fund Series Trust (the “Trust”), was organized as an Ohio business trust on February 27, 2006. The Trust is registered as an open-end management investment company under the Investment Company Act of 1940, as amended (“1940 Act”). The Trust currently consists of thirty-six series. These financial statements include the following series: Eventide Core Bond Fund, Eventide Dividend Opportunities Fund, Eventide Exponential Technologies Fund, Eventide Gilead Fund, Eventide Healthcare & Life Sciences Fund, Eventide Large Cap Focus Fund, Eventide Limited-Term Bond Fund and the Eventide Multi-Asset Income Fund (each a “Fund” or collectively the “Funds”). Each Fund except Eventide Exponential Technologies Fund and Eventide Large Cap Focus Fund is a diversified series of the Trust. Eventide Exponential Technologies Fund and Eventide Large Cap Focus Fund are non-diversified series of the Trust. The Funds’ investment manager is Eventide Asset Management, LLC (the “Manager”).
Eventide Core Bond Fund commenced operations on July 31, 2020. The Fund’s investment objective is total return consistent with income generation.
Eventide Dividend Opportunities Fund commenced operations on September 29, 2017. The Fund’s investment objectives are dividend income and long-term capital appreciation. The Fund’s secondary objective is dividend growth.
Eventide Exponential Technologies Fund commenced operations on June 30, 2020. The Fund’s investment objective is long-term capital appreciation.
Eventide Gilead Fund commenced operations on July 8, 2008. The Fund’s investment objective is long-term capital appreciation.
Eventide Healthcare & Life Sciences Fund commenced operations on December 27, 2012. The Fund’s investment objective is long-term capital appreciation.
Eventide Large Cap Focus Fund commenced operations on June 30, 2022. The Fund’s investment objective is long-term capital appreciation.
Eventide Limited-Term Bond Fund (formerly Epiphany FFV Strategic Income Fund) Class A and Class I shares commenced operations on July 28, 2010. On March 29, 2017, the Board of Trustees of Epiphany Funds voted to reclassify (the “Conversion”) all outstanding Class C Shares of the Epiphany FFV Strategic Income Fund to Class I shares to be effective on May 30, 2017 (the “Conversion Date”). On the Conversion Date, each Class C share was reclassified as a Class I shares equal in value to the Class C shares owned by that shareholder. The Eventide Limited-Term Bond Fund’s Class N and Class C shares commenced operations December 14, 2018. The Fund changed its fiscal year end from October 31 to June 30. The Fund’s investment objective is income.
| A N N U A L R E P O R T | June 30, 2023 |
Eventide Multi-Asset Income Fund commenced operations on July 15, 2015. The Fund’s investment objective is current income while maintaining the potential for capital appreciation.
Each Fund offers four classes of shares, Class N, Class A, Class C and Class I. Each class differs as to sales and redemption charges and ongoing fees.
The following is a summary of significant accounting policies consistently followed by the Funds and are in accordance with accounting principles generally accepted in the United States of America (“GAAP”). The Funds are investment companies and accordingly follow the investment company accounting and reporting guidance of the Financial Accounting Standards Board (FASB) Accounting Standards Codification Topic 946 “Financial Services – Investment Companies” including Accounting Standards Update 2013-08.
a) Securities Valuation - Securities listed on an exchange are valued at the last reported sale price at the close of the regular trading session of the exchange on the business day the value is being determined, or in the case of securities listed on NASDAQ, at the NASDAQ Official Closing Price (“NOCP”). In the absence of a sale, such securities shall be valued at the last bid price on the day of valuation. Debt securities (other than short-term obligations) are valued each day by an independent pricing service approved by the Board of Trustees (the “Board”) using methods which include current market quotations from a major market maker in the securities and based on methods which include the consideration of yields or prices of securities of comparable quality, coupon, maturity and type. The Funds may invest in portfolios of open-end or closed-end investment companies (the “underlying funds”). Open-end investment companies are valued at their respective net asset values as reported by such investment companies. The underlying funds value securities in their portfolios for which market quotations are readily available at their market values (generally the last reported sale price) and all other securities and assets at their fair value by the methods established by the boards of trustees of the underlying funds. The shares of many closed-end investment companies, after their initial public offering, frequently trade at a price per share, which is different than the net asset value per share. The difference represents a market premium or market discount of such shares. There can be no assurances that the market discount or market premium on shares of any closed-end investment company purchased by the Funds will not change. The independent pricing service does not distinguish between smaller-sized bond positions known as “odd lots” and larger institutional-sized bond positions known as “round lots”. The Funds may fair value a particular bond if the manager does not believe that the round lot value provided by the independent pricing service reflects fair value of the Fund’s holding. Short term debt obligations having 60 days or less remaining until maturity, at time of purchase, may be valued at amortized cost, provided each such valuations represent fair value. Options are valued at their closing price on the exchange they are traded on. When no closing price is available, options are valued at their mean price.
The Fund may hold securities, such as private investments, interests in commodity pools, other non-traded securities or temporarily illiquid securities, for which market quotations are not readily available or are determined to be unreliable. These securities are valued using the “fair value” procedures approved by the Board. The Board has designated the adviser as its valuation designee (the “Valuation Designee”) to execute these procedures. The Board may also enlist third party consultants such a valuation specialist at a public accounting firm, valuation consultant or financial officer of a security issuer on an as-needed basis to assist the Valuation Designee in determining a security-specific fair value. The Board is responsible for reviewing and approving fair value methodologies utilized by the Valuation Designee, approval of which shall be based upon whether the Valuation Designee followed the valuation procedures established by the Board.
| A N N U A L R E P O R T | June 30, 2023 |
The Funds utilize various methods to measure the fair value of most of their investments on a recurring basis. GAAP establishes a hierarchy that prioritizes inputs to valuation methods. The three levels of input are:
| ■ | Level 1 – Unadjusted quoted prices in active markets for identical assets and liabilities that the Funds have the ability to access. |
| ■ | Level 2 – Observable inputs other than quoted prices included in Level 1 that are observable for the asset or liability, either directly or indirectly. These inputs may include quoted prices for the identical instrument in an inactive market, prices for similar instruments, interest rates, prepayment speeds, credit risk, yield curves, default rates and similar data. |
| ■ | Level 3 – Unobservable inputs for the asset or liability, to the extent relevant observable inputs are not available, representing the Funds’ own assumptions about the assumptions a market participant would use in valuing the asset or liability, and would be based on the best information available. |
The availability of observable inputs can vary from security to security and is affected by a wide variety of factors, including, for example, the type of security, whether the security is new and not yet established in the marketplace, the liquidity of markets, and other characteristics particular to the security. To the extent that valuation is based on models or inputs that are less observable or unobservable in the market, the determination of fair value requires more judgment. Accordingly, the degree of judgment exercised in determining fair value is greatest for instruments categorized in Level 3.
The inputs used to measure fair value may fall into different levels of the fair value hierarchy. In such cases, for disclosure purposes, the level in the fair value hierarchy within which the fair value measurement falls in its entirety, is determined based on the lowest level input that is significant to the fair value measurement in its entirety.
The inputs or methodology used for valuing securities are not necessarily an indication of the risk associated with investing in those securities. The following tables summarize the inputs used as of June 30, 2023 for the Funds’ assets measured at fair value:
| Eventide Core Bond Fund Assets | | | | | | | | | | | | |
| | | | | | | | | | | | | |
| Security Classifications | | Level 1 | | | Level 2 | | | Level 3 | | | Totals | |
| Asset Backed Securities 1 | | $ | — | | | $ | 3,499,530 | | | $ | — | | | $ | 3,499,530 | |
| Corporate Bonds 1 | | | — | | | | 36,467,527 | | | | — | | | | 36,467,527 | |
| Municipal Bonds 1 | | | — | | | | 5,629,219 | | | | — | | | | 5,629,219 | |
| U.S. Government & Agencies 1 | | | — | | | | 30,110,276 | | | | — | | | | 30,110,276 | |
| Short-Term Investments | | | 800,919 | | | | — | | | | — | | | | 800,919 | |
| Total | | $ | 800,919 | | | $ | 75,706,552 | | | $ | — | | | $ | 76,507,471 | |
| | | | | | | | | | | | | | | | | |
| Eventide Dividend Opportunities Fund Assets | | | | | | | | | | | | |
| | | | | | | | | | | | | |
| Security Classifications | | Level 1 | | | Level 2 | | | Level 3 | | | Totals | |
| Common Stocks 1 | | $ | 549,048,339 | | | $ | — | | | $ | — | | | $ | 549,048,339 | |
| Corporate Bonds 1 | | | — | | | | 2,000,300 | | | | 2,000,000 | | | | 4,000,300 | |
| Short-Term Investments | | | 16,028,116 | | | | — | | | | — | | | | 16,028,116 | |
| Total | | $ | 565,076,455 | | | $ | 2,000,300 | | | $ | 2,000,000 | | | $ | 569,076,755 | |
| A N N U A L R E P O R T | June 30, 2023 |
| Eventide Exponential Technologies Fund Assets | | | | | | | | | | | | |
| | | | | | | | | | | | | |
| Security Classifications | | Level 1 | | | Level 2 | | | Level 3 | | | Totals | |
| Common Stocks 1 | | $ | 109,020,870 | | | $ | — | | | $ | — | | | $ | 109,020,870 | |
| Corporate Bonds 1 | | | — | | | | 900,135 | | | | — | | | | 900,135 | |
| Short-Term Investments | | | 5,603,773 | | | | — | | | | — | | | | 5,603,773 | |
| Total | | $ | 114,624,643 | | | $ | 900,135 | | | $ | — | | | $ | 115,524,778 | |
| | | | | | | | | | | | | | | | | |
| Eventide Gilead Fund Assets | | | | | | | | | | | | |
| | | | | | | | | | | | | |
| Security Classifications | | Level 1 | | | Level 2 | | | Level 3 | | | Totals | |
| Common Stocks 1 | | $ | 3,563,625,280 | | | $ | — | | | $ | — | | | $ | 3,563,625,280 | |
| Contingent Value Rights 1 | | | — | | | | — | | | | 3,197,106 | | | | 3,197,106 | |
| Private Investments 1 | | | — | | | | — | | | | 18,653,578 | | | | 18,653,578 | |
| Corporate Bonds 1 | | | — | | | | 24,001,800 | | | | 27,000,000 | | | | 51,001,800 | |
| Warrant 1 | | | — | | | | — | | | | 1,274,958 | | | | 1,274,958 | |
| Short-Term Investments | | | 117,914,178 | | | | — | | | | — | | | | 117,914,178 | |
| Total | | $ | 3,681,539,458 | | | $ | 24,001,800 | | | $ | 50,125,642 | | | $ | 3,755,666,900 | |
| | | | | | | | | | | | | | | | | |
| Eventide Healthcare & Life Sciences Fund Assets | | | | | | | | | | | | |
| | | | | | | | | | | | | |
| Security Classifications | | Level 1 | | | Level 2 | | | Level 3 | | | Totals | |
| Common Stocks 1 | | $ | 1,561,113,632 | | | $ | — | | | $ | — | | | $ | 1,561,113,632 | |
| Contingent Value Rights 1 | | | — | | | | — | | | | 1,227,225 | | | | 1,227,225 | |
| Private Investments 1 | | | — | | | | — | | | | 93,230,465 | | | | 93,230,465 | |
| Convertible Bonds 1 | | | — | | | | — | | | | 2,818,000 | | | | 2,818,000 | |
| Warrants 1 | | | — | | | | — | | | | 708,377 | | | | 708,377 | |
| Short-Term Investments | | | 145,393,844 | | | | — | | | | — | | | | 145,393,844 | |
| Total | | $ | 1,706,507,476 | | | $ | — | | | $ | 97,984,067 | | | $ | 1,804,491,543 | |
| | | | | | | | | | | | | | | | | |
| Eventide Large Cap Focus Fund Assets | | | | | | | | | | | | |
| | | | | | | | | | | | | |
| Security Classifications | | Level 1 | | | Level 2 | | | Level 3 | | | Totals | |
| Common Stocks 1 | | $ | 12,720,019 | | | $ | — | | | $ | — | | | $ | 12,720,019 | |
| Short-Term Investments | | | 876,190 | | | | — | | | | — | | | | 876,190 | |
| Total | | $ | 13,596,209 | | | $ | — | | | $ | — | | | $ | 13,596,209 | |
| | | | | | | | | | | | | | | | | |
| Eventide Limited-Term Bond Fund Assets | | | | | | | | | | | | |
| | | | | | | | | | | | | |
| Security Classifications | | Level 1 | | | Level 2 | | | Level 3 | | | Totals | |
| Asset Backed Securities 1 | | $ | — | | | $ | 7,067,664 | | | $ | — | | | $ | 7,067,664 | |
| Corporate Bonds 1 | | | — | | | | 75,440,137 | | | | — | | | | 75,440,137 | |
| Municipal Bonds 1 | | | — | | | | 9,214,379 | | | | — | | | | 9,214,379 | |
| U.S. Government & Agencies 1 | | | — | | | | 32,630,962 | | | | — | | | | 32,630,962 | |
| Short-Term Investments | | | 1,606,256 | | | | — | | | | — | | | | 1,606,256 | |
| Total | | $ | 1,606,256 | | | $ | 124,353,142 | | | $ | — | | | $ | 125,959,398 | |
| | | | | | | | | | | | | | | | | |
| Eventide Multi-Asset Income Fund Assets | | | | | | | | | | | | |
| | | | | | | | | | | | | |
| Security Classifications | | Level 1 | | | Level 2 | | | Level 3 | | | Totals | |
| Common Stocks 1 | | $ | 157,580,538 | | | $ | — | | | $ | — | | | $ | 157,580,538 | |
| Asset Backed Securities 1 | | | — | | | | 5,259,670 | | | | — | | | | 5,259,670 | |
| Collateralized Mortgage Obligations 1 | | | — | | | | 1,798,563 | | | | — | | | | 1,798,563 | |
| Convertible Bonds 1 | | | — | | | | 3,165,750 | | | | — | | | | 3,165,750 | |
| Corporate Bonds 1 | | | — | | | | 80,425,384 | | | | 3,800,000 | | | | 84,225,384 | |
| Municipal Bonds 1 | | | — | | | | 7,403,408 | | | | — | | | | 7,403,408 | |
| U.S. Government & Agencies 1 | | | — | | | | 67,135,450 | | | | — | | | | 67,135,450 | |
| Short-Term Investments | | | 3,048,471 | | | | — | | | | — | | | | 3,048,471 | |
| Total | | $ | 160,629,009 | | | $ | 165,188,225 | | | $ | 3,800,000 | | | $ | 329,617,234 | |
| 1. | For a detailed break-out of investments by security classification, please refer to the Schedule of Investments. |
| A N N U A L R E P O R T | June 30, 2023 |
The following is a reconciliation of assets in which level 3 inputs were used in determining value:
| Eventide Dividend Opportunities Fund | | Corporate Bonds | | | Total | | | | | | | | | | | | | |
| Beginning balance 6/30/2022 | | $ | 2,000,000 | | | $ | 2,000,000 | | | | | | | | | | | | | |
| Total realized gain (loss) | | | — | | | | — | | | | | | | | | | | | | |
| Change in unrealized appreciation (depreciation) | | | — | | | | — | | | | | | | | | | | | | |
| Cost of purchases | | | — | | | | — | | | | | | | | | | | | | |
| Proceeds from sales | | | — | | | | — | | | | | | | | | | | | | |
| Net transfers in/out of level 3 | | | — | | | | — | | | | | | | | | | | | | |
| Ending balance 6/30/2023 | | $ | 2,000,000 | | | $ | 2,000,000 | | | | | | | | | | | | | |
| | | | | | | | | | | | | | | | | | | | | |
| Eventide Gilead Fund | | Contingent Value
Rights | | | Private Investments | | | Corporate Bonds | | | Warrant | | | Total | |
| Beginning balance 6/30/2022 | | $ | 3,068,855 | | | $ | 32,492,360 | | | $ | 22,000,000 | | | $ | 1,899,799 | | | $ | 59,461,014 | |
| Total realized gain (loss) | | | — | | | | — | | | | — | | | | — | | | | — | |
| Change in unrealized appreciation (depreciation) | | | 128,251 | | | | (13,838,782 | ) | | | — | | | | (624,841 | ) | | | (14,335,372 | ) |
| Cost of purchases | | | — | | | | — | | | | 5,000,000 | | | | — | | | | 5,000,000 | |
| Proceeds from sales | | | — | | | | — | | | | — | | | | — | | | | — | |
| Net transfers in/out of level 3 | | | — | | | | — | | | | — | | | | — | | | | — | |
| Ending balance 6/30/2023 | | $ | 3,197,106 | | | $ | 18,653,578 | | | $ | 27,000,000 | | | $ | 1,274,958 | | | $ | 50,125,642 | |
| | | | | | | | | | | | | | | | | | | | | |
| Eventide Healthcare & Life Sciences Fund | | Contingent Value
Rights | | | Private Investments | | | Convertible Bonds | | | Warrants | | | Total | |
| Beginning balance 6/30/2022 | | $ | 1,177,995 | | | $ | 126,990,296 | | | $ | 795,520 | | | $ | 949,847 | | | $ | 129,913,658 | |
| Total realized gain (loss) | | | — | | | | — | | | | — | | | | — | | | | — | |
| Change in unrealized appreciation (depreciation) | | | 49,230 | | | | (48,898,910 | ) | | | 359,870 | | | | (241,470 | ) | | | (48,731,280 | ) |
| Cost of purchases | | | — | | | | 15,139,079 | | | | 2,500,000 | | | | — | | | | 17,639,079 | |
| Proceeds from sales | | | — | | | | — | | | | | | | | — | | | | — | |
| Corporate Action | | | — | | | | — | | | | (837,390 | ) | | | — | | | | (837,390 | ) |
| Net transfers in/out of level 3 | | | — | | | | — | | | | — | | | | — | | | | — | |
| Ending balance 6/30/2023 | | $ | 1,227,225 | | | $ | 93,230,465 | | | $ | 2,818,000 | | | $ | 708,377 | | | $ | 97,984,067 | |
| | | | | | | | | | | | | | | | | | | | | |
| Eventide Multi-Asset Income Fund | | Corporate Bonds | | | Total | | | | | | | | | | | | | |
| Beginning balance 6/30/2022 | | $ | 3,800,000 | | | $ | 3,800,000 | | | | | | | | | | | | | |
| Total realized gain (loss) | | | — | | | | — | | | | | | | | | | | | | |
| Change in unrealized appreciation (depreciation) | | | — | | | | — | | | | | | | | | | | | | |
| Cost of purchases | | | — | | | | — | | | | | | | | | | | | | |
| Proceeds from sales | | | — | | | | — | | | | | | | | | | | | | |
| Net transfers in/out of level 3 | | | — | | | | — | | | | | | | | | | | | | |
| Ending balance 6/30/2023 | | $ | 3,800,000 | | | $ | 3,800,000 | | | | | | | | | | | | | |
The significant unobservable inputs used in the fair value measurement of the Funds’ Level 3 private investment in Arch Oncology, Inc. Series C1 are as follows: (1) recent investor transactions in the company (2) updates from the company including new clinical trials data and (3) a ninety-percent discount to cost based on termination of trial and estimated remaining cash and wind-down expenses.
The significant unobservable inputs used in the fair value measurement of the Funds’ Level 3 private investment in Beta Bionics, Inc. Series B, Beta Bionics, Inc. Series B2, Beta Bionics, Inc. Series C, Beta Bionics, Inc. Series C Warrant, are as follows: (1) recent investor transactions in the companies (2) updates from the companies including new clinical trials data.
The significant unobservable inputs used in the fair value measurement of the Funds’ Level 3 private investment in BioSplice Therapeutics, Inc. Series B-1 and BioSplice Therapeutics, Inc. Series C 7.50% 3/12/25, are as follows: (1) recent investor transactions in the company (2) updates from the company including new clinical trials data and (3) Monte Carlo valuation which includes volatility input of 69.97%, expiration date of March 12, 2025, and
| A N N U A L R E P O R T | June 30, 2023 |
risk free rate of 4.977%. A significant increase or decrease in unobservable inputs could result in a significantly higher or lower fair value.
The significant unobservable inputs used in the fair value measurement of the Funds’ Level 3 private investment in BioSplice Therapeutics, Inc. Series C Warrant, are as follows: (1) recent investor transactions in the company (2) updates from the company including new clinical trials data and (3) Black-Scholes options pricing model which includes volatility input of 70.13%, risk free rate of 4.224%, and discount rate for lack of marketability of 39.40%. A significant increase or decrease in unobservable inputs could result in a significantly higher or lower fair value.
The significant unobservable inputs used in the fair value measurement of the Funds’ Level 3 private investment in Casma Therapeutics, Inc. Series B1, Casma Therapeutics, Inc. Series B2, Casma Therapeutics, Inc. Series C1, Casma Therapeutics, Inc. Series C2, Flare Therapeutics, Inc. Series A, Flare Therapeutics, Inc. Series A2, Flare Therapeutics, Inc. Series B, Kojin Therapeutics, Inc. Series A-1, Kojin Therapeutics, Inc. Series A-2, Korro Bio, Inc. Series B1, Korro Bio, Inc. Series B2, LEXEO Therapeutics Series B, Metagenomi, LLC Series B, Metagenomi, LLC Series B-1, and Prometheus Laboratories, Inc. private investments are as follows: (1) recent investor transactions in the companies (2) updates from the companies including new clinical trials data and (3) a five-percent discount based on liquidity of the securities held. A significant increase or decrease in the liquidity discount could result in a significantly lower or higher fair value, respectively.
The significant unobservable inputs used in the fair value measurement of the Funds’ Level 3 private investment in Freenome Holdings, Inc. Series D, are as follows: (1) recent investor transactions in the company (2) updates from the company including new clinical trials data and (3) a 5% discount to an Option Pricing Model (OPM) based on Series E transaction value. Inputs include risk free rate (1.16%-4.15%), time to expiration (2.9-4.11 years), volatility (98.18%-108.41%), and a market equity adjustment (-50.51%). A significant increase or decrease to risk free rate, time to expiration, market equity adjustment, and liquidity discount could result in significantly lower or higher fair value, respectively. A significant increase or decrease in volatility could result in significantly higher or lower fair value.
The significant unobservable inputs used in the fair value measurement of the Funds’ Level 3 private investment in Goldfinch Biopharma, Inc. Series A, Goldfinch Biopharma, Inc. Series B, Goldfinch Biopharma, Inc. Series B2 are as follows: (1) recent investor transactions in the companies (2) updates from the companies and (3) a 100% write-down. The lead investor is walking away from Series C Funding and the current investor syndicate is unable to fill funding gap. Goldfinch management has immediately transitioned to wind down the company and the Manager is not expecting there to be any material residual value to be distributed to shareholders.
The significant unobservable inputs used in the fair value measurement of the Funds’ Level 3 private investment in Shoreline Biosciences Series B, are as follows: (1) recent investor transactions in the company (2) updates from the company including new clinical trials data and (3) a 5% discount to an Option Pricing Model (OPM) based on Series B transaction value. Inputs include risk free rate (1.18% - 3.49%), time to expiration (5 years), volatility (67.82 – 69.94%), and a market equity adjustment (-37.5%). A significant increase or decrease to risk free rate, time to expiration, market equity adjustment, and liquidity discount could result in significantly lower or higher fair value, respectively. A significant increase or decrease in volatility could result in significantly higher or lower fair value.
| A N N U A L R E P O R T | June 30, 2023 |
The significant unobservable inputs used in the fair value measurement of the Funds’ Level 3 private investment in Turnstone Biologics, Inc. Series D, are as follows: (1) recent investor transactions in the company (2) updates from the company including new clinical trials data and (3) a five-percent discount to an Option Pricing Model (OPM) based on Series D transaction value. Inputs include risk free rate (0.79%–4.15%), time to expiration (2.9– 4.51 years), volatility (65.58%–70.20%), and a market equity adjustment (-53.4%). A significant increase or decrease to risk free rate, time to expiration, market equity adjustment, and liquidity discount could result in significantly lower or higher fair value, respectively. A significant increase or decrease in volatility could result in significantly higher or lower fair value.
The significant unobservable inputs used in the fair value measurement of the Funds’ Level 3 private note in Vision Fund International are as follows: (1) credit quality of the issuer, and (2) underlying business conditions for the issuer. A significant increase or decrease in the liquidity discount could result in a significantly lower or higher fair value, respectively.
| Fair Value at June 30, 2023 | | Valuation Techniques | | Unobservable Input | | Impact to Valuation |
| 100% | | The Manager plans to hold these securities to maturity and monitors the issuer’s ability to pay interest and principal and additional financial risk metrics and views par as the appropriate valuation. The initial interest rate was set with a spread to the relevant benchmark to compensate for liquidity and interest rate risks. | | There is no active market for these securities however there is significant credit coverage for the loans, the Manager believes the issuer will be current with interest payments and pay principal in full at maturity. | | A decline in credit quality of the issuer and / or a significant increase in interest rates above the stated rate could decrease the value of the securities. |
The significant unobservable inputs used in the fair value measurement of the Funds’ Level 3 private investment in Peloton Therapeutics, Inc. contingent value rights are as follows: (1) updated valuations to reflect recent milestone payments, (2) Net Present Value (NPV) model reflecting the Manager’s probability of success for achieving the remaining milestone payments and (3) a five-percent discount based on liquidity of the securities held.
| Fair Value at June 30, 2023 | | Valuation Techniques | | Unobservable Input | | Impact to Valuation |
| $0.80 | | Net Present Value of contingent future payments less additional liquidity discount. | | Probability of success range 2.5%-75% Discount rate of 10%, Milestone payments range $50M– $1.1B Estimated timing of payments range 2025-2039 5% Liquidity Discount | | Increase or decrease in liquidity discount or discount rate could significantly decrease or increase fair value, while an increase or decrease in probability of success, milestone payments and timing could significantly increase or decrease fair value. |
The total change in unrealized appreciation or depreciation included in the Statements of Operations attributable to Level 3 investments still held at June 30, 2023 was $0, $(14,335,372), $(48,731,280) and $0 for the Eventide Dividend Opportunities Fund, Eventide Gilead Fund, Eventide Healthcare & Life Sciences Fund and Eventide Multi-Asset Income Fund, respectively.
b) Accounting for Options - When the Funds write an option, an amount equal to the premium received by the Funds is recorded as a liability and is subsequently adjusted to the current fair value of the option written.
| A N N U A L R E P O R T | June 30, 2023 |
Premiums received from writing options that expire unexercised are treated by the Funds on the expiration date as realized gains from investments. The difference between the premium and the amount paid on effecting a closing purchase transaction, including brokerage commissions, is also treated as a realized gain, or, if the premium is less than the amount paid for the closing purchase transaction, as a realized loss. If a call option is exercised, the premium is added to the proceeds from the sale of the underlying security or currency in determining whether the Funds have realized gains or losses. If a put option is exercised, the premium reduces the cost basis of the securities purchased by the Funds.
The Manager may use options strategies, such as puts and covered calls on individual securities, as well as options on securities indices, to generate income, to reduce portfolio volatility, or to reduce downside risk when the manager believes adverse market, political or other conditions are likely. The Manager may also utilize a combination of puts and/or calls regarding the same security (sometimes referred to as “straddles,” “collars” or “spreads”) or utilize puts and calls on related securities. The Funds may purchase a call option on a stock (including securities of exchange traded funds (“ETFs”)) it may purchase at some point in the future. When the Funds purchase an option, the premium paid is recorded as an asset. Each day the option contract is valued in accordance with the procedures for security valuation discussed above. When an offsetting option is written (a closing transaction) or the option contract expires, the Funds realize a gain or loss and the asset representing such option contract is eliminated. When a put option is exercised, the Funds realize a gain or loss from the sale of the underlying security and the proceeds of the sale are decreased by the premiums originally paid. When a call option is exercised, the Funds purchase the underlying security and the cost basis of such purchase is increased by the premium originally paid.
c) Short Sales - The Funds may sell securities short. A short sale is a transaction in which the Funds sell securities they do not own in anticipation of a decline in the market price of the securities. To deliver the securities to the buyer, the Funds must arrange through a broker to borrow the securities and, in so doing, the Funds become obligated to replace the securities borrowed at their market price at the time of replacement, whatever that price may be. The Funds will make a profit or incur a loss as a result of a short sale depending on whether the price of the securities decrease or increase between the date of the short sale and the date on which the Funds purchased the securities to replace the borrowed securities that have been sold.
d) Federal Income Tax - The Funds have qualified and intend to continue to qualify as regulated investment companies and to comply with the applicable provisions of the Internal Revenue Code of 1986, as amended, and to distribute substantially all of their taxable income to their shareholders. Therefore, no federal income or excise tax provisions are required.
As of and during the year ended June 30, 2023, the Funds did not have a liability for any unrecognized tax expense. The Funds recognize interest and penalties, if any, related to unrecognized tax expense as income tax expense in the Statements of Operations. As of June 30, 2023, the Funds did not incur any interest or penalties. Management has analyzed the Funds’ tax positions and has concluded that no liability for unrecognized tax benefits should be recorded related to uncertain tax positions taken on returns filed for open tax years ended June 30, 2020, to June 30, 2022, or expected to be taken in the Funds’ June 30, 2023, year-end tax return.
e) Distributions to Shareholders - Distributions to shareholders, which are determined in accordance with income tax regulations and may differ from GAAP, are recorded on the ex-dividend date. Each Fund typically distributes substantially all of its net investment income in the form of dividends, interest and taxable capital gains to its shareholders. These distributions are automatically reinvested in the Fund unless you request cash
| A N N U A L R E P O R T | June 30, 2023 |
distributions on your application or through a written request to the Fund. Each Fund expects that its distributions will consist of both capital gains and net investment income. Each Fund may make distributions of its net realized capital gains (after any reductions for capital loss carry forwards) annually. Each Fund intends to make annual capital gains distributions if applicable. The Eventide Core Bond Fund, Eventide Dividend Opportunities Fund and Eventide Large Cap Focus Fund intend to make quarterly income distributions if applicable. The Eventide Limited-Term Bond Fund and Eventide Multi-Asset Income Fund intend to make monthly income distributions if applicable.
f) Multiple Class Allocations - Income, non-class specific expenses and realized/unrealized gains or losses are allocated to each class based on relative net assets. Distribution fees are charged to each respective share class in accordance with the distribution plan. Expenses of the Trust that are directly identifiable to a specific fund are charged to that fund. Expenses, which are not readily identifiable to a specific fund, are allocated in such a manner as deemed equitable, taking into consideration the nature and type of expense and the relative sizes of the Funds in the Trust.
g) Security Transactions and Investment Income - Investment and shareholder transactions are recorded on the trade date. The Funds determine the gain or loss realized from the investment transactions by comparing the specific identified cost of the security lot sold with the net sales proceeds. Dividend income is recognized on the ex-dividend date or as soon as information is available to the Funds and interest income is recognized on an accrual basis. Discounts and premiums on debt securities are amortized over their respective lives using the effective interest method, except certain callable debt securities that are held at premium and will be amortized to the earliest call date. Withholding taxes on foreign dividends have been provided for in accordance with the Funds’ understanding of the applicable country’s tax rules and rates. Distributions received from a Fund’s investments in MLPs generally are comprised of income and return of capital. The Funds record these distributions as investment income and subsequently adjusts these distributions within the components of net assets based upon their tax treatment when the information becomes available. Distribution from REITs are initially recorded as dividend income and, to the extent such represent a return of capital or capital gain for tax purposes, are reclassified when such information becomes available.
h) Use of Estimates - The preparation of financial statements in conformity with GAAP requires management to make estimates and assumptions that affect the reported amounts of assets and liabilities and disclosure of contingent assets and liabilities at the date of the financial statements and the reported amounts of revenues and expenses during the reporting period. Actual results could differ from those estimates.
i) Indemnification – The Trust indemnifies its officers and Trustees for certain liabilities that may arise from the performance of their duties to the Trust. In the normal course of business, the Trust may enter into contracts that contain a variety of representations and warranties and provide general indemnifications. The Funds’ maximum exposure under these arrangements is dependent on future claims that may be made against the Funds and, therefore, cannot be estimated; however, management considers the risk of loss from such claims to be remote.
j) Redemption Fees and Sales Charges (loads) - A $15 fee may be charged for redemptions made by wire. Redemptions of Eventide Exponential Technologies Fund within 180 days of purchase were subject to a redemption fee of 1.00% effective until June 26, 2023. A maximum sales charge of 5.75% is imposed on Class A shares of the Funds. The maximum deferred sales charge of 1.00% on Class A shares applies only to purchases of $1 million or more made without an initial sales charge and applies to shares sold within 18 months of purchase.
| A N N U A L R E P O R T | June 30, 2023 |
The maximum deferred sales charge of 1.00% on Class C shares applies to shares sold within 12 months of purchase. The respective shareholders pay such CDSC charges, which are not an expense of the Funds. For the year ended June 30, 2023, there were the following redemption fees paid to the Funds and CDSC fees paid to the distributor:
| | | | | | CDSC Fees | |
| Fund | | Redemption Fees | | | Class A | | | Class C | |
| Eventide Dividend Opportunities Fund | | $ | — | | | $ | 82 | | | $ | 712 | |
| Eventide Exponential Technologies Fund | | | 122,525 | | | | — | | | | 641 | |
| Eventide Gilead Fund | | | — | | | | 22 | | | | 3,051 | |
| Eventide Healthcare & Life Sciences Fund | | | — | | | | 128 | | | | 2,622 | |
| Eventide Limited-Term Bond Fund | | | — | | | | — | | | | 178 | |
| Eventide Multi-Asset Income Fund | | | — | | | | 37 | | | | 283 | |
k) Cash and cash equivalents - Cash and cash equivalents are held with a financial institution. Cash and cash equivalents of the Funds may be placed in deposit accounts at U.S. banks and such deposits generally exceed Federal Deposit Insurance Corporation (“FDIC”) insurance limits. The FDIC insures deposit accounts up to $250,000 for each accountholder. The counterparty is generally a single bank rather than a group of financial institutions; thus there may be a greater counterparty credit risk. The Funds place deposits only with those counterparties which are believed to be creditworthy and there has been no history of loss.
2. INVESTMENT TRANSACTIONS
For the year ended June 30, 2023, aggregate purchases and proceeds from sales of investment securities (excluding short-term investments) for the Funds were as follows:
| Fund | | Purchases | | | Sales | |
| Eventide Core Bond Fund | | $ | 44,372,814 | | | $ | 36,746,079 | |
| Eventide Dividend Opportunities Fund | | | 354,137,459 | | | | 239,518,110 | |
| Eventide Exponential Technologies Fund | | | 94,629,619 | | | | 74,686,499 | |
| Eventide Gilead Fund | | | 1,143,046,174 | | | | 1,197,096,349 | |
| Eventide Healthcare & Life Sciences Fund | | | 1,182,372,235 | | | | 1,143,688,429 | |
| Eventide Large Cap Focus Fund | | | 14,429,503 | | | | 3,084,026 | |
| Eventide Limited-Term Bond Fund | | | 51,936,684 | | | | 104,079,635 | |
| Eventide Multi-Asset Income Fund | | | 161,101,679 | | | | 181,063,400 | |
3. INVESTMENT ADVISORY AGREEMENT AND TRANSACTIONS WITH RELATED PARTIES
Eventide Asset Management, LLC acts as investment manager to the Funds pursuant to the terms of a management agreement between the Manager and the Trust (the “Management Agreement”). Boyd Watterson Asset Management, LLC serves as sub-adviser to the Eventide Limited-Term Bond Fund, the Eventide Core Bond Fund, and a portion of the Eventide Multi-Asset Income Fund’s portfolio. Under the terms of the Management Agreement, the Manager manages the investment operations of the Funds in accordance with the Funds’ investment policies and restrictions. The Manager provides the Funds with investment advice and supervision and furnishes an investment program for the Funds. The fees paid by the Funds to the Manager are described in greater detail below. Prior to March 2, 2020, Eventide Multi-Asset Income Fund paid to the manager, as of the last day of each month, an annualized fee equal to 0.73% of its average net assets. The Manager pays expenses incurred by it in connection with acting as investment manager to the Funds other than costs (including taxes and brokerage commissions, borrowing costs, costs of investing in underlying funds and
| A N N U A L R E P O R T | June 30, 2023 |
extraordinary expenses, if any) of securities purchased for the Funds and certain other expenses paid by the Funds (as detailed in the Management Agreement). The Manager pays for all employees, office space and facilities required by it to provide services under the Management Agreement, with the exception of specific items of expense (as detailed in the Management Agreement). For the year ended June 30, 2023, management fees of $239,959, $3,688,377, $1,085,748, $34,478,771, $17,709,516, $46,365, $514,006 and $2,107,840 were incurred by the Eventide Core Bond Fund, Eventide Dividend Opportunities Fund, Eventide Exponential Technologies Fund, Eventide Gilead Fund, Eventide Healthcare & Life Sciences Fund, Eventide Large Cap Focus Fund, Eventide Limited-Term Bond Fund and Eventide Multi-Asset Income Fund, respectively, before the waivers and reimbursements described below.
Each Fund is authorized to pay the Manager an annual fee based on its average daily net assets. The management fee is paid monthly. The Manager has contractually agreed to waive fees and/or reimburse expenses, but only to the extent necessary to maintain each Fund’s total annual operating expenses (excluding front-end or contingent deferred loads, taxes, leverage interest, brokerage commissions, expenses incurred in connection with any merger or reorganization, dividend expenses on securities sold short, underlying fund fees and expenses or extraordinary expenses such as litigation) at a certain level through October 31, 2023. This agreement may be terminated by the Board only on 60 days’ written notice to the Manager and upon the termination of the Management Agreement between the Trust and the Manager. Fee waivers and expense reimbursements are subject to possible recoupment by the Manager from the Funds in future years on a rolling three-year basis (within the three years after the fees have been waived or reimbursed) if, after the recoupment is taken into account, such recoupment can be achieved within the lesser of the expense limitation in place at the time of waiver/reimbursement and the expense limitation in place at the time of recapture. Each waiver or reimbursement by the Manager is subject to repayment by the Fund within the three years following the year in which that particular expense is incurred, if the Fund is able to make the repayment without exceeding the expense limitation in effect at that time and the repayment is approved by the Board.
| A N N U A L R E P O R T | June 30, 2023 |
The following table lists the contractual management fee and the expense limitation for each Fund.
| Fund | | Contractual Advisory Fee | | Expense Limitation | |
| Eventide Core Bond Fund | | 0.34% | * | Class N: | 0.78% |
| | | | | Class A: | 0.83% |
| | | | | Class C: | 1.58% |
| | | | | Class I: | 0.58% |
| | | | | | |
| Eventide Dividend Opportunities Fund | | 0.73% | | Class N: | 1.15% |
| | | | | Class A: | 1.20% |
| | | | | Class C: | 1.95% |
| | | | | Class I: | 0.95% |
| | | | | | |
| Eventide Exponential Technologies Fund | | 1.10% | | Class N: | 1.63% |
| | | | | Class A: | 1.68% |
| | | | | Class C: | 2.43% |
| | | | | Class I: | 1.43% |
| | | | | | |
| Eventide Gilead Fund | | 1.00% of the first $2 billion; | | Class N: | 1.62% |
| | | 0.95% on the next $1 billion; | | Class A: | 1.67% |
| | | 0.90% on the next $1 billion; | | Class C: | 2.42% |
| | | and 0.85% thereafter | | Class I: | 1.42% |
| | | | | | |
| Eventide Healthcare & Life Sciences Fund | | 1.10% | | Class N: | 1.63% |
| | | | | Class A: | 1.68% |
| | | | | Class C: | 2.43% |
| | | | | Class I: | 1.43% |
| | | | | | |
| Eventide Large Cap Focus Fund | | 0.73% | | Class N: | 1.14% |
| | | | | Class A: | 1.19% |
| | | | | Class C: | 1.94% |
| | | | | Class I: | 0.94% |
| | | | | | |
| Eventide Limited-Term Bond Fund | | 0.31% | * | Class N: | 0.75% |
| | | | | Class A: | 0.80% |
| | | | | Class C: | 1.55% |
| | | | | Class I: | 0.55% |
| | | | | | |
| Eventide Multi-Asset Income Fund | | 0.60% | | Class N: | 1.02% |
| | | | | Class A: | 1.07% |
| | | | | Class C: | 1.82% |
| | | | | Class I: | 0.82% |
| * | Effective May 31, 2023, the contractual advisory fees of Eventide Core Bond Fund and Eventide Limited-Term Bond Fund were reduced from 0.36% to 0.34% and 0.33% to 0.31%., respectively. |
| A N N U A L R E P O R T | June 30, 2023 |
For the year ended June 30, 2023, the Manager waived no management fees from Eventide Gilead Fund and Eventide Healthcare & Life Sciences Fund and waived fees of $164,775, $391,061, $69,721, $107,732, $243,710 and $276,044 from the Eventide Core Bond Fund, Eventide Dividend Opportunities Fund, Exponential Technologies Fund, Eventide Large Cap Focus Fund, Eventide Limited-Term Bond Fund and Eventide Multi-Asset Income Fund, respectively. As of June 30, 2023, the Manager has waived/reimbursed expenses that may be recovered no later than June 30 of the years indicated below:
| | | 2024 | | | 2025 | | | 2026 | |
| Eventide Core Bond Fund | | $ | 99,512 | | | $ | 201,020 | | | $ | 164,775 | |
| Eventide Dividend Opportunities Fund | | | 64,772 | | | | — | | | | 391,061 | |
| Eventide Exponential Technologies Fund | | | 53,115 | | | | — | | | $ | 69,721 | |
| Eventide Large Cap Focus Fund | | | — | | | | — | | | | 107,732 | |
| Eventide Limited-Term Bond Fund | | | 133,760 | | | | 165,476 | | | | 243,710 | |
| Eventide Multi-Asset Income Fund | | | 65,335 | | | | — | | | | 276,044 | |
The Eventide Gilead Fund and Eventide Healthcare & Life Sciences Fund do not have any expenses previously waived by the Manager that are subject to recapture and did not waive any further expenses during the year ended June 30, 2023.
Pursuant to the Management Services Agreement between the Trust and MFund Services, LLC (“MFund”), MFund provides the Funds with management and legal administrative services (the “Management Services Agreement”). For these services, the Funds pay MFund as of the last day of each month an annualized asset based fee which scales downward based upon net assets. In addition, the Funds reimburse MFund for any reasonable out-of-pocket expenses incurred in the performance of its duties under the Management Services Agreement. The amounts due to MFund for the Management Services Agreement are listed in the Statements of Assets and Liabilities under “Payable to related parties” and the amounts accrued for the year are shown in the Statements of Operations under “Management service fees.”
Pursuant to the Compliance Services Agreement, MFund provides chief compliance officer services to the Funds. For these services, the Funds pay MFund as of the last day of each month an annualized base fee plus an annualized asset-based fee based upon net assets. In addition, the Funds reimburse MFund for any reasonable out-of-pocket expenses incurred in the performance of its duties under the Compliance Services Agreement.
The amounts due to MFund for chief compliance officer services are listed in the Statements of Assets and Liabilities under “Compliance officer fees payable” and the amounts accrued for the year are shown in the Statements of Operations under “Compliance officer fees.”
A trustee of the Trust is also the controlling member of MFund and the investment advisers to other series of the Trust and is not paid any fees directly by the Trust for serving in such capacities. Trustees who are not “interested persons” as that term is defined in the 1940 Act, are paid a quarterly retainer and receive compensation for each special Board meeting and Risk and Compliance Committee meeting attended. The fees paid to the Independent Trustees for their attendance at a meeting will be shared equally by the funds of the Trust in which the meeting relates. The Lead Independent Trustee of the Trust, the Chairman of the Trust’s Audit Committee and the Chairman of the Risk and Compliance Committee receive an additional quarterly retainer. The “interested persons” of the Trust receive no compensation from the Funds. The “interested persons” of the Trust receive no
| A N N U A L R E P O R T | June 30, 2023 |
compensation from the Fund. The Trust reimburses each Trustee and Officer for his or her travel and other expenses related to attendance at such meetings.
Ultimus Fund Solutions, LLC (“UFS”), an affiliate of the distributor, provides administrative, fund accounting, and transfer agency services to the Funds pursuant to agreements with the Trust, for which it receives from each Fund: (i) basis points in decreasing amounts as assets reach certain breakpoints; and (ii) any related out-of-pocket expenses.
Blu Giant, LLC (“Blu Giant”), an affiliate of UFS and the distributor, provides EDGAR conversion and filing services as well as print management services for the Funds on an ad-hoc basis. For the provision of these services, Blu Giant receives customary fees from the Funds.
The Trust’s officers are not paid any fees directly by the Trust for serving in such capacity except for the chief compliance officer.
The Trust has adopted a distribution plan pursuant to rule 12b-1 under the 1940 Act for each class of shares except Class I, that allows the Funds to pay distribution and shareholder servicing expenses of up to 0.25% per annum for the Class N shares, up to 0.50% per annum for the Class A shares and up to 1.00% for the Class C shares based on average daily net assets of each class. The Class N shares are currently paying 0.20% per annum of 12b-1 fees, Class A shares are currently paying 0.25% per annum of 12b-1 fees and Class C shares are currently paying 1.00% per annum of 12b-1 fees.
The 12b-1 fees may be used for a variety of purposes, including compensating dealers and other financial service organizations for eligible services provided by those parties to the Funds and their shareholders and to reimburse Northern Lights Distributors, LLC (the “Distributor”) and the Manager for distribution related expenses.
For the year ended June 30, 2023, the Distributor received $682, $48,085, $7,071, $150,295, $64,103, $1,234, $1,213 and $18,401 in underwriter commissions from the sale of Class A shares of the Fund from the Eventide Core Bond Fund, Eventide Dividend Opportunities Fund, Eventide Exponential Technologies Fund, Eventide Gilead Fund, Eventide Healthcare & Life Sciences Fund, Eventide Large Cap Focus Fund, Eventide Limited-Term Bond Fund and Eventide Multi-Asset Income Fund, respectively.
4. DISTRIBUTIONS TO SHAREHOLDERS AND TAX COMPONENTS OF CAPITAL
The following table represents aggregate cost for federal tax purposes, including options written, for the Funds as of June 30, 2023 and differs from market value by net unrealized appreciation/depreciation which consisted of:
| | | | | | | | | | | | Total Unrealized | |
| | | | | | Gross Unrealized | | | Gross Unrealized | | | Appreciation | |
| Fund | | Aggregate Cost | | | Appreciation | | | Depreciation | | | (Depreciation) | |
| Eventide Core Bond Fund | | $ | 84,472,215 | | | $ | 17,954 | | | $ | (7,982,698 | ) | | $ | (7,964,744 | ) |
| Eventide Dividend Opportunities Fund | | | 511,921,558 | | | | 75,050,285 | | | | (17,895,088 | ) | | | 57,155,197 | |
| Eventide Exponential Technologies Fund | | | 99,082,229 | | | | 25,866,184 | | | | (9,423,635 | ) | | | 16,442,549 | |
| Eventide Gilead Fund | | | 2,596,146,685 | | | | 1,379,184,559 | | | | (219,664,344 | ) | | | 1,159,520,215 | |
| Eventide Healthcare & Life Sciences Fund | | | 1,579,620,948 | | | | 390,723,046 | | | | (165,852,451 | ) | | | 224,870,595 | |
| Eventide Large Cap Focus Fund | | | 11,945,410 | | | | 1,780,682 | | | | (129,883 | ) | | | 1,650,799 | |
| Eventide Limited-Term Bond Fund | | | 132,599,728 | | | | 18,873 | | | | (6,659,203 | ) | | | (6,640,330 | ) |
| Eventide Multi-Asset Income Fund | | | 320,274,406 | | | | 29,737,470 | | | | (20,394,642 | ) | | | 9,342,828 | |
| A N N U A L R E P O R T | June 30, 2023 |
The tax character of fund distributions for the years ended June 30, 2023 and June 30, 2022 was as follows:
| | | For the year ended June 30, 2023: | |
| | | Ordinary | | | Long-Term | | | Return of | | | | |
| Fund | | Income | | | Capital Gains | | | Capital | | | Total | |
| Eventide Core Bond Fund | | $ | 1,536,982 | | | $ | — | | | $ | — | | | $ | 1,536,982 | |
| Eventide Dividend Opportunities Fund | | | 3,346,718 | | | | 3,513,286 | | | | 1,113,976 | | | | 7,973,980 | |
| Eventide Exponential Technologies Fund | | | — | | | | — | | | | — | | | | — | |
| Eventide Gilead Fund | | | — | | | | 172,246,986 | | | | — | | | | 172,246,986 | |
| Eventide Healthcare & Life Sciences Fund | | | — | | | | — | | | | — | | | | — | |
| Eventide Large Cap Focus Fund | | | 4,107 | | | | — | | | | 5,791 | | | | 9,898 | |
| Eventide Limited-Term Bond Fund | | | 2,675,469 | | | | — | | | | 42,422 | | | | 2,717,891 | |
| Eventide Multi-Asset Income Fund | | | 4,832,162 | | | | 3,689,551 | | | | 1,039,779 | | | | 9,561,492 | |
| | | For the year ended June 30, 2022: | |
| | | Ordinary | | | Long-Term | | | Return of | | | | |
| Fund | | Income | | | Capital Gains | | | Capital | | | Total | |
| Eventide Core Bond Fund | | $ | 1,309,050 | | | $ | — | | | $ | 152,476 | | | $ | 1,461,526 | |
| Eventide Dividend Opportunities Fund | | | 5,984,302 | | | | 8,263,195 | | | | — | | | | 14,247,497 | |
| Eventide Exponential Technologies Fund | | | 1,906,725 | | | | — | | | | — | | | | 1,906,725 | |
| Eventide Gilead Fund | | | — | | | | 327,575,226 | | | | — | | | | 327,575,226 | |
| Eventide Healthcare & Life Sciences Fund | | | 34,043,234 | | | | 158,591,589 | | | | — | | | | 192,634,823 | |
| Eventide Limited-Term Bond Fund | | | 1,300,163 | | | | 50,373 | | | | 1,089,637 | | | | 2,440,173 | |
| Eventide Multi-Asset Income Fund | | | 11,154,838 | | | | 13,561,075 | | | | — | | | | 24,715,913 | |
As of June 30, 2023, the components of accumulated earnings/losses on a tax basis were as follows:
| | | Undistributed | | | Undistributed | | | Post October Loss | | | Capital Loss | | | Other | | | Unrealized | | | Total | |
| | | Ordinary | | | Long-Term | | | and | | | Carry | | | Book/Tax | | | Appreciation/ | | | Accumulated | |
| Portfolio | | Income | | | Capital Gains | | | Late Year Loss | | | Forwards | | | Differences | | | (Depreciation) | | | Earnings/(Losses) | |
| Eventide Core Bond Fund | | $ | 22,168 | | | $ | — | | | $ | (1,744,260 | ) | | $ | (9,399,631 | ) | | $ | — | | | $ | (7,964,744 | ) | | $ | (19,086,467 | ) |
| Eventide Dividend Opportunities Fund | | | — | | | | — | | | | (38,343,750 | ) | | | (5,332,097 | ) | | | — | | | | 57,155,197 | | | | 13,479,350 | |
| Eventide Exponential Technologies Fund | | | — | | | | — | | | | (19,293,707 | ) | | | (30,865,266 | ) | | | — | | | | 16,442,549 | | | | (33,716,424 | ) |
| Eventide Gilead Fund | | | — | | | | — | | | | (47,736,460 | ) | | | (10,943,785 | ) | | | — | | | | 1,159,520,215 | | | | 1,100,839,970 | |
| Eventide Healthcare & Life Sciences Fund | | | — | | | | — | | | | (8,463,362 | ) | | | (54,846,012 | ) | | | — | | | | 224,870,595 | | | | 161,561,221 | |
| Eventide Large Cap Focus Fund | | | — | | | | — | | | | (267,344 | ) | | | (8,133 | ) | | | — | | | | 1,650,799 | | | | 1,375,322 | |
| Eventide Limited-Term Bond Fund | | | — | | | | — | | | | (4,094,436 | ) | | | (3,449,767 | ) | | | — | | | | (6,640,330 | ) | | | (14,184,533 | ) |
| Eventide Multi-Asset Income Fund | | | — | | | | — | | | | (9,672,041 | ) | | | (3,743,606 | ) | | | — | | | | 9,342,828 | | | | (4,072,819 | ) |
The difference between book basis and tax basis undistributed net investment income/(loss), accumulated net realized gain/(loss), and unrealized appreciation/(depreciation) from investments is primarily attributable to the tax deferral of losses on wash sales and adjustments for partnerships, real estate investment trusts, and C-Corporation return of capital.
| A N N U A L R E P O R T | June 30, 2023 |
Late year losses incurred after December 31 within the fiscal year are deemed to arise on the first business day of the following fiscal year for tax purposes. The Funds incurred and elected to defer such late year losses as follows:
| Fund | | Late Year Losses | |
| Eventide Exponential Technologies Fund | | $ | 502,291 | |
| Eventide Gilead Fund | | | 12,330,410 | |
| Eventide Healthcare & Life Sciences Fund | | | 8,463,362 | |
| Eventide Large Cap Focus Fund | | | 13 | |
Capital losses incurred after October 31 within the fiscal year are deemed to arise on the first business day of the following fiscal year for tax purposes. The Funds incurred and elected to defer such capital losses as follows:
| Portfolio | | Losses | |
| Eventide Core Bond Fund | | $ | 1,744,260 | |
| Eventide Dividend Opportunities Fund | | | 38,343,750 | |
| Eventide Exponential Technologies Fund | | | 18,791,416 | |
| Eventide Gilead Fund | | | 35,406,050 | |
| Eventide Large Cap Focus Fund | | | 267,331 | |
| Eventide Limited-Term Bond Fund | | | 4,094,436 | |
| Eventide Multi-Asset Income Fund | | | 9,672,041 | |
At June 30, 2023, the Funds had capital loss carry forwards for federal income tax purposes available to offset future capital gains:
| | | Non-Expiring | | | | |
| Portfolio | | Short-Term | | | Long-Term | | | Total | |
| Eventide Core Bond Fund | | $ | 3,391,429 | | | $ | 6,008,202 | | | $ | 9,399,631 | |
| Eventide Dividend Opportunities Fund | | | 4,101,249 | | | | 1,230,848 | | | | 5,332,097 | |
| Eventide Exponential Technologies Fund | | | 25,078,444 | | | | 5,786,822 | | | | 30,865,266 | |
| Eventide Gilead Fund | | | 10,943,785 | | | | — | | | | 10,943,785 | |
| Eventide Healthcare & Life Sciences Fund | | | 54,846,012 | | | | — | | | | 54,846,012 | |
| Eventide Large Cap Focus Fund | | | 8,133 | | �� | | — | | | | 8,133 | |
| Eventide Limited-Term Bond Fund | | | 1,143,655 | | | | 2,306,112 | | | | 3,449,767 | |
| Eventide Multi-Asset Income Fund | | | 2,115,758 | | | | 1,627,848 | | | | 3,743,606 | |
Permanent book and tax differences, primarily attributable to the book/tax basis treatment of net operating losses, distributions in excess, and adjustments for prior year tax returns, resulted in reclassifications for the Funds for the fiscal year ended June 30, 2023, as follows:
| | | Paid In | | | Accumulated | |
| Portfolio | | Capital | | | Earnings (Losses) | |
| Eventide Dividend Opportunities Fund | | $ | 81,501 | | | $ | (81,501 | ) |
| Eventide Exponential Technologies Fund | | | (1,415,338 | ) | | | 1,415,338 | |
| Eventide Gilead Fund | | | (33,610,714 | ) | | | 33,610,714 | |
| Eventide Healthcare & Life Sciences Fund | | | (8,826,002 | ) | | | 8,826,002 | |
| Eventide Multi-Asset Income Fund | | | 6,386 | | | | (6,386 | ) |
| A N N U A L R E P O R T | June 30, 2023 |
5. INVESTMENTS IN AFFILIATED COMPANIES
An affiliated company is a company in which the Fund has ownership of at least 5% of the voting securities. Companies which are affiliates of the Eventide Gilead Fund and Eventide Healthcare & Life Sciences Fund at June 30, 2023 are noted in the Funds’ Schedule of Investments. Transactions during the year with companies which are affiliates are as follows:
Eventide Gilead Fund
| | | | | | | | | | | | | | | | | | | | | Net Increase/ | | | | | | | | | | |
| | | | | | | | | | | | | | | | | | Dividends | | | Decrease in | | | | | | | | | | |
| | | Market Value at | | | Share Balance at | | | | | | | | | | | | Credited to | | | Appreciation | | | Realized Gains | | | Market Value at | | | Share Balance at | |
| Description | | June 30, 2022 | | | June 30, 2022 | | | Purchases | | | Sales Proceeds | | | Corporate Actions | | | Income | | | (Depreciation) | | | (Losses) | | | June 30, 2023 | | | June 30, 2023 | |
| KnowBe4, Inc. | | $ | 61,042,694 | | | | 3,907,983 | | | $ | — | | | $ | (93,140,620 | ) | | $ | — | | | $ | — | | | $ | 30,413,006 | | | $ | 1,684,920 | | | $ | — | | | | — | |
| Beta Bionics, Inc. Series B | | | 18,435,172 | | | | 139,527 | | | | — | | | | — | | | | — | | | | — | | | | (8,388,907 | ) | | | — | | | | 10,046,265 | | | | 139,527 | |
| Beta Bionics, Inc. Series B2 | | | 6,457,272 | | | | 48,872 | | | | — | | | | — | | | | — | | | | — | | | | (2,843,745 | ) | | | — | | | | 3,613,527 | | | | 48,872 | |
| Beta Bionics, Inc. Series C | | | 7,599,916 | | | | 71,900 | | | | — | | | | — | | | | — | | | | — | | | | (2,606,130 | ) | | | — | | | | 4,993,786 | | | | 71,900 | |
| Beta Bionics, Inc. Series C Warrants | | | 1,899,799 | | | | 17,975 | | | | — | | | | — | | | | — | | | | — | | | | (624,841 | ) | | | — | | | | 1,274,958 | | | | 17,975 | |
| Total | | $ | 95,434,853 | | | | 4,186,257 | | | $ | — | | | $ | (93,140,620 | ) | | $ | — | | | $ | — | | | $ | 15,949,383 | | | $ | 1,684,920 | | | $ | 19,928,536 | | | | 278,274 | |
| A N N U A L R E P O R T | June 30, 2023 |
Eventide Healthcare & Life Sciences Fund
| | | | | | | | | | | | | | | | | | | | | Net Increase/ | | | | | | | | | | |
| | | | | | | | | | | | | | | | | | Dividends | | | Decrease in | | | | | | | | | | |
| | | Market Value at | | | Share Balance at | | | | | | | | | | | | Credited to | | | Appreciation | | | Realized Gains | | | Market Value at | | | Share Balance at | |
| Description | | June 30, 2022 | | | June 30, 2022 | | | Purchases | | | Sales Proceeds | | | Corporate Actions | | | Income | | | (Depreciation) | | | (Losses) | | | June 30, 2023 | | | June 30, 2023 | |
| Annexon, Inc. | | $ | 13,671,935 | | | | 3,626,508 | | | $ | — | | | $ | (11,350,178 | ) | | $ | — | | | $ | — | | | $ | 42,423,915 | | | $ | (44,745,672 | ) | | $ | — | | | | — | |
| Aura Biosciences, Inc. | | | — | | | | — | | | | 33,616,637 | | | | — | | | | — | | | | — | | | | 2,637,023 | | | | — | | | | 36,253,660 | | | | 2,935,519 | |
| Casma Therapeutics, Inc.Series B1 | | | 2,185,000 | | | | 5,000,000 | | | | — | | | | — | | | | — | | | | — | | | | — | | | | — | | | | 2,185,000 | | | | 5,000,000 | |
| Casma Therapeutics, Inc. Series B2 | | | 2,185,000 | | | | 5,000,000 | | | | — | | | | — | | | | — | | | | — | | | | — | | | | — | | | | 2,185,000 | | | | 5,000,000 | |
| Casma Therapeutics, Inc. Series C1 1 | | | — | | | | — | | | | — | | | | — | | | | 837,390 | | | | — | | | | (41,870 | ) | | | — | | | | 795,520 | | | | 1,820,413 | |
| Casma Therapeutics, Inc. Series C2 | | | — | | | | — | | | | 560,746 | | | | — | | | | — | | | | — | | | | (28,037 | ) | | | — | | | | 532,709 | | | | 1,219,013 | |
| Casma Therapeutics, Inc. Series C Tranche 1, 5.0000% 4/28/23 1 | | | 795,520 | | | | 830,000 | | | | — | | | | — | | | | (837,390 | ) | | | — | | | | 41,870 | | | | — | | | | — | | | | — | |
| Essa Pharma, Inc. | | | 9,143,220 | | | | 2,902,609 | | | | — | | | | (9,390,280 | ) | | | — | | | | — | | | | 14,877,478 | | | | (14,630,418 | ) | | | — | | | | — | |
| Freeline Therapeutics Ltd. 2 | | | 4,144,233 | | | | 4,721,696 | | | | — | | | | (1,746,419 | ) | | | 15,750,000 | | | | — | | | | 25,028,088 | | | | (43,175,902 | ) | | | — | | | | — | |
| Freeline Therapeutics Ltd. Series C 2 | | | 1,024,178 | | | | 1,228,304 | | | | — | | | | — | | | | (15,750,000 | ) | | | — | | | | 14,725,822 | | | | — | | | | — | | | | — | |
| Goldfinch Biopharma, Inc. Series A | | | 5,605,000 | | | | 5,000,000 | | | | — | | | | — | | | | — | | | | — | | | | (5,605,000 | ) | | | — | | | | — | | | | 5,000,000 | |
| Goldfinch Biopharma, Inc. Series B | | | 9,500,000 | | | | 8,474,576 | | | | — | | | | — | | | | — | | | | — | | | | (9,500,000 | ) | | | — | | | | — | | | | 8,474,576 | |
| Goldfinch Biopharma, Inc. Series B2 | | | 4,750,000 | | | | 4,237,288 | | | | — | | | | — | | | | — | | | | — | | | | (4,750,000 | ) | | | — | | | | — | | | | 4,237,288 | |
| Korro Bio, Inc. Series B1 3 | | | 9,500,001 | | | | 3,831,418 | | | | — | | | | — | | | | — | | | | — | | | | 618,774 | | | | — | | | | 10,118,775 | | | | 3,831,418 | |
| Korro Bio, Inc. Series B2 | | | — | | | | — | | | | 9,999,999 | | | | — | | | | — | | | | — | | | | (500,000 | ) | | | — | | | | 9,499,999 | | | | 3,597,122 | |
| LEXEO Therapeutics Series B | | | 14,250,300 | | | | 8,718,446 | | | | — | | | | — | | | | — | | | | — | | | | — | | | | — | | | | 14,250,300 | | | | 8,718,446 | |
| Marinus Pharmaceuticals, Inc. | | | — | | | | — | | | | 15,074,927 | | | | — | | | | — | | | | — | | | | 19,385,992 | | | | — | | | | 34,460,919 | | | | 3,173,197 | |
| Mirum Pharmaceuticals, Inc. | | | — | | | | — | | | | 43,840,820 | | | | — | | | | — | | | | — | | | | 9,430,710 | | | | — | | | | 53,271,530 | | | | 2,059,201 | |
| Praxis Precision Medicines, Inc. | | | 6,043,628 | | | | 2,466,787 | | | | — | | | | (11,064,382 | ) | | | — | | | | — | | | | 23,373,670 | | | | (18,352,916 | ) | | | — | | | | — | |
| Prometheus Biosciences, Inc.4 | | | 91,259,120 | | | | 3,232,700 | | | | — | | | | (235,262,052 | ) | | | (83,000,000 | ) | | | — | | | | (48,242,068 | ) | | | 275,245,000 | | | | — | | | | — | |
| Prometheus Laboratories, Inc. | | | 667,148 | | | | 1,017,770 | | | | — | | | | — | | | | — | | | | — | | | | — | | | | — | | | | 667,148 | | | | 1,017,770 | |
| Reneo Pharmaceuticals, Inc. | | | — | | | | — | | | | 14,000,000 | | | | — | | | | — | | | | — | | | | (2,520,000 | ) | | | — | | | | 11,480,000 | | | | 1,750,000 | |
| Sutro Biopharma, Inc. | | | 14,113,760 | | | | 2,708,975 | | | | — | | | | (20,153,320 | ) | | | — | | | | — | | | | 20,274,321 | | | | (14,234,761 | ) | | | — | | | | — | |
| VectivBio Holdings A.G. | | | 12,630,838 | | | | 2,339,044 | | | | 10,097,400 | | | | (59,320,011 | ) | | | — | | | | — | | | | 13,453,653 | | | | 23,138,120 | | | | — | | | | — | |
| Zentalis Pharmaceuticals, Inc.3 | | | 28,212,400 | | | | 1,004,000 | | | | 69,333,773 | | | | — | | | | — | | | | — | | | | 15,293,828 | | | | — | | | | 112,840,001 | | | | 4,000,000 | |
| Zymeworks, Inc. | | | 28,515,060 | | | | 5,380,200 | | | | — | | | | (37,063,954 | ) | | | — | | | | — | | | | 83,486,125 | | | | (74,937,231 | ) | | | — | | | | — | |
| TOTAL | | $ | 258,196,341 | | | | 71,720,321 | | | $ | 196,524,302 | | | $ | (385,350,596 | ) | | $ | (83,000,000 | ) | | $ | — | | | $ | 213,864,294 | | | $ | 88,306,220 | | | $ | 288,540,561 | | | | 61,833,963 | |
| A N N U A L R E P O R T | June 30, 2023 |
Eventide Healthcare & Life Sciences Fund
Investments no longer affiliated as of June 30, 2023
| | | | | | | | | | | | | | | | | | | | | Net Increase/ | | | | | | | | | | |
| | | | | | | | | | | | | | | | | | Dividends | | | Decrease in | | | | | | | | | | |
| | | Market Value at | | | Share Balance at | | | | | | | | | | | | Credited to | | | Appreciation | | | Realized Gains | | | Market Value at | | | Share Balance at | |
| Description | | June 30, 2022 | | | June 30, 2022 | | | Purchases | | | Sales Proceeds | | | Corporate Actions | | | Income | | | (Depreciation) | | | (Losses) | | | June 30, 2023 | | | June 30, 2023 | |
| Cogent Biosciences, Inc. | | $ | 45,956,900 | | | | 5,095,000 | | | $ | 10,163,276 | | | $ | (40,585,147 | ) | | $ | — | | | $ | — | | | $ | 8,607,205 | | | $ | 16,596,791 | | | $ | 40,739,025 | | | | 3,440,796 | |
| Total | | $ | 45,956,900 | | | | 5,095,000 | | | $ | 10,163,276 | | | $ | (40,585,147 | ) | | $ | — | | | $ | — | | | $ | 8,607,205 | | | $ | 16,596,791 | | | $ | 40,739,025 | | | | 3,440,796 | |
| | | | | | | | | | | | | | | | | | | | | | | | | | | | | | | | | | | | | | | | | |
| | | $ | 304,153,241 | | | | 76,815,321 | | | $ | 206,687,578 | | | $ | (425,935,743 | ) | | $ | — | | | $ | — | | | $ | 222,471,499 | | | $ | 104,903,011 | | | $ | 329,279,586 | | | | 65,274,759 | |
| 1. | Conversion of convertible note to private investment. |
| 2. | Reorganization of private investment to the publicly traded common stock. |
| 3. | Not affiliated June 30, 2022. |
6. INVESTMENT IN RESTRICTED SECURITIES
Restricted securities include securities that have not been registered under the Securities Act of 1933, as amended, and securities that are subject to restrictions on resale. Each Fund may invest in restricted securities that are consistent with the Fund’s investment objectives and investment strategies. A Fund will not invest in a restricted security if, immediately after and as a result of the investment in such security, more than 15% of the Fund’s net assets would be invested in illiquid securities. In some cases, the issuer of restricted securities has agreed to register such securities for resale, at the issuer’s expense either upon demand by the Funds or in connection with another registered offering of the securities. Investments in restricted securities are valued at fair value as determined in good faith in accordance with procedures adopted by the Board. It is possible that the estimated value may differ significantly from the amount that might ultimately be realized in the near term, and the difference could be material.
As of June 30, 2023, the Eventide Dividend Opportunities Fund, Eventide Gilead Fund, Eventide Healthcare & Life Sciences Fund and Eventide Multi-Asset Income Fund were invested in the following restricted securities:
Eventide Dividend Opportunities Fund
| | | Initial Acquisition | | | | | | | | | | | | |
| Security | | Date | | Shares | | | Cost | | | Value | | | % of Net Assets | |
| Vision Fund International, 2.6110%, 11/30/23 | | 12/1/21 | | | 2,000,000 | | | $ | 2,000,000 | | | $ | 2,000,000 | | | | 0.3 | % |
| | | | | | | | | | | | | | | | | | | |
| Eventide Gilead Fund | | | | | | | | | | | | | | | | | | |
| | | | | | | | | | | | | | | | | | | |
| | | Initial Acquisition | | | | | | | | | | | | |
| Security | | Date | | Shares | | | Cost | | | Value | | | % of Net Assets | |
| Beta Bionics, Inc. Series B | | 8/31/18 | | | 139,527 | | | $ | 20,000,031 | | | $ | 10,046,265 | | | | 0.3 | % |
| Beta Bionics, Inc. Series B2 | | 6/27/19 | | | 48,872 | | | | 7,400,000 | | | | 3,631,527 | | | | 0.1 | % |
| Beta Bionics, Inc. Series C | | 2/16/22 | | | 71,900 | | | | 9,999,867 | | | | 4,993,786 | | | | 0.1 | % |
| Beta Bionics, Inc. Series C Warrant | | 2/16/22 | | | 17,975 | | | | — | | | | 1,274,958 | | | | 0.0 | % |
| Peloton Therapeutics, Inc. - CVR | | 2/14/19 | | | 3,982,940 | | | | — | | | | 3,197,106 | | | | 0.0 | % |
| Vision Fund International, 2.6110%, 11/30/23 | | 12/1/21 | | | 7,000,000 | | | | 7,000,000 | | | | 7,000,000 | | | | 0.2 | % |
| Vision Fund International, 3.1500%, 12/15/25 | | 12/16/21 | | | 5,000,000 | | | | 5,000,000 | | | | 5,000,000 | | | | 0.1 | % |
| Vision Fund International, 3.2230%, 12/15/26 | | 12/16/21 | | | 5,000,000 | | | | 5,000,000 | | | | 5,000,000 | | | | 0.1 | % |
| Vision Fund International, 4.7400%, 06/16/25 | | 5/18/22 | | | 5,000,000 | | | | 5,000,000 | | | | 5,000,000 | | | | 0.1 | % |
| Vision Fund International, 5.9030%, 09/19/25 | | 9/21/22 | | | 5,000,000 | | | | 5,000,000 | | | | 5,000,000 | | | | 0.1 | % |
| A N N U A L R E P O R T | June 30, 2023 |
Eventide Healthcare & Life Sciences Fund
| | | Initial Acquisition | | | | | | | | | | | | |
| Security | | Date | | Shares | | | Cost | | | Value | | | % of Net Assets | |
| Arch Oncology, Inc. Series C1 | | 4/26/21 | | | 4,643,043 | | | $ | 5,952,381 | | | $ | 565,523 | | | | 0.0 | % |
| Beta Bionics, Inc. Series B | | 8/31/18 | | | 69,763 | | | | 10,000,016 | | | | 5,023,096 | | | | 0.3 | % |
| Beta Bionics, Inc. Series B2 | | 6/27/19 | | | 59,439 | | | | 9,000,000 | | | | 4,394,836 | | | | 0.3 | % |
| Beta Bionics, Inc. Series C | | 2/16/22 | | | 35,950 | | | | 4,999,933 | | | | 2,496,893 | | | | 0.1 | % |
| Beta Bionics, Inc. Series C Warrant | | 2/16/22 | | | 8,987 | | | | — | | | | 637,443 | | | | 0.0 | % |
| BioSplice Therapeutics, Inc. Series B-1 | | 3/5/21 | | | 295,276 | | | | 15,000,021 | | | | 1,470,475 | | | | 0.1 | % |
| BioSplice Therapeutics, Inc. Series C, 7.5000%, 03/12/25 | | 5/2/23 | | | 2,500,000 | | | | 2,500,000 | | | | 2,818,000 | | | | 0.2 | % |
| BioSplice Therapeutics, Inc. Series C Warrant | | 5/2/23 | | | 72,382 | | | | — | | | | 70,934 | | | | 0.0 | % |
| Casma Therapeutics, Inc. Series B1 | | 8/26/20 | | | 5,000,000 | | | | 3,750,000 | | | | 2,185,000 | | | | 0.1 | % |
| Casma Therapeutics, Inc. Series B2 | | 6/7/21 | | | 5,000,000 | | | | 3,750,000 | | | | 2,185,000 | | | | 0.1 | % |
| Casma Therapeutics, Inc. Series C1 | | 7/6/22 | | | 1,820,413 | | | | 837,390 | | | | 795,520 | | | | 0.0 | % |
| Casma Therapeutics, Inc. Series C2 | | 1/31/23 | | | 1,219,013 | | | | 560,746 | | | | 532,709 | | | | 0.0 | % |
| Flare Therapeutics, Inc. Series A | | 4/22/21 | | | 1,097,561 | | | | 1,097,561 | | | | 1,254,622 | | | | 0.1 | % |
| Flare Therapeutics, Inc. Series A2 | | 5/31/22 | | | 902,439 | | | | 902,439 | | | | 1,031,578 | | | | 0.1 | % |
| Flare Therapeutics, Inc. Series B | | 2/1/23 | | | 1,952,962 | | | | 2,349,999 | | | | 2,232,431 | | | | 0.1 | % |
| Freenome Holdings, Inc. Series D | | 11/22/21 | | | 928,098 | | | | 6,999,994 | | | | 4,807,548 | | | | 0.3 | % |
| Goldfinch Biopharma, Inc. Series A | | 3/15/19 | | | 5,000,000 | | | | 5,000,000 | | | | — | | | | 0.0 | % |
| Goldfinch Biopharma, Inc. Series B | | 6/29/20 | | | 8,474,576 | | | | 10,000,000 | | | | — | | | | 0.0 | % |
| Goldfinch Biopharma, Inc. Series B2 | | 3/21/22 | | | 4,237,288 | | | | 5,000,000 | | | | — | | | | 0.0 | % |
| Kojin Therapeutics, Inc. Series A-1 | | 6/2/21 | | | 763,319 | | | | 1,499,998 | | | | 1,424,998 | | | | 0.1 | % |
| Kojin Therapeutics, Inc. Series A-2 | | 1/28/22 | | | 763,319 | | | | 1,499,998 | | | | 1,424,998 | | | | 0.1 | % |
| Korro Bio, Inc. Series B1 | | 11/8/21 | | | 3,831,418 | | | | 10,000,001 | | | | 10,118,775 | | | | 0.6 | % |
| Korro Bio, Inc. Series B2 | | 3/23/23 | | | 3,597,122 | | | | 9,999,999 | | | | 9,499,999 | | | | 0.5 | % |
| LEXEO Therapeutics Series B | | 8/10/21 | | | 8,718,446 | | | | 14,999,999 | | | | 14,250,300 | | | | 0.8 | % |
| Metagenomi, LLC Series B | | 1/21/22 | | | 686,724 | | | | 7,999,998 | | | | 9,177,586 | | | | 0.5 | % |
| Metagenomi, LLC Series B-1 | | 12/20/22 | | | 98,875 | | | | 1,390,944 | | | | 1,321,395 | | | | 0.1 | % |
| Peloton Therapeutics, Inc. - CVR | | 2/14/19 | | | 1,528,871 | | | | — | | | | 1,227,225 | | | | 0.1 | % |
| Prometheus Laboratories, Inc. | | 12/31/20 | | | 1,017,770 | | | | 702,262 | | | | 667,148 | | | | 0.0 | % |
| Shoreline Biosciences Series B | | 10/28/21 | | | 1,489,958 | | | | 15,000,003 | | | | 9,780,829 | | | | 0.5 | % |
| Turnstone Biologics Inc. Series D | | 6/29/21 | | | 3,660,670 | | | | 9,999,999 | | | | 6,589,206 | | | | 0.4 | % |
Eventide Multi-Asset Income Fund
| | | Initial Acquisition | | | | | | | | | | | | |
| Security | | Date | | Shares | | | Cost | | | Value | | | % of Net Assets | |
| Vision Fund International, 3.7250%, 2/24/25 | | 2/25/22 | | | 3,800,000 | | | $ | 3,800,000 | | | $ | 3,800,000 | | | | 1.1 | % |
7. SECTOR EXPOSURE RISK
The Eventide Exponential Technologies Fund invests primarily in equity and equity-related securities of companies in the technology sectors that derive or are expected to derive 50% or more of their revenue from technology products and services including, but not limited to, information technology, communications companies, internet and direct marketing retail services and healthcare technology and devices companies. Because of its focus on technology companies, the Eventide Exponential Technologies Fund’s investment performance will be closely tied to many factors which affect those companies. As a result, the Eventide Exponential Technologies Fund’s net asset value is more likely to have greater fluctuations than that of a fund which invests in other industries.
The Eventide Healthcare & Life Sciences Fund invests primarily in equity and equity-related securities of companies in the healthcare and life sciences sectors that derive or are expected to derive 50% or more of their
| A N N U A L R E P O R T | June 30, 2023 |
revenue from healthcare and life science products and services including, but not limited to, biotechnology, pharmaceuticals, diagnostics, life science tools, medical devices, healthcare information technology, healthcare services, synthetic biology, agricultural and environmental management, and pharmaceutical manufacturing products and services. Because of its focus on healthcare and life science companies, the Eventide Healthcare & Life Sciences Fund’s investment performance will be closely tied to many factors which affect those companies. As a result, the Eventide Healthcare & Life Sciences Fund’s net asset value is more likely to have greater fluctuations than that of a fund which invests in other industries.
8. OPTIONS RISK
There are risks associated with the sale and purchase of call and put options. The seller (writer) of a call option which is covered (e.g., the writer holds the underlying security) assumes the risk of a decline in the market price of an underlying security below the purchase price of an underlying security less the premium received, and gives up the opportunity for gain on the underlying security above the exercise price of the option. The seller of an uncovered call option assumes the risk of a theoretical unlimited increase in the market price of an underlying security above the exercise price of the option. The securities necessary to satisfy the exercise of the call option may be unavailable for purchase except at much higher prices. Purchasing securities to satisfy the exercise of the call option can itself cause the price of securities to rise further, sometimes by a significant amount, thereby exacerbating the loss. The buyer of a call option assumes the risk of losing its entire premium invested in the call option. The seller (writer) of a put option which is covered (e.g., the writer has a short position in the underlying security) assumes the risk of an increase in the market price of the underlying security above the sales price (in establishing the short position) of the underlying security plus the premium received, and gives up the opportunity for gain on the underlying security below the exercise price of the option. The seller of an uncovered put option assumes the risk of a decline in the market price of the underlying security below the exercise price of the option. The buyer of a put option assumes the risk of losing his entire premium invested in the put option.
9. MARKET RISK
Overall market risks may also affect the value of the Funds. The market values of securities or other investments owned by the Funds will go up or down, sometimes rapidly or unpredictably. Factors such as economic growth and market conditions, interest rate levels, exchange rates and political events affect the securities markets. Changes in market conditions and interest rates generally do not have the same impact on all types of securities and instruments. Unexpected local, regional or global events and their aftermath, such as war; acts of terrorism; financial, political or social disruptions; natural, environmental or man-made disasters; climate-change and climate-related events; the spread of infectious illnesses or other public health issues; recessions and depressions; or other tragedies, catastrophes and events could have a significant impact on the Funds and their investments and could result in increased premiums or discounts to a Fund’s net asset value, and may impair market liquidity, thereby increasing liquidity risk. Such events can cause investor fear and panic, which can adversely affect the economies of many companies, sectors, nations, regions and the market in general, in ways that cannot necessarily be foreseen. The Funds could lose money over short periods due to short-term market movements and over longer periods during more prolonged market downturns. During a general market downturn, multiple asset classes may be negatively affected. In times of severe market disruptions you could lose your entire investment.
The impact of the COVID-19 pandemic adversely affected, and other infectious illness outbreaks that may arise in the future could adversely affect, the economies of many nations and the entire global economy, individual issuers and capital markets in ways that cannot necessarily be foreseen. In addition, the impact of infectious
| A N N U A L R E P O R T | June 30, 2023 |
illnesses in emerging market countries may be greater due to generally less established healthcare systems. Public health crises may exacerbate other pre-existing political, social and economic risks in certain countries or globally. The duration of these effects cannot be determined with certainty.
10. LINE OF CREDIT
Effective January 25, 2023, the Eventide Funds have a $150,000,000 uncommitted line of credit provided by U.S. Bank National Association (the “Bank”) under an agreement (the “Uncommitted Line”), that is set to expire on January 24, 2024. Borrowings under the Uncommitted Line bear an interest at Prime Rate minus 0% per month. Any advance under the Uncommitted Line is contemplated primarily for temporary or emergency purposes, including the meeting of redemption requests that otherwise might require the untimely disposition of securities. Interest on borrowings is payable on an annualized basis. The Uncommitted Line is not a “committed” line of credit, which is to say that the Bank is not obligated to lend money to the Funds. Accordingly, it is possible that Funds may wish to borrow money for a temporary or emergency purpose but may not be able to do so. During the year ended June 30, 2023, the Eventide Core Bond Fund, the Eventide Limited-Term Bond Fund and the Eventide Multi-Asset Income Fund accessed the line of credit. Based only on the days borrowed, the average amount of borrowings outstanding was $459,000, $7,399,500 and $5,977,000, respectively. As of June 30, 2023, the line of credit was used a total of one day for the Eventide Core Bond Fund and the Eventide Multi-Asset Income Fund and two days for the Eventide Limited-Term Bond Fund. The maximum borrowings amount during the year ended June 30, 2023 was $459,000, $14,298,000 and $5,977,000 for the Eventide Core Bond Fund, the Eventide Limited-Term Bond Fund and the Eventide Multi-Asset Income Fund, respectively. The maximum borrowings rate during the year ended June 30, 2023 was 5.50%, 6.25% and 7.75%, respectively. As of June 30, 2023, the interest expense for the Eventide Core Bond Fund, the Eventide Limited-Term Bond Fund and the Eventide Multi-Asset Income Fund is $70, $3,983 and $1,286, respectively. The average interest rate for the Eventide Core Bond Fund, the Eventide Limited-Term Bond Fund and the Eventide Multi-Asset Income Fund during the year ended June 30, 2023 was 5.50%, 5.50% and 7.75%, respectively. As of June 30, 2023, each Fund paid $489 in line of credit fees. As of June 30, 2023, the Eventide Core Bond Fund, the Eventide Limited-Term Bond Fund, and the Eventide Multi-Asset Income Fund had $0, $0, and $0 in outstanding borrowings on the Uncommitted Line, respectively.
11. BENEFICIAL OWNERSHIP
The beneficial ownership, either directly or indirectly, of more than 25% of the voting securities of a fund creates a presumption of control of the fund, under Section 2(a)(9) of the 1940 Act. As of June 30, 2023, Charles Schwab & Co, Inc. Special Custody Account for the Exclusive Benefit of Customers held 60.87%, 29.39% and 37.15% of the Eventide Core Bond Fund, Eventide Exponential Technologies Fund and Eventide Limited-Term Bond Fund, respectively. As of June 30, 2023, TD Ameritrade, Inc. for the Exclusive Benefit of Customers held 34.39% of the Eventide Large Cap Focus Fund. As of June 30, 2023, National Financial Services LLC held 28.26% of the Eventide Large Cap Focus Fund.
| A N N U A L R E P O R T | June 30, 2023 |
12. SUBSEQUENT EVENTS
Subsequent events after the date of the Statements of Assets and Liabilities have been evaluated through the date the financial statements were issued. Management has determined that no events or transactions occurred requiring adjustment or disclosure in the financial statements.
| A N N U A L R E P O R T | June 30, 2023 |

REPORT OF INDEPENDENT REGISTERED PUBLIC ACCOUNTING FIRM
To the Shareholders of Eventide Core Bond Fund, Eventide Dividend Opportunities Fund, Eventide Exponential Technologies Fund, Eventide Gilead Fund, Eventide Healthcare & Life Sciences Fund, Eventide Large Cap Focus Fund, Eventide Limited-Term Bond Fund, Eventide Multi-Asset Income Fund, and Board of Trustees of Mutual Fund Series Trust
Opinion on the Financial Statements
We have audited the accompanying statements of assets and liabilities, including the schedules of investments, of Eventide Core Bond Fund, Eventide Dividend Opportunities Fund, Eventide Exponential Technologies Fund, Eventide Gilead Fund, Eventide Healthcare & Life Sciences Fund, Eventide Limited- Term Bond Fund, and Eventide Multi-Asset Income Fund (the “Funds”), each a series of Mutual Fund Series Trust, as of June 30, 2023, the related statements of operations and changes in net assets, the related notes, and the financial highlights for the year then ended (collectively referred to as the “financial statements”). In our opinion, the financial statements present fairly, in all material respects, the financial position of the Funds as of June 30, 2023, the results of their operations, the changes in net assets, and the financial highlights for the year then ended, in conformity with accounting principles generally accepted in the United States of America.
We have also audited the accompanying statement of assets and liabilities, including the schedule of investments, of Eventide Large Cap Focus Fund (the “Fund”), a series of Mutual Fund Series Trust, as of June 30, 2023, the related statements of operations and changes in net assets, the related notes, and the financial highlights for the period June 30, 2022 (commencement of operations) to June 30, 2023 (collectively referred to as the “financial statements”). In our opinion, the financial statements present fairly, in all material respects, the financial position of the Fund as of June 30, 2023, and the results of its operations, the changes in net assets, and the financial highlights for the period then ended, in conformity with accounting principles generally accepted in the United States of America.
The Funds’ financial statements and financial highlights for the years and periods ended June 30, 2022, and prior, were audited by another auditor whose report dated August 29, 2022 expressed an unqualified opinion on those financial statements and financial highlights.
Basis for Opinion
These financial statements are the responsibility of the Funds’ management. Our responsibility is to express an opinion on the Funds’ financial statements based on our audits. We are a public accounting firm registered with the Public Company Accounting Oversight Board (United States) (“PCAOB”) and are required to be independent with respect to the Funds in accordance with the U.S. federal securities laws and the applicable rules and regulations of the Securities and Exchange Commission and the PCAOB.
We conducted our audits in accordance with the standards of the PCAOB. Those standards require that we plan and perform the audits to obtain reasonable assurance about whether the financial statements are free of material misstatement whether due to error or fraud.
COHEN & COMPANY, LTD.
800.229.1099 | 866.818.4538 fax | cohencpa.com
Registered with the Public Company Accounting Oversight Board
| A N N U A L R E P O R T | June 30, 2023 |
Our audits included performing procedures to assess the risks of material misstatement of the financial statements, whether due to error or fraud, and performing procedures that respond to those risks. Such procedures included examining, on a test basis, evidence regarding the amounts and disclosures in the financial statements. Our procedures included confirmation of securities owned as of June 30, 2023, by correspondence with the custodian, issuers, and brokers; when replies were not received from issuers and brokers, we performed other auditing procedures. Our audits also included evaluating the accounting principles used and significant estimates made by management, as well as evaluating the overall presentation of the financial statements. We believe that our audits provide a reasonable basis for our opinion.
We have served as the Funds’ auditor since 2023.

COHEN & COMPANY, LTD.
Philadelphia, Pennsylvania
August 29, 2023
| A N N U A L R E P O R T | June 30, 2023 |
| Eventide Funds | |
| Consideration and Renewal of Management Agreement (Unaudited) | June 30, 2023 |
Consideration and Renewal of Management Agreement between Mutual Fund Series Trust and Eventide Asset Management, LLC with respect to Eventide Gilead Fund, Eventide Healthcare and Life Sciences Fund, Eventide Multi-Asset Income Fund, Eventide Dividend Opportunities Fund, Eventide Limited-Term Bond Fund, Eventide Exponential Technologies Fund, and Eventide Core Bond Fund
In connection with a meeting held on May 9, 10 and 22, 2023, the Board of Trustees (the “Board”) of Mutual Fund Series Trust (the “Trust”), including a majority of the Trustees who are not “interested persons” as that term is defined in the Investment Company Act of 1940, as amended, discussed the renewal of the management agreement (the “Eventide Agreement”) between the Trust and Eventide Asset Management, LLC (“Eventide”) with respect to Eventide Gilead Fund (“Eventide Gilead”), Eventide Healthcare and Life Sciences Fund (“Eventide HLS”), Eventide Multi-Asset Income Fund (“Eventide MAI”), Eventide Dividend Opportunities Fund (“Eventide DO”), Eventide Limited-Term Bond Fund (“Eventide LTB”), Eventide Exponential Technologies Fund (“Eventide ET”) and Eventide Core Bond Fund (“Eventide CB”) (collectively, the “Eventide Renewal Funds”)
The Board examined Eventide’s responses to a series of questions regarding, among other things, its management services provided to the Eventide Renewal Funds, comparative fee and expense information, and profitability from managing the Eventide Renewal Funds. The Board was assisted by legal counsel throughout the review process and relied upon the advice of legal counsel and its own business judgment in determining the material factors to be considered in evaluating the Eventide Agreement and the weight to be given to each factor considered. The conclusions reached by the Board were based on a comprehensive evaluation of all of the information provided and were not the result of any one factor. Moreover, each Trustee may have afforded different weight to the various factors in reaching his conclusions with respect to the renewal of the Eventide Agreement.
Nature, Extent and Quality of Services. The Board reviewed Eventide’s management team, noting that Eventide continued to invest in talented personnel, and the key personnel that provided both investment related and non-investment related services to the Eventide Renewal Funds. The Board discussed Eventide’s services provided to the Eventide Renewal Funds, including portfolio positioning, security selection, compliance oversight and ethical screening services. The Board commented that Eventide used a third-party service to ensure compliance with the Eventide Renewal Funds’ investment limitations and guidelines on a pre- and post-trade basis and that there had been no material compliance issues since the Eventide Agreement’s most recent renewal. The Board acknowledged Eventide’s transition to a new managed service provider to enhance its cybersecurity protocols and that Eventide reported no material data security incidents. The Board noted that an SEC examination that began in July 2022 was concluded with a “no further action” letter from the SEC. The Board agreed that Eventide’s team members had demonstrated a strong, collaborative working relationship with the Trust. The Board concluded it expected Eventide to continue providing high quality service to each Eventide Renewal Fund and its shareholders.
| A N N U A L R E P O R T | June 30, 2023 |
Performance. The Board reviewed the performance of each Eventide Renewal Fund relative to its peer group and Morningstar category.
| ■ | Eventide Gilead: The Board commented that Eventide Gilead had outperformed all benchmarks over the 5-year and 10-year periods, though it underperformed all benchmarks for the 1-year period. The Board observed that Eventide attributed the underperformance to Eventide Gilead’s selection in the information technology and industrials sectors, as well as the impact of inflation and rising interest rates on the industrial sector. The Board acknowledged that Eventide remained committed to Eventide Gilead’s long-term investment strategy. |
| ■ | Eventide HLS: The Board noted that Eventide HLS outperformed all benchmarks for the 1-year and 10-year periods and outperformed the S&P Biotechnology Select Industry TR Index for the 3-year and 5-year periods. The Board discussed Eventide’s explanation that Eventide HLS’s underperformance to the peer group and US Fund Health Morningstar category for the 3-year and 5-year periods could be attributed to its high conviction portfolio, which led to greater volatility. |
| ■ | Eventide MAI: The Board observed that Eventide MAI outperformed all benchmarks for the 3-year, 5-year and since inception periods and outperformed its peer group and Morningstar category over the 1-year period. The Board noted that Eventide MAI outperformed a blended benchmark comprised of 50% Russell Mid Cap Value Index and 50% Bloomberg U.S. Intermediate Aggregate Bond Index over the 3-year and 5-year periods. |
| ■ | Eventide DO: The Board noted that Eventide DO outperformed all benchmarks across the 3-year and 5-year periods and its peer group and Morningstar category over the since inception period with strong positive returns, though it underperformed all of its benchmarks for the 1-year period and the Russell Mid Cap Total Return Index over the since inception period due to elevated market volatility. |
| ■ | Eventide LTB: The Board recognized that Eventide LTB outperformed the Bloomberg Government 1-5 year Index over the 1-year and 10-year period but trailed its benchmarks for all other periods. The Board noted that fixed income securities experienced elevated interest rate volatility because of heightened concerns of inflation and restrictive monetary policy. The Board observed that the 3-year and 5-year performance data reflected performance of Eventide LTB under a different sub-advisor. |
| ■ | Eventide ET: The Board remarked that Eventide ET outperformed its peer group for the since inception period but underperformed all of its benchmarks for the 1-year period with negative returns. The Board acknowledged Eventide’s explanation that the underperformance over the 1-year period was a result of Eventide ET’s focus on smaller cap companies and stock selection. The Board took notice of Eventide’s confidence in the long-term performance of Eventide ET’s investment strategy and process. |
| ■ | Eventide CB: The Board discussed that Eventide CB had slightly outperformed the Morningstar category over the 1-year period but underperformed all other benchmarks across all periods. The Board noted that fixed income securities experienced elevated interest rate volatility because of heightened inflation concerns and restrictive monetary policy. The Board considered Eventide’s explanation that the underperformance of Eventide CB compared to its benchmarks was due to Eventide CB’s launch coinciding with the rise in interest rates. |
After discussion, the Board concluded that the performance of each Eventide Renewal Fund was acceptable.
Fees and Expenses: The Board reviewed the management fee for each Eventide Renewal Fund, and the average fees charged by each Eventide Renewal Fund’s peer group and Morningstar category. The Board considered the soft dollar benefits received by Eventide, the sub-advisory fees paid with respect to certain of the Eventide Renewal Funds and the indirect benefits of Rule 12b-1 fees paid with respect to the distribution of the Eventide Renewal Funds. The Board acknowledged Eventide’s belief that its management fees were fair considering its expertise in dividend producing equity sectors, biotechnical research, ethical screening and active management of the Eventide Renewal Funds. The Board noted the uniqueness of the Eventide Renewal Funds in the
| A N N U A L R E P O R T | June 30, 2023 |
marketplace. The Board concluded that the management fee for each Eventide Renewal Fund was not unreasonable.
| ■ | Eventide Gilead: The Board commented that Eventide Gilead’s management fee and net expense ratio were above the medians and averages of its peer group and Morningstar category but well below the highs of each. The Board noted that Eventide Gilead’s involved a specialized due diligence process due to the nature of the smaller market capitalization size of portfolio companies than Eventide Gilead’s relevant category or peer group. |
| ■ | Eventide HLS: The Board discussed that Eventide HLS’s management fee and net expense ratio were higher than the medians and averages of its peer group and Morningstar category, but below the highs of each. The Board noted that Eventide employed a highly differentiated values-based screening process to align Eventide HLS’s holdings with its stated objective and required investment personnel with specific training and educational degrees. |
| ■ | Eventide MAI: The Board remarked that Eventide MAI’s management fee was higher than the averages of its peer group and Morningstar category but well below the highs of each. The Board noted that Eventide MAI’s net expense ratio was slightly higher than the medians of its peer group and Morningstar category and average of its peer group but lower than the average of its Morningstar category. The Board acknowledged Eventide’s explanation that the Eventide MAI was the only fund in its peer group that provided values-based screening across a multi-asset base, which provided significant value to Eventide MAI for attracting investors. |
| ■ | Eventide DO: The Board observed that the management fee for Eventide DO was slightly lower than the median of the peer group and on par with the median of its Morningstar category. The Board acknowledged that Eventide DO’s net expense ratio was in line with the median of its peer group and only slightly higher than the median and average of its Morningstar category. |
| ■ | Eventide LTB: The Board noted that Eventide LTB’s management fee was lower than the averages and medians of its peer group and Morningstar category. The Board observed that Eventide LTB’s net expense ratio was lower than the median and average of its peer group and within the range of its Morningstar category. The Board noted that Eventide reduced its management fee for Eventide LTB by two basis points and acknowledged that the sub-advisor proposed to reduce its sub-advisory fee by one basis point once the aggregate asset level of the Funds and investment products offered by Eventide and sub-advised by the sub-advisor exceeded $500 million. |
| ■ | Eventide ET: The Board commented that the management fee and net expense ratio for Eventide ET were higher than the averages and medians of its peer group and Morningstar category, but significantly below the highs of each. |
| ■ | Eventide CB: The Board observed that the management fee for Eventide CB was slightly below the median management fee of the peer group and Morningstar category and slightly higher than the average of its Morningstar category. The Board noted that Eventide CB’s net expense ratio was slightly higher than the averages and medians of the peer group and Morningstar category but well within the range of each. The Board noted that Eventide reduced its management fee for Eventide CB by two basis points and acknowledged that the sub-advisor proposed to reduce its sub-advisory fee by one basis point once the aggregate asset level of the Funds and investment products offered by Eventide and sub-advised by the sub-advisor exceeded $500 million. |
After further discussion, the Board concluded that based on the information and advisory services provided by Eventide and its sub-advisor, including the payment of the sub-advisory fees by Eventide, that the management fee for each Eventide Renewal Fund was not unreasonable.
Profitability: The Board discussed Eventide’s profitability from its relationship with each Eventide Renewal Fund based on the information that Eventide provided and took note of other revenue and expenses related to
| A N N U A L R E P O R T | June 30, 2023 |
each Eventide Renewal Fund. The Board noted that some of Eventide’s senior personnel received compensation in the form of ownership distributions that, if included as an operating expense in Eventide’s calculations, would reduce the estimated profit levels. The Board discussed that Eventide calculated its indirect expenses for each Eventide Renewal Fund based on the Fund’s percentage of Eventide’s gross revenue. The Board noted that Eventide was managing Eventide LTB and Eventide CB at a loss. The Board therefore concluded that excessive profitability of Eventide with respect to either of Eventide LTB or Eventide CB was not an issue at this time.
The Board commented that Eventide earned a reasonable profit from its relationship with each of Eventide Gilead, Eventide HLS, Eventide MAI, Eventide DO and Eventide ET. After further discussion, the Board determined that Eventide’s profit in connection with these Eventide Renewal Funds was not excessive.
Economies of Scale: The Board noted that Eventide Gilead had breakpoints in its management fee schedule, but that the other Eventide Funds did not. The Board discussed that each Eventide Renewal Fund had an expense cap and that shareholders benefitted from economies of scale from being in a family of funds. The Board discussed the breakpoints on the fee schedule of the sub-advisor to Eventide MAI, Eventide LTB and Eventide CB and how such breakpoints could benefit Eventide. The Board agreed to revisit the issue of breakpoints at the Eventide Agreement’s next renewal.
Conclusion. Having requested and received such information from Eventide as the Board believed to be reasonably necessary to evaluate the terms of the Eventide Agreement, and as assisted by the advice of counsel, the Board concluded that renewal of the Eventide Agreement was in the best interests of each Eventide Renewal Fund and its respective shareholders.
| A N N U A L R E P O R T | June 30, 2023 |
| Eventide Funds | |
| Consideration and Renewal of Sub-Advisory Agreement (Unaudited) | June 30, 2023 |
Consideration and Renewal of the Sub-Advisory Agreements between Eventide Asset Management, LLC and Boyd Watterson Asset Management LLC with respect to Eventide Core Bond Fund, Eventide Limited-Term Bond Fund and Eventide Multi-Asset Income Fund
In connection with a meeting held on May 9, 10 and 22, 2023, the Board of Trustees (the “Board”) of Mutual Fund Series Trust (the “Trust”), including a majority of the Trustees who are not “interested persons” as that term is defined in the Investment Company Act of 1940, as amended, discussed the renewal of the sub-advisory agreements (the “Boyd Agreements”) between Eventide Asset Management, LLC (“Eventide”) and Boyd Watterson Asset Management LLC (“Boyd”) with respect to Eventide Core Bond Fund (“Eventide CB”); Eventide Limited-Term Bond Fund (“Eventide LTB”) and Eventide Multi-Asset Income Fund (“Eventide MAI”).
The Board examined Boyd’s responses to a series of questions regarding, among other things, its sub-advisory services provided to Eventide CB, Eventide LTB and Eventide MAI, comparative fee and expense information, and profitability from sub-advising Eventide CB, Eventide LTB and Eventide MAI. The Board was assisted by legal counsel throughout the review process and relied upon the advice of legal counsel and its own business judgment in determining the material factors to be considered in evaluating the Boyd Agreements and the weight to be given to each factor considered. The conclusions reached by the Board were based on a comprehensive evaluation of all of the information provided and were not the result of any one factor. Moreover, each Trustee may have afforded different weight to the various factors in reaching his conclusions with respect to renewal of the Boyd Agreements.
Nature, Extent and Quality of Services: The Board noted that there were no recent departures or additions to Boyd’s key personnel servicing Eventide CB, Eventide LTB or Eventide MAI. The Board observed that Boyd provided a variety of investment advisory services to Eventide CB, Eventide LTB and Eventide MAI, including portfolio management and trading and settling of securities. The Board noted that Boyd’s portfolio management team met regularly to assess sector valuation and new issues, purchase and sale candidates, changes in credit ratings and economic and market news. The Board commented that Boyd’s credit research team utilized a bottom-up approach to invest in high quality strategic issuers that could be held throughout a full credit cycle. The Board acknowledged that Boyd drew upon various members of its fixed income team, in addition to the portfolio manager, to fulfill the investment needs of Eventide CB, Eventide LTB and Eventide MAI. The Board observed that Boyd’s proprietary informational technology system was designed to ensure compliance with investment objectives and guidelines. The Board noted that Boyd selected broker-dealers on the basis of best execution and acknowledged that Boyd had reported no material compliance or litigation issues in the past year. The Board acknowledged that Boyd reported that its in-house staff was continuously monitoring and improving its cybersecurity systems and software and that there were no material data security incidents in the past year. After further discussion, the Board concluded that Boyd had the ability to continue providing high quality service to Eventide CB, Eventide LTB, Eventide MAI and their respective shareholders.
| A N N U A L R E P O R T | June 30, 2023 |
Performance. The Board reviewed the performance of each of Eventide CB, Eventide LTB and Eventide MAI relative to its benchmarks.
| ■ | Eventide CB: The Board discussed that Eventide CB had slightly outperformed the Morningstar category over the 1-year period but underperformed all other benchmarks across all periods. The Board noted that fixed income securities experienced elevated interest rate volatility because of heightened inflation concerns and restrictive monetary policy. The Board considered Eventide’s explanation that the underperformance of Eventide CB compared to its benchmarks was due to Eventide CB’s launch coinciding with the rise in interest rates. |
| ■ | Eventide LTB: The Board recognized that Eventide LTB outperformed the Bloomberg Government 1-5 year over the 1-year and 10-year period but trailed its benchmarks for all other periods. The Board noted that fixed income securities experienced elevated interest rate volatility because of heightened concerns of inflation and restrictive monetary policy. The Board observed that the 3-year and 5-year performance data reflected performance of Eventide LTB under a different sub-advisor. |
| ■ | Eventide MA: The Board observed that Eventide MAI outperformed all benchmarks for the 3-year, 5-year and since inception periods and outperformed its peer group and Morningstar category over the 1-year period. The Board noted that Eventide MAI outperformed a blended benchmark comprised of 50% Russell Mid Cap Value Index and 50% Bloomberg U.S. Intermediate Aggregate Bond Index over the 3-year and 5-year periods. |
Fees and Expenses. The Board discussed Boyd’s tiered sub-advisory fee schedule for Eventide CB, Eventide LTB and Eventide MAI, including the levels at which breakpoints would reduce the fee. The Board noted that Boyd added a larger breakpoint at $500 million and a sub-advisory fee of 0.06% at that breakpoint, which was a one basis point reduction once the aggregate asset level of the Funds and investment products offered by Eventide and sub-advised by Boyd exceeded $500 million. The Board acknowledged Boyd’s assertion that there would be no changes in the services and quality provided as a result of the fee reduction. The Board reviewed the allocation of fees between Eventide and Boyd relative to their respective duties and other factors and agreed the allocations for Eventide CB, Eventide LTB and Eventide MAI were appropriate. They also considered the sub-advisory fee breakpoints, the benefit of which accrued to the Funds. The Board concluded that the sub-advisory fees for Eventide CB, Eventide LTB and Eventide MAI were not unreasonable.
Profitability. The Board recognized that Boyd earned a modest profit from sub-advising each of Eventide CB, Eventide LTB and Eventide MAI. The Board determined that Boyd’s profits were not excessive.
Economies of Scale. The Board considered whether Boyd had realized economies of scale with respect to the sub-advisory services provided to any of Eventide CB, Eventide LTB or Eventide MAI. The Board agreed that this was primarily an advisor-level issue and should be considered with respect to the overall management agreement taking into consideration the impact of the sub-advisory expense. The Board concluded that, based on the current size of Eventide CB, Eventide LTB, and Eventide MAI, it was unlikely that Boyd was benefitting from any material economies of scale, but would be monitored alongside the advisor fees.
Conclusion. Having requested and received such information from Boyd as the Board believed to be reasonably necessary to evaluate the terms of the Boyd Agreements, and as assisted by the advice of counsel, the Board concluded that renewal of the Boyd Agreements was in the best interests of Eventide CB, Eventide LTB, Eventide MAI and their shareholders.
| A N N U A L R E P O R T | June 30, 2023 |
| Eventide Funds | |
| Supplemental Information (Unaudited) | June 30, 2023 |
The Funds have adopted and implemented a written liquidity risk management program as required by Rule 22e-4 (the “Liquidity Rule”) under the Investment Company Act. The program is reasonably designed to assess and manage the Funds’ liquidity risk, taking into consideration, among other factors, the Funds’ investment strategies and the liquidity of their portfolio investments during normal and reasonably foreseeable stressed conditions; its short and long-term cash flow projections; and its cash holdings and access to other funding sources.
During the year ended June 30, 2023, the Board and the Trust’s Liquidity Risk Management Program Committee (the “Committee”) reviewed the Funds’ investments and they determined that the Funds held adequate levels of cash and highly liquid investments to meet shareholder redemption activities in accordance with applicable requirements. Accordingly, the Board and Committee concluded that (i) the Funds’ liquidity risk management program is reasonably designed to prevent violations of the Liquidity Rule and (ii) the Funds’ liquidity risk management program has been effectively implemented.
| A N N U A L R E P O R T | June 30, 2023 |
| Eventide Funds | |
| Expense Examples (Unaudited) | June 30, 2023 |
As a shareholder of a Fund, you incur two types of costs: (1) transaction costs, including sales charges (loads) on purchases of Class A shares; and 2 ongoing costs, including management fees, distribution and/or service (12b-1) fees, and other Fund expenses. This example is intended to help you understand your ongoing costs (in dollars) of investing in a Fund and to compare these costs with the ongoing costs of investing in other mutual funds.
The example for Eventide Core Bond Fund, Eventide Dividend Opportunities Fund, Eventide Exponential Technologies Fund, Eventide Gilead Fund, Eventide Healthcare & Life Sciences Fund, Eventide Limited-Term Bond Fund and Eventide Multi-Asset Income Fund is based on an investment of $1,000 invested at the beginning of the period and held for the entire period from January 1, 2023 through June 30, 2023.
Actual Expenses
The “Actual” columns in the table below provide information about actual account values and actual expenses. You may use the information below, together with the amount you invested, to estimate the expenses that you paid over the period. Simply divide your account value by $1,000 (for example, an $8,600 account value divided by $1,000 = 8.6), then multiply the result by the number in the table under the heading entitled “Expenses Paid During Period” to estimate the expenses you paid on your account during this period.
Hypothetical Example for Comparison Purposes
The “Hypothetical” columns in the table below provide information about hypothetical account values and hypothetical expenses based on the actual expense ratio of each of Eventide Core Bond Fund, Eventide Dividend Opportunities Fund, Eventide Exponential Technologies Fund, Eventide Gilead Fund, Eventide Healthcare & Life Sciences Fund, Eventide Limited-Term Bond Fund and Eventide Multi-Asset Income Fund and an assumed rate of return of 5% per year before expenses, which is not the Funds’ actual returns. The hypothetical account values and expenses may not be used to estimate the actual ending account balances or expenses you paid for the period. You may use this information to compare this 5% hypothetical example with the 5% hypothetical examples that appear in the shareholder reports of other funds.
Please note that the expenses shown in the table are meant to highlight your ongoing costs only and do not reflect any transactional costs, such as sales charges (loads), or redemption fees. Therefore, the table is useful in comparing ongoing costs only, and will not help you determine the relative total costs of owning different funds. In addition, if these transactional costs were included, your costs would have been higher.
| A N N U A L R E P O R T | June 30, 2023 |
| | | | | | | | | | | Hypothetical |
| | | | | | | Actual | | (5% return before expenses) |
| | | | | Beginning | | | | | | | | |
| | | Funds’ | | Account | | Ending Account | | Expenses | | Ending | | |
| | | Annualized | | Value | | Value | | Paid During | | Account Value | | Expenses Paid |
| | | Expense Ratio | | 1/1/23 | | 6/30/23 | | Period1 | | 6/30/23 | | During Period |
| Eventide Core Bond Fund - Class N | | 0.78% | | $1,000.00 | | $1,019.20 | | $3.91 | | $1,020.93 | | $3.91 |
| Eventide Core Bond Fund – Class A | | 0.83% | | 1,000.00 | | 1,017.80 | | 4.15 | | 1,020.68 | | 4.16 |
| Eventide Core Bond Fund – Class C | | 1.58% | | 1,000.00 | | 1,015.10 | | 7.90 | | 1,016.96 | | 7.90 |
| Eventide Core Bond Fund – Class I | | 0.58% | | 1,000.00 | | 1,018.90 | | 2.90 | | 1,021.92 | | 2.91 |
| Eventide Dividend Opportunities Fund - Class N | | 1.15% | | 1,000.00 | | 1,083.40 | | 5.96 | | 1,019.07 | | 5.78 |
| Eventide Dividend Opportunities Fund – Class A | | 1.20% | | 1,000.00 | | 1,083.90 | | 6.22 | | 1,018.82 | | 6.03 |
| Eventide Dividend Opportunities Fund – Class C | | 1.95% | | 1,000.00 | | 1,079.40 | | 10.08 | | 1,015.10 | | 9.77 |
| Eventide Dividend Opportunities Fund – Class I | | 0.95% | | 1,000.00 | | 1,084.40 | | 4.93 | | 1,020.06 | | 4.78 |
| Eventide Exponential Technologies Fund - Class N | | 1.63% | | 1,000.00 | | 1,215.80 | | 8.96 | | 1,016.71 | | 8.15 |
| Eventide Exponential Technologies Fund – Class A | | 1.68% | | 1,000.00 | | 1,215.80 | | 9.23 | | 1,016.46 | | 8.40 |
| Eventide Exponential Technologies Fund – Class C | | 2.43% | | 1,000.00 | | 1,212.80 | | 13.34 | | 1,012.74 | | 12.13 |
| Eventide Exponential Technologies Fund – Class I | | 1.43% | | 1,000.00 | | 1,217.70 | | 7.87 | | 1,017.70 | | 7.16 |
| Eventide Gilead Fund – Class N | | 1.38% | | 1,000.00 | | 1,174.50 | | 7.42 | | 1,017.97 | | 6.88 |
| Eventide Gilead Fund – Class A | | 1.43% | | 1,000.00 | | 1,174.20 | | 7.71 | | 1,017.70 | | 7.15 |
| Eventide Gilead Fund – Class C | | 2.18% | | 1,000.00 | | 1,169.80 | | 11.71 | | 1,014.00 | | 10.87 |
| Eventide Gilead Fund – Class I | | 1.18% | | 1,000.00 | | 1,175.60 | | 6.34 | | 1,018.97 | | 5.88 |
| Eventide Healthcare & Life Sciences Fund – Class N | | 1.50% | | 1,000.00 | | 1,129.50 | | 7.94 | | 1,017.34 | | 7.52 |
| Eventide Healthcare & Life Sciences Fund – Class A | | 1.55% | | 1,000.00 | | 1,129.20 | | 8.19 | | 1,017.10 | | 7.76 |
| Eventide Healthcare & Life Sciences Fund – Class C | | 2.30% | | 1,000.00 | | 1,124.70 | | 12.13 | | 1,013.37 | | 11.50 |
| Eventide Healthcare & Life Sciences Fund – Class I | | 1.30% | | 1,000.00 | | 1,130.80 | | 6.88 | | 1,018.34 | | 6.51 |
| Eventide Large Cap Focus Fund – Class N | | 1.15% | | 1,000.00 | | 1,176.00 | | 6.20 | | 1,019.09 | | 5.76 |
| Eventide Large Cap Focus Fund – Class A | | 1.20% | | 1,000.00 | | 1,174.00 | | 6.46 | | 1,018.85 | | 6.00 |
| Eventide Large Cap Focus Fund – Class C | | 1.95% | | 1,000.00 | | 1,171.10 | | 10.49 | | 1,015.13 | | 9.74 |
| Eventide Large Cap Focus Fund – Class I | | 0.95% | | 1,000.00 | | 1,176.60 | | 5.11 | | 1,020.10 | | 4.75 |
| Eventide Limited-Term Bond Fund – Class N | | 0.75% | | 1,000.00 | | 1,016.30 | | 3.76 | | 1,021.06 | | 3.77 |
| Eventide Limited-Term Bond Fund – Class A | | 0.80% | | 1,000.00 | | 1,016.10 | | 4.01 | | 1,020.82 | | 4.02 |
| Eventide Limited-Term Bond Fund – Class C | | 1.55% | | 1,000.00 | | 1,012.30 | | 7.75 | | 1,017.10 | | 7.76 |
| Eventide Limited-Term Bond Fund – Class I | | 0.55% | | 1,000.00 | | 1,016.90 | | 2.77 | | 1,022.05 | | 2.77 |
| Eventide Multi-Asset Income Fund – Class N | | 1.02% | | 1,000.00 | | 1,049.50 | | 5.19 | | 1,019.73 | | 5.11 |
| Eventide Multi-Asset Income Fund – Class A | | 1.07% | | 1,000.00 | | 1,049.20 | | 5.44 | | 1,019.49 | | 5.36 |
| Eventide Multi-Asset Income Fund – Class C | | 1.82% | | 1,000.00 | | 1,045.60 | | 9.23 | | 1,015.77 | | 9.10 |
| Eventide Multi-Asset Income Fund – Class I | | 0.82% | | 1,000.00 | | 1,050.60 | | 4.17 | | 1,020.73 | | 4.11 |
| 1. | Expenses are equal to the average account value over the period, multiplied by the Funds’ annualized expense ratio, multiplied by the number of days in the period (181) divided by the number of days in the fiscal year (365). |
| A N N U A L R E P O R T | June 30, 2023 |
| Eventide Funds | |
| Change in Independent Registered Public Accounting Firm (Unaudited) | June 30, 2023 |
On March 9, 2023, BBD, LLP (“BBD”) ceased to serve as the independent registered public accounting firm of the Eventide Core Bond Fund, Eventide Dividend Opportunities Fund, Eventide Exponential Technologies Fund, Eventide Gilead Fund, Eventide Healthcare & Life Sciences Fund, Eventide Large Cap Focus Fund, Eventide Limited-Term Bond Fund and the Eventide Multi-Asset Income Fund (The “Funds”), each a series of Mutual Fund Series Trust. The Audit Committee of the Board of Trustees approved the replacement of BBD as a result of Cohen & Company, Ltd.’s (“Cohen”) acquisition of BBD’s investment management group.
The reports of BBD on the financial statements of the Funds as of and for the fiscal years ended June 30, 2021 and June 30, 2022 did not contain an adverse opinion or a disclaimer of opinion, and were not qualified or modified as to uncertainties, audit scope or accounting principles. During the fiscal years ended June 30, 2021 and June 30, 2022, and during the subsequent interim period through March 9, 2023, (i) there were no disagreements between the registrant and BBD on any matter of accounting principles or practices, financial statement disclosure, or auditing scope or procedure, which disagreements, if not resolved to the satisfaction of BBD, would have caused it to make reference to the subject matter of the disagreements in its report on the financial statements of the Funds for such years or interim period; and (ii) there were no “reportable events,” as defined in Item 3041,(1)(v) of Regulation S-K under the Securities Exchange Act of 1934, as amended.
The registrant requested that BBD furnish it with a letter addressed to the U.S. Securities and Exchange Commission stating that it agrees with the above statements. A copy of such letter is filed as an exhibit to Form N-CSR.
On May 22, 2023, the Audit Committee of the Board of Trustees also recommended and approved the appointment of Cohen as the Funds’ independent registered public accounting firm for the fiscal year ending June 30, 2023.
During the fiscal years ended June 30, 2021 and June 30, 2022, and during the subsequent interim period through May 22, 2023, neither the registrant, nor anyone acting on its behalf, consulted with Cohen on behalf of the Funds regarding the application of accounting principles to a specified transaction (either completed or proposed), the type of audit opinion that might be rendered on the Funds’ financial statements, or any matter that was either: (i) the subject of a “disagreement,” as defined in Item 3041,(1)(iv) of Regulation S-K and the instructions thereto; or (ii) “reportable events,” as defined in Item 3041,(1)(v) of Regulation S-K.
| A N N U A L R E P O R T | June 30, 2023 |
| Eventide Funds | |
| Additional Information (Unaudited) | June 30, 2023 |
Reference is made to the Prospectus and the Statement of Additional Information for more detailed descriptions of the Management Agreement, Services Agreement and Distribution and/or Service (12b-1) Plan, tax aspects of each Fund and the calculation of the net asset value of shares of each Fund.
The Funds file a complete schedule of portfolio holdings with the Securities and Exchange Commission (the “SEC”) for the first and third quarters of each fiscal year as an exhibit to its reports on Form N-PORT, within sixty days after the end of the period. Form N-PORT reports are available at the SEC’s website at http://www.sec.gov. The information on Form N-PORT is available without charge, upon request, by calling 1-877-771-3836.
Information regarding how each Fund voted proxies relating to portfolio securities during the twelve month period ended June 30 as well as a description of the policies and procedures that each Fund uses to determine how to vote proxies relating to portfolio securities is available without charge, upon request, by calling 1-877-771-3836; and on the SEC’s website at http://www.sec.gov.
| A N N U A L R E P O R T | June 30, 2023 |
| Eventide Funds | |
| Independent Trustees (Unaudited) | June 30, 2023 |
Name, Address
Year of Birth | Position(s)
Held with
Registrant | Term and
Length
Served1 | Principal
Occupation(s)
During Past 5
Years | Number of
Portfolios
Overseen in the
Fund Complex2 | Other Directorships
Held During Past 5
Years |
Tobias Caldwell
c/o Mutual Fund
Series Trust
36 N. New York
Avenue,
Huntington, NY
11743
Year of Birth: 1967 | Lead Trustee, Chairman of the Audit Committee and Nominating Committee | Since 6/2006 | Manager of Genovese Family Enterprises LLC & affiliates, the Genovese family office, since 1999; Managing Member of Bear Properties, LLC, a real estate management firm, since 2006; Managing Member of PTL Real Estate LLC, from 2000 until 2019. | 53 | Trustee of Variable Insurance Trust since 2010; Chairman of the Board of Mutual Fund and Variable Insurance Trust since 2016; Chairman of the Board of Strategy Shares since 2016; Trustee of IDX Funds Trust since 2016; Chairman of the Board of AlphaCentric Prime Meridian Income Fund since 2018 |
| | | | | | |
Tiberiu Weisz
c/o Mutual Fund
Series Trust
36 N. New York
Avenue,
Huntington, NY
11743
Year of Birth: 1949 | Trustee, Chairman of the Risk and Compliance Committee | Since 6/2006 | Attorney since 1982. | 36 | Trustee of Variable Insurance Trust since 2010 |
| | | | | | |
Stephen P. Lachenauer
c/o Mutual Fund
Series Trust
36 N. New York
Avenue,
Huntington, NY
11743
Year of Birth: 1967 | Trustee | Since 4/2022 | Attorney, private practice since 2010. | 53 | Trustee and Chair of the Audit and Risk and Compliance Committees since 2016, and Chair of the Investment Committee since November 2020, Mutual Fund and Variable Insurance Trust; Trustee and Chair of the Audit and Risk and Compliance Committees since 2016, and Chair of the Investment Committee since November 2020, Strategy Shares; Chairman of the Board, TCG Financial Series Trusts I-X since 2015; Trustee and Chair of the Audit and Risk and Compliance Committees since 2018, and Chair of the Investment Committee since November 2020, AlphaCentric Prime Meridian Income Fund. |
| A N N U A L R E P O R T | June 30, 2023 |
| Eventide Funds | |
| Interested Trustee3 and Officers (Unaudited) | June 30, 2023 |
Name, Address
Year of Birth | Position(s)
Held with
Registrant | Term and
Length
Served1 | Principal
Occupation(s)
During Past 5
Years | Number of
Portfolios
Overseen in the
Fund Complex2 | Other Directorships
Held During Past 5
Years |
Jerry Szilagyi
53 Palmeras St.
Suite 601
San Juan, PR
00901
Year of Birth: 1962 | Chairman of the Board | Trustee since 7/2006; President 2/2012- 3/2022 | President of the Trust, 2/2012-3/2022; President, Rational Advisors, Inc., 1/2016-present; Chief Executive Officer, Catalyst Capital Advisors LLC, 1/2006-present; Member, AlphaCentric Advisors LLC, 2/2014-present; Managing Member, MFund Distributors LLC, 10/2012-present; Managing Member, MFund Services LLC, 1/2012- present; CEO, Catalyst International Advisors LLC, 11/2019-present; CEO, Insights Media LLC, 11/2019-present; CEO, MFund Management LLC, 11/2019-present. | 36 | Variable Insurance Trust since 2010 |
| | | | | | |
Michael Schoonover
53 Palmeras St.
Suite 601
San Juan, PR
00901
Year of Birth: 1983 | President | Since 3/2022 | Vice President of the Trust, 2018-2022; Chief Operating Officer, Catalyst Capital Advisors LLC and Rational Advisors, Inc., 6/2017- present; Portfolio Manager, Catalyst Capital Advisors LLC 12/2013-5/2021; Portfolio Manager, Rational Advisors, Inc. 1/2016-5/2018; President, MFund Distributors LLC, 1/2020-present; COO, Catalyst International Advisors LLC, 11/2019- present; COO, Insights Media LLC, 11/2019-present; COO, MFund Management LLC, 11/2019-present; COO, AlphaCentric Advisors LLC, since 1/2021. | N/A | N/A |
| | | | | | |
Alex Merino
53 Palmeras St.
Suite 601
San Juan, PR
00901
Year of Birth: 1985 | Vice President | Since 3/2022 | Investment Operations Manager, MFund Management LLC, 1/2022– present; Investment Operations Analyst, MFund Management LLC, 9/2020– 12/2021; Tax Senior Associate, PwC Asset & Wealth Management NY Metro, 7/2016-6/2019. | N/A | N/A |
| | | | | | |
Erik Naviloff
4221 North 203rd
Street,
Suite 100,
Elkhorn, Nebraska,
68022
Year of Birth: 1968 | Treasurer | Since 4/2012 | Vice President – Fund Administration, Ultimus Fund Solutions, LLC, since 2011. | N/A | N/A |
| | | | | | |
Brian Curley
4221 North 203rd
Street, Suite 100,
Elkhorn, Nebraska,
68022
Year of Birth: 1970 | Assistant Treasurer | Since 11/2013 | Vice President – Fund Administration, Ultimus Fund Solutions, LLC since 1/2015. | N/A | N/A |
| | | | | | |
Sam Singh
4221 North 203rd
Street, Suite 100,
Elkhorn, Nebraska,
68022
Year of Birth: 1976 | Assistant Treasurer | Since 2/2015 | Vice President – Fund Administration, Ultimus Fund Solutions, LLC since 1/2015. | N/A | N/A |
| | | | | | |
Frederick J. Schmidt
36 N. New York
Avenue
Huntington, NY
11743
Year of Birth: 1959 | Chief Compliance Officer | Since 5/2015 | Director of Compliance Services, MFund Services LLC since 5/2015. | N/A | N/A |
Jennifer A. Bailey
36 N. New York
Avenue
Huntington, NY
11743
Year of Birth: 1968 | Secretary | Since 4/2014 | Director of Legal Services, MFund Services LLC, since 2012. | N/A | N/A |
| | | | | | |
| 1. | The term of office of each Trustee is indefinite. |
| 2. | The ‘Fund Complex’ includes the Trust, Variable Insurance Trust, Mutual Fund and Variable Insurance Trust, Strategy Shares, and AlphaCentric Prime Meridian Income Fund, each a registered investment company. |
| 3. | The Trustee who is an “interested person” of the Trust as defined in the 1940 Act is an interested person by virtue of being an officer of the advisor to certain series of the Trust. |
Additional information about the Trustees can be found in the Funds’ Statement of Additional Information, which is available, without charge, upon request by calling 1-877-771-2836.
| A N N U A L R E P O R T | June 30, 2023 |
| Privacy Notice |
| Mutual Fund Series Trust Revised August 2021 | 1 of 2 |
| FACTS | WHAT DOES MUTUAL FUND SERIES TRUST DO WITH YOUR PERSONAL INFORMATION? |
| Why? | Financial companies choose how they share your personal information. Federal law gives consumers the right to limit some, but not all sharing. Federal law also requires us to tell you how we collect, share, and protect your personal information. Please read this notice carefully to understand what we do. |
| What? | The types of personal information we collect and share depends on the product or service that you have with us. This information can include: ■ Social Security number and wire transfer instructions ■ account transactions and transaction history ■ investment experience and purchase history When you are no longer our customer, we continue to share your information as described in this notice. |
| How? | All financial companies need to share customers’ personal information to run their everyday business. In the section below, we list the reasons financial companies can share their customers’ personal information; the reasons Mutual Fund Series Trust chooses to share; and whether you can limit this sharing. |
Reasons we can share your personal
information: | Does Mutual Fund Series
Trust share information? | Can you limit this sharing? |
| | | |
| For our everyday business purposes - such as to process your transactions, maintain your account(s), respond to court orders and legal investigations, or report to credit bureaus. | YES | NO |
| | | |
| For our marketing purposes - to offer our products and services to you. | NO | We don’t share |
| | | |
| For joint marketing with other financial companies. | NO | We don’t share |
| | | |
| For our affiliates’ everyday business purposes - information about your transactions and records. | NO | We don’t share |
| | | |
| For our affiliates’ everyday business purposes - information about your credit worthiness. | NO | We don’t share |
| | | |
| For our affiliates to market to you | NO | We don’t share |
| | | |
| For non-affiliates to market to you | NO | We don’t share |
| A N N U A L R E P O R T | June 30, 2023 |
| Privacy Notice |
| Mutual Fund Series Trust Revised August 2021 | 2 of 2 |
| What we do: |
How does Mutual Fund Series Trust protect my personal information? | To protect your personal information from unauthorized access and use, we use security measures that comply with federal law. These measures include computer safeguards and secured files and buildings. Our service providers are held accountable for adhering to strict policies and procedures to prevent any misuse of your nonpublic personal information. |
How does Mutual Fund Series Trust collect my personal information? | We collect your personal information, for example, when you: ■ open an account or deposit money ■ direct us to buy securities or direct us to sell your securities ■ seek advice about your investments We also collect your personal information from others, such as credit bureaus, affiliates, or other companies. |
Why can’t I limit all sharing? | Federal law gives you the right to limit only: ■ sharing for affiliates’ everyday business purposes – information about your creditworthiness. ■ affiliates from using your information to market to you. ■ sharing for non-affiliates to market to you. State laws and individual companies may give you additional rights to limit sharing. |
| Definitions |
| Affiliates | Companies related by common ownership or control. They can be financial and non-financial companies. ■ Mutual Fund Series Trust does not share with affiliates. |
| | |
| Non-affiliates | Companies not related by common ownership or control. They can be financial and non-financial companies. ■ Mutual Fund Series Trust doesn’t share with nonaffiliates so they can market to you. |
| | |
| Joint marketing | A formal agreement between nonaffiliated financial companies that together market financial products or services to you. ■ Mutual Fund Series Trust doesn’t jointly market. |
| QUESTIONS? | Call 1-877-771-3836 |
| | |
| A N N U A L R E P O R T | June 30, 2023 |
| MUTUAL FUND SERIES TRUST |
| 4221 North 203rd Street, Suite 100 |
| Elkhorn, NE 68022 |
| |
| MANAGER |
| Eventide Asset Management, LLC |
| One International Place, |
| Suite 4210 |
| Boston, MA 02110 |
| |
| ADMINISTRATOR |
| Ultimus Fund Solutions, LLC |
| 225 Pictoria Drive, Suite 450 |
| Cincinnati, OH 45246 |
| |
| TRANSFER AGENT |
| Ultimus Fund Solutions, LLC |
| 225 Pictoria Drive, Suite 450 |
| Cincinnati, OH 45246 |
| |
| INDEPENDENT REGISTERED PUBLIC ACCOUNTING FIRM |
| Cohen & Company, Ltd. |
| 1835 Market Street, Suite 310 |
| Philadelphia, PA 19103 |
| |
| LEGAL COUNSEL |
| Thompson Hine LLP |
| 41 South High Street, Suite 1700 |
| Columbus, OH 43215 |
| |
| CUSTODIAN BANK |
| U.S. Bank |
| 1555 N. Rivercenter Drive, |
| Suite 302 |
| Milwaukee, WI 53212 |
| |
| |
| |
| |
| |
| |
| |
| |
| |
| |
| |
| |
| |
| |
| ETF-AR23 |
(b) Not applicable
ITEM 2. CODE OF ETHICS.
| (a) | The registrant has, as of the end of the period covered by this report, adopted a code of ethics that applies to the registrant's principal executive officer, principal financial officer, and principal accounting officer or controller, or persons performing similar functions, regardless of whether these individuals are employed by the registrant or a third party. |
| (b) | During the period covered by this report, there were no amendments to any provision of the code of ethics. |
| (c) | During the period covered by this report, there were no waivers or implicit waivers of a provision of the code of ethics. |
ITEM 3. AUDIT COMMITTEE FINANCIAL EXPERT.
| | The registrant’s Board of Trustees has determined that it does not have an audit committee financial expert serving on its audit committee. At this time, the registrant believes that the experience provided by each member of the audit committee together offer the registrant adequate oversight for the registrant’s level of financial complexity. |
ITEM 4. PRINCIPAL ACCOUNTANT FEES AND SERVICES.
| (a) | Audit Fees. The aggregate fees billed for each of the last two fiscal years for professional services rendered by the registrant's principal accountant for the audit of the registrant's annual financial statements or services that are normally provided by the accountant in connection with statutory and regulatory filings or engagements for those fiscal years are as follows: |
| Trust Series | 2023 | 2022 |
| Eventide Gilead Fund | 30,000 | 30,000 |
| Eventide Dividend Opportunities Fund | 13,000 | 11,000 |
| Eventide Healthcare & Life Sciences Fund | 30,000 | 20,000 |
| Eventide Limited Term Bond Fund | 15,000 | 15,000 |
| Eventide Multi-Asset Income Fund | 17,000 | 15,000 |
| Eventide Core Bond Fund | 13,000 | 12,250 |
| Eventide Exponential Technologies Fund | 13,000 | 10,250 |
| Eventide Large Cap Focus Fund | 13,000 | - |
| | | | |
| (b) | Audit-Related Fees. There were no fees billed in each of the last two fiscal years for assurances and related services by the principal accountant that are reasonably related to the performance of the audit of the registrant’s financial statements and are not reported under paragraph (a) of this item. |
| (c) | Tax Fees. The aggregate fees billed in each of the last two fiscal years for professional services rendered by the principal accountant for tax compliance are as follows: |
| Trust Series | 2023 | 2022 |
| Eventide Gilead Fund | 3,000 | 2,000 |
| Eventide Dividend Opportunities Fund | 3,000 | 2,000 |
| Eventide Healthcare & Life Sciences Fund | 3,000 | 2,000 |
| Eventide Limited Term Bond Fund | 2,500 | 2,000 |
| Eventide Multi-Asset Income Fund | 3,000 | 2,000 |
| Eventide Core Bond Fund | 2,500 | 2,500 |
| Eventide Exponential Technologies Fund | 2,500 | 2,500 |
| Eventide Large Cap Focus Fund | 3,000 | - |
| (d) | All Other Fees. The aggregate fees billed in each of the last two fiscal years for products and services provided by the registrant’s principal accountant, other than the services reported in paragraphs (a) through (c) of this item were $0 and $0 for the fiscal years ended June 30, 2023 and 2022 respectively. |
| (e)(1) | The audit committee does not have pre-approval policies and procedures. Instead, the audit committee or audit committee chairman approves on a case-by-case basis each audit or non-audit service before the principal accountant is engaged by the registrant. |
| (e)(2) | There were no services described in each of paragraphs (b) through (d) of this Item that were approved by the audit committee pursuant to paragraph (c)(7)(i)(C) of Rule 2-01 of Regulation S-X. |
| (f) | Not applicable. The percentage of hours expended on the principal accountant's engagement to audit the registrant's financial statements for the most recent fiscal year that were attributed to work performed by persons other than the principal accountant's full-time, permanent employees was zero percent (0%). |
| (g) | All non-audit fees billed by the registrant's principal accountant for services rendered to the registrant for the fiscal years ended June 30, 2023 and 2022 respectively are disclosed in (b)-(d) above. There were no audit or non-audit services performed by the registrant's principal accountant for the registrant's adviser. |
| (h) | Not applicable. The registrant's audit committee has considered whether the provision of non-audit services to the registrant's investment adviser (not including any sub-adviser whose role is primarily portfolio management and is subcontracted with or overseen by another investment adviser), and any entity controlling, controlled by, or under common control with the investment adviser that provides ongoing services to the registrant, that were not pre-approved pursuant to paragraph (c)(7)(ii) of Rule 2-01 of Regulation S-X, is compatible with maintaining the principal accountant's independence. |
| (i) | Not applicable. |
| (j) | Not applicable. |
ITEM 5. AUDIT COMMITTEE OF LISTED REGISTRANTS.
Not applicable
ITEM 6. SCHEDULE OF INVESTMENT
Included in annual report to shareholders filed under item 1 of this form.
ITEM 7. DISCLOSURE OF PROXY VOTING POLICIES AND PROCEDURES FOR CLOSED-END MANAGEMENT INVESTMENT COMPANIES.
Not applicable Fund is an open-end management investment company
ITEM 8. PORTFOLIO MANAGERS OF CLOSED-END MANAGEMENT INVESTMENT COMPANIES
Not applicable Fund is an open-end management investment company
ITEM 9. PURCHASES OF EQUITY SECURITIES BY CLOSED-END MANAGEMENT INVESTMENT COMPANY AND AFFILIATED PURCHASERS.
Not applicable Fund is an open-end management investment company
ITEM 10. SUBMISSION OF MATTERS TO A VOTE OF SECURITY HOLDERS.
Not applicable at this time.
ITEM 11. CONTROLS AND PROCEDURES.
| (a) | The registrant's principal executive and principal financial officers, or persons performing similar functions, have concluded that the registrant's disclosure controls and procedures (as defined in Rule 30a-3(c) under the 1940 Act, are effective, as of a date within 90 days of the filing date of this report, based on the evaluation of these controls and procedures required by Rule 30a-3(b) under the 1940 Act and Rule 15d-15(b) under the Securities Exchange Act of 1934, as amended. |
| (b) | There were no significant changes in the Registrant’s internal control over financial reporting that occurred during the period covered by this report that have materially affected, or are reasonably likely to materially affect, the Registrant’s internal control over financial reporting. |
ITEM 12. DISCLOSURE OF SECURITIES LENDING ACTIVITIES FOR CLOSED-END MANAGEMENT INVESTMENT COMPANIES. Not applicable to open-end investment companies.
ITEM 13. EXHIBITS
(a)(1) Code of Ethics for Principal Executive and Senior Financial Officers is attached hereto.
(a)(3) Not applicable.
(a)(4) Change in registrant’s independent public accountant is filed herewith
SIGNATURES
Pursuant to the requirements of the Securities Exchange Act of 1934 and the Investment Company Act of 1940, the registrant has duly caused this report to be signed on its behalf by the undersigned, thereunto duly authorized.
Mutual Fund Series Trust
| By Michael Schoonover | /s/ Michael Schoonover__________ |
| Principal Executive Officer/President |
| Date: September 6, 2023 | |
Pursuant to the requirements of the Securities Exchange Act of 1934 and the Investment Company Act of 1940, this report has been signed below by the following person on behalf of the registrant and in the capacities and on the date indicated.
| By Erik Naviloff | /s/ Erik Naviloff_____________ |
| Principal Financial Officer/Treasurer |
| Date: September 6, 2023 | |