united states
securities and exchange commission
washington, d.c. 20549
form n-csr
certified shareholder report of registered management
investment companies
Investment Company Act file number 811-21872
Mutual Fund Series Trust
(Exact name of registrant as specified in charter)
225 Pictoria Drive, Suite 450, Cincinnati, OH 45246
(Address of principal executive offices) (Zip code)
CT CORPORATION SYSTEM
1300 EAST NINTH STREET, CLEVELAND, OH 44114
(Name and address of agent for service)
Registrant's telephone number, including area code: 631-490-4300
Date of fiscal year end: 6/30
Date of reporting period: 6/30/23
ITEM 1. REPORTS TO SHAREHOLDERS.
| (a) |
ANNUAL REPORT
Day Hagan Smart Value Fund
June 30, 2023
Day Hagan Asset Management
1000 South Tamiami Trail
Sarasota, FL 34236
1-877-329-4246
Day Hagan Fund’s Annual Shareholder Letter
June 30, 2023
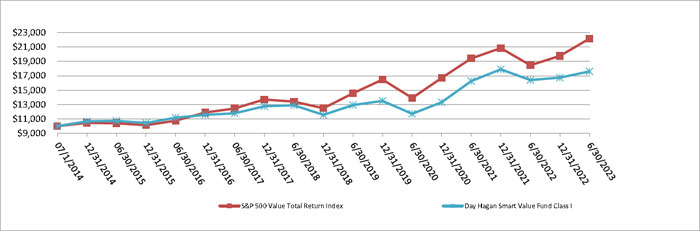
For the one-year period through June 30, 2023, the fund gained +7.27% (I shares) versus the S&P 500 Value Total Return Index (the Fund’s Primary Benchmark) +19.99%. Dividend-paying stocks had a difficult time as investors eschewed what had historically been viewed as a measure of quality (dividends) and instead seemed to favor the promise of Artificial Intelligence (AI) companies. We note that the top three holdings in the S&P 500 Value Total Return Index are Microsoft, Meta, and Amazon (Netflix is #10). Their combined weighting is over 13% of the portfolio. A large portion of the benchmark’s gain over the past year can be attributed to their outperformance.
Moreover, according to Ned Davis Research, during the fiscal year that ended June 30, 2023, companies within the S&P 500 that were dividend-payers with no change in dividends were up +4.0%, while non-dividend-paying stocks were up +19.8%. Popular dividend-focused exchange-traded funds were also under pressure, with the iShares Select Dividend ETF (DVY) down -0.10% and the SPDR S&P Dividend ETF (SDY) up +6.01%. Dividend-paying companies were broadly out of favor.
From a broader perspective, the U.S. equity markets made an initial low in June 2022, rallied, and then retreated— ultimately breaking the June lows and bottoming on October 12, 2022. Through October, markets were reeling from the fastest FOMC hiking cycle in over 50 years. For comparison’s sake, from January 2022 through October 2022, the typically safe-haven Bloomberg U.S. Credit Index (a bond index comprising investment-grade corporate and government bonds) was down -18.92%. The S&P 500 Growth Index was down -27.29% over the same timeframe.
From the October 2022 lows, the major capitalization-weighted indexes began to stage a rally, again based on the performance of just a handful of stocks. For example, during the first six months of 2023, the top 10 companies in the S&P 500 accounted for 95% of the index’s year-to-date performance (source: NDR). Perhaps even more interesting to investors seeking value, we note that dividend-paying stocks had their worst first-half performance relative to non-dividend-paying stocks since 2009, and it was the fourth-worst period in 50 years. Much of the underlying weakness in equities was being masked by a few large companies. And for those companies that were leading in performance, many did not pay dividends and were trading at historically elevated valuations. For example, NVIDIA (NVDA), the AI semiconductor chip darling, is now trading at over 40 times its annual revenues.
This reminds us of a famous quote from Scott McNeely, former CEO of Sun Microsystems. In 2000, as the dot.com mania was in full bloom, Sun Micro’s stock price spiked to a value that equaled ten times the company’s annual revenues. A couple of years later, after reality and gravity took hold, McNeely had this to say, “At ten times revenues, to give you a 10-year payback, I have to pay you 100% of revenues for ten straight years in dividends. That assumes I can get that by my shareholders. That assumes I have zero cost of goods sold, which is very hard for a computer company. That assumes zero expenses, which is really hard with 39,000 employees. That assumes I pay no taxes, which is very hard. And that assumes you pay no taxes on your dividends, which is kind of illegal. And that assumes with zero R&D for the next ten years, I can maintain the current revenue run rate. Now, having done that, would any of you like to buy my stock at $64? Do you realize how ridiculous those basic assumptions are? You don’t need any transparency. You don’t need any footnotes. What were you thinking?”
The stock subsequently cratered from over $60 to less than $5 as investors realized that hope isn’t an investment strategy and that valuations matter—even for quality companies. We continue to focus on value and margin of safety, waiting for the current “high-flyers” to return to earth, potentially providing a better buy opportunity.
Why did the market go up following the October 2022 bottom? First, at the time, our work indicated that the U.S. equity markets had declined to oversold levels consistent with what we measured at the worst of the pandemic (March 23, 2020) and the Great Financial Crisis (March 9, 2009). Investors had become far too pessimistic, given the weight of the evidence. Second, investors began to realize that the Fed was closing in on the end of the rate hike cycle. But it’s been a bumpy ride.
Lastly, following the bottom in October, FOMO (fear of missing out) began to assert. Many investor categories, from hedge funds to individuals, found themselves holding too much cash as the markets spiked higher. In fact, there were
1
over $5 trillion dollars being held in money market fund assets, far higher than in 2008-2009 and above the levels seen pre-pandemic. It was the highest in history, and it remains close to that level. The chase for performance ensued as low-quality companies with weak operating cash flows, low free cash flow, high valuations, and low profitability outperformed. History has shown that these types of “low-quality, short-covering” rallies often stall, and quality companies once again move into favor. And that’s where we choose to invest.
We also viewed the weakness in many stocks as resulting from a repricing of earnings expectations. One-year forward earnings expectations for 2023 actually peaked at the beginning of 2022, dropping from over $250 to $216 currently. More recently, through June of 2023, the estimated S&P 500 earnings decline in the second quarter (ending in June) was -6.8%. If this proves to be correct, it will be the largest quarterly earnings decline since the second quarter of 2020—as the pandemic lockdowns accelerated. (The expected decline for Q2 earnings was -4.7% as of March 31, so expectations have continued to sour.) Interestingly, only two sectors saw increases in their earnings expectations: Information Technology and Communications Services. As you might expect, the largest stocks in those sectors are Apple, Microsoft, Meta, and Alphabet.
At this point in the cycle, we continue to focus on value-oriented stocks as we navigate the tug of war between many of the major headwinds in 2022 being “Past Their Peak” vs. continuing concerns around a Fed-induced recession and greater-than-expected earnings decline. We continue to focus on companies evidencing the characteristics that have led to long-term outperformance: quality, profitability, and reasonable valuation. Given the crosscurrents and potential headwinds, we believe the weight of the evidence continues to support caution and places a high priority on risk management.
Currently, the portfolio’s factor profile shows that the fund’s holdings are tilted toward value, higher- yielding stocks, higher quality, lower volatility, and positions with higher-than-category-average liquidity. All of these factors exhibit defensive characteristics. (Source: Morningstar)
The fund continues to invest in companies producing excess returns through positive economic profitability, supported by solid balance sheets (quality), significant cash generation (profitability), and trading with considerable margins of safety (valuation). We believe these factors will continue to provide rational opportunities for the foreseeable future.
Sincerely,
Donald L. Hagan, CFA
Arthur S. Day
Regan Teague, CFA, CFP®
7526-NLD 07/11/2023
2
Day Hagan Smart Value Fund
PORTFOLIO REVIEW (Unaudited)
June 30, 2023
Average Annual Total Returns through June 30, 2023*, as compared to its benchmark:
| 1 Year Return | 3 Year Return | 5 Year Return | Since Inception ^ | |
| Day Hagan Smart Value Fund Class A | 6.95% | 14.27% | 6.15% | 6.22% |
| Day Hagan Smart Value Fund Class A with load | 0.82% | 12.04% | 4.91% | 5.52% |
| Day Hagan Smart Value Fund Class C | 6.16% | 13.40% | 5.36% | 5.42% |
| Day Hagan Smart Value Fund Class I | 7.27% | 14.53% | 6.43% | 6.49% |
| S&P 500 Value Total Return Index ** | 19.99% | 16.79% | 10.58% | 9.25% |
| * | The performance data quoted here represents past performance. The performance comparison includes reinvestment of all dividends and capital gains, if any, and has been adjusted for the Class A maximum applicable sales charge of 5.75%. Current performance may be lower or higher than the performance data quoted above. Past performance is no guarantee of future results. The investment return and principal value of an investment will fluctuate so that investor’s shares, when redeemed, may be worth more or less than their original cost. Please consider the investment objectives, risks, and charges and expenses of the Fund carefully before investing. The prospectus and summary prospectus contain this and other information. Please read carefully before investing. Certain purchases of Class A shares are subject to a 1.00% maximum deferred sales charge. A $15 fee may be charged for redemptions made by wire. The returns shown do not reflect the deduction of taxes that a shareholder would pay on Fund distributions or on the redemption of Fund shares. Performance figures for periods greater than 1 year are annualized. The manager has contractually agreed to waive fees and/or reimburse expenses of the Fund to the extent necessary to limit operating expenses (excluding brokerage costs; borrowing and liquidity costs such as interest and dividends on securities sold short; taxes; underlying/acquired fund expenses; and extraordinary expenses) at 1.48% for Class A shares, 2.23% for Class C shares and 1.23% for Class I shares through October 31, 2023. The Fund’s gross total annual operating expenses were 2.30% for Class A shares, 3.05% for Class C shares and 2.05% for Class I shares per the latest prospectus. For performance information current to the most recent month-end, please call toll-free 1-877-329-4246. |
| ** | The S&P 500 Value Total Return Index is a market capitalization-weighted index of approximately 500 widely held value stocks. Investors cannot invest directly in an index. |
| ^ | Inception date is July 1, 2014. |
Comparison of the Change in Value of a $10,000 Investment
| Portfolio Composition on June 30, 2023 | % of Net Assets | |||
| Institutional Financial Services | 10.6 | % | ||
| Transportation & Logistics | 8.1 | % | ||
| Banking | 8.0 | % | ||
| Retail-Discretionary | 7.3 | % | ||
| Telecommunications | 6.7 | % | ||
| Biotech & Pharma | 6.6 | % | ||
| Technology Services | 5.4 | % | ||
| Food | 3.9 | % | ||
| Self-Storage REIT | 3.9 | % | ||
| Oil & Gas Producers | 3.8 | % | ||
| Other / Cash & Cash Equivalents | 35.7 | % | ||
| 100.0 | % | |||
Please refer to the Schedule of Investments in this annual report for a detailed listing of the Fund’s holdings.
3
| DAY HAGAN SMART VALUE FUND |
| SCHEDULE OF INVESTMENTS |
| June 30, 2023 |
| Shares | Fair Value | |||||||
| COMMON STOCKS — 91.3% | ||||||||
| ASSET MANAGEMENT - 3.4% | ||||||||
| 641 | BlackRock, Inc. | $ | 443,021 | |||||
| 10,664 | Franklin Resources, Inc. | 284,835 | ||||||
| 727,856 | ||||||||
| BANKING - 8.0% | ||||||||
| 18,224 | Bank of America Corporation | 522,847 | ||||||
| 4,693 | Bank of Montreal | 423,825 | ||||||
| 2,300 | JPMorgan Chase & Company | 334,512 | ||||||
| 6,946 | Toronto-Dominion Bank (The) | 430,721 | ||||||
| 1,711,905 | ||||||||
| BIOTECH & PHARMA - 6.6% | ||||||||
| 2,053 | Amgen, Inc. | 455,807 | ||||||
| 5,400 | Bristol-Myers Squibb Company | 345,330 | ||||||
| 3,600 | Zoetis, Inc. | 619,956 | ||||||
| 1,421,093 | ||||||||
| CHEMICALS - 1.8% | ||||||||
| 4,833 | International Flavors & Fragrances, Inc. | 384,658 | ||||||
| CONSTRUCTION MATERIALS - 3.7% | ||||||||
| 6,184 | Owens Corning | 807,012 | ||||||
| ELECTRIC UTILITIES - 1.5% | ||||||||
| 8,699 | OGE Energy Corporation | 312,381 | ||||||
| FOOD - 3.9% | ||||||||
| 14,356 | Conagra Brands, Inc. | 484,084 | ||||||
| 8,800 | Hormel Foods Corporation | 353,936 | ||||||
| 838,020 | ||||||||
| GAS & WATER UTILITIES - 3.1% | ||||||||
| 5,160 | ONE Gas, Inc. | 396,340 | ||||||
| 10,068 | UGI Corporation | 271,534 | ||||||
| 667,874 | ||||||||
See accompanying notes to financial statements.
4
| DAY HAGAN SMART VALUE FUND |
| SCHEDULE OF INVESTMENTS (Continued) |
| June 30, 2023 |
| Shares | Fair Value | |||||||
| COMMON STOCKS — 91.3% (Continued) | ||||||||
| HEALTH CARE FACILITIES & SERVICES - 3.3% | ||||||||
| 1,454 | Cigna Group (The) | $ | 407,992 | |||||
| 4,300 | CVS Health Corporation | 297,259 | ||||||
| 705,251 | ||||||||
| HOME CONSTRUCTION - 2.4% | ||||||||
| 8,833 | Masco Corporation | 506,838 | ||||||
| INFRASTRUCTURE REIT - 2.8% | ||||||||
| 3,086 | American Tower Corporation | 598,498 | ||||||
| INSTITUTIONAL FINANCIAL SERVICES - 10.6% | ||||||||
| 9,467 | Bank of New York Mellon Corporation (The) | 421,471 | ||||||
| 1,500 | Goldman Sachs Group, Inc. (The) | 483,810 | ||||||
| 3,379 | Intercontinental Exchange, Inc. | 382,097 | ||||||
| 5,716 | Morgan Stanley | 488,146 | ||||||
| 8,923 | SEI Investments Company | 531,990 | ||||||
| 2,307,514 | ||||||||
| LEISURE PRODUCTS - 3.4% | ||||||||
| 3,906 | Brunswick Corporation | 338,416 | ||||||
| 6,160 | Hasbro, Inc. | 398,983 | ||||||
| 737,399 | ||||||||
| OIL & GAS PRODUCERS - 3.8% | ||||||||
| 17,000 | Coterra Energy, Inc. | 430,100 | ||||||
| 3,000 | Diamondback Energy, Inc. | 394,080 | ||||||
| 824,180 | ||||||||
| RETAIL - CONSUMER STAPLES - 1.6% | ||||||||
| 12,251 | Walgreens Boots Alliance, Inc. | 349,031 | ||||||
| RETAIL - DISCRETIONARY - 7.3% | ||||||||
| 1,343 | Home Depot, Inc. (The) | 417,190 | ||||||
| 2,782 | Lowe’s Companies, Inc. | 627,897 | ||||||
| 2,400 | Tractor Supply Company | 530,640 | ||||||
| 1,575,727 | ||||||||
See accompanying notes to financial statements.
5
| DAY HAGAN SMART VALUE FUND |
| SCHEDULE OF INVESTMENTS (Continued) |
| June 30, 2023 |
| Shares | Fair Value | |||||||
| COMMON STOCKS — 91.3% (Continued) | ||||||||
| SELF-STORAGE REIT - 3.9% | ||||||||
| 9,348 | CubeSmart | $ | 417,482 | |||||
| 1,461 | Public Storage | 426,437 | ||||||
| 843,919 | ||||||||
| TECHNOLOGY SERVICES - 5.4% | ||||||||
| 3,580 | Amdocs Ltd. | 353,883 | ||||||
| 5,078 | Fidelity National Information Services, Inc. | 277,767 | ||||||
| 3,900 | International Business Machines Corporation | 521,859 | ||||||
| 1,153,509 | ||||||||
| TELECOMMUNICATIONS - 6.7% | ||||||||
| 10,900 | BCE, Inc. | 496,931 | ||||||
| 26,317 | TELUS Corporation | 512,129 | ||||||
| 11,400 | Verizon Communications, Inc. | 423,966 | ||||||
| 1,433,026 | ||||||||
| TRANSPORTATION & LOGISTICS - 8.1% | ||||||||
| 2,958 | FedEx Corporation | 733,288 | ||||||
| 2,375 | Landstar System, Inc. | 457,283 | ||||||
| 3,060 | United Parcel Service, Inc., Class B | 548,505 | ||||||
| 1,739,076 | ||||||||
| TOTAL COMMON STOCKS (Cost $19,681,079) | 19,644,767 | |||||||
| TOTAL INVESTMENTS – 91.3% (Cost $19,681,079) | $ | 19,644,767 | ||||||
| OTHER ASSETS IN EXCESS OF LIABILITIES- 8.7% | 1,870,059 | |||||||
| NET ASSETS - 100.0% | $ | 21,514,826 | ||||||
Ltd - Limited Company
REIT - Real Estate Investment Trust
See accompanying notes to financial statements.
6
| Day Hagan Smart Value Fund |
| STATEMENT OF ASSETS AND LIABILITIES |
| June 30, 2023 |
| ASSETS | ||||
| Investment securities: | ||||
| At cost | $ | 19,681,079 | ||
| At value | $ | 19,644,767 | ||
| Cash at Custodian | 1,845,100 | |||
| Receivable for Fund shares sold | 1,904 | |||
| Dividend and interest receivable | 53,339 | |||
| Receivable due from Advisor | 1,588 | |||
| Prepaid expenses and other assets | 28,339 | |||
| TOTAL ASSETS | 21,575,037 | |||
| LIABILITIES | ||||
| Payable for Fund shares repurchased | 24,890 | |||
| Payable to related parties | 9,432 | |||
| Distribution (12b-1) fees payable | 5,051 | |||
| Accrued audit fees | 14,000 | |||
| Compliance officer fees payable | — | |||
| Accrued expenses and other liabilities | 6,838 | |||
| TOTAL LIABILITIES | 60,211 | |||
| NET ASSETS | $ | 21,514,826 | ||
| Composition of Net Assets: | ||||
| Paid in capital | $ | 19,213,852 | ||
| Distributable Earnings | 2,300,974 | |||
| NET ASSETS | $ | 21,514,826 |
See accompanying notes to financial statements.
7
| Day Hagan Smart Value Fund |
| STATEMENT OF ASSETS AND LIABILITIES (Continued) |
| June 30, 2023 |
| Net Asset Value Per Share: | ||||
| Class A Shares: | ||||
| Net Assets | $ | 2,896,364 | ||
| Shares of beneficial interest outstanding (a) | 228,062 | |||
| Net asset value (Net Assets ÷ Shares Outstanding) and redemption price per share (b) | $ | 12.70 | ||
| Maximum offering price per share (net asset value plus maximum sales charge of 5.75%) | $ | 13.47 | ||
| Class C Shares: | ||||
| Net Assets | $ | 3,326,552 | ||
| Shares of beneficial interest outstanding (a) | 268,492 | |||
| Net asset value (Net Assets ÷ Shares Outstanding), offering price and redemption price per share | $ | 12.39 | ||
| Class I Shares: | ||||
| Net Assets | $ | 15,291,910 | ||
| Shares of beneficial interest outstanding (a) | 1,198,354 | |||
| Net asset value (Net Assets ÷ Shares Outstanding), offering price and redemption price per share | $ | 12.76 |
| (a) | Unlimited number of shares of beneficial interest authorized, no par value. |
| (b) | Investment in Class A shares made at or above the $1 million breakpoint that are not subject to an initial sales charge may be subject to a 1.00% contingent deferred sales charge (“CDSC”) on shares redeemed within 18 months after the date of purchase (excluding shares purchased with reinvested dividends and/or distributions). |
See accompanying notes to financial statements.
8
| Day Hagan Smart Value Fund |
| STATEMENT OF OPERATIONS |
| For the Year Ended June 30, 2023 |
| INVESTMENT INCOME | ||||
| Dividends | $ | 598,425 | ||
| Interest | 46,416 | |||
| Foreign tax withheld | (5,012 | ) | ||
| TOTAL INVESTMENT INCOME | 639,829 | |||
| EXPENSES | ||||
| Investment management fees | 231,960 | |||
| Distribution (12b-1) fees: | ||||
| Class A | 5,993 | |||
| Class C | 41,073 | |||
| Registration fees | 60,225 | |||
| Administration fees and expenses | 56,663 | |||
| Transfer agent fees | 39,504 | |||
| Shareholder service fees | 24,126 | |||
| Management service fees | 23,196 | |||
| Legal fees | 20,858 | |||
| Compliance officer fees | 20,519 | |||
| Trustees fees and expenses | 15,202 | |||
| Audit fees | 14,004 | |||
| Printing and postage expenses | 9,274 | |||
| Custodian fees | 3,963 | |||
| Insurance expense | 1,095 | |||
| Other expenses | 2,405 | |||
| TOTAL EXPENSES | 570,060 | |||
| Less: Fees waived and expenses reimbursed by the Manager | (236,198 | ) | ||
| NET EXPENSES | 333,862 | |||
| NET INVESTMENT INCOME | 305,967 | |||
| REALIZED AND UNREALIZED GAIN (LOSS) FROM INVESTMENTS | ||||
| Net realized gain from investments | 2,579,833 | |||
| Net realized gain from foreign currency transactions | 296 | |||
| Net realized gain from investments | 2,580,129 | |||
| Net change in unrealized appreciation (depreciation) on investments | (1,267,975 | ) | ||
| Net change in unrealized appreciation (depreciation) from foreign currency translations | (190 | ) | ||
| Net change in unrealized depreciation on investments and foreign currency translations | (1,268,165 | ) | ||
| NET REALIZED AND UNREALIZED GAIN FROM INVESTMENTS | 1,311,964 | |||
| NET INCREASE IN NET ASSETS RESULTING FROM OPERATIONS | $ | 1,617,931 |
See accompanying notes to financial statements.
9
| Day Hagan Smart Value Fund |
| STATEMENTS OF CHANGES IN NET ASSETS |
| For the | For the | |||||||
| Year Ended | Year Ended | |||||||
| June 30, 2023 | June 30, 2022 | |||||||
| FROM OPERATIONS | ||||||||
| Net investment income | $ | 305,967 | $ | 329,499 | ||||
| Net realized gain from investments | 2,580,129 | 6,257,955 | ||||||
| Net change in unrealized appreciation (depreciation) on investments and foreign currency translations | (1,268,165 | ) | (5,969,338 | ) | ||||
| Net increase in net assets resulting from operations | 1,617,931 | 618,116 | ||||||
| DISTRIBUTIONS TO SHAREHOLDERS | ||||||||
| Total distributions paid | ||||||||
| Class A | (118,584 | ) | (17,172 | ) | ||||
| Class C | (187,696 | ) | (22,395 | ) | ||||
| Class I | (843,549 | ) | (294,986 | ) | ||||
| Total distributions to shareholders | (1,149,829 | ) | (334,553 | ) | ||||
| FROM SHARES OF BENEFICIAL INTEREST | ||||||||
| Proceeds from shares sold: | ||||||||
| Class A | 1,358,127 | 508,200 | ||||||
| Class C | 10,013 | 18,994 | ||||||
| Class I | 864,673 | 1,542,320 | ||||||
| Net asset value of shares issued in reinvestment of distributions: | ||||||||
| Class A | 98,927 | 13,285 | ||||||
| Class C | 185,235 | 21,850 | ||||||
| Class I | 690,324 | 184,229 | ||||||
| Payments for shares redeemed: | ||||||||
| Class A | (265,400 | ) | (102,463 | ) | ||||
| Class C | (1,894,810 | ) | (332,040 | ) | ||||
| Class I | (4,775,379 | ) | (13,950,242 | ) | ||||
| Net decrease in net assets from shares of beneficial interest | (3,728,290 | ) | (12,095,867 | ) | ||||
| TOTAL DECREASE IN NET ASSETS | (3,260,188 | ) | (11,812,304 | ) | ||||
| NET ASSETS | ||||||||
| Beginning of year | 24,775,014 | 36,587,318 | ||||||
| End of year | $ | 21,514,826 | $ | 24,775,014 | ||||
| SHARE ACTIVITY | ||||||||
| Class A: | ||||||||
| Shares Sold | 110,031 | 37,660 | ||||||
| Shares Reinvested | 8,027 | 1,017 | ||||||
| Shares Redeemed | (21,142 | ) | (7,995 | ) | ||||
| Net increase in shares of beneficial interest outstanding | 96,916 | 30,682 | ||||||
| Class C: | ||||||||
| Shares Sold | 817 | 1,469 | ||||||
| Shares Reinvested | 15,403 | 1,735 | ||||||
| Shares Redeemed | (156,311 | ) | (25,853 | ) | ||||
| Net decrease in shares of beneficial interest outstanding | (140,091 | ) | (22,649 | ) | ||||
| Class I: | ||||||||
| Shares Sold | 67,562 | 115,706 | ||||||
| Shares Reinvested | 55,862 | 14,044 | ||||||
| Shares Redeemed | (373,297 | ) | (1,068,236 | ) | ||||
| Net decrease in shares of beneficial interest outstanding | (249,873 | ) | (938,486 | ) | ||||
See accompanying notes to financial statements.
10
| Day Hagan Smart Value Fund |
| FINANCIAL HIGHLIGHTS |
Per Share Data and Ratios for a Share of Beneficial Interest Outstanding Throughout each Year Presented
| Class A | ||||||||||||||||||||
| Year | Year | Year | Year | Year | ||||||||||||||||
| Ended | Ended | Ended | Ended | Ended | ||||||||||||||||
| June 30, 2023 | June 30, 2022 | June 30, 2021 | June 30, 2020 | June 30, 2019 | ||||||||||||||||
| Net asset value, beginning of year | $ | 12.49 | $ | 12.54 | $ | 9.17 | $ | 10.32 | $ | 11.53 | ||||||||||
| Activity from investment operations: | ||||||||||||||||||||
| Net investment income (1)(2) | 0.16 | 0.15 | 0.11 | 0.13 | 0.15 | |||||||||||||||
| Net realized and unrealized gain (loss) from investments | 0.68 | (0.05 | ) | 3.40 | (1.13 | ) | (0.23 | ) | ||||||||||||
| Total from investment operations | 0.84 | 0.10 | 3.51 | (1.00 | ) | (0.08 | ) | |||||||||||||
| Less distributions from: | ||||||||||||||||||||
| Net investment income | (0.13 | ) | (0.15 | ) | (0.14 | ) | (0.14 | ) | (0.15 | ) | ||||||||||
| Net realized gains | (0.50 | ) | — | — | (0.01 | ) | (0.98 | ) | ||||||||||||
| Total distributions | (0.63 | ) | (0.15 | ) | (0.14 | ) | (0.15 | ) | (1.13 | ) | ||||||||||
| Net asset value, end of year | $ | 12.70 | $ | 12.49 | $ | 12.54 | $ | 9.17 | $ | 10.32 | ||||||||||
| Total return (3) | 6.95 | % | 0.76 | % | 38.46 | % | (9.75 | )% | 0.09 | % (6) | ||||||||||
| Net assets, at end of year (000s) | $ | 2,896 | $ | 1,637 | $ | 1,260 | $ | 2,041 | $ | 4,321 | ||||||||||
| Ratio of gross expenses to average net assets before expense reimbursement (4)(5) | 2.51 | % | 2.30 | % | 2.12 | % | 1.86 | % | 1.70 | % | ||||||||||
| Ratio of net expenses to average net assets after expense reimbursement (5) | 1.49 | % | 1.55 | % | 1.55 | % | 1.55 | % | 1.55 | % | ||||||||||
| Ratio of net investment income to average net assets (2)(5) | 1.29 | % | 1.11 | % | 1.09 | % | 1.28 | % | 1.41 | % | ||||||||||
| Portfolio Turnover Rate | 171 | % | 65 | % | 64 | % | 54 | % | 53 | % | ||||||||||
| (1) | Per share amounts calculated using the average shares method. |
| (2) | Recognition of net investment income is affected by the timing and declaration of dividends by the underlying investment companies in which the Fund invests. |
| (3) | Total return in the above table is historical in nature and represents the rate that the investor would have earned or lost on an investment in the Fund assuming reinvestment of dividends and capital gains distributions, if any, and does not reflect the impact of sales charges or redemption fees. Had the manager not waived a portion of the Fund’s expenses and/or reimbursed expenses, total returns would have been lower. |
| (4) | Represents the ratio of expenses to average net assets absent fee waivers, expense reimbursements or recapture by the manager. |
| (5) | The ratios of expenses to average net assets and net investment income to average net assets do not reflect the expenses of the underlying investment companies in which the Fund invests. |
| (6) | Had the manager not reimbursed a trade error, the effect on total return would have been (0.01)%. |
See accompanying notes to financial statements.
11
| Day Hagan Smart Value Fund |
| FINANCIAL HIGHLIGHTS |
Per Share Data and Ratios for a Share of Beneficial Interest Outstanding Throughout each Year Presented
| Class C | ||||||||||||||||||||
| Year | Year | Year | Year | Year | ||||||||||||||||
| Ended | Ended | Ended | Ended | Ended | ||||||||||||||||
| June 30, 2023 | June 30, 2022 | June 30, 2021 | June 30, 2020 | June 30, 2019 | ||||||||||||||||
| Net asset value, beginning of year | $ | 12.21 | $ | 12.26 | $ | 8.97 | $ | 10.10 | $ | 11.31 | ||||||||||
| Activity from investment operations: | ||||||||||||||||||||
| Net investment income (1)(2) | 0.06 | 0.04 | 0.04 | 0.05 | 0.07 | |||||||||||||||
| Net realized and unrealized gain (loss) from investments | 0.67 | (0.04 | ) | 3.30 | (1.09 | ) | (0.23 | ) | ||||||||||||
| Total from investment operations | 0.73 | — | 3.34 | (1.04 | ) | (0.16 | ) | |||||||||||||
| Less distributions from: | ||||||||||||||||||||
| Net investment income | (0.05 | ) | (0.05 | ) | (0.05 | ) | (0.08 | ) | (0.07 | ) | ||||||||||
| Net realized gains | (0.50 | ) | — | — | (0.01 | ) | (0.98 | ) | ||||||||||||
| Total distributions | (0.55 | ) | (0.05 | ) | (0.05 | ) | (0.09 | ) | (1.05 | ) | ||||||||||
| Net asset value, end of year | $ | 12.39 | $ | 12.21 | $ | 12.26 | $ | 8.97 | $ | 10.10 | ||||||||||
| Total return (3) | 6.16 | % | 0.02 | % | 37.34 | % | (10.35 | )% | (0.70 | )% (6) | ||||||||||
| Net assets, at end of year (000s) | $ | 3,327 | $ | 4,987 | $ | 5,288 | $ | 6,963 | $ | 11,495 | ||||||||||
| Ratio of gross expenses to average net assets before expense reimbursement (4)(5) | 3.26 | % | 3.05 | % | 2.87 | % | 2.61 | % | 2.45 | % | ||||||||||
| Ratio of net expenses to average net assets after expense reimbursement (5) | 2.24 | % | 2.30 | % | 2.30 | % | 2.30 | % | 2.30 | % | ||||||||||
| Ratio of net investment income to average net assets (2)(5) | 0.52 | % | 0.33 | % | 0.34 | % | 0.54 | % | 0.69 | % | ||||||||||
| Portfolio Turnover Rate | 171 | % | 65 | % | 64 | % | 54 | % | 53 | % | ||||||||||
| (1) | Per share amounts calculated using the average shares method. |
| (2) | Recognition of net investment income is affected by the timing and declaration of dividends by the underlying investment companies in which the Fund invests. |
| (3) | Total return in the above table is historical in nature and represents the rate that the investor would have earned or lost on an investment in the Fund assuming reinvestment of dividends and capital gains distributions, if any, and does not reflect the impact of sales charges or redemption fees. Had the manager not waived a portion of the Fund’s expenses and/or reimbursed expenses, total returns would have been lower. |
| (4) | Represents the ratio of expenses to average net assets absent fee waivers, expense reimbursements or recapture by the manager. |
| (5) | The ratios of expenses to average net assets and net investment income to average net assets do not reflect the expenses of the underlying investment companies in which the Fund invests. |
| (6) | Had the manager not reimbursed a trade error, the effect on total return would have been (0.01)%. |
See accompanying notes to financial statements.
12
| Day Hagan Smart Value Fund |
| FINANCIAL HIGHLIGHTS |
Per Share Data and Ratios for a Share of Beneficial Interest Outstanding Throughout each Year Presented
��
| Class I | ||||||||||||||||||||
| Year | Year | Year | Year | Year | ||||||||||||||||
| Ended | Ended | Ended | Ended | Ended | ||||||||||||||||
| June 30, 2023 | June 30, 2022 | June 30, 2021 | June 30, 2020 | June 30, 2019 | ||||||||||||||||
| Net asset value, beginning of year | $ | 12.53 | $ | 12.59 | $ | 9.21 | $ | 10.35 | $ | 11.56 | ||||||||||
| Activity from investment operations: | ||||||||||||||||||||
| Net investment income (1)(2) | 0.19 | 0.17 | 0.14 | 0.15 | 0.19 | |||||||||||||||
| Net realized and unrealized gain (loss) from investments | 0.69 | (0.05 | ) | 3.40 | (1.11 | ) | (0.24 | ) | ||||||||||||
| Total from investment operations | 0.88 | 0.12 | 3.54 | (0.96 | ) | (0.05 | ) | |||||||||||||
| Less distributions from: | ||||||||||||||||||||
| Net investment income | (0.15 | ) | (0.18 | ) | (0.16 | ) | (0.17 | ) | (0.18 | ) | ||||||||||
| Net realized gains | (0.50 | ) | — | — | (0.01 | ) | (0.98 | ) | ||||||||||||
| Total distributions | (0.65 | ) | (0.18 | ) | (0.16 | ) | (0.18 | ) | (1.16 | ) | ||||||||||
| Net asset value, end of year | $ | 12.76 | $ | 12.53 | $ | 12.59 | $ | 9.21 | $ | 10.35 | ||||||||||
| Total return (3) | 7.27 | % | 0.92 | % | 38.76 | % | (9.43 | )% | 0.35 | % (6) | ||||||||||
| Net assets, at end of year (000s) | $ | 15,292 | $ | 18,150 | $ | 30,040 | $ | 29,940 | $ | 62,506 | ||||||||||
| Ratio of gross expenses to average net assets before expense reimbursement (4)(5) | 2.26 | % | 2.05 | % | 1.87 | % | 1.61 | % | 1.45 | % | ||||||||||
| Ratio of net expenses to average net assets after expense reimbursement (5) | 1.24 | % | 1.30 | % | 1.30 | % | 1.30 | % | 1.30 | % | ||||||||||
| Ratio of net investment income to average net assets (2)(5) | 1.52 | % | 1.31 | % | 1.36 | % | 1.52 | % | 1.71 | % | ||||||||||
| Portfolio Turnover Rate | 171 | % | 65 | % | 64 | % | 54 | % | 53 | % | ||||||||||
| (1) | Per share amounts calculated using the average shares method. |
| (2) | Recognition of net investment income is affected by the timing and declaration of dividends by the underlying investment companies in which the Fund invests. |
| (3) | Total return in the above table is historical in nature and represents the rate that the investor would have earned or lost on an investment in the Fund assuming reinvestment of dividends and capital gains distributions, if any, and does not reflect the impact of sales charges or redemption fees. Had the manager not waived a portion of the Fund’s expenses and/or reimbursed expenses, |
| (4) | Represents the ratio of expenses to average net assets absent fee waivers, expense reimbursements or recapture by the manager. |
| (5) | The ratios of expenses to average net assets and net investment income to average net assets do not reflect the expenses of the underlying investment companies in which the Fund invests. |
| (6) | Had the manager not reimbursed a trade error, the effect on total return would have been (0.01)%. |
See accompanying notes to financial statements.
13
| Day Hagan Smart Value Fund |
| NOTES TO FINANCIAL STATEMENTS |
| June 30, 2023 |
| (1) | ORGANIZATION AND SIGNIFICANT ACCOUNTING POLICIES |
Mutual Fund Series Trust (the “Trust”), was organized as an Ohio business trust on February 27, 2006. The Trust is registered as an open-end management investment company under the Investment Company Act of 1940, as amended, (“1940 Act”). The Trust currently consists of thirty- six series. These financial statements relate to the Day Hagan Smart Value Fund (the “Fund”), a separate diversified series of the Trust. The Fund’s investment manager is Donald L. Hagan, LLC, also known as Day Hagan Asset Management (the “Manager” or “Day Hagan”).
The Fund commenced operations on July 1, 2014. The Fund’s primary investment objective is to achieve long-term capital appreciation with current income as a secondary objective.
The Fund offers three classes of shares, Class A, Class C and Class I. Each share class represents an interest in the same assets of the Fund, has the same rights and voting privileges, and is identical in all material respects except that they differ as to sales and redemption charges and ongoing service and distribution fees.
The following is a summary of significant accounting policies consistently followed by the Fund and are in accordance with accounting principles generally accepted in the United States of America (“GAAP”). The Fund is an investment company and accordingly follows the investment company accounting and reporting guidance of the Financial Accounting Standards Board (“FASB”) Accounting Standards Codification Topic 946 “Financial Services-Investment Companies” including Accounting Standards Update 2013-08.
a) Securities Valuation – Securities listed on an exchange are valued at the last reported sale price at the close of the regular trading session of the exchange on the business day the value is being determined, or in the case of securities listed on NASDAQ, at the NASDAQ Official Closing Price (“NOCP”). In the absence of a sale, such securities shall be valued at the last bid price on the day of valuation. Debt securities (other than short-term obligations) are valued each day by an independent pricing service approved by the Board of Trustees (the “Board”) using methods which include current market quotations from a major market maker in the securities and based on methods which include the consideration of yields or prices of securities of comparable quality, coupon, maturity and type. The Fund may invest in portfolios of open-end or closed-end investment companies and exchange-traded funds (the “underlying funds”). Open-end funds are valued at their respective net asset values as reported by such investment companies. The underlying funds value securities in their portfolios for which market quotations are readily available at their market values (generally the last reported sale price) and all other securities and assets at their fair value by the methods established by the boards of the underlying funds. The shares of many closed-end investment companies and exchange-traded funds, after their initial public offering, frequently trade at a price per share, which is different than the net asset value per share. The difference represents a market premium or market discount of such shares. There can be no assurances that the market discount or market premium on shares of any closed-end investment company or exchange--traded fund purchased by the Fund will not change. The independent- pricing service does not distinguish between smaller sized bond positions known as “odd lots” and larger institutional sized bond positions known as “round lots”. The Fund may fair value a particular bond if the manager does not believe that the round lot value provided by the independent pricing service reflects fair value of the Fund’s holding. Short-term debt obligations having 60 days or less remaining until maturity, at time of purchase, may be valued at amortized cost, provided such valuations represent fair value. Options are valued at their closing price on the exchange they are traded on. When no closing price is available, options are valued at their mean price. Index options are valued at the mean prices provided by an approved independent pricing services.
In unusual circumstances, instead of valuing securities in the usual manner, the Fund may value securities at “fair value” as determined in good faith by the Board, pursuant to the procedures (the “Procedures”) approved by the Board. The Board has designated the adviser as its valuation designee (the “Valuation Designee”) to execute these procedures. The Procedures consider, among others, the following factors to determine a security’s fair value: the nature and pricing history (if any) of the security; whether any dealer quotations for the security are available; and possible valuation methodologies that could be used to determine the fair value of the security. Fair value may also be used by the Board if extraordinary events occur after the close of the relevant world market but prior to the New York Stock Exchange close. The Board may also enlist third party consultants such a valuation specialist at a public accounting firm, valuation consultant or financial officer of a security issuer on an as-needed basis to assist the Valuation Designee in determining a security-specific fair value. The Board is responsible for reviewing and
14
| Day Hagan Smart Value Fund |
| NOTES TO FINANCIAL STATEMENTS (Continued) |
| June 30, 2023 |
approving fair value methodologies utilized by the Valuation Designee, approval of which shall be based upon whether the Valuation Designee followed the valuation procedures established by the Board.
The Fund utilizes various methods to measure the fair value of all of its investments on a recurring basis. GAAP establishes a hierarchy that prioritizes inputs to valuation methods. The three levels of input are:
Level 1 – Unadjusted quoted prices in active markets for identical assets and liabilities that the Fund has the ability to access.
Level 2 – Observable inputs other than quoted prices included in Level 1 that are observable for the asset or liability, either directly or indirectly. These inputs may include quoted prices for the identical instrument in an inactive market, prices for similar instruments, interest rates, prepayment speeds, credit risk, yield curves, default rates and similar data.
Level 3 – Unobservable inputs for the asset or liability, to the extent relevant observable inputs are not available; representing the Fund’s own assumptions about the assumptions a market participant would use in valuing the asset or liability, and would be based on the best information available.
The availability of observable inputs can vary from security to security and is affected by a wide variety of factors, including, for example, the type of security, whether the security is new and not yet established in the marketplace, the liquidity of markets, and other characteristics particular to the security. To the extent that valuation is based on models or inputs that are less observable or unobservable in the market, the determination of fair value requires more judgment. Accordingly, the degree of judgment exercised in determining fair value is greatest for instruments categorized in Level 3.
The inputs used to measure fair value may fall into different levels of the fair value hierarchy. In such cases, for disclosure purposes, the level in the fair value hierarchy within which the fair value measurement falls in its entirety, is determined based on the lowest level input that is significant to the fair value measurement in its entirety.
The inputs or methodology used for valuing securities are not necessarily an indication of the risk associated with investing in those securities. The following is a summary of the valuation inputs, representing 100% of the Fund’s investments, used to value the Fund’s net assets as of June 30, 2023:
| Assets | ||||||||||||||||
| Security Classifications (a) | Level 1 | Level 2 | Level 3 | Totals | ||||||||||||
| Common Stocks (b) | $ | 19,644,767 | $ | — | $ | — | $ | 19,644,767 | ||||||||
| Total | $ | 19,644,767 | $ | — | $ | — | $ | 19,644,767 | ||||||||
| (a) | As of and during the year ended June 30, 2023, the Fund held no securities that were considered to be “Level 3” securities (those valued using significant unobservable inputs). Therefore, a reconciliation of assets in which significant unobservable inputs (Level 3) were used in determining fair value is not applicable. |
| (b) | All common stocks held in the Fund are Level 1 securities. For a detailed break-out of common stocks by major industry classification, please refer to the Schedule of Investments. |
b) Federal Income Tax – The Fund has qualified and intends to continue to qualify as a regulated investment company and to comply with the applicable provisions of the Internal Revenue Code of 1986, as amended, and to distribute substantially all of its taxable income to its shareholders. Therefore, no Federal income or excise tax provisions are required.
As of and during the year ended June 30, 2023, the Fund did not have a liability for any unrecognized tax expense. The Fund recognizes interest and penalties, if any, related to unrecognized tax expense as income tax expense in the Statement of Operations. As of June 30, 2023, the Fund did not incur any interest or penalties. As required, management has analyzed the
15
| Day Hagan Smart Value Fund |
| NOTES TO FINANCIAL STATEMENTS (Continued) |
| June 30, 2023 |
Fund’s tax positions taken or to be taken on Federal income tax returns for all open tax years (tax years or periods ended 2020-2022 for the Fund) or expected to be taken in year ended 2023 and has concluded that no provision for income tax is required in these financial statements. The tax filings are open for examination by applicable taxing authorities. No examination of the Fund’s tax returns are presently in progress.
c) Distributions to Shareholders – Distributions to shareholders, which are determined in accordance with income tax regulations and may differ from GAAP, are recorded on the ex-dividend date. Dividends from net investment income, if any, are declared and paid at least annually. The Fund distributes net investment income quarterly. Distributable net realized gains, if any, are declared and distributed annually.
d) Multiple Class Allocations – Income, non-class specific expenses and realized/unrealized gains or losses are allocated to each class based on relative net assets. Distribution fees are charged to each respective share class in accordance with the distribution plan. Expenses of the Trust that are directly identifiable to a specific fund are charged to that fund. Expenses, which are not readily identifiable to a specific fund, are allocated in such a manner as deemed equitable, taking into consideration the nature and type of expense and the relative sizes of the funds in the Trust.
e) Security Transactions and Investment Income – Investment and shareholder transactions are recorded on the trade date. Interest income is recognized on an accrual basis. Discounts are accreted and premiums are amortized on securities purchased over the lives of the respective securities using the effective interest method, except certain securities that are held at premium and will be amortized to the earliest call date. Withholding taxes on foreign dividends have been provided for in accordance with the Fund’s understanding of the applicable country’s tax rules and rates. Dividend income is recorded on the ex-dividend date. Realized gains or losses from sales of securities are determined by comparing the identified cost of the security lot sold with the net sales proceeds.
f) Use of Estimates – The preparation of financial statements in conformity with GAAP requires management to make estimates and assumptions that affect the reported amounts of assets and liabilities and disclosure of contingent assets and liabilities at the date of the financial statements and the reported amounts of revenues and expenses during the reporting period. Actual results could differ from those estimates.
g) Indemnification – In the normal course of business, the Trust may enter into contracts that contain a variety of representations and warranties and provide general indemnifications. The Fund’s maximum exposure under these arrangements is dependent on future claims that may be made against the Fund and, therefore, cannot be estimated; however, management considers the risk of loss from such claims to be remote.
h) Redemption Fees and Sales Charges (loads) – A $15 fee may be charged for redemptions made by wire. A maximum sales charge of 5.75% is imposed on Class A shares of the Fund. Investments in Class A shares, in the Fund, made at or above the $1 million breakpoint that are not subject to an initial sales charge may be subject to a 1.00% contingent deferred sales charge (“CDSC”) on shares redeemed within 18 months of purchase (excluding shares purchased with reinvested dividends and/or distributions). The respective shareholders pay such CDSC charges, which are not an expense of the Fund. For the year ended June 30, 2023, there were no redemption fees paid to the Fund and there were no CDSC fees paid to the Manager.
i) Cash and cash equivalents – Cash and cash equivalents are held with a financial institution. The assets of the Fund may be placed in deposit accounts at U.S. banks and such deposits generally exceed Federal Deposit Insurance Corporation (“FDIC”) insurance limits. The FDIC insures deposit accounts up to $250,000 for each accountholder. The counterparty is generally a single bank rather than a group of financial institutions; thus there may be a greater counterparty credit risk. The Fund places deposits only with those counterparties which are believed to be creditworthy and there has been no history of loss.
16
| Day Hagan Smart Value Fund |
| NOTES TO FINANCIAL STATEMENTS (Continued) |
| June 30, 2023 |
| (2) | INVESTMENT TRANSACTIONS |
For the year ended June 30, 2023, aggregate purchases and proceeds from sales of investment securities (excluding short-term investments) for the Fund was as follows:
| Purchases | Sales | |||||
| $ | 37,246,159 | $ | 42,844,246 | |||
| (3) | INVESTMENT ADVISORY AGREEMENT AND TRANSACTIONS WITH RELATED PARTIES |
Day Hagan acts as investment manager to the Fund pursuant to the terms of a management agreement between the Fund and Day Hagan (the “Management Agreement”). Under the terms of the Management Agreement, the Manager manages the investment operations of the Fund in accordance with the Fund’s investment policies and restrictions. The Manager provides the Fund with investment advice and supervision and furnishes an investment program for the Fund. For its investment management services, the Fund pays to the Manager, as of the last day of each month, an annualized fee equal to 1.00% of average net assets for the Fund, such fees to be computed daily based upon daily average net assets of the Fund. The Manager pays expenses incurred by it in connection with acting as investment manager to the Fund other than costs (including taxes and brokerage commissions, borrowing costs, costs of investing in underlying funds and extraordinary expenses, if any) of securities purchased for the Fund and certain other expenses paid by the Fund (as detailed in the Management Agreement). The Manager pays for all employees, office space and facilities required by it to provide services under the Management Agreement, with the exception of specific items of expense (as detailed in the Management Agreement). For the year ended June 30, 2023, management fees of $231,960 were incurred by the Fund, before the waiver and reimbursement described below. For the year ended June 30, 2023 the Manager owed $1,588 to the Fund.
Effective November 1, 2022, the Manager and the Trust, with respect to the Fund, have entered into an Expense Limitation Agreement under which the Manager has contractually agreed to waive fees and/or reimburse expenses but only to the extent necessary to maintain total annual operating expenses (excluding brokerage costs; borrowing and liquidity costs such as interest and dividends on securities sold short; taxes; underlying/acquired funds expenses; and extraordinary expenses) at 1.48% for Class A shares, 2.23% for Class C shares, and 1.23% for Class I shares of the Fund’s average daily net assets through October 31, 2023. Prior to November 1, 2022, the Expense Limitation Agreement was 1.55% for Class A shares, 2.30% for Class C shares, and 1.30% for Class I shares of the Fund’s average daily net assets. Each waiver or reimbursement by the Manager is subject to repayment by the Fund within three years after the fees have been waived or reimbursed, if the Fund is able to make the repayment without exceeding the expense limitation in effect at that time and the repayment is approved by the Board.
For the year ended June 30, 2023, the Manager waived management fees and reimbursed expenses of $236,198 for the Fund, pursuant to the Expense Limitation Agreement. As of June 30, 2023 the Manager has waived/reimbursed expenses that may be recovered no later than June 30 of the years indicated below:
| 2024 | 2025 | 2026 | ||||||||||
| Day Hagan Smart Value Fund | $ | 200,749 | $ | 221,616 | $ | 236,198 | ||||||
Pursuant to the Management Services Agreement between the Trust and MFund, MFund provides the Fund with various management and legal administrative services (the “Management Services Agreement”). For these services, the Fund pays MFund as of the last day of each month an annualized asset-based fee which scales downward based upon net assets. In addition, the Fund reimburses MFund for any reasonable out- of-pocket expenses incurred in the performance of its duties under the Management Services Agreement. The amount due to MFund for the Management Services Agreement is listed in the Statement of Assets and Liabilities under “Payable to related parties” and the amount accrued for the year is shown in the Statement of Operations under “Management service fees.”
17
| Day Hagan Smart Value Fund |
| NOTES TO FINANCIAL STATEMENTS (Continued) |
| June 30, 2023 |
Pursuant to the Compliance Services Agreement, MFund provides chief compliance officer services to the Fund. For these services, the Fund pays MFund as of the last day of each month annualized base fees plus an annualized asset-based fee based upon net assets. In addition, the Fund reimburses MFund for any reasonable out- of-pocket expenses incurred in the performance of its duties under the Compliance Services Agreement. The amount due to MFund for chief compliance officer services is listed in the Statement of Assets and Liabilities under “Compliance officer fees payable” and the amount accrued for the year is shown in the Statement of Operations under “Compliance officer fees.”
A trustee is the controlling member of MFund and of AlphaCentric Advisors LLC and Catalyst Capital Advisors LLC (investments managers to other series of the Trust) and is not paid any fees directly by the Trust for serving in such capacities. Trustees who are not “interested persons” as that term is defined in the 1940 Act, are paid a quarterly retainer and receive compensation for each special Board meeting and Risk and Compliance Committee meeting. The fees paid to the Independent Trustees for their attendance at a meeting will be shared equally by the funds of the Trust in which the meeting relates. The Lead Independent Trustee of the Trust and the Chairman of the Trust’s Audit Committee receive an additional quarterly retainer. The “interested persons” of the Trust receive no compensation from the Fund. The Trust reimburses each Trustee and Officer for his or her travel and other expenses related to attendance at such meetings.
Northern Lights Distributors, LLC, (“Distributor”) serves as the principal underwriter and national distributor for the shares of the Fund pursuant to an Underwriting Agreement with the Trust.
Ultimus Fund Solutions, LLC (“UFS”), an affiliate of the Distributor, provides administrative, fund accounting, and transfer agency services to the Fund pursuant to agreements with the Trust, for which it receives from the Fund: (i) basis points in decreasing amounts as assets reach certain breakpoints; and (ii) any related out-of-pocket expenses.
Blu Giant, LLC (“Blu Giant”), an affiliate of the Distributor and UFS, provides EDGAR conversion and filing services as well as print management services for the Funds on an ad-hoc basis. For the provision of these services, Blu Giant receives customary fees from the Funds.
The Trust has adopted a Distribution Plan pursuant to rule 12b-1 under the 1940 Act for Class A and Class C shares of the Fund, that allows the Fund to pay distribution and shareholder servicing expenses of up to 0.25% per annum for the Class A shares and up to 1.00% for the Class C shares based on average daily net assets of each class. The fee may be used for a variety of purposes, including compensating dealers and other financial service organizations for eligible services provided by those parties to the Fund and its shareholders and to reimburse the Distributor and the Manager for distribution related expenses. Brokers may receive a 1.00% commission from the Manager for the sale of Class C shares.
For the year ended June 30, 2023 the Distributor received $85 in underwriter commissions from the sale of Class A shares of the Fund.
| (4) | DISTRIBUTIONS TO SHAREHOLDERS AND TAX COMPONENTS OF CAPITAL |
The Statement of Assets and Liabilities represents cost for financial reporting purposes. Aggregate cost for federal tax purposes is $19,817,636 for the Fund, and differs from fair value by net unrealized appreciation (depreciation) of securities as follows:
| Gross Unrealized Appreciation: | $ | 731,781 | ||
| Gross Unrealized Depreciation: | (904,650 | ) | ||
| Net Unrealized Depreciation: | $ | (172,869 | ) |
18
| Day Hagan Smart Value Fund |
| NOTES TO FINANCIAL STATEMENTS (Continued) |
| June 30, 2023 |
The tax character of distributions paid during the fiscal years ended June 30, 2023 and June 30, 2022 was as follows:
| Fiscal Year Ended | Fiscal Year Ended | |||||||
| June 30, 2023 | June 30, 2022 | |||||||
| Ordinary Income | $ | 232,760 | $ | 329,571 | ||||
| Long-Term Capital Gain | 917,069 | 4,982 | ||||||
| Return of Capital | — | — | ||||||
| $ | 1,149,829 | $ | 334,553 | |||||
As of June 30, 2023, the components of accumulated earnings on a tax basis were as follows:
| Undistributed | Undistributed | Post October Loss | Capital Loss | Other | Unrealized | Total | ||||||||||||||||||||
| Ordinary | Long-Term | and | Carry | Book/Tax | Appreciation/ | Accumulated | ||||||||||||||||||||
| Income | Capital Gains | Late Year Loss | Forwards | Differences | (Depreciation) | Earnings/(Losses) | ||||||||||||||||||||
| $ | 51,147 | $ | 2,422,467 | $ | — | $ | — | $ | — | $ | (172,640 | ) | $ | 2,300,974 | ||||||||||||
The difference between book basis and tax basis unrealized appreciation and accumulated net realized losses are primarily attributable to of losses the C-Corporation return of capital distribution.
During the fiscal period ended June 30, 2023, the Fund utilized tax equalization which is the use of earnings and profits distributions to shareholders on redemption of shares as part of the dividends paid deduction for income tax purposes. Permanent book and tax differences, primarily attributable to the use of tax equalization credits resulted in reclassifications for the Funds for the fiscal year ended June 30, 2023 as follows:
| Paid In | Distributable | |||||
| Capital | Earnings | |||||
| $ | 421,985 | $ | (421,985 | ) | ||
| (5) | BENEFICIAL OWNERSHIP |
The beneficial ownership, either directly or indirectly, of more than 25% of the voting securities of a fund creates a presumption of control of the fund, under Section 2(a)(9) of the 1940 Act. As of June 30, 2023, RJ Trust Co. held 46.06% and may be deemed to control the Fund.
| (6) | SUBSEQUENT EVENTS |
Subsequent events after the date of the Statement of Assets and Liabilities have been evaluated through the date the financial statements were issued. Management has determined that no events or transactions occurred requiring adjustment or disclosure in the financial statements.
19

REPORT OF INDEPENDENT REGISTERED PUBLIC ACCOUNTING FIRM
To the Shareholders of Day Hagan Smart Value Fund and
Board of Trustees of Mutual Fund Series Trust
Opinion on the Financial Statements
We have audited the accompanying statement of assets and liabilities, including the schedule of investments, of Day Hagan Smart Value Fund (the “Fund”), a series of Mutual Fund Series Trust, as of June 30, 2023, the related statements of operations and changes in net assets, the related notes, and the financial highlights for the year then ended (collectively referred to as the “financial statements”). In our opinion, the financial statements present fairly, in all material respects, the financial position of the Fund as of June 30, 2023, the results of its operations, the changes in net assets, and the financial highlights for the year then ended, in conformity with accounting principles generally accepted in the United States of America.
The Fund’s financial statements and financial highlights for the years ended June 30, 2022, and prior, were audited by another auditor whose report dated August 29, 2022 expressed an unqualified opinion on those financial statements and financial highlights.
Basis for Opinion
These financial statements are the responsibility of the Fund’s management. Our responsibility is to express an opinion on the Fund’s financial statements based on our audit. We are a public accounting firm registered with the Public Company Accounting Oversight Board (United States) (“PCAOB”) and are required to be independent with respect to the Fund in accordance with the U.S. federal securities laws and the applicable rules and regulations of the Securities and Exchange Commission and the PCAOB.
We conducted our audit in accordance with the standards of the PCAOB. Those standards require that we plan and perform the audit to obtain reasonable assurance about whether the financial statements are free of material misstatement whether due to error or fraud.
Our audit included performing procedures to assess the risks of material misstatement of the financial statements, whether due to error or fraud, and performing procedures that respond to those risks. Such procedures included examining, on a test basis, evidence regarding the amounts and disclosures in the financial statements. Our procedures included confirmation of securities owned as of June 30, 2023, by correspondence with the custodian. Our audit also included evaluating the accounting principles used and significant estimates made by management, as well as evaluating the overall presentation of the financial statements. We believe that our audit provides a reasonable basis for our opinion.
We have served as the Fund’s auditor since 2023.

COHEN & COMPANY, LTD.
Philadelphia, Pennsylvania
August 29, 2023
COHEN & COMPANY, LTD.
800.229.1099 | 866.818.4538 fax | cohencpa.com
Registered with the Public Company Accounting Oversight Board
20
| Day Hagan Smart Value Fund |
| CHANGE IN INDEPENDENT REGISTERED PUBLIC ACCOUNTING FIRM (Unaudited) |
| June 30, 2023 |
On March 9, 2023, BBD, LLP (“BBD”) ceased to serve as the independent registered public accounting firm of the Day Hagan Smart Value Fund, (“Fund”), a series of Mutual Fund Series Trust. The Audit Committee of the Board of Trustees approved the replacement of BBD as a result of Cohen & Company, Ltd.’s (“Cohen”) acquisition of BBD’s investment management group.
The report of BBD on the financial statements of the Fund as of and for the fiscal years ended June 30, 2021 and June 30, 2022 did not contain an adverse opinion or a disclaimer of opinion, and were not qualified or modified as to uncertainties, audit scope or accounting principles. During the years ended June 30, 2021 and June 30, 2022 and during the subsequent interim period ended March 9, 2023: (i) there were no disagreements between the registrant and BBD on any matter of accounting principles or practices, financial statement disclosure, or auditing scope or procedure, which disagreements, if not resolved to the satisfaction of BBD, would have caused it to make reference to the subject matter of the disagreements in its report on the financial statements of the Fund for such years or interim period; and (ii) there were no “reportable events,” as defined in Item 304(a)(1)(v) of Regulation S-K under the Securities Exchange Act of 1934, as amended.
The registrant requested that BBD furnish it with a letter addressed to the U.S. Securities and Exchange Commission stating that it agrees with the above statements. A copy of such letter is filed as an exhibit to Form N-CSR.
On May 22, 2023, the Audit Committee of the Board of Trustees also recommended and approved the appointment of Cohen as the Fund’s independent registered public accounting firm for the fiscal period ending June 30, 2023.
During the fiscal years ended June 30, 2021 and June 30, 2022, and during the interim period through May 22, 2023, neither the registrant, nor anyone acting on its behalf, consulted with Cohen on behalf of the Fund regarding the application of accounting principles to a specified transaction (either completed or proposed), the type of audit opinion that might be rendered on the Fund’s financial statements, or any matter that was either: (i) the subject of a “disagreement,” as defined in Item 304(a)(1)(iv) of Regulation S-K and the instructions thereto; or (ii) “reportable events,” as defined in Item 304(a)(1)(v) of Regulation S-K.
21
| Day Hagan Smart Value Fund |
| EXPENSE EXAMPLES (Unaudited) |
| June 30, 2023 |
As a shareholder of the Fund, you incur two types of costs: (1) transaction costs, including sales charges (loads) on purchases of Class A shares; and (2) ongoing costs, including management fees, distribution and/or service (12b-1) fees, and other Fund expenses. This example is intended to help you understand your ongoing costs (in dollars) of investing in the Funds and to compare these costs with the ongoing costs of investing in other mutual funds.
The example is based on an investment of $1,000 invested at the beginning of the period and held for the period from January 1, 2023 through June 30, 2023.
Actual Expenses
The “Actual” lines in the table below provide information about actual account values and actual expenses. You may use the information below, together with the amount you invested, to estimate the expenses that you paid over the period. Simply divide your account value by $1,000 (for example, an $8,600 account value divided by $1,000 = 8.6), then multiply the result by the number in the table under the heading entitled “Expenses Paid During Period” to estimate the expenses you paid on your account during this period.
Hypothetical Example for Comparison Purposes
The “Hypothetical” lines in the tables below provide information about hypothetical account values and hypothetical expenses based on the Fund’s actual expense ratio and an assumed rate of return of 5% per year before expenses, which is not the Fund’s actual return. The hypothetical account values and expenses may not be used to estimate the actual ending account balances or expenses you paid for the period. You may use this information to compare this 5% hypothetical example with the 5% hypothetical examples that appear in the shareholder reports of other funds.
Please note that the expenses shown in the table are meant to highlight your ongoing costs only and do not reflect any transactional costs, such as sales charges (loads), or redemption fees. Therefore, the table is useful in comparing ongoing costs only, and will not help you determine the relative total costs of owning different funds. In addition, if these transactional costs were included, your costs would have been higher.
| Beginning | Ending | Expenses Paid | Expense Ratio | |||||
| Account Value | Account Value | During Period* | During Period** | |||||
| Actual | 1/1/23 | 6/30/23 | 1/1/23-6/30/23 | 1/1/23 – 6/30/23 | ||||
| Class A | $1,000.00 | $1,049.80 | $7.52 | 1.48% | ||||
| Class C | 1,000.00 | 1,045.90 | 11.31 | 2.23 | ||||
| Class I | 1,000.00 | 1,050.80 | 6.25 | 1.23 | ||||
| Beginning | Ending | Expenses Paid | Expense Ratio | |||||
| Hypothetical | Account Value | Account Value | During Period* | During Period** | ||||
| (5% return before expenses) | 1/1/23 | 6/30/23 | 1/1/23 – 6/30/23 | 1/1/23-6/30/23 | ||||
| Class A | $1,000.00 | $1,017.46 | $7.40 | 1.48% | ||||
| Class C | 1,000.00 | 1,013.74 | 11.13 | 2.23 | ||||
| Class I | 1,000.00 | 1,018.70 | 6.16 | 1.23 |
| * | Expenses are equal to the average account value over the period, multiplied by the Fund’s annualized expense ratio, multiplied by the number of days in the period (181) divided by the number of days in the fiscal year (365). |
| ** | Annualized. |
22
| Day Hagan Smart Value Fund |
| SUPPLEMENTAL INFORMATION (Unaudited) |
| June 30, 2023 |
Reference is made to the Prospectus and the Statement of Additional Information for more detailed descriptions of the Management Agreement, Services Agreement and Distribution and/or Service (12b-1) Plan, tax aspects of the Fund and the calculation of the net asset value of shares of the Fund.
The Fund files a complete schedule of portfolio holdings with the Securities and Exchange Commission (the “SEC”) for the first and third quarters of each fiscal year as an exhibit to its reports on Form N-PORT, within sixty days after the end of the period. Form N-PORT reports are available at the SEC’s website at http://www.sec.gov.
Information regarding how the Fund voted proxies relating to portfolio securities during the twelve month period ended June 30 as well as a description of the policies and procedures that the Fund uses to determine how to vote proxies relating to portfolio securities is available without charge, upon request, by calling 1-877-329-4246; and on the Commission’s website at http://www.sec.gov.
23
| Day Hagan Smart Value Fund |
| SUPPLEMENTAL INFORMATION (Unaudited) |
| June 30, 2023 |
LIQUIDITY RISK MANAGEMENT PROGRAM
The Fund has adopted and implemented a written liquidity risk management program as required by Rule 22e-4 (the “Liquidity Rule”) under the Investment Company Act. The program is reasonably designed to assess and manage the Fund’s liquidity risk, taking into consideration, among other factors, the Fund’s investment strategies and the liquidity of its portfolio investments during normal and reasonably foreseeable stressed conditions; its short and long-term cash flow projections; and its cash holdings and access to other funding sources.
During the year ended June 30, 2023, the Board and the Trust’s Liquidity Risk Management Program Committee (the “Committee”) reviewed the Fund’s investments and they determined that the Fund held adequate levels of cash and highly liquid investments to meet shareholder redemption activities in accordance with applicable requirements. Accordingly, the Board and Committee concluded that (i) the Fund’s liquidity risk management program is reasonably designed to prevent violations of the Liquidity Rule and (ii) the Fund’s liquidity risk management program has been effectively implemented.
24
| Day Hagan Smart Value Fund |
| SUPPLEMENTAL INFORMATION |
| June 30, 2023 (Unaudited) |
Independent Trustees
| Name, Address Year of Birth | Position(s) Held with Registrant | Term and Length Served* | Principal Occupation(s) During Past 5 Years | Number of Portfolios Overseen in the Fund Complex** | Other Directorships Held During Past 5 Years |
| Tobias Caldwell c/o Mutual Fund Series Trust 36 N. New York Avenue, Huntington, NY 11743 Year of Birth: 1967 | Lead Trustee, Chairman of the Audit Committee and Nominating Committee | Since 6/2006 | Manager of Genovese Family Enterprises LLC & affiliates, the Genovese family office, since 1999; Managing Member of Bear Properties, LLC, a real estate management firm, since 2006; Managing Member of PTL Real Estate LLC, from 2000 until 2019. | 53 | Trustee of Variable Insurance Trust since 2010; Chairman of the Board of Mutual Fund and Variable Insurance Trust since 2016; Chairman of the Board of Strategy Shares since 2016; Trustee of IDX Funds Trust since 2016; Chairman of the Board of AlphaCentric Prime Meridian Income Fund since 2018 |
| Tiberiu Weisz c/o Mutual Fund Series Trust 36 N. New York Avenue, Huntington, NY 11743 Year of Birth: 1949 | Trustee, Chairman of the Risk and Compliance Committee | Since 6/2006 | Attorney since 1982. | 36 | Trustee of Variable Insurance Trust since 2010 |
| Stephen P. Lachenauer c/o Mutual Fund Series Trust 36 N. New York Avenue, Huntington, NY 11743 Year of Birth: 1967 | Trustee | Since 4/2022 | Attorney, private practice since 2010. | 53 | Trustee and Chair of the Audit and Risk and Compliance Committees since 2016, and Chair of the Investment Committee since November 2020, Mutual Fund and Variable Insurance Trust; Trustee and Chair of the Audit and Risk and Compliance Committees since 2016, and Chair of the Investment Committee since November 2020, Strategy Shares; Chairman of the Board, TCG Financial Series Trusts I-X since 2015; Trustee and Chair of the Audit and Risk and Compliance Committees since 2018, and Chair of the Investment Committee since November 2020, AlphaCentric Prime Meridian Income Fund. |
25
Day Hagan Smart Value Fund
SUPPLEMENTAL INFORMATION
June 30, 2023 (Unaudited) (Continued)
Interested Trustee*** and Officers
Name, Address, Year of Birth | Position(s) Held with Registrant | Term and Length Served* | Principal Occupation(s) During Past 5 Years | Number of Portfolios Overseen In The Fund Complex** | Other Directorships During Past 5 |
| Jerry Szilagyi 53 Palmeras St. Suite 601 San Juan, PR 00901 Year of Birth: 1962 | Chairman of the Board | Trustee since 7/2006; President 2/2012- 3/2022 | President of the Trust, 2/2012- 3/2022; President, Rational Advisors, Inc., 1/2016 - present; Chief Executive Officer, Catalyst Capital Advisors LLC, 1/2006- present; Member, AlphaCentric Advisors LLC, 2/2014 to Present; Managing Member, MFund Distributors LLC, 10/2012- present; Managing Member, MFund Services LLC, 1/2012 – Present; CEO, Catalyst International Advisors LLC, 11/2019 to present; CEO, Insights Media LLC, 11/2019 to present; CEO, MFund Management LLC, 11/2019 to present. | 36 | Variable Insurance Trust since 2010 |
| Michael Schoonover 53 Palmeras St. Suite 601 San Juan, PR 00901 Year of Birth: 1983 | President | Since 3/2022 | Vice President of the Trust, 2018-- 2022; Chief Operating Officer, Catalyst Capital Advisors LLC and Rational Advisors, Inc., 6/2017 to present; Portfolio Manager, Catalyst Capital Advisors LLC 12/2013 to 5/2021; Portfolio Manager, Rational Advisors, Inc. 1/2016 to 5/2018; President, MFund Distributors LLC, 1/2020 to present; COO, Catalyst International Advisors LLC, 11/2019 to present; COO, Insights Media LLC, 11/2019 to present; COO, MFund Management LLC, 11/2019 to present; COO, AlphaCentric Advisors LLC, since 1/2021. | N/A | N/A |
| Alex Merino 53 Palmeras St. Suite 601 San Juan, PR 00901 Year of Birth: 1985 | Vice President | Since 3/2022 | Investment Operations Manager, MFund Management LLC, 1/2022 to present; Investment Operations Analyst, MFund Management LLC, 9/2020 to 12/2021; Tax Senior Associate, PwC Asset & Wealth Management NY Metro, 7/2016-6/2019. | N/A | N/A |
| Erik Naviloff 4221 North 203rd Street, Suite 100, Elkhorn, Nebraska, 68022 Year of Birth: 1968 | Treasurer | Since 4/2012 | Vice President – Fund Administration, Ultimus Fund Solutions, LLC, since 2011. | N/A | N/A |
| Brian Curley 4221 North 203rd Street, Suite 100, Elkhorn, Nebraska, 68022 Year of Birth: 1970 | Assistant Treasurer | Since 11/2013 | Vice President – Fund Administration, Ultimus Fund Solutions, LLC since 1/2015. | N/A | N/A |
| Sam Singh 4221 North 203rd Street, Suite 100, Elkhorn, Nebraska, 68022 Year of Birth: 1976 | Assistant Treasurer | Since 2/2015 | Vice President – Fund Administration, Ultimus Fund Solutions, LLC since 1/2015. | N/A | N/A |
| Frederick J. Schmidt 36 N. New York Avenue Huntington, NY 11743 Year of Birth: 1959 | Chief Compliance Officer | Since 5/2015 | Director of Compliance Services, MFund Services LLC since 5/2015. | N/A | N/A |
| Jennifer A. Bailey 36 N. New York Avenue Huntington, NY 11743 Year of Birth: 1968 | Secretary | Secretary since 4/2014 | Director of Legal Services, MFund Services LLC, since 2012. | N/A | N/A |
| * | The term of office of each Trustee is indefinite. |
| ** | The ‘Fund Complex’ includes the Trust, Variable Insurance Trust, Mutual Fund and Variable Insurance Trust, Strategy Shares, and AlphaCentric Prime Meridian Income Fund, each a registered investment company. |
| *** | The Trustee who is an “interested person” of the Trust as defined in the 1940 Act is an interested person by virtue of being an officer of the advisor to certain series of the Trust. |
The Fund’s SAI includes additional information about the Trustees and is available, free of charge, by calling toll-free 1-877-329-4246.
26
PRIVACY NOTICE
Mutual Fund Series Trust
Rev. August 2021
| FACTS | WHAT DOES MUTUAL FUND SERIES TRUST DO WITH YOUR PERSONAL INFORMATION? |
| Why? | Financial companies choose how they share your personal information. Federal law gives consumers the right to limit some, but not all sharing. Federal law also requires us to tell you how we collect, share, and protect your personal information. Please read this notice carefully to understand what we do. |
| What? | The types of personal information we collect and share depends on the product or service that you have with us. This information can include:
● Social Security number and wire transfer instructions
● account transactions and transaction history
● investment experience and purchase history
When you are no longer our customer, we continue to share your information as described in this notice. |
| How? | All financial companies need to share customers’ personal information to run their everyday business. In the section below, we list the reasons financial companies can share their customers’ personal information; the reasons Mutual Fund Series Trust chooses to share; and whether you can limit this sharing. |
| Reasons we can share your personal information: | Does Mutual Fund Series Trust share information? | Can you limit this sharing? |
| For our everyday business purposes - such as to process your transactions, maintain your account(s), respond to court orders and legal investigations, or report to credit bureaus. | YES | NO |
| For our marketing purposes - to offer our products and services to you. | NO | We don’t share |
| For joint marketing with other financial companies. | NO | We don’t share |
| For our affiliates’ everyday business purposes - information about your transactions and records. | NO | We don’t share |
| For our affiliates’ everyday business purposes - information about your credit worthiness. | NO | We don’t share |
| For our affiliates to market to you | NO | We don’t share |
| For non-affiliates to market to you | NO | We don’t share |
27
PRIVACY NOTICE
Mutual Fund Series Trust
| What we do: | |
How does Mutual Fund Series Trust protect my personal information? | To protect your personal information from unauthorized access and use, we use security measures that comply with federal law. These measures include computer safeguards and secured files and buildings.
Our service providers are held accountable for adhering to strict policies and procedures to prevent any misuse of your nonpublic personal information. |
How does Mutual Fund Series Trust collect my personal information? | We collect your personal information, for example, when you: ● open an account or deposit money
● direct us to buy securities or direct us to sell your securities
● seek advice about your investments
We also collect your personal information from others, such as credit bureaus, affiliates, or other companies. |
Why can’t I limit all sharing? | Federal law gives you the right to limit only: ● sharing for affiliates’ everyday business purposes – information about your creditworthiness.
● affiliates from using your information to market to you.
● sharing for non-affiliates to market to you.
State laws and individual companies may give you additional rights to limit sharing. |
| Definitions | |
| Affiliates | Companies related by common ownership or control. They can be financial and non-financial companies.
● Mutual Fund Series Trust does not share with affiliates. |
| Non-affiliates | Companies not related by common ownership or control. They can be financial and non-financial companies.
● Mutual Fund Series Trust doesn’t share with non-affiliates so they can market to you. |
| Joint marketing | A formal agreement between nonaffiliated financial companies that together market financial products or services to you.
● Mutual Fund Series Trust doesn’t jointly market. |
| QUESTIONS? CALL | Alpha Centric | 844-223-8637 |
| Catalyst | 866-447-4228 | |
| Day Hagan | 877-329-4246 | |
| Empiric | 888-839-7424 | |
| Eventide | 877-771-3836 | |
| JAG | 855-552-4596 |
28
| Mutual Fund Series Trust |
| 4221 North 203rd Street, Suite 100 |
| Elkhorn, NE 68022 |
| MANAGER |
| Donald L. Hagan, LLC |
| also known as |
| Day Hagan Asset Management |
| 1000 South Tamiami Trail |
| Sarasota, FL 34236 |
| ADMINISTRATOR |
| Ultimus Fund Solutions, LLC |
225 Pictoria Drive, Suite 450 |
Cincinnati, OH 45246 |
| TRANSFER AGENT |
Ultimus Fund Solutions, LLC |
225 Pictoria Drive, Suite 450 |
Cincinnati, OH 45246 |
| INDEPENDENT REGISTERED PUBLIC ACCOUNTING FIRM |
| Cohen & Company, Ltd. |
| 1835 Market Street |
| Suite 310 |
| Philadelphia, PA 19103 |
| LEGAL COUNSEL |
| Thompson Hine LLP |
| 41 South High Street |
| Suite 1700 |
| Columbus, OH 43215 |
| CUSTODIAN BANK |
| U.S. Bank |
| 1555 N. Rivercenter Drive |
| Suite 302 |
| Milwaukee, WI 53212 |
| DH-AR23 |
| (b) | Not Applicable |
ITEM 2. CODE OF ETHICS.
(a) The registrant has, as of the end of the period covered by this report, adopted a code of ethics that applies to the registrant's principal executive officer, principal financial officer, principal accounting officer or controller, or persons performing similar functions, regardless of whether these individuals are employed by the registrant or a third party.
(b) During the period covered by this report, there were no amendments to any provision of the code of ethics.
(c) During the period covered by this report, there were no waivers or implicit waivers of a provision of the code of ethics.
ITEM 3. AUDIT COMMITTEE FINANCIAL EXPERT.
| The registrant’s Board of Trustees has determined that it does not have an audit committee financial expert serving on its audit committee. At this time, the registrant believes that the experience provided by each member of the audit committee together offer the registrant adequate oversight for the registrant’s level of financial complexity. |
ITEM 4. PRINCIPAL ACCOUNTANT FEES AND SERVICES.
| (a) | Audit Fees. The aggregate fees billed for each of the last two fiscal years for professional services rendered by the registrant's principal accountant for the audit of the registrant's annual financial statements or services that are normally provided by the accountant in connection with statutory and regulatory filings or engagements for those fiscal years are as follows:
| |||
| Trust Series | 2023 | 2022 | ||
| Day Hagan Logix Smart Value Fund | 12,000 | 12,000 | ||
| (b) | Audit-Related Fees. There were no fees billed in each of the last two fiscal years for assurances and related services by the principal accountant that are reasonably related to the performance of the audit of the registrant’s financial statements and are not reported under paragraph (a) of this item. | |||
| (c) | Tax Fees. The aggregate fees billed in each of the last two fiscal years for professional services rendered by the principal accountant for tax compliance are as follows: | |||
| Trust Series | 2023 | 2022 |
| Day Hagan Logix Smart Value Fund | 2,500 | 2,000 |
| (d) | All Other Fees. The aggregate fees billed in each of the last two fiscal years for products and services provided by the registrant’s principal accountant, other than the services reported in paragraphs (a) through (c) of this item were $0 and $0 for the fiscal years ended June 30, 2023 and 2022 respectively. |
| (e)(1) | The audit committee does not have pre-approval policies and procedures. Instead, the audit committee or audit committee chairman approves on a case-by-case basis each audit or non-audit service before the principal accountant is engaged by the registrant. |
| (e)(2) | There were no services described in each of paragraphs (b) through (d) of this Item that were approved by the audit committee pursuant to paragraph (c)(7)(i)(C) of Rule 2-01 of Regulation S-X. |
| (f) | Not applicable. The percentage of hours expended on the principal accountant's engagement to audit the registrant's financial statements for the most recent fiscal year that were attributed to work performed by persons other than the principal accountant's full-time, permanent employees was zero percent (0%). |
| (g) | All non-audit fees billed by the registrant's principal accountant for services rendered to the registrant for the fiscal years ended June 30, 2023 and 2022 respectively are disclosed in (b)-(d) above. There were no audit or non-audit services performed by the registrant's principal accountant for the registrant's adviser. |
| (h) | Not applicable. The registrant's audit committee has considered whether the provision of non-audit services to the registrant's investment adviser (not including any sub-adviser whose role is primarily portfolio management and is subcontracted with or overseen by another investment adviser), and any entity controlling, controlled by, or under common control with the investment adviser that provides ongoing services to the registrant, that were not pre-approved pursuant to paragraph (c)(7)(ii) of Rule 2-01 of Regulation S-X, is compatible with maintaining the principal accountant's independence. |
| (i) | Not applicable. |
| (j) | Not applicable. |
ITEM 5. AUDIT COMMITTEE OF LISTED REGISTRANTS.
Not applicable
ITEM 6. SCHEDULE OF INVESTMENT
Included in annual report to shareholders filed under item 1 of this form.
ITEM 7. DISCLOSURE OF PROXY VOTING POLICIES AND PROCEDURES FOR CLOSED-END MANAGEMENT INVESTMENT COMPANIES.
Not applicable Fund is an open-end management investment company
ITEM 8. PORTFOLIO MANAGERS OF CLOSED-END MANAGEMENT INVESTMENT COMPANIES
Not applicable Fund is an open-end management investment company
ITEM 9. PURCHASES OF EQUITY SECURITIES BY CLOSED-END MANAGEMENT INVESTMENT COMPANY AND AFFILIATED PURCHASERS.
Not applicable Fund is an open-end management investment company
ITEM 10. SUBMISSION OF MATTERS TO A VOTE OF SECURITY HOLDERS.
Not applicable at this time.
ITEM 11. CONTROLS AND PROCEDURES.
| (a) | The registrant's principal executive and principal financial officers, or persons performing similar functions, have concluded that the registrant's disclosure controls and procedures (as defined in Rule 30a-3(c) under the 1940 Act, are effective, as of a date within 90 days of the filing date of this report, based on the evaluation of these controls and procedures required by Rule 30a-3(b) under the 1940 Act and Rule 15d-15(b) under the Securities Exchange Act of 1934, as amended. |
| (b) | There were no significant changes in the Registrant’s internal control over financial reporting that occurred during the period covered by this report that have materially affected, or are reasonably likely to materially affect, the Registrant’s internal control over financial reporting. |
ITEM 12. DISCLOSURE OF SECURITIES LENDING ACTIVITIES FOR CLOSED-END MANAGEMENT INVESTMENT COMPANIES. Not applicable to open-end investment companies.
ITEM 13. EXHIBITS
| (1) | Code of Ethics for Principal Executive and Senior Financial Officers is attached hereto. |
| (2) | Certifications pursuant to Section 302 of the Sarbanes-Oxley Act of 2002 are filed herewith. |
| (3) | Certifications pursuant to Section 906 of the Sarbanes-Oxley Act of 2002 are filed herewith. |
| (4) | Change in registrant’s independent public accountant is filed herewith. |
SIGNATURES
Pursuant to the requirements of the Securities Exchange Act of 1934 and the Investment Company Act of 1940, the registrant has duly caused this report to be signed on its behalf by the undersigned, thereunto duly authorized.
Mutual Fund Series Trust
| By Michael Schoonover | /s/ Michael Schoonover__________ |
| Principal Executive Officer/President | |
| Date: September 7, 2023 | |
Pursuant to the requirements of the Securities Exchange Act of 1934 and the Investment Company Act of 1940, this report has been signed below by the following person on behalf of the registrant and in the capacities and on the date indicated.
| By Erik Naviloff | /s/Erik Naviloff ____________ |
| Erik Naviloff, Principal Financial Officer/Treasurer | |
| Date: September 7, 2023 | |