united states
securities and exchange commission
washington, d.c. 20549
form n-csr
certified shareholder report of registered management
investment companies
Investment Company Act file number 811-21872
Mutual Fund Series Trust
(Exact name of registrant as specified in charter)
225 Pictoria Drive, Suite 450, Cincinnati, Ohio 45246
(Address of principal executive offices) (Zip code)
CT CORPORATION SYSTEM
1300 EAST NINTH STREET, CLEVELAND, OH 44114
(Name and address of agent for service)
Registrant's telephone number, including area code: 631-490-4300
Date of fiscal year end: 9/30
Date of reporting period: 9/30/23
ITEM 1. REPORTS TO SHAREHOLDERS.

Annual Report
September 30, 2023
7951-NLD 11/13/2023
For the year ending September 30th, 2023, the Empiric Fund was up 15.43% versus 11.81% for the MSCI Small Cap Index. Your managers work hard to minimize capital gains each year. We do not expect any capital gains distributions this year.
The Fund’s best performers were Fair Isaac Corp, United Rentals Inc., Ares Management Corp, Coca-Cola Bottling Co, and Extreme Networks. The Fund’s worst performers were Calix, Generac Holdings, Dollar General, AMN Healthcare and Dine Brands Global, Inc.
Management Letter
There’s a French saying: “The more things change, the more they stay the same.”
The saying suggests that though circumstances may appear to change, certain underlying fundamental principles guiding those changes remain constant. It proposes that even when there are apparent shifts or transformations, some core elements, patterns, and philosophies persist over time. The more things change, the more they stay the same reminds us that even amid massive change, there are enduring principles which remain true.
The investment landscape has changed dramatically over the past two years. An unrelenting Russia has waged a brutal war against Ukraine, and more recently the focus has shifted to Hamas’ attack on Israel. Two years ago, the 10-Year Treasury yielded 1.56%; Today it yields 4.85%. Two years ago, the Federal Reserve’s benchmark rate stood at .25%; Today it’s 5.5%.
It is human nature to use recent experience as the basis for what to expect in the future, this error is known as “recency bias.” Our nervous systems are tied to the now. For instance, the long-term treasury bond for most of the last decade yielded between a low of .56% and, until recently, about 2.5%.
Those low rates led two banks in California, Silicon Valley Bank and First Republic, in a bone head move to buy huge amounts of long-term treasury bonds as the bonds yielded slightly more than very short-term treasury bills. Bank of America is guilty of this as well, as are many regional banks. Long-term treasury bonds have little credit risk but significant interest rate risk, so much so that both Silicon Valley Bank and First Republic failed.
The San Francisco Federal Reserve, the regulators who oversaw those failed banks, missed interest risk as well. The banks’ and Fed’s bet was that rates would stay low, which in hindsight, was a tragic bet. Mark Twain said it best, “It ain’t what you don’t know that gets you in trouble. It’s what you know for sure that just ain’t so.” The banks “knew” rates would stay low, and it just wasn’t so.
One of the most apparent changes has been the tsunami of new, inexperienced investors created by the Federal Reserve’s Payroll Protection Program and the Federal Government’s Paycheck Stimulus Program. These new investors unleashed an appetite for new investment and brought with them a euphoria for assets unlike any I’ve ever witnessed. The result was wild speculation in crypto, crypto related stocks, as well as meme stocks such as AMC Movie Theatres, Bed, Bath and Beyond, and
GameStop. Most speculators have lost money in crypto, and two of the three companies mentioned above have gone bankrupt. This is a crucial reminder of how important it is to have a solid foundation of principles guiding investment decisions. Warren Buffett so acutely stated, “The stock market is designed to transfer money from the active to the patient.”
His remarks emphasize the importance of a long-term, principled, diligent approach to investing, rather than being swayed by short-term market fluctuations, excitement, or paranoia. Staying calm and sticking to a long-term investment strategy, especially one focused on quality, will fare better over time than reacting to recent experience with exuberance or gloom.
The fundamental principles and rules we use to guide our investment decisions is largely based around:
| 1. | A company’s sustainable advantage, or the strength of a company’s moat. |
| 2. | High profitability. Highly profitable companies can grow without issuing debt or more stock. |
| 3. | The ability to grow and reinvest at highly profitable rates. |
| 4. | Management focused on shareholder stewardship. |
Sustainable advantage. Warren Buffett stated, “The key to investing is not assessing how much an industry is going to affect society, or how much it will grow, but rather determining the competitive advantage of any given company and, above all, the durability of that advantage.” The wisdom behind Buffett’s statement is that no matter how sexy an industry’s growth rate, or how influential a company may become, without a significant competitive advantage or, “moat,” the company’s profits will be eroded by competitors. Companies with moats will eventually overtake those without them, and the rewards will be passed down to the patient investors who hold them.
High profitability. For a company to maintain high profitability for long periods means it has some sustainable advantage, such as patents, processes, brand, location, economies of scale, network effects and/or high switching costs. Profitability can be measured in several ways. We look for high returns on equity and high return on invested capital (ROIC). You can think of a high ROIC as a high yielding investment for the company and its investors.
Grow and reinvest. We seek companies that can grow and reinvest at highly profitable rates. Most investors seek hot growth in earnings and sales - but fail to account for how profitable past investments in invested capital have been. High growth but low profitability signals a company will have to issue shares or debt to fund itself for future new investments. We want to focus on the companies that will not require additional outside capital to fund themselves or new invested capital.
Management focused on shareholder stewardship. One would think that management is always focused on shareholders, but unfortunately at times they enrich themselves at the expense of everyone else. Robinhood, the center of the meme stock mania, issued $2.07 Billion in stock options to management in fiscal 2021. Management would have no way to pay themselves other than by diluting shareholders, because in that same year the business which they manage lost nearly $4 Billion. Obviously, we do not want to be shareholders of these companies.
Companies who reward shareholders alongside management are far, far more appealing. These companies tend to buy back significant portions of their own stock as well as pay dividends. Stock buybacks provide a tax-friendly route to reward both management and shareholders. Stipulating the company has plenty of sufficient capital to reinvest in its growth prospects going forward, we approve the use of excess capital to reward shareholders through share repurchases and dividends.
The best example of the above principles and our best performing stock for the year is Fair Isaac (FICO). Almost every loan and every credit card issued, the lenders reference one’s FICO score. Your FICO score follows you everywhere. It may even be used to set your insurance rates. A good FICO score indicates you are likely to repay borrowed debt. It sets the likelihood of getting a loan and the interest rate you will pay.
Fair Isaac has a sustainable advantage. Lenders understand and have used FICO scores for a long time. The company’s moat is substantial. It hits on several components of what is believed to derive a moat (patents, processes, brand, location, economies of scale, network effects and/or high switching costs). Its brand has been built up over decades. It is integrated into almost every bank’s credit application system. The company holds over 200 intellectual property patents in the United States and abroad. Their algorithms are difficult to replicate, and the company is so integrated into the financial plumbing of consumer credit, it’s hard to see how any consumer credit could be issued without it.
Fair Isaac has High profitability. The company’s Return on Invested Capital (ROIC) for the last year was a remarkable 36.7% and has been consistently high over the last ten years. Fair Isaac is Growing and Reinvesting. Fair Isaac has increased its revenues, its cash-flow, and earnings every year for the last 10 years. Fair Isaac is focused on Shareholder Stewardship. Fair Isaac has reduced its shares outstanding by 13% over the last five years.
We will continue to operate and invest using the principles laid out above. We know no other way to long-term investment success other than operating on a foundation of rules which have a proven and verifiable track record. We cannot see into the future better than anyone else, but we can make sure that the companies we buy for our portfolios are of the highest quality possible.
We greatly appreciate you investing along with us.
Respectfully submitted,
| Mark A Coffelt, CFA | Loren M Coffelt |
| | |
| Co-Portfolio Manager | Co-Portfolio Manager |
Empiric Fund
PORTFOLIO REVIEW (Unaudited)
September 30, 2023
Average Annual Total Return through September 30, 2023*, as compared to its benchmarks:
| | 1 Year Return | 5 Year Return | 10 Year Return | Since Inception (a) |
| Empiric Fund Class A | 15.43% | 3.70% | 7.54% | 8.58% |
| Empiric Fund Class A with Load (b) | 8.79% | 2.48% | 6.91% | 8.35% |
| MSCI USA Small Cap Index(c) | 11.81% | 4.36% | 7.83% | N/A |
| * | The performance data quoted here represents past performance. Current performance may be lower or higher than the performance data quoted above. Investment return and principal value will fluctuate, so that shares, when redeemed, may be worth more or less than their original cost. The returns shown do not reflect the deduction of taxes that a shareholder would pay on Fund distributions or on the redemptions of Fund shares. Past performance is no guarantee of future results. For performance information current to the most recent month-end, please call toll-free 1-888-839-7424. The Fund’s expense ratio, as of the February 1, 2023 prospectus, is 2.12% for Class A shares. For more current information on the Fund’s expense ratio, please see the Financial Highlights. |
| (a) | Class A commenced operations on November 6, 1995. |
| (b) | Class A shares are subject to a maximum sales load of 5.75%, which decreases depending on the amount invested and a maximum deferred sales charge of 1.00%. |
| (c) | The MSCI USA Small Cap Index is designed to measure the performance of the small cap segment of the U.S equity market. This index is not available back to the inception of Class A shares. Investors cannot invest directly in an index. |
Comparison of the Change in Value of a $10,000 Investment
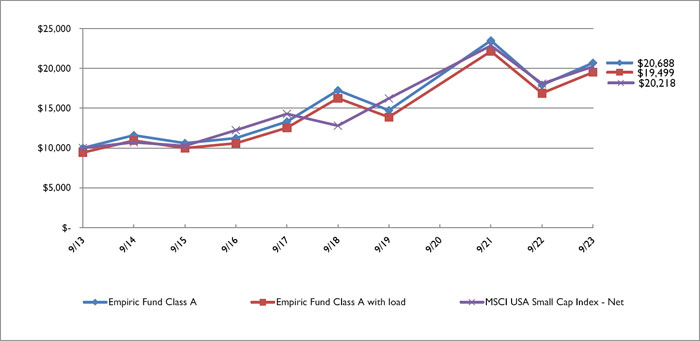
Empiric Fund
PORTFOLIO REVIEW (Unaudited) (Continued)
September 30, 2023
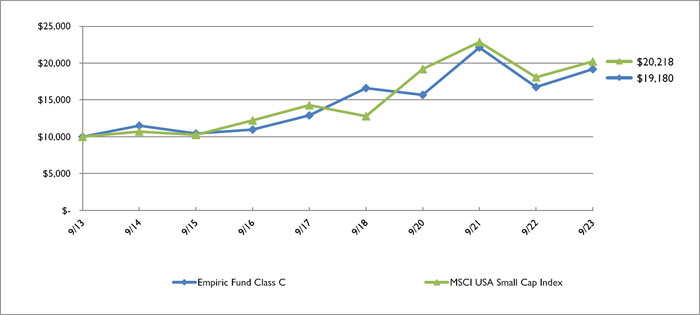
Average Annual Total Return through September 30, 2023*, as compared to its benchmark:
| | 1 Year Return | 5 Year Return | 10 Year Return | Since Inception (a) |
| Empiric Fund Class C | 14.57% | 2.92% | 6.73% | 5.21% |
| MSCI USA Small Cap Index(b) | 11.81% | 4.36% | 7.83% | N/A |
| * | The performance data quoted here represents past performance. Current performance may be lower or higher than the performance data quoted above. Investment return and principal value will fluctuate, so that shares, when redeemed, may be worth more or less than their original cost. The returns shown do not reflect the deduction of taxes that a shareholder would pay on Fund distributions or on the redemptions of Fund shares. Past performance is no guarantee of future results. For performance information current to the most recent month-end, please call toll-free 1-888-839-7424. The Fund’s expense ratio, as of the February 1, 2023 prospectus, is 2.87% for Class C shares. For more current information on the Fund’s expense ratio, please see the Financial Highlights. |
| (a) | Class C commenced operations on October 7, 2005. |
| (b) | The MSCI USA Small Cap Index is designed to measure the performance of the small cap segment of the U.S equity market. This index is not available back to the inception of Class C shares. Investors cannot invest directly in an index. |
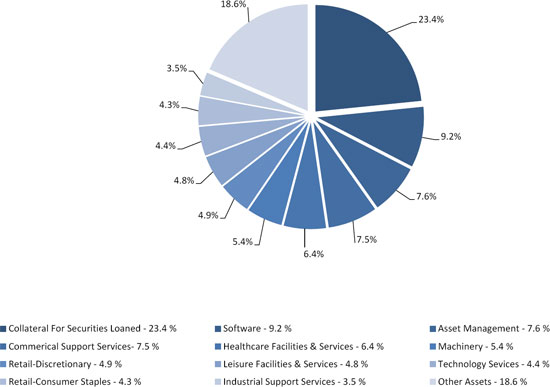
Empiric Fund Portfolio Weightings (Unaudited)
September 30, 2023
___________________________________________________________________________________________
The percentages in the above chart are based on the portfolio holdings as a percentage of net assets of the Fund as of September 30, 2023 and are subject to change.
| EMPIRIC FUND |
| SCHEDULE OF INVESTMENTS |
| September 30, 2023 |
| Shares | | | | | Fair Value | |
| | | | | COMMON STOCKS — 88.3% | | | | |
| | | | | ADVERTISING & MARKETING - 2.4% | | | | |
| | 19,563 | | | Interpublic Group of Companies, Inc. (The)(a) | | $ | 560,676 | |
| | | | | | | | | |
| | | | | ASSET MANAGEMENT - 7.6% | | | | |
| | 7,700 | | | Ares Management Corporation, Class A | | | 792,099 | |
| | 4,250 | | | LPL Financial Holdings, Inc. | | | 1,010,013 | |
| | | | | | | | 1,802,112 | |
| | | | | BEVERAGES - 3.5% | | | | |
| | 1,307 | | | Coca-Cola Consolidated, Inc. | | | 831,670 | |
| | | | | | | | | |
| | | | | BIOTECH & PHARMA - 1.9% | | | | |
| | 8,166 | | | Halozyme Therapeutics, Inc.(b) | | | 311,941 | |
| | 1,191 | | | Horizon Therapeutics plc(b) | | | 137,787 | |
| | | | | | | | 449,728 | |
| | | | | CHEMICALS - 1.5% | | | | |
| | 1,988 | | | Avery Dennison Corporation | | | 363,148 | |
| | | | | | | | | |
| | | | | COMMERCIAL SUPPORT SERVICES - 7.5% | | | | |
| | 3,545 | | | AMN Healthcare Services, Inc.(a),(b) | | | 301,963 | |
| | 4,205 | | | Brink’s Company (The) | | | 305,451 | |
| | 9,910 | | | Robert Half International, Inc. | | | 726,205 | |
| | 3,836 | | | TriNet Group, Inc.(a),(b) | | | 446,817 | |
| | | | | | | | 1,780,436 | |
| | | | | CONTAINERS & PACKAGING - 1.6% | | | | |
| | 4,288 | | | Crown Holdings, Inc. | | | 379,402 | |
| | | | | | | | | |
| | | | | ELECTRICAL EQUIPMENT - 3.4% | | | | |
| | 2,529 | | | A O Smith Corporation | | | 167,243 | |
| | 2,433 | | | Chase Corporation | | | 309,551 | |
| | 1,677 | | | Generac Holdings, Inc.(a),(b) | | | 182,726 | |
| | 437 | | | Hubbell, Inc.(a) | | | 136,960 | |
| | | | | | | | 796,480 | |
| | | | | ENGINEERING & CONSTRUCTION - 2.7% | | | | |
| | 3,412 | | | Quanta Services, Inc. | | | 638,283 | |
| | | | | | | | | |
See accompanying notes to financial statements.
| EMPIRIC FUND |
| SCHEDULE OF INVESTMENTS (Continued) |
| September 30, 2023 |
| Shares | | | | | Fair Value | |
| | | | | COMMON STOCKS — 88.3% (Continued) | | | | |
| | | | | HEALTH CARE FACILITIES & SERVICES - 6.4% | | | | |
| | 435 | | | Chemed Corporation | | $ | 226,070 | |
| | 5,044 | | | Henry Schein, Inc.(b) | | | 374,517 | |
| | 1,511 | | | Medpace Holdings, Inc.(b) | | | 365,858 | |
| | 1,705 | | | Molina Healthcare, Inc.(b) | | | 559,052 | |
| | | | | | | | 1,525,497 | |
| | | | | INDUSTRIAL SUPPORT SERVICES - 3.5% | | | | |
| | 1,880 | | | United Rentals, Inc. | | | 835,792 | |
| | | | | | | | | |
| | | | | INSURANCE - 1.5% | | | | |
| | 2,394 | | | Assurant, Inc. | | | 343,731 | |
| | | | | | | | | |
| | | | | LEISURE FACILITIES & SERVICES - 4.8% | | | | |
| | 6,036 | | | Dine Brands Global, Inc.(a) | | | 298,480 | |
| | 860 | | | Domino’s Pizza, Inc. | | | 325,759 | |
| | 3,100 | | | Jack in the Box, Inc. | | | 214,086 | |
| | 1,394 | | | Vail Resorts, Inc. | | | 309,315 | |
| | | | | | | | 1,147,640 | |
| | | | | MACHINERY - 5.4% | | | | |
| | 5,500 | | | Donaldson Company, Inc. | | | 328,020 | |
| | 3,496 | | | Lincoln Electric Holdings, Inc.(a) | | | 635,538 | |
| | 3,872 | | | Toro Company (The)(a) | | | 321,763 | |
| | | | | | | | 1,285,321 | |
| | | | | MEDICAL EQUIPMENT & DEVICES - 3.5% | | | | |
| | 8,068 | | | Bruker Corporation | | | 502,636 | |
| | 6,429 | | | Globus Medical, Inc., Class A(b) | | | 319,200 | |
| | | | | | | | 821,836 | |
| | | | | OIL & GAS PRODUCERS - 2.5% | | | | |
| | 3,700 | | | Denbury, Inc.(a),(b) | | | 362,637 | |
| | 640 | | | Murphy USA, Inc.(a) | | | 218,707 | |
| | | | | | | | 581,344 | |
| | | | | PUBLISHING & BROADCASTING - 0.3% | | | | |
| | 500 | | | Nexstar Media Group, Inc.(a) | | | 71,685 | |
| | | | | | | | | |
See accompanying notes to financial statements.
| EMPIRIC FUND |
| SCHEDULE OF INVESTMENTS (Continued) |
| September 30, 2023 |
| Shares | | | | | Fair Value | |
| | | | | COMMON STOCKS — 88.3% (Continued) | | | | |
| | | | | RETAIL - CONSUMER STAPLES - 4.3% | | | | |
| | 6,800 | | | BJ’s Wholesale Club Holdings, Inc.(b) | | $ | 485,316 | |
| | 1,935 | | | Casey’s General Stores, Inc.(a) | | | 525,391 | |
| | | | | | | | 1,010,707 | |
| | | | | RETAIL - DISCRETIONARY - 4.9% | | | | |
| | 140 | | | AutoZone, Inc.(a),(b) | | | 355,599 | |
| | 400 | | | O’Reilly Automotive, Inc.(b) | | | 363,544 | |
| | 670 | | | Ulta Beauty, Inc.(b) | | | 267,632 | |
| | 1,125 | | | Williams-Sonoma, Inc.(a) | | | 174,825 | |
| | | | | | | | 1,161,600 | |
| | | | | SEMICONDUCTORS - 1.7% | | | | |
| | 4,064 | | | Teradyne, Inc.(a) | | | 408,269 | |
| | | | | | | | | |
| | | | | SOFTWARE - 9.2% | | | | |
| | 13,376 | | | Agilysys, Inc.(b) | | | 884,956 | |
| | 16,206 | | | Calix, Inc.(b) | | | 742,883 | |
| | 8,148 | | | CommVault Systems, Inc.(b) | | | 550,886 | |
| | | | | | | | 2,178,725 | |
| | | | | TECHNOLOGY HARDWARE - 2.1% | | | | |
| | 20,311 | | | Extreme Networks, Inc.(b) | | | 491,729 | |
| | | | | | | | | |
| | | | | TECHNOLOGY SERVICES - 4.4% | | | | |
| | 762 | | | Fair Isaac Corporation(a),(b) | | | 661,820 | |
| | 800 | | | Mastercard, Inc., Class A | | | 316,728 | |
| | 2,807 | | | TTEC Holdings, Inc. | | | 73,600 | |
| | | | | | | | 1,052,148 | |
| | | | | TRANSPORTATION & LOGISTICS - 1.7% | | | | |
| | 225 | | | GXO Logistics, Inc.(b) | | | 13,196 | |
| | 2,160 | | | Landstar System, Inc. | | | 382,190 | |
| | 225 | | | XPO Logistics, Inc.(a),(b) | | | 16,799 | |
| | | | | | | | 412,185 | |
| | | | | | | | | |
| | | | | TOTAL COMMON STOCKS (Cost $11,531,842) | | | 20,930,144 | |
See accompanying notes to financial statements.
| EMPIRIC FUND |
| SCHEDULE OF INVESTMENTS (Continued) |
| September 30, 2023 |
| Shares | | | | | Fair Value | |
| | | | | SHORT-TERM INVESTMENTS — 23.4% | | | | |
| | | | | COLLATERAL FOR SECURITIES LOANED - 23.4% | | | | |
| | 5,556,826 | | | Mount Vernon Liquid Assets Portfolio, LLC, 5.50% (Cost $5,556,826)(c),(d) | | $ | 5,556,826 | |
| | | | | | | | | |
| | | | | TOTAL INVESTMENTS - 111.7% (Cost $17,088,668) | | $ | 26,486,970 | |
| | | | | LIABILITIES IN EXCESS OF OTHER ASSETS - (11.7)% | | | (2,781,972 | ) |
| | | | | NET ASSETS - 100.0% | | $ | 23,704,998 | |
| | | | | | | | | |
| LLC | - Limited Liability Company |
| PLC | - Public Limited Company |
| (a) | All or a portion of the security is on loan. The total fair value of the securities on loan as of September 30, 2023 was $5,390,475. |
| (b) | Non-income producing security. |
| (c) | Rate disclosed is the seven day effective yield as of September 30, 2023. |
| (d) | Security was purchased with cash received as collateral for securities on loan at September 30, 2023. Total Collateral had a value of $5,556,826 at September 30, 2023. |
See accompanying notes to financial statements.
| Empiric Fund |
| STATEMENT OF ASSETS AND LIABILITIES |
| September 30, 2023 |
| ASSETS | | | | |
| Investment securities: (a) | | | | |
| At cost | | $ | 17,088,668 | |
| At fair value | | $ | 26,486,970 | |
| Cash and cash equivalents | | | 2,820,014 | |
| Dividends and interest receivable | | | 15,310 | |
| Prepaid expenses and other assets | | | 2,481 | |
| TOTAL ASSETS | | | 29,324,775 | |
| | | | | |
| LIABILITIES | | | | |
| Payable for collateral from securities loaned | | | 5,556,826 | |
| Payable for Fund shares repurchased | | | 50 | |
| Investment advisory fees payable | | | 22,550 | |
| Distribution (12b-1) fees payable | | | 4,273 | |
| Payable to related parties | | | 15,882 | |
| Accrued expenses and other liabilities | | | 20,196 | |
| TOTAL LIABILITIES | | | 5,619,777 | |
| NET ASSETS | | $ | 23,704,998 | |
| | | | | |
| Composition of Net Assets: | | | | |
| Paid in capital | | $ | 14,520,673 | |
| Accumulated earnings | | | 9,184,325 | |
| NET ASSETS | | $ | 23,704,998 | |
| | | | | |
| Net Asset Value Per Share: | | | | |
| Class A Shares: | | | | |
| Net Assets | | $ | 22,559,604 | |
| Shares of beneficial interest outstanding (b) | | | 428,968 | |
| Net asset value (Net Assets ÷ Shares Outstanding) and redemption price per share (c) | | $ | 52.59 | |
| Maximum offering price per share (net asset value plus maximum sales charge of 5.75%) | | $ | 55.80 | |
| | | | | |
| Class C Shares: | | | | |
| Net Assets | | $ | 1,145,394 | |
| Shares of beneficial interest outstanding (b) | | | 25,328 | |
| Net asset value (Net Assets ÷ Shares Outstanding), offering price and redemption price per share | | $ | 45.22 | |
| (a) | Includes $5,390,475 of securities out on loan. |
| (b) | Unlimited number of shares of beneficial interest authorized, no par value. |
| (c) | Investments in Class A shares made at or above the $1 million breakpoint are not subject to an initial sales charge and may be subject to a 1.00% contingent deferred sales charge (“CDSC”) on shares redeemed within 12 months after the date of purchase (excluding shares purchased with reinvested dividends and/or distributions). |
See accompanying notes to financial statements.
| Empiric Fund |
| STATEMENT OF OPERATIONS |
| For the Year Ended September 30, 2023 |
| INVESTMENT INCOME | | | | |
| Dividends (net of foreign withholding taxes of $42) | | $ | 242,563 | |
| Interest | | | 21,801 | |
| Securities lending income - net | | | 11,612 | |
| TOTALINVESTMENT INCOME | | | 275,976 | |
| | | | | |
| EXPENSES | | | | |
| Investment management fees | | | 244,752 | |
| Distribution (12b-1) fees: | | | | |
| Class A | | | 58,144 | |
| Class C | | | 12,174 | |
| Financial administration/fund accounting fees | | | 85,425 | |
| Legal administration/management services fees | | | 24,475 | |
| Compliance officer fees | | | 21,755 | |
| Legal fees | | | 20,469 | |
| Registration fees | | | 18,250 | |
| Trustees fees and expenses | | | 15,003 | |
| Audit Fees | | | 13,621 | |
| Printing and postage expenses | | | 12,807 | |
| Shareholder service fees | | | 10,837 | |
| Custodian fees | | | 1,581 | |
| Insurance expense | | | 821 | |
| Other expenses | | | 1,009 | |
| TOTAL EXPENSES | | | 541,123 | |
| | | | | |
| NET INVESTMENT LOSS | | | (265,147 | ) |
| | | | | |
| REALIZED AND UNREALIZED GAIN FROM INVESTMENTS | | | | |
| Net realized gain from investments | | | 481,214 | |
| Net realized gain from redemptions in kind | | | 235,155 | |
| Net change in unrealized appreciation on investments | | | 2,936,425 | |
| | | | | |
| NET REALIZED AND UNREALIZED GAIN FROM INVESTMENTS | | | 3,652,794 | |
| | | | | |
| NET INCREASE IN NET ASSETS RESULTING FROM OPERATIONS | | $ | 3,387,647 | |
See accompanying notes to financial statements.
| Empiric Fund |
| STATEMENTS OF CHANGES IN NET ASSETS |
| | | For the | | | For the | |
| | | Year Ended | | | Year Ended | |
| | | September 30, 2023 | | | September 30, 2022 | |
| FROM OPERATIONS | | | | | | | | |
| Net investment loss | | $ | (265,147 | ) | | $ | (364,186 | ) |
| Net realized gain (loss) from investments | | | 481,214 | | | | (511,730 | ) |
| Net realized gain from redemptions in kind | | | 235,155 | | | | — | |
| Net change in unrealized appreciation (depreciation) on investments | | | 2,936,425 | | | | (6,128,205 | ) |
| Net increase (decrease) in net assets resulting from operations | | | 3,387,647 | | | | (7,004,121 | ) |
| | | | | | | | | |
| DISTRIBUTIONS TO SHAREHOLDERS | | | | | | | | |
| From distributable earnings: | | | | | | | | |
| Class A | | | — | | | | (147,358 | ) |
| Class C | | | — | | | | (9,226 | ) |
| Net decrease in net assets from distributions to shareholders | | | — | | | | (156,584 | ) |
| | | | | | | | | |
| FROM SHARES OF BENEFICIAL INTEREST | | | | | | | | |
| Proceeds from shares sold: | | | | | | | | |
| Class A | | | 588,857 | | | | 61,129 | |
| Class C | | | — | | | | 500 | |
| Net asset value of shares issued in reinvestment of distributions: | | | | | | | | |
| Class A | | | — | | | | 135,674 | |
| Class C | | | — | | | | 8,689 | |
| Payments for shares redeemed: | | | | | | | | |
| Class A | | | (2,245,938 | ) | | | (1,145,289 | ) |
| Class C | | | (134,012 | ) | | | (65,413 | ) |
| Net decrease in net assets from shares of beneficial interest | | | (1,791,093 | ) | | | (1,004,710 | ) |
| | | | | | | | | |
| TOTAL INCREASE (DECREASE) IN NET ASSETS | | | 1,596,554 | | | | (8,165,415 | ) |
| | | | | | | | | |
| NET ASSETS | | | | | | | | |
| Beginning of Year | | | 22,108,444 | | | | 30,273,859 | |
| End of Year | | $ | 23,704,998 | | | $ | 22,108,444 | |
| | | | | | | | | |
| SHARE ACTIVITY | | | | | | | | |
| Class A: | | | | | | | | |
| Shares Sold | | | 11,174 | | | | 1,116 | |
| Shares Reinvested | | | — | | | | 2,323 | |
| Shares Redeemed | | | (43,002 | ) | | | (20,868 | ) |
| Net decrease in shares of beneficial interest outstanding | | | (31,828 | ) | | | (17,429 | ) |
| | | | | | | | | |
| Class C: | | | | | | | | |
| Shares Sold | | | — | | | | 10 | |
| Shares Reinvested | | | — | | | | 171 | |
| Shares Redeemed | | | (2,960 | ) | | | (1,385 | ) |
| Net decrease in shares of beneficial interest outstanding | | | (2,960 | ) | | | (1,204 | ) |
See accompanying notes to financial statements.
| Empiric Fund |
| FINANCIAL HIGHLIGHTS |
Per Share Data and Ratios for a Share of Beneficial Interest Outstanding Throughout each of the Years Presented
| | | Class A | |
| | | Year | | | Year | | | Year | | | Year | | | Year | |
| | | Ended | | | Ended | | | Ended | | | Ended | | | Ended | |
| | | September 30, | | | September 30, | | | September 30, | | | September 30, | | | September 30, | |
| | | 2023 | | | 2022 | | | 2021 | | | 2020 | | | 2019 | |
| Net asset value, beginning of year | | $ | 45.56 | | | $ | 60.07 | | | $ | 45.46 | | | $ | 40.47 | | | $ | 47.39 | |
| Activity from investment operations: | | | | | | | | | | | | | | | | | | | | |
| Net investment loss (1) | | | (0.55 | ) | | | (0.71 | ) | | | (0.68 | ) | | | (0.56 | ) | | | (0.45 | ) |
| Net realized and unrealized gain (loss) on investments | | | 7.58 | | | | (13.49 | ) | | | 19.24 | | | | 5.55 | | | | (6.47 | ) |
| Total from investment operations | | | 7.03 | | | | (14.20 | ) | | | 18.56 | | | | 4.99 | | | | (6.92 | ) |
| | | | | | | | | | | | | | | | | | | | | |
| Less distributions from: | | | | | | | | | | | | | | | | | | | | |
| Net realized gains | | | — | | | | (0.31 | ) | | | (3.95 | ) | | | — | | | | — | |
| Total distributions | | | — | | | | (0.31 | ) | | | (3.95 | ) | | | — | | | | — | |
| | | | | | | | | | | | | | | | | | | | | |
| Net asset value, end of year | | $ | 52.59 | | | $ | 45.56 | | | $ | 60.07 | | | $ | 45.46 | | | $ | 40.47 | |
| Total return (2) | | | 15.43 | % | | | (23.72 | )% | | | 42.05 | % | | | 12.33 | % | | | (14.62 | )% |
| Net assets, at end of year (000s) | | $ | 22,560 | | | $ | 20,992 | | | $ | 28,726 | | | $ | 22,865 | | | $ | 22,346 | |
| | | | | | | | | | | | | | | | | | | | | |
| Ratio of net expenses to average net assets after waiver (3) | | | 2.17 | % | | | 2.12 | % | | | 1.96 | % | | | 2.13 | % | | | 2.02 | % |
| Ratio of net investment loss to average net assets (3)(4) | | | (1.05 | )% | | | (1.32 | )% | | | (1.17 | )% | | | (1.35 | )% | | | (1.08 | )% |
| Portfolio Turnover Rate (5) | | | 8 | % | | | 5 | % | | | 21 | % | | | 119 | % | | | 50 | % |
| | | | | | | | | | | | | | | | | | | | | |
| (1) | Per share amounts calculated using the average shares method. |
| (2) | Total return in the above table is historical in nature and represents the rate that the investor would have earned or lost on an investment in the Fund assuming reinvestment of dividends and capital gains distributions, if any, and does not reflect the impact of sales charges. Had the adviser not waived a portion of the Fund’s expenses, total returns would have been lower. |
| (3) | The ratios of expenses to average net assets and net investment loss to average net assets do not reflect the expenses of the underlying investment companies in which the Fund invests. |
| (4) | Recognition of net investment income (loss) is affected by the timing and declaration of dividends by the underlying investment companies in which the Fund invests. |
| (5) | In-kind transactions are not included in calculation of turnover. |
See accompanying notes to financial statements.
| Empiric Fund |
| FINANCIAL HIGHLIGHTS |
Per Share Data and Ratios for a Share of Beneficial Interest Outstanding Throughout each of the Years Presented
| | | Class C | |
| | | Year Ended | | | Year Ended | | | Year | | | Year | | | Year | |
| | | Ended | | | Ended | | | Ended | | | Ended | | | Ended | |
| | | September 30, | | | September 30, | | | September 30, | | | September 30, | | | September 30, | |
| | | 2023 | | | 2022 | | | 2021 | | | 2020 | | | 2019 | |
| Net asset value, beginning of year | | $ | 39.47 | | | $ | 52.48 | | | $ | 40.40 | | | $ | 36.24 | | | $ | 42.75 | |
| Activity from investment operations: | | | | | | | | | | | | | | | | | | | | |
| Net investment loss (1) | | | (0.81 | ) | | | (0.98 | ) | | | (0.98 | ) | | | (0.78 | ) | | | (0.69 | ) |
| Net realized and unrealized gain (loss) on investments | | | 6.56 | | | | (11.72 | ) | | | 17.01 | | | | 4.94 | | | | (5.82 | ) |
| Total from investment operations | | | 5.75 | | | | (12.70 | ) | | | 16.03 | | | | 4.16 | | | | (6.51 | ) |
| | | | | | | | | | | | | | | | | | | | | |
| Less distributions from: | | | | | | | | | | | | | | | | | | | | |
| Net realized gains | | | — | | | | (0.31 | ) | | | (3.95 | ) | | | — | | | | — | |
| Total distributions | | | — | | | | (0.31 | ) | | | (3.95 | ) | | | — | | | | — | |
| | | | | | | | | | | | | | | | | | | | | |
| Net asset value, end of year | | $ | 45.22 | | | $ | 39.47 | | | $ | 52.48 | | | $ | 40.40 | | | $ | 36.24 | |
| Total return (2) | | | 14.57 | % | | | (24.30 | )% | | | 40.99 | % | | | 11.48 | % | | | (15.25 | )% |
| Net assets, at end of year (000s) | | $ | 1,145 | | | $ | 1,117 | | | $ | 1,548 | | | $ | 1,166 | | | $ | 1,175 | |
| | | | | | | | | | | | | | | | | | | | | |
| Ratio of net expenses to average net assets after waiver (3) | | | 2.92 | % | | | 2.87 | % | | | 2.71 | % | | | 2.88 | % | | | 2.77 | % |
| Ratio of net investment loss to average net assets (3)(4) | | | (1.79 | )% | | | (2.07 | )% | | | (1.92 | )% | | | (2.10 | )% | | | (1.83 | )% |
| Portfolio Turnover Rate (5) | | | 8 | % | | | 5 | % | | | 21 | % | | | 119 | % | | | 50 | % |
| | | | | | | | | | | | | | | | | | | | | |
| (1) | Per share amounts calculated using the average shares method. |
| (2) | Total return in the above table is historical in nature and represents the rate that the investor would have earned or lost on an investment in the Fund assuming reinvestment of dividends and capital gains distributions, if any. Had the adviser not waived a portion of the Fund’s expenses, total returns would have been lower. |
| (3) | The ratios of expenses to average net assets and net investment loss to average net assets do not reflect the expenses of the underlying investment companies in which the Fund invests. |
| (4) | Recognition of net investment loss is affected by the timing and declaration of dividends by the underlying investment companies in which the Fund invests. |
| (5) | In-kind transactions are not included in calculation of turnover. |
See accompanying notes to financial statements.
| Empiric Fund |
| NOTES TO FINANCIAL STATEMENTS |
| September 30, 2023 |
| (1) | ORGANIZATION AND SIGNIFICANT ACCOUNTING POLICIES |
Mutual Fund Series Trust (the “Trust”), was organized as an Ohio business trust on February 27, 2006. The Trust is registered as an open-end management investment company under the Investment Company Act of 1940, as amended, (“1940 Act”). These financial statements include the following series: Empiric Fund (the “Fund”) . The Trust currently consists of thirty-six series. The Fund is a separate diversified series of the Trust. Empiric Advisors, Inc. (the “Adviser”), acts as the investment advisor to the Fund.
The Fund offers two classes of shares: Class A and Class C shares. Each share class represents an interest in the same assets of the Fund, has the same rights and is identical in all material respects except that (i) each class of shares may bear different distribution fees; (ii) each class of shares may be subject to different (or no) sales charges; (iii) certain other class specific expenses will be borne solely by the class to which such expenses are attributable; and (iv) each class has exclusive voting rights with respect to matters relating to its own distribution arrangements. The Fund’s Class A shares commenced operations on November 6, 1995. The Fund’s Class C shares commenced operations on October 7, 2005. Prior to October 7, 2005, the shares of the Fund had no specific class designation. As of that date, all of the then outstanding shares were redesignated as Class A shares. The Fund’s investment objective is to achieve capital appreciation.
The following is a summary of significant accounting policies consistently followed by the Fund which are in accordance with accounting principles generally accepted in the United States of America (“GAAP”). The Fund is an investment company and accordingly follows the Investment Company accounting and reporting guidance of the Financial Accounting Standards Board (“FASB”) Accounting Standards Codification Topic 946, Financial Services - Investment Companies, including FASB Accounting Standards Update (“ASU”) 2013-08.
a) Securities Valuation – Securities listed on an exchange are valued at the last reported sale price at the close of the regular trading session of the exchange on the business day the value is being determined, or in the case of securities listed on NASDAQ, at the NASDAQ Official Closing Price (“NOCP”). In the absence of a sale, such securities shall be valued at the last bid price on the day of valuation. The Fund may invest in portfolios of open-end or closed-end investment companies and exchange traded funds (the “underlying funds”). Open-end funds are valued at their respective net asset values as reported by such investment companies. The underlying funds value securities in their portfolios for which market quotations are readily available at their market values (generally the last reported sale price) and all other securities and assets at their fair value by the methods established by the boards of the underlying funds. The shares of many closed-end investment companies and exchange traded funds, after their initial public offering, frequently trade at a price per share, which is different than the net asset value per share. The difference represents a market premium or market discount of such shares. There can be no assurances that the market discount or market premium on shares of any closed-end investment company or exchange traded fund purchased by the Fund will not change. Short-term debt obligations having 60 days or less remaining until maturity, at time of purchase, may be valued at amortized cost, provided such valuations represent fair value.
In unusual circumstances, instead of valuing securities in the usual manner, the Fund may value securities at “fair value” as determined in good faith by the Board of Trustees (the “Board”), pursuant to the procedures (the “Procedures”) approved by the Board. The Board has designated the adviser as its valuation designee (the “Valuation Designee”) to execute these Procedures. The Procedures consider, among others, the following factors to determine a security’s fair value: the nature and pricing history (if any) of the security; whether any dealer quotations for the security are available; and possible valuation methodologies that could be used to determine the fair value of the security. Fair value may also be used by the Board if extraordinary events occur after the close of the relevant world market but prior to the New York Stock Exchange close. The Board may also enlist third party consultants such a valuation specialist at a public accounting firm, valuation consultant or financial officer of a security issuer on an as-needed basis to assist the Valuation Designee in determining a security-specific fair value. The Board is responsible for reviewing and approving fair value methodologies utilized by the Valuation Designee, approval of which shall be based upon whether the Valuation Designee followed the Procedures.
| Empiric Fund |
| NOTES TO FINANCIAL STATEMENTS (Continued) |
| September 30, 2023 |
The Fund utilizes various methods to measure the fair value of most of its investments on a recurring basis. GAAP establishes a hierarchy that prioritizes inputs to valuation methods. The three levels of input are:
Level 1 – Unadjusted quoted prices in active markets for identical assets and liabilities that the Fund has the ability to access.
Level 2 – Observable inputs other than quoted prices included in Level 1 that are observable for the asset or liability, either directly or indirectly. These inputs may include quoted prices for the identical instrument in an inactive market, prices for similar instruments, interest rates, prepayment speeds, credit risk, yield curves, default rates and similar data.
Level 3 – Unobservable inputs for the asset or liability, to the extent relevant observable inputs are not available, representing the Fund’s own assumptions about the assumptions a market participant would use in valuing the asset or liability, and would be based on the best information available.
The availability of observable inputs can vary from security to security and is affected by a wide variety of factors, including, for example, the type of security, whether the security is new and not yet established in the marketplace, the liquidity of markets, and other characteristics particular to the security. To the extent that valuation is based on models or inputs that are less observable or unobservable in the market, the determination of fair value requires more judgment. Accordingly, the degree of judgment exercised in determining fair value is greatest for instruments categorized in Level 3.
The inputs used to measure fair value may fall into different levels of the fair value hierarchy. In such cases, for disclosure purposes, the level in the fair value hierarchy within which the fair value measurement falls in its entirety, is determined based on the lowest level input that is significant to the fair value measurement in its entirety.
The inputs or methodology used for valuing securities are not necessarily an indication of the risk associated with investing in those securities. The following table summarizes the inputs used as of September 30, 2023, for the Fund’s assets and liabilities measured at fair value:
| Assets | | | | | | | | | | | | |
| | | | | | | | | | | | | |
| Security Classifications (a) | | Level 1 | | | Level 2 | | | Level 3 | | | Totals | |
| Common Stocks | | $ | 20,930,144 | | | $ | — | | | $ | — | | | $ | 20,930,144 | |
| Collateral for Securities Loaned (b) | | | — | | | | — | | | | — | | | | 5,556,826 | |
| Total | | $ | 20,930,144 | | | $ | — | | | $ | — | | | $ | 26,486,970 | |
| (a) | As of and during the year ended September 30, 2023 the Fund held no securities that were considered to be “Level 3” securities. Therefore, a reconciliation of assets in which significant unobservable inputs (Level 3) were used in determining fair value is not applicable. |
| (b) | The Trust’s officers have elected to adopt ASU 2015-07, Disclosures for Investments in Certain Entities That Calculate Net Asset Value per Share (or Its Equivalent) — a consensus of the Emerging Issues Task Force issued, on May 1, 2015. In accordance with Subtopic 820-10, certain investments that are measured at fair value using the net asset value per share (or its equivalent) have not been classified in the fair value hierarchy. The fair value amount presented in this table is intended to permit reconciliation of the fair value hierarchy to the amounts presented in the Statement of Assets and Liabilities. |
b) Federal Income Tax – As of and during the year ended September 30, 2023, the Fund did not have a liability for any unrecognized tax expense. The Fund recognizes interest and penalties, if any, related to unrecognized tax expense as income tax expense in the Statement of Operations. As of September 30, 2023 the Fund did not incur any interest or penalties. Management has analyzed the Fund’s tax positions and has concluded that no liability for unrecognized tax benefits should be recorded related to uncertain tax positions taken on returns filed for open tax years September 30, 2020 - September 30, 2022 or expected to be taken in the Fund’s September 30, 2023 tax returns. The tax filings are open for examination by applicable taxing authorities, U.S. federal, Ohio and foreign jurisdictions. No examination of the Fund’s tax returns is presently in progress.
c) Distribution to Shareholders – Distributions of net investment income and capital gains to shareholders, which are determined in accordance with income tax regulations and may differ from GAAP, are recorded on the ex-dividend date and are distributed on an annual basis.
d) Multiple Class Allocations – Income, non-class specific expenses and realized or unrealized gains or losses are allocated to each class based on relative net assets. Distribution fees are charged to each respective share class in accordance with the distribution plan. Expenses of the Trust that are directly identifiable to a specific fund are charged to that fund. Expenses, which are not readily identifiable to a specific fund, are allocated in such a manner as deemed equitable, taking into consideration the nature and type of expense and the relative sizes of the funds in the Trust.
| Empiric Fund |
| NOTES TO FINANCIAL STATEMENTS (Continued) |
| September 30, 2023 |
e) Other – Investment and shareholder transactions are recorded on the trade date. Interest income is recognized on an accrual basis. Discounts are accreted and premiums are amortized on debt securities using the effective interest method. Withholding taxes on foreign dividends have been provided for in accordance with the Fund’s understanding of the applicable country’s tax rules and rates. Dividend income is recorded on the ex-dividend date. Realized gains or losses from sales of securities are determined by comparing the identified cost of the security lot sold with the net sales proceeds.
f) Use of Estimates – The preparation of financial statements in conformity with GAAP requires management to make estimates and assumptions that affect the reported amounts of assets and liabilities and disclosure of contingent assets and liabilities at the date of the financial statements and the reported amounts of increases and decreases in net assets from operations during the reporting period. Actual results could differ from those estimates.
g) Indemnification – The Trust indemnifies its officers and trustees for certain liabilities that may arise from the performance of their duties to the Trust. Additionally, in the normal course of business, the Fund enters into contracts that contain a variety of representations and warranties and which provide general indemnities. The Fund’s maximum exposure under these arrangements is unknown, as this would involve future claims that may be made against the Fund that have not yet occurred. However, based on experience, the risk of loss due to these warranties and indemnities appears to be remote.
h) Sales charges (loads) – A maximum sales charge of 5.75% is imposed on Class A shares of the Fund. Investments in Class A shares made at or above the $1 million breakpoint are not subject to an initial sales charge and may be subject to a 1.00% contingent deferred sales charge (“CDSC”) on shares redeemed within 12 months of purchase (excluding shares purchased with reinvested dividends and/or distributions). The respective shareholders pay such CDSC charges, which are not an expense of the Fund. For the year ended September 30, 2023 there were no CDSC fees paid.
i) Foreign Currency – Investment securities and other assets and liabilities denominated in foreign currencies are translated into U.S. dollar amounts at the date of valuation. Purchases and sales of investment securities and income and expense items denominated in foreign currencies are translated into U.S. dollar amounts on the respective dates as such transactions.
The Fund does not isolate that portion of the results of operations resulting from changes in foreign exchange rates on investments from the fluctuations arising from changes in market prices of securities held. Such fluctuations are included with the net realized and unrealized gain or loss from investments.
Reported net realized foreign exchange gains or losses arise from sales of foreign currencies, currency gains or losses realized between the trade and settlement dates on securities transactions, and the difference between the amounts of dividends, interest, and foreign withholding taxes recorded on the Fund’s books and the U.S. dollar equivalent of the amounts actually received or paid. Net unrealized foreign exchange gains and losses arise from changes in the fair values of assets and liabilities, other than investments in securities at fiscal period-end, resulting from changes in exchange rates.
j) Security Loans – The Fund has entered into a securities lending agreement with U.S. Bank National Association. The Fund receives compensation in the form of fees, or retains a portion of interest on the investment of any cash received as collateral. The cash collateral is invested in short-term investments. The Fund also continues to receive interest or dividends on the securities loaned. The loans are secured by collateral at least equal, at all times, to 102% of the market value of loaned securities. Gain or loss in the fair value of the securities loaned that may occur during the term of the loan will be for the account of the Fund. The Fund has the right under the lending agreement to recover the securities from the borrower on demand. If the market value of the collateral falls below 102% of market value plus accrued interest of the loaned securities, the lender’s agent shall request additional collateral from the borrowers to bring the collateralization back to 102%. Under the terms of the securities lending agreement, the Fund is indemnified for such losses by the security lending agent. Should the borrower of the securities fail financially, the Fund has the right to repurchase the securities using the collateral in the open market. Although risk is mitigated by the collateral, the Fund could experience a delay in recovering their securities and possible loss of income or value if the borrower fails to return them.
| Empiric Fund |
| NOTES TO FINANCIAL STATEMENTS (Continued) |
| September 30, 2023 |
The Fund receives cash as collateral in return for securities lent as part of the securities lending program. The collateral is invested in the Mount Vernon Liquid Assets Portfolio, LLC of which the investment objective is to seek to maximize current income to the extent with the preservation of capital and liquidity and maintain a stable NAV of $1.00 per unit. The Fund held $5,556,826 in the Mount Vernon Liquid Assets Portfolio, LLC as of September 30, 2023. The remaining contractual maturity of all securities lending transactions is overnight and continuous. The Fund is not subject to a master netting agreement with respect to securities lending; therefore no additional disclosures are required. The income earned by the Fund on investments of cash collateral received from borrowers for the securities loaned to them, if any was received, would be reflected in the Fund’s Statement of Operations.
The following table is a summary of the Fund’s securities loaned and related collateral which are subject to a netting agreement as of September 30, 2023:
| | | | | | | | | | | | | | | Gross Amounts Not Offset in the | |
| | | | | | | | | | | | | | | Statement of Assets & Liabilities | |
| | | | | | | | | Net Amounts of | | | | | | | | | | |
| | | | | | Gross Amounts | | | Assets | | | | | | | | | | |
| | | | | | Offset in the | | | Presented in the | | | | | | | | | | |
| | | Gross Amounts | | | Statement of | | | Statement of | | | Financial | | | Non-Cash | | | | |
| | | of Recognized | | | Assets & | | | Assets & | | | Instruments | | | Collateral | | | Net Amount of | |
| Assets: | | Assets | | | Liabilities | | | Liabilities | | | Pledged | | | Received * | | | Assets | |
| Empiric Fund | | | | | | | | | | | | | | | | | | | | | | | | |
| Description: | | | | | | | | | | | | | | | | | | | | | | | | |
| Securities Loaned | | $ | 5,390,475 | | | $ | — | | | $ | 5,390,475 | | | $ | — | | | $ | 5,390,475 | * | | $ | — | |
| Total | | $ | 5,390,475 | | | $ | — | | | $ | 5,390,475 | | | $ | — | | | $ | 5,390,475 | | | $ | — | |
| * | The amount is limited to the asset balance and accordingly does not include excess collateral pledged. |
The fair value of the securities loaned for the Fund totaled $5,390,475 at September 30, 2023. The securities loaned are noted in the Schedule of Investments. The fair value of the “Collateral for Securities Loaned” on the Schedule of Investments includes cash collateral received and reinvested that totaled $5,556,826 for the Fund at September 30, 2023. This amount is offset by a liability recorded as “Collateral on securities loaned.” The contractual maturity of securities lending transactions is on an overnight and continuous basis. The Fund cannot pledge or resell the collateral.
| (2) | INVESTMENT TRANSACTIONS |
For the year ended September 30, 2023, aggregate purchases and proceeds from sales of investment securities (excluding short-term investments) for the Fund were as follows:
| Purchases | | | Sales (a) | |
| $ | 1,908,401 | | | $ | 5,084,164 | * |
| (a) | The Fund may participate in a liquidity program operated by ReFlow Fund, LLC (“ReFlow”). The program is designed to provide an alternative liquidity source for mutual funds experiencing redemptions of their shares. In order to pay cash to shareholders who redeem their shares on a given day, a mutual fund typically must hold cash in its portfolio, liquidate portfolio securities, or borrow money, all of which impose certain costs on the Fund. ReFlow provides participating mutual funds with another source of cash by standing ready to purchase shares from a fund equal to the amount of the Fund’s net redemptions on a given day. ReFlow then generally redeems those shares when the Fund experiences net sales. In return for this service, the Fund will pay a fee to ReFlow at a rate determined by a daily auction with other participating mutual funds. The costs to the Fund for participating in ReFlow are expected to be influenced by and comparable to the cost of the other sources of liquidity, such as the Fund’s short-term lending arrangement or the costs of selling portfolio securities to meet redemptions. ReFlow will be prohibited from acquiring more than 3% of the outstanding voting shares of the Fund. The Fund will waive any redemption fee with respect to redemptions by ReFlow. When covering net sales for the Fund, ReFlow normally utilizes Redemptions In-Kind. During the year ended September 30, 2023, the Fund utilized ReFlow. ReFlow subscribed 6,901 shares of the Fund during the year. The resulting fee is recorded in other expenses on the Statement of Operations. |
| * | Proceeds from sales include $359,758 from redemptions in-kind sales. |
| Empiric Fund |
| NOTES TO FINANCIAL STATEMENTS (Continued) |
| September 30, 2023 |
| (3) | INVESTMENT MANAGEMENT AGREEMENT AND TRANSACTIONS WITH RELATED PARTIES |
The Trust, with respect to the Fund, has entered into an investment advisory agreement (the “Advisory Agreement”) with the Adviser, pursuant to which the Adviser receives a fee, computed daily, at an annual rate of 1.00% of the average daily net assets of the Fund. The Adviser pays expenses incurred by it in connection with acting as an investment adviser to the Fund other than costs (including taxes and brokerage commissions, borrowing costs, costs of investing in underlying funds and extraordinary expenses, if any) of securities purchased for the Fund and certain other expenses paid by the Fund (as detailed in the Advisory Agreement.) . The Adviser pays for all employees, office space and facilities required by it to provide services under the Advisory Agreement, with the exception of specific items of expense (as detailed in the Advisory Agreement). For the year ended September 30, 2023, management fees of $244,752 were incurred by the Fund.
Pursuant to the Management Services Agreement between the Trust and MFund Services LLC (“Mfund”), MFund provides the Fund with various management and legal administrative services (the “Management Services Agreement”). For these services, the Fund pays MFund as of the last day of each month an annualized asset-based fee which scales downward based upon net assets. In addition, the Fund reimburses MFund for any reasonable out-of-pocket expenses incurred in the performance of its duties under the Management Services Agreement. The amount due to MFund for the Management Services Agreement is listed in the Statement of Assets and Liabilities under “Payable to related parties” and the amount accrued for the year is shown in the Statement of Operations under “Legal administration/management services fee.”
Pursuant to the Compliance Services Agreement, MFund provides chief compliance officer services to the Fund. For these services, the Fund pays MFund as of the last day of each month annualized base fees plus an annualized asset-based fee based upon net assets. In addition, the Fund reimburses MFund for any reasonable out- of-pocket expenses incurred in the performance of its duties under the Compliance Services Agreement. The amount due to MFund for chief compliance officer services is listed in the Statement of Assets and Liabilities under “Compliance officer fees payable” and the amount accrued for the year is shown in the Statement of Operations under “Compliance officer fees.”
A trustee is the controlling member of MFund and of AlphaCentric Advisors LLC and Catalyst Capital Advisors LLC (investments managers to other series of the Trust) and is not paid any fees directly by the Trust for serving in such capacities. Trustees who are not “interested persons” as that term is defined in the 1940 Act, are paid a quarterly retainer and receive compensation for each special Board meeting and Risk and Compliance Committee meeting. The fees paid to the Independent Trustees for their attendance at a meeting will be shared equally by the funds of the Trust in which the meeting relates. The Lead Independent Trustee of the Trust and the Chairmen of the Trust’s Audit Committee and Risk and Compliance Committee receive an additional quarterly retainer. The “interested persons” of the Trust receive no compensation from the Fund. The Trust reimburses each Trustee and Officer for his or her travel and other expenses related to attendance at such meetings.
Northern Lights Distributors, LLC, (“Distributor”) serves as the principal underwriter and national distributor for the shares of the Fund pursuant to an Underwriting Agreement with the Trust. For the year ended September 30, 2023, NLD received $288 in underwriter commissions from the sale of Class A shares of the Fund, of which they kept $38.
Ultimus Fund Solutions, LLC (“UFS”), an affiliate of the distributor, provides administrative, fund accounting, and transfer agency services to the Fund pursuant to agreements with the Trust, for which it receives from each Fund: (i) basis points in decreasing amounts as assets reach certain breakpoints; and (ii) any related out-of-pocket expenses.
Blu Giant, LLC (“Blu Giant” ) – Blu Giant, an affiliate of the Distributor and UFS, provides EDGAR conversion and filing services as well as print management services for the Fund on an ad-hoc basis. For the provision of these services, Blu Giant receives customary fees from the Fund.
Certain Officers of the Trust are also employees of UFS, and are not paid any fees directly by the Fund for serving in such capacity.
The Trust has adopted a Distribution Plan pursuant to Rule 12b-1(the “Plan”), under the 1940 Act for Class A shares and Class C shares, that allows the Fund to pay distribution and shareholder servicing expenses of up to 0.25% per annum for the Class A shares and up to 1.00% for the Class C shares based on average daily net assets of each class. Class A shares are
| Empiric Fund |
| NOTES TO FINANCIAL STATEMENTS (Continued) |
| September 30, 2023 |
currently paying 0.25% per annum of 12b-1 fees. Class C shares are currently paying 1.00% per annum of 12b -1 fees. The fee may be used for a variety of purposes, including compensating dealers and other financial service organizations for eligible services provided by those parties to the Fund and its shareholders and to reimburse the Distributor and the Adviser for distribution related expenses.
| (4) | TAX COMPONENTS OF CAPITAL |
The Statement of Assets and Liabilities represents cost for financial reporting purposes. Aggregate cost for federal tax purposes is $17,057,289 for the Fund and differs from fair value by net unrealized appreciation (depreciation) of securities as follows:
| Unrealized appreciation: | | $ | 9,532,910 | |
| Unrealized depreciation: | | | (103,229 | ) |
| Net unrealized appreciation: | | $ | 9,429,681 | |
The tax character of fund distributions paid for the years ended September 30, 2023 and September 30, 2022 was as follows:
| | | Fiscal Year Ended | | | Fiscal Year Ended | |
| | | September 30, 2023 | | | September 30, 2022 | |
| Ordinary Income | | $ | — | | | $ | — | |
| Long-Term Capital Gain | | | — | | | | 156,544 | |
| Return of Capital | | | — | | | | 40 | |
| | | $ | — | | | $ | 156,584 | |
As of September 30, 2023, the components of accumulated earnings/(deficit) on a tax basis were as follows:
| Undistributed | | | Undistributed | | | Post October Loss | | | Capital Loss | | | Other | | | Unrealized | | | Total | |
| Ordinary | | | Long-Term | | | and | | | Carry | | | Book/Tax | | | Appreciation/ | | | Distributable Earnings | |
| Income | | | Gains | | | Late Year Loss | | | Forwards | | | Differences | | | (Depreciation) | | | /(Accumulated Deficit) | |
| $ | — | | | $ | — | | | $ | (222,596 | ) | | $ | (22,760 | ) | | $ | — | | | $ | 9,429,681 | | | $ | 9,184,325 | |
The difference between book basis and tax basis undistributed net investment income/(loss), accumulated net realized gain/(loss), and unrealized appreciation/(depreciation) from investments is primarily attributable to the tax deferral of losses on wash sales and adjustments for C-Corporation return of capital distributions.
Late year losses incurred after December 31 within the fiscal year are deemed to arise on the first business day of the following fiscal year for tax purposes. The Fund incurred and elected to defer such late year losses of $222,596.
At September 30, 2023, the Funds had capital loss carry forwards for federal income tax purposes available to offset future capital gains, as follows:
| | | | Long-Term Non- | | | | | | | |
| Short-Term Non-Expiring | | | Expiring | | | Total | | | CLCF Utilized | |
| $ | 22,760 | | | $ | — | | | $ | 22,760 | | | $ | 115,105 | |
| Empiric Fund |
| NOTES TO FINANCIAL STATEMENTS (Continued) |
| September 30, 2023 |
Permanent book and tax differences, primarily attributable to the book/tax basis treatment of realized gain (loss) on in-kind redemptions and net operating losses, resulted in reclassification for the year ended September 30, 2023, as follows:
| Paid | | | | |
| In | | | Distributable | |
| Capital | | | Earnings | |
| $ | (88,130 | ) | | $ | 88,130 | |
| (5) | RECENT REGULATORY UPDATES |
On January 24, 2023, the SEC adopted rule and form amendments to require mutual funds and ETFs to transmit concise and visually engaging streamlined annual and semiannual reports to shareholders that highlight key information. Other information, including financial statements, will not appear in a streamlined shareholder report but must be available online, delivered free of charge upon request, and filed on a semiannual basis on Form N-CSR. The rule and form amendments have a compliance date of July 24, 2024. At this time, management is evaluating the impact of these amendments on the shareholder reports for the Fund.
Subsequent events occurring after the date of the Statement of Assets and Liabilities have been evaluated through the date the financial statements were issued. The Trust’s officers have determined that no events or transactions occurred requiring adjustment or disclosure in the financial statements.

REPORT OF INDEPENDENT REGISTERED PUBLIC ACCOUNTING FIRM
To the Shareholders of Empiric Fund and
Board of Trustees of Mutual Fund Series Trust
Opinion on the Financial Statements
We have audited the accompanying statement of assets and liabilities, including the schedule of investments, of Empiric Fund (the “Fund”), a series of Mutual Fund Series Trust, as of September 30, 2023, the related statement of operations for the year then ended, the statements of changes in net assets for each of the two years in the period then ended, the related notes, and the financial highlights for each of the five years in the period then ended (collectively referred to as the “financial statements”). In our opinion, the financial statements present fairly, in all material respects, the financial position of the Fund as of September 30, 2023, the results of its operations for the year then ended, the changes in net assets for each of the two years in the period then ended, and the financial highlights for each of the five years in the period then ended, in conformity with accounting principles generally accepted in the United States of America.
Basis for Opinion
These financial statements are the responsibility of the Fund’s management. Our responsibility is to express an opinion on the Fund’s financial statements based on our audits. We are a public accounting firm registered with the Public Company Accounting Oversight Board (United States) (“PCAOB”) and are required to be independent with respect to the Fund in accordance with the U.S. federal securities laws and the applicable rules and regulations of the Securities and Exchange Commission and the PCAOB.
We conducted our audits in accordance with the standards of the PCAOB. Those standards require that we plan and perform the audit to obtain reasonable assurance about whether the financial statements are free of material misstatement whether due to error or fraud.
Our audits included performing procedures to assess the risks of material misstatement of the financial statements, whether due to error or fraud, and performing procedures that respond to those risks. Such procedures included examining, on a test basis, evidence regarding the amounts and disclosures in the financial statements. Our procedures included confirmation of securities owned as of September 30, 2023, by correspondence with the custodian. Our audits also included evaluating the accounting principles used and significant estimates made by management, as well as evaluating the overall presentation of the financial statements. We believe that our audits provide a reasonable basis for our opinion.
We have served as the Fund’s auditor since 2018.

COHEN & COMPANY, LTD.
Cleveland, Ohio
November 29, 2023
COHEN & COMPANY, LTD.
800.229.1099 | 866.818.4538 fax | cohencpa.com
Registered with the Public Company Accounting Oversight Board
| Empiric Fund |
| ADDITIONAL INFORMATION (Unaudited) |
| September 30, 2023 |
LIQUIDITY RISK MANAGEMENT PROGRAM
The Fund has adopted and implemented a written liquidity risk management program as required by Rule 22e-4 (the “Liquidity Rule”) under the 1940 Act. The program is reasonably designed to assess and manage the Fund’s liquidity risk, taking into consideration, among other factors, the Fund’s investment strategies and the liquidity of its portfolio investments during normal and reasonably foreseeable stressed conditions; its short and long-term cash flow projections; and its cash holdings and access to other funding sources.
During the year ended September 30, 2023 the Board and the Trust’s Liquidity Risk Management Program Committee (the “Committee”) reviewed the Fund’s investments and they determined that the Fund held adequate levels of cash and highly liquid investments to meet shareholder redemption activities in accordance with applicable requirements. Accordingly, the Board and Committee concluded that (i) the Fund’s liquidity risk management program is reasonably designed to prevent violations of the Liquidity Rule and (ii) the Fund’s liquidity risk management program has been effectively implemented.
| Empiric Fund |
| EXPENSE EXAMPLES (Unaudited) |
| September 30, 2023 |
As a shareholder of the Fund, you incur two types of costs: (1) transaction costs, including sales charges (loads) on purchases of Class A shares; (2) ongoing costs, including management fees; distribution and/or service (12b-1) fees; and other Fund expenses. This example is intended to help you understand your ongoing costs (in dollars) of investing in the Fund and to compare these costs with the ongoing costs of investing in other mutual funds.
The example is based on an investment of $1,000 invested at the beginning of the period and held for the entire period from April 1, 2023 through September 30, 2023.
Actual Expenses
The “Actual” lines in the table below provide information about actual account values and actual expenses. You may use the information below together with the amount you invested, to estimate the expenses that you paid over the period. Simply divide your account value by $ 1,000 (for example, an $8,600 account value divided by $1,000 = 8.6), then multiply the result by the number in the table under the heading entitled “Expenses Paid During Period” to estimate the expenses you paid on your account during this period.
Hypothetical Example for Comparison Purposes
The “Hypothetical” lines in the table below provide information about hypothetical account values and hypothetical expenses based on the Fund’s actual expense ratio and an assumed rate of return of 5% per year before expenses, which is not the Fund’s actual return. The hypothetical account values and expenses may not be used to estimate the actual ending account balances or expenses you paid for the period. You may use this information to compare this 5% hypothetical example with the 5% hypothetical examples that appear in the shareholder reports of other funds.
Please note that the expenses shown in the table are meant to highlight your ongoing costs only and do not reflect any transactional costs, such as sales charges (loads) . Therefore, the table is useful in comparing ongoing costs only, and will not help you determine the relative total costs of owning different funds. In addition, if these transactional costs were included, your costs would have been higher.
| | | Beginning | | Ending | | Expenses Paid | | Expense Ratio |
| | | Account Value | | Account Value | | During Period* | | During Period** |
| Actual | | 4/1/23 | | 9/30/23 | | 4/1/23 – 9/30/23 | | 4/1/23 – 9/30/23 |
| Class A | | $1,000.00 | | $1,004.60 | | $10.92 | | 2.17% |
| Class C | | 1,000.00 | | 1,000.70 | | 14.66 | | 2.92% |
| | | | | | | | | |
| | | Beginning | | Ending | | Expenses Paid | | Expense Ratio |
| Hypothetical | | Account Value | | Account Value | | During Period* | | During Period** |
| (5% return before expenses) | | 4/1/23 | | 9/30/23 | | 4/1/23 – 9/30/23 | | 4/1/23 – 9/30/23 |
| Class A | | $1,000.00 | | $1,014.17 | | $10.97 | | 2.17% |
| Class C | | 1,000.00 | | 1,010.42 | | 14.73 | | 2.92% |
| * | Expenses are equal to the average account value over the period, multiplied by the Fund’s annualized expense ratio, multiplied by the number of days in the period (183) divided by the number of days in the fiscal year (365). |
| Empiric Fund |
| ADDITIONAL INFORMATION (Unaudited) |
| September 30, 2023 |
Proxy Voting Policy and Portfolio Holdings
Reference is made to the Prospectus and the Statement of Additional Information for more detailed descriptions of the Management Agreement and Services Agreement Plan, tax aspects of the Fund and the calculation of the net asset value of shares of the Fund.
The Fund files its complete schedule of portfolio holdings with the Securities and Exchange Commission (the “Commission”) for the first and third quarters of each fiscal year as an exhibit to its reports on Form N-PORT, within sixty days after the end of the period. Form N-PORT reports are available at the SEC’s website at http://www.sec.gov.
Information regarding how the Fund voted proxies relating to portfolio securities during the twelve month period ended June 30 as well as a description of the policies and procedures that the Fund uses to determine how to vote proxies relating to portfolio securities is available without charge, upon request, by calling 1-888-839-7424; and on the Commission’s website at http://www.sec.gov.
| Empiric Fund |
| TRUSTEES AND OFFICERS (Unaudited) |
| September 30, 2023 |
Independent Trustees
Name, Address
Year of Birth | Position(s) Held
with Registrant | Term and
Length
Served1 | Principal Occupation(s)
During Past 5 Years | Number of
Portfolios
Overseen in
the Fund
Complex2 | Other Directorships Held
During Past 5 Years |
Tobias Caldwell
c/o Mutual Fund
Series Trust
36 N. New York
Avenue, Huntington,
NY 11743
Year of Birth: 1967 | Lead Trustee, Chairman of the Audit Committee and Nominating Committee | Since 6/2006 | Manager of Genovese Family Enterprises LLC & affiliates, the Genovese family office, since 1999; Managing Member of Bear Properties, LLC, a real estate management firm, since 2006; Managing Member of PTL Real Estate LLC, from 2000 until 2019. | 52 | Trustee of Variable Insurance Trust since 2010; Chairman of the Board of Mutual Fund and Variable Insurance Trust since 2016; Chairman of the Board of Strategy Shares since 2016; Trustee of IDX Funds Trust since 2016; Chairman of the Board of AlphaCentric Prime Meridian Income Fund ( 2018- 2023) |
Tiberiu Weisz
c/o Mutual Fund
Series Trust
36 N. New York
Avenue, Huntington,
NY 11743
Year of Birth: 1949 | Trustee, Chairman of the Risk and Compliance Committee | Since 6/2006 | Attorney since 1982. | 36 | Trustee of Variable Insurance Trust since 2010 |
Stephen P.Lachenauer
c/o Mutual Fund
Series Trust
36 N. New York
Avenue, Huntington,
NY 11743
Year of Birth: 1967 | Trustee | Since 4/2022 | Attorney, private practice since 2010 | 52 | Trustee and Chair of the Audit and Risk and Compliance Committees since 2016, and Chair of the Investment Committee since November 2020, Mutual Fund and Variable Insurance Trust; Trustee and Chair of the Audit and Risk and Compliance Committees since 2016, and Chair of the Investment Committee since November 2020, Strategy Shares; Chairman of the Board, TCG Financial Series Trusts I-X since 2015; Trustee and Chair of the Audit and Risk and Compliance Committees (2018- 2023), and Chair of the Investment Committee (2020-2023), AlphaCentric Prime Meridian Income Fund. |
| Empiric Fund |
| TRUSTEES AND OFFICERS (Unaudited) (Continued) |
| September 30, 2023 |
Interested Trustee3
Name, Address,
Year of Birth | Position(s)
Held
with
Registrant | Term and
Length
Served1 | Principal Occupation(s)
During Past 5 Years | Number of
Portfolios
Overseen
In The
Fund
Complex2 | Other Directorships Held
During Past 5 Years |
Jerry Szilagyi
53 Palmeras St.
Suite 601
San Juan, PR
00901
Year of Birth: 1962 | Chairman of the Board | Trustee since 7/2006; President 2/2012- 3/2022 | President of the Trust, 2/2012– 3/2022; President, Rational Advisors, Inc., 1/2016–present; Chief Executive Officer, Catalyst Capital Advisors LLC, 1/2006– present; Member, AlphaCentric Advisors LLC, 2/2014–present; Managing Member, MFund Distributors LLC, 10/2012– present; Managing Member, MFund Services LLC, 1/2012– present; CEO, Catalyst International Advisors LLC, 11/2019–present; CEO, Insights Media LLC, 11/2019–present; CEO, MFund Management LLC, 11/2019–present. | 36 | Variable Insurance Trust since 2010 |
| Empiric Fund |
| TRUSTEES AND OFFICERS (Unaudited) (Continued) |
| September 30, 2023 |
Officers
Name, Address,
Year of Birth | Position(s)
Held
with
Registrant | Term and
Length
Served1 | Principal Occupation(s)
During Past 5 Years | Number of
Portfolios
Overseen In
The Fund
Complex2 | Other Directorships Held
During Past 5 Years |
Michael Schoonover
53 Palmeras St. Suite
601
San Juan, PR 00901
Year of Birth: 1983 | President | Since 3/2022 | Vice President of the Trust, 2018– 2022; Chief Operating Officer, Catalyst Capital Advisors LLC and Rational Advisors, Inc., 6/2017– present; Portfolio Manager, Catalyst Capital Advisors LLC 12/2013–5/2021; Portfolio Manager, Rational Advisors, Inc. 1/2016–5/2018; President, MFund Distributors LLC, 1/2020– present; COO, Catalyst International Advisors LLC, 11/2019–present; COO, Insights Media LLC, 11/2019–present; COO, MFund Management LLC, 11/2019–present; COO, AlphaCentric Advisors LLC, since 1/2021. | N/A | N/A |
| | | | | | |
Alex Merino
53 Palmeras St. Suite
601
San Juan, PR 00901
Year of Birth: 1985 | Vice President | Since 3/2022 | Investment Operations Manager, MFund Management LLC, 1/2022– present; Investment Operations Analyst, MFund Management LLC, 9/2020–12/2021; Tax Senior Associate, PwC Asset & Wealth Management NY Metro, 7/2016– 6/2019. | N/A | N/A |
| | | | | | |
Erik Naviloff
4221 North 203rd
Street, Suite 100,
Elkhorn, Nebraska,
68022
Year of Birth: 1968 | Treasurer | Since 4/2012 | Vice President – Fund Administration, Ultimus Fund Solutions, LLC, since 2011. | N/A | N/A |
| | | | | | |
Brian Curley
4221 North 203rd
Street, Suite 100,
Elkhorn, Nebraska,
68022
Year of Birth: 1970 | Assistant Treasurer | Since 11/2013 | Vice President – Fund Administration, Ultimus Fund Solutions, LLC since 1/2015. | N/A | N/A |
| | | | | | |
Sam Singh
4221 North 203rd
Street, Suite 100,
Elkhorn, Nebraska,
68022
Year of Birth: 1976 | Assistant Treasurer | Since 2/2015 | Vice President – Fund Administration, Ultimus Fund Solutions, LLC since 1/2015. | N/A | N/A |
| | | | | | |
Frederick J. Schmidt
36 N. New York
Avenue
Huntington, NY
11743
Year of Birth: 1959 | Chief Compliance Officer | Since 5/2015 | Director of Compliance Services, MFund Services LLC since 5/2015. | N/A | N/A |
| | | | | | |
Jennifer A. Bailey
36 N. New York
Avenue
Huntington, NY
11743
Year of Birth: 1968 | Secretary | Since 4/2014 | Director of Legal Services, MFund Services LLC, since 2012. | N/A | N/A |
| 1. | The term of office of each Trustee is indefinite. |
| 2. | The ‘Fund Complex’ includes the Trust, Variable Insurance Trust, Mutual Fund and Variable Insurance Trust, and Strategy Shares, each a registered investment company. |
| 3. | The Trustee who is an “interested person” of the Trust as defined in the 1940 Act is an interested person by virtue of being an officer of the advisor to certain series of the Trust. |
The Fund’s SAI includes additional information about the Trustees and is available, free of charge, by calling toll-free 1-877-771-2836.
PRIVACY NOTICE
Mutual Fund Series Trust
Rev. August 2021
| FACTS | WHAT DOES MUTUAL FUND SERIES TRUST DO WITH YOUR PERSONAL INFORMATION? |
| | |
| Why? | Financial companies choose how they share your personal information. Federal law gives consumers the right to limit some, but not all sharing. Federal law also requires us to tell you how we collect, share, and protect your personal information. Please read this notice carefully to understand what we do. |
| | |
| What? | The types of personal information we collect and share depends on the product or service that you have with us. This information can include: ● Social Security number and wire transfer instructions ● account transactions and transaction history ● investment experience and purchase history When you are no longer our customer, we continue to share your information as described in this notice. |
| | |
| How? | All financial companies need to share customers’ personal information to run their everyday business. In the section below, we list the reasons financial companies can share their customers’ personal information; the reasons Mutual Fund Series Trust chooses to share; and whether you can limit this sharing. |
Reasons we can share your
personal information: | Does Mutual Fund Series
Trust share information? | Can you limit this
sharing? |
For our everyday business purposes - such as to process your transactions, maintain your account(s), respond to court orders and legal investigations, or report to credit bureaus. | YES | NO |
For our marketing purposes - to offer our products and services to you. | NO | We don’t share |
| For joint marketing with other financial companies. | NO | We don’t share |
For our affiliates’ everyday business purposes - information about your transactions and records. | NO | We don’t share |
For our affiliates’ everyday business purposes - information about your credit worthiness. | NO | We don’t share |
| For our affiliates to market to you | NO | We don’t share |
| For non-affiliates to market to you | NO | We don’t share |
PRIVACY NOTICE
Mutual Fund Series Trust
| What we do: |
| How does Mutual Fund Series Trust protect my personal information? | To protect your personal information from unauthorized access and use, we use security measures that comply with federal law. These measures include computer safeguards and secured files and buildings. Our service providers are held accountable for adhering to strict policies and procedures to prevent any misuse of your nonpublic personal information. |
| How does Mutual Fund Series Trust collect my personal information? | We collect your personal information, for example, when you: ● open an account or deposit money ● direct us to buy securities or direct us to sell your securities ● seek advice about your investments We also collect your personal information from others, such as credit bureaus, affiliates, or other companies. |
| Why can’t I limit all sharing? | Federal law gives you the right to limit only: ● sharing for affiliates’ everyday business purposes – information about your creditworthiness. ● affiliates from using your information to market to you. ● sharing for non-affiliates to market to you. State laws and individual companies may give you additional rights to limit sharing. |
| | |
| Definitions |
| Affiliates | Companies related by common ownership or control. They can be financial and non-financial companies. ● Mutual Fund Series Trust does not share with affiliates. |
| Non-affiliates | Companies not related by common ownership or control. They can be financial and non-financial companies. ● Mutual Fund Series Trust doesn’t share with non-affiliates so they can market to you. |
| Joint marketing | A formal agreement between nonaffiliated financial companies that together market financial products or services to you. ● Mutual Fund Series Trust doesn’t jointly market. |
| | Alpha Centric | 844-223-8637 |
| | Catalyst | 866-447-4228 |
| QUESTIONS? | Day Hagan | 877-329-4246 |
| CALL | Empiric | 888-839-7424 |
| | Eventide | 877-771-3836 |
| | JAG | 855-552-4596 |
| |
| |
| |
| Mutual Fund Series Trust |
| 4221 North 203rd Street, Suite 100 |
| Elkhorn, NE 68022 |
| |
| ADVISER |
| Empiric Advisors, Inc. |
| 500 N. Capital of Texas Highway |
| Building 8, Suite 150 |
| Austin, TX 78746 |
| |
| ADMINISTRATOR |
Ultimus Fund Solutions, LLC
225 Pictoria Drive, Suite 450
Cincinnati, OH 45246 |
| |
| TRANSFER AGENT |
Ultimus Fund Solutions, LLC
225 Pictoria Drive, Suite 450
Cincinnati, OH 45246 |
| |
| DISTRIBUTOR |
| Northern Lights Distributors, LLC |
| 4221 North 203rd Street, Suite 100 |
| Elkhorn, NE 68022 |
| |
| INDEPENDENT REGISTERED PUBLIC ACCOUNTING FIRM |
Cohen & Company, Ltd.
1350 Euclid Avenue,
Suite 800
Cleveland, OH 44115 |
| |
| LEGAL COUNSEL |
| Thompson Hine LLP |
| 41 South High Street |
| Suite 1700 |
| Columbus, OH 43215 |
| |
| CUSTODIAN BANK |
| U.S. Bank |
| 1555 N. Rivercenter Dr. |
| Milwaukee, WI 53212 |
| |
| |
| |
| |
| |
| |
| |
| |
| |
| |
| |
| EMP-AR23 |
| |
(b) Not applicable
ITEM 2. CODE OF ETHICS.
| (a) | The registrant has, as of the end of the period covered by this report, adopted a code of ethics that applies to the registrant's principal executive officer, principal financial officer, and principal accounting officer or controller, or persons performing similar functions, regardless of whether these individuals are employed by the registrant or a third party. |
| (b) | During the period covered by this report, there were no amendments to any provision of the code of ethics. |
| (c) | During the period covered by this report, there were no waivers or implicit waivers of a provision of the code of ethics. |
ITEM 3. AUDIT COMMITTEE FINANCIAL EXPERT.
| | The registrant’s Board of Trustees has determined that it does not have an audit committee financial expert serving on its audit committee. At this time, the registrant believes that the experience provided by each member of the audit committee together offer the registrant adequate oversight for the registrant’s level of financial complexity. |
ITEM 4. PRINCIPAL ACCOUNTANT FEES AND SERVICES.
| (a) | Audit Fees. The aggregate fees billed for each of the last two fiscal years for professional services rendered by the registrant's principal accountant for the audit of the registrant's annual financial statements or services that are normally provided by the accountant in connection with statutory and regulatory filings or engagements for those fiscal years are as follows: |
| Trust Series | 2023 | 2022 |
| Empiric Fund | 12,000 | 11,000 |
| | | |
| | | | |
| (b) | Audit-Related Fees. There were no fees billed in each of the last two fiscal years for assurances and related services by the principal accountant that are reasonably related to the performance of the audit of the registrant’s financial statements and are not reported under paragraph (a) of this item. |
| (c) | Tax Fees. The aggregate fees billed in each of the last two fiscal years for professional services rendered by the principal accountant for tax compliance are as follows: |
| Trust Series | 2023 | 2022 |
| Empiric Fund | 3,000 | 2,600 |
| | | |
| (d) | All Other Fees. The aggregate fees billed in each of the last two fiscal years for products and services provided by the registrant’s principal accountant, other than the services reported in paragraphs (a) through (c) of this item were $0 and $0 for the fiscal years ended September 30, 2023 and 2022 respectively. |
| (e)(1) | The audit committee does not have pre-approval policies and procedures. Instead, the audit committee or audit committee chairman approves on a case-by-case basis each audit or non-audit service before the principal accountant is engaged by the registrant. |
| (e)(2) | There were no services described in each of paragraphs (b) through (d) of this Item that were approved by the audit committee pursuant to paragraph (c)(7)(i)(C) of Rule 2-01 of Regulation S-X. |
| f) | Not applicable. The percentage of hours expended on the principal accountant's engagement to audit the registrant's financial statements for the most recent fiscal year that were attributed to work performed by persons other than the principal accountant's full-time, permanent employees was zero percent (0%). |
| (g) | All non-audit fees billed by the registrant's principal accountant for services rendered to the registrant for the fiscal years ended September 30, 2023 and 2022 respectively are disclosed in (b)-(d) above. There were no audit or non-audit services performed by the registrant's principal accountant for the registrant's adviser. |
| (h) | Not applicable. The registrant's audit committee has considered whether the provision of non-audit services to the registrant's investment adviser (not including any sub-adviser whose role is primarily portfolio management and is subcontracted with or overseen by another investment adviser), and any entity controlling, controlled by, or under common control with the investment adviser that provides ongoing services to the registrant, that were not pre-approved pursuant to paragraph (c)(7)(ii) of Rule 2-01 of Regulation S-X, is compatible with maintaining the principal accountant's independence. |
| (i) | Not applicable. |
| (j) | Not applicable. |
ITEM 5. AUDIT COMMITTEE OF LISTED REGISTRANTS.
Not applicable
ITEM 6. SCHEDULE OF INVESTMENT
Included in annual report to shareholders filed under item 1 of this form.
ITEM 7. DISCLOSURE OF PROXY VOTING POLICIES AND PROCEDURES FOR CLOSED-END MANAGEMENT INVESTMENT COMPANIES.
Not applicable Fund is an open-end management investment company
ITEM 8. PORTFOLIO MANAGERS OF CLOSED-END MANAGEMENT INVESTMENT COMPANIES
Not applicable Fund is an open-end management investment company
ITEM 9. PURCHASES OF EQUITY SECURITIES BY CLOSED-END MANAGEMENT INVESTMENT COMPANY AND AFFILIATED PURCHASERS.
Not applicable Fund is an open-end management investment company
ITEM 10. SUBMISSION OF MATTERS TO A VOTE OF SECURITY HOLDERS.
Not applicable at this time.
ITEM 11. CONTROLS AND PROCEDURES.
(a) The registrant's principal executive and principal financial officers, or persons performing similar functions, have concluded that the registrant's disclosure controls and procedures (as defined in Rule 30a-3(c) under the 1940 Act, are effective, as of a date within 90 days of the filing date of this report, based on the evaluation of these controls and procedures required by Rule 30a-3(b) under the 1940 Act and Rule 15d-15(b) under the Securities Exchange Act of 1934, as amended.
(b) There were no significant changes in the Registrant’s internal control over financial reporting that occurred during the period covered by this report that have materially affected, or are reasonably likely to materially affect, the Registrant’s internal control over financial reporting.
ITEM 12. Disclosure of Securities Lending Activities for Closed-End Management Investment Companies.
Not applicable Fund is an open-end management investment company
ITEM 13. EXHIBITS
(1) Code of Ethics for Principal Executive and Senior Financial Officers is attached hereto.
(2) Certifications pursuant to Section 302 of the Sarbanes-Oxley Act of 2002 are filed herewith.
(3) Certifications pursuant to Section 906 of the Sarbanes-Oxley Act of 2002 are filed herewith.
SIGNATURES
Pursuant to the requirements of the Securities Exchange Act of 1934 and the Investment Company Act of 1940, the registrant has duly caused this report to be signed on its behalf by the undersigned, thereunto duly authorized.
Mutual Fund Series Trust
| By Michael Schoonover | /s/ Michael Schoonover |
| Principal Executive Officer/President |
| Date: December 6, 2023 | |
Pursuant to the requirements of the Securities Exchange Act of 1934 and the Investment Company Act of 1940, this report has been signed below by the following person on behalf of the registrant and in the capacities and on the date indicated.
| By Erik Naviloff | /s/ Erik Naviloff_____________ |
| Principal Financial Officer/Treasurer |
| Date: December 6, 2023 | |