UNITED STATES
SECURITIES AND EXCHANGE COMMISSION
Washington, D.C. 20549
FORM N-CSR
CERTIFIED SHAREHOLDER REPORT OF REGISTERED
MANAGEMENT INVESTMENT COMPANIES
Investment Company Act file number: 811-21869
NEXPOINT CREDIT STRATEGIES FUND
(Exact name of registrant as specified in charter)
200 Crescent Court
Suite 700
Dallas, Texas 75201
(Address of principal executive offices) (Zip code)
NexPoint Advisors, L.P.
200 Crescent Court
Suite 700
Dallas, Texas 75201
(Name and Address of Agent for Service)
Registrant’s telephone number, including area code: (877) 665-1287
Date of fiscal year end: December 31
Date of reporting period: December 31, 2013
Item 1. Reports to Stockholders.
A copy of the Report to Shareholders transmitted to shareholders pursuant to Rule 30e-1 under the Investment Company Act of 1940 is attached herewith.

NexPoint Credit Strategies Fund
Annual Report
December 31, 2013
NexPoint Credit Strategies Fund
TABLE OF CONTENTS
Economic and market conditions change frequently.
There is no assurance that the trends described in this report will continue or commence.
Privacy Policy
We recognize and respect your privacy expectations, whether you are a visitor to our web site, a potential shareholder, a current shareholder or even a former shareholder.
Collection of Information. We may collect nonpublic personal information about you from the following sources:
| | Ÿ | | Account applications and other forms, which may include your name, address and social security number, written and electronic correspondence and telephone contacts; |
| | Ÿ | | Web site information, including any information captured through the use of “cookies”; and |
| | Ÿ | | Account history, including information about the transactions and balances in your accounts with us or our affiliates. |
Disclosure of Information. We may share the information we collect with our affiliates. We may also disclose this information as otherwise permitted by law. We do not sell your personal information to third parties for their independent use.
Confidentiality and Security of Information. We restrict access to nonpublic personal information about you to our employees and agents who need to know such information to provide products or services to you. We maintain physical, electronic and procedural safeguards that comply with federal standards to guard your nonpublic personal information, although you should be aware that data protection cannot be guaranteed.
PORTFOLIO MANAGER COMMENTARY (unaudited)
| | |
| December 31, 2013 | | NexPoint Credit Strategies Fund |
2013: A Step in the Right Direction
We are pleased to report strong 2013 results for the Fund’s shareholders. As discussed in our letter last year, we refocused the priorities in NexPoint Credit Strategies Fund (the “Fund”) beginning in the summer of 2012. We believe we can consistently outperform the DJ Credit Suisse Hedge Fund Index and the HFRX Global Hedge Fund Index. The Fund had the best NAV performance of all closed-end funds in 201311, up 61.55%, and was one of only 43 credit oriented funds to increase its dividend during the year, increasing it three times for a total increase of 43%. For the month of February 2014, the Trustees approved an additional dividend increase of 10%. The Fund now pays a monthly dividend of $.055 per share. As of December 31, 2013, the Fund had an undistributed net investment income balance of $6.4 million or $.100 per share, representing income that has been earned but not paid out to shareholders. This balance provides a cushion to maintain the current monthly dividend if the portfolio suffers defaults or losses of income in the future. The annualized earn rate on assets as of January 31, 2014, is $.684 per share; the current monthly distribution is $.055 per share, or $.66 per share annually.
2013 Performance
In 2013, the Fund (NAV) returned 61.55% and the stock price was up 52.03%, including reinvested dividends. The Fund’s performance compared very favorably to the Fund’s two benchmarks, the DJ Credit Suisse Hedge Fund Index (+ 9.73%) and the HFRX Global Hedge Fund Index (+6.72%) as well as to other credit focused closed-end funds. In 2013, 43 credit funds increased their dividend, 93 credit funds decreased their dividend and 8 credit funds left their dividend unchanged (source: Morningstar, includes only credit oriented funds). The Fund increased its regular monthly dividend three times during 2013 for a total increase of 43%.
For the year, the top five performing investments in the portfolio were American Airlines Group common stock, Media General/New Young Broadcasting common stock, Communications Corporation of America common stock, American Express Co. common stock, and Metro-Goldwyn-Mayer Inc common stock. The top five underperforming investments in the portfolio in 2013 were ProShares Ultra Silver ETF, Celtic Pharma Phinco bond, LLV Holding Co. equity and debt, ProShares UltraShort Russell 2000 ETF, Oracle Corporation equity short and Chesapeake Energy Corporation equity short. In 2013, the Fund’s equity investments outperformed all other asset classes contributing 51.8% to the Fund’s NAV. CLOs were the second best performing asset class contributing 5.7% to the Fund’s NAV.
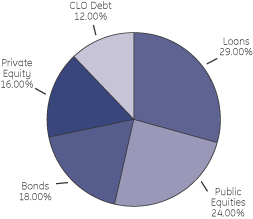
As of December 31, 2012, the Fund’s investments were allocated among the following asset classes:
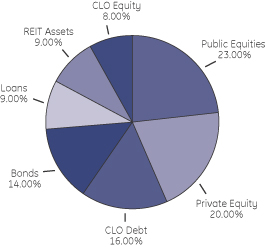
As of December 31, 2013, the Fund’s investments were allocated among the following asset classes:
PORTFOLIO MANAGER COMMENTARY (unaudited)
| | |
| December 31, 2013 | | NexPoint Credit Strategies Fund |
During 2013, the Fund increased its allocation to CLOs. We feel CLOs are a more efficient way to gain exposure to syndicated floating rate bank debt. Beginning in the summer of 2013, we also began allocating a portion of the portfolio to real estate through a wholly-owned private REIT subsidiary that invests directly in real estate. The allocation to private equity increased through additional market gains not purchases.
The Fund’s Strategy
The Fund is managed as an asset allocation strategy that attempts to exceed the return of the Fund’s two benchmarks in a transparent, registered fund format, paying a stable monthly dividend. We consider the Fund similar to a hedge fund and position the portfolio accordingly. We will typically allocate the Fund’s investments in the following asset classes: public equities, private equity investments, collateralized loan obligation (CLOs) debt, high yield bonds, syndicated floating rate bank loans, real estate assets, CLO equity and will hedge exposure where necessary.
Our View of the Year Ahead
In 2014, we believe the equity markets will encounter significant head winds compared to 2013, especially in emerging markets. Based on our research, we believe equities may be poised for a significant pullback of 10% or more and that choppy and/or declining markets may last longer than some expect. Specifically we notice that on an historical basis the US equity market appears to be overvalued measured as a percentage of US GDP. As the chart below shows, the two previous times the total capitalization of the U.S. equity market hit 140% of U.S. GDP (2000 and 2008), the S&P 500 suffered a pullback of over 20%, with 2008 being the worst decline since the Great Depression.
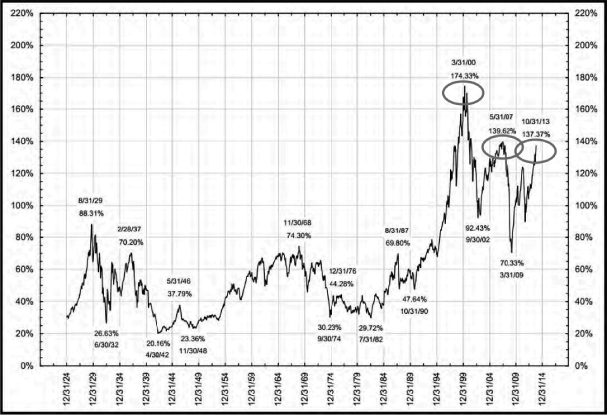
Source: Ron Griess, www.thechartstore.com
PORTFOLIO MANAGER COMMENTARY (unaudited)
| | |
| December 31, 2013 | | NexPoint Credit Strategies Fund |
Of equal concern to us is the high level of margin debt shown in the chart below. Again, the last two times margin debt was at current levels (2000 and 2008), the S&P 500 suffered a pullback of over 20%.
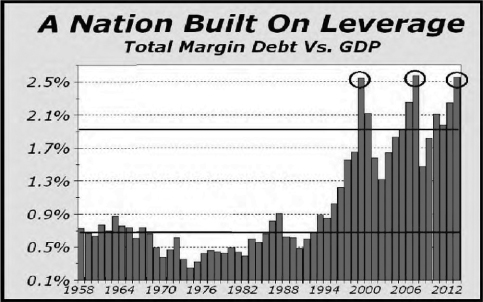
Source: Alan Newman, www.cross-currents.net
Finally, we are concerned about the disparity between household net worth and disposable personal income, as shown in the chart below. Household net worth in the U.S. is driven largely by gains in the equity and housing markets, which we believe have been artificially inflated by easy money policies by the Federal Reserve and is not sustainable in the long-term. The same factors were present in 2000 and 2008 and a severe decline in the equity markets followed.
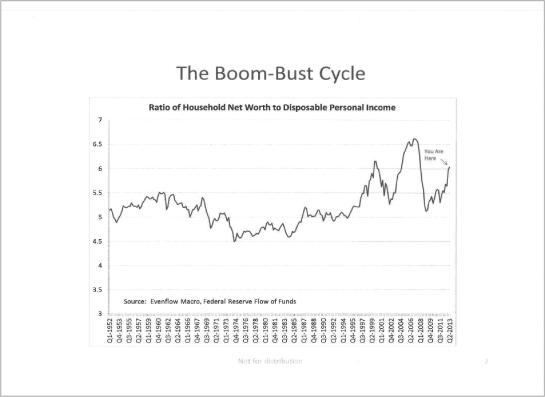
PORTFOLIO MANAGER COMMENTARY (unaudited)
| | |
| December 31, 2013 | | NexPoint Credit Strategies Fund |
Reviewing these observations, U.S. equity market capitalization to U.S. GDP, margin debt and household net worth to disposable income together, we believe a 20% pullback in the broader equity markets is possible. However, we are not “bears” long-term and feel any correction will be a healthy clearing of the market and then it will resume its upward trajectory. We believe it will be a stock pickers market with opportunities among downtrodden and misunderstood situations. Although we feel some are overly optimistic regarding GDP and employment growth in the U.S., we do feel both will continue to improve. We believe the Federal Reserve will be slow to increase rates or remove tapering, erring on the side of accommodation. We will watch emerging markets carefully, and move in to these markets if we see a bottom forming in 2014.
As for credit markets, our view is that credit still provides attractive risk-adjusted returns and yields. Given the importance of yield in today’s environment, particularly in the closed-end fund universe, we intend to have high allocations to credit and credit alternatives. Although we are weary of long duration fixed income investments, we still see value in high yield investments, including bonds, with maturities of less than five years. Our opinion is that the Federal Reserve will work to keep the short end of the yield curve low until there is a reduction in the unemployment rate below 5.5%. GDP growth has been anemic for a recovery in its sixth year and lower unemployment rates mask a drop in workforce participation. We see rates remaining lower thru 2015.
As always, the Federal Reserve’s actions will be a major determinant in how the equity and credit markets fare this year.
Portfolio Allocation
As a result of our views of the equity and credit markets we intend to have large allocations to low duration credit investments and credit alternatives with opportunistic allocations to value equities. The Fund will be cautious in its allocations to equities in 2014. Our focus with regard to equities will be on undervalued stocks with catalysts to the upside. We will continue to hedge our overall equity exposure and short more single names we feel are overvalued with a downside risk. On the credit side, we anticipate our allocations to liquid syndicated floating rate bank debt and high yield bonds will remain largely unchanged. However, our allocation to CLO debt and equity tranches will increase. We see the strongest risk-adjusted returns and yields in this asset class.
Although not a large contributor to returns in 2013, the Fund began to allocate to real estate investments in mid-2013. The Fund set up a private REIT subsidiary and is funding the purchase of real estate, predominantly class B multi-family properties but also opportunistic retail investments. Both categories provide high cash flow. We view these real estate investments as credit alternatives. They pay a healthy and stable yield, while offering strong collateral, and a low correlation versus credit and equity markets. We intend to allocate 15-20% of the Fund’s total assets to this private REIT in 2014.
As is our philosophy, we will continue to diversify the portfolio across asset classes and sectors but will continue to make large allocations to our highest conviction ideas in an effort to generate meaningful alpha and outperformance against relevant indices and competing funds.
Shareholder Loyalty Program
In July 2012, we developed and implemented a unique and creative Dividend Reinvestment Plan (the “DRIP Program”) that we believe rewards long-term shareholders while aligning the interests of the portfolio manager and other employees of the manager with those of the Fund’s shareholders. The primary purpose of the DRIP Program is to promote shareholder loyalty. The DRIP Program offers shareholders a 2% gross-up on all new purchases made through accounts held by the DRIP Program’s administrator that are held for at least 12-months after initial purchase date. The DRIP Program was offered to employees of NexPoint and affiliates beginning in July 2012 and has increased direct employee ownership in the Fund from less than 1% of outstanding shares to 7% as of January, 2014. As of February 15, 2014, the DRIP Program had accumulated 5.7 million shares of the Fund’s stock, representing 8.3% of the outstanding shares or $61.6 million in value. All costs of the program, including the cost of the gross-up on purchases and dividend reinvestments, are paid by the manager, not by the Fund.
We believe over time the DRIP Program will prove an effective means of increasing liquidity and ultimately reducing the market price discount to NAV.
James Dondero
President and Portfolio Manager
FUND PROFILE
| | |
| | NexPoint Credit Strategies Fund |
The NexPoint Credit Strategies Fund (the “Fund”) seeks to provide both current income and capital appreciation.
Total Net Assets of Common Shares as of December 31, 2013
$724.5 million
Portfolio Data as of December 31, 2013
The information below provides a snapshot of the Fund at the end of the reporting period. The Fund is actively managed and the composition of its portfolio will change over time.
| | | | |
| Quality Breakdown as of 12/31/2013 (%)(1)(2) | |
AAA | | | 1.3 | |
AA | | | 0.2 | |
A | | | 0.9 | |
BBB | | | 10.5 | |
BB | | | 15.7 | |
B | | | 30.4 | |
CCC | | | 24.0 | |
C | | | 1.3 | |
D | | | 0.1 | |
Not Rated | | | 15.6 | |
| | | | |
| Top 5 Sectors as of 12/31/2013 (%)(1)(2) | |
Asset-Backed Securities | | | 22.1 | |
Media & Telecommunications | | | 19.0 | |
Transportation | | | 14.8 | |
Real Estate Investment Trust | | | 12.3 | |
Financial | | | 11.3 | |
| | | | |
| Top 10 Holdings as of 12/31/2013 (%)(1)(2) | |
Media General, Inc. (Common Stocks) | | | 15.4 | |
AAL (Rights) | | | 14.7 | |
Freedom REIT (Private REIT) | | | 5.9 | |
ComCorp Broadcasting, Inc. (U.S. Senior Loans) | | | 4.9 | |
ProShares Ultra Silver, ETF (Exchange-Traded Funds) | | | 4.8 | |
K12, Inc. (Common Stocks) | | | 4.5 | |
Fortinet, Inc. (Common Stocks) | | | 3.6 | |
Spirit Realty Capital, Inc. (Common Stocks) | | | 3.6 | |
Nokia OYJ (Foreign Corporate Bonds & Notes) | | | 3.3 | |
Texas Competitive Electric Holdings Co. LLC (U.S. Senior Loans) | | | 3.2 | |
| (1) | Quality is calculated as a percentage of total senior loans, asset-backed securities and corporate bonds & notes. Sectors and holdings are calculated as a percentage of total net assets. The quality ratings reflected were issued by Standard & Poor’s, a nationally recognized statistical rating organization. Ratings are measured on a scale that generally ranges from AAA (highest) to D (lowest). Quality ratings reflect the credit quality of the underlying bonds in the Fund’s portfolio and not that of the Fund itself. Quality Ratings are subject to change. |
| (2) | Excludes the Fund’s investment in an investment company purchased with cash collateral from securities lending. |
FINANCIAL STATEMENTS
| | |
| December 31, 2013 | | NexPoint Credit Strategies Fund |
A guide to understanding the Fund’s financial statements
| | |
| Investment Portfolio | | The Investment Portfolio details all of the Fund’s holdings and their value as of the last day of the reporting period. Portfolio holdings are organized by type of asset and industry to demonstrate areas of concentration and diversification. |
| |
| Statement of Assets and Liabilities | | This statement details the Fund’s assets, liabilities, net assets and common share price as of the last day of the reporting period. Net assets are calculated by subtracting all the Fund’s liabilities (including any unpaid expenses) from the total of the Fund’s investment and non-investment assets. The net asset value per common share is calculated by dividing net assets by the number of common shares outstanding as of the last day of the reporting period. |
| |
| Statement of Operations | | This statement reports income earned by the Fund and the expenses accrued by the Fund during the reporting period. The Statement of Operations also shows any net gain or loss the Fund realized on the sales of its holdings during the period as well as any unrealized gains or losses recognized over the period. The total of these results represents the Fund’s net increase or decrease in net assets from operations applicable to common shareholders. |
| |
| Statements of Changes in Net Assets | | These statements detail how the Fund’s net assets were affected by its operating results, distributions to common shareholders and shareholder transactions from common shares (e.g., subscriptions, redemptions and distribution reinvestments) during the reporting period. The Statements of Changes in Net Assets also detail changes in the number of common shares outstanding. |
| |
| Statement of Cash Flows | | This statement reports net cash and foreign currency provided or used by operating, investing and financing activities and the net effect of those flows on cash and foreign currency during the period. |
| |
| Financial Highlights | | The Financial Highlights demonstrate how the Fund’s net asset value per common share was affected by the Fund’s operating results. The Financial Highlights also disclose the Fund’s performance and certain key ratios (e.g., net expenses and net investment income as a percentage of average net assets). |
| |
| Notes to Financial Statements | | These notes disclose the organizational background of the Fund, its significant accounting policies (including those surrounding security valuation, income recognition and distributions to shareholders), federal tax information, fees and compensation paid to affiliates and significant risks and contingencies. |
INVESTMENT PORTFOLIO
| | |
| As of December 31, 2013 | | NexPoint Credit Strategies Fund |
| | | | | | | | |
| |
Principal Amount ($) | | Value ($) | |
|
| U.S. Senior Loans (a) - 19.1% | |
|
| | BROADCASTING - 5.0% | |
| | 35,950,043 | | | ComCorp Broadcasting, Inc.
Term Loan B
9.00%, 04/03/2014 (b) | | | 35,809,838 | |
| | | | | | | | |
|
| | CHEMICALS - 1.0% | |
| | 750,000 | | | Arysta LifeScience SPC LLC
Second Lien Term Loan
8.25%, 11/30/2020 | | | 763,819 | |
| | 1,597,107 | | | W.R. Grace & Co.
5-Year Revolver (c) | | | 3,353,924 | |
| | 1,597,107 | | | Revolver Credit Loan (c) | | | 3,353,924 | |
| | | | | | | | |
| | | | | | | 7,471,667 | |
| | | | | | | | |
|
| | CONSUMER DISCRETIONARY - 0.1% | |
| | 332,483 | | | Bass Pro Group LLC New
Term Loan 11/20/2019 (d) | | | 334,907 | |
| | | | | | | | |
|
| | FOREST PRODUCTS & CONTAINERS - 0.0% | |
| | 200,000 | | | Berlin Packaging LLC Second Lien
Term Loan 8.75%, 04/02/2020 | | | 205,250 | |
| | | | | | | | |
|
| | GAMING & LEISURE - 0.5% | |
| | 3,937,249 | | | Ginn LA Conduit Lender, Inc.
First Lien Tranche A (c) | | | 118,117 | |
| | 8,438,203 | | | First Lien Tranche B
Term Loan (c) | | | 253,146 | |
| | 7,879,521 | | | LLV Holdco LLC Exit Revolving
Loan 5.00%, 02/28/2017 (b)(e) | | | 3,519,782 | |
| | 7,000,000 | | | WAICCS Las Vegas 3 LLC
Second Lien Term Loan (b)(c) | | | — | |
| | | | | | | | |
| | | | | | | 3,891,045 | |
| | | | | | | | |
|
| | HEALTHCARE - 0.3% | |
| | 2,000,000 | | | Onex Carestream Finance LP
Second Lien Term Loan
9.50%, 06/07/2019 | | | 2,042,500 | |
| | | | | | | | |
|
| | HOUSING - 0.0% | |
| | 2,498,819 | | | LBREP/L-Suncal Master I LLC
First Lien Term Loan (b)(c) | | | 189,410 | |
| | | | | | | | |
|
| | INFORMATION TECHNOLOGY - 1.9% | |
| | 4,697,834 | | | Avaya, Inc.
Term Loan B-5 8.00%, 03/30/2018 | | | 4,775,348 | |
| | 4,000,000 | | | Kronos, Inc. Second Lien
Initial Term Loan 9.75%, 04/30/2020 | | | 4,147,500 | |
| | 5,000,000 | | | Vertafore, Inc.
Second Lien Term Loan
9.75%, 10/27/2017 | | | 5,093,750 | |
| | | | | | | | |
| | | | | | | 14,016,598 | |
| | | | | | | | |
|
| | MANUFACTURING - 0.3% | |
| | 2,000,000 | | | Doncasters U.S. Finance LLC
Second Lien Term Loan
9.50%, 10/09/2020 | | | 2,035,000 | |
| | 240,000 | | | Filtration Group Corp.
Second Lien Term Loan
11/22/2021 (d) | | | 246,000 | |
| | | | | | | | |
| | | | | | | 2,281,000 | |
| | | | | | | | |
| | | | | | | | |
| |
Principal Amount ($) | | Value ($) | |
|
| | MEDIA & TELECOMMUNICATIONS - 0.2% | |
| | 300,000 | | | Aufinco Pty, Ltd.
Second Lien Term Loan
8.25%, 11/20/2020 | | | 304,875 | |
| | 8,920,151 | | | Broadstripe LLC
First Lien Term Loan (b)(c) | | | 115,070 | |
| | 886,042 | | | Revolver (b)(c) | | | 11,430 | |
| | 3,373,813 | | | Endurance Business Media, Inc.
Term Loan 6.50%, 12/15/2014 | | | 775,977 | |
| | | | | | | | |
| | | | | | | 1,207,352 | |
| | | | | | | | |
|
| | RETAIL - 1.5% | |
| | 7,766,060 | | | Guitar Center, Inc.
Extended Term Loan
6.25%, 04/10/2017 | | | 7,596,178 | |
| | 3,395,935 | | | JC Penney Corp., Inc.
Term Loan 6.00%, 05/22/2018 | | | 3,328,016 | |
| | | | | | | | |
| | | | | | | 10,924,194 | |
| | | | | | | | |
|
| | SERVICE - 1.1% | |
| | 500,000 | | | Spin Holdco Inc. 11/14/2019 (d) | | | 504,375 | |
| | 7,044,219 | | | Travelport LLC Tranche 1
Term Loan 9.50%, 01/29/2016 | | | 7,310,596 | |
| | | | | | | | |
| | | | | | | 7,814,971 | |
| | | | | | | | |
|
| | UTILITY - 7.2% | |
| | 25,003,843 | | | Entegra TC LLC Third Lien
Term Loan 6.25%, 10/19/2015 | | | 15,627,402 | |
| | 17,000,000 | | | Texas Competitive Electric
Holdings Co. LLC
Non Extended Term Loan
3.73%, 10/10/2014 | | | 12,082,750 | |
| | 33,329,417 | | | 2017 Extended
Term Loan 10/10/2017 (d) | | | 23,136,281 | |
| | 1,125,000 | | | TGGT Holdings, LLC Term Loan 11/15/2018 (d) | | | 1,133,438 | |
| | | | | | | | |
| | | | | | | 51,979,871 | |
| | | | | | | | |
| | | | Total U.S. Senior Loans
(Cost $169,451,234) | | | 138,168,603 | |
| | | | | | | | |
| |
Principal Amount | | | |
|
| Foreign Denominated or Domiciled | |
| Senior Loans (a) - 0.1% | |
|
| | LUXEMBOURG - 0.0% | |
| | USD | |
| | 222,222 | | | AI Chem & Cy SCA Second Lien
Term Loan 8.25%, 04/03/2020 | | | 228,751 | |
| | | | | | | | |
|
| | UNITED KINGDOM - 0.1% | |
| | GBP | | | | | | | |
| | 930,744 | | | Henson No. 4, Ltd.
Term Loan Facility B (b)(c) | | | 78,497 | |
| | 934,584 | | | Term Loan Facility C (b)(c) | | | 79,261 | |
| | | | | | | | |
| | | | Total Foreign Denominated or Domiciled Senior Loans
(Cost $1,810,438) | | | 386,509 | |
| | | | | | | | |
| | | | | | |
| See accompanying Notes to Financial Statements. | | | | | | 7 |
INVESTMENT PORTFOLIO (continued)
| | |
| As of December 31, 2013 | | NexPoint Credit Strategies Fund |
| | | | | | | | |
| |
Principal Amount ($) | | Value ($) | |
|
| Asset-Backed Securities - 22.1% | |
| | 2,000,000 | | | ABCLO, Ltd.
Series 2007-1A, Class C
2.09%, 04/15/2021 (f)(g) | | | 1,884,400 | |
| | 3,000,000 | | | ACA CLO, Ltd.
Series 2007-1A, Class D
2.59%, 06/15/2022 (f)(g) | | | 2,797,500 | |
| | 2,000,000 | | | Apidos CLO
Series 2013-12A, Class D
3.29%, 04/15/2025 (f)(g) | | | 1,878,200 | |
| | 1,000,000 | | | Series 2013-12A, Class F
5.14%, 04/15/2025 (f)(g) | | | 870,100 | |
| | 3,227,559 | | | ARES XII CLO, Ltd.
Series 2007-12A, Class E
5.99%, 11/25/2020 (f)(g) | | | 3,165,913 | |
| | 1,000,000 | | | Babson Mid-Market CLO, Inc.
Series 2007-2A, Class D
1.94%, 04/15/2021 (f)(g) | | | 946,000 | |
| | 1,250,000 | | | BlueMountain CLO, Ltd.
Series 2013-2A, Class D
3.82%, 01/22/2025 (f)(g) | | | 1,200,375 | |
| | 950,000 | | | Series 2013-2A, Class E
5.32%, 01/22/2025 (f)(g) | | | 898,510 | |
| | 2,500,000 | | | Brentwood CLO Corp.
Series 2006-1A, Class B
1.06%, 02/01/2022 (f)(g) | | | 2,213,750 | |
| | 2,000,000 | | | Carlyle High Yield Partners X, Ltd.
Series 2007-10A, Class E
3.44%, 04/19/2022 (f)(g) | | | 1,800,000 | |
| | 3,000,000 | | | Catamaran CLO, Ltd.
Series 2013-1A, Class E
5.28%, 01/27/2025 (f)(g) | | | 2,788,500 | |
| | 250,000 | | | Series 2012-1A, Class E
5.50%, 12/20/2023 (f)(g) | | | 236,250 | |
| | 1,500,000 | | | Series 2013-1A, Class F
5.97%, 01/27/2025 (f)(g) | | | 1,341,750 | |
| | 2,000,000 | | | Cent CDO, Ltd.
Series 2007-15A, Class C
2.49%, 03/11/2021 (f)(g) | | | 1,840,200 | |
| | 2,000,000 | | | ColumbusNova CLO, Ltd.
Series 2007-1A, Class D
1.59%, 05/16/2019 (f)(g) | | | 1,832,600 | |
| | 742,733 | | | CSAM Funding II
Series 2A, Class B1
7.05%, 10/15/2016 (f) | | | 747,189 | |
| | 457,922 | | | Del Mar CLO, Ltd.
Series 2006-1A, Class E
4.24%, 07/25/2018 (f)(g) | | | 443,040 | |
| | 1,500,000 | | | Diamond Lake CLO, Ltd.
Series 2006-1A, Class B2L
4.24%, 12/01/2019 (f)(g) | | | 1,422,450 | |
| | 1,000,000 | | | Dryden XXV Senior Loan Fund
Series 2012-25A, Class E
5.74%, 01/15/2025 (f)(g) | | | 977,500 | |
| | 750,000 | | | Dryden XXVI Senior Loan Fund
Series 2013-26A, Class F
4.74%, 07/15/2025 (f)(g) | | | 633,750 | |
| | 11,010,000 | | | Eastland CLO, Ltd.
Series 2007-1A, Class C
1.74%, 05/01/2022 (f)(g) | | | 9,468,600 | |
| | | | | | | | |
| |
Principal Amount ($) | | Value ($) | |
| | 2,006,825 | | | Series 2007-1A, Class D
3.84%, 05/01/2022 (f)(g) | | | 1,720,853 | |
| | 1,000,000 | | | Eaton Vance CDO IX, Ltd.
Series 2007-9A, Class D
1.74%, 04/20/2019 (f)(g) | | | 947,500 | |
| | 2,000,000 | | | Fraser Sullivan CLO II, Ltd.
Series 2006-2A, Class D
1.75%, 12/20/2020 (f)(g) | | | 1,906,200 | |
| | 2,100,000 | | | Galaxy CLO, Ltd.
Series 2007-8A, Class D
1.54%, 04/25/2019 (f)(g) | | | 1,965,180 | |
| | 1,000,000 | | | Gannett Peak CLO, Ltd.
Series 2006-1A, Class C
1.76%, 10/27/2020 (f)(g) | | | 956,000 | |
| | 2,000,000 | | | Golden Knight CDO, Ltd.
Series 2007-2A, Class D
1.64%, 04/15/2019 (f)(g) | | | 1,859,200 | |
| | 847,661 | | | Goldman Sachs Asset Management CLO PLC
Series 2007-1A, Class E
5.24%, 08/01/2022 (f)(g) | | | 830,708 | |
| | 3,000,000 | | | Grayson CLO, Ltd.
Series 2006-1A, Class B
0.94%, 11/01/2021 (f)(g) | | | 2,667,000 | |
| | 2,000,000 | | | Series 2006-1A, Class C
1.79%, 11/01/2021 (f)(g) | | | 1,667,000 | |
| | 2,915,407 | | | Series 2006-1A,
Class D 3.84%, 11/01/2021 (f)(g) | | | 2,364,395 | |
| | 5,487,000 | | | Greenbriar CLO, Ltd.
Series 2007-1A, Class C
1.99%, 11/01/2021 (f)(g) | | | 4,984,391 | |
| | 1,000,000 | | | Series 2007-1A, Class D
2.99%, 11/01/2021 (f)(g) | | | 895,000 | |
| | 814,466 | | | Greywolf CLO, Ltd.
Series 2007-1A, Class E
4.19%, 02/18/2021 (f)(g) | | | 773,743 | |
| | 850,000 | | | Series 2013-1A, Class E
5.29%, 04/15/2025 (f)(g) | | | 754,035 | |
| | 1,000,000 | | | Gulf Stream - Sextant CLO, Ltd.
Series 2006-1A, Class D
1.84%, 08/21/2020 (f)(g) | | | 963,800 | |
| | 2,000,000 | | | HarbourView CLO
Series 6A, Class D
3.95%, 12/27/2019 (f)(g) | | | 1,870,000 | |
| | 2,127,119 | | | Hewett’s Island CDO, Ltd.
Series 2007-1RA, Class E
6.99%, 11/12/2019 (f)(g) | | | 2,105,847 | |
| | 2,000,000 | | | Hewett’s Island CLO V, Ltd.
Series 2006-5A, Class D
1.69%, 12/05/2018 (f)(g) | | | 1,927,000 | |
| | 762,824 | | | Highland Loan Funding V, Ltd.
Series 1A, Class B
1.51%, 08/01/2014 (f)(g) | | | 719,877 | |
| | 14,639,941 | | | Highland Park CDO, Ltd.
Series 2006-1A, Class A1
0.57%, 11/25/2051 (f)(g) | | | 12,938,780 | |
| | 538,553 | | | Series 2006-1X, Class A1
0.57%, 11/25/2051 (f)(g) | | | 475,973 | |
| | 7,375,000 | | | Series 2006-1A, Class A2
0.64%, 11/25/2051 (f)(g) | | | 2,281,825 | |
| | | | | | |
| 8 | | | | | | See accompanying Notes to Financial Statements. |
INVESTMENT PORTFOLIO (continued)
| | |
| As of December 31, 2013 | | NexPoint Credit Strategies Fund |
| | | | | | | | |
| |
Principal Amount ($) | | Value ($) | |
|
| Asset-Backed Securities (continued) | |
| | 3,000,000 | | | Hillmark Funding
Series 2006-1A, Class C
1.94%, 05/21/2021 (f)(g) | | | 2,822,100 | |
| | 2,142,361 | | | Series 2006-1A, Class D
3.84%, 05/21/2021 (f)(g) | | | 1,913,128 | |
| | 1,000,000 | | | Inwood Park CDO, Ltd.
Series 2006-1A, Class D
1.64%, 01/20/2021 (f)(g) | | | 937,300 | |
| | 500,000 | | | Katonah CLO, Ltd.
Series 2006-9A, Class B1L
1.64%, 01/25/2019 (f)(g) | | | 465,000 | |
| | 848,153 | | | Series 7A, Class D
2.09%, 11/15/2017 (f)(g) | | | 812,107 | |
| | 2,000,000 | | | Landmark VIII CDO, Ltd.
Series 2006-8A, Class E
3.84%, 10/19/2020 (f)(g) | | | 1,905,000 | |
| | 1,000,000 | | | Liberty CLO, Ltd.
Series 2005-1A, Class A3
0.74%, 11/01/2017 (f)(g) | | | 958,100 | |
| | 1,500,000 | | | Madison Park Funding I, Ltd.
Series 2007-5A, Class D
3.74%, 02/26/2021 (f)(g) | | | 1,391,250 | |
| | 1,000,000 | | | Marquette U.S./European CLO LLC
Series 2006-1A, Class D1
1.99%, 07/15/2020 (f)(g) | | | 930,700 | |
| | 835,038 | | | Navigator CDO, Ltd.
Series 2006-2A, Class D
3.75%, 09/20/2020 (f)(g) | | | 781,846 | |
| | 3,500,000 | | | Neuberger Berman CLO, Ltd.
Series 2012-13A, Class E
5.34%, 01/23/2024 (f)(g) | | | 3,248,000 | |
| | 5,000,000 | | | Newmark Capital Funding
Series 2013-1A, Cass A1
1.18%, 06/02/2025 (f)(g) | | | 4,850,000 | |
| | 3,500,000 | | | Newmark Capital Funding CLO, Ltd.
Series 2013-1A, Class E
4.89%, 06/02/2025 (f)(g) | | | 3,115,000 | |
| | 750,000 | | | NYLIM Flatiron CLO, Ltd.
Series 2006-1A, Class D
3.69%, 08/08/2020 (f)(g) | | | 697,500 | |
| | 1,000,000 | | | OHA Credit Partners, Ltd.
Series 2012-7A, Class D
4.24%, 11/20/2023 (f)(g) | | | 990,800 | |
| | 1,000,000 | | | Palmer Square CLO, Ltd.
Series 2013-2A, Class C
3.88%, 10/17/2025 (f)(g) | | | 952,000 | |
| | 1,300,000 | | | Series 2013-1A, Class C
4.29%, 05/15/2025 (f)(g) | | | 1,292,590 | |
| | 1,000,000 | | | Series 2013-2A, Class D
5.60%, 10/17/2025 (f)(g) | | | 947,200 | |
| | 386,129 | | | Pam Capital Funding LP
Series 1998-1A, Class B2
1.59%, 05/01/2014 (b)(f)(g) | | | 349,447 | |
| | 772,258 | | | Series 1998-1A, Class B1
7.47%, 05/01/2014 (b)(f) | | | 697,581 | |
| | 1,000,000 | | | PPM Grayhawk CLO, Ltd.
Series 2007-1A, Class C
1.65%, 04/18/2021 (f)(g) | | | 896,800 | |
| | | | | | | | |
| |
Principal Amount ($) | | Value ($) | |
| | 5,000,000 | | | Primus CLO II, Ltd.
Series 2007-2A, Class D
2.64%, 07/15/2021 (f)(g) | | | 4,730,500 | |
| | 4,000,000 | | | Rampart CLO, Ltd.
Series 2006-1A, Class C
1.70%, 04/18/2021 (f)(g) | | | 3,798,000 | |
| | 3,972,238 | | | Red River CLO, Ltd.
Series 1A, Class E
3.99%, 07/27/2018 (f)(g) | | | 3,506,294 | |
| | 6,000,000 | | | Rockwall CDO II, Ltd.
Series 2007-1A, Class A3L
1.24%, 08/01/2024 (f)(g) | | | 4,680,000 | |
| | 2,752,426 | | | Series 2007-1A, Class B2L
4.49%, 08/01/2024 (f)(g) | | | 2,312,038 | |
| | 1,955,796 | | | San Gabriel CLO, Ltd.
Series 2007-1A, Class B2L
4.49%, 09/10/2021 (f)(g) | | | 1,862,895 | |
| | 500,000 | | | Stanfield Azure CLO, Ltd.
Series 2006-1A, Class B1L
1.94%, 05/27/2020 (f)(g) | | | 483,050 | |
| | 1,000,000 | | | Stanfield Bristol CLO, Ltd.
Series 2005-1A, Class C
2.29%, 10/15/2019 (f)(g) | | | 972,400 | |
| | 1,070,000 | | | Stanfield Daytona CLO, Ltd.
Series 2007-1A, Class A3L
0.91%, 04/27/2021 (f)(g) | | | 952,300 | |
| | 1,200,000 | | | Series 2007-1A, Class B1L
1.59%, 04/27/2021 (f)(g) | | | 1,110,960 | |
| | 4,000,000 | | | Stanfield McLaren CLO Delaware Corp.
Series 2007-1A, Class B1L
2.64%, 02/27/2021 (f)(g) | | | 3,673,600 | |
| | 10,300,000 | | | Stratford CLO, Ltd.
Series 2007-1A, Class C 2.24%, 11/01/2021 (f)(g) | | | 9,398,750 | |
| | 1,397,789 | | | Series 2007-1A, Class E 4.24%, 11/01/2021 (f)(g) | | | 1,235,366 | |
| | 1,500,000 | | | Valhalla CLO, Ltd.
Series 2004-1A, Class EIN 0.00%, 08/01/2016 (f) | | | 435,000 | |
| | 2,000,000 | | | Venture IX CDO, Ltd.
Series 2007-9A, Class D 4.39%, 10/12/2021 (f)(g) | | | 1,960,000 | |
| | 1,000,000 | | | Westbrook CLO, Ltd.
Series 2006-1A, Class D 1.95%, 12/20/2020 (f)(g) | | | 952,300 | |
| | | | | | | | |
| | | | Total Asset-Backed Securities
(Cost $145,609,751) | | | 159,977,786 | |
| | | | | | | | |
|
| Corporate Bonds & Notes - 14.4% | |
|
| | CHEMICALS - 2.2% | |
| | 2,025,000 | | | Momentive Performance Materials, Inc.
9.00%, 01/15/2021 (h) | | | 1,787,063 | |
| | 3,000,000 | | | 9.50%, 01/15/2021 | | | 3,513,771 | |
| | 10,000,000 | | | TPC Group, Inc.
8.75%, 12/15/2020 (f) | | | 10,675,000 | |
| | | | | | | | |
| | | | | | | 15,975,834 | |
| | | | | | | | |
| | | | | | |
| See accompanying Notes to Financial Statements. | | | | | | 9 |
INVESTMENT PORTFOLIO (continued)
| | |
| As of December 31, 2013 | | NexPoint Credit Strategies Fund |
| | | | | | | | |
| |
Principal Amount ($) | | Value ($) | |
|
| Corporate Bonds & Notes (continued) | |
|
| | ENERGY - 1.3% | |
| | 2,785,000 | | | Calumet Specialty Products Partners LP/Calumet Finance Corp.
9.38%, 05/01/2019 (h) | | | 3,105,275 | |
| | 300,000 | | | 9.63%, 08/01/2020 (i) | | | 338,250 | |
| | 1,000,000 | | | Penn Virginia Corp.
7.25%, 04/15/2019 (h) | | | 1,030,000 | |
| | 5,000,000 | | | Venoco, Inc.
8.88%, 02/15/2019 (h) | | | 4,950,000 | |
| | | | | | | | |
| | | | | | | 9,423,525 | |
| | | | | | | | |
|
| | FOOD & DRUG - 0.1% | |
| | 1,000,000 | | | SUPERVALU, Inc.
6.75%, 06/01/2021 | | | 992,500 | |
| | | | | | | | |
|
| | GAMING & LEISURE - 0.6% | |
| | 5,000,000 | | | Caesars Entertainment Operating Co., Inc.
10.75%, 02/01/2016 | | | 4,075,000 | |
| | | | | | | | |
|
| | HOUSING - 0.2% | |
| | 1,125,000 | | | Building Materials Holding Corp.
9.00%, 09/15/2018 (f)(h) | | | 1,217,812 | |
| | | | | | | | |
|
| | HEALTHCARE - 0.5% | |
| | 10,320,366 | | | Azithromycin Royalty Sub LLC
16.00%, 05/15/2019 (b) | | | 1,379,833 | |
| | 93,180,348 | | | Celtic Pharma Phinco BV, PIK (b)(c) | | | 2,367,703 | |
| | | | | | | | |
| | | | | | | 3,747,536 | |
| | | | | | | | |
|
| | INFORMATION TECHNOLOGY - 4.6% | |
| | 10,500,000 | | | Avaya, Inc.
7.00%, 04/01/2019 (f)(h) | | | 10,342,500 | |
| | 23,971,250 | | | 10.50%, 03/01/2021 (f)(h) | | | 23,012,400 | |
| | | | | | | | |
| | | | | | | 33,354,900 | |
| | | | | | | | |
|
| | MEDIA & TELECOMMUNICATIONS - 0.4% | |
| | 3,500,000 | | | DISH DBS Corp. 5.00%, 03/15/2023 (h) | | | 3,281,250 | |
| | | | | | | | |
|
| | RETAIL - 0.8% | |
| | 7,000,000 | | | JC Penney Corp., Inc. 5.65%, 06/01/2020 (h) | | | 5,547,500 | |
| | | | | | | | |
|
| | SERVICE - 1.6% | |
| | 4,500,000 | | | Sabre, Inc.
8.50%, 05/15/2019 (f) | | | 5,011,875 | |
| | 5,990,773 | | | Travelport LLC, PIK (f) | | | 6,380,173 | |
| | | | | | | | |
| | | | | | | 11,392,048 | |
| | | | | | | | |
|
| | TELECOMMUNICATIONS - 0.4% | |
| | 3,000,000 | | | MetroPCS Wireless, Inc. 6.63%, 11/15/2020 (h) | | | 3,191,250 | |
| | | | | | | | |
|
| | TRANSPORTATION - 0.1% | |
| | 3,750,000 | | | DPH Holdings Corp. (c) | | | 121,875 | |
| | 3,933,000 | | | DPH Holdings Corp. (c) | | | 127,823 | |
| | 8,334,000 | | | DPH Holdings Corp. (c) | | | 270,855 | |
| | | | | | | | |
| | | | | | | 520,553 | |
| | | | | | | | |
| | | | | | | | |
| |
Principal Amount ($) | | Value ($) | |
|
| | UTILITY - 1.6% | |
| | 5,000,000 | | | Edison Mission Energy (c) | | | 3,812,500 | |
| | 5,000,000 | | | Texas Competitive Electric Holdings Co. LLC
11.50%, 10/01/2020 (f) | | | 3,700,000 | |
| | 14,000,000 | | | 15.00%, 04/01/2021 (h) | | | 3,920,000 | |
| | | | | | | | |
| | | | | | | 11,432,500 | |
| | | | | | | | |
| | | | Total Corporate Bonds & Notes
(Cost $170,858,250) | | | 104,152,208 | |
| | | | | | | | |
| |
Principal Amount | | | |
|
| Foreign Corporate Bonds & Notes - 4.7% | |
|
| | CANADA - 1.4% | |
| | USD | | | | | | | |
| | 10,069,000 | | | Tervita Corp.
8.00%, 11/15/2018 (f) | | | 10,446,587 | |
| | | | | | | | |
|
| | FINLAND - 3.3% | |
| | USD | | | | | | | |
| | 23,000,000 | | | Nokia OYJ
5.38%, 05/15/2019 (h) | | | 23,977,500 | |
| | | | | | | | |
| | | | Total Foreign Corporate Bonds & Notes
(Cost $31,084,123) | | | 34,424,087 | |
| | | | | | | | |
| |
Shares | | | |
|
| Common Stocks - 54.4% | |
|
| | BROADCASTING - 2.2% | |
| | 2,010,616 | | | Communications Corp. of
America (b)(k)(j) | | | 16,084,928 | |
| | | | | | | | |
|
| | CONSUMER DISCRETIONARY - 10.4% | |
| | 73,550 | | | Apollo Group, Inc., Class A (k)(l) | | | 2,009,386 | |
| | 11,050 | | | Big Lots, Inc. (k)(l) | | | 356,804 | |
| | 2,050 | | | Coca-Cola Enterprises, Inc. (h) | | | 90,467 | |
| | 52,035 | | | DeVry, Inc. | | | 1,847,242 | |
| | 5,050 | | | Family Dollar Stores, Inc. (h)(l) | | | 328,099 | |
| | 4,600 | | | GameStop Corp., Class A (h) | | | 226,596 | |
| | 6,425 | | | Garmin, Ltd. (h) | | | 296,964 | |
| | 1,512,721 | | | K12, Inc. (k)(l) | | | 32,901,682 | |
| | 1,103,100 | | | Sony Corp. ADR (h)(l) | | | 19,072,599 | |
| | 1,167,650 | | | Staples, Inc. (l) | | | 18,553,958 | |
| | | | | | | | |
| | | | | | | 75,683,797 | |
| | | | | | | | |
|
| | CONSUMER STAPLES - 0.1% | |
| | 9,400 | | | Colgate-Palmolive Co. (l) | | | 612,974 | |
| | 2,650 | | | Dr. Pepper Snapple Group, Inc. (l) | | | 129,108 | |
| | | | | | | | |
| | | | | | | 742,082 | |
| | | | | | | | |
|
| | ENERGY - 0.4% | |
| | 14,910 | | | Hess Corp. (h) | | | 1,237,530 | |
| | 204,000 | | | Nordic American Tankers, Ltd. (m) | | | 1,978,800 | |
| | | | | | | | |
| | | | | | | 3,216,330 | |
| | | | | | | | |
| | | | | | |
| 10 | | | | | | See accompanying Notes to Financial Statements. |
INVESTMENT PORTFOLIO (continued)
| | |
| As of December 31, 2013 | | NexPoint Credit Strategies Fund |
| | | | | | | | |
| |
Shares | | Value ($) | |
|
| Common Stocks (continued) | |
|
| | FINANCIAL - 0.7% | |
| | 1,000,000 | | | Adelphia Recovery Trust (k) | | | 2,000 | |
| | 46,601 | | | American Banknote Corp. (b)(k) | | | 342,517 | |
| | 2,500 | | | Automatic Data Processing, Inc. (l) | | | 202,025 | |
| | 3,900 | | | Chubb Corp. (The) (l) | | | 376,857 | |
| | 571,712 | | | SWS Group, Inc. (k)(l) | | | 3,476,009 | |
| | 12,100 | | | Torchmark Corp. (l) | | | 945,615 | |
| | | | | | | | |
| | | | | | | 5,345,023 | |
| | | | | | | | |
|
| | GAMING & LEISURE - 0.0% | |
| | 13 | | | LLV Holdco LLC - Litigation Trust Units (b)(k)(j) | | | — | |
| | 26,712 | | | LLV Holdco LLC - Series A, Membership Interest (b)(k)(j) | | | — | |
| | 144 | | | LLV Holdco LLC - Series B, Membership Interest (b)(k)(j) | | | — | |
| | | | | | | | |
| | | | | | | — | |
| | | | | | | | |
|
| | HEALTHCARE - 2.2% | |
| | 13,639 | | | Akorn, Inc. (h)(k) | | | 335,929 | |
| | 22,600 | | | Edwards Lifesciences Corp. (k)(l) | | | 1,486,176 | |
| | 24,000,000 | | | Genesys Ventures IA, LP (b)(k) | | | 13,992,000 | |
| | 8,685 | | | Myriad Genetics, Inc. (k) | | | 182,211 | |
| | | | | | | | |
| | | | | | | 15,996,316 | |
| | | | | | | | |
|
| | HOUSING - 0.2% | |
| | 368,150 | | | CCD Equity Partners LLC (b)(k) | | | 1,126,539 | |
| | | | | | | | |
|
| | INFORMATION TECHNOLOGY - 5.7% | |
| | 21,579 | | | CommVault Systems, Inc. (k)(l) | | | 1,615,836 | |
| | 1,098,398 | | | Compuware Corp. (l) | | | 12,313,042 | |
| | 16,135 | | | Corning, Inc. (l) | | | 287,526 | |
| | 1,360,200 | | | Fortinet, Inc. (k)(l) | | | 26,020,626 | |
| | 1 | | | Magnachip Semiconductor Corp. (k) | | | 19 | |
| | 15,050 | | | Microsoft Corp. (l) | | | 563,321 | |
| | 14,700 | | | NetApp, Inc. (l) | | | 604,758 | |
| | | | | | | | |
| | | | | | | 41,405,128 | |
| | | | | | | | |
|
| | MEDIA & TELECOMMUNICATIONS - 18.4% | |
| | 6,480 | | | Endurance Business Media, Inc., Class A (b)(k)(j) | | | — | |
| | 18,000 | | | Gray Television, Inc., Class A (k) | | | 232,380 | |
| | 4,938,971 | | | Media General, Inc. (k)(j) | | | 111,620,744 | |
| | 308,875 | | | Metro-Goldwyn-Mayer, Inc., Class A (k) | | | 20,771,844 | |
| | 5,160 | | | Time Warner, Inc. (l) | | | 359,755 | |
| | | | | | | | |
| | | | | | | 132,984,723 | |
| | | | | | | | |
|
| | METALS & MINERALS - 0.4% | |
| | 69,900 | | | Allegheny Technologies, Inc. (l) | | | 2,490,537 | |
| | 3,200 | | | Reliance Steel & Aluminum Co. (l) | | | 242,688 | |
| | | | | | | | |
| | | | | | | 2,733,225 | |
| | | | | | | | |
|
| | REAL ESTATE INVESTMENT TRUST - 12.3% | |
| | 631,160 | | | Corrections Corp. of America, REIT (l) | | | 20,241,301 | |
| | 2,845,299 | | | Freedom REIT (b)(j) | | | 42,964,014 | |
| | 2,630,627 | | | Spirit Realty Capital, Inc., REIT (l) | | | 25,859,064 | |
| | | | | | | | |
| | | | | | | 89,064,379 | |
| | | | | | | | |
| | | | | | | | |
| |
Shares | | Value ($) | |
|
| | TELECOMMUNICATIONS - 0.1% | |
| | 45,168 | | | Fairpoint Communications, Inc. (k) | | | 510,850 | |
| | | | | | | | |
|
| | TRANSPORTATION - 0.0% | |
| | 1 | | | American Airlines Group, Inc. (k) | | | 13 | |
| | | | | | | | |
|
| | UTILITY - 0.7% | |
| | 1,272,973 | | | Entegra TC LLC (k) | | | 127,297 | |
| | 172,263 | | | NRG Energy, Inc. | | | 4,947,394 | |
| | | | | | | | |
| | | | | | | 5,074,691 | |
| | | | | | | | |
|
| | WIRELESS COMMUNICATIONS - 0.6% | |
| | 2,260,529 | | | Pendrell Corp. (k) | | | 4,543,663 | |
| | | | | | | | |
| | | | Total Common Stocks
(Cost $381,079,961) | | | 394,511,687 | |
| | | | | | | | |
|
| Preferred Stocks (k) - 10.9% | |
|
| | FINANCIAL - 10.9% | |
| | 14,500 | | | Aberdeen Loan Funding, Ltd. (f) | | | 6,742,500 | |
| | 1,200 | | | Brentwood CLO, Ltd. (f) | | | 750,000 | |
| | 3,800 | | | Brentwood CLO, Ltd. (f) | | | 2,375,000 | |
| | 25,250 | | | Eastland CLO, Ltd. (f) | | | 15,564,100 | |
| | 5,000 | | | Eastland Investors Corp. (f) | | | 3,082,000 | |
| | 33,500 | | | Grayson CLO, Ltd., Series II (f) | | | 19,095,001 | |
| | 11,000 | | | Greenbriar CLO, Ltd. (f) | | | 8,030,000 | |
| | 8,500 | | | Red River CLO, Ltd., Series PS-2 (f) | | | 4,800,460 | |
| | 10,500 | | | Rockwall CDO, Ltd. (f) | | | 5,985,000 | |
| | 6,000 | | | Southfork CLO, Ltd. (f) | | | 3,000,000 | |
| | 13,000 | | | Stratford CLO, Ltd. (f) | | | 9,418,370 | |
| | | | | | | | |
|
| | REAL ESTATE - 0.0% | |
| | 50,675 | | | Allenby (b) | | | — | |
| | 660,498 | | | Claymore (b) | | | — | |
| | | | | | | | |
| | | | | | | 78,842,431 | |
| | | | | | | | |
| | | | Total Preferred Stocks
(Cost $81,610,247) | | | 78,842,431 | |
| | | | | | | | |
|
| Exchange-Traded Funds (k) - 7.2% | |
| | 23,400 | | | Direxion Daily Gold Miners Bull 3x Shares, ETF (l) | | | 641,394 | |
| | 27,200 | | | ProShares Ultra Gold, ETF | | | 1,122,272 | |
| | 2,218,215 | | | ProShares Ultra Silver, ETF | | | 34,914,704 | |
| | 1,294,500 | | | ProShares UltraShort Russell 2000, ETF (h)(l) | | | 15,572,835 | |
| | | | | | | | |
| | | | Total Exchange-Traded Funds
(Cost $87,909,767) | | | 52,251,205 | |
| | | | | | | | |
| |
Units | | | |
|
| Rights (k) - 14.7% | |
|
| | TRANSPORTATION - 14.7% | |
| | 4,104,743 | | | AAL, expires 04/11/14 | | | 106,846,449 | |
| | | | | | | | |
| | | | Total Rights
(Cost $24,303,039) | | | 106,846,449 | |
| | | | | | | | |
|
| Warrants (b)(k) - 0.0% | |
|
| | GAMING & LEISURE - 0.0% | |
| | 602 | | | LLV Holdco LLC - Series C, Membership Interest, expires 07/15/15 | | | — | |
| | | | | | |
| See accompanying Notes to Financial Statements. | | | | | | 11 |
INVESTMENT PORTFOLIO (continued)
| | |
| As of December 31, 2013 | | NexPoint Credit Strategies Fund |
| | | | | | | | |
| |
Units | | Value ($) | |
|
| Warrants (continued) | |
|
| | GAMING & LEISURE (continued) | |
| | 828 | | | LLV Holdco LLC - Series D, Membership Interest, expires 07/15/15 | | | — | |
| | 925 | | | LLV Holdco LLC - Series E, Membership Interest, expires 07/15/15 | | | — | |
| | 1,041 | | | LLV Holdco LLC - Series F, Membership Interest, expires 07/15/15 | | | — | |
| | 1,179 | | | LLV Holdco LLC - Series G, Membership Interest, expires 07/15/15 | | | — | |
| | | | | | | | |
| | | | Total Gaming/Leisure
(Cost $—) | | | — | |
| | | | | | | | |
| | | | Total Warrants (Cost $—) | | | — | |
| | | | | | | | |
| |
Shares | | | |
|
| Investment Companies (n) - 0.3% | |
| | 1,919,814 | | | State Street Navigator Prime Securities Lending Portfolio | | | 1,919,814 | |
| | | | | | | | |
| | | | Total Investment Companies
(Cost $1,919,814) | | | 1,919,814 | |
| | | | | | | | |
| Total Investments - 147.9% | | | 1,071,480,779 | |
| | | | | | | | |
| | | | (Cost $1,095,636,624) (o) | | | | |
| |
| Securities Sold Short (p) - (12.8)% | | | | |
| |
| Common Stocks - (9.7)% | | | | |
| |
| | INFORMATION TECHNOLOGY - (7.8)% | | | | |
| | 1,162,850 | | | Oracle Corp. | | | (44,490,641 | ) |
| | 268,200 | | | Teradata Corp. (q) | | | (12,200,418 | ) |
| | | | | | | | |
| | | | | | | (56,691,059 | ) |
| | | | | | | | |
|
| | HEALTHCARE - (0.3)% | |
| | 16,000 | | | Alexion Pharmaceuticals, Inc. (q) | | | (2,128,960 | ) |
| | | | | | | | |
|
| | ENERGY - (1.6)% | |
| | 434,800 | | | Chesapeake Energy Corp. | | | (11,800,472 | ) |
| | | | | | | | |
| | | | Total Common Stocks
(Proceeds $62,268,984) | | | (70,620,491 | ) |
| | | | | | | | |
|
| Exchange-Traded Funds (q) - (3.1)% | |
| | 152,100 | | | iShares Russell 2000 Index Fund, ETF | | | (17,538,651 | ) |
| | 141,050 | | | ProShares Ultra DJ-UBS Crude Oil, ETF | | | (4,544,631 | ) |
| | | | | | | | |
| | | | Total Exchange-Traded Funds
(Proceeds $19,233,745) | | | (22,083,282 | ) |
| | | | | | | | |
| | | | Total Securities Sold Short
(Proceeds $81,502,729) | | | (92,703,773 | ) |
| | | | | | | | |
| Other Assets & Liabilities, Net – (35.1)% | | | (254,292,010 | ) |
| | | | | | | | |
| Net Assets – 100.0% | | | 724,484,996 | |
| | | | | | | | |
| (a) | Senior loans (also called bank loans, leveraged loans, or floating rate loans) in which the Fund invests generally pay interest at rates which are periodically determined by reference to a base lending rate plus a spread (unless otherwise identified, all senior loans carry a variable rate of interest). These base lending rates are generally (i) the Prime Rate offered by one or more major United States banks, (ii) the lending rate offered by one or more European banks such as the London Interbank Offered Rate (“LIBOR”) or (iii) the Certificate of Deposit rate. Rate shown represents the weighted average rate at December 31, 2013. Senior loans, while exempt from registration under the Securities Act of 1933 (the “1933 Act”), contain certain restrictions on resale and cannot be sold publicly. Senior secured floating rate loans often require prepayments from excess cash flow or permit the borrower to repay at its election. The degree to which borrowers repay, whether as a contractual requirement or at their election, cannot be predicted with accuracy. As a result, the actual remaining maturity may be substantially less than the stated maturity shown. |
| (b) | Represents fair value as determined by the Fund’s Board of Trustees (the “Board”), or its designee in good faith, pursuant to the policies and procedures approved by the Board. Securities with a total aggregate value of $119,107,851, or 16.4% of net assets, were fair valued under the Fund’s valuation procedures as of December 31, 2013. |
| (c) | The issuer is, or is in danger of being, in default of its payment obligation. Income is not being accrued. |
| (d) | All or a portion of this position has not settled. Full contract rates do not take effect until settlement date. |
| (e) | Fixed rate senior loan. |
| (f) | Securities exempt from registration under Rule 144A of the 1933 Act. These securities may only be resold in transactions exempt from registration to qualified institutional buyers. At December 31, 2013, these securities amounted to $309,606,563, or 42.7% of net assets. |
| (g) | Variable or floating rate security. The interest rate shown reflects the rate in effect December 31, 2013. |
| (h) | All or part of the security is pledged as collateral for the Committed Facility Agreement with BNPP PB, Inc. The market value of the securities pledged as collateral was $257,949,624. See Note 6. |
| (i) | Step coupon bond. The interest rate shown reflects the rate in effect December 31, 2013 and will reset at a future date. |
| (j) | Affiliated issuer. Assets with a total aggregate market value of $170,669,686, or 23.6% of net assets, were affiliated with the Fund as of December 31, 2013. |
| (k) | Non-income producing security. |
| (l) | All or part of this security is pledged as collateral for short sales. The market value of the securities pledged as collateral was $105,001,041. |
| (m) | Securities (or a portion of securities) on loan. As of December 31, 2013, the market value of securities loaned was $1,909,969. The loaned securities were secured with cash collateral of $1,919,814. Collateral is calculated based on prior day’s prices. See Note 4. |
| (n) | Represents investments of cash collateral received in connection with securities lending. |
| (o) | Cost for U.S. federal income tax purposes is $1,104,139,219. |
| (p) | As of December 31, 2013, $75,438,228 in cash was segregated or on deposit with the brokers to cover investments sold short and is included in “Other Assets & Liabilities, Net.” |
| (q) | No dividend payable on security sold short. |
Currency Abbreviations:
| | |
| EUR | | Euro Currency |
| GBP | | British Pound |
| | | | | | |
| 12 | | | | | | See accompanying Notes to Financial Statements. |
INVESTMENT PORTFOLIO (continued)
| | |
| As of December 31, 2013 | | NexPoint Credit Strategies Fund |
| | |
Glossary: |
| ADR | | American Depositary Receipt |
| CDO | | Collateralized Debt Obligation |
| CLO | | Collateralized Loan Obligation |
| ETF | | Exchange-Traded Fund |
| PIK | | Payment-in-Kind |
| PLC | | Public Limited Company |
| PNC | | PNC Capital Markets LLC |
| REIT | | Real Estate Investment Trust |
Forward foreign currency exchange contracts outstanding as of December 31, 2013 were as follows:
| | | | | | | | | | | | | | | | | | | | |
Contracts
to Buy or
to Sell | | Currency | | | Counterparty | | | Principal
Amount
Covered
by
Contracts | | | Expiration | | | Unrealized
Appreciation/
(Depreciation) | |
Sell | | | EUR | | | | PNC | | | € | 4,615,000 | | | | 01/31/2014 | | | $ | (240,356 | ) |
| | | | | | | | | | | | | | | | | | | | |
| | | | |
Foreign Denominated or Domiciled Senior Loans
and Foreign Corporate Bonds & Notes
Industry Concentration Table:
(% of Net Assets) | |
Telecommunications | | | 3.3 | % |
Service | | | 1.5 | % |
Chemicals | | | 0.0 | %(1) |
Retail | | | 0.0 | %(1) |
| | | | |
Total | | | 4.8 | % |
| | | | |
| | | | | | |
| See accompanying Notes to Financial Statements. | | | | | | 13 |
STATEMENTS OF ASSETS AND LIABILITIES
| | |
| As of December 31, 2013 | | NexPoint Credit Strategies Fund |
| | | | |
| | | ($) | |
Assets: | | | | |
Unaffiliated issuers, at value (cost $928,500,863)(a) | | | 900,811,093 | |
Affiliated issuers, at value (cost $167,135,761) (Note 12) | | $ | 170,669,686 | |
| | | | |
Total investments, at value (cost $1,095,636,624) | | | 1,071,480,779 | |
Foreign currency (cost $2,876,696) | | | 2,886,963 | |
Restricted Cash — Securities sold short (Note 2) | | | 75,438,228 | |
Receivable for: | | | | |
Investments sold | | | 1,455,263 | |
Dividends & interest receivable | | | 9,394,623 | |
Other assets | | | 86,215 | |
| | | | |
Total assets | | | 1,160,742,071 | |
| | | | |
| |
Liabilities: | | | | |
Due to Custodian | | | 15,871,110 | |
Notes payable (Notes 6 and 7) | | | 318,500,000 | |
Securities sold short, at value (Proceeds $81,502,729) (Notes 2 and 10) | | | 92,703,773 | |
Net unrealized depreciation on forward foreign currency exchange contracts | | | 240,356 | |
Payable upon receipt of securities loaned (Note 4) | | | 1,919,814 | |
| |
Payables for: | | | | |
Investments purchased | | | 5,107,792 | |
Investment advisory fee payable (Note 9) | | | 825,149 | |
Administration fee (Note 9) | | | 158,433 | |
Audit and tax payable | | | 191,523 | |
Trustees’ fees (Note 9) | | | 19,112 | |
Interest expense (Notes 6 and 7) | | | 294,795 | |
Accrued expenses and other liabilities | | | 425,218 | |
| | | | |
Total Liabilities | | | 436,257,075 | |
| | | | |
Net Assets Applicable To Common Shares | | | 724,484,996 | |
| | | | |
| |
Composition of Net Assets: | | | | |
Par value of common shares (Note 1) | | | 63,881 | |
Paid-in capital in excess of par value of common shares | | | 1,139,462,715 | |
Undistributed net investment income | | | 6,414,491 | |
Accumulated net realized gain/(loss) from investments, securities sold short, written options and foreign currency transactions | | | (385,866,887 | ) |
Net unrealized appreciation/(depreciation) on investments, securities sold short, written options, forward foreign currency exchange contracts and translation of assets and liabilities denominated in foreign currency | | | (35,589,204 | ) |
| | | | |
Net Assets Applicable to Common Shares | | | 724,484,996 | |
| | | | |
| |
Common Shares | | | | |
Net assets | | | 724,484,996 | |
Shares outstanding (unlimited authorization) | | | 63,881,473 | |
Net asset value per share (Net assets/shares outstanding) | | | 11.34 | |
| (a) | Includes market value of securities on loan of $1,909,969. |
| | | | | | |
| 14 | | | | | | See accompanying Notes to Financial Statements. |
STATEMENT OF OPERATIONS
| | |
| For the Year Ended December 31, 2013 | | NexPoint Credit Strategies Fund |
| | | | |
| | | ($) | |
Investment Income: | | | | |
Interest from unaffiliated issuers | | | 37,717,499 | |
Interest from affiliated issuers (Note 12) | | | 681,706 | |
Dividends (Net of withholdings tax of $8,044) | | | 16,756,395 | |
Securities lending income (Note 4) | | | 328,733 | |
Other income | | | 33,457 | |
| | | | |
Total investment income | | | 55,517,790 | |
| | | | |
| |
Expenses: | | | | |
Investment advisory fees (Note 9) | | | 8,050,253 | |
Administration fees (Note 9) | | | 1,603,454 | |
Accounting service fees | | | 244,269 | |
Transfer agent fee | | | 87,566 | |
Trustees’ fees (Note 9) | | | 94,066 | |
Custodian fees | | | 6,956 | |
Reports to shareholders | | | 153,961 | |
Audit fees | | | 244,313 | |
Legal fees | | | 1,671,942 | |
Insurance expense | | | 50,561 | |
Interest expense (Notes 6 and 7) | | | 3,412,769 | |
Dividends and expenses on securities sold short (Note 2) | | | 266,978 | |
Other expenses | | | 74,629 | |
| | | | |
Total operating expenses | | | 15,961,717 | |
| | | | |
Net investment income | | | 39,556,073 | |
| | | | |
| |
Net Realized and Unrealized Gain/(Loss) on Investments: | | | | |
Net realized gain/(loss) on investments from unaffiliated issuers | | | 73,960,991 | |
Net realized gain/(loss) on securities sold short (Note 2) | | | 555,400 | |
Net realized gain/(loss) on written options (Note 3) | | | 3,995,994 | |
Net realized gain/(loss) on forward foreign currency exchange contracts (Note 3) | | | (440,040 | ) |
Net realized gain/(loss) on foreign currency transactions | | | 32,034 | |
Net change in unrealized appreciation/(depreciation) on investments | | | 177,124,637 | |
Net change in unrealized appreciation/(depreciation) on securities sold short (Note 2) | | | (11,750,784 | ) |
Net change in unrealized appreciation/(depreciation) on written options (Note 3) | | | 107,942 | |
Net change in unrealized appreciation/(depreciation) on forward foreign currency exchange contracts (Note 3) | | | 174,955 | |
Net change in unrealized appreciation/(depreciation) on translation of assets and liabilities denominated in foreign currency | | | (24,663 | ) |
| | | | |
Net realized and unrealized gain/(loss) on investments | | | 243,736,466 | |
| | | | |
Net increase in net assets from operations | | | 283,292,539 | |
| | | | |
| | | | | | |
| See accompanying Notes to Financial Statements. | | | | | | 15 |
STATEMENTS OF CHANGES IN NET ASSETS
| | |
| | NexPoint Credit Strategies Fund |
| | | | | | | | |
| | | Year Ended
December 31, 2013
($) | | | Year Ended
December 31, 2012
($) | |
From Operations | | | | | | | | |
Net investment income | | | 39,556,073 | | | | 27,367,939 | |
Net realized gain/(loss) on investments, securities sold short, written options, forward foreign currency contracts and foreign currency transactions | | | 78,104,379 | | | | (8,429,212 | ) |
Net unrealized appreciation/(depreciation) on investments, securities sold short, written options, forward foreign currency contracts and translation of assets and liabilities denominated in foreign currency | | | 165,632,087 | | | | 41,426,537 | |
| | | | | | | | |
Net change in net assets from operations | | | 283,292,539 | | | | 60,365,264 | |
| | | | | | | | |
| | |
Distributions Declared to Common Shareholders | | | | | | | | |
From net investment income | | | (35,070,929 | ) | | | (27,149,626 | ) |
| | | | | | | | |
Total distributions declared to common shareholders | | | (35,070,929 | ) | | | (27,149,626 | ) |
| | | | | | | | |
Total increase in net assets from common shares | | | 248,221,610 | | | | 33,215,638 | |
| | | | | | | | |
| | |
Net Assets Applicable to Common Shares | | | | | | | | |
Beginning of period | | | 476,263,386 | | | | 443,047,748 | |
| | | | | | | | |
End of period (including undistributed net investment income of $6,414,491 and $4,039,033, respectively) | | | 724,484,996 | | | | 476,263,386 | |
| | | | | | | | |
| | |
Change in Common Shares | | | | | | | | |
Net increase (decrease) in common shares | | | — | | | | — | |
| | | | | | | | |
| | | | | | |
| 16 | | | | | | See accompanying Notes to Financial Statements. |
STATEMENT OF CASH FLOWS
| | |
| For the Year Ended December 31, 2013 | | NexPoint Credit Strategies Fund |
| | | | |
| | | ($) | |
Cash Flows Used in Operating Activities | | | | |
Net increase from operations | | | 283,292,539 | |
| |
Adjustments to Reconcile Net Investment Income to Net Cash Used in Operating Activities | | | | |
Purchases of investment securities from unaffiliated issuers | | | (884,442,859 | ) |
Proceeds from disposition of investment securities from unaffiliated issuers | | | 804,861,036 | |
Purchases of investment securities from affiliated issuers | | | (42,679,484 | ) |
Proceeds from disposition of investment securities from affiliated issuers | | | 4,558,190 | |
Purchases of purchased options | | | (2,227,204 | ) |
Proceeds from the disposition of purchased options | | | 220,791 | |
Purchases of securities sold short | | | (24,981,852 | ) |
Proceeds from disposition of securities sold short | | | 101,639,313 | |
Net premium received on written options | | | 1,044,317 | |
Paydowns at cost | | | 8,209,656 | |
Net accretion of discount | | | (7,563,441 | ) |
Net realized gain on investments from unaffiliated issuers | | | (73,960,991 | ) |
Net realized gain on securities sold short, written options contracts, and foreign currency related transactions | | | (4,143,388 | ) |
Net change in unrealized appreciation on investments, securities sold short, written options contracts and foreign currency related translations | | | (165,632,087 | ) |
Net change in short-term investments | | | (1,919,814 | ) |
Increase in restricted cash | | | (73,783,337 | ) |
Decrease in cash held with prime broker | | | 3,464,191 | |
Decrease in receivable for investments sold | | | 35,588,648 | |
Increase in dividends and interest receivable | | | (4,992,569 | ) |
Increase in receivable for other assets | | | (71,798 | ) |
Decrease in payable for investments purchased | | | (8,060,762 | ) |
Decrease in payable for distributions | | | (77,628 | ) |
Increase in payable for audit and tax | | | 191,523 | |
Increase in payables to related parties | | | 258,410 | |
Increase in payable upon receipt of securities loaned | | | 1,899,954 | |
Decrease in payable to prime broker | | | (21,791,386 | ) |
Decrease in payable for interest expense | | | (451,863 | ) |
Decrease in dividends payable on securities sold short | | | (3,888 | ) |
Increase in accrued expenses and other liabilities | | | 66,122 | |
| | | | |
Net cash flow used in operating activities | | | (71,489,661 | ) |
| |
Cash Flows Provided by Financing Activities | | | | |
Increase in notes payable | | | 93,500,000 | |
Distributions paid in cash | | | (35,070,929 | ) |
| | | | |
Net cash flow provided by financing activities | | | 58,429,071 | |
Effect of exchange rate changes on cash | | | 7,028 | |
| | | | |
Net decrease in cash | | | (13,053,562 | ) |
| |
Cash & Foreign Currency/Due to Custodian | | | | |
Beginning of the year | | | 69,415 | |
| | | | |
End of the year | | | (12,984,147 | ) |
| | | | |
| |
Supplemental disclosure of cash flow information: | | | | |
Cash paid during the year for interest | | | 3,412,769 | |
| | | | |
| | | | | | |
| See accompanying Notes to Financial Statements. | | | | | | 17 |
FINANCIAL HIGHLIGHTS
| | |
| | NexPoint Credit Strategies Fund |
Selected data for a share outstanding throughout each period is as follows:
| | | | | | | | | | | | | | | | | | | | |
| | | For the Years Ended December 31, | |
| Common Shares Per Share Operating Performance: | | 2013 | | | 2012 | | | 2011 | | | 2010 | | | 2009 | |
| | | | | |
Net Asset Value, Beginning of Period | | $ | 7.46 | | | $ | 6.94 | | | $ | 7.72 | | | $ | 7.20 | | | $ | 6.51 | |
Income from Investment Operations: | | | | | | | | | | | | | | | | | | | | |
Net investment income | | | 0.63 | | | | 0.43 | | | | 0.47 | | | | 0.59 | | | | 0.74 | |
Net realized and unrealized gain/(loss) | | | 3.80 | | | | 0.52 | | | | (0.72 | ) | | | 0.56 | | | | 0.74 | |
| | | | | | | | | | | | | | | | | | | | |
Total from investment operations | | | 4.43 | | | | 0.95 | | | | (0.25 | ) | | | 1.15 | | | | 1.48 | |
Less Distributions Declared to Common Shareholders: | | | | | | | | | | | | | | | | | | | | |
From net investment income | | | (0.55 | ) | | | (0.43 | ) | | | (0.53 | ) | | | (0.63 | ) | | | (0.79 | ) |
| | | | | | | | | | | | | | | | | | | | |
| | | | | |
Total distributions declared to common shareholders | | | (0.55 | ) | | | (0.43 | ) | | | (0.53 | ) | | | (0.63 | ) | | | (0.79 | ) |
Net Asset Value, End of Period | | $ | 11.34 | | | $ | 7.46 | | | $ | 6.94 | | | $ | 7.72 | | | $ | 7.20 | |
Market Value, End of Period | | $ | 9.42 | | | $ | 6.64 | | | $ | 6.18 | | | $ | 7.58 | | | $ | 6.31 | |
Market Value Total Return(a) | | | 52.03 | % | | | 14.73 | % | | | (12.18 | )% | | | 30.76 | % | | | 27.69 | % |
Ratios and Supplemental Data: | | | | | | | | | | | | | | | | | | | | |
Net assets, end of period (in 000’s) | | $ | 724,485 | | | $ | 476,263 | | | $ | 443,048 | | | $ | 492,753 | | | $ | 458,764 | |
Common Share Information at End of Period: | | | | | | | | | | | | | | | | | | | | |
Ratios based on average net assets of common shares: | | | | | | | | | | | | | | | | | | | | |
Gross operating expenses (excluding interest expense and commitment fee)(b) | | | 2.22 | % | | | 2.22 | % | | | 2.23 | % | | | 2.13 | % | | | 2.41 | % |
Interest expense and commitment fee | | | 0.60 | % | | | 0.92 | % | | | 0.92 | % | | | 1.01 | % | | | 1.49 | % |
Fees and expenses waived | | | N/A | | | | N/A | | | | N/A | | | | (0.14 | )% | | | (0.31 | )% |
Net operating expenses (including interest expense and commitment fee)(b) | | | 2.82 | % | | | 3.14 | % | | | 3.15 | % | | | 3.00 | % | | | 3.59 | % |
Net investment income | | | 7.01 | % | | | 6.00 | % | | | 6.24 | % | | | 7.92 | % | | | 11.09 | % |
Ratios based on managed net assets of common shares: | | | | | | | | | | | | | | | | | | | | |
Gross operating expenses (excluding interest and commitment fee expense)(b) | | | 1.56 | % | | | 1.60 | % | | | 1.61 | % | | | 1.70 | % | | | 1.93 | % |
Interest expense and commitment fee | | | 0.42 | % | | | 0.66 | % | | | 0.66 | % | | | 0.81 | % | | | 1.19 | % |
Fees and expenses waived | | | N/A | | | | N/A | | | | N/A | | | | (0.11 | )% | | | (0.25 | )% |
Net operating expenses (including interest expense and commitment fee)(b) | | | 1.98 | % | | | 2.26 | % | | | 2.27 | % | | | 2.40 | % | | | 2.87 | % |
Net investment income | | | 4.91 | % | | | 4.32 | % | | | 4.50 | % | | | 6.34 | % | | | 8.88 | % |
Portfolio turnover rate | | | 74 | % | | | 92 | % | | | 52 | % | | | 91 | % | | | 88 | % |
| (a) | Based on market value per share. Distributions, if any, are assumed for purposes of this calculation to be reinvested at prices obtained under the Fund’s Dividend Reinvestment Plan. |
| (b) | Includes dividends and expenses on securities sold short. |
| | | | | | |
| 18 | | | | | | See accompanying Notes to Financial Statements. |
NOTES TO FINANCIAL STATEMENTS
| | |
| December 31, 2013 | | NexPoint Credit Strategies Fund |
Note 1. Organization
NexPoint Credit Strategies Fund (the “Fund”) is a Delaware statutory trust and is registered with the Securities and Exchange Commission (the “SEC”) under the Investment Company Act of 1940, as amended (the “1940 Act”), as a non-diversified, closed-end management investment company. The financial statements include information for the fiscal year ended December 31, 2013. The Fund trades on the New York Stock Exchange under the ticker symbol NHF. The Fund may issue an unlimited number of common shares, par value $0.001 per share (“Common Shares”). The Fund commenced operations on June 29, 2006. NexPoint Advisors, L.P. (“NexPoint”) or “Investment Advisor”, an affiliate of Highland Capital Management Fund Advisors, L.P. (“Highland”), is the investment advisor and administrator to the Fund.
Note 2. Significant Accounting Policies
The following summarizes the significant accounting policies consistently followed by the Fund in the preparation of its financial statements.
Use of Estimates
The Fund’s financial statements have been prepared in conformity with accounting principles generally accepted in the United States of America (“GAAP”), which require management to make estimates and assumptions that affect the reported amounts of assets and liabilities, the disclosure of contingent assets and liabilities at the date of the financial statements and the reported amounts of revenue and expenses during the reporting period. Changes in the economic environment, financial markets and any other parameters used in determining these estimates could cause actual results to differ materially.
Fund Valuation
The net asset value (“NAV”) of the Fund’s common shares is determined daily on each day that the New York Stock Exchange (“NYSE”) is open for business as of the close of the regular trading session on the NYSE, usually 4:00 PM, Eastern time. The NAV is calculated by dividing the value of the Fund’s net assets attributable to common shares by the numbers of common shares outstanding.
Valuation of Investments
In computing the Fund’s net assets attributable to common shares, securities with readily available market quotations on the New York Stock Exchange, NASDAQ or other nationally recognized exchange, use the closing quotations on the respective exchange for valuation of those securities. Securities for which there are no readily available market quotations will be valued pursuant to policies adopted by the Board of Trustees. Typically, such securities will be
valued at the mean between the most recently quoted bid and ask prices provided by the principal market makers. If there is more than one such principal market maker, the value shall be the average of such means. Securities without a sale price or quotations from principal market makers on the valuation day may be priced by an independent pricing service. Generally, the Fund’s loan and bond positions are not traded on exchanges and consequently are valued based on a mean of the bid and ask price from the third-party pricing services or broker-dealer sources determined to generally have the capability to provide appropriate pricing services and that have been approved by the Trustees.
Securities for which market quotations are not readily available, for which the Fund has determined the price received from a pricing service or broker-dealer is “stale” or otherwise does not represent fair value (such as when events materially affecting the value of securities occur between the time when market price is determined and calculation of the Fund’s NAV), will be valued by the Fund at fair value, as determined by the Board or its designee in good faith in accordance with procedures approved by the Board, taking into account factors reasonably determined to be relevant, including, among other things,: (i) the fundamental analytical data relating to the investment; (ii) the nature and duration of restrictions on disposition of the securities; and (iii) an evaluation of the forces that influence the market in which these securities are purchased and sold. In these cases, the Fund’s NAV will reflect the affected portfolio securities’ fair value as determined in the judgment of the Board or its designee instead of being determined by the market. Using a fair value pricing methodology to value securities may result in a value that is different from a security’s most recent sale price and from the prices used by other investment companies to calculate their NAV. Determination of fair value is uncertain because it involves subjective judgments and estimates.
There can be no assurance that the Fund’s valuation of a security will not differ from the amount that it realizes upon the sale of such security. Those differences could have a material impact to the Fund.
Fair Value Measurements
The Fund has performed an analysis of all existing investments and derivative instruments to determine the significance and character of all inputs to their fair value determination. The levels of fair value inputs used to measure the Fund’s investments are characterized into a fair value hierarchy. Where inputs for an asset or liability fall into more than one level in the fair value hierarchy, the investment is classified in its entirety based on the lowest level input that is significant to that investment’s valuation.
NOTES TO FINANCIAL STATEMENTS (continued)
| | |
| December 31, 2013 | | NexPoint Credit Strategies Fund |
The three levels of the fair value hierarchy are described below:
| Level 1 — | Quoted unadjusted prices for identical instruments in active markets to which the Fund has access at the date of measurement; |
| Level 2 — | Quoted prices for similar instruments in active markets; quoted prices for identical or similar instruments in markets that are not active, but are valued based on executed trades; broker quotations that constitute an executable price; and alternative pricing sources supported by observable inputs are classified within Level 2. Level 2 inputs are either directly or indirectly observable for the asset in connection with market data at the measurement date; and |
| Level 3 — | Model derived valuations in which one or more significant inputs or significant value drivers are unobservable. In certain cases, investments classified within Level 3 may include securities for which the Fund has obtained indicative quotes from broker-dealers that do not necessarily represent prices the broker may be willing to trade on, as such quotes can be subject to material management judgment. Unobservable inputs are those inputs that reflect the Fund’s own assumptions that market participants would use to price the asset or liability based on the best available information. |
The Investment Adviser has established policies, as described above and approved by the Board, to ensure that valuation methodologies for investments and financial instruments that are categorized within all levels of the fair value hierarchy are fair and consistent. A Pricing Committee has been established to provide oversight of the valuation policies, processes and procedures, and is comprised of personnel from the Investment Adviser. The Pricing Committee meets monthly to review the proposed valuations for investments and financial instruments and is responsible for evaluating the overall fairness and consistent application of those policies.
As of December 31, 2013, the Fund’s investments consisted of senior loans, asset-backed securities, corporate bonds and notes, common stocks, preferred stocks, exchange-traded funds, rights, warrants and securities sold short. The fair value of the Fund’s loans, bonds and asset-backed securities are generally based on quotes received from brokers or independent pricing services. Loans, bonds and asset-backed securities with quotes that are based on actual trades with a sufficient level of activity on or near the measurement date are classified as Level 2 assets.
Loans, bonds and asset-backed securities that are priced using quotes derived from implied values, indicative bids, or a limited number of actual trades are classified as Level 3 assets because the inputs used by the brokers and pricing services to derive the values are not readily observable.
The fair value of the Fund’s common stocks, preferred stocks rights and warrants that are not actively traded on national exchanges are generally priced using quotes derived from implied values, indicative bids, or a limited amount of actual trades and are classified as Level 3 assets because the inputs used by the brokers and pricing services to derive the values are not readily observable. The Fund’s real estate investments include equity interests in limited liability companies and equity issued by REITs that invest in commercial real estate. The fair value of real estate investments that are not actively traded on national exchanges are based on internal models developed by the Investment Advisor. The significant inputs to the models include cash flow projections for the underlying properties and appraisals performed by independent valuation firms. These inputs are not readily observable, and the Fund has classified the investments as Level 3 assets.
At the end of each calendar quarter, management evaluates the Level 2 and 3 assets and liabilities for changes in liquidity, including but not limited to: whether a broker is willing to execute at the quoted price, the depth and consistency of prices from third party services, and the existence of contemporaneous, observable trades in the market. Additionally, management evaluates the Level 1 and 2 assets and liabilities on a quarterly basis for changes in listings or delistings on national exchanges.
Due to the inherent uncertainty of determining the fair value of investments that do not have a readily available market value, the fair value of the Fund’s investments may fluctuate from period to period. Additionally, the fair value of investments may differ significantly from the values that would have been used had a ready market existed for such investments and may differ materially from the values the Fund may ultimately realize. Further, such investments may be subject to legal and other restrictions on resale or otherwise less liquid than publicly traded securities.
NOTES TO FINANCIAL STATEMENTS (continued)
| | |
| December 31, 2013 | | NexPoint Credit Strategies Fund |
The inputs or methodology used for valuing securities are not necessarily an indication of the risk associated with investing in those securities. Transfers in and out of the levels are recognized at the value at the end of the period. A summary of the inputs used to value the Fund’s assets as of December 31, 2013 is as follows:
| | | | | | | | | | | | | | | | |
| | | Total
value at
December 31, 2013 | | | Level 1
Quoted
Price | | | Level 2
Significant
Observable
Inputs | | | Level 3
Significant
Unobservable
Inputs | |
Assets | | | | | | | | | | | | | | | | |
U.S. Senior Loans | | $ | 138,168,603 | | | $ | — | | | $ | 95,599,158 | | | $ | 42,569,445 | (2) |
Foreign Denominated or Domiciled Senior Loans | | | 386,509 | | | | — | | | | 228,751 | | | | 157,758 | |
Asset-Backed Securities | | | 159,977,786 | | | | — | | | | 144,416,158 | | | | 15,561,628 | |
Corporate Bonds & Notes | | | | | | | | | | | | | | | | |
Chemicals | | | 15,975,834 | | | | — | | | | 15,975,834 | | | | — | |
Energy | | | 9,423,525 | | | | — | | | | 9,423,525 | | | | — | |
Food & Drug | | | 992,500 | | | | — | | | | 992,500 | | | | — | |
Gaming & Leisure | | | 4,075,000 | | | | — | | | | 4,075,000 | | | | — | |
Healthcare | | | 3,747,536 | | | | — | | | | — | | | | 3,747,536 | |
Housing | | | 1,217,812 | | | | — | | | | 1,217,812 | | | | — | |
Information Technology | | | 33,354,900 | | | | — | | | | 33,354,900 | | | | — | |
Media & Telecommunications | | | 3,281,250 | | | | — | | | | 3,281,250 | | | | — | |
Retail | | | 5,547,500 | | | | — | | | | 5,547,500 | | | | — | |
Service | | | 11,392,048 | | | | — | | | | 11,392,048 | | | | — | |
Telecommunications | | | 3,191,250 | | | | — | | | | 3,191,250 | | | | — | |
Transportation | | | 520,553 | | | | — | | | | 520,553 | | | | — | |
Utility | | | 11,432,500 | | | | — | | | | 11,432,500 | | | | — | |
Foreign Corporate Bonds & Notes | | | 34,424,087 | | | | — | | | | 34,424,087 | | | | — | |
Common Stocks | | | | | | | | | | | | | | | | |
Broadcasting | | | 16,084,928 | | | | — | | | | — | | | | 16,084,928 | |
Consumer Discretionary | | | 75,683,797 | | | | 75,683,797 | | | | — | | | | — | |
Consumer Staples | | | 742,082 | | | | 742,082 | | | | — | | | | — | |
Energy | | | 3,216,330 | | | | 3,216,330 | | | | — | | | | — | |
Financial | | | 5,345,023 | | | | 5,002,506 | | | | — | | | | 342,517 | |
Gaming & Leisure | | | — | | | | — | | | | — | | | | — | (2) |
Healthcare | | | 15,996,316 | | | | 2,004,316 | | | | — | | | | 13,992,000 | |
Housing | | | 1,126,539 | | | | — | | | | — | | | | 1,126,539 | |
Information Technology | | | 41,405,128 | | | | 41,405,128 | | | | — | | | | — | |
Media & Telecommunications | | | 132,984,723 | | | | 112,212,879 | | | | 20,771,844 | | | | — | (2) |
Metals & Minerals | | | 2,733,225 | | | | 2,733,225 | | | | — | | | | — | |
Real Estate Investment Trust | | | 89,064,379 | | | | 46,100,365 | | | | — | | | | 42,964,014 | |
Telecommunications | | | 510,850 | | | | 510,850 | | | | — | | | | — | |
Transportation | | | 13 | | | | 13 | | | | — | | | | — | |
Utility | | | 5,074,691 | | | | 4,947,394 | | | | 127,297 | | | | — | |
Wireless Communications | | | 4,543,663 | | | | 4,543,663 | | | | — | | | | — | |
Preferred Stocks | | | | | | | | | | | | | | | | |
Financial | | | 78,842,431 | | | | — | | | | 64,623,600 | | | | 14,218,831 | |
Real Estate | | | — | | | | — | | | | — | | | | — | (2) |
Exchange-Traded Funds(1) | | | 52,251,205 | | | | 52,251,205 | | | | — | | | | — | |
Rights | | | 106,846,449 | | | | — | | | | 106,846,449 | | | | — | |
Warrants(1) | | | | | | | | | | | | | | | | |
Equity Contracts | | | — | | | | — | | | | — | | | | — | (2) |
Investment Companies | | | 1,919,814 | | | | 1,919,814 | | | | — | | | | — | |
| | | | | | | | | | | | | | | | |
Total Assets | | $ | 1,071,480,779 | | | $ | 353,273,567 | | | $ | 567,442,016 | | | $ | 150,765,196 | |
| | | | | | | | | | | | | | | | |
Liabilities | | | | | | | | | | | | | | | | |
Securities Sold Short | | $ | (92,703,773 | ) | | $ | (92,703,773 | ) | | $ | — | | | $ | — | |
Other Financial Instruments | | | | | | | | | | | | | | | | |
Forward Foreign Currency Contracts Foreign Exchange Contracts | | | (240,356 | ) | | | (240,356 | ) | | | — | | | | — | |
| | | | | | | | | | | | | | | | |
Total Liabilities | | $ | (92,944,129 | ) | | $ | (92,944,129 | ) | | $ | — | | | $ | — | |
| | | | | | | | | | | | | | | | |
Total | | $ | 978,536,650 | | | $ | 260,329,438 | | | $ | 567,442,016 | | | $ | 150,765,196 | |
| | | | | | | | | | | | | | | | |
| (1) | See Investment Portfolio detail for industry breakout. |
| (2) | This category includes securities with a value of zero. |
NOTES TO FINANCIAL STATEMENTS (continued)
| | |
| December 31, 2013 | | NexPoint Credit Strategies Fund |
The table below sets forth a summary of changes in the Fund’s Level 3 assets (assets measured at fair value using significant unobservable inputs) for the year ended December 31, 2013.
| | | | | | | | | | | | | | | | | | | | | | | | | | | | | | | | | | | | | | | | |
| | | Balance
as of
December 31,
2012 | | | Transfers
into
Level 3 | | | Transfers
Out
of Level 3 | | | Net
Amortization
(Accretion)
of Premium/
(Discount) | | | Net
Realized
Gains/
(Losses) | | | Net
Unrealized
Gains/
(Losses) | | | Net
Purchases(1) | | | Net
(Sales)(1) | | | Balance
as of
December 31,
2013 | | | Change in
Unrealized
Gain/(Loss)
on Level 3
securities
still held at
period end | |
U.S. Senior Loans | | $ | 42,087,789 | | | $ | — | | | $ | — | | | $ | 1,073,704 | | | $ | 27,766 | | | $ | (2,503,850 | ) | | $ | 2,711,432 | | | $ | (827,396 | ) | | | 42,569,445 | | | $ | (2,503,850 | ) |
Foreign
Denominated or Domiciled Senior Loans | | | 187,531 | | | | — | | | | — | | | | — | | | | 165 | | | | 225,222 | | | | 1,437 | | | | (256,597 | ) | | | 157,758 | | | | 225,222 | |
Asset-Backed Securities | | | 1,700,238 | | | | 12,630,200 | | | | — | | | | 539,663 | | | | (19,749 | ) | | | 46,057 | | | | 733,720 | | | | (68,501 | ) | | | 15,561,628 | | | | 46,057 | |
Corporate Bonds & Notes | | | 8,435,914 | | | | 1,379,833 | | | | (520,552 | ) | | | — | | | | — | | | | (5,189,970 | ) | | | — | | | | (357,689 | ) | | | 3,747,536 | | | | (5,916,031 | ) |
Claims | | | — | | | | — | | | | — | | | | — | | | | (1,752,328 | ) | | | 1,192,006 | | | | 560,322 | | | | — | | | | — | | | | — | |
Common Stocks | | | | | | | | | | | | | | | | | | | | | | | | | | | | | | | | | | | | | | | | |
Broadcasting | | | 24,671,202 | | | | — | | | | — | | | | — | | | | 1,438,321 | | | | 10,367,451 | | | | — | | | | (20,392,046 | ) | | | 16,084,928 | | | | 15,464,251 | |
Financial(2) | | | 428,263 | | | | — | | | | — | | | | — | | | | — | | | | (62,445 | ) | | | — | | | | (23,301 | ) | | | 342,517 | | | | (62,445 | ) |
Gaming & Leisure | | | — | | | | — | | | | — | | | | — | | | | — | | | | 4,558,190 | | | | 95,809 | | | | (4,653,999 | ) | | | — | | | | 4,558,190 | |
Healthcare | | | 40,320,000 | | | | — | | | | — | | | | — | | | | — | | | | (2,328,000 | ) | | | — | | | | (24,000,000 | ) | | | 13,992,000 | | | | (2,328,000 | ) |
Housing | | | 839,382 | | | | — | | | | — | | | | — | | | | — | | | | 287,157 | | | | — | | | | — | | | | 1,126,539 | | | | 287,157 | |
Media & Telecommunications(2) | | | 71,278 | | | | — | | | | — | | | | — | | | | — | | | | (71,278 | ) | | | — | | | | — | | | | — | | | | (71,278 | ) |
Real Estate Investment Trust | | | — | | | | — | | | | — | | | | — | | | | — | | | | 284,530 | | | | 42,679,484 | | | | — | | | | 42,964,014 | | | | 284,530 | |
Utility | | | 18,269 | | | | — | | | | (127,297 | ) | | | — | | | | — | | | | (224,670 | ) | | | 333,698 | | | | — | | | | — | | | | — | |
Preferred Stocks | | | | | | | | | | | | | | | | | | | | | | | | | | | | | | | | | | | | | | | | |
Financial | | | — | | | | — | | | | — | | | | — | | | | — | | | | (362,345 | ) | | | 14,581,176 | | | | — | | | | 14,218,831 | | | | (362,345 | ) |
Real Estate | | | — | | | | — | | | | — | | | | — | | | | — | | | | (711,172 | ) | | | 711,172 | | | | — | | | | — | | | | (711,172 | ) |
Warrants | | | | | | | | | | | | | | | | | | | | | | | | | | | | | | | | | | | | | | | | |
Equity Contracts | | | 1,468,475 | | | | — | | | | — | | | | — | | | | 65,745 | | | | (693,478 | ) | | | — | | | | (840,742 | ) | | | — | | | | — | |
| | | | | | | | | | | | | | | | | | | | | | | | | | | | | | | | | | | | | | | | |
Total | | $ | 120,228,341 | | | $ | 14,010,033 | | | $ | (647,849 | ) | | $ | 1,613,367 | | | $ | (240,080 | ) | | $ | 4,813,405 | | | $ | 62,408,250 | | | $ | (51,420,271 | ) | | $ | 150,765,196 | | | $ | 8,910,286 | |
| | | | | | | | | | | | | | | | | | | | | | | | | | | | | | | | | | | | | | | | |
| 1) | Includes any applicable borrowings and/or paydowns made on revolving credit facilities held in the Fund’s Investment Portfolio. |
| (2) | Balance as of December 31, 2012 reflects an industry reclassification for American Banknote Corp. from Media & Telecommunications to Financial. |
Investments designated as Level 3 may include assets valued using quotes or indications furnished by brokers which are based on models or estimates and may not be executable prices. In light of the developing market conditions, the Investment Adviser continues to search for observable data points and evaluate broker quotes and indications received for portfolio investments. As a result, for the year ended December 31, 2013, a net amount of $13,362,184 of the Fund’s portfolio investments were transferred between Level 2 and Level 3. Determination of fair values is uncertain because it involves subjective judgments and estimates that are unobservable. Transfers
from Level 2 to Level 3 are due to a decline in market activity (e.g. frequency of trades), which resulted in a reduction of available market inputs to determine price.
Transfers from Level 3 to Level 2 are due to an increase in market activity (e.g. frequency of trades), which resulted in an increase of available market inputs to determine price.
For the year ended December 31, 2013, an amount of $2,000 of the Fund’s portfolio investments were transferred between Level 2 and Level 1. Transfers between Level 1 and Level 2 were due to management’s assessment of quoted prices for assets in active markets.
NOTES TO FINANCIAL STATEMENTS (continued)
| | |
| December 31, 2013 | | NexPoint Credit Strategies Fund |
The following table summarizes the valuation techniques used and unobservable inputs developed to determine the fair value of material Level 3 investments:
| | | | | | | | | | |
| Category | | Ending
Balance at
12/31/13 | | | Valuation Technique | | Unobservable Inputs | | Input Value(s) |
Debt | | $ | 62,036,367 | | | Third-Party Pricing Vendor | | N/A | | N/A |
| | | | | | Liquidation Analysis | | Discount Rate | | 15% - 25% |
| | | | | | | | Liquidity Discount | | 25% - 30% |
| | | | | | | | Asset Specific Discount | | 99% - 100% |
| | | | | | Debt - Loan Spread | | Weighting of Comparables | | Equal Weights of Comps |
| | | | | | | | Weighted Avg DM | | 5% |
| | | | | | | | Liquidity Discount | | 3% |
Preferred Stock | | | 14,218,831 | | | Third-Party Pricing Vendor | | N/A | | N/A |
Common Stocks | | | 31,545,984 | | | Multiples Analysis | | Discount Rate | | 20% -25% |
| | | | | | | | Liquidity Discount | | 25% -40% |
| | | | | | | | Minority Discount | | 20% |
| | | | | | Fair Valuation - Multiple Scenarios | | Discount Rate | | 22% |
| | | | | | | | Scenario Probabilities | | Various Equal Weights |
Real Estate Investment Trust | | | 42,964,014 | | | Fair Valuation - Multiple Scenarios | | Capitalization Rate | | 5% - 7% |
| | | | | | | | Regional Market Appreciation | | 11% - 13% |
| | | | | | | | | | |
Total | | $ | 150,765,196 | | | | | | | |
The significant unobservable inputs used in the fair value measurement of the Fund’s debt investments are discount rates and liquidity discounts. Significant increases or decreases in either of those inputs in isolation would result in a significantly lower or higher fair value measurement.
The significant unobservable inputs used in the fair value measurement of the reporting entity’s common stock investments are discount rates and scenario probabilities. Significant changes in either of those inputs in isolation would result in a significantly lower or higher fair value measurement.
Security Transactions
Security transactions are accounted for on the trade date. Realized gains/(losses) on investments sold are recorded on the basis of specific identification method for both financial statement and U.S. federal income tax purposes.
Income Recognition
Corporate actions (including cash dividends) are recorded on the ex-dividend date, net of applicable withholding taxes, except for certain foreign corporate actions, which are recorded as soon after ex-dividend date as such information becomes available. Interest income is recorded on the accrual basis.
Accretion of discount and amortization of premium on taxable bonds and loans are computed to the call or maturity date, whichever is shorter, using the effective yield method. Withholding taxes on foreign dividends have
been provided for in accordance with the Funds’ understanding of the applicable country’s tax rules and rates.
U.S. Federal Income Tax Status
The Fund is treated as a separate taxpayer for U.S. federal income tax purposes. The Fund intends to qualify each year as a “regulated investment company” under Subchapter M of the Internal Revenue Code of 1986, as amended, and will distribute substantially all of its taxable income and gains, if any, for the tax year, and as such will not be subject to U.S. federal income taxes. In addition, the Fund intends to distribute, in each calendar year, all of its net investment income, capital gains and certain other amounts, if any, such that the Fund should not be subject to U.S. federal excise tax. Therefore, no U.S. federal income or excise tax provisions are recorded.
Management has analyzed the Fund’s tax positions taken on U.S. federal income tax returns for all open tax years (current and prior three tax years), and has concluded that no provision for U.S. federal income tax is required in the Fund’s financial statements. The Fund’s U.S. federal and state income and U.S. federal excise tax returns for tax years for which the applicable statutes of limitations have not expired are subject to examination by the Internal Revenue Service and state departments of revenue. Furthermore, management of the Fund is also not aware of any tax positions for which it is reasonably possible that the total amounts of unrecognized tax benefits will significantly change in the next 12 months.
NOTES TO FINANCIAL STATEMENTS (continued)
| | |
| December 31, 2013 | | NexPoint Credit Strategies Fund |
Distributions to Shareholders
The Fund plans to pay distributions from net investment income monthly and net realized capital gains annually to common shareholders. To permit the Fund to maintain more stable monthly distributions and annual distributions, the Fund may from time to time distribute less than the entire amount of income and gains earned in the relevant month or year, respectively. The undistributed income and gains would be available to supplement future distributions. Shareholders of the Fund will automatically have all distributions reinvested in Common Shares of the Fund issues by the Fund or purchased in the open market in accordance with the Fund’s Dividend Reinvestment Plan (the “Plan”) unless an election is made to receive cash. Each participant in the Plan will pay a pro rata share of brokerage commissions incurred in connection with open market purchases, and participants requesting a sale of securities through the plan agent of the Plan are subject to a sales fee and a brokerage commission.
Statement of Cash Flows
Information on financial transactions which have been settled through the receipt or disbursement of cash is presented in the Statement of Cash Flows. The cash amount shown in the Statement of Cash Flows is the amount included within the Fund’s Statement of Assets and Liabilities and includes cash on hand at its custodian bank and sub-custodian bank, and does not include cash posted as collateral in the segregated account or with the broker-dealers.
Cash & Cash Equivalents
The Fund considers liquid assets deposited with a bank and certain short term debt instruments with original maturities of 3 months or less to be cash equivalents. These investments represent amounts held with financial institutions that are readily accessible to pay Fund expenses or purchase investments. Cash and cash equivalents are valued at cost plus accrued interest, which approximates market value. The value of cash equivalents denominated in foreign currencies is determined by converting to U.S. dollars on the date of the Statement of Assets and Liabilities.
Foreign Currency
Accounting records of the Fund are maintained in U.S. dollars. Foreign currencies, investments and other assets and liabilities denominated in foreign currencies are translated into U.S. dollars at the exchange rates using the current 4:00 PM London Time Spot Rate. Fluctuations in the value of the foreign currencies and other assets and liabilities resulting from changes in exchange rates between trade and settlement dates on securities transactions and between the accrual and payment dates on dividends,
interest income and foreign withholding taxes, are recorded as unrealized foreign currency gains/(losses). Realized gains/(losses) and unrealized appreciation/(depreciation) on investment securities and income and expenses are translated on the respective dates of such transactions. The effects of changes in foreign currency exchange rates on investments in securities are not segregated in the Statement of Operations from the effects of changes in market prices of those securities, but are included with the net realized and unrealized gain or loss on investment securities.
Investments in Foreign Markets
Investments in foreign markets involve special risks and considerations not typically associated with investing in the United States. These risks include revaluation of currencies, high rates of inflation, restrictions on repatriation of income and capital, and adverse political and economic developments. Moreover, securities issued in these markets may be less liquid, subject to government ownership controls, tariffs and taxes, subject to delays in settlements, and their prices may be more volatile.
The Fund may be subject to capital gains and repatriation taxes imposed by certain countries in which they invest. Such taxes are generally based on income and/or capital gains earned or repatriated. Taxes are accrued based upon net investment income, net realized gains and net unrealized appreciation as income and/or capital gains are earned.
Securities Sold Short
The Fund may sell securities short. A security sold short is a transaction in which the Fund sells a security it does not own in anticipation that the market price of that security will decline. When the Fund sells a security short, it must borrow the security sold short from a broker-dealer and deliver it to the buyer upon conclusion of the transaction. The Fund may have to pay a fee to borrow particular securities and is often obligated to pay over any dividends or other payments received on such borrowed securities. Cash held as collateral for securities sold short is classified as restricted cash on the Statement of Assets and Liabilities. Securities held as collateral for securities sold short are shown on the Investment Portfolio of the fund.
When securities are sold short, the Fund intends to limit exposure to a possible market decline in the value of its portfolio securities through short sales of securities that the Investment Adviser believes possess volatility characteristics similar to those being hedged. In addition, the Fund may use short sales for non-hedging purposes to pursue its investment objective. Subject to the requirements of the 1940 Act and the Internal Revenue Code of
NOTES TO FINANCIAL STATEMENTS (continued)
| | |
| December 31, 2013 | | NexPoint Credit Strategies Fund |
1986, as amended (the “Code”), the Fund will not make a short sale if, after giving effect to such sale, the market value of all securities sold short by the Fund exceeds 25% of the value of its total assets.
Note 3. Derivative Transactions
The Fund is subject to equity price risk, interest rate risk, and foreign currency exchange rate risk in the normal course of pursuing its investment objective. The Fund enters into derivative transactions for the purpose of hedging against the effects of changes in the value of portfolio securities due to anticipated changes in market conditions, to gain market exposure for residual and accumulating cash positions, and for managing the duration of fixed income investments.
Forward Foreign Currency Exchange Contracts
The Fund enters into forward foreign currency exchange contracts to facilitate transactions in foreign denominated securities and to manage the Fund’s currency exposure. Forward foreign currency exchange contracts are valued at the mean between the bid and the offered forward rates as last quoted by a recognized dealer. The aggregate principal amounts of the contracts are not recorded in the Fund’s financial statements. Such amounts appear under the caption Forward Foreign Currency Exchange Contracts in the Investment Portfolio. Fluctuations in the value of the contracts are recorded in the Statement of Assets and Liabilities as an asset (or liability) and in the Statement of Operations as unrealized appreciation (depreciation) until the contracts are closed, when they are recorded as realized gains or losses on foreign currency related transactions. The Fund’s risks in using these contracts include changes in the value of foreign currency or the possibility that the counterparties do not perform under the contracts’ terms. When the Fund enters into a forward foreign currency exchange contract, it is required to segregate cash or liquid securities with its custodian in an amount equal to the value of the Fund’s total assets committed to the consummation of the forward contract. If the value of the segregated securities declines, additional cash or securities is segregated so that the value of the account will equal the amount of the Fund’s commitment with respect to the contract.
Options
The Fund purchases and writes options, subject to certain limitations. The Fund may invest in options contracts to manage its exposure to the stock and bond markets and fluctuations in foreign currency values. Writing puts and buying calls tend to increase the Fund’s exposure to the underlying instrument while buying puts and writing calls tend to decrease the Fund’s exposure to the underlying
instrument, or economically hedge other Fund investments. The Fund’s risks in using these contracts include changes in the value of the underlying instruments, nonperformance of the counterparties under the contracts’ terms and changes in the liquidity of the secondary market for the contracts. Options are valued at the last sale price, or if no sales occurred on that day, at the last quoted bid price.
When the Fund writes an option, the amount of the premium received is recorded as a liability and is subsequently adjusted to the current fair value of the option written. Premiums received from writing options that expire unexercised are treated by the Fund on the expiration date as realized gains from investments. The difference between the premium and the amount paid on effecting a closing purchase transaction, including brokerage commissions, is also treated as a realized gain, or if the premium is less than the amount paid for the closing purchase, as a realized loss. When an option is exercised, the proceeds from the sale of the underlying security or the cost basis of the securities purchased are adjusted by the original premium received or paid.
Transactions in written options for the year ended December 31, 2013 were as follows:
| | | | | | | | |
| | | Number of
Contracts | | | Premium | |
Outstanding, December 31, 2012 | | | 11,934 | | | $ | 2,951,678 | |
Call Options Written | | | 4,675 | | | | 533,599 | |
Put Options Written | | | 8,834 | | | | 1,191,594 | |
Call Options Exercised | | | (3,900 | ) | | | (483,448 | ) |
Put Options Expired Exercised | | | (1,500 | ) | | | (254,973 | ) |
Call Options Expired | | | (775 | ) | | | (50,151 | ) |
Put Options Expired | | | (11,934 | ) | | | (1,421,526 | ) |
Put Options Closed | | | (7,334 | ) | | | (2,466,773 | ) |
| | | | | | | | |
Outstanding, December 31, 2013 | | | — | | | $ | — | |
Additional Derivative Information
The Fund adopted amendments to authoritative guidance on disclosures about derivative instruments and hedging activities which require that the Fund disclose: a) how and why an entity uses derivative instruments, b) how derivative instruments and related hedged items are accounted for, c) how derivative instruments and related hedged items affect an entity’s financial position, financial performance and cash flows, and d) how the netting of derivatives subject to master netting arrangements affects the net exposure of the Fund related to the derivatives.
NOTES TO FINANCIAL STATEMENTS (continued)
| | |
| December 31, 2013 | | NexPoint Credit Strategies Fund |
The fair value of derivative instruments on the Statement of Assets and Liabilities have the following risk exposure at December 31, 2013:
| | | | | | | | |
| Risk Exposure | | Asset
Derivative
Fair Value | | | Liability
Derivative
Fair Value | |
Foreign Exchange Risk | | $ | — | | | $ | 240,356 | (1) |
| (1) | Statement of Assets and Liabilities location: Unrealized appreciation on forward foreign currency exchange contracts. |
To reduce counterparty credit risk with respect to OTC transactions, the Fund has entered into master netting arrangements, established within the Fund’s International Swap and Derivatives Association, Inc. (“ISDA”) master agreements, which allows the Fund to make (or to have an entitlement to receive) a single net payment in the event of default (close-out netting) for outstanding payables and receivables with respect to certain OTC derivative positions in forward currency exchange contracts for each individual counterparty. In addition, the Fund may require that certain counterparties post cash and/or securities in collateral accounts to cover their net payment obligations for those derivative contracts subject to ISDA master agreements. If the counterparty fails to perform under these contracts and agreements, the cash and/or securities will be made available to the Fund.
Certain ISDA master agreements include credit related contingent features which allow counterparties to OTC derivatives to terminate derivative contracts prior to maturity in the event the Fund’s net assets decline by a stated percentage or the Fund fails to meet the terms of its ISDA master agreements, which would cause the Fund to accelerate payment of any net liability owed to the counterparty.
For financial reporting purposes, the Fund does not offset derivative assets and derivative liabilities that are subject to netting arrangements in the Statement of Assets and Liabilities. Bankruptcy or insolvency laws of a particular jurisdiction may impose restrictions on or prohibitions against the right of offset in bankruptcy, insolvency or other events.
Collateral terms are contract specific for OTC derivatives. For derivatives traded under an ISDA master agreement, the collateral requirements are typically calculated by netting the mark to market amount for each transaction under such agreement and comparing that to the value of any collateral currently pledged by the Fund or the Counterparty.
For financial reporting purposes, cash collateral that has been pledged to cover obligations of the Fund, if any, is reported in due to/from brokers on the Statement of Assets
and Liabilities. Generally, the amount of collateral due from or to a party must exceed a minimum transfer amount threshold before a transfer has to be made. To the extent amounts due to the Fund from its counterparties are not fully collateralized, contractually or otherwise, the Fund bears the risk of loss from counterparty non-performance.
The following table presents derivative instruments that are subject to enforceable netting arrangements as of December 31, 2013:
| | | | | | | | | | | | | | | | |
| Gross Amounts Not Offset in the Statement of Assets and Liabilities | |
| Counterparty | | Gross Amounts
of Liabilities
Presented in
Statement of
Assets &
Liabilities | | | Financial
Instrument | | | Collateral
Received | | | Net
Amount
(not less
than 0) | |
PNC Capital Markets LLC | | $ | 240,356 | | | $ | — | | | $ | — | | | $ | 240,356 | |
The effect of derivative instruments on the Statement of Operations for the year ended December 31, 2013, is as follows:
| | | | | | | | |
| Risk Exposure | | Net
Realized
Gain(Loss)
on Derivatives | | | Net Change in
Unrealized
Appreciation/
(Depreciation)
on Derivatives | |
Equity Price Risk | | $ | 3,995,994 | (1) | | $ | 107,942 | (3) |
Foreign Exchange Risk | | | (440,040 | )(2) | | | 174,955 | (4) |
| (1) | Statement of Operations location: Net realized gain/(loss) on written options contracts. |
| (2) | Statement of Operations location: Net realized gain/(loss) on forward foreign currency exchange contracts. |
| (3) | Statement of Operations location: Net change in unrealized appreciation/(depreciation) on written options contracts. |
| (4) | Statement of Operations location: Net change in unrealized appreciation/(depreciation) on forward foreign currency exchange contracts. |
For the year ended December 31, 2013, the Fund’s average volume of derivatives is as follows:
| | | | | | | | |
| | | Units/
Contracts | | | Appreciation/
(Depreciation) | |
Forward Foreign Currency Exchange Contracts | | | — | | | $ | (37,013 | ) |
Written Options Contracts | | | 2,487 | | | | — | |
Note 4. Securities Lending
The Fund may make secured loans of its portfolio securities amounting to not more than one-third of the value of its total assets, in an attempt to realize additional income. The risks in lending portfolio securities, as with other extensions of credit, consist of possible delays in recovery of the securities or possible loss of rights in the collateral should the borrower fail financially and possible investment losses in the investment of collateral. Pursuant to the
NOTES TO FINANCIAL STATEMENTS (continued)
| | |
| December 31, 2013 | | NexPoint Credit Strategies Fund |
Fund’s securities lending policy, securities loans are made to unaffiliated broker dealers pursuant to agreements requiring that loans be continuously secured by collateral in cash or short-term debt obligations in an amount equal to 102% of the market value of the securities subject to the loan. The borrower pays to the Fund an amount equal to any interest or dividends received on securities subject to the loan. The Fund and its securities lending agent retains all or a portion of the interest received on investment of the cash collateral and receives a fee from the borrower.
Securities lending transactions are entered into Securities Lending Authorization Agreements (“SLAA”), which provides the right, in the event of default (including bankruptcy or insolvency) for the non-defaulting party to liquidate the collateral and calculate a net exposure to the defaulting party or request additional collateral. In the event that a borrower defaults, the Fund, as lender, would offset the market value of the collateral received against the market value of the securities loaned. The value of the collateral is typically greater than that of the market value of the securities loaned, leaving the lender with a net amount payable to the defaulting party. However, bankruptcy or insolvency laws of a particular jurisdiction may impose restrictions on or prohibitions against such a right of offset in the event of a SLAA counterparty’s bankruptcy or insolvency. Under the SLAA, the Fund can reinvest cash collateral, or, upon an event of default, resell or repledge the collateral, and the borrower can resell or repledge the loaned securities. The risks of securities lending also include the risk that the borrower may not provide additional collateral when required or may not return the securities when due. To mitigate this risk, the Fund benefits from a borrower default indemnity provided by State Street Bank and Trust Company (“State Street,” the Fund’s securities lending agent). State Street’s indemnity allows for full replacement of securities lent.
The following table presents financial instruments that are subject to enforceable netting arrangements as of December 31, 2013:
| | | | | | | | | | | | | | |
| Gross Amounts Not Offset in the Statement of Assets and Liabilities | |
Gross Amounts
of Liabilities
Presented in
Statement of
Assets &
Liabilities | | | Financial
Instrument | | | Collateral
Received | | | Net
Amount
(not less
than 0) | |
| $ | 1,919,814 | (1) | | $ | (1,909,969 | )(2)(3) | | $ | — | | | $ | 9,845 | |
| (1) | Represents market value of securities on loan at year end. |
| (2) | As of December 31, 2013, the market value of securities loaned by the Fund was $1,909,969. The loaned securities were secured with cash collateral of $1,919,814, which was invested in the State Street Navigator Prime Securities Lending Portfolio. |
| (3) | In some instances, the actual collateral received and/or pledged may be more than the amount shown here due to overcollateralization. |
Note 5. U.S. Federal Income Tax Information
The character of income and gains to be distributed is determined in accordance with income tax regulations which may differ from U.S. GAAP. These differences include (but are not limited to) investments organized as partnerships for tax purposes, losses deferred to off-setting positions, losses deferred due to wash sale transactions. Reclassifications are made to the Fund’s capital accounts to reflect income and gains available for distribution (or available capital loss carryovers) under income tax regulations. These reclassifications have no impact on net investment income, realized gains or losses, or net asset value of the Fund. The calculation of net investment income per share in the Financial Highlights table excludes these adjustments.
For the year ended December 31, 2013, permanent differences chiefly resulting from foreign currency gains and losses, paydown gains and losses, defaulted bonds and non-deductible excise taxes paid were identified and reclassified among the components of the Fund’s net assets as follows:
| | | | | | | | | | |
Undistributed Net
Investment Income | | | Accumulated Net
Realized Gain (Loss) | | | Paid-In Capital | |
| $ | (2,109,686 | ) | | $ | 2,213,488 | | | $ | (103,802 | ) |
For the year ended December 31, 2013, the Fund’s tax year end, components of distributable earnings on a tax basis are as follows:
| | | | | | | | | | | | | | | | | | |
Undistributed
Ordinary
Income | | | Undistributed
Long-Term
Capital Gains | | | Other
Temporary
Differences(2) | | | Accumulated
Capital and
Other Losses | | | Net Tax
Appreciation/
(Depreciation)(1) | |
| $ | 6,518,318 | | | $ | — | | | $ | 934,651 | | | $ | (378,643,125 | ) | | $ | (43,851,444 | ) |
| (1) | Any differences between book-basis and tax-basis net unrealized appreciation/(depreciation) are primarily due to deferral of losses from wash sales, Passive Foreign Investment Company un-reversed inclusions, partnership adjustments and defaulted bonds. |
| (2) | Other Temporary Differences is comprised of deferred REIT income. |
NOTES TO FINANCIAL STATEMENTS (continued)
| | |
| December 31, 2013 | | NexPoint Credit Strategies Fund |
For the year ended December 31, 2013, the Fund had capital loss carryovers as indicated below. The capital loss carryovers are available to offset future realized capital gains to the extent provided in the Code and regulations promulgated thereunder. To the extent that these carryover losses are used to offset future capital gains, it is probable that the gains so offset will not be distributed to shareholders because they would be taxable as ordinary income.
| | | | | | | | | | | | | | | | | | | | | | | | | | |
| 2016 | | | 2017 | | | 2018 | | | 2019 | | | No
Expiration Short-Term(1) | | | No
Expiration
Long-Term(1) | | | Total | |
| $ | 50,723,640 | (2)(3) | | $ | 282,026,384 | (4) | | $ | 45,893,101 | (4) | | $ | — | | | $ | — | | | $ | — | | | $ | 378,643,125 | |
| (1) | On December 22, 2010, the Regulated Investment Company Modernization Act of 2010 (the “Modernization Act”) was signed into law. The Modernization Act modifies several of the Federal income and excise tax provisions related to RICs. Under the Modernization Act, new capital losses may now be carried forward indefinitely, and retain the character of the original loss as compared with pre-enactment law where capital losses could be carried forward for eight years, and carried forward as short-term capital losses, irrespective of the character of the original loss. |
| (2) | These capital loss carryforward amounts were acquired in the reorganizations of Prospect Street High Income Portfolio Inc (“PHY”) and Prospect Street Income Shares Inc (“CNN”) into the Fund on July 18, 2008 and are available to offset future capital gains of the Fund. The Fund’s ability to utilize the capital loss carryforwards is limited under Internal Revenue Service regulations. |
| (3) | This capital loss carryforward amount was acquired in the reorganization of Highland Distressed Opportunities, Inc. (“HCD”) into the Fund on June 12, 2009, and is available to offset future capital gains of the Fund. The Fund’s ability to utilize the capital loss carryforwards is limited under Internal Revenue Service regulations. |
| (4) | The Fund’s ability to utilize the capital loss carryforward may be limited. |
The tax character of distributions paid during the years ended December 31, 2013 and December 31, 2012 (unless otherwise indicated) were as follows:
| | | | | | | | |
| Distributions Paid From: | | 2013 | | | 2012 | |
Ordinary Income(1) | | $ | 35,070,929 | | | $ | 27,149,626 | |
| (1) | For tax purposes, short-term capital gains distributions, if any, are considered ordinary income distributions. |
Unrealized appreciation and depreciation at December 31, 2013, based on cost of investments for U.S. federal income tax purposes was:
| | | | | | | | | | | | | | |
Gross
Appreciation | | | Gross
Depreciation | | | Net
Appreciation/
(Depreciation) (1) | | | Cost | |
| $ | 246,256,591 | | | $ | (278,915,031 | ) | | $ | (32,658,440 | ) | | $ | 1,104,139,219 | |
| (1) | Any differences between book-basis and tax-basis net unrealized appreciation/(depreciation) are primarily due to deferral of losses from wash sales, Passive Foreign Investment Company un-reversed inclusions, partnership adjustments and defaulted bonds. |
Qualified Late Year Ordinary and Post October Losses
Under current laws, certain capital losses realized after October 31 may be deferred and treated as occurring on the first day of the following fiscal year. For the fiscal year ended December 31, 2013, the Fund did not elect to defer net realized capital losses incurred from November 1, 2013 through December 31, 2013.
Note 6. Credit Agreement
On February 2, 2011, the Fund entered into a $125,000,000 credit agreement with State Street Bank and Trust Company (the “Credit Agreement”). Concurrent with entering into the Credit Agreement, the Fund agreed to pay a $125,000 structuring fee, which was amortized ratably
over the term of the agreement. The terms of the Credit Agreement require the Fund to pay 0.15% on the uncommitted balance and pay a spread of 1.25% over LIBOR on amounts borrowed. In connection with the execution of the Credit Agreement, the Fund amended the agreement with the holders of the Notes (the “Amendment”) (see Note 7) to allow for a secured credit facility provider. The Amendment changed the status of the Notes from unsecured to secured pari pasu with State Street Bank and Trust Company.
On December 14, 2012, the Fund entered into an amendment (the “Fifth Amendment”) extending the Credit Agreement termination date from January 31, 2013 to December 13, 2013. Additionally, the spread over LIBOR on amounts borrowed declined from 1.10% to 0.95%. The terms of the Credit Agreement continue to require the Fund to pay 0.15% on the uncommitted balance. On May 16, 2013 the Credit Agreement was increased to $150,000,000, and the termination date was extended to May 15, 2014. As of December 31, 2013, the carrying value of the outstanding debt under the Credit Agreement was $145,000,000 million, excluding accrued interest that was owed at that date. As of December 31, 2013, the fair value of the outstanding debt under the Credit Agreement was estimated to be $145,280,000, and would be categorized as Level 3 within the fair value hierarchy. The fair value was estimated based on discounting the cash flows owed using a discount rate of 0.50% over the 11 month risk free rate.
For the year ended December 31, 2013, the average daily loan balance was $99,016,438 at a weighted average interest rate of 1.15%, excluding any commitment fee. With respect to these borrowings, interest expense of $1,142,951
NOTES TO FINANCIAL STATEMENTS (continued)
| | |
| December 31, 2013 | | NexPoint Credit Strategies Fund |
and uncommitted balance fee of $61,333 are included in interest expense in the Statement of Operations.
On May 16, 2013, the Fund entered into a $125,000,000 Committed Facility Agreement with BNP Paribas Prime Brokerage, Inc. (“BNPP PB, Inc.”) (the “Committed Facility Agreement”). The terms of the Committed Facility Agreement require the Fund to pay 0.55% on the uncommitted balance and pay a spread of 0.75% over the 1-month LIBOR on amounts borrowed. The Fund has the right to terminate the agreement upon 90 days prior notice. On May 29, 2013 the Committed Facility Agreement was amended (the “First Amendment”), increasing from $125,000,000 to $155,000,000. On December 11, 2013 the Committed Facility Agreement was amended (the “Second Amendment”), increasing from $155,000,000 to $175,000,000. As of December 31, 2013, the carrying value of the Committed Facility Agreement was $173,500,000. The fair value of the outstanding Committed Facility Agreement was estimated to be $173,659,000, and would be categorized as Level 3 within the fair value hierarchy. The fair value was estimated based on discounting the cash flows owed using a discount rate of 0.50% over the 90 days risk free rate.
For the year ended December 31, 2013, the average daily note balance was $141,881,562 at a weighted average interest rate of 0.95%. With respect to the Notes, interest expense of $920,771 and uncommitted balance fee of $279 are included in interest expense in the Statement of Operations.
Note 7. Series A Senior Unsecured Notes
On April 16, 2010, the Fund issued $120,000,000 principal amount of floating rate Series A senior unsecured notes (“Notes”). The Notes bore interest, payable quarterly, at the rate of the 3 month LIBOR, subject to a LIBOR floor of 1.00%, plus 1.70%, to maturity on April 16, 2015. On May 16, 2013 the Fund made an early payment fully satisfying the Fund’s obligations under the terms of the Notes. With respect to the Notes, interest expense of $1,215,000 is included in interest expense in the Statement of Operations.
Note 8. Asset Coverage
The Fund is required to maintain 300% asset coverage with respect to amounts outstanding under the Credit Agreement and the Notes. Asset coverage is calculated by subtracting the Fund’s total liabilities, not including any amount representing bank loans and senior securities, from the Fund’s total assets and dividing the result by the principal amount of the borrowings outstanding. As of the dates indicated below, the Fund’s debt outstanding and asset coverage was as follows:
| | | | | | | | |
| Date | | Total Amount
Outstanding | | | % of Asset Coverage of Indebtedness | |
12/31/2013 | | $ | 318,500,000 | | | | 327.5 | % |
12/31/2012 | | | 225,000,000 | | | | 311.7 | |
12/31/2011 | | | 173,000,000 | | | | 356.1 | |
12/31/2010 | | | 120,000,000 | | | | 510.6 | |
12/31/2009 | | | 112,000,000 | | | | 509.6 | |
12/31/2008 | | | 141,000,000 | | | | 356.2 | |
12/31/2007 | | | 248,000,000 | | | | 350.4 | |
Note 9. Investment Advisory, Administration, and Trustee Fees Investment Advisory Fee
The Investment Adviser to the Fund receives an annual fee, paid monthly, in an amount equal to 1.00% of the average weekly value of the Fund’s Managed Assets. The Fund’s “Managed Assets” is an amount equal to the total assets of the Fund, including any form of leverage, minus all accrued expenses incurred in the normal course of operations, but not excluding any liabilities or obligations attributable to investment leverage obtained through (i) indebtedness of any type (including, without limitation, borrowing through a credit facility or the issuance of debt securities), (ii) the issuance of preferred stock or other similar preference securities, (iii) the reinvestment of collateral received for securities loaned in accordance with the Fund’s investment objectives and policies, and/or (iv) any other means.
Administration Fee
The Investment Adviser provides administrative services to the Fund. For its services, the Investment Adviser receives an annual fee, payable monthly, in an amount equal to 0.20% of the average weekly value of the Fund’s Managed Assets. Under a separate sub-administration agreement, the Investment Adviser has delegated certain administrative functions to State Street Bank and Trust Company. The Investment Adviser pays State Street Bank and Trust Company directly for these sub-administration services.
Fees Paid to Officers and Trustees
Each Trustee who is not an “interested person” of the Fund as defined in the 1940 Act (the “Independent Trustees”) receives an annual retainer of $150,000 payable in quarterly installments and allocated among each portfolio in the Highland Fund Complex based on relative net assets. The “Highland Fund Complex” consists of all of the registered investment companies advised by the Investment Adviser and any affiliates as of the period covered by this annual report. The Fund pays no compensation to its one interested Trustee or any of its officers, all of whom are employees of the Investment Adviser.
NOTES TO FINANCIAL STATEMENTS (continued)
| | |
| December 31, 2013 | | NexPoint Credit Strategies Fund |
Note 10. Disclosure of Significant Risks and Contingencies
The primary risks of investing in the Funds are described below in alphabetical order:
Concentration Risk
The Fund may focus its investments in instruments of only a few companies. The concentration of the Fund’s portfolio in any one obligor would subject the Fund to a greater degree of risk with respect to defaults by such obligor, and the concentration of the portfolio in any one industry would subject the Fund to a greater degree of risk with respect to economic downturns relating to such industry.
Counterparty Credit Risk
Counterparty credit risk is the potential loss the Fund may incur as a result of the failure of a counterparty or an issuer to make payments according to the terms of a contract. Counterparty credit risk is measured as the loss the Fund would record if its counterparties failed to perform pursuant to the terms of their obligations to the Fund. Because the Fund may enter into over-the-counter forwards, options, swaps and other derivative financial instruments, the Fund may be exposed to the credit risk of its counterparties. To limit the counterparty credit risk associated with such transactions, the Fund conducts business only with financial institutions judged by the Investment Adviser to present acceptable credit risk.
Credit Risk
Investments rated below investment grade are commonly referred to as high-yield, high risk or “junk debt.” They are regarded as predominantly speculative with respect to the issuing company’s continuing ability to meet principal and/ or interest payments. Investments in high yield debt and high yield Senior Loans may result in greater net asset value fluctuation than if the Fund did not make such investments.
Corporate debt obligations, including Senior Loans, are subject to the risk of non-payment of scheduled interest and/or principal. Non-payment would result in a reduction of income to the Fund, a reduction in the value of the corporate debt obligation experiencing non-payment and a potential decrease in the NAV of the Fund.
Currency Risk
A portion of the Fund’s assets may be quoted or denominated in non-U.S. currencies. These securities may be adversely affected by fluctuations in relative currency exchange rates and by exchange control regulations. The Fund’s investment performance may be negatively affected by a devaluation of a currency in which the Fund’s investments are quoted or denominated. Further,
the Fund’s investment performance may be significantly affected, either positively or negatively, by currency exchange rates because the U.S. dollar value of securities quoted or denominated in another currency will increase or decrease in response to changes in the value of such currency in relation to the U.S. dollar.
Emerging Markets Risk
Any investments in Emerging Market Countries (countries in which the capital markets are developing) may involve greater risks than investments in more developed markets and the prices of such investments may be more volatile. The consequences of political, social or economic changes in these markets may have disruptive effects on the market prices of the Fund’s investments and the income they generate, as well as the Fund’s ability to repatriate such amounts.
Foreign Securities Risk
Investments in foreign securities involve certain factors not typically associated with investing in U.S. securities, such as risks relating to (i) currency exchange matters, including fluctuations in the rate of exchange between the U.S. dollar (the currency in which the books of the Fund are maintained) and the various foreign currencies in which the Fund’s portfolio securities will be denominated and costs associated with conversion of investment principal and income from one currency into another; (ii) differences between the U.S. and foreign securities markets, including the absence of uniform accounting, auditing and financial reporting standards and practices and disclosure requirements, and less government supervision and regulation; (iii) political, social or economic instability; and (iv) the extension of credit, especially in the case of sovereign debt.
Forward Foreign Currency Exchange Contracts Risk
The Fund is subject to foreign currency exchange rate risk in the normal course of pursuing its investment objectives. The Fund may use forward contracts to gain exposure to, or hedge against changes in the value of foreign currencies. A forward contract represents a commitment for the future purchase or sale of an asset at a specified price on a specified date. Upon entering into such contracts, daily fluctuations in the value of the contract are recorded for financial statement purposes as unrealized gains or losses by the Fund. At the expiration of the contracts the Fund realizes the gain or loss. Upon entering into such contracts, the Fund bears the risk of exchange rates moving unexpectedly, in which case, the Fund may not achieve the anticipated benefits of the forward contracts and may realize a loss. With forwards, there is counterparty credit
NOTES TO FINANCIAL STATEMENTS (continued)
| | |
| December 31, 2013 | | NexPoint Credit Strategies Fund |
risk to the Fund because the forwards are not exchange-traded, and there is no clearinghouse to guarantee the forwards against default.
Hedging Transactions Risk
The Fund may engage in “hedging,” the practice of attempting to offset a potential loss in one position by establishing an opposite position in another investment. Hedging strategies in general are usually intended to limit or reduce investment risk, but can also be expected to limit or reduce the potential for profit. For example, if the Fund has taken a defensive posture by hedging its portfolio, and stock prices advance, the return to investors will be lower than if the portfolio had not been hedged. No assurance can be given that any particular hedging strategy will be successful or that the Investment Adviser will elect to use a hedging strategy at a time when it is advisable.
Illiquid Securities Risk
The investments made by the Fund may be illiquid, and consequently the Fund may not be able to sell such investments at prices that reflect the Investment Adviser’s assessment of their value or the amount originally paid for such investments by the Fund. Illiquidity may result from the absence of an established market for the investments as well as legal, contractual or other restrictions on their resale and other factors. Furthermore, the nature of the Fund’s investments, especially those in financially distressed companies, may require a long holding period prior to profitability.
Indemnification Risk
The Fund has a variety of indemnification obligations under contracts with its service providers. The Fund’s maximum exposure under these arrangements is unknown. However, the Fund has not had prior claims or losses pursuant to these contracts and expect the risk of loss to be remote.
Leverage Risk
The Fund may use leverage in their investment program, including the use of borrowed funds and investments in certain types of options, such as puts, calls and warrants, which may be purchased for a fraction of the price of the underlying securities. While such strategies and techniques increase the opportunity to achieve higher returns on the amounts invested, they also increase the risk of loss. To the extent the Fund purchases securities with borrowed funds, its net assets will tend to increase or decrease at a greater rate than if borrowed funds are not used. If the interest expense on borrowings were to exceed the net return on the portfolio securities purchased with borrowed funds, the Fund’s use of leverage would result in a lower rate of return than if the Fund were not leveraged.
Options Risk
There are several risks associated with transactions in options on securities. For example, there are significant differences between the securities and options markets that could result in an imperfect correlation between these markets, causing a given transaction not to achieve its objectives. A transaction in options or securities may be unsuccessful to some degree because of market behavior or unexpected events.
When the Fund writes a covered call option, the Fund forgoes, during the option’s life, the opportunity to profit from increases in the market value of the security covering the call option above the sum of the premium and the strike price of the call, but retains the risk of loss should the price of the underlying security decline. The writer of an option has no control over the time when it may be required to fulfill its obligation and once an option writer has received an exercise notice, it must deliver the underlying security in exchange for the strike price.
When the Fund writes a covered put option, the Fund bears the risk of loss if the value of the underlying stock declines below the exercise price minus the put premium. If the option is exercised, the Fund could incur a loss if it is required to purchase the stock underlying the put option at a price greater than the market price of the stock at the time of exercise plus the put premium the Fund received when it wrote the option. While the Fund’s potential gain in writing a covered put option is limited to distributions earned on the liquid assets securing the put option plus the premium received from the purchaser of the put option, the Fund risks a loss equal to the entire exercise price of the option minus the put premium.
Restricted Securities Risk
Restricted securities (i.e., securities acquired in private placement transactions) and illiquid securities may offer higher yields than comparable publicly traded securities. The Fund, however, may not be able to sell these securities when the Investment Adviser considers it desirable to do so or, to the extent they are sold privately, may have to sell them at less than the price of otherwise comparable securities. Restricted securities are subject to limitations on resale which can have an adverse effect on the price obtainable for such securities. Also, if in order to permit resale the securities are registered under the Securities Act at the Fund’s expense, the Fund’s expenses would be increased.
Short-Selling Risk
Short sales by the Fund that are not made where there is an offsetting long position in the asset that it is being sold short theoretically involve unlimited loss potential since the
NOTES TO FINANCIAL STATEMENTS (continued)
| | |
| December 31, 2013 | | NexPoint Credit Strategies Fund |
market price of securities sold short may continuously increase. Short selling allows the Fund to profit from declines in market prices to the extent such decline exceeds the transaction costs and costs of borrowing the securities. However, since the borrowed securities must be replaced by purchases at market prices in order to close out the short position, any appreciation in the price of the borrowed securities would result in a loss. Purchasing securities to close out the short position can itself cause the price of securities to rise further, thereby exacerbating the loss. The Fund may mitigate such losses by replacing the securities sold short before the market price has increased significantly. Under adverse market conditions, the Fund might have difficulty purchasing securities to meet margin calls on its short sale delivery obligations, and might have to sell portfolio securities to raise the capital necessary to meet its short sale obligations at a time when fundamental investment considerations would not favor such sales.
Troubled, Distressed or Bankrupt Companies Risk
The Fund invests in companies that are troubled, in distress or bankrupt. As such, they are subject to a multitude of legal, industry, market, environmental and governmental forces that make analysis of these companies inherently difficult. Further, the Investment Adviser relies on company management, outside experts, market participants and personal experience to analyze potential investments for the Fund. There can be no assurance that any of these sources will prove credible, or that the resulting analysis will produce accurate conclusions.
Note 11. Investment Transactions
For the year ended December 31, 2013, the cost of purchases and proceeds from sales of securities, excluding short-term obligations, were $781,884,331 and $620,767,253, respectively.
Note 12. Affiliated Issuers
Under Section 2(a)(3) of the 1940 Act, a portfolio company is defined as “affiliated” if a Fund owns five percent or more of its outstanding voting securities. The Fund held at least five percent of the outstanding voting securities of the following companies as of December 31, 2013:
| | | | | | | | | | | | | | | | | | | | | | | | | | | | |
| | | | | | | | | Market Value | | | | | | | | | �� | |
| Issuer | | Par Value
at December 31,
2013 | | | Shares/Units at
December 31,
2013 | | | December 31,
2012 | | | December 31,
2013 | | | Affiliated
Income | | | Purchases | | | Sales | |
ComCorp Broadcasting, Inc. (Senior Loans)(1)(2) | | $ | 35,950,043 | | | | — | | | $ | 34,829,552 | | | $ | 35,809,838 | | | $ | — | | | $ | — | | | $ | — | |
Communications Corp of America (Common Stocks) | | | — | | | | 2,010,616 | | | | 620,677 | | | | 16,084,928 | | | | — | | | | — | | | | — | |
Endurance Business Media, Inc., Class A (Common Stocks) | | | — | | | | 6,480 | | | | 71,278 | | | | — | | | | — | | | | — | | | | — | |
Endurance Business Media, Inc. (Senior Loans)(2) | | | 3,373,813 | | | | — | | | | 682,339 | | | | 775,977 | | | | — | | | | — | | | | — | |
Freedom REIT (Common Stocks) | | | — | | | | 2,845,299 | | | | — | | | | 42,964,014 | | | | 681,706 | | | | 42,679,484 | | | | — | |
Genesys Ventures IA, L.P. (Common Stocks)(2) | | | — | | | | 24,000,000 | | | | 40,320,000 | | | | 13,992,000 | | | | — | | | | — | | | | — | |
LLV Holdco, LLC (Senior Loans)(2) | | | 7,879,521 | | | | — | | | | 5,234,227 | | | | 3,519,782 | | | | — | | | | — | | | | — | |
LLV Holdco, LLC (Common Stocks) | | | — | | | | 26,869 | | | | — | | | | — | | | | — | | | | — | | | | (4,558,190 | )(3) |
LLV Holdco, LLC (Warrants)(2) | | | — | | | | 4,575 | | | | — | | | | — | | | | — | | | | — | | | | — | |
Media General, Inc. (Common Stocks)(4) | | | — | | | | 4,938,971 | | | | 24,050,525 | | | | 111,620,744 | | | | — | | | | — | | | | — | |
Young Broadcasting Holding Co., Inc., (Warrants)(2) | | | — | | | | — | | | | 1,468,475 | | | | — | | | | — | | | | — | | | | — | |
| | | | | | | | | | | | | | | | | | | | | | | | | | | | |
| | $ | 47,203,377 | | | | 33,832,810 | | | $ | 107,277,073 | | | $ | 224,767,283 | | | $ | 681,706 | | | $ | 42,679,484 | | | $ | (4,558,190 | ) |
| | | | | | | | | | | | | | | | | | | | | | | | | | | | |
| (1) | Company is a wholly owned subsidiary of Communications Corp. of America. |
| (2) | No longer an affiliate as of December 31, 2013. |
| (3) | Amount represents return of capital. |
| (4) | Previously known as Young Broadcasting Holding Co., Inc., Class A. |
NOTES TO FINANCIAL STATEMENTS (continued)
| | |
| December 31, 2013 | | NexPoint Credit Strategies Fund |
Note 13. New Accounting Pronouncements
ASU 2013-08
In June 2013, FASB issued an update (“ASU 2013-08”) to ASC Topic 946, Financial Services — Investment Companies (“Topic 946”). ASU 2013-08 amends the guidance in Topic 946 for determining whether an entity qualifies as an investment company and requires certain additional disclosures. ASU 2013-08 is effective for interim and annual reporting periods in fiscal years that begin after December 15, 2013. Management is currently evaluating the impact, if any, of ASU 2013-08 on the Fund’s financial statements.
Note 14. Subsequent Events
Management has evaluated the impact of all subsequent events on the Fund through the date the financial statements were issued, and has determined that there were no subsequent events.
REPORT OF INDEPENDENT REGISTERED PUBLIC ACCOUNTING FIRM
To the Board of Trustees and Shareholders of Nexpoint Credit Strategies Fund:
In our opinion, the accompanying statement of assets and liabilities, including the investment portfolio, and the related statements of operations, of cash flows and of changes in net assets and the financial highlights present fairly, in all material respects, the financial position of Nexpoint Credit Strategies Fund (the “Fund”) at December 31, 2013, the results of its operations and its cash flows for the year then ended, the changes in its net assets for each of the two years in the period then ended and the financial highlights for each of the five years in the period then ended, in conformity with accounting principles generally accepted in the United States of America. These financial statements and financial highlights (hereafter referred to as “financial statements”) are the responsibility of the Fund’s management; our responsibility is to express an opinion on these financial statements based on our audits. We conducted our audits of these financial statements in accordance with the standards of the Public Company Accounting Oversight Board (United States). Those standards require that we plan and perform the audit to obtain reasonable assurance about whether the financial statements are free of material misstatement. An audit includes examining, on a test basis, evidence supporting the amounts and disclosures in the financial statements, assessing the accounting principles used and significant estimates made by management, and evaluating the overall financial statement presentation. We believe that our audits, which included confirmation of securities at December 31, 2013 by correspondence with the custodian and brokers, provide a reasonable basis for our opinion.
/s/ PricewaterhouseCoopers LLP
Dallas, Texas
February 28, 2014
ADDITIONAL INFORMATION (unaudited)
| | |
| December 31, 2013 | | NexPoint Credit Strategies Fund |
Additional Portfolio Information
The Investment Adviser and its affiliates manage other accounts, including registered and private funds and individual accounts. Although investment decisions for the Fund are made independently from those of such other accounts, the Investment Adviser may, consistent with applicable law, make investment recommendations to other clients or accounts that may be the same or different from those made to the Fund, including investments in different levels of the capital structure of a company, such as equity versus senior loans, or that involve taking contradictory positions in multiple levels of the capital structure. The Investment Adviser has adopted policies and procedures that address the allocation of investment opportunities, execution of portfolio transactions, personal trading by employees and other potential conflicts of interest that are designed to ensure that all client accounts are treated equitably over time. Nevertheless, this may create situations where a client could be disadvantaged because of the investment activities conducted by the Investment Adviser for other client accounts. When the Fund and one or more of such other accounts is prepared to invest in, or desires to dispose of, the same security, available investments or opportunities for each will be allocated in a manner believed by the Investment Adviser to be equitable to the fund and such other accounts. The Investment Adviser also may aggregate orders to purchase and sell securities for the Fund and such other accounts. Although the Investment Adviser believes that, over time, the potential benefits of participating in volume transactions and negotiating lower transaction costs should benefit all accounts including the Fund, in some cases these activities may adversely affect the price paid or received by the Fund or the size of the position obtained or disposed of by the Fund.
Tax Information
For shareholders that do not have a December 31, 2013 tax year end, this notice is for informational purposes only. For shareholders with a December 31, 2013 tax year end, please consult your tax adviser a to the pertinence of this notice. For the fiscal year ended December 31, 2013, the Fund hereby designates the following items with regard to distributions paid during the year.
| | | | | | | | | | |
Qualified
Dividends
and
Corporate
Dividends
Received
Deduction | | | Qualified
Dividend
Income
(15% tax
rate for
QDI) | | | Qualifying
Interest
Income | |
| | 4.36 | % | | | 5.21 | % | | | 80.55 | % |
Dividend Reinvestment Plan
Unless the registered owner of Common Shares elects to receive cash by contacting American Stock Transfer & Trust Company, LLC (“AST” or the “Plan Agent”), as agent for shareholders in administering the Fund’s dividend reinvestment plan (the “Plan”), all dividends declared for Common Shares of the Fund will be automatically reinvested by AST in additional Common Shares of the Fund. If a registered owner of Common Shares elects not to participate in the Plan, they will receive all dividends in cash paid by check mailed directly to them (or, if the shares are held in street or other nominee name, then to such nominee) by AST, as dividend disbursing agent. Shareholders may elect not to participate in the Plan and to receive all dividends in cash by sending written instructions or by contacting AST, as dividend disbursing agent, at the address set forth below. Participation in the Plan is completely voluntary and may be terminated or resumed at any time without penalty by contacting the Plan Agent before the dividend record date; otherwise such termination or resumption will be effective with respect to any subsequently declared dividend or other distribution. Some brokers may automatically elect to receive cash on the shareholders’ behalf and may reinvest that cash in additional Common Shares of the Fund for them. The Plan Agent will open an account for each shareholder under the Plan in the same name in which such shareholder’s Common Shares are registered. Whenever the Fund declares a dividend or other distribution (together, a “dividend”) payable in cash, non-participants in the Plan will receive cash and participants in the Plan will receive the equivalent in Common Shares. The Common Shares will be acquired by the Plan Agent for the participants’ accounts, depending upon the circumstances described below, either (i) through receipt of additional unissued but authorized Common Shares from the Fund (“newly issued Common Shares”) or (ii) by purchase of outstanding Common Shares on the open market (“open-market purchases”) on the New York Stock Exchange or elsewhere. If, on the payment date for any dividend, the market price per Common Share plus estimated brokerage commissions is greater than the net asset value per Common Share (such condition being referred to herein as “market premium”), the Plan Agent will invest the dividend amount in newly issued Common Shares, including fractional shares, on behalf of the participants. The number of newly issued Common Shares to be credited to each participant’s account will be determined by dividing the dollar amount of the dividend by the net asset value per Common Share on the payment date; provided that, if the net asset value per Common Share is less than 95% of the market price per Common Share on the payment date, the dollar amount of the dividend will be divided by 95% of the
ADDITIONAL INFORMATION (unaudited) (continued)
| | |
| December 31, 2013 | | NexPoint Credit Strategies Fund |
market price per Common Share on the payment date. If, on the payment date for any dividend, the net asset value per Common Share is greater than the market value per common share plus estimated brokerage commissions (such condition being referred to herein as “market discount”), the Plan Agent will invest the dividend amount in Common Shares acquired on behalf of the participants in open-market purchases. In the event of a market discount on the payment date for any dividend, the Plan Agent will have until the last business day before the next date on which the Common Shares trade on an “ex-dividend” basis or 120 days after the payment date for such dividend, whichever is sooner (the “last purchase date”), to invest the dividend amount in Common Shares acquired in open-market purchases. It is contemplated that the Fund will pay monthly dividends. Therefore, the period during which open-market purchases can be made will exist only from the payment date of each dividend through the date before the “ex-dividend” date of the third month of the quarter. If, before the Plan Agent has completed its open-market purchases, the market price of a Common Share exceeds the net asset value per Common Share, the average per Common Share purchase price paid by the Plan Agent may exceed the net asset value of the Common Shares, resulting in the acquisition of fewer common shares than if the dividend had been paid in newly issued Common Shares on the dividend payment date. Because of the foregoing difficulty with respect to open market purchases, if the Plan Agent is unable to invest the full dividend amount in open market purchases during the purchase period or if the market discount shifts to a market premium during the purchase period, the Plan Agent may cease making open-market purchases and may invest the uninvested portion of the dividend amount in newly issued Common Shares at the net asset value per Common Share at the close of business on the last purchase date; provided that, if the net asset value per Common Share is less than 95% of the market price per Common Share on the payment date, the dollar amount of the dividend will be divided by 95% of the market price per Common Share on the payment date. The Plan Agent maintains all shareholders’ accounts in the Plan and furnishes written confirmation of all transactions in the accounts, including information needed by shareholders for tax records. Common Shares in the account of each Plan participant will be held by the Plan Agent on behalf of the Plan participant, and each shareholder proxy will include those shares purchased or received pursuant to the Plan. The Plan Agent will forward all proxy solicitation materials to participants and vote proxies for shares held under the Plan in accordance with the instructions of the participants. In the case of shareholders such as banks, brokers or nominees which hold shares for others who are
the beneficial owners, the Plan Agent will administer the Plan on the basis of the number of Common Shares certified from time to time by the record shareholder’s name and held for the account of beneficial owners who participate in the Plan. There will be no brokerage charges with respect to Common Shares issued directly by the Fund. However, each participant will pay a pro rata share of brokerage commissions incurred in connection with open-market purchases. The automatic reinvestment of dividends will not relieve participants of any federal, state or local income tax that may be payable (or required to be withheld) on such dividends. Accordingly, any taxable dividend received by a participant that is reinvested in additional Common Shares will be subject to federal (and possibly state and local) income tax even though such participant will not receive a corresponding amount of cash with which to pay such taxes. Participants who request a sale of shares through the Plan Agent are subject to a $2.50 sales fee and pay a brokerage commission of $0.05 per share sold. The Fund reserves the right to amend or terminate the Plan. There is no direct service charge to participants in the Plan; however, the Fund reserves the right to amend the Plan to include a service charge payable by the participants. All correspondence concerning the Plan should be directed to the Plan Agent at American Stock Transfer & Trust Company, LLC 6201 15th Avenue Brooklyn, NY 11219; telephone (877) 665-1287.
Shareholder Loyalty Program
To promote loyalty and long-term alignment of interests among the Trust’s shareholders, the Adviser offers an incentive to shareholders that buy and hold the Trust’s common shares for a period of at least twelve months through its Shareholder Loyalty Program (the “Program”). To participate in the Program, existing shareholders must open an account (the “Account”) with the Program’s administrator, American Stock Transfer & Trust Company (“AST”). Subsequently, if a participant makes contributions to the Account during a defined trading period to purchase shares, the Adviser will make a corresponding contribution to create an effective 2% gross up of the participant’s contributions. More specifically, the Adviser’s contribution will account for 2% of the total sum contributed by both the participant and the Adviser. For example, if a participant contributes $10,000 to the Account during a defined trading period to purchase shares, the Adviser will make a corresponding contribution of $204.08, or 2% of $10,204.08, to purchase additional shares for the participant (the “Bonus Shares”). In addition, Program participants will not be required to pay any customary selling commissions or distribution fees on the purchase of shares under the Program. The Adviser will bear the costs of brokerage fees in connection with the Program. While the
ADDITIONAL INFORMATION (unaudited) (continued)
| | |
| December 31, 2013 | | NexPoint Credit Strategies Fund |
portion of the Trust’s common shares that are acquired through the participant’s contribution will vest immediately, Bonus Shares will not vest until the first anniversary of the date that the Bonus Shares were purchased. Vested shares will be held in the Account and Bonus Shares will be held in an account at AST for the conditional benefit of the shareholder. Under the Program, participants must purchase a minimum of $10,000 worth of shares in the initial subscription and $5,000 in each subsequent subscription, unless the Adviser, in its sole discretion, decides to permit subscriptions for a lesser amount. If the Trust’s common shares are trading at a discount, AST will purchase common shares on behalf of participants in open-market purchases. If the Trust’s common shares are trading at a premium, AST may purchase common shares on behalf of participants in open market purchases or the Trust may sell common shares to the Shareholder Loyalty Program by means of a prospectus or otherwise. All dividends received on shares that are purchased under the Program will be automatically reinvested through the Program. A participant’s interest in a dividend paid to the holder of a vested share will vest immediately. A participant’s interest in a dividend paid to the holder of a Bonus Share will vest at the same time that the Bonus Share’s vesting requirements are met. In addition, for dividends paid to holders of shares that were purchased with a participant’s contributions, the Adviser will make a corresponding contribution to the amount of the reinvested dividend to create an effective 2% gross up of the dividend amount. AST maintains all shareholders’ accounts in the Program and furnishes written confirmation of all transactions in the accounts, including information needed by shareholders for tax records. Shares in the account of each Program participant will be held by AST on behalf of the Program participant, and each shareholder proxy will include those shares purchased or received pursuant to a Program. AST will forward all proxy solicitation materials to participants and vote proxies for shares held under the Program in accordance with the instructions of the participants. In the case of shareholders such as banks, brokers or nominees which hold shares for others who are the beneficial owners, AST will administer the Program on the basis of the number of common shares certified from time to time by the record shareholder’s name and held for the account of beneficial owners who participate in the Program. The Trust and the Adviser reserve the right to amend or terminate the Program. To help align the interests of the Adviser’s employees with the interests of the Trust’s shareholders, the Adviser offers a similar program to its employees. Participants in the Program should be aware that their receipt of Bonus Shares under the Program constitutes taxable income to them. In addition, such participants owe taxes on that portion of any distribution that
constitutes taxable income in respect of shares of our common stock held in their Program accounts, whether or not such shares of common stock have vested in the hands of the participants. To the extent any payments or distributions under the Program are subject to U.S. federal, state or local taxes, the Trust, any participating affiliate of the Trust or the agent for the Program may satisfy its tax withholding obligation by (1) withholding shares of Stock allocated to the participant’s account, (2) deducting cash from the participant’s account or (3) deducting cash from any other compensation the participant may receive. Program participants should consult their tax advisers regarding the tax consequences to them of participating in the Program.
Approval of Investment Advisory Agreement for NexPoint Credit Strategies Fund
The Fund has retained the Investment Adviser (the “Adviser”) to manage the assets of the Fund pursuant to an Investment Advisory Agreement between the Adviser and the Fund (the “Advisory Agreement”). The Advisory Agreement has been approved by the Fund’s Board of Trustees, including a majority of the Independent Trustees.
Following an initial two-year term, the Advisory Agreement continues in effect from year-to-year, provided such continuance is specifically approved at least annually by the vote of holders of at least a majority of the outstanding shares of the Fund or by the Board of Trustees and, in either event, by a majority of the Independent Trustees of the Fund casting votes in person at a meeting called for such purpose.
The Board of Trustees held a meeting of the board on August 29, 2013, at which meeting they gave preliminary consideration to information bearing on the continuation of the Advisory Agreement for a one-year period commencing December 31, 2013. The primary purpose of the meeting was to ensure that the Trustees had ample opportunity to consider matters they deemed relevant in considering the continuation of the Advisory Agreement, and to request any additional information they considered reasonably necessary to their deliberations, without undue time constraints.
At a meeting held on September 12-13, 2013, the Board of Trustees, including the Independent Trustees, approved the continuance of the Advisory Agreement. As part of its review process, the Board of Trustees requested, through Fund counsel and its independent legal counsel, and received from the Adviser, various information and written materials in connection with meetings of the Board of Trustees held on August 29, 2013 and September 12-13, 2013, including: (1) information regarding the financial soundness of the Adviser and the profitability of the
ADDITIONAL INFORMATION (unaudited) (continued)
| | |
| December 31, 2013 | | NexPoint Credit Strategies Fund |
Advisory Agreement to the Adviser; (2) information on the advisory and compliance personnel of the Adviser, including compensation arrangements; (3) information on the internal compliance procedures of the Adviser; (4) comparative information showing how the Fund’s proposed and actual fees and anticipated and actual operating expenses compare to those of other registered investment companies that follow investment strategies similar to that of the Fund; (5) information on the investment performance of the Fund, including comparisons of the Fund’s performance against that of other registered investment companies that follow investment strategies similar to that of the Fund; (6) information regarding brokerage and portfolio transactions; and (7) information on any legal proceedings or regulatory audits or investigations affecting the Adviser. The Trustees also relied on information provided in connection with the initial approval of the Advisory Agreement, as well as new information specifically relating to changes from such time, and information provided at periodic meetings of the Trustees over the course of the year. In addition, the Trustees received an independent report from Keil Fiduciary Strategies (“KFS”) , an independent source of investment company data, relating to the Fund’s performance, volatility and expenses compared to the performance, volatility and expenses of a relatively small peer group determined by Keil Fiduciary Strategies to be comparable. The Trustees also reviewed various factors discussed in independent counsel’s legal memorandum, the detailed information provided by the Adviser and other relevant information and factors. The Trustees’ conclusions as to the approval of the Advisory Agreement were based on a comprehensive consideration of all information provided to the Trustees without any single factor being dispositive in and of itself. Some of the factors that figured particularly in the Trustees’ deliberations are described below, although individual Trustees may have evaluated the information presented differently from one another, giving different weights to various factors.
The nature, extent, and quality of the services to be provided by the Adviser — The Board of Trustees considered the portfolio management services to be provided by the Adviser under the Advisory Agreement and the activities related to portfolio management, including use of technology, research capabilities, and investment management staff. The Board of Trustees discussed the relevant experience and qualifications of the personnel providing advisory services, including the background and experience of the members of the Fund’s portfolio management team. The Trustees reviewed the management structure, assets under management and investment philosophies and processes of the Adviser. The Trustees also reviewed and discussed information regarding the
Adviser’s compliance policies, procedures and personnel, including compensation arrangements. The Trustees concluded that the Adviser had the quality and depth of personnel and investment methods essential to performing its duties under the Advisory Agreement, and that the nature and the quality of such advisory services were satisfactory.
The Adviser’s Historical Performance in Managing the Fund — The Board of Trustees reviewed the historical performance of the Adviser and the Fund’s portfolio management teams in managing the Fund over various time periods and reflected on previous discussions regarding matters bearing on the Adviser’s performance at their meetings throughout the year. With respect to the Fund, the Trustees discussed relative performance and contrasted the performance of the Fund and its portfolio management team versus that of the Fund’s peers, as represented by certain other registered investment companies that follow investment strategies similar to the Fund as well as comparable indices.
The Fund outperformed its peer group in the one-year period and three-year period and underperformed its peer group in the five year period. The Board of Trustees considered the expenses of the Fund in relation to a combination of three Morningstar categories (multisector bond, conservative allocation (the Fund’s category) and high yield bond), due to the unique nature of the fund as compared to potential peers. The Trustees considered the Fund’s management fee in that context, and determined that the fees were reasonable in relation to the services rendered.
The Trustees concluded that the Fund’s performance and other relevant factors supported the renewal of the Advisory Agreement. While performance lagged that of a relevant peer group for certain (although not necessarily all) periods, the Trustees concluded that other factors relevant to performance supported renewal of the Advisory Agreement, including that underperformance was attributable, to a significant extent, to investment decisions (such as security selection or sector allocation) by the Adviser that were reasonable and consistent with the Fund’s investment objective and policies.
The costs of the services to be provided by the Adviser and the profits to be realized by the Adviser and its affiliates from the relationship with the Fund — The Board of Trustees also gave substantial consideration to the fees payable under the Advisory Agreement, the expenses the Adviser incurs in providing advisory services and the profitability to the Adviser of managing the Fund, including: (1) information regarding the financial condition of the Adviser; (2) information regarding the total fees and payments received by the Adviser for its services and
ADDITIONAL INFORMATION (unaudited) (continued)
| | |
| December 31, 2013 | | NexPoint Credit Strategies Fund |
whether such fees are appropriate given economies of scale and other considerations; (3) comparative information showing (a) the fees payable under the Advisory Agreement and the actual fees paid by the Fund to the Adviser versus the investment advisory fees of certain registered investment companies and private pooled vehicles that follow investment strategies similar to that of the Fund and (b) the expense ratios of the Fund versus the expense ratios of certain registered investment companies that follow investment strategies similar to that of the Fund; and (4) information regarding the total fees and payments received and to the Fund under separate agreements and whether such fees are appropriate. The Trustees also considered the so-called “fall-out benefits” to the Adviser with respect to the Fund, such as the reputational value of serving as Adviser to the Fund, potential fees paid to the Adviser’s affiliates by a Fund or portfolio companies for services provided, including administrative services provided to the Fund by the Adviser pursuant to separate agreements, and the benefits of research made available to the Adviser by reason of brokerage commissions (if any) generated by the Fund’s securities transactions. After such review, the Trustees determined that the anticipated profitability rates to the Adviser with respect to the Advisory Agreement were fair and reasonable.
The extent to which economies of scale would be realized as the Fund grows and whether fee levels reflect these economies of scale for the benefit of shareholders — The Board of Trustees considered the asset levels of the Fund, the information provided by the Adviser relating to its costs and information comparing the fee rates charged by the Adviser with fee rates charged by other unaffiliated investment advisers to their clients. The Trustees concluded that the fee structure is reasonable, and appropriately should result in a sharing of economies of scale in view of the information provided by the Adviser. The Board determined to continue to review ways, and the extent to which, economies of scale might be shared between the Adviser on the one hand and shareholders of the Fund on the other.
Conclusion — Following a further discussion of the factors above and the merits of the Advisory Agreement and its various provisions, it was noted that in considering the approval of the Advisory Agreement, no single factor was determinative to the decision of the Board of Trustees. Rather, after weighing all of the factors and reasons discussed above, the Trustees, including the Independent Trustees, unanimously agreed that the Advisory Agreement, including the advisory fees to be paid to the Adviser, is fair and reasonable to the Fund in light of the services that the Adviser provides, the expenses that it incurs and the reasonably foreseeable asset levels of the Fund.
ADDITIONAL INFORMATION (unaudited) (continued)
| | |
| December 31, 2013 | | NexPoint Credit Strategies Fund |
Trustees and Officers
The Board of Trustees (“Board”) provides broad oversight of the operations and affairs of the Funds and protects the interests of shareholders. The Board has overall responsibility to manage and control the business affairs of the Funds, including the complete and exclusive authority to establish policies regarding the management, conduct and operation of the Funds’ business. The names and birth dates of the Trustees and officers of the Funds, the year each was first elected or appointed to office, their principal business occupations during the last five years, the number of funds overseen by each Trustee and other directorships or trusteeships they hold are shown below. The business address for each Trustee and officer of the Funds is c/o Highland Capital Management Fund Advisors, L.P., 200 Crescent Court, Suite 700, Dallas, Texas 75201. The Statement of Additional Information includes additional information about the Trustees and is available, without charge, upon request, by calling (877) 665-1287.
| | | | | | | | | | |
| Name and Date of Birth | | Position(s)
with the Funds | | Term of Office
and Length of
Time Served1 | | Principal Occupation(s) During Past Five Years | | Number of Portfolios
in Highland Fund
Complex Overseen
by Trustee2 | | Other
Directorships/
Trusteeships
Held |
|
| Independent Trustees |
| | | | | |
Timothy K. Hui (6/13/1948) | | Trustee | | Indefinite Term; Trustee since inception in 2006 | | Dean of Educational Resources since July 2012 and from July 2006 to January 2008, Vice President from February 2008 to June 2012, and Assistant Provost for Graduate Education from July 2004 to June 2006 at Cairn University. | | 16 | | None |
| | | | | |
Bryan A. Ward (2/4/1955) | | Trustee | | Indefinite Term; Trustee since inception in 2006 | | Senior Manager, Accenture, LLP (a consulting firm) since January 2002. | | 16 | | None |
| | | | | |
Terrence O. Jones (7/3/1963) | | Trustee | | Indefinite Term; Trustee since December 2013 | | Chief Investment Officer, Banco Santander/Optimal Investments from November 2008 to April 2009; Founder and President, Battersby Capital Management LLC from January 2006 to November 2008; and Managing Director, Goldman Sachs Hedge Fund Strategies from December 2001 to December 2005. | | 16 | | Genworth
Life
Insurance
Company
of New
York;
Father
Judge |
ADDITIONAL INFORMATION (unaudited) (continued)
| | |
| December 31, 2013 | | NexPoint Credit Strategies Fund |
Trustees and Officers
| | | | | | | | | | |
| Name and Date of Birth | | Position(s)
with the Funds | | Term of Office
and Length of
Time Served1 | | Principal Occupation(s) During Past Five Years | | Number of Portfolios
in Highland Fund
Complex Overseen
by Trustee2 | | Other
Directorships/
Trusteeships
Held |
|
| Independent Trustees |
| | | | | |
Dr. Bob Froehlich
(4/28/1953) | | Trustee | | Indefinite Term; Trustee since December 2013 | | Executive Vice President and Chief Investment Strategist, The Hartford Mutual Funds from 2009 until retirement in 2012; Vice Chairman of Deutsche Asset Management from 2002 to 2009. | | 16 | | Director of American
Realty Capital
Finance Trust, Inc.;
Director of KC
Concession, Inc.;
Trustee of American
AR Capital Real
Estate Fund;
Director of American
Realty Capital
Healthcare Trust II;
Director, American
Realty Capital Daily
Net Asset Value
Trust, Inc.; Director
of American Sports
Enterprise, Inc.;
Director of Davidson
Investment Advisors. |
|
| Interested Trustees |
| | | | | |
John Honis3
(6/16/1958) | | Trustee | | Indefinite Term; Trustee since July 2013. | | President of Rand Advisors, LLC since August 2013; Partner of Highland Capital Management, L.P. (“HCM”) | | 16 | | None |
| | | | | |
Ethan Powell3
(6/20/1975) | | Trustee; Chairman of the Board; Executive Vice President and Secretary (Principal Executive Officer) | | Indefinite Term; Trustee since December 2013; Chairman of the Board since December 2013; Executive Vice President since June 2012; Secretary since November 2010 | | Trustee of NexPoint Credit Strategies Fund (“NHF”), Highland Funds II, Highland Funds I and Highland Special Situations Fund (“HSSF”) from June 2012 until July 2013; Chief Product Strategist of NexPoint Advisors, L.P. and HCMFA since 2012; Senior Retail Fund Analyst of HCM since 2007 and of HCMFA since its inception and Secretary of the funds in the Highland Fund Complex since November 2010. | | 16 | | None |
ADDITIONAL INFORMATION (unaudited) (continued)
| | |
| December 31, 2013 | | NexPoint Credit Strategies Fund |
Trustees and Officers
| | | | | | |
Name and Date of Birth | | Position(s)
with the Funds | | Term of
Office and
Length of
Time Served | | Principal Occupation(s) During Past Five Years |
|
| Officers |
| | | |
Brian Mitts
(8/26/1970) | | Treasurer (Principal Accounting Officer and Principal Financial Officer) | | Indefinite Term; Treasurer since November 2010 | | Chief Financial Officer and Financial and Operations Principal of Highland Capital Funds Distributor, Inc. since November 2013; Chief Operations Officer of HCMFA since 2012; Senior Retail Fund Analyst of Highland Capital Management, L.P. (“HCM”) since 2007 and HCMFA since its inception; Principal Accounting Officer and Treasurer of the funds in the Highland Fund Complex since November 2010; Manager of Financial Reporting at HBK Investments (a hedge fund) from 2005 to 2007. |
| | | |
Ethan Powell (6/20/1975) | | Trustee; Chairman of the Board; Executive Vice President and Secretary (Principal Executive Officer) | | Indefinite Term; Trustee since December 2013; Chairman of the Board since December 2013; Executive Vice President since June 2012; Secretary since November 2010 | | Chief Product Strategist of HCMFA since 2012; Senior Retail Fund Analyst of HCM since 2007 and HCMFA since its inception; and Secretary of the funds in the Highland Fund Complex since November 2010; Manager in the Merger and Acquisitions Division at Ernst & Young from 1999 to 2007. |
| | | |
Alan Head (8/5/1973) | | Chief Compliance Officer | | Indefinite Term; Chief Compliance Officer since January 2012 | | Chief Compliance Officer of Highland Capital Funds Distributor, Inc. since November 2013; Compliance Director at HCM and Chief Compliance Officer of NexBank Securities, Inc. (an affiliated broker-dealer) since November 2010; President of NexBank Securities, Inc. since November 2011;Vice President, Manager of Reporting and Research from May 2008 to September 2010 and Compliance; Manager from August 2005 to May 2008 at Capital Institutional Services. |
| | | |
Dustin Norris (1/6/1984) | | Assistant Treasurer | | Indefinite Term; Assistant Treasurer since November 2012 | | Senior Accounting Manager at HCMFA since August 2012; Assistant Treasurer of the Funds in the Highland Fund Complex since November 2012; Fund Accountant at HCM from June 2010 to August 2012; Auditor at Deloitte & Touche LLP from 2009 to June 2010. |
| 1 | One on annual basis, as a matter of Board policy, the Governance Committee reviews each Trustee’s performance and determines whether to extend each such Trustee’s service for another year. Effective June 2013, the Board adopted a retirement policy wherein the Governance Committee shall not recommend the continued service as a Trustee of a Board member who is older than 80 years of age at the time the Governance Committee reports its findings to the Board. |
| 2 | The “Highland Fund Complex” consists of all of the registered investment companies overseen by the Board and advised by the Adviser or an affiliated person of the Adviser as of the date of this report. |
| 3 | Mr. Powell is deemed to be an “interested person” of the Funds under the 1940 Act because of his position with HCMFA. Mr. Honis is deemed to be an “interested person” of the Fund under the 1940 Act because of his affiliation with Highland Capital Management, L.P., an affiliate of HCMFA. |
IMPORTANT INFORMATION ABOUT THIS REPORT
Investment Adviser
NexPoint Advisors, L.P.
200 Crescent Court, Suite 700
Dallas, TX 75201
Transfer Agent
American Stock Transfer & Trust Company, LLC
6201 15th Avenue
Brooklyn, NY 11219
Custodian
State Street Bank and Trust Company
One Lincoln Street
Boston, MA 02111
Independent Registered Public Accounting Firm
PricewaterhouseCoopers LLP
2001 Ross Avenue, Suite 1800
Dallas, TX 75201
Fund Counsel
Ropes & Gray LLP
Prudential Tower
800 Boylston Street
Boston, MA 02199-3600
This report has been prepared for shareholders of NexPoint Credit Strategies Fund (the “Fund”). The Fund mails one shareholder report to each shareholder address. If you would like more than one report, please call shareholder services at 1-866-351-4440 to request that additional reports be sent to you.
A description of the policies and procedures that the Fund uses to determine how to vote proxies relating to its portfolio securities, and the Fund’s proxy voting record for the most recent 12-month period ended June 30, are available (i) without charge, upon request, by calling 1-866-351-4440 and (ii) on the SEC’s website at http://www.sec.gov.
The Fund files its complete schedule of portfolio holdings with the SEC for the first and third quarters of each fiscal year on Form N-Q. The Fund’s Forms N-Q are available on the SEC’s website at http://www.sec.gov and also may be reviewed and copied at the SEC’s Public Reference Room in Washington, DC. Information on the Public Reference Room may be obtained by calling 1-800-SEC-0330. Shareholders may also obtain the Form N-Q by visiting the Fund’s website at www.NexPointAdvisors.com.
On July 2, 2013, the Fund submitted a CEO annual certification to the New York Stock Exchange (“NYSE”) on which the Fund’s principal executive officer certified that he was not aware, as of the date, of any violation by the Fund of the NYSE’s Corporate Governance listing standards. In addition, as required by Section 302 of the Sarbanes-Oxley Act of 2002 and related SEC rules, the Fund’s principal executive officer and principal financial officer made quarterly certifications, included in filings with the SEC on Forms N-CSR and N-Q relating to, among other things, the Fund’s disclosure controls and procedures and internal controls over financial reporting, as applicable.

6201 15th Avenue
Brooklyn, NY 11219

| | |
| NexPoint Credit Strategies Fund | | Annual Report, December 31, 2013 |
| | |
| www.nexpointadvisors.com | | NexPoint-HCF-AR-12/13 |
Item 2. Code of Ethics.
| (a) | The registrant, as of the end of the period covered by this report, has adopted a code of ethics that applies to the registrant’s principal executive officer, principal financial officer, principal accounting officer or controller, or persons performing similar functions, regardless of whether these individuals are employed by the registrant or a third party. |
| (c) | There have been no amendments, during the period covered by this report, to a provision of the code of ethics that applies to the registrant’s principal executive officer, principal financial officer, principal accounting officer or controller, or persons performing similar functions, regardless of whether these individuals are employed by the registrant or a third party, and that relates to any element of the code of ethics description. |
| (d) | The registrant has not granted any waivers, including an implicit waiver, from a provision of the code of ethics that applies to the registrant’s principal executive officer, principal financial officer, principal accounting officer or controller, or persons performing similar functions, regardless of whether these individuals are employed by the registrant or a third party, that relates to one or more of the items set forth in paragraph (b) of this item’s instructions. |
| (f) | The registrant’s code of ethics is attached. |
Item 3. Audit Committee Financial Expert.
As of the end of the period covered by the report, the registrant’s board of trustees has determined that Bryan Ward is qualified to serve as an audit committee financial expert serving on its audit committee and that he is “independent,” as defined by Item 3 of Form N-CSR.
Item 4. Principal Accountant Fees and Services.
Audit Fees
| (a) | The aggregate fees billed for each of the last two fiscal years for professional services rendered by the principal accountant for the audit of the registrant’s annual financial statements or services that are normally provided by the accountant in connection with statutory and regulatory filings or engagements for those fiscal years are $124,000 for 2012 and $204,500 for 2013. |
Audit-Related Fees
| (b) | The aggregate fees billed in each of the last two fiscal years for assurance and related services by the principal accountant that are reasonably related to the performance of the audit of the registrant’s financial statements and are not reported under paragraph (a) of this Item $8,500 for 2012 and $8,500 for 2013. The nature of the services related to agreed-upon procedures, performed on the Fund’s semi-annual financial statements. |
Tax Fees
| (c) | The aggregate fees billed in each of the last two fiscal years for professional services rendered by the principal accountant for tax compliance, tax advice, and tax planning are $9,000 for 2012 and $9,833 for 2013. The nature of the services related to assistance on the Fund’s tax returns and excise tax calculations. |
All Other Fees
| (d) | The aggregate fees billed in each of the last two fiscal years for products and services provided by the principal accountant, other than the services reported in paragraphs (a) through (c) of this Item are $0 for 2012 and $0 for 2013. |
| (e)(1) | Disclose the audit committee’s pre-approval policies and procedures described in paragraph (c)(7) of Rule 2-01 of Regulation S-X: |
The Audit Committee shall:
(a) have direct responsibility for the appointment, compensation, retention and oversight of the Fund’s independent auditors and, in connection therewith, to review and evaluate matters potentially affecting the independence and capabilities of the auditors; and
(b) review and pre-approve (including associated fees) all audit and other services to be provided by the independent auditors to the Fund and all non-audit services to be provided by the independent auditors to the Fund’s investment adviser or any entity controlling, controlled by or under common control with the investment adviser (an “Adviser Affiliate”) that provides ongoing services to the Fund, if the engagement relates directly to the operations and financial reporting of the Fund; and
(c) establish, to the extent permitted by law and deemed appropriate by the Audit Committee, detailed pre-approval policies and procedures for such services; and
(d) consider whether the independent auditors’ provision of any non-audit services to the Fund, the Fund’s investment adviser or an Adviser Affiliate not pre-approved by the Audit Committee are compatible with maintaining the independence of the independent auditors.
| (e)(2) | The percentage of services described in each of paragraphs (b) through (d) of this Item that were approved by the audit committee pursuant to paragraph (c)(7)(i)(C) of Rule 2-01 of Regulation S-X are as follows: |
(b) 100%
(c) 100%
(d) N/A
| (f) | The percentage of hours expended on the principal accountant’s engagement to audit the registrant’s financial statements for the most recent fiscal year that were attributed to work performed by persons other than the principal accountant’s full-time, permanent employees was less than fifty percent. |
| (g) | The aggregate non-audit fees billed by the registrant’s accountant for services rendered to the registrant, and rendered to the registrant’s investment adviser (not including any sub-adviser whose role is primarily portfolio management and is subcontracted with or overseen by another investment adviser), and any entity controlling, controlled by, or under common control with the adviser that provides ongoing services to the registrant for each of the last two fiscal years of the registrant was $475,000 for 2012 and $475,000 for 2013. |
| (h) | The registrant’s audit committee of the board of directors has considered whether the provision of non-audit services that were rendered to the registrant’s investment adviser (not including any sub-adviser whose role is primarily portfolio management and is subcontracted with or overseen by another investment adviser), and any entity controlling, controlled by, or under common control with the investment adviser that provides ongoing services to the registrant that were not pre-approved pursuant to paragraph (c)(7)(ii) of Rule 2-01 of Regulation S-X is compatible with maintaining the principal accountant’s independence. |
Item 5. Audit Committee of Listed Registrants.
The Registrant has a separately-designated standing audit committee established in accordance with Section 3(a)(58)(A) of the Securities Exchange Act of 1934, as amended. It is composed of the following Directors, each of who is not an “interested person” as defined in the 1940 Act:
Timothy K. Hui
Bryan A. Ward
Dr. Bob Froehlich
Terrence O. Jones
Item 6. Investments.
| (a) | Schedule of Investments in securities of unaffiliated issuers as of the close of the reporting period is included as part of the report to shareholders filed under Item 1 of this form. |
Item 7. Disclosure of Proxy Voting Policies and Procedures for Closed-End Management Investment Companies.
NEXPOINT ADVISORS, L.P.
PROXY VOTING POLICY
General Principals
This Policy applies to securities held in Client accounts (including registered investment companies and other pooled investment vehicles) as to which the Company has voting authority, directly or indirectly. Indirect voting authority exists where the Company’s voting authority is implied by a general delegation of investment authority without reservation of proxy voting authority.
The Company shall vote proxies in respect of securities owned by or on behalf of a Client in the Client’s best economic interests and without regard to the interests of the Company or any other Client of the Company.
Voting Procedures
Monitoring
A member of the settlement group (the “settlement designee”) of the Company shall have responsibility for monitoring portfolios managed by the Company for securities subject to a proxy vote. Upon the receipt of a proxy notice related to a security held in a portfolio managed by the Company, the settlement designee shall forward all relevant information to the Portfolio Manager(s) with responsibility for the security. The Portfolio Manager(s) may consult a member of the settlement group as necessary.
Voting
Upon receipt of notice from the settlement designee, the Portfolio Manager(s) of the fund(s) in which the security subject to a proxy vote shall evaluate the subject matter of the proxy and cause the proxy to be voted on behalf of the Client in accordance with the Guidelines set forth below.
Guidelines
In determining how to vote a particular proxy, the Portfolio Manager(s) shall consider, among other things, the interests of each Client account as it relates to the subject matter of the proxy, any potential conflict of interest the Company may have in voting the proxy on behalf of the Client and the procedures set forth in this Policy. This Policy is designed to be implemented in a manner reasonably expected to ensure that voting rights are exercised in the best interests of the Company’s clients. Each proxy is voted on a case-by-case basis taking into consideration any relevant contractual obligations as well as other relevant facts and circumstances. In general, the Company reviews and considers corporate governance issues related to proxy matters and generally supports proposals that foster good corporate governance practices. Portfolio manager(s) may vote proxies as recommended by the security issuers management on routine matters related to the operation of the issuer and on matters not expected to have a significant impact on the issuer and/or its shareholders, because the Company believes that recommendations by the issuer are generally in shareholders’ best interests, and therefore in the best economic interest of the Company’s clients.
Conflicts of Interest
If the Portfolio Manager(s) determine that the Company may have a potential material conflict of interest (as defined in Section 3 of this Policy) in voting a particular proxy, the Portfolio Manager(s) shall contact the Company’s compliance department prior to causing the proxy to be voted.
For a security held by a an investment company, the Company shall disclose the conflict and its reasoning for voting as it did to the Retail Fund’s Board of Trustees at the next regularly scheduled quarterly meeting. In voting proxies for securities held by an investment company, the Company may consider only the interests of the Fund. It is the responsibility of the compliance department to document the basis for the decision and furnish the documentation to the Board of Trustees. The Company may resolve the conflict of interest by following the proxy voting recommendation of a disinterested third party (such as ISS, Glass Lewis, or another institutional proxy research firm).
Non-Votes
The Company may determine not to vote proxies in respect of securities of any issuer if it determines it would be in its Client’s overall best interests not to vote. Such determination may apply in respect of all Client holdings of the securities or only certain specified Clients, as the Company deems appropriate under the circumstances. As examples, the Portfolio Manager(s) may determine: (a) not to recall securities on loan if, in its judgment, the matters being voted upon are not material events affecting the securities and the negative consequences to Clients of disrupting the securities lending program would outweigh the benefits of voting in the particular instance or (b) not to vote certain foreign securities positions if, in its judgment, the expense and administrative inconvenience outweighs the benefits to Clients of voting the securities.
Recordkeeping
Following the submission of a proxy vote, the applicable Portfolio Manager(s) shall submit a report of the vote to a settlement designee of the Company. Records of proxy votes by the Company shall be maintained in accordance with the Recordkeeping section of this Policy.
Material Conflicts of Interest
Voting the securities of an issuer where the following relationships or circumstances exist are deemed to give rise to a material conflict of interest for purposes of this Policy:
| | (i) | The issuer is a Client of the Company, or of an affiliate, accounting for more than 5% of the Company’s or affiliate’s annual revenues. |
| | (ii) | The issuer is an entity that reasonably could be expected to pay the Company or its affiliates more than $1 million through the end of the Company’s next two full fiscal years. |
| | (iii) | The issuer is an entity in which a “Covered Person” (as defined in the Company’s Policies and Procedures Designed to Detect and Prevent Insider Trading and to Comply with Rule 17j-1 of the Investment Company Act of 1940, as amended (the “Code of Ethics”)) has a beneficial interest contrary to the position held by the Company on behalf of Clients. |
| | (iv) | The issuer is an entity in which an officer or partner of the Company or a relative of any such person is or was an officer, director or employee, or such person or relative otherwise has received more than $150,000 in fees, compensation and other payment from the issuer during the Company’s last three fiscal years; provided, however, that the Compliance Department may deem such a relationship not to be a material conflict of interest if the Company representative serves as an officer or director of the issuer at the direction of the Company for purposes of seeking control over the issuer. |
| | (v) | The matter under consideration could reasonably be expected to result in a material financial benefit to the Company or its affiliates through the end of |
the Company’s next two full fiscal years (for example, a vote to increase an investment advisory fee for a Fund advised by the Company or an affiliate).
| | (vi) | Another Client or prospective Client of the Company, directly or indirectly, conditions future engagement of the Company on voting proxies in respect of any Client’s securities on a particular matter in a particular way. |
| | (vii) | The Company holds various classes and types of equity and debt securities of the same issuer contemporaneously in different Client portfolios. |
| | (viii) | Any other circumstance where the Company’s duty to serve its Clients’ interests, typically referred to as its “duty of loyalty,” could be compromised. |
Notwithstanding the foregoing, a conflict of interest described in Section 3.1 shall not be considered material for the purposes of this Policy in respect of a specific vote or circumstance if:
| | (i) | The securities in respect of which the Company has the power to vote account for less than 1% of the issuer’s outstanding voting securities, but only if: (i) such securities do not represent one of the 10 largest holdings of such issuer’s outstanding voting securities and (ii) such securities do not represent more than 2% of the Client’s holdings with the Company. |
| | (ii) | The matter to be voted on relates to a restructuring of the terms of existing securities or the issuance of new securities or a similar matter arising out of the holding of securities, other than common equity, in the context of a bankruptcy or threatened bankruptcy of the issuer. |
Recordkeeping
The Company shall retain records relating to the voting of proxies, including:
| | (i) | Copies of this Policy and any amendments thereto; |
| | (ii) | A copy of each proxy statement that the Company receives regarding Client securities. |
| | (iii) | Records of each vote cast by the Company on behalf of Clients. |
| | (iv) | A copy of any documents created by the Company that were material to making a decision how to vote or that memorializes the basis for that decision. |
| | (v) | A copy of each written request for information on how the Company voted proxies on behalf of the Client, and a copy of any written response by the Company to any (oral or written) request for information on how the Company voted. |
These records shall be maintained and preserved in an easily accessible place for a period of not less than five years from the end of the Company’s fiscal year during which the last entry was made in the records, the first two years in an appropriate office of the Company.
The Company may rely on proxy statements filed on the SEC’s EDGAR system or on proxy statements and records of votes cast by the Company maintained by a third party, such as a proxy voting service (provided the Company had obtained an undertaking from the third party to provide a copy of the proxy statement or record promptly on request).
Records relating to the voting of proxies for securities held by investment company clients will be reported periodically, as requested, to the investment company’s Board of Trustees and, to the SEC on an annual basis pursuant to Form N-PX.
Item 8. Portfolio Managers of Closed-End Management Investment Companies.
| (a)(1) | Identification of Portfolio Manager(s) or Management Team Members and Description of Role of Portfolio Manager(s) or Management Team Members |
The Fund’s portfolio manager, who is primarily responsible for the day-to-day management of the Fund’s portfolio, is James Dondero.
James Dondero – Mr. Dondero has over 25 years of experience in the credit markets. In addition to his role at NexPoint Advisors, L.P., Mr. Dondero is the President of Highland Capital Management, L.P. (“HCM”), which he co-founded in 1993. Prior to founding HCM, Mr. Dondero served as Chief Investment Officer of Protective Life’s GIC subsidiary and helped grow the business from concept to over $2 billion between 1989 and 1993. His portfolio management experience includes mortgage-backed securities, investment grade corporates, leveraged bank loans, high-yield bonds, emerging market debt, derivatives, and equity securities. He received a BS in Commerce (Accounting and Finance) from the University of Virginia. Mr. Dondero is a Certified Public Accountant, a Certified Management Accountant, and a Chartered Financial Analyst.
| (a)(2) | Other Accounts Managed by Portfolio Manager(s) or Management Team Member and Potential Conflicts of Interest |
Other Accounts Managed by Portfolio Manager(s) or Management Team Member
The following table provides information about funds and accounts, other than the Fund, for which the Fund’s portfolio manager is primarily responsible for the day-to-day portfolio management as of December 31, 2013.
Jim Dondero
| | | | | | | | |
| Type of Accounts | | Total # of Accounts Managed | | Total Assets (millions) | | # of Accounts Managed with
Performance-Based
Advisory Fee | | Total Assets with
Performance-Based
Advisory Fee (millions) |
Registered Investment Companies: | | 2 | | $968 | | 0 | | $0 |
Other Pooled Investment Vehicles: | | 2 | | $152 | | 0 | | $0 |
Other Accounts: | | 0 | | $0 | | 0 | | $0 |
Potential Conflicts of Interests
NexPoint Advisors, L.P. (“NexPoint” or the “Adviser”) and/or its general partner, limited partners, officers, affiliates and employees provide investment advice to other parties and manage other accounts and private investment vehicles similar to the Fund. In connection with such other investment management activities, the Adviser and/or its general partner, limited partners, officers, affiliates and employees may decide to invest the funds of one or more other accounts or recommend the investment of funds by other parties, rather than the Fund’s monies, in a particular security or strategy. In addition, the Adviser and such other persons will determine the allocation of funds from the Fund and such other accounts to investment strategies and techniques on whatever basis they consider appropriate or desirable in their sole and absolute discretion.
The Adviser has built a professional working environment, a firm-wide compliance culture and compliance procedures and systems designed to protect against potential incentives that may favor one account over another. The Adviser has adopted policies and procedures that address the allocation of investment opportunities, execution of portfolio transactions, personal trading by employees and other potential conflicts of interest that are designed to ensure that all client accounts are treated equitably over time. Nevertheless, the Adviser furnishes advisory services to numerous clients in addition to the Fund, and the Adviser may, consistent with applicable law, make investment recommendations to other clients or accounts (including accounts that are hedge funds or have performance or higher fees paid to the Adviser or in which portfolio managers have a personal interest in the receipt of such fees) that may be the same as or different from those made to the Fund. In addition, the Adviser, its affiliates and any of their partners, directors, officers, stockholders or employees may or may not have an interest in the securities whose purchase and sale the Adviser recommends to the Fund. Actions with respect to securities of the same kind may be the same as or different from the action that the Adviser, or any of its affiliates, or any of their partners, directors, officers, stockholders or employees or any member of their families may take with respect to the same securities. Moreover, the Adviser may refrain from rendering any advice or services concerning securities of companies of which any of the Adviser’s (or its affiliates’) partners, directors, officers or employees are directors or officers, or companies as to which the Adviser or any of its affiliates or partners, directors, officers and employees of any of them has any substantial economic interest or possesses material non-public information. In addition to its various policies and procedures designed to address these issues, the Adviser includes disclosure regarding these matters to its clients in both its Form ADV and investment advisory agreements.
The Adviser, its affiliates or their partners, directors, officers and employees similarly serve or may serve other entities that operate in the same or related lines of business or of investment funds managed by affiliates of the Adviser. Accordingly, these individuals may have obligations to investors in those entities or funds or to other clients, the fulfillment of which might not be in the best interests of the Fund. As a result, the Adviser will face conflicts in the allocation of investment opportunities to the Fund and other funds and clients. In order to enable such affiliates to fulfill their fiduciary duties to each of the clients for which they have responsibility, the Adviser will endeavor to allocate investment opportunities in a fair and equitable manner which may, subject to applicable regulatory constraints, involve pro rata co-investment by the Fund and such other clients or may involve a rotation of opportunities among the Fund and such other clients.
While the Adviser does not believe there will be frequent conflicts of interest, if any, the Adviser and its affiliates have both subjective and objective procedures and policies in place designed to manage the potential conflicts of interest between the Adviser’s fiduciary obligations to the Fund and their similar fiduciary obligations to other clients so that, for example, investment opportunities are allocated in a fair and equitable manner among the Fund and such other clients. An investment opportunity that is suitable for multiple clients of the Adviser and its affiliates may not be capable of being shared among some or all of such clients due to the limited scale of the opportunity or other factors, including regulatory restrictions imposed by the 1940 Act. There can be no assurance that the Adviser’s or its affiliates’ efforts to allocate any particular investment opportunity fairly among all clients for whom such opportunity is appropriate will result in an allocation of all or part of such opportunity to the Fund. Not all conflicts of interest can be expected to be resolved in favor of the Fund.
| (a)(3) | Compensation Structure of Portfolio Manager(s) or Management Team Members |
NexPoint’s financial arrangements with its portfolio managers, its competitive compensation and its career path emphasis at all levels reflect the value senior management places on key resources. Compensation may include a variety of components and may vary from year to year based on a number of factors, including the relative performance of a portfolio manager’s underlying account, the combined performance of the portfolio managers’ underlying accounts, and the relative performance of the portfolio managers’ underlying accounts measured against other employees. The principal components of compensation include a base salary, a discretionary bonus, various retirement benefits and one or more of the incentive compensation programs established by NexPoint, such as its “Short-Term Incentive Plan” and its “Long-Term Incentive Plan,” described below.
Base compensation. Generally, portfolio managers receive base compensation based on their seniority and/or their position with NexPoint, which may include the amount of assets supervised and other management roles within NexPoint. Base compensation is determined by taking into account current industry norms and market data to ensure that NexPoint pays a competitive base compensation.
Discretionary compensation. In addition to base compensation, portfolio managers may receive discretionary compensation, which can be a substantial portion of total compensation. Discretionary compensation can include a discretionary cash bonus paid to recognize specific business contributions and to ensure that the total level of compensation is competitive with the market, as well as participation in incentive plans, including one or more of the following:
Short-Term Incentive Plan. The purpose of this plan is to attract and retain the highest quality employees for positions of substantial responsibility, and to provide additional incentives to a select group of management or highly-compensated employees of NexPoint in order to promote the success of NexPoint.
Long Term Incentive Plan. The purpose of this plan is to create positive morale and teamwork, to attract and retain key talent, and to encourage the achievement of common goals. This plan seeks to reward participating employees based on the increased value of NexPoint through the use of Long-Term Incentive Units.
Because each person’s compensation is based on his or her individual performance, NexPoint does not have a typical percentage split among base salary, bonus and other compensation. Senior portfolio managers who perform additional management functions may receive additional compensation in these other capacities. Compensation is structured such that key professionals benefit from remaining with NexPoint.
| (a)(4) | Disclosure of Securities Ownership |
The following table sets forth the dollar range of equity securities beneficially owned by the portfolio manager in the Fund as of December 31, 2013.
| | |
| Name of Portfolio Manager | | Dollar Ranges of Equity Securities Beneficially Owned by
Portfolio Manager |
Jim Dondero | | Over $1,000,000 |
Item 9. Purchases of Equity Securities by Closed-End Management Investment Company and Affiliated Purchasers.
Not applicable.
Item 10. Submission of Matters to a Vote of Security Holders.
There have been no material changes to the procedures by which the shareholders may recommend nominees to the registrant’s board of directors.
Item 11. Controls and Procedures.
| (a) | The registrant’s principal executive and principal financial officers, or persons performing similar functions, have concluded that the registrant’s disclosure controls and procedures (as defined in Rule 30a-3(c) under the Investment Company Act of 1940, as amended (the “1940 Act”) (17 CFR 270.30a-3 (c)) are effective, as of a date within 90 days of the filing date of the report that includes the disclosure required by this paragraph, based on their evaluation of these controls and procedures required by Rule 30a-3(b) under the 1940 Act (17 CFR 270.30a-3(b)) and Rules 13a-15(b) or 15d-15(b) under the Securities Exchange Act of 1934, as amended (17 CFR 240.13a-15(b) or 240.15d-15(b)). |
| (b) | There were no changes in the registrant’s internal control over financial reporting (as defined in Rule 30a-3(d) under the 1940 Act (17 CFR 270.30a-3(d)) that occurred during the registrant’s second fiscal quarter of the period covered by this report that has materially affected, or is reasonably likely to materially affect, the registrant’s internal control over financial reporting. |
Item 12. Exhibits.
| (a)(1) | Code of ethics, or amendment thereto, that is the subject of disclosure required by Item 2 is attached hereto. |
| (a)(2) | Certifications pursuant to Rule 30a-2(a) under the 1940 Act and Section 302 of the Sarbanes-Oxley Act of 2002 are attached hereto. |
| (b) | Certifications pursuant to Rule 30a-2(b) under the 1940 Act and Section 906 of the Sarbanes-Oxley Act of 2002 are attached hereto. |
SIGNATURES
Pursuant to the requirements of the Securities Exchange Act of 1934 and the Investment Company Act of 1940, the registrant has duly caused this report to be signed on its behalf by the undersigned, thereunto duly authorized.
NEXPOINT CREDIT STRATEGIES FUND
| | |
By (Signature and Title): | | /s/ Ethan Powell |
| | Ethan Powell |
| | Executive Vice President and Principal Executive Officer |
| | (Principal Executive Officer) |
Date: March 10, 2014
Pursuant to the requirements of the Securities Exchange Act of 1934 and the Investment Company Act of 1940, this report has been signed below by the following persons on behalf of the registrant and in the capacities and on the dates indicated.
| | |
By (Signature and Title): | | /s/ Ethan Powell |
| | Ethan Powell |
| | Executive Vice President and Principal Executive Officer |
| | (Principal Executive Officer) |
Date: March 10, 2014
| | |
By (Signature and Title): | | /s/ Brian Mitts |
| | Brian Mitts |
| | Chief Financial Officer and Treasurer |
| | (Principal Financial Officer) |
Date: March 10, 2014