UNITED STATES
SECURITIES AND EXCHANGE COMMISSION
Washington, D.C. 20549
FORM N-CSR
CERTIFIED SHAREHOLDER REPORT OF REGISTERED
MANAGEMENT INVESTMENT COMPANIES
Investment Company Act file number: 811-21869
NEXPOINT CREDIT STRATEGIES FUND
| | | | |
| | (Exact name of registrant as specified in charter) | | |
| | |
| | 200 Crescent Court Suite 700 Dallas, Texas 75201 | | |
| | (Address of principal executive offices)(Zip code) | | |
| | |
| | NexPoint Advisors, L.P. 200 Crescent Court Suite 700 Dallas, Texas 75201 | | |
| | (Name and Address of Agent for Service) | | |
Registrant’s telephone number, including area code: (877) 665-1287
Date of fiscal year end: December 31
Date of reporting period: December 31, 2015
Item 1. Reports to Stockholders.
A copy of the Report to Shareholders transmitted to shareholders pursuant to Rule 30e-1 under the Investment Company Act of 1940, as amended (the “1940 Act”), is attached herewith.

NexPoint Credit Strategies Fund
Annual Report
December 31, 2015
NexPoint Credit Strategies Fund
TABLE OF CONTENTS
Economic and market conditions change frequently.
There is no assurance that the trends described in this report will continue or commence.
Privacy Policy
We recognize and respect your privacy expectations, whether you are a visitor to our web site, a potential shareholder, a current shareholder or even a former shareholder.
Collection of Information. We may collect nonpublic personal information about you from the following sources:
| | • | | Account applications and other forms, which may include your name, address and social security number, written and electronic correspondence and telephone contacts; |
| | • | | Web site information, including any information captured through the use of “cookies”; and |
| | • | | Account history, including information about the transactions and balances in your accounts with us or our affiliates. |
Disclosure of Information. We may share the information we collect with our affiliates. We may also disclose this information as otherwise permitted by law. We do not sell your personal information to third parties for their independent use.
Confidentiality and Security of Information. We restrict access to nonpublic personal information about you to our employees and agents who need to know such information to provide products or services to you. We maintain physical, electronic and procedural safeguards that comply with federal standards to guard your nonpublic personal information, although you should be aware that data protection cannot be guaranteed.
PORTFOLIO MANAGER COMMENTARY (unaudited)
| | |
| December 31, 2015 | | NexPoint Credit Strategies Fund |
2015 Performance
In 2015, the net asset value (“NAV”) of NexPoint Credit Strategies Fund (the “Fund”) was down 20.80% and the stock price was down 18.09%, including reinvested dividends. The Fund’s performance lagged its benchmark, the Credit Suisse Hedge Fund Index (-0.71%) as well other Allocation and Fixed Income closed-end funds. The Fund had a solid start to the year; however, volatility in credit markets driven by macroeconomic headline risk and technical pressure took hold during the second half of the year.
| | | | | | | | | | | | | | | | |
NHF | | One Year | | | Three Years | | | Five Years | | | Inception
to Date | |
| | | | | | | | | | | | | | | | |
NAV | | | -20.80 | % | | | 17.75 | % | | | 12.57 | % | | | 2.22 | % |
Market Price | | | -18.09 | % | | | 16.46 | % | | | 9.74 | % | | | 0.14 | % |
For the year, the top five performing investments in the portfolio were Freedom REIT LLC, our Argentine sovereign bond position, Nexpoint Real Estate Capital LLC, Greenbriar CLO Preferred Equity and Salesforce.com common equity. The top five underperforming investments in the portfolio in 2015 were Anadarko Petroleum common equity, NRG Energy common equity, Texas Competitive Electric Holdings (“TXU”) 1st lien senior debt, Ocean Rig UDW Inc. common equity, and Avaya Inc. high-yield bond. Overall, the Fund’s equity investments underperformed all other asset classes, contributing approximately 15% to the total loss. Real Estate was the best performing asset class, which contributed approximately 6.99%, to the Fund’s -20.80% NAV return.
Big Picture Highlights
The two most significant underperforming areas within the portfolio during the year were our exposures to Utilities and Energy. A key Utility position that was originally added to the portfolio in 2014, after it filed for bankruptcy, but became one of the highest conviction investments during the year is Texas Competitive Electric Holdings (“TXU”). To provide a little history, TXU’s parent company, Energy Futures Holdings Corp (“EFH”) and the substantial majority of its direct and indirect subsidiaries, including TXU, filed for bankruptcy in April 2014. Previously a public company, TXU was taken private in 2007 by private equity firms, KKR, Goldman Sachs and TPG, in one of the biggest leveraged-buyouts at that time. TXU has been working its way through the restructuring process and we believe is close to emerging from bankruptcy. The plan of reorganization is currently being reviewed by regulators, the most important of which is the Public Utility Commission of Texas (PUCT). The Fund owns 1st lien senior debt in TXU with the total investment making up just over 8% of the portfolio as of December 31, 2015. Despite successfully completing several key steps of the reorganization process, the loans traded down 53% during the year, we believe due to the market’s misplaced sensitivity to the continued sell-off in commodity prices.
We believe the market’s association with commodity/energy funds is misplaced, as TXU’s fundamentals are relatively insulated from oil prices and fears of a slowdown in China. And from a trading perspective, we believe much of this dislocation is technical in nature, as large lenders and investors in TXU have either been restricted from trading as they have been involved in restructuring discussions, or cannot add to their position because they have already filled their maximum position size. El Niño has also led to the country experiencing a mild winter which we believe has been a large contributor to the year-end fall in gas prices. TXU does have sensitivity to natural gas given that the marginal source of electricity generation is typically a natural gas fueled plant. Nonetheless, we think the market is placing too much importance on this gas sensitivity. We see the Texas power grid supply/demand story creating structurally higher power prices as a result of higher peak prices, which are not a function of natural gas prices.
Based on recent bankruptcy court approvals and restructuring progress, we expect TXU to emerge from bankruptcy in the first half of 2016. The bankruptcy judge approved the company’s plan to emerge from bankruptcy and sale of their transmission business, ONCOR, to a group of new investors. According to the terms of the plan of reorganization, 1st lien lenders, like NHF, will receive 100% of the reorganized equity in TXU (power generation and retail energy business), 100% of the cash proceeds from the new debt issued by TXU, and the right to invest in the new parent company subject to the sale of ONCOR and its conversion into a REIT. The focus now shifts to the company’s plan receiving approval from regulators. The Federal Energy Regulatory Commission (FERC) has already approved the deal. We expect a decision from the Public Utility Commission of Texas by the end of March and an emergence from bankruptcy by the end of the second quarter. Our long-term view is that the new equity received from TXU’s reorganization will trade higher over time, ultimately reaching a par recovery.
On September 9, 2014, the Fund’s Board of Trustees announced a plan to separate NexPoint Residential Trust, Inc. (“NXRT”) from the Fund through a series of restructuring transactions involving Freedom REIT, the Fund’s wholly-owned subsidiary, and
PORTFOLIO MANAGER COMMENTARY (unaudited)
| | |
| December 31, 2015 | | NexPoint Credit Strategies Fund |
NXRT, a real estate investment trust, followed by a distribution of all of the outstanding shares of NXRT common stock to the shareholders of the Fund on a pro-rata basis (the “Spin-Off”). The Board approved the advisory agreement for NXRT on January 5, 2015, which subsequently was approved by the shareholders of the Fund on March 16, 2015. On April 1, 2015, the Fund transferred certain real estate assets, multifamily properties, held by Freedom REIT to NXRT in exchange for NXRT common stock. The Fund completed the Spin-Off through a pro-rata taxable distribution of NXRT common stock to the Fund’s shareholders of record as of the close of business on March 23, 2015 (the “Record Date”). The Fund’s shareholders received one share of NXRT common stock for every three common shares of the Fund held on the Record Date and the shares began trading on the New York Stock Exchange on April 1.
Following the Spin-Off, the Fund continues to invest directly in multifamily properties in Texas and the Southeastern United States. We continue to see good value in direct investments in real estate as well as debt investments. The Fund’s subsidiary NexPoint Real Estate Capital (“NREC”) has originated approximately $120 million of preferred equity investments that are primarily collateralized by multifamily properties. These investments are below the mortgages on properties but above the equity and are structured such that we can take over the property upon payment default by the borrower or uncured breach of covenants. Neither NREC nor any affiliate of the Fund owns the underlying party. These preferred equity investments are originated by unaffiliated third parties.
Lastly, the Fund increased its allocation to CLO equity following the Spin-Off. CLO equity and underlying bank loan pricing exhibited panic selling in the last few quarters of 2015. These deteriorating or bearish assumptions we believe exceed actual credit conditions in the economy. We believe the long term fundamentals of CLO equity provide a very attractive return profile and are comfortable that ultimate defaults in underlying companies will be less than expected.
Although the NAVs of some CLOs have dropped precipitously, the vast majority of equity continues to produce over 20% annualized cash flow. We expect to see volatility continue in the short term, particularly in companies exposed to distressed sectors such as oil-and-gas and metals-and-mining. In such an environment, we give additional scrutiny to the underlying collateral, the pace of downgrades, and overcollateralization cushions. We believe the current market sell-off is exacerbated by credit market technicals and investor sentiment, therefore creating an extraordinary buying opportunity based on fundamentals. Accordingly, we expect to hold CLO debt and equity that has become distressed but ultimately holds sound underlying collateral.
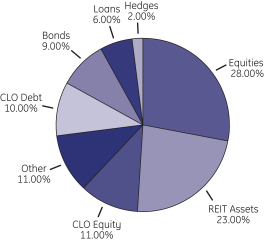
As of December 31, 2014, the Fund’s investments were allocated among the following asset classes:
PORTFOLIO MANAGER COMMENTARY (unaudited)
| | |
| December 31, 2015 | | NexPoint Credit Strategies Fund |
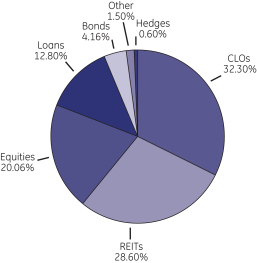
As of December 31, 2015, the Fund’s investments were allocated among the following asset classes:
For the twelve-month period ended December 31, 2015, the Fund returned -20.80%, based on NAV, putting it well behind the majority of other funds in the Morningstar Tactical Allocation category during the period. During 2015, the Fund tactically increased its allocation of the portfolio to CLO Debt and Equity as well as Loans.
The Fund’s Strategy
The Fund’s investment adviser, NexPoint Advisers L.P. (the “Investment Adviser”), manages the Fund pursuant to a multi-strategy investment program that attempts to exceed the return of the Fund’s benchmark in a transparent, registered fund format, with monthly dividends. We will typically allocate the Fund’s investments in the following asset classes: public equities, private equity investments, collateralized loan obligation (CLOs) debt, high yield bonds, syndicated floating rate bank loans, real estate assets, CLO equity, non-traditional yield oriented investments and may hedge exposure where necessary.
Our View of the Year Ahead
Fears centered on China and oil helped to erode investor sentiment throughout 2015 with an acceleration of risk-off sentiment into year-end. Credit was ahead of equities all year, pricing in stress and driving spreads to historically wide levels and arguably pricing recession in certain instances.
Equities joined the downdraft party at the start of the year as credit initially outperformed before renewed pressure emerged on spreads. As heightened concerns around global macro conditions fade, there remains the potential for more normalized risk markets. In addition, we believe quantitative easing implemented overseas could finally start to have a lagged effect with increased liquidity helping to drive a turnaround in global growth. Back in the U.S., absolute levels of service sector activity, automotive sales, and housing demand remain supportive. Under this lens, we would expect to see continued modest domestic GDP growth driving higher corporate revenues and cash flows. We believe a modest growth with no-recession scenario in the U.S. coupled with low inflation, lower stock prices, lower long-term interest rates, lower borrowing costs, and a relatively benign default environment could drive increasing demand for yield across all fixed income spread products. We believe better technicals could emerge via CLO creation as risk market volatility subsides, default rates remain below trend, certainty as Fed policy emerges, and hurdles surrounding CLO risk retention rules get sorted through.
Shareholder Loyalty Program
In July 2012, we developed and implemented a unique and creative Shareholder Loyalty Program (the “Program”) that we believe rewards long-term shareholders while aligning the interests of the portfolio manager and other employees of the Investment Adviser and its affiliates with those of the Fund’s shareholders. The primary purpose of the Program is to promote shareholder loyalty. Subject to certain limitations, the Program offers shareholders a 2% gross-up on all new contributions made through accounts held by the Program’s administrator that are held for at least 12-months after initial purchase date. The Program was offered to employees of NexPoint and affiliates beginning in July 2012 and has increased direct employee ownership in the Fund. All costs of the program, including the cost of the gross-up on purchases and dividend reinvestments, are paid by the Investment Adviser, not by the Fund.
FUND PROFILE (unaudited)
| | |
| | NexPoint Credit Strategies Fund |
The Fund seeks to provide both current income and capital appreciation.
Total Net Assets of Common Shares as of December 31, 2015
$366.1 million
Portfolio Data as of December 31, 2015
The information below provides a snapshot of the Fund at the end of the reporting period. The Fund is actively managed and the composition of its portfolio will change over time.
| | | | |
| Quality Breakdown as of 12/31/2015 (%)(1) | |
BB | | | 13.9 | |
B | | | 31.6 | |
CCC | | | 7.0 | |
Not Rated | | | 47.5 | |
| | | | |
| Top 5 Sectors as of 12/31/2015 (%)(2) | |
Real Estate Investment Trust | | | 44.6 | |
Financial | | | 39.3 | |
Utility | | | 21.4 | |
Asset-Backed Securities | | | 17.1 | |
Telecommunications | | | 13.1 | |
| | | | |
| Top 10 Holdings as of 12/31/2015 (%)(2) | |
Nexpoint Real Estate Capital, REIT (Common Stocks) | | | 26.7 | |
Freedom, REIT (Common Stocks) | | | 17.5 | |
TerreStar Corp. (Common Stocks) | | | 9.1 | |
Metro-Goldwyn-Mayer, Inc. (Common Stocks) | | | 6.5 | |
Texas Competitive Electric Holdings Co. LLC (U.S. Senior Loans) | | | 6.5 | |
Grayson CLO, Ltd. (Preferred Stocks) | | | 5.9 | |
Stratford CLO, Ltd. (Preferred Stocks) | | | 5.2 | |
Greenbriar CLO, Ltd. (Preferred Stocks) | | | 4.8 | |
Eastland CLO, Ltd. (Preferred Stocks) | | | 3.9 | |
Specialty Finance, Inc. (Common Stocks) | | | 3.9 | |
| (1) | Quality is calculated as a percentage of total senior loans, asset-backed securities and corporate bonds & notes. The quality ratings reflected were issued by Standard & Poors, a nationally recognized statistical rating organization. Ratings are measured on a scale that generally ranges from AAA (highest) to D (lowest). Quality ratings reflect the credit quality of the underlying bonds in the Fund’s portfolio and not that of the Fund itself. Credit quality ratings assigned by a rating agency are subjective opinions, not statements of fact, and are subject to change, including daily. The ratings assigned by credit rating agencies are but one of the considerations that the Fund’s investment adviser incorporates into its credit analysis process, along with such other issuer-specific factors as cash flows, capital structure and leverage ratios, ability to de-leverage through free cash flow, quality of management, market positioning and access to capital, as well as such security-specific factors as the terms of the security (e.g., interest rate, and time to maturity) and the amount of any collateral. Quality Ratings are subject to change. |
| (2) | Sectors and holdings are calculated as a percentage of total net assets. |
FINANCIAL STATEMENTS
| | |
| December 31, 2015 | | NexPoint Credit Strategies Fund |
A guide to understanding the Fund’s financial statements
| | |
| Investment Portfolio | | The Investment Portfolio details all of the Fund’s holdings and their value as of the last day of the reporting period. Portfolio holdings are organized by type of asset and industry to demonstrate areas of concentration and diversification. |
| |
| Statement of Assets and Liabilities | | This statement details the Fund’s assets, liabilities, net assets and common share price as of the last day of the reporting period. Net assets are calculated by subtracting all the Fund’s liabilities (including any unpaid expenses) from the total of the Fund’s investment and non-investment assets. The net asset value per common share is calculated by dividing net assets by the number of common shares outstanding as of the last day of the reporting period. |
| |
| Statement of Operations | | This statement reports income earned by the Fund and the expenses accrued by the Fund during the reporting period. The Statement of Operations also shows any net gain or loss the Fund realized on the sales of its holdings during the period as well as any unrealized gains or losses recognized over the period. The total of these results represents the Fund’s net increase or decrease in net assets from operations applicable to common shareholders. |
| |
| Statements of Changes in Net Assets | | These statements detail how the Fund’s net assets were affected by its operating results, distributions to common shareholders and shareholder transactions from common shares (e.g., subscriptions, redemptions and distribution reinvestments) during the reporting period. The Statements of Changes in Net Assets also detail changes in the number of common shares outstanding. |
| |
| Statement of Cash Flows | | This statement reports net cash and foreign currency provided or used by operating, investing and financing activities and the net effect of those flows on cash and foreign currency during the period. |
| |
| Financial Highlights | | The Financial Highlights demonstrate how the Fund’s net asset value per common share was affected by the Fund’s operating results. The Financial Highlights also disclose the Fund’s performance and certain key ratios (e.g., net expenses and net investment income as a percentage of average net assets). |
| |
| Notes to Financial Statements | | These notes disclose the organizational background of the Fund, its significant accounting policies (including those surrounding security valuation, income recognition and distributions to shareholders), federal tax information, fees and compensation paid to affiliates and significant risks and contingencies. |
INVESTMENT PORTFOLIO
| | |
| As of December 31, 2015 | | NexPoint Credit Strategies Fund |
| | | | | | | | |
| |
Principal Amount ($) | | Value ($) | |
|
| U.S. Senior Loans (a) - 19.0% | |
|
| | CHEMICALS - 0.6% | |
| | 2,971,436 | | | Vertellus Specialties, Inc.
Term Loan B
10.50%, 10/31/2019 | | | 2,202,577 | |
| | | | | | | | |
|
| | ENERGY - 0.1% | |
| | 449,798 | | | Azure Midstream Energy LLC
Term Loan B
7.50%, 11/15/2018 | | | 267,630 | |
| | 1,529,000 | | | Fieldwood Energy LLC
Second Lien Term Loan
8.38%, 09/30/2020 | | | 243,875 | |
| | | | | | | | |
| | | | | | | 511,505 | |
| | | | | | | | |
|
| | GAMING & LEISURE - 1.2% | |
| | 3,883,480 | | | Ginn-LA CS Borrower LLC
First Lien Tranche A Credit-Linked Deposit (b) | | | 97,087 | |
| | 8,322,966 | | | First Lien Tranche B Term Loan (b) | | | 208,074 | |
| | 8,714,766 | | | LLV Holdco LLC
Exit Revolving Loan
5.00%, 02/28/2017 (c)(d)(e) | | | 4,170,887 | |
| | | | | | | | |
| | | | | | | 4,476,048 | |
| | | | | | | | |
|
| | HOUSING - 0.0% | |
| | 2,221,161 | | | LBREP/L-SunCal Master I LLC
First Lien Term Loan B (b)(d) | | | — | |
| | | | | | | | |
|
| | MEDIA & TELECOMMUNICATIONS - 0.0% | |
| | 2,578,841 | | | Endurance Business Media, Inc.
Term Loan (b)(c)(d) | | | — | |
| | | | | | | | |
|
| | SERVICE - 3.0% | |
| | 14,678,022 | | | Weight Watchers International, Inc.
Tranche B-2 Initial Term Loan
4.00%, 04/02/2020 | | | 10,984,004 | |
| | | | | | | | |
|
| | TELECOMMUNICATIONS - 3.8% | |
| | 13,929,823 | | | TerreStar Corp.
Term Loan A (c)(d) | | | 13,874,103 | |
| | | | | | | | |
|
| | UTILITY - 10.3% | |
| | 8,867,015 | | | Entegra TC LLC
Third Lien Term Loan
9.25%, 10/02/2020 | | | 8,778,345 | |
| | 75,329,417 | | | Texas Competitive Electric Holdings Co. LLC
Extended Term Loan
4.73%, 10/10/2017 (f) | | | 23,615,772 | |
| | 17,000,000 | | | Non-Extended Term Loan
4.73%, 10/10/2016 | | | 5,174,460 | |
| | | | | | | | |
| | | | | | | 37,568,577 | |
| | | | | | | | |
| | | | Total U.S. Senior Loans
(Cost $119,078,875) | | | 69,616,814 | |
| | | | | | | | |
| | | | | | | | |
| |
Principal Amount | | Value ($) | |
|
| Foreign Denominated or Domiciled | |
| Senior Loans (a) - 0.2% | |
|
| | MARSHALL ISLANDS - 0.2% | |
| | 1,500,808 | | | Drillships Financing Holding, Inc.
Tranche Term Loan B-1
6.00%, 03/31/2021 | | | 609,703 | |
| | | | | | | | |
|
| | UNITED KINGDOM - 0.0% | |
| | 930,409 | | | Henson No. 4, Ltd.
Term Loan Facility B (b)(d) | | | 17,436 | |
| | 942,045 | | | Term Loan Facility C (b)(d) | | | 17,624 | |
| | | | | | | | |
| | | | Total Foreign Denominated or Domiciled Senior Loans
(Cost $2,794,499) | | | 644,763 | |
| | | | | | | | |
|
Principal Amount ($) | |
|
| Asset-Backed Securities (g)(h) - 17.1% | |
| | 14,000,000 | | | Acis CLO, Ltd.
Series 2013-1A, Class SUB
0.00%, 04/18/2024 (p) | | | 5,145,000 | |
| | 10,000,000 | | | Series 2014-3A, Class E
5.08%, 02/01/2026 (p) | | | 7,233,500 | |
| | 2,000,000 | | | Series 2013-2A, Class E
5.25%, 10/14/2022 (p) | | | 1,770,000 | |
| | 4,500,000 | | | Series 2013-1A, Class E
5.92%, 04/18/2024 (p) | | | 3,431,925 | |
| | 5,000,000 | | | Series 2014-3A, Class F
5.93%, 02/01/2026 (p) | | | 3,296,000 | |
| | 9,142,000 | | | Series 2013-1A, Class F
6.82%, 04/18/2024 (p) | | | 6,036,005 | |
| | 2,250,000 | | | ALM VII, Ltd.
Series 2013-7R2A, Class SUB
0.00%, 04/24/2024 | | | 1,192,500 | |
| | 1,000,000 | | | Apidos CLO
Series 2013-12A, Class F
5.22%, 04/15/2025 | | | 778,300 | |
| | 1,925,000 | | | Betony CLO, Ltd.
Series 2015-1A, Class SUB
0.00%, 04/15/2027 | | | 981,750 | |
| | 2,000,000 | | | CFIP CLO, Ltd.
Series 2014-1A, Class E
5.07%, 04/13/2025 | | | 1,460,000 | |
| | 1,000,000 | | | CIFC Funding, Ltd.
Series 2014-4A, Class F
5.92%, 10/17/2026 | | | 625,000 | |
| | 3,375,116 | | | Eastland CLO, Ltd.
Series 2007-1A, Class D
3.93%, 05/01/2022 (p) | | | 2,873,489 | |
| | 1,000,000 | | | Flagship CLO VIII, Ltd.
Series 2014-8A, Class F
6.17%, 01/16/2026 | | | 605,000 | |
| | 2,915,407 | | | Grayson CLO, Ltd.
Series 2006-1A, Class D
3.93%, 11/01/2021 (p) | | | 2,434,365 | |
| | 850,000 | | | Greywolf CLO, Ltd.
Series 2013-1A, Class E
5.37%, 04/15/2025 | | | 625,345 | |
| | | | | | |
| 6 | | | | | | See accompanying Notes to Financial Statements. |
INVESTMENT PORTFOLIO (continued)
| | |
| As of December 31, 2015 | | NexPoint Credit Strategies Fund |
| | | | | | | | |
| |
Principal Amount ($) | | Value ($) | |
|
| Asset-Backed Securities (continued) | |
| | 3,000,000 | | | Harbourview CLO, Ltd.
Series 7A, Class E
5.49%, 11/18/2026 | | | 2,190,000 | |
| | 2,127,119 | | | Hewett’s Island CDO, Ltd.
Series 2007-1RA, Class E
7.11%,11/12/2019 (p) | | | 2,092,532 | |
| | 757,853 | | | Highland Loan Funding V, Ltd.
2.76%, 08/01/2016 (p) | | | 568,390 | |
| | 13,375,000 | | | Highland Park CDO, Ltd.
Series 2006-1A, Class A2
0.79%, 11/25/2051 (p) | | | 9,362,500 | |
| | 2,000,000 | | | KVK CLO, Ltd.
Series 2015-1A, Class E
6.12%, 05/20/2027 | | | 1,540,000 | |
| | 852,594 | | | Lenox CDO, Ltd.
Series 2005-1A, Class A1S
1.32%, 11/14/2043 | | | 822,753 | |
| | 2,752,426 | | | Rockwall CDO II, Ltd.
Series 2007-1A, Class B2L
4.58%, 08/01/2024 (p) | | | 2,397,088 | |
| | 1,500,000 | | | Valhalla CLO, Ltd.
Series 2004-1A, Class EIN
0.00%, 08/01/2016 (p) | | | 370,000 | |
| | 2,100,000 | | | Vibrant CLO II, Ltd.
Series 2013-2A, Class E
5.82%, 07/24/2024 | | | 1,249,500 | |
| | 3,980,138 | | | Westchester CLO, Ltd.
Series 2007-1A, Class E
4.63%, 08/01/2022 (p) | | | 3,593,189 | |
| | | | | | | | |
| | | | Total Asset-Backed Securities
(Cost $73,885,447) | | | 62,674,131 | |
| | | | | | | | |
|
| Corporate Bonds & Notes - 9.9% | |
| |
| | ENERGY - 0.6% | | | | |
| | 877,000 | | | American Energy-Permian Basin LLC
7.13%, 11/01/2020 (h)(i) | | | 334,356 | |
| | 307,681 | | | 7.38%, 11/01/2021 (h)(i) | | | 121,534 | |
| | 4,062,000 | | | Arch Coal, Inc.
7.00%, 06/15/2019 (i) | | | 40,620 | |
| | 3,363,000 | | | Linn Energy LLC
6.25%, 11/01/2019 (i) | | | 571,710 | |
| | 2,493,000 | | | Penn Virginia Corp.
8.50%, 05/01/2020 (i) | | | 405,113 | |
| | 5,000,000 | | | Venoco, Inc.
8.88%, 02/15/2019 (i) | | | 775,000 | |
| | | | | | | | |
| | | | | | | 2,248,333 | |
| | | | | | | | |
|
| | INFORMATION TECHNOLOGY - 3.2% | |
| | 23,971,250 | | | Avaya, Inc.
10.50%, 03/01/2021 (h)(i) | | | 8,270,081 | |
| | 5,000,000 | | | Scientific Games International, Inc.
10.00%, 12/01/2022 (i) | | | 3,575,000 | |
| | | | | | | | |
| | | | | | | 11,845,081 | |
| | | | | | | | |
|
| | TELECOMMUNICATIONS - 0.2% | |
| | 2,020,000 | | | iHeartCommunications, Inc., PIK
14.00%, 02/01/2021 (i) | | | 560,550 | |
| | | | | | | | |
| | | | | | | | |
| |
Principal Amount ($) | | Value ($) | |
|
| | TRANSPORTATION - 0.1% | |
| | 3,750,000 | | | DPH Holdings Corp.
6.50%, 05/01/2009 (b) | | | 93,750 | |
| | 3,933,000 | | | 6.55%, 06/15/2006 (b) | | | 98,325 | |
| | 8,334,000 | | | 7.13%, 05/01/2029 (b) | | | 208,350 | |
| | | | | | | | |
| | | | | | | 400,425 | |
| | | | | | | | |
|
| | UTILITY - 5.8% | |
| | 8,847,860 | | | Entegra TC LLC, PIK
10.00%, 10/03/2017 (h)(i) | | | 8,869,980 | |
| | 21,239,000 | | | Ocean Rig UDW, Inc.
7.25%, 04/01/2019 (h)(i)(j) | | | 9,238,965 | |
| | 5,000,000 | | | Texas Competitive Electric Holdings Co. LLC
11.50%, 10/01/2020 (b)(h)(i) | | | 1,675,000 | |
| | 24,000,000 | | | 15.00%, 04/01/2021 (b)(i) | | | 1,560,000 | |
| | | | | | | | |
| | | | | | | 21,343,945 | |
| | | | | | | | |
| | | | Total Corporate Bonds & Notes
(Cost $83,704,357) | | | 36,398,334 | |
| | | | | | | | |
| |
Principal Amount | | | |
|
| Foreign Corporate Bonds & Notes (b) - 0.2% | |
|
| | NETHERLANDS - 0.2% | |
| | USD | |
| | 64,515,064 | | | Celtic Pharma Phinco BV, PIK (h) | | | 645,151 | |
| 28,665,284
|
| | Celtic Pharma Phinco BV, PIK (d) | | | — | |
| | | | | | | | |
| | | | Total Foreign Corporate Bonds & Notes
(Cost $62,254,526) | | | 645,151 | |
| | | | | | | | |
| |
Principal Amount ($) | | | |
|
| Sovereign Bonds (b) - 1.7% | |
| | 10,000,000 | | | Argentine Republic Government International Bond (i) | | | 6,280,000 | |
| | 20 | | | Argentine Republic Government International Bond | | | 23 | |
| | 10 | | | Argentine Republic Government International Bond | | | 11 | |
| | | | | | | | |
| | | | Total Sovereign Bonds
(Cost $4,939,463) | | | 6,280,034 | |
| | | | | | | | |
| |
Shares | | | |
|
| Common Stocks - 81.2% | |
|
| | CHEMICALS - 1.3% | |
| | 372,971 | | | MPM Holdings, Inc. (k) | | | 3,822,953 | |
| | 83,904 | | | MPM Holdings, Inc. (j)(k) | | | 860,016 | |
| | | | | | | | |
| | | | | | | 4,682,969 | |
| | | | | | | | |
|
| | CONSUMER DISCRETIONARY - 1.8% | |
| | 761,836 | | | K12, Inc. (j)(k) | | | 6,704,157 | |
| | | | | | | | |
|
| | ENERGY - 2.5% | |
| | 27,500 | | | Anadarko Petroleum Corp. | | | 1,335,950 | |
| | 161,280 | | | Atlantic Power Corp. (i) | | | 317,722 | |
| | 3,360 | | | California Resources Corp. (j) | | | 7,829 | |
| | 6,241,435 | | | DryShips, Inc. (i)(j)(k) | | | 1,085,385 | |
| | | | | | |
| See accompanying Notes to Financial Statements. | | | | | | 7 |
INVESTMENT PORTFOLIO (continued)
| | |
| As of December 31, 2015 | | NexPoint Credit Strategies Fund |
| | | | | | | | |
| |
Shares | | Value ($) | |
|
| Common Stocks (continued) | |
|
| | ENERGY (continued) | |
| | 85,750 | | | Energy Transfer Equity LP (i) | | | 1,178,205 | |
| | 2,060,928 | | | Ocean Rig UDW, Inc. (i) | | | 3,359,313 | |
| | 110,000 | | | Plains GP Holdings LP, Class A (i) | | | 1,039,500 | |
| | 22,600 | | | Western Gas Equity Partners LP (i) | | | 820,154 | |
| | | | | | | | |
| | | | | | | 9,144,058 | |
| | | | | | | | |
| |
| | FINANCIAL - 7.7% | | | | |
| | 1,000,000 | | | Adelphia Recovery Trust | | | 4,000 | |
| | 46,601 | | | American Banknote Corp. (d)(k) | | | 207,374 | |
| | 1,098,185 | | | Fortress Investment Group LLC, Class A (i)(j) | | | 5,589,762 | |
| | 13,388,945 | | | Specialty Finance, Inc. (c)(d)(k)(l) | | | 14,188,265 | |
| | 1,175,233 | | | SWS Group, Inc. (d)(i)(j)(k) | | | 8,120,860 | |
| | | | | | | | |
| | | | | | | 28,110,261 | |
| | | | | | | | |
|
| | GAMING & LEISURE - 0.0% | |
| | 14 | | | LLV Holdco LLC - Litigation Trust Units (c)(d)(k) | | | — | |
| | 26,712 | | | LLV Holdco LLC - Series A, Membership Interest (c)(d)(k) | | | — | |
| | 144 | | | LLV Holdco LLC - Series B, Membership Interest (c)(d)(k) | | | — | |
| | | | | | | | |
| | | | | | | — | |
| | | | | | | | |
|
| | HEALTHCARE - 0.4% | |
| | 24,000,000 | | | Genesys Ventures IA, LP (c)(d) | | | 1,569,600 | |
| | | | | | | | |
|
| | HOUSING - 0.3% | |
| | 368,150 | | | CCD Equity Partners LLC (d) | | | 1,141,265 | |
| | | | | | | | |
|
| | INFORMATION TECHNOLOGY - 0.7% | |
| | 833 | | | CDK Global, Inc. (j) | | | 39,542 | |
| | 141,685 | | | Corning, Inc. (i)(j) | | | 2,590,002 | |
| | 1 | | | Magnachip Semiconductor Corp. (k) | | | 5 | |
| | | | | | | | |
| | | | | | | 2,629,549 | |
| | | | | | | | |
|
| | MEDIA & TELECOMMUNICATIONS - 7.1% | |
| | 74,362 | | | Cumulus Media, Inc., Class A (i)(k) | | | 24,547 | |
| | 18,000 | | | Gray Television, Inc., Class A (i)(k) | | | 250,020 | |
| | 49,784 | | | Loral Space & Communications, Inc. (i)(k) | | | 2,026,707 | |
| | 308,875 | | | Metro-Goldwyn-Mayer, Inc., Class A (k)(m) | | | 23,764,070 | |
| | 645 | | | Time, Inc. (j) | | | 10,107 | |
| | | | | | | | |
| | | | | | | 26,075,451 | |
| | | | | | | | |
|
| | REAL ESTATE - 0.0% | |
| | 436,635 | | | Allenby (c)(d)(k) | | | — | |
| | 4,881,036 | | | Claymore (c)(d)(k) | | | 5 | |
| | | | | | | | |
| | | | | | | 5 | |
| | | | | | | | |
|
| | REAL ESTATE INVESTMENT TRUST - 44.6% | |
| | 25,255,573 | | | Freedom, REIT (c)(d)(k) | | | 63,896,601 | |
| | 30,000 | | | Landmark Apartment Trust, Inc., REIT (d)(k) | | | 175,500 | |
| | 8,271,300 | | | Nexpoint Real Estate Capital, REIT (c)(d)(k) | | | 97,833,766 | |
| | 137,177 | | | Spirit Realty Capital, Inc., REIT (i)(j) | | | 1,374,513 | |
| | | | | | | | |
| | | | | | | 163,280,380 | |
| | | | | | | | |
| | | | | | | | |
| |
Shares | | Value ($) | |
|
| | TELECOMMUNICATIONS - 9.2% | |
| | 110,872 | | | TerreStar Corp. (c)(d)(k)(m) | | | 33,434,560 | |
| | | | | | | | |
| |
| | UTILITY - 5.3% | | | | |
| | 26,220 | | | Entegra TC LLC, Class A (k) | | | 6,292,800 | |
| | 1,272,973 | | | Entegra TC LLC, Class B (k) | | | 4,455 | |
| | 1,115,163 | | | NRG Energy, Inc. (j) | | | 13,125,469 | |
| | | | | | | | |
| | | | | | | 19,422,724 | |
| | | | | | | | |
| |
| | WIRELESS COMMUNICATIONS - 0.3% | | | | |
| | 2,260,529 | | | Pendrell Corp. (i)(k) | | | 1,132,751 | |
| | | | | | | | |
| | | | Total Common Stocks
(Cost $468,128,217) | | | 297,327,730 | |
| | | | | | | | |
| |
| Preferred Stocks (h)(p) - 31.4% | | | | |
| |
| | FINANCIAL - 31.4% | | | | |
| | 14,500 | | | Aberdeen Loan Funding, Ltd. | | | 5,969,167 | |
| | 1,200 | | | Brentwood CLO, Ltd. | | | 465,000 | |
| | 13,800 | | | Brentwood CLO, Ltd. | | | 5,347,500 | |
| | 34,500 | | | Eastland CLO, Ltd. | | | 14,270,925 | |
| | 5,000 | | | Eastland Investors Corp. | | | 2,068,250 | |
| | 7,750 | | | Gleneagles CLO, Ltd. | | | 3,022,500 | |
| | 62,600 | | | Grayson CLO, Ltd., Series II | | | 21,712,810 | |
| | 1,500 | | | Grayson Investors Corp. | | | 520,275 | |
| | 39,000 | | | Greenbriar CLO, Ltd. | | | 17,452,500 | |
| | 3,750 | | | Greenbriar CLO, Ltd. | | | 1,678,125 | |
| | 2,500 | | | Liberty CLO, Ltd. | | | 718,750 | |
| | 8,500 | | | Red River CLO, Ltd., Series PS-2 | | | 1,615,000 | |
| | 10,500 | | | Rockwall CDO, Ltd. | | | 6,578,250 | |
| | 6,000 | | | Southfork CLO, Ltd. | | | 2,367,300 | |
| | 41,500 | | | Stratford CLO, Ltd. | | | 19,090,000 | |
| | 29,007 | | | Westchester CLO, Ltd. | | | 11,965,387 | |
| | | | | | | | |
| | | | | | | 114,841,739 | |
| | | | | | | | |
| | | | Total Preferred Stocks
(Cost $169,308,711) | | | 114,841,739 | |
| | | | | | | | |
|
| Exchange-Traded Funds (j) - 1.0% | |
| | 2,340 | | | Direxion Daily Gold Miners Index Bull 3X Shares ETF | | | 56,768 | |
| | 121,455 | | | ProShares UltraShort Nasdaq Biotechnology, ETF | | | 3,486,973 | |
| | | | | | | | |
| | | | Total Exchange-Traded Funds
(Cost $8,350,955) | | | 3,543,741 | |
| | | | | | | | |
| |
Units | | | |
|
| Warrants (k) - 0.1% | |
|
| | ENERGY - 0.1% | |
| | 6,536,535 | | | Kinder Morgan, Inc., expires 05/25/2017 | | | 392,846 | |
| | | | | | | | |
|
| | GAMING & LEISURE - 0.0% | |
| | 602 | | | LLV Holdco LLC - Series C, Membership Interest, expires 07/15/15 (c)(d) | | | — | |
| | 828 | | | LLV Holdco LLC - Series D, Membership Interest, expires 07/15/15 (c)(d) | | | — | |
| | 925 | | | LLV Holdco LLC - Series E, Membership Interest, expires 07/15/15 (c)(d) | | | — | |
| | 1,041 | | | LLV Holdco LLC - Series F, Membership Interest, expires 07/15/15 (c)(d) | | | — | |
| | | | | | |
| 8 | | | | | | See accompanying Notes to Financial Statements. |
INVESTMENT PORTFOLIO (continued)
| | |
| As of December 31, 2015 | | NexPoint Credit Strategies Fund |
| | | | | | | | |
| |
Units | | Value ($) | |
|
| Warrants (continued) | |
|
| | GAMING & LEISURE (continued) | |
| | 1,179 | | | LLV Holdco LLC - Series G, Membership Interest, expires 07/15/15 (c)(d) | | | — | |
| | | | | | | | |
| | | | | | | — | |
| | | | | | | | |
| | | | Total Warrants (Cost $4,500,396) | | | 392,846 | |
| | | | | | | | |
| |
Contracts | | | |
|
| Purchased Call Options (n) - 1.9% | |
| | 9,000 | | | Anadarko Petroleum Corp., Strike price $72.50, expires 01/15/2016 | | | 9,000 | |
| | 4,000 | | | Anadarko Petroleum Corp., Strike price $80.00, expires 01/15/2016 | | | 4,000 | |
| | 7,900 | | | Salesforce.com, Inc., Strike price $72.50, expires 03/18/2016 | | | 7,031,000 | |
| | | | | | | | |
| | | | Total Purchased Call Options
(Cost $20,111,061) | | | 7,044,000 | |
| | | | | | | | |
| Total Investments - 163.7% | | | 599,409,283 | |
| | | | | | | | |
| | | | (Cost $1,017,056,507) | | | | |
| |
Shares | | | |
| |
�� | Securities Sold Short - (5.8)% | | | | |
|
| Common Stocks (o) - (5.8)% | |
| |
| | ENERGY - (0.3)% | | | | |
| | 31,350 | | | Cheniere Energy, Inc. | | | (1,167,787 | ) |
| | 8,451 | | | Seventy Seven Energy, Inc. | | | (8,874 | ) |
| | | | | | | | |
| | | | | | | (1,176,661 | ) |
| | | | | | | | |
|
| | HEALTHCARE - (3.5)% | |
| | 13,025 | | | Alexion Pharmaceuticals, Inc. | | | (2,484,518 | ) |
| | 236,200 | | | Myriad Genetics, Inc. | | | (10,194,393 | ) |
| | | | | | | | |
| | | | | | | (12,678,911 | ) |
| | | | | | | | |
|
| | INFORMATION TECHNOLOGY - (2.0)% | |
| | 114,750 | | | Zillow Group, Inc., Class A | | | (2,988,090 | ) |
| | 192,750 | | | Zillow Group, Inc., Class C | | | (4,525,770 | ) |
| | | | | | | | |
| | | | | | | (7,513,860 | ) |
| | | | | | | | |
| | | | Total Common Stocks
(Proceeds $24,956,062) | | | (21,369,432 | ) |
| | | | | | | | |
| | | | Total Securities Sold Short
(Proceeds $24,956,062) | | | (21,369,432 | ) |
| | | | | | | | |
| Other Assets & Liabilities, Net - (57.9)% | | | (211,961,702 | ) |
| | | | | | | | |
| Net Assets - 100.0% | | | 366,078,149 | |
| | | | | | | | |
| (a) | Senior loans (also called bank loans, leveraged loans, or floating rate loans) in which the Fund invests generally pay interest at rates which are periodically determined by reference to a base lending rate plus a spread (unless otherwise identified, all senior loans carry a variable rate of interest). These base lending rates are generally (i) the Prime Rate offered by one or more major United States banks, (ii) the lending rate offered by one or more European banks such as the London Interbank Offered Rate (“LIBOR”) or (iii) the Certificate of Deposit rate. Rate shown represents the weighted average rate at December 31, 2015. Senior loans, while exempt from registration under the Securities Act of 1933 (the “1933 Act”), contain certain restrictions on resale and cannot be sold publicly. Senior secured floating rate loans often require prepayments from excess cash flow or permit the borrower to repay at its election. The degree to which borrowers repay, whether as a contractual requirement or at their election, cannot be predicted with accuracy. As a result, the actual remaining maturity may be substantially less than the stated maturity shown. |
| (b) | The issuer is, or is in danger of being, in default of its payment obligation. Income is not being accrued. |
| (c) | Affiliated issuer. Assets with a total aggregate market value of $228,967,787, or 62.5% of net assets, were affiliated with the Fund as of December 31, 2015. |
| (d) | Represents fair value as determined by the Fund’s Board of Trustees (the “Board”), or its designee in good faith, pursuant to the policies and procedures approved by the Board. Securities with a total aggregate value of $238,647,846, or 65.2% of net assets, were fair valued under the Fund’s valuation procedures as of December 31, 2015. |
| (e) | Fixed rate senior loan. |
| (f) | All or a portion of this position has not settled. Full contract rates do not take effect until settlement date. |
| (g) | Variable or floating rate security. The interest rate shown reflects the rate in effect December 31, 2015. |
| (h) | Securities exempt from registration under Rule 144A of the 1933 Act. These securities may only be resold in transaction exempt from registration to qualified institutional buyers. At December 31, 2015, these securities amounted to $206,670,937 or 56.5% of net assets. |
| (i) | All or part of the security is pledged as collateral for the Committed Facility Agreement with BNP Paribas Prime Brokerage, Inc. The market value of the securities pledged as collateral was $51,507,117. |
| (j) | All or part of this security is pledged as collateral for short sales and written options contracts. The market value of the securities pledged as collateral was $45,035,686. |
| (k) | Non-income producing security. |
| (l) | This investment is made up of the fair value of ten life settlement contracts. |
| (m) | Restricted Securities. These securities are not registered and may not be sold to the public. There are legal and/or contractual restrictions on resale. The Fund does not have the right to demand that such securities be registered. The values of these securities are determined by valuations provided by pricing services, brokers, dealers, market makers, or in good faith under the procedures established by the Fund’s Board of Trustees. |
| (n) | Options are shown at market value. |
| (o) | No dividend payable on security sold short. |
| (p) | Securities of collateralized loan obligations where an affiliate of the Investment Adviser serves as collateral manager. |
Currency Abbreviations:
| | |
| GBP | | British Pound |
| USD | | United States Dollar |
| | | | | | |
| See accompanying Notes to Financial Statements. | | | | | | 9 |
INVESTMENT PORTFOLIO (continued)
| | |
| As of December 31, 2015 | | NexPoint Credit Strategies Fund |
Glossary:
| | |
| CDO | | Collateralized Debt Obligation |
| CLO | | Collateralized Loan Obligation |
| ETF | | Exchange-Traded Fund |
| PIK | | Payment-in-Kind |
| REIT | | Real Estate Investment Trust |
Written options contracts outstanding as of December 31, 2015 were as follows:
| | | | | | | | | | | | | | | | | | | | | | | | |
Description | | Exercise
Price | | | Expiration
Date | | | Number
of
Contracts | | | Notional
Value | | | Premium | | | Value | |
WRITTEN PUT OPTIONS: | | | | | | | | | | | | | | | | | |
Anadarko Petroleum Corp. | | $ | 80.00 | | | | January 2016 | | | | 2,725 | | | $ | 21,800,000 | | | $ | 1,723,422 | | | $ | (8,563,313 | ) |
Salesforce.com, Inc. | | $ | 72.50 | | | | March 2016 | | | | 400 | | | | 2,900,000 | | | | 302,877 | | | | (89,600 | ) |
| | | | | | | | | | | | | | | | | | | | | | | | |
Total Written Options Contracts | | | | | | | | | | | $ | 2,026,299 | | | $ | (8,652,913 | ) |
| | | | | | | | | | | | | | | | | | | | | | | | |
| | | | |
Foreign Denominated or Domiciled Senior Loans
and Foreign Corporate Bonds & Notes
Industry Concentration Table:
(% of Net Assets) | |
Healthcare | | | 0.2 | % |
Energy | | | 0.2 | % |
Retail | | | 0.0 | % |
| | | | |
Total | | | 0.4 | % |
| | | | |
| | | | | | |
| 10 | | | | | | See accompanying Notes to Financial Statements. |
STATEMENT OF ASSETS AND LIABILITIES
| | |
| As of December 31, 2015 | | NexPoint Credit Strategies Fund |
| | | | |
| | | ($) | |
Assets | | | | |
Investments from unaffiliated issuers, at value (cost $696,831,730) | | | 370,441,496 | |
Affiliated issuers, at value (cost $320,224,777) (Note 11) | | | 228,967,787 | |
| | | | |
Total Investments, at value (cost $1,017,056,507) | | | 599,409,283 | |
Receivable for: | | | | |
Investments sold | | | 2,042,630 | |
Dividends and interest | | | 5,799,842 | |
Due from broker | | | 20,334,410 | |
Prepaid expenses and other assets | | | 63,054 | |
| | | | |
Total assets | | | 627,649,219 | |
| | | | |
| |
Liabilities | | | | |
Due to custodian | | | 3,791,649 | |
Notes payable (Note 6) | | | 215,925,315 | |
Securities sold short, at value (proceeds $24,956,062) (Notes 2 and 9) | | | 21,369,432 | |
Written options contracts, at value (premiums $2,026,299) (Note 3) | | | 8,652,913 | |
| |
Payable for: | | | | |
Distributions to shareholders | | | 200 | |
Investments purchased | | | 10,168,750 | |
Investment advisory and administration fees (Note 8) | | | 602,308 | |
Trustees’ fees | | | 12,271 | |
Transfer agent fees | | | 20,699 | |
Interest expense (Note 6) | | | 355,929 | |
Accrued expenses and other liabilities | | | 671,604 | |
| | | | |
Total liabilities | | | 261,571,070 | |
| | | | |
Net Assets Applicable to Common Shares | | | 366,078,149 | |
| | | | |
| |
Net Assets Consist of: | | | | |
Par value (Note 1) | | | 15,970 | |
Paid-in capital | | | 856,288,042 | |
Accumulated (distributions in excess of) net investment income | | | (1,123,636 | ) |
Accumulated net realized loss from investments, securities sold short and foreign currency transactions | | | (68,333,386 | ) |
Net unrealized depreciation on investments, securities sold short, written options contracts and translation of assets and liabilities denominated in foreign currency | | | (420,768,841 | ) |
| | | | |
Net Assets Applicable to Common Shares | | | 366,078,149 | |
| | | | |
| |
Common Shares | | | | |
Net assets | | | 366,078,149 | |
Shares outstanding (unlimited authorization) | | | 15,969,655 | |
Net asset value per share (Net assets/shares outstanding) | | | 22.92 | |
| | | | | | |
| See accompanying Notes to Financial Statements. | | | | | | 11 |
STATEMENTS OF OPERATIONS
| | |
| For the Year Ended December 31, 2015 | | NexPoint Credit Strategies Fund |
| | | | |
| | | ($) | |
Investment Income | | | | |
Dividends from unaffiliated issuers | | | 52,085,515 | |
Dividends from affiliated issuers (Note 11) | | | 83,693,853 | |
Less: Foreign taxes withheld | | | (5,920 | ) |
Securities lending income (Note 4) | | | 63,078 | |
Interest from unaffiliated issuers | | | 23,714,218 | |
Other income | | | 35,384 | |
| | | | |
Total Income | | | 159,586,128 | |
| | | | |
| |
Expenses: | | | | |
Investment advisory (Note 8) | | | 8,854,346 | |
Administration fees (Note 8) | | | 1,770,870 | |
Transfer agent fees | | | 140,987 | |
Trustees fees (Note 8) | | | 78,370 | |
Accounting services fees | | | 216,179 | |
Audit fees | | | 285,833 | |
Legal fees | | | 1,419,416 | |
Registration fees | | | 84,745 | |
Insurance | | | 106,306 | |
Reports to shareholders | | | 313,311 | |
Interest expense (Note 6) | | | 4,064,875 | |
Dividends and fees on securities sold short (Note 2) | | | 1,370,655 | |
Other | | | 1,067,357 | |
| | | | |
Total operating expenses | | | 19,773,250 | |
| | | | |
Net investment income | | | 139,812,878 | |
| | | | |
| |
Net Realized and Unrealized Gain (Loss) on Investments | | | | |
Net realized gain/(loss) on investments from unaffiliated issuers | | | 10,593,172 | |
Net realized gain/(loss) on securities sold short (Note 2) | | | 5,439,756 | |
Net realized gain/(loss) on written options contracts (Note 3) | | | 2,579,598 | |
Net realized gain/(loss) on foreign currency transactions | | | (603,542 | ) |
Net change in unrealized appreciation/(depreciation) on investments | | | (271,441,114 | ) |
Net change in unrealized appreciation/(depreciation) on securities sold short (Note 2) | | | 2,042,053 | |
Net change in unrealized appreciation/(depreciation) on written options contracts (Note 3) | | | (5,192,234 | ) |
Net change in unrealized appreciation/(depreciation) on translation of assets and liabilities denominated in foreign currency | | | 31,305 | |
| | | | |
Net realized and unrealized gain/(loss) on investments | | | (256,551,006 | ) |
| | | | |
Total decrease in net assets resulting from operations | | | (116,738,128 | ) |
| | | | |
| | | | | | |
| 12 | | | | | | See accompanying Notes to Financial Statements. |
STATEMENTS OF CHANGES IN NET ASSETS
| | |
| | NexPoint Credit Strategies Fund |
| | | | | | | | |
| | | Year Ended
December 31, 2015
($) | | | Year Ended
December 31, 2014
($) | |
From Operations | | | | | | | | |
Net investment income | | | 139,812,878 | | | | 52,656,114 | |
Net realized gain (loss) on investments, securities sold short and foreign currency transactions | | | 18,008,984 | | | | 238,753,558 | |
Net change in unrealized depreciation on investments, securities sold short, written options contracts and translation of assets and liabilities denominated in foreign currency | | | (274,559,990 | ) | | | (110,619,647 | ) |
| | | | | | | | |
Net increase (decrease) from operations | | | (116,738,128 | ) | | | 180,790,025 | |
| | | | | | | | |
| | |
Distributions Declared to Common Shareholders | | | | | | | | |
From net investment income | | | (45,994,364 | ) | | | (44,397,624 | ) |
Spin-Off (Note 12) | | | (332,056,224 | ) | | | — | |
| | | | | | | | |
Total distributions declared to common shareholders | | | (378,050,588 | ) | | | (44,397,624 | ) |
| | | | | | | | |
Total increase/(decrease) in net assets from common shares | | | (494,788,716 | ) | | | 136,392,401 | |
| | | | | | | | |
| | |
Share transactions | | | | | | | | |
Cost of shares redeemed (Note 13) | | | (10,532 | ) | | | — | |
| | | | | | | | |
Net increase (decrease) from shares transactions | | | (10,532 | ) | | | — | |
| | | | | | | | |
Total increase (decrease) in net assets | | | (494,799,248 | ) | | | 136,392,401 | |
| | |
Net Assets | | | | | | | | |
Beginning of period | | | 860,877,397 | | | | 724,484,996 | |
| | | | | | | | |
End of period (including undistributed net investment income of $0 and $17,839,665 respectively) | | | 366,078,149 | | | | 860,877,397 | |
| | | | | | | | |
| | |
Change in Common Shares | | | | | | | | |
Shares redeemed (Note 13) | | | (713 | ) | | | — | |
| | | | | | | | |
Net increase/(decrease) in common shares | | | (713 | ) | | | — | |
| | | | | | | | |
| | | | | | |
| See accompanying Notes to Financial Statements. | | | | | | 13 |
Statement of Cash Flows
| | |
| Year Ended December 31, 2015 | | NexPoint Credit Strategies Fund |
| | | | |
| | | ($) | |
Cash Flows Provided by (Used for) Operating Activities: | | | | |
Net decrease in net assets resulting from operations | | | (116,738,128 | ) |
| |
Adjustments to Reconcile Net Investment Income to Net Cash Provided by Operating Activities | | | | |
Operating Activities: | | | | |
Purchases of investment securities from unaffiliated issuers | | | (315,508,500 | ) |
Proceeds from disposition of investment securities from unaffiliated issuers | | | 654,366,526 | |
Purchases of investment securities from affiliated issuers | | | (479,171,129 | ) |
Proceeds from disposition of investment securities from affiliated issuers | | | 355,781,879 | |
Purchases of purchased options | | | (10,531,182 | ) |
Purchases of securities sold short | | | (49,415,309 | ) |
Proceeds of securities sold short | | | 46,169,496 | |
Paydowns at cost | | | 1,468,569 | |
Net accretion of discount | | | (3,998,556 | ) |
Dividends received in kind | | | (83,693,853 | ) |
Net premium received on open written options contracts | | | 4,779,820 | |
Net realized gain on Investments from unaffiliated issuers | | | (10,593,172 | ) |
Net realized gain on securities sold short, written options contracts and foreign currency transactions | | | (7,415,812 | ) |
Net change in unrealized appreciation/ (depreciation) on investments, securities sold short, written options contracts and translation on assets and liabilities denominated in foreign currency | | | 274,559,990 | |
Increase in due from broker | | | (20,334,410 | ) |
Decrease in receivable for investments sold | | | 44,542,654 | |
Decrease in receivable for dividends and interest | | | 1,392,675 | |
Decrease in other assets | | | 26,337 | |
Decrease in payable for investments purchased | | | (6,904,799 | ) |
Decrease in payable Due to Broker | | | (56,853,612 | ) |
Decrease in payables to related parties | | | (502,687 | ) |
Increase in payable to transfer agent fees | | | 20,699 | |
Decrease in payable for interest expense | | | (58,085 | ) |
Increase in accrued expenses and other liabilities | | | 246,643 | |
| | | | |
Net cash flow provided by operating activities | | | 221,636,054 | |
| |
Cash Flows Received from (Used In) Financing Activities: | | | | |
Decrease in notes payable | | | (169,411,140 | ) |
Distributions paid in cash | | | (45,994,164 | ) |
Payments on shares redeemed | | | (10,532 | ) |
| | | | |
Net cash flow received from (used in) financing activities | | | (215,415,836 | ) |
Effect of exchange rate changes on cash | | | (572,237 | ) |
| | | | |
Net Increase in Cash | | | 5,647,981 | |
| |
Cash and Foreign Currency/Due to Custodian: | | | | |
Beginning of year | | | (9,439,630 | ) |
| | | | |
End of year | | $ | (3,791,649 | ) |
| | | | |
| |
Supplemental disclosure of cash flow information: | | | | |
Cash paid during the year for interest | | $ | 4,006,790 | |
| | | | |
Spin-off (Note 12) | | | 332,056,224 | |
| | | | |
| | | | | | |
| 14 | | | | | | See accompanying Notes to Financial Statements. |
FINANCIAL HIGHLIGHTS
| | |
| | NexPoint Credit Strategies Fund |
Selected data for a share outstanding throughout each period is as follows:
| | | | | | | | | | | | | | | | | | | | |
| | | For the Years Ended December 31, | |
| Common Shares Per Share Operating Performance: | | 2015* | | | 2014 | | | 2013 | | | 2012 | | | 2011 | |
| | | | | |
Net Asset Value, Beginning of Period | | $ | 53.92 | | | $ | 11.34 | | | $ | 7.46 | | | $ | 6.94 | | | $ | 7.72 | |
Income from Investment Operations: | | | | | | | | | | | | | | | | | | | | |
Net investment income | | | 8.75 | (e) | | | 0.82 | | | | 0.63 | | | | 0.43 | | | | 0.47 | |
Net realized and unrealized gain/(loss) | | | (16.08 | ) | | | 2.02 | | | | 3.80 | | | | 0.52 | | | | (0.72 | ) |
| | | | | | | | | | | | | | | | | | | | |
Total from investment operations | | | (7.33 | ) | | | 2.84 | | | | 4.43 | | | | 0.95 | | | | (0.25 | ) |
Less Distributions Declared to Common Shareholders: | | | | | | | | | | | | | | | | | | | | |
From net investment income | | | (2.88 | ) | | | (0.70 | ) | | | (0.55 | ) | | | (0.43 | ) | | | (0.53 | ) |
From spin-off (Note 12) | | | (20.79 | ) | | | — | | | | — | | | | — | | | | — | |
| | | | | | | | | | | | | | | | | | | | |
| | | | | |
Total distributions declared to common shareholders | | | (23.67 | ) | | | (0.70 | ) | | | (0.55 | ) | | | (0.43 | ) | | | (0.53 | ) |
Net Asset Value, End of Period | | $ | 22.92 | | | $ | 13.48 | | | $ | 11.34 | | | $ | 7.46 | | | $ | 6.94 | |
Market Value, End of Period | | $ | 20.44 | | | $ | 11.23 | | | $ | 9.42 | | | $ | 6.64 | | | $ | 6.18 | |
Market Value Total Return(a) | | | (18.09 | )% | | | 26.77 | % | | | 52.03 | % | | | 14.73 | % | | | (12.18 | )% |
Common Share Information at End of Period: | | | | | | | | | | | | | | | | | | | | |
Ratios based on average net assets of common shares: | | | | | | | | | | | | | | | | | | | | |
Ratios and Supplemental Data: | | | | | | | | | | | | | | | | | | | | |
Net assets, end of period (in 000’s) | | $ | 366,078 | | | $ | 860,877 | | | $ | 724,485 | | | $ | 476,263 | | | $ | 443,048 | |
Gross operating expenses(b)(c) | | | 3.43 | % | | | 2.48 | % | | | 2.82 | % | | | 3.14 | % | | | 3.15 | % |
Net operating expenses(b) | | | 3.43 | % | | | 2.48 | % | | | 2.82 | % | | | 3.14 | % | | | 3.15 | % |
Net investment income | | | 24.23 | %(f) | | | 6.45 | % | | | 7.01 | % | | | 6.00 | % | | | 6.24 | % |
Ratios based on managed net assets of common shares: | | | | | | | | | | | | | | | | | | | | |
Gross operating expenses(b)(d) | | | 2.23 | % | | | 1.68 | % | | | 1.98 | % | | | 2.26 | % | | | 2.27 | % |
Net operating expenses(b) | | | 2.23 | % | | | 1.68 | % | | | 1.98 | % | | | 2.26 | % | | | 2.27 | % |
Net investment income | | | 15.79 | %(g) | | | 4.38 | % | | | 4.91 | % | | | 4.32 | % | | | 4.50 | % |
Portfolio turnover rate(h) | | | 31 | % | | | 59 | % | | | 74 | % | | | 92 | % | | | 52 | % |
| * | Per share data prior to October 6, 2015 has been adjusted to give effect to a 4 to 1 reverse stock split. (See Note 13) |
| (a) | Based on market value per share. Distributions, if any, are assumed for purposes of this calculation to be reinvested at prices obtained under the Fund’s Dividend Reinvestment Plan. |
| (b) | Includes dividends and expenses on securities sold short. |
| (c) | Gross operating expenses (excluding interest expense and commitment fees) were 2.72% for the year ended December 31, 2015. Gross operating expenses (excluding interest expense and commitment fees) were 1.98%, 2.22%, 2.22% and 2.23% for the years ended December 31, 2014, 2013, 2012 and 2011, respectively. |
| (d) | Gross operating expenses (excluding interest expense and commitment fees) were 1.77% for the year ended December 31, 2015. Gross operating expenses (excluding interest expense and commitment fees) were 1.34%, 1.56%, 1.60% and 1.61% for the years ended December 31, 2014, 2013, 2012 and 2011, respectively. |
| (e) | Includes non-recurring dividend from Freedom REIT. (See Note 12). |
| (f) | Net investment income (excluding non-recurring dividend from Freedom REIT) was 9.76%. (See Note 12) |
| (g) | Net investment income (excluding non-recurring dividend from Freedom REIT) was 6.36%. (See Note 12) |
| (h) | Excludes in-kind activity. |
| | | | | | |
| See accompanying Notes to Financial Statements. | | | | | | 15 |
NOTES TO FINANCIAL STATEMENTS
| | |
| December 31, 2015 | | NexPoint Credit Strategies Fund |
Note 1. Organization
NexPoint Credit Strategies Fund (the “Fund”) is a Delaware statutory trust and is registered with the Securities and Exchange Commission (the “SEC”) under the Investment Company Act of 1940, as amended (the “1940 Act”), as a non-diversified, closed-end management investment company. The financial statements include information for the fiscal year ended December 31, 2015. The Fund trades on the New York Stock Exchange (“NYSE”) under the ticker symbol NHF. The Fund may issue an unlimited number of common shares, par value $0.001 per share (“Common Shares”). The Fund commenced operations on June 29, 2006. NexPoint Advisors, L.P. (“NexPoint” or “Investment Adviser”), an affiliate of Highland Capital Management Fund Advisors, L.P. (“Highland”), is the investment adviser and administrator to the Fund.
Note 2. Significant Accounting Policies
The following summarizes the significant accounting policies consistently followed by the Fund in the preparation of its financial statements.
Use of Estimates
The Fund is an investment company that follows the accounting and reporting guidance of Accounting Standards Codification Topic 946 applicable to investment companies. The Fund’s financial statements have been prepared in conformity with accounting principles generally accepted in the United States of America (“GAAP”), which require management to make estimates and assumptions that affect the reported amounts of assets and liabilities, the disclosure of contingent assets and liabilities at the date of the financial statements and the reported amounts of revenue and expenses during the reporting period. Changes in the economic environment, financial markets and any other parameters used in determining these estimates could cause actual results to differ materially.
Fund Valuation
The net asset value (“NAV”) of the Fund’s common shares is calculated daily on each day that the NYSE is open for business as of the close of the regular trading session on the NYSE, usually 4:00 PM, Eastern Time. The NAV is calculated by dividing the value of the Fund’s net assets attributable to common shares by the numbers of common shares outstanding.
Valuation of Investments
In computing the Fund’s net assets attributable to common shares, securities with readily available market quotations on the NYSE, NASDAQ or other nationally recognized exchange, use the closing quotations on the respective exchange for valuation of those securities. Securities for
which there are no readily available market quotations will be valued pursuant to policies adopted by the Board of Trustees (the “Board”). Typically, such securities will be valued at the mean between the most recently quoted bid and ask prices provided by the principal market makers. If there is more than one such principal market maker, the value shall be the average of such means. Securities without a sale price or quotations from principal market makers on the valuation day may be priced by an independent pricing service. Generally, the Fund’s loan and bond positions are not traded on exchanges and consequently are valued based on a mean of the bid and ask price from the third-party pricing services or broker-dealer sources that the Investment Adviser has determined to generally have the capability to provide appropriate pricing and have been approved by the Board.
Securities for which market quotations are not readily available, for which the Fund has determined the price received from a pricing service or broker-dealer is “stale” or otherwise does not represent fair value (such as when events materially affecting the value of securities occur between the time when market price is determined and calculation of the Fund’s NAV), will be valued by the Fund at fair value, as determined by the Board or its designee in good faith in accordance with procedures approved by the Board, taking into account factors reasonably determined to be relevant, including, among other things,: (i) the fundamental analytical data relating to the investment; (ii) the nature and duration of restrictions on disposition of the securities; and (iii) an evaluation of the forces that influence the market in which these securities are purchased and sold. In these cases, the Fund’s NAV will reflect the affected portfolio securities’ fair value as determined in the judgment of the Board or its designee instead of being determined by the market. Using a fair value pricing methodology to value securities may result in a value that is different from a security’s most recent sale price and from the prices used by other investment companies to calculate their NAV. Determination of fair value is uncertain because it involves subjective judgments and estimates.
There can be no assurance that the Fund’s valuation of a security will not differ from the amount that it realizes upon the sale of such security. Those differences could have a material impact to the Fund. The NAV shown in the Fund’s financial statements may vary from the NAV published by the Fund as of its fiscal year end because portfolio securities transactions are accounted for on the trade date (rather than the day following the trade date) for financial statement purposes and/or because of information relating to the value of the Fund’s portfolio securities as of the Fund’s fiscal year end that became available prior to the completion of this annual report that was not available at the time the Fund’s NAV as of its fiscal year end was published.
NOTES TO FINANCIAL STATEMENTS (continued)
| | |
| December 31, 2015 | | NexPoint Credit Strategies Fund |
Fair Value Measurements
The Fund has performed an analysis of all existing investments and derivative instruments to determine the significance and character of all inputs to their fair value determination. The levels of fair value inputs used to measure the Fund’s investments are characterized into a fair value hierarchy. Where inputs for an asset or liability fall into more than one level in the fair value hierarchy, the investment is classified in its entirety based on the lowest level input that is significant to that investment’s valuation. The three levels of the fair value hierarchy are described below:
| Level 1 — | Quoted unadjusted prices for identical instruments in active markets to which the Fund has access at the date of measurement; |
| Level 2 — | Quoted prices for similar instruments in active markets; quoted prices for identical or similar instruments in markets that are not active, but are valued based on executed trades; broker quotations that constitute an executable price; and alternative pricing sources supported by observable inputs are classified within Level 2. Level 2 inputs are either directly or indirectly observable for the asset in connection with market data at the measurement date; and |
| Level 3 — | Model derived valuations in which one or more significant inputs or significant value drivers are unobservable. In certain cases, investments classified within Level 3 may include securities for which the Fund has obtained indicative quotes from broker-dealers that do not necessarily represent prices the broker may be willing to trade on, as such quotes can be subject to material management judgment. Unobservable inputs are those inputs that reflect the Fund’s own assumptions that market participants would use to price the asset or liability based on the best available information. |
The Investment Adviser has established policies and procedures, as described above and approved by the Board, to ensure that valuation methodologies for investments and financial instruments that are categorized within all levels of the fair value hierarchy are fair and consistent. A Pricing Committee has been established to provide oversight of the valuation policies, processes and procedures, and is comprised of personnel from the Investment Adviser. The Pricing Committee meets monthly to review the proposed valuations for investments and financial Instruments and is responsible for evaluating the overall fairness and consistent application of established policies.
As of December 31, 2015, the Fund’s investments consisted of senior loans, asset-backed securities, corporate bonds and notes, foreign bonds, sovereign bonds, common stocks,
preferred stocks, exchange-traded funds, warrants, securities sold short and options. The fair value of the Fund’s loans, bonds and asset-backed securities are generally based on quotes received from brokers or independent pricing services. Loans, bonds collateralized loan obligations and asset-backed securities with quotes that are based on actual trades with a sufficient level of activity on or near the measurement date are classified as Level 2 assets. Loans, bonds and asset-backed securities that are priced using quotes derived from implied values, indicative bids, or a limited number of actual trades are classified as Level 3 assets because the inputs used by the brokers and pricing services to derive the values are not readily observable.
The fair value of the Fund’s common stocks, preferred stocks, exchange-traded funds, warrants and options that are not actively traded on national exchanges are generally priced using quotes derived from implied values, indicative bids, or a limited amount of actual trades and are classified as Level 3 assets because the inputs used by the brokers and pricing services to derive the values are not readily observable. The Fund’s real estate investments include equity interests in limited liability companies and equity issued by REITs that invest in commercial real estate. The fair value of real estate investments that are not actively traded on national exchanges are based on internal models developed by the Investment Adviser. The significant inputs to the models include cash flow projections for the underlying properties, capitalization rates and appraisals performed by independent valuation firms. These inputs are not readily observable, and the Fund has classified the investments as Level 3 assets. Exchange-traded options are valued based on the last traded price on the primary exchange on which they trade. If an option does not trade, the mid-price is utilized to value the option.
At the end of each calendar quarter, management evaluates the Level 2 and 3 assets and liabilities for changes in liquidity, including but not limited to: whether a broker is willing to execute at the quoted price, the depth and consistency of prices from third party services, and the existence of contemporaneous, observable trades in the market. Additionally, management evaluates the Level 1 and 2 assets and liabilities on a quarterly basis for changes in listings or delistings on national exchanges.
Due to the inherent uncertainty of determining the fair value of investments that do not have a readily available market value, the fair value of the Fund’s investments may fluctuate from period to period. Additionally, the fair value of investments may differ significantly from the values that would have been used had a ready market existed for such investments and may differ materially from the values the Fund may ultimately realize. Further, such investments may be subject to legal and other restrictions on resale or otherwise less liquid than publicly traded securities.
NOTES TO FINANCIAL STATEMENTS (continued)
| | |
| December 31, 2015 | | NexPoint Credit Strategies Fund |
The inputs or methodology used for valuing securities are not necessarily an indication of the risk associated with investing in those securities. Transfers in and out of the levels are recognized at the value at the end of the period. A summary of the inputs used to value the Fund’s assets as of December 31, 2015 is as follows:
| | | | | | | | | | | | | | | | |
| | | Total
value at
December 31, 2015 | | | Level 1
Quoted
Price | | | Level 2
Significant
Observable
Inputs | | | Level 3
Significant
Unobservable
Inputs | |
Assets | |
U.S. Senior Loans(1) | | | | | | | | | | | | | | | | |
Chemicals | | $ | 2,202,577 | | | $ | — | | | $ | 2,202,577 | | | $ | — | |
Energy | | | 511,505 | | | | — | | | | 511,505 | | | | — | |
Gaming & Leisure | | | 4,476,048 | | | | — | | | | — | | | | 4,476,048 | |
Housing | | | — | | | | — | | | | — | | | | — | (2) |
Media & Telecommunications | | | — | | | | — | | | | — | | | | — | (2) |
Service | | | 10,984,004 | | | | — | | | | 10,984,004 | | | | — | |
Telecommunications | | | 13,874,103 | | | | — | | | | — | | | | 13,874,103 | |
Utility | | | 37,568,577 | | | | — | | | | 37,568,577 | | | | — | |
Foreign Denominated or Domiciled Senior Loans | | | 644,763 | | | | — | | | | 609,703 | | | | 35,060 | |
Asset-Backed Securities | | | 62,674,131 | | | | — | | | | 62,674,131 | | | | — | |
Corporate Bonds & Notes(1) | | | 36,398,334 | | | | — | | | | 36,398,334 | | | | — | (2) |
Foreign Corporate Bonds & Notes | | | 645,151 | | | | — | | | | 645,151 | | | | — | (2) |
Sovereign Bonds | | | 6,280,034 | | | | — | | | | 6,280,034 | | | | — | |
Common Stocks | | | | | | | | | | | | | | | | |
Chemicals | | | 4,682,969 | | | | — | | | | — | | | | 4,682,969 | |
Consumer Discretionary | | | 6,704,157 | | | | 6,704,157 | | | | — | | | | — | |
Energy | | | 9,144,058 | | | | 9,144,058 | | | | — | | | | — | |
Financial | | | 28,110,261 | | | | 5,593,762 | | | | — | | | | 22,516,499 | |
Gaming & Leisure | | | — | | | | — | | | | — | | | | — | (2) |
Healthcare | | | 1,569,600 | | | | — | | | | — | | | | 1,569,600 | |
Housing | | | 1,141,265 | | | | — | | | | — | | | | 1,141,265 | |
Information Technology | | | 2,629,549 | | | | 2,629,549 | | | | — | | | | — | |
Media & Telecommunications | | | 26,075,451 | | | | 2,311,381 | | | | 23,764,070 | | | | — | |
Real Estate | | | 5 | | | | — | | | | — | | | | 5 | (2) |
Real Estate Investment Trust | | | 163,280,380 | | | | 1,374,513 | | | | — | | | | 161,905,867 | |
Telecommunications | | | 33,434,560 | | | | — | | | | — | | | | 33,434,560 | |
Utility | | | 19,422,724 | | | | 13,125,469 | | | | 6,297,255 | | | | — | |
Wireless Communications | | | 1,132,751 | | | | 1,132,751 | | | | — | | | | — | |
Preferred Stocks(1) | | | 114,841,739 | | | | — | | | | 114,841,739 | | | | — | |
Exchange-Traded Funds | | | 3,543,741 | | | | 3,543,741 | | | | — | | | | — | |
Warrants(1) | | | | | | | | | | | | | | | | |
Equity Contracts | | | 392,846 | | | | 392,846 | | | | — | | | | — | (2) |
Purchased Call Options | | | 7,044,000 | | | | 7,044,000 | | | | — | | | | — | |
| | | | | | | | | | | | | | | | |
Total Assets | | $ | 599,409,283 | | | $ | 52,996,227 | | | $ | 302,777,080 | | | $ | 243,635,976 | |
| | | | | | | | | | | | | | | | |
Liabilities | |
Securities Sold Short(1) | | $ | (21,369,432 | ) | | $ | (21,369,432 | ) | | $ | — | | | $ | — | |
Other Financial Instruments | | | | | | | | | | | | | | | | |
Written Put Options Contracts | | | | | | | | | | | | | | | | |
Equity Contracts | | | (8,652,913 | ) | | | (8,652,913 | ) | | | — | | | | — | |
| | | | | | | | | | | | | | | | |
Total Liabilities | | $ | (30,022,345 | ) | | $ | (30,022,345 | ) | | $ | — | | | $ | — | |
| | | | | | | | | | | | | | | | |
Total | | $ | 569,386,938 | | | $ | 22,973,882 | | | $ | 302,777,080 | | | $ | 243,635,976 | |
| | | | | | | | | | | | | | | | |
| (1) | See Investment Portfolio detail for industry breakout. |
| (2) | This category includes securities with a value of zero. |
NOTES TO FINANCIAL STATEMENTS (continued)
| | |
| December 31, 2015 | | NexPoint Credit Strategies Fund |
The table below sets forth a summary of changes in the Fund’s Level 3 assets (assets measured at fair value using significant unobservable inputs) for the year ended December 31, 2015.
| | | | | | | | | | | | | | | | | | | | | | | | | | | | | | | | | | | | | | | | |
| | | Balance
as of
December 31,
2014 | | | Transfers
into
Level 3 | | | Transfers
Out
of Level 3 | | | Net
Amortization
(Accretion)
of Premium/
(Discount) | | | Net
Realized
Gains/
(Losses) | | | Net
Unrealized
Gains/
(Losses) | | | Net
Purchases(1) | | | Net
(Sales)(1) | | | Balance
as of
December 31,
2015 | | | Change in
Unrealized
Gain/(Loss)
on Level 3
securities
still held at
period end | |
U.S. Senior Loans | | | | | | | | | | | | | | | | | | | | | | | | | | | | | | | | | | | | | | | | |
Gaming & Leisure | | $ | 4,596,592 | | | $ | 305,161 | | | $ | — | | | $ | — | | | $ | — | | | $ | (853,844 | ) | | $ | 428,139 | | | $ | — | | | $ | 4,476,048 | | | $ | (853,844 | ) |
Healthcare | | | 2,150,625 | | | | — | | | | — | | | | 757 | | | | (34,057 | ) | | | 47,175 | | | | — | | | | (2,164,500 | ) | | | — | | | | — | |
Housing | | | 72,857 | | | | — | | | | — | | | | — | | | | 204,848 | | | | (53,989 | ) | | | — | | | | (223,716 | ) | | | — | (2) | | | (53,989 | ) |
Media & Telecommunications | | | — | | | | — | | | | — | | | | — | | | | 2,421 | | | | 4,882 | | | | — | | | | (7,303 | ) | | | — | (2) | | | 4,882 | |
Telecommunications | | | 6,637,538 | | | | — | | | | — | | | | (1,794 | ) | | | 11,515 | | | | (256,642 | ) | | | 16,853,382 | | | | (9,369,896 | ) | | | 13,874,103 | | | | (65,443 | ) |
Utility | | | 7,883,995 | | | | — | | | | (8,778,345 | ) | | | 108,856 | | | | 18,852 | | | | 83,690 | | | | 976,981 | | | | (294,029 | ) | | | — | | | | — | |
Foreign Denominated or Domiciled Senior Loans | | | 383,212 | | | | — | | | | — | | | | (237 | ) | | | 59,322 | | | | 107,215 | | | | — | | | | (514,452 | ) | | | 35,060 | | | | 104,800 | |
Foreign Corporate Bonds & Notes | | | | | | | | | | | | | | | | | | | | | | | | | | | | | | | | | | | | | | | | |
Healthcare | | | 645,151 | | | | — | | | | (645,151 | ) | | | — | | | | — | | | | — | | | | — | | | | — | | | | — | (2) | | | — | |
Common Stocks | | | | | | | | | | | | | | | | | | | | | | | | | | | | | | | | | | | | | | | | |
Broadcasting | | | 2,826,747 | | | | — | | | | — | | | | — | | | | — | | | | (2,826,747 | ) | | | — | | | | — | | | �� | — | | | | 231,701 | |
Chemicals | | | 6,445,041 | | | | | | | | | | | | | | | | | | | | (7,904,753 | ) | | | 6,142,681 | | | | | | | | 4,682,969 | | | | (7,904,753 | ) |
Financial | | | 4,925,294 | | | | 8,120,860 | | | | — | | | | — | | | | — | | | | 168,403 | | | | 9,301,942 | | | | — | | | | 22,516,499 | | | | 168,403 | |
Gaming & Leisure | | | — | | | | — | | | | — | | | | — | | | | — | | | | — | | | | — | | | | — | | | | — | (2) | | | — | |
Healthcare | | | 3,429,600 | | | | — | | | | — | | | | — | | | | — | | | | (1,860,000 | ) | | | — | | | | — | | | | 1,569,600 | | | | (1,860,000 | ) |
Housing | | | 1,239,193 | | | | — | | | | — | | | | — | | | | — | | | | (97,928 | ) | | | — | | | | — | | | | 1,141,265 | | | | (97,928 | ) |
Real Estate | | | 3 | | | | — | | | | — | | | | — | | | | — | | | | (2,672,943 | ) | | | 2,672,945 | | | | — | | | | 5 | (2) | | | (2,672,944 | ) |
Real Estate Investment Trust | | | 294,021,630 | | | | — | | | | — | | | | — | | | | — | | | | (43,480,182 | ) | | | 491,992,249 | | | | (580,627,830 | ) | | | 161,905,867 | | | | (43,480,182 | ) |
Telecommunications | | | 12,325,733 | | | | — | | | | — | | | | — | | | | — | | | | 1,845,001 | | | | 19,263,826 | | | | — | | | | 33,434,560 | | | | 1,845,001 | |
Warrants | | | | | | | | | | | | | | | | | | | | | | | | | | | | | | | | | | | | | | | | |
Equity Contracts | | | — | | | | — | | | | — | | | | — | | | | — | | | | — | | | | — | | | | — | | | | — | (2) | | | | |
| | | | | | | | | | | | | | | | | | | | | | | | | | | | | | | | | | | | | | | | |
Total | | $ | 347,583,211 | | | $ | 8,426,021 | | | $ | (9,423,496 | ) | | $ | 107,582 | | | $ | 262,901 | | | $ | (57,750,662 | ) | | $ | 547,632,145 | | | $ | (593,201,726 | ) | | $ | 243,635,976 | | | $ | (54,634,296 | ) |
| | | | | | | | | | | | | | | | | | | | | | | | | | | | | | | | | | | | | | | | |
| (1) | Includes any applicable borrowings and/or paydowns made on revolving credit facilities held in the Fund’s Investment Portfolio. |
| (2) | This category includes securities with a value of zero. |
Investments designated as Level 3 may include assets valued using quotes or indications furnished by brokers which are based on models or estimates and may not be executable prices. In light of the developing market conditions, the Investment Adviser continues to search for observable data points and evaluate broker quotes and indications received for portfolio investments. As a result, for the year ended December 31, 2015, $8,120,860 of the Fund’s portfolio investments was transferred from Level 1 to Level 3. In addition, $305,161 of the Fund’s portfolio investments was transferred from Level 2 to Level 3. Determination of fair values is uncertain because it involves subjective judgments and estimates that are
unobservable. Transfers from Level 1 or Level 2 to Level 3 are due to a decline in market activity (e.g. frequency of trades), which resulted in a reduction of available market inputs to determine price.
For the year ended December 31, 2015, $9,423,496 of the Fund’s portfolio investments was transferred from Level 3 to Level 2. Transfers from Level 3 to Level 2 are due to an increase in market activity (e.g. frequency of trades), which resulted in an increase of available market inputs to determine price.
For the year ended December 31, 2015, there were no transfers between Level 1 and Level 2.
NOTES TO FINANCIAL STATEMENTS (continued)
| | |
| December 31, 2015 | | NexPoint Credit Strategies Fund |
The following is a summary of significant unobservable inputs used in the fair valuation of assets and liabilities categorized within Level 3 of the fair value hierarchy:
| | | | | | | | | | |
| Category | | Market
Value at
12/31/2015 | | | Valuation Technique | | Unobservable Inputs | | Input Value(s) |
Real Estate Investment Trust | | $ | 161,905,867 | | | Third-Party Valuations | | Capitalization Rates | | 6% - 9.5% |
| | | | | | Net Asset Value | | N/A | | N/A |
Common Stock | | | 60,634,033 | | | Third-Party Pricing Vendor | | N/A | | N/A |
| | | | | | Multiples Analysis | | Price/MHz-PoP | | $0.13 - $0.50 |
| | | | | | | | Multiple of EBITDA | | 6.3x |
| | | | | | | | Liquidity Discount | | 25% |
| | | | | | Net Asset Value | | N/A | | N/A |
Bank Loans | | | 18,385,211 | | | Third-Party Pricing Vendor | | N/A | | N/A |
| | | | | | Discounted Cash Flow | | Spread Adjustment | | 0.0% - 0.2% |
| | | | | | Adjusted Appraisal | | Liquidity Discount | | 10% |
Limited Partnership Units | | | 2,710,865 | | | Recovery Analysis | | Scenario Probabilities | | Various |
| | | | | | Discounted Cash Flow | | Discount Rate | | 19% |
| | | | | | | | | | |
Total | | $ | 243,635,976 | | | | | | | |
Security Transactions
Security transactions are accounted for on the trade date. Realized gains/ (losses) on investments sold are recorded on the basis of specific identification method for both financial statement and U.S. federal income tax purposes.
Income Recognition
Corporate actions (including cash dividends) are recorded on the ex-dividend date, net of applicable withholding taxes, except for certain foreign corporate actions, which are recorded as soon after ex-dividend date as such information becomes available. Interest income is recorded on the accrual basis.
Accretion of discount and amortization of premium on taxable bonds are computed to the call or maturity date, whichever is shorter, using the effective yield method. Withholding taxes on foreign dividends have been provided for in accordance with the Fund’s understanding of the applicable country’s tax rules and rates.
U.S. Federal Income Tax Status
The Fund is treated as a separate taxpayer for U.S. federal income tax purposes. The Fund intends to qualify each year as a “regulated investment company” under Subchapter M of the Internal Revenue Code of 1986, as amended, and will distribute substantially all of its taxable income and gains, if any, for the tax year, and as such will not be subject to U.S. federal income taxes. In addition, the Fund intends to distribute, in each calendar year, all of its net investment income, capital gains and certain other amounts, if any, such that the Fund should not be subject to U.S. federal excise tax. Therefore, no U.S. federal income or excise tax provisions are recorded.
Management has analyzed the Fund’s tax positions taken on U.S. federal income tax returns for all open tax years (current and prior three tax years), and has concluded that no provision for U.S. federal income tax is required in the Fund’s financial statements. The Fund’s U.S. federal and state income and U.S. federal excise tax returns for tax years for which the applicable statutes of limitations have not expired are subject to examination by the Internal Revenue Service and state departments of revenue. Furthermore, management of the Fund is also not aware of any tax positions for which it is reasonably possible that the total amounts of unrecognized tax benefits will significantly change in the next 12 months.
Distributions to Shareholders
The Fund plans to pay distributions from net investment income monthly and net realized capital gains annually to common shareholders. To permit the Fund to maintain more stable monthly distributions and annual distributions, the Fund may from time to time distribute less than the entire amount of income and gains earned in the relevant month or year, respectively. The undistributed income and gains would be available to supplement future distributions. Shareholders of the Fund will automatically have all distributions reinvested in Common Shares of the Fund issued by the Fund in accordance with the Fund’s Dividend Reinvestment Plan (the “Plan”) unless an election is made to receive cash. The number of newly issued Common Shares to be credited to each participant’s account will be determined by dividing the dollar amount of the dividend by the lesser of (i) the NAV per Common Share determined on the Declaration Date and (ii) the market price per Common Share as of the close of regular trading on the NYSE on the Declaration Date. Participants
NOTES TO FINANCIAL STATEMENTS (continued)
| | |
| December 31, 2015 | | NexPoint Credit Strategies Fund |
in the Plan requesting a sale of securities through the plan agent of the Plan are subject to a sales fee and a brokerage commission.
Statement of Cash Flows
Information on financial transactions which have been settled through the receipt or disbursement of cash is presented in the Statement of Cash Flows. The cash amount shown in the Statement of Cash Flows is the amount included within the Fund’s Statement of Assets and Liabilities and includes cash on hand at its custodian bank and sub-custodian bank, respectively, and does not include cash posted as collateral in the segregated account or with the broker-dealers.
Cash & Cash Equivalents
The Fund considers liquid assets deposited with a bank and certain short-term debt instruments with original maturities of 3 months or less to be cash equivalents. These investments represent amounts held with financial institutions that are readily accessible to pay Fund expenses or purchase investments. Cash and cash equivalents are valued at cost plus accrued interest, which approximates market value. The value of cash equivalents denominated in foreign currencies is determined by converting to U.S. dollars on the date of the Statement of Assets and Liabilities.
Foreign Currency
Accounting records of the Fund is maintained in U.S. dollars. Foreign currencies, investments and other assets and liabilities denominated in foreign currencies are translated into U.S. dollars at the exchange rates using the current 4:00 PM London Time Spot Rate. Fluctuations in the value of the foreign currencies and other assets and liabilities resulting from changes in exchange rates, between trade and settlement dates on securities transactions and between the accrual and payment dates on dividends, interest income and foreign withholding taxes, are recorded as unrealized foreign currency gains/(losses). Realized gains/ (losses) and unrealized appreciation/ (depreciation) on investment securities and income and expenses are translated on the respective dates of such transactions. The effects of changes in foreign currency exchange rates on investments in securities are not segregated in the Statement of Operations from the effects of changes in market prices of those securities, but are included with the net realized and unrealized gain or loss on investment securities.
Securities Sold Short
The Fund may sell securities short. A security sold short is a transaction in which the Fund sells a security it does not
own in anticipation that the market price of that security will decline. When the Fund sells a security short, it must borrow the security sold short from a broker-dealer and deliver it to the buyer upon conclusion of the transaction. The Fund may have to pay a fee to borrow particular securities and is often obligated to pay over any dividends or other payments received on such borrowed securities. Cash held as collateral for securities sold short is classified as due to broker on the Statement of Assets and Liabilities. Securities held as collateral for securities sold short are shown on the Investment Portfolio for the Fund.
When securities are sold short, the Fund intends to limit exposure to a possible market decline in the value of its portfolio securities through short sales of securities that the Investment Adviser believes possess volatility characteristics similar to those being hedged. In addition, the Fund may use short sales for non-hedging purposes to pursue its investment objective. Subject to the requirements of the 1940 Act and the Internal Revenue Code of 1986, as amended (the “Code”), the Fund will not make a short sale if, after giving effect to such sale, the market value of all securities sold short by the Fund exceeds 25% of the value of its total assets. The Fund may make short sales “against the box” without respect to such limitations.
Note 3. Derivative Transactions
The Fund is subject to equity price risk, interest rate risk and foreign currency exchange rate risk in the normal course of pursuing its investment objective. The Fund enters into derivative transactions for the purpose of hedging against the effects of changes in the value of portfolio securities due to anticipated changes in market conditions, to gain market exposure for residual and accumulating cash positions and for managing the duration of fixed income investments.
Options
The Fund purchases and writes options, subject to certain limitations. The Fund may invest in options contracts to manage its exposure to the stock and bond markets and fluctuations in foreign currency values. Writing puts and buying calls tend to increase the Fund’s exposure to the underlying instrument while buying puts and writing calls tend to decrease the Fund’s exposure to the underlying instrument, or economically hedge other Fund investments. The Fund’s risks in using these contracts include changes in the value of the underlying instruments, nonperformance of the counterparties under the contracts’ terms and changes in the liquidity of the secondary market for the contracts. Options are valued at the last sale price, or if no sales occurred on that day, at the last quoted bid price.
NOTES TO FINANCIAL STATEMENTS (continued)
| | |
| December 31, 2015 | | NexPoint Credit Strategies Fund |
When the Fund writes an option, the amount of the premium received is recorded as a liability and is subsequently adjusted to the current fair value of the option written. Premiums received from writing options that expire unexercised are treated by the Fund on the expiration date as realized gains from investments. The difference between the premium and the amount paid on effecting a closing purchase transaction, including brokerage commissions, is also treated as a realized gain, or if the premium is less than the amount paid for the closing purchase, as a realized loss. When an option is exercised, the proceeds from the sale of the underlying security or the cost basis of the securities purchased are adjusted by the original premium received or paid.
Transactions in written options for the year ended December 31, 2015 were as follows:
| | | | | | | | | | | | |
| | | Number of
Contracts | | | Notional Value | | | Premium | |
Outstanding, December 31, 2014 | | | 5,050 | | | $ | 21,850,000 | | | $ | 1,296,020 | |
Call Options Written | | | 3,000 | | | | 5,100,000 | | | | 427,321 | |
Put Options Written | | | 11,900 | | | | 89,275,000 | | | | 8,511,620 | |
Call Options Expired | | | (1,000 | ) | | | (1,700,000 | ) | | | (142,440 | ) |
Put Options Exercised | | | (5,325 | ) | | | (24,050,000 | ) | | | (1,469,943 | ) |
Call Options Closed | | | (2,000 | ) | | | (3,400,000 | ) | | | (284,881 | ) |
Put Options Closed | | | (8,500 | ) | | | (62,375,000 | ) | | | (6,311,398 | ) |
| | | | | | | | | | | | |
Outstanding, December 31, 2015 | | | 3,125 | | | | 24,700,000 | | | | 2,026,299 | |
Additional Derivative Information
The Fund adopted amendments to authoritative guidance on disclosures about derivative instruments and hedging activities which require that the Fund disclose: a) how and why an entity uses derivative instruments, b) how derivative instruments and related hedged items are accounted for, c) how derivative instruments and related hedged items affect an entity’s financial position, financial performance and cash flows and d) how the netting of derivatives subject to master netting arrangements (if applicable) affects the net exposure of the Fund related to the derivatives.
The fair value of derivative instruments on the Statement of Assets and Liabilities have the following risk exposure at December 31, 2015:
| | | | | | | | |
| | | Fair Value | |
| Risk Exposure | | Asset
Derivative | | | Liability
Derivative | |
Equity Price Risk | | $ | 7,044,000 | (1) | | $ | 8,652,913 | (2) |
| (1) | Statement of Assets and Liabilities location: Investments from unaffiliated issuers, at value. |
| (2) | Statement of Assets and Liabilities location: Written options contracts, at value. |
The effect of derivative instruments on the Statement of Operations for the year ended December 31, 2015, is as follows:
| | | | | | | | |
| Risk Exposure | | Net
Realized
Gain/(Loss)
on Derivatives | | | Net Change in
Unrealized
Appreciation/
(Depreciation)
on Derivatives | |
Equity Price Risk | | $ | (3,847,112 | )(1)(2) | | $ | (21,473,996 | )(3)(4) |
| (1) | Statement of Operations location: Realized gain/(loss) on investments from unaffiliated issuers. |
| (2) | Statement of Operations location: Realized gain/(loss) on investments from written options contracts. |
| (3) | Statement of Operations location: Net change in unrealized appreciation/ (depreciation) on investments. |
| (4) | Statement of Operations location: Net change in unrealized appreciation/ (depreciation) on written options contracts. |
For the year ended December 31, 2015, the Fund’s quarterly average volume of derivatives is as follows:
| | | | |
| Fund | | Units/
Contracts | |
Purchased Options Contracts | | | 23,978 | |
Written Options Contracts | | | 5,415 | |
Note 4. Securities Lending
The Fund may make secured loans of its portfolio securities amounting to not more than one-third of the value of its portfolio securities, thereby realizing additional income. The risks in lending portfolio securities, as with other extensions of credit, consist of possible delays in recovery of the securities or possible loss of rights in the collateral should the borrower fail financially and possible investment losses in the investment of collateral. Pursuant to the Fund’s securities lending policy, securities loans are made to borrowers pursuant to agreements requiring that loans be continuously secured by collateral in cash or securities of the U.S. government or its agencies or instrumentalities, irrevocable letters of credit issued by a bank or forms of collateral acceptable under the Fund’s securities lending agreement at least equal at all times to the current market value of the securities subject to the loan. The borrower pays to the Fund an amount equal to any interest or dividends received on securities subject to the loan. The Fund retains all or a portion of the interest received on investment of the cash collateral or receives a fee from the borrower.
Securities lending transactions are entered into pursuant to Securities Lending Authorization Agreements (“SLAA”), which provides the right, in the event of default (including bankruptcy or insolvency) for the non-defaulting party to liquidate the collateral and calculate a net exposure to the defaulting party or request additional collateral. In the event that a borrower defaults, the Fund, as lender, would
NOTES TO FINANCIAL STATEMENTS (continued)
| | |
| December 31, 2015 | | NexPoint Credit Strategies Fund |
offset the market value of the collateral received against the market value of the securities loaned. The value of the collateral is typically greater than that of the market value of the securities loaned, leaving the lender with a net amount payable to the defaulting party. However, bankruptcy or insolvency laws of a particular jurisdiction may impose restrictions on or prohibitions against such a right of offset in the event of a SLAA counterparty’s bankruptcy or insolvency. Under the SLAA, the Fund can reinvest cash collateral, or, upon an event of default, resell or repledge the collateral, and the borrower can resell or repledge the loaned securities. The risks of securities lending also include the risk that the borrower may not provide additional collateral when required or may not return the securities when due. To mitigate this risk, the Fund benefits from a borrower default indemnity provided by State Street Bank and Trust Company (“State Street”). State Street’s indemnity generally provides for replacement of securities lent or the approximate value thereof. As of December 31, 2015, the Fund did not hold securities on loan.
Note 5. U.S. Federal Income Tax Information
The character of income and gains to be distributed is determined in accordance with income tax regulations which may differ from U.S. GAAP. These differences include (but are not limited to) investments organized as partnerships for tax purposes, foreign taxes, investments in futures, losses deferred to off-setting positions, tax treatment of organizational start-up costs, losses deferred due
to wash sale transactions, dividends deemed paid upon shareholder redemption of Fund shares and tax attributes from Fund reorganizations. Reclassifications are made to the Fund’s capital accounts to reflect income and gains available for distribution (or available capital loss carryovers) under income tax regulations. These reclassifications have no impact on the NAV of the Fund. The calculation of net investment income per share in the Financial Highlights table excludes these adjustments.
For the year ended December 31, 2015, permanent differences chiefly resulting from foreign currency gains and losses, defaulted bonds, partnership basis adjustments, return of capital distributions from real estate investment trusts, passive foreign investment companies, expired capital loss carry-overs and non-deductible excise taxes paid were identified and reclassified among the components of the Fund’s net assets as follows:
| | | | | | | | | | |
Undistributed Net
Investment Income | | | Accumulated Net
Realized Gain/(Loss) | | | Paid-in-Capital | |
| $ | 219,274,409 | | | $ | 62,793,706 | | | $ | (282,068,115 | ) |
For the year ended December 31, 2015, the Fund’s most recent tax year-end, components of distributable earnings on a tax basis are as follows:
| | | | | | | | | | | | | | | | | | |
Undistributed
Ordinary
Income | | | Undistributed
Long-Term
Capital Gains | | | Other
Temporary
Differences(1) | | | Accumulated
Capital and
Other Losses | | | Net Tax
Appreciation/
(Depreciation) | |
| $ | — | | | $ | — | | | $ | — | | | $ | (83,041,326 | ) | | $ | (407,184,537 | ) |
| (1) | Other Temporary Differences is comprised of deferred REIT income. |
For the year ended December 31, 2015, the Fund had capital loss carryovers as indicated below. The capital loss carryovers are available to offset future realized capital gains to the extent provided in the Code and regulations promulgated thereunder. To the extent that these carryover losses are used to offset future capital gains, it is probable that the gains so offset will not be distributed to shareholders because they would be taxable as ordinary income.
| | | | | | | | | | | | | | | | | | |
| 2017 | | | 2018 | | | No
Expiration
Short-Term(1) | | | No
Expiration
Long-Term(1) | | | Total | |
| $ | 34,052,711 | | | $ | 43,701,044 | (2) | | $ | — | | | $ | 5,287,571 | (2) | | $ | 83,01,326 | |
| (1) | On December 22, 2010, the Regulated Investment Company Modernization Act of 2010 (the “Modernization Act”) was signed into law. The Modernization Act modifies several of the Federal income and excise tax provisions related to RICs. Under the Modernization Act, new capital losses may now be carried forward indefinitely, and retain the character of the original loss as compared with pre-enactment law where capital losses could be carried forward for eight years, and carried forward as short-term capital losses, irrespective of the character of the original loss. |
| (2) | The Fund’s ability to utilize the capital loss carryforward may be limited. |
NOTES TO FINANCIAL STATEMENTS (continued)
| | |
| December 31, 2015 | | NexPoint Credit Strategies Fund |
The tax character of distributions paid during the years ended December 31, 2015 and December 31, 2014 (unless otherwise indicated) is as follows:
| | | | | | | | |
| Distributions Paid From: | | 2015 | | | 2014 | |
Ordinary Income(1) | | $ | 196,176,513 | | | $ | 44,397,624 | |
Return of Capital | | | 147,931,387 | | | | — | |
| (1) | For tax purposes, short-term capital gains distributions, if any, are considered ordinary income distributions. |
The above mentioned distributions are reflected on a tax basis. The tax basis distributions are less than the book basis distributions reflected on the Statement of Changes in Net Assets. The difference is the result of a book tax difference on the distribution of NXRT shares to the Fund shareholders of record on the declaration of the NXRT distribution. For tax purposes, the value of this distribution was based on the closing public share price of NXRT on 3/31/15. For book purposes, the value of the distribution was based on the underlying value of the assets owned by NXRT.
Unrealized appreciation and depreciation at December 31, 2015, based on cost of investments for U.S. federal income tax purposes is:
| | | | | | | | | | | | |
Gross
Appreciation | | Gross
Depreciation | | | Net
Appreciation/
(Depreciation) (1) | | | Cost | |
| $32,810,747 | | $ | 436,873,668 | | | $ | (404,062,921 | ) | | $ | 1,003,472,204 | |
| (1) | Any differences between book-basis and tax-basis net unrealized appreciation/ (depreciation) are primarily due to wash sales, non-taxable dividends, partnership, Controlled Foreign Corporation and Passive Foreign Investment Company (Qualifying Electing Fund) basis adjustments and defaulted bonds. |
Qualified Late Year Ordinary and Post October Losses
Under current laws, certain capital losses realized after October 31 may be deferred (and certain ordinary losses after January 1st may be deferred) and treated as occurring on the first day of the following fiscal year. For the fiscal year ended December 31, 2015, the Fund did not elect to defer net realized capital losses incurred from November 1, 2014 through December 31, 2015.
Note 6. Credit Agreement
On February 2, 2011, the Fund entered into a $125,000,000 credit agreement with State Street Bank and Trust Company (the “Credit Agreement”). Concurrent with entering into the Credit Agreement, the Fund agreed to pay a $125,000 structuring fee, which was amortized ratably over the term of the agreement. The terms of the Credit Agreement require the Fund to pay 0.15% on the uncommitted balance and pay a spread of 1.25% over LIBOR on amounts borrowed.
On December 14, 2012, the Fund entered into an amendment extending the Credit Agreement termination date from January 31, 2013 to December 13, 2013. Additionally, the spread over LIBOR on amounts borrowed declined from 1.10% to 0.95%. The terms of the Credit Agreement continue to require the Fund to pay 0.15% on the uncommitted balance. On May 9, 2014 the Credit Agreement was increased to $250,000,000, and the termination date was extended to May 8, 2015. On May 8, 2015 the Credit Agreement termination date was extended to May 6, 2016 and the facility decreased to $200,000,000, increasing the interest rate to LIBOR + 1.10%. Additionally, the Fund agreed to pay increased commitment fee expenses of 0.20% on undrawn amounts. As of December 31, 2015, the carrying value of the outstanding debt under the Credit Agreement was $200,000,000, excluding accrued interest that was owed at that date. As of December 31, 2015, the fair value of the outstanding Credit Agreement was estimated to be $200,741,096, and would be categorized as Level 3 within the fair value hierarchy. The fair value was estimated based on discounting the cash flows owed using a discount rate of 0.50% over the 4 month risk free rate.
For the year ended December 31, 2015, the average daily note balance was $208,244,384 at a weighted average interest rate of 1.25%, excluding any commitment fee. With respect to the note balance, interest expense of $2,593,181 and uncommitted balance fee of $14,719 are included in interest expense in the Statement of Operations.
On May 16, 2013, the Fund entered into a $125,000,000 Committed Facility Agreement with BNP Paribas Prime Brokerage, Inc. (“BNPP PB, Inc.”) (the “Committed Facility Agreement”). The terms of the Committed Facility Agreement require the Fund to pay 0.55% on the uncommitted balance and pay a spread of 0.75% over the 1-month LIBOR on amounts borrowed. The Fund has the right to terminate the agreement upon 90 days prior notice. On May 29, 2013 the Committed Facility Agreement was amended, increasing the facility from $125,000,000 to $155,000,000. On December 11, 2013 the Committed Facility Agreement was amended, increasing the facility from $155,000,000 to $175,000,000. On May 6, 2014, the Committed Facility Agreement was amended, increasing the facility from $175,000,000 to $200,000,000. On October 28, 2014, the Committed Facility Agreement was amended, increasing the number of days prior notice necessary to terminate the agreement from 90 days to 180 days. On February 26, 2015, the Committed Facility Agreement was amended, increasing the facility from $200,000,000 to $225,000,000. On August 3, 2015, the Committed Facility Agreement was amended, decreasing the facility from
NOTES TO FINANCIAL STATEMENTS (continued)
| | |
| December 31, 2015 | | NexPoint Credit Strategies Fund |
$225,000,000 to $175,000,000. On December 9, 2015, the Committed Facility Agreement was amended, decreasing the facility from $175,000,000 to $75,000,000. As of December 31, 2015, the carrying value of the Committed Facility Agreement was $15,925,315. The fair value of the outstanding Committed Facility Agreement was estimated to be $16,126,324, and would be categorized as Level 3 within the fair value hierarchy. The fair value was estimated based on discounting the cash flows owed using a discount rate of 0.50% over the 180 day risk free rate.
For the year ended December 31, 2015, the average daily note balance was $94,180,367 at a weighted average interest rate of 0.95%, excluding any commitment fee. With respect to the note balance, interest expense of $891,572 and uncommitted balance fee of $568,321 are included in interest expense in the Statement of Operations.
Note 7. Asset Coverage
The Fund is required to maintain 300% asset coverage with respect to amounts outstanding (excluding short-term borrowings) under the Credit Agreement and Committed Facility Agreement. Asset coverage is calculated by subtracting the Fund’s total liabilities, not including any amount representing bank loans and senior securities, from the Fund’s total assets and dividing the result by the principal amount of the borrowings outstanding. As of the dates indicated below, the Fund’s debt outstanding and asset coverage was as follows:
| | | | | | | | |
| Date | | Total Amount
Outstanding | | | % of Asset
Coverage of
Indebtedness | |
12/31/2015 | | $ | 186,625,315 | (1) | | | 296.2 | %(1)(2) |
12/31/2014 | | | 385,336,455 | | | | 323.0 | |
12/31/2013 | | | 318,500,000 | | | | 327.5 | |
12/31/2012 | | | 225,000,000 | | | | 311.7 | |
12/31/2011 | | | 173,000,000 | | | | 356.1 | |
12/31/2010 | | | 120,000,000 | | | | 510.6 | |
12/31/2009 | | | 112,000,000 | | | | 509.6 | |
12/31/2008 | | | 141,000,000 | | | | 356.2 | |
12/31/2007 | | | 248,000,000 | | | | 350.4 | |
| (1) | Excludes borrowings of $29,300,000 deemed to be temporary in accordance with Section 18 of the 1940 Act. |
| (2) | The Fund closes its net asset value daily, and using asset prices available at the time of the December 31, 2015 NAV close, the Fund calculated asset coverage of greater than 300%. The Fund received updated prices for certain instruments in January that were used for financial reporting purposes as part of this report. These updated prices pushed the percentage of asset coverage down to 296.2%. As of February 4, 2016, the date that the Fund declared the February monthly dividend, the percentage of asset coverage was over 300%. |
Note 8. Investment Advisory, Administration and Trustee Fees
Investment Advisory Fee
The Investment Adviser to the Fund receives an annual fee, paid monthly, in an amount equal to 1.00% of the average weekly value of the Fund’s Managed Assets. The Fund’s “Managed Assets” is an amount equal to the total assets of the Fund, including any form of leverage, minus all accrued expenses incurred in the normal course of operations, but not excluding any liabilities or obligations attributable to investment leverage obtained through (i) indebtedness of any type (including, without limitation, borrowing through a credit facility or the issuance of debt securities), (ii) the issuance of preferred stock or other preference securities, (iii) the reinvestment of collateral received for securities loaned in accordance with the Fund’s investment objectives and policies, and/or (iv) any other means.
Administration Fee
The Investment Adviser provides administrative services to the Fund. For its services, the Investment Adviser receives an annual fee, payable monthly, in an amount equal to 0.20% of the average weekly value of the Fund’s Managed Assets. Under a separate sub-administration agreement, the Investment Adviser has delegated certain administrative functions to State Street Bank and Trust Company. The Investment Adviser pays State Street Bank and Trust Company directly for these sub-administration services.
Fees Paid to Officers and Trustees
Each Trustee who is not an “interested person” of the Fund as defined in the 1940 Act (the “Independent Trustees”) receives an annual retainer of $150,000 payable in quarterly installments and allocated among each portfolio in the Highland Fund Complex based on relative net assets. The “Highland Fund Complex” consists of all of the registered investment companies and NexPoint Capital, Inc., a closed-end management investment company that has elected to be treated as a business development company under the 1940 Act, which are advised by the Investment Adviser and its affiliated advisers as of the date of this report. Although the Fund believes that Mr. Powell is technically no longer an “interested person” of the Fund, in light of his previous employment with certain affiliates of the Investment Adviser, it is possible that the SEC might in the future determine Mr. Powell to be an “interested person” of the Fund. Therefore, the Fund intends to treat Mr. Powell as an “interested person” of the Fund for all purposes other than compensation (Mr. Powell will be compensated at the same rate as the Independent Trustees) from December 16, 2015 until December 4, 2017 (the second anniversary of his resignation).
NOTES TO FINANCIAL STATEMENTS (continued)
| | |
| December 31, 2015 | | NexPoint Credit Strategies Fund |
The Fund pays no compensation to its officers, all of whom are employees of the Investment Adviser or its affiliate.
Note 9. Disclosure of Significant Risks and Contingencies
The primary risks of investing in the Fund are described below in alphabetical order:
Counterparty Risk
Counterparty risk is the potential loss the Fund may incur as a result of the failure of a counterparty or an issuer to make payments according to the terms of a contract. Counterparty risk is measured as the loss the Fund would record if its counterparties failed to perform pursuant to the terms of their obligations to the Fund. Because the Fund may enter into over-the-counter forwards, options, swaps and other derivative financial instruments, the Fund may be exposed to the credit risk of its counterparties. To limit the counterparty risk associated with such transactions, the Fund conducts business only with financial institutions judged by the Investment Adviser to present acceptable credit risk.
Credit Risk
Investments rated below investment grade are commonly referred to as high-yield, high risk or “junk debt.” They are regarded as predominantly speculative with respect to the issuing company’s continuing ability to meet principal and/ or interest payments. Investments in high yield debt and high yield Senior Loans may result in greater NAV fluctuation than if the Fund did not make such investments.
Corporate debt obligations, including Senior Loans, are subject to the risk of non-payment of scheduled interest and/or principal. Non-payment would result in a reduction of income to the Fund, a reduction in the value of the corporate debt obligation experiencing non-payment and a potential decrease in the NAV of the Fund.
Emerging Markets Risk
Any investments in Emerging Market Countries (countries in which the capital markets are developing) may involve greater risks than investments in more developed markets and the prices of such investments may be more volatile. The consequences of political, social or economic changes in these markets may have disruptive effects on the market prices of the Fund’s investments and the income they generate, as well as the Fund’s ability to repatriate such amounts.
Foreign Currency Risk
A portion of the Fund’s assets may be quoted or denominated in non-U.S. currencies. These securities may be adversely affected by fluctuations in relative currency
exchange rates and by exchange control regulations. The Fund’s investment performance may be negatively affected by a devaluation of a currency in which the Fund’s investments are quoted or denominated. Further, the Fund’s investment performance may be significantly affected, either positively or negatively, by currency exchange rates because the U.S. dollar value of securities quoted or denominated in another currency will increase or decrease in response to changes in the value of such currency in relation to the U.S. dollar.
Illiquidity of Investments Risk
The investments made by the Fund may be illiquid, and consequently the Fund may not be able to sell such investments at prices that reflect the Investment Adviser’s assessment of their value or the amount originally paid for such investments by the Fund. Illiquidity may result from the absence of an established market for the investments as well as legal, contractual or other restrictions on their resale and other factors. Furthermore, the nature of the Fund’s investments, especially those in financially distressed companies, may require a long holding period prior to profitability.
Leverage Risk
The Fund may use leverage in its investment program, including the use of borrowed funds and investments in certain types of options, such as puts, calls and warrants, which may be purchased for a fraction of the price of the underlying securities. While such strategies and techniques increase the opportunity to achieve higher returns on the amounts invested, they also increase the risk of loss. To the extent the Fund purchases securities with borrowed funds, its net assets will tend to increase or decrease at a greater rate than if borrowed funds are not used. If the interest expense on borrowings were to exceed the net return on the portfolio securities purchased with borrowed funds, the Fund’s use of leverage would result in a lower rate of return than if the Fund were not leveraged.
Non-U.S. Securities Risk
Investments in foreign markets involve special risks and considerations not typically associated with investing in the United States. These risks include revaluation of currencies, high rates of inflation, restrictions on repatriation of income and capital, and adverse political and economic developments. Moreover, securities issued in these markets may be less liquid, subject to government ownership controls, tariffs and taxes, subject to delays in settlements, and their prices may be more volatile.
The Fund may be subject to capital gains and repatriation taxes imposed by certain countries in which they invest. Such taxes are generally based on income and/or capital gains
NOTES TO FINANCIAL STATEMENTS (continued)
| | |
| December 31, 2015 | | NexPoint Credit Strategies Fund |
earned or repatriated. Taxes are accrued based upon net investment income, net realized gains and net unrealized appreciation as income and/or capital gains are earned.
Risks Associated with Options on Securities
There are several risks associated with transactions in options on securities. For example, there are significant differences between the securities and options markets that could result in an imperfect correlation between these markets, causing a given transaction not to achieve its objectives. A transaction in options or securities may be unsuccessful to some degree because of market behavior or unexpected events.
When the Fund writes a covered call option, the Fund forgoes, during the option’s life, the opportunity to profit from increases in the market value of the security covering the call option above the sum of the premium and the strike price of the call, but retains the risk of loss should the price of the underlying security decline. The writer of an option has no control over the time when it may be required to fulfill its obligation and once an option writer has received an exercise notice, it must deliver the underlying security in exchange for the strike price.
When the Fund writes a covered put option, the Fund bears the risk of loss if the value of the underlying stock declines below the exercise price minus the put premium. If the option is exercised, the Fund could incur a loss if it is required to purchase the stock underlying the put option at a price greater than the market price of the stock at the time of exercise plus the put premium the Fund received when it wrote the option. While the Fund’s potential gain in writing a covered put option is limited to distributions earned on the liquid assets securing the put option plus the premium received from the purchaser of the put option, the Fund risks a loss equal to the entire exercise price of the option minus the put premium.
Risks of Investing in Obligations of Stressed, Distressed and Bankrupt Issuers
The Fund invests in companies that are troubled, in distress or bankrupt. As such, they are subject to a multitude of legal, industry, market, environmental and governmental forces that make analysis of these companies inherently difficult. Further, the Investment Adviser relies on company management, outside experts, market participants and personal experience to analyze potential investments for the Fund. There can be no assurance that any of these sources will prove credible, or that the resulting analysis will produce accurate conclusions.
Risks of Investing in Senior Loans
The risk that the issuer of a senior loan may fail to pay interest or principal when due, and changes in market
interest rates may reduce the value of the senior loan or reduce the Fund’s returns. The risks associated with senior loans are similar to the risks of high yield debt securities. Senior loans and other debt securities are also subject to the risk of price declines and to increases in prevailing interest rates. The Fund’s investments in senior loans are typically below investment grade and are considered speculative because of the credit risk of their issuers.
Risks of Non-Diversification and Other Focused Strategies
The Fund may focus its investments in instruments of only a few companies. The concentration of the Fund’s portfolio in any one obligor would subject the Fund to a greater degree of risk with respect to defaults by such obligor, and the concentration of the portfolio in any one industry would subject the Fund to a greater degree of risk with respect to economic downturns relating to such industry.
Real Estate Investment Trusts-Specific Risk
Real estate investments are subject to various risk factors. Generally, real estate investments could be adversely affected by a recession or general economic downturn where the properties are located. Real estate investment performance is also subject to the success that a particular property manager has in managing the property.
Short Sales Risk
Short sales by the Fund that are not made where there is an offsetting long position in the asset that it is being sold short theoretically involve unlimited loss potential since the market price of securities sold short may continuously increase. Short selling allows the Fund to profit from declines in market prices to the extent such decline exceeds the transaction costs and costs of borrowing the securities. However, since the borrowed securities must be replaced by purchases at market prices in order to close out the short position, any appreciation in the price of the borrowed securities would result in a loss. Purchasing securities to close out the short position can itself cause the price of securities to rise further, thereby exacerbating the loss. The Fund may mitigate such losses by replacing the securities sold short before the market price has increased significantly. Under adverse market conditions, the Fund might have difficulty purchasing securities to meet margin calls on its short sale delivery obligations, and might have to sell portfolio securities to raise the capital necessary to meet its short sale obligations at a time when fundamental investment considerations would not favor such sales.
Note 10. Investment Transactions
For the year ended December 31, 2015, the cost of purchases and proceeds from sales of securities, excluding short-term obligations, were $294,712,184 and $674,063,436
NOTES TO FINANCIAL STATEMENTS (continued)
| | |
| December 31, 2015 | | NexPoint Credit Strategies Fund |
Note 11. Affiliated Issuers
Under Section 2 (a)(3) of the Investment Company Act of 1940, as amended, a portfolio company is defined as “affiliated” if a fund owns five percent or more of its outstanding voting securities. The Fund held at least five percent of the outstanding voting securities of the following companies during the year ended December 31, 2015:
| | | | | | | | | | | | | | | | | | | | | | | | | | | | |
| | | | | | | | | Market Value | | | | | | | | | | |
| Issuer | | Shares at
December 31,
2014 | | | Shares at
December 31,
2015 | | | December 31,
2014 | | | December 31,
2015 | | | Affiliated
Income | | | Purchases | | | Sales | |
Allenby (Common Stocks) | | | 250,912 | | | | 436,635 | | | $ | — | | | $ | — | | | $ | — | | | $ | 185,723 | | | $ | — | |
Claymore (Common Stocks) | | | 2,393,814 | | | | 4,881,036 | | | | 3 | | | | 5 | | | | — | | | | 2,487,222 | | | | — | |
Endurance Business Media, Inc. (U.S. Senior Loans) | | | 6,480 | | | | 2,578,841 | | | | — | | | | — | | | | — | | | | — | | | | 7,302 | |
Freedom REIT (Common Stocks)(1) | | | 15,006,336 | | | | 25,255,573 | | | | 278,967,787 | | | | 63,896,601 | | | | 83,482,618 | | | | 84,854,012 | | | | — | |
Genesys Ventures IA, LP (Common Stocks) | | | 24,000,000 | | | | 24,000,000 | | | | 3,429,600 | | | | 1,569,600 | | | | — | | | | — | | | | — | |
LLV Holdco, LLC (U.S. Senior Loans & Common Stocks) | | | 8,318,071 | | | | 8,746,211 | | | | 4,596,592 | | | | 4,170,887 | | | | — | | | | 428,139 | | | | — | |
NexPoint Real Estate Capital, REIT (Common Stocks)(1) | | | 1,457,100 | | | | 8,271,300 | | | | 15,051,843 | | | | 97,833,766 | | | | 211,235 | | | | — | | | | — | |
NexPoint Residential Trust, Inc., REIT(2) | | | 200,000 | | | | — | | | | 2,000 | | | | — | | | | — | | | | 332,054,224 | | | | 332,054,224 | |
TerreStar Corp. (U.S. Senior Loans & Common Stocks) | | | 6,637,581 | | | | 14,040,695 | | | | 18,963,271 | | | | 47,308,663 | | | | — | | | | 50,471,809 | | | | 23,720,353 | |
Specialty Finance, Inc. (Common Stocks) | | | 4,762,223 | | | | 13,388,945 | | | | 4,630,310 | | | | 14,188,265 | | | | — | | | | 8,690,000 | | | | — | |
| | | | | | | | | | | | | | | | | | | | | | | | | | | | |
| | | 63,032,517 | | | | 101,599,236 | | | $ | 325,641,406 | | | $ | 228,967,787 | | | $ | 83,693,853 | | | $ | 479,171,129 | | | $ | 355,781,879 | |
| | | | | | | | | | | | | | | | | | | | | | | | | | | | |
| (1) | Managed by the same Investment Adviser as the Fund. |
| (2) | No longer an affiliate as of December 31, 2015. |
Note 12. Spin-Off
On September 9, 2014, the Board announced a plan to separate NexPoint Residential Trust, Inc. (“NXRT”) from the Fund through a series of restructuring transactions involving Freedom REIT, the Fund’s wholly-owned subsidiary, and NXRT, a real estate investment trust, followed by a distribution of all of the outstanding shares of NXRT common stock to the shareholders of the Fund on a pro-rata basis.
The Board approved the advisory agreement for NXRT on January 5, 2015, which subsequently was approved by the shareholders of the Fund on March 16, 2015. The Fund, the Investment Adviser, NXRT, and NXRT’s investment adviser received an exemptive order from the SEC under the 1940 Act permitting the Spin-Off and related transactions.
On April 1, 2015, the Fund transferred certain real estate assets and cash valued at $332,054,224, held by Freedom REIT to NXRT in exchange for NXRT common stock. Prior to this transaction, NXRT held $2,000 of cash. The Fund completed the spin-off through a pro-rata taxable distribution of NXRT common stock to the Fund’s shareholders of record as of the close of business on March 23, 2015 (the “Record Date”). The Fund’s shareholders received one share of NXRT common stock for every three common shares of the Fund held on the Record Date in the amount of $332,056,224, as shown on the Statements of Changes in Net Assets. Following the Spin-Off, the Fund continues to operate as a non-diversified, closed-end investment
company and NXRT acquires, owns, operates and selectively develops multi-family real property.
Note 13. Reverse Stock Split
The Fund effected a 1-for-4 reverse stock split of the Fund’s issued and outstanding shares on October 6, 2015, thereby reducing by a factor of four the number of shares outstanding. Shareholders were paid cash for any fractional shares resulting from the reverse stock split.
Note 14. New Accounting Pronouncements
In February 2015, the Financial Accounting Standards Board (“FASB”) issued Accounting Standards Update (“ASU”) No. 2015-02 regarding “Consolidation (Topic 810): Amendments to the Consolidation Analysis”. The amendments in this update are effective for fiscal years, and for interim periods within those fiscal years, beginning after December 15, 2015. ASU No. 2015-02 will modify the evaluation of limited partnerships and similar legal entities as variable interest entities (VIEs). This update will eliminate the presumption that a general partner should consolidate a limited partnership. This update also affects the consolidation analysis of reporting entities that are involved with VIEs. The update also provides a scope exception from consolidation guidance for reporting entities with interests in legal entities that are required to comply with or operate in accordance with requirements similar to Rule 2a-7 of the investment Company Act of 1940 for registered money market funds.
NOTES TO FINANCIAL STATEMENTS (continued)
| | |
| December 31, 2015 | | NexPoint Credit Strategies Fund |
In April 2015, FASB issued ASU No. 2015-03 regarding “Interest—Imputation of Interest (Subtopic 835-30): Simplifying the Presentation of Debt Issuance Costs”. The amendments in this update are effective for financial statements issued for fiscal years beginning after December 15, 2015, and interim periods within those fiscal years. ASU No. 2015-03 will simplify the presentation of debt issuance costs by requiring that debt issuance costs related to a recognized debt liability be presented in the balance sheet as a direct deduction from the carrying amount of that debt liability, consistent with debt discounts. The recognition and measurement guidance for debt issuance costs are not affected by the amendments.
In May 2015, FASB issued ASU No. 2015-07 regarding “Fair Value Measurement (Topic 820): Disclosures for Investments in Certain Entities That Calculate Net Asset Value per Share”. The amendments in this update are effective for fiscal years beginning after December 15, 2015, and interim periods within those fiscal years. ASU No. 2015-07 will eliminate the requirement to categorize investments in the fair value hierarchy if their fair value is measured at NAV per share (or its equivalent) using the practical expedient in the FASB’s fair value measurement guidance.
At this time, the implications of each of the above ASUs and their impact on the financial statement disclosures have not yet been determined.
Note 15. Subsequent Events
Management has evaluated the impact of all subsequent events on the Fund through the date the financial statements were issued.
On February 19, 2016, the Board approved an amendment to the Fund’s dividend reinvestment plan (the “Plan”) which the Fund anticipates will be in effect for the Fund’s March distribution. More information on the amended Plan can be found in the Additional Information section of this report.
REPORT OF INDEPENDENT REGISTERED PUBLIC ACCOUNTING FIRM
To the Board of Trustees and Shareholders of NexPoint Credit Strategies Fund:
In our opinion, the accompanying statement of assets and liabilities, including the investment portfolio, and the related statements of operations, of changes in net assets, of cash flows and the financial highlights present fairly, in all material respects, the financial position of NexPoint Credit Strategies Fund (the “Fund”) at December 31, 2015, the results of its operations for the year then ended, the changes in its net assets for each of the two years in the period then ended, its cash flows for the year then ended and the financial highlights for each of the five years in the period then ended, in conformity with accounting principles generally accepted in the United States of America. These financial statements and financial highlights (hereafter referred to as “financial statements”) are the responsibility of the Fund’s management. Our responsibility is to express an opinion on these financial statements based on our audits. We conducted our audits of these financial statements in accordance with the standards of the Public Company Accounting Oversight Board (United States). Those standards require that we plan and perform the audit to obtain reasonable assurance about whether the financial statements are free of material misstatement. An audit includes examining, on a test basis, evidence supporting the amounts and disclosures in the financial statements, assessing the accounting principles used and significant estimates made by management, and evaluating the overall financial statement presentation. We believe that our audits, which included confirmation of securities at December 31, 2015 by correspondence with the custodian and brokers, provide a reasonable basis for our opinion.

Dallas, Texas
February 26, 2016
ADDITIONAL INFORMATION (unaudited)
| | |
| December 31, 2015 | | NexPoint Credit Strategies Fund |
Additional Portfolio Information
The Investment Adviser and its affiliates manage other accounts, including registered and private funds and individual accounts. Although investment decisions for the Fund are made independently from those of such other accounts, the Investment Adviser may, consistent with applicable law, make investment recommendations to other clients or accounts that may be the same or different from those made to the Fund, including investments in different levels of the capital structure of a company, such as equity versus senior loans, or that involve taking contradictory positions in multiple levels of the capital structure. The Investment Adviser has adopted policies and procedures that address the allocation of investment opportunities, execution of portfolio transactions, personal trading by employees and other potential conflicts of interest that are designed to ensure that all client accounts are treated equitably over time. Nevertheless, this may create situations where a client could be disadvantaged because of the investment activities conducted by the Investment Adviser for other client accounts. When the Fund and one or more of such other accounts is prepared to invest in, or desires to dispose of, the same security, available investments or opportunities for each will be allocated in a manner believed by the Investment Adviser to be equitable to the fund and such other accounts. The Investment Adviser also may aggregate orders to purchase and sell securities for the Fund and such other accounts. Although the Investment Adviser believes that, over time, the potential benefits of participating in volume transactions and negotiating lower transaction costs should benefit all accounts including the Fund, in some cases these activities may adversely affect the price paid or received by the Fund or the size of the position obtained or disposed of by the Fund.
Tax Information
For shareholders that do not have a December 31, 2015 tax year end, this notice is for informational purposes only. For shareholders with a December 31, 2015 tax year end, please consult your tax adviser as to the pertinence of this notice. For the fiscal year ended December 31, 2015, the Fund hereby designates the following items with regard to distributions paid during the year.
| | | | | | | | | | |
Qualified
Dividends
and
Corporate
Dividends
Received
Deduction | | | Qualified
Dividend
Income
(15% tax
rate for
QDI) | | | Qualifying
Interest
Income | |
| | 5 | % | | | 3 | % | | | 55 | % |
Dividend Reinvestment Plan
Unless the registered owner of Common Shares elects to receive cash by contacting American Stock Transfer & Trust Company, LLC (“AST” or the “Plan Agent”), as agent for shareholders in administering the Plan, a registered owner will receive newly issued Common Shares for all dividends declared for Common Shares of the Fund. If a registered owner of Common Shares elects not to participate in the Plan, they will receive all dividends in cash paid by check mailed directly to them (or, if the shares are held in street or other nominee name, then to such nominee) by AST, as dividend disbursing agent. Shareholders may elect not to participate in the Plan and to receive all dividends in cash by sending written instructions or by contacting AST, as dividend disbursing agent, at the address set forth below.
Participation in the Plan is completely voluntary and may be terminated or resumed at any time without penalty by contacting the Plan Agent before the dividend record date; otherwise such termination or resumption will be effective with respect to any subsequently declared dividend. Some brokers may automatically elect to receive cash on the shareholders’ behalf and may reinvest that cash in additional Common Shares of the Fund for them. The Plan Agent will open an account for each shareholder under the Plan in the same name in which such shareholder’s Common Shares are registered.
Whenever the Fund declares a dividend payable in cash, non-participants in the Plan will receive cash and participants in the Plan will receive the equivalent in Common Shares. The Common Shares will be acquired by the Plan Agent through receipt of additional unissued but authorized Common Shares from the Fund (“newly issued Common Shares”). The number of newly issued Common Shares to be credited to each participant’s account will be determined by dividing the dollar amount of the dividend by the lesser of (i) the net asset value per Common Share determined on the Declaration Date and (ii) the market price per Common Share as of the close of regular trading on the New York Stock Exchange (the “NYSE”) on the Declaration Date.
The Plan Agent maintains all shareholders’ accounts in the Plan and furnishes written confirmation of all transactions in the accounts, including information needed by shareholders for tax records. Common Shares in the account of each Plan participant will be held by the Plan Agent on behalf of the Plan participant, and each shareholder proxy will include those shares purchased or received pursuant to the Plan. The Plan Agent will forward all proxy solicitation materials to participants and vote proxies for shares held under the Plan in accordance with the instructions of the participants. In the case of shareholders such as banks, brokers or nominees which hold shares for others who are
ADDITIONAL INFORMATION (unaudited) (continued)
| | |
| December 31, 2015 | | NexPoint Credit Strategies Fund |
the beneficial owners, the Plan Agent will administer the Plan on the basis of the number of Common Shares certified from time to time by the record shareholder’s name and held for the account of beneficial owners who participate in the Plan. There will be no brokerage charges with respect to Common Shares issued directly by the Fund.
The automatic reinvestment of dividends will not relieve participants of any federal, state or local income tax that may be payable (or required to be withheld) on such dividends. Accordingly, any taxable dividend received by a participant that is reinvested in additional Common Shares will be subject to federal (and possibly state and local) income tax even though such participant will not receive a corresponding amount of cash with which to pay such taxes. Participants who request a sale of shares through the Plan Agent are subject to a $2.50 sales fee and pay a brokerage commission of $0.05 per share sold. The Fund reserves the right to amend or terminate the Plan. There is no direct service charge to participants in the Plan; however, the Fund reserves the right to amend the Plan to include a service charge payable by the participants. All correspondence concerning the Plan should be directed to the Plan Agent at American Stock Transfer & Trust Company, LLC 6201 15th Avenue Brooklyn, NY 11219; telephone (718) 921-8200.
Shareholder Loyalty Program
To promote loyalty and long-term alignment of interests among the Fund’s shareholders, the Investment Adviser offers an incentive to shareholders that buy and hold the Fund’s common shares for a period of at least twelve months through its Shareholder Loyalty Program (the “Program”). To participate in the Program, existing shareholders must open an account (the “Account”) with the Program’s administrator, American Stock Transfer & Trust Company (“AST”). Subsequently, if a participant makes contributions to the Account during a defined trading period to purchase shares, the Investment Adviser will make a corresponding contribution equal to 2% of the participant’s contributions. For example, if a participant contributes $10,000 to the Account during a defined trading period to purchase shares, the Adviser will make a corresponding contribution of $200, to purchase additional shares for the participant (the “Bonus Shares”). In addition, Program participants will not be required to pay any customary selling commissions or distribution fees on the purchase of shares under the Program. The Investment Adviser will bear the costs of brokerage fees in connection with the Program. While the portion of the Fund’s common shares that are acquired through the participant’s contribution will vest immediately, Bonus Shares will not vest until the first anniversary of the date that the Bonus Shares were purchased. Vested shares will be held in the Account
and Bonus Shares will be held in an account at AST for the conditional benefit of the shareholder. Under the Program, participants must purchase a minimum of $10,000 worth of shares in the initial subscription and $5,000 in each subsequent subscription, unless the Investment Adviser, in its sole discretion, decides to permit subscriptions for a lesser amount. If the Fund’s common shares are trading at a discount, AST will purchase common shares on behalf of participants in open-market purchases. If the Fund’s common shares are trading at a premium, AST may purchase common shares on behalf of participants in open market purchases or the Fund may sell common shares to the Shareholder Loyalty Program by means of a prospectus or otherwise. All dividends received on shares that are purchased under the Program will be automatically reinvested through the Program. A participant’s interest in a dividend paid to the holder of a vested share will vest immediately. A participant’s interest in a dividend paid to the holder of a Bonus Share will vest at the same time that the Bonus Share’s vesting requirements are met. In addition, for dividends paid to holders of shares that were purchased with a participant’s contributions, the Investment Adviser will make a corresponding contribution to the amount of the reinvested dividend equal to 2% of the dividend amount. AST maintains all shareholders’ accounts in the Program and furnishes written confirmation of all transactions in the accounts, including information needed by shareholders for tax records. Shares in the account of each Program participant will be held by AST on behalf of the Program participant, and each shareholder proxy will include those shares purchased or received pursuant to a Program. AST will forward all proxy solicitation materials to participants and vote proxies for shares held under the Program in accordance with the instructions of the participants. In the case of shareholders such as banks, brokers or nominees which hold shares for others who are the beneficial owners, AST will administer the Program on the basis of the number of common shares certified from time to time by the record shareholder’s name and held for the account of beneficial owners who participate in the Program. The Fund and the Investment Adviser reserve the right to amend or terminate the Program. To help align the interests of the Investment Adviser’s employees with the interests of the Fund’s shareholders, the Investment Adviser offers a similar program to its employees. Participants in the Program should be aware that their receipt of Bonus Shares under the Program constitutes taxable income to them. In addition, such participants owe taxes on that portion of any distribution that constitutes taxable income in respect of shares of our common stock held in their Program accounts, whether or not such shares of common stock have vested in the hands of the participants. To the extent any payments or distributions under
ADDITIONAL INFORMATION (unaudited) (continued)
| | |
| December 31, 2015 | | NexPoint Credit Strategies Fund |
the Program are subject to U.S. federal, state or local taxes, the Fund, any participating affiliate of the Fund or the agent for the Program may satisfy its tax withholding obligation by (1) withholding shares of Stock allocated to the participant’s account, (2) deducting cash from the participant’s account or (3) deducting cash from any other compensation the participant may receive. Program participants should consult their tax advisers regarding the tax consequences to them of participating in the Program.
The Program may create an incentive for shareholders to invest additional amounts in the Fund. Because the Investment Adviser’s management fee is based on a percentage of the assets of the Fund, the Program will result in increased net revenues to the Investment Adviser if the increase in the management fee due to the increased asset base offsets the costs associated with establishing and maintaining the Program.
Approval of Investment Advisory Agreement for NexPoint Credit Strategies Fund
The Fund has retained the Investment Adviser to manage the assets of the Fund pursuant to an investment advisory agreement between the Investment Adviser and the Fund (the “Advisory Agreement”). The Advisory Agreement has been approved by the Fund’s Board of Trustees, including a majority of the Independent Trustees.
The Advisory Agreement continues in effect from year-to-year, provided that such continuance is specifically approved at least annually by the vote of holders of at least a majority of the outstanding shares of the Fund or by the Board of Trustees and, in either event, by a majority of the Independent Trustees of the Fund casting votes in person at a meeting called for such purpose.
At a meeting on August 27, 2015, the Board of Trustees gave preliminary consideration to information bearing on the continuation of the Advisory Agreement for a one-year period commencing November 1, 2015. The primary purpose of the meeting was to ensure that the Trustees had ample opportunity to consider matters they deemed relevant in evaluating the continuation of the Advisory Agreement, and to request any additional information they considered reasonably necessary to their deliberations.
At a meeting held on September 10-11, 2015, the Board of Trustees, including the Independent Trustees, approved the continuance of the Advisory Agreement for a one-year period commencing November 1, 2015. As part of its review process, the Board of Trustees requested, through its independent legal counsel, and received from the Investment Adviser, various information and written materials in connection with meetings of the Board of Trustees held on August 27, 2015 and September 10-11, 2015, including: (1) information regarding the financial
soundness of the Investment Adviser and the profitability of the Advisory Agreement to the Investment Adviser; (2) information on the advisory and compliance personnel of the Investment Adviser, including compensation arrangements for portfolio managers; (3) information on the internal compliance procedures of the Investment Adviser; (4) comparative information showing how the Fund’s fees and operating expenses compare to those of other registered investment companies and comparable funds that follow investment strategies similar to those of the Fund; (5) information on the investment performance of the Fund, including comparisons of the Fund’s performance against that of other registered investment companies and comparable funds that follow investment strategies similar to those of the Fund; (6) information regarding brokerage and portfolio transactions; and (7) information on any legal proceedings or regulatory audits or investigations affecting the Investment Adviser. The Trustees also relied on information provided at periodic meetings of the Board of Trustees over the course of the year. In addition, the Trustees received an independent report from Morningstar Associates, LLC (“Morningstar”), an independent source of investment company data, relating to the Fund’s performance, volatility and expenses compared to the performance, volatility and expenses of a peer group determined by Morningstar to be comparable. The Trustees reviewed various factors discussed in independent counsel’s legal memoranda, the detailed information provided by the Investment Adviser and other relevant information and factors. The Trustees’ conclusion as to the approval of the Advisory Agreement was based on a comprehensive consideration of all information provided to the Trustees without any single factor being dispositive in and of itself. Some of the factors that figured particularly in the Trustees’ deliberations are described below, although individual Trustees may have evaluated the information presented differently from one another, giving different weights to various factors.
The nature, extent, and quality of the services to be provided by the Investment Adviser — The Board of Trustees considered the portfolio management services to be provided by the Investment Adviser under the Advisory Agreement and the activities related to portfolio management, including use of technology, research capabilities, and investment management staff. The Board of Trustees discussed the relevant experience and qualifications of the personnel providing advisory services, including the background and experience of the members of the Fund’s portfolio management team and portfolio manager compensation arrangements. The Trustees reviewed the management structure, assets under management and investment philosophies and processes of the Investment Adviser. The Trustees also reviewed and discussed information regarding the Investment Adviser’s compliance policies, procedures and personnel. The Trustees
ADDITIONAL INFORMATION (unaudited) (continued)
| | |
| December 31, 2015 | | NexPoint Credit Strategies Fund |
concluded that the Investment Adviser had the quality and depth of personnel and investment methods essential to performing its duties under the Advisory Agreement, and that the nature and the quality of such advisory services were satisfactory.
The Investment Adviser’s Historical Performance in Managing the Fund — With respect to the Advisory Agreement, the Board of Trustees reviewed the historical performance of the Investment Adviser and the Fund’s portfolio management team in managing the Fund over various time periods and reflected on previous discussions regarding matters bearing on the Investment Adviser’s performance at their meetings throughout the year. With respect to the Fund, the Trustees discussed relative performance and contrasted the performance of the Fund and its portfolio management team to that of the Fund’s peers, as represented by certain other registered investment companies that follow investment strategies similar to the Fund as well as a comparable index and the Fund’s Morningstar peer group.
The Fund trailed its benchmark index and slightly outperformed its Morningstar peer group and classification median for the one-year period ended June 30, 2015 while substantially outperforming its benchmark index and peer group and classification median for the three- and five-year periods ended June 30, 2015. The Trustees also took into account management’s discussion of the Fund’s performance. Additionally, the Trustees considered the expenses of the Fund in relation to a combination of two Morningstar categories (moderate allocation and tactical allocation (the Fund’s classification)), due to the unique nature of the Fund as compared to potential peers. The Trustees further considered that, while net expenses of the Fund have decreased over the past five years, the Fund’s management fees and net expenses were above both the peer group median and the category median. It was noted that the Fund’s other expenses and interest expenses from leverage contributed to the Fund’s higher total expense ratio. Additionally, the Trustees considered the Fund’s management fee in that context, and determined that the fees were reasonable in relation to the services rendered. The Trustees concluded that the Fund’s performance and other relevant factors supported the renewal of the Advisory Agreement. Additionally, the Board Trustees considered the Fund’s market price discount to its net asset value. The Board took into account that it received information on a quarterly basis regarding the Fund’s discount to net asset value and that it monitored both the Fund’s discount and efforts undertaken by the Investment Adviser to narrow the Fund’s discount.
The costs of the services to be provided by the Investment Adviser and the profits to be realized by the Investment Adviser and its affiliates from their
relationship with the Fund — The Board of Trustees also gave substantial consideration to the fees payable under the Advisory Agreement, the expenses that the Investment Adviser incurs in providing advisory services and the profitability to the Investment Adviser of managing the Fund, including:(1) information regarding the financial condition of the Investment Adviser; (2) information regarding the total fees and payments received by the Investment Adviser for its services, including under a separate agreement for providing administrative services, and whether such fees are appropriate given economies of scale and other considerations; and (3) comparative information showing (a) the fees payable under the Advisory Agreement versus the investment advisory fees of certain registered investment companies and comparable funds that follow investment strategies similar to those of the Fund and (b) the expense ratios of the Fund relative to the expense ratios of certain registered investment companies and comparable funds that follow investment strategies similar to those of the Fund. The Trustees also considered the so-called “fall-out benefits” to the Investment Adviser with respect to the Fund, such as the reputational value of serving as Investment Adviser to the Fund, potential fees paid to the Investment Adviser’s affiliates by the Fund or portfolio companies for services provided, including administrative services provided to the Fund by the Investment Adviser pursuant to a separate agreement, and the benefits of research made available to the Investment Adviser by reason of brokerage commissions (if any) generated by the Fund’s securities transactions. After such review, the Trustees determined that the profitability to the Investment Adviser with respect to the Advisory Agreement was reasonable. The Board of Trustees also considered certain actions it had taken as a result of the Investment Adviser’s desire to increase the proportion of the Fund’s yield generated by investments not directly correlated with the public debt and equity markets, including the separation of NexPoint Residential Trust, Inc. (“NXRT”), a newly formed real estate investment trust, from the Fund through a series of restructuring transactions involving Freedom REIT, a wholly-owned subsidiary of the Fund, followed by a distribution of all of the outstanding shares of NXRT common stock to the shareholders of the Fund on a pro rata basis.
The extent to which economies of scale would be realized as the Fund grows and whether fee levels reflect these economies of scale for the benefit of shareholders — The Board of Trustees considered the asset levels of the Fund, the information provided by the Investment Adviser relating to its costs and information comparing the fee rate
ADDITIONAL INFORMATION (unaudited) (continued)
| | |
| December 31, 2015 | | NexPoint Credit Strategies Fund |
charged by the Investment Adviser with fee rates charged by other unaffiliated investment advisers to their clients. The Trustees concluded that the fee structure is reasonable, and appropriately should result in a sharing of economies of scale in view of the information provided by the Investment Adviser. The Board determined to continue to review ways, and the extent to which, economies of scale might be shared between the Investment Adviser on the one hand and shareholders of the Fund on the other. The Board of Trustees also requested that the Investment Adviser consider ways in which economies of scale can be shared with Fund shareholders.
Conclusion — Following a further discussion of the factors above and the merits of the Advisory Agreement and its various provisions, it was noted that in considering the approval of the Advisory Agreement, no single factor was determinative to the decision of the Board of Trustees. Rather, after weighing all of the factors and reasons discussed above, the Trustees, including the Independent Trustees, unanimously agreed that the Advisory Agreement, including the advisory fees to be paid to the Investment Adviser is fair and reasonable to the Fund in light of the services that the Investment Adviser provides, the expenses that it incurs and the reasonably foreseeable asset levels of the Fund.
Submission of Proposals to a Vote of Shareholders
The annual meeting of shareholders of the Fund was held on June 5, 2015. The following is a summary of the proposals submitted to shareholders for vote at the meeting and votes cast.
| | | | | | | | |
| Proposal | | Votes For | | | Votes
Withheld | |
To elect Terrence O. Jones as Class III Trustee of the Fund, to serve for a three-year term expiring at the 2018 Annual Meeting | | | 46,379,809 | | | | 6,099,680 | |
To elect John Honis as Class III Trustee of the Fund, to serve for a three-year term expiring at the 2018 Annual Meeting | | | 46,347,595 | | | | 6,131,896 | |
In addition to the two Trustees who were elected at the annual meeting, as noted above, the following other Trustees continued in office after the Fund’s annual meeting: Timothy K. Hui, Dr. Bob Froehlich, Bryan A. Ward and Ethan Powell.
ADDITIONAL INFORMATION (unaudited) (continued)
| | |
| December 31, 2015 | | NexPoint Credit Strategies Fund |
Management of the Trust
| | | | | | | | | | | | |
Name, Date of Birth
and Address1 | | Position(s)
held with
the Trust | | Term of Office
and Length of
Time Served2 | | Principal
Occupation(s) During the
Past Five Years | | Number of
Portfolios in
the Fund
Complex3
Overseen
by Trustee | | Other
Directorships/
Trusteeships
Held During the
Past Five Years | | Experience, Qualifications, Attributes, Skills
for Board
Membership |
|
| Independent Trustees4 |
| | | | | | |
Timothy K. Hui (6/13/1948) | | Trustee | | 3 year term (expiring at 2017 annual meeting). Trustee since inception in May 2006. | | Dean of Educational Resources since July 2012 and from July 2006 to January 2008, Vice President from February 2008 to June 2012, and Assistant Provost for Graduate Education from July 2004 to June 2006 at Cairn University. | | 17 | | None | | Significant
experience on
this and/or other
boards of
directors/
trustees;
administrative
and managerial
experience; legal
training and
practice. |
| | | | | | |
Dr. Bob Froehlich (4/28/1953) | | Trustee | | 3 year term (expiring at 2017 annual meeting). Trustee since December 2013. | | Executive Vice President and Chief Investment Strategist, The Hartford Mutual Funds from 2009 until retirement in 2012; Vice Chairman of Deutsche Asset Management from 2002 to 2009. | | 17 | | Trustee of ARC Realty
Finance Trust, Inc.;
Director of KC
Concessions, Inc.;
Trustee of Realty
Capital Income
Funds Trust; Director
of American Realty
Capital Healthcare
Trust II; Director,
American Realty
Capital Daily Net
Asset Value Trust,
Inc.; Director of
American Sports
Enterprise, Inc.;
Director of Davidson
Investment Advisors;
Chairman and
owner, Kane County
Cougars Baseball
Club; Advisory Board
of Directors, Internet
Connectivity Group,
Inc.; Director of AR
Capital Acquisition
Corp.; Director of The
Midwest League of
Professional Baseball
Clubs, Inc.; Director
of Ozzie’s Outreach
Foundation, Inc. | | Significant
experiences in
the financial
industry;
significant
managerial and
executive
experience;
significant
experience on
other boards of
directors,
including as a
member of
several audit
committees. |
ADDITIONAL INFORMATION (unaudited) (continued)
| | |
| December 31, 2015 | | NexPoint Credit Strategies Fund |
Management of the Trust
| | | | | | | | | | | | |
Name, Date of Birth
and Address1 | | Position(s)
held with
the Trust | | Term of Office
and Length of
Time Served2 | | Principal
Occupation(s) During the
Past Five Years | | Number of
Portfolios in
the Fund
Complex3
Overseen
by Trustee | | Other
Directorships/
Trusteeships
Held During the
Past Five Years | | Experience, Qualifications, Attributes, Skills
for Board
Membership |
|
| Independent Trustees4 |
| | | | | | |
John Honis5 (6/16/1958) | | Trustee | | 3 year term (expiring at 2018 annual meeting) for the Trust. Trustee since July 2013. | | President of Rand Advisors, LLC since August 2013; Partner of Highland Capital Management, L.P. (“HCM”) from February 2007 until his resignation in November 2014. | | 17 | | None. | | Significant
experience in the
financial industry;
significant
managerial and
executive
experience,
including
experience as
president, chief
executive officer
or chief
restructuring
officer of five
telecommunication
firms; experience
on another board
of directors. |
| | | | | | |
Bryan A. Ward (2/4/1955) | | Trustee | | 3 year term (expiring at 2016 annual meeting). Trustee since inception in May 2006. | | Private Investor; Senior Manager, Accenture, LLP (a consulting firm) from 2002 until retirement in 2014. | | 17 | | Director of Equity
Metrix, LLC. | | Significant
experience on
this and/or other
boards of
directors/
trustees;
significant
managerial and
executive
experience;
significant
experience as a
management
consultant. |
ADDITIONAL INFORMATION (unaudited) (continued)
| | |
| December 31, 2015 | | NexPoint Credit Strategies Fund |
Management of the Trust
| | | | | | | | | | | | |
Name, Date of Birth
and Address1 | | Position(s)
held with
the Trust | | Term of Office
and Length of
Time Served2 | | Principal
Occupation(s) During the
Past Five Years | | Number of
Portfolios in
the Fund
Complex3
Overseen
by Trustee | | Other
Directorships/
Trusteeships
Held During the
Past Five Years | | Experience, Qualifications, Attributes, Skills
for Board
Membership |
|
| Interested Trustee |
| | | | | | |
Ethan Powell6 (6/20/1975) | | Trustee; Chairman of the Board | | 3 year term (expiring at 2016 annual meeting) for the Trust. Trustee since December 2013. Chairman of the Board since December 2013. Executive Vice President from June 2012 until December 2015. Secretary from November 2010 until May 2015. | | Trustee of the Highland Fund Complex from June 2012 until July 2013 and since December 2013; Chief Product Strategist of Highland Capital Management Fund Advisors, L.P. (“HCMFA”) from 2012 until December 2015; Senior Retail Fund Analyst of HCM from 2007 until December 2015 and HCMFA from its inception until December 2015; Secretary of NexPoint Credit Strategies Fund (“NHF”) from November 2010 until June 2012; President and Principal Executive Officer of NHF from June 2012 until May 2015; Secretary of NHF from May 2015 until December 2015; Executive Vice President and Principal Executive Officer of Highland Funds I and Highland Funds II from June 2012 until December 2015; and Secretary of Highland Funds I and Highland Funds II from November 2010 to May 2015. President of Impact Shares Corporation from January 1, 2016 to present. | | 17 | | None | | Significant
experience in the
financial industry;
significant
executive
experience
including past
service as an
officer of funds in
the Fund
Complex;
significant
administrative
and managerial
experience. |
ADDITIONAL INFORMATION (unaudited) (continued)
| | |
| December 31, 2015 | | NexPoint Credit Strategies Fund |
Management of the Trust
| 1 | The address for each Trustee is c/o NexPoint Advisors, L.P., 200 Crescent Court, Suite 700, Dallas, Texas 75201. |
| 2 | On an annual basis, as a matter of Board policy, the Governance Committee reviews each Trustee’s performance and determines whether to extend each such Trustee’s service for another year. Effective June 2013, the Board adopted a retirement policy wherein the Governance Committee shall not recommend the continued service as a Trustee of a Board member who is older than 80 years of age at the time the Governance Committee reports its findings to the Board. |
| 3 | The “Fund Complex” consists of the Trust, each series of Highland Funds I (“HFI”), each series of Highland Funds II (“HFII”) and NexPoint Capital, Inc., a closed-end management investment company that has elected to be treated as a business development company under the Investment Company Act. |
| 4 | Independent Trustees are those who are not “interested persons” as that term is defined under Section 2(a)(19) of the Investment Company Act. |
| 5 | Since May 1, 2015, Mr. Honis has been treated as an Independent Trustee of the Funds. Prior to that date, Mr. Honis was treated as an Interested Trustee because he was a partner of an investment adviser affiliated with the Investment Adviser until his resignation in November 2014. As of December 31, 2015, Mr. Honis was entitled to receive aggregate severance and/or deferred compensation payments of approximately $2.4 million from another affiliate of the Investment Adviser. Mr. Honis also serves as a director for a portfolio company affiliated with the Investment Adviser. During the Trust’s last two fiscal years, Mr. Honis’ aggregate compensation from this portfolio company for his service as a director was approximately $50,000. In addition, Mr. Honis serves as a trustee of a trust that owns substantially all of the economic interest in an investment adviser affiliated with the Investment Adviser. Mr. Honis indirectly receives an asset-based fee in respect of such interest, which is projected to range from $100,000-$150,000 annually. In light of these relationships between Mr. Honis and affiliates of the Investment Adviser, it is possible that the SEC might in the future determine Mr. Honis to be an interested person of the Trust. |
| 6 | Effective December 4, 2015, Mr. Powell resigned from his positions with certain affiliates of the Investment Adviser. As of December 15, 2015, all financial payments owed to Mr. Powell from such parties had been paid in full. Although the Trust believes that Mr. Powell is technically no longer an interested person of the Trust, in light of his previous employment, it is possible that the SEC might in the future determine Mr. Powell to be an interested person of the Trust. Therefore, the Trust intends to treat Mr. Powell as an Interested Trustee of the Trust for all purposes other than compensation (Mr. Powell will be compensated at the same rate as the Independent Trustees) from December 16, 2015 until December 4, 2017 (the second anniversary of his resignation). |
ADDITIONAL INFORMATION (unaudited) (continued)
| | |
| December 31, 2015 | | NexPoint Credit Strategies Fund |
Management of the Trust
| | | | | | |
Name, Date of Birth and
Address1 | | Position(s) held
with the Trust | | Term of
Office and
Length of
Time Served | | Principal Occupation(s) During Past Five Years |
|
| Officers |
| | | |
James Dondero (6/29/62) | | President, Principal Executive Officer | | Indefinite Term; President since May 2015 | | President of Highland Capital Management, L.P., which he co-founded in 1993; Portfolio Manager of NHF, Portfolio Manager of Highland Energy MLP Fund, Highland Global Allocation Fund, Highland Small-Cap Equity Fund and Highland Premier Growth Equity Fund(all series of HFII); and Portfolio Manager of Highland Opportunistic Credit Fund (series of Highland Funds I (“HFI”)) |
| | | |
Brian Mitts (8/26/1970) | | Executive Vice President, Principal Accounting Officer and Principal Financial Officer | | Executive Vice President since December 2015; Indefinite Term; Principal Accounting Officer and Principal Financial Officer since May 2015; Treasurer from November 2010 until May 2015 | | Chairman of the Board, Chief Financial Officer, Executive Vice President and Treasurer of NexPoint Residential Trust, Inc. since 2014; Principal Financial Officer and Principal Accounting Officer of NHF since November 2010; Executive Vice President, Principal Financial Officer and Principal Accounting Officer of NHF since May 2015; Treasurer of NHF from November 2010 until May 2015; Chief Financial Officer of NexPoint Capital, Inc. from August 2014 until May 2015; Chief Financial Officer, Principal Financial Officer and Principal Accounting Officer of NexPoint Capital, Inc. since May 2015; Chief Financial Officer and Financial and Operations Principal of Highland Capital Funds Distributor, Inc. since November 2013; Chief Operations Officer of HCMFA since 2012; Secretary of NexPoint Advisors, L.P. from August 2012 until May 2015; Executive Vice President of NexPoint Advisors, L.P. since May 2015; Senior Retail Fund Analyst of HCM since 2007 and HCMFA since its inception; Secretary, Principal Financial Officer and Principal Accounting Officer of Highland Funds I and Highland Funds II since May 2015; Principal Financial Officer and Principal Accounting Officer of Highland Funds I since November 2010 and of Highland Funds II since February 2011; Treasurer of Highland Funds I from November 2010 until May 2015 and of Highland Funds II from February 2011 until May 2015 and Financial and Operations Principal of NexBank Securities, Inc. since 2014. |
| | | |
Frank Waterhouse (4/14/1971) | | Treasurer | | Indefinite Term; Treasurer since May 2015 | | Assistant Treasurer of Acis Capital Management, L.P. from December 2011 until February 2012; Treasurer of Acis Capital Management, L.P. since February 2012; Assistant Treasurer of HCM from November 2011 until April 2012; Treasurer of HCM since April 2012; Assistant Treasurer of HCMFA from December 2011 until October 2012; Treasurer of HCMFA since October 2012; Treasurer of NexPoint Advisors, L.P. since March 2012 and Treasurer of NexPoint Capital, Inc., NHF, Highland Funds I, Highland Funds II, and NexPoint Real Estate Advisors, L.P. since May 2015. |
| | | |
Dustin Norris (1/6/1984) | | Secretary | | Indefinite Term; Secretary since December 2015 | | Director of Product Strategy at HCMFA since May 2014; Assistant Treasurer of NHF, Highland Funds I and Highland Funds II since November 2012; Secretary of NexPoint Capital, Inc. since 2014; Senior Accounting Manager at HCMFA from August 2012 to May 2014; and Fund Accountant at HCM from June 2010 to August 2012. |
| 1 | The address for each officer is c/o NexPoint Advisors, L.P., 200 Crescent Court, Suite 700, Dallas, Texas 75201. |

6201 15th Avenue
Brooklyn, NY 11219
| | |
| NexPoint Credit Strategies Fund | | Annual Report, December 31, 2015 |
| | |
| www.nexpointadvisors.com | | NHF-AR-1215 |
Item 2. Code of Ethics.
| (a) | NexPoint Credit Strategies Fund (the “Registrant”), as of the end of the period covered by this report, has adopted a code of ethics that applies to the Registrant’s principal executive officer, principal financial officer, principal accounting officer or controller, or persons performing similar functions, regardless of whether these individuals are employed by the Registrant or a third party. |
| (c) | There have been no amendments, during the period covered by this report, to a provision of the code of ethics that applies to the Registrant’s principal executive officer, principal financial officer, principal accounting officer or controller, or persons performing similar functions, regardless of whether these individuals are employed by the Registrant or a third party, and that relates to any element of the code of ethics description. |
| (d) | The Registrant has not granted any waiver, including any implicit waiver, from a provision of the code of ethics that applies to the Registrant’s principal executive officer, principal financial officer, principal accounting officer or controller, or persons performing similar functions, regardless of whether these individuals are employed by the Registrant or a third party, that relates to one or more of the items set forth in paragraph (b) of this Item’s instructions. |
| (f) | The Registrant’s code of ethics that applies to the Registrant’s principal executive officer, principal financial officer, principal accounting officer or controller, or persons performing similar functions is filed herewith as Exhibit (a)(1). |
Item 3. Audit Committee Financial Expert.
As of the end of the period covered by the report, the Registrant’s Board of Trustees (the “Board”) has determined that Bryan A. Ward, a member of the Audit Committee of the Board (the “Audit Committee”), is an audit committee financial expert as defined by the Securities and Exchange Commission (the “SEC”) in Item 3 of Form N-CSR. Mr. Ward is “independent” as defined by the SEC for purposes of this Item 3 of Form N-CSR.
Item 4. Principal Accountant Fees and Services.
Audit Fees
| (a) | The aggregate fees billed for each of the last two fiscal years for professional services rendered by the principal accountant for the audit of the Registrant’s annual financial statements or services that are normally provided by the accountant in connection with statutory and regulatory filings or engagements for those fiscal years are $266,000 for the fiscal year ended December 31, 2014 and $275,000 for the fiscal year ended December 31, 2015. |
Audit-Related Fees
| (b) | The aggregate fees billed in each of the last two fiscal years for assurance and related services by the principal accountant that are reasonably related to the performance of the audit of the Registrant’s financial statements and are not reported under paragraph (a) of this Item are $8,500 for the fiscal year ended December 31, 2014 and $8,500 for the fiscal year ended December 31, 2015. The nature of the services related to agreed-upon procedures, performed on the Registrant’s semi-annual financial statements. |
Tax Fees
| (c) | The aggregate fees billed in each of the last two fiscal years for professional services rendered by the principal accountant for tax compliance, tax advice, and tax planning are $10,400 for the fiscal year ended December 31, 2014 and $10,820 for the fiscal year ended December 31, 2015. The nature of the services related to assistance on the Registrant’s tax returns and excise tax calculations. |
All Other Fees
| (d) | The aggregate fees billed in each of the last two fiscal years for products and services provided by the principal accountant, other than the services reported in paragraphs (a) through (c) of this Item are $0 for the fiscal year ended December 31, 2014 and $0 for the fiscal year ended December 31, 2015. |
| (e)(1) | Disclose the Audit Committee’s pre-approval policies and procedures described in paragraph (c)(7) of Rule 2-01 of Regulation S-X: |
The Audit Committee shall:
(a) have direct responsibility for the appointment, compensation, retention and oversight of the Registrant’s independent auditors and, in connection therewith, to review and evaluate matters potentially affecting the independence and capabilities of the auditors; and
(b) review and pre-approve (including associated fees) all audit and other services to be provided by the independent auditors to the Registrant and all non-audit services to be provided by the independent auditors to the Registrant’s investment adviser or any entity controlling, controlled by or under common control with the investment adviser (an “Adviser Affiliate”) that provides ongoing services to the Registrant, if the engagement relates directly to the operations and financial reporting of the Registrant; and
(c) establish, to the extent permitted by law and deemed appropriate by the Audit Committee, detailed pre-approval policies and procedures for such services; and
(d) review and consider whether the independent auditors’ provision of any non-audit services to the Registrant, the Registrant’s investment adviser or an Adviser Affiliate not pre-approved by the Audit Committee are compatible with maintaining the independence of the independent auditors.
| (e)(2) | The percentage of services described in each of paragraphs (b) through (d) of this Item that were approved by the Audit Committee pursuant to paragraph (c)(7)(i)(C) of Rule 2-01 of Regulation S-X are as follows: |
(b) 100%
(c) 100%
(d) N/A
| (f) | The percentage of hours expended on the principal accountant’s engagement to audit the Registrant’s financial statements for the most recent fiscal year that were attributed to work performed by persons other than the principal accountant’s full-time, permanent employees was less than fifty percent. |
| (g) | The aggregate non-audit fees billed by the Registrant’s principal accountant for services rendered to the Registrant, and rendered to the Registrant’s investment adviser (not including any sub-adviser whose role is primarily portfolio management and is subcontracted with or overseen by another investment adviser), and an Adviser Affiliate that provides ongoing services to the Registrant for each of the last two fiscal years of the Registrant was $455,500 for the fiscal year ended December 31, 2014 and $412,000 for the fiscal year ended December 31, 2015. |
| (h) | The Registrant’s Audit Committee has considered whether the provision of non-audit services that were rendered to the Registrant’s investment adviser (not including any sub-adviser whose role is primarily portfolio management and is subcontracted with or overseen by another investment adviser), and an Adviser Affiliate that provides ongoing services to the Registrant that were not pre-approved pursuant to paragraph (c)(7)(ii) of Rule 2-01 of Regulation S-X is compatible with maintaining the principal accountant’s independence. |
Item 5. Audit Committee of Listed Registrants.
The Registrant has a separately-designated standing Audit Committee established in accordance with Section 3(a)(58)(A) of the Securities Exchange Act of 1934, as amended. It is composed of the following Trustees, each of whom is not an “interested person” as defined in the 1940 Act:
Dr. Bob Froehlich
Timothy K. Hui
Bryan A. Ward
Item 6. Investments.
| (a) | Schedule of Investments in securities of unaffiliated issuers as of the close of the reporting period is included as part of the Report to Shareholders filed under Item 1 of this form. |
Item 7. Disclosure of Proxy Voting Policies and Procedures for Closed-End Management Investment Companies.
NEXPOINT ADVISORS, L.P.
PROXY VOTING POLICY
General Principals
This Policy applies to securities held in Client accounts (including registered investment companies and other pooled investment vehicles) as to which the Company has voting authority, directly or indirectly. Indirect voting authority exists where the Company’s voting authority is implied by a general delegation of investment authority without reservation of proxy voting authority.
The Company shall vote proxies in respect of securities owned by or on behalf of a Client in the Client’s best economic interests and without regard to the interests of the Company or any other Client of the Company.
Voting Procedures
Monitoring
A member of the settlement group (the “settlement designee”) of the Company shall have responsibility for monitoring portfolios managed by the Company for securities subject to a proxy vote. Upon the receipt of a proxy notice related to a security held in a portfolio managed by the Company, the settlement designee shall forward all relevant information to the Portfolio Manager(s) with responsibility for the security. The Portfolio Manager(s) may consult a member of the settlement group as necessary.
Voting
Upon receipt of notice from the settlement designee, the Portfolio Manager(s) of the fund(s) in which the security subject to a proxy vote shall evaluate the subject matter of the proxy and cause the proxy to be voted on behalf of the Client in accordance with the Guidelines set forth below.
Guidelines
In determining how to vote a particular proxy, the Portfolio Manager(s) shall consider, among other things, the interests of each Client account as it relates to the subject matter of the proxy, any potential conflict of interest the Company may have in voting the proxy on behalf of the Client and the procedures set forth in this Policy. This Policy is designed to be implemented in a manner reasonably expected to ensure that voting rights are exercised in the best interests of the Company’s clients. Each proxy is voted on a case-by-case basis taking into consideration any relevant contractual obligations as well as other relevant facts and circumstances. In general, the Company reviews and considers corporate governance issues related to proxy matters and generally supports proposals that foster good corporate governance practices. Portfolio manager(s) may vote proxies as recommended by the security issuers management on routine matters related to the operation of the issuer and on matters not expected to have a significant impact on the issuer and/or its shareholders, because the Company believes that recommendations by the issuer are generally in shareholders’ best interests, and therefore in the best economic interest of the Company’s clients.
Conflicts of Interest
If the Portfolio Manager(s) determine that the Company may have a potential material conflict of interest (as defined in Section 3 of this Policy) in voting a particular proxy, the Portfolio Manager(s) shall contact the Company’s compliance department prior to causing the proxy to be voted.
For a security held by an investment company, the Company shall disclose the conflict and its reasoning for voting as it did to the Retail Fund’s Board of Trustees at the next regularly scheduled quarterly meeting. In voting proxies for securities held by an investment company, the Company may consider only the interests of the Fund. It is the responsibility of the compliance department to document the basis for the decision and furnish the documentation to the Board of Trustees. The Company may resolve the conflict of interest by following the proxy voting recommendation of a disinterested third party (such as ISS, Glass Lewis, or another institutional proxy research firm).
Non-Votes
The Company may determine not to vote proxies in respect of securities of any issuer if it determines it would be in its Client’s overall best interests not to vote. Such determination may apply in respect of all Client holdings of the securities or only certain specified Clients, as the Company deems appropriate under the circumstances. As examples, the Portfolio Manager(s) may determine: (a) not to recall securities on loan if, in its judgment, the matters being voted upon are not material events affecting the securities and the negative consequences to Clients of disrupting the securities lending program would outweigh the benefits of voting in the particular instance or (b) not to vote certain foreign securities positions if, in its judgment, the expense and administrative inconvenience outweighs the benefits to Clients of voting the securities.
Recordkeeping
Following the submission of a proxy vote, the applicable Portfolio Manager(s) shall submit a report of the vote to a settlement designee of the Company. Records of proxy votes by the Company shall be maintained in accordance with the Recordkeeping section of this Policy.
Material Conflicts of Interest
Voting the securities of an issuer where the following relationships or circumstances exist are deemed to give rise to a material conflict of interest for purposes of this Policy:
| | (i) | The issuer is a Client of the Company, or of an affiliate, accounting for more than 5% of the Company’s or affiliate’s annual revenues. |
| | (ii) | The issuer is an entity that reasonably could be expected to pay the Company or its affiliates more than $1 million through the end of the Company’s next two full fiscal years. |
| | (iii) | The issuer is an entity in which a “Covered Person” (as defined in the Company’s Policies and Procedures Designed to Detect and Prevent Insider Trading and to Comply with Rule 17j-1 of the Investment Company Act of 1940, as amended (the “Code of Ethics”)) has a beneficial interest contrary to the position held by the Company on behalf of Clients. |
| | (iv) | The issuer is an entity in which an officer or partner of the Company or a relative of any such person is or was an officer, director or employee, or such person or relative otherwise has received more than $150,000 in fees, compensation and other payment from the issuer during the Company’s last three fiscal years; provided, however, that the Compliance Department may deem such a relationship not to be a material conflict of interest if the Company representative serves as an officer or director of the issuer at the direction of the Company for purposes of seeking control over the issuer. |
| | (v) | The matter under consideration could reasonably be expected to result in a material financial benefit to the Company or its affiliates through the end of the Company’s next two full fiscal years (for example, a vote to increase an investment advisory fee for a Fund advised by the Company or an affiliate). |
| | (vi) | Another Client or prospective Client of the Company, directly or indirectly, conditions future engagement of the Company on voting proxies in respect of any Client’s securities on a particular matter in a particular way. |
| | (vii) | The Company holds various classes and types of equity and debt securities of the same issuer contemporaneously in different Client portfolios. |
| | (viii) | Any other circumstance where the Company’s duty to serve its Clients’ interests, typically referred to as its “duty of loyalty,” could be compromised. |
Notwithstanding the foregoing, a conflict of interest described in Section 3.1 shall not be considered material for the purposes of this Policy in respect of a specific vote or circumstance if:
| | (i) | The securities in respect of which the Company has the power to vote account for less than 1% of the issuer’s outstanding voting securities, but only if: (i) such securities do not represent one of the 10 largest holdings of such issuer’s outstanding voting securities and (ii) such securities do not represent more than 2% of the Client’s holdings with the Company. |
| | (ii) | The matter to be voted on relates to a restructuring of the terms of existing securities or the issuance of new securities or a similar matter arising out of the holding of securities, other than common equity, in the context of a bankruptcy or threatened bankruptcy of the issuer. |
Recordkeeping
The Company shall retain records relating to the voting of proxies, including:
| | (i) | Copies of this Policy and any amendments thereto; |
| | (ii) | A copy of each proxy statement that the Company receives regarding Client securities. |
| | (iii) | Records of each vote cast by the Company on behalf of Clients. |
| | (iv) | A copy of any documents created by the Company that were material to making a decision how to vote or that memorializes the basis for that decision. |
| | (v) | A copy of each written request for information on how the Company voted proxies on behalf of the Client, and a copy of any written response by the Company to any (oral or written) request for information on how the Company voted. |
These records shall be maintained and preserved in an easily accessible place for a period of not less than five years from the end of the Company’s fiscal year during which the last entry was made in the records, the first two years in an appropriate office of the Company.
The Company may rely on proxy statements filed on the SEC’s EDGAR system or on proxy statements and records of votes cast by the Company maintained by a third party, such as a proxy voting service (provided the Company had obtained an undertaking from the third party to provide a copy of the proxy statement or record promptly on request).
Records relating to the voting of proxies for securities held by investment company clients will be reported periodically, as requested, to the investment company’s Board of Trustees and, to the SEC on an annual basis pursuant to Form N-PX.
Item 8. Portfolio Managers of Closed-End Management Investment Companies.
| (a)(1) | Identification of Portfolio Manager(s) or Management Team Members and Description of Role of Portfolio Manager(s) or Management Team Members |
The Registrant’s portfolio manager, who is primarily responsible for the day-to-day management of the Registrant’s portfolio, is James Dondero.
James Dondero – Mr. Dondero has over 25 years of experience in the credit markets. In addition to his role at NexPoint Advisors, L.P., Mr. Dondero is the President of Highland Capital Management, L.P. (“HCM”), which he co-founded in 1993. Prior to founding HCM, Mr. Dondero served as Chief Investment Officer of Protective Life’s GIC subsidiary and helped grow the business from concept to over $2 billion between 1989 and 1993. His portfolio management experience includes mortgage-backed securities, investment grade corporates, leveraged bank loans, high-yield bonds, emerging market debt, derivatives, and equity securities. He received a BS in Commerce (Accounting and Finance) from the University of Virginia. Mr. Dondero is a Certified Public Accountant, a Certified Management Accountant, and has earned the right to use the Chartered Financial Analyst designation.
| (a)(2) | Other Accounts Managed by Portfolio Manager(s) or Management Team Member and Potential Conflicts of Interest |
Other Accounts Managed by Portfolio Manager(s) or Management Team Member
The following table provides information about funds and accounts, other than the Registrant, for which the Registrant’s portfolio manager is primarily responsible for the day-to-day portfolio management as of December 31, 2015.
James Dondero
| | | | | | | | |
Type of Accounts | | Total # of Accounts Managed | | Total Assets (millions) | | # of Accounts Managed with Performance-Based Advisory Fee | | Total Assets with Performance-Based Advisory Fee (millions) |
| Registered Investment Companies: | | 5 | | $1,186 | | 0 | | $0 |
| Other Pooled Investment Vehicles: | | 0 | | $0 | | 0 | | $0 |
| Other Accounts: | | 0 | | $0 | | 0 | | $0 |
Potential Conflicts of Interests
NexPoint Advisors, L.P. (“NexPoint” or the “Adviser”) and/or its general partner, limited partners, officers, affiliates and employees provide investment advice to other parties and manage other accounts and private investment vehicles similar to the Registrant. In connection with such other investment management activities, the Adviser and/or its general partner, limited partners, officers, affiliates and employees may decide to invest the funds of one or more other accounts or recommend the investment of funds by other parties, rather than the Registrant’s monies, in a particular security or strategy. In addition, the Adviser and such other persons will determine the allocation of funds from the Registrant and such other accounts to investment strategies and techniques on whatever basis they consider appropriate or desirable in their sole and absolute discretion.
The Adviser has built a professional working environment, a firm-wide compliance culture and compliance procedures and systems designed to protect against potential incentives that may favor one account over another. The Adviser has adopted policies and procedures that address the allocation of investment opportunities, execution of portfolio transactions, personal trading by employees and other potential conflicts of interest that are designed to ensure that all client accounts are treated equitably over time. Nevertheless, the Adviser furnishes advisory services to numerous clients in addition to the Registrant, and the Adviser may, consistent with applicable law, make investment recommendations to other clients or accounts (including accounts that are hedge funds or have performance or higher fees paid to the Adviser or in which portfolio managers have a personal interest in the receipt of such fees) that may be the same as or different from those made to the Registrant. In addition, the Adviser, its affiliates and any of their partners, directors, officers, stockholders or employees may or may not have an interest in the securities whose purchase and sale the Adviser recommends to the Registrant. Actions with respect to securities of the same kind may be the same as or different from the action that the Adviser, or any of its affiliates, or any of their partners, directors, officers, stockholders or employees or any member of their families may take with respect to the same securities. Moreover, the Adviser may refrain from rendering any advice or services concerning securities of companies of which any of the Adviser’s (or its affiliates’) partners, directors, officers or employees are directors or officers, or companies as to which the Adviser or any of its affiliates or partners, directors, officers and employees of any of them has any substantial economic interest or possesses material non-public information. In addition to its various policies and procedures designed to address these issues, the Adviser includes disclosure regarding these matters to its clients in both its Form ADV and investment advisory agreements.
The Adviser, its affiliates or their partners, directors, officers and employees similarly serve or may serve other entities that operate in the same or related lines of business or of investment funds managed by affiliates of the Adviser. Accordingly, these individuals may have obligations to investors in those entities or funds or to other clients, the fulfillment of which might not be in the best interests of the Registrant. As a result, the Adviser will face conflicts in the allocation of investment opportunities to the
Fund and other funds and clients. In order to enable such affiliates to fulfill their fiduciary duties to each of the clients for which they have responsibility, the Adviser will endeavor to allocate investment opportunities in a fair and equitable manner which may, subject to applicable regulatory constraints, involve pro rata co-investment by the Registrant and such other clients or may involve a rotation of opportunities among the Registrant and such other clients.
The Adviser and its affiliates have both subjective and objective procedures and policies in place designed to manage potential conflicts of interest involving clients so that, for example, investment opportunities are allocated in a fair and equitable manner among the Registrant and such other clients. An investment opportunity that is suitable for multiple clients of the Adviser and its affiliates may not be capable of being shared among some or all of such clients due to the limited scale of the opportunity or other factors, including regulatory restrictions imposed by the 1940 Act. There can be no assurance that the Adviser’s or its affiliates’ efforts to allocate any particular investment opportunity fairly among all clients for whom such opportunity is appropriate will result in an allocation of all or part of such opportunity to the Registrant. Not all conflicts of interest can be expected to be resolved in favor of the Registrant.
| (a)(3) | Compensation Structure of Portfolio Manager(s) or Management Team Members |
NexPoint’s financial arrangements with its portfolio managers, its competitive compensation and its career path emphasis at all levels reflect the value senior management places on key resources. Compensation may include a variety of components and may vary from year to year based on a number of factors, including the relative performance of a portfolio manager’s underlying account, the combined performance of the portfolio managers’ underlying accounts, and the relative performance of the portfolio managers’ underlying accounts measured against other employees. The principal components of compensation include a base salary, a discretionary bonus, various retirement benefits and one or more of the incentive compensation programs established by NexPoint, such as its “Short-Term Incentive Plan” and its “Long-Term Incentive Plan,” described below.
Base compensation. Generally, portfolio managers receive base compensation based on their seniority and/or their position with NexPoint, which may include the amount of assets supervised and other management roles within NexPoint. Base compensation is determined by taking into account current industry norms and market data to ensure that NexPoint pays a competitive base compensation.
Discretionary compensation. In addition to base compensation, portfolio managers may receive discretionary compensation, which can be a substantial portion of total compensation. Discretionary compensation can include a discretionary cash bonus paid to recognize specific business contributions and to ensure that the total level of compensation is competitive with the market, as well as participation in incentive plans, including one or more of the following:
Short-Term Incentive Plan. The purpose of this plan is to attract and retain the highest quality employees for positions of substantial responsibility, and to provide additional incentives to a select group of management or highly-compensated employees of NexPoint in order to promote the success of NexPoint.
Long Term Incentive Plan. The purpose of this plan is to create positive morale and teamwork, to attract and retain key talent, and to encourage the achievement of common goals. This plan seeks to reward participating employees based on the increased value of NexPoint through the use of Long-Term Incentive Units.
Because each person’s compensation is based on his or her individual performance, NexPoint does not have a typical percentage split among base salary, bonus and other compensation. Senior portfolio managers who perform additional management functions may receive additional compensation in these other capacities. Compensation is structured such that key professionals benefit from remaining with NexPoint.
| (a)(4) | Disclosure of Securities Ownership |
The following table sets forth the dollar range of equity securities beneficially owned by the portfolio manager in the Registrant as of December 31, 2015.
| | | | |
| Name of Portfolio Manager | | Dollar Ranges of Equity Securities Beneficially Owned by Portfolio Manager | | |
James Dondero | | Over $1,000,000 | | |
| Item 9. | Purchases of Equity Securities by Closed-End Management Investment Company and Affiliated Purchasers. |
Not applicable.
Item 10. Submission of Matters to a Vote of Security Holders.
There have been no material changes to the procedures by which the shareholders may recommend nominees to the Registrant’s Board.
Item 11. Controls and Procedures.
| (a) | The Registrant’s principal executive and principal financial officers, or persons performing similar functions, have concluded that the Registrant’s disclosure controls and procedures (as defined in Rule 30a-3(c) under the 1940 Act (17 CFR 270.30a-3 (c)) are effective, as of a date within 90 days of the filing date of the report that includes the disclosure required by this paragraph, based on their evaluation of these controls and procedures required by Rule 30a-3(b) under the 1940 Act (17 CFR 270.30a-3(b)) and Rules 13a-15(b) or 15d-15(b) under the Securities Exchange Act of 1934, as amended (17 CFR 240.13a-15(b) or 240.15d-15(b)). |
| (b) | There were no changes in the Registrant’s internal control over financial reporting (as defined in Rule 30a-3(d) under the 1940 Act (17 CFR 270.30a-3(d)) that occurred during the Registrant’s second fiscal quarter of the period covered by this report that has materially affected, or is reasonably likely to materially affect, the Registrant’s internal control over financial reporting. |
Item 12. Exhibits.
| (a)(1) | Code of ethics, or amendment thereto, that is the subject of disclosure required by Item 2 is attached hereto. |
| (a)(2) | Certifications pursuant to Rule 30a-2(a) under the 1940 Act and Section 302 of the Sarbanes-Oxley Act of 2002 are attached hereto. |
| (b) | Certifications pursuant to Rule 30a-2(b) under the 1940 Act and Section 906 of the Sarbanes-Oxley Act of 2002 are attached hereto. |
SIGNATURES
Pursuant to the requirements of the Securities Exchange Act of 1934 and the Investment Company Act of 1940, the Registrant has duly caused this report to be signed on its behalf by the undersigned, thereunto duly authorized.
NEXPOINT CREDIT STRATEGIES FUND
| | |
| By (Signature and Title): | | /s/ Brian Mitts |
| | Brian Mitts |
| | Executive Vice President, Principal Financial Officer |
| | and Principal Accounting Officer |
Date: March 4, 2016
Pursuant to the requirements of the Securities Exchange Act of 1934 and the Investment Company Act of 1940, this report has been signed below by the following persons on behalf of the Registrant and in the capacities and on the dates indicated.
| | |
| By (Signature and Title): | | /s/ Brian Mitts |
| | Brian Mitts |
| | Executive Vice President, Principal Financial Officer |
| | and Principal Accounting Officer |
Date: March 4, 2016
| | |
| By (Signature and Title): | | /s/ James Dondero |
| | James Dondero |
| | President and Principal Executive Officer |
Date: March 4, 2016