UNITED STATES
SECURITIES AND EXCHANGE COMMISSION
Washington, D.C. 20549
SECURITIES AND EXCHANGE COMMISSION
Washington, D.C. 20549
FORM N-CSR
CERTIFIED SHAREHOLDER REPORT OF REGISTERED
MANAGEMENT INVESTMENT COMPANIES
Investment Company Act file number 811-21897
Manager Directed Portfolios
(Exact name of registrant as specified in charter)
(Exact name of registrant as specified in charter)
615 East Michigan Street
Milwaukee, WI 53202
(Address of principal executive offices) (Zip code)
(Address of principal executive offices) (Zip code)
Douglas J. Neilson, President
Manager Directed Portfolios
c/o U.S. Bancorp Fund Services, LLC
777 East Wisconsin Avenue, 5th Floor
Milwaukee, WI 53202
(Name and address of agent for service)
(Name and address of agent for service)
(414) 287-3101
Registrant's telephone number, including area code
Date of fiscal year end: June 30, 2016
Date of reporting period: June 30, 2016
Item 1. Reports to Stockholders.
Hood River Small-Cap Growth Fund
Annual Report
June 30, 2016
Hood River Small-Cap Growth Fund
| Table of Contents | ||
| Letter to Shareholders | 3 | |
| Investment Highlights | 5 | |
| Sector Allocation of Portfolio Assets | 8 | |
| Schedule of Investments | 9 | |
| Statement of Assets and Liabilities | 16 | |
| Statement of Operations | 17 | |
| Statements of Changes in Net Assets | 18 | |
| Financial Highlights | 20 | |
| Notes to the Financial Statements | 22 | |
| Report of Independent Registered Public Accounting Firm | 31 | |
| Expense Example | 32 | |
| Notice to Shareholders | 34 | |
| Management | 35 | |
| Privacy Notice | 37 |
Hood River Small-Cap Growth Fund
Dear Shareholders,
As investors look back on the most recent twelve months, it will be remembered as a period of volatility and the end of six consecutive fiscal years of positive U.S. equity market returns across the entire market capitalization spectrum. While the large-cap indexes posted slightly positive returns and have now extended their streak to seven consecutive positive fiscal years, small-cap stocks were not as fortunate. In fact, small-cap stocks underperformed large-cap stocks by nearly 10%. Even within small-cap stocks there was significant variability of returns. Small-cap value indexes delivered modestly negative returns, but small-cap growth indexes experienced negative returns greater than 10%. In last year’s Letter to Shareholders, we raised concern about the health of the bull market and the likelihood of increased overall risk in stocks. It appears that our caution was well founded and helps to explain the muted returns from the U.S. equity market this year.
While the fiscal year returns were muted, the underlying quarterly performance demonstrated a dramatic see-saw battle between optimism and pessimism. For the quarter ended September 30, 2015, most major stock markets entered into correction or bear market territory. Investor angst appeared to be centered on weaker corporate earnings, unpredictable monetary policy and tighter credit market conditions. In the fourth quarter of 2015, stocks around the globe rebounded, largely erasing the declines from the previous three months as China’s outlook improved coupled with the Federal Reserve determining that the strength in jobs, housing and services warranted a shift in interest rate policy. After a historically tumultuous start to 2016, equity markets around the globe staged a massive comeback to end Q1 2016 on a positive note. Investors’ concern over global growth, central bank policy and an earnings recession saw intra-quarter declines of more than 10% before markets rebounded after the Federal Reserve’s decision to pause interest rate hikes and a recovery in energy prices of nearly 40%. Up until the fateful Brexit referendum, equity markets in the second quarter of 2016 largely held their recovery from February’s nadir and managed to post positive returns for the quarter despite dramatic intra-quarter volatility. The period will be remembered, however, for the tumultuous response to the United Kingdom’s vote to leave the European Union. As investors struggle to assess its long-term geopolitical and economic impact, capital has rushed into “safe” assets, if one can define “safe” as negative yielding government and corporate debt with maturities as long as fifty years in the case of Swiss government bonds.
The Hood River Small-Cap Growth Fund Institutional Shares returned -10.41% over the fiscal year ended June 30, 2016. That compares to a return of -10.75% for the Russell 2000® Growth Index and a -9.86% return for the average small-cap growth fund in the Morningstar© database. The modest excess return generated can be attributed to the team’s stock selection in healthcare and the portfolio’s under-weighted exposure to energy while holdings in consumer discretionary and industrials modestly detracted from returns. For a more in depth review of the Small-Cap Fund’s performance and commentary please see the investment review on page 5.
3
Hood River Small-Cap Growth Fund
The above comments reflect general views regarding the market and the economy, were current as of the date of this letter, and are subject to change at any time.
Returns represent past performance and include changes in share price and reinvestment of dividends and capital gains. The primary benchmark is the Russell 2000® Growth Index, defined as an unmanaged, capitalization weighted index of those Russell 2000® companies with higher price-to-book ratios and higher forecasted growth values. The S&P 500® Index is defined as an unmanaged, capitalization weighted index of the common stocks of 500 major U.S. corporations. Index returns include dividends and/or interest income and, unlike composite returns, do not reflect fees or expenses. In addition, unlike the Fund, which periodically maintains a significant cash position, the indices are fully invested. Each Morningstar category average represents a universe of funds with similar investment objectives. ©Morningstar, Inc. All Rights Reserved. The information contained herein: 1) is proprietary to Morningstar; 2) may not be copied or distributed and 3) is not warranted to be accurate, complete or timely. Neither Morningstar nor its content providers are responsible for any damages or losses arising from any use of this information. Past performance does not guarantee future results. It is not possible to invest directly in an index. The current performance of the Fund may be lower or higher than figures shown. Returns and share price will fluctuate, and redemption value may be more or less than original cost. Performance information current to the most recent month-end is available by calling (800) 497-2960.
4
Hood River Small-Cap Growth Fund
Investment Highlights
How did the Hood River Small-Cap Growth Fund perform during the annual period ended June 30, 2016?
During the 12-month period ended June 30, 2016 the Institutional Shares of the Hood River Small-Cap Growth Fund posted a total return of -10.41%. This compares to a total return of -10.75% for the Russell 2000® Growth Index during the same period.
What key factors were responsible for the Fund’s performance during the 12-month reporting period?
Typically our variation from the index is primarily driven by our bottom-up stock selection, but this year our positive relative performance was driven by our sector allocation, which contributed 161 basis points of outperformance. Stock selection netted out to -24 basis points of relative performance during the period.
Which equity market sectors most significantly affected Fund performance?
Our best sector this year was healthcare, which contributed 466 basis points of outperformance, composed of 374 basis points of stock selection and 92 basis points of sector allocation. Our biggest winner in the sector was VCA Inc., which operates veterinary hospitals and clinical labs. The company contributed 152 basis points of stock selection as higher consumer demand plus operating leverage combined to drive better-than-expected earnings during the year. Diplomat Pharmacy, the largest independent specialty pharmacy, contributed 93 basis points of total performance as revenue growth exceeded expectations. Amsurg Corp., which operates ambulatory surgery centers and specialty physician networks, added 80 basis points of stock selection as firm patient volumes and good expense control drove earnings. Our healthcare performance also benefited from our substantial underweight in biotechnology. While we generally like the biotech industry, in the past year we have not found many biotech companies trading at defensible valuations, and thus our portfolio has not had much exposure to that industry. With the Russell 2000® Biotechnology Growth Index underperforming the overall Russell 2000® Growth Index by 27.4% during the twelve-month period, that positioning helped our performance.
Our worst sector in the year was consumer discretionary, which contributed -207 basis points to performance, essentially all of which was stock selection. Our biggest detractor from returns was Lifelock, a provider of identity theft protection services, which was sued by the Federal Trade Commission regarding its advertising claims and protection of consumer information. Other stocks that hurt us included Men’s Wearhouse and Aaron’s, Inc., both retailers that posted disappointing results.
What are you expecting from the equity markets over the upcoming year?
We are primarily bottom-up stock pickers, so most of our economic outlook is based on what we hear from the business people we talk to on a daily basis. We believe that the economy continues to grow at a slow but positive pace, which should be a constructive
5
Hood River Small-Cap Growth Fund
backdrop for our type of stock picking as companies that are growing faster and winning share should see their stocks rewarded. In times of macro-driven broad market volatility, sometimes company-specific fundamental performance can get lost in the shuffle.
As we look at valuations, many asset classes in the world look expensive to us. The fixed income world looks scary, with much developed-world sovereign debt trading at negative or trivially positive yields, and riskier fixed income instruments offering historically low yields. Turning to equities, large-cap stocks in the U.S. look a little better, with forward price/earnings around the median seen since the turn of the current century. But small-cap growth stocks are currently trading well below their median price/earnings for that period, and trading at a similar price/earnings to the S&P 500® Index, despite having a considerably higher expected growth rate (and realized historical growth rate). While we are most focused on the long-term opportunity to add alpha in the relatively inefficient small-cap growth space, we will simply note that small-cap growth stocks look pretty defensible in absolute terms, and arguably attractive relative to other major asset classes.
The primary benchmark is the Russell 2000® Growth Index, defined as an unmanaged, capitalization weighted index of those Russell 2000® companies with higher price-to-book ratios and higher forecasted growth values. The S&P 500® Index is defined as an unmanaged, capitalization weighted index of the common stocks of 500 major U.S. corporations. The Russell 2000® Biotechnology Growth Index measures the performance of those Russell 2000® Biotechnology with higher price-to-book ratios and higher forecasted growth values. Index returns include dividends and/or interest income and, unlike composite returns, do not reflect fees or expenses. In addition, unlike the Fund, which periodically maintains a significant cash position, the indices are fully invested. Investors cannot directly invest in an index. “Basis Point” is a unit of measure used in finance to describe the percentage change in the value or rate of a financial instrument. “Price-Earnings Ratio” (P/E Ratio) is the ratio for valuing a company that measures its current share price relative to its per-share earnings. “Alpha” is the excess returns of a fund relative to the return of a benchmark index.
The Fund invests in small-cap securities, which present a greater risk of loss than large-cap securities, and in growth companies, which can be more sensitive to the company’s earnings and more volatile than the stock market in general. The Fund may also invest in foreign securities which are subject to risks including currency fluctuations, economic and political change and differing accounting standards. The Fund may invest in derivatives and IPOs, which are highly volatile. Additional risk information may be found in the prospectus. For a complete list of holdings, see the Schedule of Investments on page 9.
6
Hood River Small-Cap Growth Fund
Comparison of the Change in Value of a Hypothetical $25,000 Investment
in the Hood River Small-Cap Growth Fund – Institutional Shares and
Russell 2000® Growth Index
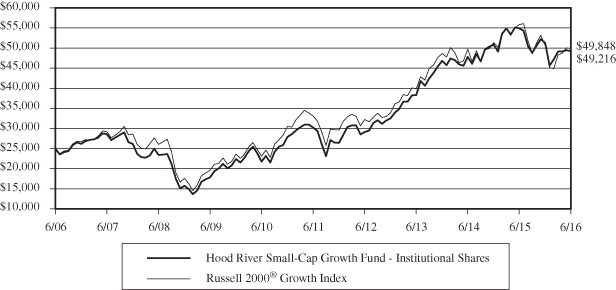
| Annualized | |||
| Total Return Periods Ended June 30, 2016: | 1 Year | 5 Years | 10 Years |
| Hood River Small-Cap Growth Fund – | |||
| Institutional Shares | -10.41% | 10.23% | 7.01% |
| Hood River Small-Cap Growth Fund – | |||
Investor Shares(1) | -10.63% | 10.18% | 6.98% |
Russell 2000® Growth Index | -10.75% | 8.51% | 7.14% |
| Expense ratios: 1.34% (Investor Shares); 1.09% (Institutional Shares) | |||
Performance data quoted represents past performance; past performance does not guarantee future results. The investment return and principal value of an investment will fluctuate so that an investor’s shares, when redeemed, may be worth more or less than their original cost. Current performance of the Fund may be lower or higher than the performance quoted. Performance data current to the most recent month end may be obtained by calling 1-800-497-2960.
This chart illustrates the performance of a hypothetical $25,000 investment made in the Institutional Class of the Fund on June 30, 2006. Returns reflect the reinvestment of dividends and capital gain distributions. The performance data and expense ratios shown reflect a contractual fee waiver made by the Adviser, currently, through December 31, 2020. In the absence of fee waivers, returns would be reduced. The performance data and graph do not reflect the deduction of taxes that a shareholder may pay on dividends, capital gain distributions, or redemption of Fund shares. This chart does not imply any future performance.
The Russell 2000® Growth Index measures the performance of the small-cap growth segment of the U.S. equity universe. It includes those Russell 2000® Index companies with higher price-to-value ratios and higher forecasted growth values.
(1) | The inception date of the Investor Shares is July 7, 2015. Performance shown prior to the inception of the Investor Shares reflects the performance of the Institutional Shares and excludes expenses that are not applicable to and are lower than those of the Investor Shares. The actual performance during the period July 7, 2015 (Investor Share inception) through June 30, 2016 was -9.96%. |
7
Hood River Small-Cap Growth Fund
| SECTOR ALLOCATION OF PORTFOLIO ASSETS |
| at June 30, 2016 (Unaudited) |
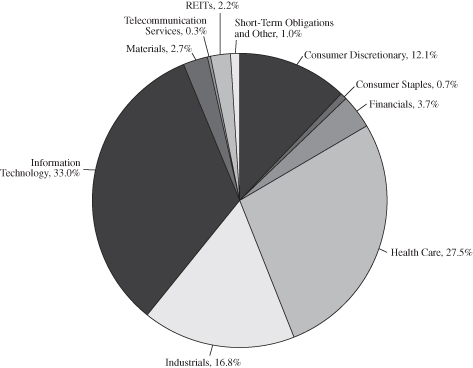
Percentages represent market value as a percentage of net assets.
8
Hood River Small-Cap Growth Fund
| SCHEDULE OF INVESTMENTS |
| at June 30, 2016 |
| COMMON STOCKS – 96.8% | Shares | Value | ||||||
| CONSUMER DISCRETIONARY – 12.1% | ||||||||
| Auto Components – 0.8% | ||||||||
| Cooper Tire & Rubber Co. | 21,681 | $ | 646,527 | |||||
| Drew Industries, Inc. | 4,759 | 403,754 | ||||||
| 1,050,281 | ||||||||
| Diversified Consumer Services – 1.1% | ||||||||
| Chegg, Inc. (a) | 163,835 | 819,175 | ||||||
| Grand Canyon Education, Inc. (a) | 14,674 | 585,786 | ||||||
| 1,404,961 | ||||||||
| Hotels, Restaurants & Leisure – 2.2% | ||||||||
| Diamond Resorts International, Inc. (a) | 32,980 | 988,081 | ||||||
| Six Flags Entertainment Corp. | 32,487 | 1,882,621 | ||||||
| 2,870,702 | ||||||||
| Leisure Products – 2.4% | ||||||||
| Brunswick Corp/DE | 43,608 | 1,976,315 | ||||||
| MCBC Holdings, Inc. | 45,300 | 500,565 | ||||||
| Smith & Wesson Holding Corp. (a) | 29,150 | 792,297 | ||||||
| 3,269,177 | ||||||||
| Specialty Retail – 5.6% | ||||||||
| Genesco, Inc. (a) | 33,734 | 2,169,434 | ||||||
| Hibbett Sports, Inc. (a) | 46,847 | 1,629,807 | ||||||
| MarineMax, Inc. (a) | 84,117 | 1,427,465 | ||||||
| Murphy USA, Inc. (a) | 30,999 | 2,298,886 | ||||||
| 7,525,592 | ||||||||
| TOTAL CONSUMER DISCRETIONARY | 16,120,713 | |||||||
| CONSUMER STAPLES – 0.7% | ||||||||
| Food & Staples Retailing – 0.7% | ||||||||
| Smart & Final Stores, Inc. (a) | 65,392 | 973,687 | ||||||
| TOTAL CONSUMER STAPLES | 973,687 | |||||||
The accompanying notes are an integral part of these financial statements.
9
Hood River Small-Cap Growth Fund
| SCHEDULE OF INVESTMENTS (Continued) |
| at June 30, 2016 |
| COMMON STOCKS – 96.8% (Continued) | Shares | Value | ||||||
| FINANCIALS – 3.7% | ||||||||
| Banks – 1.9% | ||||||||
| Bank of the Ozarks, Inc. | 55,219 | $ | 2,071,817 | |||||
| Equity Bancshares, Inc. (a) | 21,149 | 468,239 | ||||||
| Umpqua Holdings Corp. | 1 | 11 | ||||||
| 2,540,067 | ||||||||
| Insurance – 1.8% | ||||||||
| James River Group Holdings Ltd. (c) | 71,205 | 2,418,122 | ||||||
| TOTAL FINANCIALS | 4,958,189 | |||||||
| HEALTH CARE – 27.5% | ||||||||
| Biotechnology – 1.5% | ||||||||
| Ligand Pharmaceuticals, Inc. (a) | 7,602 | 906,691 | ||||||
| Neurocrine Biosciences, Inc. (a) | 24,291 | 1,104,026 | ||||||
| 2,010,717 | ||||||||
| Health Care Equipment & Supplies – 9.1% | ||||||||
| Cerus Corp. (a) | 334,370 | 2,086,469 | ||||||
| Cynosure, Inc. (a) | 31,714 | 1,542,727 | ||||||
| Integra LifeSciences Holdings Corp. (a) | 27,742 | 2,213,257 | ||||||
| NuVasive, Inc. (a) | 75,021 | 4,480,254 | ||||||
| OraSure Technologies, Inc. (a) | 188,059 | 1,111,429 | ||||||
| Tandem Diabetes Care, Inc. (a) | 92,427 | 696,899 | ||||||
| 12,131,035 | ||||||||
| Health Care Providers & Services – 11.6% | ||||||||
| AMN Healthcare Services, Inc. (a) | 79,216 | 3,166,263 | ||||||
| Amsurg Corp. (a) | 25,453 | 1,973,626 | ||||||
| Diplomat Pharmacy, Inc. (a) | 46,208 | 1,617,280 | ||||||
| HealthEquity, Inc. (a) | 44,393 | 1,348,881 | ||||||
| LHC Group, Inc. (a) | 30,374 | 1,314,587 | ||||||
| Surgical Care Affiliates, Inc. (a) | 19,663 | 937,335 | ||||||
| VCA, Inc. (a) | 51,280 | 3,467,041 | ||||||
| WellCare Health Plans, Inc. (a) | 14,989 | 1,608,020 | ||||||
| 15,433,033 | ||||||||
The accompanying notes are an integral part of these financial statements.
10
Hood River Small-Cap Growth Fund
| SCHEDULE OF INVESTMENTS (Continued) |
| at June 30, 2016 |
| COMMON STOCKS – 96.8% (Continued) | Shares | Value | ||||||
| HEALTH CARE – 27.5% (Continued) | ||||||||
| Health Care Technology – 1.2% | ||||||||
| HMS Holdings Corp. (a) | 93,177 | $ | 1,640,847 | |||||
| Life Sciences Tools & Services – 4.1% | ||||||||
| Charles River Laboratories International, Inc. (a) | 32,812 | 2,705,022 | ||||||
| PRA Health Sciences, Inc. (a) | 64,578 | 2,696,777 | ||||||
| 5,401,799 | ||||||||
| TOTAL HEALTH CARE | 36,617,431 | |||||||
| INDUSTRIALS – 16.8% | ||||||||
| Aerospace & Defense – 0.9% | ||||||||
| Hexcel Corp. | 30,232 | 1,258,860 | ||||||
| Building Products – 1.5% | ||||||||
| Patrick Industries, Inc. (a) | 7,723 | 465,620 | ||||||
| PGT, Inc. (a) | 152,787 | 1,573,706 | ||||||
| 2,039,326 | ||||||||
| Commercial Services & Supplies – 3.1% | ||||||||
| Herman Miller, Inc. | 58,166 | 1,738,582 | ||||||
| KAR Auction Services, Inc. | 56,921 | 2,375,882 | ||||||
| 4,114,464 | ||||||||
| Construction & Engineering – 1.7% | ||||||||
| MasTec, Inc. (a) | 104,292 | 2,327,797 | ||||||
| Electrical Equipment – 1.0% | ||||||||
| Energous Corp. (a) | 105,822 | 1,370,395 | ||||||
| Professional Services – 5.5% | ||||||||
| Huron Consulting Group, Inc. (a) | 29,759 | 1,798,039 | ||||||
| Korn/Ferry International | 28,019 | 579,993 | ||||||
| Navigant Consulting, Inc. (a) | 65,046 | 1,050,493 | ||||||
| On Assignment, Inc. (a) | 104,605 | 3,865,155 | ||||||
| 7,293,680 | ||||||||
| Road & Rail – 2.0% | ||||||||
| Old Dominion Freight Line, Inc. (a) | 26,245 | 1,582,836 | ||||||
| Swift Transportation Co. (a) | 67,378 | 1,038,295 | ||||||
| 2,621,131 | ||||||||
The accompanying notes are an integral part of these financial statements.
11
Hood River Small-Cap Growth Fund
| SCHEDULE OF INVESTMENTS (Continued) |
| at June 30, 2016 |
| COMMON STOCKS – 96.8% (Continued) | Shares | Value | ||||||
| INDUSTRIALS – 16.8% (Continued) | ||||||||
| Transportation Infrastructure – 1.1% | ||||||||
| Macquarie Infrastructure Corp. | 18,874 | $ | 1,397,620 | |||||
| TOTAL INDUSTRIALS | 22,423,273 | |||||||
| INFORMATION TECHNOLOGY – 33.0% | ||||||||
| Communications Equipment – 6.3% | ||||||||
| Applied Optoelectronics, Inc. (a) | 63,006 | 702,517 | ||||||
| Finisar Corp. (a) | 80,602 | 1,411,341 | ||||||
| Lumentum Holdings, Inc. (a) | 104,709 | 2,533,958 | ||||||
| Oclaro, Inc. (a) | 760,416 | 3,710,830 | ||||||
| 8,358,646 | ||||||||
| Electronic Equipment, | ||||||||
| Instruments & Components – 3.0% | ||||||||
| Fabrinet (a)(c) | 70,215 | 2,606,381 | ||||||
| Orbotech Ltd. (a)(c) | 52,017 | 1,329,034 | ||||||
| 3,935,415 | ||||||||
| Internet Software & Services – 3.1% | ||||||||
| 2U, Inc. (a) | 46,440 | 1,365,800 | ||||||
| Apigee Corp. (a) | 17,775 | 217,211 | ||||||
| Brightcove, Inc. (a) | 15,475 | 136,180 | ||||||
| Five9, Inc. (a) | 76,490 | 910,231 | ||||||
| inContact, Inc. (a) | 11,226 | 155,480 | ||||||
| LogMeIn, Inc. (a) | 21,919 | 1,390,322 | ||||||
| 4,175,224 | ||||||||
| IT Services – 2.4% | ||||||||
| Euronet Worldwide, Inc. (a) | 9,485 | 656,267 | ||||||
| ExlService Holdings, Inc. (a) | 37,117 | 1,945,302 | ||||||
| Travelport Worldwide Ltd. (c) | 48,977 | 631,314 | ||||||
| 3,232,883 | ||||||||
| Semiconductors & Semiconductor Equipment – 11.3% | ||||||||
| Advanced Micro Devices, Inc. (a) | 267,609 | 1,375,510 | ||||||
| Axcelis Technologies, Inc. (a) | 356,404 | 958,727 | ||||||
| Cirrus Logic, Inc. (a) | 59,198 | 2,296,291 | ||||||
The accompanying notes are an integral part of these financial statements.
12
Hood River Small-Cap Growth Fund
| SCHEDULE OF INVESTMENTS (Continued) |
| at June 30, 2016 |
| COMMON STOCKS – 96.8% (Continued) | Shares | Value | ||||||
| INFORMATION TECHNOLOGY – 33.0% (Continued) | ||||||||
| Semiconductors & Semiconductor | ||||||||
| Equipment – 11.3% (Continued) | ||||||||
| FormFactor, Inc. (a) | 95,093 | $ | 854,886 | |||||
| Himax Technologies, Inc. – ADR (a)(c) | 421,717 | 3,483,382 | ||||||
| Integrated Device Technology, Inc. (a) | 87,468 | 1,760,731 | ||||||
| Microsemi Corp. (a) | 60,491 | 1,976,846 | ||||||
| Nanometrics, Inc. (a) | 33,660 | 699,791 | ||||||
| Ultratech, Inc. (a) | 73,561 | 1,689,696 | ||||||
| 15,095,860 | ||||||||
| Software – 6.9% | ||||||||
| Callidus Software, Inc. (a) | 129,634 | 2,590,087 | ||||||
| Gigamon, Inc. (a) | 22,812 | 852,941 | ||||||
| Globant SA (a)(c) | 13,161 | 517,885 | ||||||
| Imperva, Inc. (a) | 19,973 | 859,039 | ||||||
| Proofpoint, Inc. (a) | 59,301 | 3,741,300 | ||||||
| Rovi Corp. (a) | 40,074 | 626,758 | ||||||
| 9,188,010 | ||||||||
| TOTAL INFORMATION TECHNOLOGY | 43,986,038 | |||||||
| MATERIALS – 2.7% | ||||||||
| Chemicals – 1.9% | ||||||||
| Trinseo SA (a)(c) | 59,711 | 2,563,393 | ||||||
| Containers & Packaging – 0.8% | ||||||||
| Berry Plastics Group, Inc. (a) | 26,719 | 1,038,033 | ||||||
| TOTAL MATERIALS | 3,601,426 | |||||||
| TELECOMMUNICATION SERVICES – 0.3% | ||||||||
| Diversified Telecommunication Services – 0.3% | ||||||||
| Cogent Communications Holdings, Inc. | 11,174 | 447,630 | ||||||
| TOTAL TELECOMMUNICATION SERVICES | 447,630 | |||||||
| TOTAL COMMON STOCKS | ||||||||
(Cost $116,384,328) | 129,128,387 | |||||||
The accompanying notes are an integral part of these financial statements.
13
Hood River Small-Cap Growth Fund
| SCHEDULE OF INVESTMENTS (Continued) |
| at June 30, 2016 |
| REITs – 2.2% | Shares | Value | ||||||
| Hannon Armstrong Sustainable | ||||||||
| Infrastructure Capital, Inc. | 23,842 | $ | 514,987 | |||||
| Pebblebrook Hotel Trust | 91,232 | 2,394,840 | ||||||
| TOTAL REITs | ||||||||
| (Cost $2,806,622) | 2,909,827 | |||||||
| RIGHTS – 0.0% | ||||||||
| Dyax Corp. Contingent Value Rights (a)(d)(e) | 26,407 | 0 | ||||||
| TOTAL RIGHTS | ||||||||
| (Cost $0) | 0 | |||||||
| SHORT-TERM INVESTMENTS – 0.8% | ||||||||
| MONEY MARKET FUNDS – 0.8% | ||||||||
| BlackRock Liquidity Funds TempFund | ||||||||
| Portfolio – Class I, 0.44% (b) | 1,085,918 | 1,085,918 | ||||||
| TOTAL SHORT-TERM INVESTMENTS | ||||||||
| (Cost $1,085,918) | 1,085,918 | |||||||
| TOTAL INVESTMENTS | ||||||||
| (Cost $120,276,868) – 99.8% | 133,124,132 | |||||||
| Other Assets in Excess of Liabilities – 0.2% | 253,538 | |||||||
| TOTAL NET ASSETS – 100.00% | $ | 133,377,670 | ||||||
Percentages are stated as a percent of net assets.
| ADR – American Depositary Receipt | |
| (a) | Non-income producing security. |
| (b) | The rate shown represents the fund’s 7-day yield as of June 30, 2016. |
| (c) | U.S. traded security of a foreign issuer or corporation. |
| (d) | Illiquid security; a security may be considered illiquid if it lacks a readily available market. As of June 30, 2016, the value of these securities was $0 or 0.00% of total net assets. |
| (e) | Security valued at fair value using methods determined in good faith by or at the direction of members of the Valuation Committee. |
The accompanying notes are an integral part of these financial statements.
14
Hood River Small-Cap Growth Fund
(This Page Intentionally Left Blank.)
15
Hood River Small-Cap Growth Fund
| STATEMENT OF ASSETS AND LIABILITIES |
| at June 30, 2016 |
| Assets: | ||||
| Investments, at value (cost of $120,276,868) | $ | 133,124,132 | ||
| Receivables: | ||||
| Fund shares sold | 1,130,782 | |||
| Dividends and interest | 63,849 | |||
| Prepaid expenses | 57,862 | |||
| Total assets | 134,376,625 | |||
| Liabilities: | ||||
| Payables: | ||||
| Fund shares redeemed | 826,794 | |||
| Advisory fee | 106,115 | |||
| Administration and accounting fees | 17,809 | |||
| Reports to shareholders | 10,427 | |||
| Custody fees | 4,472 | |||
| Transfer agent fees and expenses | 5,417 | |||
| Other accrued expenses | 27,921 | |||
| Total liabilities | 998,955 | |||
| Net assets | $ | 133,377,670 | ||
| Net assets consist of: | ||||
| Capital stock | $ | 129,605,025 | ||
| Accumulated net investment loss | (510,678 | ) | ||
| Accumulated net realized loss on investments | (8,563,941 | ) | ||
| Net unrealized appreciation on: | ||||
| Investments | 12,847,264 | |||
| Net assets | $ | 133,377,670 | ||
| Investor Shares: | ||||
| Net assets applicable to outstanding Investor Shares | $ | 38,746 | ||
| Shares issued (Unlimited number of beneficial | ||||
| interest authorized, $0.01 par value) | 1,371 | |||
| Net asset value and redemption price per share | $ | 28.25 | (a) | |
| Institutional Shares: | ||||
| Net assets applicable to outstanding Institutional Shares | $ | 133,338,924 | ||
| Shares issued (Unlimited number of beneficial | ||||
| interest authorized, $0.01 par value) | 4,708,286 | |||
| Net asset value, offering price and redemption price per share | $ | 28.32 | ||
| (a) | Does not recompute due to rounding. |
The accompanying notes are an integral part of these financial statements.
16
Hood River Small-Cap Growth Fund
| STATEMENT OF OPERATIONS |
| For the Year Ended June 30, 2016 |
| Investment income: | ||||
| Dividends | $ | 731,547 | ||
| Interest | 8,969 | |||
| Total investment income | 740,516 | |||
| Expenses: | ||||
| Advisory fees (Note 4) | 1,147,856 | |||
| Administration and accounting fees (Note 4) | 176,507 | |||
| Distribution fees (Note 5) | ||||
| Distribution fees – Investor Shares | 31 | |||
| Transfer agent fees and expenses | 57,759 | |||
| Federal and state registration fees | 41,371 | |||
| Audit fees | 18,498 | |||
| Legal fees | 65,872 | |||
| Reports to shareholders | 15,120 | |||
| Trustees’ fees and expenses | 20,898 | |||
| Custody fees | 30,630 | |||
| Other | 31,784 | |||
| Total expenses before reimbursement from advisor | 1,606,326 | |||
| Expenses waived by advisor (Note 4) | (355,132 | ) | ||
| Total net expenses | 1,251,194 | |||
| Net investment loss | (510,678 | ) | ||
| Realized and unrealized loss on investments: | ||||
| Net realized loss on investments | (7,303,117 | ) | ||
| Net change in unrealized appreciation (depreciation) on investments | (3,148,437 | ) | ||
| Net realized and unrealized loss on investments | (10,451,554 | ) | ||
| Net decrease in net assets resulting from operations | $ | (10,962,232 | ) | |
The accompanying notes are an integral part of these financial statements.
17
Hood River Small-Cap Growth Fund
| STATEMENTS OF CHANGES IN NET ASSETS |
| Year Ended | Year Ended | |||||||
| June 30, 2016 | June 30, 2015 | |||||||
| Operations: | ||||||||
| Net investment loss | $ | (510,678 | ) | $ | (658,710 | ) | ||
| Net realized gain (loss) on investments | (7,303,117 | ) | 13,665,747 | |||||
| Net change in unrealized appreciation | ||||||||
| (depreciation) on investments | (3,148,437 | ) | (3,364,334 | ) | ||||
| Net increase (decrease) in net assets | ||||||||
| resulting from operations | (10,962,232 | ) | 9,642,703 | |||||
| Distributions to Shareholders From: | ||||||||
| Net realized gains | ||||||||
| Investor shares | (374 | ) | — | |||||
| Institutional shares | (6,796,491 | ) | — | |||||
| Total distributions | (6,796,865 | ) | — | |||||
| Capital Share Transactions: | ||||||||
| Proceeds from shares sold | ||||||||
| Investor shares | 37,225 | — | ||||||
| Institutional shares | 77,470,215 | 42,102,738 | ||||||
| Proceeds from shares issued to holders | ||||||||
| in reinvestment of dividends | ||||||||
| Investor shares | 374 | — | ||||||
| Institutional shares | 6,283,327 | — | ||||||
| Cost of shares redeemed | ||||||||
| Investor shares | (12 | ) | — | |||||
| Institutional shares | (29,984,212 | ) | (38,403,511 | ) | ||||
| Redemption fees retained | ||||||||
| Investor shares | 1 | — | ||||||
| Institutional shares | 15,296 | 6,868 | ||||||
| Net increase in net assets from | ||||||||
| capital share transactions | 53,822,214 | 3,706,095 | ||||||
| Total increase in net assets | 36,063,117 | 13,348,798 | ||||||
| Net Assets: | ||||||||
| Beginning of year | 97,314,553 | 83,965,755 | ||||||
| End of year | $ | 133,377,670 | $ | 97,314,553 | ||||
| Accumulated net investment loss | $ | (510,678 | ) | $ | (293,210 | ) | ||
The accompanying notes are an integral part of these financial statements.
18
Hood River Small-Cap Growth Fund
| STATEMENTS OF CHANGES IN NET ASSETS (Continued) |
| Year Ended | Year Ended | |||||||
| June 30, 2016 | June 30, 2015 | |||||||
| Changes in Shares Outstanding: | ||||||||
| Shares sold | ||||||||
| Investor shares | 1,359 | — | ||||||
| Institutional shares | 2,630,309 | 1,346,674 | ||||||
| Proceeds from shares issued to holders | ||||||||
| in reinvestment of dividends | ||||||||
| Investor shares | 13 | — | ||||||
| Institutional shares | 213,937 | — | ||||||
| Shares redeemed | ||||||||
| Investor shares | (1 | ) | — | |||||
| Institutional shares | (1,046,825 | ) | (1,322,425 | ) | ||||
| Net increase in shares outstanding | 1,798,792 | 24,249 | ||||||
The accompanying notes are an integral part of these financial statements.
19
Hood River Small-Cap Growth Fund
| FINANCIAL HIGHLIGHTS |
For a capital share outstanding throughout the period
| Investor Shares | ||||
| July 7, 2015 | ||||
| through | ||||
| June 30, 2016* | ||||
| Net Asset Value – Beginning of Period | $ | 33.18 | ||
| Income from Investment Operations: | ||||
Net investment loss1 | (0.19 | ) | ||
| Net realized and unrealized loss on investments | (3.05 | ) | ||
| Total from investment operations | (3.24 | ) | ||
| Less Distributions: | ||||
| Distributions from net realized gains | (1.69 | ) | ||
| Total distributions | (1.69 | ) | ||
| Redemption fees | — | 2 | ||
| Net Asset Value – End of Period | $ | 28.25 | ||
| Total Return | (9.96 | )%^ | ||
| Ratios and Supplemental Data: | ||||
| Net assets, end of period (thousands) | $ | 39 | ||
| Ratio of operating expenses to average net assets: | ||||
| Before Waivers | 1.65 | %+ | ||
| After Waivers | 1.34 | %+ | ||
| Ratio of net investment loss to average net assets: | ||||
| Before Waivers | (0.99 | )%+ | ||
| After Waivers | (0.68 | )%+ | ||
Portfolio turnover rate3 | 170 | % | ||
| * | Operations commenced for the Investor Shares on July 7, 2015. |
| + | Annualized |
| ^ | Not Annualized |
1 | The net investment loss per share was calculated using the average shares outstanding method. |
2 | Amount is less than $0.01. |
3 | Portfolio turnover is calculated on the basis of the Fund as a whole. The rate presented represents portfolio turnover for the entire fiscal year. |
The accompanying notes are an integral part of these financial statements.
20
Hood River Small-Cap Growth Fund
| FINANCIAL HIGHLIGHTS |
For a capital share outstanding throughout each year
| Institutional Shares | ||||||||||||||||||||
| Year Ended | Year Ended | Year Ended | Year Ended | Year Ended | ||||||||||||||||
| June 30, | June 30, | June 30, | June 30, | June 30, | ||||||||||||||||
| 2016 | 2015 | 2014 | 2013 | 2012 | ||||||||||||||||
| Net Asset Value – | ||||||||||||||||||||
| Beginning of Year | $ | 33.43 | $ | 29.09 | $ | 23.31 | $ | 17.72 | $ | 18.40 | ||||||||||
| Income from | ||||||||||||||||||||
| Investment Operations: | ||||||||||||||||||||
Net investment loss1 | (0.13 | ) | (0.24 | ) | (0.22 | ) | (0.12 | ) | (0.15 | ) | ||||||||||
| Net realized and unrealized | ||||||||||||||||||||
| gain (loss) on investments | (3.29 | ) | 4.58 | 6.00 | 5.71 | (0.53 | ) | |||||||||||||
| Total from | ||||||||||||||||||||
| investment operations | (3.42 | ) | 4.34 | 5.78 | 5.59 | (0.68 | ) | |||||||||||||
| Less Distributions: | ||||||||||||||||||||
| Distributions from | ||||||||||||||||||||
| net realized gains | (1.69 | ) | — | — | — | — | ||||||||||||||
| Total distributions | (1.69 | ) | — | — | — | — | ||||||||||||||
| Redemption fees | — | 2 | — | 2 | — | 2 | — | 2 | — | 2 | ||||||||||
| Net Asset Value – | ||||||||||||||||||||
| End of Year | $ | 28.32 | $ | 33.43 | $ | 29.09 | $ | 23.31 | $ | 17.72 | ||||||||||
| Total Return | (10.41 | )% | 14.92 | % | 24.80 | % | 31.55 | % | (3.70 | )% | ||||||||||
| Ratios and Supplemental Data: | ||||||||||||||||||||
| Net assets, end of | ||||||||||||||||||||
| year (thousands) | $ | 133,339 | $ | 97,315 | $ | 83,966 | $ | 59,893 | $ | 57,643 | ||||||||||
| Ratio of operating expenses | ||||||||||||||||||||
| to average net assets: | ||||||||||||||||||||
| Before Waivers | 1.40 | % | 1.45 | % | 1.48 | % | 1.59 | % | 1.57 | % | ||||||||||
| After Waivers | 1.09 | % | 1.20 | % | 1.25 | % | 1.25 | % | 1.25 | % | ||||||||||
| Ratio of net investment loss | ||||||||||||||||||||
| to average net assets: | ||||||||||||||||||||
| Before Waivers | (0.75 | )% | (1.04 | )% | (1.05 | )% | (0.92 | )% | (1.20 | )% | ||||||||||
| After Waivers | (0.44 | )% | (0.79 | )% | (0.82 | )% | (0.58 | )% | (0.88 | )% | ||||||||||
| Portfolio turnover rate | 170 | % | 142 | % | 115 | % | 119 | % | 138 | % | ||||||||||
1 | The net investment loss per share was calculated using the average shares outstanding method. |
2 | Amount is less than $0.01. |
The accompanying notes are an integral part of these financial statements.
21
Hood River Small-Cap Growth Fund
| NOTES TO FINANCIAL STATEMENTS |
| June 30, 2016 |
NOTE 1 – ORGANIZATION
The Hood River Small-Cap Growth Fund (formerly, the Roxbury/Hood River Small-Cap Growth Fund) (the “Small-Cap Growth Fund” or the “Fund”) is a series of Manager Directed Portfolios (formerly, The Roxbury Funds) (the “Trust”). The Trust is registered under the Investment Company Act of 1940, as amended (the “1940 Act”), as a diversified open-end investment management company and was organized as a Delaware statutory trust on April 4, 2006. The investment objective of the Fund is long-term growth of capital. The Fund’s Institutional Shares commenced operations on January 2, 2003. The Fund’s Investor Shares commenced operations on July 7, 2015. Each class of shares differs principally in its respective distribution expenses. Each class of shares has identical rights to earnings, assets and voting privileges, except for class-specific expenses and exclusive rights to vote on matters affecting only individual classes.
NOTE 2 – SIGNIFICANT ACCOUNTING POLICIES
The following is a summary of significant accounting policies consistently followed by the Fund. These policies are in conformity with U.S. generally accepted accounting principles (“GAAP”).
| A. | Security Valuation: All investments in securities are recorded at their estimated fair value, as described in Note 3. | |
| B. | Federal Income Taxes: It is the Fund’s policy to comply with the requirements of Subchapter M of the Internal Revenue Code applicable to regulated investment companies and to distribute substantially all of its taxable income to its shareholders. Therefore, no federal income or excise tax provisions are required. | |
| The Fund recognizes the tax benefits of uncertain tax positions only where the position is “more likely than not” to be sustained assuming examination by tax authorities. Management has analyzed the Fund’s tax positions, and has concluded that no liability for unrecognized tax benefits should be recorded related to uncertain tax positions to be taken or expected to be taken on a tax return. The tax returns for the Fund for the prior three fiscal years are open for examination. The Fund identifies its major tax jurisdictions as U.S. Federal and the state of Delaware. | ||
| C. | Securities Transactions, Income and Distributions: Securities transactions are accounted for on the trade date. Realized gains and losses on securities sold are determined on the basis of identified cost. Interest income is recorded on an accrual basis. Dividend income and distributions to shareholders are recorded on the ex-dividend date. Withholding taxes on foreign dividends have been provided for in accordance with the Fund’s understanding of the applicable country’s tax rules and rates. | |
| The Fund distributes substantially all of its net investment income, if any, and net realized capital gains, if any, annually. Distributions from net realized gains for |
22
Hood River Small-Cap Growth Fund
| NOTES TO FINANCIAL STATEMENTS (Continued) |
| June 30, 2016 |
| book purposes may include short-term capital gains. All short-term capital gains are included in ordinary income for tax purposes. The amount of dividends and distributions to shareholders from net investment income and net realized capital gains is determined in accordance with federal income tax regulations, which differ from GAAP. To the extent these book/tax differences are permanent, such amounts are reclassified within the capital accounts based on their federal tax treatment. | ||
| Investment income, expenses (other than those specific to the class of shares), and realized and unrealized gains and losses on investments are allocated to the separate classes of the Fund’s shares based upon their relative net assets on the date income is earned or expensed and realized and unrealized gains and losses are incurred. | ||
| The Fund is charged for those expenses that are directly attributable to it, such as investment advisory, custody and transfer agent fees. Expenses that are not attributable to a Fund are typically allocated among the funds in the Trust proportionately based on allocation methods approved by the Board of Trustees (the “Board”). Common expenses of the Trust are typically allocated among the funds in the Trust based on a fund’s respective net assets, or by other equitable means. | ||
| D. | Use of Estimates: The preparation of financial statements in conformity with GAAP requires management to make estimates and assumptions that affect the reported amounts of assets and liabilities at the date of the financial statements and the reported amounts of increases and decreases in net assets during the reporting period. Actual results could differ from those estimates. | |
| E. | Redemption Fees: Each share class of the Hood River Small-Cap Growth Fund charges a 1% redemption fee to most shareholders who redeem shares held for 60 days or less. Such fees are retained by the Fund and accounted for as an addition to paid-in capital. | |
| F. | Mutual Fund and ETF Trading Risk: The Fund may invest in other mutual funds that are either open-end or closed-end investment companies as well as ETFs. ETFs are investment companies that are bought and sold on a national securities exchange. Unlike mutual funds, ETFs do not necessarily trade at the net asset values of their underlying securities, which means an ETF could potentially trade above or below the value of the underlying portfolios. Additionally, because ETFs trade like stocks on exchanges, they are subject to trading and commission costs unlike mutual funds. Also, both mutual funds and ETFs have management fees that are part of its costs, and the Fund will indirectly bear their proportionate share of the costs. | |
| G. | Reclassification of Capital Accounts: GAAP requires that certain components of net assets relating to permanent differences be reclassified between financial and tax reporting. These reclassifications have no effect on net assets or net asset value per share. For the year ended June 30, 2016, the Fund made the following permanent tax adjustments on the Statement of Assets and Liabilities: |
23
Hood River Small-Cap Growth Fund
| NOTES TO FINANCIAL STATEMENTS (Continued) |
| June 30, 2016 |
| Accumulated | Accumulated | |||
| Net Investment | Net Realized | Capital | ||
Income/(Loss) | Gain/(Loss) | Stock | ||
| Small-Cap Growth Fund | $293,210 | $— | $(293,210) |
NOTE 3 – SECURITIES VALUATION
The Fund has adopted authoritative fair value accounting standards which establish an authoritative definition of fair value and set out a hierarchy for measuring fair value. These standards require additional disclosures about the various inputs and valuation techniques used to develop the measurements of fair value, a discussion of changes in valuation techniques and related inputs during the period, and expanded disclosure of valuation levels for major security types. These inputs are summarized in the three broad levels listed below:
| Level 1 – | Unadjusted quoted prices in active markets for identical assets or liabilities that the Fund has the ability to access. | |
| Level 2 – | Observable inputs other than quoted prices included in level 1 that are observable for the asset or liability, either directly or indirectly. These inputs may include quoted prices for the identical instrument on an inactive market, prices for similar instruments, interest rates, prepayment speeds, credit risk, yield curves, default rates and similar data. | |
| Level 3 – | Unobservable inputs for the asset or liability, to the extent relevant observable inputs are not available, representing the Fund’s own assumptions about the assumptions a market participant would use in valuing the asset or liability, and would be based on the best information available. |
Following is a description of the valuation techniques applied to the Fund’s major categories of assets and liabilities measured at fair value on a recurring basis.
Equity Securities: Equity securities, including common stocks, preferred stocks, foreign-issued common stocks, exchange-traded funds, closed-end mutual funds and real estate investment trusts (REITs), that are primarily traded on a national securities exchange shall be valued at the last sale price on the exchange on which they are primarily traded on the day of valuation or, if there has been no sale on such day, at the mean between the bid and asked prices. Securities primarily traded in the NASDAQ Global Market System for which market quotations are readily available shall be valued using the NASDAQ Official Closing Price (“NOCP”). If the NOCP is not available, such securities shall be valued at the last sale price on the day of valuation, or if there has been no sale on such day, at the mean between the bid and asked prices. Over-the-counter securities which are not traded in the NASDAQ Global Market System shall be valued at the mean between the bid and asked prices. To the extent these securities are actively traded and valuation adjustments are not applied, they are categorized in level 1 of the fair value hierarchy.
24
Hood River Small-Cap Growth Fund
| NOTES TO FINANCIAL STATEMENTS (Continued) |
| June 30, 2016 |
Investment Companies: Investments in open-end mutual funds, including money market funds, are generally priced at their net asset value per share and will be classified in level 1 of the fair value hierarchy.
The Board delegated day-to-day valuation issues to a Valuation Committee of the Trust which, as of June 30, 2016, was comprised of representatives from Hood River Capital Management LLC (the “Advisor”) and the Trust. The function of the Valuation Committee is to value securities where current and reliable market quotations are not readily available, or the closing price does not represent fair value, by following procedures approved by the Board. These procedures consider many factors, including the type of security, size of holding, trading volume and news events. All actions taken by the Valuation Committee are subsequently reviewed and ratified by the Board.
Depending on the relative significance of the valuation inputs, fair valued securities may be classified in either level 2 or level 3 of the fair value hierarchy.
The inputs or methodology used for valuing securities are not an indication of the risk associated with investing in those securities. The following is a summary of the fair valuation hierarchy of the Small-Cap Growth Fund’s securities as of June 30, 2016:
| Level 1 | Level 2 | Level 3 | Total | ||||||||||||||
| Common Stocks | |||||||||||||||||
| Consumer Discretionary | $ | 16,120,713 | $ | — | $ | — | $ | 16,120,713 | |||||||||
| Consumer Staples | 973,687 | — | — | 973,687 | |||||||||||||
| Financials | 4,958,189 | — | — | 4,958,189 | |||||||||||||
| Health Care | 36,617,431 | — | — | 36,617,431 | |||||||||||||
| Industrials | 22,423,273 | — | — | 22,423,273 | |||||||||||||
| Information Technology | 43,986,038 | — | — | 43,986,038 | |||||||||||||
| Materials | 3,601,426 | — | — | 3,601,426 | |||||||||||||
| Telecommunication Services | 447,630 | — | — | 447,630 | |||||||||||||
| Total Common Stock | 129,128,387 | — | — | 129,128,387 | |||||||||||||
| REITs | 2,909,827 | — | — | 2,909,827 | |||||||||||||
| Rights | — | — | — | — | |||||||||||||
| Short-Term Investments | 1,085,918 | — | — | 1,085,918 | |||||||||||||
| Total Investments in Securities | $ | 133,124,132 | $ | — | $ | — | $ | 133,124,132 | |||||||||
Refer to the Fund's schedule of investments for a detailed break-out of securities by industry classification. Transfers between levels are recognized at the end of the reporting period. During the year ended June 30, 2016, the Fund recognized no transfers between levels. There was one level 3 security held in the Fund on June 30, 2016.
25
Hood River Small-Cap Growth Fund
| NOTES TO FINANCIAL STATEMENTS (Continued) |
| June 30, 2016 |
Level 3 Reconciliation Disclosure
The following is a reconciliation of Level 3 assets for which significant unobservable inputs were used to determine fair value.
| Investments in Securities, at Value | |||||
| Balance as of June 30, 2015 | $ | — | |||
| Accrued discounts/premiums | — | ||||
| Realized gain/(loss) | — | ||||
| Change in unrealized appreciation/(depreciation) | — | ||||
| Purchases | — | ||||
| Sales | — | ||||
| Transfers in and/or out of level 3 | — | ||||
| Balance as of June 30, 2016 | $ | — | * | ||
| * | On January 25, 2016, the Fund held common shares of Dyax Corp (DYAX). DYAX was acquired by Shire and the Fund received in exchange for each DYAX share a payment in cash, as well as a contingent value right (CVR). With no observable market price for the CVR, there is no objective ongoing source of valuation data for this instrument. Accordingly, the security is valued at zero and categorized as level 3 on the fair value hierarchy. |
The Level 3 investments as of June 30, 2016, represented 0.00% of net assets and did not warrant a disclosure of significant unobservable inputs.
In May 2015, the Financial Accounting Standards Board (“FASB”) issued Accounting Standards Update (“ASU”) No. 2015-07 “Disclosure for Investments in Certain Entities that Calculate Net Asset Value (“NAV”) per Share (or its equivalent).” The amendments in ASU No. 2015-07 remove the requirement to categorize within the fair value hierarchy investments measured using the NAV practical expedient. The ASU also removes certain disclosure requirements for investments that qualify, but do not utilize, the NAV practical expedient. The amendments in the ASU are effective for fiscal years beginning after December 15, 2015, and interim periods within those fiscal years. Management is currently evaluating the impact these changes will have on the Fund’s financial statements and related disclosures.
NOTE 4 – INVESTMENT ADVISORY FEE AND OTHER TRANSACTIONS WITH AFFILIATES
For the year ended June 30, 2016, the Advisor provided the Fund with investment management services under an Investment Advisory Agreement. The Advisor furnishes all investment advice, office space, and facilities, and provides most of the personnel needed by the Fund. As compensation for its services, the Advisor is entitled to a monthly fee at an annual rate of 1.00% for the Small-Cap Growth Fund based upon the average daily net assets of the Fund. For the year ended June 30, 2016, the Small-Cap Growth Fund incurred $1,147,856 in advisory fees. Advisory fees payable at June 30, 2016 for the Small-Cap Growth Fund were $106,115.
26
Hood River Small-Cap Growth Fund
| NOTES TO FINANCIAL STATEMENTS (Continued) |
| June 30, 2016 |
The Fund is responsible for its own operating expenses. The Advisor has contractually agreed to waive its fees and/or absorb expenses of the Fund to ensure that the net annual operating expenses [excluding Acquired Fund Fees and Expenses, taxes, brokerage commissions, interest and extraordinary expenses (collectively, “Excludable Expenses”)] do not exceed the following amounts of the average daily net assets for each class of shares:
| Small-Cap Growth Fund | |
| Investor Shares | 1.34% |
| Institutional Shares | 1.09% |
For the year ended June 30, 2016, the Advisor reduced its fees and absorbed Fund expenses in the amount of $355,132 for the Small-Cap Growth Fund.
Roxbury Capital Management, LLC (“Roxbury”), an affiliate of the Advisor, provided certain compliance and administrative services to the Trust pursuant to an Administration Agreement through June 30, 2016.
BNY Mellon Investment Servicing (US) Inc. (“BNY Mellon”) provided administrative and accounting services to the Fund pursuant to an Accounting and Administrative Services Agreement through June 30, 2016.
The Bank of New York Mellon served as custodian to the Trust pursuant to a Custodian Services Agreement through June 30, 2016.
NOTE 5 – DISTRIBUTION AGREEMENT AND PLAN
The Fund has adopted a Distribution Plan pursuant to Rule 12b-1 (the “Plan”). The Plan permits the Fund to pay for distribution and related expenses at an annual rate of up to 0.25% of the average daily net assets of the Fund’s Investor Class shares. The expenses covered by the Plan may include costs in connection with the promotion and distribution of shares and the provision of personal services to shareholders, including, but not necessarily limited to, advertising, compensation to underwriters, dealers and selling personnel, the printing and mailing of prospectuses to other than current Fund shareholders, and the printing and mailing of sales literature. Payments made pursuant to the Plan will represent compensation for distribution and service activities, not reimbursements for specific expenses incurred. For the year ended June 30, 2016, the Small-Cap Growth Fund incurred distribution expenses on its Investor Class shares of $31.
NOTE 6 – SECURITIES TRANSACTIONS
For the year ended June 30, 2016, the cost of purchases and the proceeds from sales of securities, excluding short-term securities, were as follows:
Purchases | Sales | |||
| Small-Cap Growth Fund | $240,747,750 | $191,997,271 |
There were no purchases or sales of long-term U.S. Government securities.
27
Hood River Small-Cap Growth Fund
| NOTES TO FINANCIAL STATEMENTS (Continued) |
| June 30, 2016 |
NOTE 7 – INCOME TAXES AND DISTRIBUTIONS TO SHAREHOLDERS
As of June 30, 2016, the components of accumulated earnings/(losses) on a tax basis were as follows:
| Small-Cap | |||||
| Growth Fund | |||||
Cost of investments(a) | $ | 121,626,181 | |||
| Gross unrealized appreciation | 17,145,915 | ||||
| Gross unrealized depreciation | (5,647,964 | ) | |||
| Net unrealized appreciation | 11,497,951 | ||||
| Undistributed ordinary income | — | ||||
| Undistributed long-term capital gain | — | ||||
| Total distributable earnings | — | ||||
| Other accumulated gains/(losses) | (7,725,306 | ) | |||
| Total accumulated earnings/(losses) | $ | 3,772,645 | |||
(a) | The difference between the book basis and tax basis net unrealized appreciation and cost is attributable primarily to wash sales. |
At June 30, 2016, the Small-Cap Growth Fund had no long-term tax basis capital losses to offset future capital gains.
The tax character of distributions paid during 2016 and 2015 was as follows:
| Year Ended | Year Ended | ||
June 30, 2016 | June 30, 2015 | ||
| Small-Cap Growth Fund | |||
| Ordinary income | $ — | $ — | |
| Long-term capital gains | $6,796,865 | $ — |
At June 30, 2016, the Fund deferred, on a tax basis, post-October losses of:
| Late Year Ordinary | ||
Loss Deferral | Capital | |
| $510,678 | $7,214,628 |
Net qualified late year losses include post-October losses, which are incurred after October 31, 2015 and within a Fund’s taxable year, and are deemed to arise on the first day of the Fund’s next taxable year.
NOTE 8 – PRINCIPAL RISKS
The following is a list of certain risks that may apply to your investment in the Fund. Further information about investment risks is available in the Fund’s Statement of Additional Information.
Market Risk: The risk that the market value of a security may go up or down in response to many factors including the historical and prospective earnings of the issuer,
28
Hood River Small-Cap Growth Fund
| NOTES TO FINANCIAL STATEMENTS (Continued) |
| June 30, 2016 |
the value of its assets, general economic conditions, interest rates, investor perceptions and market liquidity. Price changes may be temporary or last for extended periods.
Small Company Risk: Companies in which the Fund invests may be more vulnerable than larger companies to adverse business or economic developments. Small-cap companies may also have limited product lines, markets, or financial resources, may be dependent on relatively small or inexperienced management groups, and may operate in industries characterized by rapid technological obsolescence. Securities of such companies may be less liquid, more volatile and more difficult to value than securities of larger companies and therefore may involve greater risk than investing in large companies.
Growth Investing Risk: An investment in a growth-oriented fund may be more volatile than the rest of the U.S. market as a whole. If the investment adviser’s assessment of a company’s prospects for earnings growth or how other investors will value the company’s earnings growth is incorrect, the stock may fail to reach the value that the adviser has placed on it. Growth stock prices tend to fluctuate more dramatically than the overall stock market.
Foreign Security Risk: Foreign investments involve risks relating to political, economic, regulatory, or social instability, military action or unrest, or diplomatic developments and may be affected by actions of foreign governments adverse to the interest of U.S. investors.
IPO Risk: The Fund may purchase securities of companies engaged in initial public offerings (“IPOs”). The price of securities purchased in IPOs can be very volatile. The Fund’s investments in IPO shares may include the securities of “unseasoned” companies (companies with less than three years of continuous operations), which present risks considerably greater than common stocks of more established companies. These companies may be involved in new and evolving businesses and may be vulnerable to competition and changes in technology, markets and economic conditions. They may be more dependent on key managers and third parties and may have limited product lines. The effect of IPO investments on a Fund’s performance depends on a variety of factors, including the number of IPOs the Fund invests in relative to the size of the Fund, and whether and to what extent a security purchased in an IPO appreciates or depreciates in value. When the Fund’s asset base is small, a significant portion of the Fund’s performance could be attributable to investments in IPOs because such investments would have a magnified impact on the Fund. As the Fund’s asset grow, the effect of the Fund’s investments in IPOs on the Fund’s performance probably will decline, which could reduce the Fund’s performance.
Liquidity Risk: Certain securities may be difficult or impossible to sell at the time and the price that the seller would like. While the markets in securities of small companies have grown rapidly in recent years, such securities may trade less frequently and in smaller volumes than more widely held securities. The values of these
29
Hood River Small-Cap Growth Fund
| NOTES TO FINANCIAL STATEMENTS (Continued) |
| June 30, 2016 |
securities may fluctuate more sharply than those of other securities, and the Fund may experience some difficulty in establishing or closing out positions in these securities at prevailing market prices. There may be less publicly available information about the issuers of these securities or less market interest in such securities than in the case of larger companies, and it may take a longer period of time for the prices of such securities to reflect the full value of their issuers’ underlying earnings potential or assets.
NOTE 9 – COMMITMENTS AND CONTINGENCIES
In the normal course of business, the Fund enters into contracts that contain a variety of representations and warranties and which provide general indemnifications. The Fund’s maximum exposure under these arrangements is unknown, as this would involve future claims that may be made against the Fund that have not yet occurred. However, based on experience, the Fund expects the risk of loss to be remote.
NOTE 10 – SUBSEQUENT EVENTS
The name of the Trust has been changed to Manager Directed Portfolios effective July 1, 2016. The Board has approved the retention of U.S. Bancorp Fund Services, LLC (“USBFS”), U.S. Bank N.A. (“U.S. Bank”), Quasar Distributors LLC (“Quasar”) and Vigilant Compliance, LLC (“Vigilant”) as new service providers to the Trust. The new service agreements became effective on July 1, 2016. The Administration Agreement with Roxbury was terminated on June 30, 2016. The prior service agreements with BNY Mellon were terminated on June 30, 2016. In preparing the financial statements as of June 30, 2016, management considered the impact of subsequent events for potential recognition or disclosure in the financial statements and had concluded that no additional disclosures are necessary other than those mentioned above.
NOTE 11 – MATTERS SUBMITTED TO A SHAREHOLDER VOTE
A special meeting of shareholders of the Fund was held on June 21, 2016, and the following matters were approved by the Fund’s shareholders:
To elect four trustees to the Trust’s Board of Trustees:
For | Withhold | |||
| Gaylord B. Lyman | 3,708,575 | 19,266 | ||
| James R. Schoenike | 2,172,985 | 1,554,856 | ||
| Scott Craven Jones | 3,721,476 | 6,365 | ||
| Lawrence T. Greenberg | 3,721,476 | 6,365 |
30
Hood River Small-Cap Growth Fund
| REPORT OF INDEPENDENT REGISTERED PUBLIC ACCOUNTING FIRM |
To the Board of Trustees of
Manager Directed Portfolios
and the Shareholders of the
Hood River Small-Cap Growth Fund
We have audited the accompanying statement of assets and liabilities of the Hood River Small-Cap Growth Fund (the “Fund”), a series of Manager Directed Portfolios (formerly The Roxbury Funds), including the schedule of investments, as of June 30, 2016, and the related statement of operations for the year then ended, the statements of changes in net assets for each of the years in the two-year period then ended and the financial highlights for each of the years and period presented in the five-year period then ended. These financial statements and financial highlights are the responsibility of the Fund’s management. Our responsibility is to express an opinion on these financial statements and financial highlights based on our audits.
We conducted our audits in accordance with the standards of the Public Company Accounting Oversight Board (United States). Those standards require that we plan and perform the audits to obtain reasonable assurance about whether the financial statements and financial highlights are free of material misstatement. An audit includes examining, on a test basis, evidence supporting the amounts and disclosures in the financial statements. Our procedures included confirmation of securities owned as of June 30, 2016, by correspondence with the custodian. An audit also includes assessing the accounting principles used and significant estimates made by management, as well as evaluating the overall financial statement presentation. We believe that our audits provide a reasonable basis for our opinion.
In our opinion, the financial statements and financial highlights referred to above present fairly, in all material respects, the financial position of the Hood River Small-Cap Growth as of June 30, 2016, and the results of its operations for the year then ended, the changes in its net assets for each of the years in the two-year period then ended and its financial highlights for each of the years and period presented in the five-year period then ended, in conformity with accounting principles generally accepted in the United States of America.

BBD, LLP
Philadelphia, Pennsylvania
August 26, 2016
31
Hood River Small-Cap Growth Fund
| EXPENSE EXAMPLE |
| June 30, 2016 (Unaudited) |
As a shareholder of the Fund, you incur two types of costs: (1) transaction costs including sales charges (loads) and redemption fees, if applicable; and (2) ongoing costs, including management fees; distribution and/or service (12b-1 fees); and other Fund expenses. This Example is intended to help you understand your ongoing costs (in dollars) of investing in the Fund and to compare these costs with the ongoing costs of investing in other mutual funds.
The Example is based on an investment of $1,000 invested at the beginning of the period indicated and held for the entire period from January 1, 2016 to June 30, 2016.
Actual Expenses
The information in the table under the heading “Actual” provides information about actual account values and actual expenses. You may use the information in these columns together with the amount you invested, to estimate the expenses that you paid over the period. Simply divide your account value by $1,000 (for example, an $8,600 account value divided by $1,000 = 8.6), then multiply the result by the number in the row entitled “Expenses Paid During Period” to estimate the expenses you paid on your account during this period. There are some account fees that are charged to certain types of accounts, such as Individual Retirement Accounts (generally, a $15 fee is charged to the account annually) that would increase the amount of expenses paid on your account. The example below does not include portfolio trading commissions and related expenses and other extraordinary expenses as determined under generally accepted accounting principles.
Hypothetical Example for Comparison Purposes
The information in the table under the heading “Hypothetical (5% return before expenses)” provides information about hypothetical account values and hypothetical expenses based on the Fund’s actual expense ratio and assumed rate of return of 5% per year before expenses, which is not the Fund’s actual return. The hypothetical account values and expenses may not be used to estimate the actual ending account balance or expenses you paid for the period. You may use this information to compare the ongoing costs of investing in the Fund and other funds. To do so, compare this 5% hypothetical example with the 5% hypothetical examples that appear in the shareholder reports of the other funds. As noted above, there are some account fees that are charged to certain types of accounts that would increase the amount of expense paid on your account.
Please note that the expenses shown in the table are meant to highlight your ongoing costs only and do not reflect any transaction costs, such as sales charges (loads), redemption fees, or exchange fees. Therefore, the information under the heading “Hypothetical (5% return before expenses)” is useful in comparing ongoing costs only, and will not help you determine the relative total costs of owning different funds. In addition, if these transactional costs were included, your costs would have been higher.
32
Hood River Small-Cap Growth Fund
| EXPENSE EXAMPLE (Continued) |
| June 30, 2016 (Unaudited) |
| Beginning | Ending | Expenses Paid | |
| Account Value | Account Value | During Period(1) | |
1/1/2016 | 6/30/2016 | 1/1/2016 – 6/30/2016 | |
| Actual | |||
| Investor Class | $1,000.00 | $ 958.90 | $6.53 |
| Institutional Class | $1,000.00 | $ 960.30 | $5.31 |
| Hypothetical (5% return | |||
| before expenses) | |||
| Investor Class | $1,000.00 | $1,018.20 | $6.72 |
| Institutional Class | $1,000.00 | $1,019.44 | $5.47 |
(1) | Expenses are equal to the Investor Class and Institutional Class fund shares’ annualized expense ratios of 1.34% and 1.09%, respectively, multiplied by the average account value over the period, multiplied by 182/366 (to reflect the period). |
��
33
Ho6 od River Small-Cap Growth Fund
| NOTICE TO SHAREHOLDERS |
| at June 30, 2016 (Unaudited) |
How to Obtain a Copy of the Fund’s Proxy Voting Policies
A description of the policies and procedures that the Fund uses to determine how to vote proxies relating to portfolio securities is available without charge, upon request, by calling 1-800-497-2960 or on the U.S. Securities and Exchange Commission’s (“SEC”) website at http://www.sec.gov.
How to Obtain a Copy of the Fund’s Proxy Voting Records for the most recent 12-Month Period Ended June 30
Information regarding how the Fund voted proxies relating to portfolio securities during the most recent 12-month period ended June 30 is available no later than August 31 without charge, upon request, by calling 1-800-497-2960. Furthermore, you can obtain the Fund’s proxy voting records on the SEC’s website at http://www.sec.gov.
Quarterly Filings on Form N-Q
The Fund files its complete schedule of portfolio holdings with the SEC for the first and third quarters of each fiscal year on Form N-Q. The Fund’s Form N-Q is available on the SEC’s website at http://www.sec.gov. The Fund’s Form N-Q may be reviewed and copied at the SEC’s Public Reference Room in Washington, DC, and information on the operation of the Public Reference Room may be obtained by calling 1-202-551-8090. Information included in the Fund’s Form N-Q is also available, upon request, by calling 1-800-497-2960.
Householding
In an effort to decrease costs, the Fund intends to reduce the number of duplicate prospectuses and annual and semi-annual reports you receive by sending only one copy of each to those addresses shared by two or more accounts and to shareholders the Transfer Agent reasonably believes are from the same family or household. Once implemented, if you would like to discontinue householding for your accounts, please call toll-free at 1-800-497-2960 to request individual copies of these documents. Once the Transfer Agent receives notice to stop householding, the Transfer Agent will begin sending individual copies thirty days after receiving your request. This policy does not apply to account statements.
34
Hood River Small-Cap Growth Fund
| MANAGEMENT |
| (Unaudited) |
This chart provides information about the Trustees and Officers who oversee the Fund. Officers elected by the Trustees manage the day-to-day operations of the Fund and execute policies formulated by the Trustees. The information in the chart is as of July 1, 2016.
| Number of | ||||
| Portfolios | Other | |||
| Position(s) Held | in Fund | Directorships | ||
| Name | with the Trust | Complex | Held by | |
| (Year of Birth) | and Length of | Principal Occupation(s) | Overseen by | Trustee During |
and Address(1) | Time Served(3) | During Past Five Years | Trustee | Past Five Years |
| INTERESTED TRUSTEE | ||||
| James R. | Trustee since | President and CEO, | 2 | None |
Schoenike(2) | July 2016 | Board of Managers, | ||
| (Born 1959) | Quasar Distributors, LLC, | |||
| since 2000 | ||||
| INDEPENDENT TRUSTEES | ||||
| Gaylord B. Lyman | Trustee and Audit | Managing Director of | 2 | None |
| (Born 1962) | Committee | Kohala Capital Partners, LLC, | ||
| Chairman, since | since 2011; Vice President, | |||
| April 2015 | Becker Capital Management, | |||
| Inc. (1997 – 2011) | ||||
| Scott Craven Jones | Trustee since | Managing Director, | 2 | Director, |
| (Born 1962) | July 2016 | Carne Global Financial | Guestlogix Inc. | |
| Services (US) LLC, since 2013; | (a provider of | |||
| Adviser, Wanzenburg Partners | ancillary-focused | |||
| (2012 – 2013); Chief Operating | technology to the | |||
| Officer and Chief Financial | travel industry), | |||
| Officer, Aurora Investment | since 2015 | |||
| Management (2010 – 2012) | ||||
| Lawrence T. | Trustee since | Vice President and Secretary, | 2 | None |
| Greenberg | July 2016 | The Motley Fool Funds Trust, | ||
| (Born 1963) | since 2009; Senior Vice President | |||
| and Chief Legal Officer, | ||||
| The Motley Fool Holdings, Inc., | ||||
| since 1996; General Counsel, | ||||
| Motley Fool Asset Management, | ||||
| LLC, since 2008; Manager, | ||||
| Motley Fool Wealth Management, | ||||
| LLC, since 2013; Adjunct Professor, | ||||
| Washington College of Law, | ||||
| American University, since 2006 |
(1) | The address of each Trustee as it relates to the Trust’s business is c/o U.S. Bancorp Fund Services LLC, 615 East Michigan Street, Milwaukee, WI 53202. |
(2) | Mr. Schoenike is an Interested Trustee by virtue of his position as President of Quasar Distributors, LLC, the Fund’s distributor. |
(3) | Each Trustee serves during the continued lifetime of the Trust until he dies, resigns, is declared bankrupt or incompetent by a court of competent jurisdiction, or is removed. |
35
Hood River Small-Cap Growth Fund
| MANAGEMENT (Continued) |
| (Unaudited) |
| Name | Position(s) Held with | |
| (Year of Birth) | the Trust and Length | |
and Address | of Time Served(3) | Principal Occupation(s) During Past Five Years |
Douglas J. Neilson(1) | President and Principal | Vice President, Compliance and Administration, |
| (Born 1975) | Executive Officer, | USBFS, since 2001 |
| since July 1, 2016 | ||
Matthew J. McVoy(1) | Treasurer and Principal | Assistant Vice President, Compliance and |
| (Born 1980) | Financial Officer, | Administration, USBFS, since 2005 |
| since July 1, 2016 | ||
Nathan R. Bentley, CPA(1) | Assistant Treasurer, | Officer, Compliance and Administration, USBFS, |
| (Born 1983) | since July 1, 2016 | since 2012; Master of Science, Accounting Graduate, |
| University of Wisconsin-Milwaukee (2010 – 2012) | ||
Gerard Scarpati(2) | Chief Compliance | Compliance Director, Vigilant, since 2010 |
| (Born 1955) | Officer and | |
| Anti-Money Laundering | ||
| Compliance Officer, | ||
| since July 1, 2016 | ||
Carolyn Mead(2) | Secretary, | Compliance Director, Vigilant Compliance, LLC, |
| (Born 1957) | since July 1, 2016 | since 2015; Counsel at SEI Investments Global Funds |
| Services (2007 – 2014) |
(1) | The mailing address of this officer is: 615 East Michigan Street, Milwaukee, Wisconsin 53202. |
(2) | The mailing address of this officer is: 223 Wilmington West Chester Pike, Suite 216, Chadds Ford, Pennsylvania 19317. |
(3) | Each officer is elected annually and serves until his or her successor has been duly elected and qualified. |
The Statement of Additional Information includes additional information about the Fund’s Trustees and Officers and is available, without charge, upon request by calling 1-800-497-2960.
36
Hood River Small-Cap Growth Fund
| PRIVACY NOTICE |
| FACTS | WHAT DOES THE HOOD RIVER SMALL-CAP GROWTH FUND (“THE FUND”) DO WITH YOUR PERSONAL INFORMATION? | |
Why? | Financial companies choose how they share your personal information. Federal law gives consumers the right to limit some but not all sharing. Federal law also requires us to tell you how we collect, share, and protect your personal information. Please read this notice carefully to understand what we do. | |
| What? | The types of personal information we collect and share depends on the product or service you have with us. This information can include: | |
| • Social Security number | ||
| • account balances | ||
| • account transactions | ||
| • transaction history | ||
| • wire transfer instructions | ||
| • checking account information | ||
When you are no longer our customer, we continue to share your information as described in this notice. | ||
| How? | All financial companies need to share customers’ personal information to run their everyday business. In the section below, we list the reasons financial companies can share their customers’ personal information; the reasons the Fund chooses to share; and whether you can limit this sharing. |
| Does the | Can you limit | |
| Reasons we can share your personal information | Fund share? | this sharing? |
For our everyday business purposes – such as to process your | Yes | No |
| transactions, maintain your account(s), respond to court orders | ||
| and legal investigations, or report to credit bureaus. | ||
| For our marketing purposes – | Yes | No |
| to offer our products and services to you | ||
| For joint marketing with other financial companies | No | We do not share |
For our affiliates’ everyday business purposes – | Yes | No |
| information about your transactions and experiences | ||
For our affiliates’ everyday business purposes – | No | We do not share |
| information about your creditworthiness | ||
For our affiliates to market to you – The Fund may share | Yes | Yes |
| information with our affiliates about shareholders or shareholder | ||
| accounts in order to make shareholders aware of services and | ||
| products which the Fund thinks may be of interest or value to them | ||
| For nonaffiliates to market to you | No | We do not share |
| To Limit the | To limit our sharing, please notify us in the following way: | |
| Fund’s Sharing | • Contact the Fund by calling our toll-free phone number 1-800-497-2960. | |
| Your choice to limit the personal information the Fund shares with its affiliates will apply until you request a change. If you are a new customer, we can begin sharing your information with our affiliates for marketing purposes 30 days from the date we sent this notice. When you are no longer a customer, we continue to share your information as described in this notice. | ||
| Questions? | If you have any questions or concerns regarding this notice or the Fund’s privacy policies, please contact us at 800-497-2960. |
37
Hood River Small-Cap Growth Fund
| PRIVACY NOTICE (Continued) |
State Disclosures – In addition to the rights described below and in this notice, you may have other rights under state laws. We will comply with the applicable state laws with respect to our information practices.
California and Vermont have other protections under state law. If you primary mailing address is in California or Vermont, we will not share your financial information that we collect except as permitted by law, including, for example, with your consent or to service your account. We will also not use your information for joint marketing purposes. We do not share customer information with third parties except as permitted by law.
| Who we are | ||
| Who is providing | The Fund is an open-end management investment company registered under the | |
| this notice? | Investment Company Act of 1940. | |
| What we do | ||
| How does the Fund | To protect your personal information from unauthorized access and use, we use security measures that comply with federal law. These | |
| protect my personal | measures include computer safeguards and secured files and buildings. | |
| information? | ||
| How does the Fund | We collect your personal information, for example, when you | |
| collect my personal | • open an account | |
| information? | • provide account information | |
| • give us your contact information | ||
| • make a wire transfer | ||
| • tell us where to send the money | ||
| We collect your personal information from others, such as credit bureaus, affiliates or other companies. | ||
| Why can’t I limit | Federal law gives you the right to limit only | |
| all sharing? | • sharing for affiliates’ everyday business purposes – information about your creditworthiness | |
| • affiliates from using your information to market to you | ||
| • sharing for nonaffiliates to market to you | ||
| State laws and individual companies may give you additional rights to limit sharing. | ||
| Definitions | ||
| Affiliates | Companies related by common ownership or control. They can be financial and nonfinancial companies. | |
• The Fund’s affiliates are Hood River Capital Management LLC, investment advisor to the Hood River Small-Cap Growth Fund. | ||
| Nonaffiliates | Companies not related by common ownership or control. They can be financial and nonfinancial companies. | |
• The Fund does not share with nonaffiliates so they can market to you. | ||
| Joint marketing | A formal agreement between nonaffiliated financial companies that together market financial products or services to you. | |
• The Fund does not jointly market. |
38
(This Page Intentionally Left Blank.)
Investment Advisor
Hood River Capital Management LLC
1 SW Columbia Street, Suite 630
Portland, OR 97258
Distributor
Quasar Distributors, LLC
615 East Michigan Street, 4th Floor
Milwaukee, WI 53202
Transfer Agent
U.S. Bancorp Fund Services, LLC
615 East Michigan Street
Milwaukee, WI 53202
(800) 497-2960
Custodian
U.S. Bank National Association
Custody Operations
1555 North River Center Drive, Suite 302
Milwaukee, WI 53212
Independent Registered Public Accounting Firm
BBD, LLP
1835 Market Street, 26th floor
Philadelphia, PA 19103
Legal Counsel
Godfrey & Kahn S.C.
833 East Michigan Street, Suite 1800
Milwaukee, WI 53202
This report is intended for shareholders of the Fund and may not be used as sales literature unless preceded or accompanied by a current prospectus.
Past performance results shown in this report should not be considered a representation of future performance. Share price and returns will fluctuate so that shares, when redeemed, may be worth more or less than their original cost. Statements and other information herein are dated and are subject to change.
Mar Vista Strategic Growth Fund
Annual Report
June 30, 2016
Mar Vista Strategic Growth Fund
| Table of Contents | ||
| Letter to Shareholders | 3 | |
| Investment Highlights | 5 | |
| Sector Allocation of Portfolio Assets | 8 | |
| Schedule of Investments | 9 | |
| Statement of Assets and Liabilities | 13 | |
| Statement of Operations | 14 | |
| Statements of Changes in Net Assets | 15 | |
| Financial Highlights | 16 | |
| Notes to the Financial Statements | 18 | |
| Report of Independent Registered Public Accounting Firm | 26 | |
| Expense Example | 27 | |
| Notice to Shareholders | 29 | |
| Management | 30 | |
| Privacy Notice | 32 |
Mar Vista Strategic Growth Fund
Dear Shareholders,
As investors look back on the most recent twelve months, it will be remembered as a period of volatility and the end of six consecutive fiscal years of positive U.S. equity market returns across the entire market capitalization spectrum. While the large-cap indexes posted slightly positive returns and have now extended their streak to seven consecutive positive fiscal years, small-cap stocks were not as fortunate. In fact, small-cap stocks underperformed large-cap stocks by nearly 10%. Even within small-cap stocks there was significant variability of returns. Small-cap value indexes delivered modestly negative returns, but small-cap growth indexes experienced negative returns greater than 10%. In last year’s Letter to Shareholders, we raised concern about the health of the bull market and the likelihood of increased overall risk in stocks. It appears that our caution was well founded and helps to explain the muted returns from the U.S. equity market this year.
While the fiscal year returns were muted, the underlying quarterly performance demonstrated a dramatic see-saw battle between optimism and pessimism. For the quarter ended September 30, 2015, most major stock markets entered into correction or bear market territory. Investor angst appeared to be centered on weaker corporate earnings, unpredictable monetary policy and tighter credit market conditions. In the fourth quarter of 2015, stocks around the globe rebounded, largely erasing the declines from the previous three months as China’s outlook improved coupled with the Federal Reserve determining that the strength in jobs, housing and services warranted a shift in interest rate policy. After a historically tumultuous start to 2016, equity markets around the globe staged a massive comeback to end Q1 2016 on a positive note. Investors’ concern over global growth, central bank policy and an earnings recession saw intra-quarter declines of more than 10% before markets rebounded after the Federal Reserve’s decision to pause interest rate hikes and a recovery in energy prices of nearly 40%. Up until the fateful Brexit referendum, equity markets in the second quarter of 2016 largely held their recovery from February’s nadir and managed to post positive returns for the quarter despite dramatic intra-quarter volatility. The period will be remembered, however, for the tumultuous response to the United Kingdom’s vote to leave the European Union. As investors struggle to assess its long-term geopolitical and economic impact, capital has rushed into “safe” assets, if one can define “safe” as negative yielding government and corporate debt with maturities as long as fifty years in the case of Swiss government bonds.
The Mar Vista Strategic Growth Fund gained 4.44% over the most recent twelve months ended June 30, 2016. That compares with a gain of 3.02% for the Russell 1000® Growth Index, a gain of 3.99% for the S&P 500® Index and a -2.37% return for the average large-cap growth fund in the Morningstar© universe. The Fund’s return was positively impacted by strong stock selection in energy, financials and healthcare, but stock selection in consumer discretionary, consumer staples and industrials detracted from returns. For a more detailed review of the Mar Vista Strategic Growth Fund please see the investment review on page 5.
3
Mar Vista Strategic Growth Fund
The above comments reflect general views regarding the market and the economy, were current as of the date of this letter, and are subject to change at any time.
Returns represent past performance and include changes in share price and reinvestment of dividends and capital gains. The primary benchmark is the Russell 1000® Growth Index, defined as an unmanaged, capitalization weighted index of those Russell 1000 companies with higher price-to-book ratios and higher forecasted growth values. The S&P 500® Index is defined as an unmanaged, capitalization weighted index of the common stocks of 500 major U.S. corporations. Index returns include dividends and/or interest income and, unlike composite returns, do not reflect fees or expenses. In addition, unlike the Fund, which periodically maintains a significant cash position, the Russell 1000® Growth Index and S&P 500® Index are fully invested. Each Morningstar category average represents a universe of funds with similar investment objectives. ©Morningstar, Inc. All Rights Reserved. The information contained herein: 1) is proprietary to Morningstar; 2) may not be copied or distributed and 3) is not warranted to be accurate, complete or timely. Neither Morningstar nor its content providers are responsible for any damages or losses arising from any use of this information. Past performance is no guarantee of future results. It is not possible to invest directly in an index. The current performance of the Fund may be lower or higher than figures shown. Returns and share price will fluctuate, and redemption value may be more or less than original cost. Performance information current to the most recent month-end is available by calling (844) 737-MVIP (6847).
4
Mar Vista Strategic Growth Fund
Investment Highlights
How did the Fund perform during the annual period ended June 30, 2016?
The Mar Vista Strategic Growth Fund was up 4.44% for the twelve months ended June 30, 2016 compared to 3.02% for the Fund’s benchmark, the Russell 1000® Growth Index for the same period. Strong stock selection contributed to the Fund’s outperformance, while sector allocations negatively impacted results.
What key factors were responsible for the Fund’s performance during the reporting period?
Companies that are anti-fragile typically thrive in uncertain environments due to their recurring revenue streams and predictable earnings. The Fund’s performance over the last twelve months was led by a cohort of businesses that represent these characteristics. Johnson & Johnson (+28%), American Tower (+24%), Unilever (+21%), Markel (+19%) and Honeywell International (+17%) contributed the most to performance, while Sensata (-34%), Liberty Global (-30%), Advance Auto Parts (-25%), Allergan (-24%) and Apple (-22%) detracted from results during the period.
Which equity market sectors most significantly affected Fund performance?
Sectors that drove the Fund’s performance during the year included financials, healthcare and technology. Within the financial sector, our significant investment in American Tower and specialty insurance companies positively affected results. Additionally, the lack of exposure to traditional banks contributed to performance. Within healthcare and technology, strong stock selection and sector positioning added value during the period. The Fund’s avoidance of excessive valuations in biotechnology and social media added value during the year. Investments within consumer staples and discretionary detracted from results. The chase for income yield pushed many investments in the consumer sectors to excessive valuations. When business valuations disconnect with fundamentals, the Fund will typically underperform. Finally, the lack of exposure to telecommunication services detracted from results.
What are you expecting from the equity markets over the upcoming year?
The recent market appreciation reduced the portfolio’s average discount to intrinsic value to 12%, which is well below the 20-35% historical averages. As a result, the investment team expects future returns to be primarily influenced by the compounding growth rates of the portfolio companies and less from stock price convergence with intrinsic value. Given the team’s emphasis on capital protection and the elevated valuations for the overall market, the investment team will remain prudent in allocating the Fund’s capital. Portfolio cash levels, at around 8%, are higher than the historic averages of 2%. Should market disruptions provide the team with better valuations, they will allocate the capital expeditiously.
5
Mar Vista Strategic Growth Fund
The Fund’s primary benchmark is the Russell 1000® Growth Index, defined as an unmanaged, capitalization weighted index of those Russell 1000 companies with higher price-to-book ratios and higher forecasted growth values. Index returns include dividends and/or interest income and, unlike Fund returns, do not reflect fees or expenses. In addition, unlike the Fund, which periodically maintains a significant cash position, the Russell 1000® Growth Index is fully invested. Investors cannot directly invest in an index. “Average Discount to Intrinsic Value” The Fund’s average percentage difference between a business’ stock price and our estimate of its intrinsic value (calculated as Estimated Intrinsic Value/Price - 1).
The Strategic Growth Fund invests in growth companies which can be more sensitive to the company’s earnings and more volatile than the stock market in general. The Fund may invest in small/mid-cap securities which have less liquidity and more volatility than large capitalization stocks. The Fund may also invest in foreign securities which are subject to risk including currency fluctuations, economic and political change and differing accounting standards. The Fund may invest in derivatives and IPOs, which are highly volatile. Additional risk information may be found in the prospectus. For a complete list of holdings, see the Schedule of Investments on page 9.
6
Mar Vista Strategic Growth Fund
Comparison of the Change in Value of a Hypothetical $25,000 Investment
in the Mar Vista Strategic Growth Fund – Institutional Class and
Russell 1000® Growth Index
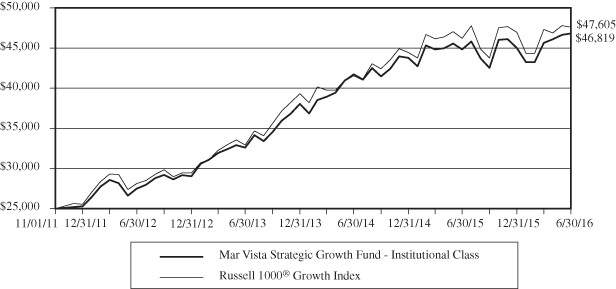
| Annualized | ||
| Since Inception | ||
| Total Return Periods Ended June 30, 2016: | 1 Year | (11/1/2011) |
| Mar Vista Strategic Growth Fund (No Load) | 4.44% | 14.40% |
Russell 1000® Growth Index | 3.02% | 14.81% |
| Expense ratio: 0.90% |
Performance data quoted represents past performance; past performance does not guarantee future results. The investment return and principal value of an investment will fluctuate so that an investor’s shares, when redeemed, may be worth more or less than their original cost. Current performance of the Fund may be lower or higher than the performance quoted. Performance data current to the most recent month end may be obtained by calling 1-844-737-6847.
This chart illustrates the performance of a hypothetical $25,000 investment made in the Fund on November 1, 2011, the Fund’s inception date. Returns reflect the reinvestment of dividends and capital gain distributions. The performance data and expense ratios shown reflect a contractual fee waiver made by the Adviser, currently through December 31, 2020. In the absence of fee waivers, returns would be reduced. The performance data and graph do not reflect the deduction of taxes that a shareholder may pay on dividends, capital gain distributions, or redemption of Fund shares.
The Russell 1000® Growth Index measures the performance of the large-cap growth segment of the U.S. equity universe. It includes those Russell 1000® Index companies with high price-to-book ratios and higher forecasted growth values.
7
Mar Vista Strategic Growth Fund
| SECTOR ALLOCATION OF PORTFOLIO ASSETS |
| at June 30, 2016 (Unaudited) |
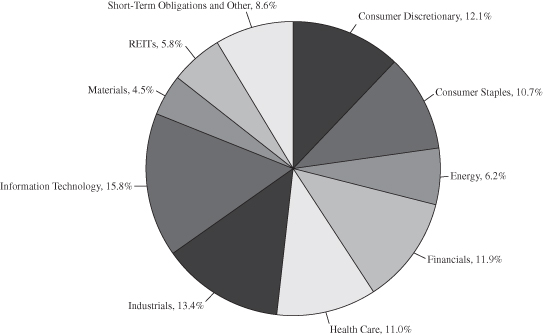
Percentages represent market value as a percentage of net assets.
8
Mar Vista Strategic Growth Fund
| SCHEDULE OF INVESTMENTS |
| at June 30, 2016 |
| COMMON STOCKS – 85.6% | Shares | Value | ||||||
| CONSUMER DISCRETIONARY – 12.1% | ||||||||
| Hotels, Restaurants & Leisure – 3.0% | ||||||||
| Starbucks Corp. | 13,123 | $ | 749,586 | |||||
| Internet & Catalog Retail – 1.5% | ||||||||
| Amazon.com, Inc. (a) | 533 | 381,425 | ||||||
| Media – 1.4% | ||||||||
| Liberty Global PLC (a)(c) | 2,998 | 85,893 | ||||||
| Liberty Global PLC LiLAC (a)(c) | 8,455 | 274,701 | ||||||
| 360,594 | ||||||||
| Specialty Retail – 4.8% | ||||||||
| O’Reilly Automotive, Inc. (a) | 1,432 | 388,215 | ||||||
| The TJX Companies, Inc. | 10,775 | 832,153 | ||||||
| 1,220,368 | ||||||||
| Textiles, Apparel & Luxury Goods – 1.4% | ||||||||
| NIKE, Inc. | 6,498 | 358,690 | ||||||
| TOTAL CONSUMER DISCRETIONARY | 3,070,663 | |||||||
| CONSUMER STAPLES – 10.7% | ||||||||
| Beverages – 3.9% | ||||||||
| PepsiCo, Inc. | 9,419 | 997,849 | ||||||
| Food Products – 3.3% | ||||||||
| Mondelez International, Inc. | 18,193 | 827,964 | ||||||
| Personal Products – 3.5% | ||||||||
| Unilever NV – ADR (c) | 18,814 | 883,129 | ||||||
| TOTAL CONSUMER STAPLES | 2,708,942 | |||||||
| ENERGY – 6.2% | ||||||||
| Energy Equipment & Services – 6.2% | ||||||||
| Core Laboratories NV (c) | 6,235 | 772,454 | ||||||
| Schlumberger Ltd. (c) | 10,130 | 801,081 | ||||||
| TOTAL ENERGY | 1,573,535 | |||||||
The accompanying notes are an integral part of these financial statements.
9
Mar Vista Strategic Growth Fund
| SCHEDULE OF INVESTMENTS (Continued) |
| at June 30, 2016 |
| COMMON STOCKS – 85.6% (Continued) | Shares | Value | ||||||
| FINANCIALS – 11.9% | ||||||||
| Banks – 2.4% | ||||||||
| U.S. Bancorp | 15,014 | $ | 605,515 | |||||
| Diversified Financial Services – 5.4% | ||||||||
| Berkshire Hathaway, Inc. (a) | 9,431 | 1,365,514 | ||||||
| Insurance – 4.1% | ||||||||
| Markel Corp. (a) | 1,090 | 1,038,530 | ||||||
| TOTAL FINANCIALS | 3,009,559 | |||||||
| HEALTH CARE – 11.0% | ||||||||
| Life Sciences Tools & Services – 3.6% | ||||||||
| Mettler-Toledo International, Inc. (a) | 2,499 | 911,935 | ||||||
| Pharmaceuticals – 7.4% | ||||||||
| Allergan PLC (a)(c) | 4,831 | 1,116,336 | ||||||
| Johnson & Johnson | 6,232 | 755,941 | ||||||
| 1,872,277 | ||||||||
| TOTAL HEALTH CARE | 2,784,212 | |||||||
| INDUSTRIALS – 13.4% | ||||||||
| Aerospace & Defense – 9.6% | ||||||||
| B/E Aerospace, Inc. | 9,755 | 450,437 | ||||||
| Honeywell International, Inc. | 8,564 | 996,165 | ||||||
| TransDigm Group, Inc. (a) | 3,800 | 1,002,022 | ||||||
| 2,448,624 | ||||||||
| Electrical Equipment – 1.5% | ||||||||
| Sensata Technologies Holding NV (a)(c) | 10,599 | 369,799 | ||||||
| Road & Rail – 2.3% | ||||||||
| Kansas City Southern | 6,587 | 593,423 | ||||||
| TOTAL INDUSTRIALS | 3,411,846 | |||||||
The accompanying notes are an integral part of these financial statements.
10
Mar Vista Strategic Growth Fund
| SCHEDULE OF INVESTMENTS (Continued) |
| at June 30, 2016 |
| COMMON STOCKS – 85.6% (Continued) | Shares | Value | ||||||
| INFORMATION TECHNOLOGY – 15.8% | ||||||||
| Internet Software & Services – 3.2% | ||||||||
| Alphabet, Inc. (a) | 1,183 | $ | 818,754 | |||||
| IT Services – 2.0% | ||||||||
| Visa, Inc. | 6,828 | 506,433 | ||||||
| Software – 7.7% | ||||||||
| Adobe Systems, Inc. (a) | 5,673 | 543,416 | ||||||
| Intuit, Inc. | 6,800 | 758,948 | ||||||
| Oracle Corp. | 15,945 | 652,629 | ||||||
| 1,954,993 | ||||||||
| Technology Hardware, Storage & Peripherals – 2.9% | ||||||||
| Apple, Inc. | 7,778 | 743,577 | ||||||
| TOTAL INFORMATION TECHNOLOGY | 4,023,757 | |||||||
| MATERIALS – 4.5% | ||||||||
| Chemicals – 4.5% | ||||||||
| Ecolab, Inc. | 6,484 | 769,003 | ||||||
| Praxair, Inc. | 3,411 | 383,362 | ||||||
| TOTAL MATERIALS | 1,152,365 | |||||||
| TOTAL COMMON STOCKS | ||||||||
| (Cost $18,059,489) | 21,734,879 | |||||||
| REITs – 5.8% | ||||||||
| American Tower Corp. | 12,872 | 1,462,388 | ||||||
| TOTAL REITs | ||||||||
| (Cost $1,038,826) | 1,462,388 | |||||||
The accompanying notes are an integral part of these financial statements.
11
Mar Vista Strategic Growth Fund
| SCHEDULE OF INVESTMENTS (Continued) |
| at June 30, 2016 |
| SHORT-TERM INVESTMENTS – 8.3% | Shares | Value | ||||||
| MONEY MARKET FUNDS – 8.3% | ||||||||
| BlackRock Liquidity Funds TempFund | ||||||||
| Portfolio – Class I, 0.44% (b) | 2,104,167 | $ | 2,104,167 | |||||
| TOTAL SHORT-TERM INVESTMENTS | ||||||||
| (Cost $2,104,167) | 2,104,167 | |||||||
| TOTAL INVESTMENTS | ||||||||
| (Cost $21,202,482) – 99.7% | 25,301,434 | |||||||
| Other Assets in Excess of Liabilities – 0.3% | 87,031 | |||||||
| TOTAL NET ASSETS – 100.00% | $ | 25,388,465 | ||||||
Percentages are stated as a percent of net assets.
ADR – American Depositary Receipt
PLC – Public Limited Company
LiLAC – Liberty Latin America and Caribbean Group
| (a) | Non-income producing security. |
| (b) | The rate shown represents the fund’s 7-day yield as of June 30, 2016. |
| (c) | U.S. traded security of a foreign issuer or corporation. |
The accompanying notes are an integral part of these financial statements.
12
Mar Vista Strategic Growth Fund
| STATEMENT OF ASSETS AND LIABILITIES |
| at June 30, 2016 |
| Assets: | ||||
| Investments, at value (cost of $21,202,482) | $ | 25,301,434 | ||
| Receivables: | ||||
| Fund shares sold | 100,000 | |||
| Dividends and interest | 25,689 | |||
| Prepaid expenses | 35,955 | |||
| Total assets | 25,463,078 | |||
| Liabilities: | ||||
| Payables: | ||||
| Fund shares redeemed | 15,993 | |||
| Advisory fee | 14,091 | |||
| Administration and accounting fees | 8,330 | |||
| Reports to shareholders | 9,183 | |||
| Custody fees | 1,569 | |||
| Transfer agent fees and expenses | 1,558 | |||
| Other accrued expenses | 23,889 | |||
| Total liabilities | 74,613 | |||
| Net assets | $ | 25,388,465 | ||
| Net assets consist of: | ||||
| Capital stock | $ | 21,131,634 | ||
| Accumulated net investment income | 28,308 | |||
| Accumulated net realized gain on investments | 129,571 | |||
| Net unrealized appreciation (depreciation) on: | ||||
| Investments | 4,098,952 | |||
| Net assets | $ | 25,388,465 | ||
| Institutional Shares: | ||||
| Net assets applicable to outstanding Institutional Shares | $ | 25,388,465 | ||
| Shares issued (Unlimited number of beneficial | ||||
| interest authorized, $0.01 par value) | 1,633,825 | |||
| Net asset value, offering price and redemption price per share | $ | 15.54 | ||
The accompanying notes are an integral part of these financial statements.
13
Mar Vista Strategic Growth Fund
| STATEMENT OF OPERATIONS |
| For the Year Ended June 30, 2016 |
| Investment income: | ||||
| Dividends (net of foreign taxes withheld of $4,880) | $ | 248,487 | ||
| Interest | 3,977 | |||
| Total investment income | 252,464 | |||
| Expenses: | ||||
| Advisory fees (Note 4) | 173,251 | |||
| Administration and accounting fees (Note 4) | 65,201 | |||
| Transfer agent fees and expenses | 25,953 | |||
| Federal and state registration fees | 14,805 | |||
| Audit fees | 18,498 | |||
| Legal fees | 54,040 | |||
| Reports to shareholders | 9,855 | |||
| Trustees’ fees and expenses | 10,712 | |||
| Custody fees | 8,549 | |||
| Other | 21,637 | |||
| Total expenses before reimbursement from advisor | 402,501 | |||
| Expense waivers and reimbursement from advisor (Note 4) | (194,600 | ) | ||
| Total net expenses | 207,901 | |||
| Net investment income | 44,563 | |||
| Realized and unrealized gain on investments: | ||||
| Net realized gain on investments | 282,923 | |||
| Net change in unrealized appreciation (depreciation) on investments | 873,718 | |||
| Net realized and unrealized gain on investments | 1,156,641 | |||
| Net increase in net assets resulting from operations | $ | 1,201,204 | ||
The accompanying notes are an integral part of these financial statements.
14
Mar Vista Strategic Growth Fund
| STATEMENTS OF CHANGES IN NET ASSETS |
| Year Ended | Year Ended | |||||||
| June 30, 2016 | June 30, 2015 | |||||||
| Operations: | ||||||||
| Net investment income | $ | 44,563 | $ | 29,522 | ||||
| Net realized gain on investments | 282,923 | 1,113,325 | ||||||
| Net change in unrealized appreciation (depreciation) | ||||||||
| on investments | 873,718 | 77,734 | ||||||
| Net increase in net assets | ||||||||
| resulting from operations | 1,201,204 | 1,220,581 | ||||||
| Distributions to Shareholders From: | ||||||||
| Net investment income | (16,245 | ) | (57,714 | ) | ||||
| Net realized gains | (736,502 | ) | (1,045,970 | ) | ||||
| Total distributions | (752,747 | ) | (1,103,684 | ) | ||||
| Capital Share Transactions: | ||||||||
| Proceeds from shares sold | 10,210,921 | 7,088,871 | ||||||
| Proceeds from shares issued to holders | ||||||||
| in reinvestment of dividends | 590,635 | 1,065,759 | ||||||
| Cost of shares redeemed | (6,401,517 | ) | (1,409,539 | ) | ||||
| Redemption fees retained | 344 | — | ||||||
| Net increase in net assets from | ||||||||
| capital share transactions | 4,400,383 | 6,745,091 | ||||||
| Total increase in net assets | 4,848,840 | 6,861,988 | ||||||
| Net Assets: | ||||||||
| Beginning of year | 20,539,625 | 13,677,637 | ||||||
| End of year | $ | 25,388,465 | $ | 20,539,625 | ||||
| Accumulated net investment income | $ | 28,308 | $ | — | ||||
| Changes in Shares Outstanding: | ||||||||
| Shares sold | 692,934 | 466,994 | ||||||
| Proceeds from shares issued to holders | ||||||||
| in reinvestment of dividends | 39,455 | 71,003 | ||||||
| Shares redeemed | (432,926 | ) | (91,468 | ) | ||||
| Net increase in shares outstanding | 299,463 | 446,529 | ||||||
The accompanying notes are an integral part of these financial statements.
15
Mar Vista Strategic Growth Fund
| FINANCIAL HIGHLIGHTS |
For a capital share outstanding throughout each period
Institutional Shares
| Year Ended | Year Ended | Year Ended | Year Ended | Period Ended | ||||||||||||||||
| June 30, | June 30, | June 30, | June 30, | June 30, | ||||||||||||||||
| 2016 | 2015 | 2014 | 2013 | 2012* | ||||||||||||||||
| Net Asset Value – | ||||||||||||||||||||
| Beginning of Period | $ | 15.39 | $ | 15.41 | $ | 12.80 | $ | 11.00 | $ | 10.00 | ||||||||||
| Income from | ||||||||||||||||||||
| Investment Operations: | ||||||||||||||||||||
Net investment income1 | 0.03 | 0.04 | 0.08 | 0.10 | 0.08 | |||||||||||||||
| Net realized and unrealized | ||||||||||||||||||||
| gain on investments | 0.63 | 1.11 | 3.35 | 1.92 | 0.92 | |||||||||||||||
| Total from | ||||||||||||||||||||
| investment operations | 0.66 | 1.15 | 3.43 | 2.02 | 1.00 | |||||||||||||||
| Less Distributions: | ||||||||||||||||||||
| Dividends from net | ||||||||||||||||||||
| investment income | (0.01 | ) | (0.06 | ) | (0.15 | ) | (0.13 | ) | — | |||||||||||
| Distributions from | ||||||||||||||||||||
| net realized gains | (0.50 | ) | (1.11 | ) | (0.67 | ) | (0.09 | ) | — | |||||||||||
| Total distributions | (0.51 | ) | (1.17 | ) | (0.82 | ) | (0.22 | ) | — | |||||||||||
| Redemption fees | — | 2 | — | — | 2 | — | 2 | — | 2 | |||||||||||
| Net Asset Value – | ||||||||||||||||||||
| End of Period | $ | 15.54 | $ | 15.39 | $ | 15.41 | $ | 12.80 | $ | 11.00 | ||||||||||
| Total Return | 4.44 | % | 7.67 | % | 27.71 | % | 18.55 | % | 10.00 | %^ | ||||||||||
| * | Operations commenced on November 1, 2011. |
| + | Annualized |
| ^ | Not Annualized |
1 | The net investment income per share was calculated using the average shares outstanding method. |
2 | Amount is less than $0.01. |
The accompanying notes are an integral part of these financial statements.
16
Mar Vista Strategic Growth Fund
| FINANCIAL HIGHLIGHTS (Continued) |
For a capital share outstanding throughout each period
Institutional Shares
| Year Ended | Year Ended | Year Ended | Year Ended | Period Ended | ||||||||||||||||
| June 30, | June 30, | June 30, | June 30, | June 30, | ||||||||||||||||
| 2016 | 2015 | 2014 | 2013 | 2012* | ||||||||||||||||
| Ratios and Supplemental Data: | ||||||||||||||||||||
| Net assets, end | ||||||||||||||||||||
| of period (thousands) | $ | 25,388 | $ | 20,540 | $ | 13,678 | $ | 8,665 | $ | 6,483 | ||||||||||
| Ratio of operating expenses | ||||||||||||||||||||
| to average net assets: | ||||||||||||||||||||
| Before Waivers | ||||||||||||||||||||
| and Reimbursements | 1.74 | % | 2.23 | % | 2.79 | % | 3.99 | % | 4.85 | %+ | ||||||||||
| After Waivers | ||||||||||||||||||||
| and Reimbursements | 0.90 | % | 0.90 | % | 0.90 | % | 0.90 | % | 0.90 | %+ | ||||||||||
| Ratio of net investment income | ||||||||||||||||||||
| (loss) to average net assets: | ||||||||||||||||||||
| Before Waivers | ||||||||||||||||||||
| and Reimbursements | (0.65 | )% | (1.15 | )% | (1.31 | )% | (2.27 | )% | (2.83 | )%+ | ||||||||||
| After Waivers | ||||||||||||||||||||
| and Reimbursements | 0.19 | % | 0.18 | % | 0.58 | % | 0.82 | % | 1.12 | %+ | ||||||||||
| Portfolio turnover rate | 40 | % | 33 | % | 31 | % | 59 | % | 27 | %^ | ||||||||||
| * | Operations commenced on November 1, 2011. |
| + | Annualized |
| ^ | Not Annualized |
1 | The net investment income per share was calculated using the average shares outstanding method. |
2 | Amount is less than $0.01. |
The accompanying notes are an integral part of these financial statements.
17
Mar Vista Strategic Growth Fund
| NOTES TO FINANCIAL STATEMENTS |
| June 30, 2016 |
NOTE 1 – ORGANIZATION
The Mar Vista Strategic Growth Fund (formerly, the Roxbury/Mar Vista Strategic Growth Fund) (the “Strategic Growth Fund” or the “Fund”) is a series of Manager Directed Portfolios (formerly, The Roxbury Funds) (the “Trust”). The Trust is registered under the Investment Company Act of 1940, as amended (the “1940 Act”), as a diversified open-end investment management company and was organized as a Delaware statutory trust on April 4, 2006. The investment objective of the Fund is long-term growth of capital. The Fund commenced operations on November 1, 2011, and offers Institutional Shares.
NOTE 2 – SIGNIFICANT ACCOUNTING POLICIES
The following is a summary of significant accounting policies consistently followed by the Fund. These policies are in conformity with U.S. generally accepted accounting principles (“GAAP”).
| A. | Security Valuation: All investments in securities are recorded at their estimated fair value, as described in Note 3. | |
| B. | Federal Income Taxes: It is the Fund’s policy to comply with the requirements of Subchapter M of the Internal Revenue Code applicable to regulated investment companies and to distribute substantially all of its taxable income to its shareholders. Therefore, no federal income or excise tax provisions are required. | |
| The Fund recognizes the tax benefits of uncertain tax positions only where the position is “more likely than not” to be sustained assuming examination by tax authorities. Management has analyzed the Fund’s tax positions, and has concluded that no liability for unrecognized tax benefits should be recorded related to uncertain tax positions to be taken or expected to be taken on a tax return. The tax returns for the Fund for the prior three fiscal years are open for examination. The Fund identifies its major tax jurisdictions as U.S. Federal and the state of Delaware. | ||
| C. | Securities Transactions, Income and Distributions: Securities transactions are accounted for on the trade date. Realized gains and losses on securities sold are determined on the basis of identified cost. Interest income is recorded on an accrual basis. Dividend income and distributions to shareholders are recorded on the ex-dividend date. Withholding taxes on foreign dividends have been provided for in accordance with the Fund’s understanding of the applicable country’s tax rules and rates. | |
| The Fund distributes substantially all of its net investment income, if any, and net realized capital gains, if any, annually. Distributions from net realized gains for book purposes may include short-term capital gains. All short-term capital gains are included in ordinary income for tax purposes. The amount of dividends and distributions to shareholders from net investment income and net realized capital gains is determined in accordance with federal income tax regulations, which differ |
18
Mar Vista Strategic Growth Fund
| NOTES TO FINANCIAL STATEMENTS (Continued) |
| June 30, 2016 |
| from GAAP. To the extent these book/tax differences are permanent, such amounts are reclassified within the capital accounts based on their federal tax treatment. | ||
| Investment income, expenses (other than those specific to the class of shares), and realized and unrealized gains and losses on investments are allocated to the separate classes of the Fund’s shares based upon their relative net assets on the date income is earned or expensed and realized and unrealized gains and losses are incurred. | ||
| The Fund is charged for those expenses that are directly attributable to it, such as investment advisory, custody and transfer agent fees. Expenses that are not attributable to a Fund are typically allocated among the funds in the Trust proportionately based on allocation methods approved by the Board of Trustees (the “Board”). Common expenses of the Trust are typically allocated among the funds in the Trust based on a fund’s respective net assets, or by other equitable means. | ||
| D. | Use of Estimates: The preparation of financial statements in conformity with GAAP requires management to make estimates and assumptions that affect the reported amounts of assets and liabilities at the date of the financial statements and the reported amounts of increases and decreases in net assets during the reporting period. Actual results could differ from those estimates. | |
| E. | Redemption Fees: The Mar Vista Strategic Growth Fund charges a 0.75% redemption fee to most shareholders who redeem shares held for 60 days or less. Such fees are retained by the Fund and accounted for as an addition to paid-in capital. | |
| F. | Mutual Fund and ETF Trading Risk: The Fund may invest in other mutual funds that are either open-end or closed-end investment companies as well as ETFs. ETFs are investment companies that are bought and sold on a national securities exchange. Unlike mutual funds, ETFs do not necessarily trade at the net asset values of their underlying securities, which means an ETF could potentially trade above or below the value of the underlying portfolios. Additionally, because ETFs trade like stocks on exchanges, they are subject to trading and commission costs unlike mutual funds. Also, both mutual funds and ETFs have management fees that are part of their costs, and the Fund will indirectly bear its proportionate share of the costs. | |
| G. | Reclassification of Capital Accounts: GAAP requires that certain components of net assets relating to permanent differences be reclassified between financial and tax reporting. These reclassifications have no effect on net assets or net asset value per share. For the year ended June 30, 2016, the Fund made the following permanent tax adjustments on the Statement of Assets and Liabilities: |
19
Mar Vista Strategic Growth Fund
| NOTES TO FINANCIAL STATEMENTS (Continued) |
| June 30, 2016 |
| Accumulated | Accumulated | |||
| Net Investment | Net Realized | Capital | ||
Income/(Loss) | Gain/(Loss) | Stock | ||
| Strategic Growth Fund | $(10) | $10 | $— |
NOTE 3 – SECURITIES VALUATION
The Fund has adopted authoritative fair value accounting standards which establish an authoritative definition of fair value and set out a hierarchy for measuring fair value. These standards require additional disclosures about the various inputs and valuation techniques used to develop the measurements of fair value, a discussion of changes in valuation techniques and related inputs during the period, and expanded disclosure of valuation levels for major security types. These inputs are summarized in the three broad levels listed below:
| Level 1 – | Unadjusted quoted prices in active markets for identical assets or liabilities that the Fund has the ability to access. | |
| Level 2 – | Observable inputs other than quoted prices included in level 1 that are observable for the asset or liability, either directly or indirectly. These inputs may include quoted prices for the identical instrument on an inactive market, prices for similar instruments, interest rates, prepayment speeds, credit risk, yield curves, default rates and similar data. | |
| Level 3 – | Unobservable inputs for the asset or liability, to the extent relevant observable inputs are not available, representing the Fund’s own assumptions about the assumptions a market participant would use in valuing the asset or liability, and would be based on the best information available. |
Following is a description of the valuation techniques applied to the Fund’s major categories of assets and liabilities measured at fair value on a recurring basis.
Equity Securities: Equity securities, including common stocks, preferred stocks, foreign-issued common stocks, exchange-traded funds, closed-end mutual funds and real estate investment trusts (REITs), that are primarily traded on a national securities exchange shall be valued at the last sale price on the exchange on which they are primarily traded on the day of valuation or, if there has been no sale on such day, at the mean between the bid and asked prices. Securities primarily traded in the NASDAQ Global Market System for which market quotations are readily available shall be valued using the NASDAQ Official Closing Price (“NOCP”). If the NOCP is not available, such securities shall be valued at the last sale price on the day of valuation, or if there has been no sale on such day, at the mean between the bid and asked prices. Over-the-counter securities which are not traded in the NASDAQ Global Market System shall be valued at the mean between the bid and asked prices. To the extent these securities are actively traded and valuation adjustments are not applied, they are categorized in level 1 of the fair value hierarchy.
20
Mar Vista Strategic Growth Fund
| NOTES TO FINANCIAL STATEMENTS (Continued) |
| June 30, 2016 |
Investment Companies: Investments in open-end mutual funds, including money market funds, are generally priced at their net asset value per share and will be classified in level 1 of the fair value hierarchy.
Exchange-Traded Notes: Investments in exchange-traded notes are actively traded on a national securities exchange and are valued based on the last sales price from the exchange and are categorized in level 1 of the fair value hierarchy.
The Board has delegated day-to-day valuation issues to a Valuation Committee of the Trust which, as of June 30, 2016, was comprised of representatives from Mar Vista Investment Partners, LLC (the “Advisor”) and the Trust. The function of the Valuation Committee is to value securities where current and reliable market quotations are not readily available, or the closing price does not represent fair value, by following procedures approved by the Board. These procedures consider many factors, including the type of security, size of holding, trading volume and news events. All actions taken by the Valuation Committee are subsequently reviewed and ratified by the Board.
Depending on the relative significance of the valuation inputs, fair valued securities may be classified in either level 2 or level 3 of the fair value hierarchy.
The inputs or methodology used for valuing securities are not an indication of the risk associated with investing in those securities. The following is a summary of the fair valuation hierarchy of the Strategic Growth Fund’s securities as of June 30, 2016:
| Level 1 | Level 2 | Level 3 | Total | |||||||||||||
| Common Stocks | ||||||||||||||||
| Consumer Discretionary | $ | 3,070,663 | $ | — | $ | — | $ | 3,070,663 | ||||||||
| Consumer Staples | 2,708,942 | — | — | 2,708,942 | ||||||||||||
| Energy | 1,573,535 | — | — | 1,573,535 | ||||||||||||
| Financials | 3,009,559 | — | — | 3,009,559 | ||||||||||||
| Health Care | 2,784,212 | — | — | 2,784,212 | ||||||||||||
| Industrials | 3,411,846 | — | — | 3,411,846 | ||||||||||||
| Information Technology | 4,023,757 | — | — | 4,023,757 | ||||||||||||
| Materials | 1,152,365 | — | — | 1,152,365 | ||||||||||||
| Total Common Stock | 21,734,879 | — | — | 21,734,879 | ||||||||||||
| REITs | 1,462,388 | — | — | 1,462,388 | ||||||||||||
| Short-Term Investments | 2,104,167 | — | — | 2,104,167 | ||||||||||||
| Total Investments in Securities | $ | 25,301,434 | $ | — | $ | — | $ | 25,301,434 | ||||||||
Refer to the Fund’s schedule of investments for a detailed break-out of securities by industry classification. Transfers between levels are recognized at the end of the reporting period. During the year ended June 30, 2016, the Fund recognized no transfers between levels. There were no level 3 securities held in the Fund on June 30, 2016.
In May 2015, the Financial Accounting Standards Board (“FASB”) issued Accounting Standards Update (“ASU”) No. 2015-07 “Disclosure for Investments in Certain Entities
21
Mar Vista Strategic Growth Fund
| NOTES TO FINANCIAL STATEMENTS (Continued) |
| June 30, 2016 |
that Calculate Net Asset Value (“NAV”) per Share (or its equivalent).” The amendments in ASU No. 2015-07 remove the requirement to categorize within the fair value hierarchy investments measured using the NAV practical expedient. The ASU also removes certain disclosure requirements for investments that qualify, but do not utilize, the NAV practical expedient. The amendments in the ASU are effective for fiscal years beginning after December 15, 2015, and interim periods within those fiscal years. Management is currently evaluating the impact these changes will have on the Fund’s financial statements and related disclosures.
NOTE 4 – INVESTMENT ADVISORY FEE AND OTHER TRANSACTIONS WITH AFFILIATES
For the year ended June 30, 2016, the Advisor provided the Fund with investment management services under an Investment Advisory Agreement. The Advisor furnishes all investment advice, office space, and facilities, and provides most of the personnel needed by the Fund. As compensation for its services, the Advisor is entitled to a monthly fee at an annual rate of 0.75% for the Strategic Growth Fund based upon the average daily net assets of the Fund. For the year ended June 30, 2016, the Strategic Growth Fund incurred $173,251 in advisory fees. Advisory fees payable at June 30, 2016, for the Strategic Growth Fund were $14,091.
The Fund is responsible for its own operating expenses. The Advisor has contractually agreed to waive its fees and/or absorb expenses of the Fund to ensure that the net annual operating expenses (excluding Acquired Fund Fees and Expenses, taxes, brokerage commissions, interest and extraordinary expenses (collectively, “Excludable Expenses”)) do not exceed the following amounts of the average daily net assets of the Fund:
| Strategic Growth Fund | |
| Institutional Class | 0.90% |
For the year ended June 30, 2016, the Advisor reduced its fees and absorbed Fund expenses in the amount of $194,600 for the Strategic Growth Fund.
Roxbury Capital Management, LLC (“Roxbury”), an affiliate of the Advisor, provided certain compliance and administrative services to the Trust pursuant to an Administration Agreement through June 30, 2016.
BNY Mellon Investment Servicing (US) Inc. (“BNY Mellon”) provided administrative and accounting services to the Fund pursuant to an Accounting and Administrative Services Agreement through June 30, 2016.
The Bank of New York Mellon served as custodian to the Trust pursuant to a Custodian Services Agreement through June 30, 2016.
NOTE 5 – SECURITIES TRANSACTIONS
For the year ended June 30, 2016, the cost of purchases and the proceeds from sales of securities, excluding short-term securities, were as follows:
22
Mar Vista Strategic Growth Fund
| NOTES TO FINANCIAL STATEMENTS (Continued) |
| June 30, 2016 |
Purchases | Sales | ||
| Strategic Growth Fund | $12,177,549 | $8,567,617 |
There were no purchases or sales of long-term U.S. Government securities.
NOTE 6 – INCOME TAXES AND DISTRIBUTIONS TO SHAREHOLDERS
As of June 30, 2016, the components of accumulated earnings/(losses) on a tax basis were as follows:
| Strategic | |||||
| Growth Fund | |||||
Cost of investments(a) | $ | 21,206,779 | |||
| Gross unrealized appreciation | 4,691,985 | ||||
| Gross unrealized depreciation | (597,330 | ) | |||
| Net unrealized appreciation | 4,094,655 | ||||
| Undistributed ordinary income | 28,308 | ||||
| Undistributed long-term capital gain | 133,868 | ||||
| Total distributable earnings | 162,176 | ||||
| Other accumulated gains | — | ||||
| Total accumulated earnings | $ | 4,256,831 | |||
(a) | The difference between the book basis and tax basis net unrealized appreciation and cost is attributable primarily to wash sales. |
At June 30, 2016, the Strategic Growth Fund had no long-term tax basis capital losses to offset future capital gains.
The tax character of distributions paid during 2016 and 2015 was as follows:
| Year Ended | Year Ended | ||
June 30, 2016 | June 30, 2015 | ||
| Strategic Growth Fund | |||
| Ordinary income | $183,033 | $292,021 | |
| Long-term capital gains | $569,714 | $811,663 |
NOTE 7 – PRINCIPAL RISKS
The following is a list of certain risks that may apply to your investment in the Fund. Further information about investment risks is available in the Fund’s Statement of Additional Information.
Market Risk: The risk that the market value of a security may go up or down in response to many factors including the historical and prospective earnings of the issuer, the value of its assets, general economic conditions, interest rates, investor perceptions and market liquidity. Price changes may be temporary or last for extended periods.
Growth Investing Risk: The risk that an investment in a growth-oriented fund may be more volatile than the rest of the U.S. market as a whole. If the investment adviser’s
23
Mar Vista Strategic Growth Fund
| NOTES TO FINANCIAL STATEMENTS (Continued) |
| June 30, 2016 |
assessment of a company’s prospects for earnings growth or how other investors will value the company’s earnings growth is incorrect, the process of the stock may fail to reach the value that the adviser has placed on it. Growth stock prices tend to fluctuate more dramatically than the overall stock market.
Foreign Security Risk: Foreign investments involve risks relating to political, economic, regulatory, or social instability, military action or unrest, or diplomatic developments and may be affected by actions of foreign governments adverse to the interest of U.S. investors.
IPO Risk: The Fund may purchase securities of companies engaged in initial public offerings (“IPOs”). The price of securities purchased in IPOs can be very volatile. The Fund’s investments in IPO shares may include the securities of “unseasoned” companies (companies with less than three years of continuous operations), which present risks considerably greater than common stocks of more established companies. These companies may be involved in new and evolving businesses and may be vulnerable to competition and changes in technology, markets and economic conditions. They may be more dependent on key managers and third parties and may have limited product lines. The effect of IPO investments on a Fund’s performance depends on a variety of factors, including the number of IPOs the Fund invests in relative to the size of the Fund, and whether and to what extent a security purchased in an IPO appreciates or depreciates in value. When the Fund’s asset base is small, a significant portion of the Fund’s performance could be attributable to investments in IPOs because such investments would have a magnified impact on the Fund. As the Fund’s asset grow, the effect of the Fund’s investments in IPOs on the Fund’s performance probably will decline, which could reduce the Fund’s performance.
NOTE 8 – COMMITMENTS AND CONTINGENCIES
In the normal course of business, the Fund enters into contracts that contain a variety of representations and warranties and which provide general indemnifications. The Fund’s maximum exposure under these arrangements is unknown, as this would involve future claims that may be made against the Fund that have not yet occurred. However, based on experience, the Fund expects the risk of loss to be remote.
NOTE 9 – SUBSEQUENT EVENTS
The name of the Trust has been changed to Manager Directed Portfolios effective July 1, 2016. The Board has approved the retention of U.S. Bancorp Fund Services, LLC (“USBFS”), U.S. Bank N.A. (“U.S. Bank”), Quasar Distributors LLC (“Quasar”) and Vigilant Compliance, LLC (“Vigilant”) as new service providers to the Trust. The new service agreements became effective on July 1, 2016. The Administration Agreement with Roxbury was terminated on June 30, 2016. The prior service agreements with BNY Mellon were terminated on June 30, 2016. While not effective for the fiscal year ended June 30, 2016, it should be noted that the investment in U.S. Bancorp would be considered an affiliated security with the new service agreements effective July 1, 2016. Quasar Distributors, LLC, which serves as the Fund’s distributor, is a subsidiary of U.S.
24
Mar Vista Strategic Growth Fund
| NOTES TO FINANCIAL STATEMENTS (Continued) |
| June 30, 2016 |
Bancorp. In preparing the financial statements as of June 30, 2016, management considered the impact of subsequent events for potential recognition or disclosure in the financial statements and had concluded that no additional disclosures are necessary other than those mentioned above.
NOTE 10 – MATTERS SUBMITTED TO A SHAREHOLDER VOTE
A special meeting of shareholders of the Fund was held on June 21, 2016, and the following matters were approved by the Fund’s shareholders:
To elect four trustees to the Trust’s Board of Trustees:
For | Withhold | |||
| Gaylord B. Lyman | 1,282,087 | 52,993 | ||
| James R. Schoenike | 1,287,779 | 47,301 | ||
| Scott Craven Jones | 1,327,258 | 7,822 | ||
| Lawrence T. Greenberg | 1,327,258 | 7,822 |
25
Mar Vista Strategic Growth Fund
| REPORT OF INDEPENDENT REGISTERED PUBLIC ACCOUNTING FIRM |
To the Board of Trustees of
Manager Directed Portfolios
and the Shareholders of
the Mar Vista Strategic Growth Fund
We have audited the accompanying statement of assets and liabilities of the Mar Vista Strategic Growth Fund (the “Fund”), a series of Manager Directed Portfolios (formerly The Roxbury Funds), including the schedule of investments, as of June 30, 2016, and the related statement of operations for the year then ended, the statements of changes in net assets for each of the years in the two-year period then ended and the financial highlights for each of the years in the four-year period then ended and for the period November 1, 2011 (commencement of operations) through June 30, 2012. These financial statements and financial highlights are the responsibility of the Fund’s management. Our responsibility is to express an opinion on these financial statements and financial highlights based on our audits.
We conducted our audits in accordance with the standards of the Public Company Accounting Oversight Board (United States). Those standards require that we plan and perform the audits to obtain reasonable assurance about whether the financial statements and financial highlights are free of material misstatement. An audit includes examining, on a test basis, evidence supporting the amounts and disclosures in the financial statements. Our procedures included confirmation of securities owned as of June 30, 2016, by correspondence with the custodian. An audit also includes assessing the accounting principles used and significant estimates made by management, as well as evaluating the overall financial statement presentation. We believe that our audits provide a reasonable basis for our opinion.
In our opinion, the financial statements and financial highlights referred to above present fairly, in all material respects, the financial position of the Mar Vista Strategic Growth Fund as of June 30, 2016, and the results of its operations for the year then ended, the changes in its net assets for each of the years in the two-year period then ended and its financial highlights for each of the years in the four-year period then ended and for the period November 1, 2011 (commencement of operations) through June 30, 2012, in conformity with accounting principles generally accepted in the United States of America.
BBD, LLP
Philadelphia, Pennsylvania
August 26, 2016
26
Mar Vista Strategic Growth Fund
| EXPENSE EXAMPLE |
| June 30, 2016 (Unaudited) |
As a shareholder of the Fund, you incur two types of costs: (1) transaction costs including sales charges (loads) and redemption fees, if applicable; and (2) ongoing costs, including management fees; distribution and/or service (12b-1 fees); and other Fund expenses. This Example is intended to help you understand your ongoing costs (in dollars) of investing in the Fund and to compare these costs with the ongoing costs of investing in other mutual funds.
The Example is based on an investment of $1,000 invested at the beginning of the period indicated and held for the entire period from January 1, 2016 to June 30, 2016.
Actual Expenses
The information in the table under the heading “Actual” provides information about actual account values and actual expenses. You may use the information in these columns together with the amount you invested, to estimate the expenses that you paid over the period. Simply divide your account value by $1,000 (for example, an $8,600 account value divided by $1,000 = 8.6), then multiply the result by the number in the row entitled “Expenses Paid During Period” to estimate the expenses you paid on your account during this period. There are some account fees that are charged to certain types of accounts, such as Individual Retirement Accounts (generally, a $15 fee is charged to the account annually) that would increase the amount of expenses paid on your account. The example below does not include portfolio trading commissions and related expenses and other extraordinary expenses as determined under generally accepted accounting principles.
Hypothetical Example for Comparison Purposes
The information in the table under the heading “Hypothetical (5% return before expenses)” provides information about hypothetical account values and hypothetical expenses based on the Fund’s actual expense ratio and assumed rate of return of 5% per year before expenses, which is not the Fund’s actual return. The hypothetical account values and expenses may not be used to estimate the actual ending account balance or expenses you paid for the period. You may use this information to compare the ongoing costs of investing in the Fund and other funds. To do so, compare this 5% hypothetical example with the 5% hypothetical examples that appear in the shareholder reports of the other funds. As noted above, there are some account fees that are charged to certain types of accounts that would increase the amount of expense paid on your account.
Please note that the expenses shown in the table are meant to highlight your ongoing costs only and do not reflect any transaction costs, such as sales charges (loads), redemption fees, or exchange fees. Therefore, the information under the heading “Hypothetical (5% return before expenses)” is useful in comparing ongoing costs only, and will not help you determine the relative total costs of owning different funds. In addition, if these transactional costs were included, your costs would have been higher.
27
Mar Vista Strategic Growth Fund
| EXPENSE EXAMPLE (Continued) |
| June 30, 2016 (Unaudited) |
| Beginning | Ending | Expenses Paid | |
| Account Value | Account Value | During Period(1) | |
1/1/2016 | 6/30/2016 | 1/1/2016 – 6/30/2016 | |
| Actual | |||
| Institutional Class | $1,000.00 | $1,040.20 | $4.57 |
| Hypothetical (5% return | |||
| before expenses) | |||
| Institutional Class | $1,000.00 | $1,020.39 | $4.52 |
(1) | Expenses are equal to the Institutional Class fund shares’ annualized expense ratios of 0.90%, multiplied by the average account value over the period, multiplied by 182/366 (to reflect the period). |
28
Mar Vista Strategic Growth Fund
| NOTICE TO SHAREHOLDERS |
| at June 30, 2016 (Unaudited) |
How to Obtain a Copy of the Fund’s Proxy Voting Policies
A description of the policies and procedures that the Fund uses to determine how to vote proxies relating to portfolio securities is available without charge, upon request, by calling 1-844-737-6847 or on the U.S. Securities and Exchange Commission’s (“SEC”) website at http://www.sec.gov.
How to Obtain a Copy of the Fund’s Proxy Voting Records for the most recent 12-Month Period Ended June 30
Information regarding how the Fund voted proxies relating to portfolio securities during the most recent 12-month period ended June 30 is available no later than August 31 without charge, upon request, by 1-844-737-6847. Furthermore, you can obtain the Fund’s proxy voting records on the SEC’s website at http://www.sec.gov.
Quarterly Filings on Form N-Q
The Fund files its complete schedule of portfolio holdings with the SEC for the first and third quarters of each fiscal year on Form N-Q. The Fund’s Form N-Q is available on the SEC’s website at http://www.sec.gov. The Fund’s Form N-Q may be reviewed and copied at the SEC’s Public Reference Room in Washington, DC, and information on the operation of the Public Reference Room may be obtained by calling 1-202-551-8090. Information included in the Fund’s Form N-Q is also available, upon request, by calling 1-844-737-6847.
Householding
In an effort to decrease costs, the Fund intends to reduce the number of duplicate prospectuses and annual and semi-annual reports you receive by sending only one copy of each to those addresses shared by two or more accounts and to shareholders the Transfer Agent reasonably believes are from the same family or household. Once implemented, if you would like to discontinue householding for your accounts, please call toll-free at 1-844-737-6847 to request individual copies of these documents. Once the Transfer Agent receives notice to stop householding, the Transfer Agent will begin sending individual copies thirty days after receiving your request. This policy does not apply to account statements.
Other Tax Information (Unaudited)
For the fiscal year ended June 30, 2016, 54.50% of dividends paid from net investment income qualify for the dividends received deduction available to corporate shareholders of the Fund. For shareholders of the Fund, 58.99% of the dividend income distributed for the year ended June 30, 2016 is designated as qualified dividend income under the Jobs and Growth Relief Act of 2003. The percentage of taxable ordinary income distributions that are designated as short-term capital gain distributions under Internal Revenue Section 871(k)(2)(C) for the Fund was 91.12%.
29
Mar Vista Strategic Growth Fund
| MANAGEMENT |
| (Unaudited) |
This chart provides information about the Trustees and Officers who oversee the Fund. Officers elected by the Trustees manage the day-to-day operations of the Fund and execute policies formulated by the Trustees. The information in the chart is as of July 1, 2016.
| Number of | ||||
| Portfolios | Other | |||
| Position(s) Held | in Fund | Directorships | ||
| Name | with the Trust | Complex | Held by | |
| (Year of Birth) | and Length of | Principal Occupation(s) | Overseen by | Trustee During |
and Address(1) | Time Served(3) | During Past Five Years | Trustee | Past Five Years |
| INTERESTED TRUSTEE | ||||
| James R. | Trustee since | President and CEO, | 2 | None |
Schoenike(2) | July 2016 | Board of Managers, | ||
| (Born 1959) | Quasar Distributors, LLC, | |||
| since 2000 | ||||
| INDEPENDENT TRUSTEES | ||||
| Gaylord B. Lyman`7 | Trustee and Audit | Managing Director of | 2 | None |
| (Born 1962) | Committee | Kohala Capital Partners, LLC, | ||
| Chairman, since | since 2011; Vice President, | |||
| April 2015 | Becker Capital Management, | |||
| Inc. (1997 – 2011) | ||||
| Scott Craven Jones | Trustee since | Managing Director, | 2 | Director, |
| (Born 1962) | July 2016 | Carne Global Financial | Guestlogix Inc. | |
| Services (US) LLC, since 2013; | (a provider of | |||
| Adviser, Wanzenburg Partners | ancillary-focused | |||
| (2012 – 2013); Chief Operating | technology to the | |||
| Officer and Chief Financial | travel industry), | |||
| Officer, Aurora Investment | since 2015 | |||
| Management (2010 – 2012) | ||||
| Lawrence T. | Trustee since | Vice President and Secretary, | 2 | None |
| Greenberg | July 2016 | The Motley Fool Funds Trust, | ||
| (Born 1963) | since 2009; Senior Vice President | |||
| and Chief Legal Officer, | ||||
| The Motley Fool Holdings, Inc., | ||||
| since 1996; General Counsel, | ||||
| Motley Fool Asset Management, | ||||
| LLC, since 2008; Manager, | ||||
| Motley Fool Wealth Management, | ||||
| LLC, since 2013; Adjunct Professor, | ||||
| Washington College of Law, | ||||
| American University, since 2006 |
(1) | The address of each Trustee as it relates to the Trust’s business is c/o U.S. Bancorp Fund Services LLC, 615 East Michigan Street, Milwaukee, WI 53202. |
(2) | Mr. Schoenike is an Interested Trustee by virtue of his position as President of Quasar Distributors, LLC, the Fund’s distributor. |
(3) | Each Trustee serves during the continued lifetime of the Trust until he dies, resigns, is declared bankrupt or incompetent by a court of competent jurisdiction, or is removed. |
30
Mar Vista Strategic Growth Fund
| MANAGEMENT (Continued) |
| (Unaudited) |
| Name | Position(s) Held with | |
| (Year of Birth) | the Trust and Length | |
and Address | of Time Served(3) | Principal Occupation(s) During Past Five Years |
Douglas J. Neilson(1) | President and Principal | Vice President, Compliance and Administration, |
| (Born 1975) | Executive Officer, | USBFS, since 2001 |
| since July 1, 2016 | ||
Matthew J. McVoy(1) | Treasurer and Principal | Assistant Vice President, Compliance and |
| (Born 1980) | Financial Officer, | Administration, USBFS, since 2005 |
| since July 1, 2016 | ||
Nathan R. Bentley, CPA(1) | Assistant Treasurer, | Officer, Compliance and Administration, USBFS, |
| (Born 1983) | since July 1, 2016 | since 2012; Master of Science, Accounting Graduate, |
| University of Wisconsin-Milwaukee (2010 – 2012) | ||
Gerard Scarpati(2) | Chief Compliance | Compliance Director, Vigilant, since 2010 |
| (Born 1955) | Officer and | |
| Anti-Money Laundering | ||
| Compliance Officer, | ||
| since July 1, 2016 | ||
Carolyn Mead(2) | Secretary, | Compliance Director, Vigilant Compliance, LLC, |
| (Born 1957) | since July 1, 2016 | since 2015; Counsel at SEI Investments Global Funds |
| Services (2007 – 2014) |
(1) | The mailing address of this officer is: 615 East Michigan Street, Milwaukee, Wisconsin 53202. |
(2) | The mailing address of this officer is: 223 Wilmington West Chester Pike, Suite 216, Chadds Ford, Pennsylvania 19317. |
(3) | Each officer is elected annually and serves until his or her successor has been duly elected and qualified. |
The Statement of Additional Information includes additional information about the Fund’s Trustees and Officers and is available, without charge, upon request by calling 1-844-737-6847.
31
Mar Vista Strategic Growth Fund
| PRIVACY NOTICE |
| FACTS | WHAT DOES THE MAR VISTA STRATEGIC GROWTH FUND (“THE FUND”) DO WITH YOUR PERSONAL INFORMATION? | |
| Why? | Financial companies choose how they share your personal information. Federal law gives consumers the right to limit some but not all sharing. Federal law also requires us to tell you how we collect, share, and protect your personal information. Please read this notice carefully to understand what we do. | |
| What? | The types of personal information we collect and share depends on the product or service you have with us. This information can include: | |
| • Social Security number | ||
| • account balances | ||
| • account transactions | ||
| • transaction history | ||
| • wire transfer instructions | ||
| • checking account information | ||
When you are no longer our customer, we continue to share your information as described in this notice. | ||
| How? | All financial companies need to share customers’ personal information to run their everyday business. In the section below, we list the reasons financial companies can share their customers’ personal information; the reasons the Fund chooses to share; and whether you can limit this sharing. |
| Does the | Can you limit | |
| Reasons we can share your personal information | Fund share? | this sharing? |
For our everyday business purposes – such as to process your | Yes | No |
| transactions, maintain your account(s), respond to court orders | ||
| and legal investigations, or report to credit bureaus. | ||
| For our marketing purposes – | Yes | No |
| to offer our products and services to you | ||
| For joint marketing with other financial companies | No | We do not share |
For our affiliates’ everyday business purposes – | Yes | No |
| information about your transactions and experiences | ||
For our affiliates’ everyday business purposes – | No | We do not share |
| information about your creditworthiness | ||
For our affiliates to market to you – The Fund may share | Yes | Yes |
| information with our affiliates about shareholders or shareholder | ||
| accounts in order to make shareholders aware of services and | ||
| products which the Fund thinks may be of interest or value to them | ||
| For nonaffiliates to market to you | No | We do not share |
| To Limit the | To limit our sharing, please notify us in the following way: | |
| Fund’s Sharing | • Contact the Fund by calling our toll-free phone number 1-844-737-6847. | |
| Your choice to limit the personal information the Fund shares with its affiliates will apply until you request a change. If you are a new customer, we can begin sharing your information with our affiliates for marketing purposes 30 days from the date we sent this notice. When you are no longer a customer, we continue to share your information as described in this notice. | ||
| Questions? | If you have any questions or concerns regarding this notice or the Fund’s privacy policies, please contact us at 844-737-6847. |
32
Mar Vista Strategic Growth Fund
| PRIVACY NOTICE (Continued) |
State Disclosures – In addition to the rights described below and in this notice, you may have other rights under state laws. We will comply with the applicable state laws with respect to our information practices.
California and Vermont have other protections under state law. If you primary mailing address is in California or Vermont, we will not share your financial information that we collect except as permitted by law, including, for example, with your consent or to service your account. We will also not use your information for joint marketing purposes. We do not share customer information with third parties except as permitted by law.
| Who we are | ||
| Who is providing | The Fund is an open-end management investment company registered under the | |
| this notice? | Investment Company Act of 1940. | |
| What we do | ||
| How does the Fund | To protect your personal information from unauthorized access and use, we use | |
| protect my personal | security measures that comply with federal law. These measures include computer | |
| information? | safeguards and secured files and buildings. | |
| How does the Fund | We collect your personal information, for example, when you | |
| collect my personal | • open an account | |
| information? | • provide account information | |
| • give us your contact information | ||
| • make a wire transfer | ||
| • tell us where to send the money | ||
| We collect your personal information from others, such as credit bureaus, affiliates or other companies. | ||
| Why can’t I limit | Federal law gives you the right to limit only | |
| all sharing? | • sharing for affiliates’ everyday business purposes – information about your creditworthiness | |
| • affiliates from using your information to market to you | ||
| • sharing for nonaffiliates to market to you | ||
| State laws and individual companies may give you additional rights to limit sharing. | ||
| Definitions | ||
| Affiliates | Companies related by common ownership or control. They can be financial and nonfinancial companies. | |
| • The Fund’s affiliates are Mar Vista Investment Partners, investment advisor to the Mar Vista Strategic Growth Fund and Roxbury Capital Management, LLC, subadministrator to Roxbury. | ||
| Nonaffiliates | Companies not related by common ownership or control. They can be financial and nonfinancial companies. | |
| • The Fund does not share with nonaffiliates so they can market to you. | ||
| Joint marketing | A formal agreement between nonaffiliated financial companies that together market financial products or services to you. | |
| • The Fund does not jointly market. |
33
(This Page Intentionally Left Blank.)
Investment Advisor
Mar Vista Investment Partners, LLC
11150 Santa Monica Blvd., Suite 320
Los Angeles, CA 90025
Distributor
Quasar Distributors, LLC
615 East Michigan Street, 4th Floor
Milwaukee, WI 53202
Transfer Agent
U.S. Bancorp Fund Services, LLC
615 East Michigan Street
Milwaukee, WI 53202
(844) 737-6847
Custodian
U.S. Bank National Association
Custody Operations
1555 North River Center Drive, Suite 302
Milwaukee, WI 53212
Independent Registered Public Accounting Firm
BBD, LLP
1835 Market Street, 26th floor
Philadelphia, PA 19103
Legal Counsel
Godfrey & Kahn S.C.
833 East Michigan Street, Suite 1800
Milwaukee, WI 53202
This report is intended for shareholders of the Fund and may not be used as sales literature unless preceded or accompanied by a current prospectus.
Past performance results shown in this report should not be considered a representation of future performance. Share price and returns will fluctuate so that shares, when redeemed, may be worth more or less than their original cost. Statements and other information herein are dated and are subject to change.
Item 2. Code of Ethics.
The registrant has adopted a code of ethics that applies to the registrant’s principal executive officer and principal financial officer. The registrant has not made any substantive amendments to its code of ethics during the period covered by this report. The registrant has not granted any waivers from any provisions of the code of ethics during the period covered by this report.
A copy of the registrant’s Code of Ethics is filed herewith.
Item 3. Audit Committee Financial Experts.
The registrant’s Board of Trustees has determined that there are at least two audit committee financial experts serving on its audit committee. Messrs. Gaylord B. Lyman and Scott C. Jones are the “audit committee financial experts” and are considered to be “independent” as each term is defined in Item 3 of Form N‑CSR.
Item 4. Principal Accountant Fees and Services.
The registrant has engaged its principal accountant to perform audit services, audit-related services, tax services and other services during the past two fiscal years. “Audit services” refer to performing an audit of the registrant's annual financial statements or services that are normally provided by the accountant in connection with statutory and regulatory filings or engagements for those fiscal years. “Audit-related services” refer to the assurance and related services by the principal accountant that are reasonably related to the performance of the audit. “Tax services” refer to professional services rendered by the principal accountant for tax compliance, tax advice, and tax planning. There were no “other services” provided by the principal accountant. The following table details the aggregate fees billed or expected to be billed for each of the last two fiscal years for audit fees, audit-related fees, tax fees and other fees by the principal accountant.
| FYE 6/30/2016 | FYE 6/30/2015 | |
| Audit Fees | $35,000 | $34,000 |
| Audit-Related Fees | N/A | N/A |
| Tax Fees | $3,000 | $3,000 |
| All Other Fees | N/A | N/A |
Pursuant to its charter, the Trust’s Audit Committee must review and approve in advance the engagement of the independent accountants, including each audit and non-audit service permitted by appropriate rules or regulations provided to the Trust and each non-audit service provided to the Trust’s investment advisers and any entity controlling, controlled by or under common control with the investment advisers that provides ongoing services to the Trust relating to the operations and financial reporting of the Trust. The Committee may delegate the authority to grant such pre-approval to one or more Committee members who are independent Trustees within the meaning of Section 10A(i) of the Securities Exchange Act of 1934, as amended, provided that the decision of such member(s) is presented to the full Committee at its next scheduled meeting. The Committee may approve each audit and non-audit service on a case-by-case basis, and/or adopt pre-approval policies and procedures that are detailed as to a particular service, provided that the Committee is informed of each service in a timely manner and the policies and procedures do not include delegation of the Committee’s responsibilities under the Securities Exchange Act of 1934 to management. The foregoing pre-approval requirement with respect to the provision of non-audit services to the Trust may be waived if (i) the aggregate amount of all such non-audit services provided to the Trust constitutes not more than 5 percent of the total amount of revenues paid by the Trust to its independent accountants during the fiscal year in which the non-audit services are provided; (ii) such services were not recognized by the Trust at the time of the engagement to be non-audit services; and (iii) such services are promptly brought to the attention of the Committee and approved prior to the completion of the audit by the Committee or by one or more members of the Committee to whom authority to grant such approvals has been delegated by the Committee.
The percentage of fees billed by BBD, LLP applicable to non-audit services pursuant to waiver of pre-approval requirement were as follows:
| FYE 6/30/2016 | FYE 6/30/2015 | |
| Audit-Related Fees | 0% | 0% |
| Tax Fees | 0% | 0% |
| All Other Fees | 0% | 0% |
All of the principal accountant’s hours spent on auditing the registrant’s financial statements were attributed to work performed by full‑time permanent employees of the principal accountant.
The following table indicates the non-audit fees billed or expected to be billed by the registrant’s accountant for services to the registrant and to the registrant’s investment adviser (and any other controlling entity, etc.—not sub-adviser) for the last two years. The audit committee of the Board of Trustees has considered whether the provision of non-audit services that were rendered to the registrant's investment adviser is compatible with maintaining the principal accountant's independence and has concluded that the provision of such non-audit services by the accountant has not compromised the accountant’s independence.
| Non-Audit Related Fees | FYE 6/30/2016 | FYE 6/30/2015 |
| Registrant | N/A | N/A |
| Registrant’s Investment Adviser | N/A | N/A |
Item 5. Audit Committee of Listed Registrants.
Not applicable to registrants who are not listed issuers (as defined in Rule 10A-3 under the Securities Exchange Act of 1934).
Item 6. Investments.
| (a) | Schedule of Investments is included as part of the report to shareholders filed under Item 1 of this Form. |
(b) | Not Applicable. |
Item 7. Disclosure of Proxy Voting Policies and Procedures for Closed-End Management Investment Companies.
Not applicable to open-end investment companies.
Item 8. Portfolio Managers of Closed-End Management Investment Companies.
Not applicable to open-end investment companies.
Item 9. Purchases of Equity Securities by Closed‑End Management Investment Company and Affiliated Purchasers.
Not applicable to open-end investment companies.
Item 10. Submission of Matters to a Vote of Security Holders.
There have been no material changes to the procedures by which shareholders may recommend nominees to the Registrant’s Board of Trustees.
Item 11. Controls and Procedures.
| (a) | The Registrant’s President/Principal Executive Officer and Treasurer/Principal Financial Officer have reviewed the Registrant's disclosure controls and procedures (as defined in Rule 30a-3(c) under the Investment Company Act of 1940, as amended, (the “Act”)) as of a date within 90 days of the filing of this report, as required by Rule 30a-3(b) under the Act and Rules 13a-15(b) or 15d‑15(b) under the Securities Exchange Act of 1934. Based on their review, such officers have concluded that the disclosure controls and procedures are effective in ensuring that information required to be disclosed in this report is appropriately recorded, processed, summarized and reported and made known to them by others within the Registrant and by the Registrant’s service provider. |
| (b) | There were no changes in the Registrant's internal control over financial reporting (as defined in Rule 30a-3(d) under the Act) that occurred during the fourth fiscal quarter of the period covered by this report that has materially affected, or is reasonably likely to materially affect, the Registrant's internal control over financial reporting. |
Item 12. Exhibits.
| (a) | (1) Any code of ethics or amendment thereto, that is subject to the disclosure required by Item 2, to the extent that the registrant intends to satisfy Item 2 requirements through filing an exhibit. Filed herewith. |
(2) A separate certification for each principal executive and principal financial officer pursuant to Section 302 of the Sarbanes-Oxley Act of 2002. Filed herewith.
(3) Any written solicitation to purchase securities under Rule 23c‑1 under the Act sent or given during the period covered by the report by or on behalf of the registrant to 10 or more persons. Not applicable to open-end investment companies.
| (b) | Certifications pursuant to Section 906 of the Sarbanes‑Oxley Act of 2002. Furnished herewith. |
SIGNATURES
Pursuant to the requirements of the Securities Exchange Act of 1934 and the Investment Company Act of 1940, as amended, the registrant has duly caused this report to be signed on its behalf by the undersigned, thereunto duly authorized.
(Registrant) Manager Directed Portfolios
By (Signature and Title)* /s/Douglas J. Neilson
Douglas J. Neilson, President
Date 9/7/2016
Pursuant to the requirements of the Securities Exchange Act of 1934 and the Investment Company Act of 1940, as amended, this report has been signed below by the following persons on behalf of the registrant and in the capacities and on the dates indicated.
By (Signature and Title)* /s/Douglas J. Neilson
Douglas J. Neilson, President
Date 9/7/2016
By (Signature and Title)* /s/Matthew J. McVoy
Matthew J. McVoy, Treasurer
Date 9/7/2016
* Print the name and title of each signing officer under his or her signature.