UNITED STATES
SECURITIES AND EXCHANGE COMMISSION
Washington, D.C. 20549
FORM N-CSR
CERTIFIED SHAREHOLDER REPORT OF REGISTERED MANAGEMENT
INVESTMENT COMPANIES
Investment Company Act file number 811-21897
The Roxbury Funds
(Exact name of registrant as specified in charter)
6001 Shady Oak Road Suite 200
Minnetonka, MN 55343
(Address of principal executive offices) (Zip code)
Brian C. Beh
Roxbury Capital Management, LLC
6001 Shady Oak Road Suite 200
Minnetonka, MN 55343
(Name and address of agent for service)
Copy to:
Michael P. Malloy, Esquire
Drinker Biddle & Reath LLP
One Logan Square, Ste. 2000
Philadelphia, PA 19103-6996
Registrant’s telephone number, including area code: (952) 230-6140
Date of fiscal year end: June 30
Date of reporting period: June 30, 2014
Form N-CSR is to be used by management investment companies to file reports with the Commission not later than 10 days after the transmission to stockholders of any report that is required to be transmitted to stockholders under Rule 30e-1 under the Investment Company Act of 1940 (17 CFR 270.30e-1). The Commission may use the information provided on Form N-CSR in its regulatory, disclosure review, inspection, and policymaking roles.
A registrant is required to disclose the information specified by Form N-CSR, and the Commission will make this information public. A registrant is not required to respond to the collection of information contained in Form N-CSR unless the Form displays a currently valid Office of Management and Budget (“OMB”) control number. Please direct comments concerning the accuracy of the information collection burden estimate and any suggestions for reducing the burden to Secretary, Securities and Exchange Commission, 100 F Street, NE, Washington, DC 20549. The OMB has reviewed this collection of information under the clearance requirements of 44 U.S.C. § 3507.
Item 1. Reports to Stockholders.
The Report to Shareholders is attached herewith.

ANNUAL REPORT
JUNE 30, 2014
Roxbury/Hood River Small-Cap Growth Fund
Roxbury/Mar Vista Strategic Growth Fund
Telephone: (800) 497-2960
www.RoxburyFunds.com
| 3 | ||||
| 4 | ||||
| 7 | ||||
| 9 | ||||
| 12 | ||||
| 15 | ||||
| 16 | ||||
| 17 | ||||
| 18 | ||||
| 20 | ||||
| 23 | ||||
| 24 | ||||
| 24 | ||||
| 27 | ||||
| 28 | ||||
2
Dear Shareholders,
Another fiscal year ended, another double digit return for the U.S. equity markets. Domestic equity investors have now experienced five and a half straight years of stock market gains with the major indices producing cumulative returns of 150% to 200%. The obvious question is how much longer can this continue? It would seem that the obvious answer should be “not much longer”, however, it might continue, but not without some amount of increased risk. The Federal Reserve and other central banks around the globe have remained committed to keeping interest rates low for an extended period of time. That has been the key driver of this market’s multiple expansion while overall organic earnings growth is a distant second. Given today’s low level of interest rates, market multiples have gone from very attractive five years ago to fairly priced today. When markets move from fairly priced to overpriced real risks begin to emerge.
As bull markets grind on pockets of over-valuation will appear. We saw this play out last quarter. A fairly significant correction in a few of the more frothy sectors began in mid-March of 2014. Many stocks in the Social Media and Bio-Tech sectors in particular, which had appreciated significantly the previous six to twelve months, took a beating with many stocks in these sectors down 10% to 25% through the end of May 2014. Both of our investment teams attempt to stay away from companies that do not provide a margin of safety, which helped both teams navigate this correction well.
The Roxbury/Hood River Small-Cap Growth Fund gained 24.8% during the fiscal year ended June 30, 2014. That compares to a gain of 24.7% for the Russell 2000® Growth Index and a 22.4% gain for the average Small Cap Growth mutual fund in the Morningstar database. The Hood River team added a considerable amount of value in the Technology, Consumer and Industrial sectors while underperforming in the Financial, Health Care and Energy sectors. For a more detailed review of our Small-Cap Fund’s performance and commentary, please review the Hood River team’s thoughts on page 4.
The Roxbury/Mar Vista Strategic Growth Fund gained 27.7% during the fiscal year ended June 30, 2014. That compares with a gain of 26.9% for the Russell 1000® Growth Index, a gain of 24.6% for the S&P 500 Index and a gain of 26.2% for the average Large Cap Growth manager in the Morningstar database. The Mar Vista team had solid stock selection in the Heath Care, Financial and Industrial sectors while underperforming in the Technology sector. For a more in depth review of the Mar Vista team’s thoughts and commentaries please see page 9.
As always we appreciate the trust you have placed with us as stewards of your capital. We remain committed to our shareholders and welcome the opportunity to discuss our Funds with you.
Sincerely,

Brian C. Beh
President
The Roxbury Funds
The above comments reflect the investment adviser’s general views regarding the market and the economy, were current as of the date of this letter, and are subject to change at any time.

Brian C. Beh
President, The Roxbury Funds
3
How did the Roxbury/Hood River Small-Cap Growth Fund perform during the annual period ended June 30, 2014?
During the twelve month period ended June 30, 2014, the Roxbury/Hood River Small-Cap Growth Fund achieved a total return of 24.80%. This compares to a return of 24.72% for the Russell 2000® Growth Index during the same period.
What key factors were responsible for the Fund’s performance during the 12-month reporting period?
The positive performance for the twelve month period ended June 30, 2014 was driven by our bottom-up research, with stock selection adding roughly 340 basis points of outperformance. Conversely, for the year, our sector allocation weights detracted by roughly 190 basis points. Typically the impact of our sector allocation has a smaller impact on performance than does stock selection.
Which equity market sectors most significantly affected Fund performance?
Our strongest sector for the twelve month period ended June 30, 2014 was information technology, which added nearly 500 basis points of performance versus the Russell 2000® Growth Index. The biggest contributor in the information technology sector was SunEdison Inc., which benefited from increased solar project backlog, spinning off its semiconductor business, and the upcoming IPO of its “YieldCo,” TerraForm. Technology performance was also helped by Synaptics, which enjoyed accelerating demand for its interface solutions for mobile devices. Other strong sectors included industrials and consumer discretionary, which each added over 100 basis points of performance versus the Russell 2000® Growth Index.
Our weakest sector was financials, which underperformed the Russell 2000® Growth Index by roughly 200 basis points in part due to Tower Group, a property and casualty insurance company that incurred unexpected charges due to inadequate reserves. Other weak sectors for the twelve month period ended June 30, 2014 included healthcare and energy.
What are you expecting from the equity markets over the upcoming fiscal year?
We believe that very few investors, ourselves included, are good at market timing. We spend most of our time doing bottom-up research on individual companies as we believe that is the best way to achieve excess returns.
With that said, our current read on the economy based on discussions with numerous sources including management at many small cap companies, is that the economy remains in the modest growth mode it has been in for several years now. As with most economic environments, we are optimistic that this will be a good environment for our research to identify relative winners that should outperform other small cap companies.
The other key piece of the puzzle beyond earnings is equity valuations. Last year in this space we wrote about the impact of the Federal Reserve’s easy money policies that drove down interest
rates and drove up equity valuations as investors took on more risk in the search for return. That dynamic of expanding equity valuations has continued in the past year, and most markets, including US small cap growth, currently stand at or near all-time highs as a result. We are quite aware that when the Federal Reserve’s stance changes, rates may rise and equity valuations may compress; accordingly, our portfolio continues to demonstrate factors that we hope will perform well in the event of a downturn, such as lower leverage, more profitability, and greater liquidity. Importantly, our portfolio has similar expected (consensus) growth as the Russell 2000® Growth Index, while our portfolio is trading below the price/earnings of the Russell 2000® Growth Index. As usual, we continue to believe that over time, owning quality companies that are likely to meet or beat expectations, and which trade at a discount to the market, will lead to outperformance.
Very truly yours,
Robert C. Marvin, CFA Portfolio Manager | Brian P. Smoluch, CFA Portfolio Manager | |
|
| |
David G. Swank, CFA Portfolio Manager | ||
| ||


Returns represent past performance and include change in share price and reinvestment of dividends and capital gains. Past performance cannot guarantee future results. The current performance of the Fund may be lower or higher than the figures shown. Returns and shares price will fluctuate, and redemption value may be more or less than original cost. Performance information current to the most recent month-end is available by calling (800) 497-2960.
In addition to historical information, this report contains forward-looking statements which may concern, among other things, the domestic and foreign markets, economic trends and government regulations and their potential impact on the Fund’s investments. These statements are subject to risks and uncertainties and actual developments in the future and their impact on the Fund could be materially different than those that are projected or implied.
Portfolio composition is subject to change.
4
ROXBURY/HOOD RIVER SMALL-CAP GROWTH FUND
The following tables are for the year ended June 30, 2014:
| Top Ten Holdings (Unaudited) | % of Portfolio | |||
SunEdison, Inc. | 4.7 | % | ||
Portfolio Recovery Association, Inc. | 2.9 | % | ||
Centene Corp. | 2.4 | % | ||
Skyworks Solutions, Inc. | 2.3 | % | ||
Cooper Companies, Inc. (The) | 2.2 | % | ||
Umpqua Holdings Corp. | 2.2 | % | ||
Megellan Health, Inc. | 1.9 | % | ||
Old Dominion Freight Line, Inc. | 1.9 | % | ||
EnerSys, Inc. | 1.8 | % | ||
Integrated Device technology, Inc. | 1.8 | % | ||
| Sector Breakdown (Unaudited) | % of Portfolio | |||
Common Stock | ||||
Industrials | 24.5 | % | ||
Information Technology | 23.6 | % | ||
Health Care | 20.6 | % | ||
Consumer Discretionary | 11.6 | % | ||
Financials | 5.8 | % | ||
Telecommunication Services | 2.3 | % | ||
Consumer Staples | 1.5 | % | ||
Energy | 0.3 | % | ||
Short-Term Investments | 9.8 | % | ||
TOTAL | 100.0 | % | ||
| Portfolio Statistics (Unaudited) | ||||
Number of Holdings | 84 | |||
Market Cap (wtd. Median, mil.) | $3,024.0 | |||
Price / Book Value (wtd. Avg.) | 4.2 | x | ||
Price / Earnings (wtd. Avg.) | 22.7 | x | ||
Beta | 0.95 | |||
Standard Deviation | 18.42 | % | ||
Portfolio Turnover | 115 | % | ||
QUARTERLY PORTFOLIO HOLDINGS
The Fund files a complete schedule of portfolio holdings with the Securities and Exchange Commission (SEC) for the first and third quarters of each fiscal year on Form N-Q. The Fund’s Forms N-Q are available electronically on the SEC’s website at www.sec.gov. Hard copies may be reviewed and copied at the SEC’s Public Reference Room in Washington, DC. For more information on the Public Reference Room, call 1-800-SEC-0330.
Portfolio holdings are subject to change at any time.
5
SMALL-CAP GROWTH
Roxbury/Hood River Small-Cap Growth Fund
Comparison of Change in Value of a Hypothetical $100,000 Investment* (Unaudited)
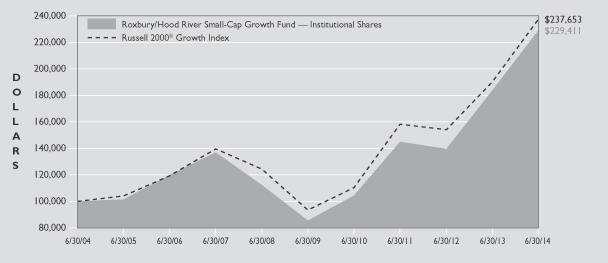
The following table compares the performance of the Roxbury/Hood River Small-Cap Growth Fund and the Russell 2000® Growth Index for the periods ended June 30.
| Average Annual Total Return For the Periods Ended June 30, 2014. | ||||||||||||||||
| 1 Year | 5 Years | 10 Years | Since Inception1 | |||||||||||||
Roxbury/Hood River Small-Cap Growth Fund Institutional Shares | 24.80% | 21.83% | 8.66% | 12.68 | % | |||||||||||
Russell 2000® Growth Index2 | 24.72% | 20.50% | 9.01% | (4.87 | )% | |||||||||||
Fund Expense Ratios3: Institutional Shares: Gross 1.60%, Net 1.26%.
| * | Performance quoted represents past performance and does not guarantee future results. Investment return and principal value will fluctuate. Shares, when redeemed, may be worth more or less than their original cost. Current performance may be lower or higher than that shown here. Performance data current to the most recent month-end is available by calling (800) 497-2960. |
The performance in the table above does not reflect the deduction of taxes a shareholder would pay on Fund distributions or redemption of Fund shares.
Small company stocks may be subject to a higher degree of market risk because they tend to be more volatile and less liquid.
Shareholders should consider the investment objectives, risks, charges and expenses of the Fund carefully before investing. The Fund’s prospectus contains this and other important information about the Fund. For a copy of the prospectus, call (800) 497-2960. Please read carefully before investing.
| 1 | The Institutional Shares commenced operations on January 2, 2003. |
| 2 | The Russell 2000® Growth Index measures the performance of the small-cap growth segment of the U.S. equity universe. It includes those Russell 2000® Index companies with higher price-to-value ratios and higher forecasted growth values. |
| 3 | The expense ratios of the Fund are set forth according to the prospectus for the Fund effective November 1, 2013 and may differ from the expense ratios disclosed in the Financial Highlights tables in this report. Net Expense: Expenses reduced by a contractual fee waiver through December 31, 2020. Gross expenses do not reflect the effect of a contractual fee waiver. |
6
ROXBURY/HOOD RIVER SMALL-CAP GROWTH FUND
SCHEDULE OF INVESTMENTS JUNE 30, 2014
| Shares | Value (Note 2) | |||||||
| COMMON STOCK – 96.3% | ||||||||
CONSUMER DISCRETIONARY – 12.4% |
| |||||||
Diversified Consumer Services – 1.5% |
| |||||||
Grand Canyon Education, Inc.* | 26,928 | $ | 1,237,880 | |||||
|
| |||||||
Hotels, Restaurants & Leisure – 2.4% |
| |||||||
Bally Technologies, Inc.* | 9,776 | 642,479 | ||||||
Diamond Resorts International, Inc.* | 55,070 | 1,281,479 | ||||||
Papa Murphy’s Holdings, Inc.* | 9,150 | 87,657 | ||||||
|
| |||||||
| 2,011,615 | ||||||||
|
| |||||||
Media – 1.5% |
| |||||||
Lions Gate Entertainment Corp. | 37,435 | 1,069,892 | ||||||
Rentrak Corp.* | 4,160 | 218,192 | ||||||
|
| |||||||
| 1,288,084 | ||||||||
|
| |||||||
Multi-Line Retail – 0.9% |
| |||||||
Tuesday Morning Corp.* | 44,310 | 789,604 | ||||||
|
| |||||||
Specialty Retail – 5.3% |
| |||||||
Conn’s, Inc.* | 24,104 | 1,190,497 | ||||||
Genesco, Inc.* | 17,860 | 1,466,842 | ||||||
LifeLock, Inc.* | 82,315 | 1,149,117 | ||||||
MarineMax, Inc.* | 37,675 | 630,679 | ||||||
|
| |||||||
| 4,437,135 | ||||||||
|
| |||||||
Textiles, Apparel & Luxury Goods – 0.8% |
| |||||||
Hanesbrands, Inc. | 6,872 | 676,480 | ||||||
|
| |||||||
TOTAL CONSUMER DISCRETIONARY |
| 10,440,798 | ||||||
|
| |||||||
CONSUMER STAPLES – 1.6% |
| |||||||
Food & Staples Retailing – 1.6% |
| |||||||
United Natural Foods, Inc.* | 10,333 | 672,678 | ||||||
Whitewave Foods Co.* | 20,065 | 649,504 | ||||||
|
| |||||||
| 1,322,182 | ||||||||
|
| |||||||
TOTAL CONSUMER STAPLES |
| 1,322,182 | ||||||
|
| |||||||
ENERGY – 0.3% |
| |||||||
Oil, Gas & Consumable Fuels – 0.3% |
| |||||||
Nordic American Tankers Ltd. | 29,720 | 283,232 | ||||||
|
| |||||||
TOTAL ENERGY |
| 283,232 | ||||||
|
| |||||||
FINANCIALS – 6.2% |
| |||||||
Commercial Banks – 3.2% |
| |||||||
Bank of The Ozarks, Inc. | 13,080 | 437,526 | ||||||
Tristate Capital Holdings, Inc.* | 19,954 | 281,950 | ||||||
Umpqua Holdings Corp. | 108,715 | 1,948,168 | ||||||
|
| |||||||
| 2,667,644 | ||||||||
|
| |||||||
Real Estate Investment Trusts – 1.9% |
| |||||||
Pebblebrook Hotel Trust | 42,305 | 1,563,593 | ||||||
|
| |||||||
Thrifts & Mortgage Finance – 1.1% |
| |||||||
BankUnited, Inc. | 28,110 | 941,123 | ||||||
|
| |||||||
TOTAL FINANCIALS |
| 5,172,360 | ||||||
|
| |||||||
| Shares | Value (Note 2) | |||||||
| COMMON STOCK – continued | ||||||||
HEALTH CARE – 22.0% |
| |||||||
Biotechnology – 1.0% |
| |||||||
Alnylam Pharmaceuticals, Inc.* | 6,240 | $ | 394,181 | |||||
Isis Pharmaceuticals, Inc.* | 12,370 | 426,147 | ||||||
|
| |||||||
| 820,328 | ||||||||
|
| |||||||
Health Care Equipment & Supplies – 4.8% |
| |||||||
Cooper Companies, Inc. (The) | 14,474 | 1,961,661 | ||||||
Cynosure Inc. - Class A* | 26,835 | 570,244 | ||||||
Greatbatch, Inc.* | 30,470 | 1,494,858 | ||||||
|
| |||||||
| 4,026,763 | ||||||||
|
| |||||||
Health Care Providers & Services – 14.3% |
| |||||||
Air Methods Corp.* | 27,640 | 1,427,606 | ||||||
Centene Corp.* | 27,812 | 2,102,865 | ||||||
ExamWorks Group, Inc.* | 34,151 | 1,083,611 | ||||||
Magellan Health, Inc.* | 27,635 | 1,720,002 | ||||||
MEDNAX, Inc.* | 27,225 | 1,583,134 | ||||||
Molina Healthcare, Inc.* | 14,845 | 662,532 | ||||||
MWI Veterinary Supply, Inc.* | 3,693 | 524,369 | ||||||
Providence Service Corp.* | 35,525 | 1,299,860 | ||||||
Team Health Holdings, Inc.* | 12,968 | 647,622 | ||||||
VCA Antech, Inc.* | 27,775 | 974,625 | ||||||
|
| |||||||
| 12,026,226 | ||||||||
|
| |||||||
Health Care Technology – 0.8% |
| |||||||
Omnicell Inc* | 22,845 | 655,880 | ||||||
|
| |||||||
Life Sciences Tools & Services – 1.1% |
| |||||||
Cambrex Corp.* | 46,120 | 954,684 | ||||||
|
| |||||||
TOTAL HEALTH CARE |
| 18,483,881 | ||||||
|
| |||||||
INDUSTRIALS – 26.2% |
| |||||||
Aerospace & Defense – 2.1% |
| |||||||
Hexcel Corp.* | 23,826 | 974,483 | ||||||
KEYW Holding Corp. (The)* | 62,970 | 791,533 | ||||||
|
| |||||||
| 1,766,016 | ||||||||
|
| |||||||
Building Products – 1.5% |
| |||||||
PGT, Inc.* | 56,835 | 481,392 | ||||||
Trex Co., Inc.* | 25,819 | 744,104 | ||||||
|
| |||||||
| 1,225,496 | ||||||||
|
| |||||||
Commercial Services & Supplies – 5.9% |
| |||||||
Encore Capital Group, Inc.* | 21,755 | 988,112 | ||||||
KAR Auction Services, Inc. | 35,690 | 1,137,440 | ||||||
Portfolio Recovery Associates, Inc.* | 43,240 | 2,574,077 | ||||||
TriNet Group, Inc* | 10,676 | 256,971 | ||||||
|
| |||||||
| 4,956,600 | ||||||||
|
| |||||||
Construction & Engineering – 0.8% |
| |||||||
William Lyon Homes - Class A* | 20,631 | 628,008 | ||||||
|
| |||||||
Electrical Equipment – 3.4% |
| |||||||
EnerSys, Inc. | 23,725 | 1,632,043 | ||||||
SolarCity Corp.* | 17,750 | 1,253,150 | ||||||
|
| |||||||
| 2,885,193 | ||||||||
|
| |||||||
The accompanying notes are an integral part of the financial statements.
7
SMALL-CAP GROWTH
ROXBURY/HOOD RIVER SMALL-CAP GROWTH FUND
SCHEDULE OF INVESTMENTS JUNE 30, 2014 continued
| Shares | Value (Note 2) | |||||||
| COMMON STOCK – continued | ||||||||
Machinery – 0.9% |
| |||||||
Greenbrier Cos, Inc.* | 13,510 | $ | 778,176 | |||||
|
| |||||||
Marine – 1.3% |
| |||||||
Kirby Corp.* | 9,048 | 1,059,883 | ||||||
|
| |||||||
Professional Services – 4.6% |
| |||||||
Barrett Business Services, Inc. | 19,490 | 916,030 | ||||||
Huron Consulting Group, Inc.* | 14,802 | 1,048,278 | ||||||
On Assignment, Inc.* | 41,340 | 1,470,464 | ||||||
Resources Connection, Inc. | 2,170 | 28,449 | ||||||
WageWorks, Inc.* | 8,860 | 427,141 | ||||||
|
| |||||||
| 3,890,362 | ||||||||
|
| |||||||
Road & Rail – 5.7% |
| |||||||
Genesee & Wyoming, Inc. - Class A* | 9,634 | 1,011,570 | ||||||
Heartland Express, Inc. | 20,340 | 434,056 | ||||||
Marten Transport, Ltd. | 13,948 | 311,738 | ||||||
Old Dominion Freight Line, Inc.* | 26,781 | 1,705,414 | ||||||
Swift Transportation Co.* | 53,805 | 1,357,500 | ||||||
|
| |||||||
| 4,820,278 | ||||||||
|
| |||||||
TOTAL INDUSTRIALS |
| 22,010,012 | ||||||
|
| |||||||
INFORMATION TECHNOLOGY – 25.2% |
| |||||||
Communications Equipment – 3.0% |
| |||||||
Applied Optoelectronics, Inc.* | 33,850 | 785,320 | ||||||
CommScope Holding Co., Inc.* | 55,540 | 1,284,640 | ||||||
Finisar Corp.* | 23,374 | 461,636 | ||||||
|
| |||||||
| 2,531,596 | ||||||||
|
| |||||||
Computers & Peripherals – 2.1% |
| |||||||
Synaptics, Inc.* | 13,680 | 1,239,955 | ||||||
Violin Memory, Inc.* | 120,095 | 532,021 | ||||||
|
| |||||||
| 1,771,976 | ||||||||
|
| |||||||
Internet Software & Services – 2.4% |
| |||||||
Constant Contact, Inc.* | 26,145 | 839,516 | ||||||
CoStar Group, Inc.* | 2,780 | 439,713 | ||||||
Global Eagle Entertainment, Inc.* | 56,620 | 702,088 | ||||||
|
| |||||||
| 1,981,317 | ||||||||
|
| |||||||
IT Services – 1.9% |
| |||||||
Euronet Worldwide, Inc.* | 15,556 | 750,421 | ||||||
MAXIMUS, Inc. | 20,047 | 862,422 | ||||||
|
| |||||||
| 1,612,843 | ||||||||
|
| |||||||
Semiconductors & Semiconductor Equipment – 12.9% |
| |||||||
Integrated Device Technology, Inc.* | 103,796 | 1,604,686 | ||||||
Mattson Technology, Inc.* | 123,965 | 271,483 | ||||||
Microsemi Corp.* | 28,308 | 757,522 | ||||||
Power Integrations, Inc. | 13,840 | 796,354 | ||||||
Skyworks Solutions, Inc.* | 44,693 | 2,098,783 | ||||||
SunEdison Semiconductor Ltd.* | 16,109 | 272,725 | ||||||
SunEdison, Inc.* | 185,241 | 4,186,447 | ||||||
Veeco Instruments, Inc.* | 21,840 | 813,758 | ||||||
|
| |||||||
| 10,801,758 | ||||||||
|
| |||||||
| Shares | Value (Note 2) | |||||||
| COMMON STOCK – continued | ||||||||
Software – 2.9% |
| |||||||
Monotype Imaging Holdings, Inc. | 19,976 | $ | 562,724 | |||||
Proofpoint, Inc.* | 22,596 | 846,446 | ||||||
Solera Holdings, Inc. | 15,220 | 1,022,023 | ||||||
|
| |||||||
| 2,431,193 | ||||||||
|
| |||||||
TOTAL INFORMATION TECHNOLOGY |
| 21,130,683 | ||||||
|
| |||||||
TELECOMMUNICATION SERVICES – 2.4% |
| |||||||
Diversified Telecommunication Services – 2.4% |
| |||||||
Cogent Communications Group, Inc. | 24,375 | 842,156 | ||||||
inContact, Inc.* | 131,235 | 1,206,050 | ||||||
|
| |||||||
| 2,048,206 | ||||||||
|
| |||||||
TOTAL TELECOMMUNICATION SERVICES |
| 2,048,206 | ||||||
|
| |||||||
TOTAL COMMON STOCK |
| 80,891,354 | ||||||
|
| |||||||
| SHORT-TERM INVESTMENTS – 10.5% | ||||||||
Blackrock Liquidity Funds TempFund Portfolio, Institutional Class, 0.03%** | 8,766,360 | 8,766,360 | ||||||
|
| |||||||
TOTAL SHORT-TERM INVESTMENTS |
| 8,766,360 | ||||||
|
| |||||||
TOTAL INVESTMENTS |
| 89,657,714 | ||||||
LIABILITIESIN EXCESSOF OTHER ASSETS - (6.8%) |
| (5,691,959) | ||||||
|
| |||||||
NET ASSETS - 100.0% |
| $ | 83,965,755 | |||||
|
| |||||||
| * | Non-income producing security. |
| ** | The rate shown represents the 7-day effective yield as of June 30, 2014. |
| † | The cost for federal income tax purposes is $70,535,011. At June 30, 2014, net unrealized appreciation was $19,122,703. This consisted of aggregate gross unrealized appreciation for all securities for which there was an excess of market value over tax cost of $20,024,635, and aggregate gross unrealized depreciation for all securities for which there was an excess of tax cost over market value of $901,932. |
The accompanying notes are an integral part of the financial statements.
8
INVESTMENT REVIEW
How did the Fund perform during the annual period ended June 30, 2014?
The Roxbury/Mar Vista Strategic Growth Fund was up 27.71% for the twelve months ended June 30, 2014 compared to 26.92% for the Fund’s benchmark the Russell 1000® Growth Index for the same period.
What key factors were responsible for the Fund’s performance during the reporting period?
The Federal Reserve’s commitment to keep interest rates low for an extended period has been the key driver of the market’s multiple expansion with earnings growth a distant second. While economic indicators indicate an anemic environment, investors have cheered data suggesting a broader swath of the economy appears to be recovering. The combination of cheap capital with a dearth of organic revenue growth opportunities, as well as an onerous domestic tax code, has led to a frenzied $1.7 trillion wave of mergers and tax-driven inversion arrangements just in the last six months giving more support to stock prices.
Which equity market sectors most significantly affected Fund performance?
During the reporting period, our healthcare holdings appreciated 57% helped by proposed mergers for two of our positions, Allergan and Covidien. In addition, our overall returns in industrials and technology exceeded 30% with particular strength in TransDigm, Union Pacific, Apple, Google, Intuit, Oracle and Qualcomm, all of which appreciated more than 30% over the last twelve months. Consumer discretionary appreciated 28% which exceeded the benchmark return of 21%. We had no stocks that declined over the reporting period but Proctor & Gamble and Baxter lagged with mid-single digit returns.
What are you expecting from the equity markets over the upcoming fiscal year?
The returns we expect over our time horizon (3 to 5 years) are based on the average upside to fair value and the expected growth of our companies’ intrinsic value. Our average discount to intrinsic value is currently less than 10%, the lowest since our inception. With this discount between current prices and fair values unusually compressed, we don’t expect appreciation in the next five years to achieve the above-average returns we’ve enjoyed over the last five years when the starting discount to intrinsic value exceeded 70% and the economy and investor sentiment was moribund.
Sincerely,
Silas A. Myers Portfolio Manager
| Brian L. Massey Portfolio Manager
|


Returns represent past performance and include change in share price and reinvestment of dividends and capital gains. Past performance cannot guarantee future results. The current performance of the Fund may be lower or higher than the figures shown. Returns and shares price will fluctuate, and redemption value may be more or less than original cost. Performance information current to the most recent month-end is available by calling (800) 497-2960.
In addition to historical information, this report contains forward-looking statements which may concern, among other things, the domestic and foreign markets, economic trends and government regulations and their potential impact on the Fund’s investments. These statements are subject to risks and uncertainties and actual developments in the future and their impact on the Fund could be materially different than those that are projected or implied.
Portfolio composition is subject to change.
9
STRATEGIC GROWTH
The following tables are for the year ended June 30, 2014:
| Top Ten Holdings (Unaudited) | % of Portfolio | |||
American Tower Corp. | 4.8 | % | ||
Berkshire Hathaway, Inc. - Class B | 4.0 | % | ||
Oracle Corp. | 3.9 | % | ||
Apple, Inc. | 3.3 | % | ||
Honeywell International, Inc. | 3.3 | % | ||
Markel Corp. | 2.9 | % | ||
Mondelez International, Inc. - Class A | 2.9 | % | ||
Mettler-Toledo International, Inc. | 2.9 | % | ||
Occidental Petroleum Corp. | 2.9 | % | ||
Liberty Global PLC - Class C | 2.8 | % | ||
| Sector Breakdown (Unaudited) | % of Portfolio | |||
Common Stock | ||||
Information Technology | 21.8 | % | ||
Industrials | 14.2 | % | ||
Consumer Discretionary | 12.5 | % | ||
Financials | 11.8 | % | ||
Health Care | 11.5 | % | ||
Consumer Staples | 8.6 | % | ||
Energy | 7.4 | % | ||
Materials | 3.8 | % | ||
Short-Term Investments | 8.4 | % | ||
TOTAL | 100.0 | % | ||
| Portfolio Statistics (Unaudited) | ||||
Number of Holdings | 41 | |||
Market Cap (wtd. Median, mil.) | $120.2 | |||
Price / Book Value (wtd. Avg.) | 4.6 | x | ||
Price / Earnings (wtd. Avg.) | 22.0 | x | ||
Beta | 0.88 | |||
Standard Deviation | 9.83 | % | ||
Portfolio Turnover | 31 | % | ||
QUARTERLY PORTFOLIO HOLDINGS
The Fund files a complete schedule of portfolio holdings with the Securities and Exchange Commission (SEC) for the first and third quarters of each fiscal year on Form N-Q. The Fund’s Forms N-Q are available electronically on the SEC’s website at www.sec.gov. Hard copies may be reviewed and copied at the SEC’s Public Reference Room in Washington, DC. For more information on the Public Reference Room, call 1-800-SEC-0330.
Portfolio holdings are subject to change at any time.
10
ROXBURY/MAR VISTA STRATEGIC GROWTH FUND
Roxbury/Mar Vista Strategic Growth Fund
Comparison of Change in Value of a Hypothetical $100,000 Investment* (Unaudited)
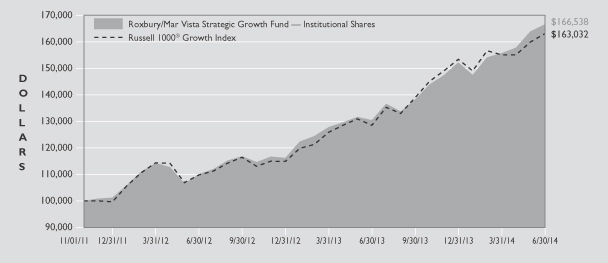
The following table compares the performance of the Roxbury/Mar Vista Strategic Growth Fund and the Russell 1000® Growth Index for the periods ended June 30.
| Average Annual Total Return For the Periods Ended June 30, 2014 | ||||||||
| 1 Year | Since Inception1 | |||||||
Roxbury/Mar Vista Strategic Growth Fund Institutional Shares | 27.71% | 21.11% | ||||||
Russell 1000® Growth Index2 | 26.92% | 21.29% | ||||||
Fund Expense Ratios3: Institutional Shares: Gross 4.01%, Net 0.91%.
| * | Performance quoted represents past performance and does not guarantee future results. Investment return and principal value will fluctuate. Shares, when redeemed, may be worth more or less than their original cost. Current performance may be lower or higher than that shown here. Performance data current to the most recent month-end is available by calling (800) 497-2960. |
The performance in the table above does not reflect the deduction of taxes a shareholder would pay on Fund distributions or redemption of Fund shares.
Shareholders should consider the investment objectives, risks, charges and expenses of the Fund carefully before investing. The Fund’s prospectus contains this and other important information about the Fund. For a copy of the prospectus, call (800) 497-2960. Please read carefully before investing.
| 1 | The Institutional Shares commenced operations on November 1, 2011. |
| 2 | The Russell 1000® Growth Index measures the performance of the large-cap growth segment of the U.S. equity universe. It includes those Russell 1000® Index companies with higher price-to-book ratios and higher forecasted growth values. |
| 3 | The expense ratios of the Fund are set forth according to the prospectus for the Fund effective November 1, 2013 and may differ from the expense ratios disclosed in the Financial Highlights tables in this report. Net Expense: Expenses reduced by a contractual fee waiver through [November 1, 2014.] Gross expenses do not reflect the effect of a contractual fee waiver. |
11
STRATEGIC GROWTH
SCHEDULE OF INVESTMENTS JUNE 30, 2014
| Shares | Value (Note 2) | |||||||
| COMMON STOCK – 91.6% | ||||||||
CONSUMER DISCRETIONARY – 12.5% |
| |||||||
Hotels, Restaurants & Leisure – 2.6% |
| |||||||
Starbucks Corp. | 4,595 | $ | 355,561 | |||||
|
| |||||||
Media – 8.5% |
| |||||||
Comcast Corp. - Class A | 5,776 | 308,034 | ||||||
Discovery Communications, Inc. - Class C* | 3,920 | 284,553 | ||||||
Liberty Global PLC - Class C* | 9,014 | 381,382 | ||||||
Walt Disney Co. (The) | 2,292 | 196,516 | ||||||
|
| |||||||
| 1,170,485 | ||||||||
|
| |||||||
Textiles, Apparel & Luxury Goods – 1.4% |
| |||||||
Nike, Inc. - Class B | 2,415 | 187,283 | ||||||
|
| |||||||
TOTAL CONSUMER DISCRETIONARY |
| 1,713,329 | ||||||
|
| |||||||
CONSUMER STAPLES – 8.6% |
| |||||||
Beverages – 3.8% |
| |||||||
Anheuser-Busch InBev NV, ADR | 2,820 | 324,131 | ||||||
PepsiCo, Inc. | 2,249 | 200,926 | ||||||
|
| |||||||
| 525,057 | ||||||||
|
| |||||||
Food Products – 2.9% |
| |||||||
Mondelez International, Inc. - Class A | 10,523 | 395,770 | ||||||
|
| |||||||
Household Products – 1.9% |
| |||||||
Procter & Gamble Co. (The) | 3,242 | 254,789 | ||||||
|
| |||||||
TOTAL CONSUMER STAPLES |
| 1,175,616 | ||||||
|
| |||||||
ENERGY – 7.4% |
| |||||||
Energy, Equipment & Services – 2.6% |
| |||||||
Schlumberger Ltd. | 2,954 | 348,424 | ||||||
|
| |||||||
Oil, Gas & Consumable Fuels – 4.8% |
| |||||||
Exxon Mobil Corp. | 2,708 | 272,641 | ||||||
Occidental Petroleum Corp. | 3,800 | 389,994 | ||||||
|
| |||||||
| 662,635 | ||||||||
|
| |||||||
TOTAL ENERGY |
| 1,011,059 | ||||||
|
| |||||||
FINANCIALS – 11.7% |
| |||||||
Insurance – 6.9% |
| |||||||
Berkshire Hathaway, Inc. - Class B* | 4,351 | 550,663 | ||||||
Markel Corp.* | 611 | 400,596 | ||||||
|
| |||||||
| 951,259 | ||||||||
|
| |||||||
Real Estate Investment Trusts – 4.8% |
| |||||||
American Tower Corp. | 7,299 | 656,764 | ||||||
|
| |||||||
TOTAL FINANCIALS |
| 1,608,023 | ||||||
|
| |||||||
HEALTH CARE – 11.5% |
| |||||||
Health Care Equipment & Supplies – 5.3% |
| |||||||
Baxter International, Inc. | 2,140 | 154,722 | ||||||
Covidien PLC | 3,375 | 304,358 | ||||||
St. Jude Medical, Inc. | 3,968 | 274,784 | ||||||
|
| |||||||
| 733,864 | ||||||||
|
| |||||||
| Shares | Value (Note 2) | |||||||
| COMMON STOCK – continued | ||||||||
Life Sciences Tools & Services – 2.9% |
| |||||||
Mettler-Toledo International, Inc* | 1,548 | $ | 391,923 | |||||
|
| |||||||
Pharmaceuticals – 3.3% |
| |||||||
Allergan, Inc. | 1,561 | 264,152 | ||||||
Johnson & Johnson | 1,753 | 183,399 | ||||||
|
| |||||||
| 447,551 | ||||||||
|
| |||||||
TOTAL HEALTH CARE |
| 1,573,338 | ||||||
|
| |||||||
INDUSTRIALS – 14.2% |
| |||||||
Aerospace & Defense – 10.3% |
| |||||||
B/E Aerospace, Inc.* | 3,757 | 347,485 | ||||||
Boeing Co. (The) | 1,994 | 253,697 | ||||||
Honeywell International, Inc. | 4,812 | 447,275 | ||||||
TransDigm Group, Inc. | 2,140 | 357,936 | ||||||
|
| |||||||
| 1,406,393 | ||||||||
|
| |||||||
Electrical Equipment – 2.1% |
| |||||||
Sensata Technologies Holding NV* | 6,122 | 286,387 | ||||||
|
| |||||||
Road & Rail – 1.8% |
| |||||||
Union Pacific Corp. | 2,524 | 251,769 | ||||||
|
| |||||||
TOTAL INDUSTRIALS |
| 1,944,549 | ||||||
|
| |||||||
INFORMATION TECHNOLOGY – 21.9% |
| |||||||
Communications Equipment – 2.7% |
| |||||||
QUALCOMM, Inc. | 4,612 | 365,270 | ||||||
|
| |||||||
Computers & Peripherals – 4.7% |
| |||||||
Apple, Inc. | 4,837 | 449,502 | ||||||
EMC Corp. | 7,156 | 188,489 | ||||||
|
| |||||||
| 637,991 | ||||||||
|
| |||||||
Internet Software & Services – 3.0% |
| |||||||
GOOGLE, Inc. - Class A* | 252 | 147,337 | ||||||
GOOGLE, Inc. - Class C* | 457 | 262,903 | ||||||
|
| |||||||
| 410,240 | ||||||||
|
| |||||||
IT Services – 1.5% |
| |||||||
Visa, Inc. - Class A | 965 | 203,335 | ||||||
|
| |||||||
Semiconductors & Semiconductor Equipment – 2.4% |
| |||||||
Analog Devices, Inc. | 6,015 | 325,231 | ||||||
|
| |||||||
Software – 7.6% |
| |||||||
Adobe Systems, Inc.* | 3,084 | 223,158 | ||||||
Intuit, Inc. | 3,537 | 284,835 | ||||||
Oracle Corp. | 13,322 | 539,941 | ||||||
|
| |||||||
| 1,047,934 | ||||||||
|
| |||||||
TOTAL INFORMATION TECHNOLOGY |
| 2,990,001 | ||||||
|
| |||||||
The accompanying notes are an integral part of the financial statements.
12
ROXBURY/MAR VISTA STRATEGIC GROWTH FUND
SCHEDULE OF INVESTMENTS JUNE 30, 2014 continued
| Shares | Value (Note 2) | |||||||
| COMMON STOCK – continued | ||||||||
MATERIALS – 3.8% |
| |||||||
Chemicals – 3.8% |
| |||||||
Ecolab Inc. | 2,366 | $ | 263,430 | |||||
Praxair, Inc. | 1,914 | 254,256 | ||||||
|
| |||||||
| 517,686 | ||||||||
|
| |||||||
TOTAL MATERIALS |
| 517,686 | ||||||
|
| |||||||
TOTAL COMMON STOCK |
| 12,533,601 | ||||||
|
| |||||||
| SHORT-TERM INVESTMENTS – 8.5% | ||||||||
Blackrock Liquidity Funds | 1,155,821 | 1,155,821 | ||||||
|
| |||||||
TOTAL SHORT-TERM INVESTMENTS |
| 1,155,821 | ||||||
|
| |||||||
TOTAL INVESTMENTS |
| 13,689,422 | ||||||
LIABILITIESIN EXCESSOF OTHER ASSETS - (0.1%) |
| (11,785) | ||||||
|
| |||||||
NET ASSETS - 100.0% |
| $ | 13,677,637 | |||||
|
| |||||||
| ADR | American Depositary Receipt |
| PLC | Public Limited Company |
| * | Non-income producing security. |
| ** | The rate shown represents the 7-day effective yield as of June 30, 2014. |
| † | The cost for federal income tax purposes is $10,551,540. At June 30, 2014, net unrealized appreciation was $3,137,882. This consisted of aggregate gross unrealized appreciation for all securities for which there was an excess of market value over tax cost of $3,137,882. |
The accompanying notes are an integral part of the financial statements.
13
This page left blank intentionally
STATEMENTS OF ASSETS AND LIABILITIES
June 30, 2014
| Roxbury/ Hood River Small-Cap Growth Fund | Roxbury/ Mar Vista Strategic Growth Fund | |||||||
Assets: | ||||||||
Investments in securities, at value* | $ | 89,657,714 | $ | 13,689,422 | ||||
Receivable for Fund shares sold | 6,930 | 25,000 | ||||||
Receivables for investments sold | 481,283 | — | ||||||
Dividends and interest receivable | 41,397 | 15,316 | ||||||
Other assets | 12,869 | 8,822 | ||||||
|
|
|
| |||||
Total assets | 90,200,193 | 13,738,560 | ||||||
|
|
|
| |||||
Liabilities: | ||||||||
Payable for Fund shares redeemed | 291,175 | 4,680 | ||||||
Payable for investments purchased | 5,819,836 | — | ||||||
Accrued advisory fee | 63,261 | 5,430 | ||||||
Other accrued expenses | 60,166 | 50,813 | ||||||
|
|
|
| |||||
Total liabilities | 6,234,438 | 60,923 | ||||||
|
|
|
| |||||
Net Assets | $ | 83,965,755 | $ | 13,677,637 | ||||
|
|
|
| |||||
Net Assets consist of: | ||||||||
Par value | $ | 28,866 | $ | 8,878 | ||||
Paid-in capital | 73,091,334 | 9,977,282 | ||||||
Accumulated net investment loss | (384,774 | ) | — | |||||
Accumulated net realized gain/(loss) on investments | (8,129,706 | ) | 543,977 | |||||
Net unrealized appreciation of investments | 19,360,035 | 3,147,500 | ||||||
|
|
|
| |||||
Net Assets | $ | 83,965,755 | $ | 13,677,637 | ||||
|
|
|
| |||||
Net assets by share class: | ||||||||
Institutional Shares | $ | 83,965,755 | $ | 13,677,637 | ||||
|
|
|
| |||||
Shares of beneficial interest outstanding: | ||||||||
($0.01 par value, unlimited authorized shares): | ||||||||
Institutional Shares | 2,886,616 | 887,833 | ||||||
Per Share: | ||||||||
Institutional Shares (net asset value, offering and redemption price**) | $ | 29.09 | $ | 15.41 | ||||
|
|
|
|
| ||||
* Investments at cost | $ | 70,297,679 | $ | 10,541,922 | ||||
|
|
|
| |||||
| **Redemption | price will vary based on length of time shares are held. See Note 6. |
The accompanying notes are an integral part of the financial statements.
15
THE ROXBURY FUNDS
For the Year Ended June 30, 2014
| Roxbury/ Hood River Small-Cap Growth Fund | Roxbury/ Mar Vista Strategic Growth Fund | |||||||
Investment Income: | ||||||||
Dividends | $ | 300,538 | $ | 159,471 | ||||
Foreign tax withheld | (741 | ) | (2,401 | ) | ||||
|
|
|
| |||||
Total investment income | 299,797 | 157,070 | ||||||
|
|
|
| |||||
Expenses: | ||||||||
Advisory fees (Note 3) | 694,154 | 79,501 | ||||||
Administration and accounting fees | 80,710 | 36,978 | ||||||
Transfer agent fees | 55,963 | 22,313 | ||||||
Legal fees | 54,896 | 55,412 | ||||||
Insurance expense | 41,462 | 12,573 | ||||||
Registration fees | 24,054 | 25,561 | ||||||
Trustees’ and Officers’ fees | 21,500 | 21,500 | ||||||
Custody fees | 15,286 | 9,455 | ||||||
Audit fees | 18,800 | 18,800 | ||||||
Reports to shareholders | 14,699 | 12,654 | ||||||
Other | 6,941 | 1,060 | ||||||
|
|
|
| |||||
Total expenses before fee waivers and expense reimbursements | 1,028,465 | 295,807 | ||||||
|
|
|
| |||||
Advisory fees waived/expenses reimbursed (Note 3) | (160,720 | ) | (200,352 | ) | ||||
|
|
|
| |||||
Total expenses, net | 867,745 | 95,455 | ||||||
|
|
|
| |||||
Net investment income/(loss) | (567,948 | ) | 61,615 | |||||
Net realized and unrealized gain/(loss) on investments: | ||||||||
Net realized gain on investments | 10,789,686 | 637,351 | ||||||
Net change in unrealized appreciation on investments | 4,618,340 | 1,896,785 | ||||||
|
|
|
| |||||
Net gain on investments | 15,408,026 | 2,534,136 | ||||||
|
|
|
| |||||
Net increase in net assets resulting from operations | $ | 14,840,078 | $ | 2,595,751 | ||||
|
|
|
| |||||
The accompanying notes are an integral part of the financial statements.
16
FINANCIAL STATEMENTS
STATEMENTS OF CHANGES IN NET ASSETS
| Roxbury/ Hood River Small-Cap Growth Fund | Roxbury/ Mar Vista Strategic Growth Fund | |||||||||||||||
| For the Year Ended June 30, 2014 | For the Year Ended June 30, 2013 | For the Year Ended June 30, 2014 | For the Year Ended June 30, 2013 | |||||||||||||
Increase/(Decrease) in Net Assets: | ||||||||||||||||
Operations: | ||||||||||||||||
Net investment income/(loss) | $ | (567,948 | ) | $ | (342,281 | ) | $ | 61,615 | $ | 63,886 | ||||||
Net realized gain on investments | 10,789,686 | 11,928,881 | 637,351 | 368,874 | ||||||||||||
Net change in unrealized appreciation on investments | 4,618,340 | 4,572,481 | 1,896,785 | 888,954 | ||||||||||||
|
|
|
|
|
|
|
| |||||||||
Net increase in net assets resulting from operations | 14,840,078 | 16,159,081 | 2,595,751 | 1,321,714 | ||||||||||||
|
|
|
|
|
|
|
| |||||||||
Distributions to shareholders from: | ||||||||||||||||
Net investment income | — | — | (103,328 | ) | (77,850 | ) | ||||||||||
Net realized gains | — | — | (452,078 | ) | (53,676 | ) | ||||||||||
|
|
|
|
|
|
|
| |||||||||
Total Distributions | — | — | (555,406 | ) | (131,526 | ) | ||||||||||
|
|
|
|
|
|
|
| |||||||||
Fund share transactions: | ||||||||||||||||
Institutional Class | ||||||||||||||||
Proceeds from shares sold | 25,437,627 | 10,159,701 | 4,377,479 | 2,734,925 | ||||||||||||
Cost of shares issued on reinvestment of distributions | — | — | 393,510 | 68,719 | ||||||||||||
Redemption fees | 4,033 | 2,431 | 32 | 170 | ||||||||||||
Cost of shares redeemed | (16,208,751 | ) | (24,071,586 | ) | (1,798,363 | ) | (1,812,642 | ) | ||||||||
|
|
|
|
|
|
|
| |||||||||
Net increase/(decrease) in net assets from Fund share transactions | 9,232,909 | (13,909,454 | ) | 2,972,658 | 991,172 | |||||||||||
|
|
|
|
|
|
|
| |||||||||
Total increase in net assets | 24,072,987 | 2,249,627 | 5,013,003 | 2,181,360 | ||||||||||||
Net Assets: | ||||||||||||||||
Beginning of year | 59,892,768 | 57,643,141 | 8,664,634 | 6,483,274 | ||||||||||||
|
|
|
|
|
|
|
| |||||||||
End of year | $ | 83,965,755 | $ | 59,892,768 | $ | 13,677,637 | $ | 8,664,634 | ||||||||
|
|
|
|
|
|
|
| |||||||||
Accumulated net investment income/(loss) | $ | (384,774 | ) | $ | (265,187 | ) | $ | — | $ | 31,844 | ||||||
|
|
|
|
|
|
|
| |||||||||
Capital share transactions: | ||||||||||||||||
Institutional Class | ||||||||||||||||
Shares sold | 914,985 | 496,050 | 309,565 | 231,982 | ||||||||||||
Shares reinvested | — | — | 28,913 | 6,017 | ||||||||||||
Shares redeemed | (598,207 | ) | (1,178,566 | ) | (127,576 | ) | (150,197 | ) | ||||||||
|
|
|
|
|
|
|
| |||||||||
Net increase/(decrease) in capital shares | 316,778 | (682,516 | ) | 210,902 | 87,802 | |||||||||||
|
|
|
|
|
|
|
| |||||||||
The accompanying notes are an integral part of the financial statements.
17
The following table includes selected data for a share outstanding throughout each year and other performance information derived from the financial statements. The total returns in the table represent the rate an investor would have earned or lost on an investment in the Fund (assuming reinvestment of all dividends and distributions). This information should be read in conjunction with the financial statements and notes thereto.
| For the Years Ended June 30, | ||||||||||||||||||||
| 2014 | 2013 | 2012 | 2011 | 2010 | ||||||||||||||||
Roxbury/Hood River Small-Cap Growth Fund — Institutional Shares | ||||||||||||||||||||
Net Asset Value — Beginning of Year | $ | 23.31 | $ | 17.72 | $ | 18.40 | $ | 13.24 | $ | 10.84 | ||||||||||
|
|
|
|
|
|
|
|
|
| |||||||||||
Investment Operations: | ||||||||||||||||||||
Net investment loss1 | (0.22 | ) | (0.12 | ) | (0.15 | ) | (0.16 | ) | (0.12 | ) | ||||||||||
Net realized and unrealized gain/(loss) on investments | 6.00 | 5.71 | (0.53 | ) | 5.32 | 2.52 | ||||||||||||||
|
|
|
|
|
|
|
|
|
| |||||||||||
Total from investment operations | 5.78 | 5.59 | (0.68 | ) | 5.16 | 2.40 | ||||||||||||||
|
|
|
|
|
|
|
|
|
| |||||||||||
Redemption fees | — | 2 | — | 2 | — | 2 | — | 2 | — | 2 | ||||||||||
|
|
|
|
|
|
|
|
|
| |||||||||||
Net Asset Value — End of Year | $ | 29.09 | $ | 23.31 | $ | 17.72 | $ | 18.40 | $ | 13.24 | ||||||||||
|
|
|
|
|
|
|
|
|
| |||||||||||
Total Return | 24.80% | 31.55% | (3.70)% | 38.97% | 22.14% | |||||||||||||||
Ratios (to average net assets)/Supplemental Data: |
| |||||||||||||||||||
Expenses: | ||||||||||||||||||||
Including waivers/reimbursements | 1.25% | 1.25% | 1.25% | 1.25% | 1.25% | |||||||||||||||
Excluding waivers/reimbursements | 1.48% | 1.59% | 1.57% | 1.53% | 1.45% | |||||||||||||||
Net investment loss | (0.82)% | (0.58)% | (0.88)% | (0.96)% | (0.92)% | |||||||||||||||
Portfolio turnover rate | 115% | 119% | 138% | 181% | 194% | |||||||||||||||
Net assets at the end of year | $ | 83,966 | $ | 59,893 | $ | 57,643 | $ | 99,054 | $ | 94,207 | ||||||||||
| 1 | The net investment loss per share was calculated using the average shares outstanding method. |
| 2 | Amount is less than $0.01. |
The accompanying notes are an integral part of the financial statements.
18
FINANCIAL HIGHLIGHTS
The following table includes selected data for a share outstanding throughout each period and other performance information derived from the financial statements. The total return in the table represents the rate an investor would have earned or lost on an investment in the Fund (assuming reinvestment of all dividends and distributions). This information should be read in conjunction with the financial statements and notes thereto.
| For the Year Ended June 30, 2014 | For the Year Ended June 30, 2013 | For the Period Ended June 30, 20121 | ||||||||||
Roxbury/Mar Vista Strategic Growth Fund — Institutional Shares | ||||||||||||
Net Asset Value — Beginning of Period | $ | 12.80 | $ | 11.00 | $ | 10.00 | ||||||
|
|
|
|
|
| |||||||
Investment Operations: | ||||||||||||
Net investment income2 | 0.08 | 0.10 | 0.08 | |||||||||
Net realized and unrealized gain on investments | 3.35 | 1.92 | 0.92 | |||||||||
|
|
|
|
|
| |||||||
Total from investment operations | 3.43 | 2.02 | 1.00 | |||||||||
|
|
|
|
|
| |||||||
Distributions: | ||||||||||||
From net investment income | (0.15 | ) | (0.13 | ) | — | |||||||
From net realized gains | (0.67 | ) | (0.09 | ) | — | |||||||
|
|
|
|
|
| |||||||
Total distributions | (0.82 | ) | (0.22 | ) | — | |||||||
Redemption fees | — | 3 | — | 3 | — | 3 | ||||||
|
|
|
|
|
| |||||||
Net Asset Value — End of Period | $ | 15.41 | $ | 12.80 | $ | 11.00 | ||||||
|
|
|
|
|
| |||||||
Total Return | 27.71% | 18.55% | 10.00% | ** | ||||||||
Ratios (to average net assets)/Supplemental Data: |
| |||||||||||
Expenses: | ||||||||||||
Including waivers/reimbursements | 0.90% | 0.90% | 0.90% | * | ||||||||
Excluding waivers/reimbursements | 2.79% | 3.99% | 4.85% | * | ||||||||
Net investment income | 0.58% | 0.82% | 1.12% | * | ||||||||
Portfolio turnover rate | 31% | 59% | 27% | ** | ||||||||
Net assets at the end of period | $ | 13,678 | $ | 8,665 | $ | 6,483 | ||||||
| * | Annualized |
| ** | Not Annualized |
| 1 | Operations commenced on November 1, 2011. |
| 2 | The net investment income per share was calculated using the average shares outstanding method. |
| 3 | Amount is less than $0.01. |
The accompanying notes are an integral part of the financial statements.
19
| 1. | Description of the Funds. The Roxbury/Hood River Small-Cap Growth Fund (“Small-Cap Growth Fund”) and the Roxbury/Mar Vista Strategic Growth Fund (“Strategic Growth Fund”) (the “Funds”) are each a series of The Roxbury Funds (the “Trust”). The Trust is registered under the Investment Company Act of 1940, as amended (the “1940 Act”), as a diversified open-end investment management company and was organized as a Delaware statutory trust on April 4, 2006. The fiscal year end for the Funds is June 30th. |
As of June 30, 2014, each of the Funds offers one class of shares: Institutional Shares.
| 2. | Significant Accounting Policies. The following is a summary of the significant accounting policies of the Funds: |
Use of Estimates in the Preparation of Financial Statements. The preparation of financial statements in conformity with accounting principles generally accepted in the United States of America (“GAAP”) requires management to make estimates and assumptions that affect the reported amounts of assets and liabilities and the disclosure of contingent assets and liabilities at the date of the financial statements and the reported amounts of increases and decreases in net assets from operations during the reporting period. Actual results could differ from those estimates.
Security Valuation. Securities held by the Funds which are listed on a securities exchange and for which market quotations are available are valued at the last quoted sale price of the day, or, if there is no such reported sale, securities are valued at the mean between the most recent quoted bid and ask prices. Securities traded on The NASDAQ Stock Market, Inc. (“NASDAQ”) are valued in accordance with the NASDAQ Official Closing Price, which may not be the last sale price. Price information for listed securities is taken from the exchange where the security is primarily traded. Unlisted securities for which market quotations are readily available are valued at the most recent bid prices. Securities with a remaining maturity of 60 days or less are valued at amortized cost, which approximates market value, unless the Trustees determine that this does not represent fair value. Securities that do not have a readily available current market value are valued in good faith using procedures adopted by the Trustees.
Fair Value Measurements. The inputs and valuation techniques used to measure the fair value of the Funds’ investments are summarized into three levels as described in the hierarchy below:
| • Level 1 — | quoted prices in active markets for identical securities | |
| • Level 2 — | other significant observable inputs (including quoted prices for similar securities, interest rates, prepayment speeds, credit risk, etc.) | |
| • Level 3 — | significant unobservable inputs (including the Funds’ own assumptions in determining the fair value of investments) | |
The inputs or methodologies used for valuing securities are not necessarily an indication of the risk associated with investing in those securities. The following is a summary of the inputs used, as of June 30, 2014, in valuing each Fund’s investments carried at fair value:
Small-Cap Growth Fund
| Total Value at June 30, 2014 | Level 1 Quoted Price | Level 2 Other Significant Observable Inputs | Level 3 Significant Unobservable Inputs | |||||||||||||
Investments in Securities* | $ | 89,657,714 | $ | 89,657,714 | $ | — | $ | — | ||||||||
Strategic Growth Fund
| Total Value at June 30, 2014 | Level 1 Quoted Price | Level 2 Other Significant Observable Inputs | Level 3 Significant Unobservable Inputs | |||||||||||||
Investments in Securities* | $ | 13,689,422 | $ | 13,689,422 | $ | — | $ | — | ||||||||
*Common stocks and short-term investments are Level 1. Please refer to the schedule of investments for industry or sector breakout.
At the end of each calendar quarter, management evaluates the classification of Levels 1,2 and 3 assets and liabilities. Various factors are considered, such as changes in liquidity from the prior reporting period; whether or not a broker is willing to execute at the quoted price; the depth and consistency of prices from third party pricing services; and the existence of contemporaneous, observable trades in the market. Additionally, management evaluates the classification of Level 1 and Level 2 assets and liabilities on a quarterly basis for changes in listings or delistings on national exchanges.
Due to the inherent uncertainty of determining the fair value of investments that do not have a readily available market value, the fair value of each Fund’s investments may fluctuate from period to period. Additionally, the fair value of investments may differ significantly from the values that would have been used had a ready market existed for such investments and may differ materially from the values the Funds may ultimately realize. Further, such investments may be subject to legal and other restrictions on resale or may be otherwise less liquid than publicly traded securities.
20
NOTES TO FINANCIAL STATEMENTS
For the year ended June 30, 2014, there were no transfers between Levels 1, 2 and 3 for the Funds. It is each Fund’s policy to recognize transfers at the end of the reporting period.
Federal Income Taxes. The Funds are treated as separate entities for Federal income tax purposes and intend to continue to qualify as “regulated investment companies” under Subchapter M of the Internal Revenue Code of 1986, as amended, and to distribute substantially all of their income to their shareholders. Therefore, no Federal income tax provision has been made.
Management has analyzed the Funds’ tax positions taken on Federal income tax returns for all open tax years (current and prior three tax years) and has concluded that no provision for Federal income tax is required in the Funds’ financial statements. The Funds’ Federal and state income and Federal excise tax returns for tax years for which the applicable statutes of limitations have not expired are subject to examination by the Internal Revenue Service and state departments of revenue.
Security Transactions, Investment Income and Expenses. Investment security transactions are accounted for on a trade date basis. The Funds use the specific identification method for determining realized gains and losses on investments for both financial and Federal income tax reporting purposes. Interest income is recorded on the accrual basis and includes the amortization of premium and the accretion of discount. Dividend income is recorded on the ex-dividend date. The Funds record expenses on an accrual basis. General expenses of the Trust are generally allocated to each Fund in proportion to its relative daily net assets. Expenses directly attributable to a particular Fund in the Trust are charged directly to that Fund.
Distributions to Shareholders. Dividends and distributions to shareholders are recorded on the ex-dividend date. Distributions from net investment income and net realized gains, if any, will be declared and paid annually.
| 3. | Fees and Other Transactions with Related Parties. Roxbury Capital Management, LLC (“Roxbury”) serves as investment adviser to the Funds. For its services, Roxbury receives a fee from the Funds at annual rates as follows: |
% of Average Daily Net Assets | ||
Small-Cap Growth Fund | 1.00% up to $1 billion; 0.95% of next $1 billion; and 0.90% in excess of $2 billion | |
Strategic Growth Fund | 0.75% |
Mar Vista Investment Partners, LLC (“Mar Vista”), serves as the sub-adviser to the Strategic Growth Fund subject to the supervision of Roxbury. Hood River Capital Management LLC (“Hood River”) serves as the sub-adviser to the Small-Cap Growth Fund subject to the supervision of Roxbury. Sub-advisory fees with respect to each Fund are paid by Roxbury.
Roxbury has contractually agreed to waive a portion of its advisory fees or reimburse for other operating expenses (excluding taxes, extraordinary expenses, brokerage commissions and interest) to the extent that total annual Fund operating expenses exceed the following percentages of average daily net assets:
| Expense Cap | Expiration Date | |||||||
Small-Cap Growth Fund | 1.25 | % | December 31, 2020 | |||||
Strategic Growth Fund | 0.90 | % | [November 1, 2014 | ] | ||||
Compensation of Trustees and Officers. The Funds pay each Trustee who is not an interested person of the Funds a fee of $5,000 per year plus $2,000 for each regularly scheduled Board or Committee meeting, attended in person or by telephone; $2,000 for each special Board or Committee meeting attended in person and $200 for each special Board or Committee meeting attended by telephone. Each Trustee is reimbursed for reasonable out-of-pocket expenses incurred in connection with attendance at Board or Committee meetings. The Chairman is paid an additional fee of $1,000 per year. The Funds pay the Chief Compliance Officer a fee of $8,000 per year. Michael P. Malloy, Secretary of the Funds, is a partner of Drinker Biddle & Reath LLP, which received legal fees from the Funds.
| 4. | Other Service Providers. BNY Mellon Investment Servicing (US) Inc. (“BNY Mellon”) provides administrative and accounting services to the Funds pursuant to an Accounting and Administrative Services Agreement. |
The Bank of New York Mellon serves as custodian to the Trust pursuant to a Custodian Services Agreement.
| 5. | Investment Securities Transactions. During the fiscal year ended June 30, 2014, purchases and sales of investment securities (excluding short-term investments) were as follows: |
| Small-Cap Growth Fund | Strategic Growth Fund | |||||||
Purchases | $ | 86,645,115 | $ | 5,002,784 | ||||
Sales | 78,113,395 | 3,115,606 | ||||||
| 6. | Redemption Fees. In accordance with the prospectus, the Funds charge a redemption fee of 1% on proceeds from shares redeemed within 60 days following their acquisition. The redemption fee is included as a separate line item under the Fund share transactions section on the Statements of Changes in Net Assets. |
21
THE ROXBURY FUNDS
NOTES TO FINANCIAL STATEMENTS continued
| 7. | Federal Tax Information. Distributions to shareholders from net investment income and realized gains are determined in accordance with Federal income tax regulations, which may differ from net investment income and realized gains recognized for financial reporting purposes. Accordingly, the character of distributions and composition of net assets for tax purposes may differ from those reflected in the accompanying financial statements. To the extent these differences are permanent, such amounts are reclassified within the capital accounts based on the tax treatment; temporary differences do not require such reclassification. On June 30, 2014, the following reclassifications were made within the capital accounts to reflect permanent differences relating to net operating losses: |
| Small-Cap Growth Fund | Strategic Growth Fund | |||||||
Paid-in capital | $ | (448,361 | ) | $ | — | |||
Undistributed net investment income/(loss) | 448,361 | 9,869 | ||||||
Accumulated net realized gain/(loss) | — | (9,869 | ) | |||||
The tax character of distributions paid for the fiscal year ended June 30, 2014 was as follows:
| Small-Cap Growth Fund | Strategic Growth Fund | |||||||
Distribution paid from: | ||||||||
Ordinary income | $ | — | $ | 288,914 | ||||
Long term capital gains | — | 266,492 | ||||||
|
|
|
| |||||
Total taxable distribution | $ | — | $ | 555,406 | ||||
|
|
|
| |||||
The tax character of distributions paid for the fiscal year ended June 30, 2013 was as follows:
| Small-Cap Growth Fund | Strategic Growth Fund | |||||||
Distribution paid from: | ||||||||
Ordinary income | $ | — | $ | 131,526 | ||||
Long term capital gains | — | — | ||||||
|
|
|
| |||||
Total taxable distribution | $ | — | $ | 131,526 | ||||
|
|
|
| |||||
Under federal tax law, qualified late year ordinary and capital losses realized after December 31 and October 31, respectively, may be deferred and treated as occurring on the first day of the following fiscal year. For the fiscal year ended June 30, 2014, the Small-Cap Growth Fund incurred a late year ordinary loss of $384,774 which it will elect to defer to the fiscal year ended June 30, 2015. For the fiscal year ended June 30, 2014, the Strategic Growth Fund incurred no late year losses.
As of June 30, 2014, the components of accumulated undistributed earnings/(deficit) on a tax basis were as follows:
| Small-Cap Growth Fund | Strategic Growth Fund | |||||||
Undistributed ordinary income | $ | — | $ | 172,402 | ||||
Accumulated long-term capital gains | — | 381,193 | ||||||
Capital loss carryforwards | (7,892,374 | ) | — | |||||
Qualified late year loss deferrals | (384,774 | ) | — | |||||
Net unrealized appreciation on investments | 19,122,703 | 3,137,882 | ||||||
|
|
|
| |||||
Total accumulated undistributed earnings/(deficit) | $ | 10,845,555 | $ | 3,691,477 | ||||
|
|
|
| |||||
The difference between the book basis and tax basis components of accumulated earnings/(deficit) are attributable to the deferral of losses on wash sales and tax treatment of short-term capital gains.
For federal income tax purposes, capital loss carryforwards are available to offset future capital gains. As of June 30, 2014, the Small-Cap Growth Fund had capital loss carryforwards of $7,892,374, which will expire on June 30, 2018. As of June 30, 2014, the Strategic Growth Fund had no capital loss carryforwards. Under the enacted Regulated Investment Company Modernization Act of 2010, capital losses incurred by the Funds after June 30, 2011 will not be subject to expiration. In addition, these losses must be utilized prior to the losses incurred in pre-enactment taxable years.
| 8. | Contractual Obligations. The Funds enter into contracts in the normal course of business that contain a variety of indemnifications. The Funds’ maximum exposure under these arrangements is dependent on claims that may be made against the Funds in the future, and therefore, cannot be estimated. However, based on experience, the risk of material loss for such claims is considered remote. |
| 9. | Subsequent Events. |
Management has evaluated the impact of all subsequent events on the Funds through the date the financial statements were issued and has determined that there were no disclosure required as a result of subsequent events.
22
REPORT TO SHAREHOLDERS
REPORT OF INDEPENDENT REGISTERED PUBLIC ACCOUNTING FIRM
To the Board of Trustees of The Roxbury Funds
and the Shareholders of the Roxbury/Hood River Small-Cap Growth Fund
and the Roxbury/Mar Vista Strategic Growth Fund
We have audited the accompanying statements of assets and liabilities of the Roxbury/Hood River Small-Cap Growth Fund and the Roxbury/Mar Vista Strategic Growth Fund, each a series of The Roxbury Funds (the “Funds”), including the schedules of investments, as of June 30, 2014, and the related statements of operations for the year then ended, the statements of changes in net assets for each of the two years in the period then ended and the financial highlights for each of the years and period presented in the five-year period then ended. These financial statements and financial highlights are the responsibility of the Funds’ management. Our responsibility is to express an opinion on these financial statements and financial highlights based on our audits.
We conducted our audits in accordance with the standards of the Public Company Accounting Oversight Board (United States). Those standards require that we plan and perform the audits to obtain reasonable assurance about whether the financial statements and financial highlights are free of material misstatement. An audit includes examining, on a test basis, evidence supporting the amounts and disclosures in the financial statements. Our procedures included confirmation of securities owned as of June 30, 2014 by correspondence with the custodian and brokers or by other appropriate auditing procedures where replies from brokers were not received. An audit also includes assessing the accounting principles used and significant estimates made by management, as well as evaluating the overall financial statement presentation. We believe that our audits provide a reasonable basis for our opinion.
In our opinion, the financial statements and financial highlights referred to above present fairly, in all material respects, the financial position of the Roxbury/Hood River Small-Cap Growth Fund and the Roxbury/Mar Vista Strategic Growth Fund as of June 30, 2014, and the results of their operations for the year then ended, the changes in their net assets for each of the two years in the period then ended and their financial highlights for each of the years and period presented in the five-year period then ended, in conformity with accounting principles generally accepted in the United States of America.

BBD, LLP
Philadelphia, Pennsylvania
August 27, 2014
23
For individual shareholders, a percentage of their ordinary income dividends (dividend income plus short-term gains, if any) may qualify for a maximum tax rate of 20%. Complete information is computed and reported in conjunction with your Form 1099-DIV.
In addition, for corporate shareholders, a percentage of their ordinary income distributions qualifies for the dividends-received deduction (“DRD”).
For the fiscal year ended June 30, 2014, the percentage of their ordinary income dividends that qualify is as follows:
| Qualified Dividend Income | DRD-Eligible Dividends | |||||||
Small-Cap Growth Fund | — | % | — | % | ||||
Strategic Growth Fund | 57.58 | % | 53.13 | % | ||||
In January 2015, shareholders of the Funds will receive Federal income tax information on all distributions paid to their accounts in the calendar year 2014, including any distributions paid between July 1, 2014 and December 31, 2014.
Board Approval of Advisory and Sub-Advisory Agreements
At a meeting held on May 28, 2014 (the “Meeting”), the Board of Trustees of The Roxbury Funds (the “Trust”), including the Trustees who are not “interested persons” as defined in the Investment Company Act of 1940, as amended (the “Independent Trustees”), approved the continuation of (1) the Investment Advisory Agreement between the Trust and Roxbury Capital Management, LLC (“Roxbury”) with respect to the Roxbury/Hood River Small-Cap Growth Fund (the “Small-Cap Growth Fund”) and the Roxbury/Mar Vista Strategic Growth Fund (the “Strategic Growth Fund”) (collectively the “Funds”) and (2) the Sub-Advisory Agreement between Roxbury and Mar Vista Investment Partners, LLC (“Mar Vista”) with respect to the Strategic Growth Fund.
A. Investment Advisory Agreement
In considering whether to approve the continuation of the Investment Advisory Agreement, the Independent Trustees considered the information provided during the Meeting and at other meetings throughout the year, the presentations on the Funds by Roxbury and certain additional factors described below that they deemed relevant. This information included, among other things: the terms of the Investment Advisory Agreement; a memorandum completed by Roxbury in response to the questionnaire circulated on behalf of the Trustees; a copy of Roxbury’s ADV Part 1 and Part 2A; a copy of Roxbury’s Compliance Manual, 2013 Compliance Review, Code of Ethics, 2013 Soft Dollar Report, and Proxy Policies, and a memorandum from counsel to the Independent Trustees on the Trustees’ fiduciary duties in connection with approving the continuation of the Investment Advisory Agreement.
(1) The nature, extent and quality of services provided by the Adviser. The Board considered the scope and quality of services provided by Roxbury, particularly the qualifications and capabilities of the personnel responsible for providing services to the Funds. On the basis of this evaluation, the Board concluded that the nature, quality and extent of services by Roxbury was satisfactory.
(2) The performance of the Funds and the Investment Adviser. The Trustees considered the Small-Cap Growth Fund’s performance as compared to its benchmark, the Russell 2000® Growth Index, for the quarter, 1-year, 3-year, 5-year, 10-year and since inception periods ended March 31, 2014, noting that the Fund had outperformed the benchmark for the 1-year, 3-year, 5-year and since inception periods. The Trustees also considered performance information for comparable funds provided by Roxbury for the 1-year, 3-year and 5-year periods, noting that the Fund had outperformed three out of five comparable funds for the 1- year period, all of the comparable funds for the 3-year period and four out of five comparable funds for the 5-year period ended May 1, 2014.
The Trustees then considered the Strategic Growth Fund’s performance as compared to its benchmark, the Russell 1000® Growth Index, for the quarter, 1-year and since inception periods ended March 31, 2014, noting that the Fund had outperformed the benchmark for the first quarter of 2014, but slightly underperformed the benchmark for the 1-year and since inception periods. The Trustees also considered performance information for comparable funds provided by Roxbury for the 1-year period, which indicated that the Fund had outperformed two out of five comparable funds for the 1-year period ended May 1, 2014.
24
ADDITIONAL INFORMATION (Unaudited)
(3) The cost of the advisory services provided to the Funds. The Trustees considered the gross and next expense ratio and gross and net advisory fee comparisons of the Funds compared to other funds deemed comparable by Roxbury, noting the breakpoints in the Small-Cap Growth Fund’s advisory fee. The Board also noted that while the Strategic Growth Fund’s contractual advisory fee was slightly higher than the comparable funds, the net expenses after the waiver by the Adviser was below the highest expense ratio of the comparable funds. The Board also considered that the Adviser’s contractual agreements to limit the total expenses for the Funds would remain the same. On the basis of the information provided, the Board concluded that the advisory fees and total expense ratios were reasonable and appropriate in light of the quality of the services provided to the Funds.
(4) The extent to which economies of scale will be realized as the Funds grow and whether fee levels reflect those economies of scale. The Trustees considered the extent to which economies of scale were expected to be realized relative to fee levels as the Funds’ assets grow, noting the advisory fee breakpoints with respect to the Small-Cap Growth Fund.
(5) Ancillary benefits and other factors. In addition to the above factors, the Trustees also discussed other benefits to be received by Roxbury from its management of the Funds, including the ability to market its advisory services for similar products in the future.
After considering all the factors, and taking into consideration information presented before and during the meeting, the Board, including all of the Independent Trustees, concluded that the fees payable under the Advisory Agreement with respect to each Fund were fair and reasonable with respect to the services that Roxbury provided, in light of the factors described above that the Board deemed relevant and that the Investment Advisory Agreement should be continued for an additional one-year period. The Board based its decision on an evaluation of all these factors as a whole and did not consider any one factor as all-important or controlling
B. Sub-Advisory Agreement
The Independent Trustees also discussed the continuance of the Sub-Advisory Agreement between Roxbury and Mar Vista with respect to the Strategic Growth Fund.
In considering whether to approve the continuation of the Sub-Advisory Agreement, the Independent Trustees considered the information provided during the Meeting and at other meetings throughout the year, the presentations on the Strategic Growth Fund by Mar Vista and certain additional factors described below that they deemed relevant. This information included: the terms of the Sub-Advisory Agreement; a memorandum completed by Mar Vista in response to the questionnaire circulated on behalf of the Trustees; a copy of Mar Vista’s ADV Part 1 and Part 2A and 2B; a copy of Mar Vista’s Compliance Manual, Code of Ethics and Proxy Policies, and a memorandum from counsel to the Independent Trustees on the Trustees’ fiduciary duties in connection with approving the Sub-Advisory Agreement.
(1) The nature, extent and quality of services provided by the Sub-Adviser. The Board considered the scope and quality of services provided by Mar Vista, particularly the qualifications and capabilities of the personnel responsible for providing services to the Strategic Growth Fund. On the basis of this evaluation, the Board concluded that the nature, quality, and extent of services provided by Mar Vista was satisfactory.
(2) The performance of the Fund and the Sub-Adviser. The Trustees then considered the Strategic Growth Fund’s performance as compared to its benchmark, the Russell 1000 Growth Index, for the quarter, 1-year and since inception periods ended March 31, 2014, noting that the Fund had outperformed the benchmark for the last quarter. The Trustees also considered performance information for comparable funds provided by Roxbury, which indicated that the Fund had outperformed two out of five of the comparable funds for the one-year period ended May 1, 2014.
(3) The cost of the advisory services provided to the Fund. The Trustees considered the gross and net expense ratio and gross and net advisory fee comparisons of the Strategic Growth Fund compared to other funds deemed comparable by Roxbury. The Trustees noted that while the Strategic Growth Fund’s contractual advisory fee of 0.75% was slightly higher than the other comparable funds, the net expenses of the Fund, after the waiver by the Adviser, was below the highest expense ratio of the comparable funds. The Board also considered that Roxbury’s contractual agreement to limit the total expenses for the Strategic Growth Fund would remain the same. On the basis of the information provided, the Board concluded that the sub-advisory fee and total expense ratio were reasonable and appropriate in light of the quality of the services provided to the Strategic Growth Fund.
(4) The extent to which economies of scale will be realized as the Fund grows and whether fee levels reflect those economies of scale. The Trustees considered the extent to which economies of scale were expected to be realized relative to
25
THE ROXBURY FUNDS
ADDITIONAL INFORMATION (Unaudited) continued
fee levels as the Fund’s assets grow. The Trustees noted that the Strategic Growth Fund’s advisory fee and sub-advisory fees did not have breakpoints.
(5) Ancillary benefits and other factors. In addition to the above factors, the Trustees also discussed other benefits received by Mar Vista from its management of the Funds, including the ability to market its advisory services for similar products in the future.
After considering all the factors, and taking into consideration information presented before and during the Meeting, the Board, including all of the Independent Trustees concluded that the fees payable under the Sub-Advisory Agreement were fair and reasonable with respect to the services that Mar Vista provided, in light of the factors described above that the Board deemed relevant, and that the Sub-Advisory Agreement should be continued for an additional one-year period. The Board based its decision on an evaluation of all these factors as a whole and did not consider any one factor as all-important or controlling.
Proxy Voting Policies and Procedures and Proxy Voting Record
A description of the Funds’ policies and procedures with respect to the voting of proxies relating to each Fund’s portfolio securities is available without charge, upon request, by calling (800) 497-2960. Information regarding how the Funds voted proxies related to portfolio securities during the 12-month period ended June 30, 2014 is available without charge, upon request, by calling (800) 497-2960. This information is also available on the Securities and Exchange Commission’s (“SEC”) website at www.sec.gov.
26
DISCLOSURE OF FUND EXPENSES (Unaudited)
The following Expense Tables are shown so that you can understand the impact of fees on your investment. All mutual funds have operating expenses. As a shareholder of the Funds, you may incur transaction costs, such as redemption fees, and ongoing costs, including management fees and other Fund expenses. Each Fund’s expenses are expressed as a percentage of its average net assets. This figure is known as the expense ratio. The following examples are intended to help you understand the ongoing costs (in dollars) of investing in the Funds and to compare these costs with the ongoing costs of investing in other mutual funds. The example is based on an investment of $1,000 made at the beginning of the period shown and held for the entire period.
The Expense Tables below illustrate your Fund’s costs in two ways.
— Actual fund return. The first line of the tables below provides information about actual account values and actual expenses. You may use the information in these lines, together with the amount you invested, to estimate the expenses that you paid over the period. Simply divide your account value by $1,000 (for example, an $8,600 account value divided by $1,000 = 8.6), then multiply the result by the number in the first line under the heading entitled “Expenses Paid During Period” to estimate the expenses you paid on your account during the period.
— Hypothetical 5% return. The second line of the tables below provides information about hypothetical account values and hypothetical expenses based on each Fund’s actual expense ratio and an assumed rate of return of 5% per year before expenses, which is not the Fund’s actual return. The hypothetical account values and expenses may not be used to estimate the actual ending account balance or expenses you paid for the period. You may use this information to compare the ongoing costs of investing in the Funds and other funds. To do so, compare this 5% hypothetical example with the 5% hypothetical examples that appear in the shareholder reports of the other funds.
Please note that the expenses shown in the tables are meant to highlight your ongoing costs only and do not reflect any transactional costs, such as sales charges (loads), redemption fees, or exchange fees, if any. Therefore, the second line of each table is useful in comparing ongoing costs only, and will not help you determine the relative total costs of owning different funds. In addition, if these transactional costs were included, your costs would have been higher. The “Annualized Expense Ratio” reflects the actual expenses for the period indicated.
For the Period January 1, 2014 to June 30, 2014
Expense Table
Beginning | Ending | Annualized | Expenses | |||||||||||||
Roxbury/Hood River Small-Cap Growth Fund – Institutional Shares | ||||||||||||||||
Actual Fund Return | $ | 1,000.00 | $ | 1,020.70 | 1.25 | % | $ | 6.26 | ||||||||
Hypothetical 5% Return Before Expenses | 1,000.00 | 1,018.60 | 1.25 | 6.26 | ||||||||||||
Expense Table
Beginning | Ending | Annualized | Expenses | |||||||||||||
Roxbury/Mar Vista Strategic Growth Fund – Institutional Shares | ||||||||||||||||
Actual Fund Return | $ | 1,000.00 | $ | 1,094.50 | 0.90 | % | $ | 4.67 | ||||||||
Hypothetical 5% Return Before Expenses | 1,000.00 | 1,020.33 | 0.90 | 4.51 | ||||||||||||
| * | Expenses are equal to the Fund’s annualized expense ratio multiplied by the average account value over the period, multiplied by 181/365 (to reflect the one half-year period). |
27
The Trust is governed by a Board of Trustees (the “Trustees”). The primary responsibilities of the Trustees of the Trust are to represent the interest of the Trust’s shareholders and to provide oversight management of the Trust.
Unless specified otherwise, the address of each Trustee and Officer as it relates to the Trust is 6001 Shady Oak Road, Suite 200, Minnetonka, MN 55343.
The Statement of Additional Information for the Trust contains additional information about the Trust’s Trustees and Officers and is available, without charge, upon request, by calling (800) 497-2960 or by visiting the Fund’s website at www.RoxburyFunds.com.
The following table sets forth certain information with respect to the Trustees of the Trust:
INDEPENDENT TRUSTEES
Name, Address | Position(s) | Term of Office1 and | Principal | Number of | Other | |||||
| KENNETH GUDORF Age 75 | Trustee and Chairman of the Board | Since June 2006 | CEO, Agio Capital Partners I, L.P. (private investment company) since approximately 1996. | 2 | None | |||||
| JOHN OTTERLEI Age 65 | Trustee | Since June 2006 | Chief Investment Officer, Bush Foundation, since 2010; Managing Director, Investments, from 2008 to 2009; Independent Financial Advisor, from 2005 to 2008. | 2 | None | |||||
| 1 | Each Trustee serves during the continued lifetime of the Trust until he dies, resigns, is declared bankrupt or incompetent by a court of competent jurisdiction, or is removed. |
| 2 | Includes directorships of companies required to report to the SEC under the Securities Exchange Act of 1934, as amended (i.e., “public companies”), or other investment companies registered under the 1940 Act. |
28
TRUSTEES AND OFFICERS (Unaudited)
OFFICERS OF THE TRUST
The following table sets forth certain information with respect to the Officers of the Trust as of June 30, 2014.
Name, Address | Position(s) | Term of Office1 and | Principal | |||
| BRIAN C. BEH Age 51 | President, Chief Compliance Officer and Anti-Money Laundering Officer | President since April 2006; Chief Compliance Officer and Anti-Money Laundering Officer since August 2012 | President and Chief Executive Officer and Chief Compliance Officer of Roxbury Capital Management, LLC, since October 2012; President and Chief Executive Officer of Roxbury Capital Management, LLC, since 2007. | |||
| MICHAEL P. MALLOY Drinker Biddle & Reath LLP One Logan Square Suite 2000 Philadelphia, PA 19103-6996 Age 55 | Secretary | Since May 2007 | Partner in the law firm Drinker Biddle & Reath LLP. | |||
| BROOKE CLEMENTS Age 37 | Treasurer | Treasurer since August 2012 | Senior Financial Manager of Roxbury Capital Management, LLC since August 2013; Financial Accounting Manager of Roxbury Capital Management, LLC from 2009-2013; Staff Accountant, Roxbury Capital Management, LLC from 2005 to 2009. | |||
BECKY KRULIK Age 30 | Assistant Secretary | Assistant Secretary since 2013 | Compliance Analyst, Roxbury Capital Management, LLC since 2012; Supervising Principal, Thrivent Financial 2007-2012 | |||
| 1 | Each officer shall serve until his or her resignation is accepted by the Trustees, and his or her successor is chosen, elected and qualified, or until he or she dies or is removed. Any officer may be removed by the affirmative vote of a majority of the Trustees at any time, with or without cause. |
29
This page left blank intentionally
This page left blank intentionally
 | This report is not authorized for distribution unless preceded or accompanied by a prospectus for the Funds. Effective July 1, 2012, shares of The Roxbury Funds are distributed by Foreside Fund Services, LLC, 3 Canal Plaza, Suite 100, Portland, ME 04101. |
June 14
Item 2. Code of Ethics.
(a) | The registrant, as of the end of the period covered by this report, has adopted a code of ethics that applies to the registrant’s principal executive officer, principal financial officer, principal accounting officer or controller, or persons performing similar functions, regardless of whether these individuals are employed by the registrant or a third party. |
(c) | There have been no amendments, during the period covered by this report, to a provision of the code of ethics that applies to the registrant’s principal executive officer, principal financial officer, principal accounting officer or controller, or persons performing similar functions, regardless of whether these individuals are employed by the registrant or a third party, and that relates to any element of the code of ethics definition set forth in paragraph (b) of this Item. |
(d) | The registrant has not granted any waivers, including an implicit waiver, from a provision of the code of ethics that applies to the registrant’s principal executive officer, principal financial officer, principal accounting officer or controller, or persons performing similar functions, regardless of whether these individuals are employed by the registrant or a third party, that relates to one or more of the items set forth in paragraph (b) of this Item. |
(f) | A copy of the Code of Ethics is available as provided in Item 12 (a) (1) of this report |
Item 3. Audit Committee Financial Expert.
As of the end of the period covered by the report, the Registrant’s Board of Trustees has determined that Kenneth Gudorf and John Otterlei each qualify to serve as an audit committee financial expert serving on its audit committee and that each is “independent,” as defined by Item 3 of Form N-CSR.
Item 4. Principal Accountant Fees and Services.
Audit Fees
(a) | The aggregate fees billed for the fiscal years ended June 30, 2014 and June 30, 2013 for professional services rendered by the principal accountant for the audit of the registrant’s annual financial statements or services that are normally provided by the accountant in connection with statutory and regulatory filings or engagements for those fiscal years are $34,000 and $34,000, respectively. |
Audit-Related Fees
(b) | The aggregate fees billed in the fiscal years ended June 30, 2014 and June 30, 2013 for assurance and related services by the principal accountant that are reasonably related to the performance of the audit of the registrant’s financial statements and are not reported under paragraph (a) of this Item are $0 and $0, respectively. |
Tax Fees
(c) | The aggregate fees billed in the fiscal years ended June 30, 2014 and June 30, 2013 for professional services rendered by the principal accountant for tax compliance, tax advice, and tax planning are $3,000 and $3,000, respectively. Fees were for the review of federal and state income tax returns and excise tax returns. |
All Other Fees
(d) | The aggregate fees billed in the fiscal years ended June 30, 2014 and June 30, 2013 for products and services provided by the principal accountant, other than the services reported in paragraphs (a) through (c) of this Item are $0 and $0, respectively. |
(e)(1) Disclose the audit committee’s pre-approval policies and procedures described in paragraph (c)(7) of Rule 2-01 of Regulation S-X.
Pursuant to its charter, the Trust’s Audit Committee must review and approve in advance the engagement of the independent accountants, including each audit and non-audit service permitted by appropriate rules or regulations provided to the Trust and each non-audit service provided to the Trust’s investment adviser and any entity controlling, controlled by or under common control with the investment adviser that provides ongoing services to the Trust relating to the operations and financial reporting of the Trust. The Committee may delegate the authority to grant such pre-approval to one or more Committee members who are independent Trustees within the meaning of Section 10A(i) of the Securities Exchange Act of 1934, as amended, provided that the decision of such member(s) is presented to the full Committee at its next scheduled meeting. The Committee may approve each audit and non-audit service on a case-by-case basis, and/or adopt pre-approval policies and procedures that are detailed as to a particular service, provided that the Committee is informed of each service in a timely manner and the policies and procedures do not include delegation of the Committee’s responsibilities under the Securities Exchange Act of 1934 to management. The foregoing pre-approval requirement with respect to the provision of non-audit services to the Trust may be waived if (i) the aggregate amount of all such non-audit services provided to the Trust constitutes not more than 5 percent of the total amount of revenues paid by the Trust to its independent accountants during the fiscal year in which the non-audit services are provided; (ii) such services were not recognized by the Trust at the time of the engagement to be non-audit services; and (iii) such services are promptly brought to the attention of the Committee and approved prior to the completion of the audit by the Committee or by one or more members of the Committee to whom authority to grant such approvals has been delegated by the Committee.
(e)(2) There were no percentage of services described in each of paragraphs (b) through (d) of this Item that were approved by the audit committee pursuant to paragraph (c)(7)(i)(C) of Rule 2-01 of Regulation S-X
(f) | The percentage of hours expended on the principal accountant’s engagement to audit the registrant’s financial statements for the most recent fiscal year that were attributed to work performed by persons other than the principal accountant’s full-time, permanent employees was less than fifty percent. |
(g) | The aggregate non-audit fees billed by the registrant’s accountant for services rendered to the registrant, and rendered to the registrant’s investment adviser (not including any sub-adviser whose role is primarily portfolio management and is subcontracted with or overseen by another investment adviser), and any entity controlling, controlled by, or under common control with the adviser that provides ongoing services to the registrant for fiscal years ended June 30, 2014 and June 30, 2013 of the registrant was $3,000 and $3,000, respectively. |
(h) | The registrant’s audit committee of the board of directors has considered whether the provision of non-audit services that were rendered to the registrant’s investment adviser (not including any sub-adviser whose role is primarily portfolio management and is subcontracted with or overseen by another investment adviser), and any entity controlling, controlled by, or under common control with the investment adviser that provides ongoing services to the registrant that were not pre-approved pursuant to paragraph (c)(7)(ii) of Rule 2-01 of Regulation S-X is compatible with maintaining the principal accountant’s independence. |
Item 5. Audit Committee of Listed Registrants.
Not applicable.
Item 6. Investments.
(a) | Schedule of Investments in securities of unaffiliated issuers as of the close of the reporting period is included as part of the report to shareholders filed under Item 1 of this form. |
(b) | Not applicable. |
Item 7. Disclosure of Proxy Voting Policies and Procedures for Closed-End Management
Investment Companies.
Not applicable.
Item 8. Portfolio Managers of Closed-End Management Investment Companies.
Not applicable.
Item 9. Purchases of Equity Securities by Closed-End Management Investment Company and Affiliated Purchasers.
Not applicable.
Item 10. Submission of Matters to a Vote of Security Holders.
There have been no material changes to the procedures by which the shareholders may recommend nominees to the registrant’s board of trustees.
Item 11. Controls and Procedures.
(a) | The registrant’s principal executive and principal financial officers, or persons performing similar functions, have concluded that the registrant’s disclosure controls and procedures (as defined in Rule 30a-3(c) under the Investment Company Act of 1940, as amended (the “1940 Act”) (17 CFR 270.30a-3(c))) are effective, as of a date within 90 days of the filing date of this report that includes the disclosure required by this paragraph, based on their evaluation of these controls and procedures required by Rule 30a-3(b) under the 1940 Act (17 CFR 270.30a-3(b)) and Rule 15d-15(b) under the Securities Exchange Act of 1934, as amended (17 CFR 240 15d-15(b)). |
(b) | There were no changes in the registrant’s internal control over financial reporting (as defined in Rule 30a-3(d) under the 1940 Act (17 CFR 270.30a-3(d)) that occurred during the registrant’s second fiscal quarter of the period covered by this report that has materially affected, or are reasonably likely to materially affect, the registrant’s internal control over financial reporting. |
Item 12. Exhibits.
(a)(1) | Code of ethics, or any amendment thereto, that is the subject of disclosure required by Item 2 is attached hereto. | |
(a)(2) | Certifications pursuant to Rule 30a-2(a) under the 1940 Act and Section 302 of the Sarbanes-Oxley Act of 2002 are attached hereto. | |
(a)(3) | Not applicable. | |
(b) | Certifications pursuant to Rule 30a-2(b) under the 1940 Act and Section 906 of the Sarbanes-Oxley Act of 2002 are attached hereto. | |
(12.other) Not applicable. | ||
SIGNATURES
Pursuant to the requirements of the Securities Exchange Act of 1934 and the Investment Company Act of 1940, the registrant has duly caused this report to be signed on its behalf by the undersigned, thereunto duly authorized.
(Registrant) | The Roxbury Funds |
By (Signature and Title)* | /s/ Brian C. Beh | |||
Brian C. Beh, President and Chief Compliance Officer | ||||
(principal executive officer) | ||||
Date | 9/5/2014 |
Pursuant to the requirements of the Securities Exchange Act of 1934 and the Investment Company Act of 1940, this report has been signed below by the following persons on behalf of the registrant and in the capacities and on the dates indicated.
By (Signature and Title)* | /s/ Brian C. Beh | |||
Brian C. Beh, President and Chief Compliance Officer | ||||
(principal executive officer) | ||||
Date | 9/5/2014 |
By (Signature and Title)* | /s/ Brooke Clements | |||
Brooke Clements, Treasurer | ||||
(principal financial officer) | ||||
Date | 9/5/2014 |
* Print the name and title of each signing officer under his or her signature.