UNITED STATES
SECURITIES AND EXCHANGE COMMISSION
Washington, D.C. 20549
FORM N-CSR
CERTIFIED SHAREHOLDER REPORT OF REGISTERED MANAGEMENT
INVESTMENT COMPANIES
Investment Company Act file number 811-21897
The Roxbury Funds
(Exact name of registrant as specified in charter)
6001 Shady Oak Road Suite 200
Minnetonka, MN 55343
(Address of principal executive offices) (Zip code)
Jon Foust
Roxbury Capital Management, LLC
6001 Shady Oak Road Suite 200
Minnetonka, MN 55343
(Name and address of agent for service)
Copy to:
Ellen Drought, Esq.
Godfrey & Kahn, S.C.
780 North Water Street
Milwaukee, WI 53202-3590
Registrant’s telephone number, including area code: (952) 230-6140
Date of fiscal year end: June 30
Date of reporting period: June 30, 2015
Item 1. Reports to Stockholders.
The Report to Shareholders is attached herewith.

ANNUAL REPORT
JUNE 30, 2015
Hood River Small-Cap Growth Fund
(formerly Roxbury/Hood River Small-Cap Growth Fund)
Mar Vista Strategic Growth Fund
(formerly Roxbury/Mar Vista Strategic Growth Fund)
Telephone: (800) 497-2960
www.RoxburyFunds.com
| 3 | ||||
Hood River Small-Cap Growth Fund (formerly Roxbury/Hood River Small-Cap Growth Fund) | ||||
| 4 | ||||
| 7 | ||||
Mar Vista Strategic Growth Fund (formerly Roxbury/Mar Vista Strategic Growth Fund) | ||||
| 9 | ||||
| 12 | ||||
| 13 | ||||
| 14 | ||||
| 15 | ||||
| 16 | ||||
| 18 | ||||
| 22 | ||||
| 23 | ||||
| 23 | ||||
| 25 | ||||
| 26 | ||||
| 27 | ||||
2
Dear Shareholders,
The U.S. equity markets continued their upward climb for the fiscal year ending June 30, 2015. The most recent twelve months marks the sixth consecutive fiscal year that the broad U.S. equity market posted positive returns. In fact, since the financial crisis investors have experienced cumulative returns of more than 200%. For the market to continue this uninterrupted string of positive returns corporations need to deliver profit growth and/or stocks need to have valuations expand. In our opinion, the most recent quarter began to show some cracks in the most recent bull market run and increases the overall risk in the market.
Domestic equity markets largely marked time during the 2nd quarter of 2015 as optimism for a self-sustaining U.S. economic rebound was balanced against fears emanating mostly from international markets. The European Union played a wicked game of brinksmanship
while Chinese investors learned the always painful lesson that losses hurt twice as bad as gains feel good. Their government’s efforts to apply a salve by restricting sales and pumping up prices only deepened global investors’ distrust in their market reforms. Overshadowed by Europe and China’s headlines were a deepening Brazilian recession, the worst in twenty-five years, and fading Indian optimism as Modi’s reforms have proven frustratingly slow. Finally, the dollar’s status as a safe-haven sustained its strength but weakened global commodity prices and international profits for U.S. companies. As a result of all these factors, overall profit expectations further moderated during the quarter. Consensus now anticipates flat to declining earnings compared to high single digit growth at the start of 2015. Low interest rates also continue to prop up overall valuation metrics with several overall market measures continue to suggest valuations are extended. Total market value to Gross Domestic Product (“GDP”) (>120%), Shiller’s ten-year trailing Price-Earnings Ratio (“P/E”) (>27x) and the median P/E for all NYSE listed stocks (21x) all remain at the extreme ends of historical ranges.
The Hood River Small-Cap Growth Fund gained 14.92% over the fiscal year. That compares to a gain of 12.34% for the Russell 2000 Growth Index and a 9.60% return for the average small-cap growth fund in the Morningstar universe. The excess return generated can be attributed to the team’s strong stock selection in Industrials, Technology, Materials and the portfolio’s under-weighted exposure to Energy while holdings in Consumer Discretionary and Health Care modestly detracted from returns. For a more in depth review of the Small-Cap Growth Fund’s performance and commentary please review the team’s thoughts on page 4.
The Mar Vista Strategic Growth Fund gained 7.67% over the fiscal year. That compares with a gain of 10.56% for the Russell 1000 Growth Index, a gain of 7.42% for the S&P 500 Index and a 9.39% return for the average large-cap growth fund in the Morningstar universe. The Fund’s return was positively impacted by strong stock selection in Consumer Discretionary, Energy and Financials, but stock selection in Technology and our underweight to Health Care/Biotech detracted from returns relative to the Russell 1000 Growth Index. For a more detailed review of the Mar Vista Strategic Growth Fund and the team’s thoughts, please see page 9.
Sincerely,

Jon R. Foust
President
The Roxbury Funds
The above comments reflect general views regarding the market and the economy, were current as of the date of this letter, and are subject to change at any time.
Returns represent past performance and include changes in share price and reinvestment of dividends and capital gains. Past performance cannot guarantee future results. The current performance of the Fund may be lower or higher than the figures shown. Returns and share price will fluctuate, and redemption value may be more or less than original cost. Performance information current to the most recent month-end is available by calling (800) 497-2960.

Jon R. Foust
President, The Roxbury Funds
3
How did the Hood River Small-Cap Growth Fund perform during the annual period ending June 30, 2015?
During the 12-month period ending June 30, 2015, the Hood River Small-Cap Growth Fund achieved a total return of 14.92%. This compares to a return of 12.34% for the Russell 2000® Growth Index during the same period.
What key factors were responsible for the Fund’s performance during the 12-month reporting period?
The positive performance for the reporting period was driven by our bottom-up research, with stock selection adding roughly 132 basis points of outperformance. Our sector allocation weights added roughly 212 basis points to performance during the period.
Which equity market sectors most significantly affected Fund performance?
During the twelve months ending June 30, 2015, the Small-Cap Growth Fund was positively impacted by performance and stock selection in Industrials, Materials and Technology, coupled with an underweight in Energy. Consumer Discretionary and Healthcare detracted from returns during the period.
What are you expecting from the equity markets over the upcoming year?
Our recent conversations with companies leave us encouraged that the economy is continuing to grow, albeit at a moderate rate. Employment markets continue to tighten, with more companies implementing or contemplating wage increases to attract and retain employees. This suggests that the headline unemployment rate of 5.4% may continue to tick down in future quarters. Despite news surrounding Greek debt problems and Chinese stock market crashes, in the near-term the U.S. economy seems to be in decent shape overall.
Our biggest concern continues to be the potential for rising interest rates. When fixed income instruments eventually fall enough in price that they offer a reasonable return and more effectively compete with equities for investment dollars, we expect to see some valuation compression in equities. While we are hopeful any compression will be more than offset by growing earnings, the negative impact may be more pronounced among the more speculative areas such as biotech, which have enjoyed dramatic run-ups in the past few years. In fact, as we look at the Russell 2000® Growth Index return as of June 30, much of the overall index’s 8.7% year-to-date return is attributable to more speculative, negative-earnings companies, including biotech. Specifically, these negative-earnings companies have outperformed, returning 15.7% in the first half of 2015. While we are concerned about valuations in those speculative areas, our portfolio has historically been, and currently is, more focused on high quality companies with positive earnings, and we believe that we are well positioned to outperform over the next year, especially if areas such as biotech soften.
As always, our process continues to be driven by our original bottom-up fundamental research, which entails talking to as many sources as we can to help understand the businesses we invest in. While we know that every year will bring macro surprises, we believe that we should be able to outperform in most market environments by identifying quality small companies that are underappreciated by the market.
Very truly yours,
Robert C. Marvin, CFA Portfolio Manager | Brian P. Smoluch, CFA Portfolio Manager | |
|
| |
David G. Swank, CFA Portfolio Manager | ||
| ||


Returns represent past performance and include changes in share price and reinvestment of dividends and capital gains. Past performance cannot guarantee future results. The current performance of the Fund may be lower or higher than the figures shown. Returns and share price will fluctuate, and redemption value may be more or less than original cost. Performance information current to the most recent month-end is available by calling (800) 497-2960.
In addition to historical information, this report contains forward-looking statements which may concern, among other things, the domestic and foreign markets, economic trends and government regulations and their potential impact on the Fund’s investments. These statements are subject to risks and uncertainties and actual developments in the future and their impact on the Fund could be materially different than those that are projected or implied.
Portfolio composition is subject to change.
4
HOOD RIVER SMALL-CAP GROWTH FUND
The following tables are for the year ended June 30, 2015:
| Top Ten Holdings (Unaudited) | % of Portfolio | |||
SunEdison, Inc. | 3.7 | % | ||
Amsurg Corp. | 2.9 | % | ||
comScore, Inc. | 2.7 | % | ||
VCA Antech, Inc. | 2.4 | % | ||
On Assignment, Inc. | 2.3 | % | ||
JinkoSolar Holding Co., Ltd., ADR | 2.3 | % | ||
KAR Auction Services, Inc. | 2.2 | % | ||
Team Health Holdings, Inc. | 2.2 | % | ||
Pebblebrook Hotel Trust | 2.1 | % | ||
PRA Group, Inc. | 2.1 | % | ||
| Sector Breakdown (Unaudited) | % of Portfolio | |||
Information Technology | 30.4 | % | ||
Industrials | 22.4 | % | ||
Health Care | 17.0 | % | ||
Consumer Discretionary | 16.1 | % | ||
Financials | 8.0 | % | ||
Telecommunication Services | 1.8 | % | ||
Materials | 1.3 | % | ||
Consumer Staples | 0.5 | % | ||
Short-Term Investments | 2.5 | % | ||
TOTAL | 100.0 | % | ||
| Portfolio Statistics (Unaudited) | ||||
Number of Holdings | 85 | |||
Market Cap (wtd. avg, mil) | $2,667 | m | ||
Price / Book Value (wtd. avg.) | 7.5 | x | ||
Price / Earnings (wtd. avg.) | 23.1 | x | ||
Beta | 0.93 | |||
Standard Deviation | 17.17 | |||
Portfolio Turnover | 142 | % | ||
QUARTERLY PORTFOLIO HOLDINGS (Unaudited)
The Fund files a complete schedule of portfolio holdings with the Securities and Exchange Commission (SEC) for the first and third quarters of each fiscal year on Form N-Q. The Fund’s Forms N-Q are available electronically on the SEC’s website at www.sec.gov. Hard copies may be reviewed and copied at the SEC’s Public Reference Room in Washington, DC. For more information on the Public Reference Room, call 1-800-SEC-0330.
Portfolio holdings are subject to change at any time.
5
SMALL-CAP GROWTH
Hood River Small-Cap Growth Fund
Comparison of Change in Value of a Hypothetical $100,000 Investment* (Unaudited)
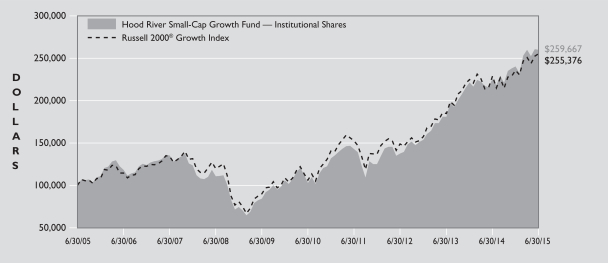
The following table compares the performance of the Hood River Small-Cap Growth Fund and the Russell 2000® Growth Index for the periods ended June 30.
| Average Annual Total Return For the Periods Ended June 30, 2015. | ||||||||||||||||
| 1 Year | 5 Years | 10 Years | Since Inception1 | |||||||||||||
Hood River Small-Cap Growth Fund Institutional Shares | 14.92% | 20.35% | 10.01% | 12.86% | ||||||||||||
Russell 2000® Growth Index2 | 12.34% | 19.33% | 9.86% | 12.15% | ||||||||||||
Fund Expense Ratios3: Institutional Shares: Gross 1.49%, Net 1.10%.
| * | Performance quoted represents past performance and does not guarantee future results. Investment return and principal value will fluctuate. Shares, when redeemed, may be worth more or less than their original cost. Current performance may be lower or higher than that shown here. Performance data current to the most recent month-end is available by calling (800) 497-2960. |
The performance in the table above does not reflect the deduction of taxes a shareholder would pay on Fund distributions or redemption of Fund shares.
Small company stocks may be subject to a higher degree of market risk because they tend to be more volatile and less liquid.
Shareholders should consider the investment objectives, risks, charges and expenses of the Fund carefully before investing. The Fund’s prospectus contains this and other important information about the Fund. For a copy of the prospectus, call (800) 497-2960. Please read carefully before investing.
| 1 | The Institutional Shares commenced operations on January 2, 2003. |
| 2 | The Russell 2000® Growth Index measures the performance of the small-cap growth segment of the U.S. equity universe. It includes those Russell 2000® Index companies with higher price-to-value ratios and higher forecasted growth values. |
| 3 | The expense ratios of the Fund are set forth according to the prospectus for the Fund effective November 1, 2014, as supplemented May 18, 2015 and may differ from the expense ratios disclosed in the Financial Highlights tables in this report. Net Expense: Expenses reduced by a contractual fee waiver through December 31, 2020. Gross expenses do not reflect the effect of a contractual fee waiver. |
6
HOOD RIVER SMALL-CAP GROWTH FUND
SCHEDULE OF INVESTMENTS JUNE 30, 2015
| Shares | Value (Note 2) | |||||||
| COMMON STOCK – 96.4% | ||||||||
CONSUMER DISCRETIONARY – 15.9% |
| |||||||
Auto Components – 0.7% |
| |||||||
Drew Industries, Inc. | 11,415 | $ | 662,298 | |||||
|
| |||||||
Diversified Consumer Services – 2.1% |
| |||||||
2U, Inc.* | 43,966 | 1,415,266 | ||||||
Grand Canyon Education, Inc.* | 15,987 | 677,849 | ||||||
|
| |||||||
| 2,093,115 | ||||||||
|
| |||||||
Hotels, Restaurants & Leisure – 2.1% |
| |||||||
Diamond Resorts International, Inc.* | 43,623 | 1,376,306 | ||||||
Papa Murphy’s Holdings, Inc.* | 32,689 | 677,316 | ||||||
|
| |||||||
| 2,053,622 | ||||||||
|
| |||||||
Household Durables – 0.5% |
| |||||||
Kirkland’s, Inc. | 17,590 | 490,233 | ||||||
|
| |||||||
Leisure Equipment & Products – 1.2% |
| |||||||
Smith & Wesson Holding Corp.* | 72,110 | 1,196,305 | ||||||
|
| |||||||
Multi-Line Retail – 0.4% |
| |||||||
Tuesday Morning Corp.* | 30,626 | 345,002 | ||||||
|
| |||||||
Specialty Retail – 8.9% |
| |||||||
Cabela’s, Inc.* | 28,788 | 1,438,824 | ||||||
Francesca’s Holdings Corp.* | 68,431 | 921,766 | ||||||
Hibbett Sports, Inc.* | 19,516 | 909,055 | ||||||
LifeLock, Inc.* | 103,301 | 1,694,136 | ||||||
Lithia Motors, Inc. - Class A | 17,950 | 2,031,222 | ||||||
MarineMax, Inc.* | 38,210 | 898,317 | ||||||
Men’s Wearhouse, Inc. | 12,282 | 786,908 | ||||||
|
| |||||||
| 8,680,228 | ||||||||
|
| |||||||
TOTAL CONSUMER DISCRETIONARY |
| 15,520,803 | ||||||
|
| |||||||
CONSUMER STAPLES – 0.5% |
| |||||||
Food & Staples Retailing – 0.5% |
| |||||||
United Natural Foods, Inc.* | 7,095 | 451,810 | ||||||
|
| |||||||
TOTAL CONSUMER STAPLES |
| 451,810 | ||||||
|
| |||||||
FINANCIALS – 7.9% |
| |||||||
Commercial Banks – 2.3% |
| |||||||
Bank of The Ozarks, Inc. | 17,035 | 779,351 | ||||||
Umpqua Holdings Corp. | 1 | 13 | ||||||
Webster Financial Corp. | 37,946 | 1,500,764 | ||||||
|
| |||||||
| 2,280,128 | ||||||||
|
| |||||||
Consumer Finance – 2.1% |
| |||||||
PRA Group, Inc.* | 32,933 | 2,052,055 | ||||||
|
| |||||||
Real Estate Investment Trusts – 2.1% |
| |||||||
Pebblebrook Hotel Trust | 48,083 | 2,061,799 | ||||||
|
| |||||||
Thrifts & Mortgage Finance – 1.4% |
| |||||||
BankUnited, Inc. | 36,731 | 1,319,745 | ||||||
|
| |||||||
TOTAL FINANCIALS |
| 7,713,727 | ||||||
|
| |||||||
| Shares | Value (Note 2) | |||||||
| COMMON STOCK – continued | ||||||||
HEALTH CARE – 16.8% | ||||||||
Biotechnology – 3.0% | ||||||||
Bluebird Bio, Inc.* | 6,782 | $ | 1,141,885 | |||||
Clovis Oncology, Inc.* | 11,028 | 969,141 | ||||||
Isis Pharmaceuticals, Inc.* | 13,959 | 803,340 | ||||||
|
| |||||||
| 2,914,366 | ||||||||
|
| |||||||
Health Care Equipment & Supplies – 0.4% |
| |||||||
Tandem Diabetes Care, Inc.* | 36,621 | 396,972 | ||||||
|
| |||||||
Health Care Providers & Services – 12.9% |
| |||||||
Adeptus Health, Inc. - Class A* | 6,375 | 605,561 | ||||||
Amsurg Corp.* | 39,389 | 2,755,261 | ||||||
ExamWorks Group, Inc.* | 13,198 | 516,042 | ||||||
Magellan Health, Inc.* | 26,257 | 1,839,828 | ||||||
Molina Healthcare, Inc.* | 26,412 | 1,856,764 | ||||||
Providence Service Corp.* | 13,619 | 603,049 | ||||||
Team Health Holdings, Inc.* | 32,246 | 2,106,631 | ||||||
VCA Antech, Inc.* | 41,959 | 2,282,779 | ||||||
|
| |||||||
| 12,565,915 | ||||||||
|
| |||||||
Health Care Technology – 0.4% |
| |||||||
Omnicell, Inc* | 10,603 | 399,839 | ||||||
|
| |||||||
Life Sciences Tools & Services – 0.1% |
| |||||||
PRA Health Sciences, Inc.* | 1,798 | 65,321 | ||||||
|
| |||||||
TOTAL HEALTH CARE |
| 16,342,413 | ||||||
|
| |||||||
INDUSTRIALS – 22.2% |
| |||||||
Aerospace & Defense – 1.5% |
| |||||||
Hexcel Corp. | 29,654 | 1,474,990 | ||||||
|
| |||||||
Air Freight & Logistics – 0.2% |
| |||||||
Radiant Logistics, Inc.* | 26,263 | 191,983 | ||||||
|
| |||||||
Building Products – 3.0% |
| |||||||
Apogee Enterprises, Inc. | 25,337 | 1,333,740 | ||||||
Patrick Industries, Inc.* | 15,857 | 603,359 | ||||||
PGT, Inc.* | 69,158 | 1,003,483 | ||||||
|
| |||||||
| 2,940,582 | ||||||||
|
| |||||||
Commercial Services & Supplies – 3.6% |
| |||||||
James River Group Holdings Ltd. | 53,626 | 1,387,305 | ||||||
KAR Auction Services, Inc. | 57,212 | 2,139,729 | ||||||
|
| |||||||
| 3,527,034 | ||||||||
|
| |||||||
Construction & Engineering – 1.7% |
| |||||||
Dycom Industries, Inc* | 14,347 | 844,321 | ||||||
William Lyon Homes - Class A* | 31,864 | 817,949 | ||||||
|
| |||||||
| 1,662,270 | ||||||||
|
| |||||||
Machinery – 1.4% |
| |||||||
ARC Group Worldwide, Inc* | 7,881 | 41,769 | ||||||
Greenbrier Cos, Inc. | 28,452 | 1,332,976 | ||||||
|
| |||||||
| 1,374,745 | ||||||||
|
| |||||||
Professional Services – 8.1% |
| |||||||
Barrett Business Services, Inc. | 34,418 | 1,250,062 | ||||||
Huron Consulting Group, Inc.* | 18,621 | 1,305,146 | ||||||
Korn/Ferry International | 33,696 | 1,171,610 | ||||||
The accompanying notes are an integral part of the financial statements.
7
SMALL-CAP GROWTH
HOOD RIVER SMALL-CAP GROWTH FUND
SCHEDULE OF INVESTMENTS JUNE 30, 2015 continued
| Shares | Value (Note 2) | |||||||
| COMMON STOCK – continued | ||||||||
Professional Services (Continued) |
| |||||||
On Assignment, Inc.* | 55,909 | $ | 2,196,106 | |||||
Resources Connection, Inc. | 69,223 | 1,113,798 | ||||||
WageWorks, Inc.* | 19,160 | 775,022 | ||||||
|
| |||||||
| 7,811,744 | ||||||||
|
| |||||||
Road & Rail – 2.2% |
| |||||||
Genesee & Wyoming, Inc. - Class A* | 9,919 | 755,629 | ||||||
Old Dominion Freight Line, Inc.* | 9,567 | 656,344 | ||||||
Swift Transportation Co.* | 30,312 | 687,173 | ||||||
|
| |||||||
| 2,099,146 | ||||||||
|
| |||||||
Trading Companies & Distributors – 0.5% |
| |||||||
Fly Leasing Ltd. | 30,145 | 473,277 | ||||||
|
| |||||||
TOTAL INDUSTRIALS |
| 21,555,771 | ||||||
|
| |||||||
INFORMATION TECHNOLOGY – 30.0% |
| |||||||
Communications Equipment – 1.1% |
| |||||||
Applied Optoelectronics, Inc.* | 61,906 | 1,074,688 | ||||||
|
| |||||||
Computers & Peripherals – 1.8% |
| |||||||
Immersion Corp.* | 50,507 | 639,924 | ||||||
Super Micro Computer, Inc.* | 38,913 | 1,151,047 | ||||||
|
| |||||||
| 1,790,971 | ||||||||
|
| |||||||
Internet Software & Services – 4.7% |
| |||||||
comScore, Inc.* | 48,788 | 2,598,449 | ||||||
Constant Contact, Inc.* | 40,444 | 1,163,169 | ||||||
Global Eagle Entertainment, Inc.* | 58,827 | 765,928 | ||||||
|
| |||||||
| 4,527,546 | ||||||||
|
| |||||||
IT Services – 2.6% |
| |||||||
Euronet Worldwide, Inc.* | 14,215 | 877,066 | ||||||
MAXIMUS, Inc. | 25,443 | 1,672,368 | ||||||
|
| |||||||
| 2,549,434 | ||||||||
|
| |||||||
Semiconductors & Semiconductor Equipment – 15.1% |
| |||||||
Canadian Solar, Inc.* | 17,020 | 486,772 | ||||||
Integrated Device Technology, Inc.* | 71,077 | 1,542,371 | ||||||
JinkoSolar Holding Co., Ltd., ADR* | 73,797 | 2,178,487 | ||||||
Mattson Technology, Inc.* | 237,351 | 795,126 | ||||||
Microsemi Corp.* | 26,862 | 938,827 | ||||||
Photronics, Inc.* | 55,303 | 525,932 | ||||||
Skyworks Solutions, Inc. | 7,944 | 826,970 | ||||||
SunEdison, Inc.* | 119,960 | 3,588,004 | ||||||
Tessera Technologies, Inc. | 33,769 | 1,282,547 | ||||||
Tower Semiconductor Ltd.* | 46,526 | 718,361 | ||||||
Veeco Instruments, Inc.* | 63,126 | 1,814,240 | ||||||
|
| |||||||
| 14,697,637 | ||||||||
|
| |||||||
Software – 4.7% |
| |||||||
Arista Networks, Inc.* | 9,146 | 747,594 | ||||||
Callidus Software, Inc.* | 127,561 | 1,987,400 | ||||||
Five9, Inc.* | 40,253 | 210,523 | ||||||
Gigamon, Inc.* | 21,835 | 720,337 | ||||||
Monotype Imaging Holdings, Inc. | 9,514 | 229,383 | ||||||
Proofpoint, Inc.* | 10,775 | 686,043 | ||||||
|
| |||||||
| 4,581,280 | ||||||||
|
| |||||||
TOTAL INFORMATION TECHNOLOGY |
| 29,221,556 | ||||||
|
| |||||||
| Shares | Value (Note 2) | |||||||
| COMMON STOCK – continued | ||||||||
MATERIALS – 1.3% |
| |||||||
Construction Materials – 1.3% |
| |||||||
US Concrete, Inc.* | 34,171 | $ | 1,294,739 | |||||
|
| |||||||
TOTAL MATERIALS |
| 1,294,739 | ||||||
|
| |||||||
TELECOMMUNICATION SERVICES – 1.8% |
| |||||||
Diversified Telecommunication Services – 1.8% |
| |||||||
inContact, Inc.* | 172,815 | 1,705,683 | ||||||
|
| |||||||
TOTAL TELECOMMUNICATION SERVICES |
| 1,705,683 | ||||||
|
| |||||||
TOTAL COMMON STOCK |
| 93,806,502 | ||||||
|
| |||||||
| SHORT-TERM INVESTMENTS – 2.5% | ||||||||
Blackrock Liquidity Funds TempFund Portfolio, Institutional Class, 0.01%** | 2,395,230 | 2,395,230 | ||||||
TOTAL SHORT-TERM INVESTMENTS |
| 2,395,230 | ||||||
|
| |||||||
TOTAL INVESTMENTS |
| 96,201,732 | ||||||
OTHER ASSETSIN EXCESSOF LIABILITIES - 1.1% |
| 1,112,821 | ||||||
|
| |||||||
NET ASSETS - 100.0% |
| $ | 97,314,553 | |||||
|
| |||||||
| ADR | American Depositary Receipt |
| * | Non-income producing security. |
| ** | The rate shown represents the 7-day effective yield as of June 30, 2015. |
| † | The cost for federal income tax purposes is $80,542,327. At June 30, 2015, net unrealized appreciation was $15,659,405. This consisted of aggregate gross unrealized appreciation for all securities for which there was an excess of market value over tax cost of $17,498,127, and aggregate gross unrealized depreciation for all securities for which there was an excess of tax cost over market value $1,838,722. |
The accompanying notes are an integral part of the financial statements.
8
How did the Fund perform during the annual period ending June 30, 2015?
The Mar Vista Strategic Growth Fund was up 7.67% for the twelve months ending June 30, 2015 compared to 10.56% for the Fund’s benchmark, the Russell 1000® Growth Index for the same period.
What key factors were responsible for the Fund’s performance during the 12-month reporting period?
Stable interest rates, a modest U.S. economic recovery and strong financial results for our businesses drove the Fund’s appreciation over the last twelve months. O’Reilly Automotive (+49%), Allergan (+42%), Mettler Toledo (+35%), and TransDigm (+34%) contributed the most to absolute performance while Qualcomm (-19%), two of our aerospace businesses, B/E Aerospace (-18%) and Precision Castparts (-13%), and our energy positions, Schlumberger (-25%), Core Lab (-23%) and Occidental Petroleum (-19%), detracted during the period. Relative to the benchmark, our lack of biotechnology stocks (up over 60%) and a large underweight in Apple which was up 37% and accounts for 6.4% of the benchmark compared to our 3.0% weight hurt performance. Combined, the underweight in biotechnology and Apple placed more than a 3% drag on relative performance.
Which equity market sectors most significantly affected Fund performance?
Sectors that drove the Fund’s return included consumer discretionary (+30%), healthcare (+24%), and financials (+10%) while Energy (-20%) was the only meaningful decliner. Relative to the benchmark, healthcare was the clear detractor as both our underweight (9.5% vs. 14.1%) in the sector and owning no biotechnology businesses dragged on overall relative performance by more than 2.5%.
What are you expecting from the equity markets over the upcoming year?
Our average discount to intrinsic value, at 13%, has improved but still remains compressed compared to the historical averages of 20-35% discounts. Our expectations for future returns remain the same: with the discount between prices and intrinsic values unusually compressed, we would anticipate returns over our time horizon to more closely correlate with our companies’ ability to compound per share intrinsic value (10-12% average with a range of 7% to 20% assuming a stable economic environment) and only a modest return from discounted prices.
Sincerely,
Silas A. Myers Portfolio Manager
| Brian L. Massey Portfolio Manager
|


Returns represent past performance and include changes in share price and reinvestment of dividends and capital gains. Past performance cannot guarantee future results. The current performance of the Fund may be lower or higher than the figures shown. Returns and share price will fluctuate, and redemption value may be more or less than original cost. Performance information current to the most recent month-end is available by calling (800) 497-2960.
In addition to historical information, this report contains forward-looking statements which may concern, among other things, the domestic and foreign markets, economic trends and government regulations and their potential impact on the Fund’s investments. These statements are subject to risks and uncertainties and actual developments in the future and their impact on the Fund could be materially different than those that are projected or implied.
Portfolio composition is subject to change.
9
STRATEGIC GROWTH
The following tables are for the year ended June 30, 2015:
| Top Ten Holdings (Unaudited) | % of Portfolio | |||
Honeywell International, Inc. | 4.9 | % | ||
American Tower Corp. | 4.6 | % | ||
Mondelez International, Inc. - Class A | 4.0 | % | ||
Berkshire Hathaway, Inc. - Class B | 4.0 | % | ||
TJX Cos, Inc. (The) | 3.7 | % | ||
Oracle Corp. | 3.6 | % | ||
Mettler-Toledo International, Inc | 3.6 | % | ||
PepsiCo, Inc. | 3.5 | % | ||
Markel Corp. | 3.3 | % | ||
TransDigm Group, Inc. | 3.2 | % | ||
| Sector Breakdown (Unaudited) | % of Portfolio | |||
Information Technology | 17.3 | % | ||
Industrials | 16.4 | % | ||
Financials | 13.4 | % | ||
Consumer Discretionary | 11.3 | % | ||
Consumer Staples | 10.5 | % | ||
Health Care | 9.7 | % | ||
Energy | 6.7 | % | ||
Materials | 4.4 | % | ||
Short-Term Investments | 10.3 | % | ||
TOTAL | 100.0 | % | ||
| Portfolio Statistics (Unaudited) | ||||
Number of Holdings | 35 | |||
Market Cap (wtd. avg, bil) | $114.6 | b | ||
Price/Book Value (wtd. Avg.) | 5.4 | x | ||
Price/Earnings (wtd. Avg.) | 24.5 | x | ||
Beta | 0.95 | |||
Standard Deviation | 7.29 | |||
Portfolio Turnover | 33 | % | ||
QUARTERLY PORTFOLIO HOLDINGS (Unaudited)
The Fund files a complete schedule of portfolio holdings with the Securities and Exchange Commission (SEC) for the first and third quarters of each fiscal year on Form N-Q. The Fund’s Forms N-Q are available electronically on the SEC’s website at www.sec.gov. Hard copies may be reviewed and copied at the SEC’s Public Reference Room in Washington, DC. For more information on the Public Reference Room, call 1-800-SEC-0330.
Portfolio holdings are subject to change at any time.
10
MAR VISTA STRATEGIC GROWTH FUND
Mar Vista Strategic Growth Fund
Comparison of Change in Value of a Hypothetical $100,000 Investment* (Unaudited)
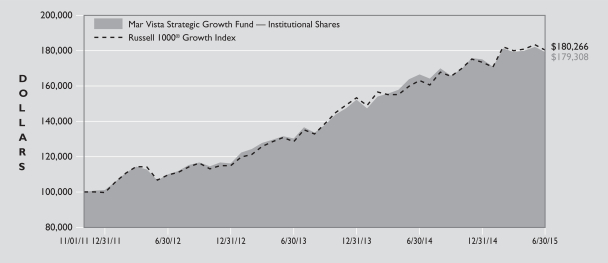
The following table compares the performance of the Mar Vista Strategic Growth Fund and the Russell 1000® Growth Index for the periods ended June 30.
| Average Annual Total Return For the Periods Ended June 30, 2015 | ||||||||||||
| 1 Year | 3 Years | Since Inception1 | ||||||||||
Mar Vista Strategic Growth Fund Institutional Shares | 7.67% | 17.69% | 17.28% | |||||||||
Russell 1000® Growth Index2 | 10.56% | 17.99% | 17.45% | |||||||||
Fund Expense Ratios3: Institutional Shares: Gross 2.80%, Net 0.91%.
| * | Performance quoted represents past performance and does not guarantee future results. Investment return and principal value will fluctuate. Shares, when redeemed, may be worth more or less than their original cost. Current performance may be lower or higher than that shown here. Performance data current to the most recent month-end is available by calling (800) 497-2960. |
The performance in the table above does not reflect the deduction of taxes a shareholder would pay on Fund distributions or redemption of Fund shares.
Shareholders should consider the investment objectives, risks, charges and expenses of the Fund carefully before investing. The Fund’s prospectus contains this and other important information about the Fund. For a copy of the prospectus, call (800) 497-2960. Please read carefully before investing.
| 1 | The Institutional Shares commenced operations on November 1, 2011. |
| 2 | The Russell 1000® Growth Index measures the performance of the large-cap growth segment of the U.S. equity universe. It includes those Russell 1000® Index companies with higher price-to-book ratios and higher forecasted growth values. |
| 3 | The expense ratios of the Fund are set forth according to the prospectus for the Fund effective November 1, 2014 and may differ from the expense ratios disclosed in the Financial Highlights tables in this report. Net Expense: Expenses reduced by a contractual fee waiver through November 1, 2020. Gross expenses do not reflect the effect of a contractual fee waiver. |
11
STRATEGIC GROWTH
MAR VISTA STRATEGIC GROWTH FUND
SCHEDULE OF INVESTMENTS JUNE 30, 2015
| Shares | Value (Note 2) | |||||||
| COMMON STOCK – 89.7% | ||||||||
CONSUMER DISCRETIONARY – 11.3% |
| |||||||
Hotels, Restaurants & Leisure – 2.6% |
| |||||||
Starbucks Corp. | 10,009 | $ | 536,633 | |||||
|
| |||||||
Media – 2.9% |
| |||||||
Liberty Global PLC - Class C* | 11,553 | 584,928 | ||||||
|
| |||||||
Specialty Retail – 5.8% |
| |||||||
O’Reilly Automotive, Inc.* | 1,953 | 441,339 | ||||||
TJX Cos, Inc. (The) | 11,440 | 756,985 | ||||||
|
| |||||||
| 1,198,324 | ||||||||
|
| |||||||
TOTAL CONSUMER DISCRETIONARY |
| 2,319,885 | ||||||
|
| |||||||
CONSUMER STAPLES – 10.5% | ||||||||
Beverages – 4.8% |
| |||||||
Anheuser-Busch InBev NV, ADR | 2,271 | 274,042 | ||||||
PepsiCo, Inc. | 7,628 | 711,998 | ||||||
|
| |||||||
| 986,040 | ||||||||
|
| |||||||
Food Products – 4.0% |
| |||||||
Mondelez International, Inc. - Class A | 20,056 | 825,104 | ||||||
|
| |||||||
Household Products – 1.7% |
| |||||||
Procter & Gamble Co. (The) | 4,498 | 351,924 | ||||||
|
| |||||||
TOTAL CONSUMER STAPLES |
| 2,163,068 | ||||||
|
| |||||||
ENERGY – 6.7% | ||||||||
Energy, Equipment & Services – 5.2% |
| |||||||
Core Laboratories NV | 5,094 | 580,920 | ||||||
Schlumberger Ltd. | 5,676 | 489,214 | ||||||
|
| |||||||
| 1,070,134 | ||||||||
|
| |||||||
Oil, Gas & Consumable Fuels – 1.5% |
| |||||||
Exxon Mobil Corp. | 3,757 | 312,582 | ||||||
|
| |||||||
TOTAL ENERGY |
| 1,382,716 | ||||||
|
| |||||||
FINANCIALS – 13.4% | ||||||||
Commercial Bank – 1.5% |
| |||||||
US Bancorp/MN | 7,185 | 311,829 | ||||||
|
| |||||||
Insurance – 7.3% |
| |||||||
Berkshire Hathaway, Inc. - Class B* | 6,035 | 821,424 | ||||||
Markel Corp.* | 849 | 679,777 | ||||||
|
| |||||||
| 1,501,201 | ||||||||
|
| |||||||
Real Estate Investment Trusts – 4.6% |
| |||||||
American Tower Corp. | 10,126 | 944,655 | ||||||
|
| |||||||
TOTAL FINANCIALS |
| 2,757,685 | ||||||
|
| |||||||
HEALTH CARE – 9.7% | ||||||||
Health Care Equipment & Supplies – 1.9% |
| |||||||
St Jude Medical, Inc. | 5,519 | 403,273 | ||||||
|
| |||||||
Life Sciences Tools & Services – 3.6% |
| |||||||
Mettler-Toledo International, Inc* | 2,147 | 733,115 | ||||||
|
| |||||||
Pharmaceuticals – 4.2% |
| |||||||
Allergan PLC | 1,199 | 363,769 | ||||||
Johnson & Johnson | 5,064 | 493,537 | ||||||
|
| |||||||
| 857,306 | ||||||||
|
| |||||||
TOTAL HEALTH CARE |
| 1,993,694 | ||||||
|
| |||||||
INDUSTRIALS – 16.4% | ||||||||
Aerospace & Defense – 11.6% |
| |||||||
B/E Aerospace, Inc. | 7,894 | 433,381 | ||||||
| Shares | Value (Note 2) | |||||||
| COMMON STOCK – continued | ||||||||
Honeywell International, Inc. | 9,860 | $ | 1,005,424 | |||||
Precision Castparts Corp. | 1,408 | 281,417 | ||||||
TransDigm Group, Inc.* | 2,969 | 667,045 | ||||||
|
| |||||||
| 2,387,267 | ||||||||
|
| |||||||
Electrical Equipment – 2.2% |
| |||||||
Sensata Technologies Holding NV* | 8,494 | 447,974 | ||||||
|
| |||||||
Road & Rail – 2.6% |
| |||||||
Union Pacific Corp. | 5,467 | 521,388 | ||||||
|
| |||||||
TOTAL INDUSTRIALS |
| 3,356,629 | ||||||
|
| |||||||
INFORMATION TECHNOLOGY – 17.3% | ||||||||
Communications Equipment – 2.0% |
| |||||||
QUALCOMM, Inc. | 6,399 | 400,769 | ||||||
|
| |||||||
Computers & Peripherals – 2.8% |
| |||||||
Apple, Inc. | 4,643 | 582,348 | ||||||
|
| |||||||
Internet Software & Services – 1.6% |
| |||||||
GOOGLE, Inc. - Class C* | 636 | 331,044 | ||||||
|
| |||||||
IT Services – 2.9% |
| |||||||
Visa, Inc. - Class A | 8,784 | 589,846 | ||||||
|
| |||||||
Software – 8.0% |
| |||||||
Adobe Systems, Inc.* | 6,968 | 564,478 | ||||||
Intuit, Inc. | 3,367 | 339,293 | ||||||
Oracle Corp. | 18,484 | 744,905 | ||||||
|
| |||||||
| 1,648,676 | ||||||||
|
| |||||||
TOTAL INFORMATION TECHNOLOGY |
| 3,552,683 | ||||||
|
| |||||||
MATERIALS – 4.4% | ||||||||
Chemicals – 4.4% |
| |||||||
Ecolab, Inc. | 5,235 | 591,921 | ||||||
Praxair, Inc. | 2,662 | 318,242 | ||||||
|
| |||||||
| 910,163 | ||||||||
|
| |||||||
TOTAL MATERIALS |
| 910,163 | ||||||
|
| |||||||
TOTAL COMMON STOCK |
| 18,436,523 | ||||||
|
| |||||||
| SHORT-TERM INVESTMENTS – 10.3% | ||||||||
Blackrock Liquidity Funds | 2,109,980 | 2,109,980 | ||||||
|
| |||||||
TOTAL SHORT-TERM INVESTMENTS (COST $2,109,980) |
| 2,109,980 | ||||||
|
| |||||||
TOTAL INVESTMENTS |
| 20,546,503 | ||||||
LIABILITIESIN EXCESSOF OTHER ASSETS - (0.0)% |
| (6,878) | ||||||
|
| |||||||
NET ASSETS - 100.0% |
| $ | 20,539,625 | |||||
|
| |||||||
| ADR | American Depositary Receipt |
| PLC | Professional Legal Corporation |
| * | Non-income producing security. |
| ** | The rate shown represents the 7-day effective yield as of June 30, 2015. |
| † | The cost for federal income tax purposes is $17,325,787. At June 30, 2015, net unrealized appreciation was $3,220,716. This consisted of aggregate gross unrealized appreciation for all securities for which there was an excess of market value over tax cost of $3,291,170, and aggregate gross unrealized depreciation for all securities for which there was an excess of tax cost over market value $70,454. |
The accompanying notes are an integral part of the financial statements.
12
STATEMENTS OF ASSETS AND LIABILITIES
June 30, 2015
| Small-Cap Growth Fund | Strategic Growth Fund | |||||||
Assets: | ||||||||
Investments in securities, at value* | $ | 96,201,732 | $ | 20,546,503 | ||||
Cash | 62,835 | — | ||||||
Receivable for Fund shares sold | 28,780 | 28,000 | ||||||
Receivable for investments sold | 2,220,089 | — | ||||||
Dividends and interest receivable | 40,794 | 18,361 | ||||||
Receivable from adviser | — | 10,117 | ||||||
Prepaid Expenses | 14,495 | 2,323 | ||||||
|
|
|
| |||||
Total assets | 98,568,725 | 20,605,304 | ||||||
|
|
|
| |||||
Liabilities: | ||||||||
Payable for Fund shares redeemed | 107,721 | 10,817 | ||||||
Payable for investments purchased | 1,024,450 | — | ||||||
Accrued advisory fee | 52,022 | — | ||||||
Other accrued expenses | 69,979 | 54,862 | ||||||
|
|
|
| |||||
Total liabilities | 1,254,172 | 65,679 | ||||||
|
|
|
| |||||
Net Assets | $ | 97,314,553 | $ | 20,539,625 | ||||
|
|
|
| |||||
Net Assets consist of: | ||||||||
Par value | $ | 29,109 | $ | 13,344 | ||||
Paid-in capital | 76,046,912 | 16,717,907 | ||||||
Accumulated net investment loss | (293,210 | ) | — | |||||
Accumulated net realized gain on investments | 5,536,041 | 583,140 | ||||||
Net unrealized appreciation of investments | 15,995,701 | 3,225,234 | ||||||
|
|
|
| |||||
Net Assets | $ | 97,314,553 | $ | 20,539,625 | ||||
|
|
|
| |||||
Net assets by share class: | ||||||||
Institutional Shares | $ | 97,314,553 | $ | 20,539,625 | ||||
|
|
|
| |||||
Shares of beneficial interest outstanding: | ||||||||
($0.01 par value, unlimited authorized shares): | ||||||||
Institutional Shares | 2,910,865 | 1,334,362 | ||||||
Per Share: | ||||||||
Institutional Shares (net asset value, offering and redemption price**) | $ | 33.43 | $ | 15.39 | ||||
|
|
|
|
| ||||
*Investments at cost | $ | 80,206,031 | $ | 17,321,269 | ||||
|
|
|
| |||||
| **Redemption | price will vary based on length of time shares are held. See Note 6. |
The accompanying notes are an integral part of the financial statements.
13
THE ROXBURY FUNDS
For the Year Ended June 30, 2015
| Small-Cap Growth Fund | Strategic Growth Fund | |||||||
Investment Income: | ||||||||
Dividends | $ | 338,304 | $ | 182,261 | ||||
Foreign tax withheld | (951 | ) | (1,994 | ) | ||||
|
|
|
| |||||
Total investment income | 337,353 | 180,267 | ||||||
|
|
|
| |||||
Expenses: | ||||||||
Advisory fees (Note 3) | 832,927 | 125,342 | ||||||
Administration and accounting fees | 128,937 | 54,788 | ||||||
Transfer agent fees | 62,939 | 26,088 | ||||||
Legal fees | 49,660 | 49,660 | ||||||
Insurance expense | 31,757 | 18,048 | ||||||
Registration fees | 28,206 | 36,023 | ||||||
Custody fees | 18,972 | 8,639 | ||||||
Trustees’ and Officers’ fees | 22,880 | 22,880 | ||||||
Reports to shareholders | 13,106 | 11,012 | ||||||
Audit fees | 18,001 | 18,001 | ||||||
Other | 2,600 | 2,301 | ||||||
|
|
|
| |||||
Total expenses before fee waivers and expense reimbursements | 1,209,985 | 372,782 | ||||||
|
|
|
| |||||
Advisory fees waived/expenses reimbursed (Note 3) | (213,922 | ) | (222,037 | ) | ||||
|
|
|
| |||||
Total expenses, net | 996,063 | 150,745 | ||||||
|
|
|
| |||||
Net investment income/(loss) | (658,710 | ) | 29,522 | |||||
|
|
|
| |||||
Net realized and unrealized gain/(loss) on investments: | ||||||||
Net realized gain on investments | 13,665,747 | 1,113,325 | ||||||
Net change in unrealized appreciation (depreciation) on investments | (3,364,334 | ) | 77,734 | |||||
|
|
|
| |||||
Net gain on investments | 10,301,413 | 1,191,059 | ||||||
|
|
|
| |||||
Net increase in net assets resulting from operations | $ | 9,642,703 | $ | 1,220,581 | ||||
|
|
|
| |||||
The accompanying notes are an integral part of the financial statements.
14
FINANCIAL STATEMENTS
STATEMENTS OF CHANGES IN NET ASSETS
| Small-Cap Growth Fund | Strategic Growth Fund | |||||||||||||||
| For the Year Ended June 30, 2015 | For the Year Ended June 30, 2014 | For the Year Ended June 30, 2015 | For the Year Ended June 30, 2014 | |||||||||||||
Increase/(Decrease) in Net Assets: | ||||||||||||||||
Operations: | ||||||||||||||||
Net investment gain/(loss) | $ | (658,710 | ) | $ | (567,948 | ) | $ | 29,522 | $ | 61,615 | ||||||
Net realized gain on investments | 13,665,747 | 10,789,686 | 1,113,325 | 637,351 | ||||||||||||
Net change in unrealized appreciation (depreciation) on investments | (3,364,334 | ) | 4,618,340 | 77,734 | 1,896,785 | |||||||||||
|
|
|
|
|
|
|
| |||||||||
Net increase in net assets resulting from operations | 9,642,703 | 14,840,078 | 1,220,581 | 2,595,751 | ||||||||||||
|
|
|
|
|
|
|
| |||||||||
Distributions to shareholders from: | ||||||||||||||||
Net investment income: | ||||||||||||||||
Institutional shares | — | — | (57,714 | ) | (103,328 | ) | ||||||||||
Net realized gains: | ||||||||||||||||
Institutional shares | — | — | (1,045,970 | ) | (452,078 | ) | ||||||||||
|
|
|
|
|
|
|
| |||||||||
Total Distributions | — | — | (1,103,684 | ) | (555,406 | ) | ||||||||||
|
|
|
|
|
|
|
| |||||||||
Fund share transactions: | ||||||||||||||||
Institutional Class | ||||||||||||||||
Proceeds from shares sold | 42,102,738 | 25,437,627 | 7,088,871 | 4,377,479 | ||||||||||||
Cost of shares issued on reinvestment of distributions | — | — | 1,065,759 | 393,510 | ||||||||||||
Redemption fees | 6,868 | 4,033 | — | 32 | ||||||||||||
Cost of shares redeemed | (38,403,511 | ) | (16,208,751 | ) | (1,409,539 | ) | (1,798,363 | ) | ||||||||
|
|
|
|
|
|
|
| |||||||||
Net increase in net assets from Fund share transactions | 3,706,095 | 9,232,909 | 6,745,091 | 2,972,658 | ||||||||||||
|
|
|
|
|
|
|
| |||||||||
Total increase in net assets | 13,348,798 | 24,072,987 | 6,861,988 | 5,013,003 | ||||||||||||
Net Assets: | ||||||||||||||||
Beginning of year | 83,965,755 | 59,892,768 | 13,677,637 | 8,664,634 | ||||||||||||
|
|
|
|
|
|
|
| |||||||||
End of year | $ | 97,314,553 | $ | 83,965,755 | $ | 20,539,625 | $ | 13,677,637 | ||||||||
|
|
|
|
|
|
|
| |||||||||
Accumulated net investment loss | $ | (293,210 | ) | $ | (384,774 | ) | $ | — | $ | — | ||||||
|
|
|
|
|
|
|
| |||||||||
Capital share transactions: | ||||||||||||||||
Institutional Class | ||||||||||||||||
Shares sold | 1,346,674 | 914,985 | 466,994 | 309,565 | ||||||||||||
Shares reinvested | — | — | 71,003 | 28,913 | ||||||||||||
Shares redeemed | (1,322,425 | ) | (598,207 | ) | (91,468 | ) | (127,576 | ) | ||||||||
|
|
|
|
|
|
|
| |||||||||
Net increase in capital shares | 24,249 | 316,778 | 446,529 | 210,902 | ||||||||||||
|
|
|
|
|
|
|
| |||||||||
The accompanying notes are an integral part of the financial statements.
15
THE ROXBURY FUNDS
The following table includes selected data for a share outstanding throughout each year and other performance information derived from the financial statements. The total returns in the table represent the rate an investor would have earned or lost on an investment in the Fund (assuming reinvestment of all dividends and distributions). This information should be read in conjunction with the financial statements and notes thereto.
| For the Years Ended June 30, | ||||||||||||||||||||
| 2015 | 2014 | 2013 | 2012 | 2011 | ||||||||||||||||
Small-Cap Growth Fund — Institutional Shares | ||||||||||||||||||||
Net Asset Value — Beginning of Year | $ | 29.09 | $ | 23.31 | $ | 17.72 | $ | 18.40 | $ | 13.24 | ||||||||||
|
|
|
|
|
|
|
|
|
| |||||||||||
Investment Operations: | ||||||||||||||||||||
Net investment loss1 | (0.24 | ) | (0.22 | ) | (0.12 | ) | (0.15 | ) | (0.16 | ) | ||||||||||
Net realized and unrealized gain/(loss) on investments | 4.58 | 6.00 | 5.71 | (0.53 | ) | 5.32 | ||||||||||||||
|
|
|
|
|
|
|
|
|
| |||||||||||
Total from investment operations | 4.34 | 5.78 | 5.59 | (0.68 | ) | 5.16 | ||||||||||||||
|
|
|
|
|
|
|
|
|
| |||||||||||
Redemption fees | — | 2 | — | 2 | — | 2 | — | 2 | — | 2 | ||||||||||
|
|
|
|
|
|
|
|
|
| |||||||||||
Net Asset Value — End of Year | $ | 33.43 | $ | 29.09 | $ | 23.31 | $ | 17.72 | $ | 18.40 | ||||||||||
|
|
|
|
|
|
|
|
|
| |||||||||||
Total Return | 14.92% | 24.80% | 31.55% | (3.70)% | 38.97% | |||||||||||||||
Ratios (to average net assets)/Supplemental Data: |
| |||||||||||||||||||
Expenses: | ||||||||||||||||||||
Including waivers/reimbursements | 1.20% | 1.25% | 1.25% | 1.25% | 1.25% | |||||||||||||||
Excluding waivers/reimbursements | 1.45% | 1.48% | 1.59% | 1.57% | 1.53% | |||||||||||||||
Net investment loss | (0.79)% | (0.82)% | (0.58)% | (0.88)% | (0.96)% | |||||||||||||||
Portfolio turnover rate | 142% | 115% | 119% | 138% | 181% | |||||||||||||||
Net assets at the end of year | $ | 97,315 | $ | 83,966 | $ | 59,893 | $ | 57,643 | $ | 99,054 | ||||||||||
| 1 | The net investment loss per share was calculated using the average shares outstanding method. |
| 2 | Amount is less than $0.01. |
The accompanying notes are an integral part of the financial statements.
16
The following table includes selected data for a share outstanding throughout each period and other performance information derived from the financial statements. The total return in the table represents the rate an investor would have earned or lost on an investment in the Fund (assuming reinvestment of all dividends and distributions). This information should be read in conjunction with the financial statements and notes thereto.
| For the Year Ended June 30, 2015 | For the Year Ended June 30, 2014 | For the Year Ended June 30, 2013 | For the Period Ended June 30, 20121 | |||||||||||||
Strategic Growth Fund — Institutional Shares | ||||||||||||||||
Net Asset Value — Beginning of Period | $ | 15.41 | $ | 12.80 | $ | 11.00 | $ | 10.00 | ||||||||
|
|
|
|
|
|
|
| |||||||||
Investment Operations: | ||||||||||||||||
Net investment income2 | 0.04 | 0.08 | 0.10 | 0.08 | ||||||||||||
Net realized and unrealized gain on investments | 1.11 | 3.35 | 1.92 | 0.92 | ||||||||||||
|
|
|
|
|
|
|
| |||||||||
Total from investment operations | 1.15 | 3.43 | 2.02 | 1.00 | ||||||||||||
|
|
|
|
|
|
|
| |||||||||
Distributions: | ||||||||||||||||
From net investment income | (0.06 | ) | (0.15 | ) | (0.13 | ) | — | |||||||||
From net realized gains | (1.11 | ) | (0.67 | ) | (0.09 | ) | — | |||||||||
|
|
|
|
|
|
|
| |||||||||
Total distributions | (1.17 | ) | (0.82 | ) | (0.22 | ) | — | |||||||||
Redemption fees | — | — | 3 | — | 3 | — | 3 | |||||||||
|
|
|
|
|
|
|
| |||||||||
Net Asset Value — End of Period | $ | 15.39 | $ | 15.41 | $ | 12.80 | $ | 11.00 | ||||||||
|
|
|
|
|
|
|
| |||||||||
Total Return | 7.67% | 27.71% | 18.55% | 10.00% | ** | |||||||||||
Ratios (to average net assets)/Supplemental Data: |
| |||||||||||||||
Expenses: | ||||||||||||||||
Including waivers/reimbursements | 0.90% | 0.90% | 0.90% | 0.90% | * | |||||||||||
Excluding waivers/reimbursements | 2.23% | 2.79% | 3.99% | 4.85% | * | |||||||||||
Net investment income | 0.18% | 0.58% | 0.82% | 1.12% | * | |||||||||||
Portfolio turnover rate | 33% | 31% | 59% | 27% | ** | |||||||||||
Net assets at the end of period | $ | 20,540 | $ | 13,678 | $ | 8,665 | $ | 6,483 | ||||||||
| * | Annualized |
| ** | Not Annualized |
| 1 | Operations commenced on November 1, 2011. |
| 2 | The net investment income per share was calculated using the average shares outstanding method. |
| 3 | Amount is less than $0.01. |
The accompanying notes are an integral part of the financial statements.
17
| 1. | Description of the Funds. The Hood River Small-Cap Growth Fund (formerly, the Roxbury/Hood River Small-Cap Growth Fund) (“Small-Cap Growth Fund”) and the Mar Vista Strategic Growth Fund (formerly the Roxbury/Mar Vista Strategic Growth Fund) (“Strategic Growth Fund”) (the “Funds”) are each a series of The Roxbury Funds (the “Trust”). The Trust is registered under the Investment Company Act of 1940, as amended (the “1940 Act”), as a diversified open-end investment management company and was organized as a Delaware statutory trust on April 4, 2006. The fiscal year end for the Funds is June 30th. |
As of June 30, 2015, each of the Funds offers one class of shares: Institutional Shares.
| 2. | Significant Accounting Policies. The following is a summary of the significant accounting policies of the Funds: |
Use of Estimates in the Preparation of Financial Statements. The preparation of financial statements in conformity with accounting principles generally accepted in the United States of America (“GAAP”) requires management to make estimates and assumptions that affect the reported amounts of assets and liabilities and the disclosure of contingent assets and liabilities at the date of the financial statements and the reported amounts of increases and decreases in net assets from operations during the reporting period. Actual results could differ from those estimates.
Security Valuation. Securities held by the Funds which are listed on a securities exchange and for which market quotations are available are valued at the last quoted sale price of the day, or, if there is no such reported sale, securities are valued at the mean between the most recent quoted bid and ask prices. Securities traded on The NASDAQ Stock Market, Inc. (“NASDAQ”) are valued in accordance with the NASDAQ Official Closing Price, which may not be the last sale price. Price information for listed securities is taken from the exchange where the security is primarily traded. Unlisted securities for which market quotations are readily available are valued at the mean between the closing asked and bid quotations in the over-the-counter market. Securities with a remaining maturity of 60 days or less are valued at amortized cost, which approximates market value, unless the Trustees determine that this does not represent fair value. Securities that do not have a readily available current market value are valued in good faith using procedures adopted by the Trustees.
Fair Value Measurements. The inputs and valuation techniques used to measure the fair value of the Funds’ investments are summarized into three levels as described in the hierarchy below:
| • Level 1 — | quoted prices in active markets for identical securities | |
| • Level 2 — | other significant observable inputs (including quoted prices for similar securities, interest rates, prepayment speeds, credit risk, etc.) | |
| • Level 3 — | significant unobservable inputs (including the Funds’ own assumptions in determining the fair value of investments) |
The inputs or methodologies used for valuing securities are not necessarily an indication of the risk associated with investing in those securities. The following is a summary of the inputs used, as of June 30, 2015, in valuing each Fund’s investments carried at fair value:
Small-Cap Growth Fund
| Total Value at June 30, 2015 | Level 1 Quoted Price | Level 2 Other Significant Observable Inputs | Level 3 Significant Unobservable Inputs | |||||||||||||
Investments in Securities* | $ | 96,201,732 | $ | 96,201,732 | $ | — | $ | — | ||||||||
Strategic Growth Fund
| Total Value at June 30, 2015 | Level 1 Quoted Price | Level 2 Other Significant Observable Inputs | Level 3 Significant Unobservable Inputs | |||||||||||||
Investments in Securities* | $ | 20,546,503 | $ | 20,546,503 | $ | — | $ | — | ||||||||
*Common stocks and short-term investments are Level 1. Please refer to the schedule of investments for industry or sector breakout.
At the end of each calendar quarter, management evaluates the classification of Levels 1, 2 and 3 assets and liabilities. Various factors are considered, such as changes in liquidity from the prior reporting period; whether or not a broker is willing to execute at the quoted price; the depth and consistency of prices from third party pricing services; and the existence of contemporaneous, observable trades in the market. Additionally, management evaluates the classification of Level 1 and Level 2 assets and liabilities on a quarterly basis for changes in listings or delistings on national exchanges.
Due to the inherent uncertainty of determining the fair value of investments that do not have a readily available market value, the fair value of each Fund’s investments may fluctuate from period to period. Additionally, the fair value of investments may differ
18
significantly from the values that would have been used had a ready market existed for such investments and may differ materially from the values the Funds may ultimately realize. Further, such investments may be subject to legal and other restrictions on resale or may be otherwise less liquid than publicly traded securities.
For the year ended June 30, 2015, there were no transfers between Levels 1, 2 and 3 for the Funds. It is each Fund’s policy to recognize transfers at the end of the reporting period.
Federal Income Taxes. The Funds are treated as separate entities for Federal income tax purposes and intend to continue to qualify as “regulated investment companies” under Subchapter M of the Internal Revenue Code of 1986, as amended, and to distribute substantially all of their income to their shareholders. Therefore, no Federal income tax provision has been made.
Management has analyzed the Funds’ tax positions taken on Federal income tax returns for all open tax years (current and prior three tax years) and has concluded that no provision for Federal income tax is required in the Funds’ financial statements. The Funds’ Federal and state income and Federal excise tax returns for tax years for which the applicable statutes of limitations have not expired are subject to examination by the Internal Revenue Service and state departments of revenue.
Security Transactions, Investment Income and Expenses. Investment security transactions are accounted for on a trade date basis. The Funds use the specific identification method for determining realized gains and losses on investments for both financial and Federal income tax reporting purposes. Interest income is recorded on the accrual basis and includes the amortization of premium and the accretion of discount. Dividend income is recorded on the ex-dividend date. The Funds record expenses on an accrual basis. General expenses of the Trust are generally allocated to each Fund in proportion to its relative daily net assets. Expenses directly attributable to a particular Fund in the Trust are charged directly to that Fund.
Distributions to Shareholders. Dividends and distributions to shareholders are recorded on the ex-dividend date. Distributions from net investment income and net realized gains, if any, will be declared and paid annually.
| 3. | Fees and Other Transactions with Related Parties. Roxbury Capital Management, LLC (“Roxbury”) served as investment adviser to the Funds for the period ended June 30, 2014 and through January 20, 2015. For its services, Roxbury received a fee from the Funds at annual rates as follows: |
% of Average Daily Net Assets | ||
Small-Cap Growth Fund | 1.00% up to $1 billion; 0.95% of next $1 billion; and 0.90% in excess of $2 billion | |
Strategic Growth Fund | 0.75% |
Mar Vista Investment Partners, LLC (“Mar Vista”), served as the sub-adviser to the Strategic Growth Fund subject to the supervision of Roxbury through January 20, 2015. Hood River Capital Management LLC (“Hood River”) served as the sub-adviser to the Small-Cap Growth Fund subject to the supervision of Roxbury through January 20, 2015. Sub-advisory fees with respect to each Fund were paid by Roxbury.
On January 20, 2015, Mar Vista and Hood River each acquired a controlling interest in Roxbury (the “Transaction”). Prior to the Transaction, Roxbury had served as the investment adviser to the Small-Cap Growth Fund and the Strategic Growth Fund, Mar Vista had served as sub-adviser to the Strategic Growth Fund and Hood River had served as sub-adviser to the Small-Cap Growth Fund. Roxbury and each subadviser had previously notified the Board of Trustees of the Trust (the “Board”) that they recommend that Hood River replace Roxbury as primary investment adviser to the Small-Cap Growth Fund and that Mar Vista replace Roxbury as primary investment adviser to the Strategic Growth Fund following the Transaction.
As a result of the Transaction, the investment advisory agreement between Roxbury and the Trust, and the subadvisory agreements between Roxbury and each of Mar Vista for sub-advisory services to the Strategic Growth Fund and Hood River for sub-advisory services to the Small-Cap Growth Fund terminated effective January 20, 2015. In order to avoid disruption of the Funds’ investment management program, on December 30, 2014 the Board approved interim investment advisory agreements, between the Trust, on behalf of the Strategic Growth Fund, and Mar Vista, and between the Trust, on behalf of the Small-Cap Growth Fund, and Hood River in accordance with Rule 15a-4 under the 1940 Act. The interim investment advisory agreements became effective on January 20, 2015 upon termination of the investment advisory agreement between Roxbury and the Trust. The interim investment advisory agreements remained in effect until April 9, 2015 when the shareholders of each Fund approved new advisory agreements with Mar Vista and Hood River, respectively. The new investment advisory agreements have identical fee structures to the prior investment advisory agreement between Roxbury and the Trust, on behalf of the Funds. Mar Vista, on behalf of the Strategic Growth Fund, and Hood River on behalf of the Small Cap Growth Fund, each entered into an expense limitation agreement with the Trust that became effective January 20, 2015. The new expense limitation agreements have expense caps and termination dates as detailed below.
In connection with the appointment of Mar Vista and Hood River as investment advisers to the Strategic Growth Fund and Small-Cap Growth Fund, respectively, the Board also approved an administration agreement between Roxbury and the Trust pursuant to which Roxbury provides certain compliance and administrative services to the Trust. In addition, the name of the Strategic Growth Fund was changed to the Mar Vista Strategic Growth Fund and the name of the Small-Cap Growth Fund was changed to the Hood River
19
THE ROXBURY FUNDS
NOTES TO FINANCIAL STATEMENTS continued
Small-Cap Growth Fund, following the approval of the new advisory agreements by shareholders of each Fund at the special meeting on April 9, 2015.
During the year ended June 30, 2015, advisory fees of $376,680 and $65,204 were paid to Hood River from the Small-Cap Growth Fund and to Mar Vista from the Strategic Growth Fund, respectively. For the period from July 1, 2014 until January 20, 2015, advisory fees were paid to Roxbury in the amounts of $456,247 and $60,138 from the Small Cap Growth Fund and the Strategic Growth Fund, respectively.
Each Fund’s adviser has contractually agreed to waive a portion of its advisory fees or reimburse for other operating expenses (excluding taxes, extraordinary expenses, acquired funds fees and expenses and brokerage commissions and interest) to the extent that total annual Fund operating expenses exceed the following percentages of average daily net assets:
| Expense Cap | Expiration Date | |||||||
Small-Cap Growth Fund | 1.09 | % | December 31, 2020 | |||||
Strategic Growth Fund | 0.90 | % | November 1, 2020 | |||||
Prior to May 18, 2015, the contractual expense cap for the Small Cap Growth Fund was 1.25%. For the period from March 9, 2015 to May 18, 2015, Hood River voluntarily agreed to lower the Small-Cap Growth Fund’s expense cap to 1.09%. During the year ended June 30, 2015, Hood River waived advisory fees in the amount of $126,983 from the Small Cap Growth Fund; Mar Vista waived advisory fees in the amount of $100,548 from the Strategic Growth Fund. For the period from July 1, 2014 until January 20, 2015 Roxbury waived advisory fees in the amount of $86,939 from the Small-Cap Growth Fund and $121,489 from the Strategic Growth Fund.
Compensation of Trustees and Officers. For the fiscal year ended June 30, 2015, the Funds paid each Trustee who is not an interested person of the Funds a fee of $5,000 per year plus $2,000 for each regularly scheduled Board or Committee meeting, attended in person or by telephone; $2,000 for each special Board or Committee meeting attended in person and $2,000 for each special Board or Committee meeting attended by telephone. Each Trustee is reimbursed for reasonable out-of-pocket expenses incurred in connection with attendance at Board or Committee meetings. The Chairman of the Board was paid an additional fee of $1,000 per year. The Funds pay the Chief Compliance Officer a fee of $8,000 per year.
| 4. | Other Service Providers. BNY Mellon Investment Servicing (US) Inc. (“BNY Mellon”) provides administrative and accounting services to the Funds pursuant to an Accounting and Administrative Services Agreement. |
The Bank of New York Mellon serves as custodian to the Trust pursuant to a Custodian Services Agreement.
| 5. | Investment Securities Transactions. During the year ended June 30, 2015, purchases and sales of investment securities (excluding short-term investments) were as follows: |
| Small-Cap Growth Fund | Strategic Growth Fund | |||||||
Purchases | $ | 117,781,890 | $ | 9,724,067 | ||||
Sales | 115,153,503 | 5,012,632 | ||||||
| 6. | Redemption Fees. In accordance with the prospectus, the Small-Cap Growth Fund and the Strategic Growth Fund charge a redemption fee of 1% and 0.75%, respectively, on proceeds from shares redeemed within 60 days following their acquisition. The redemption fee is included as a separate line item under the Fund share transactions section on the Statements of Changes in Net Assets. |
| 7. | Federal Tax Information. Distributions to shareholders from net investment income and realized gains are determined in accordance with Federal income tax regulations, which may differ from net investment income and realized gains recognized for financial reporting purposes. Accordingly, the character of distributions and composition of net assets for tax purposes may differ from those reflected in the accompanying financial statements. To the extent these differences are permanent, such amounts are reclassified within the capital accounts based on the tax treatment; temporary differences do not require such reclassification. On June 30, 2015, the following reclassifications were made within the capital accounts to reflect permanent differences relating to net operating losses and redesignation of dividends paid. |
| Small-Cap Growth Fund | Strategic Growth Fund | |||||||
Paid-in capital | $ | (750,274 | ) | $ | — | |||
Undistributed net investment income/(loss) | 750,274 | 28,192 | ||||||
Accumulated net realized gain/(loss) | — | (28,192 | ) | |||||
20
NOTES TO FINANCIAL STATEMENTS continued
The tax character of distributions paid for the fiscal year ended June 30, 2015 was as follows:
| Small-Cap Growth Fund | Strategic Growth Fund | |||||||
Distribution paid from: | ||||||||
Ordinary income | $ | — | $ | 292,021 | ||||
Long term capital gains | — | 811,663 | ||||||
|
|
|
| |||||
Total taxable distribution | $ | — | $ | 1,103,684 | ||||
|
|
|
| |||||
The tax character of distributions paid for the fiscal year ended June 30, 2014 was as follows:
| Small-Cap Growth Fund | Strategic Growth Fund | |||||||
Distribution paid from: | ||||||||
Ordinary income | $ | — | $ | 288,914 | ||||
Long term capital gains | — | 266,492 | ||||||
|
|
|
| |||||
Total taxable distribution | $ | — | $ | 555,406 | ||||
|
|
|
| |||||
Under Federal tax law, qualified late year ordinary and capital losses realized after December 31 and October 31, respectively, may be deferred and treated as occurring on the first day of the following fiscal year. For the fiscal year ended June 30, 2015, the Small-Cap Growth Fund incurred a late year ordinary loss of $293,210 which it will elect to defer to the fiscal year ended June 30, 2016. For the fiscal year ended June 30, 2015, the Strategic Growth Fund incurred no late year losses.
As of June 30, 2015, the components of accumulated undistributed earnings on a tax basis were as follows:
| Small-Cap Growth Fund | Strategic Growth Fund | |||||||
Undistributed ordinary income | $ | — | $ | 166,778 | ||||
Accumulated long-term capital gains | 5,872,337 | 420,880 | ||||||
Qualified late year loss deferrals | (293,210 | ) | — | |||||
Net unrealized appreciation on investments | 15,659,405 | 3,220,716 | ||||||
|
|
|
| |||||
Total accumulated undistributed earnings | $ | 21,238,532 | $ | 3,808,374 | ||||
|
|
|
| |||||
The difference between the book basis and tax basis components of accumulated earnings are attributable to the deferral of losses on wash sales and tax treatment of short-term capital gains.
For federal income tax purposes, capital loss carryforwards are available to offset future capital gains. As of June 30, 2015, the Small-Cap Growth Fund and the Strategic Growth Fund had no capital loss carryforwards.
| 8. | Contractual Obligations. The Funds enter into contracts in the normal course of business that contain a variety of indemnifications. The Funds’ maximum exposure under these arrangements is dependent on claims that may be made against the Funds in the future, and therefore, cannot be estimated. However, based on experience, the risk of material loss for such claims is considered remote. |
| 9. | Subsequent Events. |
Effective July 7, 2015, the Small-Cap Growth Fund began to offer a new share class, Investor Shares. The Trust, on behalf of the Investor Shares of the Small-Cap Growth Fund, adopted a distribution and shareholder servicing plan pursuant to Rule 12b-1 under the 1940 Act. The Rule 12b-1 plan authorizes payments by Investor Shares of the Small-Cap Growth Fund to finance activities intended to result in the sale of Investor Shares. The 12b-1 Plan provides that the Fund will incur distribution and shareholder servicing expenses up to 0.25% of the average daily net assets of the Small-Cap Growth Fund’s Investor Shares.
Management has evaluated the impact of all subsequent events of the Funds through the date the financial statements were issued and has determined that there are no other items, except those noted above, that require disclosure.
21
THE ROXBURY FUNDS
REPORT TO SHAREHOLDERS
REPORT OF INDEPENDENT REGISTERED PUBLIC ACCOUNTING FIRM
To the Board of Trustees of The Roxbury Funds
and the Shareholders of the Hood River Small-Cap Growth Fund
and the Mar Vista Strategic Growth Fund
We have audited the accompanying statements of assets and liabilities of the Hood River Small-Cap Growth Fund (formerly the Roxbury/Hood River Small-Cap Growth Fund) and the Mar Vista Strategic Growth Fund (formerly the Roxbury/Mar Vista Strategic Growth Fund), each a series of The Roxbury Funds (the “Funds”), including the schedules of investments, as of June 30, 2015, and the related statements of operations for the year then ended, the statements of changes in net assets for each of the years in the two year period then ended and the financial highlights for each of the years and period presented in the five-year period then ended. These financial statements and financial highlights are the responsibility of the Funds’ management. Our responsibility is to express an opinion on these financial statements and financial highlights based on our audits.
We conducted our audits in accordance with the standards of the Public Company Accounting Oversight Board (United States). Those standards require that we plan and perform the audits to obtain reasonable assurance about whether the financial statements and financial highlights are free of material misstatement. An audit includes examining, on a test basis, evidence supporting the amounts and disclosures in the financial statements. Our procedures included confirmation of securities owned as of June 30, 2015 by correspondence with the custodian and brokers or by other appropriate auditing procedures where replies from brokers were not received. An audit also includes assessing the accounting principles used and significant estimates made by management, as well as evaluating the overall financial statement presentation. We believe that our audits provide a reasonable basis for our opinion.
In our opinion, the financial statements and financial highlights referred to above present fairly, in all material respects, the financial position of the Hood River Small-Cap Growth Fund and the Mar Vista Strategic Growth Fund as of June 30, 2015, and the results of their operations for the year then ended, the changes in their net assets for each of the years in the two year period then ended and their financial highlights for each of the years and period presented in the five-year period then ended, in conformity with accounting principles generally accepted in the United States of America.

BBD, LLP
Philadelphia, Pennsylvania
August 28, 2015
22
For individual shareholders, a percentage of their ordinary income dividends (dividend income plus short-term gains, if any) may qualify for a maximum tax rate of 20% (“Qualified Dividend Income”). Complete information is computed and reported in conjunction with your Form 1099-DIV.
In addition, for corporate shareholders, a percentage of their ordinary income distributions qualifies for the dividends-received deduction (“DRD”).
For the fiscal year ended June 30, 2015, the percentage of their ordinary income dividends that qualify is as follows:
| Qualified Dividend Income | DRD-Eligible Dividends | |||||||
Small-Cap Growth Fund | — | % | — | % | ||||
Strategic Growth Fund | 54.99 | % | �� | 50.04 | % | |||
In January 2016, shareholders of the Funds will receive Federal income tax information on all distributions paid to their accounts in the calendar year 2015, including any distributions paid between July 1, 2015 and December 31, 2015.
Board Approval of Advisory Agreements
At the January 26, 2015 meeting of the Board of Trustees (the “Board”) of The Roxbury Funds (the “Trust”), the Board met to consider the approval of new investment advisory agreements between the Trust, on behalf of the Small-Cap Growth Fund, and Hood River and between the Trust, on behalf of the Strategic Growth Fund, and Mar Vista (collectively, the “New Advisory Agreements”). The Board considered whether the New Advisory Agreements would be in the best interests of each Fund and its shareholders and the overall fairness of the agreements. The Board considered the information provided during the meeting, the presentations on the Funds by Hood River and Mar Vista and certain additional information, including the proposed New Advisory Agreements; responses provided by Hood River and Mar Vista to the 15(c) requests submitted by the Trust’s legal counsel on behalf of the Trustees; Hood River and Mar Vista’s Form ADV Part 2; Hood River’s and Mar Vista’s compliance manuals and proxy voting policies; and a memorandum from the Trust’s legal counsel on the Trustees’ fiduciary duties in connection with the New Advisory Agreements. The Board had previously reviewed each firm’s code of ethics. The Board also reviewed information concerning: (1) the nature, extent and quality of the services expected to be provided by Mar Vista and Hood River; (2) each Fund’s investment performance; (3) each adviser’s financial condition; and (4) brokerage allocation and trading costs.
The Board considered all factors deemed to be relevant, including but not limited to the following: (1) the quality of services provided to the Strategic Growth Fund since Mar Vista first became investment sub-adviser to the Strategic Growth Fund in 2011 and the performance of the Strategic Growth Fund since Mar Vista became the investment sub-adviser; (2) the quality of services provided to the Small-Cap Growth Fund since Hood River first became investment sub-adviser to the Small-Cap Growth Fund in 2013 (and previously by the same portfolio management team as principals of Roxbury) and the performance of the Small-Cap Growth Fund since Hood River became the investment sub-adviser and prior thereto when managed by the same portfolio management team; (3) the fact that the transaction involving Roxbury Capital Management, LLC (“Roxbury”), the previous investment adviser to the Funds, is not expected to affect the manner in which the Funds are advised; (4) the fact that the investment management team at each adviser will continue to manage the respective Fund; (5) the fact that the fee structure under the New Advisory Agreements would be identical to the fee structure under the prior advisory agreement; (6) the changes to terms in the New Advisory Agreements are generally to conform to current regulatory requirements and industry best practices; (7) the fact that Mar Vista and Hood River have agreed to comply with Section 15(f) of the Investment Company Act of 1940, as amended; and (8) other factors deemed relevant. In its deliberations, the Board did not identify any single factor as determinative.
(1) The nature, extent and quality of services to be provided by the Advisers. The Board considered the scope and quality of services expected to be provided by Mar Vista, including the qualifications and capabilities of the personnel responsible for providing services to the Strategic Growth Fund. The Board considered the relationship between Roxbury and Mar Vista and that Roxbury’s staff would continue to provide trading, compliance and other administrative services to Mar Vista and the Strategic Growth Fund at no additional cost to the Fund. The Board also considered the qualifications, experience and responsibilities of the portfolio managers for the Strategic Growth Fund which comprise the same team that currently manages the Strategic Growth Fund. On the basis of this evaluation, the Board concluded that the nature, quality and extent
23
THE ROXBURY FUNDS
ADDITIONAL INFORMATION (Unaudited) continued
of services that would be provided by Mar Vista are appropriate and that the Fund would likely benefit from services provided by Mar Vista under the Mar Vista Advisory Agreement.
The Board also considered the scope and quality of services expected to be provided by Hood River, including the qualifications and capabilities of the personnel responsible for providing services to the Small-Cap Growth Fund. The Board considered the relationship between Roxbury and Hood River and that Roxbury’s staff would continue to provide trading, compliance and other administrative services to Hood River and the Small-Cap Growth Fund. The Board also considered the qualifications, experience and responsibilities of the portfolio managers for the Small-Cap Growth Fund which comprise the same team that currently manages the Fund. On the basis of this evaluation, the Board concluded that the nature, quality and extent of services that would be provided by Hood River are appropriate and that the Fund would likely benefit from services provided by Hood River under the Hood River Advisory Agreement.
(2) The performance of the Funds and Advisers. The Board considered the Strategic Growth Fund’s performance as compared to its benchmark, the Russell 1000® Growth Index, for the 1-year, 3-year and since inception periods ended December 31, 2014, noting that the Fund had outperformed the benchmark for the one year period and was in line with the benchmark for the 3-year and since inception periods. The Board also considered the performance for the corresponding composite of Mar Vista’s separate account clients. The Board concluded that Mar Vista would continue to provide a high level of advisory services to the Strategic Growth Fund.
The Board also considered the Small-Cap Growth Fund’s performance as compared to its benchmark, the Russell 2000 Growth Index, for the one-year, 3-year, 5-year and 10-year periods ended December 31, 2014, noting that the Small-Cap Growth Fund had outperformed the benchmark for each of the periods. The Board also considered the performance of the corresponding composite of Hood River’s separate account clients. The Board concluded that Hood River would continue to provide a high level of advisory services to the Small-Cap Growth Fund.
(3) Management Fees and Total Expense Ratio; Profitability. The Board compared the Strategic Growth Fund’s contractual advisory fee and total expense ratio to a peer group of similar funds using data provided to Mar Vista by an independent service. The Board noted that the Strategic Growth Fund’s contractual advisory fee and total expense ratio were lower than the peer group average. The Board also compared the Fund’s net expense ratio to the Strategic Growth Fund’s Morningstar category and noted that the net expense ratio was below the category average. The Board also considered Mar Vista’s contractual agreement to limit the total annual fund operating expenses, excluding taxes, extraordinary expenses, brokerage commissions, interest and acquired fund fees and expenses, to 0.90% through November 1, 2020. The Board considered that the Strategic Growth Fund’s advisory fees and total annual operating expenses would remain the same. On the basis of the information provided, the Board concluded that the advisory fee and total expense ratio were reasonable and appropriate in light of the quality of the services to be provided to the Strategic Growth Fund.
The Board reviewed information concerning Mar Vista’s financial condition and projected profitability as a result of the transaction. Since Mar Vista would be new as the primary adviser of the Strategic Growth Fund, there was no historical profitability analysis. The Board considered the expected revenue for Mar Vista based on the Fund’s anticipated assets under management and Mar Vista’s expected expenses.
The Board compared the Small-Cap Growth Fund’s contractual advisory fee and total expense ratio to a peer group of similar funds using data provided to Hood River by an independent service. The Board noted that the Fund’s contractual advisory fee was in line with the peer group average and the total expense ratio was lower than the peer group average. The Board also compared the Small-Cap Growth Fund’s net expense ratio to the Small-Cap Growth Fund’s Morningstar category and noted that the net expense ratio was below the category average. The Board also considered Hood River’s contractual agreement to limit the total annual fund operating expenses, excluding taxes, extraordinary expenses, brokerage commissions, interest and acquired fund fees and expenses to 1.25% through December 31, 2020. The Board considered that the Small-Cap Growth Fund’s advisory fees and total annual operating expenses would remain the same. On the basis of the information provided, the Board concluded that the advisory fee and total expense ratio were reasonable and appropriate in light of the quality of the services provided to the Small-Cap Growth Fund. The Board reviewed information concerning Hood River’s financial condition and projected profitability as a result of the transaction. Since Hood River would be new as the primary adviser to the Small-Cap Growth Fund, there was no historical profitability analysis. The Board considered the expected revenue for Hood River based on the Fund’s anticipated assets under management and Hood River’s expected expenses.
(4) Economies of Scale. The Board reviewed the asset size of the Strategic Growth Fund and considered whether there may be economies of scale in the management of the Strategic Growth Fund if its assets were to increase significantly. The Board concluded that the current fee structure was reasonable given the Fund’s current asset levels.
24
ADDITIONAL INFORMATION (Unaudited) continued
The Board also considered the extent to which economies of scale were expected to be realized relative to fee levels as the Small-Cap Growth Fund’s assets grow. The Board noted that the Small-Cap Growth Fund’s advisory fees have breakpoints. The Board noted the breakpoints on the advisory fees for similar separate accounts managed by Hood River were lower than the advisory breakpoints for the Small-Cap Growth Fund and considered the higher costs of managing a mutual fund as compared to a separate account. The Board concluded that the current fee structure was reasonable given the Fund’s current asset levels.
(5) Ancillary Benefits. Based on the information presented, the Board did not consider any ancillary benefits to Mar Vista from serving as adviser to the Strategic Growth Fund to be relevant factors. Based on the information presented, the Board did not consider any ancillary benefits to Hood River from serving as adviser to the Small-Cap Growth Fund to be relevant factors.
Conclusion
On the basis of its review of the foregoing information, the Board found that the terms of the Mar Vista Advisory Agreement were fair and reasonable and in the best interest of the Strategic Growth Fund’s shareholders. On the basis of its review of the foregoing information, the Board found that the terms of the Hood River Advisory Agreement were fair and reasonable and in the best interest of the Small-Cap Growth Fund’s shareholders.
Voting Results of Special Meeting of Shareholders
A special meeting of shareholders of the Trust was held on April 9, 2015. Three proposals were presented to shareholders at the special meeting. Shareholders of the Trust were asked to elect two trustees to the Board. Shareholders of the Small-Cap Growth Fund were asked to approve a new investment advisory agreement between the Trust, on behalf of the Small-Cap Growth Fund, and Hood River. Shareholders of the Strategic Growth Fund were asked to approve a new investment advisory agreement between the Trust, on behalf of the Strategic Growth Fund, and Mar Vista.
Shareholders approved all three proposals as follows:
| 1. | Election of Trustees |
Trustee Nominee | For | Withhold | ||||||
Steven N. Marshman | 2,497,731.184 | 6,043.760 | ||||||
Gaylord B. Lyman | 2,497,356.490 | 6,418.454 | ||||||
| 2. | Approval of an investment advisory agreement between the Trust, on behalf of the Strategic Growth Fund, and Mar Vista |
| For | Against | Abstain | ||
| 802,373.941 | 0 | 0 |
| 3. | Approval of an investment advisory agreement between the Trust, on behalf of the Small-Cap Growth Fund, and Hood River |
| For | Against | Abstain | ||
| 1,285,545.194 | 2,758.730 | 10,319.176 |
Please see “A. Board Approval of Advisory Agreements” for information regarding the material factors and the conclusions reached with respect to the Board’s approval of the new advisory agreements.
Proxy Voting Policies and Procedures and Proxy Voting Record
A description of the Funds’ policies and procedures with respect to the voting of proxies relating to each Fund’s portfolio securities is available without charge, upon request, by calling (800) 497-2960. Information regarding how the Funds voted proxies related to portfolio securities during the 12-month period ended June 30, 2015 is available without charge, upon request, by calling (800) 497-2960. This information is also available on the Securities and Exchange Commission’s (“SEC”) website at www.sec.gov.
25
DISCLOSURE OF FUND EXPENSES (Unaudited)
The following Expense Tables are shown so that you can understand the impact of fees on your investment. All mutual funds have operating expenses. As a shareholder of the Funds, you may incur transaction costs, such as redemption fees, and ongoing costs, including management fees and other Fund expenses. Each Fund’s expenses are expressed as a percentage of its average net assets. This figure is known as the expense ratio. The following examples are intended to help you understand the ongoing costs (in dollars) of investing in the Funds and to compare these costs with the ongoing costs of investing in other mutual funds. The example is based on an investment of $1,000 made at the beginning of the period shown and held for the entire period.
The Expense Tables below illustrate your Fund’s costs in two ways.
● Actual fund return. The first line of the tables below provides information about actual account values and actual expenses. You may use the information in these lines, together with the amount you invested, to estimate the expenses that you paid over the period. Simply divide your account value by $1,000 (for example, an $8,600 account value divided by $1,000 = 8.6), then multiply the result by the number in the first line under the heading entitled “Expenses Paid During Period” to estimate the expenses you paid on your account during the period.
● Hypothetical 5% return. The second line of the tables below provides information about hypothetical account values and hypothetical expenses based on each Fund’s actual expense ratio and an assumed rate of return of 5% per year before expenses, which is not the Fund’s actual return. The hypothetical account values and expenses may not be used to estimate the actual ending account balance or expenses you paid for the period. You may use this information to compare the ongoing costs of investing in the Funds and other funds. To do so, compare this 5% hypothetical example with the 5% hypothetical examples that appear in the shareholder reports of the other funds.
Please note that the expenses shown in the tables are meant to highlight your ongoing costs only and do not reflect any transactional costs, such as sales charges (loads), redemption fees, or exchange fees, if any. Therefore, the second line of each table is useful in comparing ongoing costs only, and will not help you determine the relative total costs of owning different funds. In addition, if these transactional costs were included, your costs would have been higher. The “Annualized Expense Ratio” reflects the actual expenses for the period indicated.
For the Period January 1, 2015 to June 30, 2015
Expense Table
Beginning | Ending | Annualized | Expenses | |||||||||||||
Hood River Small-Cap Growth Fund – Institutional Shares | ||||||||||||||||
Actual Fund Return | $ | 1,000.00 | $ | 1,080.50 | 1.14 | % | $ | 5.88 | ||||||||
Hypothetical 5% Return Before Expenses | 1,000.00 | 1,019.14 | 1.14 | 5.71 | ||||||||||||
Expense Table
Beginning | Ending | Annualized | Expenses | |||||||||||||
Mar Vista Strategic Growth Fund – Institutional Shares | ||||||||||||||||
Actual Fund Return | $ | 1,000.00 | $ | 1,024.00 | 0.90 | % | $ | 4.52 | ||||||||
Hypothetical 5% Return Before Expenses | 1,000.00 | 1,020.33 | 0.90 | 4.51 | ||||||||||||
| * | Expenses are equal to the Fund’s annualized expense ratio multiplied by the average account value over the period, multiplied by 181/365 (to reflect the one half-year period). |
26
The Trust is governed by a Board of Trustees (the “Trustees”). The primary responsibilities of the Trustees of the Trust are to represent the interest of the Trust’s shareholders and to provide oversight over the management of the Trust.
Unless specified otherwise, the address of each Trustee and Officer as it relates to the Trust is c/o The Roxbury Funds, 6001 Shady Oak Road, Suite 200, Minnetonka, MN 55343.
The Statement of Additional Information for the Trust contains additional information about the Trust’s Trustees and Officers and is available, without charge, upon request, by calling (800) 497-2960 or by visiting the Fund’s website at www.RoxburyFunds.com.
The following table sets forth certain information with respect to the Trustees of the Trust:
INDEPENDENT TRUSTEES
Name, Address and Age | Position(s) | Term of Office and | Principal | Number of | Other | |||||
| STEVEN N. MARSHMAN Age 54 | Trustee and Chairman | Trustee Since December 2014; Chairman Since May 2015 | Owner of Focused Investing LLC since 2013; Retired, January 2010-2013; Portfolio Manager at Roxbury from 2002-2009. | 2 | None | |||||
| GAYLORD B. LYMAN Age 52 | Trustee and Audit Committee Chairman | Since April 2015 | Managing Director of Kohala Capital Partners, LLC, since 2011; Vice President, Becker Capital Management, Inc. from 1997-2011. | 2 | None | |||||
| 1 | Each Trustee serves during the continued lifetime of the Trust until he dies, resigns, is declared bankrupt or incompetent by a court of competent jurisdiction, or is removed. |
| 2 | Includes directorships of companies required to report to the SEC under the Securities Exchange Act of 1934, as amended (i.e., “public companies”), or other investment companies registered under the 1940 Act. |
27
THE ROXBURY FUNDS
TRUSTEES AND OFFICERS (Unaudited) continued
OFFICERS OF THE TRUST
The following table sets forth certain information with respect to the Officers of the Trust as of June 30, 2015.
Name, Address | Position(s) | Term of Office1 and | Principal | |||
JON R. FOUST 6001 Shady Oak Road Suite 200 | President | President since November 2014 | Director of Marketing & Client Service of Roxbury since 2000; Served as President of Roxbury from 2012-2014. | |||
| BROOKE CLEMENTS Roxbury Capital Management, LLC 6001 Shady Oak Road Suite 200 Minnetonka, MN 55343 Age 38 | Treasurer | Treasurer since August 2012 | Senior Financial Manager of Roxbury since August 2013; Financial Accounting Manager of Roxbury from 2009-2013; Staff Accountant of Roxbury from 2005-2009. | |||
BECKY KRULIK Roxbury Capital Management, LLC | Secretary, Chief Compliance Officer and Anti-Money Laundering Compliance Officer | Secretary since September 2014; Chief Compliance Officer and Anti-Money Laundering Compliance Officer since December 2014 | Compliance Analyst of Roxbury since 2012; Assistant Secretary of the Trust from February 2013-September 2014; Supervising Principal of Thrivent Financial from 2011-2012; Business Analyst of Thrivent Financial 2010-2011; Brokerage Service Professional of Thrivent Financial 2007-2010 | |||
| 1 | Each Officer shall serve until his or her resignation is accepted by the Trustees, and his or her successor is chosen, elected and qualified, or until he or she sooner dies or is removed. Any Officer may be removed by the affirmative vote of a majority of the Trustees at any time, with or without cause. |
28
 | This report is not authorized for distribution unless preceded or accompanied by a prospectus for the Funds. Effective July 1, 2012, shares of The Roxbury Funds are distributed by Foreside Fund Services, LLC, Three Canal Plaza, Suite 100, Portland, ME 04101. |
June 15
Item 2. Code of Ethics.
(a) | The registrant, as of the end of the period covered by this report, has adopted a code of ethics that applies to the registrant’s principal executive officer, principal financial officer, principal accounting officer or controller, or persons performing similar functions, regardless of whether these individuals are employed by the registrant or a third party. |
(c) | There have been no amendments, during the period covered by this report, to a provision of the code of ethics that applies to the registrant’s principal executive officer, principal financial officer, principal accounting officer or controller, or persons performing similar functions, regardless of whether these individuals are employed by the registrant or a third party, and that relates to any element of the code of ethics definition set forth in paragraph (b) of this Item. |
(d) | The registrant has not granted any waivers, including an implicit waiver, from a provision of the code of ethics that applies to the registrant’s principal executive officer, principal financial officer, principal accounting officer or controller, or persons performing similar functions, regardless of whether these individuals are employed by the registrant or a third party, that relates to one or more of the items set forth in paragraph (b) of this Item. |
(f) | A copy of the Code of Ethics is available as provided in Item 12 (a) (1) of this report. |
Item 3. Audit Committee Financial Expert.
The Registrant’s Board of Trustees has determined that Gaylord B. Lyman qualifies to serve as an audit committee financial expert serving on its audit committee and is “independent,” as defined by Item 3 of Form N-CSR.
Item 4. Principal Accountant Fees and Services.
Audit Fees
(a) | The aggregate fees billed for the fiscal years ended June 30, 2015 and June 30, 2014 for professional services rendered by the principal accountant for the audit of the registrant’s annual financial statements or services that are normally provided by the accountant in connection with statutory and regulatory filings or engagements for those fiscal years are $34,000 and $34,000, respectively. |
Audit-Related Fees
(b) | The aggregate fees billed in the fiscal years ended June 30, 2015 and June 30, 2014 for assurance and related services by the principal accountant that are reasonably related to the performance of the audit of the registrant’s financial statements and are not reported under paragraph (a) of this Item are $0 and $0, respectively. |
Tax Fees
(c) | The aggregate fees billed in the fiscal years ended June 30, 2015 and June 30, 2014 for professional services rendered by the principal accountant for tax compliance, tax advice, and tax planning are $3,000 and $3,000, respectively. Fees were for the review of federal and state income tax returns and excise tax returns. |
All Other Fees
(d) | The aggregate fees billed in the fiscal years ended June 30, 2015 and June 30, 2014 for products and services provided by the principal accountant, other than the services reported in paragraphs (a) through (c) of this Item are $0 and $0, respectively. |
(e)(1) Disclose the audit committee’s pre-approval policies and procedures described in paragraph (c)(7) of Rule 2-01 of Regulation S-X.
Pursuant to its charter, the Trust’s Audit Committee must review and approve in advance the engagement of the independent accountants, including each audit and non-audit service permitted by appropriate rules or regulations provided to the Trust and each non-audit service provided to the Trust’s investment advisers and any entity controlling, controlled by or under common control with the investment advisers that provides ongoing services to the Trust relating to the operations and financial reporting of the Trust. The Committee may delegate the authority to grant such pre-approval to one or more Committee members who are independent Trustees within the meaning of Section 10A(i) of the Securities Exchange Act of 1934, as amended, provided that the decision of such member(s) is presented to the full Committee at its next scheduled meeting. The Committee may approve each audit and non-audit service on a case-by-case basis, and/or adopt pre-approval policies and procedures that are detailed as to a particular service, provided that the Committee is informed of each service in a timely manner and the policies and procedures do not include delegation of the Committee’s responsibilities under the Securities Exchange Act of 1934 to management. The foregoing pre-approval requirement with respect to the provision of non-audit services to the Trust may be waived if (i) the aggregate amount of all such non-audit services provided to the Trust constitutes not more than 5 percent of the total amount of revenues paid by the Trust to its independent accountants during the fiscal year in which the non-audit services are provided; (ii) such services were not recognized by the Trust at the time of the engagement to be non-audit services; and (iii) such services are promptly brought to the attention of the Committee and approved prior to the completion of the audit by the Committee or by one or more members of the Committee to whom authority to grant such approvals has been delegated by the Committee.
(e)(2) There were no services described in each of paragraphs (b) through (d) of this Item that were approved by the audit committee pursuant to paragraph (c)(7)(i)(C) of Rule 2-01 of Regulation S-X
(f) | The percentage of hours expended on the principal accountant’s engagement to audit the registrant’s financial statements for the most recent fiscal year that were attributed to work performed by persons other than the principal accountant’s full-time, permanent employees was less than fifty percent. |
(g) | The aggregate non-audit fees billed by the registrant’s accountant for services rendered to the registrant, and rendered to the registrant’s investment advisers (not including any sub-adviser whose role is primarily portfolio management and is subcontracted with or overseen by another investment adviser), and any entity controlling, controlled by, or under common control with the advisers that provides ongoing services to the registrant for fiscal years ended June 30, 2015 and June 30, 2014 of the registrant was $3,000 and $3,000, respectively. |
(h) | Not applicable. |
Item 5. Audit Committee of Listed Registrants.
Not applicable.
Item 6. Investments.
(a) | Schedule of Investments in securities of unaffiliated issuers as of the close of the reporting period is included as part of the report to shareholders filed under Item 1 of this form. |
(b) | Not applicable. |
Item 7. | Disclosure of Proxy Voting Policies and Procedures for Closed-End Management Investment Companies. |
Not applicable.
Item 8. Portfolio Managers of Closed-End Management Investment Companies.
Not applicable.
Item 9. Purchases of Equity Securities by Closed-End Management Investment Company and Affiliated Purchasers.
Not applicable.
Item 10. Submission of Matters to a Vote of Security Holders.
There have been no material changes to the procedures by which the shareholders may recommend nominees to the registrant’s board of trustees.
Item 11. Controls and Procedures.
(a) | The registrant’s principal executive and principal financial officers, or persons performing similar functions, have concluded that the registrant’s disclosure controls and procedures (as defined in Rule 30a-3(c) under the Investment Company Act of 1940, as amended (the “1940 Act”) (17 CFR 270.30a-3(c))) are effective, as of a date within 90 days of the filing date of this report that includes the disclosure required by this paragraph, based on their evaluation of these controls and procedures required by Rule 30a-3(b) under the 1940 Act (17 CFR 270.30a-3(b)) and Rule 15d-15(b) under the Securities Exchange Act of 1934, as amended (17 CFR 240 15d-15(b)). |
(b) | There were no changes in the registrant’s internal control over financial reporting (as defined in Rule 30a-3(d) under the 1940 Act (17 CFR 270.30a-3(d)) that occurred during the registrant’s second fiscal quarter of the period covered by this report that has materially affected, or are reasonably likely to materially affect, the registrant’s internal control over financial reporting. |
Item 12. Exhibits.
(a)(1) | Code of ethics, incorporated by reference to the Registrant’s Form N-CSR filed on September 8, 2015. | |
(a)(2) | Certifications pursuant to Rule 30a-2(a) under the 1940 Act and Section 302 of the Sarbanes-Oxley Act of 2002 are attached hereto. | |
(a)(3) | Not applicable. | |
(b) | Certifications pursuant to Rule 30a-2(b) under the 1940 Act and Section 906 of the Sarbanes-Oxley Act of 2002 are attached hereto. | |
SIGNATURES
Pursuant to the requirements of the Securities Exchange Act of 1934 and the Investment Company Act of 1940, the registrant has duly caused this report to be signed on its behalf by the undersigned, thereunto duly authorized.
(Registrant) | The Roxbury Funds |
By (Signature and Title)* | /s/ Jon Foust | |
Jon Foust, President | ||
(principal executive officer) | ||
Date | 9/3/15 | |
Pursuant to the requirements of the Securities Exchange Act of 1934 and the Investment Company Act of 1940, this report has been signed below by the following persons on behalf of the registrant and in the capacities and on the dates indicated.
By (Signature and Title)* | /s/ Jon Foust | |
Jon Foust, President | ||
(principal executive officer) |
Date | 9/3/15 | |
By (Signature and Title)* | /s/ Brooke Clements | |
Brooke Clements, Treasurer | ||
(principal financial officer) |
Date | 9/3/15 | |
* Print the name and title of each signing officer under his or her signature.