UNITED STATES
SECURITIES AND EXCHANGE COMMISSION
Washington, D.C. 20549
SECURITIES AND EXCHANGE COMMISSION
Washington, D.C. 20549
FORM N-CSR
CERTIFIED SHAREHOLDER REPORT OF REGISTERED
MANAGEMENT INVESTMENT COMPANIES
Investment Company Act file number 811-21897
Manager Directed Portfolios
(Exact name of registrant as specified in charter)
(Exact name of registrant as specified in charter)
615 East Michigan Street
Milwaukee, WI 53202
(Address of principal executive offices) (Zip code)
(Address of principal executive offices) (Zip code)
Scott M. Ostrowski, President
Manager Directed Portfolios
c/o U.S. Bank Global Fund Services
811 East Wisconsin Avenue, 8th Floor
Milwaukee, WI 53202
(Name and address of agent for service)
(Name and address of agent for service)
(414) 765-4339
Registrant's telephone number, including area code
Date of fiscal year end: June 30, 2022
Date of reporting period: June 30, 2022
Item 1. Reports to Stockholders.
| (a) |
Hood River Small-Cap Growth Fund
Hood River International Opportunity Fund
Annual Report
June 30, 2022
Hood River Funds
Table of Contents
| Letters to Shareholders | 3 | |
| Investment Highlights | 9 | |
| Sector Allocation of Portfolio Assets | 11 | |
| Schedules of Investments | 13 | |
| Statements of Assets and Liabilities | 26 | |
| Statements of Operations | 28 | |
| Statements of Changes in Net Assets | 30 | |
| Financial Highlights | 34 | |
| Notes to the Financial Statements | 39 | |
| Report of Independent Registered Public Accounting Firm | 54 | |
| Expense Example | 56 | |
| Statement Regarding Liquidity Risk Management Program | 58 | |
| Notice to Shareholders | 59 | |
| Trustees and Officers | 60 | |
| Privacy Notice | 63 |
Hood River Small-Cap Growth Fund
Letter to Shareholders
June 30, 2022
This fiscal year ending June 30, 2022 has been difficult for small-cap growth stocks, to say the least, underscored by the Russell 2000® Growth Index’s -33.43% decline over the trailing twelve months. While it was indeed a rough period, the majority of the losses have come in the last six months. The Russell 2000® Growth Index fell only -5.73% between June 30, 2021 and December 31, 2021, but growing fears of inflation, the potential for an economic slowdown, and what was (and will likely continue to be) an aggressive Fed rate-hike cycle pushed the index down -29.45% over the subsequent six months. This marks the largest trailing four-quarter decline since the first quarter of 2009’s -36.36%, which of course occurred during the Great Financial Crisis.
To expand on the macro headwinds, the ubiquitous fear of a recession was reflected in concerns voiced by distinguished economists ranging from Larry Summers to Cardi B. Although the second quarter in a row of negative GDP growth does place the U.S. in a technical recession, stock prices have largely been pricing in an economic slowdown for some time now. Consumers have been pressured by inflation and rate hikes are already impacting housing as well other debt-financed spending (credit cards, auto loans, etc.). Supply chain issues are less of a concern, but a weakening demand side is now impacting outlooks. Recent conversations with management teams suggest visibility on demand has become increasingly cloudy as sales cycles are extended and budgets questioned.
Regarding rising prices, we suspect that some of the inflationary pressures will be reduced by improving supply chain issues over the coming year, combined with softer demand in the face of an economic slowdown. Copper, steel, oil, and wheat have all pulled back meaningfully in recent weeks. The M2 growth rate, (a broad measure of money supply) has also fallen from the mid-twenty percent range a year ago to roughly 6-7% for the past handful of weeks – a much more normal range consistent with lower levels of inflation, though it may take time to get there. Conversely, the long-term trend of globalization that helped hold down U.S. inflation in the past few decades may no longer be a tailwind. Lastly, we still believe the Fed is behind the curve with respect to raising rates – we certainly do not believe this to be an out-of-consensus statement.
While the first half of 2022 has been brutal for U.S. small-cap growth stocks, the selloff has brought valuations down dramatically. The Russell 2000® Growth Index is trading at 12.4x positive forward earnings estimates – compared to year-end closes since 2000, that’s less expensive than all but year-end 2008, with which it is tied. It’s also inexpensive on a relative basis as the current level represents a 19% discount to the S&P 500® Index. Although we think earnings estimates are suspect for both indices, that’s a very cheap reading vs. the average premium of roughly 18% since 2020. The Russell 2000® Growth Index is also trading at a 16% premium to its Value counterpart, which is a smaller premium than any year-end since 2000.
Hood River’s investment team has navigated the choppy markets by utilizing the same process we have employed over the past twenty years. That is, we construct a portfolio of stocks that we believe will outperform the market through our proprietary bottom-up research process. Hood River does not attempt to time market cycles and thus cash as a
3
Hood River Small-Cap Growth Fund
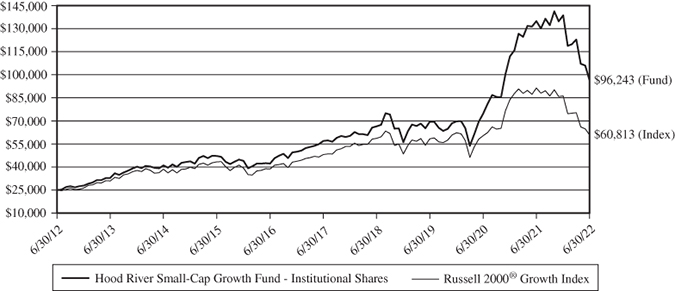
percentage of the portfolio is usually not more than five percent. While we agree there are many headwinds and unknowns facing the macro environment, we invest in companies we believe can best navigate the near term headwinds while maintaining (or even improving) longer term prospects. For the fiscal year ending June 30, 2022, the Hood River Small Cap Growth Fund Institutional Share Class posted an absolute return of -28.71%, outperforming the Russell 2000® Growth Index (the “benchmark”) by +4.78%. A table of the fund’s 1-, 3-, 5-, 10-year and since-inception returns can be found on the following page.
| Since | |||||
1 Year | 3 Years | 5 Years | 10 Years | Inception | |
| HRSMX | -28.71% | 11.51% | 11.06% | 14.43% | 12.09% |
Russell 2000® Growth Index | -33.43% | 1.40% | 4.80% | 9.30% | 9.37% |
Performance quoted represents past performance for the Fund’s institutional class shares and there is no guarantee of future results. The investment return and principal value will fluctuate so that shares, when redeemed, may be worth more or less than the original cost. Current performance may be higher or lower than the performance data quoted above. Please call 800-497-2960 to obtain current and the most recent month-end performance data. The institutional share class gross expense ratio is 1.08%. Recent short-term performance is attributable to unusually favorable conditions that are likely not sustainable, and such conditions might not continue to exist.
As is typically the case, Hood River’s stock selection process drove the majority of returns for the fiscal year ending June 30, 2022, representing 314 basis points (“bps”) of the 472 total bps outperformance. Over the past twelve months the sectors contributing the most to outperformance through stock selection were health care (+421 basis points (“bps”)), information technology (+166 bps), and consumer discretionary (+101 bps). On the other end, sectors with the largest negative stock selection over the past twelve months include industrials (-279 bps), financials (-44 bps), and communication services (-38 bps).
The first half of 2022 was historic in many respects, and in choppy markets like these we are hopeful to minimize macro factor exposure and stock-pick our way through the downturn. Our sector weightings are relatively tight to the Russell 2000® Growth Index, with every sector ending within 400 bps of the benchmark. Our holdings also screen well on several quality measures: versus the benchmark, our portfolio has a lower P/E, higher market cap, higher dividend yield, and lower debt/equity. We have historically added value through building a portfolio through our process of rigorous, fundamental research. While in the second quarter the market balked at its typical practice of rewarding companies with positive surprises/revisions, we are optimistic the market will emerge from this period of indiscriminate selloffs and high correlations. Regardless, we continue to find good opportunities and, in our view, own companies that can best navigate the uncertainties confronting the economy.
4
Hood River Small-Cap Growth Fund
We appreciate all of our shareholders’ confidence in the Hood River team. Thank you for your partnership and support.
All the best,
Brian Smoluch and David Swank
The above comments reflect general views regarding the market and the economy, were current as of the date of this letter, and are subject to change at any time.
Returns represent past performance and include changes in share price and reinvestment of dividends and capital gains. The primary benchmark is the Russell 2000® Growth Index, defined as an unmanaged, capitalization weighted index of those Russell 2000® companies with higher price-to-book ratios and higher forecasted growth values. Index returns include dividends and/or interest income and, unlike composite returns, do not reflect fees or expenses. In addition, unlike the composite, which periodically maintains a significant cash position, the indices are fully invested. Basis points refers to a common unit of measure for interest rates and other percentages in finance. One basis point is equal to 1/100th of 1%, or 0.01%, or 0.0001, and is used to denote the percentage change in a financial instrument. Valuation is the analytical process of determining the current (or projected) worth of an asset or company. Earnings estimates are analyst estimates for a company’s future quarterly or annual earnings per share. P/E (Price-to-Earnings) ratio is a ratio for valuing a company that measures its current share price relative to its earnings per share. Market cap is the total dollar market value of a company’s outstanding shares of stocks. Dividend yield is the financial ratio that shows how much a company pays out in dividends each year relative to its stock price. Debt/Equity is a calculation that divides a company’s total liabilities by its shareholder equity. Past performance does not guarantee future results. It is not possible to invest directly in an index. The current performance of the Fund may be lower or higher than figures shown. Returns and share price will fluctuate, and redemption value may be more or less than original cost. Performance information current to the most recent month-end is available by calling (800) 497-2960.
Mutual fund investing involves risk. Principal loss is possible. The Fund invests in small-cap securities, which present a greater risk of loss than large-cap securities, and in growth companies, which can be more sensitive to the company’s earnings and more volatile than the stock market in general. The Fund may also invest in foreign securities which are subject to risks including currency fluctuations, economic and political change and differing accounting standards. The Fund may invest in derivatives and IPOs, which are highly volatile. Additional risk information may be found in the prospectus.
Fund holdings and/or sector allocations are subject to change at any time and are not recommendations to buy or sell any security. For a complete list of holdings, see the Schedule of Investments on page 13.
5
Hood River International Opportunity Fund
Letter to Shareholders
June 30, 2022
This fiscal year ending June 30, 2022 has been difficult for international small-cap growth stocks, to say the least, underscored by the MSCI ACWI ex USA Small Cap Index’s -22.45% decline over the trailing twelve months. While it was indeed a rough period, the majority of the losses have come in the last six months. The MSCI ACWI ex USA Small Cap Index returned positive 0.61% between June 30, 2021 and December 31, 2021, but growing fears of inflation, the potential for an economic slowdown, and what was (and will likely continue to be) an aggressive global rate-hike cycle pushed the index down -22.92% over the subsequent six months. This marks the largest trailing four-quarter decline since the first quarter of 2020 -31.83%, which of course occurred with the onset of COVID-19.
The last six months have been almost entirely dictated by inflation. Idiosyncratic fundamentals have become increasingly irrelevant as investors attempt to navigate sentiment to find the elusive market bottom. Commodity prices are the clearest illustration of this dynamic. While the long-term theses for many base metals are intact, the various central bank responses to rising inflation render short-term visibility murky at best. Compounding this issue is the strong US Dollar which can have significant impact on companies’ profit and losses depending on their cost structure vis-a-vis raw input, labor sourcing, and currency-denominated contracting.
At the end of the day, consumer behavior will largely dictate the path forward. Right now, what they’re saying and what they’re doing are quite different. We think this divergence will close quickly within the next several months and position the portfolio accordingly.
We remain cognizant of the flow of risk capital away from countries with higher risk premia and risk-free rates. While considerable opportunities remain in these markets, we believe dislocations will expand until investors have a better grasp of global macro trends.
While we are not macro investors, we are macro aware. We continue to find opportunities in companies with pricing power that are, at the very least, able to maintain margins by passing through cost increases while continuing to gain market share. We have also identified companies that are able to source labor and materials in high inflation geographies while generating revenues based in USD or EUR terms within secular markets allowing them to stretch their economics further in this environment. We are underweight highly levered companies – especially those that have USD-denominated debt and source revenues in an alternative currency.
The Hood River International Opportunity Fund Institutional Shares posted an absolute return of -29.65% from its inception (9/28/21) through June 30, 2022, outperforming the MSCI ACWI ex USA Small Cap Index (the “benchmark”) by -6.82%. A table of the since-inception returns can be found in the table below.
Since Inception | |
| HRIOX | -29.65% |
| MSCI ACWI ex USA Small Cap | -22.83% |
Performance quoted represents past performance for the Fund’s institutional class shares and there is no guarantee of future results. The investment return and principal
6
Hood River International Opportunity Fund
value will fluctuate so that shares, when redeemed, may be worth more or less than the original cost. Current performance may be higher or lower than the performance data quoted above. Please call 800-497-2960 to obtain current and the most recent month-end performance data. The advisor has contractually agreed to waive fees and/or reimburse expenses to limit the Total Annual Operating Expense to 1.40% through September 28, 2024 otherwise performance would have been lower. Recent short-term performance is attributable to unusual conditions that are likely not sustainable, and such conditions might not continue to exist.
As is typically the case, Hood River’s stock selection process drove the majority of returns for the since inception period ending June 30, 2022, representing -802 basis points (“bps”) of the -682 total bps underperformance. Since the inception of the fund, the sectors contributing the most to outperformance through stock selection were Consumer Discretionary (+28 basis points (“bps”)), and Materials (+13 bps). On the other end, sectors with the largest negative stock selection over the past twelve months include Financials (-228 bps), Information Technology (-177 bps), and Consumer Staples (-155 bps).
The MSCI ACWI ex US Small Cap Index (“Index”) is trading at 10x for positive forward earnings estimates. The multiple is approaching the trough from 2008 (9x) and currently trades at a 17% discount to the Russell 2000® Growth Index and a 34% discount to the S&P 500® Index. While the Index has historically traded at a discount to the US-based indices, the discount has been widening this year. Though estimate cuts need to be incorporated across all indices, the spread serves as a relative valuation floor for the Index.
Furthermore, the Index’s valuation embeds earnings decline of 24% in 2022 followed by 9% growth in 2023. The Russell 2000® Growth Index and S&P 500® Index are expecting 2022 earnings growth of 20% and 15%, respectively. Holding earnings flat for all indices widens the discount significantly making valuations appear significantly attractive for the investment universe.
The above comments reflect general views regarding the market and the economy, were current as of the date of this letter, and are subject to change at any time.
Returns represent past performance and include changes in share price and reinvestment of dividends and capital gains. The benchmark is the MSCI ACWI ex USA Small Cap Index, defined as an index that captures small cap securities exhibiting overall growth style characteristics across 22 of 23 developed markets countries (excluding the US) and 27 emerging markets countries. Index returns include dividends and/or interest income and do not reflect fees or expenses. In addition, unlike the Fund, which periodically maintains a cash position, the MSCI ACWI ex USA Small Cap Index is fully invested. Investors cannot directly invest in an index. The S&P 500® Index is a market capitalization weighted index of the 500 largest publicly traded companies in the U.S. the
7
Hood River International Opportunity Fund
Russell 2000® Growth Index, defined as an unmanaged, capitalization weighted index of those Russell 2000® companies with higher price-to-book ratios and higher forecasted growth values. Basis points refers to a common unit of measure for interest rates and other percentages in finance. One basis point is equal to 1/100th of 1%, or 0.01%, or 0.0001, and is used to denote the percentage change in a financial instrument. Valuation is the analytical process of determining the current (or projected) worth of an asset or company. Earnings estimates are analyst estimates for a company’s future quarterly or annual earnings per share. Past performance does not guarantee future results. It is not possible to invest directly in an index. The current performance of the Fund may be lower or higher than figures shown. Returns and share price will fluctuate, and redemption value may be more or less than original cost. Performance information current to the most recent month-end is available by calling (800) 497-2960.
Mutual fund investing involves risk. Principal loss is possible. The Fund invests in small-cap securities, which present a greater risk of loss than large-cap securities, and in growth companies, which can be more sensitive to the company’s earnings and more volatile than the stock market in general. The Fund also invests in foreign securities which are subject to risks including currency fluctuations, economic and political change and differing accounting standards. The Fund may invest in derivatives and IPOs, which are highly volatile. Additional risk information may be found in the prospectus.
Fund holdings and/or sector allocations are subject to change at any time and are not recommendations to buy or sell any security. For a complete list of holdings, see the Schedule of Investments on page 20.
8
Hood River Small-Cap Growth Fund
Investment Highlights (Unaudited)
Comparison of the Change in Value of a Hypothetical $25,000 Investment
in the Hood River Small-Cap Growth Fund – Institutional Shares and
Russell 2000 Growth Index
| Total Return Periods Ended June 30, 2022: | 1 Year | 3 Year | 5 Year | 10 Year |
| Hood River Small-Cap Growth Fund – | ||||
| Institutional Shares | (28.71)% | 11.51% | 11.06% | 14.43% |
Investor Shares(1) | (28.85)% | 11.28% | 10.83% | 14.27% |
Retirement Shares(2) | (28.66)% | 11.58% | 11.13% | 14.47% |
| Russell 2000 Growth Index | (33.43)% | 1.40% | 4.80% | 9.30% |
| Expense Ratios*: | Gross 1.27%; Net 1.26% (Investor Shares); Gross 1.09%; Net 1.08% (Institutional Shares); |
| Gross 1.00%; Net 0.99% (Retirement Shares) |
Performance data quoted represents past performance; past performance does not guarantee future results. The investment return and principal value of an investment will fluctuate so that an investor’s shares, when redeemed, may be worth more or less than their original cost. Current performance of the Fund may be lower or higher than the performance quoted. Performance data current to the most recent month end may be obtained by calling 1-800-497-2960.
This chart illustrates the performance of a hypothetical $25,000 investment made in the Institutional Shares of the Fund on June 30, 2011. Returns reflect the reinvestment of dividends and capital gain distributions. The performance data and expense ratios shown reflect a contractual fee waiver made by the Adviser, currently, through October 31, 2022. In the absence of fee waivers, returns would be reduced. The performance data and graph do not reflect the deduction of taxes that a shareholder may pay on dividends, capital gain distributions, or redemption of Fund shares. This chart does not imply any future performance.
(1) | The inception date of the Investor Shares is July 7, 2015. Performance shown prior to the inception of the Investor Shares reflects the performance of the Institutional Shares and excludes expenses that are not applicable to and are lower than those of the Investor Shares. The actual annualized performance during the period July 7, 2015 (Investor Share inception) through June 30, 2022 was 10.65%. |
(2) | The inception date of the Retirement Shares is March 3, 2017. Performance shown prior to the inception of the Retirement Shares reflects the performance of the Institutional Shares and excludes expenses that are not applicable to and are higher than those of the Retirement Shares. The actual annualized performance during the period March 3, 2017 (Retirement Share inception) through June 30, 2022 was 12.06%. |
| * | The expense ratios presented are from the most recent prospectus. |
9
Hood River International Opportunity Fund
Investment Highlights (Unaudited)
Comparison of the Change in Value of a Hypothetical $25,000 Investment
in the Hood River International Opportunity Fund – Institutional Shares and
MSCI All Country World ex-USA SC Index

| Total Return Periods Ended June 30, 2022: | Six Month | Since Inception |
| Hood River International Opportunity Fund – | ||
Institutional Shares(1) | (31.24)% | (29.65)% |
Retirement Shares(2) | (31.24)% | (30.22)% |
| MSCI All Country World ex-USA SC Index | (22.92)% | (22.83)% |
Expense Ratios*: Gross 10.32%; Net 1.51% (Institutional Shares); Gross 10.22%; Net 1.41% (Retirement Shares)
Performance data quoted represents past performance; past performance does not guarantee future results. The investment return and principal value of an investment will fluctuate so that an investor’s shares, when redeemed, may be worth more or less than their original cost. Current performance of the Fund may be lower or higher than the performance quoted. Performance data current to the most recent month end may be obtained by calling 1-800-497-2960.
This chart illustrates the performance of a hypothetical $25,000 investment made in the Institutional Shares of the Fund on June September 27, 2021. Returns reflect the reinvestment of dividends and capital gain distributions. The performance data and expense ratios shown reflect a contractual fee waiver made by the Adviser, currently, through October 31, 2024. In the absence of fee waivers, returns would be reduced. The performance data and graph do not reflect the deduction of taxes that a shareholder may pay on dividends, capital gain distributions, or redemption of Fund shares. This chart does not imply any future performance.
(1) | The inception date of the Institutional Shares is September 28th, 2021. The actual annualized performance during the period September 28, 2021 (Institutional Share inception) through June 30, 2022, was (29.65)%. |
(2) | The inception date of the Retirement Shares is December 22, 2021. Performance shown prior to the inception of the Retirement Shares reflects the performance of the Institutional Shares and excludes expenses that are not applicable to and are higher than those of the Retirement Shares. The actual annualized performance during the period December 22, 2021 (Retirement Share inception) through June 30, 2022, was (29.73)%. |
| * | The expense ratios presented are from the most recent prospectus. |
10
Hood River Small-Cap Growth Fund
| SECTOR ALLOCATION OF PORTFOLIO ASSETS |
| at June 30, 2022 (Unaudited) |
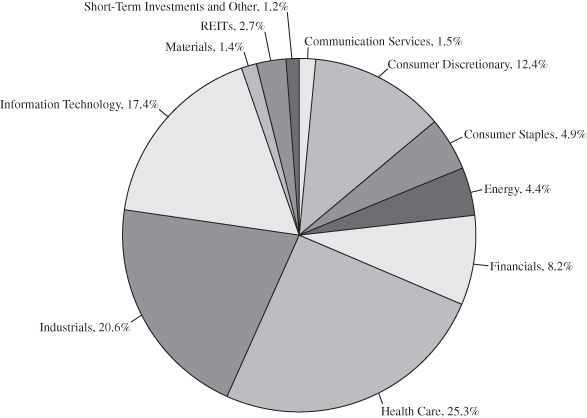
Percentages represent market value as a percentage of net assets.
Note: For presentation purposes, the Fund has grouped some of the industry categories. For purposes of categorizing securities for compliance with Section 8(b)(1) of the Investment Company Act of 1940, as amended, the Fund uses more specific industry classifications.
11
Hood River International Opportunity Fund
| SECTOR ALLOCATION OF PORTFOLIO ASSETS |
| at June 30, 2022 (Unaudited) |

Percentages represent market value as a percentage of net assets.
Note: For presentation purposes, the Fund has grouped some of the industry categories. For purposes of categorizing securities for compliance with Section 8(b)(1) of the Investment Company Act of 1940, as amended, the Fund uses more specific industry classifications.
| COUNTRY ALLOCATION OF PORTFOLIO ASSETS |
| at June 30, 2022 (Unaudited) |
| United States | 6.8% |
| Canada | 18.8% |
| Japan | 12.3% |
| United Kingdom | 11.8% |
| Netherlands | 9.4% |
| Israel | 5.3% |
| France | 5.2% |
| Jersey | 3.7% |
| Cayman Islands | 2.8% |
| Australia | 2.3% |
| Italy | 2.2% |
| Indonesia | 1.8% |
| Thailand | 1.5% |
| Denmark | 1.0% |
| Turkey | 1.0% |
| Marshall Islands, | 0.8% |
| Sweden | 0.6% |
| Korea | 0.5% |
| Short-Term Investments and Other | 12.2% |
12
Hood River Small-Cap Growth Fund
| SCHEDULE OF INVESTMENTS |
| at June 30, 2022 |
| COMMON STOCKS – 96.1% | Shares | Value | ||||||
| COMMUNICATION SERVICES – 1.5% | ||||||||
| Interactive Media & Services – 1.5% | ||||||||
| ZoomInfo Technologies, Inc. (a)(c) | 466,721 | $ | 15,513,806 | |||||
| TOTAL COMMUNICATION SERVICES | ||||||||
| (Cost $15,670,108) | 15,513,806 | |||||||
| CONSUMER DISCRETIONARY – 12.4% | ||||||||
| Distributors – 1.4% | ||||||||
| Funko, Inc. (a)(c) | 626,720 | 13,988,390 | ||||||
| Hotels, Restaurants & Leisure – 5.1% | ||||||||
| Caesars Entertainment, Inc. (a) | 310,640 | 11,897,512 | ||||||
| Cedar Fair LP (a) | 84,972 | 3,731,120 | ||||||
| Golden Entertainment, Inc. (a) | 277,487 | 10,974,611 | ||||||
| Playa Hotels & Resorts NV – ADR (a) | 680,864 | 4,677,536 | ||||||
| SeaWorld Entertainment, Inc. (a)(c) | 477,600 | 21,100,368 | ||||||
| 52,381,147 | ||||||||
| Household Durables – 0.5% | ||||||||
| Lovesac Co. (a)(c) | 171,521 | 4,716,828 | ||||||
| Internet & Direct Marketing Retail – 0.8% | ||||||||
| RumbleON, Inc. (a)(c) | 287,077 | 4,222,902 | ||||||
| Shutterstock, Inc. | 70,083 | 4,016,457 | ||||||
| 8,239,359 | ||||||||
| Leisure Products – 1.2% | ||||||||
| AMMO, Inc. (a)(c) | 2,186,784 | 8,419,118 | ||||||
| Clarus Corp. (c) | 199,207 | 3,782,941 | ||||||
| 12,202,059 | ||||||||
| Multiline Retail – 2.1% | ||||||||
| Franchise Group, Inc. (c) | 509,650 | 17,873,426 | ||||||
| Kohl’s Corp. | 119,703 | 4,272,200 | ||||||
| 22,145,626 | ||||||||
| Specialty Retail – 1.3% | ||||||||
| Boot Barn Holdings, Inc. (a) | 196,680 | 13,553,219 | ||||||
| TOTAL CONSUMER DISCRETIONARY | ||||||||
| (Cost $119,198,726) | 127,226,628 | |||||||
The accompanying notes are an integral part of these financial statements.
13
Hood River Small-Cap Growth Fund
| SCHEDULE OF INVESTMENTS (Continued) |
| at June 30, 2022 |
| COMMON STOCKS – 96.1% (Continued) | Shares | Value | ||||||
| CONSUMER STAPLES – 4.9% | ||||||||
| Beverages – 4.5% | ||||||||
| Celsius Holdings, Inc. (a)(c) | 716,910 | $ | 46,785,547 | |||||
| Food Products – 0.4% | ||||||||
| Freshpet, Inc. (a)(c) | 72,107 | 3,741,632 | ||||||
| TOTAL CONSUMER STAPLES | ||||||||
| (Cost $40,323,157) | 50,527,179 | |||||||
| ENERGY – 4.4% | ||||||||
| Oil, Gas & Consumable Fuels – 4.4% | ||||||||
| Antero Resources Corp. (a)(c) | 458,055 | 14,039,386 | ||||||
| Denison Mines Corp. – ADR (a) | 8,757,005 | 8,520,566 | ||||||
| Northern Oil and Gas, Inc. (c) | 302,337 | 7,637,033 | ||||||
| Scorpio Tankers, Inc. – ADR | 262,509 | 9,059,185 | ||||||
| Southwestern Energy Co. (a) | 914,217 | 5,713,856 | ||||||
| 44,970,026 | ||||||||
| TOTAL ENERGY | ||||||||
| (Cost $52,668,377) | 44,970,026 | |||||||
| FINANCIALS – 8.2% | ||||||||
| Banks – 4.0% | ||||||||
| Bancorp, Inc. (a)(c) | 197,604 | 3,857,230 | ||||||
| Customers Bancorp, Inc. (a) | 95,193 | 3,227,043 | ||||||
| OceanFirst Financial Corp. | 620,481 | 11,869,801 | ||||||
| Western Alliance Bancorp (c) | 317,518 | 22,416,771 | ||||||
| 41,370,845 | ||||||||
| Capital Markets – 0.8% | ||||||||
| B Riley Financial, Inc. (c) | 190,280 | 8,039,330 | ||||||
| Consumer Finance – 1.1% | ||||||||
| FirstCash Holdings, Inc. (c) | 155,701 | 10,822,776 | ||||||
| Insurance – 2.3% | ||||||||
| HCI Group, Inc. (c) | 58,597 | 3,970,533 | ||||||
| Kinsale Capital Group, Inc. (c) | 87,611 | 20,118,990 | ||||||
| 24,089,523 | ||||||||
| TOTAL FINANCIALS | ||||||||
| (Cost $81,577,661) | 84,322,474 | |||||||
The accompanying notes are an integral part of these financial statements.
14
Hood River Small-Cap Growth Fund
| SCHEDULE OF INVESTMENTS (Continued) |
| at June 30, 2022 |
| COMMON STOCKS – 96.1% (Continued) | Shares | Value | ||||||
| HEALTH CARE – 25.3% | ||||||||
| Biotechnology – 9.6% | ||||||||
| Alkermes Plc – ADR (a) | 176,818 | $ | 5,267,408 | |||||
| Amicus Therapeutics, Inc. (a)(c) | 735,709 | 7,901,515 | ||||||
| Arrowhead Pharmaceuticals, Inc. (a) | 145,339 | 5,117,386 | ||||||
| Biohaven Pharmaceutical Holding Co Ltd. – ADR (a) | 96,402 | 14,046,735 | ||||||
| Cerevel Therapeutics Holdings, Inc. (a)(c) | 170,754 | 4,514,736 | ||||||
| ChemoCentryx, Inc. (a)(c) | 538,069 | 13,333,350 | ||||||
| Cytokinetics, Inc. (a)(c) | 344,048 | 13,517,646 | ||||||
| Karuna Therapeutics, Inc. (a)(c) | 49,760 | 6,295,137 | ||||||
| Kezar Life Sciences, Inc. (a) | 550,131 | 4,549,583 | ||||||
| Krystal Biotech, Inc. (a)(c) | 164,804 | 10,821,031 | ||||||
| Natera, Inc. (a)(c) | 164,431 | 5,827,435 | ||||||
| Neurocrine Biosciences, Inc. (a)(c) | 76,045 | 7,412,867 | ||||||
| 98,604,829 | ||||||||
| Health Care Equipment & Supplies – 8.6% | ||||||||
| Axonics, Inc. (a)(c) | 485,102 | 27,490,731 | ||||||
| Cerus Corp. (a) | 615,773 | 3,257,439 | ||||||
| Enovis Corp. (a)(c) | 163,648 | 9,000,640 | ||||||
| Lantheus Holdings, Inc. (a) | 605,342 | 39,970,732 | ||||||
| Tandem Diabetes Care, Inc. (a)(c) | 154,111 | 9,121,830 | ||||||
| 88,841,372 | ||||||||
| Health Care Providers & Services – 4.4% | ||||||||
| Agiliti, Inc. (a)(c) | 168,605 | 3,458,089 | ||||||
| Community Health Systems, Inc. (a) | 965,797 | 3,621,739 | ||||||
| DocGo, Inc. (a)(c) | 1,199,675 | 8,565,679 | ||||||
| Option Care Health, Inc. (a) | 793,620 | 22,054,700 | ||||||
| Surgery Partners, Inc. (a)(c) | 272,040 | 7,867,397 | ||||||
| 45,567,604 | ||||||||
| Health Care Technology – 0.7% | ||||||||
| Evolent Health, Inc. (a) | 221,706 | 6,808,591 | ||||||
| Pharmaceuticals – 2.0% | ||||||||
| Harmony Biosciences Holdings, Inc. (a)(c) | 114,338 | 5,576,264 | ||||||
| Intra-Cellular Therapies, Inc. (a)(c) | 254,698 | 14,538,162 | ||||||
| 20,114,426 | ||||||||
| TOTAL HEALTH CARE | ||||||||
| (Cost $256,325,205) | 259,936,822 | |||||||
The accompanying notes are an integral part of these financial statements.
15
Hood River Small-Cap Growth Fund
| SCHEDULE OF INVESTMENTS (Continued) |
| at June 30, 2022 |
| COMMON STOCKS – 96.1% (Continued) | Shares | Value | ||||||
| INDUSTRIALS – 20.6% | ||||||||
| Aerospace & Defense – 2.7% | ||||||||
| AeroVironment, Inc. (a)(c) | 32,632 | $ | 2,682,351 | |||||
| Axon Enterprise, Inc. (a) | 171,342 | 15,963,934 | ||||||
| Kratos Defense & Security Solutions, Inc. (a) | 618,781 | 8,588,680 | ||||||
| 27,234,965 | ||||||||
| Air Freight & Logistics – 0.6% | ||||||||
| GXO Logistics, Inc. (a)(c) | 68,699 | 2,972,606 | ||||||
| XPO Logistics, Inc. (a) | 64,658 | 3,113,929 | ||||||
| 6,086,535 | ||||||||
| Commercial Services & Supplies – 2.3% | ||||||||
| Clean Harbors, Inc. (a) | 135,761 | 11,902,167 | ||||||
| Viad Corp. (a) | 415,969 | 11,484,904 | ||||||
| 23,387,071 | ||||||||
| Construction & Engineering – 3.8% | ||||||||
| Comfort Systems USA, Inc. (c) | 103,213 | 8,582,161 | ||||||
| MasTec, Inc. (a)(c) | 420,281 | 30,117,336 | ||||||
| 38,699,497 | ||||||||
| Electrical Equipment – 0.6% | ||||||||
| Babcock & Wilcox Enterprises, Inc. (a) | 1,108,934 | 6,686,872 | ||||||
| Machinery – 5.2% | ||||||||
| Chart Industries, Inc. (a)(c) | 241,104 | 40,355,987 | ||||||
| Esab Corp. (a)(c) | 163,648 | 7,159,600 | ||||||
| Kornit Digital Ltd. – ADR (a) | 185,218 | 5,871,411 | ||||||
| 53,386,998 | ||||||||
| Marine – 1.4% | ||||||||
| Kirby Corp. (a) | 237,732 | 14,463,615 | ||||||
| Road & Rail – 1.6% | ||||||||
| TFI International, Inc. – ADR | 211,269 | 16,960,675 | ||||||
| Trading Companies & Distributors – 2.4% | ||||||||
| Fortress Transportation and Infrastructure Investors LLC | 1,283,558 | 24,824,012 | ||||||
| TOTAL INDUSTRIALS | ||||||||
| (Cost $215,486,024) | 211,730,240 | |||||||
The accompanying notes are an integral part of these financial statements.
16
Hood River Small-Cap Growth Fund
| SCHEDULE OF INVESTMENTS (Continued) |
| at June 30, 2022 |
| COMMON STOCKS – 96.1% (Continued) | Shares | Value | ||||||
| INFORMATION TECHNOLOGY – 17.4% | ||||||||
| Communications Equipment – 1.8% | ||||||||
| Calix, Inc. (a) | 445,703 | $ | 15,216,300 | |||||
| Lumentum Holdings, Inc. (a)(c) | 42,769 | 3,396,714 | ||||||
| 18,613,014 | ||||||||
| Electronic Equipment, Instruments & Components – 0.3% | ||||||||
| nLight, Inc. (a) | 322,525 | 3,296,206 | ||||||
| IT Services – 4.4% | ||||||||
| DigitalOcean Holdings, Inc. (a)(c) | 113,104 | 4,677,981 | ||||||
| ExlService Holdings, Inc. (a) | 73,314 | 10,801,352 | ||||||
| I3 Verticals, Inc. (a) | 271,691 | 6,797,709 | ||||||
| WEX, Inc. (a) | 43,060 | 6,698,413 | ||||||
| WNS Holdings Ltd. – ADR (a) | 213,787 | 15,957,062 | ||||||
| 44,932,517 | ||||||||
| Semiconductors & Semiconductor Equipment – 6.2% | ||||||||
| Credo Technology Group Holding Ltd. – ADR (a)(c) | 1,015,870 | 11,865,361 | ||||||
| Onto Innovation, Inc. (a)(c) | 459,070 | 32,015,542 | ||||||
| Rambus, Inc. (a) | 477,487 | 10,261,196 | ||||||
| SiTime Corp. (a)(c) | 60,399 | 9,846,849 | ||||||
| 63,988,948 | ||||||||
| Software – 4.7% | ||||||||
| Applied Blockchain, Inc. (a) | 1,270,722 | 1,334,258 | ||||||
| CS Disco, Inc. (a)(c) | 273,736 | 4,938,197 | ||||||
| CyberArk Software Ltd. – ADR (a) | 86,133 | 11,021,579 | ||||||
| Elastic NV – ADR (a) | 208,135 | 14,084,496 | ||||||
| Five9, Inc. (a) | 53,794 | 4,902,785 | ||||||
| NICE Ltd. – ADR (a) | 40,400 | 7,774,980 | ||||||
| Rapid7, Inc. (a) | 65,137 | 4,351,152 | ||||||
| 48,407,447 | ||||||||
| TOTAL INFORMATION TECHNOLOGY | ||||||||
| (Cost $184,411,030) | 179,238,132 | |||||||
The accompanying notes are an integral part of these financial statements.
17
Hood River Small-Cap Growth Fund
| SCHEDULE OF INVESTMENTS (Continued) |
| at June 30, 2022 |
| COMMON STOCKS – 96.1% (Continued) | Shares | Value | ||||||
| MATERIALS – 1.4% | ||||||||
| Construction Materials – 1.4% | ||||||||
| Eagle Materials, Inc. | 134,277 | $ | 14,762,413 | |||||
| TOTAL MATERIALS | ||||||||
| (Cost $13,667,451) | 14,762,413 | |||||||
| TOTAL COMMON STOCKS | ||||||||
| (Cost $979,327,739) | 988,227,720 | |||||||
| REITS – 2.7% | ||||||||
| Chicago Atlantic Real Estate Finance, Inc. | 218,605 | 3,292,191 | ||||||
| Hannon Armstrong Sustainable | ||||||||
| Infrastructure Capital, Inc. (c) | 302,009 | 11,434,061 | ||||||
| iStar, Inc. (c) | 926,298 | 12,699,546 | ||||||
| TOTAL REITS | ||||||||
| (Cost $33,937,394) | 27,425,798 | |||||||
| MONEY MARKET FUNDS – 0.7% | ||||||||
| First American Treasury Obligations Fund – | ||||||||
| Class Z, 1.284% (b) | 7,044,693 | 7,044,693 | ||||||
| TOTAL MONEY MARKET FUNDS | ||||||||
| (Cost $7,044,693) | 7,044,693 | |||||||
| INVESTMENTS PURCHASED WITH | ||||||||
| PROCEEDS FROM SECURITIES LENDING – 32.0% | ||||||||
| Mount Vernon Liquid Assets Portfolio, 0.41% (b) | 328,860,952 | 328,860,952 | ||||||
| TOTAL INVESTMENTS PURCHASED WITH CASH | ||||||||
| PROCEEDS FROM SECURITIES LENDING | ||||||||
| (Cost 328,860,952) | 328,860,952 | |||||||
| TOTAL INVESTMENTS | ||||||||
| (Cost $1,349,170,778) – 131.5% | 1,351,559,163 | |||||||
| Liabilities in Excess of Other Assets – (31.5)% | (323,730,112 | ) | ||||||
| TOTAL NET ASSETS – 100.00% | $ | 1,027,829,051 | ||||||
Percentages are stated as a percent of net assets.
The accompanying notes are an integral part of these financial statements.
18
Hood River Small-Cap Growth Fund
| SCHEDULE OF INVESTMENTS (Continued) |
| at June 30, 2022 |
ADR – American Depositary Receipt
PLC – Public Limited Company
REIT – Real Estate Investment Trust
| (a) | Non-income producing security. |
| (b) | The rate shown represents the fund’s 7-day yield as of June 30, 2022. |
| (c) | This security or a portion of this security was out on loan at June 30, 2022. As of June 30, 2022, the total value of loaned securities was 317,234,122 or 32.4% of net assets. The remaining contractual maturity of all the securities lending transactions, is overnight and continuous. |
The Global Industry Classification Standard (GICS®) was developed by and/or is the exclusive property of MSCI, Inc. and Standard & Poor’s Financial Services LLC (“S&P”). GICS is a service mark of MSCI and S&P and has been licensed for use by Hood River Capital Management LLC.
The accompanying notes are an integral part of these financial statements.
19
Hood River International Opportunity Fund
| SCHEDULE OF INVESTMENTS |
| at June 30, 2022 |
| COMMON STOCKS – 84.6% | Shares | Value | ||||||
| COMMUNICATION SERVICES – 1.4% | ||||||||
| Entertainment – 0.9% | ||||||||
| WildBrain Ltd. (a) | 10,279 | $ | 19,644 | |||||
| Interactive Media & Services – 0.5% | ||||||||
| Baltic Classifieds Group Plc (a) | 6,219 | 9,889 | ||||||
| TOTAL COMMUNICATION SERVICES | ||||||||
| (Cost $37,008) | 29,533 | |||||||
| CONSUMER DISCRETIONARY – 11.8% | ||||||||
| Distributors – 3.4% | ||||||||
| Central Automotive Products Ltd. | 4,058 | 70,266 | ||||||
| Hotels, Restaurants & Leisure – 6.3% | ||||||||
| Basic-Fit NV (a) | 877 | 33,049 | ||||||
| Inspired Entertainment, Inc. (a) | 4,620 | 39,778 | ||||||
| Playa Hotels & Resorts NV – ADR (a) | 1,605 | 11,026 | ||||||
| Webjet Ltd. (a) | 12,778 | 47,307 | ||||||
| 131,160 | ||||||||
| Internet & Direct Marketing Retail – 0.8% | ||||||||
| RumbleON, Inc. (a) | 1,183 | 17,402 | ||||||
| Leisure Products – 1.3% | ||||||||
| Sanlorenzo SpA/Ameglia | 798 | 26,821 | ||||||
| TOTAL CONSUMER DISCRETIONARY | ||||||||
| (Cost $346,515) | 245,649 | |||||||
| CONSUMER STAPLES – 1.56% | ||||||||
| Beverages – 1.16% | ||||||||
| Fevertree Drinks Plc | 1,623 | 24,168 | ||||||
| Food Products – 0.40% | ||||||||
| CubicFarm Systems Corp. (a) | 20,166 | 8,460 | ||||||
| TOTAL CONSUMER STAPLES | ||||||||
| (Cost $72,003) | 32,628 | |||||||
The accompanying notes are an integral part of these financial statements.
20
Hood River International Opportunity Fund
| SCHEDULE OF INVESTMENTS (Continued) |
| at June 30, 2022 |
| COMMON STOCKS – 84.6% (Continued) | Shares | Value | ||||||
| ENERGY – 4.6% | ||||||||
| Oil, Gas & Consumable Fuels – 4.6% | ||||||||
| Denison Mines Corp. – ADR (a) | 29,196 | $ | 28,408 | |||||
| Enerplus Corp. (a) | 678 | 8,959 | ||||||
| Iwatani Corp. | 600 | 23,157 | ||||||
| NexGen Energy Ltd. – ADR (a) | 5,435 | 19,512 | ||||||
| Scorpio Tankers, Inc. – ADR | 486 | 16,772 | ||||||
| 96,808 | ||||||||
| TOTAL ENERGY | ||||||||
| (Cost $118,923) | 96,808 | |||||||
| FINANCIALS – 2.4% | ||||||||
| Capital Markets – 2.4% | ||||||||
| Canaccord Genuity Group, Inc. (a) | 7,750 | 50,756 | ||||||
| TOTAL FINANCIALS | ||||||||
| (Cost $82,269) | 50,756 | |||||||
| HEALTH CARE – 5.9% | ||||||||
| Biotechnology – 3.8% | ||||||||
| Biohaven Pharmaceutical Holding Co Ltd. – ADR (a) | 450 | 65,569 | ||||||
| Exscientia Plc – ADR (a) | 1,213 | 13,210 | ||||||
| 78,779 | ||||||||
| Health Care Equipment & Supplies – 0.9% | ||||||||
| Establishment Labs Holdings, Inc. – ADR (a) | 348 | 18,924 | ||||||
| Health Care Providers & Services – 1.2% | ||||||||
| Korian SA | 1,655 | 24,944 | ||||||
| TOTAL HEALTH CARE | ||||||||
| (Cost $144,589) | 122,647 | |||||||
| INDUSTRIALS – 25.6% | ||||||||
| Aerospace & Defense – 0.9% | ||||||||
| Leonardo SpA | 1,920 | 19,480 | ||||||
The accompanying notes are an integral part of these financial statements.
21
Hood River International Opportunity Fund
| SCHEDULE OF INVESTMENTS (Continued) |
| at June 30, 2022 |
| COMMON STOCKS – 84.6% (Continued) | Shares | Value | ||||||
| INDUSTRIALS – 25.6% (Continued) | ||||||||
| Commercial Services & Supplies – 4.8% | ||||||||
| Carbon Streaming Corp. (a) | 1,213 | $ | 3,138 | |||||
| GFL Environmental, Inc. – ADR | 3,750 | 96,750 | ||||||
| 99,888 | ||||||||
| Electrical Equipment – 2.5% | ||||||||
| Gerard Perrier Industrie SA | 454 | 39,489 | ||||||
| PowerCell Sweden AB (a) | 945 | 12,574 | ||||||
| 52,063 | ||||||||
| Industrial Conglomerates – 1.0% | ||||||||
| KOC Holding AS | 9,600 | 21,197 | ||||||
| Machinery – 8.1% | ||||||||
| Japan Steel Works Ltd/The | 1,000 | 21,779 | ||||||
| Judges Scientific Plc | 501 | 44,360 | ||||||
| Kornit Digital Ltd. – ADR (a) | 829 | 26,279 | ||||||
| Mitsubishi Heavy Industries Ltd. | 900 | 31,475 | ||||||
| Precia SA | 1,320 | 44,621 | ||||||
| 168,514 | ||||||||
| Road & Rail – 2.1% | ||||||||
| TFI International, Inc. – ADR | 550 | 44,154 | ||||||
| Trading Companies & Distributors – 6.1% | ||||||||
| Diploma Plc | 673 | 18,329 | ||||||
| Marubeni Corp. | 12,209 | 109,534 | ||||||
| 127,863 | ||||||||
| TOTAL INDUSTRIALS | ||||||||
| (Cost $646,819) | 533,159 | |||||||
| INFORMATION TECHNOLOGY – 15.9% | ||||||||
| Electronic Equipment, Instruments & Components – 1.4% | ||||||||
| LG Innotek Co Ltd. | 41 | 10,875 | ||||||
| SDI Group Plc (a) | 10,334 | 18,520 | ||||||
| 29,395 | ||||||||
The accompanying notes are an integral part of these financial statements.
22
Hood River International Opportunity Fund
| SCHEDULE OF INVESTMENTS (Continued) |
| at June 30, 2022 |
| COMMON STOCKS – 84.6% (Continued) | Shares | Value | ||||||
| INFORMATION TECHNOLOGY – 15.9% (Continued) | ||||||||
| IT Services – 3.7% | ||||||||
| WNS Holdings Ltd. – ADR (a) | 1,032 | $ | 77,028 | |||||
| Semiconductors & Semiconductor Equipment – 7.9% | ||||||||
| Alchip Technologies Ltd. | 1,455 | 34,145 | ||||||
| Credo Technology Group Holding Ltd. – ADR (a) | 2,084 | 24,341 | ||||||
| Nova Ltd. – ADR (a) | 194 | 17,175 | ||||||
| NXP Semiconductors NV – ADR | 606 | 89,706 | ||||||
| 165,367 | ||||||||
| Software – 2.9% | ||||||||
| CyberArk Software Ltd. – ADR (a) | 165 | 21,114 | ||||||
| Elastic NV – ADR (a) | 284 | 19,218 | ||||||
| NICE Ltd. – ADR (a) | 102 | 19,630 | ||||||
| 59,962 | ||||||||
| TOTAL INFORMATION TECHNOLOGY | ||||||||
| (Cost $421,519) | 331,752 | |||||||
| MATERIALS – 11.1% | ||||||||
| Chemicals – 8.4% | ||||||||
| CVR Partners LP | 509 | 50,824 | ||||||
| Holland Colours NV | 270 | 43,857 | ||||||
| ICL Group Ltd. – ADR | 2,944 | 26,731 | ||||||
| Indorama Ventures PCL | 23,600 | 31,373 | ||||||
| SP Group A/S | 488 | 21,589 | ||||||
| 174,374 | ||||||||
| Metals & Mining – 2.7% | ||||||||
| Teck Resources Ltd. – ADR | 1,225 | 37,448 | ||||||
| Vale Indonesia Tbk PT (a) | 48,000 | 18,267 | ||||||
| 55,715 | ||||||||
| TOTAL MATERIALS | ||||||||
| (Cost $260,593) | 230,089 | |||||||
The accompanying notes are an integral part of these financial statements.
23
Hood River International Opportunity Fund
| SCHEDULE OF INVESTMENTS (Continued) |
| at June 30, 2022 |
| COMMON STOCKS – 84.6% (Continued) | Shares | Value | ||||||
| REAL ESTATE – 2.8% | ||||||||
| Equity Real Estate Investment Trusts (REITs) – 1.9% | ||||||||
| Nexus Industrial REIT (a) | 5,250 | $ | 39,522 | |||||
| Real Estate Management & Development – 0.9% | ||||||||
| Ciputra Development Tbk PT | 340,000 | 19,627 | ||||||
| TOTAL REAL ESTATE | ||||||||
| (Cost $78,569) | 59,149 | |||||||
| UTILITIES – 1.5% | ||||||||
| Independent Power and Renewable | ||||||||
| Electricity Producers – 1.5% | ||||||||
| ReNew Energy Global Plc – ADR (a) | 4,898 | 31,690 | ||||||
| TOTAL UTILITIES | ||||||||
| (Cost $35,468) | 31,690 | |||||||
| TOTAL COMMON STOCKS | ||||||||
| (Cost $2,244,275) | 1,763,860 | |||||||
| EXCHANGE TRADED FUNDS – 1.5% | ||||||||
| KraneShares Global Carbon Strategy ETF | 660 | 32,492 | ||||||
| TOTAL EXCHANGE TRADED FUNDS | ||||||||
| (Cost $33,153) | 32,492 | |||||||
| CLOSED-END INVESTMENT TRUSTS – 1.7% | ||||||||
| Sprott Physical Uranium Trust | 3,235 | 34,905 | ||||||
| TOTAL CLOSED-END INVESTMENT TRUSTS | ||||||||
| (Cost $40,373) | 67,397 | |||||||
The accompanying notes are an integral part of these financial statements.
24
Hood River International Opportunity Fund
| SCHEDULE OF INVESTMENTS (Continued) |
| at June 30, 2022 |
| MONEY MARKET FUNDS – 11.3% | Shares | Value | ||||||
| First American Treasury Obligations Fund – | ||||||||
| Class Z – 1.284% (b) | 236,059 | $ | 236,059 | |||||
| TOTAL MONEY MARKET FUNDS | ||||||||
| (Cost $236,059) | 236,059 | |||||||
| TOTAL INVESTMENTS | ||||||||
| (Cost $2,553,860) – 99.1% | 2,067,316 | |||||||
| Other Assets in Excess of Liabilities – 0.9% | 18,593 | |||||||
| TOTAL NET ASSETS – 100.00% | $ | 2,085,909 | ||||||
Percentages are stated as a percent of net assets.
ADR – American Depositary Receipt
PLC – Public Limited Company
REIT – Real Estate Investment Trust
| (a) | Non-income producing security. |
| (b) | The rate shown represents the fund’s 7-day yield as of June 30, 2022 |
The Global Industry Classification Standard (GICS®) was developed by and/or is the exclusive property of MSCI, Inc. and Standard & Poor’s Financial Services LLC (“S&P”). GICS is a service mark of MSCI and S&P and has been licensed for use by Hood River Capital Management LLC.
The accompanying notes are an integral part of these financial statements.
25
Hood River Funds
| STATEMENTS OF ASSETS AND LIABILITIES |
| at June 30, 2022 |
| Hood River | Hood River | |||||||
| Small-Cap | International | |||||||
| Growth Fund | Opportunity Fund | |||||||
| Assets: | ||||||||
| Investments at value* (Including securities on | ||||||||
| loan valued at $317,234,122 and $0, respectively) | $ | 1,351,559,163 | $ | 2,067,316 | ||||
| Cash | — | 101 | ||||||
| Receivables: | ||||||||
| Securities sold | 10,574,043 | 93,778 | ||||||
| Fund shares sold | 998,116 | — | ||||||
| Dividends and interest | 640,044 | 2,541 | ||||||
| Securities lending income | 44,787 | — | ||||||
| Due From Advisor | — | 11,994 | ||||||
| Prepaid expenses | 85,743 | 22,393 | ||||||
| Total assets | 1,363,901,896 | 2,198,123 | ||||||
| Liabilities: | ||||||||
| Payables: | ||||||||
| Payable upon return of securities loaned | 328,860,952 | — | ||||||
| Securities purchased | 1,659,114 | 63,409 | ||||||
| Fund shares redeemed | 4,349,452 | — | ||||||
| Advisory fee | 790,804 | — | ||||||
| Administration and fund accounting fees | 80,109 | 13,636 | ||||||
| Distribution fees | 51,302 | — | ||||||
| Service fees | 173,832 | 1,550 | ||||||
| Reports to shareholders | 10,357 | 4,535 | ||||||
| Custody fees | 12,709 | 3,854 | ||||||
| Transfer agent fees and expenses | 22,034 | 5,230 | ||||||
| Other accrued expenses | 62,180 | 20,000 | ||||||
| Total liabilities | 336,072,845 | 112,214 | ||||||
| Net assets | $ | 1,027,829,051 | $ | 2,085,909 | ||||
| Net assets consist of: | ||||||||
| Capital stock | $ | 1,051,113,527 | $ | 2,883,651 | ||||
| Total accumulated losses | (23,284,476 | ) | (797,742 | ) | ||||
| Net assets | $ | 1,027,829,051 | $ | 2,085,909 | ||||
| * Investments at cost | $ | 1,349,170,778 | $ | 2,553,860 | ||||
The accompanying notes are an integral part of these financial statements.
26
Hood River Funds
| STATEMENTS OF ASSETS AND LIABILITIES (Continued) |
| at June 30, 2022 |
| Hood River | Hood River | |||||||
| Small-Cap | International | |||||||
| Growth Fund | Opportunity Fund | |||||||
| Investor Shares: | ||||||||
| Net assets applicable to outstanding | ||||||||
| Investor Shares | $ | 39,865,563 | N/A | |||||
| Shares issued (Unlimited number of beneficial | ||||||||
| interest authorized, $0.01 par value) | 900,812 | N/A | ||||||
| Net asset value, offering price and | ||||||||
| redemption price per share | $ | 44.26 | N/A | |||||
| Institutional Shares: | ||||||||
| Net assets applicable to outstanding | ||||||||
| Institutional Shares | $ | 438,897,863 | $ | 1,590,298 | ||||
| Shares issued (Unlimited number of beneficial | ||||||||
| interest authorized, $0.01 par value) | 9,739,033 | 226,613 | ||||||
| Net asset value, offering price and | ||||||||
| redemption price per share | $ | 45.07 | $ | 7.02 | ||||
| Retirement Shares: | ||||||||
| Net assets applicable to outstanding | ||||||||
| Retirement Shares | $ | 549,065,625 | $ | 495,611 | ||||
| Shares issued (Unlimited number of beneficial | ||||||||
| interest authorized, $0.01 par value) | 12,127,102 | 70,559 | ||||||
| Net asset value, offering price and | ||||||||
| redemption price per share | $ | 45.28 | $ | 7.02 | ||||
The accompanying notes are an integral part of these financial statements.
27
Hood River Funds
| STATEMENTS OF OPERATIONS |
| For the Period Ended June 30, 2022 |
| Hood River | Hood River | |||||||
| Small-Cap | International | |||||||
| Growth Fund | Opportunity Fund* | |||||||
| Investment income: | ||||||||
| Dividends (net of foreign taxes withheld | ||||||||
| of $52,198 and $2,728, respectively) | $ | 5,568,858 | $ | 18,538 | ||||
| Interest | 33,419 | 515 | ||||||
| Securities lending income | 662,591 | — | ||||||
| Total investment income | 6,264,868 | 19,053 | ||||||
| Expenses: | ||||||||
| Investment advisory fees (Note 4) | 10,465,166 | 22,691 | ||||||
| Administration and fund accounting fees (Note 4) | 512,628 | 63,138 | ||||||
| Service fees (Note 6) | ||||||||
| Service fees – Investor Shares | 39,782 | — | ||||||
| Service fees – Institutional Shares | 299,534 | 1,550 | ||||||
| Transfer agent fees and expenses | 144,918 | 27,183 | ||||||
| Federal and state registration fees | 175,741 | 29,049 | ||||||
| Custody fees | 88,908 | 13,566 | ||||||
| Legal fees | 30,999 | 13,186 | ||||||
| Reports to shareholders | 18,715 | 4,535 | ||||||
| Distribution fees (Note 5) | ||||||||
| Distribution fees – Investor Shares | 75,016 | — | ||||||
| Audit fees | 16,002 | 15,000 | ||||||
| Compliance expense | 12,429 | 9,351 | ||||||
| Trustees’ fees and expenses | 15,129 | 11,975 | ||||||
| Other | 21,063 | 6,260 | ||||||
| Total expenses before | ||||||||
| reimbursement from advisor | 11,916,030 | 217,484 | ||||||
| Expense recoupment (reimbursement) | ||||||||
| to/(from) advisor (Note 4) | 6,587 | (191,498 | ) | |||||
| Net expenses | 11,922,617 | 25,986 | ||||||
| Net investment loss | $ | (5,657,749 | ) | $ | (6,933 | ) | ||
| * | The Hood River International Opportunity Fund commenced operations on September 28, 2021. |
The accompanying notes are an integral part of these financial statements.
28
Hood River Funds
| STATEMENTS OF OPERATIONS (Continued) |
| For the Period Ended June 30, 2022 |
| Hood River | Hood River | |||||||
| Small-Cap | International | |||||||
| Growth Fund | Opportunity Fund* | |||||||
| Realized and unrealized | ||||||||
| gain (loss) on investments: | ||||||||
| Net realized (loss) on transactions from: | ||||||||
| Investments | $ | (18,875,958 | ) | $ | (290,022 | ) | ||
| Foreign currency related transactions | — | (9,484 | ) | |||||
| Net change in unrealized depreciation on: | ||||||||
| Investments | (359,043,369 | ) | (399,154 | ) | ||||
| Foreign currency related translations | — | (87,423 | ) | |||||
| Net realized and unrealized | ||||||||
| loss on investments | (377,919,327 | ) | (786,083 | ) | ||||
| Net decrease in net assets | ||||||||
| resulting from operations | $ | (383,577,076 | ) | $ | (793,016 | ) | ||
| * | The Hood River International Opportunity Fund commenced operations on September 28, 2021. |
The accompanying notes are an integral part of these financial statements.
29
Hood River Small-Cap Growth Fund
| STATEMENTS OF CHANGES IN NET ASSETS |
| Year Ended | Year Ended | |||||||
| June 30, 2022 | June 30, 2021 | |||||||
| Operations: | ||||||||
| Net investment loss | $ | (5,657,749 | ) | $ | (3,928,223 | ) | ||
| Net realized gain (loss) on investments | (18,875,958 | ) | 282,448,192 | |||||
| Net change in unrealized | ||||||||
| appreciation (depreciation) on investments | (359,043,369 | ) | 210,995,390 | |||||
| Net increase (decrease) in net assets | ||||||||
| resulting from operations | (383,577,076 | ) | 489,515,359 | |||||
| Distributions: | ||||||||
| Distributed earnings – Investor shares | (12,419,787 | ) | (786,330 | ) | ||||
| Distributed earnings – Institutional shares | (78,741,474 | ) | (21,557,677 | ) | ||||
| Distributed earnings – Retirement shares | (123,086,118 | ) | (33,480,771 | ) | ||||
| Total distributions | (214,247,379 | ) | (55,824,778 | ) | ||||
| Capital Share Transactions: | ||||||||
| Proceeds from shares sold | ||||||||
| Investor shares | 85,908,156 | 5,219,186 | ||||||
| Institutional shares | 289,705,102 | 79,289,486 | ||||||
| Retirement shares | 228,158,339 | 223,526,920 | ||||||
| Proceeds from shares issued to | ||||||||
| holders in reinvestment of dividends | ||||||||
| Investor shares | 12,401,270 | 784,159 | ||||||
| Institutional shares | 67,465,539 | 19,289,148 | ||||||
| Retirement shares | 123,086,118 | 33,480,771 | ||||||
| Cost of shares redeemed | ||||||||
| Investor shares | (41,871,469 | ) | (3,309,212 | ) | ||||
| Institutional shares | (127,940,657 | ) | (99,121,730 | ) | ||||
| Retirement shares | (174,543,159 | ) | (132,610,245 | ) | ||||
| Net increase in net assets | ||||||||
| from capital share transactions | 462,369,239 | 126,548,483 | ||||||
| Total increase (decrease) in net assets | (135,455,216 | ) | 560,239,064 | |||||
| Net Assets: | ||||||||
| Beginning of year | 1,163,284,267 | 603,045,203 | ||||||
| End of year | $ | 1,027,829,051 | $ | 1,163,284,267 | ||||
The accompanying notes are an integral part of these financial statements.
30
Hood River Small-Cap Growth Fund
| STATEMENTS OF CHANGES IN NET ASSETS (Continued) |
| Year Ended | Year Ended | |||||||
| June 30, 2022 | June 30, 2021 | |||||||
| Changes in Shares Outstanding: | ||||||||
| Shares sold | ||||||||
| Investor shares | 1,191,477 | 78,528 | ||||||
| Institutional shares | 5,141,537 | 1,206,820 | ||||||
| Retirement shares | 3,599,848 | 3,448,875 | ||||||
| Proceeds from shares issued to | ||||||||
| holders in reinvestment of dividends | ||||||||
| Investor shares | 197,409 | 13,338 | ||||||
| Institutional shares | 1,055,800 | 324,133 | ||||||
| Retirement shares | 1,918,126 | 561,005 | ||||||
| Shares redeemed | ||||||||
| Investor shares | (733,641 | ) | (55,175 | ) | ||||
| Institutional shares | (2,164,692 | ) | (1,572,897 | ) | ||||
| Retirement shares | (2,709,844 | ) | (2,158,444 | ) | ||||
| Net increase in shares outstanding | 7,496,020 | 1,846,183 | ||||||
The accompanying notes are an integral part of these financial statements.
31
Hood River International Opportunity Fund
| STATEMENTS OF CHANGES IN NET ASSETS |
| Period Ended | ||||
| June 30, 2022* | ||||
| Operations: | ||||
| Net investment loss | $ | (6,933 | ) | |
| Net realized loss on investments and foreign currency transactions | (299,506 | ) | ||
| Net change in unrealized depreciation on | ||||
| investments and foreign currency translations | (486,577 | ) | ||
| Net decrease in net assets resulting from operations | (793,016 | ) | ||
| Distributions: | ||||
| Distributed earnings – Institutional shares | (4,849 | ) | ||
| Total distributions | (4,849 | ) | ||
| Capital Share Transactions: | ||||
| Proceeds from shares sold | ||||
| Institutional shares | 2,260,800 | |||
| Retirement shares | 623,222 | |||
| Proceeds from shares issued to | ||||
| holders in reinvestment of dividends | ||||
| Institutional shares | 4,849 | |||
| Retirement shares | — | |||
| Cost of shares redeemed | ||||
| Institutional shares | (15 | ) | ||
| Retirement shares | (5,082 | ) | ||
| Net increase in net assets from capital share transactions | 2,883,774 | |||
| Total increase in net assets | 2,085,909 | |||
| Net Assets: | ||||
| Beginning of period | — | |||
| End of period | $ | 2,085,909 | ||
The accompanying notes are an integral part of these financial statements.
32
Hood River International Opportunity Fund
| STATEMENTS OF CHANGES IN NET ASSETS (Continued) |
| Period Ended | ||||
| June 30, 2022* | ||||
| Changes in Shares Outstanding: | ||||
| Shares sold | ||||
| Institutional shares | 226,137 | |||
| Retirement shares | 71,065 | |||
| Proceeds from shares issued to | ||||
| holders in reinvestment of dividends | ||||
| Institutional shares | 478 | |||
| Retirement shares | — | |||
| Shares redeemed | ||||
| Institutional shares | (2 | ) | ||
| Retirement shares | (506 | ) | ||
| Net increase in shares outstanding | 297,172 | |||
| * | The Hood River International Opportunity Fund commenced operations on September 28, 2021. |
The accompanying notes are an integral part of these financial statements.
33
Hood River Small-Cap Growth Fund
| FINANCIAL HIGHLIGHTS |
For a capital share outstanding throughout each year
Investor Shares
| Year Ended | Year Ended | Year Ended | Year Ended | Year Ended | ||||||||||||||||
| June 30, | June 30, | June 30, | June 30, | June 30, | ||||||||||||||||
| 2022 | 2021 | 2020 | 2019 | 2018 | ||||||||||||||||
| Net Asset Value – | ||||||||||||||||||||
| Beginning of Year | $ | 75.04 | $ | 44.40 | $ | 41.36 | $ | 41.36 | $ | 38.04 | ||||||||||
| Income from | ||||||||||||||||||||
| Investment Operations: | ||||||||||||||||||||
Net investment loss1 | (0.41 | ) | (0.42 | ) | (0.34 | ) | (0.36 | ) | (0.28 | ) | ||||||||||
| Net realized and unrealized | ||||||||||||||||||||
| gain (loss) on investments | (17.41 | ) | 35.02 | 3.38 | 1.91 | 6.14 | ||||||||||||||
| Total from | ||||||||||||||||||||
| investment operations | (17.82 | ) | 34.60 | 3.04 | 1.55 | 5.86 | ||||||||||||||
| Less Distributions: | ||||||||||||||||||||
| Distributions from | ||||||||||||||||||||
| net realized gains | (12.96 | ) | (3.96 | ) | — | (1.55 | ) | (2.55 | ) | |||||||||||
| Total distributions | (12.96 | ) | (3.96 | ) | — | (1.55 | ) | (2.55 | ) | |||||||||||
Redemption fees3: | — | — | — | — | 2 | 0.01 | ||||||||||||||
| Net Asset Value – | ||||||||||||||||||||
| End of Year | $ | 44.26 | $ | 75.04 | $ | 44.40 | $ | 41.36 | $ | 41.36 | ||||||||||
| Total Return | (28.85 | )% | 80.27 | % | 7.35 | % | 4.30 | % | 16.35 | % | ||||||||||
| Ratios and Supplemental Data: | ||||||||||||||||||||
| Net assets, end of | ||||||||||||||||||||
| year (thousands) | $ | 39,866 | $ | 18,428 | $ | 9,274 | $ | 11,316 | $ | 11,470 | ||||||||||
| Ratio of operating expenses | ||||||||||||||||||||
| to average net assets: | ||||||||||||||||||||
| Before recoupments/ | ||||||||||||||||||||
| reimbursements | 1.25 | % | 1.26 | % | 1.27 | % | 1.32 | % | 1.41 | % | ||||||||||
| After recoupments/ | ||||||||||||||||||||
| reimbursements | 1.25 | % | 1.25 | % | 1.25 | % | 1.27 | % | 1.32 | % | ||||||||||
| Ratio of net investment loss | ||||||||||||||||||||
| to average net assets: | ||||||||||||||||||||
| Before recoupments/ | ||||||||||||||||||||
| reimbursements | (0.71 | )% | (0.69 | )% | (0.90 | )% | (0.96 | )% | (0.81 | )% | ||||||||||
| After recoupments/ | ||||||||||||||||||||
| reimbursements | (0.71 | )% | (0.68 | )% | (0.88 | )% | (0.91 | )% | (0.72 | )% | ||||||||||
| Portfolio turnover rate | 77 | % | 119 | % | 157 | % | 98 | % | 102 | % | ||||||||||
1 | The net investment loss per share was calculated using the average shares outstanding method. |
2 | Amount is less than $0.01. |
3 | The Fund’s redemption fee was eliminated on October 31, 2018. |
The accompanying notes are an integral part of these financial statements.
34
Hood River Small-Cap Growth Fund
| FINANCIAL HIGHLIGHTS |
For a capital share outstanding throughout each year
Institutional Shares
| Year Ended | Year Ended | Year Ended | Year Ended | Year Ended | ||||||||||||||||
| June 30, | June 30, | June 30, | June 30, | June 30, | ||||||||||||||||
| 2022 | 2021 | 2020 | 2019 | 2018 | ||||||||||||||||
| Net Asset Value – | ||||||||||||||||||||
| Beginning of Year | $ | 76.04 | $ | 44.87 | $ | 41.71 | $ | 41.61 | $ | 38.18 | ||||||||||
| Income from | ||||||||||||||||||||
| Investment Operations: | ||||||||||||||||||||
Net investment loss1 | (0.32 | ) | (0.30 | ) | (0.27 | ) | (0.28 | ) | (0.18 | ) | ||||||||||
| Net realized and unrealized | ||||||||||||||||||||
| gain (loss) on investments | (17.69 | ) | 35.43 | 3.43 | 1.93 | 6.16 | ||||||||||||||
| Total from | ||||||||||||||||||||
| investment operations | (18.01 | ) | 35.13 | 3.16 | 1.65 | 5.98 | ||||||||||||||
| Less Distributions: | ||||||||||||||||||||
| Distributions from | ||||||||||||||||||||
| net realized gains | (12.96 | ) | (3.96 | ) | — | (1.55 | ) | (2.55 | ) | |||||||||||
| Total distributions | (12.96 | ) | (3.96 | ) | — | (1.55 | ) | (2.55 | ) | |||||||||||
Redemption fees3: | — | — | — | — | 2 | — | 2 | |||||||||||||
| Net Asset Value – | ||||||||||||||||||||
| End of Year | $ | 45.07 | $ | 76.04 | $ | 44.87 | $ | 41.71 | $ | 41.61 | ||||||||||
| Total Return | (28.71 | )% | 80.66 | % | 7.55 | % | 4.52 | % | 16.59 | % | ||||||||||
| Ratios and Supplemental Data: | ||||||||||||||||||||
| Net assets, end of | ||||||||||||||||||||
| year (thousands) | $ | 438,898 | $ | 433,921 | $ | 257,909 | $ | 246,374 | $ | 246,859 | ||||||||||
| Ratio of operating expenses | ||||||||||||||||||||
| to average net assets: | ||||||||||||||||||||
| Before recoupments/ | ||||||||||||||||||||
| reimbursements | 1.06 | % | 1.06 | % | 1.07 | % | 1.11 | % | 1.15 | % | ||||||||||
| After recoupments/ | ||||||||||||||||||||
| reimbursements | 1.06 | % | 1.05 | % | 1.05 | % | 1.06 | % | 1.06 | % | ||||||||||
| Ratio of net investment loss | ||||||||||||||||||||
| to average net assets: | ||||||||||||||||||||
| Before recoupments/ | ||||||||||||||||||||
| reimbursements | (0.52 | )% | (0.49 | )% | (0.69 | %) | (0.74 | )% | (0.55 | )% | ||||||||||
| After recoupments/ | ||||||||||||||||||||
| reimbursements | (0.52 | )% | (0.48 | )% | (0.67 | %) | (0.69 | )% | (0.46 | )% | ||||||||||
| Portfolio turnover rate | 77 | % | 119 | % | 157 | % | 98 | % | 102 | % | ||||||||||
1 | The net investment loss per share was calculated using the average shares outstanding method. |
2 | Amount is less than $0.01. |
3 | The Fund’s redemption fee was eliminated on October 31, 2018. |
The accompanying notes are an integral part of these financial statements.
35
Hood River Small-Cap Growth Fund
| FINANCIAL HIGHLIGHTS |
For a capital share outstanding throughout each year
Retirement Shares
| Year Ended | Year Ended | Year Ended | Year Ended | Year Ended | ||||||||||||||||
| June 30, | June 30, | June 30, | June 30, | June 30, | ||||||||||||||||
| 2022 | 2021 | 2020 | 2019 | 2018 | ||||||||||||||||
| Net Asset Value – | ||||||||||||||||||||
| Beginning of Year | $ | 76.29 | $ | 44.98 | $ | 41.78 | $ | 41.66 | $ | 38.19 | ||||||||||
| Income from | ||||||||||||||||||||
| Investment Operations: | ||||||||||||||||||||
Net investment loss1 | (0.29 | ) | (0.26 | ) | (0.25 | ) | (0.25 | ) | (0.15 | ) | ||||||||||
| Net realized and unrealized | ||||||||||||||||||||
| gain (loss) on investments | (17.76 | ) | 35.53 | 3.45 | 1.92 | 6.17 | ||||||||||||||
| Total from | ||||||||||||||||||||
| investment operations | (18.05 | ) | 35.27 | 3.20 | 1.67 | 6.02 | ||||||||||||||
| Less Distributions: | ||||||||||||||||||||
| Distributions from | ||||||||||||||||||||
| net realized gains | (12.96 | ) | (3.96 | ) | — | (1.55 | ) | (2.55 | ) | |||||||||||
| Total distributions | (12.96 | ) | (3.96 | ) | — | (1.55 | ) | (2.55 | ) | |||||||||||
Redemption fees3: | — | — | — | — | 2 | — | 2 | |||||||||||||
| Net Asset Value – | ||||||||||||||||||||
| End of Year | $ | 45.28 | $ | 76.29 | $ | 44.98 | $ | 41.78 | $ | 41.66 | ||||||||||
| Total Return | (28.66 | )% | 80.76 | % | 7.61 | % | 4.59 | % | 16.70 | % | ||||||||||
| Ratios and Supplemental Data: | ||||||||||||||||||||
| Net assets, end of | ||||||||||||||||||||
| year (thousands) | $ | 549,066 | $ | 710,935 | $ | 335,863 | $ | 318,344 | $ | 196,019 | ||||||||||
| Ratio of operating expenses | ||||||||||||||||||||
| to average net assets: | ||||||||||||||||||||
| Before recoupments/ | ||||||||||||||||||||
| reimbursements | 0.99 | % | 1.00 | % | 1.01 | % | 1.04 | % | 1.08 | % | ||||||||||
| After recoupments/ | ||||||||||||||||||||
| reimbursements | 0.99 | % | 0.99 | % | 0.99 | % | 0.99 | % | 0.99 | % | ||||||||||
| Ratio of net investment (loss) | ||||||||||||||||||||
| to average net assets: | ||||||||||||||||||||
| Before recoupments/ | ||||||||||||||||||||
| reimbursements | (0.45 | )% | (0.41 | )% | (0.64 | )% | (0.67 | )% | (0.47 | )% | ||||||||||
| After recoupments/ | ||||||||||||||||||||
| reimbursements | (0.45 | )% | (0.40 | )% | (0.62 | )% | (0.62 | )% | (0.38 | )% | ||||||||||
| Portfolio turnover rate | 77 | % | 119 | % | 157 | % | 98 | % | 102 | % | ||||||||||
1 | The net investment loss per share was calculated using the average shares outstanding method. |
2 | Amount is less than $0.01. |
3 | The Fund’s redemption fee was eliminated on October 31, 2018. |
The accompanying notes are an integral part of these financial statements.
36
Hood River International Opportunity Fund
| FINANCIAL HIGHLIGHTS |
For a capital share outstanding throughout the period
Institutional Shares
| September 28, 2021* | ||||
| through | ||||
| June 30, 2022 | ||||
| Net Asset Value – Beginning of Period | $ | 10.00 | ||
| Income from Investment Operations: | ||||
Net investment loss1 | (0.03 | ) | ||
| Net realized and unrealized gain (loss) on investments | (2.93 | ) | ||
| Total from investment operations | (2.96 | ) | ||
| Less Distributions: | ||||
| Distributions from net realized gains | (0.02 | ) | ||
| Total distributions | (0.02 | ) | ||
| Net Asset Value – End of Period | $ | 7.02 | ||
| Total Return | (29.65 | )%^ | ||
| Ratios and Supplemental Data: | ||||
| Net assets, end of period (thousands) | $ | 1,590 | ||
| Ratio of operating expenses to average net assets: | ||||
| Before reimbursements | 12.57 | %+ | ||
| After reimbursements | 1.50 | %+ | ||
| Ratio of net investment loss to average net assets: | ||||
| Before reimbursements | (11.57 | )%+ | ||
| After reimbursements | (0.50 | )%+ | ||
| Portfolio turnover rate | 98 | %^ | ||
| * | Operations commenced for the Institutional Shares on September 28, 2021. |
+ | Annualized |
| ^ | Not Annualized |
1 | The net investment loss per share was calculated using the average shares outstanding method. |
The accompanying notes are an integral part of these financial statements.
37
Hood River International Opportunity Fund
| FINANCIAL HIGHLIGHTS |
For a capital share outstanding throughout the period
Retirement Shares
| December 22, 2021* | ||||
| through | ||||
| June 30, 2022 | ||||
| Net Asset Value – Beginning of Period | $ | 10.06 | ||
| Income from Investment Operations: | ||||
Net investment income1 | 0.02 | |||
| Net realized and unrealized gain (loss) on investments | (3.06 | ) | ||
| Total from investment operations | (3.04 | ) | ||
| Less Distributions: | ||||
| Distributions from net realized gains | — | |||
| Total distributions | — | |||
| Net Asset Value – End of Period | $ | 7.02 | ||
| Total Return | (30.22 | )%^ | ||
| Ratios and Supplemental Data: | ||||
| Net assets, end of period (thousands) | $ | 496 | ||
| Ratio of operating expenses to average net assets: | ||||
| Before reimbursements | 11.80 | %+ | ||
| After reimbursements | 1.40 | %+ | ||
| Ratio of net investment loss to average net assets: | ||||
| Before reimbursements | (9.95 | )%+ | ||
| After reimbursements | 0.45 | %+ | ||
| Portfolio turnover rate | 98 | %^ | ||
| * | Operations commenced for the Retirement Shares on December 22, 2021. |
+ | Annualized |
| ^ | Not Annualized |
1 | The net investment income per share was calculated using the average shares outstanding method. |
The accompanying notes are an integral part of these financial statements.
38
Hood River Funds
| NOTES TO FINANCIAL STATEMENTS |
| June 30, 2022 |
NOTE 1 – ORGANIZATION
Manager Directed Portfolios Trust (the “Trust”) is registered under the Investment Company Act of 1940, as amended (the “1940 Act”), as an open-end management investment company consisting of multiple series, and was organized as a Delaware statutory trust on April 4, 2006. These financial statements include the Hood River Small-Cap Growth Fund and the Hood River International Opportunity Fund (each a “Fund” and collectively, the “Funds”). The Funds are both open-end investment management companies that are a diversified series of the Trust. The investment objective of the Funds is long-term growth of capital. The Hood River Small-Cap Growth Fund’s Institutional Shares commenced operations on January 2, 2003. The Hood River Small-Cap Growth Fund’s Investor Shares commenced operations on July 7, 2015. The Hood River Small-Cap Growth Fund’s Retirement Shares commenced operations on March 3, 2017. The Hood River International Opportunity Fund’s Institutional Shares commenced operations on September 28, 2021. The Hood River International Opportunity Fund’s Retirement Shares commenced operations on December 22, 2021. While both funds follow different fundamental investing strategies, each class of shares differs principally in its respective distribution or shareholder servicing expenses. Each class of shares has identical rights to earnings, assets and voting privileges, except for class-specific expenses and exclusive rights to vote on matters affecting only individual classes.
NOTE 2 – SIGNIFICANT ACCOUNTING POLICIES
The following is a summary of significant accounting policies consistently followed by the Funds. These policies are in conformity with U.S. generally accepted accounting principles (“GAAP”). Each Fund is an investment company and accordingly follows the investment company accounting and reporting guidance of the Financial Accounting Standards Board (FASB) Accounting Standard Codification Topic 946 “Financial Services – Investment Companies” including FASB Accounting Standard Update ASU 2013-08.
| A. | Security Valuation: All investments in securities are recorded at their estimated fair value, as described in Note 3. | |
| B. | Federal Income Taxes: It is each Fund’s policy to continue to comply with the requirements of Subchapter M of the Internal Revenue Code applicable to regulated investment companies and to distribute substantially all of its taxable income to its shareholders. Therefore, no federal income or excise tax provisions are required. | |
| The Funds recognize the tax benefits of uncertain tax positions only where the position is “more likely than not” to be sustained assuming examination by tax authorities. Management has analyzed the Funds’ tax positions, and has concluded that no liability for unrecognized tax benefits should be recorded related to uncertain tax positions to be taken or expected to be taken on a tax return. The tax returns for the Funds for the prior three fiscal years are open for examination. The Funds identify their major tax jurisdictions as U.S. Federal and the state of Delaware. |
39
Hood River Funds
| NOTES TO FINANCIAL STATEMENTS (Continued) |
| June 30, 2022 |
| C. | Securities Transactions, Income and Distributions: Securities transactions are accounted for on the trade date. Realized gains and losses on securities sold are determined on the basis of identified cost. Interest income is recorded on an accrual basis. Dividend income and distributions to shareholders are recorded on the ex-dividend date. Withholding taxes on foreign dividends have been provided for in accordance with the Funds’ understanding of the applicable country’s tax rules and rates. | |
| The Funds distribute substantially all of their net investment income, if any, and net realized capital gains, if any, annually. Distributions from net realized gains for book purposes may include short-term capital gains. All short-term capital gains are included in ordinary income for tax purposes. The amount of dividends and distributions to shareholders from net investment income and net realized capital gains is determined in accordance with federal income tax regulations, which differ from GAAP. To the extent these book/tax differences are permanent, such amounts are reclassified within the capital accounts based on their federal tax treatment. | ||
| Investment income, expenses (other than those specific to the class of shares), and realized and unrealized gains and losses on investments are allocated to the separate classes of the Funds’ shares based upon their relative net assets on the date income is earned or expensed and realized and unrealized gains and losses are incurred. | ||
| The Funds are charged for those expenses that are directly attributable to it, such as investment advisory, custody and transfer agent fees. Expenses that are not attributable to the Funds are typically allocated among the funds in the Trust proportionately based on allocation methods approved by the Board of Trustees (the “Board”). Common expenses of the Trust are typically allocated among the funds in the Trust based on a fund’s respective net assets, or by other equitable means. | ||
| D. | Use of Estimates: The preparation of financial statements in conformity with GAAP requires management to make estimates and assumptions that affect the reported amounts of assets and liabilities at the date of the financial statements and the reported amounts of increases and decreases in net assets during the reporting period. Actual results could differ from those estimates. | |
| E. | Reclassification of Capital Accounts: GAAP requires that certain components of net assets relating to permanent differences be reclassified between financial and tax reporting. These reclassifications have no effect on net assets or net asset value per share. | |
| F. | Foreign Currency: Values of investments denominated in foreign currencies are converted into U.S. dollars using the spot market rate of exchange at the time of valuation. Purchases and sales of investments and income are translated into U.S. dollars using the spot market rate of exchange prevailing on the respective dates of such transactions. The Funds do not isolate the portion of the results of operations resulting from fluctuations in foreign exchange rates on investments from |
40
Hood River Funds
| NOTES TO FINANCIAL STATEMENTS (Continued) |
| June 30, 2022 |
| fluctuations resulting from changes in the market prices of securities held. Such fluctuations are included with the net realized and unrealized gain/loss on investments. Foreign investments present additional risks due to currency fluctuations, economic and political factors, lower liquidity, government regulations, differences in accounting standards, and other factors. | ||
| G. | Events Subsequent to the Fiscal Period End: In preparing the financial statements as of June 30, 2022, management considered the impact of subsequent events for potential recognition or disclosure in the financial statements and had concluded that no additional disclosures are necessary. | |
| H. | Recent Accounting Pronouncements and Rule Issuances: In October 2020, the SEC adopted new regulations governing the use of derivatives by registered investment companies (“Rule 18f-4”). Rule 18f-4 will impose limits on the amount of derivatives a Fund can enter into, eliminate the asset segregation framework currently used by funds to comply with Section 18 of the 1940 Act, and require funds whose use of derivatives is greater than a limited specified amount to establish and maintain a comprehensive derivatives risk management program and appoint a derivatives risk manager. Funds are required to comply with Rule 18f-4 by August 19, 2022. Rule 18f-4 may require changes in how a Fund uses derivatives, adversely affect the Fund’s performance and increase costs related to the Fund’s use of derivatives. | |
| In December 2020, the SEC adopted a new rule providing a framework for fund valuation practices (“Rule 2a-5”). Rule 2a-5 establishes requirements for determining fair value in good faith for purposes of the 1940 Act. Rule 2a-5 will permit fund boards to designate certain parties to perform fair value determinations, subject to board oversight and certain other conditions. Rule 2a-5 also defines when market quotations are “readily available” for purposes of the 1940 Act and the threshold for determining whether a fund must fair value a security. In connection with Rule 2a-5, the SEC also adopted related recordkeeping requirements and is rescinding previously issued guidance, including with respect to the role of a board in determining fair value and the accounting and auditing of fund investments. The Funds will be required to comply with the rules by September 8, 2022. Management is currently assessing the potential impact of the new rules on the Funds’ financial statements. |
NOTE 3 – SECURITIES VALUATION
The Funds have adopted authoritative fair value accounting standards which establish an authoritative definition of fair value and set out a hierarchy for measuring fair value. These standards require additional disclosures about the various inputs and valuation techniques used to develop the measurements of fair value, a discussion of changes in
41
Hood River Funds
| NOTES TO FINANCIAL STATEMENTS (Continued) |
| June 30, 2022 |
valuation techniques and related inputs during the period, and expanded disclosure of valuation levels for major security types. These inputs are summarized in the three broad levels listed below:
| Level 1 – | Unadjusted quoted prices in active markets for identical assets or liabilities that the Fund has the ability to access. | |
| Level 2 – | Observable inputs other than quoted prices included in Level 1 that are observable for the asset or liability, either directly or indirectly. These inputs may include quoted prices for the identical instrument on an inactive market, prices for similar instruments, interest rates, prepayment speeds, credit risk, yield curves, default rates and similar data. | |
| Level 3 – | Unobservable inputs for the asset or liability, to the extent relevant observable inputs are not available, representing the Fund’s own assumptions about the assumptions a market participant would use in valuing the asset or liability, and would be based on the best information available. |
Following is a description of the valuation techniques applied to the Funds’ major categories of assets and liabilities measured at fair value on a recurring basis.
Equity Securities: Equity securities, including common stocks, preferred stocks, foreign-issued common stocks, exchange-traded funds, closed-end mutual funds and real estate investment trusts (REITs), that are primarily traded on a national securities exchange shall be valued at the last sale price on the exchange on which they are primarily traded on the day of valuation or, if there has been no sale on such day, at the mean between the bid and asked prices. Securities primarily traded in the NASDAQ Global Market System for which market quotations are readily available shall be valued using the NASDAQ Official Closing Price (“NOCP”). If the NOCP is not available, such securities shall be valued at the last sale price on the day of valuation, or if there has been no sale on such day, at the mean between the bid and asked prices. Over-the-counter securities that are not traded on a listed exchange are valued at the last sale price in the over-the-counter market. Over-the-counter securities which are not traded in the NASDAQ Global Market System shall be valued at the mean between the bid and asked prices. To the extent these securities are actively traded and valuation adjustments are not applied, they are categorized in Level 1 of the fair value hierarchy.
Registered Investment Companies: Investments in registered investment companies (e.g., mutual funds) are generally priced at the ending NAV provided by the applicable registered investment company’s service agent and will be classified in Level 1 of the fair value hierarchy.
Short-Term Debt Securities: Debt securities, including short-term debt instruments having a maturity of less than 60 days, are valued at the evaluated mean price supplied by an approved pricing service. Pricing services may use various valuation methodologies including matrix pricing and other analytical pricing models as well as market
42
Hood River Funds
| NOTES TO FINANCIAL STATEMENTS (Continued) |
| June 30, 2022 |
transactions and dealer quotations. In the absence of prices from a pricing service, the securities will be priced in accordance with the procedures adopted by the Board. Short-term securities are generally classified in Level 1 or Level 2 of the fair market hierarchy depending on the inputs used and market activity levels for specific securities.
The Board has delegated day-to-day valuation issues to a Valuation Committee of the Trust which, as of June 30, 2022, was comprised of officers of the Trust. The function of the Valuation Committee is to value securities where current and reliable market quotations are not readily available, or the closing price does not represent fair value, by following procedures approved by the Board. These procedures consider many factors, including the type of security, size of holding, trading volume and news events. All actions taken by the Valuation Committee are subsequently reviewed and ratified by the Board.
Depending on the relative significance of the valuation inputs, fair valued securities may be classified in either Level 2 or Level 3 of the fair value hierarchy.
The inputs or methodology used for valuing securities are not an indication of the risk associated with investing in those securities. The following is a summary of the fair valuation hierarchy of the Funds’ securities as of June 30, 2022:
Hood River Small-Cap Growth Fund
| Level 1 | Level 2 | Level 3 | Total | |||||||||||||
| Common Stocks | ||||||||||||||||
| Communication Services | $ | 15,513,806 | $ | — | $ | — | $ | 15,513,806 | ||||||||
| Consumer Discretionary | 127,226,628 | — | — | 127,226,628 | ||||||||||||
| Consumer Staples | 50,527,179 | — | — | 50,527,179 | ||||||||||||
| Energy | 44,970,026 | — | — | 44,970,026 | ||||||||||||
| Financials | 84,322,474 | — | — | 84,322,474 | ||||||||||||
| Health Care | 259,936,822 | — | — | 259,936,822 | ||||||||||||
| Industrials | 211,730,240 | — | — | 211,730,240 | ||||||||||||
| Information Technology | 179,238,132 | — | — | 179,238,132 | ||||||||||||
| Materials | 14,762,413 | — | — | 14,762,413 | ||||||||||||
| Total Common Stocks | 988,227,720 | — | — | 988,227,720 | ||||||||||||
| REITs | 27,425,798 | — | — | 27,425,798 | ||||||||||||
| Short-Term Investments | 7,044,693 | — | — | 7,044,693 | ||||||||||||
| Investments Purchased | ||||||||||||||||
| with Cash Proceeds | ||||||||||||||||
| from Securities Lending | — | 328,860,952 | — | 328,860,952 | ||||||||||||
| Total Investments | ||||||||||||||||
| in Securities | $ | 1,022,698,211 | $ | 328,860,952 | $ | — | $ | 1,351,559,163 | ||||||||
43
Hood River Funds
| NOTES TO FINANCIAL STATEMENTS (Continued) |
| June 30, 2022 |
Hood River International Opportunity Fund
| Level 1 | Level 2 | Level 3 | Total | |||||||||||||
| Common Stocks | ||||||||||||||||
| Communication Services | $ | 19,644 | $ | 9,889 | $ | — | $ | 29,533 | ||||||||
| Consumer Discretionary | 68,206 | 177,443 | — | 245,649 | ||||||||||||
| Consumer Staples | 8,460 | 24,168 | — | 32,628 | ||||||||||||
| Energy | 73,651 | 23,157 | — | 96,808 | ||||||||||||
| Financials | 50,756 | — | — | 50,756 | ||||||||||||
| Health Care | 97,703 | 24,944 | — | 122,647 | ||||||||||||
| Industrials | 170,321 | 362,838 | — | 533,159 | ||||||||||||
| Information Technology | 268,212 | 63,540 | — | 331,752 | ||||||||||||
| Materials | 115,003 | 115,086 | — | 230,089 | ||||||||||||
| Real Estate | 39,522 | 19,627 | — | 59,149 | ||||||||||||
| Utilities | 31,690 | — | — | 31,690 | ||||||||||||
| Total Common Stocks | 943,168 | 820,692 | — | 1,763,860 | ||||||||||||
| Exchange Traded Funds | 32,492 | — | — | 32,492 | ||||||||||||
| Closed-End Investment Trust | 34,905 | — | — | 34,905 | ||||||||||||
| Short-Term Investments | 236,059 | — | — | 236,059 | ||||||||||||
| Total Investments | ||||||||||||||||
| in Securities | $ | 1,246,624 | $ | 820,692 | $ | — | $ | 2,067,316 | ||||||||
Level 3 Reconciliation Disclosure
The following is a reconciliation of Level 3 assets for which significant unobservable inputs were used to determine fair value.
| Hood River Small-Cap Growth Fund | Investments, at Value | |||
| Balance as of June 30, 2021 | $ | 3,893,172 | ||
| Purchases | — | |||
| (Sales proceeds and/or rights exercised) | (3,893,172 | ) | ||
| Accrued discounts/premiums, net | — | |||
| Realized gain/(loss) | — | |||
| Change in unrealized appreciation/(depreciation) | — | |||
| Transfers in and/or out of Level 3 | — | |||
| Balance as of June 30, 2022 | $ | — | ||
NOTE 4 – INVESTMENT ADVISORY FEE AND OTHER TRANSACTIONS WITH AFFILIATES
For the fiscal year ended June 30, 2022, Hood River Capital Management LLC, (the “Advisor”) provided the Funds with investment management services under an Investment Advisory Agreement. The Advisor furnishes all investment advice, office space, and facilities, and provides most of the personnel needed by the Fund. As
44
Hood River Funds
| NOTES TO FINANCIAL STATEMENTS (Continued) |
| June 30, 2022 |
compensation for its services, the Advisor is entitled to a monthly fee at an annual rate of 0.90% of the average daily net assets of the Small Cap-Growth Fund and 1.30% for the International Opportunity Fund. For the fiscal year ended June 30, 2022, the Small-Cap Growth Fund incurred $10,465,166 in advisory fees. Advisory fees payable at June 30, 2022 for the Small-Cap Growth Fund were $790,804. For the fiscal year ended June 30, 2022, the International Opportunity Fund incurred $22,691 in advisory fees. Advisory fees payable at June 30, 2022 for the International Opportunity Fund were $0.
Each Fund is responsible for its own operating expenses. The Advisor has contractually agreed to waive a portion of its fees and reimburse certain expenses for the Funds to ensure that the total annual fund operating expenses [excluding front-end or contingent deferred loads, Rule 12b-1 plan fees, shareholder servicing plan fees, taxes, leverage, interest, brokerage commissions and other transactional expenses, expenses in connection with a merger or reorganization, dividends or interest on short positions, acquired fund fees and expenses or extraordinary expenses (collectively, “Excludable Expenses”)] do not exceed the following amounts of the average daily net assets for each class of shares:
Hood River Small-Cap Growth Fund
| Investor Shares | 0.99% | ||
| Institutional Shares | 0.99% | ||
| Retirement Shares | 0.99% |
Hood River International Opportunity Fund
| Institutional Shares | 1.40% | ||
| Retirement Shares | 1.40% |
For the fiscal year ended June 30, 2022, the Advisor reduced its fees in the amount of $0 and $191,498, respectively, for the Small-Cap Growth Fund and International Opportunity Fund. The waivers and reimbursements will remain in effect through October 31, 2022, unless terminated sooner by mutual agreement of the Board and the Advisor.
The Advisor may request recoupment of previously waived fees and paid expenses in any subsequent month dating back to January 1, 2022, for the Small-Cap Growth Fund, if the aggregate amount actually paid by the Fund toward the operating expenses for such fiscal year (taking into account the reimbursement) will not cause the Fund to exceed the lesser of: (1) the expense limitation in place at the time of the management fee reduction and expense payment; or (2) the expense limitation in place at the time of the reimbursement. Any such reimbursement is also contingent upon Board of Trustees review and approval at the time the reimbursement is made. Such reimbursement may not be paid prior to the Funds’ payment of current ordinary operating expenses. Cumulative expenses subject to recapture pursuant to the aforementioned conditions expire as follows:
| Amount | Expiration | |||||
| Small-Cap Growth Fund | $ | — | 6/30/2025 | |||
| International Opportunity Fund | $ | 191,498 | 6/30/2025 | |||
45
Hood River Funds
| NOTES TO FINANCIAL STATEMENTS (Continued) |
| June 30, 2022 |
U.S. Bancorp Fund Services, LLC, doing business as U.S. Bank Global Fund Services, LLC (“Fund Services” or the “Administrator”) acts as the Fund’s Administrator under an Administration Agreement. The Administrator prepares various federal and state regulatory filings, reports and returns for the Fund; prepares reports and materials to be supplied to the Trustees; monitors the activities of the Funds’ custodian, transfer agent and accountants; coordinates the preparation and payment of the Funds’ expenses and reviews the Funds’ expense accruals. Fund Services also serves as the fund accountant and transfer agent to the Funds. Vigilant Compliance, LLC serves as the Chief Compliance Officer to the Funds. U.S. Bank N.A., an affiliate of Fund Services, serves as the Funds’ custodian. For the fiscal year ended June 30, 2022, the Funds incurred the following expenses for administration, fund accounting, transfer agency and custody fees:
| Small-Cap | International | |||||||
| Growth Fund | Opportunity Fund | |||||||
| Administration & fund accounting | $ | 512,628 | $ | 63,138 | ||||
| Custody | $ | 88,908 | $ | 13,566 | ||||
| Transfer agency | $ | 144,918 | $ | 27,183 | ||||
At June 30, 2022, the Funds had payables due to Fund Services for administration, fund accounting and transfer agency fees and to U.S. Bank N.A. for custody fees in the following amounts:
| Small-Cap | International | |||||||
| Growth Fund | Opportunity Fund | |||||||
| Administration & fund accounting | $ | 80,109 | $ | 13,636 | ||||
| Custody | $ | 12,709 | $ | 3,854 | ||||
| Transfer agency | $ | 22,034 | $ | 5,230 | ||||
Quasar Distributors, LLC (the “Distributor”) acts as the Funds’ principal underwriter in a continuous public offering of the Fund’s shares. On July 7, 2021, Foreside Financial Group, LLC (“Foreside”), the parent company of Quasar Distributors, LLC (“Quasar”), the Fund’s distributor, announced that it had entered into a definitive purchase and sale agreement with Genstar Capital (“Genstar”) such that Genstar would acquire a majority stake in Foreside. The transaction closed at the end of the third quarter of 2021. Quasar will remain the Fund’s distributor.
Certain officers of the Fund are employees of the Administrator and are not paid any fees by the Fund for serving in such capacities.
NOTE 5 – DISTRIBUTION AGREEMENT AND PLAN
The Small-Cap Growth and International Opportunity Funds have adopted a Distribution Plan pursuant to Rule 12b-1 (the “Plan”). The Plan permits the Funds to pay for distribution and related expenses at an annual rate of up to 0.25% of the average daily net assets of the Funds’ Investor Shares. The expenses covered by the Plan may include costs in connection with the promotion and distribution of shares and the provision of personal services to shareholders, including, but not necessarily limited to, advertising,
46
Hood River Funds
| NOTES TO FINANCIAL STATEMENTS (Continued) |
| June 30, 2022 |
compensation to underwriters, dealers and selling personnel, the printing and mailing of prospectuses to other than current Fund shareholders, and the printing and mailing of sales literature. Payments made pursuant to the Plan will represent compensation for distribution and service activities, not reimbursements for specific expenses incurred. For the fiscal year ended June 30, 2022, the Small-Cap Growth Fund incurred distribution expenses on its Investor Shares of $75,016. For the fiscal year ended June 30, 2022, the investor shares of the International Opportunity Fund have not yet commenced operations.
NOTE 6 – SHAREHOLDER SERVICING FEE
The Funds have adopted a shareholder servicing plan (the “Plan”) on behalf of the Small-Cap Growth Funds’ Investor and Institutional Share Classes and the International Opportunity Fund’s Institutional Share Class. Under the Plan, the Investor and Institutional Share Classes for each Fund are authorized to pay an annual shareholder servicing fee of up to 0.10% of each class’s average daily net assets. This fee is used to finance certain activities related to servicing and maintaining shareholder accounts. Payments made under the Plan may not be used to pay for any services in connection with the distribution and sale of the Investor and Institutional Shares.
Payments to the Advisor under the Plan may reimburse the Advisor for payments it makes to selected brokers, dealers and administrators which have entered into service agreements with the Advisor for services provided to Investor and Institutional Class shareholders of the Funds. The services provided by such intermediaries are primarily designed to assist Investor and Institutional Class shareholders of the Funds and include the furnishing of office space and equipment, telephone facilities, personnel, and assistance to the Funds in servicing such shareholders. Services provided by such intermediaries also include the provision of support services to the Funds and include establishing and maintaining shareholders’ accounts and record processing, purchase and redemption transactions, answering routine client inquiries regarding the Funds, and providing such other personal services to shareholders as the Funds may reasonably request. For the fiscal year ended June 30, 2022, the Funds incurred, under the Agreement, shareholder servicing fees as follows:
| Small-Cap | International | |||||||
| Growth Fund | Opportunity Fund | |||||||
| Investor Shares | $ | 39,782 | N/A | |||||
| Institutional Shares | $ | 299,534 | $ | 1,550 | ||||
NOTE 7 – SECURITIES TRANSACTIONS
For the fiscal year ended June 30, 2022, the cost of purchases and the proceeds from sales of securities, excluding short-term securities, were as follows:
| Purchases | Sales | |||||||
| Small-Cap Growth Fund | $ | 1,115,160,340 | $ | 878,717,190 | ||||
| International Opportunity Fund | $ | 4,555,428 | $ | 1,943,024 | ||||
There were no purchases or sales of long-term U.S. Government securities.
47
Hood River Funds
| NOTES TO FINANCIAL STATEMENTS (Continued) |
| June 30, 2022 |
NOTE 8 – INCOME TAXES AND DISTRIBUTIONS TO SHAREHOLDERS
As of June 30, 2022, the Funds’ most recent fiscal year end, the components of accumulated earnings/(losses) on a tax basis were as follows:
| Small-Cap | International | |||||||
| Growth Fund | Opportunity Fund | |||||||
Cost of investments(a) | $ | 1,370,260,606 | $ | 2,553,979 | ||||
| Gross unrealized appreciation | 140,264,314 | 21,154 | ||||||
| Gross unrealized depreciation | (158,965,757 | ) | (507,817 | ) | ||||
| Net unrealized depreciation | (18,701,443 | ) | (486,663 | ) | ||||
| Undistributed ordinary income | — | — | ||||||
| Undistributed long-term capital gain | — | — | ||||||
| Total distributable earnings | — | — | ||||||
| Other accumulated gains/(losses) | (4,583,033 | ) | (311,079 | ) | ||||
| Total accumulated earnings/(losses) | $ | (23,284,476 | ) | $ | (797,742 | ) | ||
(a) | The difference between the book basis and tax basis net unrealized appreciation and cost is attributable primarily to wash sales and partnership adjustments. |
As of June 30, 2022, the Small-Cap Growth Fund had short-term capital losses in the amount of $1,667,778 with no expiration to offset future capital gains. The International Opportunity Fund had no long-term or short-term capital losses to offset future capital gains.
As of June 30, 2022, the Funds deferred, on a tax basis, post-October losses of:
| Ordinary Late Year | ||||||||
| Capital | Loss Deferral | |||||||
| Small-Cap Growth Fund | $ | — | $ | 2,916,282 | ||||
| International Opportunity Fund | 304,635 | 6,411 | ||||||
For the fiscal year ended June 30, 2022, the effect of permanent “book/tax” reclassifications resulted in increases and decreases to components of the Funds’ net assets as follows:
| Total Distributable | Paid-In | |||||||
| Earnings/(Loss) | Capital | |||||||
| Small-Cap Growth Fund | $ | 3,249,310 | $ | (3,249,310 | ) | |||
| International Opportunity Fund | 123 | (123 | ) | |||||
48
Hood River Funds
| NOTES TO FINANCIAL STATEMENTS (Continued) |
| June 30, 2022 |
The tax character of distributions paid during the year ended June 30, 2022, and the year ended June 30, 2021 were as follows:
| Year Ended | Year Ended | |||||||
| June 30, 2022 | June 30, 2021 | |||||||
| Small-Cap Growth Fund | ||||||||
| Ordinary income | $ | 117,432,276 | $ | 42,535,278 | ||||
| Long-term capital gains | 96,815,103 | 13,289,500 | ||||||
| $ | 214,247,379 | $ | 55,824,778 | |||||
| International Opportunity Fund | ||||||||
| Ordinary income | $ | 4,849 | $ | — | ||||
NOTE 9 – SECURITIES LENDING
The Small-Cap Growth Fund participates in securities lending arrangements whereby it lends certain of its portfolio securities to brokers, dealers and financial institutions (not with individuals) in order to receive additional income and increase the rate of return of its portfolio. U.S. Bank, N.A. serves as the Fund’s securities lending agent.
U.S. Bank, N.A. oversees the securities lending process, which includes the screening, selection and ongoing review of borrowers, monitoring the availability of securities, negotiating rebates, daily marking to market of loans, monitoring and maintaining cash collateral levels, processing securities movements and reinvesting cash collateral as directed by the Adviser.
The Small-Cap Growth Fund may lend securities pursuant to agreements that require the loans to be secured by collateral consisting of cash, securities of the U.S. Government or it agencies, or any combination of cash and such securities. At the time of loans, the collateral value should at least be equal to 102% of domestic securities and 105% of foreign securities. The value of loaned securities will then be marked-to-market daily and the collateral will be continuously secured by collateral equal to 100% of the market value of the loaned securities. Such loans will not be made if, as a result, the aggregate amount of all outstanding securities loans for the Fund exceeds one-third of the value of the Small-Cap Growth Fund’s total assets taken at fair market value. The Small-Cap Growth Fund will earn interest on the investment of the cash collateral in U.S. Government securities, short-term money market instruments or such other approved vehicle. However, the Small-Cap Growth Fund will normally pay lending fees to such broker-dealers and related expenses from the interest earned on invested collateral. There may be risks of delay in receiving additional collateral or risks of delay in recovery of the securities and even loss of rights in the collateral should the borrower of the securities fail financially. However, loans are made only to borrowers deemed by the adviser to be of good standing and when, in the judgment of the adviser, the consideration that can be earned currently from such securities loans justifies the attendant risk. Either party, upon reasonable notice to the other party, may terminate the loan.
49
Hood River Funds
| NOTES TO FINANCIAL STATEMENTS (Continued) |
| June 30, 2022 |
As of June 30, 2022, the Fund had loaned securities that were collateralized by cash. The cash collateral received was invested in securities as listed in the Fund’s Schedule of Investments.
The following table presents the securities out on loan for the Fund, and the collateral delivered related to those securities, as of the end of the reporting period.
Securities Lending Transactions
| Investments | ||||
| Purchased with | Collateral | |||
| Overnight and | Asset Class | Proceeds from | Pledged | Net |
Continuous | out on Loan | Securities Lending | Counterparty^ | Exposure |
| Hood River Small – | ||||
| Cap Growth Fund | Common Stock | $328,860,952 | $328,860,952 | $ — |
| ^ | As of the end of the reporting period, the value of the collateral pledged from the counterparty exceeded the value of the securities out on loan. Refer to the Fund’s Schedule of Investments for details on the securities out on loan. |
NOTE 10 – PRINCIPAL RISKS
The following is a list of certain risks that may apply to your investment in the Funds. Further information about investment risks is available in the Funds’ Statement of Additional Information.
General Market Risk; Recent Market Events: The value of the Funds’ shares will fluctuate based on the performance of the Funds’ investments and other factors affecting the securities markets generally. Certain investments selected for the Funds’ portfolio may be worth less than the price originally paid for them, or less than they were worth at an earlier time. The value of the Funds’ investments may go up or down, sometimes dramatically and unpredictably, based on current market conditions, such as real or perceived adverse political or economic conditions, inflation, changes in interest rates, lack of liquidity in the fixed income markets or adverse investor sentiment.
U.S. and international markets have experienced volatility in recent months and years due to a number of economic, political and global macro factors, including the impact of the coronavirus (COVID-19) global pandemic, which has resulted in a public health crisis, business interruptions, growth concerns in the U.S. and overseas, layoffs, rising unemployment claims, changed travel and social behaviors and reduced consumer spending. The effects of COVID-19 may lead to a substantial economic downturn or recession in the U.S. and global economies, the recovery from which is uncertain and may last for an extended period of time.
Small-Cap Company Risk: Companies in which the Funds invest may be more vulnerable than larger companies to adverse business or economic developments. Small-cap companies may also have limited product lines, markets, or financial resources, may be dependent on relatively small or inexperienced management groups, and may operate in
50
Hood River Funds
| NOTES TO FINANCIAL STATEMENTS (Continued) |
| June 30, 2022 |
industries characterized by rapid technological obsolescence. Securities of such companies may be less liquid, more volatile, and more difficult to value than securities of larger companies and therefore may involve greater risk than investing in large companies.
Equity Market Risk: Equity securities are susceptible to general stock market fluctuations due to economic, market, political and issuer-specific considerations and to potential volatile increases and decreases in value as market confidence in and perceptions of their issuers change.
Growth-Style Investing Risk: An investment in a growth-oriented fund may be more volatile than the rest of the U.S. market as a whole. If the investment adviser’s assessment of a company’s prospects for earnings growth or how other investors will value the company’s earnings growth is incorrect, the stock may fail to reach the value that the adviser has placed on it. Growth stock prices tend to fluctuate more dramatically than the overall stock market.
Foreign Securities and Currency Risk: Foreign securities are subject to risks relating to political, social and economic developments abroad and differences between U.S. and foreign regulatory requirements and market practices. Those risks are increased for investments in emerging markets. Securities that are denominated in foreign currencies are subject to further risk that the value of the foreign currency will fall in relation to the U.S. dollar and/or will be affected by volatile currency markets or actions of U.S. and foreign governments or central banks. Income earned on foreign securities may be subject to foreign withholding taxes.
IPO Risk: The Funds may purchase securities of companies engaged in initial public offerings (“IPOs”). The price of securities purchased in IPOs can be very volatile. The Funds’ investments in IPO shares may include the securities of “unseasoned” companies (companies with less than three years of continuous operations), which present risks considerably greater than common stocks of more established companies. These companies may be involved in new and evolving businesses and may be vulnerable to competition and changes in technology, markets and economic conditions. They may be more dependent on key managers and third parties and may have limited product lines. The effect of IPO investments on a Fund’s performance depends on a variety of factors, including the number of IPOs the Funds invest in relative to the size of the Funds, and whether and to what extent a security purchased in an IPO appreciates or depreciates in value. When the Funds’ asset base is small, a significant portion of the Funds’ performance could be attributable to investments in IPOs because such investments would have a magnified impact on the Funds. As the Funds’ assets grow, the effect of the Fund’s investments in IPOs on the Funds’ performance probably will decline, which could reduce the Funds’ performance.
Liquidity Risk: Certain securities may be difficult or impossible to sell at the time and the price that the seller would like. While the markets in securities of small companies have grown rapidly in recent years, such securities may trade less frequently and in
51
Hood River Funds
| NOTES TO FINANCIAL STATEMENTS (Continued) |
| June 30, 2022 |
smaller volumes than more widely held securities. The values of these securities may fluctuate more sharply than those of other securities, and the Funds may experience some difficulty in establishing or closing out positions in these securities at prevailing market prices. There may be less publicly available information about the issuers of these securities or less market interest in such securities than in the case of larger companies, and it may take a longer period of time for the prices of such securities to reflect the full value of their issuers’ underlying earnings potential or assets.
Mutual Fund and ETF Trading Risk: The Funds may invest in other mutual funds that are either open-end or closed-end investment companies as well as Exchange Traded Funds (“ETFs”). ETFs are investment companies that are bought and sold on a national securities exchange. Unlike mutual funds, ETFs do not necessarily trade at the net asset values of their underlying securities, which means an ETF could potentially trade above or below the value of the underlying portfolios. Additionally, because ETFs trade like stocks on exchanges, they are subject to trading and commission costs unlike mutual funds. Also, both mutual funds and ETFs have management fees that are part of its costs, and the Funds will indirectly bear their proportionate share of the costs.
Private Placements: The Funds may invest in private placement securities, which are securities that are subject to restrictions on resale as a matter of contract or under federal securities laws. Private placements are often issued by privately held companies that are not subject to the reporting requirements of the SEC and are not required to maintain their accounting records in accordance with generally accepted accounting principles. Because there may be relatively few potential purchasers for such securities, the Funds could find it more difficult to sell such securities, especially under adverse market or economic conditions or in the event of adverse changes in the financial condition of the issuer.
Due to the more limited financial information and lack of publicly available prices, it may be more difficult to determine the fair value of these securities for purposes of computing the Funds’ net asset value. Securities acquired in private placements generally are classified as illiquid. Disposing of securities acquired in private placements may involve time-consuming negotiations and legal expenses, and it may be difficult or impossible for the Funds to sell the security promptly at an acceptable price.
NOTE 11 – GUARANTEES AND INDEMNIFICATIONS
In the normal course of business, the Funds enters into contracts that contain a variety of representations and warranties and which provide general indemnifications. The Funds’ maximum exposure under these arrangements is unknown, as this would involve future claims that may be made against the Fund that have not yet occurred. However, based on experience, the Funds expect the risk of loss to be remote.
52
Hood River Funds
| NOTES TO FINANCIAL STATEMENTS (Continued) |
| June 30, 2022 |
NOTE 12 – CONTROL OWNERSHIP
The beneficial ownership, either directly or indirectly, of more than 25% of the voting securities of a fund creates a presumption of control of the funds, under Section 2(a)(9) of the 1940 Act. As of June 30, 2022, National Financial Services LLC held 33% of the outstanding shares of the Small-Cap Growth Fund. The Fund has no knowledge as to whether all or any portion of the shares owned of record by National Financial Services LLC are also beneficially owned. As of June 30, 2022, Brian Smoluch held 35% of the outstanding shares of the International Opportunity Fund.
53
Hood River Funds
| REPORT OF INDEPENDENT REGISTERED PUBLIC ACCOUNTING FIRM |
To the Board of Trustees of Manager Directed Portfolios
and the Shareholders of Hood River Small-Cap Growth Fund
and Hood River International Opportunity Fund
Opinion on the Financial Statements
We have audited the accompanying statement of assets and liabilities of Hood River Small-Cap Growth Fund (the “Small-Cap Growth Fund”), a series of shares of beneficial interest in Manager Directed Portfolios (the “Funds”), including the schedule of investments, as of June 30, 2022, the related statement of operations for the year then ended, the statements of changes in net assets for each of the years in the two-year period then ended and the financial highlights for each of the years in the five-year period then ended, and the related notes (collectively referred to as the “financial statements”). In our opinion, the financial statements present fairly, in all material respects, the financial position of the Small-Cap Growth Fund as of June 30, 2022, and the results of its operations for the year then ended, the changes in its net assets for each of the years in the two-year period then ended and its financial highlights for each of the years in the five-year period then ended, in conformity with accounting principles generally accepted in the United States of America.
We have also audited the statement of assets and liabilities of Hood River International Opportunity Fund (the “International Opportunity Fund”), a series of shares of beneficial interest in Manager Directed Portfolios, including the schedule of investments, as of June 30, 2022, and the related statement of operations and the statements of changes in net assets for the period September 28, 2021 (commencement of operations) through June 30, 2022 and the financial highlights as noted in the table below, and the related notes. In our opinion, the financial statements present fairly, in all material respects, the financial position of the International Opportunity Fund as of June 30, 2022, and the results of its operations and the changes in its net assets for the period September 28, 2021 through June 30, 2022 and its financial highlights as noted in the table below, in conformity with accounting principles generally accepted in the United States of America.
| Financial Highlights Presented | |
| International Opportunity | For the period from September 28, 2021 |
| Fund – Institutional Shares | (commencement of operations) through June 30, 2022 |
| International Opportunity | For the period from December 22, 2021 |
| Fund – Retirement Shares | (commencement of operations) through June 30, 2022 |
Basis for Opinion
These financial statements are the responsibility of the Funds’ management. Our responsibility is to express an opinion on the Funds’ financial statements based on our audits. We are a public accounting firm registered with the Public Company Accounting Oversight Board (United States) (“PCAOB”) and are required to be independent with respect to the Funds in accordance with the U.S. federal securities law and the applicable rules and regulations of the Securities and Exchange Commission and the PCAOB.
54
Hood River Funds
| REPORT OF INDEPENDENT REGISTERED PUBLIC ACCOUNTING FIRM |
| (Continued) |
We conducted our audits in accordance with the standards of the PCAOB. Those standards require that we plan and perform the audits to obtain reasonable assurance about whether the financial statements are free of material misstatement, whether due to error or fraud. The Funds are not required to have, nor were we engaged to perform, an audit of their internal control over financial reporting. As part of our audits we are required to obtain an understanding of internal control over financial reporting but not for the purpose of expressing an opinion on the effectiveness of the Funds’ internal control over financial reporting. Accordingly, we express no such opinion.
Our audits included performing procedures to assess the risk of material misstatement of the financial statements, whether due to error or fraud, and performing procedures that respond to those risks. Such procedures included examining, on a test basis, evidence regarding the amounts and disclosures in the financial statements. Our procedures included confirmation of securities owned as of June 30, 2022 by correspondence with the custodian, brokers, or by other appropriate auditing procedures where replies from brokers were not received. Our audits also included evaluating the accounting principles used and significant estimates made by management, as well as evaluating the overall presentation of the financial statements. We believe that our audits provide a reasonable basis for our opinion.

BBD, LLP
We have served as the auditor of one or more of the Funds in the Manager Directed Portfolios since 2007.
Philadelphia, Pennsylvania
August 29, 2022
55
Hood River Funds
| EXPENSE EXAMPLES |
| June 30, 2022 (Unaudited) |
As a shareholder of the Fund, you incur two types of costs: (1) transaction costs including sales charges (loads) and redemption fees, if applicable; and (2) ongoing costs, including management fees; distribution and/or service (12b-1 fees); and other Fund expenses. This Example is intended to help you understand your ongoing costs (in dollars) of investing in the Fund and to compare these costs with the ongoing costs of investing in other mutual funds.
The Example is based on an investment of $1,000 invested at the beginning of the period indicated and held for the entire period from January 1, 2022 to June 30, 2022 for the Investor, Institutional, and Retirement Shares of the Hood River Small-Cap Growth Fund.
The Example is based on an investment of $1,000 invested at the beginning of the period indicated and held for the period from January 1, 2022 to June 30, 2022 for the Institutional and Retirement Shares of the Hood River International Opportunity Fund.
Actual Expenses
The information in the table under the heading “Actual” provides information about actual account values and actual expenses. You may use the information in these columns together with the amount you invested, to estimate the expenses that you paid over the period. Simply divide your account value by $1,000 (for example, an $8,600 account value divided by $1,000 = 8.6), then multiply the result by the number in the row entitled “Expenses Paid During Period” to estimate the expenses you paid on your account during this period. There are some account fees that are charged to certain types of accounts, such as Individual Retirement Accounts (generally, a $15 fee is charged to the account annually) that would increase the amount of expenses paid on your account. The example below does not include portfolio trading commissions and related expenses and other extraordinary expenses as determined under generally accepted accounting principles.
Hypothetical Example for Comparison Purposes
The information in the table under the heading “Hypothetical (5% return before expenses)” provides information about hypothetical account values and hypothetical expenses based on the Fund’s actual expense ratio and assumed rate of return of 5% per year before expenses, which is not the Fund’s actual return. The hypothetical account values and expenses may not be used to estimate the actual ending account balance or expenses you paid for the period. You may use this information to compare the ongoing costs of investing in the Fund and other funds. To do so, compare this 5% hypothetical example with the 5% hypothetical examples that appear in the shareholder reports of the other funds. As noted above, there are some account fees that are charged to certain types of accounts that would increase the amount of expense paid on your account.
Please note that the expenses shown in the table are meant to highlight your ongoing costs only and do not reflect any transaction costs, such as sales charges (loads), redemption fees, or exchange fees. Therefore, the information under the heading
56
Hood River Funds
| EXPENSE EXAMPLES (Continued) |
| June 30, 2022 (Unaudited) |
“Hypothetical (5% return before expenses)” is useful in comparing ongoing costs only, and will not help you determine the relative total costs of owning different funds. In addition, if these transactional costs were included, your costs would have been higher.
Hood River Small-Cap Growth Fund
| Beginning | Ending | Expenses Paid | |
| Account Value | Account Value | During Period(1) | |
1/1/2022 | 6/30/2022 | 1/1/2022 – 6/30/2022 | |
| Actual | |||
| Investor Shares | $1,000.00 | $ 693.50 | $5.29 |
| Institutional Shares | $1,000.00 | $ 694.20 | $4.41 |
| Retirement Shares | $1,000.00 | $ 694.50 | $4.16 |
| Hypothetical (5% return | |||
| before expenses) | |||
| Investor Shares | $1,000.00 | $1,018.55 | $6.31 |
| Institutional Shares | $1,000.00 | $1,019.59 | $5.26 |
| Retirement Shares | $1,000.00 | $1,019.89 | $4.96 |
(1) | Expenses are equal to the Investor, Institutional, and Retirement Shares’ annualized expense ratios of 1.25%, 1.07%, and 0.99%, respectively, multiplied by the average account value over the period, multiplied by 181/365 (to reflect the period). |
Hood River International Opportunity Fund
| Beginning | Ending | Expenses Paid | |
| Account Value | Account Value | During Period(1) | |
1/1/2022 | 6/30/2022 | 1/1/2022 – 6/30/2022 | |
| Actual | |||
| Institutional Shares | $1,000.00 | $ 687.60 | $6.28 |
| Retirement Shares | $1,000.00 | $ 687.60 | $5.86 |
| Hypothetical (5% return | |||
| before expenses) | |||
| Institutional Shares | $1,000.00 | $1,017.36 | $7.50 |
| Retirement Shares | $1,000.00 | $1,017.85 | $7.00 |
(1) | Expenses are equal to the Institutional Shares’ and Retirement Shares’ annualized expense ratios of 1.50% and 1.40%, respectively, multiplied by the average account value over the period, multiplied by 181/365 (to reflect the period). |
57
Hood River Funds
| STATEMENT REGARDING LIQUIDITY RISK MANAGEMENT PROGRAM |
| (Unaudited) |
In accordance with Rule 22e-4 under the Investment Company Act of 1940, as amended, the Fund, a series of Manager Directed Portfolios (the “Trust”), has adopted and implemented a liquidity risk management program tailored specifically to the Fund (the “Program”). The Program seeks to promote effective liquidity risk management for the Fund and to protect Fund shareholders from dilution of their interests. The Board has designated the Fund’s investment adviser to serve as the administrator of the Program (the “Program Administrator”). Personnel of the Fund’s investment adviser conduct the day-to-day operation of the Program pursuant to policies and procedures administered by the Program Administrator. The Program Administrator is required to provide a written annual report to the Board and the chief compliance officer of the Trust regarding the adequacy and effectiveness of the Program and any material changes to the Program.
Under the Program, the Program Administrator manages the Fund’s liquidity risk, which is the risk that the Fund could not meet shareholder redemption requests without significant dilution of remaining shareholders’ interests in the Fund. The Program assesses liquidity risk under both normal and reasonably foreseeable stressed market conditions. This risk is managed by monitoring the degree of liquidity of the Fund’s investments, limiting the amount of the Fund’s illiquid investments, and utilizing various risk management tools and facilities available to the Fund for meeting shareholder redemptions, among other means. The Program Administrator’s process of determining the degree of liquidity of the Fund’s investments is supported by one or more third-party liquidity assessment vendors.
On November 8, 2021, the Board reviewed the Program Administrator’s assessment of the operation and effectiveness of the Program for the period June 1, 2020 through June 30, 2022 (the “Report”) and a memorandum regarding the Report prepared by the Trust’s chief compliance officer. The Report noted that the Fund’s portfolio is expected to continue to primarily hold highly liquid investments and the determination that the Fund be designated as a “primarily highly liquid fund” (as defined in Rule 22e-4) remains appropriate. The Fund can therefore continue to rely on the exclusion in Rule 22e-4 from the requirements to determine and review a highly liquid investment minimum for the Fund and to adopt policies and procedures for responding to a highly liquid investment minimum shortfall. The Report noted that there were no breaches of the Fund’s restriction on holding illiquid investments exceeding 15% of its net assets during the review period. The Report confirmed that the Fund’s investment strategy was appropriate for an open-end management investment company. The Report also indicated that no material changes had been made to the Program during the review period.
The Program Administrator determined that the Fund is reasonably likely to be able to meet redemption requests without adversely affecting non-redeeming Fund shareholders through significant dilution. The Program Administrator concluded that the during the review period, the Program was adequately designed and effectively operating to monitor the liquidity risk to the Fund, taking into account the size of the Fund, the type of business conducted, and other relevant factors.
58
Hood River Funds
| NOTICE TO SHAREHOLDERS |
| at June 30, 2022 (Unaudited) |
How to Obtain a Copy of the Fund’s Proxy Voting Policies
A description of the policies and procedures that the Fund uses to determine how to vote proxies relating to portfolio securities is available without charge, upon request, by calling 1-800-497-2960 or on the U.S. Securities and Exchange Commission’s (“SEC”) website at http://www.sec.gov.
How to Obtain a Copy of the Fund’s Proxy Voting Records for the most recent 12-Month Period Ended June 30
Information regarding how the Fund voted proxies relating to portfolio securities during the most recent 12-month period ended June 30 is available no later than August 31 without charge, upon request, by 1-800-497-2960. Furthermore, you can obtain the Fund’s proxy voting records on the SEC’s website at http://www.sec.gov.
Quarterly Filings on Form N-PORT
The Fund files its complete schedule of portfolio holdings with the SEC for the first and third quarters of each fiscal year on Part F of Form N-PORT. The Fund’s Part F of Form N-PORT is available on the SEC’s website at http://www.sec.gov. Information included in the Fund’s Part F of Form N-PORT is also available, upon request, by calling 1-800-497-2960.
Householding
In an effort to decrease costs, the Fund intends to reduce the number of duplicate prospectuses and annual and semi-annual reports you receive by sending only one copy of each to those addresses shared by two or more accounts and to shareholders the Transfer Agent reasonably believes are from the same family or household. Once implemented, if you would like to discontinue householding for your accounts, please call toll-free at 1-800-497-2960 to request individual copies of these documents. Once the Transfer Agent receives notice to stop householding, the Transfer Agent will begin sending individual copies thirty days after receiving your request. This policy does not apply to account statements.
Other Tax Information
For the fiscal year ended June 30, 2022, certain dividends paid by the Funds may be subject to a maximum tax rate of 15%, as provided for by the Jobs and Growth Tax Relief Reconciliation Act of 2003. The percentage of dividends declared from ordinary income designated as qualified dividend income was as follows:
| Small-Cap Growth Fund | 2.05% | |
| International Opportunity Fund | 100.00% |
For corporate shareholders, the percent of ordinary income distributions qualifying for the corporate dividends received deduction for the fiscal year ended June 30, 2022 was as follows:
| Small-Cap Growth Fund | 1.86% | |
| International Opportunity Fund | 15.76% |
The percentage of taxable ordinary income distributions that are designated as short-term capital gain distributions under Internal Revenue Section 871(k)(2)(C) for each Fund were as follows:
| Small-Cap Growth Fund | 100.00% | |
| International Opportunity Fund | 100.00% |
59
Hood River Funds
| TRUSTEES AND OFFICERS |
| (Unaudited) |
The business and affairs of the Trust are managed under the oversight of the Board, subject to the laws of the State of Delaware and the Trust’s Agreement and Declaration of Trust. The Board, as of January 1, 2022, is currently comprised of four trustees who are not interested persons of the Trust within the meaning of the 1940 Act (the “Independent Trustees”). The Trustees are responsible for deciding matters of overall policy and overseeing the actions of the Trust’s service providers. The officers of the Trust conduct and supervise the Trust’s daily business operations.
| Number of | ||||
| Funds | Other | |||
| Position(s) Held | in Fund | Directorships | ||
| Name, | with the Trust | Complex | Held by Trustee | |
| Year of Birth | and Length of | Principal Occupation(s) | Overseen by | During the Past |
and Address(1) | Time Served(2) | During the Past Five Years | Trustee(3) | Five Years |
| INDEPENDENT TRUSTEES | ||||
| Gaylord B. Lyman | Trustee and Audit | Senior Portfolio Manager, | 9 | None |
| (Born 1962) | Committee | Affinity Investment Advisors, | ||
| Chairman, since | LLC, since 2017; Managing | |||
| April 2015 | Director of Kohala Capital | |||
| Partners, LLC (2011 – 2016). | ||||
| Scott Craven Jones | Trustee since | Managing Director, Carne Global | 9 | Trustee, Madison |
| (Born 1962) | July 2016 and | Financial Services (US) LLC | Funds, since 2019 | |
| Lead Independent | (a provider of independent | (18 portfolios); | ||
| Trustee since | governance and distribution | Trustee, XAI | ||
| May 2017 | support for the asset management | Octagon Floating | ||
| industry), since 2013; interim | Rate & | |||
| Managing Director, Park | Alternative | |||
| Agency, Inc., since 2020. | Income Term | |||
| Trust, since 2017 | ||||
| (2 portfolios); | ||||
| Director, | ||||
| Guestlogix Inc. | ||||
| (a provider of | ||||
| ancillary-focused | ||||
| technology to the | ||||
| travel industry) | ||||
| (2015 – 2016). |
60
Hood River Funds
| TRUSTEES AND OFFICERS (Continued) |
| (Unaudited) |
| Number of | ||||
| Funds | Other | |||
| Position(s) Held | in Fund | Directorships | ||
| Name, | with the Trust | Complex | Held by Trustee | |
| Year of Birth | and Length of | Principal Occupation(s) | Overseen by | During the Past |
and Address(1) | Time Served(2) | During the Past Five Years | Trustee(3) | Five Years |
| Lawrence T. | Trustee since | Senior Vice President and Chief | 9 | None |
| Greenberg | July 2016 | Legal Officer, The Motley Fool | ||
| (Born 1963) | Holdings, Inc., since 1996; | |||
| Venture Partner and General | ||||
| Counsel, Motley Fool Ventures | ||||
| LP, since 2018; Manager, Motley | ||||
| Fool Wealth Management, LLC, | ||||
| since 2013; Adjunct Professor, | ||||
| Washington College of Law, | ||||
| American University, since 2006; | ||||
| General Counsel Motley Fool | ||||
| Asset Management, LLC | ||||
| (2008 – 2019). | ||||
| James R. Schoenike | Trustee since | Distribution consultant since | 9 | None |
| (Born 1959) | July 2016(4) | 2018, President and CEO, | ||
| Board of Managers, Quasar | ||||
| Distributors, LLC (2013 – 2018). |
| (1) | The address of each Trustee as it relates to the Trust’s business is c/o U.S. Bank Global Fund Services, 615 East Michigan Street, Milwaukee, WI 53202. |
| (2) | Each Trustee serves during the continued lifetime of the Trust until he dies, resigns, is declared bankrupt or incompetent by a court of competent jurisdiction, or is removed. |
| (3) | The Trust currently has nine active portfolios. |
| (4) | Prior to January 1, 2021, Mr. Schoenike was considered to be an “interested person” of the Fund by virtue of his previous position as President of Quasar Distributors, LLC. |
61
Hood River Funds
| TRUSTEES AND OFFICERS (Continued) |
| (Unaudited) |
As of the date of this report, no Independent Trustee nor any of his immediate family members (i.e., spouse or dependent children) serves as an officer or director or is an employee of the Advisor, Sub-Advisor or Distributor, or any of their respective affiliates, nor is such person an officer, director or employee of any company controlled by or under common control with such entities.
| Name, | Position(s) Held with | |
| Year of Birth | Trust and Length | |
and Address | of Time Served(3) | Principal Occupation(s) During Past Five Years |
| OFFICERS | ||
Scott M. Ostrowski(1) | President and Principal | Senior Vice President, Compliance and |
| (Born 1980) | Executive Officer, | Administration, Fund Services, since 2006 |
| since August 10, 2021 | ||
Colton W. Scarmardo(1) | Interim treasurer | Fund Administrator, Compliance and Administration, |
| (Born 1997) | as of June 18th, | Fund Services, since 2019; Business Administration |
| Assistant Treasurer, | Student, 2015 – 2019, MBA obtained May 2022. | |
| since May 11, 2021 | ||
Justin Dausch(2) | Chief Compliance | Director, Vigilant, since 2017; Compliance Associate, |
| (Born 1989) | Officer and Anti- | HSBC (investment banking company), 2015 – 2017 |
| Money Laundering | ||
| Compliance Officer, | ||
| since January 1, 2020 | ||
Alyssa M. Bernard(1) | Vice President and | Assistant Vice President, Compliance and |
| (Born 1988) | Secretary, since | Administration, Fund Services, since 2018; Attorney, |
August 20, 2019(4) | Mutual Fund Disclosure, Waddell & Reed Financial, | |
| Inc., 2017 – 2018; Attorney, Corporate Governance, | ||
| American Century Companies, Inc., 2014 – 2017 |
| (1) | The mailing address of this officer is: 615 East Michigan Street, Milwaukee, Wisconsin 53202. |
| (2) | The mailing address of this officer is: 223 Wilmington West Chester Pike, Suite 216, Chadds Ford, Pennsylvania 19317. |
| (3) | Each officer is elected annually and serves until his or her successor has been duly elected and qualified. |
| (4) | Ms. Bernard has served as Vice President of the Trust, in addition to her other position held with the Trust, since May 11, 2021. |
The Statement of Additional Information includes additional information about the Fund’s Trustees and Officers and is available, without charge, upon request by calling 1-800-497-2960.
62
Hood River Funds
| NOTICE OF PRIVACY POLICY & PRACTICES |
Protecting the privacy of Fund shareholders is important to us. The following is a description of the practices and policies through which we protect the privacy and security of your non-public personal information.
What Information We Collect
We collect and maintain information about you so that we can open and maintain your account in the Fund and provide various services to you. We collect non-public personal information about you from the following sources:
• information we receive about you on applications or other forms;
• information you give us orally; and
• information about your transactions with us or others.
The types of non-public personal information we collect and share can include:
• social security number;
• account balances;
• account transactions;
• transaction history;
• wire transfer instructions; and
• checking account information.
What Information We Disclose
We do not disclose any non-public personal information about shareholders or former shareholders of the Fund without the shareholder’s authorization, except as permitted by law or in response to inquiries from governmental authorities. We may share information with affiliated parties and unaffiliated third parties with whom we have contracts for servicing the Fund. We will provide unaffiliated third parties with only the information necessary to carry out their assigned responsibility.
How We Protect Your Information
All shareholder records will be disposed of in accordance with applicable law. We maintain physical, electronic and procedural safeguards to protect your non-public personal information and require third parties to treat your non-public personal information with the same high degree of confidentiality.
In the event that you hold shares of the Fund through a financial intermediary, including, but not limited to, a broker-dealer, bank or trust company, the privacy policy of your financial intermediary would govern how your non-public personal information would be shared with unaffiliated third parties.
If you have any questions or concerns regarding this notice or our Privacy Policy, please contact us at 800-497-2960.
63
Investment Advisor
Hood River Capital Management LLC
2373 PGA Boulevard, Suite 200
Palm Beach Gardens, FL 33410
Distributor
Quasar Distributors, LLC
111 East Kilbourn Avenue, Suite 2200
Milwaukee, WI 53202
Transfer Agent
U.S. Bancorp Fund Services, LLC
615 East Michigan Street
Milwaukee, WI 53202
(800) 497-2960
Custodian
U.S. Bank National Association
Custody Operations
1555 North River Center Drive, Suite 302
Milwaukee, WI 53212
Independent Registered Public Accounting Firm
BBD, LLP
1835 Market Street, 3rd floor
Philadelphia, PA 19103
Legal Counsel
Godfrey & Kahn S.C.
833 East Michigan Street, Suite 1800
Milwaukee, WI 53202
This report is intended for shareholders of the Fund and may not be used as sales literature unless preceded or accompanied by a current prospectus.
Past performance results shown in this report should not be considered a representation of future performance. Share price and returns will fluctuate so that shares, when redeemed, may be worth more or less than their original cost. Statements and other information herein are dated and are subject to change.
| (b) | Not Applicable. |
Item 2. Code of Ethics.
The registrant has adopted a code of ethics that applies to the registrant’s principal executive officer and principal financial officer. The registrant has not made any substantive amendments to its code of ethics during the period covered by this report. The registrant has not granted any waivers from any provisions of the code of ethics during the period covered by this report.
A copy of the registrant’s Code of Ethics is filed herewith.
Item 3. Audit Committee Financial Experts.
The registrant’s Board of Trustees has determined that there are at least two audit committee financial experts serving on its audit committee. Messrs. Gaylord B. Lyman and Scott C. Jones are the “audit committee financial experts” and are considered to be “independent” as each term is defined in Item 3 of Form N‑CSR.
Item 4. Principal Accountant Fees and Services.
The registrant has engaged its principal accountant to perform audit services, audit-related services, tax services and other services during the past two fiscal years. “Audit services” refer to performing an audit of the registrant's annual financial statements or services that are normally provided by the accountant in connection with statutory and regulatory filings or engagements for those fiscal years. “Audit-related services” refer to the assurance and related services by the principal accountant that are reasonably related to the performance of the audit. “Tax services” refer to professional services rendered by the principal accountant for tax compliance, tax advice, and tax planning. There were no “other services” provided by the principal accountant. The following table details the aggregate fees billed or expected to be billed for each of the last two fiscal years for audit fees, audit-related fees, tax fees and other fees by the principal accountant.
FYE 6/30/2022 | FYE 6/30/2021 | |
Audit Fees | $25,000 | $13,000 |
Audit-Related Fees | N/A | N/A |
Tax Fees | $6,000 | $3,000 |
All Other Fees | N/A | N/A |
The audit committee has adopted pre-approval policies and procedures that require the audit committee to pre‑approve all audit and non‑audit services of the registrant, including services provided to any entity affiliated with the registrant.
The percentage of fees billed by BBD, LLP applicable to non-audit services pursuant to waiver of pre-approval requirement were as follows for both of the Hood River Funds:
FYE 6/30/2022 | FYE 6/30/2021 | |
Audit-Related Fees | 0% | 0% |
Tax Fees | 0% | 0% |
All Other Fees | 0% | 0% |
All of the principal accountant’s hours spent on auditing the registrant’s financial statements were attributed to work performed by full‑time permanent employees of the principal accountant.
The following table indicates the non-audit fees billed or expected to be billed by the registrant’s accountant for services to the registrant and to the registrant’s investment adviser (and any other controlling entity, etc.—not sub-adviser) for the last two years for both funds. The audit committee of the Board of Trustees has considered whether the provision of non-audit services that were rendered to the registrant's investment adviser is compatible with maintaining the principal accountant's independence and has concluded that the provision of such non-audit services by the accountant has not compromised the accountant’s independence.
Non-Audit Related Fees | FYE 6/30/2022 | FYE 6/30/2021 |
Registrant | N/A | N/A |
Registrant’s Investment Adviser | N/A | N/A |
The registrant has not been identified by the U.S. Securities and Exchange Commission as having filed an annual report issued by a registered public accounting firm branch or office that is located in a foreign jurisdiction where the Public Company Accounting Oversight Board is unable to inspect or completely investigate because of a position taken by an authority in that jurisdiction.
The registrant is not a foreign issuer.
Item 5. Audit Committee of Listed Registrants.
(a) Not applicable to registrants who are not listed issuers (as defined in Rule 10A-3 under the Securities Exchange Act of 1934).
(b) Not Applicable.
Item 6. Investments.
(a) | Schedule of Investments is included as part of the report to shareholders filed under Item 1 of this Form. |
(b) | Not Applicable. |
Item 7. Disclosure of Proxy Voting Policies and Procedures for Closed-End Management Investment Companies.
Not applicable to open-end investment companies.
Item 8. Portfolio Managers of Closed-End Management Investment Companies.
Not applicable to open-end investment companies.
Item 9. Purchases of Equity Securities by Closed‑End Management Investment Company and Affiliated Purchasers.
Not applicable to open-end investment companies.
Item 10. Submission of Matters to a Vote of Security Holders.
There have been no material changes to the procedures by which shareholders may recommend nominees to the Registrant’s Board of Trustees.
Item 11. Controls and Procedures.
(a) | The Registrant’s President/Principal Executive Officer and Treasurer/Principal Financial Officer have reviewed the Registrant's disclosure controls and procedures (as defined in Rule 30a-3(c) under the Investment Company Act of 1940, as amended, (the “Act”)) as of a date within 90 days of the filing of this report, as required by Rule 30a-3(b) under the Act and Rules 13a-15(b) or 15d‑15(b) under the Securities Exchange Act of 1934. Based on their review, such officers have concluded that the disclosure controls and procedures are effective in ensuring that information required to be disclosed in this report is appropriately recorded, processed, summarized and reported and made known to them by others within the Registrant and by the Registrant’s service provider. |
(b) | There were no changes in the Registrant's internal control over financial reporting (as defined in Rule 30a-3(d) under the Act) that occurred during the fourth fiscal quarter of the period covered by this report that has materially affected, or is reasonably likely to materially affect, the Registrant's internal control over financial reporting. |
Item 12. Disclosure of Securities Lending Activities for Closed-End Management Investment Companies.
Not applicable to open-end investment companies.
Item 13. Exhibits.
(3) Any written solicitation to purchase securities under Rule 23c‑1 under the Act sent or given during the period covered by the report by or on behalf of the registrant to 10 or more persons. Not applicable to open-end investment companies.
(4) Change in the registrant’s independent public accountant. There was no change in the registrant’s independent public accountant for the period covered by this report.
SIGNATURES
Pursuant to the requirements of the Securities Exchange Act of 1934 and the Investment Company Act of 1940, as amended, the registrant has duly caused this report to be signed on its behalf by the undersigned, thereunto duly authorized.
(Registrant) Manager Directed Portfolios
By (Signature and Title)* /s/Scott M. Ostrowski
Scott M. Ostrowski, President/
Principal Executive Officer
Date 8/31/2022
Pursuant to the requirements of the Securities Exchange Act of 1934 and the Investment Company Act of 1940, as amended, this report has been signed below by the following persons on behalf of the registrant and in the capacities and on the dates indicated.
By (Signature and Title)* /s/Scott M. Ostrowski
Scott M. Ostrowski, President/
Principal Executive Officer
Date 8/31/2022
By (Signature and Title)* /s/Ryan Frank
Ryan Frank, Treasurer/
Principal Financial Officer
Date 8/31/2022
* Print the name and title of each signing officer under his or her signature.