UNITED STATES
SECURITIES AND EXCHANGE COMMISSION
Washington, D.C. 20549
SECURITIES AND EXCHANGE COMMISSION
Washington, D.C. 20549
FORM N-CSR
CERTIFIED SHAREHOLDER REPORT OF REGISTERED
MANAGEMENT INVESTMENT COMPANIES
Investment Company Act file number 811-21897
Manager Directed Portfolios
(Exact name of registrant as specified in charter)
(Exact name of registrant as specified in charter)
615 East Michigan Street
Milwaukee, WI 53202
(Address of principal executive offices) (Zip code)
(Address of principal executive offices) (Zip code)
Scott M. Ostrowski, President
Manager Directed Portfolios
c/o U.S. Bank Global Fund Services
777 East Wisconsin Avenue, 6th Floor
Milwaukee, WI 53202
(Name and address of agent for service)
(Name and address of agent for service)
(414) 516-3087
Registrant's telephone number, including area code
Date of fiscal year end: October 31, 2022
Date of reporting period: October 31, 2022
Item 1. Reports to Stockholders.
| (a) |
Hardman Johnston
International Growth Fund
Retail Shares HJIRX
Institutional Shares HJIGX
Annual Report
October 31, 2022
Hardman Johnston International Growth Fund
Table of Contents
Letter to Shareholders | 3 | ||
Investment Highlights | 8 | ||
Sector Allocation | 9 | ||
Schedule of Investments | 10 | ||
Statement of Assets and Liabilities | 12 | ||
Statement of Operations | 13 | ||
Statements of Changes in Net Assets | 14 | ||
Financial Highlights | 16 | ||
Notes to the Financial Statements | 18 | ||
Report of Independent Registered Public Accounting Firm | 29 | ||
Expense Example | 30 | ||
Notice to Shareholders | 32 | ||
Statement Regarding Liquidity Risk Management Program | 33 | ||
Trustees and Officers | 34 | ||
Notice of Privacy Policy & Practices | 37 |
Hardman Johnston International Growth Fund
| LETTER TO SHAREHOLDERS |
Dear Shareholders,
Since the Hardman Johnston International Growth Fund (“the Fund”), formerly Marmont Redwood International Equity Fund, inception date on February 14, 2018, the Fund generated an annualized return of -1.46% (institutional Shares) for the period ending October 31, 2022. This performance compared to the annualized return of -1.21% for its benchmark, the MSCI AC World ex-USA Index (USD) for the same period. For the 12-month period ending October 31, 2022, the Fund generated a return of -39.22% (Institutional Shares). During the same 12-month period, the MSCI AC World ex-USA Index (USD) generated a -24.73% return. Hardman Johnston Global Advisors LLC became the sub-advisor to this fund on January 1, 2020.
The combination of inflation, rates, geopolitical uncertainty, war in the Ukraine and the strong US Dollar have all contributed to volatility in the markets during the period. These macro forces have pressured international equities, with all sectors (with the exception of Energy) and all regions within the MSCI AC World ex-USA Index posting negative returns. While we are always monitoring macro events and their impacts on our portfolio holdings, we are not top-down investors. Our investment decisions are based on in-depth bottom-up fundamental analysis of individual stocks. Within the Fund, Consumer Discretionary and Information Technology were the largest sector detractors. All broad regions underperformed, with Pacific Ex Japan and Europe being the largest detractors relative to the benchmark.
For the 12-month period ending October 31, 2022, the top five portfolio contributors for the portfolio were: Duetsche Telecom AG, AstraZeneca plc, LVMH Moet Hennessy Louis Vuitton SE, Genmab A/S and ICICI Bank Limited.
Deutsche Telekom AG was added to the Fund during the second quarter of 2022 and is one of the highest quality European telecommunications companies, with one of the strongest EBITDA and free cash flow growth profiles in the industry. The company has a controlling stake and owns 48.4% in T-Mobile US. T-Mobile is set to deliver substantial synergies from its Sprint merger 2 years ago, with integration and synergy realization ahead of schedule. T-Mobile synergies is the primary driver of Deutsche Telekom’s growth. In Europe, the German and European regulatory environment is improving and supportive of creating a market where operators are encouraged to invest and earn attractive returns on capital. This new regulatory stance represents a shift from decades of punishing telecommunications price regulation that has held back technology development. With an inflection in expected cash flow, we see potential for deleveraging and big share buybacks in both T-Mobile and Deutsche Telekom. AstraZeneca plc management reconfirmed long term growth rates and increases in margin over time. While the company is spending more money on R&D, they are expecting to grow to a mid-to- high 30’s operating margin in the medium- to- long term, which is encouraging for investors. Additionally, continued strength in Enhertu data lifted the stock. Enhertu is
3
Hardman Johnston International Growth Fund
an HER2-directed antibody drug conjugate. HER2 low breast cancer was a risk point, but they are now seeing additional growth potential with positive phase III data read outs. This solidifies the idea that AstraZeneca’s solid tumor approach (beyond breast cancer) may work. Lastly, AstraZeneca reached a settlement agreement to resolve patent litigation related to Ultomiris, in which Alexion (their rare disease unit) will make a single payment of $775 million to Chugai Pharmaceutical in Q2 2022. No further amount is payable by AstraZeneca, and this does not impact 2022 guidance. This ongoing litigation was an overhang for the stock, so this settlement was viewed positively by investors. LVMH Moet Hennessy Louis Vuitton SE was added to the Fund during the third quarter 2002 in replacement of Kering because of its over-reliance on the Gucci brand. There is more variety of categories, including spirits, cosmetics, duty free shopping, and jewelry at scale at LVMH. Some of these categories have not yet recovered to pre-COVID levels, offering room for upside. At the same time, the key Fashion and Leather Goods division has gained scale and market share within the strongly performing luxury industry, and it has structurally improved its margin. The balance of risks lies with Kering, while LVMH offers multiple avenues to rewards and more attractive growth relative to its valuation. Genmab AS is an innovative, antibody design biotechnology company based in Demark. They have three products on the market, with Darzalex ($3B growing 20-30%) their lead asset. Genmab is maturing as a company with a well-balanced pipeline in oncology, rare diseases, and other indications. Genmab has technology platforms in bispecific antibodies, hexamerized antibodies (for greater potency) and HexElect antibodies (for greater potency and specificity). ICICI Bank results have demonstrated increased market share and excellent control over their non-performing loan book. The bank is taking advantage of a relatively strong Indian economy, which is allowing them to grow their loan book selectively. Each of the above-mentioned positions remain in the Fund as of the end of the reported period.
During the same period, the top five portfolio detractors for the portfolio were: PUMA SE, Wuxi Biologics (Cayman) Inc., Sea Ltd. Sponsored ADR, Atlassian Corp and Meituan.
Puma, one of our consumer discretionary holdings, has been affected by the weakness in retail. While the footwear and apparel company has delivered results that have beaten expectations and has taken share from competitors, the stock declined in this environment alongside other footwear companies. Difficult results from key peers Nike and Adidas have cast a shadow over the industry. Despite the industry headwinds, we believe Puma’s good results and strong management will be rewarded in the future. WuXi had a difficult period as the Biden administration in the US announced aims to expand domestic biomanufacturing capacity and to mitigate supply chain risks posed by China within the space. This sent stock prices for all biotech contract manufacturers lower. In evaluating the administration’s Executive Order closely, we believe that there is no near-term impact to WuXi. In fact, the Executive Order could increase funding in the biologics space,
4
Hardman Johnston International Growth Fund
which would increase demand for WuXi’s services. As a result, we believe the market overreacted in its selloff of the stock. Sea Ltd. struggled this past period after a long string of reporting sharp upside surprises in 2021, the market was not accustomed to results that were short of stellar. Sea Ltd. is a Singapore-based Internet company focused on Southeast Asia. Sea operates three platforms across digital entertainment, e-commerce, and digital payments, known as Garena, Shopee, and ShopeePay. Garena is the leading video game publishing platform in Southeast Asia and was backed by industry leader Tencent. Shopee is a top-2 e-commerce player across each of its six Southeast Asian markets and is particularly well positioned to capitalize on the most attractive e-comm growth market in Indonesia. Indonesian online retail is in its hypergrowth phase and destroying traditional retail; Shopee is #2 and the fastest growing player. ShopeePay has been critical to facilitating transactions in Sea’s core gaming and e-commerce franchises in markets where payments infrastructure is often a key friction point. Sea Ltd.’s stock has been under pressure after Tencent Holdings trimmed its stake in the company and the company has been re-focusing on key markets in Brazil, Southeast Asia, and Taiwan. Atlassian Corp. shares underperformed due to intensifying macroeconomic conditions as valuations for high growth software companies continued to compress, particularly those with long duration earnings profiles. Atlassian boasts a mission critical suite of applications catering to developer-focused organizations and is increasingly gaining share outside of the developer space with new offerings. However, the company is still in heavy investment mode. Atlassian believes their growth potential justifies heavy investment but has lowered the street’s expectations for near-term margin expansion, which has hurt share price performance in a market environment increasingly focused on profitability. We believe Atlassian’s margin guidance for its next fiscal year is conservative as they have a history of consistently beating their operating margin guide, and we continue to believe in the long-term structural growth outlook for its suite of products. Meituan is the industry leader in service e-commerce, leveraging its ‘super app’ technology to connect consumers with merchants for a broad range of local lifestyle services, including food delivery, in-store dining, hotel bookings, grocery delivery, movie tickets, and car/bike sharing services. As the dominant provider of restaurant take-out delivery services throughout China, we view Meituan’s scaled user base and pervasive delivery platform as two key assets upon which it will develop new growth drivers. Meituan’s management and operational execution capabilities are true differentiators. Additionally, accelerated by the pandemic, online grocery is the next growth battleground for China big tech. Meituan is positioned to become a leader and is strongly committed to investing in Community Group Buy (CGB). CGB will be the platform to capture the next 300-400 million users and expand their addressable market by 10x to the broader e-commerce opportunity. While regulatory has proven to be a headwind for the China’s Internet giants, including Meituan, we foresee uncertainties clearing with outcomes that range from manageable to relatively favorable allowing Meituan to continue its development and to prosper. Each of the above-mentioned positions remain in the Fund as of the end of the reported period.
5
Hardman Johnston International Growth Fund
At the end of the period, the Fund held 26 stocks across various international regions and sectors. Relative to the benchmark, the Fund carried an overweight to Europe and Pacific Ex Japan, and a relative underweight to the Emerging Markets and North America. Relative sector exposure to the benchmark, the Fund was overweight to consumer discretionary and industrials, and a relative underweight to financials and consumer staples.
OUTLOOK
The economic outlook has deteriorated over the last few months with a global downturn looking increasingly likely. As always, some regions and countries will fare better than others, but most are facing a combination of international and domestic headwinds, from energy shortages in Europe and ongoing COVID restrictions in China, to the impact of rapidly rising interest rates in the US. Sectors, such as healthcare or communications services, that might have been safe havens have sold off. Yet there are still bright spots and opportunities for investors able to look through a period of near-term volatility to the secular changes influencing the big picture to come.
The pace and extent of interest rate rises will remain one of the most important issues for markets. The Federal Reserve, along with many developed and emerging markets central banks, is sounding more hawkish, as it puts its focus firmly on fighting inflation. The pace of tightening will persist and even accelerate in regions that have been behind the curve, notably in Europe. A major impact of the step change in tightening is US Dollar strength. This will remain a headwind for US multinationals, many of which are forecasting sizable forex hits to earnings, while providing a boost to international businesses trading in Dollars. At a macro level, the strong Dollar will lead to rising energy and food prices and imported inflation in many economies, which can lead to greater civil unrest.
Europe is facing challenges on multiple fronts. The European Central Bank is tightening into a weakening economy to rein in stubbornly high inflation. In the event of a harsh winter, many countries face the real risk of energy shortages and rationing which would further weigh on GDP growth. The crisis will ultimately accelerate the energy transition, but there will be disruption in the short term.
In contrast to the global shift to higher interest rates, the Bank of Japan remains committed to ultra-loose monetary policy to support businesses in the face of relatively moderate inflation. The resultant weakening of the Yen prompted a record $20 billion spend in currency markets, with further interventions possible. The market has been one of the stronger relative performers in the third quarter, with exporters benefiting from favorable exchange rates, although at risk of seeing more softness in demand.
Japan is not the only major economy bucking the tightening trend with China continuing to provide stimulus. While Beijing’s zero-COVID policy is increasingly out of
6
Hardman Johnston International Growth Fund
step with the rest of the world, the approval of a domestic mRNA vaccine should help the country put the pandemic behind it. With a post-COVID bounce to come, China has the potential to see GDP accelerate once more, which could be positive for the global economy. Chinese stocks have sold off sharply year-to-date, however, our holdings look attractively valued and well positioned for growth.
Weakness in equity markets more broadly has compressed valuations. Earnings estimates were cut during the third quarter of 2022 and are likely to be reduced further as the global economy slows. Some stocks may not be as reasonably valued as they might appear. Still, we are comfortable in our approach and the risk-reward profile of our portfolio. We also continue to research new opportunities, using our bottom-up analysis to identify attractively valued companies with secular growth drivers that can deliver outperformance over a three-to-five-year timeframe.
This material represents the manager’s assessment of the portfolio and market environment at a specific point in time and should not be relied upon by the reader as research or investment advice.
Fund holdings and/or sector allocations are subject to change at any time and should not be considered recommendations to buy or sell any security. Please see the Schedule of Investments in this report for a complete list of Fund holdings.
Mutual fund investing involves risk, including the loss of principal. Investments in foreign securities involve greater volatility and political, economic, and currency risks and differences in accounting methods. These risks are greater in emerging markets.
The Morgan Stanley Capital International All Country World Index Ex-U.S. (MSCI ACWI Ex-U.S.) is a market-capitalization-weighted index maintained by Morgan Stanley Capital International (MSCI). It is designed to provide a broad measure of stock performance throughout the world, with the exception of U.S.-based companies. The MSCI ACWI Ex U.S. includes both developed and emerging markets.
Diversification does not assure a profit, nor does it protect against a loss in a declining market.
Must be preceded or accompanied by a prospectus.
The Hardman Johnston International Growth Fund is distributed by Quasar Distributions, LLC.
You cannot invest directly into an index.
7
Hardman Johnston International Growth Fund
Investment Highlights (Unaudited)
Comparison of the Change in Value of a Hypothetical $100,000 Investment
in the Hardman Johnston International Growth Fund – Institutional Shares and
MSCI AC World ex-USA Net (USD)
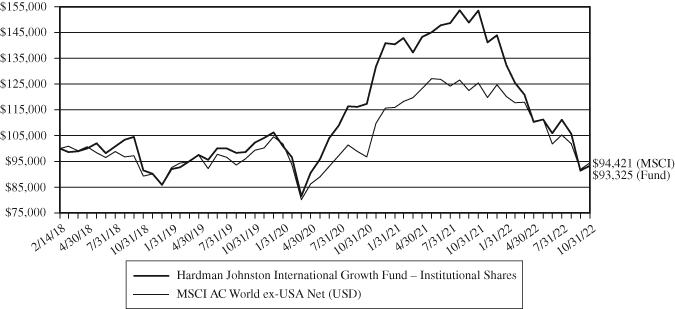
| Average Annual Total Return | Since Inception | ||
| Periods Ended October 31, 2022: | 1 Year | 3 Year | (2/14/2018) |
| Hardman Johnston International Growth Fund – | |||
| Institutional Shares | (39.22)% | (3.01)% | (1.46)% |
Retail Shares(1) | (39.42)% | (2.97)% | (1.52)% |
| MSCI AC World ex-USA Net (USD) | (24.73)% | (1.68)% | (1.21)% |
Expense Ratios*: | Gross 1.88%; Net 1.00% (Institutional Shares); |
Gross 2.18%; Net 1.25% (Retail Shares) |
Performance data quoted represents past performance; past performance does not guarantee future results. The investment return and principal value of an investment will fluctuate so that an investor’s shares, when redeemed, may be worth more or less than their original cost. Current performance of the Fund may be lower or higher than the performance quoted. Performance data current to the most recent month end may be obtained by calling 1-833-627-6668.
This chart illustrates the performance of a hypothetical $100,000 investment made in the Institutional Shares of the Fund February 14, 2018. Returns reflect the reinvestment of dividends and capital gain distributions. The performance data and expense ratios shown reflect a contractual fee waiver made by the Adviser, currently, through February 28, 2024. In the absence of fee waivers, returns would be reduced. The performance data and graph do not reflect the deduction of taxes that a shareholder may pay on dividends, capital gain distributions, or redemption of Fund shares. This chart does not imply any future performance.
(1) | The inception date of the Retail Shares is September 17, 2018. Performance shown prior to the inception of the Retail Shares reflects the performance of the Institutional Shares and does not include expenses applicable to the Retail Shares, and are higher than, those of the Institutional Shares. The actual annualized performance during the period September 17, 2018 (Retail Share inception) through October 31, 2022 was (2.45)% (annualized). |
| * | The expense ratios presented are from the most recent prospectus. |
8
Hardman Johnston International Growth Fund
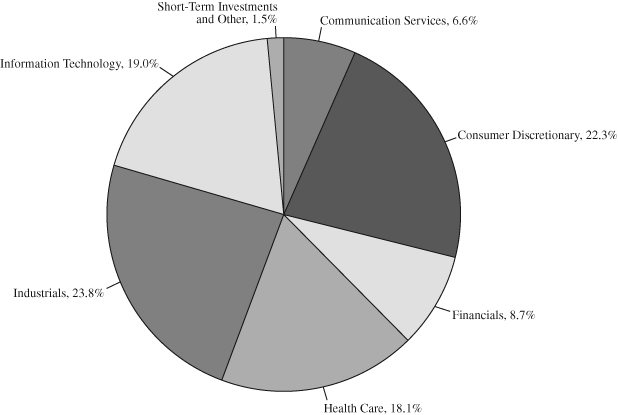
| SECTOR ALLOCATION OF PORTFOLIO ASSETS |
| at October 31, 2022 (Unaudited) |
| COUNTRY ALLOCATION OF PORTFOLIO ASSETS |
| at October 31, 2022 (Unaudited) |
| Netherlands | 14.8 | % | |||
| Japan | 10.8 | % | |||
| China | 10.6 | % | |||
| United Kingdom | 10.2 | % | |||
| France | 9.0 | % | |||
| Germany | 8.9 | % | |||
| Denmark | 6.5 | % | |||
| Italy | 5.9 | % | |||
| Hong Kong | 4.6 | % | |||
| Taiwan | 4.3 | % | |||
| India | 4.1 | % | |||
| United States | 3.5 | % | |||
| Ireland | 2.3 | % | |||
| Norway | 1.8 | % | |||
| Spain | 1.2 | % | |||
| Short-Term Investments and Other | 1.5 | % |
Percentages represent market value as a percentage of net assets.
9
Hardman Johnston International Growth Fund
| SCHEDULE OF INVESTMENTS |
| at October 31, 2022 |
| Number of | ||||||||
| COMMON STOCKS – 98.5% | Shares | Value | ||||||
| Communication Services – 6.6% | ||||||||
| Deutsche Telekom AG | 131,210 | $ | 2,476,653 | |||||
| Sea Ltd. – ADR (a) | 10,636 | 528,396 | ||||||
3,005,049 | ||||||||
| Consumer Discretionary – 22.3% | ||||||||
| Aptiv Plc – ADR (a) | 24,255 | 2,208,903 | ||||||
| JD.com, Inc. | 25,420 | 462,912 | ||||||
| LVMH Moet Hennessy Louis Vuitton SE | 2,078 | 1,311,207 | ||||||
| Meituan (a) | 97,800 | 1,565,831 | ||||||
| Melco Resorts & Entertainment Ltd. – ADR (a) | 194,470 | 1,063,751 | ||||||
| Prosus NV | 46,680 | 2,018,522 | ||||||
| Puma SE | 35,718 | 1,579,123 | ||||||
10,210,249 | ||||||||
| Financials – 8.7% | ||||||||
| AIA Group Ltd. | 279,160 | 2,114,580 | ||||||
| ICICI Bank Ltd. – ADR | 85,860 | 1,892,354 | ||||||
4,006,934 | ||||||||
| Health Care – 18.1% | ||||||||
| Alkermes Plc – ADR (a) | 45,630 | 1,035,801 | ||||||
| AstraZeneca PLC | 20,990 | 2,462,807 | ||||||
| Genmab A/S (a) | 7,760 | 2,989,212 | ||||||
| Grifols SA (a) | 66,190 | 563,117 | ||||||
| Wuxi Biologics Cayman, Inc. (a) | 278,170 | 1,251,666 | ||||||
8,302,603 | ||||||||
| Industrials – 23.8% | ||||||||
| Airbus SE | 24,715 | 2,674,256 | ||||||
| Daifuku Co Ltd. | 28,025 | 1,282,843 | ||||||
| Nidec Corp. | 26,560 | 1,460,376 | ||||||
| Prysmian SpA | 82,705 | 2,691,892 | ||||||
| Safran SA | 25,245 | 2,811,534 | ||||||
10,920,901 | ||||||||
The accompanying notes are an integral part of these financial statements.
10
Hardman Johnston International Growth Fund
| SCHEDULE OF INVESTMENTS (Continued) |
| at October 31, 2022 |
| Number of | ||||||||
| COMMON STOCKS – 98.5% (Continued) | Shares | Value | ||||||
| Information Technology – 19.0% | ||||||||
| ASML Holding NV | 4,480 | $ | 2,101,510 | |||||
| Atlassian Corp. (a) | 7,907 | 1,602,986 | ||||||
| Keyence Corp. | 5,840 | 2,202,061 | ||||||
| Nordic Semiconductor ASA (a) | 58,007 | 818,903 | ||||||
| Taiwan Semiconductor Manufacturing Co Ltd. | 163,000 | 1,959,620 | ||||||
8,685,080 | ||||||||
| TOTAL COMMON STOCKS | ||||||||
| (Cost $60,184,029) | 45,130,816 | |||||||
| SHORT-TERM INVESTMENTS – 2.1% | ||||||||
| MONEY MARKET FUNDS – 2.1% | ||||||||
| First American Government | ||||||||
| Obligations Fund – Class X, 2.92% (b) | 977,689 | 977,689 | ||||||
| TOTAL SHORT-TERM INVESTMENTS | ||||||||
| (Cost $977,689) | 977,689 | |||||||
| TOTAL INVESTMENTS | ||||||||
| (Cost $61,161,718) – 100.6% | 46,108,505 | |||||||
| Liabilities in excess of other assets – (0.6)% | (275,408 | ) | ||||||
| TOTAL NET ASSETS – 100.00% | $ | 45,833,097 | ||||||
Percentages are stated as a percent of net assets.
ADR – American Depositary Receipt
PLC – Public Limited Company
| (a) | Non-income producing security. |
| (b) | The rate shown represents the fund’s 7-day yield as of October 31, 2022. |
The Global Industry Classification Standard (GICS®) was developed by and/or is the exclusive property of MSCI, Inc. and Standard & Poor’s Financial Services LLC (“S&P”). GICS is a service mark of MSCI and S&P and has been licensed for use by U.S. Bank Global Fund Services.
The accompanying notes are an integral part of these financial statements.
11
Hardman Johnston International Growth Fund
| STATEMENT OF ASSETS AND LIABILITIES |
| at October 31, 2022 |
| Assets: | ||||
Investments, at value (cost of $61,161,718) | $ | 46,108,505 | ||
Receivables: | ||||
| Dividends and interest | 36,648 | |||
Prepaid expenses | 17,555 | |||
| Total assets | 46,162,708 | |||
| Liabilities: | ||||
Payables: | ||||
| Securities purchased | 223,948 | |||
| Administration and fund accounting fees | 44,425 | |||
| Advisory fees | 4,275 | |||
| Custody fees | 7,348 | |||
| Reports to shareholders | 5,125 | |||
| Transfer agent fees and expenses | 23,394 | |||
| Other accrued expenses | 21,096 | |||
| Total liabilities | 329,611 | |||
| Net assets | $ | 45,833,097 | ||
| Net assets consist of: | ||||
Paid in capital | $ | 65,464,805 | ||
Total accumulated loss | (19,631,708 | ) | ||
| Net assets | $ | 45,833,097 | ||
| Institutional Shares: | ||||
| Net assets applicable to outstanding Institutional Shares | $ | 45,252,149 | ||
| Shares issued (Unlimited number of beneficial | ||||
| interest authorized, $0.01 par value) | 5,180,540 | |||
| Net asset value, offering price and redemption price per share | $ | 8.74 | ||
| Retail Shares: | ||||
| Net assets applicable to outstanding Retail Shares | $ | 580,948 | ||
| Shares issued (Unlimited number of beneficial | ||||
| interest authorized, $0.01 par value) | 62,986 | |||
| Net asset value, offering price and redemption price per share | $ | 9.22 | ||
The accompanying notes are an integral part of these financial statements.
12
Hardman Johnston International Growth Fund
| STATEMENT OF OPERATIONS |
| For the Year Ended October 31, 2022 |
| Investment income: | ||||
Dividends (net of foreign taxes withheld of $50,686) | $ | 368,144 | ||
Interest | 11,099 | |||
| Total investment income | 379,243 | |||
| Expenses: | ||||
Investment advisory fees (Note 4) | 527,192 | |||
Administration and fund accounting fees (Note 4) | 130,157 | |||
Transfer agent fees and expenses | 67,225 | |||
Federal and state registration fees | 55,341 | |||
Custody fees | 42,724 | |||
Legal fees | 27,067 | |||
Audit fees | 18,998 | |||
Compliance expense | 16,084 | |||
Trustees’ fees and expenses | 14,759 | |||
Reports to shareholders | 3,460 | |||
Distribution fees (Note 5) | ||||
| Distribution fees – Retail Shares | 1,562 | |||
Other | 11,834 | |||
| Total expenses before reimbursement from advisor | 916,403 | |||
| Expense reimbursement from advisor (Note 4) | (387,648 | ) | ||
| Net expenses | 528,755 | |||
| Net investment loss | (149,512 | ) | ||
| Realized and unrealized loss on investments: | ||||
| Net realized loss on transactions from: | ||||
| Investments | (4,048,149 | ) | ||
| Foreign currency related transactions | (56,847 | ) | ||
| Net change in unrealized depreciation on: | ||||
| Investments | (23,494,732 | ) | ||
| Foreign currency related transactions | (1,706 | ) | ||
| Net realized and unrealized loss on investments | (27,601,434 | ) | ||
| Net decrease in net assets resulting from operations | $ | (27,750,946 | ) | |
The accompanying notes are an integral part of these financial statements.
13
Hardman Johnston International Growth Fund
| STATEMENTS OF CHANGES IN NET ASSETS |
| Year Ended | Year Ended | |||||||
| October 31, 2022 | October 31, 2021 | |||||||
| Operations: | ||||||||
Net investment loss | $ | (149,512 | ) | $ | (221,838 | ) | ||
Net realized gain (loss) | (4,104,996 | ) | 855,629 | |||||
Net change in unrealized appreciation (depreciation) | (23,496,438 | ) | 6,711,013 | |||||
| Net increase (decrease) in net assets | ||||||||
| resulting from operations | (27,750,946 | ) | 7,344,804 | |||||
| Distributions to Shareholders From: | ||||||||
Distributed earnings | ||||||||
| Investor class shares | (7,565 | ) | — | |||||
| Institutional shares | (678,739 | ) | — | |||||
| Total distributions | (686,304 | ) | — | |||||
| Capital Share Transactions: | ||||||||
Proceeds from shares sold | ||||||||
| Retail shares | 201,718 | 483,884 | ||||||
| Institutional shares | 23,045,651 | 42,464,294 | ||||||
Proceeds from shares issued to holders | ||||||||
in reinvestment of dividends | ||||||||
| Retail shares | 7,445 | — | ||||||
| Institutional shares | 653,292 | — | ||||||
Cost of shares redeemed | ||||||||
| Retail Shares | (65,608 | ) | (186,899 | ) | ||||
| Institutional shares | (15,312,108 | ) | (2,022,130 | ) | ||||
| Net increase in net assets from | ||||||||
| capital share transactions | 8,530,390 | 40,739,149 | ||||||
| Total increase (decrease) in net assets | (19,906,860 | ) | 48,083,953 | |||||
| Net Assets: | ||||||||
Beginning of year | 65,739,957 | 17,656,004 | ||||||
End of year | $ | 45,833,097 | $ | 65,739,957 | ||||
The accompanying notes are an integral part of these financial statements.
14
Hardman Johnston International Growth Fund
| STATEMENTS OF CHANGES IN NET ASSETS (Continued) |
| Year Ended | Year Ended | |||||||
| October 31, 2022 | October 31, 2021 | |||||||
| Changes in Shares Outstanding: | ||||||||
Shares sold | ||||||||
| Retail shares | 18,435 | 34,099 | ||||||
| Institutional shares | 2,132,845 | 3,057,943 | ||||||
Proceeds from shares issued to holders | ||||||||
in reinvestment of dividends | ||||||||
| Retail shares | 524 | — | ||||||
| Institutional shares | 48,644 | — | ||||||
Shares redeemed | ||||||||
| Retail shares | (5,477 | ) | (12,381 | ) | ||||
| Institutional shares | (1,470,326 | ) | (147,661 | ) | ||||
Net increase in shares outstanding | 724,645 | 2,932,000 | ||||||
The accompanying notes are an integral part of these financial statements.
15
Hardman Johnston International Growth Fund
| FINANCIAL HIGHLIGHTS |
For a capital share outstanding throughout each period
Institutional Shares
| Year | Year | Year | Year | February 14, | ||||||||||||||||
| Ended | Ended | Ended | Ended | 2018* through | ||||||||||||||||
| October 31, | October 31, | October 31, | October 31, | October 31, | ||||||||||||||||
| 2022 | 2021 | 2020 | 2019 | 2018 | ||||||||||||||||
| Net Asset Value – | ||||||||||||||||||||
| Beginning of Period | $ | 14.54 | $ | 11.11 | $ | 10.23 | $ | 9.15 | $ | 10.00 | ||||||||||
| Net investment | ||||||||||||||||||||
income/(loss)1 | (0.03 | ) | (0.07 | ) | (0.05 | ) | 0.09 | — | 2 | |||||||||||
| Net realized and unrealized | ||||||||||||||||||||
| gain (loss) on investments | (5.62 | ) | 3.50 | 1.48 | 0.99 | (0.85 | ) | |||||||||||||
| Total from | ||||||||||||||||||||
| investment operations | (5.65 | ) | 3.43 | 1.43 | 1.08 | (0.85 | ) | |||||||||||||
| Less Distributions: | ||||||||||||||||||||
| Dividends from net | ||||||||||||||||||||
| realized gains | (0.15 | ) | — | (0.55 | ) | — | — | |||||||||||||
| Total distributions | (0.15 | ) | — | (0.55 | ) | — | — | |||||||||||||
| Net Asset Value – | ||||||||||||||||||||
| End of Period | $ | 8.74 | $ | 14.54 | $ | 11.11 | $ | 10.23 | $ | 9.15 | ||||||||||
| Total Return | (39.22 | )% | 30.87 | % | 14.68 | % | 11.80 | % | (8.50)%^ | |||||||||||
| Ratios and Supplemental Data: | ||||||||||||||||||||
| Net assets, end of | ||||||||||||||||||||
| period (thousands) | $ | 45,252 | $ | 64,979 | $ | 17,329 | $ | 7,069 | $ | 9,580 | ||||||||||
| Ratio of operating expenses | ||||||||||||||||||||
| to average net assets: | ||||||||||||||||||||
| Before reimbursements | 1.74 | % | 1.88 | % | 6.48 | % | 4.57 | % | 11.31 | %+ | ||||||||||
| After reimbursements | 1.00 | % | 1.00 | % | 1.00 | % | 1.00 | % | 1.00 | %+ | ||||||||||
| Ratio of net investment income | ||||||||||||||||||||
| (loss) to average net assets: | ||||||||||||||||||||
| Before reimbursements | (1.02 | )% | (1.36 | )% | (5.94 | )% | (2.63 | )% | (10.25 | )%+ | ||||||||||
| After reimbursements | (0.28 | )% | (0.48 | )% | (0.46 | )% | 0.94 | % | 0.06 | %+ | ||||||||||
Portfolio turnover rate3 | 32 | % | 46 | % | 224 | % | 81 | % | 53%^ | |||||||||||
| * | Commencement of operations for Institutional Shares was February 14, 2018. |
+ | Annualized |
| ^ | Not Annualized |
1 | The net investment income per share was calculated using the average shares outstanding method. |
2 | Amount is less than $0.01 per share. |
3 | Portfolio turnover was calculated on the basis of the Fund as a whole. The rate presented represents portfolio turnover for the entire fiscal year. |
The accompanying notes are an integral part of these financial statements.
16
Hardman Johnston International Growth Fund
| FINANCIAL HIGHLIGHTS |
For a capital share outstanding throughout each period
Retail Shares
| Year | Year | Year | Year | September 17, | ||||||||||||||||
| Ended | Ended | Ended | Ended | 2018* through | ||||||||||||||||
| October 31, | October 31, | October 31, | October 31, | October 31, | ||||||||||||||||
| 2022 | 2021 | 2020 | 2019 | 2018 | ||||||||||||||||
| Net Asset Value – | ||||||||||||||||||||
| Beginning of Period | $ | 15.38 | $ | 11.79 | $ | 10.20 | $ | 9.15 | $ | 10.32 | ||||||||||
| Income from | ||||||||||||||||||||
| Investment Operations: | ||||||||||||||||||||
| Net investment | ||||||||||||||||||||
income/(loss)1 | (0.06 | ) | (0.11 | ) | (0.08 | ) | 0.07 | (0.01 | ) | |||||||||||
| Net realized and unrealized | ||||||||||||||||||||
| gain (loss) on investments | (5.95 | ) | 3.70 | 1.67 | 0.98 | (1.16 | ) | |||||||||||||
| Total from | ||||||||||||||||||||
| investment operations | (6.01 | ) | 3.59 | 1.59 | 1.05 | (1.17 | ) | |||||||||||||
| Less Distributions: | ||||||||||||||||||||
| Distributions from | ||||||||||||||||||||
| net realized gains | (0.15 | ) | — | — | — | — | ||||||||||||||
| Total distributions | (0.15 | ) | — | — | — | — | ||||||||||||||
| Net Asset Value – | ||||||||||||||||||||
| End of Period | $ | 9.22 | $ | 15.38 | $ | 11.79 | $ | 10.20 | $ | 9.15 | ||||||||||
| Total Return | (39.42 | )% | 30.45 | % | 15.59 | % | 11.48 | % | (11.34)%^ | |||||||||||
| Ratios and Supplemental Data: | ||||||||||||||||||||
| Net assets, end of | ||||||||||||||||||||
| period (thousands) | $ | 581 | $ | 761 | $ | 327 | $ | 2,479 | $ | 2,390 | ||||||||||
| Ratio of operating expenses | ||||||||||||||||||||
| to average net assets: | ||||||||||||||||||||
| Before reimbursements | 1.99 | % | 2.18 | % | 7.30 | % | 4.88 | % | 4.43 | %+ | ||||||||||
| After reimbursements | 1.25 | % | 1.25 | % | 1.25 | % | 1.25 | % | 1.25 | %+ | ||||||||||
| Ratio of net investment income | ||||||||||||||||||||
| (loss) to average net assets: | ||||||||||||||||||||
| Before reimbursements | (1.27 | )% | (1.68 | )% | (6.84 | )% | (2.87 | )% | (3.99 | )%+ | ||||||||||
| After reimbursements | (0.53 | )% | (0.75 | )% | (0.79 | )% | 0.76 | % | (0.81 | )%+ | ||||||||||
Portfolio turnover rate2 | 32 | % | 46 | % | 224 | % | 81 | % | 53%^ | |||||||||||
| * | Commencement of operations for Retail Shares was September 17, 2018. |
| + | Annualized |
| ^ | Not Annualized |
1 | The net investment income/(loss) per share was calculated using the average shares outstanding method. |
2 | Portfolio turnover was calculated on the basis of the Fund as a whole. The rate presented represents portfolio turnover for the entire fiscal year. |
The accompanying notes are an integral part of these financial statements.
17
Hardman Johnston International Growth Fund
| NOTES TO FINANCIAL STATEMENTS |
| at October 31, 2022 |
NOTE 1 – ORGANIZATION
The Hardman Johnston International Growth Fund (the “Fund”) is a series of Manager Directed Portfolios (the “Trust”). The Trust is registered under the Investment Company Act of 1940, as amended (the “1940 Act”), and was organized as a Delaware statutory trust on April 4, 2006. The Fund is an open-end investment management company and is a non-diversified series of the Trust. The Fund’s Institutional Shares commenced operations on February 14, 2018. The Fund’s Retail Shares commenced operations on September 17, 2018. Each class of shares differs principally in its respective distribution expenses. Each class of shares has identical rights to earnings, assets and voting privileges, except for class-specific expenses and exclusive rights to vote on matters affecting only individual classes. Dakota Investments LLC (the “Advisor”) serves as the investment advisor to the Fund. Hardman Johnston Global Advisors LLC (the “Sub-Advisor”) serves as the sub-advisor to the Fund. Redwood Investments, LLC (“Redwood”) served as the Fund’s sub-advisor from the Fund’s inception to December 31, 2019. Effective January 1, 2020, Hardman Johnston replaced Redwood as the Fund’s sub-advisor. As an investment company, the Fund follows the investment company accounting and reporting guidance of the Financial Accounting Standards Board (“FASB”) Accounting Standard Codification Topic 946 Financial Services – Investment Companies. The investment objective of the Fund is to seek long term capital appreciation.
NOTE 2 – SIGNIFICANT ACCOUNTING POLICIES
The following is a summary of significant accounting policies consistently followed by the Fund. These policies are in conformity with U.S. generally accepted accounting principles (“GAAP”).
| A. | Security Valuation: All investments in securities are recorded at their estimated fair value, as described in Note 3. | |
| B. | Federal Income Taxes: It is the Fund’s policy to comply with the requirements of Subchapter M of the Internal Revenue Code applicable to regulated investment companies and to distribute substantially all of its taxable income to its shareholders. Therefore, no federal income or excise tax provisions are required. | |
| The Fund recognizes the tax benefits of uncertain tax positions only where the position is “more likely than not” to be sustained assuming examination by tax authorities. Management has analyzed the Fund’s tax positions, and has concluded that no liability for unrecognized tax benefits should be recorded related to uncertain tax positions to be taken or expected to be taken on a tax return. The tax returns for the Fund for the prior three fiscal years are open for examination. The Fund identifies its major tax jurisdictions as U.S. Federal and the state of Delaware. | ||
| C. | Securities Transactions, Income and Distributions: Securities transactions are accounted for on the trade date. Realized gains and losses on securities sold are determined on the basis of identified cost. Interest income is recorded on an |
18
Hardman Johnston International Growth Fund
| NOTES TO FINANCIAL STATEMENTS (Continued) |
| at October 31, 2022 |
| accrual basis. Dividend income and distributions to shareholders are recorded on the ex-dividend date. Discounts and premiums on fixed income securities are amortized using the effective interest method. Withholding taxes on foreign dividends have been provided for in accordance with the Fund’s understanding of the applicable country’s tax rules and rates. | ||
| The Fund distributes substantially all of its net investment income, if any, and net realized capital gains, if any, annually. Distributions from net realized gains for book purposes may include short-term capital gains. All short-term capital gains are included in ordinary income for tax purposes. The amount of dividends and distributions to shareholders from net investment income and net realized capital gains is determined in accordance with federal income tax regulations, which differ from GAAP. To the extent these book/tax differences are permanent, such amounts are reclassified within the capital accounts based on their federal tax treatment. | ||
| The Fund is charged for those expenses that are directly attributable to it, such as investment advisory, custody and transfer agent fees. Expenses that are not attributable to a Fund are typically allocated among the funds in the Trust proportionately based on allocation methods approved by the Board of Trustees (the “Board”). Common expenses of the Trust are typically allocated among the funds in the Trust based on a fund’s respective net assets, or by other equitable means. | ||
| D. | Use of Estimates: The preparation of financial statements in conformity with GAAP requires management to make estimates and assumptions that affect the reported amounts of assets and liabilities at the date of the financial statements and the reported amounts of increases and decreases in net assets during the reporting period. Actual results could differ from those estimates. | |
| E. | Redemption Fees: The Fund does not charge redemption fees to shareholders. | |
| F. | Reclassification of Capital Accounts: GAAP requires that certain components of net assets relating to permanent differences be reclassified between financial and tax reporting. These reclassifications have no effect on net assets or net asset value per share. | |
| G. | Foreign Currency: Values of investments denominated in foreign currencies are converted into U.S. dollars using the spot market rate of exchange at the time of valuation. Purchases and sales of investments and income are translated into U.S. dollars using the spot market rate of exchange prevailing on the respective dates of such transactions. The Fund does not isolate the portion of the results of operations resulting from fluctuations in foreign exchange rates on investments from fluctuations resulting from changes in the market prices of securities held. Such fluctuations are included with the net realized and unrealized gain/loss on investments. Foreign investments present additional risks due to currency fluctuations, economic and political factors, lower liquidity, government regulations, differences in accounting standards, and other factors. |
19
Hardman Johnston International Growth Fund
| NOTES TO FINANCIAL STATEMENTS (Continued) |
| at October 31, 2022 |
| H. | Events Subsequent to the Fiscal Year End: In preparing the financial statements as of October 31, 2022, and through the date the financial statements were available to be issued, management considered the impact of subsequent events for potential recognition or disclosure in the financial statements and concluded that no additional disclosures are necessary. |
NOTE 3 – SECURITIES VALUATION
The Fund has adopted authoritative fair value accounting standards which establish an authoritative definition of fair value and set out a hierarchy for measuring fair value. These standards require additional disclosures about the various inputs and valuation techniques used to develop the measurements of fair value, a discussion of changes in valuation techniques and related inputs during the period, and expanded disclosure of valuation levels for major security types. These inputs are summarized in the three broad levels listed below:
| Level 1 – | Unadjusted, quoted prices in active markets for identical assets or liabilities that the Fund has the ability to access at the date of measurement. | |
| Level 2 – | Other significant observable inputs (including, but not limited to, quoted prices in active markets for similar instruments, quoted prices in markets that are not active for identical or similar instruments, and model-derived valuations in which all significant inputs and significant value drivers are observable in active markets, such as interest rates, prepayment speeds, credit risk curves, default rates, and similar data). | |
| Level 3 – | Significant unobservable inputs for the asset or liability, to the extent relevant observable inputs are not available, representing the Fund’s own assumptions about the assumptions a market participant would use in valuing the asset or liability, and would be based on the best information available. |
Following is a description of the valuation techniques applied to the Fund’s major categories of assets and liabilities measured at fair value on a recurring basis.
Equity Securities: Equity securities, including common stocks, preferred stocks, foreign-issued common stocks, exchange-traded funds, closed-end mutual funds and real estate investment trusts (REITs), that are primarily traded on a national securities exchange shall be valued at the last sale price on the exchange on which they are primarily traded on the day of valuation or, if there has been no sale on such day, at the mean between the bid and asked prices. Securities primarily traded in the NASDAQ Global Market System for which market quotations are readily available shall be valued using the NASDAQ Official Closing Price (“NOCP”). If the NOCP is not available, such securities shall be valued at the last sale price on the day of valuation, or if there has been no sale on such day, at the mean between the bid and asked prices. Over-the-counter securities that are not traded on a listed exchange are valued at the last sale price in the over-the-counter
20
Hardman Johnston International Growth Fund
| NOTES TO FINANCIAL STATEMENTS (Continued) |
| at October 31, 2022 |
market. Over-the-counter securities which are not traded in the NASDAQ Global Market System shall be valued at the mean between the bid and asked prices. To the extent these securities are actively traded and valuation adjustments are not applied, they are categorized in Level 1 of the fair value hierarchy. Securities traded on foreign exchanges generally are not valued at the same time the Fund calculates its net asset value (“NAV”) because most foreign markets close well before such time. The earlier close of most foreign markets gives rise to the possibility that significant events, including broad market moves, may have occurred in the interim. In certain circumstances, it may be determined that a security needs to be fair valued because it appears that the value of the security might have been materially affected by an event (a “Significant Event”) occurring after the close of the market in which the security is principally traded, but before the time the Fund calculates its NAV. A Significant Event may relate to a single issuer or to an entire market sector, or even occurrences not tied directly to the securities markets, such as natural disasters, armed conflicts, or significant government actions.
Registered Investment Companies: Investments in registered investment companies (e.g., mutual funds) are generally priced at the ending NAV provided by the applicable registered investment company’s service agent and will be classified in Level 1 of the fair value hierarchy.
Short-Term Debt Securities: Debt securities, including short-term debt instruments having a maturity of less than 60 days, are valued at the evaluated mean price supplied by an approved pricing service. Pricing services may use various valuation methodologies including matrix pricing and other analytical pricing models as well as market transactions and dealer quotations. In the absence of prices from a pricing service, the securities will be priced in accordance with the procedures adopted by the Board. Short-term securities are generally classified in Level 1 or Level 2 of the fair market hierarchy depending on the inputs used and market activity levels for specific securities.
In the absence of prices from a pricing service or in the event that market quotations are not readily available, fair value will be determined under the Fund’s valuation procedures adopted pursuant to Rule 2a-5. Pursuant to those procedures, the Board has appointed the Advisor as the Fund’s valuation designee (the “Valuation Designee”) to perform all fair valuations of the Fund’s portfolio investments, subject to the Board’s oversight. As the Valuation Designee, the Advisor has established procedures for its fair valuation of the Fund’s portfolio investments. These procedures address, among other things, determining when market quotations are not readily available or reliable and the methodologies to be used for determining the fair value of investments, as well as the use and oversight of third-party pricing services for fair valuation.
Depending on the relative significance of the valuation inputs, fair valued securities may be classified in either level 2 or level 3 of the fair value hierarchy.
The fair valuation of foreign securities may be determined with the assistance of a pricing service using correlations between the movement of prices of such securities and indices of domestic securities and other appropriate indicators, such as closing market
21
Hardman Johnston International Growth Fund
| NOTES TO FINANCIAL STATEMENTS (Continued) |
| at October 31, 2022 |
prices of relevant American Depositary Receipts or futures contracts. The Fund uses ICE Data Services (“ICE”) as a third-party fair valuation vendor. ICE provides a fair value for foreign securities in the Fund based on certain factors and methodologies applied by ICE in the event that there is a movement in the U.S. markets that exceeds a specific threshold established by the Valuation Committee. The effect of using fair value pricing is that the Fund’s NAV will reflect the affected portfolio securities’ values as determined by the Board or its designee instead of being determined by the market. Using a fair value pricing methodology to price a foreign security may result in a value that is different from the foreign security’s most recent closing price and from the prices used by other investment companies to calculate their NAVs and are generally classified in Level 2 of the fair valuation hierarchy. Because the Fund may invest in foreign securities, the value of the Fund’s portfolio securities may change on days when you will not be able to purchase or redeem your shares.
The inputs or methodology used for valuing securities are not an indication of the risk associated with investing in those securities. The following is a summary of the fair valuation hierarchy of the Fund’s securities as of October 31, 2022:
| Common Stocks | Level 1 | Level 2 | Level 3 | Total | ||||||||||||
Communication Services | $ | 528,396 | $ | 2,476,653 | $ | — | $ | 3,005,049 | ||||||||
Consumer Discretionary | 3,272,654 | 6,937,595 | — | 10,210,249 | ||||||||||||
Financials | 1,892,354 | 2,114,580 | — | 4,006,934 | ||||||||||||
Health Care | 1,035,801 | 7,266,802 | — | 8,302,603 | ||||||||||||
Industrials | — | 10,920,901 | — | 10,920,901 | ||||||||||||
Information Technology | 1,602,986 | 7,082,094 | — | 8,685,080 | ||||||||||||
| Total Common Stocks | 8,332,191 | 36,798,625 | — | 45,130,816 | ||||||||||||
| Short-Term Investments | 977,689 | — | — | 977,689 | ||||||||||||
| Total Investments in Securities | $ | 9,309,880 | $ | 36,798,625 | $ | — | $ | 46,108,505 | ||||||||
NOTE 4 – INVESTMENT ADVISORY FEE AND OTHER TRANSACTIONS WITH AFFILIATES
For the fiscal year ended October 31, 2022, the Advisor provided the Fund with investment management services under an Investment Advisory Agreement. The Advisor furnishes all investment advice, office space, and facilities, and provides most of the personnel needed by the Fund. As compensation for its services, the Advisor is entitled to a monthly fee at an annual rate of 1.00% of the average daily net assets of the Fund. For the fiscal year ended October 31, 2022, the Fund incurred $527,192 in advisory fees. The Advisor has hired Hardman Johnston Global Advisors LLC as a sub-advisor to the Fund. The Advisor pays the Sub-Advisor fee for the Fund from its own assets and these fees are not an additional expense of the Fund.
The Fund is responsible for its own operating expenses. The Advisor has contractually agreed to waive its management fees and/or absorb expenses of the Fund to ensure that
22
Hardman Johnston International Growth Fund
| NOTES TO FINANCIAL STATEMENTS (Continued) |
| at October 31, 2022 |
the total annual operating expenses [excluding Acquired Fund Fees and Expenses, taxes, brokerage commissions, interest and extraordinary expenses (collectively, “Excludable Expenses”)] do not exceed the following amounts of the average daily net assets for each class of shares:
Hardman Johnston International Growth Fund
| Institutional Shares | 1.00 | % | ||||
| Retail Shares | 1.25 | % |
For the fiscal year ended October 31, 2022, the Advisor reduced its fees and absorbed Fund expenses in the amount of $387,648 for the Fund. The waivers and reimbursements will remain in effect through February 28, 2024 unless terminated sooner by, or with the consent of, the Board.
The Advisor may request recoupment of previously waived fees and paid expenses in any subsequent month in the three-year period from the date of the management fee reduction and expense payment if the aggregate amount actually paid by the Fund toward the operating expenses for such fiscal year (taking into account the reimbursement) will not cause the Fund to exceed the lesser of: (1) the expense limitation in place at the time of the management fee reduction and expense payment; or (2) the expense limitation in place at the time of the reimbursement. Any such reimbursement is also contingent upon Board of Trustees review and approval at the time the reimbursement is made. Such reimbursement may not be paid prior to the Fund’s payment of current ordinary operating expenses. Cumulative expenses subject to recapture pursuant to the aforementioned conditions expire as follows:
10/31/2023 | 10/31/2024 | 10/31/2025 | Total | |
| $332,022 | $406,289 | $387,648 | $1,125,959 |
U.S. Bancorp Fund Services, LLC, doing business as U.S. Bank Global Fund Services, LLC (“Fund Services” or the “Administrator”) acts as the Fund’s Administrator under an Administration Agreement. The Administrator prepares various federal and state regulatory filings, reports and returns for the Fund; prepares reports and materials to be supplied to the Trustees; monitors the activities of the Fund’s custodian, transfer agent and accountants; coordinates the preparation and payment of the Fund’s expenses and reviews the Fund’s expense accruals. Fund Services also serves as the fund accountant and transfer agent to the Fund. Vigilant Compliance, LLC serves as the Chief Compliance Officer to the Fund. U.S. Bank N.A., an affiliate of Fund Services, serves as the Fund’s custodian. For the fiscal year ended October 31, 2022, the Fund incurred the following expenses for administration, fund accounting, transfer agency and custody fees:
Administration & fund accounting | $ | 130,157 | |||
Custody | $ | 42,724 | |||
Transfer agency | $ | 67,225 |
23
Hardman Johnston International Growth Fund
| NOTES TO FINANCIAL STATEMENTS (Continued) |
| at October 31, 2022 |
At October 31, 2022, the Fund had payables due to Fund Services for administration, fund accounting and transfer agency fees and to U.S. Bank N.A. for custody fees in the following amounts:
Administration & fund accounting | $ | 44,425 | |||
Custody | $ | 7,348 | |||
Transfer agency | $ | 23,394 |
Vigilant Distributors, LLC (the “Distributor”) acts as the Fund’s principal underwriter in a continuous public offering of the Fund’s shares.
Certain officers of the Fund are employees of the Administrator and are not paid any fees by the Fund for serving in such capacities.
NOTE 5 – DISTRIBUTION AGREEMENT AND PLAN
The Fund has adopted a Distribution Plan pursuant to Rule 12b-1 (the “Plan”). The Plan permits the Fund to pay for distribution and related expenses at an annual rate of up to 0.25% of the average daily net assets of the Fund’s Retail Shares. The expenses covered by the Plan may include costs in connection with the promotion and distribution of shares and the provision of personal services to shareholders, including, but not necessarily limited to, advertising, compensation to underwriters, dealers and selling personnel, the printing and mailing of prospectuses to other than current Fund shareholders, and the printing and mailing of sales literature. Payments made pursuant to the Plan will represent compensation for distribution and service activities, not reimbursements for specific expenses incurred. For the fiscal year ended October 31, 2022, the Hardman Johnston International Growth Fund incurred distribution expenses on its Retail Shares of $1,562.
NOTE 6 – SECURITIES TRANSACTIONS
For the fiscal year ended October 31, 2022, the cost of purchases and the proceeds from sales of securities, excluding short-term securities, were as follows:
Purchases | Sales | ||
| International Growth Fund | $27,257,700 | $15,991,606 |
There were no purchases or sales of long-term U.S. Government securities.
24
Hardman Johnston International Growth Fund
| NOTES TO FINANCIAL STATEMENTS (Continued) |
| at October 31, 2022 |
NOTE 7 – INCOME TAXES AND DISTRIBUTIONS TO SHAREHOLDERS
As of October 31, 2022, the components of accumulated earnings/(losses) on a tax basis were as follows:
| Cost of investments(a) | $ | 62,714,158 | |||
| Gross unrealized appreciation | 2,076,234 | ||||
| Gross unrealized depreciation | (18,681,887 | ) | |||
| Net unrealized depreciation | (16,605,653 | ) | |||
| Undistributed ordinary income | — | ||||
| Undistributed long-term capital gain | — | ||||
| Total distributable earnings | — | ||||
| Other accumulated gains/(losses) | (3,026,055 | ) | |||
| Total accumulated earnings/(losses) | $ | (19,631,708 | ) |
(a) | The difference between the book basis and tax basis net unrealized appreciation and cost is attributable primarily to wash sales. |
As of October 31, 2022, the Fund long-term tax basis loss carryforwards in the amount of 893,139 and short-term tax basis loss carryforwards in the amount of 2,012,544.
At October 31, 2022, the Fund deferred, on a tax basis, post-October losses of:
Capital | Ordinary Late Year Loss | ||
| $— | $117,723 |
The tax character of distributions paid during the year ended October 31, 2022, and the year ended October 31, 2021, was as follows:
| Year Ended | Year Ended | ||||||||
| October 31, 2022 | October 31, 2021 | ||||||||
| Ordinary income | $ | — | $ | — | |||||
| Long-term capital gains | 686,304 | — | |||||||
$ | 686,304 | $ | — | ||||||
For the fiscal year ended October 31, 2022, the effect of permanent “book/tax” reclassifications resulted in increases and decreases to components of the Funds’ net assets as follows:
| Total Distributable | Paid-In | ||
Earnings/(Loss) | Capital | ||
| $335,204 | $(335,204) |
25
Hardman Johnston International Growth Fund
| NOTES TO FINANCIAL STATEMENTS (Continued) |
| at October 31, 2022 |
NOTE 8 – PRINCIPAL RISKS
Below are summaries of some, but not all, of the principal risks of investing in the Fund, each of which could adversely affect the Fund’s NAV, market price, yield, and total return. Further information about investment risks is available in the Fund’s prospectus and Statement of Additional Information.
Equity Market Risk: Equity securities are susceptible to general stock market fluctuations due to economic, market, political and issuer-specific considerations and to potential volatile increases and decreases in value as market confidence in and perceptions of their issuers change.
Foreign Securities and Currency Risk: Foreign securities are subject to risks relating to political, social and economic developments abroad and differences between U.S. and foreign regulatory requirements and market practices. Those risks are increased for investments in emerging markets. Securities that are denominated in foreign currencies are subject to further risk that the value of the foreign currency will fall in relation to the U.S. dollar and/or will be affected by volatile currency markets or actions of U.S. and foreign governments or central banks. Income earned on foreign securities may be subject to foreign withholding taxes.
Management Risk: The ability of the Fund to meet its investment objective is directly related to the Advisor’s and Sub-Advisor’s management of the Fund. The value of your investment in the Fund may vary with the effectiveness of the Advisor’s research, analysis and asset allocation among portfolio securities. If the investment strategies do not produce the expected results, the value of your investment could be diminished or even lost entirely.
General Market Risk; Recent Market Events: The value of the Fund’s shares will fluctuate based on the performance of the Fund’s investments and other factors affecting the securities markets generally. Certain investments selected for the Fund’s portfolio may be worth less than the price originally paid for them, or less than they were worth at an earlier time. The value of the Fund’s investments may go up or down, sometimes dramatically and unpredictably, based on current market conditions, such as real or perceived adverse political or economic conditions, inflation, changes in interest rates, lack of liquidity in the fixed income markets or adverse investor sentiment.
U.S. and international markets have experienced volatility in recent months and years due to a number of economic, political and global macro factors, including the impact of the coronavirus (COVID-19) global pandemic, which has resulted in a public health crisis, business interruptions, growth concerns in the U.S. and overseas, layoffs, rising unemployment claims, changed travel and social behaviors and reduced consumer spending. The effects of COVID-19 may lead to a substantial economic downturn or recession in the U.S. and global economies, the recovery from which is uncertain and may last for an extended period of time.
New Fund Risk: There can be no assurance that the Fund will grow to or maintain an economically viable size, in which case the Board may determine to liquidate the Fund.
26
Hardman Johnston International Growth Fund
| NOTES TO FINANCIAL STATEMENTS (Continued) |
| at October 31, 2022 |
Liquidation of the Fund can be initiated without shareholder approval by the Board if it determines that liquidation is in the best interest of shareholders. As a result, the timing of the Fund’s liquidation may not be favorable.
Emerging and Frontier Markets Risk: Countries in emerging markets are generally more volatile and can have relatively unstable governments, social and legal systems that do not protect shareholders, economies based on only a few industries, and securities markets that trade a small number of issues. Frontier market countries generally have smaller economies and even less developed capital markets than emerging markets. As a result, the risks of investing in emerging markets are magnified in frontier markets, and include potential for extreme price volatility and illiquidity; government ownership or control of parts of private sector and of certain companies; trade barriers, exchange controls, managed adjustments in relative currency values and other protectionist measures; and relatively new and unsettled securities laws.
Large Capitalization Risk: Larger, more established companies may be unable to respond quickly to new competitive challenges such as changes in technology and consumer tastes. Larger companies also may not be able to attain the high growth rates of successful smaller companies.
Medium and Small Capitalization Risk: Investing in medium and small capitalization companies may involve special risks because those companies may have narrower product lines, more limited financial resources, fewer experienced managers, dependence on a few key employees, and a more limited trading market for their stocks, as compared with larger companies. Securities of medium and smaller capitalization issuers may be subject to greater price volatility and may decline more significantly in market downturns than securities of larger companies.
NOTE 9 – LINE OF CREDIT
As of October 31, 2022, the Fund had an uncommitted line of credit (the “Line”) with U.S. Bank N.A. The Line is for liquidity in connection with shareholder redemptions and portfolio timing differences. Borrowings under the Line must be secured by Fund assets and the Line has a maximum withdrawal capacity of the lesser of 10% of the net market value of the sum of the collateral pledged to U.S. Bank N.A at the time of any new borrowing for any period after the new borrowing or $5,000,000. Amounts outstanding under the Line can exceed 10% (up to 15%) of the net market value of collateral pledged if such excess is not due to a new borrowing request, provided that any subsequent borrowing request cannot result in amounts outstanding to exceed the original 10% threshold. The Line has a maturity date of June 1, 2023 and is reviewed annually by the Board of Trustees. During the year ended October 31, 2022, the Fund did not engage in any borrowing and therefor did not have an outstanding loan balance.
27
Hardman Johnston International Growth Fund
| NOTES TO FINANCIAL STATEMENTS (Continued) |
| at October 31, 2022 |
NOTE 10 – GUARANTEES AND INDEMNIFICATIONS
In the normal course of business, the Fund enters into contracts that contain a variety of representations and warranties and which provide general indemnifications. The Fund’s maximum exposure under these arrangements is unknown, as this would involve future claims that may be made against the Fund that have not yet occurred. However, based on experience, the Fund expects the risk of loss to be remote.
NOTE 11 – CONTROL OWNERSHIP
The beneficial ownership, either directly or indirectly, of more than 25% of the voting securities of a fund creates a presumption of control of the fund, under Section 2(a)(9) of the 1940 Act. As of October 31, 2022, National Financial held 27% of the outstanding shares of the Fund, Charles Schwab & Co. Inc. held 49% of the outstanding shares of the Fund and TD Ameritrade, Inc. held 16% of the outstanding shares of the Fund. The Fund has no knowledge as to whether all or any portion of the shares owned of record by TD Ameritrade Inc., Charles Schwab & Co. Inc. or National Financial Services are also beneficially owned.
28
Hardman Johnston International Growth Fund
| REPORT OF INDEPENDENT REGISTERED PUBLIC ACCOUNTING FIRM |
To the Board of Trustees of Manager Directed Portfolios
and the Shareholders of Hardman Johnston International Growth Fund
Opinion on the Financial Statements
We have audited the accompanying statement of assets and liabilities of Hardman Johnston International Growth Fund, a series of shares of beneficial interest in Manager Directed Portfolios (the “Fund”), including the schedule of investments, as of October 31, 2022, and the related statements of operations for the year then ended, the statements of changes in net assets for each of the years in the two-year period then ended, the financial highlights for each of the years in the four-year period then ended and for the period from commencement of operations (February 14, 2018 for Institutional Shares and September 17, 2018 for Retail Shares) to October 31, 2018, and the related notes (collectively referred to as the “financial statements”). In our opinion, the financial statements present fairly, in all material respects, the financial position of the Fund as of October 31, 2022, and the results of its operations for the year then ended, the changes in its net assets for each of the years in the two-year period then ended and its financial highlights for each of the period presented above, in conformity with accounting principles generally accepted in the United States of America.
Basis for Opinion
These financial statements are the responsibility of the Fund’s management. Our responsibility is to express an opinion on the Fund’s financial statements based on our audits. We are a public accounting firm registered with the Public Company Accounting Oversight Board (United States) (“PCAOB”) and are required to be independent with respect to the Funds in accordance with the U.S. federal securities law and the applicable rules and regulations of the Securities and Exchange Commission and the PCAOB.
We conducted our audits in accordance with the standards of the PCAOB. Those standards require that we plan and perform the audits to obtain reasonable assurance about whether the financial statements are free of material misstatement, whether due to error or fraud. The Fund is not required to have, nor were we engaged to perform, an audit of its internal control over financial reporting. As part of our audits we are required to obtain an understanding of internal control over financial reporting but not for the purpose of expressing an opinion on the effectiveness of the Fund’s internal control over financial reporting. Accordingly, we express no such opinion.
Our audits included performing procedures to assess the risk of material misstatement of the financial statements, whether due to error or fraud, and performing procedures that respond to those risks. Such procedures included examining, on a test basis, evidence regarding the amounts and disclosures in the financial statements. Our procedures included confirmation of securities owned as of October 31, 2022 by correspondence with the custodian, brokers, or by other appropriate auditing procedures where replies from brokers were not received. Our audits also included evaluating the accounting principles used and significant estimates made by management, as well as evaluating the overall presentation of the financial statements. We believe that our audits provide a reasonable basis for our opinion.

BBD, LLP
We have served as the auditor of one or more of the Funds in the Manager Directed Portfolios since 2007.
Philadelphia, Pennsylvania
December 29, 2022
29
Hardman Johnston International Growth Fund
| EXPENSE EXAMPLE |
| October 31, 2022 (Unaudited) |
As a shareholder of the Fund, you incur two types of costs: (1) transaction costs including sales charges (loads) and redemption fees, if applicable; and (2) ongoing costs, including management fees; distribution and/or service (12b-1 fees); and other Fund expenses. This Example is intended to help you understand your ongoing costs (in dollars) of investing in the Fund and to compare these costs with the ongoing costs of investing in other mutual funds.
The Example is based on an investment of $1,000 invested at the beginning of the period indicated and held for the entire period from May 1, 2022, to October 31, 2022 for the Institutional and Retail Shares.
Actual Expenses
The information in the table under the heading “Actual” provides information about actual account values and actual expenses. You may use the information in these columns together with the amount you invested, to estimate the expenses that you paid over the period. Simply divide your account value by $1,000 (for example, an $8,600 account value divided by $1,000 = 8.6), then multiply the result by the number in the row entitled “Expenses Paid During Period” to estimate the expenses you paid on your account during this period. There are some account fees that are charged to certain types of accounts, such as Individual Retirement Accounts (generally, a $15 fee is charged to the account annually) that would increase the amount of expenses paid on your account. The example below does not include portfolio trading commissions and related expenses and other extraordinary expenses as determined under generally accepted accounting principles.
Hypothetical Example for Comparison Purposes
The information in the table under the heading “Hypothetical (5% return before expenses)” provides information about hypothetical account values and hypothetical expenses based on the Fund’s actual expense ratio and assumed rate of return of 5% per year before expenses, which is not the Fund’s actual return. The hypothetical account values and expenses may not be used to estimate the actual ending account balance or expenses you paid for the period. You may use this information to compare the ongoing costs of investing in the Fund and other funds. To do so, compare this 5% hypothetical example with the 5% hypothetical examples that appear in the shareholder reports of the other funds. As noted above, there are some account fees that are charged to certain types of accounts that would increase the amount of expense paid on your account.
Please note that the expenses shown in the table are meant to highlight your ongoing costs only and do not reflect any transaction costs, such as sales charges (loads), redemption fees, or exchange fees. Therefore, the information under the heading “Hypothetical (5% return before expenses)” is useful in comparing ongoing costs only, and will not help you determine the relative total costs of owning different funds. In addition, if these transactional costs were included, your costs would have been higher.
30
Hardman Johnston International Growth Fund
| EXPENSE EXAMPLE (Continued) |
| October 31, 2022 (Unaudited) |
| Beginning | Ending | Expenses Paid | |
| Account Value | Account Value | During Period(1) | |
5/1/22 | 10/31/22 | 5/1/22 – 10/31/22 | |
| Actual | |||
| Institutional Shares | $1,000.00 | $ 846.10 | $4.65 |
| Retail Shares | $1,000.00 | $ 844.30 | $5.81 |
| Hypothetical (5% return | |||
| before expenses) | |||
| Institutional Shares | $1,000.00 | $1,020.16 | $5.09 |
| Retail Shares | $1,000.00 | $1,018.90 | $6.36 |
(1) | Expenses are equal to the Institutional and Retail Shares’ annualized expense ratio of 1.00% and 1.25%, respectively, multiplied by the average account value over the period, multiplied by 184/365 (to reflect the period). |
31
Hardman Johnston International Growth Fund
| NOTICE TO SHAREHOLDERS |
| at October 31, 2022 (Unaudited) |
How to Obtain a Copy of the Fund’s Proxy Voting Policies
A description of the policies and procedures that the Fund uses to determine how to vote proxies relating to portfolio securities is available without charge, upon request, by calling 1-833-627-6668 or on the U.S. Securities and Exchange Commission’s (“SEC”) website at http://www.sec.gov.
How to Obtain a Copy of the Fund’s Proxy Voting Records for the most recent 12-Month Period Ended June 30
Information regarding how the Fund voted proxies relating to portfolio securities during the most recent 12-month period ended June 30 is available no later than August 31 without charge, upon request, by 1-833-627-6668. Furthermore, you can obtain the Fund’s proxy voting records on the SEC’s website at http://www.sec.gov.
Quarterly Filings on Form N-PORT
The Fund files its complete schedule of portfolio holdings with the SEC for the first and third quarters of each fiscal year on Part F of Form N-PORT. The Fund’s Part F of Form N-PORT is available on the SEC’s website at http://www.sec.gov. Information included in the Fund’s Part F of Form N-PORT is also available, upon request, by calling 1-833-627-6668.
Qualified Dividend Income/Dividends Received Deduction
For the fiscal year ended October 31, 2022 certain dividends paid by the Funds may be subject to a maximum tax rate of 15%, as provided for by the Jobs and Growth Tax Relief Reconciliation Act of 2003. The percentage of dividends declared from ordinary income designated as qualified dividend income was as follows:
| Hardman Johnston International Growth Fund | 0.00 | % |
For corporate shareholders, the percent of ordinary income distributions qualifying for the corporate dividends received deduction for the fiscal year ended October 31, 2022 was as follows:
| Hardman Johnston International Growth Fund | 0.00 | % |
32
Hardman Johnston International Growth Fund
| STATEMENT REGARDING LIQUIDITY RISK MANAGEMENT PROGRAM |
In accordance with Rule 22e-4 under the Investment Company Act of 1940, as amended, the Fund, a series of Manager Directed Portfolios (the “Trust”), has adopted and implemented a liquidity risk management program tailored specifically to the Fund (the “Program”). The Program seeks to promote effective liquidity risk management for the Fund and to protect Fund shareholders from dilution of their interests. The Board has designated the Fund’s investment adviser to serve as the administrator of the Program (the “Program Administrator”). Personnel of the Fund’s investment adviser conduct the day-to-day operation of the Program pursuant to policies and procedures administered by the Program Administrator. The Program Administrator is required to provide a written annual report to the Board and the chief compliance officer of the Trust regarding the adequacy and effectiveness of the Program, including the operation of the Fund’s highly liquid investment minimum, and any material changes to the Program.
Under the Program, the Program Administrator manages the Fund’s liquidity risk, which is the risk that the Fund could not meet shareholder redemption requests without significant dilution of remaining shareholders’ interests in the Fund. The Program assesses liquidity risk under both normal and reasonably foreseeable stressed market conditions. This risk is managed by monitoring the degree of liquidity of the Fund’s investments, limiting the amount of the Fund’s illiquid investments, and utilizing various risk management tools and facilities available to the Fund for meeting shareholder redemptions, among other means. The Program Administrator’s process of determining the degree of liquidity of the Fund’s investments is supported by one or more third-party liquidity assessment vendors.
On November 10, 2021, the Board reviewed the Program Administrator’s assessment of the operation and effectiveness of the Program for the period June 1, 2020 through June 30, 2021 (the “Report”) and a memorandum regarding the Report prepared by the Trust’s chief compliance officer. The Report noted that there were no breaches of the Fund’s restriction on holding illiquid investments exceeding 15% of its net assets during the review period. The Report confirmed that the Fund’s investment strategy was appropriate for an open-end management investment company. The Report also indicated that no material changes had been made to the Program during the review period.
The Program Administrator determined that the Fund is reasonably likely to be able to meet redemption requests without adversely affecting non-redeeming Fund shareholders through significant dilution. The Program Administrator concluded that the during the review period, the Program was adequately designed and effectively operating to monitor the liquidity risk to the Fund, taking into account the size of the Fund, the type of business conducted, and other relevant factors.
33
Hardman Johnston International Growth Fund
| TRUSTEES AND OFFICERS |
| (Unaudited) |
The business and affairs of the Trust are managed under the oversight of the Board, subject to the laws of the State of Delaware and the Trust’s Agreement and Declaration of Trust. The Board, as of January 1, 2021, is currently comprised of four trustees who are not interested persons of the Trust within the meaning of the 1940 Act (the “Independent Trustees”). The Trustees are responsible for deciding matters of overall policy and overseeing the actions of the Trust’s service providers. The officers of the Trust conduct and supervise the Trust’s daily business operations.
| Number of | ||||
| Funds | Other | |||
| Position(s) Held | in Fund | Directorships | ||
| Name, | with the Trust | Complex | Held by Trustee | |
| Year of Birth | and Length of | Principal Occupation(s) | Overseen by | During the Past |
and Address(1) | Time Served(2) | During the Past Five Years | Trustee(3) | Five Years |
INDEPENDENT TRUSTEES | ||||
Gaylord B. Lyman | Trustee and Audit | Senior Portfolio Manager, | 10 | None |
(Born 1962) | Committee | Affinity Investment Advisors, | ||
Chairman, since | LLC, since 2017; Managing | |||
April 2015 | Director of Kohala Capital | |||
Partners, LLC (2011 – 2016). | ||||
Scott Craven Jones | Trustee since | Managing Director, Carne Global | 10 | Trustee, Madison |
(Born 1962) | July 2016 and | Financial Services (US) LLC | Funds, since 2019 | |
Lead Independent | (a provider of independent | (18 portfolios); | ||
Trustee since | governance and distribution | Trustee, XAI | ||
May 2017 | support for the asset management | Octagon Floating | ||
industry), since 2013; interim | Rate & Alternative | |||
Managing Director, Park Agency, | Income Term | |||
Inc., since 2020. | Trust, since 2017 | |||
(2 portfolios). |
34
Hardman Johnston International Growth Fund
| TRUSTEES AND OFFICERS (Continued) |
| (Unaudited) |
| Number of | ||||
| Funds | Other | |||
| Position(s) Held | in Fund | Directorships | ||
| Name, | with the Trust | Complex | Held by Trustee | |
| Year of Birth | and Length of | Principal Occupation(s) | Overseen by | During the Past |
and Address(1) | Time Served(2) | During the Past Five Years | Trustee(3) | Five Years |
Lawrence T. | Trustee since | Senior Vice President and Chief | 10 | None |
Greenberg | July 2016 | Legal Officer, The Motley Fool | ||
(Born 1963) | Holdings, Inc., since 1996; | |||
Venture Partner and General | ||||
Counsel, Motley Fool Ventures LP, | ||||
since 2018; Manager, Motley Fool | ||||
Wealth Management, LLC, | ||||
since 2013; Adjunct Professor, | ||||
Washington College of Law, | ||||
American University, since 2006; | ||||
General Counsel Motley Fool | ||||
Asset Management, LLC | ||||
(2008 – 2019). | ||||
James R. Schoenike | Trustee since | Distribution consultant since | 10 | None |
(Born 1959) | July 2016(4) | 2018, President and CEO, | ||
Board of Managers, Quasar | ||||
Distributors, LLC (2013 – 2018). |
| (1) | The address of each Trustee as it relates to the Trust’s business is c/o U.S. Bank Global Fund Services, 615 East Michigan Street, Milwaukee, WI 53202. |
| (2) | Each Trustee serves during the continued lifetime of the Trust until he dies, resigns, is declared bankrupt or incompetent by a court of competent jurisdiction, or is removed. |
| (3) | The Trust currently has ten active portfolios. |
| (4) | Prior to January 1, 2021, Mr. Schoenike was considered to be an “interested person” of the Fund by virtue of his previous position as President of Quasar Distributors, LLC. |
As of the date of this report, no Independent Trustee nor any of his immediate family members (i.e., spouse or dependent children) serves as an officer or director or is an employee of the Advisor, Sub-Advisor or Distributor, or any of their respective affiliates, nor is such person an officer, director or employee of any company controlled by or under common control with such entities.
35
Hardman Johnston International Growth Fund
| TRUSTEES AND OFFICERS (Continued) |
| (Unaudited) |
| Name | Position(s) Held with | |
| Year of Birth | Trust and Length | |
and Address | of Time Served(3) | Principal Occupation(s) During Past Five Years |
OFFICERS | ||
Scott M. Ostrowski(1) | President and Principal | Senior Vice President, Compliance and |
(Born 1980) | Executive Officer, | Administration, Fund Services, since 2006 |
since August 10, 2021 | ||
Ryan Frank(1) | Treasurer, and Principal | Vice President, Fund Services, since 2008 |
(Born 1985) | Financial Officer, | |
since August 17, 2022 | ||
Colton W. Scarmardo(1) | Assistant Treasurer, | Fund Administrator, Compliance and Administration, |
(Born 1997) | since May 11, 2021 | Fund Services, since 2019; Business Administration |
Student, 2015-2019, MBA obtained May 2022. | ||
Justin Dausch(2) | Chief Compliance | Director, Vigilant, since 2017; Compliance Associate, |
(Born 1989) | Officer and | HSBC (investment banking company), 2015 – 2017 |
Anti-Money Laundering | ||
Compliance Officer, | ||
since January 1, 2020 | ||
Alyssa M. Bernard(1) | Vice President and | Assistant Vice President, Compliance and |
(Born 1988) | Secretary, since | Administration, Fund Services, since 2018; Attorney, |
August 20, 2019(4) | Mutual Fund Disclosure, Waddell & Reed Financial, | |
Inc., 2017 – 2018; Attorney, Corporate Governance, | ||
American Century Companies, Inc., 2014 – 2017 | ||
Isabella K. Zoller(1) | Assistant Secretary, | Assistant Vice President, Fund Services, since 2021; |
(Born 1994) | since February 15, 2022 | Regulatory Administration Attorney, Fund Services, |
since 2019; Regulatory Administration Intern, Fund | ||
Services, 2018 – 2019; Law Student 2016 – 2019. |
| (1) | The mailing address of this officer is: 615 East Michigan Street, Milwaukee, Wisconsin 53202. |
| (2) | The mailing address of this officer is: 223 Wilmington West Chester Pike, Suite 216, Chadds Ford, Pennsylvania 19317. |
| (3) | Each officer is elected annually and serves until his or her successor has been duly elected and qualified. |
| (4) | Ms. Bernard has served as Vice President of the Trust, in addition to her other positions held with the Trust, since May 11, 2021. |
The Statement of Additional Information includes additional information about the Fund’s Trustees and Officers and is available, without charge, upon request by calling 1-833-627-6668.
36
Hardman Johnston International Growth Fund
| NOTICE OF PRIVACY POLICY & PRACTICES |
Protecting the privacy of Fund shareholders is important to us. The following is a description of the practices and policies through which we protect the privacy and security of your non-public personal information.
What Information We Collect
We collect and maintain information about you so that we can open and maintain your account in the Fund and provide various services to you. We collect non-public personal information about you from the following sources:
| • | information we receive about you on applications or other forms; | |
| • | information you give us orally; and | |
| • | information about your transactions with us or others. |
The types of non public personal information we collect and share can include:
| • | social security number; | |
| • | account balances; | |
| • | account transactions; | |
| • | transaction history; | |
| • | wire transfer instructions; and | |
| • | checking account information. |
What Information We Disclose
We do not disclose any non-public personal information about shareholders or former shareholders of the Fund without the shareholder’s authorization, except as permitted by law or in response to inquiries from governmental authorities. We may share information with affiliated parties and unaffiliated third parties with whom we have contracts for servicing the Fund. We will provide unaffiliated third parties with only the information necessary to carry out their assigned responsibility.
How We Protect Your Information
All shareholder records will be disposed of in accordance with applicable law. We maintain physical, electronic and procedural safeguards to protect your non-public personal information and require third parties to treat your non-public personal information with the same high degree of confidentiality.
In the event that you hold shares of the Fund through a financial intermediary, including, but not limited to, a broker-dealer, bank or trust company, the privacy policy of your financial intermediary would govern how your non-public personal information would be shared with unaffiliated third parties.
If you have any questions or concerns regarding this notice or our Privacy Policy, please contact us at 1-833-627-6668.
37
(This Page Intentionally Left Blank.)
Investment Advisor
Dakota Investments LLC
925 West Lancaster Avenue, Suite 220
Bryn Mawr, PA 19010
Investment Sub-Advisor
Hardman Johnston Global Advisors LLC
300 Atlantic Street, Suite 601
Stamford, CT 06901
Distributor
Vigilant Distributors, LLC
Gateway Corporate Center, Suite 216
223 Wilmington West Chester Pike
Chadds Ford, PA 19317
Transfer Agent
U.S. Bancorp Fund Services, LLC
615 East Michigan Street
Milwaukee, WI 53202
(833) 627-6668
Custodian
U.S. Bank National Association
Custody Operations
1555 North River Center Drive, Suite 302
Milwaukee, WI 53212
Independent Registered Public Accounting Firm
BBD, LLP
1835 Market Street, 3rd floor
Philadelphia, PA 19103
Legal Counsel
Godfrey & Kahn S.C.
833 East Michigan Street, Suite 1800
Milwaukee, WI 53202
This report is intended for shareholders of the Fund and may not be used as sales literature unless preceded or accompanied by a current prospectus.
Past performance results shown in this report should not be considered a representation of future performance. Share price and returns will fluctuate so that shares, when redeemed, may be worth more or less than their original cost. Statements and other information herein are dated and are subject to change.
| (b) | Not Applicable. |
Item 2. Code of Ethics.
The registrant has adopted a code of ethics that applies to the registrant’s principal executive officer and principal financial officer. The registrant has not made any substantive amendments to its code of ethics during the period covered by this report. The registrant has not granted any waivers from any provisions of the code of ethics during the period covered by this report.
A copy of the registrant’s Code of Ethics is filed herewith.
Item 3. Audit Committee Financial Experts.
The registrant’s Board of Trustees has determined that there are at least two audit committee financial experts serving on its audit committee. Messrs. Gaylord B. Lyman and Scott C. Jones are the “audit committee financial experts” and are considered to be “independent” as each term is defined in Item 3 of Form N‑CSR.
Item 4. Principal Accountant Fees and Services.
The registrant has engaged its principal accountant to perform audit services, audit-related services, tax services and other services during the past two fiscal years. “Audit services” refer to performing an audit of the registrant's annual financial statements or services that are normally provided by the accountant in connection with statutory and regulatory filings or engagements for those fiscal years. “Audit-related services” refer to the assurance and related services by the principal accountant that are reasonably related to the performance of the audit. “Tax services” refer to professional services rendered by the principal accountant for tax compliance, tax advice, and tax planning. There were no “other services” provided by the principal accountant. The following table details the aggregate fees billed or expected to be billed for each of the last two fiscal years for audit fees, audit-related fees, tax fees and other fees by the principal accountant.
FYE 10/31/2022 | FYE 10/31/2021 | |
Audit Fees | $12,500 | $12,500 |
Audit-Related Fees | N/A | N/A |
Tax Fees | $3,000 | $3,000 |
All Other Fees | N/A | N/A |
The audit committee has adopted pre-approval policies and procedures that require the audit committee to pre‑approve all audit and non‑audit services of the registrant, including services provided to any entity affiliated with the registrant.
The percentage of fees billed by BBD, LLP applicable to non-audit services pursuant to waiver of pre-approval requirement were as follows:
FYE 10/31/2022 | FYE 10/31/2021 | |
Audit-Related Fees | 0% | 0% |
Tax Fees | 0% | 0% |
All Other Fees | 0% | 0% |
All of the principal accountant’s hours spent on auditing the registrant’s financial statements were attributed to work performed by full‑time permanent employees of the principal accountant.
The following table indicates the non-audit fees billed or expected to be billed by the registrant’s accountant for services to the registrant and to the registrant’s investment adviser (and any other controlling entity, etc.—not sub-adviser) for the last two years. The audit committee of the Board of Trustees has considered whether the provision of non-audit services that were rendered to the registrant's investment adviser is compatible with maintaining the principal accountant's independence and has concluded that the provision of such non-audit services by the accountant has not compromised the accountant’s independence.
Non-Audit Related Fees | FYE 10/31/2022 | FYE 10/31/2021 |
Registrant | N/A | N/A |
Registrant’s Investment Adviser | N/A | N/A |
The registrant has not been identified by the U.S. Securities and Exchange Commission as having filed an annual report issued by a registered public accounting firm branch or office that is located in a foreign jurisdiction where the Public Company Accounting Oversight Board is unable to inspect or completely investigate because of a position taken by an authority in that jurisdiction.
The registrant is not a foreign issuer.
Item 5. Audit Committee of Listed Registrants.
(a) Not applicable to registrants who are not listed issuers (as defined in Rule 10A-3 under the Securities Exchange Act of 1934).
(b) Not Applicable.
Item 6. Investments.
| (a) | Schedule of Investments is included as part of the report to shareholders filed under Item 1 of this Form. |
(b) | Not Applicable. |
Item 7. Disclosure of Proxy Voting Policies and Procedures for Closed-End Management Investment Companies.
Not applicable to open-end investment companies.
Item 8. Portfolio Managers of Closed-End Management Investment Companies.
Not applicable to open-end investment companies.
Item 9. Purchases of Equity Securities by Closed‑End Management Investment Company and Affiliated Purchasers.
Not applicable to open-end investment companies.
Item 10. Submission of Matters to a Vote of Security Holders.
There have been no material changes to the procedures by which shareholders may recommend nominees to the Registrant’s Board of Trustees.
Item 11. Controls and Procedures.
| (a) | The Registrant’s President/Principal Executive Officer and Treasurer/Principal Financial Officer have reviewed the Registrant's disclosure controls and procedures (as defined in Rule 30a-3(c) under the Investment Company Act of 1940, as amended, (the “Act”)) as of a date within 90 days of the filing of this report, as required by Rule 30a-3(b) under the Act and Rules 13a-15(b) or 15d‑15(b) under the Securities Exchange Act of 1934. Based on their review, such officers have concluded that the disclosure controls and procedures are effective in ensuring that information required to be disclosed in this report is appropriately recorded, processed, summarized and reported and made known to them by others within the Registrant and by the Registrant’s service provider. |
| (b) | There were no changes in the Registrant's internal control over financial reporting (as defined in Rule 30a-3(d) under the Act) that occurred during the fourth fiscal quarter of the period covered by this report that has materially affected, or is reasonably likely to materially affect, the Registrant's internal control over financial reporting. |
Item 12. Disclosure of Securities Lending Activities for Closed-End Management Investment Companies.
Not applicable to open-end investment companies.
Item 13. Exhibits.
(3) Any written solicitation to purchase securities under Rule 23c‑1 under the Act sent or given during the period covered by the report by or on behalf of the registrant to 10 or more persons. Not applicable to open-end investment companies.
(4) Change in the registrant’s independent public accountant. There was no change in the registrant’s independent public accountant for the period covered by this report.
SIGNATURES
Pursuant to the requirements of the Securities Exchange Act of 1934 and the Investment Company Act of 1940, as amended, the registrant has duly caused this report to be signed on its behalf by the undersigned, thereunto duly authorized.
(Registrant) Manager Directed Portfolios
By (Signature and Title)* /s/Scott M. Ostrowski
Scott M. Ostrowski, President/
Principal Executive Officer
Date 1/5/2023
Pursuant to the requirements of the Securities Exchange Act of 1934 and the Investment Company Act of 1940, as amended, this report has been signed below by the following persons on behalf of the registrant and in the capacities and on the dates indicated.
By (Signature and Title)* /s/Scott M. Ostrowski
Scott M. Ostrowski, President/
Principal Executive Officer
Date 1/5/2023
By (Signature and Title)* /s/Ryan S. Frank
Ryan S. Frank, Treasurer/
Principal Financial Officer
Date 1/5/2023