Mar Vista Strategic Growth Fund
Annual Report
October 31, 2022
Mar Vista Strategic Growth Fund
Table of Contents
Letter to Shareholders | | | 3 |
Sector Allocation of Portfolio Assets | | | 7 |
Schedule of Investments | | | 8 |
Statement of Assets and Liabilities | | | 12 |
Statement of Operations | | | 13 |
Statements of Changes in Net Assets | | | 14 |
Financial Highlights | | | 16 |
Notes to the Financial Statements | | | 19 |
Report of Independent Registered Public Accounting Firm | | | 31 |
Expense Example | | | 33 |
Notice to Shareholders | | | 35 |
Approval of Investment Advisory Agreement | | | 36 |
Management | | | 39 |
Privacy Notice | | | 42 |
Mar Vista Strategic Growth Fund
Dear Shareholders,
The Mar Vista Strategic Growth Fund (the “Fund”) declined -22.92% for the fiscal year ended October 31, 2022, compared to a -25.26% decline for the Russell 1000® Growth Index which measures the performance of the large-cap growth segment of the US Equity Universe and a -14.61% decline for the S&P 500® Index which tracks the 500 largest publicly traded U.S. Companies. You can not invest directly into an index..
Market Perspective
Greed prevailed over fear for the last two months of 2021 as the fear of missing out continued to drive positive market sentiment. The reopen-trade was the primary tailwind for this phenomenon as unprecedented, pent-up consumer demand pulled future earnings forward. The catalyst behind the strong demand was substantial U.S. monetary and fiscal support, as well as a post-pandemic economic normalization that had global implications. As 2021 wound down, investors were willing to overlook decelerating economic growth, supply chain bottlenecks, tightening monetary supply, rising yields and geo-political turmoil.
Fear displaced greed in the first ten months of 2022. The Russian invasion of Ukraine coupled with China’s continued COVID shutdown exacerbated supply chain, inflationary and market valuation concerns. The swing in investor sentiment was dramatic and swift as the market delivered the worst returns in a 6-month period in twenty years. The economic whirlwind broadly impacted capital markets with every S&P 500® Index sector, except Energy (+68.8%), down double-digits through the first ten months of 2022.
Performance
For the fiscal year ending October 31, 2022, the Fund’s outperformance relative to the Russell 1000® Growth Index was positively impacted by an overweight in Financial Services and underweights in the Communication Services and Consumer Discretionary sectors. Stock selections in Materials and Financial Services added to the relative performance, while those in Information Technology and Industrials detracted. The lack of exposure to Energy was a detractor, given it was the strongest performing sector in the fiscal year.
The Fund’s underperformance relative to the S&P 500® Index in the fiscal year period was due to its lack of exposure to the Energy sector, which was up over 63%, and the stock selection within Information Technology, Industrials and Financials. Additionally, the underweight versus the index in Healthcare detracted from relative returns.
The top contributor to Fund performance for the fiscal year was Berkshire Hathaway (BRK.B). During a time of uncertainty, Berkshire reported strong earnings and grew revenues 12% year-over-year. Operating earnings expanded across all of their major businesses. With its unique collection of publicly traded and privately-owned businesses, and a large hoard of deployable cash, we believe Berkshire offers both sustainable growth and defensiveness in times of economic stress. Other companies that contributed positively to the Fund’s performance were Johnson & Johnson (JNJ), PepsiCo (PEP), and The Walt Disney Company (DIS).
Mar Vista Strategic Growth Fund
The largest detractor to Fund performance during the fiscal year was Adobe Incorporated (ADBE). Adobe’s stock was pressured by higher interest rates dampening valuations for software equities, as well as by questions surrounding its capital allocation strategy. Specifically, Adobe announced the plan to acquire Figma, a collaborative design software platform, for $20 billion. This raised investor concerns about competitive threats to Adobe’s economic moat and management’s capital deployment efficiency. We believe Figma competes in an adjacent market to Adobe’s Creative Cloud and expect the acquisition to widen its competitive moat long-term. We will closely monitor the integration and execution of the Figma acquisition. Other holdings that negatively weighed on relative performance included GXO Logistics Inc (GXO), First Republic Bank (FRC), Alphabet Inc. (GOOG), and Amazon.com (AMZN).
Portfolio
Mar Vista’s investment process seeks to identify wide-moat growth franchises, with reinvestment opportunities that are led by proven capital allocators. Our portfolio construction process focuses on bottom-up factors, independent of benchmark weights. The outcome of this process is a portfolio of durable growth businesses that have diverse sector exposures. The portfolio’s relative sector weights are not an expressed opinion from a macro level, but where the investment team is finding skewed risk-reward opportunities in durable growth franchises.
Relative to the Russell 1000® Growth Index, our relative sector weights have generally remained the same over the last fiscal year. We have larger exposures to the Financial Services, Materials, and Industrials sectors. Our Industrials weight increased on an absolute and relative basis during the twelve-month period as we increased the position size in TransDigm Group and initiated a new position in GXO Logistics. The Fund is underweight in the Information Technology, Consumer Discretionary and Healthcare sectors relative to the Russell 1000® Growth Index.
Companies added to the Fund during the fiscal year included GXO Logistics and The Walt Disney Company while we sold our positions in Netflix, PayPal, Unilever, Ecolab, Meta, and Vontier.
Market Outlook
Over time, the expected returns of our portfolio should reflect two components: (1) the compounding nature of our businesses and (2) the discount we are paying relative to fair value. There will be times when the sentiment pendulum swings towards optimism, and portfolio returns exceed the underlying intrinsic value growth while discounts to intrinsic value contract. Conversely, fear, skepticism and lower stock prices should provide opportunities for both potentially higher expected returns and potentially less risk. As the capital markets have shifted from an era of historically low real interest rates and benign inflation to one with decidedly higher risk-free hurdles and eroding purchasing power, asset valuations, growth expectations and security prices have adjusted rapidly.
Mar Vista Strategic Growth Fund
While our expectations for free cash flow growth are more muted than a year ago due to the more challenging global economy, stock prices have, on average, declined more than our estimates of fair value. Accordingly, the portfolio’s average margin of safety, or discount to our estimate of intrinsic value, has expanded to more attractive levels than we’ve seen in many years. Although we expect continued market volatility, we will continue to implement Mar Vista’s consistent, predictable and repeatable investment process. Our process typically leads us to businesses with wide-economic moats, that have abundant high return reinvestment opportunities with proven capital allocators at the helm. We believe that the unemotional implementation of Mar Vista’s investment process, coupled with the wider margin of safety we are realizing today, should provide a reasonable backdrop to deliver attractive risk-adjusted returns over a full economic cycle.
We are ever grateful for the ongoing support from our shareholders, partners and clients. We encourage you to seek additional information about the Mar Vista Strategic Growth Fund at www.marvistainvestments.com.
Sincerely,
The Mar Vista Investment Partners Research Team
Margin of safety – Buying with a “margin of safety,” a phrase popularized by Benjamin Graham and Warren Buffett, is when a security is purchased for less than its estimated value. This helps protect against permanent capital loss in the case of an unexpected event or analytical mistake. A purchase made with a margin of safety does not guarantee the security will not decline in price.
The above comments reflect general views regarding the market and the economy,were current as of the date of this letter, and are subject to change at any time.
All investing includes risk, including the loss of principal. The Fund invests in growth companies which can be more sensitive to the company’s earnings and more volatile than the stock market in general. The Fund may also invest in foreign securities which are subject to risks including currency fluctuations, economic and political change and differing accounting standards. The Fund may invest in derivatives and IPOs, which are highly volatile. Additional risk information may be found in the prospectus.
Fund holdings and/or sector allocations are subject to change at any time and are not recommendations to buy or sell any security. For a complete list of holdings, see the Schedule of Investments on page 8.
This report is intended for shareholders of the Fund and may not be used as sales literature unless preceded or accompanied by a current prospectus.
The Strategic Growth Fund is distributed by Quasar Distributors, LLC. Mar Vista Investment Partners serves as the advisor to the Strategic Growth Fund.
Mar Vista Strategic Growth Fund
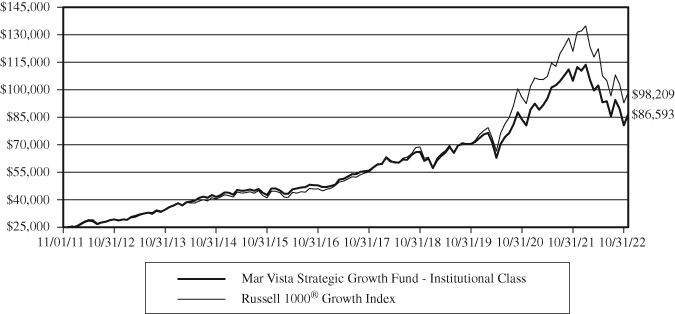
Comparison of the Change in Value of a Hypothetical $25,000 Investment
in the Mar Vista Strategic Growth Fund – Institutional Shares and
Russel 1000 Growth Total Return Index
| Average Annual Total Return Periods | | | | | Since |
| Ended October 31, 2022: | 1 Year | 3 Year | 5 Year | 10 Year | Inception* |
Mar Vista Strategic Growth Fund – | | | | | |
| Institutional Shares | (22.92)% | 6.58% | 8.50% | 11.70% | 11.96% |
| Investor Shares | (23.18)% | 6.20% | 7.82% | N/A | 9.09% |
| Retirement Shares | (22.86)% | 6.65% | 8.59% | N/A | 9.83% |
Russel 1000 Growth | | | | | |
Total Return Index (USD) | (25.26)% | 10.74% | 11.39% | 13.17% | 13.25% |
| * | Inception date is 11/1/2011 for Institutional Shares and 3/6/2017 for Investor Shares and Retirement Shares |
Expense Ratios*: Gross 0.90%; Net 0.71% (Institutional Shares); Gross 1.25%; Net 1.07% (Investor Shares); Gross 0.80%; Net 0.63% (Retirement Shares)
Performance data quoted represents past performance; past performance does not guarantee future results. The investment return and principal value of an investment will fluctuate so that an investor’s shares, when redeemed, may be worth more or less than their original cost. Current performance of the Fund may be lower or higher than the performance quoted. Performance data current to the most recent month end may be obtained by calling 1-833-627-6668.
This chart illustrates the performance of a hypothetical $25,000 investment made in the Institutional Shares of the Fund November 1, 2011. Returns reflect the reinvestment of dividends and capital gain distributions. The performance data and expense ratios shown reflect a contractual fee waiver made by the Adviser, currently, through February 28, 2023. In the absence of fee waivers, returns would be reduced. The performance data and graph do not reflect the deduction of taxes that a shareholder may pay on dividends, capital gain distributions, or redemption of Fund shares. This chart does not imply any future performance.
(1) | The inception date of the Investor Shares is March 6, 2017. Performance shown prior to the inception of the Investor Shares reflects the performance of the Institutional Shares and does not include expenses applicable to the Investor Shares, and are higher than, those of the Institutional Shares. The actual annualized performance during the period March 6, 2017 (Investor Share inception) through October 31, 2022 was 9.09% (annualized). |
(2) | The inception date of the Retirement Shares is March 6, 2017. Performance shown prior to the inception of the Retirement Shares reflects the performance of the Institutional Shares and does not include expenses applicable to the Retirement Shares, and are lower than, those of the Institutional Shares. The actual annualized performance during the period March 6, 2017 (Retirement Share inception) through October 31, 2022 was 9.83% (annualized). |
| * | The expense ratios presented are from the most recent prospectus. |
Mar Vista Strategic Growth Fund
| SECTOR ALLOCATION OF PORTFOLIO ASSETS |
| at October 31, 2022 (Unaudited) |
Mar Vista Strategic Growth Fund
| SCHEDULE OF INVESTMENTS |
| at October 31, 2022 |
| COMMON STOCKS – 95.3% | | Shares | | | Value | |
| | | | | | | |
| COMMUNICATION SERVICES – 6.6% | | | | | | |
| | | | | | | |
| Entertainment – 2.8% | | | | | | |
| The Walt Disney Co, (a) | | | 17,738 | | | $ | 1,889,807 | |
| | | | | | | | | |
| Interactive Media & Services – 3.8% | | | | | | | | |
| Alphabet, Inc. (a) | | | 27,050 | | | | 2,560,553 | |
| TOTAL COMMUNICATION SERVICES | | | | | | | 4,450,360 | |
| | | | | | | | | |
| | | | | | | | | |
| CONSUMER DISCRETIONARY – 6.4% | | | | | | | | |
| | | | | | | | | |
| Hotels, Restaurants & Leisure – 1.2% | | | | | | | | |
| Starbucks Corp. (c) | | | 9,227 | | | | 798,966 | |
| | | | | | | | | |
| Internet & Direct Marketing Retail – 3.2% | | | | | | | | |
| Amazon.com, Inc. (a) | | | 20,750 | | | | 2,125,630 | |
| | | | | | | | | |
| Textiles, Apparel & Luxury Goods – 2.0% | | | | | | | | |
| NIKE, Inc. | | | 14,130 | | | | 1,309,568 | |
| TOTAL CONSUMER DISCRETIONARY | | | | | | | 4,234,164 | |
| | | | | | | | | |
| | | | | | | | | |
| CONSUMER STAPLES – 2.8% | | | | | | | | |
| | | | | | | | | |
| Beverages – 2.8% | | | | | | | | |
| PepsiCo, Inc. | | | 10,176 | | | | 1,847,758 | |
| TOTAL CONSUMER STAPLES | | | | | | | 1,847,758 | |
| | | | | | | | | |
| | | | | | | | | |
| FINANCIALS – 20.5% | | | | | | | | |
| | | | | | | | | |
| Banks – 4.7% | | | | | | | | |
| First Republic Bank | | | 17,396 | | | | 2,089,260 | |
| U.S. Bancorp | | | 25,514 | | | | 1,083,069 | |
| | | | | | | | 3,172,329 | |
| | | | | | | | | |
| Capital Markets – 7.8% | | | | | | | | |
| Charles Schwab Corp. | | | 37,861 | | | | 3,016,386 | |
| Moody’s Corp. | | | 8,336 | | | | 2,207,956 | |
| | | | | | | | 5,224,342 | |
The accompanying notes are an integral part of these financial statements.
Mar Vista Strategic Growth Fund
| SCHEDULE OF INVESTMENTS (Continued) |
| at October 31, 2022 |
| COMMON STOCKS – 95.3% (Continued) | | Shares | | | Value | |
| | | | | | | |
| FINANCIALS – 20.5% (Continued) | | | | | | |
| | | | | | | |
| Diversified Financial Services – 3.6% | | | | | | |
| Berkshire Hathaway, Inc. (a) | | | 8,154 | | | $ | 2,406,164 | |
| | | | | | | | | |
| Insurance – 4.4% | | | | | | | | |
| Markel Corp. (a) | | | 2,445 | | | | 2,948,914 | |
| TOTAL FINANCIALS | | | | | | | 13,751,749 | |
| | | | | | | | | |
| | | | | | | | | |
| HEALTHCARE – 7.6% | | | | | | | | |
| | | | | | | | | |
| Life Sciences Tools & Services – 3.1% | | | | | | | | |
| Mettler-Toledo International, Inc. (a) | | | 1,622 | | | | 2,051,716 | |
| | | | | | | | | |
| Pharmaceuticals – 4.5% | | | | | | | | |
| Johnson & Johnson | | | 17,434 | | | | 3,032,993 | |
| TOTAL HEALTHCARE | | | | | | | 5,084,709 | |
| | | | | | | | | |
| | | | | | | | | |
| INDUSTRIALS – 12.6% | | | | | | | | |
| | | | | | | | | |
| Aerospace & Defense – 4.3% | | | | | | | | |
| TransDigm Group, Inc. (a) | | | 5,013 | | | | 2,886,285 | |
| | | | | | | | | |
| Air Freight & Logistics – 1.9% | | | | | | | | |
| GXO Logistics, Inc. (a) | | | 34,234 | | | | 1,250,911 | |
| | | | | | | | | |
| Industrial Conglomerates – 3.9% | | | | | | | | |
| Honeywell International, Inc. | | | 12,764 | | | | 2,604,111 | |
| | | | | | | | | |
| Machinery – 2.5% | | | | | | | | |
| Fortive Corp. | | | 25,667 | | | | 1,640,121 | |
| TOTAL INDUSTRIALS | | | | | | | 8,381,428 | |
| | | | | | | | | |
| | | | | | | | | |
| INFORMATION TECHNOLOGY – 31.4% | | | | | | | | |
| | | | | | | | | |
| Electronic Equipment, | | | | | | | | |
| Instruments & Components – 2.6% | | | | | | | | |
| Amphenol Corp. | | | 23,539 | | | | 1,784,962 | |
The accompanying notes are an integral part of these financial statements.
Mar Vista Strategic Growth Fund
| SCHEDULE OF INVESTMENTS (Continued) |
| at October 31, 2022 |
| COMMON STOCKS – 95.3% (Continued) | | Shares | | | Value | |
| | | | | | | |
| INFORMATION TECHNOLOGY – 31.4% (Continued) | | | | | | |
| | | | | | | |
| IT Services – 3.4% | | | | | | |
| Visa, Inc. | | | 10,931 | | | $ | 2,264,466 | |
| | | | | | | | | |
| Semiconductors & Semiconductor Equipment – 4.3% | | | | | | | | |
| Microchip Technology, Inc. | | | 46,890 | | | | 2,894,989 | |
| | | | | | | | | |
| Software – 16.8% | | | | | | | | |
| Adobe, Inc. (a) | | | 7,289 | | | | 2,321,546 | |
| Intuit, Inc. | | | 3,266 | | | | 1,396,215 | |
| Microsoft Corp. | | | 13,351 | | | | 3,099,168 | |
| Roper Technologies, Inc. | | | 3,573 | | | | 1,481,151 | |
| Salesforce, Inc. (a) | | | 8,225 | | | | 1,337,303 | |
| SAP SE – ADR | | | 16,642 | | | | 1,598,631 | |
| | | | | | | | 11,234,014 | |
| | | | | | | | | |
| Technology Hardware, Storage & Peripherals – 4.3% | | | | | | | | |
| Apple, Inc. | | | 18,733 | | | | 2,872,518 | |
| TOTAL INFORMATION TECHNOLOGY | | | | | | | 21,050,949 | |
| | | | | | | | | |
| | | | | | | | | |
| MATERIALS – 7.4% | | | | | | | | |
| | | | | | | | | |
| Chemicals – 7.4% | | | | | | | | |
| Air Products and Chemicals, Inc. | | | 13,072 | | | | 3,273,229 | |
| Linde PLC – ADR | | | 5,719 | | | | 1,700,545 | |
| TOTAL MATERIALS | | | | | | | 4,973,774 | |
| TOTAL COMMON STOCKS | | | | | | | | |
| (Cost $38,929,743) | | | | | | | 63,774,891 | |
| | | | | | | | | |
| | | | | | | | | |
| REITS – 3.4% | | | | | | | | |
| | | | | | | | | |
| Real Estate – 3.4% | | | | | | | | |
| American Tower Corp. | | | 10,907 | | | | 2,259,822 | |
| TOTAL REAL ESTATE | | | | | | | | |
| (Cost $1,860,222) | | | | | | | 2,259,822 | |
| TOTAL REITS | | | | | | | | |
| (Cost $1,860,222) | | | | | | | 2,259,822 | |
The accompanying notes are an integral part of these financial statements.
Mar Vista Strategic Growth Fund
| SCHEDULE OF INVESTMENTS (Continued) |
| at October 31, 2022 |
| SHORT-TERM INVESTMENTS – 1.5% | | Shares | | | Value | |
| | | | | | | |
| MONEY MARKET FUNDS – 1.5% | | | | | | |
| First American Government Obligations Fund – | | | | | | |
| Class V, 3.070% (b) | | | 1,025,448 | | | $ | 1,025,448 | |
| TOTAL SHORT-TERM INVESTMENTS | | | | | | | | |
| (Cost $1,025,448) | | | | | | | 1,025,448 | |
| | | | | | | | | |
| | | | | | | | | |
| INVESTMENTS PURCHASED WITH PROCEEDS | | | | | | | | |
| FROM SECURITIES LENDING – 1.0% | | | | | | | | |
| Mount Vernon Liquid Assets Portfolio, 3.21% (b) | | | 676,578 | | | | 676,578 | |
| TOTAL INVESTMENTS PURCHASED WITH | | | | | | | | |
| CASH PROCEEDS FROM SECURITIES LENDING | | | | | | | | |
| (Cost 676,578) | | | | | | | 676,578 | |
| TOTAL INVESTMENTS | | | | | | | | |
| (Cost $42,491,991) – 100.0% | | | | | | | 67,736,739 | |
| Liabilities In Excess of Other Assets – (1.2)% | | | | | | | (787,732 | ) |
| TOTAL NET ASSETS – 100.0% | | | | | | $ | 66,949,007 | |
Percentages are stated as a percent of net assets.
ADR – American Depositary Receipt
PLC – Public Limited Company
| (a) | Non-income producing security. |
| (b) | The rate shown represents the fund’s 7-day yield as of October 31, 2022. |
| (c) | This security or a portion of this security was out on loan at October 31, 2022. As of October 31, 2022, the total value of loaned securities was $658,257 or 1.0% of net assets. The remaining contractual maturity of all the securities lending transactions, is overnight and continuous. |
The Global Industry Classification Standard (GICS®) was developed by and/or is the exclusive property of MSCI, Inc. and Standard & Poor’s Financial Services LLC (“S&P”). GICS is a service mark of MSCI and S&P and has been licensed for use by U.S. Bank Global Fund Services.
The accompanying notes are an integral part of these financial statements.
Mar Vista Strategic Growth Fund
| STATEMENT OF ASSETS AND LIABILITIES |
| at October 31, 2022 |
| Assets: | | | |
Investments, at value (cost of $42,491,991)* | | $ | 67,736,739 | |
Receivables: | | | | |
| Fund shares sold | | | 16,659 | |
| Dividends and interest | | | 42,844 | |
| Securities Lending | | | 292 | |
Prepaid expenses | | | 6,531 | |
| Total assets | | | 67,803,065 | |
| Liabilities: | | | | |
Payables: | | | | |
| Upon return of securities loaned | | | 676,578 | |
| Fund shares redeemed | | | 76,309 | |
| Administration and fund accounting fees | | | 39,548 | |
| Advisory fees | | | 3,668 | |
| Custody fees | | | 2,727 | |
| Transfer agent fees and expenses | | | 16,434 | |
| Accrued service fees | | | 18,027 | |
| Accrued distribution fees | | | 550 | |
| Other accrued expenses | | | 20,217 | |
| Total liabilities | | | 854,058 | |
| Net assets | | $ | 66,949,007 | |
| Net assets consist of: | | | | |
Paid in capital | | $ | 32,686,706 | |
Total accumulated earnings | | | 34,262,301 | |
| Net assets | | $ | 66,949,007 | |
| Institutional Shares: | | | | |
| Net assets applicable to outstanding Institutional Shares | | | 62,589,108 | |
| Shares issued (Unlimited number of | | | | |
| beneficial interest authorized, $0.01 par value) | | | 2,665,774 | |
| Net asset value, offering price and redemption price per share | | $ | 23.48 | |
| Investor Shares: | | | | |
| Net assets applicable to outstanding Investor Shares | | | 798,232 | |
| Shares issued (Unlimited number of | | | | |
| beneficial interest authorized, $0.01 par value) | | | 34,849 | |
| Net asset value, offering price and redemption price per share | | $ | 22.91 | |
| Retirement | | | | |
| Net assets applicable to outstanding Retirement | | $ | 3,561,667 | |
| Shares issued (Unlimited number of | | | | |
| beneficial interest authorized, $0.01 par value) | | | 151,464 | |
| Net asset value, offering price and redemption price per share | | $ | 23.51 | |
* | Includes securities on loan of $658,257 |
The accompanying notes are an integral part of these financial statements.
Mar Vista Strategic Growth Fund
| STATEMENT OF OPERATIONS |
| For the Fiscal Year Ended October 31, 2022 |
| Investment income: | | | |
Dividends (net of foreign taxes withheld of $5,362) | | $ | 879,697 | |
Interest | | | 8,688 | |
Securities Lending | | | 292 | |
| Total investment income | | | 888,676 | |
| | | | | |
| Expenses: | | | | |
Investment advisory fees (Note 4) | | | 519,841 | |
Administration and fund accounting fees (Note 4) | | | 39,548 | |
Transfer agent fees and expenses | | | 76,324 | |
Federal and state registration fees | | | 57,219 | |
Custody fees | | | 9,313 | |
Distribution fees (Note 5) | | | | |
| Distribution fees – Investor Shares | | | 2,131 | |
| Distribution fees – Administrative Shares | | | 79 | |
Service fees (Note 6) | | | | |
| Service fees – Investor Shares | | | 975 | |
| Service fees – Institutional Shares | | | 26,646 | |
Trustees’ fees and expenses | | | 8,151 | |
Other | | | 35,710 | |
| Total expenses before reimbursement from advisor | | | 775,937 | |
| Expense reimbursement from advisor (Note 4) | | | (161,647 | ) |
| Net expenses | | | 614,290 | |
| Net investment income | | | 274,386 | |
| | | | | |
| Realized and unrealized gain (loss) on investments: | | | | |
| Net realized gain on transactions from: | | | | |
| Investments | | | 11,895,790 | |
| Net change in unrealized loss on: | | | | |
| Investments | | | (35,177,291 | ) |
| Net realized and unrealized loss on investments | | | (23,281,501 | ) |
| Net decrease in net assets resulting from operations | | $ | (23,007,115 | ) |
The accompanying notes are an integral part of these financial statements.
Mar Vista Strategic Growth Fund
| STATEMENTS OF CHANGES IN NET ASSETS |
| |
| | | Year Ended | | | Year Ended | |
| | | October 31, 2022 | | | October 31, 2021 | |
| Operations: | | | | | | |
| Net investment income | | $ | 274,386 | | | $ | 126,000 | |
| Net realized gain on investments | | | 11,895,790 | | | | 11,433,000 | |
| Net change in unrealized gain (loss) on investments | | | (35,177,291 | ) | | | 27,401,000 | |
| Net increase (decrease) in net assets | | | | | | | | |
| resulting from operations | | | (23,007,115 | ) | | | 38,960,000 | |
| | | | | | | | | |
| Distributions to Shareholders From: | | | | | | | | |
| Distributed earnings | | | | | | | | |
| Institutional Shares | | | (9,180,172 | ) | | | (3,611,000 | ) |
| Retirement Shares | | | (640,082 | ) | | | (224,000 | ) |
| Investor Shares | | | (77,585 | ) | | | (17,000 | ) |
| Administrative Shares | | | (4,209 | ) | | | — | |
| Total distributions | | | (9,902,048 | ) | | | (3,852,000 | ) |
| | | | | | | | | |
| Capital Share Transactions: | | | | | | | | |
| Proceeds from shares sold | | | | | | | | |
| Investor Shares | | | 351,228 | | | | 245,000 | |
| Institutional Shares | | | 9,836,952 | | | | 13,781,000 | |
| Retirement Shares | | | 236,153 | | | | 672,000 | |
Administrative Shares1 | | | 101 | | | | 38,000 | |
| Proceeds from shares issued to holders | | | | | | | | |
| in reinvestment of dividends | | | | | | | | |
| Investor Shares | | | 77,585 | | | | 17,000 | |
| Institutional Shares | | | 8,716,733 | | | | 3,445,000 | |
| Retirement Shares | | | 640,082 | | | | 225,000 | |
Administrative Shares1 | | | 4,209 | | | | 1,000 | |
| Cost of shares redeemed | | | | | | | | |
| Investor Shares | | | (225,258 | ) | | | (70,000 | ) |
| Institutional Shares | | | (37,989,177 | ) | | | (38,500,000 | ) |
| Retirement Shares | | | (2,858,587 | ) | | | (1,742,000 | ) |
Administrative Shares1 | | | 39,855 | | | | 20,000 | |
| Net decrease in net assets from | | | | | | | | |
| capital share transactions | | | (21,249,832 | ) | | | (21,908,000 | ) |
| Total increase (decrease) in net assets | | | (54,158,995 | ) | | | 13,200,000 | |
| | | | | | | | | |
1 | Administrative shares were exchanged for Institutional Shares on July 18, 2022. |
The accompanying notes are an integral part of these financial statements.
Mar Vista Strategic Growth Fund
| STATEMENTS OF CHANGES IN NET ASSETS (Continued) |
| |
| | | Year Ended | | | Year Ended | |
| | | October 31, 2022 | | | October 31, 2021 | |
| Net Assets: | | | | | | |
| Beginning of year | | | 121,108,000 | | | | 107,908,000 | |
| End of year | | $ | 66,949,007 | | | $ | 121,108,000 | |
| | | | | | | | | |
| Changes in Shares Outstanding: | | | | | | | | |
| Shares sold | | | | | | | | |
| Investor Shares | | | 13,020 | | | | 9,000 | |
| Institutional Shares | | | 370,488 | | | | 472,000 | |
| Retirement Shares | | | 8,574 | | | | 23,000 | |
Administrative Shares1 | | | 4 | | | | 1,000 | |
| Proceeds from shares issued to | | | | | | | | |
| holders in reinvestment of dividends | | | | | | | | |
| Investor Shares | | | 2,684 | | | | 1,000 | |
| Institutional Shares | | | 295,082 | | | | 128,000 | |
| Retirement Shares | | | 21,646 | | | | 8,000 | |
Administrative Shares1 | | | 143 | | | | — | |
| Shares redeemed | | | | | | | | |
| Investor Shares | | | (8,455 | ) | | | (3,000 | ) |
| Institutional Shares | | | (1,377,309 | ) | | | (1,318,000 | ) |
| Retirement Shares | | | (110,678 | ) | | | (62,000 | ) |
Administrative Shares1 | | | (1,700 | ) | | | — | |
| Net decrease in shares outstanding | | | (786,501 | ) | | | (741,000 | ) |
1 | Administrative shares were exchanged for Institutional Shares on July 18, 2022. |
The accompanying notes are an integral part of these financial statements.
Mar Vista Strategic Growth Fund
For a capital share outstanding throughout the year
Institutional Shares
| | | Year Ended October 31, | |
| | | 20224 | | | 2021 | | | 2020 | | | 2019 | | | 2018 | |
| Net Asset Value – | | | | | | | | | | | | | | | |
| Beginning of Year | | $ | 33.29 | | | $ | 24.64 | | | $ | 22.28 | | | $ | 19.63 | | | $ | 18.85 | |
| | | | | | | | | | | | | | | | | | | | | |
Net investment income1 | | | 0.09 | | | | 0.03 | | | | 0.08 | | | | 0.11 | | | | 0.06 | |
Net realized and unrealized | | | | | | | | | | | | | | | | | | | | |
gain (loss) on investments | | | (7.16 | ) | | | 9.51 | | | | 2.68 | | | | 3.08 | | | | 1.11 | |
| Total from | | | | | | | | | | | | | | | | | | | | |
| investment operations | | | (7.07 | ) | | | 9.54 | | | | 2.76 | | | | 3.19 | | | | 1.17 | |
| | | | | | | | | | | | | | | | | | | | | |
| Less Distributions: | | | | | | | | | | | | | | | | | | | | |
Dividends from net | | | | | | | | | | | | | | | | | | | | |
investment income | | | (0.03 | ) | | | (0.10 | ) | | | (0.09 | ) | | | (0.06 | ) | | | (0.04 | ) |
Distributions from net | | | | | | | | | | | | | | | | | | | | |
realized gains | | | (2.71 | ) | | | (0.79 | ) | | | (0.31 | ) | | | (0.48 | ) | | | (0.35 | ) |
| Total distributions | | | (2.74 | ) | | | (0.89 | ) | | | (0.40 | ) | | | (0.54 | ) | | | (0.39 | ) |
| | | | | | | | | | | | | | | | | | | | | |
| Net Asset Value – | | | | | | | | | | | | | | | | | | | | |
| End of Year | | $ | 23.48 | | | $ | 33.29 | | | $ | 24.64 | | | $ | 22.28 | | | $ | 19.63 | |
| | | | | | | | | | | | | | | | | | | | | |
Total Return | | | (22.92 | )% | | | 39.56 | % | | | 12.54 | % | | | 16.91 | % | | | 6.26 | % |
| | | | | | | | | | | | | | | | | | | | | |
| Ratios and Supplemental Data: | | | | | | | | | | | | | | | | | | | | |
Net assets, end | | | | | | | | | | | | | | | | | | | | |
of year (thousands) | | $ | 62,589 | | | $ | 112,425 | | | $ | 100,895 | | | $ | 106,463 | | | $ | 66,197 | |
Ratio of operating expenses | | | | | | | | | | | | | | | | | | | | |
to average net assets: | | | | | | | | | | | | | | | | | | | | |
| Before reimbursements | | | 0.90 | % | | | 0.80 | % | | | 0.80 | % | | | 0.79 | % | | | 0.84 | % |
| After reimbursements | | | 0.71 | % | | | 0.71 | % | | | 0.71 | % | | | 0.71 | % | | | 0.70 | % |
Ratio of net investment income | | | | | | | | | | | | | | | | | | | | |
to average net assets: | | | | | | | | | | | | | | | | | | | | |
| Before reimbursements | | | 0.13 | % | | | N/A | 3 | | | N/A | 3 | | | N/A | 3 | | | N/A | 3 |
| After reimbursements | | | 0.32 | % | | | 0.11 | % | | | 0.35 | % | | | 0.51 | % | | | 0.28 | % |
Portfolio turnover rate2 | | | 26 | % | | | 9 | % | | | 22 | % | | | 26 | % | | | 15 | % |
1 | The net investment income per share was calculated using the average shares outstanding method. |
2 | Portfolio turnover was calculated on the basis of the Fund as a whole. The rate presented represents portfolio turnover for the entire fiscal year. |
3 | Figures were not reported during prior year |
4 | The fund transitioned from the Harbor Strategic Growth Fund to the Mar Vista Strategic Growth Fund on July 22, 2022. On July 18, 2022 outstanding Administrative Shares were transferred into Institutional Shares. |
The accompanying notes are an integral part of these financial statements.
Mar Vista Strategic Growth Fund
| FINANCIAL HIGHLIGHTS (Continued) |
| |
For a capital share outstanding throughout the year
Investor Share Class
| | | Year Ended October 31, | |
| | | 20224 | | | 2021 | | | 2020 | | | 2019 | | | 2018 | |
| Net Asset Value – | | | | | | | | | | | | | | | |
| Beginning of Year | | $ | 32.62 | | | $ | 24.17 | | | $ | 21.87 | | | $ | 19.54 | | | $ | 18.81 | |
| | | | | | | | | | | | | | | | | | | | | |
Net investment income/(loss)1 | | | 0.00 | 5 | | | (0.08 | ) | | | (0.01 | ) | | | 0.03 | | | | (0.02 | ) |
Net realized and unrealized | | | | | | | | | | | | | | | | | | | | |
gain (loss) on investments | | | (7.00 | ) | | | 9.34 | | | | 2.63 | | | | 2.79 | | | | 1.10 | |
| Total from | | | | | | | | | | | | | | | | | | | | |
| investment operations | | | (7.00 | ) | | | 9.26 | | | | 2.62 | | | | 2.82 | | | | 1.08 | |
| | | | | | | | | | | | | | | | | | | | | |
| Less Distributions: | | | | | | | | | | | | | | | | | | | | |
Dividends from net | | | | | | | | | | | | | | | | | | | | |
investment income | | | — | | | | (0.02 | ) | | | (0.01 | ) | | | (0.01 | ) | | | — | |
Distributions from net | | | | | | | | | | | | | | | | | | | | |
realized gains | | | (2.71 | ) | | | (0.79 | ) | | | (0.31 | ) | | | (0.48 | ) | | | (0.35 | ) |
| Total distributions | | | (2.71 | ) | | | (0.81 | ) | | | (0.32 | ) | | | (0.49 | ) | | | (0.35 | ) |
| | | | | | | | | | | | | | | | | | | | | |
| Net Asset Value – | | | | | | | | | | | | | | | | | | | | |
| End of Year | | $ | 22.91 | | | $ | 32.62 | | | $ | 24.17 | | | $ | 21.87 | | | $ | 19.54 | |
| | | | | | | | | | | | | | | | | | | | | |
Total Return | | | (23.18 | )% | | | 39.06 | % | | | 12.12 | % | | | 14.99 | % | | | 5.80 | % |
| | | | | | | | | | | | | | | | | | | | | |
| Ratios and Supplemental Data: | | | | | | | | | | | | | | | | | | | | |
Net assets, end of | | | | | | | | | | | | | | | | | | | | |
year (thousands) | | $ | 798 | | | $ | 900 | | | $ | 503 | | | $ | 417 | | | $ | 322 | |
Ratio of operating expenses | | | | | | | | | | | | | | | | | | | | |
to average net assets: | | | | | | | | | | | | | | | | | | | | |
Before reimbursements | | | 1.25 | % | | | 1.16 | % | | | 1.17 | % | | | 1.16 | % | | | 1.21 | % |
After reimbursements | | | 1.07 | % | | | 1.07 | % | | | 1.08 | % | | | 1.08 | % | | | 1.07 | % |
Ratio of net investment income | | | | | | | | | | | | | | | | | | | | |
(loss) to average net assets: | | | | | | | | | | | | | | | | | | | | |
Before reimbursements | | | (0.19 | )% | | | N/A | 3 | | | N/A | 3 | | | N/A | 3 | | | N/A | 3 |
After reimbursements | | | (0.01 | )% | | | (0.27 | )% | | | (0.04 | )% | | | 0.14 | % | | | (0.11 | )% |
Portfolio turnover rate2 | | | 26 | % | | | 9 | % | | | 22 | % | | | 26 | % | | | 15 | % |
1 | The net investment income per share was calculated using the average shares outstanding method. |
2 | Portfolio turnover was calculated on the basis of the Fund as a whole. The rate presented represents portfolio turnover for the entire fiscal year. |
3 | Figures were not reported on the Prior reports. |
4 | The fund transitioned from the Harbor Strategic Growth Fund to the Mar Vista Strategic Growth Fund on July 22, 2022. |
5 | Amount represented is less than 0.005. |
The accompanying notes are an integral part of these financial statements.
Mar Vista Strategic Growth Fund
| FINANCIAL HIGHLIGHTS (Continued) |
| |
For a capital share outstanding throughout the year
| Retirement Share Class | | | | | | | | | | | | | | | |
| | | | | | | | | | | | | | | | |
| | | Year Ended October 31, | |
| | | 20224 | | | 2021 | | | 2020 | | | 2019 | | | 2018 | |
| Net Asset Value – | | | | | | | | | | | | | | | |
| Beginning of Year | | $ | 33.33 | | | $ | 24.67 | | | $ | 22.31 | | | $ | 19.65 | | | $ | 18.86 | |
| | | | | | | | | | | | | | | | | | | | | |
Net investment income1 | | | 0.10 | | | | 0.05 | | | | 0.09 | | | | 0.12 | | | | 0.07 | |
Net realized and unrealized | | | | | | | | | | | | | | | | | | | | |
gain (loss) on investments | | | (7.15 | ) | | | 9.52 | | | | 2.69 | | | | 3.10 | | | | 1.11 | |
| Total from | | | | | | | | | | | | | | | | | | | | |
| investment operations | | | (7.05 | ) | | | 9.57 | | | | 2.78 | | | | 3.22 | | | | 1.18 | |
| | | | | | | | | | | | | | | | | | | | | |
| Less Distributions: | | | | | | | | | | | | | | | | | | | | |
Dividends from net | | | | | | | | | | | | | | | | | | | | |
investment income | | | (0.06 | ) | | | (0.12 | ) | | | (0.11 | ) | | | (0.08 | ) | | | (0.04 | ) |
Distributions from net | | | | | | | | | | | | | | | | | | | | |
realized gains | | | (2.71 | ) | | | (0.79 | ) | | | (0.31 | ) | | | (0.48 | ) | | | (0.35 | ) |
| Total distributions | | | (2.77 | ) | | | (0.91 | ) | | | (0.42 | ) | | | (0.56 | ) | | | (0.39 | ) |
| | | | | | | | | | | | | | | | | | | | | |
| Net Asset Value – | | | | | | | | | | | | | | | | | | | | |
| End of Year | | $ | 23.51 | | | $ | 33.33 | | | $ | 24.67 | | | $ | 22.31 | | | $ | 19.65 | |
| | | | | | | | | | | | | | | | | | | | | |
Total Return | | | (22.86 | )% | | | 39.66 | % | | | 12.60 | % | | | 17.04 | % | | | 6.34 | % |
| | | | | | | | | | | | | | | | | | | | | |
| Ratios and Supplemental Data: | | | | | | | | | | | | | | | | | | | | |
Net assets, end | | | | | | | | | | | | | | | | | | | | |
of year (thousands) | | $ | 3,562 | | | $ | 7,731 | | | $ | 6,488 | | | $ | 5,152 | | | $ | 3,584 | |
Ratio of operating expenses | | | | | | | | | | | | | | | | | | | | |
to average net assets: | | | | | | | | | | | | | | | | | | | | |
| Before reimbursements | | | 0.80 | % | | | 0.72 | % | | | 0.72 | % | | | 0.71 | % | | | 0.76 | % |
| After reimbursements | | | 0.63 | % | | | 0.63 | % | | | 0.63 | % | | | 0.63 | % | | | 0.62 | % |
Ratio of net investment income | | | | | | | | | | | | | | | | | | | | |
to average net assets: | | | | | | | | | | | | | | | | | | | | |
| Before reimbursements | | | 0.20 | % | | | N/A | 3 | | | N/A | 3 | | | N/A | 3 | | | N/A | 3 |
| After reimbursements | | | 0.37 | % | | | 0.18 | % | | | 0.40 | % | | | 0.60 | % | | | 0.33 | % |
Portfolio turnover rate2 | | | 26 | % | | | 9 | % | | | 22 | % | | | 26 | % | | | 15 | % |
1 | The net investment income per share was calculated using the average shares outstanding method. |
2 | Portfolio turnover was calculated on the basis of the Fund as a whole. The rate presented represents portfolio turnover for the entire fiscal year. |
3 | Figures were not reported on the Prior reports. |
4 | The fund transitioned from the Harbor Strategic Growth Fund to the Mar Vista Strategic Growth Fund on July 22, 2022. |
The accompanying notes are an integral part of these financial statements.
Mar Vista Strategic Growth Fund
| NOTES TO FINANCIAL STATEMENTS |
| October 31, 2022 |
NOTE 1 – ORGANIZATION
The Mar Vista Strategic Growth Fund (formerly, the Harbor Strategic Growth Fund) (the “Strategic Growth Fund” or the “Fund”) is a series of Manager Directed Portfolios (formerly, The Roxbury Funds) (the “Trust”). The Trust is registered under the Investment Company Act of 1940, as amended (the “1940 Act”), and was organized as a Delaware statutory trust on April 4, 2006. The Fund is an open-end investment management company and is a diversified series of the Trust. The investment objective of the Fund is long-term growth of capital. The fund offers 3 classes of shares to investors: the Institutional, Investor, and Retirement classes. The Administrative class was collapsed into the Institutional class prior to conversion and shares were issued based upon the Institutional Shares’ net asset value per share. Each class of shares differs principally in its respective distribution or shareholder servicing expenses. Each class of shares has identical rights to earnings, assets and voting privileges, except for class-specific expenses and exclusive rights to vote on matters affecting only individual classes.
The Harbor Strategic Growth Fund (or the “Predecessor Fund”) is the successor to interest and has the same investment objective that was included as a series of another investment company, Harbor Funds, and that was advised by Harbor Capital and Sub-Advised by the Mar Vista Investment Partners. On July 1, 2022, the shareholders of the Predecessor Fund approved the tax-free reorganization of the Predecessor Fund with and into the Mar Vista Strategic Growth Fund, and effective as of the close of business on July 22, 2022, the assets and liabilities of the Predecessor Fund were transferred to the Trust in exchange for shares of the Mar Vista Strategic Growth Fund. For financial reporting purposes, assets received and shares issued by Mar Vista were recorded at fair value; however, the cost basis of the investments received from the Predecessor Fund was carried forward to align ongoing reporting of Mar Vista’s realized and unrealized gains and losses with amounts distributable to shareholders for tax purposes. Costs incurred by the Mar Vista Strategic Growth Fund, in connection with the reorganization were paid by the Adviser. The fiscal year end of the Predecessor Fund was October 31, which remained the same. Operations prior to July 22, 2022 were that of the Predecessor Fund. The net assets were $73,590,993, including $26,342,178 of net unrealized appreciation, $56,484 of undistributed net investment income, and $13,509,548 of undistributed net realized gain and shares outstanding were 3,021,636, all of which were transferred into the Trust at NAV at the close of business on July 22, 2022.
NOTE 2 – SIGNIFICANT ACCOUNTING POLICIES
The following is a summary of significant accounting policies consistently followed by the Fund. These policies are in conformity with U.S. generally accepted accounting principles (“GAAP”). The Fund is an investment company and accordingly follows the investment company accounting and reporting guidance of the Financial Accounting Standards Board (FASB) Accounting Standard Codification Topic 946 “Financial Services – Investment Companies” including FASB Accounting Standard Update ASU 2013-08.
Mar Vista Strategic Growth Fund
| NOTES TO FINANCIAL STATEMENTS (Continued) |
| October 31, 2022 |
| | A. | Security Valuation: All investments in securities are recorded at their estimated fair value, as described in Note 3. |
| | | |
| | B. | Federal Income Taxes: It is the Fund’s policy to continue to comply with the requirements of Subchapter M of the Internal Revenue Code applicable to regulated investment companies and to distribute substantially all of its taxable income to its shareholders. Therefore, no federal income or excise tax provisions are required. |
| | | |
| | | The Fund recognizes the tax benefits of uncertain tax positions only where the position is “more likely than not” to be sustained assuming examination by tax authorities. Management has analyzed the Fund’s tax positions, and has concluded that no liability for unrecognized tax benefits should be recorded related to uncertain tax positions to be taken or expected to be taken on a tax return. The tax returns for the Fund for the prior three fiscal years are open for examination. The Fund identifies its major tax jurisdictions as U.S. Federal and the state of Delaware. |
| | | |
| | C. | Securities Transactions, Income and Distributions: Securities transactions are accounted for on the trade date. Realized gains and losses on securities sold are determined on the basis of identified cost. Interest income is recorded on an accrual basis. Dividend income and distributions to shareholders are recorded on the ex-dividend date. Withholding taxes on foreign dividends have been provided for in accordance with the Fund’s understanding of the applicable country’s tax rules and rates. |
| | | |
| | | The Fund distributes substantially all of its net investment income, if any, and net realized capital gains, if any, annually. Distributions from net realized gains for book purposes may include short-term capital gains. All short-term capital gains are included in ordinary income for tax purposes. The amount of dividends and distributions to shareholders from net investment income and net realized capital gains is determined in accordance with federal income tax regulations, which differ from GAAP. To the extent these book/tax differences are permanent, such amounts are reclassified within the capital accounts based on their federal tax treatment. |
| | | |
| | | Investment income, expenses (other than those specific to the class of shares), and realized and unrealized gains and losses on investments are allocated to the separate classes of the Fund’s shares based upon their relative net assets on the date income is earned or expensed and realized and unrealized gains and losses are incurred. |
| | | |
| | | The Fund is charged for those expenses that are directly attributable to it, such as investment advisory, custody and transfer agent fees. Expenses that are not attributable to the Fund are typically allocated among the funds in the Trust proportionately based on allocation methods approved by the Board of Trustees (the “Board”). Common expenses of the Trust are typically allocated among the funds in the Trust based on a fund’s respective net assets, or by other equitable means. |
Mar Vista Strategic Growth Fund
| NOTES TO FINANCIAL STATEMENTS (Continued) |
| October 31, 2022 |
| | D. | Use of Estimates: The preparation of financial statements in conformity with GAAP requires management to make estimates and assumptions that affect the reported amounts of assets and liabilities at the date of the financial statements and the reported amounts of increases and decreases in net assets during the reporting period. Actual results could differ from those estimates. |
| | | |
| | E. | Reclassification of Capital Accounts: GAAP requires that certain components of net assets relating to permanent differences be reclassified between financial and tax reporting. These reclassifications have no effect on net assets or net asset value per share. |
| | | |
| | F. | Events Subsequent to the Fiscal Year End: In preparing the financial statements as of October 31, 2022, management considered the impact of subsequent events for potential recognition or disclosure in the financial statements and concluded that no additional disclosures are necessary. |
NOTE 3 – SECURITIES VALUATION
The Fund has adopted authoritative fair value accounting standards which establish an authoritative definition of fair value and set out a hierarchy for measuring fair value. These standards require additional disclosures about the various inputs and valuation techniques used to develop the measurements of fair value, a discussion of changes in valuation techniques and related inputs during the period, and expanded disclosure of valuation levels for major security types. These inputs are summarized in the three broad levels listed below:
| | Level 1 – | Unadjusted quoted prices in active markets for identical assets or liabilities that the Fund has the ability to access. |
| | | |
| | Level 2 – | Observable inputs other than quoted prices included in Level 1 that are observable for the asset or liability, either directly or indirectly. These inputs may include quoted prices for the identical instrument on an inactive market, prices for similar instruments, interest rates, prepayment speeds, credit risk, yield curves, default rates and similar data. |
| | | |
| | Level 3 – | Unobservable inputs for the asset or liability, to the extent relevant observable inputs are not available, representing the Fund’s own assumptions about the assumptions a market participant would use in valuing the asset or liability, and would be based on the best information available. |
Following is a description of the valuation techniques applied to the Fund’s major categories of assets and liabilities measured at fair value on a recurring basis.
Equity Securities: Equity securities, including common stocks, preferred stocks, foreign-issued common stocks, exchange-traded funds, closed-end mutual funds and real estate investment trusts (REITs), that are primarily traded on a national securities exchange shall be valued at the last sale price on the exchange on which they are primarily traded on the day of valuation or, if there has been no sale on such day, at the
Mar Vista Strategic Growth Fund
| NOTES TO FINANCIAL STATEMENTS (Continued) |
| October 31, 2022 |
mean between the bid and asked prices. Securities primarily traded in the NASDAQ Global Market System for which market quotations are readily available shall be valued using the NASDAQ Official Closing Price (“NOCP”). If the NOCP is not available, such securities shall be valued at the last sale price on the day of valuation, or if there has been no sale on such day, at the mean between the bid and asked prices. Over-the-counter securities that are not traded on a listed exchange are valued at the last sale price in the over-the-counter market. Over-the-counter securities which are not traded in the NASDAQ Global Market System shall be valued at the mean between the bid and asked prices. To the extent these securities are actively traded and valuation adjustments are not applied, they are categorized in Level 1 of the fair value hierarchy.
Registered Investment Companies: Investments in registered investment companies (e.g., mutual funds) are generally priced at the ending NAV provided by the applicable registered investment company’s service agent and will be classified in Level 1 of the fair value hierarchy.
Short-Term Debt Securities: Debt securities, including short-term debt instruments having a maturity of less than 60 days, are valued at the evaluated mean price supplied by an approved pricing service. Pricing services may use various valuation methodologies including matrix pricing and other analytical pricing models as well as market transactions and dealer quotations. In the absence of prices from a pricing service, the securities will be priced in accordance with the procedures adopted by the Board. Short-term securities are generally classified in Level 1 or Level 2 of the fair market hierarchy depending on the inputs used and market activity levels for specific securities.
In the absence of prices from a pricing service or in the event that market quotations are not readily available, fair value will be determined under the Fund’s valuation procedures adopted pursuant to Rule 2a-5. Pursuant to those procedures, the Board has appointed the Advisor as the Fund’s valuation designee (the “Valuation Designee”) to perform all fair valuations of the Fund’s portfolio investments, subject to the Board’s oversight. As the Valuation Designee, the Advisor has established procedures for its fair valuation of the Fund’s portfolio investments. These procedures address, among other things, determining when market quotations are not readily available or reliable and the methodologies to be used for determining the fair value of investments, as well as the use and oversight of third-party pricing services for fair valuation.
Depending on the relative significance of the valuation inputs, fair valued securities may be classified in either Level 2 or Level 3 of the fair value hierarchy.
Mar Vista Strategic Growth Fund
| NOTES TO FINANCIAL STATEMENTS (Continued) |
| October 31, 2022 |
The inputs or methodology used for valuing securities are not an indication of the risk associated with investing in those securities. The following is a summary of the fair valuation hierarchy of the Small-Cap Growth Fund’s securities as of October 31, 2022:
| | | Level 1 | | | Level 2 | | | Level 3 | | | Total | |
| Common Stocks | | | | | | | | | | | | |
| Communication Services | | $ | 4,450,360 | | | $ | — | | | $ | — | | | $ | 4,450,360 | |
| Consumer Discretionary | | | 4,234,164 | | | | — | | | | — | | | | 4,234,164 | |
| Consumer Staples | | | 1,847,758 | | | | — | | | | — | | | | 1,847,758 | |
| Financials | | | 13,751,749 | | | | — | | | | — | | | | 13,751,749 | |
| Health Care | | | 5,084,709 | | | | — | | | | — | | | | 5,084,709 | |
| Industrials | | | 8,381,428 | | | | — | | | | — | | | | 8,381,428 | |
| Information Technology | | | 21,050,949 | | | | — | | | | — | | | | 21,050,949 | |
| Materials | | | 4,973,774 | | | | — | | | | — | | | | 4,973,774 | |
| Total Common Stocks | | | 63,774,891 | | | | — | | | | — | | | | 63,774,891 | |
| REITs | | | 2,259,822 | | | | — | | | | — | | | | 2,259,822 | |
| Short-Term Investments | | | 1,025,448 | | | | — | | | | — | | | | 1,025,448 | |
| Investments Purchased | | | | | | | | | | | | | | | | |
| with Cash Proceeds | | | | | | | | | | | | | | | | |
| from Securities Lending | | | 676,578 | | | | — | | | | — | | | | 676,578 | |
| Total Investments in Securities | | $ | 67,736,739 | | | $ | — | | | $ | — | | | $ | 67,736,739 | |
NOTE 4 – INVESTMENT ADVISORY FEE AND OTHER TRANSACTIONS WITH AFFILIATES
For the fiscal year period October 31, 2022, Mar Vista Investment Partners, (the “Advisor”) provided the Fund with investment management services under an Investment Advisory Agreement. The Advisor furnishes all investment advice, office space, and facilities, and provides most of the personnel needed by the Fund. As compensation for its services, the Advisor is entitled to a monthly fee at an annual rate of 0.60% of the average daily net assets of the Fund. For the fiscal period ended October 31, 2022, the Strategic Growth Fund incurred $519,841 in advisory fees. Advisory fees payable at October 31, 2022 for the Strategic Growth Fund were $3,668.
The Fund is responsible for its own operating expenses. The Advisor has contractually agreed to waive a portion of its fees and reimburse certain expenses for the Fund to ensure that the total annual fund operating expenses [excluding front-end or contingent deferred loads, Rule 12b-1 plan fees, shareholder servicing plan fees, taxes, leverage, interest, brokerage commissions and other transactional expenses, expenses in connection with a merger or reorganization, dividends or interest on short positions, acquired fund fees and expenses or extraordinary expenses (collectively, “Excludable Expenses”)] do not exceed the following amounts of the average daily net assets for each class of shares:
Mar Vista Strategic Growth Fund
| NOTES TO FINANCIAL STATEMENTS (Continued) |
| October 31, 2022 |
| | Investor Shares | | | 1.07 | % |
| | Institutional Shares | | | 0.71 | % |
| | Retirement Shares | | | 0.63 | % |
| | Administrative Shares | | | 0.96 | %* |
| | | | | | |
| | * Prior to 7/22/2022 | | | | |
For the period from July 25, 2022 through October 31, 2022, the Advisor reduced its fees in the amount of $92,451 for the Fund. The waivers and reimbursements will be recoupable through October 31, 2025 unless terminated sooner by mutual agreement of the Board and the Advisor.
U.S. Bancorp Fund Services, LLC, doing business as U.S. Bank Global Fund Services, LLC (“Fund Services” or the “Administrator”) acts as the Fund’s Administrator under an Administration Agreement. The Administrator prepares various federal and state regulatory filings, reports and returns for the Fund; prepares reports and materials to be supplied to the Trustees; monitors the activities of the Fund’s custodian, transfer agent and accountants; coordinates the preparation and payment of the Fund’s expenses and reviews the Fund’s expense accruals. Fund Services also serves as the fund accountant and transfer agent to the Fund. Vigilant Compliance, LLC serves as the Chief Compliance Officer to the Fund. U.S. Bank N.A., an affiliate of Fund Services, serves as the Fund’s custodian. For the fiscal period ended October 31, 2022, the Fund incurred the following expenses for administration, fund accounting, transfer agency and custody fees:
| | Administration & fund accounting | | $ | 39,548 | |
| | Custody | | $ | 9,313 | |
| | Transfer agency | | $ | 76,324 | |
At October 31, 2022, the Fund had payables due to Fund Services for administration, fund accounting and transfer agency fees and to U.S. Bank N.A. for custody fees in the following amounts:
| | Administration & fund accounting | | $ | 39,548 | |
| | Custody | | $ | 2,727 | |
| | Transfer agency | | $ | 16,434 | |
Quasar Distributors, LLC (the “Distributor”) acts as the Fund’s principal underwriter in a continuous public offering of the Fund’s shares. On July 7, 2021, Foreside Financial Group, LLC (“Foreside”), the parent company of Quasar Distributors, LLC (“Quasar”), the Fund’s distributor, announced that it had entered into a definitive purchase and sale agreement with Genstar Capital (“Genstar”) such that Genstar would acquire a majority stake in Foreside. The transaction closed at the end of the third quarter of 2021. Quasar will remain the Fund’s distributor at the close of the transaction, subject to Board approval.
Certain officers of the Fund are employees of the Administrator and are not paid any fees by the Fund for serving in such capacities.
Mar Vista Strategic Growth Fund
| NOTES TO FINANCIAL STATEMENTS (Continued) |
| October 31, 2022 |
NOTE 5 – DISTRIBUTION AGREEMENT AND PLAN
The Fund has adopted a Distribution Plan pursuant to Rule 12b-1 (the “Plan”). The Plan permits the Fund to pay for distribution and related expenses at an annual rate of up to 0.25% of the average daily net assets of the Fund’s Investor Shares and Administrative Shares. The expenses covered by the Plan may include costs in connection with the promotion and distribution of shares and the provision of personal services to shareholders, including, but not necessarily limited to, advertising, compensation to underwriters, dealers and selling personnel, the printing and mailing of prospectuses to other than current Fund shareholders, and the printing and mailing of sales literature. Payments made pursuant to the Plan will represent compensation for distribution and service activities, not reimbursements for specific expenses incurred. For the fiscal year ended October 31, 2022, the Strategic Growth Fund incurred distribution expenses of $2,131 on its Investor Shares and $79 on its Administrative Shares.
NOTE 6 – SHAREHOLDER SERVICING FEE
The Fund has adopted a shareholder servicing plan (the “Plan”) on behalf of the Investor and Institutional Share classes on May 17th, 2022 with an effective date of July 22, 2022. Under the Plan, the Investor and Institutional Share Classes are authorized to pay an annual shareholder servicing fee of up to 0.10% of each class’s average daily net assets. This fee is used to finance certain activities related to servicing and maintaining shareholder accounts. Payments made under the Plan may not be used to pay for any services in connection with the distribution and sale of the Investor and Institutional Shares.
Payments to the Advisor under the Plan may reimburse the Advisor for payments it makes to selected brokers, dealers and administrators which have entered into service agreements with the Advisor for services provided to Investor and Institutional Class shareholders of the Fund. The services provided by such intermediaries are primarily designed to assist Investor and Institutional Class shareholders of the Fund and include the furnishing of office space and equipment, telephone facilities, personnel, and assistance to the Fund in servicing such shareholders. Services provided by such intermediaries also include the provision of support services to the Fund and include establishing and maintaining shareholders’ accounts and record processing, purchase and redemption transactions, answering routine client inquiries regarding the Fund, and providing such other personal services to shareholders as the Fund may reasonably request. For the fiscal Period ended October 31, 2022, the Fund incurred, under the Agreement, shareholder servicing fees as follows:
| | Investor Shares | | $ | 975 | |
| | Institutional Shares | | $ | 26,646 | |
Mar Vista Strategic Growth Fund
| NOTES TO FINANCIAL STATEMENTS (Continued) |
| October 31, 2022 |
NOTE 7 – SECURITIES TRANSACTIONS
For the fiscal period ended October 31, 2022, the cost of purchases and the proceeds from sales of securities, excluding short-term securities, were as follows:
| | | | Purchases | | | Sales | |
| | Strategic Growth Fund | | $ | 22,087,397 | | | $ | 51,705,409 | |
There were no purchases or sales of long-term U.S. Government securities.
NOTE 8 – INCOME TAXES AND DISTRIBUTIONS TO SHAREHOLDERS
As of October 31, 2022, the components of accumulated earnings/(losses) on a tax basis were as follows:
| | | | Strategic | |
| | | | Growth Fund | |
| | Cost of investments(a) | | $ | 42,535,627 | |
| | Gross unrealized appreciation | | | 26,119,282 | |
| | Gross unrealized depreciation | | | (918,170 | ) |
| | Net unrealized appreciation | | | 25,201,112 | |
| | Undistributed ordinary income | | | 204,077 | |
| | Undistributed long-term capital gain | | | 8,862,058 | |
| | Total distributable earnings | | | 9,066,135 | |
| | Other accumulated gains/(losses) | | | (4,446 | ) |
| | Total accumulated earnings/(losses) | | $ | 34,262,801 | |
| | (a) | The difference between the book basis and tax basis net unrealized appreciation and cost is attributable primarily to wash sales. |
As of October 31, 2022, the Strategic Growth Fund had no short-term or long-term tax basis capital losses to offset future capital gains.
The tax character of distributions paid during the period ended October 31, 2022, and the year ended October 31, 2021 was as follows:
| | | | Year Ended | | | Year Ended | |
| | | | October 31, 2022 | | | October 31, 2021 | |
| | Strategic Growth Fund | | | | | | |
| | Ordinary income | | $ | 522,628 | | | $ | 439,000 | |
| | Long-term capital gains | | | 9,379,420 | | | | 3,413,000 | |
| | | | $ | 9,902,048 | | | $ | 3,852,000 | |
At October 31, 2022 the fund had no deferred tax basis post October losses.
Mar Vista Strategic Growth Fund
| NOTES TO FINANCIAL STATEMENTS (Continued) |
| October 31, 2022 |
For the fiscal year ended October 31, 2022, the effect of permanent “book/tax” reclassifications resulted in increases and decreases to components of the Funds’ net assets as follows:
| | | Total Accumulated | Paid-In |
| | | Earnings/Loss | Capital |
| | Strategic Growth Fund | $(3,044,562) | $3,044,562 |
NOTE 9 – SECURITIES LENDING
The Fund participates in securities lending arrangements whereby it lends certain of its portfolio securities to brokers, dealers and financial institutions (not with individuals) in order to receive additional income and increase the rate of return of its portfolio. U.S. Bank, N.A. serves as the Fund’s securities lending agent.
U.S. Bank, N.A. oversees the securities lending process, which includes the screening, selection and ongoing review of borrowers, monitoring the availability of securities, negotiating rebates, daily marking to market of loans, monitoring and maintaining cash collateral levels, processing securities movements and reinvesting cash collateral as directed by the Adviser.
The Fund may lend securities pursuant to agreements that require the loans to be secured by collateral consisting of cash, securities of the U.S. Government or it agencies, or any combination of cash and such securities. At that time of loans, the collateral value should at least be equal to 102% of domestic securities and 105% of foreign securities. The value of loaned securities will then be marked-to-market daily and the collateral will be continuously secured by collateral equal to 100% of the market value of the loaned securities. Such loans will not be made if, as a result, the aggregate amount of all outstanding securities loans for the Fund exceeds one-third of the value of the Fund’s total assets taken at fair market value. The Fund will earn interest on the investment of the cash collateral in U.S. Government securities, short-term money market instruments or such other approved vehicle. However, the Fund will normally pay lending fees to such broker-dealers and related expenses from the interest earned on invested collateral. There may be risks of delay in receiving additional collateral or risks of delay in recovery of the securities and even loss of rights in the collateral should the borrower of the securities fail financially. However, loans are made only to borrowers deemed by the adviser to be of good standing and when, in the judgment of the adviser, the consideration that can be earned currently from such securities loans justifies the attendant risk. Either party, upon reasonable notice to the other party, may terminate the loan.
As of October 31, 2022, the Fund had loaned securities that were collateralized by cash. The cash collateral received was invested in securities as listed in the Fund’s Schedule of Investments.
Mar Vista Strategic Growth Fund
| NOTES TO FINANCIAL STATEMENTS (Continued) |
| October 31, 2022 |
The following table presents the securities out on loan for the Fund, and the collateral delivered related to those securities, as of the end of the reporting period.
Securities Lending Transactions
| | | | Investments | | |
| | | | Purchased with | Collateral | |
| | Overnight and | Asset Class | Proceeds from | Pledged from | Net |
| | Continuous | out on Loan | Securities Lending | Counterparty^ | Exposure |
| | Mar Vista Strategic | | | | |
| | Growth Fund | Common Stock | $676,578 | $676,578 | $ — |
| | ^ | As of the end of the reporting period, the value of the collateral pledged from the counterparty exceeded the value of the securities out on loan. Refer to the Fund’s Schedule of Investments for details on the securities out on loan. |
NOTE 10 – PRINCIPAL RISKS
The following is a list of certain risks that may apply to your investment in the Fund. Further information about investment risks is available in the Fund’s Statement of Additional Information.
General Market Risk; Recent Market Events: The value of the Fund’s shares will fluctuate based on the performance of the Fund’s investments and other factors affecting the securities markets generally. Certain investments selected for the Fund’s portfolio may be worth less than the price originally paid for them, or less than they were worth at an earlier time. The value of the Fund’s investments may go up or down, sometimes dramatically and unpredictably, based on current market conditions, such as real or perceived adverse political or economic conditions, inflation, changes in interest rates, lack of liquidity in the fixed income markets or adverse investor sentiment.
U.S. and international markets have experienced volatility in recent months and years due to a number of economic, political and global macro factors, including the impact of the coronavirus (COVID-19) global pandemic, which has resulted in a public health crisis, business interruptions, growth concerns in the U.S. and overseas, layoffs, rising unemployment claims, changed travel and social behaviors and reduced consumer spending. The effects of COVID-19 may lead to a substantial economic downturn or recession in the U.S. and global economies, the recovery from which is uncertain and may last for an extended period of time.
Small-Cap Company Risk: Companies in which the Fund invests may be more vulnerable than larger companies to adverse business or economic developments. Small-cap companies may also have limited product lines, markets, or financial resources, may be dependent on relatively small or inexperienced management groups, and may operate in industries characterized by rapid technological obsolescence. Securities of such companies may be less liquid, more volatile and more difficult to value than securities of larger companies and therefore may involve greater risk than investing in large companies.
Mar Vista Strategic Growth Fund
| NOTES TO FINANCIAL STATEMENTS (Continued) |
| October 31, 2022 |
Growth-Style Investing Risk: An investment in a growth-oriented fund may be more volatile than the rest of the U.S. market as a whole. If the investment adviser’s assessment of a company’s prospects for earnings growth or how other investors will value the company’s earnings growth is incorrect, the stock may fail to reach the value that the adviser has placed on it. Growth stock prices tend to fluctuate more dramatically than the overall stock market.
Foreign Security Risk: Foreign investments involve risks relating to political, economic, regulatory, or social instability, military action or unrest, or diplomatic developments and may be affected by actions of foreign governments adverse to the interest of U.S. investors.
IPO Risk: The Fund may purchase securities of companies engaged in initial public offerings (“IPOs”). The price of securities purchased in IPOs can be very volatile. The Fund’s investments in IPO shares may include the securities of “unseasoned” companies (companies with less than three years of continuous operations), which present risks considerably greater than common stocks of more established companies. These companies may be involved in new and evolving businesses and may be vulnerable to competition and changes in technology, markets and economic conditions. They may be more dependent on key managers and third parties and may have limited product lines. The effect of IPO investments on a Fund’s performance depends on a variety of factors, including the number of IPOs the Fund invests in relative to the size of the Fund, and whether and to what extent a security purchased in an IPO appreciates or depreciates in value. When the Fund’s asset base is small, a significant portion of the Fund’s performance could be attributable to investments in IPOs because such investments would have a magnified impact on the Fund. As the Fund’s asset grow, the effect of the Fund’s investments in IPOs on the Fund’s performance probably will decline, which could reduce the Fund’s performance.
Liquidity Risk: Certain securities may be difficult or impossible to sell at the time and the price that the seller would like. While the markets in securities of small companies have grown rapidly in recent years, such securities may trade less frequently and in smaller volumes than more widely held securities. The values of these securities may fluctuate more sharply than those of other securities, and the Fund may experience some difficulty in establishing or closing out positions in these securities at prevailing market prices. There may be less publicly available information about the issuers of these securities or less market interest in such securities than in the case of larger companies, and it may take a longer period of time for the prices of such securities to reflect the full value of their issuers’ underlying earnings potential or assets.
Mutual Fund and ETF Trading Risk: The Fund may invest in other mutual funds that are either open-end or closed-end investment companies as well as Exchange Traded Funds (“ETFs”). ETFs are investment companies that are bought and sold on a national securities exchange. Unlike mutual funds, ETFs do not necessarily trade at the net asset
Mar Vista Strategic Growth Fund
| NOTES TO FINANCIAL STATEMENTS (Continued) |
| October 31, 2022 |
values of their underlying securities, which means an ETF could potentially trade above or below the value of the underlying portfolios. Additionally, because ETFs trade like stocks on exchanges, they are subject to trading and commission costs unlike mutual funds. Also, both mutual funds and ETFs have management fees that are part of its costs, and the Fund will indirectly bear their proportionate share of the costs.
NOTE 11 – GUARANTEES AND INDEMNIFICATIONS
In the normal course of business, the Fund enters into contracts that contain a variety of representations and warranties and which provide general indemnifications. The Fund’s maximum exposure under these arrangements is unknown, as this would involve future claims that may be made against the Fund that have not yet occurred. However, based on experience, the Fund expects the risk of loss to be remote.
NOTE 12 – CONTROL OWNERSHIP
The beneficial ownership, either directly or indirectly, of more than 25% of the voting securities of a fund creates a presumption of control of the fund, under Section 2(a)(9) of the 1940 Act. As of October 31, 2022, Pershing LLC held 29% of the outstanding shares of the Fund. The Fund has no knowledge as to whether all or any portion of the shares owned of record by Pershing LLC are also beneficially owned.
Mar Vista Strategic Growth Fund
| REPORT OF INDEPENDENT REGISTERED PUBLIC ACCOUNTING FIRM |
| |
To the Board of Trustees of Manager Directed Portfolios
and the Shareholders of the Mar Vista Strategic Growth Fund
Opinion on the Financial Statements
We have audited the accompanying statement of assets and liabilities of Mar Vista Strategic Growth Fund, a series of shares of beneficial interest in Manager Directed Portfolios (the “Fund”), including the schedule of investments, as of October 31, 2022, and the related statement of operations, statement of changes in net assets, and the financial highlights for the year then ended, and the related notes (collectively referred to as the “financial statements”). In our opinion, the financial statements present fairly, in all material respects, the financial position of the Fund as of October 31, 2022, and the results of its operations, the changes in its net assets, and its financial highlights for the year then ended, in conformity with accounting principles generally accepted in the United States of America. The statement of change in net assets for the year ended October 31, 2021, and the financial highlights for each of the years in the four year period then ended, were audited by other auditors whose report dated December 21, 2021, expressed an unqualified opinion on those financial statement and financial highlights.
Basis for Opinion
These financial statements are the responsibility of the Fund’s management. Our responsibility is to express an opinion on the Fund’s financial statements based on our audit. We are a public accounting firm registered with the Public Company Accounting Oversight Board (United States) (“PCAOB”) and are required to be independent with respect to the Fund in accordance with the U.S. federal securities law and the applicable rules and regulations of the Securities and Exchange Commission and the PCAOB.
We conducted our audit in accordance with the standards of the PCAOB. Those standards require that we plan and perform the audit to obtain reasonable assurance about whether the financial statements are free of material misstatement, whether due to error or fraud. The Fund is not required to have, nor were we engaged to perform, an audit of its internal control over financial reporting. As part of our audit we are required to obtain an understanding of internal control over financial reporting but not for the purpose of expressing an opinion on the effectiveness of the Fund’s internal control over financial reporting. Accordingly, we express no such opinion.
Our audit included performing procedures to assess the risk of material misstatement of the financial statements, whether due to error or fraud, and performing procedures that respond to those risks. Such procedures included examining, on a test basis, evidence regarding the amounts and disclosures in the financial statements. Our procedures included confirmation of securities owned as of October 31, 2022 by correspondence with the custodian. Our audit also included evaluating the accounting principles used and significant estimates made by management, as well as evaluating the overall presentation of the financial statements. We believe that our audit provides a reasonable basis for our opinion.
BBD, LLP
We have served as the auditor of one or more of the Funds in the Manager Directed Portfolios since 2007.
Philadelphia, Pennsylvania
December 29, 2022
Mar Vista Strategic Growth Fund
| CHANGE IN INDEPENDENT REGISTERED PUBLIC ACCOUNTING FIRM |
| |
The Fund has selected BBD, LLP (“BBD”) to serve as the Fund’s independent registered public accounting firm for the Fund’s fiscal year ended October 31, 2022. The decision to select BBD was recommended by the Fund’s Audit Committee and was approved by the Fund’s Board of Trustees on May 17, 2022. During the fiscal year ended October 31, 2021, neither the Fund, nor anyone on its behalf, consulted with BBD on items which: (i) concerned the application of accounting principles to a specified transaction, either completed or proposed, or the type of audit opinion that might be rendered on the Fund’s financial statements; or (ii) concerned the subject of a disagreement (as defined in paragraph (a)(1)(iv) of Item 304 of Regulation S-K) or reportable events (as described in paragraph (a)(1)(iv) of said Item 304). The selection of BBD does not reflect any disagreements with or dissatisfaction by the Fund or the Fund’s Board of Trustees with the performance of the Fund’s prior independent registered public accounting firm, Ernst & Young LLP (“EY”), for the fiscal year ended October 31, 2021. EY has since resigned as the Independent Registered Public Accounting Firm for the Fund. EY’s report on the Fund’s financial statements for fiscal year ended October 31, 2021 contained no adverse opinion or disclaimer of opinion, nor were they qualified or modified as to uncertainty, audit scope, or accounting principles. During the Fund’s fiscal year ended October 31, 2021 and the subsequent interim period through December 21, 2021 (i) there were no disagreements with EY on any matter of accounting principles or practices, financial statement disclosure, or auditing scope or procedure, which disagreements, if not resolved to the satisfaction of EY, would have caused them to make reference to the subject matter of the disagreements in connection with their reports on the Fund’s financial statements for such years; and (ii) there were no “reportable events” of the kind described in Item 304(a)(1)(v) of Regulation S-K.
Mar Vista Strategic Growth Fund
| EXPENSE EXAMPLE |
| October 31, 2022 (Unaudited) |
As a shareholder of the Fund, you incur two types of costs: (1) transaction costs including sales charges (loads) and redemption fees, if applicable; and (2) ongoing costs, including management fees; distribution and/or service (12b-1 fees); and other Fund expenses. This Example is intended to help you understand your ongoing costs (in dollars) of investing in the Fund and to compare these costs with the ongoing costs of investing in other mutual funds.
The Example is based on an investment of $1,000 invested at the beginning of the period indicated and held for the entire period from April 30, 2022, to October 31, 2022 for the Institutional, Investor, and Retirement Shares.
Actual Expenses
The information in the table under the heading “Actual” provides information about actual account values and actual expenses. You may use the information in these columns together with the amount you invested, to estimate the expenses that you paid over the period. Simply divide your account value by $1,000 (for example, an $8,600 account value divided by $1,000 = 8.6), then multiply the result by the number in the row entitled “Expenses Paid During Period” to estimate the expenses you paid on your account during this period. There are some account fees that are charged to certain types of accounts, such as Individual Retirement Accounts (generally, a $15 fee is charged to the account annually) that would increase the amount of expenses paid on your account. The example below does not include portfolio trading commissions and related expenses and other extraordinary expenses as determined under generally accepted accounting principles.
Hypothetical Example for Comparison Purposes
The information in the table under the heading “Hypothetical (5% return before expenses)” provides information about hypothetical account values and hypothetical expenses based on the Fund’s actual expense ratio and assumed rate of return of 5% per year before expenses, which is not the Fund’s actual return. The hypothetical account values and expenses may not be used to estimate the actual ending account balance or expenses you paid for the period. You may use this information to compare the ongoing costs of investing in the Fund and other funds. To do so, compare this 5% hypothetical example with the 5% hypothetical examples that appear in the shareholder reports of the other funds. As noted above, there are some account fees that are charged to certain types of accounts that would increase the amount of expense paid on your account.
Please note that the expenses shown in the table are meant to highlight your ongoing costs only and do not reflect any transaction costs, such as sales charges (loads), redemption fees, or exchange fees. Therefore, the information under the heading “Hypothetical (5% return before expenses)” is useful in comparing ongoing costs only, and will not help you determine the relative total costs of owning different funds. In addition, if these transactional costs were included, your costs would have been higher.
Mar Vista Strategic Growth Fund
| EXPENSE EXAMPLE (Continued) |
| October 31, 2022 (Unaudited) |
| | Beginning | Ending | Expenses Paid |
| | Account Value | Account Value | During Period(1) |
| | 4/30/22 | 10/31/22 | 4/30/22 – 10/31/2022 |
| Actual | | | |
| Institutional Shares | $1,000.00 | $ 929.90 | $3.45 |
| Investor Shares | $1,000.00 | $ 928.30 | $5.20 |
| Retirement Shares | $1,000.00 | $ 930.00 | $3.06 |
| | | | |
| Hypothetical (5% return | | | |
| before expenses) | | | |
| Institutional Shares | $1,000.00 | $1,021.63 | $3.62 |
| Investor Shares | $1,000.00 | $1,019.81 | $5.45 |
| Retirement Shares | $1,000.00 | $1,022.03 | $3.21 |
(1) | Expenses are equal to the Institutional, Investor, and Retirement Shares’ annualized expense ratios of 0.71%, 1.07% and 0.63%, respectively, multiplied by the average account value over the period, multiplied by 184/365 (to reflect the period). |
Mar Vista Strategic Growth Fund
| NOTICE TO SHAREHOLDERS |
| at October 31, 2022 (Unaudited) |
How to Obtain a Copy of the Fund’s Proxy Voting Policies
A description of the policies and procedures that the Fund uses to determine how to vote proxies relating to portfolio securities is available without charge, upon request, by calling 1-833-627-6668 or on the U.S. Securities and Exchange Commission’s (“SEC”) website at http://www.sec.gov.
How to Obtain a Copy of the Fund’s Proxy Voting Records for the most recent 12-Month Period Ended June 30
Information regarding how the Fund voted proxies relating to portfolio securities during the most recent 12-month period ended June 30 is available no later than August 31 without charge, upon request, by 1-833-627-6668. Furthermore, you can obtain the Fund’s proxy voting records on the SEC’s website at http://www.sec.gov.
Quarterly Filings on Form N-PORT
The Fund files its complete schedule of portfolio holdings with the SEC for the first and third quarters of each fiscal year on Part F of Form N-PORT. The Fund’s Part F of Form N-PORT is available on the SEC’s website at http://www.sec.gov. Information included in the Fund’s Part F of Form N-PORT is also available, upon request, by calling 1-833-627-6668.
Qualified Dividend Income/Dividends Received Deduction
For the fiscal year ended October 31, 2022 certain dividends paid by the Funds may be subject to a maximum tax rate of 15%, as provided for by the Jobs and Growth Tax Relief Reconciliation Act of 2003. The percentage of dividends declared from ordinary income designated as qualified dividend income was as follows:
| | Mar Vista Strategic Growth Fund | 0.00% |
For corporate shareholders, the percent of ordinary income distributions qualifying for the corporate dividends received deduction for the fiscal year ended October 31, 2022 was as follows:
| | Mar Vista Strategic Growth Fund | 0.00% |
Mar Vista Strategic Growth Fund
| APPROVAL OF INVESTMENT ADVISORY AGREEMENT |
| (Unaudited) |
The Board of Trustees (the “Board” or “Trustees”) of Manager Directed Portfolios (the “Trust”) met on May 17, 2022 to consider the initial approval of the Investment Advisory Agreement (the “Advisory Agreement”) between the Trust, on behalf of the Mar Vista Strategic Growth Fund (the “Fund”), a new series of the Trust, and the Fund’s investment adviser, Mar Vista Investment Partners, LLC (“Mar Vista”). In approving the Advisory Agreement, the Board relied on an SEC order issued on June 19, 2020 that conditionally exempts registered investment companies from in-person voting requirements due to the COVID-19 pandemic.
As part of the meeting, and at a prior meeting held on February 15, 2022, the Trustees, all of whom are not “interested persons,” as that term is defined in the Investment Company Act of 1940, as amended (the “Independent Trustees”), requested and received materials to assist it in considering the approval of the Advisory Agreement. The materials provided contained information with respect to the factors enumerated below, including copies of the Advisory Agreement, a memorandum prepared by the Trust’s outside legal counsel discussing the Board’s fiduciary obligations and the factors the Board should consider in considering the approval of the Advisory Agreement, information relating to the past performance of Mar Vista and the performance of the Harbor Strategic Growth Fund (the predecessor to the Fund), as well as the proposed management fee of the Fund, due diligence materials relating to Mar Vista, including Form ADV, information regarding Mar Vista’s compliance program, personnel and financial condition, and other pertinent information. The Board also reviewed the advisory fee payable by the Fund under the Advisory Agreement, the expense cap agreement between the Trust, on behalf of the Fund, and Mar Vista, and comparative fee and expense information provided by Morningstar.
The Board noted that they had met with representatives of Mar Vista as part of the February 15, 2022 meeting to discuss the Fund’s proposed strategy and risks, Mar Vista’s investment experience, Mar Vista’s prior performance for similar strategies, Mar Vista’s compliance program and other matters relevant to the launch of the Fund. The Board also considered its prior experience with Mar Vista and the predecessor to the Harbor Strategic Growth Fund when it was a series of the Trust, prior to its reorganization into a series of Harbor Funds in 2017. Based on their evaluation of the information provided, the Trustees approved the Advisory Agreement for an initial two year term. Below is a summary of the material factors considered by the Board and the conclusions that formed the basis for the Board’s approval of the Advisory Agreement.
| 1. | NATURE, EXTENT AND QUALITY OF SERVICES TO BE PROVIDED TO THE FUND |
The Trustees considered the nature, extent and quality of services that would be provided by Mar Vista to the Fund. The Board considered the services to be provided by Mar Vista, including shareholder servicing and marketing, as well as portfolio
Mar Vista Strategic Growth Fund
| APPROVAL OF INVESTMENT ADVISORY AGREEMENT (Continued) |
| (Unaudited) |
management, strategy implementation, research, trading and compliance services. The Trustees considered the responsibilities of Mar Vista in the day to day management of the Fund, as well as the qualifications, experience and responsibilities of key personnel at Mar Vista who would be involved in the day to day activities of the Fund, including Messrs. Silas Meyers, Brian Massey, Joshua Honeycutt, and Jeffrey Prestine, who would serve as the portfolio managers of the Fund. The Trustees noted that Mar Vista was formed in 2007 and had served as the investment adviser and, before that, sub-adviser to a former series of the Trust. The Board considered Mar Vista’s experience managing equity securities and its strategic growth strategy. The Board also considered the structure of Mar Vista’s compliance program and marketing strategy for the Fund.
The Trustees reviewed the information provided by Mar Vista in response to the due diligence questionnaire and other information provided by Mar Vista. The Trustees, in consultation with counsel to the Independent Trustees and the Trust’s CCO, reviewed the compliance program maintained by Mar Vista, including Mar Vista’s code of ethics and other key policies, and considered the finding of the Trust’s CCO that Mar Vista’s compliance program was compliant with Rule 206(4) 7(a) under the Advisers Act. The Trustees concluded that Mar Vista had sufficient quality and depth of personnel, resources, investment methods, and compliance policies and procedures necessary to perform its duties under the Advisory Agreement and that the nature, overall quality, and extent of the management services to be provided by Mar Vista to the Fund were satisfactory.
| 2. | INVESTMENT PERFORMANCE OF THE ADVISER |
The Trustees noted Mar Vista currently acts as a sub-adviser to the predecessor fund, the Harbor Strategic Growth Fund, a series of Harbor Funds, which has a comprehensive operating history. The Board considered the investment performance of the Harbor Strategic Growth Fund and its predecessor fund since its inception in 2011. The Board also considered historical performance information for accounts managed by Mar Vista in the same or similar strategies as the Fund. The Board determined that Mar Vista has sufficient investment management experience to oversee the Fund.
| 3. | COSTS OF SERVICES PROVIDED AND PROFITS TO BE REALIZED BY THE ADVISER |
The Trustees considered Mar Vista’s estimated expenses in managing the Fund and the proposed management fee to be paid to Mar Vista by the Fund. The Trustees considered Mar Vista’s financial condition. The Trustees also considered the projected profitability of Mar Vista under the Advisory Agreement in the Fund’s first year of operations.
The Trustees considered the fees and expenses of the Fund relative to a peer group of US large growth funds, as compiled by Morningstar (the “Morningstar Peer Group”). The
Mar Vista Strategic Growth Fund
| APPROVAL OF INVESTMENT ADVISORY AGREEMENT (Continued) |
| (Unaudited) |
Board considered the Fund’s proposed management fee of 0.60% of the average annual net assets of the Fund, noting the fee was below the Morningstar Peer Group average. The Trustees considered that Mar Vista had agreed to waive a portion of its management fee and/or reimburse the Fund’s expenses for an initial term of two years and that the total net expense ratio for the Investor Class of the Fund was above the Morningstar Peer Group average while the Institutional and Retirement Classes of the Fund were below the Morningstar Peer Group average.
The Trustees also considered Mar Vista’s commentary regarding the Fund’s proposed advisory fee and the fee structure for its sub-advisory services to other mutual funds, noting the additional services provided by Mar Vista as investment adviser to the Fund.
The Trustees concluded the Fund’s expenses and the management fee to be paid to Mar Vista under the Advisory Agreement were fair and reasonable in light of the quality of services to be provided to the Fund. The Trustees further concluded that Mar Vista had sufficient financial resources to support its services to the Fund.
| 4. | EXTENT OF ECONOMIES OF SCALE AS THE FUND GROWS |
The Trustees compared the Fund’s proposed expenses relative to the Morningstar Peer Group and considered potential economies of scale. The Trustees also reviewed the structure of the Fund’s management fee and whether economies of scale would be expected to be realized as Fund assets grow (and if so, how those economies of scale would be shared with shareholders). The Trustees noted that the Fund’s management fee structure did not contain any breakpoint reductions as the Fund’s assets grow in size, and that the possibility of incorporating breakpoints could be reviewed in the future should assets grow significantly. The Trustees concluded that the proposed fee structure was reasonable.
| 5. | BENEFITS TO BE DERIVED FROM THE RELATIONSHIP WITH THE FUND |
The Trustees considered the direct and indirect benefits that could be realized by Mar Vista from its association with the Fund. The Trustees concluded the soft dollar research benefits Mar Vista may receive appear to be reasonable and may benefit the Fund.
CONCLUSION
In considering the Advisory Agreement, the Trustees did not identify any one factor as all important, but rather considered these factors collectively in light of the Fund’s surrounding circumstances. Based on this review, the Trustees, including a majority of the Independent Trustees, approved the Advisory Agreement for an initial two year term as being in the best interests of the Fund and its shareholders.
Mar Vista Strategic Growth Fund
Trustees and Officers
The business and affairs of the Trust are managed under the oversight of the Board, subject to the laws of the State of Delaware and the Trust’s Agreement and Declaration of Trust. The Board, as of January 1, 2021, is currently comprised of four trustees who are not interested persons of the Trust within the meaning of the 1940 Act (the “Independent Trustees”). The Trustees are responsible for deciding matters of overall policy and overseeing the actions of the Trust’s service providers. The officers of the Trust conduct and supervise the Trust’s daily business operations.
| | | | Number of | |
| | | | Funds in | Other |
| | Position(s) Held | | Fund | Directorships |
| Name, | with the Trust | | Complex | Held by Trustee |
| Year of Birth | and Length of | Principal Occupation(s) | Overseen by | During the |
and Address(1) | Time Served(2) | During the Past Five Years | Trustee(3) | Past Five Years |
| | | | | |
INDEPENDENT TRUSTEES | | | | |
| | | | | |
Gaylord B. Lyman | Trustee and Audit | Senior Portfolio Manager, Affinity | 10 | None |
(Born 1962) | Committee | Investment Advisors, LLC, since | | |
| | Chairman, since | 2017; Managing Director of | | |
| | April 2015 | Kohala Capital Partners, LLC | | |
| | | (2011 – 2016). | | |
| | | | | |
Scott Craven Jones | Trustee since | Managing Director, Carne Global | 10 | Trustee, |
(Born 1962) | July 2016 and | Financial Services (US) LLC | | Madison Funds, |
| | Lead Independent | (a provider of independent | | since 2019 |
| | Trustee since | governance and distribution | | (18 portfolios); |
| | May 2017 | support for the asset management | | Trustee, XAI |
| | | industry), since 2013; interim | | Octagon Floating |
| | | Managing Director, Park Agency, | | Rate & |
| | | Inc., since 2020. | | Alternative |
| | | | | Income Term |
| | | | | Trust, since 2017 |
| | | | | (2 portfolios); |
Mar Vista Strategic Growth Fund
| MANAGEMENT (Continued) |
| (Unaudited) |
| | | | Number of | |
| | | | Funds in | Other |
| | Position(s) Held | | Fund | Directorships |
| Name, | with the Trust | | Complex | Held by Trustee |
| Year of Birth | and Length of | Principal Occupation(s) | Overseen by | During the |
and Address(1) | Time Served(2) | During the Past Five Years | Trustee(3) | Past Five Years |
| | | | | |
Lawrence T. | Trustee since | Senior Vice President and Chief | 10 | None |
Greenberg | July 2016 | Legal Officer, The Motley Fool | | |
(Born 1963) | | Holdings, Inc., since 1996; | | |
| | | Venture Partner and General | | |
| | | Counsel, Motley Fool Ventures LP, | | |
| | | since 2018; Manager, Motley | | |
| | | Fool Wealth Management, LLC, | | |
| | | since 2013; Adjunct Professor, | | |
| | | Washington College of Law, | | |
| | | American University, since 2006; | | |
| | | General Counsel Motley Fool Asset | | |
| | | Management, LLC (2008 – 2019). | | |
| | | | | |
James R. Schoenike | Trustee since | Distribution consultant since 2018, | 10 | None |
(Born 1959) | July 2016(4) | President and CEO, Board of | | |
| | | Managers, Quasar Distributors, | | |
| | | LLC (2013 – 2018). | | |
(1) | The address of each Trustee as it relates to the Trust’s business is c/o U.S. Bank Global Fund Services, 615 East Michigan Street, Milwaukee, WI 53202. |
(2) | Each Trustee serves during the continued lifetime of the Trust until he dies, resigns, is declared bankrupt or incompetent by a court of competent jurisdiction, or is removed. |
(3) | The Trust currently has ten active portfolios. |
(4) | Prior to January 1, 2021, Mr. Schoenike was considered to be an “interested person” of the Fund by virtue of his previous position as President of Quasar Distributors, LLC. |
As of the date of this report, no Independent Trustee nor any of his immediate family members (i.e., spouse or dependent children) serves as an officer or director or is an employee of the Advisor, Sub-Advisor or Distributor, or any of their respective affiliates, nor is such person an officer, director or employee of any company controlled by or under common control with such entities.
Mar Vista Strategic Growth Fund
| MANAGEMENT (Continued) |
| (Unaudited) |
| Name | Position(s) Held with | |
| (Year of Birth) | Trust and Length | |
and Address | of Time Served(3) | Principal Occupation(s) During Past Five Years |
| | | |
OFFICERS | | |
| | | |
Scott M. Ostrowski(1) | President and Principal | Senior Vice President, Compliance and |
(Born 1980) | Executive Officer, | Administration, Fund Services, since 2006. |
| | since August 10, 2021 | |
| | | |
Ryan Frank(1) | Treasurer, and Principal | Vice President, Fund Services, since 2008. |
(Born 1985) | Financial Officer, | |
| | since August 17, 2022 | |
| | | |
Colton W. Scarmardo(1) | Assistant Treasurer, | Fund Administrator, Compliance and Administration, |
(Born 1997) | since May 11, 2021 | Fund Services, since 2019; Business Administration |
| | | Student, 2015 – 2019, MBA obtained May 2022. |
| | | |
Justin Dausch(2) | Chief Compliance | Director, Vigilant, since 2017; Compliance Associate, |
(Born 1989) | Officer and | HSBC (investment banking company), 2015-2017. |
| | Anti-Money Laundering | |
| | Compliance Officer, | |
| | since January 1, 2020 | |
| | | |
Alyssa M. Bernard(1) | Vice President | Assistant Vice President, Compliance and |
(Born 1988) | and Secretary, | Administration, Fund Services, since 2018; Attorney, |
| | since August 20, 2019(4) | Mutual Fund Disclosure, Waddell & Reed Financial, |
| | | Inc., 2017 – 2018; Attorney, Corporate Governance, |
| | | American Century Companies, Inc., 2014 – 2017. |
| | | |
Isabella K. Zoller(1) | Assistant Secretary, | Assistant Vice President, Fund Services, since 2021; |
(Born 1994) | since February 15, 2022 | Regulatory Administration Attorney, Fund Services, |
| | | since 2019; Regulatory Administration Intern, Fund |
| | | Services, 2018 – 2019; Law Student 2016 – 2019. |
(1) | The mailing address of this officer is: 615 East Michigan Street, Milwaukee, Wisconsin 53202. |
(2) | The mailing address of this officer is: 223 Wilmington West Chester Pike, Suite 216, Chadds Ford, Pennsylvania 19317. |
(3) | Each officer is elected annually and serves until his or her successor has been duly elected and qualified. |
(4) | Ms. Bernard has served as Vice President of the Trust, in addition to her other positions held with the Trust, since May 11, 2021. |
The Statement of Additional Information includes additional information about the Fund’s Trustees and Officers and is available, without charge, upon request by calling 1-800-497-2960.
Mar Vista Strategic Growth Fund
| NOTICE OF PRIVACY POLICY & PRACTICES |
| |
Protecting the privacy of Fund shareholders is important to us. The following is a description of the practices and policies through which we protect the privacy and security of your non-public personal information.
What Information We Collect
We collect and maintain information about you so that we can open and maintain your account in the Fund and provide various services to you. We collect non-public personal information about you from the following sources:
| | • | information we receive about you on applications or other forms; |
| | • | information you give us orally; and |
| | • | information about your transactions with us or others. |
The types of non-public personal information we collect and share can include:
| | • | social security number; |
| | • | account balances; |
| | • | account transactions; |
| | • | transaction history; |
| | • | wire transfer instructions; and |
| | • | checking account information. |
What Information We Disclose
We do not disclose any non-public personal information about shareholders or former shareholders of the Fund without the shareholder’s authorization, except as permitted by law or in response to inquiries from governmental authorities. We may share information with affiliated parties and unaffiliated third parties with whom we have contracts for servicing the Fund. We will provide unaffiliated third parties with only the information necessary to carry out their assigned responsibility.
How We Protect Your Information
All shareholder records will be disposed of in accordance with applicable law. We maintain physical, electronic and procedural safeguards to protect your non-public personal information and require third parties to treat your non-public personal information with the same high degree of confidentiality.
In the event that you hold shares of the Fund through a financial intermediary, including, but not limited to, a broker-dealer, bank or trust company, the privacy policy of your financial intermediary would govern how your non-public personal information would be shared with unaffiliated third parties.
If you have any questions or concerns regarding this notice or our Privacy Policy, please contact us at 1(855)870-3188.
(This Page Intentionally Left Blank.)
Investment Advisor
Mar Vista Investment Partners LLC
6001 Shady Oak Rd, Suite 200
Minnetonka, MN 55343
Distributor
Quasar Distributors, LLC
111 East Kilbourn Avenue, Suite 2200
Milwaukee, WI 53202
Transfer Agent
U.S. Bancorp Fund Services, LLC
615 East Michigan Street
Milwaukee, WI 53202
(833) 627-6668
Custodian
U.S. Bank National Association
Custody Operations
1555 North River Center Drive, Suite 302
Milwaukee, WI 53212
Independent Registered Public Accounting Firm
BBD, LLP
1835 Market Street, 3rd floor
Philadelphia, PA 19103
Legal Counsel
Godfrey & Kahn S.C.
833 East Michigan Street, Suite 1800
Milwaukee, WI 53202
This report is intended for shareholders of the Fund and may not be used as sales literature unless preceded or accompanied by a current prospectus.
Past performance results shown in this report should not be considered a representation of future performance. Share price and returns will fluctuate so that shares, when redeemed, may be worth more or less than their original cost. Statements and other information herein are dated and are subject to change.
Item 2. Code of Ethics.
The registrant has adopted a code of ethics that applies to the registrant’s principal executive officer and principal financial officer. The registrant has not made any substantive amendments to its code of ethics during the period covered by this report. The registrant has not granted any waivers from any provisions of the code of ethics during the period covered by this report.
A copy of the registrant’s Code of Ethics is filed herewith.
Item 3. Audit Committee Financial Experts.
The registrant’s Board of Trustees has determined that there are at least two audit committee financial experts serving on its audit committee. Messrs. Gaylord B. Lyman and Scott C. Jones are the “audit committee financial experts” and are considered to be “independent” as each term is defined in Item 3 of Form N‑CSR.
Item 4. Principal Accountant Fees and Services.
The registrant has engaged its principal accountant to perform audit services, audit-related services, tax services and other services during the past two fiscal years. “Audit services” refer to performing an audit of the registrant's annual financial statements or services that are normally provided by the accountant in connection with statutory and regulatory filings or engagements for those fiscal years. “Audit-related services” refer to the assurance and related services by the principal accountant that are reasonably related to the performance of the audit. “Tax services” refer to professional services rendered by the principal accountant for tax compliance, tax advice, and tax planning. There were no “other services” provided by the principal accountant. The following table details the aggregate fees billed or expected to be billed for each of the last two fiscal years for audit fees, audit-related fees, tax fees and other fees by the principal accountant.
| | FYE 10/31/2022 | FYE 10/31/2021 |
Audit Fees | $12,500 | $1,610 |
Audit-Related Fees | N/A | N/A |
Tax Fees | $3,000 | $955 |
All Other Fees | N/A | N/A |
The audit committee has adopted pre-approval policies and procedures that require the audit committee to pre‑approve all audit and non‑audit services of the registrant, including services provided to any entity affiliated with the registrant.
The percentage of fees billed by BBD, LLP applicable to non-audit services pursuant to waiver of pre-approval requirement were as follows:
| | FYE 10/31/2022 | FYE 10/31/2021 |
Audit-Related Fees | 0% | 0% |
Tax Fees | 0% | 0% |
All Other Fees | 0% | 0% |
All of the principal accountant’s hours spent on auditing the registrant’s financial statements were attributed to work performed by full‑time permanent employees of the principal accountant.
The following table indicates the non-audit fees billed or expected to be billed by the registrant’s accountant for services to the registrant and to the registrant’s investment adviser (and any other controlling entity, etc.—not sub-adviser) for the last two years. The audit committee of the Board of Trustees has considered whether the provision of non-audit services that were rendered to the registrant's investment adviser is compatible with maintaining the principal accountant's independence and has concluded that the provision of such non-audit services by the accountant has not compromised the accountant’s independence.
Non-Audit Related Fees | FYE 10/31/2022 | FYE 10/31/2021 |
Registrant | N/A | N/A |
Registrant’s Investment Adviser | N/A | N/A |
The registrant has not been identified by the U.S. Securities and Exchange Commission as having filed an annual report issued by a registered public accounting firm branch or office that is located in a foreign jurisdiction where the Public Company Accounting Oversight Board is unable to inspect or completely investigate because of a position taken by an authority in that jurisdiction.
The registrant is not a foreign issuer.
Item 5. Audit Committee of Listed Registrants.
(a) Not applicable to registrants who are not listed issuers (as defined in Rule 10A-3 under the Securities Exchange Act of 1934).
(b) Not Applicable.
Item 6. Investments.
| (a) | Schedule of Investments is included as part of the report to shareholders filed under Item 1 of this Form. |
Item 7. Disclosure of Proxy Voting Policies and Procedures for Closed-End Management Investment Companies.
Not applicable to open-end investment companies.
Item 8. Portfolio Managers of Closed-End Management Investment Companies.
Not applicable to open-end investment companies.
Item 9. Purchases of Equity Securities by Closed‑End Management Investment Company and Affiliated Purchasers.
Not applicable to open-end investment companies.
Item 10. Submission of Matters to a Vote of Security Holders.
There have been no material changes to the procedures by which shareholders may recommend nominees to the Registrant’s Board of Trustees.
Item 11. Controls and Procedures.
| (a) | The Registrant’s President/Principal Executive Officer and Treasurer/Principal Financial Officer have reviewed the Registrant's disclosure controls and procedures (as defined in Rule 30a-3(c) under the Investment Company Act of 1940, as amended, (the “Act”)) as of a date within 90 days of the filing of this report, as required by Rule 30a-3(b) under the Act and Rules 13a-15(b) or 15d‑15(b) under the Securities Exchange Act of 1934. Based on their review, such officers have concluded that the disclosure controls and procedures are effective in ensuring that information required to be disclosed in this report is appropriately recorded, processed, summarized and reported and made known to them by others within the Registrant and by the Registrant’s service provider. |
| (b) | There were no changes in the Registrant's internal control over financial reporting (as defined in Rule 30a-3(d) under the Act) that occurred during the fourth fiscal quarter of the period covered by this report that has materially affected, or is reasonably likely to materially affect, the Registrant's internal control over financial reporting. |
Item 12. Disclosure of Securities Lending Activities for Closed-End Management Investment Companies.
Not applicable to open-end investment companies.
Item 13. Exhibits.
(3) Any written solicitation to purchase securities under Rule 23c‑1 under the Act sent or given during the period covered by the report by or on behalf of the registrant to 10 or more persons. Not applicable to open-end investment companies.
SIGNATURES
Pursuant to the requirements of the Securities Exchange Act of 1934 and the Investment Company Act of 1940, as amended, the registrant has duly caused this report to be signed on its behalf by the undersigned, thereunto duly authorized.
(Registrant) Manager Directed Portfolios
By (Signature and Title)* /s/Scott M. Ostrowski
Scott M. Ostrowski, President/
Principal Executive Officer
Date 1/5/2023
Pursuant to the requirements of the Securities Exchange Act of 1934 and the Investment Company Act of 1940, as amended, this report has been signed below by the following persons on behalf of the registrant and in the capacities and on the dates indicated.
By (Signature and Title)* /s/Scott M. Ostrowski
Scott M. Ostrowski, President/
Principal Executive Officer
Date 1/5/2023
By (Signature and Title)* /s/Ryan S. Frank
Ryan S. Frank, Treasurer/
Principal Financial Officer
Date 1/5/2023