Sphere 500 Fossil Free Fund
Annual Report
September 30, 2022
Table of Contents
| Letter to Shareholders | 3 |
| Investment Highlights | 5 |
| Sector Allocation of Portfolio Assets | 6 |
| Schedule of Investments | 7 |
| Statement of Assets and Liabilities | 23 |
| Statement of Operations | 24 |
| Statements of Changes in Net Assets | 25 |
| Financial Highlights | 26 |
| Notes to Financial Statements | 27 |
| Report of Independent Registered Public Accounting Firm | 36 |
| Expense Example | 37 |
| Statement Regarding Liquidity Risk Management Program | 39 |
| Notice to Shareholders | 40 |
| Trustees and Officers | 41 |
| Notice of Privacy Policy and Practices | 44 |
Sphere 500 Fossil Free Fund
Letter to Shareholders
(Unaudited)
Dear Shareholder,
We’d like to take this opportunity to thank you for becoming an investor in the Sphere 500 Fossil Free Fund (SPFFX) during its first year and helping to make climate-friendly investing available to everyone. What a year it has been. At our launch on October 4th of last year, the US equity markets were touching all-time highs, interest rates were at all-time lows, and the US economy had somewhat recovered from pandemic lows. The backdrop for our one-year anniversary could not be more different: a tight labor market, inflation reaching a 40-year peak, the energy markets extremely volatile with the Russian invasion of Ukraine, and the S&P 500 and NASDAQ indices having plummeted over 20%. Despite these headlines, SPFFX has performed admirably in its inaugural year – underperforming the SPDR S&P 500 ETF slightly on a relative basis, as energy has increased 39% during our first year of operations, but improving most recently, as $130 per barrel prices have pared back on weaker demand. On the horizon, Russia’s continued occupation of Ukraine and China’s zero Covid policy continue to present volatility in the global financial markets. As the ramifications of the US midterm elections are digested, equity markets will likely continue to be choppy for the remainder of the year.
Since inception (NAV of $20.00 on October 4th, 2021) through 9/30/22, SPFFX has returned -17.20% vs. a benchmarked SPDR S&P 500 ETF (SPY ETF) return of -15.41%. For the quarter ended 9/30/22, SPFFX returned -4.99% vs. SPY ETF of -4.93% representing the ground made up as energy prices have come down. The fund continues to have similar risk statistics throughout the year to the benchmark (slightly lower than the SPDR S&P 500 ETF) and remains attractively priced at 7bps (0.07%).
After launch, we expanded our theory of change to include proxy voting in climate-friendly way. By engaging the unaffiliated shareholder advocacy non-profit As You Sow, the Fund is now participating in their As You Vote shareholder voting service where they are voting and actively engaging with the companies we own to improve their operations on climate-related issues.
Most recently we have changed the name of the fund from the Sphere 500 Fossil-Free Fund to the Sphere 500 Climate Fund. We believe this more accurately portrays the combination of full fossil fuel industry exclusion from the fund (not just exclusion of the major holders of fossil fuel reserves, as some other fossil fuel reserves free funds do) and of our climate action-oriented shareholder voting policy.
Thank you for your continued support and do not hesitate to reach out at any time via invest@oursphere.org.
Sincerely,
Jason Britton
President & Chief Investment Officer
Reflection Asset Management
There are risks involved with investing, including possible loss of principal. There is no guarantee the Fund will achieve its investment objective.
The information provided herein represents the opinion of the manager at a specific point in time and is not intended to be a forecast of future events, a guarantee of future results nor investment advice.
This material represents the manager’s assessment of the portfolio and market environment at a specific point in time and should not be relied upon by the reader as research or investment advice. Past performance is no guarantee of future results. Investing involves risk, including possible loss of principal.
Sphere 500 Fossil Free Fund
Investment Highlights (Unaudited)
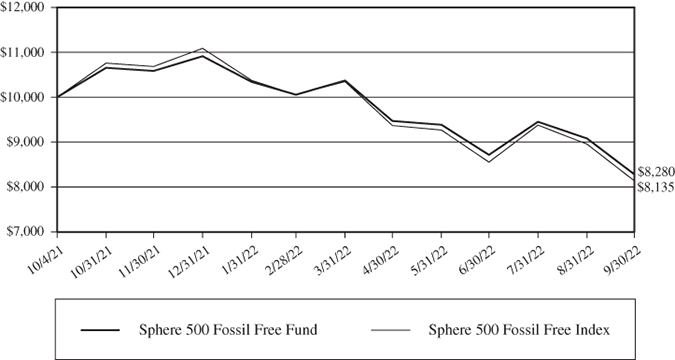
Comparison of the Change in Value of a Hypothetical $10,000 Investment
in the Sphere 500 Fossil Free Fund and
the Sphere 500 Fossil Free Index
| | Since Inception |
| Annualized Total Return Periods Ended September 30, 2022: | (10/04/2021) |
| Sphere 500 Fossil Free Fund | (17.20)% |
| Sphere 500 Fossil Free Index | (18.67)% |
Expense ratios*: Gross 0.12%, Net 0.12%
Performance data quoted represents past performance; past performance does not guarantee future results. The investment return and principal value of an investment will fluctuate so that an investor’s shares, when redeemed, may be worth more or less than their original cost. Current performance of the Fund may be lower or higher than the performance quoted. Performance data current to the most recent month end may be obtained by calling 1-800-497-2960.
This chart illustrates the performance of a hypothetical $10,000 investment made in the Fund on October 4, 2021, the Fund’s inception date. Returns reflect the reinvestment of dividends and capital gain distributions. The performance data and graph do not reflect the deduction of taxes that a shareholder may pay on dividends, capital gain distributions, or redemption of Fund shares. This chart does not imply any future performance.
* The expense ratios presented are from the most recent prospectus.
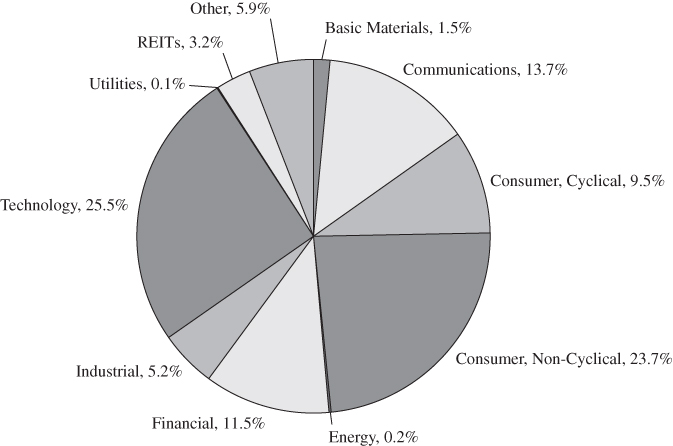
| SECTOR ALLOCATION OF PORTFOLIO ASSETS |
| at September 30, 2022 (Unaudited) |
Percentages represent market value as a percentage of net assets.
Note: For presentation purposes, the Fund has grouped some of the industry categories. For purposes of categorizing securities for compliance with Section 8(b)(1) of the Investment Company Act of 1940, as amended, the Fund uses more specific industry classifications.
| SCHEDULE OF INVESTMENTS |
| at September 30, 2022 |
| | | Number of | | | | |
| COMMON STOCKS – 90.95% | | Shares | | | Value | |
| BASIC MATERIALS – 1.51% | | | | | | |
| | | | | | | |
| Chemicals – 1.07% | | | | | | |
| Albemarle Corp. | | | 6 | | | $ | 1,587 | |
| CF Industries Holdings, Inc. | | | 10 | | | | 963 | |
| Dow, Inc. | | | 38 | | | | 1,669 | |
| DuPont de Nemours, Inc. | | | 26 | | | | 1,310 | |
| Eastman Chemical Co. | | | 6 | | | | 426 | |
| Ecolab, Inc. | | | 13 | | | | 1,878 | |
| FMC Corp. | | | 6 | | | | 634 | |
| International Flavors & Fragrances, Inc. | | | 12 | | | | 1,090 | |
| LyondellBasell Industries NV – ADR | | | 13 | | | | 979 | |
| Mosaic Co. | | | 18 | | | | 870 | |
| PPG Industries, Inc. | | �� | 12 | | | | 1,328 | |
| RPM International, Inc. | | | 6 | | | | 500 | |
| Sherwin-Williams Co. | | | 11 | | | | 2,252 | |
| | | | | | | | 15,486 | |
| Iron/Steel – 0.18% | | | | | | | | |
| Nucor Corp. | | | 13 | | | | 1,391 | |
| Reliance Steel & Aluminum Co. | | | 3 | | | | 523 | |
| Steel Dynamics, Inc. | | | 9 | | | | 639 | |
| | | | | | | | 2,553 | |
| Mining – 0.26% | | | | | | | | |
| Freeport-McMoRan, Inc. | | | 75 | | | | 2,050 | |
| Newmont Corp. | | | 42 | | | | 1,765 | |
| | | | | | | | 3,815 | |
| TOTAL BASIC MATERIALS | | | | | | | 21,854 | |
| | | | | | | | | |
| COMMUNICATIONS – 13.65% | | | | | | | | |
| | | | | | | | | |
| Advertising – 0.17% | | | | | | | | |
| Interpublic Group of Cos., Inc. | | | 20 | | | | 512 | |
| Omnicom Group, Inc. | | | 10 | | | | 631 | |
| Trade Desk, Inc. (a) | | | 21 | | | | 1,255 | |
| | | | | | | | 2,398 | |
The accompanying notes are an integral part of these financial statements.
| SCHEDULE OF INVESTMENTS (Continued) |
| at September 30, 2022 |
| | | Number of | | | | |
| COMMON STOCKS – 90.95% (Continued) | | Shares | | | Value | |
| Internet – 9.94% | | | | | | |
| Airbnb, Inc. (a) | | | 12 | | | $ | 1,260 | |
| Alphabet, Inc. (a) | | | 566 | | | | 54,281 | |
| Amazon.com, Inc. (a) | | | 489 | | | | 55,257 | |
| Booking Holdings, Inc. (a) | | | 2 | | | | 3,286 | |
| CDW Corp. | | | 6 | | | | 936 | |
| DoorDash, Inc. (a) | | | 11 | | | | 544 | |
| eBay, Inc. | | | 29 | | | | 1,068 | |
| Etsy, Inc. (a) | | | 6 | | | | 601 | |
| Expedia Group, Inc. (a) | | | 7 | | | | 656 | |
| GoDaddy, Inc. (a) | | | 7 | | | | 496 | |
| Match Group, Inc. (a) | | | 15 | | | | 716 | |
| Meta Platforms, Inc. (a) | | | 94 | | | | 12,754 | |
| Netflix, Inc. (a) | | | 23 | | | | 5,415 | |
| NortonLifeLock, Inc. | | | 30 | | | | 604 | |
| Pinterest, Inc. (a) | | | 26 | | | | 606 | |
| Twitter, Inc. (a) | | | 34 | | | | 1,491 | |
| Uber Technologies, Inc. (a) | | | 105 | | | | 2,783 | |
| VeriSign, Inc. (a) | | | 5 | | | | 869 | |
| | | | | | | | 143,623 | |
| Media – 1.46% | | | | | | | | |
| Charter Communications, Inc. (a) | | | 5 | | | | 1,517 | |
| Comcast Corp. | | | 232 | | | | 6,805 | |
| FactSet Research Systems, Inc. | | | 2 | | | | 800 | |
| Liberty Broadband Corp. (a) | | | 6 | | | | 443 | |
| Liberty Media Corp-Liberty Formula One (a) | | | 9 | | | | 526 | |
| Paramount Global | | | 25 | | | | 476 | |
| Walt Disney Co. (a) | | | 97 | | | | 9,150 | |
| Warner Bros Discovery, Inc. (a) | | | 117 | | | | 1,345 | |
| | | | | | | | 21,062 | |
| Telecommunications – 2.08% | | | | | | | | |
| Arista Networks, Inc. (a) | | | 12 | | | | 1,355 | |
| AT&T, Inc. | | | 379 | | | | 5,814 | |
| Cisco Systems, Inc. | | | 220 | | | | 8,800 | |
| Corning, Inc. | | | 40 | | | | 1,161 | |
| T-Mobile US, Inc. (a) | | | 33 | | | | 4,427 | |
The accompanying notes are an integral part of these financial statements.
| SCHEDULE OF INVESTMENTS (Continued) |
| at September 30, 2022 |
| | | Number of | | | | |
| COMMON STOCKS – 90.95% (Continued) | | Shares | | | Value | |
| Telecommunications – 2.08% (Continued) | | | | | | |
| Verizon Communications, Inc. | | | 224 | | | $ | 8,505 | |
| | | | | | | | 30,062 | |
| TOTAL COMMUNICATIONS | | | | | | | 197,145 | |
| | | | | | | | | |
| CONSUMER, CYCLICAL – 9.52% | | | | | | | | |
| | | | | | | | | |
| Airlines – 0.17% | | | | | | | | |
| Delta Air Lines, Inc. (a) | | | 33 | | | | 926 | |
| Southwest Airlines Co. (a) | | | 31 | | | | 956 | |
| United Airlines Holdings, Inc. (a) | | | 17 | | | | 553 | |
| | | | | | | | 2,435 | |
| Apparel – 0.35% | | | | | | | | |
| NIKE, Inc. | | | 54 | | | | 4,489 | |
| VF Corp. | | | 20 | | | | 598 | |
| | | | | | | | 5,087 | |
| Auto Manufacturers – 3.08% | | | | | | | | |
| Cummins, Inc. | | | 7 | | | | 1,425 | |
| Ford Motor Co. | | | 206 | | | | 2,307 | |
| General Motors Co. | | | 74 | | | | 2,375 | |
| PACCAR, Inc. | | | 18 | | | | 1,506 | |
| Tesla, Inc. (a) | | | 139 | | | | 36,870 | |
| | | | | | | | 44,483 | |
| Distribution/Wholesale – 0.33% | | | | | | | | |
| Copart, Inc. (a) | | | 11 | | | | 1,170 | |
| Fastenal Co. | | | 30 | | | | 1,381 | |
| LKQ Corp. | | | 14 | | | | 660 | |
| Pool Corp. | | | 2 | | | | 637 | |
| WW Grainger, Inc. | | | 2 | | | | 978 | |
| | | | | | | | 4,826 | |
| Entertainment – 0.04% | | | | | | | | |
| Live Nation Entertainment, Inc. (a) | | | 8 | | | | 608 | |
| | | | | | | | | |
| Home Builders – 0.15% | | | | | | | | |
| DR Horton, Inc. | | | 18 | | | | 1,212 | |
The accompanying notes are an integral part of these financial statements.
| SCHEDULE OF INVESTMENTS (Continued) |
| at September 30, 2022 |
| | | Number of | | | | |
| COMMON STOCKS – 90.95% (Continued) | | Shares | | | Value | |
| Home Builders – 0.15% (Continued) | | | | | | |
| Lennar Corp. | | | 12 | | | $ | 895 | |
| | | | | | | | 2,107 | |
| Lodging – 0.29% | | | | | | | | |
| Hilton Worldwide Holdings, Inc. | | | 14 | | | | 1,688 | |
| Las Vegas Sands Corp. (a) | | | 17 | | | | 638 | |
| Marriott International, Inc. | | | 13 | | | | 1,822 | |
| | | | | | | | 4,148 | |
| Retail – 5.11% | | | | | | | | |
| AutoZone, Inc. (a) | | | 1 | | | | 2,142 | |
| Best Buy Co, Inc. | | | 10 | | | | 634 | |
| CarMax, Inc. (a) | | | 8 | | | | 528 | |
| Chipotle Mexican Grill, Inc. (a) | | | 1 | | | | 1,503 | |
| Costco Wholesale Corp. | | | 23 | | | | 10,862 | |
| Darden Restaurants, Inc. | | | 6 | | | | 758 | |
| Dollar General Corp. | | | 11 | | | | 2,639 | |
| Dollar Tree, Inc. (a) | | | 11 | | | | 1,497 | |
| Domino’s Pizza, Inc. | | | 1 | | | | 310 | |
| Genuine Parts Co. | | | 7 | | | | 1,045 | |
| Home Depot, Inc. | | | 54 | | | | 14,901 | |
| Lowe’s Cos., Inc. | | | 33 | | | | 6,198 | |
| Lululemon Athletica, Inc. (a) | | | 5 | | | | 1,398 | |
| McDonald’s Corp. | | | 39 | | | | 8,999 | |
| O’Reilly Automotive, Inc. (a) | | | 3 | | | | 2,110 | |
| Ross Stores, Inc. | | | 18 | | | | 1,517 | |
| Starbucks Corp. | | | 59 | | | | 4,971 | |
| Target Corp. | | | 24 | | | | 3,561 | |
| TJX Cos., Inc. | | | 61 | | | | 3,789 | |
| Tractor Supply Co. | | | 5 | | | | 930 | |
| Ulta Beauty, Inc. (a) | | | 2 | | | | 802 | |
| Walgreens Boots Alliance, Inc. | | | 38 | | | | 1,193 | |
| Yum! Brands, Inc. | | | 15 | | | | 1,595 | |
| | | | | | | | 73,882 | |
| TOTAL CONSUMER, CYCLICAL | | | | | | | 137,576 | |
The accompanying notes are an integral part of these financial statements.
| SCHEDULE OF INVESTMENTS (Continued) |
| at September 30, 2022 |
| | | Number of | | | | |
| COMMON STOCKS – 90.95% (Continued) | | Shares | | | Value | |
| CONSUMER, NON-CYCLICAL – 23.74% | | | | | | |
| | | | | | | |
| Agriculture – 0.04% | | | | | | |
| Darling Ingredients, Inc. (a) | | | 8 | | | $ | 529 | |
| | | | | | | | | |
| Beverages – 2.01% | | | | | | | | |
| Brown-Forman Corp. | | | 11 | | | | 733 | |
| Coca-Cola Co. | | | 207 | | | | 11,596 | |
| Constellation Brands, Inc. | | | 6 | | | | 1,378 | |
| Keurig Dr Pepper, Inc. | | | 45 | | | | 1,612 | |
| Monster Beverage Corp. (a) | | | 20 | | | | 1,739 | |
| PepsiCo, Inc. | | | 73 | | | | 11,918 | |
| | | | | | | | 28,976 | |
| Biotechnology – 2.10% | | | | | | | | |
| Alnylam Pharmaceuticals, Inc. (a) | | | 6 | | | | 1,201 | |
| Amgen, Inc. | | | 28 | | | | 6,311 | |
| Biogen, Inc. (a) | | | 7 | | | | 1,869 | |
| BioMarin Pharmaceutical, Inc. (a) | | | 9 | | | | 763 | |
| Corteva, Inc. | | | 38 | | | | 2,172 | |
| Gilead Sciences, Inc. | | | 66 | | | | 4,071 | |
| Horizon Therapeutics PLC – ADR (a) | | | 12 | | | | 743 | |
| Illumina, Inc. (a) | | | 8 | | | | 1,526 | |
| Incyte Corp. (a) | | | 9 | | | | 600 | |
| Moderna, Inc. (a) | | | 18 | | | | 2,128 | |
| Regeneron Pharmaceuticals, Inc. (a) | | | 5 | | | | 3,444 | |
| Royalty Pharma PLC – ADR | | | 20 | | | | 804 | |
| Seagen, Inc. (a) | | | 7 | | | | 958 | |
| Vertex Pharmaceuticals, Inc. (a) | | | 13 | | | | 3,764 | |
| | | | | | | | 30,354 | |
| Commercial Services – 2.06% | | | | | | | | |
| Automatic Data Processing, Inc. | | | 22 | | | | 4,976 | |
| Block, Inc. (a) | | | 26 | | | | 1,430 | |
| Cintas Corp. | | | 4 | | | | 1,553 | |
| CoStar Group, Inc. (a) | | | 20 | | | | 1,393 | |
| Equifax, Inc. | | | 6 | | | | 1,029 | |
| FleetCor Technologies, Inc. (a) | | | 3 | | | | 528 | |
| Gartner, Inc. (a) | | | 4 | | | | 1,107 | |
| Global Payments, Inc. | | | 14 | | | | 1,513 | |
The accompanying notes are an integral part of these financial statements.
| SCHEDULE OF INVESTMENTS (Continued) |
| at September 30, 2022 |
| | | Number of | | | | |
| COMMON STOCKS – 90.95% (Continued) | | Shares | | | Value | |
| Commercial Services – 2.06% (Continued) | | | | | | |
| Moody’s Corp. | | | 9 | | | $ | 2,188 | |
| PayPal Holdings, Inc. (a) | | | 61 | | | | 5,250 | |
| Quanta Services, Inc. | | | 7 | | | | 892 | |
| S&P Global, Inc. | | | 17 | | | | 5,191 | |
| TransUnion | | | 10 | | | | 595 | |
| United Rentals, Inc. (a) | | | 3 | | | | 810 | |
| Verisk Analytics, Inc. | | | 8 | | | | 1,364 | |
| | | | | | | | 29,819 | |
| Cosmetics/Personal Care – 1.55% | | | | | | | | |
| Colgate-Palmolive Co. | | | 41 | | | | 2,880 | |
| Estee Lauder Cos., Inc. | | | 16 | | | | 3,454 | |
| Procter & Gamble Co. | | | 127 | | | | 16,034 | |
| | | | | | | | 22,368 | |
| Food – 1.17% | | | | | | | | |
| Conagra Brands, Inc. | | | 25 | | | | 816 | |
| General Mills, Inc. | | | 31 | | | | 2,375 | |
| Hershey Co. | | | 7 | | | | 1,543 | |
| J M Smucker Co. | | | 5 | | | | 687 | |
| Kellogg Co. | | | 17 | | | | 1,184 | |
| Kraft Heinz Co. | | | 42 | | | | 1,401 | |
| Kroger Co. | | | 37 | | | | 1,619 | |
| Lamb Weston Holdings, Inc. | | | 7 | | | | 542 | |
| McCormick & Co., Inc. | | | 13 | | | | 926 | |
| Mondelez International, Inc. | | | 73 | | | | 4,003 | |
| Sysco Corp. | | | 26 | | | | 1,838 | |
| | | | | | | | 16,934 | |
| Healthcare-Products – 4.09% | | | | | | | | |
| Abbott Laboratories | | | 92 | | | | 8,902 | |
| ABIOMED, Inc. (a) | | | 2 | | | | 491 | |
| Align Technology, Inc. (a) | | | 3 | | | | 621 | |
| Avantor, Inc. (a) | | | 35 | | | | 686 | |
| Baxter International, Inc. | | | 26 | | | | 1,400 | |
| Bio-Techne Corp. | | | 2 | | | | 568 | |
| Boston Scientific Corp. (a) | | | 76 | | | | 2,944 | |
| Cooper Cos., Inc. | | | 2 | | | | 528 | |
The accompanying notes are an integral part of these financial statements.
| SCHEDULE OF INVESTMENTS (Continued) |
| at September 30, 2022 |
| | | Number of | | | | |
| COMMON STOCKS – 90.95% (Continued) | | Shares | | | Value | |
| Healthcare-Products – 4.09% (Continued) | | | | | | |
| Danaher Corp. | | | 34 | | | $ | 8,782 | |
| Edwards Lifesciences Corp. (a) | | | 32 | | | | 2,644 | |
| Hologic, Inc. (a) | | | 13 | | | | 839 | |
| IDEXX Laboratories, Inc. (a) | | | 4 | | | | 1,303 | |
| Insulet Corp. (a) | | | 3 | | | | 688 | |
| Intuitive Surgical, Inc. (a) | | | 18 | | | | 3,374 | |
| Medtronic PLC – ADR | | | 70 | | | | 5,653 | |
| PerkinElmer, Inc. | | | 6 | | | | 722 | |
| Repligen Corp. (a) | | | 2 | | | | 374 | |
| ResMed, Inc. | | | 7 | | | | 1,528 | |
| STERIS PLC – ADR | | | 5 | | | | 831 | |
| Stryker Corp. | | | 17 | | | | 3,443 | |
| Thermo Fisher Scientific, Inc. | | | 20 | | | | 10,144 | |
| Waters Corp. (a) | | | 3 | | | | 809 | |
| West Pharmaceutical Services, Inc. | | | 3 | | | | 738 | |
| Zimmer Biomet Holdings, Inc. | | | 11 | | | | 1,150 | |
| | | | | | | | 59,162 | |
| Healthcare-Services – 2.93% | | | | | | | | |
| Catalent, Inc. (a) | | | 9 | | | | 651 | |
| Centene Corp. (a) | | | 30 | | | | 2,334 | |
| Elevance Health, Inc. | | | 12 | | | | 5,451 | |
| HCA Healthcare, Inc. | | | 11 | | | | 2,022 | |
| Humana, Inc. | | | 6 | | | | 2,911 | |
| IQVIA Holdings, Inc. (a) | | | 9 | | | | 1,630 | |
| Laboratory Corp of America Holdings | | | 4 | | | | 819 | |
| Molina Healthcare, Inc. (a) | | | 3 | | | | 990 | |
| Quest Diagnostics, Inc. | | | 6 | | | | 736 | |
| UnitedHealth Group, Inc. | | | 49 | | | | 24,747 | |
| | | | | | | | 42,291 | |
| Household Products/Wares – 0.29% | | | | | | | | |
| Avery Dennison Corp. | | | 4 | | | | 651 | |
| Church & Dwight Co., Inc. | | | 12 | | | | 857 | |
| Clorox Co. | | | 6 | | | | 771 | |
| Kimberly-Clark Corp. | | | 17 | | | | 1,913 | |
| | | | | | | | 4,192 | |
The accompanying notes are an integral part of these financial statements.
| SCHEDULE OF INVESTMENTS (Continued) |
| at September 30, 2022 |
| | | Number of | | | | |
| COMMON STOCKS – 90.95% (Continued) | | Shares | | | Value | |
| Pharmaceuticals – 7.50% | | | | | | |
| AbbVie, Inc. | | | 94 | | | $ | 12,616 | |
| AmerisourceBergen Corp. | | | 8 | | | | 1,083 | |
| Becton Dickinson and Co. | | | 15 | | | | 3,342 | |
| Bristol-Myers Squibb Co. | | | 113 | | | | 8,033 | |
| Cardinal Health, Inc. | | | 14 | | | | 934 | |
| Cigna Corp. | | | 16 | | | | 4,440 | |
| CVS Health Corp. | | | 69 | | | | 6,581 | |
| Dexcom, Inc. (a) | | | 20 | | | | 1,611 | |
| Eli Lilly & Co. | | | 50 | | | | 16,167 | |
| Johnson & Johnson | | | 140 | | | | 22,870 | |
| McKesson Corp. | | | 7 | | | | 2,379 | |
| Merck & Co., Inc. | | | 135 | | | | 11,626 | |
| Pfizer, Inc. | | | 299 | | | | 13,084 | |
| Zoetis, Inc. | | | 24 | | | | 3,559 | |
| | | | | | | | 108,325 | |
| TOTAL CONSUMER, NON-CYCLICAL | | | | | | | 342,950 | |
| | | | | | | | | |
| ENERGY – 0.22% | | | | | | | | |
| | | | | | | | | |
| Energy-Alternate Sources – 0.22% | | | | | | | | |
| Enphase Energy, Inc. (a) | | | 7 | | | | 1,942 | |
| First Solar, Inc. (a) | | | 5 | | | | 662 | |
| Plug Power, Inc. (a) | | | 27 | | | | 567 | |
| | | | | | | | 3,171 | |
| TOTAL ENERGY | | | | | | | 3,171 | |
| | | | | | | | | |
| FINANCIAL – 11.51% | | | | | | | | |
| | | | | | | | | |
| Banks – 5.03% | | | | | | | | |
| Bank of America Corp. | | | 427 | | | | 12,895 | |
| Bank of New York Mellon Corp. | | | 43 | | | | 1,656 | |
| Citigroup, Inc. | | | 100 | | | | 4,167 | |
| Fifth Third Bancorp | | | 36 | | | | 1,151 | |
| First Republic Bank | | | 9 | | | | 1,175 | |
| Goldman Sachs Group, Inc. | | | 17 | | | | 4,982 | |
| Huntington Bancshares, Inc. | | | 76 | | | | 1,002 | |
The accompanying notes are an integral part of these financial statements.
| SCHEDULE OF INVESTMENTS (Continued) |
| at September 30, 2022 |
| | | Number of | | | | |
| COMMON STOCKS – 90.95% (Continued) | | Shares | | | Value | |
| Banks – 5.03% (Continued) | | | | | | |
| JPMorgan Chase & Co. | | | 155 | | | $ | 16,197 | |
| KeyCorp | | | 49 | | | | 785 | |
| M&T Bank Corp. | | | 9 | | | | 1,587 | |
| Morgan Stanley | | | 71 | | | | 5,610 | |
| Northern Trust Corp. | | | 10 | | | | 856 | |
| PNC Financial Services Group, Inc. | | | 21 | | | | 3,138 | |
| Regions Financial Corp. | | | 49 | | | | 983 | |
| State Street Corp. | | | 18 | | | | 1,095 | |
| SVB Financial Group (a) | | | 3 | | | | 1,007 | |
| Truist Financial Corp. | | | 70 | | | | 3,048 | |
| US Bancorp | | | 79 | | | | 3,185 | |
| Wells Fargo & Co. | | | 202 | | | | 8,124 | |
| | | | | | | | 72,643 | |
| Diversified Financial Services – 4.07% | | | | | | | | |
| American Express Co. | | | 31 | | | | 4,182 | |
| Ameriprise Financial, Inc. | | | 5 | | | | 1,260 | |
| BlackRock, Inc. | | | 7 | | | | 3,852 | |
| Capital One Financial Corp. | | | 20 | | | | 1,843 | |
| Charles Schwab Corp. | | | 79 | | | | 5,678 | |
| CME Group, Inc. | | | 19 | | | | 3,366 | |
| Discover Financial Services | | | 14 | | | | 1,273 | |
| Intercontinental Exchange, Inc. | | | 29 | | | | 2,620 | |
| LPL Financial Holdings, Inc. | | | 4 | | | | 874 | |
| Mastercard, Inc. | | | 51 | | | | 14,501 | |
| Nasdaq, Inc. | | | 18 | | | | 1,020 | |
| Raymond James Financial, Inc. | | | 10 | | | | 988 | |
| Synchrony Financial | | | 25 | | | | 705 | |
| T Rowe Price Group, Inc. | | | 11 | | | | 1,155 | |
| Visa, Inc. | | | 87 | | | | 15,456 | |
| | | | | | | | 58,773 | |
| Insurance – 2.09% | | | | | | | | |
| Aflac, Inc. | | | 33 | | | | 1,855 | |
| Alleghany Corp. (a) | | | 1 | | | | 839 | |
| Allstate Corp. | | | 14 | | | | 1,743 | |
| American International Group, Inc. | | | 40 | | | | 1,899 | |
The accompanying notes are an integral part of these financial statements.
| SCHEDULE OF INVESTMENTS (Continued) |
| at September 30, 2022 |
| | | Number of | | | | |
| COMMON STOCKS – 90.95% (Continued) | | Shares | | | Value | |
| Insurance – 2.09% (Continued) | | | | | | |
| Arthur J Gallagher & Co. | | | 11 | | | $ | 1,883 | |
| Brown & Brown, Inc. | | | 11 | | | | 665 | |
| Chubb Ltd – ADR | | | 21 | | | | 3,820 | |
| Cincinnati Financial Corp. | | | 8 | | | | 717 | |
| Equitable Holdings, Inc. | | | 19 | | | | 501 | |
| Hartford Financial Services Group, Inc. | | | 17 | | | | 1,053 | |
| Loews Corp. | | | 10 | | | | 498 | |
| Marsh & McLennan Cos., Inc. | | | 26 | | | | 3,882 | |
| MetLife, Inc. | | | 35 | | | | 2,127 | |
| Principal Financial Group, Inc. | | | 13 | | | | 938 | |
| Progressive Corp. | | | 31 | | | | 3,603 | |
| Prudential Financial, Inc. | | | 19 | | | | 1,630 | |
| Travelers Cos., Inc. | | | 12 | | | | 1,838 | |
| W R Berkley Corp. | | | 11 | | | | 710 | |
| | | | | | | | 30,201 | |
| Private Equity – 0.25% | | | | | | | | |
| Ares Management Corp. | | | 8 | | | | 496 | |
| Blackstone, Inc. | | | 37 | | | | 3,097 | |
| | | | | | | | 3,593 | |
| Real Estate – 0.07% | | | | | | | | |
| CBRE Group, Inc. (a) | | | 16 | | | | 1,080 | |
| TOTAL FINANCIAL | | | | | | | 166,290 | |
| | | | | | | | | |
| INDUSTRIAL – 5.20% | | | | | | | | |
| | | | | | | | | |
| Aerospace/Defense – 0.04% | | | | | | | | |
| Howmet Aerospace, Inc. | | | 20 | | | | 619 | |
| | | | | | | | | |
| Building Materials – 0.29% | | | | | | | | |
| Carrier Global Corp. | | | 44 | | | | 1,565 | |
| Martin Marietta Materials, Inc. | | | 3 | | | | 966 | |
| Masco Corp. | | | 11 | | | | 514 | |
| Vulcan Materials Co. | | | 7 | | | | 1,104 | |
| | | | | | | | 4,149 | |
The accompanying notes are an integral part of these financial statements.
| SCHEDULE OF INVESTMENTS (Continued) |
| at September 30, 2022 |
| | | Number of | | | | |
| COMMON STOCKS – 90.95% (Continued) | | Shares | | | Value | |
| Electrical Components & Equipment – 0.29% | | | | | | |
| AMETEK, Inc. | | | 12 | | | $ | 1,361 | |
| Emerson Electric Co. | | | 31 | | | | 2,270 | |
| Generac Holdings, Inc. (a) | | | 3 | | | | 534 | |
| | | | | | | | 4,165 | |
| Electronics – 0.45% | | | | | | | | |
| Agilent Technologies, Inc. | | | 15 | | | | 1,823 | |
| Fortive Corp. | | | 18 | | | | 1,050 | |
| Hubbell, Inc. | | | 2 | | | | 446 | |
| Keysight Technologies, Inc. (a) | | | 9 | | | | 1,416 | |
| Mettler-Toledo International, Inc. (a) | | | 1 | | | | 1,084 | |
| Trimble, Inc. (a) | | | 13 | | | | 706 | |
| | | | | | | | 6,525 | |
| Environmental Control – 0.34% | | | | | | | | |
| Republic Services, Inc. | | | 10 | | | | 1,360 | |
| Waste Management, Inc. | | | 22 | | | | 3,525 | |
| | | | | | | | 4,885 | |
| Hand/Machine Tools – 0.06% | | | | | | | | |
| Snap-on, Inc. | | | 2 | | | | 403 | |
| Stanley Black & Decker, Inc. | | | 7 | | | | 526 | |
| | | | | | | | 929 | |
| Machinery-Construction&Mining – 0.32% | | | | | | | | |
| Caterpillar, Inc. | | | 28 | | | | 4,594 | |
| | | | | | | | | |
| Machinery-Diversified – 0.88% | | | | | | | | |
| Deere & Co. | | | 15 | | | | 5,008 | |
| Dover Corp | | | 7 | | | | 816 | |
| Graco, Inc. | | | 8 | | | | 480 | |
| IDEX Corp | | | 4 | | | | 799 | |
| Ingersoll Rand, Inc. | | | 21 | | | | 908 | |
| Nordson Corp | | | 2 | | | | 425 | |
| Otis Worldwide Corp | | | 22 | | | | 1,404 | |
| Rockwell Automation, Inc. | | | 6 | | | | 1,291 | |
| Westinghouse Air Brake Technologies Corp | | | 9 | | | | 732 | |
| Xylem, Inc. | | | 9 | | | | 786 | |
| | | | | | | | 12,649 | |
The accompanying notes are an integral part of these financial statements.
| SCHEDULE OF INVESTMENTS (Continued) |
| at September 30, 2022 |
| | | Number of | | | | |
| COMMON STOCKS – 90.95% (Continued) | | Shares | | | Value | |
| Miscellaneous Manufacturing – 0.86% | | | | | | |
| 3M Co. | | | 29 | | | $ | 3,204 | |
| Carlisle Cos., Inc. | | | 2 | | | | 561 | |
| Eaton Corp. PLC – ADR | | | 21 | | | | 2,800 | |
| Illinois Tool Works, Inc. | | | 15 | | | | 2,710 | |
| Parker-Hannifin Corp. | | | 6 | | | | 1,454 | |
| Trane Technologies PLC – ADR | | | 12 | | | | 1,738 | |
| | | | | | | | 12,467 | |
| Packaging & Containers – 0.06% | | | | | | | | |
| Crown Holdings, Inc. | | | 6 | | | | 486 | |
| Packaging Corp. of America | | | 4 | | | | 449 | |
| | | | | | | | 935 | |
| Transportation – 1.61% | | | | | | | | |
| CH Robinson Worldwide, Inc. | | | 6 | | | | 578 | |
| CSX Corp. | | | 114 | | | | 3,037 | |
| Expeditors International of Washington, Inc. | | | 8 | | | | 706 | |
| FedEx Corp. | | | 12 | | | | 1,781 | |
| JB Hunt Transport Services, Inc. | | | 4 | | | | 626 | |
| Norfolk Southern Corp. | | | 12 | | | | 2,516 | |
| Old Dominion Freight Line, Inc. | | | 5 | | | | 1,244 | |
| Union Pacific Corp. | | | 33 | | | | 6,429 | |
| United Parcel Service, Inc. | | | 39 | | | | 6,300 | |
| | | | | | | | 23,217 | |
| TOTAL INDUSTRIAL | | | | | | | 75,134 | |
| | | | | | | | | |
| TECHNOLOGY – 25.48% | | | | | | | | |
| | | | | | | | | |
| Computers – 9.25% | | | | | | | | |
| Apple, Inc. | | | 857 | | | | 118,437 | |
| Cognizant Technology Solutions Corp. | | | 27 | | | | 1,551 | |
| Crowdstrike Holdings, Inc. (a) | | | 10 | | | | 1,648 | |
| EPAM Systems, Inc. (a) | | | 2 | | | | 724 | |
| Fortinet, Inc. (a) | | | 35 | | | | 1,720 | |
| Hewlett Packard Enterprise Co. | | | 68 | | | | 815 | |
| HP, Inc. | | | 47 | | | | 1,171 | |
| International Business Machines Corp. | | | 48 | | | | 5,703 | |
| NetApp, Inc. | | | 11 | | | | 680 | |
The accompanying notes are an integral part of these financial statements.
| SCHEDULE OF INVESTMENTS (Continued) |
| at September 30, 2022 |
| | | Number of | | | | |
| COMMON STOCKS – 90.95% (Continued) | | Shares | | | Value | |
| Computers – 9.25% (Continued) | | | | | | |
| Western Digital Corp. (a) | | | 16 | | | $ | 521 | |
| Zscaler, Inc. (a) | | | 4 | | | | 658 | |
| | | | | | | | 133,628 | |
| Office/Business Equip – 0.04% | | | | | | | | |
| Zebra Technologies Corp. (a) | | | 2 | | | | 524 | |
| | | | | | | | | |
| Semiconductors – 4.93% | | | | | | | | |
| Advanced Micro Devices, Inc. (a) | | | 85 | | | | 5,386 | |
| Analog Devices, Inc. | | | 27 | | | | 3,762 | |
| Applied Materials, Inc. | | | 45 | | | | 3,687 | |
| Broadcom, Inc. | | | 21 | | | | 9,324 | |
| Entegris, Inc. | | | 7 | | | | 581 | |
| Intel Corp | | | 219 | | | | 5,644 | |
| KLA Corp | | | 7 | | | | 2,118 | |
| Lam Research Corp. | | | 7 | | | | 2,562 | |
| Microchip Technology, Inc. | | | 28 | | | | 1,709 | |
| Micron Technology, Inc. | | | 58 | | | | 2,906 | |
| Monolithic Power Systems, Inc. | | | 2 | | | | 727 | |
| NVIDIA Corp | | | 127 | | | | 15,417 | |
| ON Semiconductor Corp. (a) | | | 22 | | | | 1,371 | |
| QUALCOMM, Inc. | | | 59 | | | | 6,666 | |
| Skyworks Solutions, Inc. | | | 8 | | | | 682 | |
| Teradyne, Inc. | | | 8 | | | | 601 | |
| Texas Instruments, Inc. | | | 48 | | | | 7,429 | |
| Wolfspeed, Inc. (a) | | | 6 | | | | 620 | |
| | | | | | | | 71,192 | |
| Software – 11.26% | | | | | | | | |
| Activision Blizzard, Inc. | | | 37 | | | | 2,751 | |
| Adobe, Inc. (a) | | | 24 | | | | 6,605 | |
| Akamai Technologies, Inc. (a) | | | 8 | | | | 642 | |
| ANSYS, Inc. (a) | | | 4 | | | | 887 | |
| Autodesk, Inc. (a) | | | 11 | | | | 2,055 | |
| Bill.com Holdings, Inc. (a) | | | 5 | | | | 662 | |
| Broadridge Financial Solutions, Inc. | | | 6 | | | | 866 | |
| Cadence Design Systems, Inc. (a) | | | 14 | | | | 2,288 | |
| Citrix Systems, Inc. | | | 6 | | | | 624 | |
The accompanying notes are an integral part of these financial statements.
| SCHEDULE OF INVESTMENTS (Continued) |
| at September 30, 2022 |
| | | Number of | | | | |
| COMMON STOCKS – 90.95% (Continued) | | Shares | | | Value | |
| Software – 11.26% (Continued) | | | | | | |
| Cloudflare, Inc. (a) | | | 12 | | | $ | 664 | |
| Datadog, Inc. (a) | | | 12 | | | | 1,065 | |
| DocuSign, Inc. (a) | | | 10 | | | | 535 | |
| Electronic Arts, Inc. | | | 13 | | | | 1,504 | |
| Fair Isaac Corp. (a) | | | 1 | | | | 412 | |
| Fidelity National Information Services, Inc. | | | 32 | | | | 2,418 | |
| Fiserv, Inc. (a) | | | 33 | | | | 3,088 | |
| HubSpot, Inc. (a) | | | 2 | | | | 540 | |
| Intuit, Inc. | | | 14 | | | | 5,422 | |
| Jack Henry & Associates, Inc. | | | 3 | | | | 547 | |
| Microsoft Corp. | | | 397 | | | | 92,461 | |
| MongoDB, Inc. (a) | | | 3 | | | | 596 | |
| MSCI, Inc. | | | 4 | | | | 1,687 | |
| Oracle Corp. | | | 80 | | | | 4,886 | |
| Paychex, Inc. | | | 17 | | | | 1,908 | |
| Paycom Software, Inc. (a) | | | 2 | | | | 660 | |
| PTC, Inc. (a) | | | 5 | | | | 523 | |
| ROBLOX Corp. (a) | | | 19 | | | | 681 | |
| Roper Technologies, Inc. | | | 5 | | | | 1,798 | |
| Salesforce, Inc. (a) | | | 51 | | | | 7,336 | |
| ServiceNow, Inc. (a) | | | 10 | | | | 3,776 | |
| Snowflake, Inc. (a) | | | 14 | | | | 2,379 | |
| Splunk, Inc. (a) | | | 7 | | | | 526 | |
| SS&C Technologies Holdings, Inc. | | | 11 | | | | 525 | |
| Synopsys, Inc. (a) | | | 8 | | | | 2,444 | |
| Take-Two Interactive Software, Inc. (a) | | | 8 | | | | 872 | |
| Twilio, Inc. (a) | | | 8 | | | | 553 | |
| Tyler Technologies, Inc. (a) | | | 2 | | | | 695 | |
| Veeva Systems, Inc. (a) | | | 6 | | | | 989 | |
| Vmware, Inc. | | | 11 | | | | 1,171 | |
| Workday, Inc. (a) | | | 8 | | | | 1,218 | |
| Zoom Video Communications, Inc. (a) | | | 10 | | | | 736 | |
| ZoomInfo Technologies, Inc. (a) | | | 16 | | | | 667 | |
| | | | | | | | 162,662 | |
| TOTAL TECHNOLOGY | | | | | | | 368,006 | |
The accompanying notes are an integral part of these financial statements.
| SCHEDULE OF INVESTMENTS (Continued) |
| at September 30, 2022 |
| | | Number of | | | | |
| COMMON STOCKS – 90.95% (Continued) | | Shares | | | Value | |
| UTILITIES – 0.11% | | | | | | |
| | | | | | | |
| Water – 0.11% | | | | | | |
| American Water Works Co., Inc. | | | 9 | | | $ | 1,171 | |
| Essential Utilities, Inc. | | | 13 | | | | 538 | |
| | | | | | | | 1,709 | |
| TOTAL UTILITIES | | | | | | | 1,709 | |
| TOTAL COMMON STOCKS | | | | | | | | |
| (Cost $1,589,865) | | | | | | | 1,313,835 | |
| | | | | | | | | |
| REITS – 3.16% | | | | | | | | |
| Alexandria Real Estate Equities, Inc. | | | 8 | | | | 1,121 | |
| American Homes 4 Rent | | | 17 | | | | 558 | |
| American Tower Corp. | | | 24 | | | | 5,153 | |
| Annaly Capital Management, Inc. | | | 22 | | | | 377 | |
| AvalonBay Communities, Inc. | | | 7 | | | | 1,289 | |
| Boston Properties, Inc. | | | 7 | | | | 525 | |
| Camden Property Trust | | | 5 | | | | 597 | |
| Crown Castle, Inc. | | | 22 | | | | 3,180 | |
| Digital Realty Trust, Inc. | | | 15 | | | | 1,488 | |
| Duke Realty Corp. | | | 20 | | | | 964 | |
| Equinix, Inc. | | | 4 | | | | 2,275 | |
| Equity LifeStyle Properties, Inc. | | | 9 | | | | 566 | |
| Equity Residential | | | 19 | | | | 1,277 | |
| Essex Property Trust, Inc. | | | 3 | | | | 727 | |
| Extra Space Storage, Inc. | | | 7 | | | | 1,209 | |
| Gaming and Leisure Properties, Inc. | | | 13 | | | | 575 | |
| Healthpeak Properties, Inc. | | | 28 | | | | 642 | |
| Host Hotels & Resorts, Inc. | | | 37 | | | | 588 | |
| Invitation Homes, Inc. | | | 32 | | | | 1,081 | |
| Iron Mountain, Inc. | | | 15 | | | | 660 | |
| Kimco Realty Corp. | | | 32 | | | | 589 | |
| Life Storage, Inc. | | | 4 | | | | 443 | |
| Mid-America Apartment Communities, Inc. | | | 6 | | | | 930 | |
| Prologis, Inc. | | | 39 | | | | 3,962 | |
| Public Storage | | | 8 | | | | 2,342 | |
The accompanying notes are an integral part of these financial statements.
| SCHEDULE OF INVESTMENTS (Continued) |
| at September 30, 2022 |
| | | Number of | | | | |
| REITS – 3.16% (Continued) | | Shares | | | Value | |
| Realty Income Corp. | | | 32 | | | $ | 1,862 | |
| Rexford Industrial Realty, Inc. | | | 9 | | | | 468 | |
| SBA Communications Corp. | | | 5 | | | | 1,423 | |
| Simon Property Group, Inc. | | | 17 | | | | 1,526 | |
| Sun Communities, Inc. | | | 6 | | | | 812 | |
| UDR, Inc. | | | 17 | | | | 709 | |
| Ventas, Inc. | | | 21 | | | | 844 | |
| VICI Properties, Inc. | | | 51 | | | | 1,522 | |
| Welltower, Inc. | | | 24 | | | | 1,544 | |
| Weyerhaeuser Co. | | | 39 | | | | 1,114 | |
| WP Carey, Inc. | | | 10 | | | | 698 | |
| TOTAL REITS | | | | | | | | |
| (Cost $56,427) | | | | | | | 45,640 | |
| TOTAL INVESTMENTS | | | | | | | | |
| (Cost $1,646,292) – 94.12% | | | | | | | 1,359,475 | |
| Other Assets in Excess of Liabilities – 5.88% | | | | | | | 84,982 | |
| TOTAL NET ASSETS – 100.00% | | | | | | $ | 1,444,457 | |
Percentages are stated as a percent of net assets.
ADR – American Depositary Receipt
PLC – Public Limited Company
| (a) | Non-income producing security. |
The accompanying notes are an integral part of these financial statements.
| STATEMENT OF ASSETS AND LIABILITIES |
| at September 30, 2022 |
| Assets: | | | |
| Investments, at value (cost of $1,646,292) | | $ | 1,359,475 | |
| Cash | | | 76,922 | |
| Receivables: | | | | |
| Fund shares sold | | | 7,498 | |
| Dividends and interest | | | 979 | |
| Total assets | | | 1,444,874 | |
| | | | | |
| Liabilities: | | | | |
| Payables: | | | | |
| Advisory fee | | | 88 | |
| Sub-TA fees | | | 329 | |
| Total liabilities | | | 417 | |
| | | | | |
| Net assets | | $ | 1,444,457 | |
| | | | | |
| Net assets consist of: | | | | |
| Paid in capital | | $ | 1,746,695 | |
| Total accumulated loss | | | (302,238 | ) |
| Net assets | | $ | 1,444,457 | |
| | | | | |
| Net assets applicable to outstanding Shares | | | 1,444,457 | |
| Shares issued (Unlimited number of beneficial | | | | |
| interest authorized, $0.01 par value) | | | 87,294 | |
| Net asset value, offering price and redemption price per share | | $ | 16.55 | |
The accompanying notes are an integral part of these financial statements.
| STATEMENT OF OPERATIONS |
| For the Period Ended September 30, 2022* |
| Investment income: | | | |
| Dividends and Interest | | $ | 11,191 | |
| Total investment income | | | 11,191 | |
| | | | | |
| Expenses: | | | | |
| Investment advisory fees (Note 4) | | | 613 | |
| Sub-TA fees (Note 5) | | | 329 | |
| Total expenses | | | 942 | |
| Net investment income | | $ | 10,249 | |
| | | | | |
| Realized and unrealized loss: | | | | |
| Net realized loss on transactions from investments | | $ | (25,344 | ) |
| Net change in unrealized depreciation on investments | | | (286,817 | ) |
| Net realized and unrealized loss | | | (312,161 | ) |
| Net decrease in net assets resulting from operations | | $ | (301,912 | ) |
| * | The Sphere 500 Fossil Free Fund commenced operations on October 4, 2021. |
The accompanying notes are an integral part of these financial statements.
| STATEMENT OF CHANGES IN NET ASSETS |
| |
| | | Period Ended | |
| | | September 30, 2022* | |
| Operations: | | | |
| Net investment income | | $ | 10,249 | |
| Net realized loss on investments | | | (25,344 | ) |
| Net change in unrealized depreciation on investments | | | (286,817 | ) |
| Net decrease in net assets resulting from operations | | | (301,912 | ) |
| | | | | |
| Distributions: | | | | |
| Distributable earnings | | | (326 | ) |
| Total distributions | | | (326 | ) |
| | | | | |
| Capital Share Transactions: | | | | |
| Proceeds from shares sold | | | 1,749,606 | |
| Proceeds from shares in reinvestment of distributions | | | 326 | |
| Cost of shares redeemed | | | (3,237 | ) |
| Net increase in net assets from capital share transactions | | | 1,746,695 | |
| Total increase in net assets | | | 1,444,457 | |
| | | | | |
| Net Assets: | | | | |
| Beginning of period | | | — | |
| End of period | | $ | 1,444,457 | |
| | | | | |
| Changes in Shares Outstanding: | | | | |
| Shares sold | | | 87,434 | |
| Shares reinvested | | | 15 | |
| Shares redeemed | | | (155 | ) |
| Net increase in shares outstanding | | | 87,294 | |
| * | The Sphere 500 Fossil Free Fund commenced operations on October 4, 2021. |
The accompanying notes are an integral part of these financial statements.
For a capital share outstanding throughout the period
| | | October 4, 2021 | |
| | | through | |
| | | September 30, 2022* | |
| Net Asset Value – Beginning of Period | | $ | 20.00 | |
| | | | | |
| Income from Investment Operations: | | | | |
Net investment income1 | | | 0.22 | |
| Net realized and unrealized loss on investments | | | (3.66 | ) |
| Total from investment operations | | | (3.44 | ) |
| | | | | |
| Less Distributions: | | | | |
| From net investment income | | | (0.01 | ) |
| From net realized gain on investment | | | — | |
| Total distributions | | | — | |
| | | | | |
| Net Asset Value – End of Period | | $ | 16.55 | |
| | | | | |
| Total Return | | (17.20 | )%^ |
| | | | | |
| Ratios and Supplemental Data: | | | | |
| Net assets, end of period (thousands) | | $ | 1,444 | |
| Ratio of operating expenses to average net assets: | | | 0.11 | %+ |
| Ratio of net investment income to average net assets: | | | 1.15 | %+ |
| Portfolio turnover rate | | 14 | %^ |
| * | Commencement of operations for the Fund was October 4, 2021 |
| + | Annualized |
| ^ | Not Annualized |
1 | The net investment income per share was calculated using the average shares outstanding method. |
The accompanying notes are an integral part of these financial statements.
| NOTES TO FINANCIAL STATEMENTS |
| at September 30, 2022 |
NOTE 1 – ORGANIZATION
The Sphere 500 Fossil Free Fund (the “Fund”) is a series of Manager Directed Portfolios (the “Trust”). The Trust is registered under the Investment Company Act of 1940, as amended (the “1940 Act”), and was organized as a Delaware statutory trust on April 4, 2006. The Fund is an open-end investment management company and is a diversified series of the Trust. The Fund commenced operations on October 4, 2021. Reflection Asset Management, LLC serves as the investment adviser to the Fund. As an investment company, the Fund follows the investment company accounting and reporting guidance of the Financial Accounting Standards Board (“FASB”) Accounting Standard Codification Topic 946 Financial Services – Investment Companies. The investment objective of the Fund is to track the performance, before fees and expenses, of the Sphere 500 Fossil Free Index (the “Index”). The Index is a modified version of the BITA 500 US Giants Index (the “Reference Index”).
NOTE 2 – SIGNIFICANT ACCOUNTING POLICIES
The following is a summary of significant accounting policies consistently followed by the Fund. These policies are in conformity with U.S. generally accepted accounting principles (“GAAP”). The Fund is an investment company and accordingly follows the investment company accounting and reporting guidance of the Financial Accounting Standards Board (“FASB”) Accounting Standard Codification Topic 946 Financial Services – Investment Companies.
| | A. | Security Valuation: All investments in securities are recorded at their estimated fair value, as described in Note 3. |
| | | |
| | B. | Federal Income Taxes: It is the Fund’s policy to comply with the requirements of Subchapter M of the Internal Revenue Code applicable to regulated investment companies and to distribute substantially all of its taxable income to its shareholders. Therefore, no federal income or excise tax provisions are required. |
| | | |
| | | The Fund recognizes the tax benefits of uncertain tax positions only where the position is “more likely than not” to be sustained assuming examination by tax authorities. Management has analyzed the Fund’s tax positions, and has concluded that no liability for unrecognized tax benefits should be recorded related to uncertain tax positions expected to be taken on a tax return. The tax return for the current year is open for examination. The Fund identifies its major tax jurisdictions as U.S. Federal and the state of Delaware. |
| | | |
| | C. | Securities Transactions, Income and Distributions: Securities transactions are accounted for on the trade date. Realized gains and losses on securities sold are determined on the basis of identified cost. Interest income is recorded on an accrual basis. Dividend income and distributions to shareholders are recorded on the ex-dividend date. Withholding taxes on foreign dividends have been provided for in accordance with the Fund’s understanding of the applicable country’s tax rules and rates. |
| NOTES TO FINANCIAL STATEMENTS (Continued) |
| at September 30, 2022 |
| | | The Fund distributes substantially all of its net investment income, if any, and net realized capital gains, if any, annually. Distributions from net realized gains for book purposes may include short-term capital gains. All short-term capital gains are included in ordinary income for tax purposes. The amount of dividends and distributions to shareholders from net investment income and net realized capital gains is determined in accordance with federal income tax regulations, which may differ from GAAP. To the extent these book/tax differences are permanent, such amounts are reclassified within the capital accounts based on their federal tax treatment. |
| | | |
| | D. | Use of Estimates: The preparation of financial statements in conformity with GAAP requires management to make estimates and assumptions that affect the reported amounts of assets and liabilities at the date of the financial statements and the reported amounts of increases and decreases in net assets during the reporting period. Actual results could differ from those estimates. |
| | | |
| | E. | Reclassification of Capital Accounts: GAAP requires that certain components of net assets relating to permanent differences be reclassified between financial and tax reporting. These reclassifications have no effect on net assets or net asset value per share. |
| | | |
| | F. | Events Subsequent to the Fiscal Period End: In preparing the financial statements as of September 30, 2022 and through the date the financial statements were available to be issued, management considered the impact of subsequent events for potential recognition or disclosure in the financial statements. Effective November 14, 2022, the Sphere 500 Fossil Free Fund changed its name to the Sphere 500 Climate Fund. Information about the Fund and its risks can be found in the fund’s prospectus and statement of additional information dated November 14, 2022. |
NOTE 3 – SECURITIES VALUATION
The Fund has adopted authoritative fair value accounting standards which establish an authoritative definition of fair value and set out a hierarchy for measuring fair value. These standards require additional disclosures about the various inputs and valuation techniques used to develop the measurements of fair value, a discussion of changes in valuation techniques and related inputs during the period, and expanded disclosure of valuation levels for major security types. These inputs are summarized in the three broad levels listed below:
| | Level 1 – | Unadjusted, quoted prices in active markets for identical assets or liabilities that the Fund has the ability to access at the date of measurement. |
| | | |
| | Level 2 – | Other significant observable inputs (including, but not limited to, quoted prices in active markets for similar instruments, quoted prices in markets that are not active for identical or similar instruments, and model-derived |
| NOTES TO FINANCIAL STATEMENTS (Continued) |
| at September 30, 2022 |
| | | valuations in which all significant inputs and significant value drivers are observable in active markets, such as interest rates, prepayment speeds, credit risk curves, default rates, and similar data). |
| | | |
| | Level 3 – | Significant unobservable inputs for the asset or liability, to the extent relevant observable inputs are not available, representing the Fund’s own assumptions about the assumptions a market participant would use in valuing the asset or liability, and would be based on the best information available. |
Following is a description of the valuation techniques applied to the Fund’s major categories of assets and liabilities measured at fair value on a recurring basis.
Equity Securities: Equity securities, including common stocks, preferred stocks, foreign-issued common stocks, exchange-traded funds, closed-end mutual funds and real estate investment trusts (REITs), that are primarily traded on a national securities exchange shall be valued at the last sale price on the exchange on which they are primarily traded on the day of valuation or, if there has been no sale on such day, at the mean between the bid and asked prices. Securities primarily traded in the NASDAQ Global Market System for which market quotations are readily available shall be valued using the NASDAQ Official Closing Price (“NOCP”). If the NOCP is not available, such securities shall be valued at the last sale price on the day of valuation, or if there has been no sale on such day, at the mean between the bid and asked prices. Over-the-counter securities that are not traded on a listed exchange are valued at the last sale price in the over-the-counter market. Over-the-counter securities which are not traded in the NASDAQ Global Market System shall be valued at the mean between the bid and asked prices. To the extent these securities are actively traded and valuation adjustments are not applied, they are categorized in Level 1 or Level 2 of the fair value hierarchy.
Registered Investment Companies: Investments in registered investment companies (e.g., mutual funds) are generally priced at the ending NAV provided by the applicable registered investment company’s service agent and will be classified in Level 1 of the fair value hierarchy.
Short-Term Debt Securities: Debt securities, including short-term debt instruments having a maturity of less than 60 days, are valued at the evaluated mean price supplied by an approved pricing service. Pricing services may use various valuation methodologies including matrix pricing and other analytical pricing models as well as market transactions and dealer quotations. In the absence of prices from a pricing service, the securities will be priced in accordance with the procedures adopted by the Board. Short-term securities are generally classified in Level 1 or Level 2 of the fair market hierarchy depending on the inputs used and market activity levels for specific securities.
In the absence of prices from a pricing service or in the event that market quotations are not readily available, fair value will be determined under the Fund’s valuation procedures adopted pursuant to Rule 2a-5. Pursuant to those procedures, the Board has
| NOTES TO FINANCIAL STATEMENTS (Continued) |
| at September 30, 2022 |
appointed the Advisor as the Fund’s valuation designee (the “Valuation Designee”) to perform all fair valuations of the Fund’s portfolio investments, subject to the Board’s oversight. As the Valuation Designee, the Advisor has established procedures for its fair valuation of the Fund’s portfolio investments. These procedures address, among other things, determining when market quotations are not readily available or reliable and the methodologies to be used for determining the fair value of investments, as well as the use and oversight of third-party pricing services for fair valuation.
Depending on the relative significance of the valuation inputs, fair valued securities may be classified in either level 2 or level 3 of the fair value hierarchy.
The inputs or methodology used for valuing securities are not an indication of the risk associated with investing in those securities. The following is a summary of the fair valuation hierarchy of the Fund’s securities as of September 30, 2022:
| | | | Level 1 | | | Level 2 | | | Level 3 | | | Total | |
| | Common Stocks | | | | | | | | | | | | |
| | Basic Materials | | $ | 21,854 | | | $ | — | | | $ | — | | | $ | 21,854 | |
| | Communications | | | 197,145 | | | | — | | | | — | | | | 197,145 | |
| | Consumer, Cyclical | | | 137,576 | | | | — | | | | — | | | | 137,576 | |
| | Consumer, Non-Cyclical | | | 342,950 | | | | — | | | | — | | | | 342,950 | |
| | Energy | | | 3,171 | | | | — | | | | — | | | | 3,171 | |
| | Financial | | | 166,290 | | | | — | | | | — | | | | 166,290 | |
| | Industrial | | | 75,134 | | | | — | | | | — | | | | 75,134 | |
| | Technology | | | 368,006 | | | | — | | | | — | | | | 368,006 | |
| | Utilities | | | 1,709 | | | | — | | | | — | | | | 1,709 | |
| | Total Common Stocks | | | 1,313,835 | | | | — | | | | — | | | | 1,313,835 | |
| | REITs | | | 45,640 | | | | — | | | | — | | | | 45,640 | |
| | Total Investments in Securities | | $ | 1,359,475 | | | $ | — | | | $ | — | | | $ | 1,359,475 | |
NOTE 4 – INVESTMENT ADVISORY FEE AND OTHER TRANSACTIONS WITH AFFILIATES
For the fiscal year ended September 30, 2022, the Advisor provided the Fund with investment management services under an Investment Advisory Agreement. The Advisor furnishes all investment advice, office space, and facilities, and provides most of the personnel needed by the Fund. As compensation for its services, the Advisor is entitled to a monthly fee at an annual rate of 0.07% of the average daily net assets of the Fund. For the fiscal period ended September 30, 2022, the Fund incurred $613 in advisory fees.
Pursuant to the Advisory Agreement between the Trust, on behalf of the Fund, and Reflection Asset Management, the Fund pays a unified management fee to the Advisor, which is calculated daily and paid monthly. Under the Investment Advisory Agreement, the Advisor has agreed to pay all expenses of the Fund except for interest charges on any borrowings, dividends and other expenses on securities sold short, taxes, brokerage
| NOTES TO FINANCIAL STATEMENTS (Continued) |
| at September 30, 2022 |
commissions and other expenses incurred in placing orders for the purchase and sale of securities and other investment instruments, acquired fund fees and expenses, accrued deferred tax liability, extraordinary expenses, distribution fees and expenses paid by the Funds under any distribution plan adopted pursuant to Rule 12b-1 under the 1940 Act, shareholder servicing, and the advisory fee payable to the Advisor.
U.S. Bancorp Fund Services, LLC, doing business as U.S. Bank Global Fund Services, LLC (“Fund Services” or the “Administrator”) acts as the Fund’s Administrator under an Administration Agreement. The Administrator prepares various federal and state regulatory filings, reports and returns for the Fund; prepares reports and materials to be supplied to the Trustees; monitors the activities of the Fund’s custodian, transfer agent and accountants; coordinates the preparation and payment of the Fund’s expenses and reviews the Fund’s expense accruals. Fund Services also serves as the fund accountant and transfer agent to the Fund. Vigilant Compliance, LLC serves as the Chief Compliance Officer to the Fund. U.S. Bank N.A., an affiliate of Fund Services, serves as the Fund’s custodian.
Vigilant Distributors, LLC (the “Distributor”) acts as the Fund’s principal underwriter in a continuous public offering of the Fund’s shares.
Certain officers of the Fund are employees of the Administrator and are not paid any fees by the Fund for serving in such capacities.
NOTE 5 – SUB-TA FEE
The Fund has adopted a shareholder servicing plan (the “Plan”) on behalf of the Fund. Under the Plan, the Fund is authorized to pay an annual Sub TA fee of up to 0.10% of the Fund’s average daily net assets. This fee is used to finance certain activities related to servicing and maintaining shareholder accounts, including recordkeeping, processing transactions, providing and transmitting statements, shareholder communication, and other documentation. Payments made under the Plan may not be used to pay for any services in connection with the distribution and sale of the Shares.
Payments to the Advisor under the Plan may reimburse the Advisor for payments it makes to selected brokers, dealers and administrators which have entered into service agreements with the Advisor for services provided to the Fund. The services provided by such intermediaries are primarily designed to assist shareholders of the Fund and include the furnishing of office space and equipment, telephone facilities, personnel, and assistance to the Fund in servicing such shareholders. Services provided by such intermediaries also include the provision of support services to the Fund and include establishing and maintaining shareholders’ accounts and record processing, purchase and redemption transactions, answering routine client inquiries regarding the Fund, and providing such other personal services to shareholders as the Fund may reasonably request. For the fiscal year ended September 30, 2022, the Fund incurred, under the Agreement, Sub-TA fees of $329.
| NOTES TO FINANCIAL STATEMENTS (Continued) |
| at September 30, 2022 |
NOTE 6 – SECURITIES TRANSACTIONS
For the fiscal year ended September 30, 2022, the cost of purchases and the proceeds from sales of securities, excluding short-term securities, were as follows:
| | | Purchases | Sales |
| | Sphere 500 Fossil Free Fund | $1,790,111 | $118,365 |
There were no purchases or sales of long-term U.S. Government securities.
NOTE 7 – INCOME TAXES AND DISTRIBUTIONS TO SHAREHOLDERS
As of September 30, 2022, the components of accumulated earnings/(losses) on a tax basis were as follows:
| | Cost of investments | | $ | 1,660,578 | |
| | Gross unrealized appreciation | | | 13,418 | |
| | Gross unrealized depreciation | | | (314,521 | ) |
| | Net unrealized depreciation | | | (301,103 | ) |
| | Undistributed ordinary income | | | 9,934 | |
| | Undistributed long-term capital gain | | | — | |
| | Total distributable earnings | | | 9,934 | |
| | Capital loss carry-forwards | | | — | |
| | Other accumulated gains/(losses) | | | (11,069 | ) |
| | Total accumulated earnings/(losses) | | $ | (302,238 | ) |
At September 30, 2022, the Fund had short-term tax basis capital losses of $11,064 with no expiration date and no long-term tax basis capital losses.
The tax character of distributions paid during the fiscal period ended September 30, 2022, was as follows:
| | | Period Ended |
| | | September 30, 2022 |
| | Ordinary income | $326 |
NOTE 8 – PRINCIPAL RISKS
Below are summaries of some, but not all, of the principal risks of investing in the Fund, each of which could adversely affect the Fund’s NAV, market price, yield, and total return. Further information about investment risks is available in the Fund’s prospectus and Statement of Additional Information.
Climate Investing Considerations Risk: Considerations to mitigate climate risk, such as environmental criteria (e.g., fossil fuel screens), applied to the Index’s construction may limit the number of investment opportunities available to the Fund, and as a result, at
| NOTES TO FINANCIAL STATEMENTS (Continued) |
| at September 30, 2022 |
times, the Fund may underperform funds that are not subject to similar investment considerations. For example, the Index may exclude certain securities due to climate-friendly considerations when other investment considerations would suggest that investing in such securities would be advantageous. The Fund may also underperform funds that invest in the energy and utilities sectors, particularly in times of rising oil, gas and energy prices.
General Market Risk; Recent Market Events: The market value of a security may move up or down, sometimes rapidly and unpredictably. These fluctuations may cause a security to be worth less than the price originally paid for it, or less than it was worth at an earlier time. Market risk may affect a single issuer, industry, sector of the economy or the market as a whole. U.S. and international markets have experienced volatility in recent months and years due to a number of economic, political and global macro factors, including rising inflation, the war between Russia and Ukraine and the impact of the coronavirus (COVID-19) global pandemic. While U.S. and global economies are recovering from the effects of COVID-19, growth concerns persist. Uncertainties regarding the level of central banks’ interest rate increases, political events, the Russia-Ukraine conflict, rising government debt in the U.S. and trade tensions have also contributed to market volatility.
Global economies and financial markets are increasingly interconnected, which increases the possibility that conditions in one country or region might adversely impact issuers in a different country or region. Continuing market volatility as a result of recent market conditions or other events may have adverse effects on the Fund’s returns. The Adviser will monitor developments and seek to manage the Fund in a manner consistent with achieving the Fund’s investment objective, but there can be no assurance that they will be successful in doing so.
Small Fund Risk: There can be no assurance that the Fund will grow to or maintain an economically viable size, in which case the Board of Trustees may determine to liquidate the Fund. Liquidation of the Fund can be initiated without shareholder approval by the Board of Trustees if it determines that liquidation is in the best interest of shareholders. As a result, the timing of the Fund’s liquidation may not be favorable.
Common Stock Risk: Common stocks are susceptible to general stock market fluctuations and to volatile increases and decreases in value as market confidence in and perceptions of their issuers change.
Large-Capitalization Risk: Larger, more established companies may be unable to respond quickly to new competitive challenges such as changes in technology and consumer tastes. Larger companies also may not be able to attain the high growth rates of successful smaller companies.
| NOTES TO FINANCIAL STATEMENTS (Continued) |
| at September 30, 2022 |
Sector Risk: To the extent the Fund invests more heavily in particular sectors of the economy, its performance will be especially sensitive to developments that significantly affect those sectors.
Information Technology Sector Risk: Market or economic factors impacting information technology companies and companies that rely heavily on technological advances could have a significant effect on the value of the Fund’s investments. The value of stocks of information technology companies and companies that rely heavily on technology is particularly vulnerable to rapid changes in technology product cycles, rapid product obsolescence, government regulation and competition, both domestically and internationally, including competition from foreign competitors with lower production costs. Stocks of information technology companies and companies that rely heavily on technology, especially those of smaller, less-seasoned companies, tend to be more volatile than the overall market. Information technology companies are heavily dependent on patent and intellectual property rights, the loss or impairment of which may adversely affect profitability.
Passive Investment Risk: The Fund is not actively managed and the Adviser would not sell a security due to current or projected underperformance of a security, industry or sector, unless that security is removed from the Index or the selling of shares of that security is otherwise required upon a reconstitution of the Index in accordance with the Index methodology. The Fund invests in securities included in the Index, regardless of their investment merits. The Fund does not take defensive positions under any market conditions, including conditions that are adverse to the performance of the Fund.
Index Calculation Risk: There is no assurance that the Index Administrator will compile the Index accurately or that the Index will be reconstituted, rebalanced, calculated or disseminated accurately. The Index relies directly or indirectly on various sources of information to assess the criteria of issuers included in the Index, including information that may be based on assumptions and estimates. Neither the Fund, the Index Administrator, or the Adviser can offer assurances that the Index’s calculation methodology or sources of information will provide an accurate assessment of included issuers or a correct valuation of securities, nor can they guarantee the availability or timeliness of the production of the Index.
Cybersecurity Risk: With the increased use of technologies such as the Internet to conduct business, the Fund is susceptible to operational, information security, and related risks. Cyber incidents affecting the Fund or its service providers may cause disruptions and impact business operations, potentially resulting in financial losses, interference with the Fund’s ability to calculate its net asset value (“NAV”), impediments to trading, the inability of shareholders to transact business, violations of applicable privacy and other laws, regulatory fines, penalties, reputational damage, reimbursement or other compensation costs, or additional compliance costs.
| NOTES TO FINANCIAL STATEMENTS (Continued) |
| at September 30, 2022 |
Third Party Data Risk: The composition of the Index, and consequently the Fund’s portfolio, is heavily dependent on information and data published by independent third parties (“Third Party Data”). When Third Party Data proves to be incorrect or incomplete, any decisions made in reliance thereon may lead to the inclusion or exclusion of securities from the Index that would have been excluded or included had the Third Party Data been correct and complete. If the composition of the Index reflects such errors, the Fund’s portfolio can also be expected to reflect the errors.
Tracking Error Risk: As with all index funds, the performance of the Fund and its Index may differ from each other for a variety of reasons. For example, the Fund incurs operating expenses and portfolio transaction costs not incurred by the Index. In addition, the Fund may not be fully invested in the securities of the Index at all times or may hold securities not included in the Index.
Operational Risk: Operational risks include human error, changes in personnel, system changes, faults in communication, and failures in systems, technology, or processes. Various operational events or circumstances are outside the Adviser’s control, including instances at third parties. The Fund and the Adviser seek to reduce these operational risks through controls and procedures. However, these measures do not address every possible risk and may be inadequate to address these risks.
NOTE 9 – GUARANTEES AND INDEMNIFICATIONS
In the normal course of business, the Fund enters into contracts that contain a variety of representations and warranties and which provide general indemnifications. The Fund’s maximum exposure under these arrangements is unknown, as this would involve future claims that may be made against the Fund that have not yet occurred. However, based on experience, the Fund expects the risk of loss to be remote.
| REPORT OF INDEPENDENT REGISTERED PUBLIC ACCOUNTING FIRM |
| |
To the Board of Trustees of Manager Directed Portfolios
and the Shareholders of Sphere 500 Fossil Free Fund
Opinion on the Financial Statements
We have audited the accompanying statement of assets and liabilities of Sphere 500 Fossil Free Fund, a series of shares of beneficial interest in Manager Directed Portfolios (the “Fund”), including the schedule of investments, as of September 30, 2022, and the related statement of operations, the statement of changes in net assets and the financial highlights for the period October 4, 2021 (commencement of operations) through September 30, 2022, and the related notes (collectively referred to as the “financial statements”). In our opinion, the financial statements present fairly, in all material respects, the financial position of the Fund as of September 30, 2022, and the results of its operations, the changes in its net assets, and its financial highlights for the period October 4, 2021 through September 30, 2022, in conformity with accounting principles generally accepted in the United States of America.
Basis for Opinion
These financial statements are the responsibility of the Fund’s management. Our responsibility is to express an opinion on the Fund's financial statements based on our audit. We are a public accounting firm registered with the Public Company Accounting Oversight Board (United States) (“PCAOB”) and are required to be independent with respect to the Fund in accordance with the U.S. federal securities law and the applicable rules and regulations of the Securities and Exchange Commission and the PCAOB.
We conducted our audit in accordance with the standards of the PCAOB. Those standards require that we plan and perform the audit to obtain reasonable assurance about whether the financial statements are free of material misstatement, whether due to error or fraud. The Fund is not required to have, nor were we engaged to perform, an audit of its internal control over financial reporting. As part of our audit we are required to obtain an understanding of internal control over financial reporting but not for the purpose of expressing an opinion on the effectiveness of the Fund’s internal control over financial reporting. Accordingly, we express no such opinion.
Our audit included performing procedures to assess the risk of material misstatement of the financial statements, whether due to error or fraud, and performing procedures that respond to those risks. Such procedures included examining, on a test basis, evidence regarding the amounts and disclosures in the financial statements. Our procedures included confirmation of securities owned as of September 30, 2022 by correspondence with the custodian. Our audit also included evaluating the accounting principles used and significant estimates made by management, as well as evaluating the overall presentation of the financial statements. We believe that our audit provides a reasonable basis for our opinion.
BBD, LLP
We have served as the auditor of one or more of the Funds in the Manager Directed Portfolios since 2007.
Philadelphia, Pennsylvania
November 29, 2022
| EXPENSE EXAMPLE |
| September 30, 2022 (Unaudited) |
As a shareholder of the Fund, you incur two types of costs: (1) transaction costs including sales charges (loads) and redemption fees, if applicable; and (2) ongoing costs, including management fees; and other Fund expenses. This Example is intended to help you understand your ongoing costs (in dollars) of investing in the Fund and to compare these costs with the ongoing costs of investing in other mutual funds.
The Example is based on an investment of $1,000 invested at the beginning of the period indicated and held for the entire period from April 1, 2022 to September 30, 2022, for the Fund.
Actual Expenses
The information in the table under the heading “Actual” provides information about actual account values and actual expenses. You may use the information in these columns together with the amount you invested, to estimate the expenses that you paid over the period. Simply divide your account value by $1,000 (for example, an $8,600 account value divided by $1,000 = 8.6), then multiply the result by the number in the row entitled “Expenses Paid During Period” to estimate the expenses you paid on your account during this period. There are some account fees that are charged to certain types of accounts, such as Individual Retirement Accounts (generally, a $15 fee is charged to the account annually) that would increase the amount of expenses paid on your account. The example below does not include portfolio trading commissions and related expenses and other extraordinary expenses as determined under generally accepted accounting principles.
Hypothetical Example for Comparison Purposes
The information in the table under the heading “Hypothetical (5% return before expenses)” provides information about hypothetical account values and hypothetical expenses based on the Fund’s actual expense ratio and assumed rate of return of 5% per year before expenses, which is not the Fund’s actual return. The hypothetical account values and expenses may not be used to estimate the actual ending account balance or expenses you paid for the period. You may use this information to compare the ongoing costs of investing in the Fund and other funds. To do so, compare this 5% hypothetical example with the 5% hypothetical examples that appear in the shareholder reports of the other funds. As noted above, there are some account fees that are charged to certain types of accounts that would increase the amount of expense paid on your account.
Please note that the expenses shown in the table are meant to highlight your ongoing costs only and do not reflect any transaction costs, such as sales charges (loads), redemption fees, or exchange fees. Therefore, the information under the heading “Hypothetical (5% return before expenses)” is useful in comparing ongoing costs only, and will not help you determine the relative total costs of owning different funds. In addition, if these transactional costs were included, your costs would have been higher.
| EXPENSE EXAMPLE (Continued) |
| September 30, 2022 (Unaudited) |
| | Beginning | Ending | Expenses Paid |
| | Account Value | Account Value | During Period(1) |
| | 4/1/2022 | 9/30/2022 | 4/1/2022-9/30/2022 |
| Actual | $1,000.00 | $ 798.40 | $0.54 |
| Hypothetical (5% return | | | |
| before expenses) | $1,000.00 | $1,024.47 | $0.61 |
(1) | Expenses are equal to the Fund’s annualized expense ratio of 0.12% multiplied by the average account value over the period, multiplied by 183/365 (to reflect the prior six months of operation). |
| STATEMENT REGARDING LIQUIDITY RISK MANAGEMENT PROGRAM |
| |
In accordance with Rule 22e-4 under the Investment Company Act of 1940, as amended, the Fund, a series of Manager Directed Portfolios (the “Trust”), has adopted and implemented a liquidity risk management program tailored specifically to the Fund (the “Program”). The Program seeks to promote effective liquidity risk management for the Fund and to protect Fund shareholders from dilution of their interests. The Board has designated the Fund’s investment adviser to serve as the administrator of the Program (the “Program Administrator”). Personnel of the Fund’s investment adviser conduct the day-to-day operation of the Program pursuant to policies and procedures administered by the Program Administrator. The Program Administrator is required to provide a written annual report to the Board and the chief compliance officer of the Trust regarding the adequacy and effectiveness of the Program and any material changes to the Program.
Under the Program, the Program Administrator manages the Fund’s liquidity risk, which is the risk that the Fund could not meet shareholder redemption requests without significant dilution of remaining shareholders’ interests in the Fund. The Program assesses liquidity risk under both normal and reasonably foreseeable stressed market conditions. This risk is managed by monitoring the degree of liquidity of the Fund’s investments, limiting the amount of the Fund’s illiquid investments, and utilizing various risk management tools and facilities available to the Fund for meeting shareholder redemptions, among other means.
On November 18, 2022, the Board reviewed the Program Administrator’s assessment of the operation and effectiveness of the Program for the period October 4, 2021 through September 30, 2022 (the “Report”) and a memorandum regarding the Report prepared by the Trust’s chief compliance officer. The Report noted that the Fund’s portfolio is expected to continue to primarily hold highly liquid investments and the determination that the Fund be designated as a “primarily highly liquid fund” (as defined in Rule 22e-4) remains appropriate. The Fund can therefore continue to rely on the exclusion in Rule 22e-4 from the requirements to determine and review a highly liquid investment minimum for the Fund and to adopt policies and procedures for responding to a highly liquid investment minimum shortfall. The Report noted that there were no breaches of the Fund’s restriction on holding illiquid investments exceeding 15% of its net assets during the review period. The Report confirmed that the Fund’s investment strategy was appropriate for an open-end management investment company. The Report also indicated that no material changes had been made to the Program during the review period.
The Program Administrator determined that the Fund is reasonably likely to be able to meet redemption requests without adversely affecting non-redeeming Fund shareholders through significant dilution. The Program Administrator concluded that the during the review period, the Program was adequately designed and effectively operating to monitor the liquidity risk to the Fund, taking into account the size of the Fund, the type of business conducted, and other relevant factors.
| NOTICE TO SHAREHOLDERS |
| at September 30, 2022 (Unaudited) |
How to Obtain a Copy of the Fund’s Proxy Voting Policies
A description of the policies and procedures that the Fund uses to determine how to vote proxies relating to portfolio securities is available without charge, upon request, by calling 1-844-2SPHERE or on the U.S. Securities and Exchange Commission’s (“SEC”) website at http://www.sec.gov.
How to Obtain a Copy of the Fund’s Proxy Voting Records for the most recent 12-Month Period Ended June 30
Information regarding how the Fund voted proxies relating to portfolio securities during the most recent 12-month period ended June 30 is available no later than August 31 without charge, upon request, by calling 1-844-2SPHERE. Furthermore, you can obtain the Fund’s proxy voting records on the SEC’s website at http://www.sec.gov.
Quarterly Filings on Form N-PORT
The Fund files its complete schedule of portfolio holdings with the SEC for the first and third quarters of each fiscal year on Form N-PORT. The Fund’s Form N-PORT is available on the SEC’s website at http://www.sec.gov. The Fund’s Form N-PORT may be reviewed and copied at the SEC’s Public Reference Room in Washington, DC, and information on the operation of the Public Reference Room may be obtained by calling 1-202-551-8090. Information included in the Fund’s Form N-PORT is also available, upon request, by calling 1-844-2SPHERE.
Householding
In an effort to decrease costs, the Fund intends to reduce the number of duplicate prospectuses and annual and semi-annual reports you receive by sending only one copy of each to those addresses shared by two or more accounts and to shareholders the Transfer Agent reasonably believes are from the same family or household. Once implemented, if you would like to discontinue householding for your accounts, please call toll-free at 1-844-2SPHERE to request individual copies of these documents. Once the Transfer Agent receives notice to stop householding, the Transfer Agent will begin sending individual copies thirty days after receiving your request. This policy does not apply to account statements.
Other Tax Information (Unaudited)
For the fiscal year ended September 30, 2022, certain dividends paid by the Fund may be subject to a maximum tax rate of 23.8%, as provided by the Jobs and Growth Tax Relief Reconciliation Act of 2003. The percentage of dividends declared from ordinary income designated as qualified dividend income was as follows:
| | Sphere 500 Fossil Free Fund | 100.00% | |
For corporate shareholders, the percent of ordinary income distributions qualifying for the corporate dividends received deduction for the fiscal year ended September 30, 2022 was as follows:
| | Sphere 500 Fossil Free Fund | 100.00% | |
| TRUSTEES AND OFFICERS |
| (Unaudited) |
The business and affairs of the Trust are managed under the oversight of the Board, subject to the laws of the State of Delaware and the Trust’s Agreement and Declaration of Trust. The Board, as of January 1, 2022, is currently comprised of four trustees who are not interested persons of the Trust within the meaning of the 1940 Act (the “Independent Trustees”). The Trustees are responsible for deciding matters of overall policy and overseeing the actions of the Trust’s service providers. The officers of the Trust conduct and supervise the Trust’s daily business operations.
| | | | Number of | |
| | | | Funds | Other |
| | Position(s) Held | | in Fund | Directorships |
| Name, | with the Trust | | Complex | Held by Trustee |
| (Year of Birth) | and Length of | Principal Occupation(s) | Overseen by | During the |
and Address(1) | Time Served(2) | During the Past Five Years | Trustee(3) | Past Five Years |
| INDEPENDENT TRUSTEES |
| | | | | |
| Gaylord B. Lyman | Trustee and | Senior Portfolio Manager, | 10 | None |
| (Born 1962) | Audit | Affinity Investment Advisors, | | |
| | Committee | LLC, since 2017; Managing | | |
| | Chairman, | Director of Kohala Capital | | |
| | since April 2015 | Partners, LLC (2011 – 2016). | | |
| | | | | |
| Scott Craven Jones | Trustee | Managing Director, Carne Global | 10 | Trustee, Madison |
| (Born 1962) | since July 2016 | Financial Services (US) LLC | | Funds, since 2019 |
| | and Lead | (a provider of independent | | (18 portfolios); |
| | Independent | governance and distribution | | Trustee, XAI |
| | Trustee | support for the asset management | | Octagon Floating |
| | since May 2017 | industry), since 2013; interim | | Rate & |
| | | Managing Director, Park | | Alternative |
| | | Agency, Inc., since 2020. | | Income Term |
| | | | | Trust, since 2017 |
| | | | | (2 portfolios); |
| | | | | Director, |
| | | | | Guestlogix Inc. |
| | | | | (a provider of |
| | | | | ancillary-focused |
| | | | | technology to the |
| | | | | travel industry) |
| | | | | (2015 – 2016). |
| TRUSTEES AND OFFICERS (Continued) |
| (Unaudited) |
| | | | Number of | |
| | | | Funds | Other |
| | Position(s) Held | | in Fund | Directorships |
| Name, | with the Trust | | Complex | Held by Trustee |
| (Year of Birth) | and Length of | Principal Occupation(s) | Overseen by | During the |
and Address(1) | Time Served(2) | During the Past Five Years | Trustee(3) | Past Five Years |
| Lawrence T. | Trustee | Senior Vice President and Chief | 10 | None |
| Greenberg | since July 2016 | Legal Officer, The Motley Fool | | |
| (Born 1963) | | Holdings, Inc., since 1996; | | |
| | | Venture Partner and General | | |
| | | Counsel, Motley Fool Ventures LP, | | |
| | | since 2018; Manager, Motley Fool | | |
| | | Wealth Management, LLC, | | |
| | | since 2013; Adjunct Professor, | | |
| | | Washington College of Law, | | |
| | | American University, since 2006; | | |
| | | General Counsel Motley Fool | | |
| | | Asset Management, LLC | | |
| | | (2008 – 2019). | | |
| | | | | |
| James R. Schoenike | Trustee | Distribution consultant since | 10 | None |
| (Born 1959) | since July 2016(4) | 2018, President and CEO, | | |
| | | Board of Managers, Quasar | | |
| | | Distributors, LLC (2013 – 2018). | | |
(1) | The address of each Trustee as it relates to the Trust’s business is c/o U.S. Bank Global Fund Services, 615 East Michigan Street, Milwaukee, WI 53202. |
(2) | Each Trustee serves during the continued lifetime of the Trust until he dies, resigns, is declared bankrupt or incompetent by a court of competent jurisdiction, or is removed. |
(3) | The Trust currently has ten active portfolios. |
(4) | Prior to January 1, 2021, Mr. Schoenike was considered to be an “interested person” of the Fund by virtue of his previous position as President of Quasar Distributors, LLC. |
As of the date of this report, no Independent Trustee nor any of his immediate family members (i.e., spouse or dependent children) serves as an officer or director or is an employee of the Advisor, Sub-Advisor or Distributor, or any of their respective affiliates, nor is such person an officer, director or employee of any company controlled by or under common control with such entities.
| TRUSTEES AND OFFICERS (Continued) |
| (Unaudited) |
| Name | Position(s) Held with | |
| (Year of Birth) | Trust and Length | |
and Address | of Time Served(3) | Principal Occupation(s) During Past Five Years |
| OFFICERS |
| | | |
Scott M. Ostrowski(1) | President and Principal | Senior Vice President, Compliance and |
| (Born 1980) | Executive Officer, | Administration, Fund Services, since 2006. |
| | since August 10, 2021 | |
| | | |
Ryan Frank(1) | Treasurer, and | Vice President, Fund Services, since 2008. |
| (Born 1985) | Principal Financial | |
| | Officer, | |
| | since August 17, 2022 | |
| | | |
Colton W. Scarmardo(1) | Assistant Treasurer, | Fund Administrator, Compliance and Administration, |
| (Born 1997) | since May 11, 2021 | Fund Services, since 2019; Business Administration |
| | | Student, 2015-2019, MBA obtained May 2022. |
| | | |
Justin Dausch(2) | Chief Compliance | Director, Vigilant, since 2017; Compliance Associate, |
| (Born 1989) | Officer and | HSBC (investment banking company), 2015 – 2017. |
| | Anti-Money Laundering | |
| | Compliance Officer, | |
| | since January 1, 2020 | |
| | | |
Alyssa M. Bernard(1)(4) | Vice President and | Assistant Vice President, Compliance and |
| (Born 1988) | Secretary, since | Administration, Fund Services, since 2018; Attorney, |
| | August 20, 2019(4) | Mutual Fund Disclosure, Waddell & Reed Financial, |
| | | Inc., 2017 – 2018; Attorney, Corporate Governance, |
| | | American Century Companies, Inc., 2014 – 2017. |
| | | |
Isabella K. Zoller(1) | Assistant Secretary, | Assistant Vice President, Fund Services, since 2021; |
| (Born 1994) | since February 15, 2022 | Regulatory Administration Attorney, Fund Services, |
| | | since 2019; Regulatory Administration Intern, Fund |
| | | Services, 2018 – 2019; Law Student 2016 – 2019. |
(1) | The mailing address of this officer is: 615 East Michigan Street, Milwaukee, Wisconsin 53202. |
(2) | The mailing address of this officer is: 223 Wilmington West Chester Pike, Suite 216, Chadds Ford, Pennsylvania 19317. |
(3) | Each officer is elected annually and serves until his or her successor has been duly elected and qualified. |
(4) | Ms. Bernard has served as Vice President of the Trust, in addition to her other positions held with the Trust, since May 11, 2021. |
The Statement of Additional Information includes additional information about the Fund’s Trustees and Officers and is available, without charge, upon request by calling 1-800-497-2960.
| NOTICE OF PRIVACY POLICY AND PRACTICES |
| |
Protecting the privacy of Fund shareholders is important to us. The following is a description of the practices and policies through which we protect the privacy and security of your non-public personal information.
What Information We Collect
We collect and maintain information about you so that we can open and maintain your account in the Fund and provide various services to you. We collect non-public personal information about you from the following sources:
• information we receive about you on applications or other forms;
• information you give us orally; and
• information about your transactions with us or others.
The types of non-public personal information we collect and share can include:
• social security number;
• account balances;
• account transactions;
• transaction history;
• wire transfer instructions; and
• checking account information.
What Information We Disclose
We do not disclose any non-public personal information about shareholders or former shareholders of the Fund without the shareholder’s authorization, except as permitted by law or in response to inquiries from governmental authorities. We may share information with affiliated parties and unaffiliated third parties with whom we have contracts for servicing the Fund. We will provide unaffiliated third parties with only the information necessary to carry out their assigned responsibility.
How We Protect Your Information
All shareholder records will be disposed of in accordance with applicable law. We maintain physical, electronic and procedural safeguards to protect your non-public personal information and require third parties to treat your non-public personal information with the same high degree of confidentiality.
In the event that you hold shares of the Fund through a financial intermediary, including, but not limited to, a broker-dealer, bank or trust company, the privacy policy of your financial intermediary would govern how your non-public personal information would be shared with unaffiliated third parties.
If you have any questions or concerns regarding this notice or our Privacy Policy, please contact us at 1-844-2SPHERE.
(This Page Intentionally Left Blank.)
Investment Adviser
Reflection Asset Management, LLC
1000 Palm Boulevard
Isle of Palms, South Carolina 29451
Independent Registered Public Accounting Firm
BBD, LLP
1835 Market Street, 3rd Floor
Philadelphia, Pennsylvania 19103
Legal Counsel
Godfrey & Kahn, S.C.
833 East Michigan Street, Suite 1800
Milwaukee, Wisconsin 53202
Custodian
U.S. Bank, N.A.
Custody Operations
1555 North River Center Drive, Suite 302
Milwaukee, Wisconsin 53212
Transfer Agent, Fund Accountant and Fund Administrator
U.S. Bancorp Fund Services, LLC
615 East Michigan Street
Milwaukee, Wisconsin 53202
Distributor
Vigilant Distributors, LLC
Gateway Corporate Center, Suite 216
223 Wilmington West Chester Pike
Chadds Ford, Pennsylvania 19317
Compliance Services
Vigilant Compliance, LLC
Gateway Corporate Center, Suite 216
223 Wilmington West Chester Pike
Chadds Ford, Pennsylvania 19317
Item 2. Code of Ethics.
The registrant has adopted a code of ethics that applies to the registrant’s principal executive officer and principal financial officer. The registrant has not made any substantive amendments to its code of ethics during the period covered by this report. The registrant has not granted any waivers from any provisions of the code of ethics during the period covered by this report.
A copy of the registrant’s Code of Ethics is filed herewith.
Item 3. Audit Committee Financial Experts.
The registrant’s Board of Trustees has determined that there are at least two audit committee financial experts serving on its audit committee. Messrs. Gaylord B. Lyman and Scott C. Jones are the “audit committee financial experts” and are considered to be “independent” as each term is defined in Item 3 of Form N‑CSR.
Item 4. Principal Accountant Fees and Services.
The registrant has engaged its principal accountant to perform audit services, audit-related services, tax services and other services during the past two fiscal years. “Audit services” refer to performing an audit of the registrant's annual financial statements or services that are normally provided by the accountant in connection with statutory and regulatory filings or engagements for those fiscal years. “Audit-related services” refer to the assurance and related services by the principal accountant that are reasonably related to the performance of the audit. “Tax services” refer to professional services rendered by the principal accountant for tax compliance, tax advice, and tax planning. There were no “other services” provided by the principal accountant. The following table details the aggregate fees billed or expected to be billed for each of the last two fiscal years for audit fees, audit-related fees, tax fees and other fees by the principal accountant.
| | FYE 9/30/2022 | FYE 9/30/2021 |
Audit Fees | $12,000 | N/A |
Audit-Related Fees | N/A | N/A |
Tax Fees | $3,000 | N/A |
All Other Fees | N/A | N/A |
The audit committee has adopted pre-approval policies and procedures that require the audit committee to pre‑approve all audit and non‑audit services of the registrant, including services provided to any entity affiliated with the registrant.
The percentage of fees billed by BBD, LLP applicable to non-audit services pursuant to waiver of pre-approval requirement were as follows for the Sphere 500 Fossil Free Fund:
| | FYE 9/30/2022 | FYE 9/30/2021 |
Audit-Related Fees | 0% | N/A |
Tax Fees | 0% | N/A |
All Other Fees | 0% | N/A |
All of the principal accountant’s hours spent on auditing the registrant’s financial statements were attributed to work performed by full‑time permanent employees of the principal accountant.
The following table indicates the non-audit fees billed or expected to be billed by the registrant’s accountant for services to the registrant and to the registrant’s investment adviser (and any other controlling entity, etc.—not sub-adviser) for the last two years for both funds. The audit committee of the Board of Trustees has considered whether the provision of non-audit services that were rendered to the registrant's investment adviser is compatible with maintaining the principal accountant's independence and has concluded that the provision of such non-audit services by the accountant has not compromised the accountant’s independence.
Non-Audit Related Fees | FYE 9/30/2022 | FYE 9/30/2021 |
Registrant | N/A | N/A |
Registrant’s Investment Adviser | N/A | N/A |
The registrant has not been identified by the U.S. Securities and Exchange Commission as having filed an annual report issued by a registered public accounting firm branch or office that is located in a foreign jurisdiction where the Public Company Accounting Oversight Board is unable to inspect or completely investigate because of a position taken by an authority in that jurisdiction.
The registrant is not a foreign issuer.
Item 5. Audit Committee of Listed Registrants.
(a) Not applicable to registrants who are not listed issuers (as defined in Rule 10A-3 under the Securities Exchange Act of 1934).
(b) Not Applicable.
Item 6. Investments.
| (a) | Schedule of Investments is included as part of the report to shareholders filed under Item 1 of this Form. |
Item 7. Disclosure of Proxy Voting Policies and Procedures for Closed-End Management Investment Companies.
Not applicable to open-end investment companies.
Item 8. Portfolio Managers of Closed-End Management Investment Companies.
Not applicable to open-end investment companies.
Item 9. Purchases of Equity Securities by Closed‑End Management Investment Company and Affiliated Purchasers.
Not applicable to open-end investment companies.
Item 10. Submission of Matters to a Vote of Security Holders.
There have been no material changes to the procedures by which shareholders may recommend nominees to the Registrant’s Board of Trustees.
Item 11. Controls and Procedures.
| (a) | The Registrant’s President/Principal Executive Officer and Treasurer/Principal Financial Officer have reviewed the Registrant's disclosure controls and procedures (as defined in Rule 30a-3(c) under the Investment Company Act of 1940, as amended, (the “Act”)) as of a date within 90 days of the filing of this report, as required by Rule 30a-3(b) under the Act and Rules 13a-15(b) or 15d‑15(b) under the Securities Exchange Act of 1934. Based on their review, such officers have concluded that the disclosure controls and procedures are effective in ensuring that information required to be disclosed in this report is appropriately recorded, processed, summarized and reported and made known to them by others within the Registrant and by the Registrant’s service provider. |
| (b) | There were no changes in the Registrant's internal control over financial reporting (as defined in Rule 30a-3(d) under the Act) that occurred during the second fiscal quarter of the period covered by this report that has materially affected, or is reasonably likely to materially affect, the Registrant's internal control over financial reporting. |
Item 12. Disclosure of Securities Lending Activities for Closed-End Management Investment Companies.
Not applicable to open-end investment companies.
Item 13. Exhibits.
(3) Any written solicitation to purchase securities under Rule 23c‑1 under the Act sent or given during the period covered by the report by or on behalf of the registrant to 10 or more persons. Not applicable to open-end investment companies.
(4) Change in the registrant’s independent public accountant. There was no change in the registrant’s independent public accountant for the period covered by this report.
SIGNATURES
Pursuant to the requirements of the Securities Exchange Act of 1934 and the Investment Company Act of 1940, as amended, the registrant has duly caused this report to be signed on its behalf by the undersigned, thereunto duly authorized.
(Registrant) Manager Directed Portfolios
By (Signature and Title)* /s/Scott M. Ostrowski
Scott M. Ostrowski, President/
Principal Executive Officer
Date 12/5/2022
Pursuant to the requirements of the Securities Exchange Act of 1934 and the Investment Company Act of 1940, as amended, this report has been signed below by the following persons on behalf of the registrant and in the capacities and on the dates indicated.
By (Signature and Title)* /s/Scott M. Ostrowski
Scott M. Ostrowski, President/
Principal Executive Officer
Date 12/5/2022
By (Signature and Title)* /s/Ryan Frank
Ryan Frank, Treasurer/
Principal Financial Officer
Date 12/5/2022
* Print the name and title of each signing officer under his or her signature.