Vert Global Sustainable Real Estate Fund
Annual Report
June 30, 2023
Table of Contents
| Letter to Shareholders | | 3 |
| Investment Highlights | | 5 |
| Sector & Country Allocations | | 6 |
| Schedule of Investments | | 7 |
| Statement of Assets and Liabilities | | 13 |
| Statement of Operations | | 14 |
| Statements of Changes in Net Assets | | 15 |
| Financial Highlights | | 16 |
| Notes to Financial Statements | | 17 |
| Report of Independent Registered Public Accounting Firm | | 30 |
| Expense Example | | 31 |
| Notice to Shareholders | | 33 |
| Trustees and Officers | | 34 |
| Privacy Notice | | 37 |
Management’s Discussion of Fund Performance for the period ending June 30, 2023.
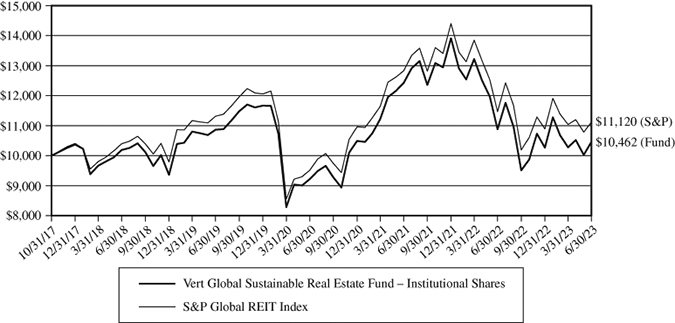
For the 12 months ended June 30, 2023, the Fund had a total return of -3.84%. Over those same 12 months, the S&P Global REIT Index return was -3.02%. For the trailing three years the Fund’s annualized performance was 4.30% compared to the Benchmark return of 5.34%.
The hangover from 2022’s dire real estate performance has been hard to shake off. Despite a strong 4th quarter in 2022 and positive returns for the first 6 months of 2023, returns are still negative for the trailing year. The improvement in performance more recently suggests that investors may be realizing that REITs are more resilient to interest rate hikes than previously feared.
Most REITs have fixed interest rates on their long-term debt. Rising interest rates do increase borrowing costs, but the bulk of these higher expenses will not be incurred for several years. And, in inflationary periods like we are in now, REITs can often raise rents more than usual. With the economy remaining strong, there are more tenants willing to pay those higher rents.
The Fund continues to deliver returns similar to the benchmark. Most quarters see returns for the Fund within about 1% of the benchmark. For most of the Fund’s existence, and for each of the last 11 quarters, the Fund has outperformed the benchmark in positive returning quarters and underperformed in negative ones. This higher ‘beta’ is to be expected as the Fund holds less than 150 companies while the benchmark S&P Global REIT Index holds over 400.
We are very comfortable with this type of performance. It is our expectation that markets rise over time. If this pattern of performance persists over the long term, where the Fund beats the Index in positive markets, comparative performance to the benchmark should be good as markets return to form.
Much has been made in the press of a political backlash to ESG investing, but this has not made much of an impact on investor appetite for sustainability. The Fund has grown significantly in the past year. Net new inflows totaled $140 million between July 1 2022 and June 30, 2023. Assets under management have reached $291 million. The Fund now has a five-year track record. That fact, and the larger asset base, make it eligible for consideration by more types of investors.
Sincerely,
Sam Adams
CEO – Vert Asset Management, LLC
Opinions expressed are subject to change at any time, are not guaranteed and should not be considered investment advice. Must be preceded or accompanied by a prospectus.
Fund holdings and sector allocations are subject to change at any time and should not be considered a recommendation to buy or sell any security. Please refer to the Schedule of Investments in this report for a complete list of Fund holdings.
Mutual fund investments involve risk. Principal loss is possible. Investors should be aware of the risks involved with investing in a fund concentrating in REITs and real estate securities, such as declines in the value of real estate and increased susceptibility to adverse economic or regulatory developments. Investments in foreign securities involve political, economic and currency risks, greater volatility and differences in accounting methods. A REIT’s share price may decline because of adverse developments affecting the real estate industry. REITs may be subject to special tax rules and may not qualify for favorable federal tax treatment which could have adverse tax consequences. The Fund’s focus on sustainability may limit the number of investment opportunities available to the Fund and at times the Fund may underperform funds that are not subject to similar investment considerations. Diversification does not assure a profit or protect against loss in a declining market.
The S&P Global REIT Index is drawn from constituents in the S&P Global Property Index. Constituents must conform to the legal structures that define a real estate investment trust in the U.S., or similar guidelines in the country of their domicile. The REITs in the index are primarily companies that invest in buildings, which are human occupied or used for storage. The REIT indices specifically exclude timber REITs, mortgage REITs and mortgage-backed REITs. One cannot invest directly in an index.
The Vert Global Sustainable Real Estate Fund is distributed by Quasar Distributors, LLC.
Vert Global Sustainable Real Estate Fund
Investment Highlights (Unaudited)
Comparison of the Change in Value of a Hypothetical $10,000 Investment
in the Vert Global Sustainable Real Estate Fund – Institutional Shares and
the S&P Global REIT Index
| | One | Three | Since Inception |
| Annualized Total Return Periods Ended June 30, 2023: | Year | Year | (10/31/2017) |
| Vert Global Sustainable Real Estate Fund – | | | |
| Institutional Shares | (3.84)% | 4.30% | 0.80% |
| S&P 500 Global REIT Index | (3.02)% | 5.34% | 1.89% |
Expense ratios*: Gross 0.67%, Net 0.50% (Institutional Shares)
Performance data quoted represents past performance; past performance does not guarantee future results. The investment return and principal value of an investment will fluctuate so that an investor’s shares, when redeemed, may be worth more or less than their original cost. Current performance of the Fund may be lower or higher than the performance quoted. Performance data current to the most recent month end may be obtained by calling 1-844-740-VERT.
This chart illustrates the performance of a hypothetical $10,000 investment made in the Fund on October 31, 2017, the Fund’s inception date. Returns reflect the reinvestment of dividends and capital gain distributions. The performance data and expense ratios shown reflect a contractual fee waiver made by the Adviser, currently, through October 31, 2023. In the absence of fee waivers, returns would be reduced. The performance data and graph do not reflect the deduction of taxes that a shareholder may pay on dividends, capital gain distributions, or redemption of Fund shares. This chart does not imply any future performance.
* The expense ratios presented are from the most recent prospectus.
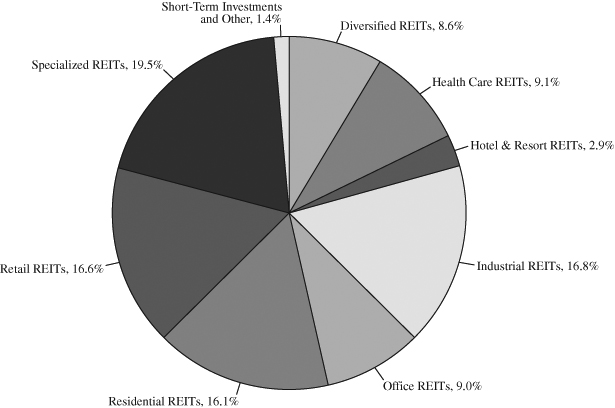
| SECTOR ALLOCATION OF PORTFOLIO ASSETS |
| at June 30, 2023 (Unaudited) |
| COUNTRY ALLOCATION OF PORTFOLIO ASSETS |
| at June 30, 2023 (Unaudited) |
| United States | 66.6% |
| Australia | 8.5% |
| Japan | 8.4% |
| United Kingdom | 4.9% |
| Singapore | 3.1% |
| France | 2.9% |
| Canada | 1.1% |
| Spain | 0.6% |
| Belgium | 0.6% |
| New Zealand | 0.4% |
| Mexico | 0.4% |
| South Africa | 0.4% |
| Mexico | 0.4% |
| Netherlands | 0.2% |
| Guernsey | 0.1% |
| Italy | 0.0%1 |
| Short-Term Investments and Other | 1.4% |
Percentages represent market value as a percentage of net assets.
1 Rounds to zero.
| SCHEDULE OF INVESTMENTS |
| at June 30, 2023 |
| | | Number of | | | | |
| REITS – 98.6% | | Shares | | | Value | |
| Diversified REITs – 8.6% | | | | | | |
| Activia Properties, Inc. | | | 265 | | | $ | 741,055 | |
| Alexander & Baldwin, Inc. | | | 27,917 | | | | 518,698 | |
| American Assets Trust, Inc. | | | 18,931 | | | | 363,475 | |
| Charter Hall Long Wale REIT | | | 236,944 | | | | 633,953 | |
| Cofinimmo SA | | | 11,189 | | | | 840,787 | |
| Covivio | | | 18,969 | | | | 896,097 | |
| Cromwell European REIT | | | 46,919 | | | | 79,869 | |
| Daiwa House REIT Investment Corp. | | | 834 | | | | 1,599,067 | |
| Dream Impact Trust (a) | | | 2,075 | | | | 14,222 | |
| Empire State Realty Trust, Inc. (c) | | | 52,847 | | | | 395,824 | |
| Gecina SA | | | 17,151 | | | | 1,829,648 | |
| Goodman Property Trust | | | 410,401 | | | | 559,136 | |
| GPT Group | | | 717,861 | | | | 1,986,389 | |
| Growthpoint Properties Ltd. | | | 1,251,926 | | | | 775,584 | |
| Growthpoint Properties Australia Ltd. | | | 99,262 | | | | 185,277 | |
| Hulic REIT, Inc. | | | 479 | | | | 535,329 | |
| ICADE | | | 12,591 | | | | 525,484 | |
| Land Securities Group PLC | | | 270,107 | | | | 1,974,991 | |
| Lar Espana Real Estate Socimi SA | | | 13,501 | | | | 80,599 | |
| Merlin Properties Socimi SA | | | 121,730 | | | | 1,042,663 | |
| Mirvac Group | | | 1,514,203 | | | | 2,286,602 | |
| Nomura Real Estate Master Fund, Inc. | | | 1,561 | | | | 1,800,432 | |
| Picton Property Income Ltd. | | | 117,544 | | | | 104,800 | |
| Premier Investment Corp. | | | 528 | | | | 494,332 | |
| Redefine Properties Ltd. | | | 2,372,542 | | | | 414,000 | |
| Schroder Real Estate Investment Trust Ltd. | | | 162,778 | | | | 83,396 | |
| Sekisui House REIT, Inc. | | | 1,570 | | | | 914,341 | |
| Stockland | | | 898,998 | | | | 2,416,767 | |
| Suntec Real Estate Investment Trust | | | 860,100 | | | | 822,107 | |
| Tritax EuroBox PLC | | | 256,649 | | | | 166,558 | |
| | | | | | | | 25,081,482 | |
| Health Care REITs – 9.1% | | | | | | | | |
| Aedifica SA | | | 14,429 | | | | 925,279 | |
| Healthpeak Properties, Inc. | | | 213,520 | | | | 4,291,752 | |
| Ventas, Inc. (c) | | | 153,484 | | | | 7,255,189 | |
The accompanying notes are an integral part of these financial statements.
| SCHEDULE OF INVESTMENTS (Continued) |
| at June 30, 2023 |
| | | Number of | | | | |
| REITS – 98.6% (Continued) | | Shares | | | Value | |
| Health Care REITs – 9.1% (Continued) | | | | | | |
| Welltower, Inc. (c) | | | 176,265 | | | $ | 14,258,076 | |
| | | | | | | | 26,730,296 | |
| Hotel & Resort REITs – 2.9% | | | | | | | | |
| CapitaLand Ascott Trust | | | 735,000 | | | | 589,070 | |
| DiamondRock Hospitality Co. (c) | | | 68,750 | | | | 550,687 | |
| Hersha Hospitality Trust | | | 11,491 | | | | 69,980 | |
| Hoshino Resorts REIT, Inc. | | | 87 | | | | 373,309 | |
| Host Hotels & Resorts, Inc. (c) | | | 273,075 | | | | 4,595,852 | |
| Japan Hotel REIT Investment Corp. | | | 1,706 | | | | 870,293 | |
| RLJ Lodging Trust (c) | | | 60,863 | | | | 625,063 | |
| Sunstone Hotel Investors, Inc. (c) | | | 72,746 | | | | 736,190 | |
| | | | | | | | 8,410,444 | |
| Industrial REITs – 16.8% | | | | | | | | |
| Advance Logistics Investment Corp. | | | 224 | | | | 208,619 | |
| Americold Realty Trust, Inc. (c) | | | 102,914 | | | | 3,324,122 | |
| Ascendas Real Estate Investment Trust | | | 1,307,300 | | | | 2,638,620 | |
| Dream Industrial Real Estate Investment Trust (a) | | | 49,419 | | | | 526,365 | |
| Frasers Logistics & Industrial Trust | | | 1,101,000 | | | | 1,019,467 | |
| GLP J-REIT | | | 1,754 | | | | 1,730,053 | |
| Goodman Group | | | 645,058 | | | | 8,671,433 | |
| Hannon Armstrong Sustainable Infrastructure Capital, Inc. (c) | | | 40,207 | | | | 1,005,175 | |
| Industrial & Infrastructure Fund Investment Corp. | | | 786 | | | | 827,444 | |
| Japan Logistics Fund, Inc. | | | 349 | | | | 757,475 | |
| LaSalle Logiport REIT | | | 686 | | | | 719,757 | |
| Mitsubishi Estate Logistics REIT Investment Corp. | | | 191 | | | | 547,833 | |
| Nippon Prologis REIT, Inc. | | | 836 | | | | 1,680,194 | |
| PLA Administradora Industrial S de RL de CV | | | 250,653 | | | | 478,257 | |
| Prologis Property Mexico SA de CV | | | 208,935 | | | | 773,390 | |
| Prologis, Inc. | | | 111,364 | | | | 13,656,567 | |
| Rexford Industrial Realty, Inc. (c) | | | 82,967 | | | | 4,332,537 | |
| Segro PLC | | | 464,722 | | | | 4,238,189 | |
| SOSiLA Logistics REIT, Inc. | | | 274 | | | | 248,823 | |
| STAG Industrial, Inc. (c) | | | 15,727 | | | | 564,285 | |
| Tritax Big Box REIT PLC | | | 710,717 | | | | 1,131,123 | |
| | | | | | | | 49,079,728 | |
The accompanying notes are an integral part of these financial statements.
| SCHEDULE OF INVESTMENTS (Continued) |
| at June 30, 2023 |
| | | Number of | | | | |
| REITS – 98.6% (Continued) | | Shares | | | Value | |
| Office REITs – 9.0% | | | | | | |
| Alexandria Real Estate Equities, Inc. (c) | | | 63,651 | | | $ | 7,223,752 | |
| Allied Properties Real Estate Investment Trust (a) | | | 26,600 | | | | 436,121 | |
| Boston Properties, Inc. (c) | | | 56,487 | | | | 3,253,086 | |
| Brandywine Realty Trust (c) | | | 83,217 | | | | 386,959 | |
| Cromwell Property Group | | | 489,498 | | | | 174,865 | |
| Derwent London PLC | | | 38,851 | | | | 1,011,300 | |
| Dexus | | | 419,727 | | | | 2,185,868 | |
| Dream Office Real Estate Investment Trust (a) | | | 3,240 | | | | 31,648 | |
| Franklin Street Properties Corp. | | | 18,517 | | | | 26,850 | |
| Global One Real Estate Investment Corp. | | | 373 | | | | 295,165 | |
| Great Portland Estates PLC | | | 82,914 | | | | 436,999 | |
| Hudson Pacific Properties, Inc. (c) | | | 47,530 | | | | 200,577 | |
| Inmobiliaria Colonial Socimi SA | | | 113,169 | | | | 686,182 | |
| Japan Excellent, Inc. | | | 447 | | | | 388,979 | |
| Japan Real Estate Investment Corp. | | | 483 | | | | 1,838,093 | |
| JBG SMITH Properties (c) | | | 37,715 | | | | 567,234 | |
| Kilroy Realty Corp. (c) | | | 41,133 | | | | 1,237,692 | |
| Manulife US Real Estate Investment Trust | | | 752,209 | | | | 130,592 | |
| Mori Trust Sogo REIT, Inc. | | | 103 | | | | 51,471 | |
| Nippon Building Fund, Inc. | | | 595 | | | | 2,339,648 | |
| NSI NV | | | 7,701 | | | | 171,849 | |
| Orix JREIT, Inc. | | | 990 | | | | 1,218,687 | |
| Precinct Properties New Zealand Ltd. | | | 550,848 | | | | 436,092 | |
| Societe de la Tour Eiffel | | | 402 | | | | 6,367 | |
| Vornado Realty Trust (c) | | | 67,406 | | | | 1,222,745 | |
| Workspace Group PLC | | | 52,043 | | | | 312,496 | |
| | | | | | | | 26,271,317 | |
| Residential REITs – 16.1% | | | | | | | | |
| Advance Residence Investment Corp. | | | 498 | | | | 1,189,263 | |
| AvalonBay Communities, Inc. (c) | | | 54,620 | | | | 10,337,927 | |
| Civitas Social Housing PLC | | | 167,400 | | | | 169,866 | |
| Comforia Residential REIT, Inc. | | | 248 | | | | 593,839 | |
| Dream Residential Real Estate Investment Trust (a) | | | 2,600 | | | | 20,800 | |
| Equity LifeStyle Properties, Inc. | | | 69,317 | | | | 4,636,614 | |
| Equity Residential | | | 138,684 | | | | 9,148,984 | |
The accompanying notes are an integral part of these financial statements.
| SCHEDULE OF INVESTMENTS (Continued) |
| at June 30, 2023 |
| | | Number of | | | | |
| REITS – 98.6% (Continued) | | Shares | | | Value | |
| Residential REITs – 16.1% (Continued) | | | | | | |
| Essex Property Trust, Inc. | | | 24,661 | | | $ | 5,778,072 | |
| Home REIT PLC (d) | | | 255,956 | | | | 30,914 | |
| Killam Apartment Real Estate Investment Trust (a) | | | 22,142 | | | | 295,171 | |
| Minto Apartment Real Estate Investment Trust (a) | | | 11,500 | | | | 130,387 | |
| Nippon Accommodations Fund, Inc. | | | 189 | | | | 851,824 | |
| Sun Communities, Inc. | | | 47,702 | | | | 6,223,203 | |
| UDR, Inc. (c) | | | 126,211 | | | | 5,422,025 | |
| UMH Properties, Inc. | | | 23,900 | | | | 381,922 | |
| UNITE Group PLC | | | 132,232 | | | | 1,464,785 | |
| Veris Residential, Inc. (a) | | | 27,498 | �� | | | 441,343 | |
| | | | | | | | 47,116,939 | |
| Retail REITs – 16.6% | | | | | | | | |
| Altarea SCA | | | 1,180 | | | | 131,052 | |
| British Land Company PLC | | | 331,770 | | | | 1,279,428 | |
| Capital & Counties Properties PLC | | | 513,319 | | | | 750,357 | |
| CapitaLand Mall Trust | | | 2,006,712 | | | | 2,843,789 | |
| Carmila SA | | | 22,262 | | | | 346,259 | |
| Charter Hall Retail REIT | | | 212,034 | | | | 511,503 | |
| Choice Properties Real Estate Investment Trust (a) | | | 64,234 | | | | 657,977 | |
| Eurocommercial Properties NV | | | 13,058 | | | | 303,305 | |
| Federal Realty OP LP (c) | | | 29,273 | | | | 2,832,748 | |
| First Capital Real Estate Investment Trust (a) | | | 35,225 | | | | 388,745 | |
| Frasers Centrepoint Trust | | | 404,700 | | | | 657,096 | |
| Hammerson PLC | | | 1,434,216 | | | | 453,543 | |
| Immobiliare Grande Distribuzione SpA | | | 20,822 | | | | 55,012 | |
| Japan Retail Fund Investment Corp. | | | 2,701 | | | | 1,807,197 | |
| Kimco Realty Corp. (c) | | | 242,891 | | | | 4,789,810 | |
| Kiwi Property Group Ltd. | | | 475,872 | | | | 266,636 | |
| Klepierre SA | | | 77,329 | | | | 1,921,180 | |
| Lendlease Global Commercial REIT | | | 730,426 | | | | 357,197 | |
| Macerich Co. (c) | | | 84,542 | | | | 952,788 | |
| Mercialys SA | | | 32,217 | | | | 291,143 | |
| Regency Centers Corp. | | | 61,403 | | | | 3,792,863 | |
| RioCan Real Estate Investment Trust | | | 56,613 | | | | 823,928 | |
| Scentre Group | | | 2,009,765 | | | | 3,554,304 | |
The accompanying notes are an integral part of these financial statements.
| SCHEDULE OF INVESTMENTS (Continued) |
| at June 30, 2023 |
| | | Number of | | | | |
| REITS – 98.6% (Continued) | | Shares | | | Value | |
| Retail REITs – 16.6% (Continued) | | | | | | |
| Simon Property Group, Inc. | | | 123,097 | | | $ | 14,215,241 | |
| Unibail-Rodamco-Westfield | | | 43,822 | | | | 2,311,367 | |
| Vastned Belgium NV | | | 37 | | | | 1,102 | |
| Vastned Retail NV | | | 3,437 | | | | 73,244 | |
| Vicinity Centres | | | 1,477,804 | | | | 1,819,949 | |
| Wereldhave Belgium Comm VA | | | 447 | | | | 22,644 | |
| Wereldhave NV | | | 10,144 | | | | 155,034 | |
| | | | | | | | 48,366,441 | |
| Specialized REITs – 19.5% | | | | | | | | |
| American Tower Corp. | | | 71,468 | | | | 13,860,504 | |
| Big Yellow Group PLC | | | 67,086 | | | | 915,445 | |
| Charter Hall Social Infrastructure REIT | | | 125,189 | | | | 245,961 | |
| Digital Realty Trust, Inc. (c) | | | 113,850 | | | | 12,964,099 | |
| Equinix, Inc. | | | 18,547 | | | | 14,539,735 | |
| Extra Space Storage, Inc. (c) | | | 53,293 | | | | 7,932,663 | |
| Iron Mountain, Inc. (c) | | | 112,497 | | | | 6,392,080 | |
| | | | | | | | 56,850,487 | |
| TOTAL REITS | | | | | | | | |
| (Cost $302,961,584) | | | | | | | 287,907,134 | |
| | | | | | | | | |
| RIGHTS – 0.00% (e) | | | | | | | | |
| Aedifica SA | | | | | | | | |
| Expiration: July, 2023, Exercise Price: $52.000 (a) | | | 14,429 | | | | 6,613 | |
| TOTAL RIGHTS | | | | | | | | |
| (Cost $33,289) | | | | | | | 6,613 | |
The accompanying notes are an integral part of these financial statements.
| SCHEDULE OF INVESTMENTS (Continued) |
| at June 30, 2023 |
| | | Number of | | | | |
| SHORT-TERM INVESTMENTS – 0.5% | | Shares | | | Value | |
| MONEY MARKET FUND – 0.5% | | | | | | |
| STIT – Government & Agency Portfolio 5.08% (b) | | | 1,377,761 | | | $ | 1,377,761 | |
| TOTAL SHORT-TERM INVESTMENTS | | | | | | | | |
| (Cost $1,377,761) | | | | | | | 1,377,761 | |
| | | | | | | | | |
| INVESTMENTS PURCHASED WITH | | | | | | | | |
| PROCEEDS FROM SECURITIES LENDING – 21.1% | | | | | | | | |
| Mount Vernon Liquid Assets Portfolio, 5.22% (b) | | | 61,522,834 | | | | 61,522,834 | |
| TOTAL INVESTMENTS PURCHASED WITH | | | | | | | | |
| PROCEEDS FROM SECURITIES LENDING | | | | | | | | |
| (Cost $61,522,834) | | | | | | | 61,522,834 | |
| TOTAL INVESTMENTS | | | | | | | | |
| (Cost $365,895,468) – 120.2% | | | | | | | 350,814,342 | |
| Liabilities in excess of Other Assets – (20.2)% | | | | | | | (58,965,526 | ) |
| TOTAL NET ASSETS – 100.00% | | | | | | $ | 291,848,816 | |
Percentages are stated as a percent of net assets.
PLC – Public Limited Company
REIT – Real Estate Investment Trust
NA – Naamloze Vennootschap
SA – Societe Anonyme
CA – Capital Variable
| (a) | Non-income producing security. |
| (b) | The rate shown represents the fund’s 7-day yield as of June 30, 2023. |
| (c) | This security or a portion of this security was out on loan at June 30, 2023. As of June 30, 2023, the total value of loaned securities was $60,467,078 or 20.7% of net assets. The remaining contractual maturity of all the securities lending transactions, is overnight and continuous. |
| (d) | Fair value determined using significant unobservable inputs in accordance with procedures established by and under the supervision of the Adviser, acting through its Valuation Committee. As of June 30, 2023, the total value of was $30,914 or 0.01% of net assets. |
| (e) | Rounds to zero. |
The Global Industry Classification Standard (GICS®) was developed by and/or is the exclusive property of MSCI, Inc. and Standard & Poor’s Financial Services LLC (“S&P”). GICS is a service mark of MSCI and S&P and has been licensed for use by U.S. Bank Global Fund Services.
The accompanying notes are an integral part of these financial statements.
| STATEMENT OF ASSETS AND LIABILITIES |
| at June 30, 2023 |
| Assets: | | | |
| Investments, at value* (cost of $365,895,468) | | $ | 350,814,342 | |
| Foreign currencies, at value (cost $155,232) | | | 155,808 | |
| Receivables: | | | | |
| Fund shares sold | | | 2,171,599 | |
| Dividends and interest | | | 1,477,192 | |
| Return of Capital | | | 5,666 | |
| Securities Lending Receivable | | | 4,317 | |
| Prepaid expenses | | | 17,105 | |
| Total assets | | | 354,646,029 | |
| | | | | |
| Liabilities: | | | | |
| Payables: | | | | |
| Payable upon return of securities loaned | | | 61,522,834 | |
| Securities purchased | | | 993,227 | |
| Fund shares redeemed | | | 127,883 | |
| Advisory fee | | | 56,871 | |
| Administration and fund accounting fees | | | 32,403 | |
| Reports to shareholders | | | 5,497 | |
| Compliance fees | | | 2,092 | |
| Custody fees | | | 12,948 | |
| Transfer agent fees and expenses | | | 11,649 | |
| Other accrued expenses | | | 31,809 | |
| Total liabilities | | | 62,797,213 | |
| | | | | |
| Net assets | | $ | 291,848,816 | |
| | | | | |
| Net assets consist of: | | | | |
| Paid in capital | | $ | 308,259,621 | |
| Total accumulated deficit | | | (16,410,805 | ) |
| Net assets | | $ | 291,848,816 | |
| | | | | |
| Institutional Shares: | | | | |
| Net assets applicable to outstanding Institutional Shares | | $ | 291,848,816 | |
| Shares issued (Unlimited number of beneficial | | | | |
| interest authorized, $0.01 par value) | | | 32,028,329 | |
| Net asset value, offering price and redemption price per share | | $ | 9.11 | |
| | | | | |
| * Value of securities on loan | | $ | 60,467,078 | |
The accompanying notes are an integral part of these financial statements.
| STATEMENT OF OPERATIONS |
| For the Year Ended June 30, 2023 |
| Investment income: | | | |
| Dividends (net of foreign taxes withheld of $422,391) | | $ | 7,518,407 | |
| Interest | | | 64,339 | |
| Securities Lending | | | 15,067 | |
| Total investment income | | | 7,597,813 | |
| | | | | |
| Expenses: | | | | |
| Investment advisory fees (Note 4) | | | 814,347 | |
| Administration and fund accounting fees (Note 4) | | | 169,148 | |
| Transfer agent fees and expenses | | | 65,890 | |
| Custody fees | | | 64,083 | |
| Federal and state registration fees | | | 45,506 | |
| Legal fees | | | 30,959 | |
| Trustees’ fees and expenses | | | 16,633 | |
| Compliance expense | | | 14,147 | |
| Audit fees | | | 14,974 | |
| Reports to shareholders | | | 9,741 | |
| Other | | | 17,991 | |
| Total expenses before reimbursement from advisor | | | 1,263,419 | |
| Expense reimbursement from advisor (Note 4) | | | (243,414 | ) |
| Net expenses | | | 1,020,005 | |
| Net investment income | | | 6,577,808 | |
| | | | | |
| Realized and unrealized gain (loss) on investments: | | | | |
| Net realized gain (loss) on transactions from: | | | | |
| Investments | | | (6,227,249 | ) |
| Foreign currency related transactions | | | (47,728 | ) |
| Long-term capital gain distributions from | | | | |
| real estate investment trusts | | | 581 | |
| Net change in unrealized gain (loss) on: | | | | |
| Investments | | | (5,041,142 | ) |
| Foreign currency related translations | | | 2,693 | |
| Net realized and unrealized loss on investments | | | (11,312,845 | ) |
| Net decrease in net assets resulting from operations | | $ | (4,735,037 | ) |
The accompanying notes are an integral part of these financial statements.
| STATEMENTS OF CHANGES IN NET ASSETS |
| |
| | | Year Ended | | | Year Ended | |
| | | June 30, 2023 | | | June 30, 2022 | |
| Operations: | | | | | | |
| Net investment income | | $ | 6,577,808 | | | $ | 2,879,710 | |
| Net realized gain (loss) on investments | | | (6,274,396 | ) | | | 2,644,955 | |
| Net change in unrealized | | | | | | | | |
| depreciation on investments | | | (5,038,449 | ) | | | (29,566,300 | ) |
| Net decrease in net assets | | | | | | | | |
| resulting from operations | | | (4,735,037 | ) | | | (24,041,635 | ) |
| | | | | | | | | |
| Distributions: | | | | | | | | |
| Institutional class shares | | | (2,751,991 | ) | | | (5,921,436 | ) |
| Total distributions | | | (2,751,991 | ) | | | (5,921,436 | ) |
| | | | | | | | | |
| Capital Share Transactions: | | | | | | | | |
| Proceeds from shares sold | | | | | | | | |
| Institutional shares | | | 179,294,885 | | | | 86,306,124 | |
| Proceeds from shares issued to holders | | | | | | | | |
| in reinvestment of dividends | | | | | | | | |
| Institutional shares | | | 2,714,419 | | | | 5,915,514 | |
| Cost of shares redeemed | | | | | | | | |
| Institutional shares | | | (42,029,899 | ) | | | (28,825,021 | ) |
| Net increase in net assets from | | | | | | | | |
| capital share transactions | | | 139,979,405 | | | | 63,396,617 | |
| Total increase in net assets | | | 132,492,377 | | | | 33,433,546 | |
| Net Assets: | | | | | | | | |
| Beginning of year | | | 159,356,439 | | | | 125,922,893 | |
| End of year | | $ | 291,848,816 | | | $ | 159,356,439 | |
| Changes in Shares Outstanding: | | | | | | | | |
| Shares sold | | | | | | | | |
| Institutional shares | | | 19,806,638 | | | | 7,551,339 | |
| Proceeds from shares issued to holders | | | | | | | | |
| in reinvestment of dividends | | | | | | | | |
| Institutional shares | | | 292,187 | | | | 505,168 | |
| Shares redeemed | | | | | | | | |
| Institutional shares | | | (4,634,699 | ) | | | (2,543,307 | ) |
| Net increase in shares outstanding | | | 15,464,126 | | | | 5,513,200 | |
The accompanying notes are an integral part of these financial statements.
For a capital share outstanding throughout each year
Institutional Shares
| | | Year | | | Year | | | Year | | | Year | | | Year | |
| | | Ended | | | Ended | | | Ended | | | Ended | | | Ended | |
| | | June 30, | | | June 30, | | | June 30, | | | June 30, | | | June 30, | |
| | | 2023 | | | 2022 | | | 2021 | | | 2020 | | | 2019 | |
| Net Asset Value – | | | | | | | | | | | | | | | |
| Beginning of Year | | $ | 9.62 | | | $ | 11.39 | | | $ | 8.59 | | | $ | 10.45 | | | $ | 10.13 | |
| | | | | | | | | | | | | | | | | | | | | |
| Income from | | | | | | | | | | | | | | | | | | | | |
| Investment Operations: | | | | | | | | | | | | | | | | | | | | |
Net investment income1 | | | 0.30 | | | | 0.21 | | | | 0.19 | | | | 0.32 | | | | 0.28 | |
| Net realized and unrealized | | | | | | | | | | | | | | | | | | | | |
| gain (loss) on investments | | | (0.67 | ) | | | (1.55 | ) | | | 2.76 | | | | (1.84 | ) | | | 0.38 | |
| Total from investment operations | | | (0.37 | ) | | | (1.34 | ) | | | 2.95 | | | | (1.52 | ) | | | 0.66 | |
| | | | | | | | | | | | | | | | | | | | | |
| Less Distributions: | | | | | | | | | | | | | | | | | | | | |
| Dividends from net | | | | | | | | | | | | | | | | | | | | |
| investment income | | | (0.04 | ) | | | (0.26 | ) | | | (0.15 | ) | | | (0.34 | ) | | | (0.33 | ) |
| Distributions from net realized gains | | | (0.10 | ) | | | (0.17 | ) | | | — | | | | — | | | | (0.01 | ) |
| Total distributions | | | (0.14 | ) | | | (0.43 | ) | | | (0.15 | ) | | | (0.34 | ) | | | (0.34 | ) |
| | | | | | | | | | | | | | | | | | | | | |
| Net Asset Value – End of Year | | $ | 9.11 | | | $ | 9.62 | | | $ | 11.39 | | | $ | 8.59 | | | $ | 10.45 | |
| | | | | | | | | | | | | | | | | | | | | |
| Total Return | | | (3.84 | )% | | | (12.41 | )% | | | 34.72 | % | | | (15.14 | )% | | | 6.64 | % |
| | | | | | | | | | | | | | | | | | | | | |
| Ratios and Supplemental Data: | | | | | | | | | | | | | | | | | | | | |
| Net assets, end of year (thousands) | | $ | 291,849 | | | $ | 159,356 | | | $ | 125,923 | | | $ | 50,637 | | | $ | 24,184 | |
| Ratio of operating expenses | | | | | | | | | | | | | | | | | | | | |
| to average net assets: | | | | | | | | | | | | | | | | | | | | |
| Before reimbursements | | | 0.62 | % | | | 0.67 | % | | | 0.80 | % | | | 1.12 | % | | | 1.92 | % |
| After reimbursements | | | 0.50 | % | | | 0.50 | % | | | 0.50 | % | | | 0.50 | % | | | 0.50 | % |
| Ratio of net investment income | | | | | | | | | | | | | | | | | | | | |
| to average net assets: | | | | | | | | | | | | | | | | | | | | |
| Before reimbursements | | | 3.11 | % | | | 1.64 | % | | | 1.66 | % | | | 2.64 | % | | | 1.36 | % |
| After reimbursements | | | 3.23 | % | | | 1.80 | % | | | 1.96 | % | | | 3.26 | % | | | 2.78 | % |
| Portfolio turnover rate | | | 9 | % | | | 11 | % | | | 19 | % | | | 18 | % | | | 10 | % |
1 | The net investment income per share was calculated using the average shares outstanding method. |
The accompanying notes are an integral part of these financial statements.
| NOTES TO FINANCIAL STATEMENTS |
| at June 30, 2023 |
NOTE 1 – ORGANIZATION
The Vert Global Sustainable Real Estate Fund (the “Fund”) is a series of Manager Directed Portfolios (the “Trust”). The Trust is registered under the Investment Company Act of 1940, as amended (the “1940 Act”), and was organized as a Delaware statutory trust on April 4, 2006. The Fund is an open-end investment management company and is a diversified series of the Trust. The Fund commenced operations on October 31, 2017 and currently only offers Institutional Shares. Vert Asset Management, LLC (the “Advisor”) serves as the investment advisor to the Fund. Dimensional Fund Advisors LP (the “Sub-Advisor”) serves as the sub-advisor to the Fund. The investment objective of the Fund is to seek long term capital appreciation.
NOTE 2 – SIGNIFICANT ACCOUNTING POLICIES
The following is a summary of significant accounting policies consistently followed by the Fund. These policies are in conformity with U.S. generally accepted accounting principles (“GAAP”). The Fund is an investment company and accordingly follows the investment company accounting and reporting guidance of the Financial Accounting Standards Board (“FASB”) Accounting Standard Codification Topic 946 “Financial Services – Investment Companies” including FASB Accounting Standard Update ASU 2013-08.
| | A. | Security Valuation: All investments in securities are recorded at their estimated fair value, as described in Note 3. |
| | | |
| | B. | Federal Income Taxes: It is the Fund’s policy to comply with the requirements of Subchapter M of the Internal Revenue Code applicable to regulated investment companies and to distribute substantially all of its taxable income to its shareholders. Therefore, no federal income or excise tax provisions are required. |
| | | |
| | | The Fund recognizes the tax benefits of uncertain tax positions only where the position is “more likely than not” to be sustained assuming examination by tax authorities. Management has analyzed the Fund’s tax positions, and has concluded that no liability for unrecognized tax benefits should be recorded related to uncertain tax positions to be taken or expected to be taken on a tax return. The tax returns for the Fund for the prior three fiscal years are open for examination. The Fund identifies its major tax jurisdictions as U.S. Federal and the state of Delaware. The Funds recognize interest and penalties, if any, related to unrecognized tax benefits as income tax expense on the Statements of Operations. Management of the Funds are required to determine whether a tax position taken by the Funds is more likely than not to be sustained upon examination by the applicable taxing authority. Based on its analysis, Management has concluded that the Funds do not have any unrecognized tax benefits or uncertain tax positions that would require a provision for income tax. Accordingly, the Funds did not incur any interest or penalties for the period ended June 30, 2023. |
| NOTES TO FINANCIAL STATEMENTS (Continued) |
| at June 30, 2023 |
| | C. | Securities Transactions, Income and Distributions: Securities transactions are accounted for on the trade date. Realized gains and losses on securities sold are determined on the basis of identified cost. Interest income is recorded on an accrual basis. Dividend income and distributions to shareholders are recorded on the ex-dividend date. The fund invests in real estate investment trusts (REITs) which report information on the source of their distributions annually. The fund’s policy is to record all REIT distributions initially as dividend income on the ex-dividend date and then re-designate them as return of capital and/or capital gain distributions at the end of the reporting period based on information provided annually by each REIT, and management estimates such re-designations when actual information has not yet been reported. Income on REITs may be reclassified to realized gains or as an adjustment to cost in order to correctly recognize the true character of the distributions received by the Fund. Withholding taxes on foreign dividends have been provided for in accordance with the Fund’s understanding of the applicable country’s tax rules and rates. |
| | | |
| | | The Fund distributes substantially all of its net investment income, if any, quarterly, and net realized capital gains, if any, annually. Distributions from net realized gains for book purposes may include short-term capital gains. All short-term capital gains are included in ordinary income for tax purposes. The amount of dividends and distributions to shareholders from net investment income and net realized capital gains is determined in accordance with federal income tax regulations, which may differ from GAAP. To the extent these book/tax differences are permanent, such amounts are reclassified within the capital accounts based on their federal tax treatment. |
| | | |
| | | The Fund is charged for those expenses that are directly attributable to it, such as investment advisory, custody and transfer agent fees. Expenses that are not attributable to a Fund are typically allocated among the funds in the Trust proportionately based on allocation methods approved by the Board of Trustees (the “Board”). Common expenses of the Trust are typically allocated among the funds in the Trust based on a fund’s respective net assets, or by other equitable means. |
| | | |
| | D. | Use of Estimates: The preparation of financial statements in conformity with GAAP requires management to make estimates and assumptions that affect the reported amounts of assets and liabilities at the date of the financial statements and the reported amounts of increases and decreases in net assets during the reporting period. Actual results could differ from those estimates. |
| | | |
| | E. | Reclassification of Capital Accounts: GAAP requires that certain components of net assets relating to permanent differences be reclassified between financial and tax reporting. These reclassifications have no effect on net assets or net asset value per share. |
| | | |
| | F. | Foreign Currency: Values of investments denominated in foreign currencies are converted into U.S. dollars using the spot market rate of exchange at the time of |
| NOTES TO FINANCIAL STATEMENTS (Continued) |
| at June 30, 2023 |
| | | valuation. Purchases and sales of investments and income are translated into U.S. dollars using the spot market rate of exchange prevailing on the respective dates of such transactions. The Fund does not isolate the portion of the results of operations resulting from fluctuations in foreign exchange rates on investments from fluctuations resulting from changes in the market prices of securities held. Such fluctuations are included with the net realized and unrealized gain/loss on investments. Foreign investments present additional risks due to currency fluctuations, economic and political factors, lower liquidity, government regulations, differences in accounting standards, and other factors. |
| | | |
| | G. | Events Subsequent to the Fiscal Period End: In preparing the financial statements as of June 30, 2023, management considered the impact of subsequent events for potential recognition or disclosure in the financial statements and has concluded that no additional disclosures are necessary. |
NOTE 3 – SECURITIES VALUATION
The Fund has adopted authoritative fair value accounting standards which establish an authoritative definition of fair value and set out a hierarchy for measuring fair value. These standards require additional disclosures about the various inputs and valuation techniques used to develop the measurements of fair value, a discussion of changes in valuation techniques and related inputs during the fiscal period, and expanded disclosure of valuation levels for major security types. These inputs are summarized in the three broad levels listed below:
| | Level 1 – | Unadjusted, quoted prices in active markets for identical assets or liabilities that the Fund has the ability to access at the date of measurement. |
| | | |
| | Level 2 – | Other significant observable inputs (including, but not limited to, quoted prices in active markets for similar instruments, quoted prices in markets that are not active for identical or similar instruments, and model-derived valuations in which all significant inputs and significant value drivers are observable in active markets, such as interest rates, prepayment speeds, credit risk curves, default rates, and similar data). |
| | | |
| | Level 3 – | Significant unobservable inputs for the asset or liability, to the extent relevant observable inputs are not available, representing the Fund’s own assumptions about the assumptions a market participant would use in valuing the asset or liability, and would be based on the best information available. |
Following is a description of the valuation techniques applied to the Fund’s major categories of assets and liabilities measured at fair value on a recurring basis.
Equity Securities: Equity securities, including common stocks, preferred stocks, foreign-issued common stocks, exchange-traded funds, closed-end mutual funds and real estate investment trusts (REITs), that are primarily traded on a national securities exchange shall be valued at the last sale price on the exchange on which they are primarily traded on the day of valuation or, if there has been no sale on such day, at the mean
| NOTES TO FINANCIAL STATEMENTS (Continued) |
| at June 30, 2023 |
between the bid and asked prices. Securities primarily traded in the NASDAQ Global Market System for which market quotations are readily available shall be valued using the NASDAQ Official Closing Price (“NOCP”). If the NOCP is not available, such securities shall be valued at the last sale price on the day of valuation, or if there has been no sale on such day, at the mean between the bid and asked prices. Over-the-counter securities that are not traded on a listed exchange are valued at the last sale price in the over-the-counter market. Over-the-counter securities which are not traded in the NASDAQ Global Market System shall be valued at the mean between the bid and asked prices. To the extent these securities are actively traded and valuation adjustments are not applied, they are categorized in Level 1 of the fair value hierarchy. Securities traded on foreign exchanges generally are not valued at the same time the Fund calculates its net asset value (“NAV”) because most foreign markets close well before such time. The earlier close of most foreign markets gives rise to the possibility that significant events, including broad market moves, may have occurred in the interim. In certain circumstances, it may be determined that a security needs to be fair valued because it appears that the value of the security might have been materially affected by an event (a “Significant Event”) occurring after the close of the market in which the security is principally traded, but before the time the Fund calculates its NAV. A Significant Event may relate to a single issuer or to an entire market sector, or even occurrences not tied directly to the securities markets, such as natural disasters, armed conflicts, or significant government actions.
Registered Investment Companies: Investments in registered investment companies (e.g., mutual funds) are generally priced at the ending NAV provided by the applicable registered investment company’s service agent and will be classified in Level 1 of the fair value hierarchy.
Short-Term Debt Securities: Debt securities, including short-term debt instruments having a maturity of less than 60 days, are valued at the evaluated mean price supplied by an approved pricing service. Pricing services may use various valuation methodologies including matrix pricing and other analytical pricing models as well as market transactions and dealer quotations. In the absence of prices from a pricing service, the securities will be priced in accordance with the procedures adopted by the Board. Short-term securities are generally classified in Level 1 or Level 2 of the fair market hierarchy depending on the inputs used and market activity levels for specific securities.
In the absence of prices from a pricing service or in the event that market quotations are not readily available, fair value will be determined under the Fund’s valuation procedures adopted pursuant to Rule 2a-5. Pursuant to those procedures, the Board has appointed the Advisor as the Fund’s valuation designee (the “Valuation Designee”) to perform all fair valuations of the Fund’s portfolio investments, subject to the Board’s oversight. As the Valuation Designee, the Advisor has established procedures for its fair valuation of the Fund’s portfolio investments. These procedures address, among other things, determining when market quotations are not readily available or reliable and the methodologies to be used for determining the fair value of investments, as well as the use and oversight of third-party pricing services for fair valuation.
| NOTES TO FINANCIAL STATEMENTS (Continued) |
| at June 30, 2023 |
Depending on the relative significance of the valuation inputs, fair valued securities may be classified in either Level 2 or Level 3 of the fair value hierarchy.
The fair valuation of foreign securities may be determined with the assistance of a pricing service using correlations between the movement of prices of such securities and indices of domestic securities and other appropriate indicators, such as closing market prices of relevant American Depositary Receipts or futures contracts. The Fund uses ICE Data Services (“ICE”) as a third party fair valuation vendor. ICE provides a fair value for foreign securities in the Fund based on certain factors and methodologies applied by ICE in the event that there is a movement in the U.S. markets that exceeds a specific threshold established by the Valuation Committee. The effect of using fair value pricing is that the Fund’s NAV will reflect the affected portfolio securities’ values as determined by the Board or its designee instead of being determined by the market. Using a fair value pricing methodology to price a foreign security may result in a value that is different from the foreign security’s most recent closing price and from the prices used by other investment companies to calculate their NAVs and are generally classified in Level 2 of the fair valuation hierarchy. Because the Fund may invest in foreign securities, the value of the Fund’s portfolio securities may change on days when you will not be able to purchase or redeem your shares.
The inputs or methodology used for valuing securities are not an indication of the risk associated with investing in those securities. The following is a summary of the fair valuation hierarchy of the Fund’s securities as of June 30, 2023:
| | | Level 1 | | | Level 2 | | | Level 3 | | | Total | |
| REITs | | | | | | | | | | | | |
| Diversified REITs | | $ | 2,873,366 | | | $ | 22,208,116 | | | $ | — | | | $ | 25,081,482 | |
| Health Care REITs | | | 25,805,017 | | | | 925,279 | | | | — | | | | 26,730,296 | |
| Hotel & Resort REITs | | | 6,577,772 | | | | 1,832,672 | | | | — | | | | 8,410,444 | |
| Industrial REITs | | | 24,660,698 | | | | 24,419,030 | | | | — | | | | 49,079,728 | |
| Office REITs | | | 15,944,100 | | | | 10,327,217 | | | | — | | | | 26,271,317 | |
| Residential REITs | | | 42,986,314 | | | | 4,099,711 | | | | 30,914 | | | | 47,116,939 | |
| Retail REITs | | | 29,659,102 | | | | 18,707,339 | | | | — | | | | 48,366,441 | |
| Specialized REITs | | | 55,689,081 | | | | 1,161,406 | | | | — | | | | 56,850,487 | |
| Total REITs | | | 204,195,450 | | | | 83,680,770 | | | | 30,914 | | | | 287,907,134 | |
| Rights | | | — | | | | 6,613 | | | | — | | | | 6,613 | |
| Short-Term Investments | | | 1,377,761 | | | | — | | | | — | | | | 1,377,761 | |
| Investments Purchased | | | | | | | | | | | | | | | | |
| with Proceeds from | | | | | | | | | | | | | | | | |
| Securities Lending* | | | — | | | | — | | | | — | | | | 61,522,834 | * |
| Total Investments | | | | | | | | | | | | | | | | |
| in Securities | | $ | 205,573,211 | | | $ | 83,687,383 | | | $ | 30,914 | | | $ | 350,814,342 | |
| * | Investment valued using the NAV per share practical expedient. In accordance with Topic 820, the investment is excluded from the fair value hierarchy. The investment is included in the total column for the purpose of reconciling the table to the schedule of investments. |
| NOTES TO FINANCIAL STATEMENTS (Continued) |
| at June 30, 2023 |
Level 3 Reconciliation Disclosure
The following is a reconciliation of Level 3 assets for which significant unobservable inputs were used to determine fair value.
| | | | Investments | | |
| | July 1, 2022 Market Value | | $ | — | | |
| | Purchases | | | 144,742 | | |
| | Sales proceeds and/or rights exercised) | | | — | | |
| | Accrued discounts/premiums net | | | — | | |
| | Change in unrealized appreciation/(depreciation) | | | (264,276 | ) | |
| | Transfer in and/or (out) of Level 3 | | | 150,448 | | |
| | Balance as of June 30, 2023 | | $ | 30,914 | | |
As of June 30, 2023, the change in unrealized depreciation on positions still held in the fund was $(264,276) for Home REIT PLC.
Significant Unobservable Inputs
The following table summarizes the significant unobservable inputs used to value the level 3 investments as of June 30, 2023.
The table is not intended to be all-inclusive but instead identifies the significant unobservable inputs relevant to the determination of fair values.
| | | Primary | | |
| Asset | Fair | Valuation | Unobservable | Weighted |
Category | Value | Technique | Inputs | Average(a) |
| REIT | $30,914 | Discount to last | Discount | 75% |
| | | quoted price | | |
(a) Weighted Averages are calculated based on Fair Value of investments.
NOTE 4 – INVESTMENT ADVISORY FEE AND OTHER TRANSACTIONS WITH AFFILIATES
For the fiscal year ended June 30, 2023, the Advisor provided the Fund with investment management services under an Investment Advisory Agreement. The Advisor furnishes all investment advice, office space, and facilities, and provides most of the personnel needed by the Fund. As compensation for its services, the Advisor is entitled to a monthly fee at an annual rate of 0.40% of the average daily net assets of the Fund. For the fiscal year ended June 30, 2023, the Fund incurred $814,347 in advisory fees. The Advisor has hired Dimensional Fund Advisors LP as a sub-advisor to the Fund. The Advisor pays the Sub-Advisor fee for the Fund from its own assets and these fees are not an additional expense of the Fund.
The Fund is responsible for its own operating expenses. The Advisor has contractually agreed to waive its fees and/or absorb expenses of the Fund to ensure that the net annual operating expenses [excluding Rule 12b-1 plan fees, shareholder servicing plan fees, any
| NOTES TO FINANCIAL STATEMENTS (Continued) |
| at June 30, 2023 |
front-end or contingent deferred loads, acquired fund fees and expenses, taxes, leverage, brokerage commissions, interest and extraordinary expenses (collectively, “Excludable Expenses”)] do not exceed the following amount of the average daily net assets for the Institutional Shares:
| | Institutional Shares | 0.50% | |
For the fiscal year ended June 30, 2023, the Advisor reduced its fees and absorbed Fund expenses in the amount of $243,414 for the Fund. The waivers and reimbursements will remain in effect through at least October 31, 2025, unless terminated sooner by, or with the consent of, the Board.
The Advisor may request recoupment of previously waived fees and paid expenses in any subsequent month in the three-year period from the date of the management fee reduction and expense payment if the aggregate amount actually paid by the Fund toward the operating expenses for such fiscal year (taking into account the reimbursement) will not cause the Fund to exceed the lesser of: (1) the expense limitation in place at the time of the management fee reduction and expense payment; or (2) the expense limitation in place at the time of the reimbursement. Any such reimbursement is also contingent upon Board of Trustees review and approval at the time the reimbursement is made. Such reimbursement may not be paid prior to the Fund’s payment of current ordinary operating expenses. Cumulative expenses subject to recapture pursuant to the aforementioned conditions expire as follows:
| | 6/30/2024 | 6/30/2025 | 6/30/2026 | Total | |
| | $264,650 | $266,114 | $243,414 | $774,178 | |
U.S. Bancorp Fund Services, LLC, doing business as U.S. Bank Global Fund Services, LLC (“Fund Services” or the “Administrator”) acts as the Fund’s Administrator under an Administration Agreement. The Administrator prepares various federal and state regulatory filings, reports and returns for the Fund; prepares reports and materials to be supplied to the Trustees; monitors the activities of the Fund’s custodian, transfer agent and accountants; coordinates the preparation and payment of the Fund’s expenses and reviews the Fund’s expense accruals. Fund Services also serves as the fund accountant, transfer agent to the Fund and Chief Compliance Officer to the Fund. U.S. Bank N.A., an affiliate of Fund Services, serves as the Fund’s custodian.
For the Fiscal year ended June 30, 2023, the Fund incurred the following expenses for administration, fund accounting, transfer agency and custody fees:
| Administration & fund accounting | $169,148 |
| Custody | $ 64,083 |
| Transfer agency | $ 65,890 |
| Compliance | $ 14,147 |
| NOTES TO FINANCIAL STATEMENTS (Continued) |
| at June 30, 2023 |
At June 30, 2023, the Fund had payables due to Fund Services for administration, fund accounting and transfer agency fees and to U.S. Bank N.A. for custody fees in the following amounts:
| Administration & fund accounting | $32,403 |
| Custody | $12,948 |
| Transfer agency | $11,649 |
| Compliance | $ 2,092 |
Quasar Distributors, LLC (the “Distributor”) acts as the Fund’s principal underwriter in a continuous public offering of the Fund’s shares.
Certain officers of the Fund are employees of the Administrator and are not paid any fees by the Fund for serving in such capacities.
NOTE 5 – SECURITIES TRANSACTIONS
For the fiscal year ended June 30, 2023, the cost of purchases and the proceeds from sales of securities, excluding short-term securities, were as follows:
| | Purchases | Sales | |
| | $160,001,900 | $17,919,998 | |
There were no purchases or sales of long-term U.S. Government securities.
NOTE 6 – INCOME TAXES AND DISTRIBUTIONS TO SHAREHOLDERS
As of June 30, 2023, the Fund’s most recent fiscal year end, the components of accumulated earnings/(losses) on a tax basis were as follows:
| | Cost of investments(a) | | $ | 367,448,676 | |
| | Gross unrealized appreciation | | | 17,997,033 | |
| | Gross unrealized depreciation | | | (34,631,367 | ) |
| | Net unrealized depreciation | | | (16,634,334 | ) |
| | Undistributed ordinary income | | | 6,155,113 | |
| | Undistributed long-term capital gain | | | — | |
| | Total distributable earnings | | | 6,155,113 | |
| | Other accumulated gains/(losses) | | | (5,931,584 | ) |
| | Total accumulated deficit | | $ | (16,410,805 | ) |
| | (a) | The difference between the book basis and tax basis net unrealized appreciation and cost is attributable primarily to wash sales and passive foreign investment companies. |
As of June 30, 2023, the Fund had long term capital losses in the amount of $3,797,883 and short term capital losses in the amount of $2,128,134 to offset future capital gains.
| NOTES TO FINANCIAL STATEMENTS (Continued) |
| at June 30, 2023 |
For the fiscal year ended June 30, 2023, the effect of permanent “book/tax” reclassifications resulted in increases and decreases to components of the Fund’s net assets as follows:
| | | Total Accumulated | Paid in |
| | | Deficit | Capital |
| | Vert Global Sustainable Real Estate Fund | $(411,963) | $411,963 |
The tax character of distributions paid during the fiscal year ended June 30, 2023, and the fiscal year ended June 30, 2022, was as follows:
| | | | Year Ended | | | Year Ended | |
| | | | June 30, 2023 | | | June 30, 2022 | |
| | Ordinary income | | $ | 1,656,103 | | | $ | 3,685,700 | |
| | Long-term capital gains | | | 1,095,888 | | | | 2,235,736 | |
| | | | $ | 2,751,991 | | | $ | 5,921,436 | |
NOTE 7 – SECURITIES LENDING
The Fund participates in securities lending arrangements whereby it lends certain of its portfolio securities to brokers, dealers and financial institutions (not with individuals) in order to receive additional income and increase the rate of return of its portfolio. U.S. Bank, N.A. serves as the Fund’s securities lending agent.
U.S. Bank, N.A. oversees the securities lending process, which includes the screening, selection and ongoing review of borrowers, monitoring the availability of securities, negotiating rebates, daily marking to market of loans, monitoring and maintaining cash collateral levels, processing securities movements and reinvesting cash collateral as directed by the Adviser.
The Fund may lend securities pursuant to agreements that require the loans to be secured by collateral consisting of cash, securities of the U.S. Government or it agencies, or any combination of cash and such securities. At the time of loans, the collateral value should at least be equal to 102% of domestic securities and 105% of foreign securities. The value of loaned securities will then be marked-to-market daily and the collateral will be continuously secured by collateral equal to 100% of the market value of the loaned securities. Such loans will not be made if, as a result, the aggregate amount of all outstanding securities loans for the Fund exceeds one-third of the value of the Fund’s total assets taken at fair market value. The Fund will earn interest on the investment of the cash collateral in U.S. Government securities, short-term money market instruments or such other approved vehicle. However, the Fund will normally pay lending fees to such broker-dealers and related expenses from the interest earned on invested collateral. There may be risks of delay in receiving additional collateral or risks of delay in recovery of the securities and even loss of rights in the collateral should the borrower of the securities fail financially. However, loans are made only to borrowers deemed by the
| NOTES TO FINANCIAL STATEMENTS (Continued) |
| at June 30, 2023 |
adviser to be of good standing and when, in the judgment of the adviser, the consideration that can be earned currently from such securities loans justifies the attendant risk. Either party, upon reasonable notice to the other party, may terminate the loan.
As of June 30, 2023, the Fund had loaned securities that were collateralized by cash. The cash collateral received was invested in securities as listed in the Fund’s Schedule of Investments.
The following table presents the securities out on loan for the Fund, and the collateral delivered related to those securities, as of the end of the reporting period.
Securities Lending Transactions
| | Investments | | | |
| | Purchased with | Collateral | | |
| | Asset Class | Proceeds from | Pledged | Net |
Overnight and Continuous | out on Loan | Securities Lending | Counterparty^ | Exposure |
| Vert Global Sustainable | | | | |
| Real Estate Fund | Common Stock | $61,522,834 | $61,522,834 | $ — |
| ^ | As of the end of the reporting period, the value of the collateral pledged from the counterparty exceeded the value of the securities out on loan. Refer to the Fund’s Schedule of Investments for details on the securities out on loan. |
NOTE 8 – PRINCIPAL RISKS
Below are summaries of some, but not all, of the principal risks of investing in the Fund, each of which could adversely affect the Fund’s NAV, market price, yield, and total return. Further information about investment risks is available in the Fund’s prospectus and Statement of Additional Information.
General Market Risk; Recent Market Events: The value of the Fund’s shares will fluctuate based on the performance of the Fund’s investments and other factors affecting the securities markets generally. Certain investments selected for the Fund’s portfolio may be worth less than the price originally paid for them, or less than they were worth at an earlier time. The value of the Fund’s investments may go up or down, sometimes dramatically and unpredictably, based on current market conditions, such as real or perceived adverse political or economic conditions, inflation, changes in interest rates, lack of liquidity in the fixed income markets or adverse investor sentiment.
U.S. and international markets have experienced volatility in recent months and years due to a number of economic, political and global macro factors, including the impact of the coronavirus (COVID-19) global pandemic, which has resulted in a public health crisis, business interruptions, growth concerns in the U.S. and overseas, layoffs, rising unemployment claims, changed travel and social behaviors and reduced consumer spending. The effects of COVID-19 may lead to a substantial economic downturn or recession in the U.S. and global economies, the recovery from which is uncertain and may last for an extended period of time.
| NOTES TO FINANCIAL STATEMENTS (Continued) |
| at June 30, 2023 |
Equity Market Risk: Equity securities are susceptible to general stock market fluctuations due to economic, market, political and issuer-specific considerations and to potential volatile increases and decreases in value as market confidence in and perceptions of their issuers change.
Foreign Securities and Currency Risk: Foreign securities are subject to risks relating to political, social and economic developments abroad and differences between U.S. and foreign regulatory requirements and market practices. Those risks are increased for investments in emerging markets. Securities that are denominated in foreign currencies are subject to further risk that the value of the foreign currency will fall in relation to the U.S. dollar and/or will be affected by volatile currency markets or actions of U.S. and foreign governments or central banks. Income earned on foreign securities may be subject to foreign withholding taxes.
Management Risk: The ability of the Fund to meet its investment objective is directly related to the Advisor’s and Sub-Advisor’s management of the Fund. The value of your investment in the Fund may vary with the effectiveness of the Advisor’s research, analysis and asset allocation among portfolio securities. If the investment strategies do not produce the expected results, the value of your investment could be diminished or even lost entirely.
Real Estate Investment Risk: The risks related to investments in real estate securities include, but are not limited to, adverse changes in general economic and local market conditions; adverse developments in employment; changes in supply or demand for similar or competing properties; unfavorable changes in applicable taxes, governmental regulations, or interest rates; operating or developmental expenses and lack of available financing.
REIT Risk: A REIT’s share price may decline because of adverse developments affecting the real estate industry, including changes in interest rates. The returns from REITs may trail returns from the overall market. The Fund’s investments in REITs may be subject to special tax rules, or a particular REIT may fail to qualify for the favorable federal income tax treatment applicable to REITs, the effect of which may have adverse tax consequences for the Fund and shareholders.
Real Estate-Related Securities Concentration Risk: The Fund could lose money due to the performance of real estate-related securities even if securities markets generally are experiencing positive results.
NOTE 9 – GUARANTEES AND INDEMNIFICATIONS
In the normal course of business, the Fund enters into contracts that contain a variety of representations and warranties and which provide general indemnifications. The Fund’s maximum exposure under these arrangements is unknown, as this would involve future claims that may be made against the Fund that have not yet occurred. However, based on experience, the Fund expects the risk of loss to be remote.
| NOTES TO FINANCIAL STATEMENTS (Continued) |
| at June 30, 2023 |
NOTE 10 – CONTROL OWNERSHIP
The beneficial ownership, either directly or indirectly, of more than 25% of the voting securities of a fund creates a presumption of control of the fund, under Section 2(a)(9) of the 1940 Act. As of June 30, 2023, TD Ameritrade, Inc. held 42% of the outstanding Institutional Shares of the Fund and Charles Schwab & Co., Inc. held 37% of the outstanding Institutional Shares of the Fund. The Fund has no knowledge as to whether all of any of the shares owned of record by TD Ameritrade, Inc. or Charles Schwab & Co. are also beneficially owned.
| CHANGE IN AUDITOR DISCLOSURE |
| (Unaudited) |
CHANGE IN INDEPENDENT REGISTERED PUBLIC ACCOUNTING FIRM
Effective March 6, 2023, BBD LLP (“BBD”) ceased to serve as the independent registered public accounting firm of Vert Global Sustainable Real Estate Fund, a series of Manager Directed Portfolios Trust. The Audit Committee of the Board of Trustees approved the replacement of BBD as a result of Cohen & Company, Ltd.’s (“Cohen”) acquisition of BBD’s investment management group.
The reports of BBD on the financial statements of the Vert Global Sustainable Real Estate Fund as of and for the fiscal years ended 2022 and 2021 did not contain an adverse opinion or a disclaimer of opinion, and were not qualified or modified as to uncertainties, audit scope or accounting principles. During the fiscal years ended 2022 and 2021, and during the subsequent interim period through February 18, 2023: (i) there were no disagreements between the registrant and BBD on any matter of accounting principles or practices, financial statement disclosure, or auditing scope or procedure, which disagreements, if not resolved to the satisfaction of BBD, would have caused it to make reference to the subject matter of the disagreements in its report on the financial statements of the Vert Global Sustainable Real Estate Fund for such years or interim period; and (ii) there were no “reportable events,” as defined in Item 304(a)(1)(v) of Regulation S-K under the Securities Exchange Act of 1934, as amended.
The registrant requested that BBD furnish it with a letter addressed to the U.S. Securities and Exchange Commission stating that it agrees with the above statements.
On February 18, 2023, the Audit Committee of the Board of Trustees also recommended and approved the appointment of Cohen as the Fund’s independent registered public accounting firm for the June 30, 2023.
During the fiscal years ended June 30, 2022 and June 30, 2021, and during the subsequent interim period through February 18, 2023, neither the registrant, nor anyone acting on its behalf, consulted with Cohen on behalf of the Vert Global Sustainable Real Estate Fund regarding the application of accounting principles to a specified transaction (either completed or proposed), the type of audit opinion that might be rendered on the Vert Global Sustainable Real Estate Fund’s financial statements, or any matter that was either: (i) the subject of a “disagreement,” as defined in Item 304(a)(1)(iv) of Regulation S-K and the instructions thereto; or (ii) “reportable events,” as defined in Item 304(a)(1)(v) of Regulation S-K.
| REPORT OF INDEPENDENT REGISTERED PUBLIC ACCOUNTING FIRM |
| |
To the Shareholders of Vert Global Sustainable Real Estate Fund
and Board of Trustees of Manager Directed Portfolios
Opinion on the Financial Statements
We have audited the accompanying statement of assets and liabilities, including the schedule of investments, of the Vert Global Sustainable Real Estate Fund (the “Fund”), a series of Manager Directed Portfolios, as of June 30, 2023, and the related statements of operations and changes in net assets, the related notes, and the financial highlights for the year then ended (collectively referred to as the “financial statements”). In our opinion, the financial statements present fairly, in all material respects, the financial position of the Fund as of June 30, 2023, the results of its operations, the changes in net assets and the financial highlights for the year then ended, in conformity with accounting principles generally accepted in the United States of America.
The Fund’s financial statements and financial highlights for the year ended June 30, 2022, and prior, were audited by other auditors whose report dated August 29, 2022, expressed an unqualified opinion on those financial statements and financial highlights.
Basis for Opinion
These financial statements are the responsibility of the Fund’s management. Our responsibility is to express an opinion on the Fund’s financial statements based on our audit. We are a public accounting firm registered with the Public Company Accounting Oversight Board (United States) (“PCAOB”) and are required to be independent with respect to the Fund in accordance with the U.S. federal securities laws and the applicable rules and regulations of the Securities and Exchange Commission and the PCAOB.
We conducted our audit in accordance with the standards of the PCAOB. Those standards require that we plan and perform the audit to obtain reasonable assurance about whether the financial statements are free of material misstatement whether due to error or fraud.
Our audit included performing procedures to assess the risks of material misstatement of the financial statements, whether due to error or fraud, and performing procedures that respond to those risks. Such procedures included examining, on a test basis, evidence regarding the amounts and disclosures in the financial statements. Our procedures included confirmation of securities owned as of June 30, 2023, by correspondence with the custodian and brokers; when replies were not received from brokers, we performed other auditing procedures. Our audit also included evaluating the accounting principles used and significant estimates made by management, as well as evaluating the overall presentation of the financial statements. We believe that our audit provides a reasonable basis for our opinion.
We have served as the Fund’s auditor since 2023.
COHEN & COMPANY, LTD.
Philadelphia, Pennsylvania
August 29, 2023
| EXPENSE EXAMPLE |
| June 30, 2023 (Unaudited) |
As a shareholder of the Fund, you incur two types of costs: (1) transaction costs including sales charges (loads) and redemption fees, if applicable; and (2) ongoing costs, including management fees; and other Fund expenses. This Example is intended to help you understand your ongoing costs (in dollars) of investing in the Fund and to compare these costs with the ongoing costs of investing in other mutual funds.
The Example is based on an investment of $1,000 invested at the beginning of the period indicated and held for the entire period from January 1, 2023 to June 30, 2023 for the Institutional Shares.
Actual Expenses
The information in the table under the heading “Actual” provides information about actual account values and actual expenses. You may use the information in these columns together with the amount you invested, to estimate the expenses that you paid over the period. Simply divide your account value by $1,000 (for example, an $8,600 account value divided by $1,000 = 8.6), then multiply the result by the number in the row entitled “Expenses Paid During Period” to estimate the expenses you paid on your account during this period. There are some account fees that are charged to certain types of accounts, such as Individual Retirement Accounts (generally, a $15 fee is charged to the account annually) that would increase the amount of expenses paid on your account. The example below does not include portfolio trading commissions and related expenses and other extraordinary expenses as determined under generally accepted accounting principles.
Hypothetical Example for Comparison Purposes
The information in the table under the heading “Hypothetical (5% return before expenses)” provides information about hypothetical account values and hypothetical expenses based on the Fund’s actual expense ratio and assumed rate of return of 5% per year before expenses, which is not the Fund’s actual return. The hypothetical account values and expenses may not be used to estimate the actual ending account balance or expenses you paid for the period. You may use this information to compare the ongoing costs of investing in the Fund and other funds. To do so, compare this 5% hypothetical example with the 5% hypothetical examples that appear in the shareholder reports of the other funds. As noted above, there are some account fees that are charged to certain types of accounts that would increase the amount of expense paid on your account.
Please note that the expenses shown in the table are meant to highlight your ongoing costs only and do not reflect any transaction costs, such as sales charges (loads), redemption fees, or exchange fees. Therefore, the information under the heading “Hypothetical (5% return before expenses)” is useful in comparing ongoing costs only, and will not help you determine the relative total costs of owning different funds. In addition, if these transactional costs were included, your costs would have been higher.
| EXPENSE EXAMPLE (Continued) |
| June 30, 2023 (Unaudited) |
| | Beginning | Ending | Expenses Paid |
| | Account Value | Account Value | During Period(1) |
| | 1/1/23 | 6/30/23 | 1/1/23-6/30/23 |
| Actual | | | |
| Institutional Shares | $1,000.00 | $1,019.00 | $2.50 |
| | | | |
| Hypothetical (5% return | | | |
| before expenses) | | | |
| Institutional Shares | $1,000.00 | $1,022.32 | $2.51 |
(1) | Expenses are equal to the Institutional Shares’ annualized expense ratio of 0.50% multiplied by the average account value over the period, multiplied by 181/365 (to reflect the period). |
| NOTICE TO SHAREHOLDERS |
| at June 30, 2023 (Unaudited) |
How to Obtain a Copy of the Fund’s Proxy Voting Policies
A description of the policies and procedures that the Fund uses to determine how to vote proxies relating to portfolio securities is available without charge, upon request, by calling 1-888-893-4491 or on the U.S. Securities and Exchange Commission’s (“SEC”) website at http://www.sec.gov.
How to Obtain a Copy of the Fund’s Proxy Voting Records for the most recent 12-Month Period Ended June 30
Information regarding how the Fund voted proxies relating to portfolio securities during the most recent 12-month period ended June 30 is available no later than August 31 without charge, upon request, by calling 1-888-740-VERT. Furthermore, you can obtain the Fund’s proxy voting records on the SEC’s website at http://www.sec.gov.
Quarterly Filings on Form N-PORT
The Fund files its complete schedule of portfolio holdings with the SEC for the first and third quarters of each fiscal year on Form N-PORT. Information included in the Fund’s Form N-PORT is also available, upon request, by calling 1-888-740-VERT.
Qualified Divided Income/Dividends Received Deduction
For the fiscal year ended June 30, 2023, certain dividends paid by the fund may be subject to a maximum tax rate of 15%, as provided for by the Jobs and Growth Tax Relief Reconciliation Act of 2003. The percentage of dividends declared from ordinary income, designated as qualified dividend income was as follows:
| | Vert Global Sustainable Real Estate Fund | 58.24% | |
For Corporate shareholders, the percent of ordinary income distributions qualifying for corporate dividends received deduction for the fiscal year ended June 30, 2023 was as follows:
| | Vert Global Sustainable Real Estate Fund | 2.20% | |
| TRUSTEES AND OFFICERS |
| (Unaudited) |
The business and affairs of the Trust are managed under the oversight of the Board, subject to the laws of the State of Delaware and the Trust’s Agreement and Declaration of Trust. The Board, as of January 1, 2023, is currently comprised of four trustees who are not interested persons of the Trust within the meaning of the 1940 Act (the “Independent Trustees”). The Trustees are responsible for deciding matters of overall policy and overseeing the actions of the Trust’s service providers. The officers of the Trust conduct and supervise the Trust’s daily business operations.
| | | | Number of | |
| | | | Funds | Other |
| | Position(s) Held | | in Fund | Directorships |
| Name, | with the Trust | | Complex | Held by Trustee |
| Year of Birth | and Length of | Principal Occupation(s) | Overseen by | During the Past |
and Address(1) | Time Served(2) | During the Past Five Years | Trustee(3) | Five Years |
| INDEPENDENT TRUSTEES | | | | |
| | | | | |
| Gaylord B. Lyman | Trustee and Audit | Chief Investment Officer and | 9 | None |
| (Born 1962) | Committee | Senior Portfolio Manager, | | |
| | Chairman, since | Mill Street Financial, LLC, | | |
| | April 2015 | since April 2023; Senior Portfolio | | |
| | | Manager Affinity Investment | | |
| | | Advisors, LLC, (2017 – 2023) | | |
| | | | | |
| Scott Craven Jones | Trustee since | Managing Director, Carne Global | 9 | Trustee, Madison |
| (Born 1962) | July 2016 and | Financial Services (US) LLC | | Funds, since 2019 |
| | Lead Independent | (a provider of independent | | (16 portfolios); |
| | Trustee since | governance and distribution | | Trustee, Madison |
| | May 2017 | support for the asset management | | Covered Call & |
| | | industry), since 2013; Managing | | Equity Strategy |
| | | Director, Park Agency, Inc., | | Fund, since 2021 |
| | | since 2020. | | (1 portfolio). |
| TRUSTEES AND OFFICERS (Continued) |
| (Unaudited) |
| | | | Number of | |
| | | | Funds | Other |
| | Position(s) Held | | in Fund | Directorships |
| Name, | with the Trust | | Complex | Held by Trustee |
| Year of Birth | and Length of | Principal Occupation(s) | Overseen by | During the Past |
and Address(1) | Time Served(2) | During the Past Five Years | Trustee(3) | Five Years |
| Lawrence T. | Trustee since | Senior Vice President and Chief | 9 | None |
| Greenberg | July 2016 | Legal Officer, The Motley Fool | | |
| (Born 1963) | | Holdings, Inc., since 1996; | | |
| | | Venture Partner and General | | |
| | | Counsel, Motley Fool Ventures | | |
| | | LP, since 2018; Adjunct Professor, | | |
| | | Washington College of Law, | | |
| | | American University, since 2006; | | |
| | | General Counsel, Motley Fool | | |
| | | Asset Management, LLC | | |
| | | (2008 – 2018); Manager, Motley | | |
| | | Fool Wealth Management, LLC | | |
| | | (2013 – 2018). | | |
| | | | | |
| James R. Schoenike | Trustee since | Retired. Distribution Consultant | 9 | None |
| (Born 1959) | July 2016(4) | (2018 – 2021); President and | | |
| | | CEO, Board of Managers, Quasar | | |
| | | Distributors, LLC (2013 – 2018). | | |
(1) | The address of each Trustee as it relates to the Trust’s business is c/o U.S. Bank Global Fund Services, 615 East Michigan Street, Milwaukee, WI 53202. |
(2) | Each Trustee serves an indefinite term; however, under the terms of the Board’s retirement policy, a Trustee shall retire during the year in which a Trustee reaches the age of 75. |
(3) | The Trust currently has nine active portfolios. |
(4) | Prior to January 1, 2021, Mr. Schoenike was considered to be an “interested person” of the Fund by virtue of his previous position as President of Quasar Distributors, LLC. |
As of the date of this report, no Independent Trustee nor any of his immediate family members (i.e., spouse or dependent children) serves as an officer or director or is an employee of the Advisor, Sub-Advisor or Distributor, or any of their respective affiliates, nor is such person an officer, director or employee of any company controlled by or under common control with such entities.
| TRUSTEES AND OFFICERS (Continued) |
| (Unaudited) |
| Name, | Position(s) Held with | |
| Year of Birth | Trust and Length | |
and Address | of Time Served(2) | Principal Occupation(s) During Past Five Years |
| OFFICERS | | |
| | | |
Scott M. Ostrowski(1) | President and Principal | Senior Vice President, Compliance and |
| (Born 1980) | Executive Officer, | Administration, Fund Services, since 2006. |
| | since August 10, 2021 | |
| | | |
Ryan Frank(1) | Treasurer, and Principal | Vice President, Fund Services, since 2008. |
| (Born 1985) | Financial Officer, | |
| | since August 17, 2022 | |
| | | |
Colton W. Scarmardo(1) | Assistant Treasurer, | Fund Administrator, Compliance and Administration, |
| (Born 1997) | since May 11, 2021 | Fund Services, since 2019; Business Administration |
| | | Student, 2015 – 2019, MBA obtained May 2022. |
| | | |
Ryan Pasowicz(1) | Assistant Treasurer, | Fund Administration, Compliance and |
| (Born 1991) | since February 22, 2023 | Administration, Fund Services since 2016. |
| | | |
Jill Silver(1) | Chief Compliance | Vice President, U.S. Bancorp Fund Services, LLC, |
| (Born 1976) | Officer and Anti-Money | since December 2022; Compliance Director, |
| | Laundering Compliance | Corebridge Financial Inc. (previously AIG), |
| | Officer, since | 2019 – 2022; Compliance Manager, Corebridge |
| | January 1, 2023 | Financial Inc., 2018 – 2019. |
| | | |
Alyssa M. Bernard(1)(3) | Vice President and | Vice President, U.S. Bancorp Fund Services, LLC, |
| (Born 1988) | Secretary, since | since 2021; Assistant Vice President, U.S. Bancorp |
| | August 20, 2019 | Fund Services, LLC, 2018 – 2021; Attorney, Mutual |
| | | Fund Disclosure, Waddell & Reed |
| | | Financial, Inc., 2017 – 2018. |
(1) | The mailing address of this officer is: 615 East Michigan Street, Milwaukee, Wisconsin 53202. |
(2) | Each officer is elected annually and serves until his or her successor has been duly elected and qualified. |
(3) | Ms. Bernard has served as Vice President of the Trust, in addition to her other positions held with the Trust, since May 11, 2021. |
The Statement of Additional Information includes additional information about the Fund’s Trustees and Officers and is available, without charge, upon request by calling 1-800-497-2960.
| NOTICE OF PRIVACY POLICY & PRACTICES |
| |
Protecting the privacy of Fund shareholders is important to us. The following is a description of the practices and policies through which we protect the privacy and security of your non-public personal information.
We collect non-public personal information about you from the following sources:
• information we receive about you on applications or other forms;
• information you give us orally; and
• information about your transactions with us or others.
The types of non-public personal information we collect and share can include:
• social security number;
• account balances;
• account transactions;
• transaction history;
• wire transfer instructions; and
• checking account information.
What Information We Disclose
We do not disclose any non-public personal information about our shareholders or former shareholders without the shareholder’s authorization, except as permitted by law or in response to inquiries from governmental authorities. We may share information with affiliated parties and unaffiliated third parties with whom we have contracts for servicing the Fund. We will provide unaffiliated third parties with only the information necessary to carry out their assigned responsibility.
How We Protect Your Information
All shareholder records will be disposed of in accordance with applicable law. We maintain physical, electronic and procedural safeguards to protect your non-public personal information and require third parties to treat your non-public personal information with the same high degree of confidentiality.
In the event that you hold shares of the Fund through a financial intermediary, including, but not limited to, a broker-dealer, bank or trust company, the privacy policy of your financial intermediary would govern how your non-public personal information would be shared with unaffiliated third parties.
If you have any questions or concerns regarding this notice or our Privacy Policy, please contact us at 1-888-893-4491.
(This Page Intentionally Left Blank.)
Investment Advisor
Vert Asset Management, LLC
85 Liberty Ship Way, Suite 201
Sausalito, CA 94965
Distributor
Quasar Distributors, LLC
111 East Kilbourn Avenue, Suite 2200
Milwaukee, WI 53202
Transfer Agent
U.S. Bancorp Fund Services, LLC
615 East Michigan Street
Milwaukee, WI 53202
(844) 740-VERT
Custodian
U.S. Bank National Association
Custody Operations
1555 North River Center Drive, Suite 302
Milwaukee, WI 53212
Independent Registered Public Accounting Firm
Cohen & Company Ltd.
1835 Market Street, Suite 310
Philadelphia, PA 19103
Legal Counsel
Godfrey & Kahn S.C.
833 East Michigan Street, Suite 1800
Milwaukee, WI 53202
This report is intended for shareholders of the Fund and may not be used as sales literature unless preceded or accompanied by a current prospectus.
Past performance results shown in this report should not be considered a representation of future performance. Share price and returns will fluctuate so that shares, when redeemed, may be worth more or less than their original cost. Statements and other information herein are dated and are subject to change.
Item 2. Code of Ethics.
The registrant has adopted a code of ethics that applies to the registrant’s principal executive officer and principal financial officer. The registrant has not made any substantive amendments to its code of ethics during the period covered by this report. The registrant has not granted any waivers from any provisions of the code of ethics during the period covered by this report.
A copy of the registrant’s Code of Ethics is filed herewith.
Item 3. Audit Committee Financial Experts.
The registrant’s Board of Trustees has determined that there are at least two audit committee financial experts serving on its audit committee. Messrs. Gaylord B. Lyman and Scott C. Jones are the “audit committee financial experts” and are considered to be “independent” as each term is defined in Item 3 of Form N‑CSR.
Item 4. Principal Accountant Fees and Services.
The registrant has engaged its principal accountant to perform audit services, audit-related services, tax services and other services during the past two fiscal years. “Audit services” refer to performing an audit of the registrant's annual financial statements or services that are normally provided by the accountant in connection with statutory and regulatory filings or engagements for those fiscal years. “Audit-related services” refer to the assurance and related services by the principal accountant that are reasonably related to the performance of the audit. “Tax services” refer to professional services rendered by the principal accountant for tax compliance, tax advice, and tax planning. There were no “other services” provided by the principal accountant. The following table details the aggregate fees billed or expected to be billed for each of the last two fiscal years for audit fees, audit-related fees, tax fees and other fees by the principal accountant.
| | FYE 6/30/2023 | FYE 6/30/2022 |
Audit Fees | $12,500 | $12,000 |
Audit-Related Fees | N/A | N/A |
Tax Fees | $3,250 | $3,000 |
All Other Fees | N/A | N/A |
The audit committee has adopted pre-approval policies and procedures that require the audit committee to pre‑approve all audit and non‑audit services of the registrant, including services provided to any entity affiliated with the registrant.
The percentage of fees billed by Cohen & Company Ltd. applicable to non-audit services pursuant to waiver of pre-approval requirement were as follows:
| | FYE 6/30/2023 | FYE 6/30/2022 |
Audit-Related Fees | 0% | 0% |
Tax Fees | 0% | 0% |
All Other Fees | 0% | 0% |
All of the principal accountant’s hours spent on auditing the registrant’s financial statements were attributed to work performed by full‑time permanent employees of the principal accountant.
The following table indicates the non-audit fees billed or expected to be billed by the registrant’s accountant for services to the registrant and to the registrant’s investment adviser (and any other controlling entity, etc.—not sub-adviser) for the last two years. The audit committee of the Board of Trustees has considered whether the provision of non-audit services that were rendered to the registrant's investment adviser is compatible with maintaining the principal accountant's independence and has concluded that the provision of such non-audit services by the accountant has not compromised the accountant’s independence.
Non-Audit Related Fees | FYE 6/30/2023 | FYE 6/30/2022 |
Registrant | N/A | N/A |
Registrant’s Investment Adviser | N/A | N/A |
The registrant has not been identified by the U.S. Securities and Exchange Commission as having filed an annual report issued by a registered public accounting firm branch or office that is located in a foreign jurisdiction where the Public Company Accounting Oversight Board is unable to inspect or completely investigate because of a position taken by an authority in that jurisdiction.
The registrant is not a foreign issuer.
Item 5. Audit Committee of Listed Registrants.
(a) Not applicable to registrants who are not listed issuers (as defined in Rule 10A-3 under the Securities Exchange Act of 1934).
(b) Not Applicable.
Item 6. Investments.
| (a) | Schedule of Investments is included as part of the report to shareholders filed under Item 1 of this Form. |
Item 7. Disclosure of Proxy Voting Policies and Procedures for Closed-End Management Investment Companies.
Not applicable to open-end investment companies.
Item 8. Portfolio Managers of Closed-End Management Investment Companies.
Not applicable to open-end investment companies.
Item 9. Purchases of Equity Securities by Closed‑End Management Investment Company and Affiliated Purchasers.
Not applicable to open-end investment companies.
Item 10. Submission of Matters to a Vote of Security Holders.
There have been no material changes to the procedures by which shareholders may recommend nominees to the Registrant’s Board of Trustees.
Item 11. Controls and Procedures.
| (a) | The Registrant’s President/Principal Executive Officer and Treasurer/Principal Financial Officer have reviewed the Registrant's disclosure controls and procedures (as defined in Rule 30a-3(c) under the Investment Company Act of 1940, as amended, (the “Act”)) as of a date within 90 days of the filing of this report, as required by Rule 30a-3(b) under the Act and Rules 13a-15(b) or 15d‑15(b) under the Securities Exchange Act of 1934. Based on their review, such officers have concluded that the disclosure controls and procedures are effective in ensuring that information required to be disclosed in this report is appropriately recorded, processed, summarized and reported and made known to them by others within the Registrant and by the Registrant’s service provider. |
| (b) | There were no changes in the Registrant's internal control over financial reporting (as defined in Rule 30a-3(d) under the Act) that occurred during the fourth fiscal quarter of the period covered by this report that has materially affected, or is reasonably likely to materially affect, the Registrant's internal control over financial reporting. |
Item 12. Disclosure of Securities Lending Activities for Closed-End Management Investment Companies.
Not applicable to open-end investment companies.
Item 13. Exhibits.
(3) Any written solicitation to purchase securities under Rule 23c‑1 under the Act sent or given during the period covered by the report by or on behalf of the registrant to 10 or more persons. Not applicable to open-end investment companies.
SIGNATURES
Pursuant to the requirements of the Securities Exchange Act of 1934 and the Investment Company Act of 1940, as amended, the registrant has duly caused this report to be signed on its behalf by the undersigned, thereunto duly authorized.
(Registrant) Manager Directed Portfolios
By (Signature and Title)* /s/Scott M. Ostrowski
Scott M. Ostrowski, President/
Principal Executive Officer
Date 08/31/2023
Pursuant to the requirements of the Securities Exchange Act of 1934 and the Investment Company Act of 1940, as amended, this report has been signed below by the following persons on behalf of the registrant and in the capacities and on the dates indicated.
By (Signature and Title)* /s/Scott M. Ostrowski
Scott M. Ostrowski, President/
Principal Executive Officer
Date 08/31/2023
By (Signature and Title)* /s/Ryan Frank
Ryan Frank,
Treasurer/Principal Financial Officer
Date 08/31/2023
* Print the name and title of each signing officer under his or her signature.