UNITED STATES
SECURITIES AND EXCHANGE COMMISSION
Washington, D.C. 20549
FORM N-CSR
CERTIFIED SHAREHOLDER REPORT OF REGISTERED
MANAGEMENT INVESTMENT COMPANIES
Investment Company Act file number | 811-21903 |
|
Nuveen Global Value Opportunities Fund |
(Exact name of registrant as specified in charter) |
|
Nuveen Investments 333 West Wacker Drive Chicago, IL 60606 |
(Address of principal executive offices) (Zip code) |
|
Kevin J. McCarthy Nuveen Investments 333 West Wacker Drive Chicago, IL 60606 |
(Name and address of agent for service) |
|
Registrant’s telephone number, including area code: | (312) 917-7700 | |
|
Date of fiscal year end: | December 31 | |
|
Date of reporting period: | June 30, 2011 | |
| | | | | | |
Form N-CSR is to be used by management investment companies to file reports with the Commission not later than 10 days after the transmission to stockholders of any report that is required to be transmitted to stockholders under Rule 30e-1 under the Investment Company Act of 1940 (17 CFR 270.30e-1). The Commission may use the information provided on Form N-CSR in its regulatory, disclosure review, inspection, and policymaking roles.
A registrant is required to disclose the information specified by Form N-CSR, and the Commission will make this information public. A registrant is not required to respond to the collection of information contained in Form N-CSR unless the Form displays a currently valid Office of Management and Budget ("OMB") control number. Please direct comments concerning the accuracy of the information collection burden estimate and any suggestions for reducing the burden to Secretary, Securities and Exchange Commission, 450 Fifth Street, NW, Washington, DC 20549-0609. The OMB has reviewed this collection of information under the clearance requirements of 44 U.S.C. ss. 3507.
ITEM 1. REPORTS TO STOCKHOLDERS.

Closed-End Funds
Nuveen Investments
Closed-End Funds
Potential for a High Level of Total Return from a Diversified Global
Portfolio Primarily Invested in Equity and Debt Securities
Semi-Annual Report
June 30, 2011

Nuveen Global Value
Opportunities Fund
JGV

LIFE IS COMPLEX.
Nuveen makes things e-simple.
It only takes a minute to sign up for e-Reports. Once enrolled, you'll receive an e-mail as soon as your Nuveen Fund information is ready. No more waiting for delivery by regular mail. Just click on the link within the e-mail to see the report and save it on your computer if you wish.
Free e-Reports right to your e-mail!
www.investordelivery.com
If you receive your Nuveen Fund dividends and statements from your financial advisor or brokerage account.
OR
www.nuveen.com/accountaccess
If you receive your Nuveen Fund dividends and statements directly from Nuveen.

Table of Contents
| Chairman's Letter to Shareholders | | | 4 | | |
|
| Portfolio Managers' Comments | | | 5 | | |
|
| Distribution and Share Price Information | | | 9 | | |
|
| Performance Overview | | | 11 | | |
|
| Shareholder Meeting Report | | | 12 | | |
|
| Portfolio of Investments | | | 13 | | |
|
| Statement of Assets & Liabilities | | | 21 | | |
|
| Statement of Operations | | | 22 | | |
|
| Statement of Changes in Net Assets | | | 23 | | |
|
| Financial Highlights | | | 24 | | |
|
| Notes to Financial Statements | | | 26 | | |
|
| Annual Investment Management Agreement Approval Process | | | 36 | | |
|
| Reinvest Automatically Easily and Conveniently | | | 44 | | |
|
| Glossary of Terms Used in this Report | | | 46 | | |
|
| Other Useful Information | | | 50 | | |
|
Chairman's
Letter to Shareholders

Dear Shareholders,
The global economy continues to be weighed down by an unusual combination of pressures facing the larger developed economies. Japanese leaders continue to work through the economic aftereffects of the March 2011 earthquake and tsunami. Political leaders in Europe and the U.S. have resolved some of the near term fiscal problems, but the financial markets are not convinced that these leaders are able to address more complex longer term fiscal issues. Despite improved earnings and capital increases, the largest banks in these countries continue to be vulnerable to deteriorating mortgage portfolios and sovereign credit exposure, adding another source of uncertainty to the global financial system.
In the U.S., recent economic statistics indicate that the economic recovery may be losing momentum. Consumption, which represents about 70% of the gross domestic product, faces an array of challenges from seemingly intractable declines in housing values, increased energy costs and limited growth in the job market. The failure of Congress and the administration to agree on the debt ceiling increase on a timely basis and the deep divisions between the political parties over fashioning a balanced program to address growing fiscal imbalances that led to the recent S&P ratings downgrade add considerable uncertainty to the domestic economic picture.
On a more positive note, corporate earnings continue to hold up well and the municipal bond market is recovering from recent weakness as states and municipalities implement various programs to reduce their budgetary deficits. In addition, the Federal Reserve System has made it clear that it stands ready to take additional steps should the economic recovery falter. However, there are concerns that the Fed is approaching the limits of its resources to intervene in the economy.
These perplexing times highlight the importance of professional investment management. Your Nuveen investment team is working hard to develop an appropriate response to increased risk, and they continue to seek opportunities created by stressful markets using proven investment disciplines designed to help your Fund achieve its investment objectives. On your behalf, we monitor their activities to assure that they maintain their investment disciplines.
As always, I encourage you to contact your financial consultant if you have any questions about your investment in a Nuveen Fund. On behalf of the other members of your Fund Board, we look forward to continuing to earn your trust in the months and years ahead.
Sincerely,

Robert P. Bremner
Chairman of the Board
August 23, 2011
Nuveen Investments
4
Portfolio Managers' Comments
Certain statements in this report are forward-looking statements. Discussions of specific investments are for illustration only and are not intended as recommendations of individual investments. The forward-looking statements and other views expressed herein are those of the portfolio managers as of the date of this report. Actual future results or occurrences may differ significantly from those anticipated in any forward-looking statementsand the views expressed herein are subject to change at any time, due to numerous market and other factors. The Fund disclaims any obligation to update publicly or revise any forward-looking statements or views expressed herein.
Ratings shown are the highest rating given by one of the following national rating agencies: S&P, Moody's or Fitch. Credit ratings are subject to change. AAA, AA, A, and BBB are investment grade ratings; BB, B, CCC/CC/C and D are below-investment grade ratings. Bonds backed by U.S. Government or agency securities are given an implied rating equal to the rating of such securities. Holdings designated NR are not rated by a national rating agency.
Nuveen Global Value Opportunities Fund (JGV)
The Fund's investment portfolio is managed by Tradewinds Global Investors, LLC, a subsidiary of Nuveen Investments. David Iben, Emily Alejos and Michael Hart manage the Fund. Dave is Chief Investment Officer, Managing Director and Portfolio Manager at Tradewinds, and has over 25 years of investment management experience. Emily Alejos, CFA, Managing Director and Portfolio Manager, has been a portfolio manager and senior consumer sector analyst at Tradewinds since 2007. Michael Hart, CFA, Senior Vice President and Portfolio Manager, has been a global securities analyst at Tradewinds since 2007 and a portfolio manager since 2008.
Subsequent to the reporting period, Emily Alejos and Michael Hart were removed as portfolio managers of the Fund, and Dave Iben remains as the sole portfolio manager.
Here Dave Iben speaks about the management strategy and performance of the Fund for the six-month period ending June 30, 2011.
What key strategies were used to manage the Fund during this reporting period?
The Fund seeks a high level of total return by investing primarily in a diversified global portfolio of value equity securities, as well as corporate and governmental debt securities, and by opportunistically using leverage, primarily via writing options and shorting a small position in equities. The ability of the Fund to engage in a modest amount of short selling within defined limits was confirmed by the Fund's Board of Trustees during the course of this reporting period.
Under normal market conditions, the Fund will invest opportunistically in a diversified global portfolio of equities as well as debt securities using a value-oriented approach that seeks to identify undervalued securities through intensive bottom-up research in the context of major themes shaping investment opportunities in the global markets. This mix will be actively managed based on market conditions, and the portfolio can range from substantially all equity to substantially all debt as circumstances warrant. Our basic investment philosophy continues to be to search for good or improving business franchises around the globe whose securities are selling at levels that we believe are below their intrinsic value.
In the first half of 2011, we continued to like materials, food, agriculture and energy stocks that benefit from increased global demand. Within the equity asset class, both the long and short equity exposure remained generally unchanged, as measured at the beginning and end of the six-month period, while the convertible bond position decreased by the end of the period. Within the fixed income asset class, the Fund's exposure increased slightly, partially due to a slight increase in corporate bonds. We
Nuveen Investments
5
Past performance is not predictive of future results. Current performance may be higher or lower than the data shown. Returns do not reflect the deduction of taxes that shareholders may have to pay on Fund distributions or upon the sale of Fund shares.
For additional information, see the Performance Overview for the Fund in this report.
* Six-month returns are cumulative; all other returns are annualized.
** Since inception returns for the Fund, index and benchmark are from 7/24/06.
1 JGV's Comparative Benchmark is comprised of 1) 80% MSCI All Country World Index 2) 15% Barclays Capital U.S. Aggregate Bond Index 3) 5% Barclays Capital High Yield Index. The MSCI All Country World Index is published by Morgan Stanley Capital International, Inc. It is a free float-adjusted market capitalization index that is designed to measure global developed and emerging market equity performance. The index covers 49 developed and emerging market countries. The Barclay Capital U.S. Aggregate Bond Index represents securities that are SEC-registered, taxable and dollar denominated. The index covers the U.S. investment grade fixed rate bond market, with index components for government and corporate securities, mortgage pass-through securities, and asset-backed securities. The Barclays Capital High Yield Index covers the universe of fixed rate, non-investment grade debt. Pay-in-kind (PIK) bonds, Eurobonds, and debt issues from countries designated as emerging markets (e.g., Argentina, Brazil, Venezuela, etc. are excluded, but Canadian and global bonds (SEC registered) of issuers in non-EMG countries are included). Original issue zeroes, step-up coupon structures and 144-As are also included. Returns do not include the effects of any sales charges or management fees. It is not possible to invest directly in this benchmark or an index.
continued to write covered calls on selected long equity positions in an attempt to enhance yield and expected total return.
How did the Fund perform over the six-month period?
The performance of JGV, as well as a comparative benchmark and general market index, is presented in the accompanying table.
Average Annual Total Return on Net Asset Value*
For periods ended 6/30/11
| | | 6-Month | | 1-Year | | Since Inception** | |
| JGV | | | -0.76 | % | | | 17.35 | % | | | 8.88 | % | |
| Comparative Benchmark1 | | | 4.65 | % | | | 25.99 | % | | | 9.42 | % | |
| MSCI All Country World Index1 | | | 4.99 | % | | | 30.77 | % | | | 4.36 | % | |
For the six-month period ended June 30, 2011, the Fund underperformed its comparative benchmark and the MCSI index.
The Fund's long equity holdings in the health care sector were the most significant positive contributors to performance in the period. Aetna Incorporated, which provides managed health care benefits through group, individual, Medicare and Medicaid programs, was the top performer in absolute terms due to, in our view, more benign prospects for health care reform, and the stock performed well after the company beat first quarter 2011 earnings estimates. The industrials sector also contributed positively, notably due to the performance of the equities of French defense electronics company Thales S.A. and U.S. defense contactor Lockheed Martin Corporation.
Our covered call writing strategy also contributed to the Fund's performance. Looking at the Fund's fixed income positions, corporate bonds represented the largest asset class within the group and performance of individual bonds was mixed.
The Fund's worst performer for the period was our long equity position in Canadian-based Cameco Corporation, the world's largest uranium producer. Its share price was severely impacted because of market fears that the ongoing troubling news regarding the stricken Fukushima Daiichi nuclear plant in Japan might reduce future demand for uranium. However, nuclear power still meets important global energy requirements, and we took advantage of the price correction to add to the Fund's holdings of Cameco and other high quality nuclear energy-related companies.
Other significant underperformers included long equity positions in Canadian-based gold producer Barrick Gold Corporation and South African-based gold miner Gold Fields Limited. During the period, precious metals companies mostly underperformed the spot prices of the metals they produce. While the environment for these stocks is currently gloomy, we think it's important to weigh the somewhat countervailing aspects of world-class mining firms priced at what we believe to be bargain levels. Tradewinds has a bias to precious metals companies with low costs and high quality metal reserves. In our view, it's very likely that increasing demand will be set against dwindling supply as mining becomes more costly and difficult, and in such a situation, companies with superior assets and a low cost of production have the potential to outpace their peers. The
Nuveen Investments
6
materials sector holdings continued to be significantly overweight versus the benchmark and proved to be a significant detractor from performance this period.
The Fund's short equity holdings represented a limited percentage of the overall Fund, but the exposure detracted from the Fund's return in the period. Its short equity positions are concentrated in several companies that we characterize as members of the "contemporary nifty fifty"—high momentum growth companies that we believe are outrageously overvalued. The Fund's greatest detractor from performance was specialty coffee and coffee maker Green Mountain Coffee Roasters Incorporated. As "value" investors, we remain patient.
RISK CONSIDERATIONS
Fund shares are not guaranteed or endorsed by any bank or other insured depository institution, and are not federally insured by the Federal Deposit Insurance Corporation. Past performance is no guarantee of future results. Fund common shares are subject to a variety of risks, including:
Investment Risk. The possible loss of the entire principal amount that you invest.
Price Risk. Shares of closed-end investment companies like the Fund frequently trade at a discount to their net asset value (NAV). Your common shares at any point in time may be worth less than your original investment, even after taking into account the reinvestment of Fund dividends and distributions.
Tax Risk. The tax treatment of Fund distributions may be affected by new IRS interpretations of the Internal Revenue Code and future changes in tax laws and regulations. This is particularly true for funds employing a managed distribution program.
Common Stock Risk. Common stock returns often have experienced significant volatility.
Non-U.S. Securities Risk. Investments in non-U.S securities involve special risks not typically associated with domestic investments including currency risk and adverse political, social and economic development. These risks often are magnified in emerging markets.
Value Stock Risk. Value stocks are securities that the portfolio manager believes to be undervalued, or mispriced. If the manager's assessment of a company's prospects is wrong, the price of the company's common stock or other equity securities may fall, or may not approach the value that the manager has placed on them.
Call Option Risk. The value of call options sold (written) by the Fund will fluctuate. The Fund may not participate in any appreciation of its equity portfolio as fully as it would if the Fund did not sell call options. In addition, the Fund will continue to bear the risk of declines in the value of the equity portfolio.
Derivatives Strategy Risk. Derivative securities, such as calls, puts, warrants, swaps and forwards, carry risks different from, and possibly greater than, the risks associated with the underlying investments.
Nuveen Investments
7
Convertible Securities Risk. Convertible securities generally offer lower interest or dividend yields than non-convertible fixed-income securities of similar credit quality.
Currency Risk. Changes in exchange rates will affect the value of a Fund's investments.
Warrants and Rights Risk. Warrants and rights are subject to the same market risks as common stocks, but are more volatile in price.
Counterparty Risk. To the extent that the Fund's derivative investments are purchased or sold in over-the-counter transactions, the Fund will be exposed to the risk that counterparties to these transactions will be unable to meet their obligations.
Issuer Credit Risk. This is the risk that a security in a Fund's portfolio will fail to make dividend or interest payments when due. This risk may be greater for lower-rated issuers.
Interest Rate Risk. Fixed-income securities such as bonds, preferred, convertible and other debt securities will decline in value if market interest rates rise.
Nuveen Investments
8
Distribution and
Share Price Information
The following information regarding your Fund's distributions is current as of June 30, 2011, and likely will vary over time based on the Fund's investment activities and portfolio investment value changes.
During the six-month reporting period, the Fund's quarterly distribution to shareholders increased during March and again in June. Some of the factors affecting the amount and composition of these distributions are summarized below.
The Fund has a managed distribution program. The goal of this program is to provide shareholders with relatively consistent and predictable cash flow by systematically converting the Fund's expected long-term return potential into regular distributions. As a result, regular distributions throughout the year are likely to include a portion of expected long-term gains (both realized and unrealized), along with net investment income.
Important points to understand about the managed distribution program are:
• The Fund seeks to establish a relatively stable distribution rate that roughly corresponds to the projected total return from its investment strategy over an extended period of time. However, you should not draw any conclusions about the Fund's past or future investment performance from its current distribution rate.
• Actual returns will differ from projected long-term returns (and therefore the Fund's distribution rate), at least over shorter time periods. Over a specific timeframe, the difference between actual returns and total distributions will be reflected in an increasing (returns exceed distributions) or a decreasing (distributions exceed returns) Fund net asset value.
• Each distribution is expected to be paid from some or all of the following sources:
• net investment income (regular interest and dividends),
• realized capital gains, and
• unrealized gains, or, in certain cases, a return of principal (non-taxable distributions).
• A non-taxable distribution is a payment of a portion of the Fund's capital. When the Fund's returns exceed distributions, it may represent portfolio gains generated, but not realized as a taxable capital gain. In periods when the Fund's returns fall short of distributions, the shortfall will represent a portion of your original principal, unless the shortfall is offset during other time periods over the life of your investment (previous or subsequent) when the Fund's total return exceeds distributions.
• Because distribution source estimates are updated during the year based on the Fund's performance and forecast for its current fiscal year (which is the calendar year
Nuveen Investments
9
2 The Fund elected to retain a portion of its realized long-term capital gains for the tax year ended December 31, 2007, and pay required federal corporate income taxes on this amount. As reported on Form 2439, shareholders on record date must include their pro-rata share of these gains on their applicable federal tax returns, and are entitled to take offsetting tax credits, for their pro-rata share of the taxes paid by the Fund. The total returns "Including retained gain tax credit/refund" include the economic benefit to shareholders on record date of these tax credits/refunds. The Fund had no retained capital gains for the tax years ended December 31, 2010 through December 31, 2008 or for the tax year ended December 31, 2006.
for the Fund), estimates on the nature of your distribution provided at the time the distributions are paid may differ from both the tax information reported to you in your Fund's IRS Form 1099 statement provided at year end, as well as the ultimate economic sources of distributions over the life of your investment.
The following table provides estimated information regarding the Fund's distributions and total return performance for the six months ended June 30, 2011. This information is provided on a tax basis rather than a generally accepted accounting principles (GAAP) basis. This information is intended to help you better understand whether the Fund's returns for the specified time period were sufficient to meet the Fund's distributions.
| As of 6/30/11 | | JGV | |
| Inception date | | 7/24/06 | |
| Six months ended June 30, 2011: | |
| Per share distribution: | |
| From net investment income | | $ | 0.35 | | |
| From realized capital gains | | | 0.33 | | |
| Return of capital | | | 0.00 | | |
| Total per share distribution | | $ | 0.68 | | |
| Annualized distribution rate on NAV | | | 6.98 | % | |
| Average annual total returns: | |
| Excluding retained gain tax credit/refund2: | |
| Six-Month (Cumulative) on NAV | | | -0.76 | % | |
| 1-Year on NAV | | | 17.35 | % | |
| Since inception on NAV | | | 8.88 | % | |
| Including retained gain tax credit/refund2: | |
| Six-Month (Cumulative) on NAV | | | -0.76 | % | |
| 1-Year on NAV | | | 17.35 | % | |
| Since inception on NAV | | | 9.04 | % | |
Share Repurchases and Share Price Information
As of June 30, 2011, and since the inception of the Fund's repurchase program, the Fund has cumulatively repurchased and retired 189,100 shares, representing approximately 1.0% of its shares outstanding.
During the six-month reporting period, the Fund did not repurchase and retire any of its outstanding common shares.
As of June 30, 2011, the Fund's share price was trading at a +0.21% premium to its NAV, compared with an average discount of -2.99% for the entire six-month period.
Nuveen Investments
10
JGV
Performance
OVERVIEW
Nuveen Global Value Opportunities Fund
June 30, 2011
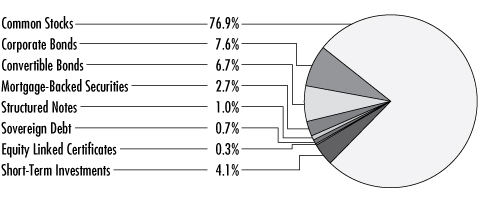
Portfolio Allocation (as a % of total investments)2,4
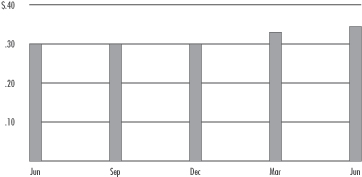
2010-2011 Quarterly Distributions Per Share
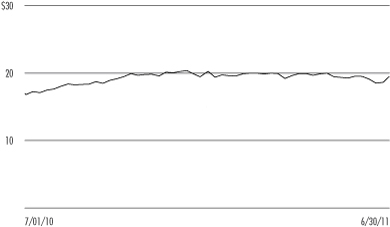
Share Price Performance — Weekly Closing Price
Refer to the Glossary of Terms used in this Report for further definition of the terms used within this Fund's Performance Overview Page.
1 Current Distribution Rate is based on the Fund's current annualized quarterly distribution divided by the Fund's current market price. The Fund's quarterly distributions to its shareholders may be comprised of ordinary income, net realized capital gains and, if at the end of the calendar year the Fund's cumulative net ordinary income and net realized gains are less than the amount of the Fund's distributions, a tax return of capital.
2 Excluding common stocks sold short and investments in derivatives.
3 As previously explained in the Distribution and Share Price Information section of this report, the Fund elected to retain a portion of its realized long-term capital gains for the tax year ended December 31, 2007, and pay required federal corporate income taxes on these amounts. These standardized total returns include the economic benefit to shareholders of record of this tax credit/refund. The Fund had no retained capital gains for the tax years ended December 31, 2010 through December 31, 2008 or for the tax year ended December 31, 2006.
4 Holdings are subject to change.
Fund Snapshot
| Share Price | | $ | 19.52 | | |
| Net Asset Value (NAV) | | $ | 19.48 | | |
| Premium/(Discount) to NAV | | | 0.21 | % | |
| Current Distribution Rate1 | | | 7.07 | % | |
| Net Assets ($000) | | $ | 373,693 | | |
Country Allocation
(as a % of total investments)2,4
| United States | | | 34.7 | % | |
| Canada | | | 15.3 | % | |
| Japan | | | 6.3 | % | |
| South Africa | | | 6.3 | % | |
| France | | | 5.9 | % | |
| Russia | | | 4.1 | % | |
| Brazil | | | 3.3 | % | |
| Australia | | | 2.7 | % | |
| South Korea | | | 2.6 | % | |
| Egypt | | | 2.5 | % | |
| Italy | | | 2.3 | % | |
| Indonesia | | | 2.1 | % | |
| Venezuela | | | 2.0 | % | |
| Finland | | | 1.6 | % | |
| Turkey | | | 1.3 | % | |
| Argentina | | | 1.0 | % | |
| Mexico | | | 0.9 | % | |
| United Kingdom | | | 0.9 | % | |
| Other | | | 4.2 | % | |
Portfolio Composition
(as a % of total investments)2,4
| Metals & Mining | | | 21.9 | % | |
| Oil, Gas & Consumable Fuels | | | 16.4 | % | |
| Electric Utilities | | | 9.9 | % | |
| Aerospace & Defense | | | 5.8 | % | |
| Diversified Telecommunication Services | | | 5.0 | % | |
| Food & Staples Retailing | | | 4.8 | % | |
| Communications Equipment | | | 3.2 | % | |
| Pharmaceuticals | | | 2.8 | % | |
| Health Care Providers & Services | | | 2.7 | % | |
| Residentials | | | 2.7 | % | |
| Road & Rail | | | 2.1 | % | |
| Short-Term Investments | | | 4.1 | % | |
| Other | | | 18.6 | % | |
Average Annual Total Return
(Inception 7/24/06)
| | | On Share Price | | On NAV | |
6-Month
(Cumulative) | | | -0.52 | % | | | -0.76 | % | |
| 1-Year | | | 21.59 | % | | | 17.35 | % | |
| Since Inception | | | 8.59 | % | | | 8.88 | % | |
Average Annual Total Return3
(Including retained gain tax credit/refund)
| | | On Share Price | | On NAV | |
6-Month
(Cumulative) | | | -0.52 | % | | | -0.76 | % | |
| 1-Year | | | 21.59 | % | | | 17.35 | % | |
| Since Inception | | | 8.75 | % | | | 9.04 | % | |
Nuveen Investments
11
JGV
Shareholder MEETING REPORT
The annual meeting of shareholders was held in the offices of Nuveen Investments on May 6, 2011; at this meeting the shareholders were asked to vote on the election of Board Members.
| | | JGV | |
| | | Common
Shares | |
| Approval of the Board Members was reached as follows: | |
| John P. Amboian | |
| For | | | 17,896,282 | | |
| Withhold | | | 218,691 | | |
| Total | | | 18,114,973 | | |
| David J. Kundert | |
| For | | | 17,874,477 | | |
| Withhold | | | 240,496 | | |
| Total | | | 18,114,973 | | |
| Terence J. Toth | |
| For | | | 17,908,332 | | |
| Withhold | | | 206,641 | | |
| Total | | | 18,114,973 | | |
Nuveen Investments
12
JGV
Nuveen Global Value Opportunities Fund
Portfolio of INVESTMENTS
June 30, 2011 (Unaudited)
| Shares | | Description (1) | | Value | |
| | | Common Stocks – 79.6% | |
| | | Aerospace & Defense – 6.0% | |
| | 355,000 | | | Finmeccanica SPA, (9) | | $ | 4,295,388 | | |
| | 89,400 | | | Lockheed Martin Corporation, (7) | | | 7,238,718 | | |
| | 253,300 | | | Thales S.A., (7), (9) | | | 10,908,868 | | |
| | | Total Aerospace & Defense | | | 22,442,974 | | |
| | | Capital Markets – 1.9% | |
| | 1,066,750 | | | EFG – Hermes Holdings SAE, (9) | | | 3,593,838 | | |
| | 488,154 | | | GP Investments Ltd., GDR | | | 1,886,117 | | |
| | 5,530 | | | Mirae Asset Securities Company Limited, (9) | | | 233,243 | | |
| | 235,000 | | | Uranium Participation Corporation, (2) | | | 1,549,692 | | |
| | | Total Capital Markets | | | 7,262,890 | | |
| | | Chemicals – 0.2% | |
| | 43,000 | | | Fertilizantes Heringer LTDA, (2) | | | 271,393 | | |
| | 20,051 | | | Omnia Holdings Limited, (2), (9) | | | 234,873 | | |
| | 36,390 | | | United Phosphorus Limited, (9) | | | 124,138 | | |
| | | Total Chemicals | | | 630,404 | | |
| | | Commercial Banks – 1.4% | |
| | 26,655 | | | Arab Bank PLC | | | 314,783 | | |
| | 2,892,572 | | | First Bank of Nigeria PLC | | | 237,096 | | |
| | 49,600 | | | Kazkommertsbank, 144A, GDR, (2), (9) | | | 272,800 | | |
| | 1,155,000 | | | Sumitomo Mitsui Financial Group, (9) | | | 4,020,243 | | |
| | 5,833,797 | | | Zenith Bank Limited of Lagos | | | 560,810 | | |
| | | Total Commercial Banks | | | 5,405,732 | | |
| | | Communications Equipment – 1.7% | |
| | 978,000 | | | Nokia Oyj, ADR, (7) | | | 6,278,760 | | |
| | | Construction & Engineering – 0.1% | |
| | 47,726 | | | Murray & Roberts Holdings Limited, DD, (9) | | | 211,773 | | |
| | | Construction Materials – 1.2% | |
| | 56,415 | | | Cemex SAB de CV, Sponsored ADR | | | 485,169 | | |
| | 1,653,785 | | | India Cements Limited, GDR, (9) | | | 2,634,496 | | |
| | 5,214,000 | | | Luks Group Vietnam Holdings Company Limited, (9) | | | 1,389,420 | | |
| | | Total Construction Materials | | | 4,509,085 | | |
| | | Diversified Financial Services – 0.5% | |
| | 139,000 | | | Guoco Group Ltd., (9) | | | 1,705,162 | | |
| | | Diversified Telecommunication Services – 5.2% | |
| | 170,645 | | | KT Corporation, Sponsored ADR | | | 3,317,339 | | |
| | 231,500 | | | Nippon Telegraph and Telephone Corporation, ADR, (7) | | | 5,597,670 | | |
| | 156,419 | | | PT Telekomunikasi Indonesia, ADR | | | 5,396,456 | | |
| | 197,786 | | | Telecom Egypt SAE, (9) | | | 503,213 | | |
| | 4,000,000 | | | Telecom Italia S.p.A., (9) | | | 4,653,507 | | |
| | | Total Diversified Telecommunication Services | | | 19,468,185 | | |
Nuveen Investments
13
JGV
Nuveen Global Value Opportunities Fund (continued)
Portfolio of INVESTMENTS June 30, 2011 (Unaudited)
| Shares | | Description (1) | | Value | |
| | | Electric Utilities – 10.2% | |
| | 383,542 | | | Centrais Eletricas Brasileiras SA, Electrobras | | $ | 6,573,910 | | |
| | 36,306 | | | Centrais Eletricas Brasileiras SA, Electrobras | | | 490,131 | | |
| | 16,603 | | | Centrais Eletricas Brasileiras SA, Electrobras | | | 222,239 | | |
| | 244,000 | | | Electricite de France S.A, (7), (9) | | | 9,565,995 | | |
| | 231,000 | | | Exelon Corporation, (7) | | | 9,896,040 | | |
| | 411,400 | | | Korea Electric Power Corporation, Sponsored ADR | | | 5,459,278 | | |
| | 6,069,378 | | | OGK-3-CLS | | | 273,122 | | |
| | 15,504 | | | Pampa Energia S.A., ADR | | | 237,831 | | |
| | 1,131,300 | | | RusHydro, (2), (9) | | | 5,442,424 | | |
| | | Total Electric Utilities | | | 38,160,970 | | |
| | | Electrical Equipment – 0.6% | |
| | 61,750 | | | Areva CI | | | 2,302,694 | | |
| | | Electronic Equipment & Instruments – 0.1% | |
| | 50,690 | | | China Security and Surveillance Techology Inc., (2) | | | 268,657 | | |
| | | Food & Staples Retailing – 5.0% | |
| | 286,000 | | | Kroger Co., (7) | | | 7,092,800 | | |
| | 218,600 | | | Wal-Mart Stores, Inc., (7) | | | 11,616,404 | | |
| | | Total Food & Staples Retailing | | | 18,709,204 | | |
| | | Food Products – 1.3% | |
| | 48,800 | | | BrasilAgro, (2) | | | 318,944 | | |
| | 21,418 | | | Cresud S.A.C.I.F., yA, ADR | | | 347,828 | | |
| | 126,344 | | | Gruma S.A.B de C.V, (2) | | | 262,216 | | |
| | 8,040 | | | Industrias Bachoco S.A.B. de C.V., ADR | | | 193,764 | | |
| | 9,100 | | | SLC Agricola SA | | | 107,813 | | |
| | 186,000 | | | Tyson Foods, Inc., Class A, (7) | | | 3,612,120 | | |
| | | Total Food Products | | | 4,842,685 | | |
| | | Health Care Providers & Services – 2.8% | |
| | 188,000 | | | Aetna Inc., (7) | | | 8,288,920 | | |
| | 201,100 | | | Faber Group Berhad, (9) | | | 139,302 | | |
| | 210,800 | | | Profarma Distribuidora de Produtos Farmaceuticos SA | | | 2,012,572 | | |
| | | Total Health Care Providers & Services | | | 10,440,794 | | |
| | | Hotels, Restaurants & Leisure – 0.1% | |
| | 610,000 | | | NagaCorp Limited, (9) | | | 149,452 | | |
| | 3,384 | | | Orascom Development Holding AG, (9) | | | 111,578 | | |
| | | Total Hotels, Restaurants & Leisure | | | 261,030 | | |
| | | Household Durables – 1.2% | |
| | 26,380 | | | LG Electronics Inc., PFD, (9) | | | 761,933 | | |
| | 767,962 | | | Oriental Weavers Group, (9) | | | 3,795,509 | | |
| | | Total Household Durables | | | 4,557,442 | | |
| | | Independent Power Producers & Energy Traders – 0.1% | |
| | 11,842 | | | Huaneng Power International Inc., Sponsored ADR | | | 252,471 | | |
| | 118,000 | | | Huaneng Power International Inc., (9) | | | 62,602 | | |
| | | Total Independent Power Producers & Energy Traders | | | 315,073 | | |
| | | Insurance – 0.9% | |
| | 314,000 | | | Cathay Financial Holding Company Limited, (9) | | | 487,318 | | |
| | 130,000 | | | Mitsui Sumitomo Insurance Company Limited, (9) | | | 3,042,888 | | |
| | | Total Insurance | | | 3,530,206 | | |
Nuveen Investments
14
| Shares | | Description (1) | | Value | |
| | | Leisure Equipment & Products – 0.6% | |
| | 42,100 | | | Sankyo Company Ltd., (9) | | $ | 2,175,203 | | |
| | | Marine – 0.6% | |
| | 104,000 | | | Stolt-Nielsen S.A. | | | 2,371,018 | | |
| | | Metals & Mining – 18.1% | |
| | 255,510 | | | AngloGold Ashanti Limited, Sponsored ADR, (7) | | | 10,754,416 | | |
| | 77,352 | | | Banro Corporation, (2) | | | 293,544 | | |
| | 306,600 | | | Barrick Gold Corporation, (7) | | | 13,885,914 | | |
| | 25,000 | | | CGA Mining Limited | | | 77,505 | | |
| | 239,815 | | | Eastern Platinum Limited, (2) | | | 198,924 | | |
| | 38,320 | | | First Uranium Corporation | | | 20,661 | | |
| | 10,081 | | | Geovic Mining Corporation, (2) | | | 3,502 | | |
| | 800,243 | | | Gold Fields Limited, Sponsored ADR, (2), (7) | | | 11,675,545 | | |
| | 1,192,501 | | | Gran Colombia Gold Corporation | | | 1,001,530 | | |
| | 4,558 | | | Impala Platinum Holdings Limited, Sponsored ADR, (9) | | | 122,200 | | |
| | 4,830 | | | Ivanhoe Mines Ltd., (2) | | | 122,199 | | |
| | 251,000 | | | Newcrest Mining Limited, (9) | | | 10,170,453 | | |
| | 225,000 | | | Newmont Mining Corporation, (7) | | | 12,143,250 | | |
| | 187,334 | | | Polyus Gold Company | | | 5,901,021 | | |
| | 2,398 | | | Polyus Gold Company | | | 75,297 | | |
| | 12,978,420 | | | Simmer & Jack Mines, Ltd., (2) | | | 57,581 | | |
| | 6,150,387 | | | Village Main Reef Limited, (9) | | | 1,127,660 | | |
| | | Total Metals & Mining | | | 67,631,202 | | |
| | | Multiline Retail – 0.0% | |
| | 13,933 | | | Pantaloon Retail India Limited, (9) | | | 95,727 | | |
| | | Oil, Gas & Consumable Fuels – 10.5% | |
| | 83,658 | | | Bankers Petroleum Limited | | | 596,783 | | |
| | 368,000 | | | Cameco Corporation, (7) | | | 9,696,800 | | |
| | 170,000 | | | Chesapeake Energy Corporation, (7) | | | 5,047,300 | | |
| | 270,749 | | | Gazprom OAO, ADR, (9) | | | 3,952,380 | | |
| | 9,397 | | | Gazprom OAO, ADR, (9) | | | 136,726 | | |
| | 365,000 | | | Nexen Inc., (7) | | | 8,212,500 | | |
| | 26,569 | | | Niko Resources Limited | | | 1,658,686 | | |
| | 17,684 | | | Petrobras Energia S.A., ADR | | | 342,539 | | |
| | 90,000 | | | PetroChina Company Limited, (9) | | | 131,958 | | |
| | 26,780 | | | Petroleo Brasileiro, Sponsored ADR | | | 821,610 | | |
| | 10,423,000 | | | PT Medco Energi Internasional TBK, (9) | | | 2,865,314 | | |
| | 16,500 | | | Range Resources Corporation, (7) | | | 915,750 | | |
| | 121,500 | | | Suncor Energy, Inc., (7) | | | 4,750,650 | | |
| | | Total Oil, Gas & Consumable Fuels | | | 39,128,996 | | |
| | | Paper & Forest Products – 0.2% | |
| | 31,299 | | | AbitibiBowater Inc. | | | 635,370 | | |
| | 592,742 | | | MagIndustries Corp., (2) | | | 138,283 | | |
| | | Total Paper & Forest Products | | | 773,653 | | |
| | | Pharmaceuticals – 2.9% | |
| | 65,000 | | | AstraZeneca PLC, Sponsored ADR, (7) | | | 3,254,550 | | |
| | 7,352 | | | EGIS PLC, (9) | | | 790,356 | | |
| | 171,200 | | | Eli Lilly and Company, (7) | | | 6,425,136 | | |
| | 2,429 | | | Krka | | | 211,345 | | |
| | | Total Pharmaceuticals | | | 10,681,387 | | |
Nuveen Investments
15
JGV
Nuveen Global Value Opportunities Fund (continued)
Portfolio of INVESTMENTS June 30, 2011 (Unaudited)
| Shares | | Description (1) | | Value | |
| | | Real Estate Management & Development – 0.6% | |
| | 572,741 | | | Emaar Propoerties PJSC, (9) | | $ | 473,990 | | |
| | 178,600 | | | KLCC Property Holdings Berhad | | | 198,149 | | |
| | 98,559 | | | Solidere, GDR, 144A, (9) | | | 1,721,826 | | |
| | | Total Real Estate Management & Development | | | 2,393,965 | | |
| | | Road & Rail – 2.1% | |
| | 85,500 | | | East Japan Railway Company, (9) | | | 4,896,652 | | |
| | 80,000 | | | West Japan Railway Company, (9) | | | 3,123,118 | | |
| | | Total Road & Rail | | | 8,019,770 | | |
| | | Software – 0.8% | |
| | 110,000 | | | Microsoft Corporation, (7) | | | 2,860,000 | | |
| | | Textiles, Apparel & Luxury Goods – 0.0% | |
| | 2,506,000 | | | China Hongxing Sports Limited, (4), (8) | | | 117,313 | | |
| | | Tobacco – 0.5% | |
| | 101,155 | | | Eastern Tobacco Co., (9) | | | 1,784,458 | | |
| | | Trading Companies & Distributors – 0.4% | |
| | 91,000 | | | Mitsui & Company Limited, (9) | | | 1,573,401 | | |
| | | Water Utilities – 0.1% | |
| | 3,379 | | | Companhia de Saneamento Basico do Estado de Sao Paulo, ADR | | | 201,625 | | |
| | | Wireless Telecommunication Services – 1.7% | |
| | 10,400 | | | MTN Group Limited, (9) | | | 222,560 | | |
| | 7,115 | | | NII Holdings Inc., Class B, (2) | | | 301,534 | | |
| | 3,739 | | | Philippine Long Distance Telephone Company, ADR | | | 202,056 | | |
| | 12,193,000 | | | SafariCom Limited | | | 546,006 | | |
| | 12,645 | | | SK Telecom Company Limited, ADR | | | 236,462 | | |
| | 700 | | | SK Telecom Company Limited | | | 105,887 | | |
| | 330,795 | | | Turkcell Iletisim Hizmetleri A.S., ADR, (7) | | | 4,482,271 | | |
| | 76,696 | | | Turkcell Iletism Hizmetleri SA, (9) | | | 413,902 | | |
| | | Total Wireless Telecommunication Services | | | 6,510,678 | | |
| | | Total Common Stocks (cost $293,791,728) | | | 297,622,116 | | |
Principal
Amount (000) | | Description (1) | | Coupon | | Maturity | | Ratings (3) | | Value | |
| | | Mortgage-Backed Securities – 2.7% | |
| | | Residentials – 2.7% | |
| $ | 22,748 | | | Fannie Mae Guaranteed REMIC Pass Through Certificates, Series 2011-16, (I/O), (4) | | | 4.000 | % | | 3/25/26 | | AAA | | $ | 1,950,300 | | |
| | 12,745 | | | Fannie Mae Mortgage Interest Strips, Series 345-17, (I/O) | | | 4.500 | % | | 5/01/20 | | AAA | | | 1,226,637 | | |
| | 113 | | | Fannie Mae Mortgage Pool 100195, (4) | | | 3.315 | % | | 8/20/22 | | AAA | | | 113,332 | | |
| | 55 | | | Fannie Mae Mortgage Pool 713939 | | | 2.045 | % | | 4/01/33 | | AAA | | | 57,683 | | |
| | 18 | | | Fannie Mae Mortgage Pool 708743 | | | 2.138 | % | | 6/01/33 | | AAA | | | 18,628 | | |
| | 128 | | | Fannie Mae Mortgage Pool 776486 | | | 2.050 | % | | 3/01/34 | | AAA | | | 134,525 | | |
| | 438 | | | Fannie Mae Mortgage Pool 816594 | | | 2.042 | % | | 2/01/35 | | AAA | | | 457,715 | | |
| | 139 | | | Fannie Mae, Collateralized Mortgage Obligations, Series 2004-75, Class KI, (I/O) | | | 4.500 | % | | 3/25/18 | | AAA | | | 2,718 | | |
| | 657 | | | Fannie Mae, Collateralized Mortgage Obligations, Series 2004-86, Class KI, (I/O) | | | 4.500 | % | | 5/25/19 | | AAA | | | 44,900 | | |
| | 1,083 | | | Federal Home Loan Mortgage Corporation, Collateralized Mortgage Obligation | | | 2.519 | % | | 1/01/33 | | AAA | | | 1,132,502 | | |
| | 47 | | | Federal Home Loan Mortgage Corporation, Collateralized Mortgage Obligation | | | 2.578 | % | | 2/01/33 | | AAA | | | 47,581 | | |
| | 391 | | | Federal Home Loan Mortgage Corporation, Collateralized Mortgage Obligation,
Series 2595, (I/O) | | | 5.000 | % | | 6/15/21 | | AAA | | | 6,417 | | |
| | 128 | | | Federal Home Loan Mortgage Corporation, Mortgage Pool 2640, (I/O) | | | 4.500 | % | | 8/15/17 | | AAA | | | 2,694 | | |
| | 250 | | | Federal Home Loan Mortgage Corporation, Mortgage Pool 2890, Class IA, (I/O) | | | 4.500 | % | | 3/15/18 | | AAA | | | 7,929 | | |
| | 343 | | | Federal Home Loan Mortgage Corporation, Mortgage Pool 2890,, Class KI, (I/O) | | | 4.500 | % | | 2/15/19 | | AAA | | | 23,350 | | |
| | 606 | | | Federal Home Loan Mortgage Corporation, Mortgage Pool, FHR 2906 EI, (I/O) | | | 4.500 | % | | 1/15/19 | | AAA | | | 42,386 | | |
| | 215 | | | Federal Home Loan Mortgage Corporation, Mortgage Pool, Series 2626 JI, (I/O) | | | 4.500 | % | | 5/15/18 | | AAA | | | 22,406 | | |
Nuveen Investments
16
Principal
Amount (000) | | Description (1) | | Coupon | | Maturity | | Ratings (3) | | Value | |
| | | Mortgage-Backed Securities (continued) | |
| $ | 48 | | | Federal Home Loan Mortgage Corporation, Pool 789045 | | | 2.500 | % | | 2/01/32 | | AAA | | $ | 50,185 | | |
| | 5,583 | | | Freddie Mac Multiclass Certificates, Series 3804, (I/O), (4) | | | 3.500 | % | | 2/15/25 | | AAA | | | 676,567 | | |
| | 6,113 | | | Freddie Mac Multiclass Certificates, Series 3855, (4) | | | 3.500 | % | | 1/15/25 | | AAA | | | 701,637 | | |
| | 20,948 | | | Freddie Mac, REMIC, (I/O), (4) | | | 3.500 | % | | 11/15/20 | | AAA | | | 2,223,878 | | |
| | 1,249 | | | GNMA Mortgage Pool 081832 | | | 3.000 | % | | 1/20/37 | | AAA | | | 1,297,138 | | |
| | 74,045 | | | Total Residentials | | | | | | | | | | | | | | | 10,241,108 | | |
| $ | 74,045 | | | Total Mortgage-Backed Securities (cost $11,683,734) | | | | | | | | | | | | | | | 10,241,108 | | |
Principal
Amount (000) | | Description (1) | | Coupon | | Maturity | | Ratings (3) | | Value | |
| | | Convertible Bonds – 7.0% | |
| | | Communications Equipment – 1.7% | |
| $ | 6,250 | | | Lucent Technologies Inc., Series B | | | 2.875 | % | | 6/15/25 | | B1 | | $ | 6,093,750 | | |
| | | Energy Equipment & Services – 0.9% | |
| | 3,350 | | | Bristow Group | | | 3.000 | % | | 6/15/38 | | BB | | | 3,484,000 | | |
| | | Metals & Mining – 2.3% | |
| | 6,635 | | | First Uranium Corporation | | | 4.250 | % | | 6/30/12 | | N/R | | | 5,262,870 | | |
| | 4,480 | | | Gold Reserve, Inc. | | | 5.500 | % | | 6/15/22 | | N/R | | | 3,382,400 | | |
| | 11,115 | | | Total Metals & Mining | | | | | | | | | | | | | | | 8,645,270 | | |
| | | Oil, Gas & Consumable Fuels – 2.1% | |
| | 280 | | | Dana Gas | | | 7.500 | % | | 10/31/12 | | N/R | | | 251,300 | | |
| | 5,303 | | | Delta Petroleum Corporation | | | 3.750 | % | | 5/01/37 | | CCC- | | | 4,706,413 | | |
| | 3,950 | | | USEC Inc. | | | 3.000 | % | | 10/01/14 | | Caa2 | | | 2,834,125 | | |
| | 9,533 | | | Total Oil, Gas & Consumable Fuels | | | | | | | | | | | | | | | 7,791,838 | | |
| $ | 30,248 | | | Total Convertible Bonds (cost $23,745,456) | | | | | | | | | | | | | | | 26,014,858 | | |
Principal
Amount (000) | | Description (1) | | Coupon | | Maturity | | Ratings (3) | | Value | |
| | | Corporate Bonds – 7.8% | |
| | | Construction Materials – 0.7% | |
| $ | 3,650 | | | Cemex C5 Capitol Special Purpose Vehicle Limited, Series 2006, 144A | | | 6.196 | % | | 12/31/11 | | B- | | $ | 2,701,000 | | |
| | | Food Products – 0.5% | |
| | 2,000 | | | Dean Foods Company | | | 7.000 | % | | 6/01/16 | | B2 | | | 1,980,000 | | |
| | | Metals & Mining – 2.2% | |
| | 8,300 | | | MagIndustries Corporation, (4), (8) | | | 11.000 | % | | 12/14/12 | | N/R | | | 8,061,243 | | |
| | | Oil, Gas & Consumable Fuels – 4.4% | |
| | 9,023 | | | Delta Petroleum Corporation | | | 7.000 | % | | 4/01/15 | | CCC- | | | 6,857,480 | | |
| | 4,050 | | | Pertoleos de Venzuela S.A. | | | 4.900 | % | | 10/28/14 | | B+ | | | 3,128,625 | | |
| | 6,450 | | | Pertoleos de Venzuela S.A. | | | 5.000 | % | | 10/28/15 | | B+ | | | 4,450,500 | | |
| | 2,000 | | | Ship Finance International Limited | | | 8.500 | % | | 12/15/13 | | B+ | | | 2,002,500 | | |
| | 21,523 | | | Total Oil, Gas & Consumable Fuels | | | | | | | | | | | | | | | 16,439,105 | | |
| | | Paper & Forest Products – 0.0% | |
| | 2,000 | | | Bowater Inc., (4), (8) | | | 9.500 | % | | 10/15/12 | | | | | | | 100,000 | | |
| $ | 37,473 | | | Total Corporate Bonds (cost $26,238,508) | | | | | | | | | | | | | | | 29,281,348 | | |
Nuveen Investments
17
JGV
Nuveen Global Value Opportunities Fund (continued)
Portfolio of INVESTMENTS June 30, 2011 (Unaudited)
Principal
Amount (000) | | Description (1) | | Coupon | | Maturity | | Ratings (3) | | Value | |
| | | Structured Notes – 1.0% | |
| | | Diversified Financial Services – 1.0% | |
| $ | 3,845 | | | JP Morgan Chase & Company Reverse Exchagenable Notes, Linked to the
Common Stock of Cameco Corporation, (4), (8) | | | 10.900 | % | | 5/18/12 | | N/R | | $ | 3,758,103 | | |
| $ | 3,845 | | | Total Structured Notes (cost $3,845,000) | | | | | | | | | | | | | | | 3,758,103 | | |
Principal
Amount (000) | | Description (1) | | Coupon | | Maturity | | Ratings (3) | | Value | |
| | | Sovereign Debt – 0.8% | |
| | | Argentina – 0.8% | |
| $ | 3,000 | | | Province of Buenos Aires, 144A | | | 10.875 | % | | 1/26/21 | | | B | | | $ | 2,829,000 | | |
| | | | | Total Sovereign Debt (cost $2,868,855) | | | | | | | | | | | | | | | 2,829,000 | | |
| Shares | | Description (1) | | | | | | | | Value | |
| | | Equity Linked Certificates – 0.3% (5) | |
| | | Commercial Banks – 0.1% | |
| | 158,192 | | | HSBC Access Notes, Equity Linked Notes, Underlying Shares of Vietnam
Export Import, 144A | | | | | | | | | | | | $ | 112,316 | | |
| | | Metals & Mining – 0.0% | |
| | 349,467 | | | Gran Colombia Gold Corporation, Warrants, 144A | | | | | | | | | | | | | | | 110,516 | | |
| | | Wireless Telecommunication Services – 0.2% | |
| | 30,060 | | | CLSA Asian Securites Program, Equity Linked Notes, Underlying Shares
Etihad Etisalat Company of Saudi Arabia, 144A | | | | | | | | | | | | | | | 414,494 | | |
| | 34,897 | | | CLSA Asian Securities Program, NATP Warrants, 144A | | | | | | | | | | | | | | | 144,683 | | |
| | 29,000 | | | CLSA Financial Products Limited, Pantaloon Retail Warrants, 144A | | | | | | | | | | | | | | | 235,292 | | |
| | 93,957 | | | Total Wireless Telecommunication Services | | | | | | | | | | | | | | | 794,469 | | |
| | 601,616 | | | Total Equity Linked Certificates (cost $1,143,697) | | | | | | | | | | | 1,017,301 | | |
Principal
Amount (000) | | Description (1) | | | | Coupon | | Maturity | | Value | |
| | | Short-Term Investments – 4.2% | |
| $ | 15,669 | | | Repurchase Agreement with State Street Bank, dated 6/30/11,
repurchase price $15,668,731, collateralized by $15,875,000
U.S. Treasury Bonds, 1.750%, due 5/31/16, valued at $15,983,966 | | | | | 0.010 | % | | 7/01/11 | | $ | 15,668,727 | | |
| | | | | Total Short-Term Investments (cost $15,668,727) | | | | | | | | | | | | | | | 15,668,727 | | |
| | | | | Total Investments (cost $378,985,705) – 103.4% | | | | | | | | | | | | | | | 386,432,561 | | |
| Shares | | Description (1) | | Value | |
| | | Common Stocks Sold Short – (5.8)% | |
| | | Chemicals – (0.5)% | |
| | (24,500 | ) | | Sigma-Aldrich Corporation | | $ | (1,797,810 | ) | |
| | | Computers & Peripherals – (0.2)% | |
| | (2,300 | ) | | Apple, Inc., (2) | | | (772,041 | ) | |
| | | Food Products – (1.0)% | |
| | (40,000 | ) | | Green Mountain Coffee Roasters Inc., (2) | | | (3,570,400 | ) | |
| | | Hotels, Restaurants & Leisure – (1.4)% | |
| | (8,700 | ) | | Chipotle Mexican Grill Inc., (2) | | | (2,681,253 | ) | |
| | (20,700 | ) | | Panera Bread Company, (2) | | | (2,601,162 | ) | |
| | | Total Hotels Restaurants & Leisure | | | (5,282,415 | ) | |
Nuveen Investments
18
| Shares | | Description (1) | | Value | |
| | | Household Products – (0.2)% | |
| | (14,000 | ) | | Reckitt and Benckiser | | $ | (773,249 | ) | |
| | | Internet & Catalog Retail – (0.9)% | |
| | (10,100 | ) | | Amazon.com, Inc., (2) | | | (2,065,349 | ) | |
| | (5,000 | ) | | NetFlix.com Inc., (2) | | | (1,313,450 | ) | |
| | | Total Internet & Catalog Retail | | | (3,378,799 | ) | |
| | | Software – (0.3)% | |
| | (8,300 | ) | | Salesforce.com, Inc., (2) | | | (1,236,534 | ) | |
| | | Specialty Retail – (1.4)% | |
| | (47,000 | ) | | Tiffany & Co. | | | (3,690,440 | ) | |
| | (48,000 | ) | | Urban Outfitters, Inc., (2) | | | (1,351,200 | ) | |
| | | Total Specialty Retail | | | (5,041,640 | ) | |
| | | Total Common Stocks sold Short (proceeds $13,067,323) | | | (21,852,888 | ) | |
| | | Other Assets Less Liabilities – 2.4% (10) | | | 9,112,897 | | |
| | | Net Assets – 100% | | $ | 373,692,570 | | |
Investments in Derivatives
Put Options Purchased outstanding at June 30, 2011:
Number of
Contracts | | Type | | Notional
Amount (6) | | Expiration
Date | | Strike
Price | | Value | |
| | | Put Options Purchased – 0.0% | |
| | 67 | | | Autozone Inc. | | $ | 1,340,000 | | | 1/21/12 | | $ | 200.0 | | | $ | 8,543 | | |
| | 67 | | | Total Put Options Purchased (cost $150,006) | | $ | 1,340,000 | | | | | | | | | | | | 8,543 | | |
Call Options Written outstanding at June 30, 2011:
Number of
Contracts | | Type | | Notional
Amount (6) | | Expiration
Date | | Strike
Price | | Value | |
| | | Call Options Written – (2.3)% | |
| | (1,880 | ) | | Aetna Inc. | | $ | (6,580,000 | ) | | 1/21/12 | | $ | 35.0 | | | $ | (1,884,700 | ) | |
| | (1,035 | ) | | Anglogold Limited | | | (4,657,500 | ) | | 1/21/12 | | | 45.0 | | | | (289,800 | ) | |
| | (130 | ) | | Anglogold Limited | | | (650,000 | ) | | 1/21/12 | | | 50.0 | | | | (18,200 | ) | |
| | (650 | ) | | Astrazeneca PLC | | | (3,250,000 | ) | | 1/21/12 | | | 50.0 | | | | (186,875 | ) | |
| | (1,533 | ) | | Barrick Gold Corporation | | | (7,665,000 | ) | | 1/21/12 | | | 50.0 | | | | (336,494 | ) | |
| | (1,530 | ) | | Cameco Corporation | | | (5,355,000 | ) | | 1/21/12 | | | 35.0 | | | | (76,500 | ) | |
| | (1,230 | ) | | Cameco Corporation | | | (4,920,000 | ) | | 1/21/12 | | | 40.0 | | | | (24,600 | ) | |
| | (410 | ) | | Cameco Corporation | | | (1,845,000 | ) | | 1/21/12 | | | 45.0 | | | | (4,100 | ) | |
| | (850 | ) | | Chesapeake Energy Corporation | | | (2,125,000 | ) | | 1/21/12 | | | 25.0 | | | | (501,500 | ) | |
| | (850 | ) | | Chesapeake Energy Corporation | | | (2,550,000 | ) | | 1/21/12 | | | 30.0 | | | | (236,300 | ) | |
| | (540 | ) | | Electricite de France S.A. | | | (1,836,000 | ) | | 9/17/11 | | | 34.0 | | | | (783 | ) | |
| | (1,712 | ) | | Eli Lilly & Company | | | (5,992,000 | ) | | 1/21/12 | | | 35.0 | | | | (547,840 | ) | |
| | (2,310 | ) | | Exelon Corporation | | | (9,817,500 | ) | | 1/21/12 | | | 42.5 | | | | (485,100 | ) | |
| | (110 | ) | | Gold Fields Limited | | | (165,000 | ) | | 1/21/12 | | | 15.0 | | | | (13,145 | ) | |
| | (1,200 | ) | | Gold Fields Limited | | | (1,920,000 | ) | | 1/21/12 | | | 16.0 | | | | (99,600 | ) | |
| | (2,370 | ) | | Gold Fields Limited | | | (4,147,500 | ) | | 1/21/12 | | | 17.5 | | | | (109,020 | ) | |
| | (2,860 | ) | | Kroger Company | | | (6,435,000 | ) | | 1/21/12 | | | 22.5 | | | | (886,600 | ) | |
| | (894 | ) | | Lockheed Martin Corporation | | | (7,152,000 | ) | | 1/21/12 | | | 80.0 | | | | (420,180 | ) | |
| | (1,100 | ) | | Microsoft Corporation | | | (3,300,000 | ) | | 1/21/12 | | | 30.0 | | | | (37,950 | ) | |
| | (1,125 | ) | | Newmont Mining Corporation | | | (6,468,750 | ) | | 1/21/12 | | | 57.5 | | | | (343,125 | ) | |
| | (540 | ) | | Nexen Inc. | | | (1,404,000 | ) | | 9/17/11 | | | 26.0 | | | | (24,300 | ) | |
| | (945 | ) | | Nippon Telegraph & Telephone Corporation | | | (2,362,500 | ) | | 9/17/11 | | | 25.0 | | | | (44,887 | ) | |
| | (4,020 | ) | | Nokia Corporation | | | (4,020,000 | ) | | 1/21/12 | | | 10.0 | | | | (52,260 | ) | |
| | (2,930 | ) | | Nokia Corporation | | | (3,662,500 | ) | | 1/21/12 | | | 12.5 | | | | (14,650 | ) | |
| | (165 | ) | | Range Resources Corporation | | | (618,750 | ) | | 1/21/12 | | | 37.5 | | | | (311,025 | ) | |
| | (1,215 | ) | | SunCor Energy Inc. | | | (4,860,000 | ) | | 1/21/12 | | | 40.0 | | | | (419,175 | ) | |
| | (12,665 | ) | | Thales SA | | | (35,462,000 | ) | | 3/17/12 | | | 28.0 | | | | (659,345 | ) | |
Nuveen Investments
19
JGV
Nuveen Global Value Opportunities Fund (continued)
Portfolio of INVESTMENTS June 30, 2011 (Unaudited)
Call Options Written outstanding at June 30, 2011 (continued):
Number of
Contracts | | Type | | Notional
Amount (7) | | Expiration
Date | | Strike
Price | | Value | |
| | (775 | ) | | Turkcell Iletisim Hizmet AS | | $ | (1,162,500 | ) | | 7/16/11 | | $ | 15.0 | | | $ | (23,250 | ) | |
| | (775 | ) | | Turkcell Iletisim Hizmet AS | | | (1,356,250 | ) | | 7/16/11 | | | 17.5 | | | | (7,750 | ) | |
| | (1,670 | ) | | Turkcell Iletisim Hizmet AS | | | (2,505,000 | ) | | 10/22/11 | | | 15.0 | | | | (70,975 | ) | |
| | (1,860 | ) | | Tyson Foods Inc. | | | (3,255,000 | ) | | 1/21/12 | | | 17.5 | | | | (530,100 | ) | |
| | (1,093 | ) | | Wal-Mart Stores Inc. | | | (6,284,750 | ) | | 1/21/12 | | | 57.5 | | | | (69,405 | ) | |
| | (1,093 | ) | | Wal-Mart Stores Inc. | | | (6,558,000 | ) | | 1/21/12 | | | 60.0 | | | | (26,232 | ) | |
| | (54,065 | ) | | Total Call Options (cost $9,479,842) | | $ | (160,342,500 | ) | | | | | | | | | | $ | (8,755,766 | ) | |
For Fund portfolio compliance purposes, the Fund's industry classifications refer to any one or more of the industry sub-classifications used by one or more widely recognized market indexes or ratings group indexes, and/or as defined by Fund management. This definition may not apply for purposes of this report, which may combine industry sub-classifications into sectors for reporting ease.
(1) All percentages shown in the Portfolio of Investments are based on net assets.
(2) Non-income producing; issuer has not declared a dividend within the past twelve months.
(3) Ratings: Using the highest of Standard & Poor's Group ("Standard & Poor's"), Moody's Investor Service, Inc. ("Moody's") or Fitch, Inc. ("Fitch") rating. Ratings below BBB by Standard & Poor's, Baa by Moody's or BBB by Fitch are considered to be below investment grade. Holdings designated N/R are not rated by any of these national rating agencies.
(4) For fair value measurement disclosure purposes, investment categorized as Level 3. See Notes to Financial Statements, Footnote 1 — General Information and Significant Accounting Policies, Investment Valuation for more information.
(5) Equity Linked Certificates provide the price appreciation or depreciation of a single stock. These investments are used to gain access to the return characteristics of small amounts of shares in countries with a costly or lengthy registration process, and are similar to ADRs, except that a third party (not the equity issuer) is responsible for paying the stock returns under the note.
(6) For disclosure purposes, Notional Amount is calculated by multiplying the Number of Contracts by the Strike Price by 100.
(7) Investment, or portion of investment, has been pledged as collateral for investments in derivatives.
(8) Investment valued at fair value using methods determined in good faith by, or at the discretion of, the Board of Trustees.
(9) For fair value measurement disclosure purposes, Common Stock categorized as Level 2. See Notes to Financial Statements, Footnote 1 — General Information and Significant Accounting Policies, Investment Valuation for more information.
(10) Other Assets Less Liabilities includes the Value and/or Unrealized Appreciation (Depreciation) of derivative instruments as noted in Investments in Derivatives.
144A Investment is exempt from registration under Rule 144A of the Securities Act of 1933, as amended. These investments may only be resold in transactions exempt from registration, which are normally those transactions with qualified institutional buyers.
ADR American Depositary Receipt.
GDR Global Depositary Receipt.
DD Investment, or portion of investment, purchased on a delayed delivery basis.
I/O Interest only security.
N/R Not rated.
See accompanying notes to financial statements.
Nuveen Investments
20
Statement of
ASSETS & LIABILITIES
June 30, 2011 (Unaudited)
| Assets | |
| Investments, at value (cost $378,985,705) | | $ | 386,432,561 | | |
| Put options purchased, at value (premiums paid $150,006) | | | 8,543 | | |
| Cash denominated in foreign currencies (cost $836,277) | | | 842,045 | | |
| Deposits with brokers | | | 21,535,899 | | |
| Receivables: | |
| Dividends | | | 823,646 | | |
| Interest | | | 1,308,222 | | |
| Investments sold | | | 45,582 | | |
| Paydowns | | | 2,367 | | |
| Other assets | | | 23,847 | | |
| Total assets | | | 411,022,712 | | |
| Liabilities | |
| Securities sold short, at value (proceeds $13,067,323) | | | 21,852,888 | | |
| Call options written, at value (premiums received $9,479,842) | | | 8,755,766 | | |
| Payables: | |
| Dividends | | | 6,054,972 | | |
| Dividends for securities sold short | | | 13,630 | | |
| Investments purchased | | | 197,007 | | |
| Accrued expenses: | |
| Management fees | | | 301,751 | | |
| Other | | | 154,128 | | |
| Total liabilities | | | 37,330,142 | | |
| Net assets | | $ | 373,692,570 | | |
| Shares outstanding | | | 19,184,278 | | |
| Net asset value per share outstanding | | $ | 19.48 | | |
| Net assets consist of: | |
| Shares, $.01 par value per share | | $ | 191,843 | | |
| Paid-in surplus | | | 369,238,148 | | |
| Undistributed (Over-distribution of) net investment income | | | (11,675,590 | ) | |
| Accumulated net realized gain (loss) | | | 16,689,210 | | |
| Net unrealized appreciation (depreciation) | | | (751,041 | ) | |
| Net assets | | $ | 373,692,570 | | |
| Authorized shares | | | Unlimited | | |
See accompanying notes to financial statements.
Nuveen Investments
21
Statement of
OPERATIONS
Six Months Ended June 30, 2011 (Unaudited)
| Investment Income | |
| Dividends (net of foreign tax withheld of $346,016) | | $ | 4,306,789 | | |
| Interest | | | 3,408,410 | | |
| Total investment income | | | 7,715,199 | | |
| Expenses | |
| Management fees | | | 1,886,644 | | |
| Dividend expense on securities sold short | | | 77,037 | | |
| Shareholders' servicing agent fees and expenses | | | 176 | | |
| Custodian's fees and expenses | | | 110,195 | | |
| Trustees' fees and expenses | | | 5,532 | | |
| Professional fees | | | 22,971 | | |
| Shareholders' reports — printing and mailing expenses | | | 62,350 | | |
| Stock exchange listing fees | | | 4,422 | | |
| Investor relations expense | | | 50,920 | | |
| Other expenses | | | 63,461 | | |
| Total expenses before custodian fee credit | | | 2,283,708 | | |
| Custodian fee credit | | | (829 | ) | |
| Net expenses | | | 2,282,879 | | |
| Net investment income (loss) | | | 5,432,320 | | |
| Realized and Unrealized Gain (Loss) | |
| Net realized gain (loss) from: | | | |
| Investments and foreign currency | | | 15,506,949 | | |
| Call options written | | | 9,733,310 | | |
| Securities sold short | | | 40,596 | | |
| Change in net unrealized appreciation (depreciation) of: | | | |
| Investments and foreign currency | | | (35,298,343 | ) | |
| Call options written | | | 6,370,686 | | |
| Put options purchased | | | (27,972 | ) | |
| Securities sold short | | | (4,614,578 | ) | |
| Net realized and unrealized gain (loss) | | | (8,289,352 | ) | |
| Net increase (decrease) in net assets from operations | | $ | (2,857,032 | ) | |
See accompanying notes to financial statements.
Nuveen Investments
22
Statement of
CHANGES in NET ASSETS (Unaudited)
| | | Six Months
Ended
6/30/11 | | Year
Ended
12/31/10 | |
| Operations | |
| Net investment income (loss) | | $ | 5,432,320 | | | $ | 6,892,474 | | |
| Net realized gain (loss) from: | |
| Investments and foreign currency | | | 15,506,949 | | | | 16,763,811 | | |
| Call options written | | | 9,733,310 | | | | 15,476,270 | | |
| Securities sold short | | | 40,596 | | | | (2,280,396 | ) | |
| Change in net unrealized appreciation (depreciation) of: | |
| Investments and foreign currency | | | (35,298,343 | ) | | | 27,296,969 | | |
| Call options written | | | 6,370,686 | | | | (1,172,616 | ) | |
| Put options purchased | | | (27,972 | ) | | | (113,491 | ) | |
| Securities sold short | | | (4,614,578 | ) | | | (2,422,351 | ) | |
| Net increase (decrease) in net assets from operations | | | (2,857,032 | ) | | | 60,440,670 | | |
| Distributions to Shareholders | |
| From and in excess of net investment income | | | (12,949,388 | ) | | | — | | |
| From net investment income | | | — | | | | (23,017,582 | ) | |
| Increase (decrease) in net assets from distributions to shareholders | | | (12,949,388 | ) | | | (23,017,582 | ) | |
| Capital Share Transactions | |
| Net proceeds from shares issued to shareholders due to reinvestment of distributions | | | — | | | | 350,608 | | |
| Shares repurchased and retired | | | — | | | | (96,908 | ) | |
| Net increase (decrease) in net assets from capital share transactions | | | — | | | | 253,700 | | |
| Net increase (decrease) in net assets | | | (15,806,420 | ) | | | 37,676,788 | | |
| Net assets at the beginning of period | | | 389,498,990 | | | | 351,822,202 | | |
| Net assets at the end of period | | $ | 373,692,570 | | | $ | 389,498,990 | | |
| Undistributed (Over-distribution of) net investment income at the end of period | | $ | (11,675,590 | ) | | $ | (4,158,522 | ) | |
See accompanying notes to financial statements.
Nuveen Investments
23
Financial
HIGHLIGHTS (Unaudited)
Selected data for a share outstanding throughout each period:
| | | | |
| | | | | Investment Operations | | Less Distributions | | | | Total Returns | |
| | | Beginning
Net Asset
Value | | Net
Investment
Income
(Loss)(a) | | Net
Realized/
Unrealized
Gain (Loss)(c) | | Total | | Net
Investment
Income | | Capital
Gains | | Return of
Capital | | Total | | Discount
from
Shares
Repurchased
and Retired | | Offering
Costs | | Ending
Net Asset
Value | | Ending
Market
Value | | Based
on
Market
Value(d) | | Based
on
Net
Asset
Value(d) | |
| Year Ended 12/31: | |
| | 2011 | (g) | | $ | 20.30 | | | $ | .28 | | | $ | (.42 | ) | | $ | (0.14 | ) | | $ | (.68 | )*** | | $ | — | | | $ | — | | | $ | (.68 | ) | | $ | — | | | $ | — | | | $ | 19.48 | | | $ | 19.52 | | | | (.52 | )% | | | (.76 | )% | |
| | 2010 | | | | 18.35 | | | | .36 | | | | 2.79 | | | | 3.15 | | | | (1.20 | ) | | | — | | | | — | | | | (1.20 | ) | | | — | * | | | — | | | | 20.30 | | | | 20.30 | | | | 23.32 | | | | 17.75 | | |
| | 2009 | | | | 13.15 | | | | .43 | | | | 5.88 | | | | 6.31 | | | | (.92 | ) | | | (.19 | ) | | | — | | | | (1.11 | ) | | | — | * | | | — | | | | 18.35 | | | | 17.53 | | | | 58.96 | | | | 48.93 | | |
| | 2008 | | | | 19.85 | | | | .46 | | | | (5.27 | ) | | | (4.81 | ) | | | (.43 | ) | | | (1.47 | ) | | | — | | | | (1.90 | ) | | | .01 | | | | — | | | | 13.15 | | | | 11.89 | | | | (26.03 | ) | | | (24.85 | ) | |
| | 2007 | | | | 20.41 | | | | .52 | | | | .89 | | | | 1.41 | | | | (.38 | ) | | | (1.59 | ) | | | — | | | | (1.97 | ) | | | — | | | | — | | | | 19.85 | | | | 18.30 | | | | 2.94 | | | | 6.48 | | |
| | 2006 | (b) | | | 19.10 | | | | .16 | | | | 1.64 | | | | 1.80 | | | | (.26 | ) | | | (.15 | ) | | | (.04 | ) | | | (.45 | ) | | | — | | | | (.04 | ) | | | 20.41 | | | | 19.70 | | | | .82 | | | | 9.27 | | |
(a) Per share Net Investment Income (Loss) is calculated using the average daily shares method.
(b) For the period July 24, 2006 (commencement of operations) through December 31, 2006.
(c) Net of federal corporate income taxes on long-term capital gains retained by the Fund per share as follows:
| | | Long-Term
Capital Gains
Retained | |
| Year Ended 12/31: | | | |
| | 2011 | (g) | | | N/A | | |
| | 2010 | | | | N/A | | |
| | 2009 | | | | N/A | | |
| | 2008 | | | | N/A | | |
| | 2007 | | | $ | 0.19 | | |
| | 2006 | (b) | | | N/A | | |
Nuveen Investments
24
| | | Ratios/Supplemental Data | |
| | | | | Ratios to Average Net Assets(e)(f) | | | |
| | | Ending Net
Assets (000) | | Expenses | | Net
Investment
Income | | Portfolio
Turnover
Rate | |
| Year Ended 12/31: | |
| | 2011 | (g) | | $ | 373,693 | | | | 1.19 | %** | | | 2.82 | %** | | | 79 | % | |
| | 2010 | | | | 389,499 | | | | 1.15 | % | | | 1.90 | % | | | 76 | | |
| | 2009 | | | | 351,822 | | | | 1.16 | | | | 2.70 | | | | 38 | | |
| | 2008 | | | | 252,695 | | | | 1.14 | | | | 2.63 | | | | 60 | | |
| | 2007 | | | | 384,149 | | | | 1.10 | | | | 2.51 | | | | 76 | | |
| | 2006 | (b) | | | 395,078 | | | | 1.12 | ** | | | 1.87 | ** | | | 17 | | |
(d) Total Return Based on Market Value is the combination of changes in the market price per share and the effect of reinvested dividend income and reinvested capital gains distributions, if any, at the average price paid per share at the time of reinvestment. The last dividend declared in the period, which is typically paid on the first business day of the following month, is assumed to be reinvested at the ending market price. The actual reinvestment for the last dividend declared in the period takes place over several days, and in some instances may not be based on the market price, so the actual reinvestment price may be different from the price used in the calculation. Total returns are not annualized.
Total Return Based on Net Asset Value is the combination of changes in net asset value, reinvested dividend income at net asset value and reinvested capital gains distributions at net asset value, if any. The last dividend declared in the period, which is typically paid on the first business day of the following month, is assumed to be reinvested at the ending net asset value. The actual reinvest price for the last dividend declared in the period may often be based on the Fund's market price (and not its net asset value), and therefore may be different from the price used in the calculation. Total returns are not annualized.
The Fund elected to retain a portion of its realized long-term capital gains for the following tax years ended December 31, (which is the fiscal year end for the Fund) and pay required federal corporate income taxes on these amounts. As reported on Form 2439, shareholders on record date must include their pro-rata share of these gains on their applicable federal tax returns, and are entitled to take offsetting tax credits, for their pro-rata share of the taxes paid by the Fund. The standardized total returns shown above do not include the economic benefit to shareholders on record date of these tax credits/refunds. The Fund's corresponding Total Returns Based on Market Value and Net Asset Value when these benefits are included are as follows:
| | | | | Total Returns | |
| | | Shareholders of
Record on | | Based on
Market Value | | Based on
Net Asset
Value | |
| Year Ended 12/31: | |
| 2011(g) | | | N/A | | | | (.52 | )% | | | (.76 | )% | |
| 2010 | | | N/A | | | | 23.32 | | | | 17.75 | | |
| 2009 | | | N/A | | | | 58.96 | | | | 48.93 | | |
| 2008 | | | N/A | | | | (26.03 | ) | | | (24.85 | ) | |
| 2007 | | | December 31 | | | | 3.99 | | | | 7.49 | | |
| 2006(b) | | | N/A | | | | .82 | | | | 9.27 | | |
(e) Each ratio includes the effect of dividend expense on securities sold short as follows:
| | | Ratios of Dividend Expense on
Securities Sold Short to Average Net Assets | |
| Year Ended 12/31: | |
| | 2011 | (g) | | | .04 | %** | |
| | 2010 | | | | .02 | | |
| | 2009 | | | | .02 | | |
| | 2008 | | | | .03 | | |
| | 2007 | | | | .03 | | |
| | 2006 | (b) | | | .02 | ** | |
(f) Ratios do not reflect the effect of custodian fee credits earned on the Fund's net cash on deposit with the custodian bank, where applicable.
(g) For the six months ended June 30, 2011.
N/A Not applicable for the six months ended June 30, 2011. The Fund had no retained capital gains for the tax years ended December 31, 2010 through December 31, 2008, or for the period July 24, 2006 (commencement of operations) through December 31, 2006.
* Rounds to less than $.01 per share.
** Annualized.
*** Represents distributions paid "From and in excess of net investment income" for the six months ended June 30, 2011.
See accompanying notes to financial statements.
Nuveen Investments
25
Notes to
FINANCIAL STATEMENTS (Unaudited)
1. General Information and Significant Accounting Policies
General Information
Nuveen Global Value Opportunities Fund (the "Fund") is a closed-end registered investment company registered under the Investment Company Act of 1940, as amended. The Fund's shares are listed on the New York Stock Exchange ("NYSE") and trade under the ticker symbol "JGV." The Fund was organized as a Massachusetts business trust on May 17, 2006.
Effective January 1, 2011, Nuveen Asset Management, a wholly-owned subsidiary of Nuveen Investments, Inc. ("Nuveen") has changed its name to Nuveen Fund Advisors, Inc. (the "Adviser").
The Fund seeks a high level of total return by investing primarily in a diversified global portfolio of value equity securities, as well as corporate and governmental debt securities and by opportunistically using leverage, primarily via writing (sell) call options and shorting a small position in equities.
Significant Accounting Policies
The following is a summary of significant accounting policies followed by the Fund in the preparation of its financial statements in accordance with accounting principles generally accepted in the United States ("U.S. GAAP").
Investment Valuation
Common stocks and other equity-type securities are valued at the last sales price on the securities exchange on which such securities are primarily traded and are generally classified as Level 1 for fair value measurement purposes. Securities primarily traded on the NASDAQ National Market ("NASDAQ") are valued, except as indicated below, at the NASDAQ Official Closing Price and are generally classified as Level 1. However, securities traded on a securities exchange or NASDAQ for which there were no transactions on a given day or securities not listed on a securities exchange or NASDAQ are valued at the quoted bid price. Prices of certain American Depository Receipts ("ADR") held by the Fund that trade in the United States are valued based on the last traded price, official closing price, or the most recent bid price of the underlying non-U.S.-traded stock, adjusted as appropriate for the underlying-to-ADR conversion ratio and foreign exchange rate, and from time-to-time foreign currencies may also be adjusted further to take into account material events that may take place after the close of the local non-U.S. market but before the close of the NYSE. These securities generally represent a transfer from a Level 1 to a Level 2 security.
Prices of fixed-income securities are provided by a pricing service approved by the Fund's Board of Trustees. These securities are generally classified as Level 2. When price quotes are not readily available, the pricing service establishes a security's fair value using methods that may include consideration of the following: yields or prices of investments of comparable quality, type of issue, coupon, maturity and rating, market quotes or indications of value from security dealers, evaluations of anticipated cash flows or collateral, general market conditions and other information and analysis, including the obligor's credit characteristics considered relevant. In pricing certain securities, particularly less liquid and lower quality securities, the pricing service may consider information about a security, its issuer, or market activity provided by the Adviser. These securities are generally classified as Level 2 or Level 3 depending on the priority of the significant inputs.
The value of exchange-traded options are based on the mean of the closing bid and ask prices. Exchange-traded options are generally classified as Level 1. Options traded in the over-the-counter market are valued using an evaluated mean price and are generally classified as Level 2.
Repurchase agreements are valued at contract amount plus interest, which approximates market value. These securities are generally classified as Level 2.
Certain securities may not be able to be priced by the pre-established pricing methods as described above. Such securities may be valued by the Fund's Board of Trustees or its designee at fair value. These securities generally include, but are not limited to, restricted securities (securities which may not be publicly sold without registration under the Securities Act of 1933, as amended) for which a pricing service is unable to provide a market price; securities whose trading has been formally suspended; debt securities that have
Nuveen Investments
26
gone into default and for which there is no current market quotation; a security whose market price is not available from a pre-established pricing source; a security with respect to which an event has occurred that is likely to materially affect the value of the security after the market has closed but before the calculation of a Fund's net asset value (as may be the case in non-U.S. markets on which the security is primarily traded) or make it difficult or impossible to obtain a reliable market quotation; and a security whose price, as provided by the pricing service, is not deemed to reflect the security's fair value. As a general principle, the fair value of security would appear to be the amount that the owner might reasonably expect to receive for them in a current sale. A variety of factors may be considered in determining the fair value of such securities, which may include consideration of the following: yields or prices of investments of comparable quality, type of issue, coupon, maturity and rating, market quotes or indications of value from security dealers, evaluations of anticipated cash flows or collateral, general market conditions and other information and analysis, including the obligor's credit characteristics considered relevant. These securities are classified as Level 2 or Level 3 depending on the priority of the significant inputs. Regardless of the method employed to value a particular security, all valuations are subject to review by the Fund's Board of Trustees or its designee.
Refer to Footnote 2—Fair Value Measurements for further details on the leveling of securities held by the Fund as of the end of the reporting period.
Investment Transactions
Investment transactions are recorded on a trade date basis. Realized gains and losses from investment transactions are determined on the specific identification method, which is the same basis used for federal income tax purposes. Investments purchased on a when-issued/delayed delivery basis may have extended settlement periods. Any investments so purchased are subject to market fluctuation during this period. The Fund has instructed the custodian to segregate assets with a current value at least equal to the amount of the when-issued/delayed delivery purchase commitments. At June 30, 2011, the Fund had outstanding when-issued/delayed delivery purchase commitments of $72,358.
Investment Income
Dividend income on investments purchased and dividend expense on securities sold short are recorded on the ex-dividend date or, for foreign securities, when information is available. Interest income, which reflects the amortization of premiums and accretion of discounts for financial reporting purposes, is recorded on an accrual basis. Interest income also reflects paydown gains and losses, if any.
Income Taxes
The Fund intends to distribute substantially all of its investment company taxable income to shareholders and to otherwise comply with the requirements of Subchapter M of the Internal Revenue Code applicable to regulated investment companies. In any year when the Fund realizes net capital gains, the Fund may choose to distribute all or a portion of its net capital gains to shareholders, or alternatively, to retain all or a portion of its net capital gains and pay federal corporate income taxes on such retained gains.
For all open tax years and all major taxing jurisdictions, management of the Fund has concluded that there are no significant uncertain tax positions that would require recognition in the financial statements. Open tax years are those that are open for examination by taxing authorities (i.e., generally the last four tax year ends and the interim tax period since then). Furthermore, management of the Fund is also not aware of any tax positions for which it is reasonably possible that the total amounts of unrecognized tax benefits will significantly change in the next twelve months.
Dividends and Distributions to Shareholders
Distributions to shareholders are recorded on the ex-dividend date. The amount and timing of distributions are determined in accordance with federal corporate income tax regulations, which may differ from U.S. GAAP.
The Fund makes quarterly cash distributions to shareholders of a stated dollar amount per share. Subject to approval and oversight by the Fund's Board of Trustees, the Fund seeks to maintain a stable distribution level designed to deliver the long-term return potential of the Fund's investment strategy through regular quarterly distributions (a "Managed Distribution Program"). Total distributions during a calendar year generally will be made from the Fund's net investment income, net realized capital gains and net unrealized capital gains in the Fund's portfolio, if any. The portion of distributions paid attributed to net unrealized gains, if any, is distributed from the Fund's assets and is treated by shareholders as a non-taxable distribution ("Return of Capital") for tax purposes. In the event that total distributions during a calendar year exceed the Fund's total return on net asset value, the difference will reduce net asset value per share. If the Fund's total return on net asset value exceeds total distributions during a calendar year, the excess will be reflected as an increase in net asset value per share. The final determination of the source and character of all distributions for the fiscal year are made after the end of the fiscal year and are reflected in the financial statements contained in the annual report as of December 31 each year.
The actual character of distributions made by the Fund during the fiscal year ended December 31, 2010, is reflected in the accompanying financial statements.
The distributions made by the Fund during the six months ended June 30, 2011, are provisionally classified as being "From and in excess of net investment income," and those distributions will be classified as being from net investment income, net realized capital
Nuveen Investments
27
Notes to
FINANCIAL STATEMENTS (Unaudited) (continued)
gains and/or a return of capital for tax purposes after the fiscal year end. For purposes of calculating "Undistributed (Over-distribution of) net investment income" as of June 30, 2011, the distribution amounts provisionally classified as "From and in excess of net investment income" were treated as being entirely from net investment income. Consequently, the financial statements at June 30, 2011, reflect an over-distribution of net investment income.
Foreign Currency Transactions
The Fund is authorized to engage in foreign currency exchange transactions, including foreign currency forwards, futures, options and swap contracts. To the extent that the Fund invests in securities and/or contracts that are denominated in a currency other than U.S. dollars, the Fund will be subject to currency risk, which is the risk that an increase in the U.S. dollar relative to the foreign currency will reduce returns or portfolio value. Generally, when the U.S. dollar rises in value against a foreign currency, the Fund's investments denominated in that currency will lose value because its currency is worth fewer U.S. dollars; the opposite effect occurs if the U.S. dollar falls in relative value. Investments and other assets and liabilities denominated in foreign currencies are converted into U.S. dollars on a spot (i.e. cash) basis at the spot rate prevailing in the foreign currency exchange market at the time of valuation. Purchases and sales of investments and income denominated in foreign currencies are translated into U.S. dollars on the respective dates of such transactions.
The books and records of the Fund are maintained in U.S. dollars. Foreign currencies, investments and other assets and liabilities are translated into U.S. dollars at 4:00 p.m. Eastern Time. Investments, income and expenses are translated on the respective dates of such transactions. Net realized foreign currency gains and losses resulting from changes in exchange rates include foreign currency gains and losses between trade date and settlement date of the transactions, foreign currency transactions, and the difference between the amounts of interest and dividends recorded on the books of the Fund and the amounts actually received.
The realized gains and losses resulting from changes in foreign currency exchange rates and changes in foreign exchange rates associated with other assets and liabilities on investments and securities sold short are recognized as a component of "Net realized gain (loss) from investments and foreign currency," where applicable.
The unrealized gains and losses resulting from changes in foreign currency exchange rates and changes in foreign exchange rates associated with other assets and liabilities on investments are recognized as a component of "Change in net unrealized appreciation/(depreciation) from investments and foreign currency," when applicable. The unrealized appreciation/(depreciation) resulting from changes in foreign exchange rates associated with call options written are recognized as a component of "Change in net appreciation/(depreciation) of call options written," when applicable. The unrealized gains and losses resulting from changes in foreign exchange rates associated with put options purchased are recognized as a component of "Change in net unrealized appreciation/(depreciation) of put options purchased," when applicable. The unrealized appreciation/(depreciation) resulting from changes in foreign exchange rates associated with securities sold short are recognized as a component of "Change in net unrealized appreciation/(depreciation) of securities sold short," where applicable.
Options Transactions
The Fund is subject to equity price risk in the normal course of pursuing its investment objectives and is authorized to purchase and write (sell) call and put options, in an attempt to manage such risk. The purchase of put options involves the risk of loss of all or a part of the cash paid for the options (the premium). The market risk associated with purchasing put options is limited to the premium paid. The counterparty credit risk of purchasing options, however, needs also to take into account the current value of the option, as this is the performance expected from the counterparty. When the Fund purchases an option, an amount equal to the premium paid (the premium plus commission) is recognized as a component of "Call and/or Put options purchased, at value" on the Statement of Assets and Liabilities. When the Fund writes an option, an amount equal to the net premium received (the premium less commission) is recognized as a component of "Call and/or Put options written, at value" on the Statement of Assets and Liabilities and is subsequently adjusted to reflect the current value of the written option until the option is exercised or expires or the Fund enters into a closing purchase transaction. The changes in the value of options purchased during the fiscal period are recognized as a component of "Change in net unrealized appreciation (depreciation) of call and/or put options purchased" on the Statement of Operations. The changes in the value of options written during the fiscal period are recognized as a component of "Change in net
Nuveen Investments
28
unrealized appreciation (depreciation) of call and/or put options written" on the Statement of Operations. When an option is exercised or expires or a Fund enters into a closing purchase transaction, the difference between the net premium received and any amount paid at expiration or on executing a closing purchase transaction, including commission, is recognized as a component of "Net realized gain (loss) from call/put options purchased and/or written '" on the Statement of Operations. The Fund, as a writer of an option, has no control over whether the underlying instrument may be sold (called) or purchased (put) and as a result bears the risk of an unfavorable change in the market value of the instrument underlying the written option. There is also the risk the Fund may not be able to enter into a closing transaction because of an illiquid market.
During six months ended June 30, 2011, the Fund wrote covered call options on individual stocks held in its portfolio to enhance returns while foregoing some upside potential, and bought put options on a single stock to benefit in the event its price declines.
The Fund did not purchase call options or write put options during the six months ended June 30, 2011. The average notional amounts of put options purchased and call options written during the six months ended June 30, 2011, were as follows:
| Average notional amount of put options purchased* | | $ | 1,340,000 | | |
| Average notional amount of call options written* | | | (148,497,483 | ) | |
* The average notional amount is calculated based on the outstanding balance at the beginning of the fiscal year and at the end of each fiscal quarter within the current fiscal year.
Refer to Footnote 3—Derivative Instruments and Hedging Activities and Footnote 5—Investment Transactions for further details on options activity.
Short Sales
The Fund is authorized to make short sales of securities. To secure its obligation to deliver securities sold short, the Fund has instructed the custodian to segregate assets of the Fund as collateral with an equivalent amount of the securities sold short. The collateral required is determined by reference to the market value of the short positions. The Fund is obligated to pay to the party to which the securities were sold short, dividends declared on the stock by the issuer and recognizes such amounts as "Dividend expense on securities sold short" on the Statement of Operations. Short sales are valued daily and the corresponding unrealized gains or losses are recognized as "Change in net unrealized appreciation (depreciation) of securities sold short" on the Statement of Operations.
Liabilities for securities sold short are reported at market value in the accompanying financial statements. Short sale transactions result in off-balance sheet risk because the ultimate obligation may exceed the related amounts shown on the Statement of Assets and Liabilities. The Fund will incur a loss if the price of the security increases between the date of the short sale and the date on which the Fund replaces the borrowed security. The Fund's loss on a short sale is potentially unlimited because there is no upward limit on the price a borrowed security could attain. The Fund will realize a gain if the price of the security declines between those dates. Gains and losses from securities sold short are recognized as of "Net realized gain (loss) from securities sold short" on the Statement of Operations.
Market and Counterparty Credit Risk
In the normal course of business the Fund may invest in financial instruments and enters into financial transactions where risk of potential loss exists due to changes in the market (market risk) or failure of the other party to the transaction to perform (counterparty credit risk). The potential loss could exceed the value of the financial assets recorded on the financial statements. Financial assets, which potentially expose the Fund to counterparty credit risk, consist principally of cash due from counterparties on forward, option and swap transactions, when applicable. The extent of the Fund's exposure to counterparty credit risk in respect to these financial assets approximates their carrying value as recorded on the Statement of Assets and Liabilities. Futures contracts, when applicable, expose the Fund to minimal counterparty credit risk as they are exchange traded and the exchange's clearing house, which is counterparty to all exchange traded futures, guarantees the futures contracts against default.
The Fund helps manage counterparty credit risk by entering into agreements only with counterparties the Adviser, believes have the financial resources to honor their obligations and by having the Adviser monitor the financial stability of the counterparties. Additionally, counterparties may be required to pledge collateral daily (based on the daily valuation of the financial asset) on behalf of the Fund with a value approximately equal to the amount of any unrealized gain above a pre-determined threshold. Reciprocally, when the Fund has an unrealized loss, the Fund has instructed the custodian to pledge assets of the Fund as collateral with a value approximately equal to the amount of the unrealized loss above a pre-determined threshold. Collateral pledges are monitored and subsequently adjusted if and when the valuations fluctuate, either up or down, by at least the pre-determined threshold amount.
Repurchase Agreements
In connection with transactions in repurchase agreements, it is the Fund's policy that its custodian take possession of the underlying collateral securities, the fair value of which exceeds the principal amount of the repurchase transaction, including accrued interest, at all times. If the counterparty defaults, and the fair value of the collateral declines, realization of the collateral may be delayed or limited.
Nuveen Investments
29
Notes to
FINANCIAL STATEMENTS (Unaudited) (continued)
Zero Coupon Securities
The Fund is authorized to invest in zero coupon securities. A zero coupon security does not pay a regular interest coupon to its holders during the life of the security. Tax-exempt income to the holder of the security comes from accretion of the difference between the original purchase price of the security at issuance and the par value of the security at maturity and is effectively paid at maturity. The market prices of zero coupon securities generally are more volatile than the market prices of securities that pay interest periodically.
Custodian Fee Credit
The Fund has an arrangement with the custodian bank whereby certain custodian fees and expenses are reduced by net credits earned on the Fund's cash on deposit with the bank. Such deposit arrangements are an alternative to overnight investments. Credits for cash balances may be offset by charges for any days on which the Fund overdraws its account at the custodian bank.
Indemnifications
Under the Fund's organizational documents, its officers and trustees are indemnified against certain liabilities arising out of the performance of their duties to the Fund. In addition, in the normal course of business, the Fund enters into contracts that provide general indemnifications to other parties. The Fund's maximum exposure under these arrangements is unknown as this would involve future claims that may be made against the Fund that have not yet occurred. However, the Fund has not had prior claims or losses pursuant to these contracts and expects the risk of loss to be remote.
Use of Estimates
The preparation of financial statements in conformity with U.S. GAAP requires management to make estimates and assumptions that affect the reported amounts of assets and liabilities at the date of the financial statements and the reported amounts of increases and decreases in net assets from operations during the reporting period. Actual results may differ from those estimates.
2. Fair Value Measurements
Fair value is defined as the price that the Fund would receive upon selling an investment or transferring a liability in an orderly transaction to an independent buyer in the principal or most advantageous market for the investment. A three-tier hierarchy is used to maximize the use of observable market data and minimize the use of unobservable inputs and to establish classification of fair value measurements for disclosure purposes. Observable inputs reflect the assumptions market participants would use in pricing the asset or liability. Observable inputs are based on market data obtained from sources independent of the reporting entity. Unobservable inputs reflect the reporting entity's own assumptions about the assumptions market participants would use in pricing the asset or liability. Unobservable inputs are based on the best information available in the circumstances. The three-tier hierarchy of inputs is summarized in the three broad levels listed below:
Level 1 — Quoted prices in active markets for identical securities.
Level 2 — Other significant observable inputs (including quoted prices for similar securities, interest rates, prepayment speeds, credit risk, etc.).
Level 3 — Significant unobservable inputs (including management's assumptions in determining the fair value of investments).
Nuveen Investments
30
The inputs or methodologies used for valuing securities are not an indication of the risk associated with investing in those securities. The following is a summary of the Fund's fair value measurements as of June 30, 2011:
| | | Level 1 | | Level 2 | | Level 3 | | Total | |
| Investments: | |
| Common Stocks* | | $ | 197,485,935 | | | $ | 100,018,868 | | | $ | 117,313 | | | $ | 297,622,116 | | |
| Mortgage-Backed Securities | | | — | | | | 4,575,394 | | | | 5,665,714 | | | | 10,241,108 | | |
| Convertible Bonds | | | — | | | | 26,014,858 | | | | — | | | | 26,014,858 | | |
| Corporate Bonds | | | — | | | | 21,120,105 | | | | 8,161,243 | | | | 29,281,348 | | |
| Structured Notes | | | — | | | | — | | | | 3,758,103 | | | | 3,758,103 | | |
| Sovereign Debt | | | — | | | | 2,829,000 | | | | — | | | | 2,829,000 | | |
| Equity LInked Certificates | | | 110,516 | | | | 906,785 | | | | — | | | | 1,017,301 | | |
| Short-Term Investments | | | — | | | | 15,668,727 | | | | — | | | | 15,668,727 | | |
| Common Stocks Sold Short | | | (21,852,888 | ) | | | — | | | | — | | | | (21,852,888 | ) | |
| Derivatives: | |
| Put Options Purchased | | | 8,543 | | | | — | | | | — | | | | 8,543 | | |
| Call Options Written | | | (8,755,766 | ) | | | — | | | | — | | | | (8,755,766 | ) | |
| Total | | $ | 166,996,340 | | | $ | 171,133,737 | | | $ | 17,702,373 | | | $ | 355,832,450 | | |
* Refer to the Fund's Portfolio of Investments for industry breakdown of Common Stocks classified as Level 2.
The following is a reconciliation of the Fund's Level 3 investments held at the beginning and end of the measurement period:
| | | Level 3
Common
Stocks | | Level 3
Mortgage-Backed
Securities | | Level 3
Corporate
Bonds | | Level 3
Structured Notes | | Level 3
Total | |
| Balance at the beginning of period | | $ | — | | | $ | 134,827 | | | $ | 8,205,039 | | | $ | — | | | $ | 8,339,866 | | |
| Gains (losses): | |
| Net realized gains (losses) | | | — | | | | (306,938 | ) | | | — | | | | — | | | | (306,938 | ) | |
| Net change in unrealized appreciation (depreciation) | | | — | | | | (590,644 | ) | | | (112,034 | ) | | | (86,897 | ) | | | (789,575 | ) | |
| Purchases at cost | | | — | | | | 6,447,647 | | | | — | | | | 3,845,000 | | | | 10,292,647 | | |
| Sales at proceeds | | | — | | | | (20,287 | ) | | | — | | | | — | | | | (20,287 | ) | |
| Net discounts (premiums) | | | — | | | | 1,109 | | | | 68,238 | | | | — | | | | 69,347 | | |
| Transfers in to | | | 117,313 | | | | — | | | | — | | | | — | | | | 117,313 | | |
| Transfers out of | | | — | | | | — | | | | — | | | | — | | | | — | | |
| Balance at the end of period | | $ | 117,313 | | | $ | 5,665,714 | | | $ | 8,161,243 | | | $ | 3,758,103 | | | $ | 17,702,373 | | |
Change in net unrealized appreciation (depreciation) during
the period of Level 3 securities held as of June 30, 2011 | | $ | 134,058 | | | $ | (590,644 | ) | | $ | (112,034 | ) | | $ | (86,897 | ) | | $ | (655,517 | ) | |
The table below presents the transfers in and out of the three valuation levels for the Fund as of the end of the reporting period when compared to the valuation levels at the end of the previous fiscal year. Changes in the leveling of investments are primarily due to changes in the leveling methodologies, changes in the observability of inputs or changes in the pricing source used by the Fund.
| Level 1 | | Level 2 | | Level 3 | |
| Transfers In | | (Transfers Out) | | Transfers In | | (Transfers Out) | | Transfers In | | (Transfers Out) | |
| $ | — | | | $ | (72,317,130 | ) | | $ | 72,199,817 | | | $ | — | | | $ | 117,313 | | | $ | — | | |
3. Derivative Instruments and Hedging Activities
The Fund records derivative instruments at fair value, with changes in fair value recognized on the Statement of Operations, when applicable. Even though the Fund's investments in derivatives may represent economic hedges, they are not considered to be hedge transactions for financial reporting purposes. For additional information on the derivative instruments in which the Fund was invested during and at the end of the reporting period, refer to the Portfolio of Investments, Financial Statements and Footnote 1—General Information and Significant Accounting Policies.
The following table presents the fair value of all derivative instruments held by the Fund as of June 30, 2011, the location of these instruments on the Statement of Assets and Liabilities, and the primary underlying risk exposure.
| | | | | Location on the Statement of Assets and Liabilities | |
| Underlying | | Derivative | | Asset Derivatives | | Liability Derivatives | |
| Risk Exposure | | Instrument | | Location | | Value | | Location | | Value | |
| Equity Price | | Options | | Put options purchased, at value | | $ | 8,543 | | | Call options written, at value | | $ | 8,755,766 | | |
Nuveen Investments
31
Notes to
FINANCIAL STATEMENTS (Unaudited) (continued)
The following tables present the amount of net realized gain (loss) and change in net unrealized appreciation (depreciation) recognized for the six months ended June 30, 2011, on derivative instruments, as well as the primary risk exposure associated with each.
| Net Realized Gain (Loss) from Call Options Written | |
| Risk Exposure | |
| Equity Price | | $ | 9,733,310 | | |
| Change in Net Unrealized Appreciation (Depreciation) of Call Options Written | |
| Risk Exposure | |
| Equity Price | | $ | 6,370,686 | | |
| Change in Net Unrealized Appreciation (Depreciation) of Put Options Purchased | |
| Risk Exposure | |
| Equity Price | | $ | (27,972 | ) | |
4. Fund Shares
Transactions in shares were as follows:
| | | Six
Months
Ended
6/30/11 | | Year
Ended
12/31/10 | |
| Shares issued to shareholders due to reinvestment of distributions | | | — | | | | 18,138 | | |
| Shares repurchased and retired | | | — | | | | (6,300 | ) | |
| Weighted average: | |
| Price per share repurchased and retired | | $ | — | | | $ | 15.25 | | |
| Discount per share repurchased and retired | | | — | | | | 19.28 | % | |
5. Investment Transactions
Purchases and sales (including maturities and proceeds from securities sold short but excluding short-term investments and derivative transactions) during the six months ended June 30, 2011, aggregated $229,066,808 and $213,036,834, respectively.
Transactions in call options written during the six months ended June 30, 2011, were as follows:
| | | Number of
Contracts | | Premiums
Received | |
| Outstanding, beginning of period | | | 59,490 | | | $ | 13,106,998 | | |
| Call options written | | | 56,323 | | | | 9,830,571 | | |
| Call options terminated in closing purchase transactions | | | (11,959 | ) | | | (2,306,023 | ) | |
| Call options expired | | | (8,171 | ) | | | (870,079 | ) | |
| Call options exercised | | | (41,618 | ) | | | (10,281,625 | ) | |
| Outstanding, end of the period | | | 54,065 | | | $ | 9,479,842 | | |
6. Income Tax Information
The following information is presented on an income tax basis. Differences between amounts for financial statement and federal income tax purposes are primarily due to the recognition of unrealized gain for tax (mark-to-market) on passive foreign investment companies ("PFIC"), the treatment of paydown gains and losses, recognition of premium amortization and timing differences in recognizing certain gains and losses on investment transactions. To the extent that differences arise that are permanent in nature,
Nuveen Investments
32
such amounts are reclassified within the capital accounts as detailed below. Temporary differences do not require reclassification. Temporary and permanent differences do not impact the net asset value of the Fund.
At June 30, 2011, the cost and unrealized appreciation (depreciation) of investments (excluding common stocks sold short and investments in derivatives), as determined on a federal income tax basis, were as follows:
| Cost of investments | | $ | 384,110,650 | | |
| Gross unrealized: | |
| Appreciation | | $ | 28,372,353 | | |
| Depreciation | | | (26,050,442 | ) | |
| Net unrealized appreciation (depreciation) of investments | | $ | 2,321,911 | | |
Permanent differences, primarily due to tax basis earnings and profits adjustments, foreign currency reclassifications, complex securities character adjustments, investments in PFICs, investments in interest-only mortgage backed securities, paydown adjustments and bond premium amortization adjustments, resulted in reclassifications among the Fund's components of net assets at December 31, 2010, the Fund's last tax year-end as follows:
| Paid-in surplus | | $ | (3,997,531 | ) | |
| Undistributed (Over-distribution of) net investment income | | | 20,672,225 | | |
| Accumulated net realized gain (loss) | | | (16,674,694 | ) | |
The tax components of undistributed net ordinary income and net long-term capital gains at December 31, 2010, the Fund's last tax year end, were as follows:
| Undistributed net ordinary income | | $ | — | | |
| Undistributed net long-term capital gains | | | — | | |
The tax character of distributions paid during the Fund's last tax year ended December 31, 2010 was designated for purposes of the dividends paid deduction as follows:
| Distributions from net ordinary income * | | $ | 23,017,582 | | |
| Distributions from net long-term capital gains | | | — | | |
* Net ordinary income consists of net taxable income derived from dividends and interest, and current year earnings and profits attributable to realized gains.
At December 31, 2010, the Fund's last tax year end, the Fund had unused capital loss carryforwards of $7,135,188 available for federal income tax purposes to be applied against future capital gains, if any. If not applied, the carryforward will expire on December 31, 2017.
During the last tax year ended December 31, 2010, the Fund utilized $7,464,010 of its capital loss carryforward.
The Fund elected to defer net realized losses from investments incurred from November 1, 2010 through December 31, 2010, the Fund's last tax year end, ("post-October losses") in accordance with federal income tax regulations. The following post-October losses are treated as having arisen on the first day of the current fiscal year:
| Post-October PFIC losses | | $ | 19,973 | | |
| Post-October currency losses | | | 202,141 | | |
7. Management Fees and Other Transactions with Affiliates
The Fund's management fee consists of two components—a fund-level fee, based only on the amount of assets within the Fund, and a complex-level fee, based on the aggregate amount of all eligible fund assets managed by the Adviser. This pricing structure enables Fund shareholders to benefit from growth in the assets within the Fund as well as from growth in the amount of complex-wide assets managed by the Adviser.
The annual fund-level fee, payable monthly, is calculated according to the following schedule:
| Average Daily Managed Assets* | | Fund-Level Fee Rate | |
| For the first $500 million | | | .8000 | % | |
| For the next $500 million | | | .7750 | | |
| For the next $500 million | | | .7500 | | |
| For the next $500 million | | | .7250 | | |
| For managed assets over $2 billion | | | .7000 | | |
Nuveen Investments
33
Notes to
FINANCIAL STATEMENTS (Unaudited) (continued)
The annual complex-level fee, payable monthly, is calculated according to the following schedule:
| Complex-Level Managed Asset Breakpoint Level* | | Effective Rate at Breakpoint Level | |
| $55 billion | | | .2000 | % | |
| $56 billion | | | .1996 | | |
| $57 billion | | | .1989 | | |
| $60 billion | | | .1961 | | |
| $63 billion | | | .1931 | | |
| $66 billion | | | .1900 | | |
| $71 billion | | | .1851 | | |
| $76 billion | | | .1806 | | |
| $80 billion | | | .1773 | | |
| $91 billion | | | .1691 | | |
| $125 billion | | | .1599 | | |
| $200 billion | | | .1505 | | |
| $250 billion | | | .1469 | | |
| $300 billion | | | .1445 | | |
* For the fund-level and complex-level fees, managed assets include closed-end fund assets managed by the Adviser that are attributable to financial leverage. For these purposes, financial leverage includes the funds' use of preferred stock and borrowings and certain investments in the residual interest certificates (also called inverse floating rate securities) in tender option bond (TOB) trusts, including the portion of assets held by a TOB trust that has been effectively financed by the trust's issuance of floating rate securities, subject to an agreement by the Adviser as to certain funds to limit the amount of such assets for determining managed assets in certain circumstances. The complex-level fee is calculated based upon the aggregate daily managed assets of all Nuveen Funds that constitute "eligible assets." Eligible assets do not include assets attributable to investments in other Nuveen Funds and assets in excess of $2 billion added to the Nuveen Fund complex in connection with the Adviser's assumption of the management of the former First American Funds effective January 1, 2011. As of June 30, 2011, the complex-level fee rate for the Fund was .1774%.
The management fee compensates the Adviser for overall investment advisory and administrative services and general office facilities. The Adviser has entered into a sub-advisory agreement with Tradewinds Global Investors, LLC ("Tradewinds"), a subsidiary of Nuveen, under which Tradewinds manages the investment portfolio of the Fund. Tradewinds is compensated for its services to the Fund from the management fee paid to the Adviser.
The Fund pays no compensation directly to those of its trustees who are affiliated with the Adviser or to its officers, all of whom receive remuneration for their services to the Fund from the Adviser or its affiliates. The Board of Trustees has adopted a deferred compensation plan for independent trustees that enables trustees to elect to defer receipt of all or a portion of the annual compensation they are entitled to receive from certain Nuveen advised funds. Under the plan, deferred amounts are treated as though equal dollar amounts had been invested in shares of select Nuveen advised funds.
8. New Accounting Pronouncements
Financial Accounting Standards Board ("FASB") Transfers and Servicing (Topic 860): Reconsideration of Effective Control for Repurchase Agreements
On April 15, 2011, the FASB issued Accounting Standards Update ("ASU") No. 2011-03 ("ASU No. 2011-03"). The guidance in ASU No. 2011-03 is intended to improve the accounting for repurchase agreements and other similar agreements. Specifically, ASU No. 2011-03 modifies the criteria for determining when these transactions would be accounted for as financings (secured borrowings/lending agreements) as opposed to sales (purchases) with commitments to repurchase (resell). The effective date of ASU No. 2011-03 is for interim and annual periods beginning on or after December 15, 2011. At this time, management is evaluating the implications of this guidance and the impact it will have to the financial statement amounts or footnote disclosures, if any.
Nuveen Investments
34
Fair Value Measurements and Disclosures
On May 12, 2011, the FASB issued ASU No. 2011-04 modifying Topic 820, Fair Value Measurements and Disclosures. At the same time, the International Accounting Standards Board ("IASB") issued International Financial Reporting Standard ("IFRS") 13, Fair Value Measurement. The objective of the FASB and IASB is convergence of their guidance on fair value measurements and disclosures. Specifically, ASU No. 2011-04 requires reporting entities to disclose i) the amounts of any transfers between Level 1 and Level 2, and the reasons for the transfers, ii) for Level 3 fair value measurements, a) quantitative information about significant unobservable inputs used, b) a description of the valuation processes used by the reporting entity and c) a narrative description of the sensitivity of the fair value measurement to changes in unobservable inputs if a change in those inputs might result in a significantly higher or lower fair value measurement. The effective date of ASU No. 2011-04 is for interim and annual periods beginning after December 15, 2011. At this time, management is evaluating the implications of this guidance and the impact it will have on the financial statement amounts and footnote disclosures, if any.
Nuveen Investments
35
Annual Investment Management
Agreement Approval Process (Unaudited)
The Board of Trustees (the "Board," and each Trustee, a "Board Member") of the Fund, including the Board Members who are not parties to the Fund's advisory or sub-advisory agreements or "interested persons" of any such parties (the "Independent Board Members"), are responsible for approving the advisory agreement (the "Investment Management Agreement") between the Fund and Nuveen Fund Advisors, Inc. (the "Advisor") and the sub-advisory agreement (the "Sub-Advisory Agreement") between the Advisor and Tradewinds Global Investors, LLC (the "Sub-Advisor") (the Investment Management Agreement and the Sub-Advisory Agreement are referred to collectively as the "Advisory Agreements") and their periodic continuation. Pursuant to the Investment Company Act of 1940, as amended (the "1940 Act"), the Board is required to consider the continuation of advisory agreements and sub-advisory agreements on an annual basis. Accordingly, at an in-person meeting held on May 23-25, 2011 (the "May Meeting"), the Board, including a majority of the Independent Board Members, considered and approved the continuation of the Advisory Agreements for the Fund for an additional one-year period.
In preparation for their considerations at the May Meeting, the Board requested and received extensive materials prepared in connection with the review of the Advisory Agreements. The materials provided a broad range of information regarding the Fund, the Advisor and the Sub-Advisor (the Advisor and the Sub-Advisor are collectively, the "Fund Advisers" and each, a "Fund Adviser"). As described in more detail below, the information provided included, among other things, a review of Fund performance, including Fund investment performance assessments against peer groups and appropriate benchmarks, a comparison of Fund fees and expenses relative to peers, a description and assessment of shareholder service levels for the Fund, a summary of the performance of certain service providers, a review of product initiatives and shareholder communications and an analysis of the Advisor's profitability with comparisons to comparable peers in the managed fund business. As part of their annual review, the Board also held a separate meeting on April 19-20, 2011, to review the Fund's investment performance and consider an analysis provided by the Advisor of the Sub-Advisor which generally evaluated the Sub-Advisor's investment team, investment mandate, organizational structure and history, investment philosophy and process, performance of the Fund, and significant changes to the foregoing. As a result of their review of the materials and discussions, the Board presented the Advisor with questions and the Advisor responded.
The materials and information prepared in connection with the annual review of the Advisory Agreements supplement the information provided to the Board during the year. In this regard, throughout the year, the Board, acting directly or through its
Nuveen Investments
36
committees, regularly reviews the performance and various services provided by the Advisor and the Sub-Advisor. The Board meets at least quarterly as well as at other times as the need arises. At its quarterly meetings, the Board reviews reports by the Advisor which include, among other things, Fund performance, a review of the investment teams and compliance reports. The Board also meets with key investment personnel managing the Fund's portfolio during the year. In addition, the Board continues its program of seeking to visit each sub-advisor to the Nuveen funds at least once over a multiple year rotation, meeting with key investment and business personnel. In this regard, the Independent Board Members met with the Sub-Advisor in 2010 and 2011. The Board also met with State Street Bank & Trust Company, the Fund's accountant and custodian, in 2010. The Board considers factors and information that are relevant to its annual consideration of the renewal of the Advisory Agreements at these meetings held throughout the year. Accordingly, the Board considers the information provided and knowledge gained at these meetings when performing its annual review of the Advisory Agreements. The Independent Board Members are assisted throughout the process by independent legal counsel who provided materials describing applicable law and the duties of directors or trustees in reviewing advisory contracts and met with the Independent Board Members in executive sessions without management present.
The Board considered all factors it believed relevant with respect to the Fund, including among other factors: (a) the nature, extent and quality of the services provided by the Fund Advisers, (b) the investment performance of the Fund and Fund Advisers, (c) the advisory fees and costs of the services to be provided to the Fund and the profitability of the Fund Advisers, (d) the extent of any economies of scale, (e) any benefits derived by the Fund Advisers from the relationship with the Fund and (f) other factors. Each Board Member may have accorded different weight to the various factors in reaching his or her conclusions with respect to the Fund's Advisory Agreements. The Independent Board Members did not identify any single factor as all important or controlling. The Independent Board Members' considerations were instead based on a comprehensive consideration of all the information presented. The principal factors considered by the Board and its conclusions are described below.
A. Nature, Extent and Quality of Services
In considering renewal of the Advisory Agreements, the Independent Board Members considered the nature, extent and quality of the Fund Adviser's services, including advisory services and the resulting Fund performance and administrative services. The Independent Board Members reviewed materials outlining, among other things, the Fund Adviser's organization and business; the types of services that the Fund Adviser or its affiliates provide to the Fund; the performance record of the Fund (as described in further detail below); and any initiatives Nuveen had taken for the applicable fund product line.
In considering advisory services, the Board recognized that the Advisor provides various oversight, administrative, compliance and other services for the Fund and the Sub-Advisor provides the portfolio investment management services to the Fund.
Nuveen Investments
37
Annual Investment Management
Agreement Approval Process (Unaudited) (continued)
Accordingly, in reviewing the portfolio management services provided to the Fund, the Board reviewed the materials provided by the Nuveen Investment Services Oversight Team analyzing, among other things, the Sub-Advisor's investment team and changes thereto, organization and history, assets under management, Fund objectives and mandate, the investment team's philosophy and strategies in managing the Fund, developments affecting the Sub-Advisor or Fund and Fund performance. The Independent Board Members also reviewed portfolio manager compensation arrangements to evaluate each Fund Adviser's ability to attract and retain high quality investment personnel, preserve stability, and reward performance but not provide an incentive to take undue risks. In addition, the Board considered the Advisor's execution of its oversight responsibilities over the Sub-Advisor. Given the importance of compliance, the Independent Board Members also considered Nuveen's compliance program, including the report of the chief compliance officer regarding the Fund's compliance policies and procedures.
In addition to advisory services, the Board considered the quality and extent of administrative and other non-investment advisory services the Advisor and its affiliates provide to the Fund, including product management, investment services (such as oversight of investment policies and procedures, risk management, and pricing), fund administration, oversight of service providers, shareholder services, administration of Board relations, regulatory and portfolio compliance, legal support, managing leverage and promoting an orderly secondary market for common shares.
In reviewing the services provided, the Board also reviewed materials describing various notable initiatives and projects the Advisor performed in connection with the closed-end fund product line. These initiatives included continued activities to refinance auction rate preferred securities; ongoing services to manage leverage that has become increasingly complex; continued secondary market offerings and share repurchases for certain funds; and continued communications efforts with shareholders, fund analysts and financial advisers. With respect to the latter, the Independent Board Members noted Nuveen's continued commitment to supporting the secondary market for the common shares of its closed-end funds through a comprehensive secondary market communication program designed to raise investor and analyst awareness and understanding of closed-end funds. Nuveen's support services included, among other things: continuing communications in support of refinancing efforts related to auction rate preferred securities; participating in conferences; communicating continually with closed-end fund analysts covering the Nuveen funds; providing marketing for the closed-end funds; share purchases; and maintaining and enhancing a closed-end fund website.
Based on their review, the Independent Board Members found that, overall, the nature, extent and quality of services provided to the Fund under each Advisory Agreement were satisfactory.
B. The Investment Performance of the Fund and Fund Advisers
The Board, including the Independent Board Members, reviewed and considered the performance history of the Fund over various time periods. The Board reviewed, among other things, the Fund's historic investment performance as well as information
Nuveen Investments
38
comparing the Fund's performance information with that of other funds (the "Performance Peer Group") based on data provided by an independent provider of mutual fund data and with recognized and/or customized benchmarks.
The Board reviewed reports, including a comprehensive analysis of the Fund's performance and the applicable investment team. In this regard, the Board reviewed the Fund's total return information compared to the returns of its Performance Peer Group and recognized and/or customized benchmarks for the quarter, one- and three-year periods ending December 31, 2010 and for the same periods ending March 31, 2011. The Independent Board Members also reviewed historic premium and discount levels, including a summary of actions taken to address or discuss other developments affecting the secondary market discounts of various funds. This information supplemented the Fund performance information provided to the Board at each of its quarterly meetings.
In reviewing performance comparison information, the Independent Board Members recognized that the usefulness of the comparisons of the performance of certain funds with the performance of their respective Performance Peer Group may be limited because the Performance Peer Group may not adequately represent the objectives and strategies of the applicable funds or may be limited in size or number. The Independent Board Members also noted that the investment experience of a particular shareholder in the Nuveen funds will vary depending on when such shareholder invests in the applicable fund, the class held (if multiple classes are offered) and the performance of the fund (or respective class) during that shareholder's investment period. With respect to any Nuveen funds that underperformed their peers and/or benchmarks from time to time, the Board monitors such funds closely and considers any steps necessary or appropriate to address such issues.
In considering the results of the comparisons, the Independent Board Members observed, among other things, that the Fund had demonstrated generally satisfactory performance compared to its peers, falling within the first quartile for the three-year period and the third quartile over the one-year period.
Based on their review, the Independent Board Members determined that the Fund's investment performance had been satisfactory.
C. Fees, Expenses and Profitability
1. Fees and Expenses
The Board evaluated the management fees and expenses of the Fund reviewing, among other things, the Fund's gross management fees, net management fees and net expense ratios in absolute terms as well as compared to the fee and expenses of a comparable universe of funds based on data provided by an independent fund data provider (the "Peer Universe") and in certain cases, to a more focused subset of funds in the Peer Universe (the "Peer Group") and any expense limitations.
The Independent Board Members further reviewed the methodology regarding the construction of the applicable Peer Universe and Peer Group (if any). In reviewing the comparisons of fee and expense information, the Independent Board Members took into account that in certain instances various factors such as: the asset level of a
Nuveen Investments
39
Annual Investment Management
Agreement Approval Process (Unaudited) (continued)
fund relative to peers; the limited size and particular composition of the Peer Universe or Peer Group; the investment objectives of the peers; expense anomalies; changes in the funds comprising the Peer Universe or Peer Group from year to year; levels of reimbursement; the timing of information used; and the differences in the type and use of leverage may impact the comparative data thereby limiting the ability to make a meaningful comparison with peers.
In reviewing the fee schedule for the Fund, the Independent Board Members also considered the fund-level and complex-wide breakpoint schedules (described in further detail below) and any fee waivers and reimbursements provided by Nuveen (applicable, in particular, for certain closed-end funds launched since 1999). In reviewing fees and expenses, the Board considered the expenses and fees to be higher if they were over 10 basis points higher, slightly higher if they were 6 to 10 basis points higher, in line if they were within 5 basis points higher than the peer average and below if they were below the peer average of the Peer Group (if available) or Peer Universe if there was no separate Peer Group. The Independent Board Members observed that the Fund had net management fees and net expense ratios below its peer averages.
Based on their review of the fee and expense information provided, the Independent Board Members determined that the Fund's management fees were reasonable in light of the nature, extent and quality of services provided to the Fund.
2. Comparisons with the Fees of Other Clients
The Independent Board Members further reviewed information regarding the nature of services and fee rates offered by the Advisor to other clients, including separately managed accounts (both retail and institutional accounts), foreign investment funds offered by Nuveen, and funds that are not offered by Nuveen but are sub-advised by one of Nuveen's investment management teams. In evaluating the comparisons of fees, the Independent Board Members noted that the fee rates charged to the Fund and other clients vary, among other things, because of the different services involved and the additional regulatory and compliance requirements associated with registered investment companies, such as the Fund. Accordingly, the Independent Board Members considered the differences in the product types, including, but not limited to, the services provided, the structure and operations, product distribution and costs thereof, portfolio investment policies, investor profiles, account sizes and regulatory requirements. The Independent Board Members noted, in particular, that the range of services provided to the Fund (as discussed above) is much more extensive than that provided to separately managed accounts. Given the inherent differences in the products, particularly the extensive services provided to the Fund, the Independent Board Members believe such facts justify the different levels of fees.
In considering the fees of the Sub-Advisor, the Independent Board Members also considered the pricing schedule or fees that the Sub-Advisor charges for similar investment management services for other fund sponsors or clients (such as retail and/or institutional managed accounts) as applicable.
Nuveen Investments
40
3. Profitability of Fund Advisers
In conjunction with its review of fees, the Independent Board Members also considered the profitability of Nuveen for its advisory activities (which incorporated Nuveen's wholly-owned affiliated sub-advisers) and its financial condition. The Independent Board Members reviewed the revenues and expenses of Nuveen's advisory activities for the last two years, the allocation methodology used in preparing the profitability data and an analysis of the key drivers behind the changes in revenues and expenses that impacted profitability in 2010. The Independent Board Members noted this information supplemented the profitability information requested and received during the year to help keep them apprised of developments affecting profitability (such as changes in fee waivers and expense reimbursement commitments). In this regard, the Independent Board Members noted that they have an Independent Board Member serve as a point person to review and keep them apprised of changes to the profitability analysis and/or methodologies during the year. The Independent Board Members also considered Nuveen's revenues for advisory activities, expenses, and profit margin compared to that of various unaffiliated management firms with similar amounts of assets under management and relatively comparable asset composition prepared by Nuveen.
In reviewing profitability, the Independent Board Members recognized the subjective nature of determining profitability which may be affected by numerous factors including the allocation of expenses. Further, the Independent Board Members recognized the difficulties in making comparisons as the profitability of other advisers generally is not publicly available and the profitability information that is available for certain advisers or management firms may not be representative of the industry and may be affected by, among other things, the adviser's particular business mix, capital costs, types of funds managed and expense allocations. Notwithstanding the foregoing, the Independent Board Members reviewed Nuveen's methodology and assumptions for allocating expenses across product lines to determine profitability. In reviewing profitability, the Independent Board Members recognized Nuveen's investment in its fund business. Based on their review, the Independent Board Members concluded that the Advisor's level of profitability for its advisory activities was reasonable in light of the services provided.
The Independent Board Members also considered the Sub-Advisor's revenues, expenses and pre-tax profitability margins. Based on their review, the Independent Board Members were satisfied that the Sub-Advisor's level of profitability was reasonable in light of the services provided.
In evaluating the reasonableness of the compensation, the Independent Board Members also considered other amounts paid to a Fund Adviser by the Fund as well as any indirect benefits (such as soft dollar arrangements, if any) the Fund Adviser and its affiliates receive, or are expected to receive, that are directly attributable to the management of the Fund, if any. See Section E below for additional information on indirect benefits a Fund Adviser may receive as a result of its relationship with the Fund. Based on their review of the overall fee arrangements of the Fund, the
Nuveen Investments
41
Annual Investment Management
Agreement Approval Process (Unaudited) (continued)
Independent Board Members determined that the advisory fees and expenses of the Fund were reasonable.
D. Economies of Scale and Whether Fee Levels Reflect These Economies of Scale
With respect to economies of scale, the Independent Board Members have recognized the potential benefits resulting from the costs of a fund being spread over a larger asset base, although economies of scale are difficult to measure and predict with precision, particularly on a fund-by-fund basis. One method to help ensure the shareholders share in these benefits is to include breakpoints in the advisory fee schedule. Generally, management fees for funds in the Nuveen complex are comprised of a fund-level component and a complex-level component, subject to certain exceptions. Accordingly, the Independent Board Members reviewed and considered the applicable fund-level breakpoints in the advisory fee schedules that reduce advisory fees as asset levels increase. Further, the Independent Board Members noted that although closed-end funds may from time-to-time make additional share offerings, the growth of their assets will occur primarily through the appreciation of such funds' investment portfolio.
In addition to fund-level advisory fee breakpoints, the Board also considered the Fund's complex-wide fee arrangement. Pursuant to the complex-wide fee arrangement, the fees of the funds in the Nuveen complex are generally reduced as the assets in the fund complex reach certain levels. The complex-wide fee arrangement seeks to provide the benefits of economies of scale to fund shareholders when total fund complex assets increase, even if assets of a particular fund are unchanged or have decreased. The approach reflects the notion that some of Nuveen's costs are attributable to services provided to all its funds in the complex and therefore all funds benefit if these costs are spread over a larger asset base.
Based on their review, the Independent Board Members concluded that the breakpoint schedules and complex-wide fee arrangement were acceptable and reflect economies of scale to be shared with shareholders when assets under management increase.
E. Indirect Benefits
In evaluating fees, the Independent Board Members received and considered information regarding potential "fall out" or ancillary benefits the respective Fund Adviser or its affiliates may receive as a result of its relationship with the Fund. In this regard, the Independent Board Members considered any revenues received by affiliates of the Advisor for serving as agent at Nuveen's trading desk and as co-manager in initial public offerings of new closed-end funds.
In addition to the above, the Independent Board Members considered whether the Fund Advisers received any benefits from soft dollar arrangements whereby a portion of the commissions paid by the Fund for brokerage may be used to acquire research that may be useful to the Fund Adviser in managing the assets of the Fund and other clients. With respect to the Advisor, the Independent Board Members recognized that the Advisor has the authority to pay a higher commission in return for brokerage and research services if it determines in good faith that the commission paid is reasonable in relation to the value of the brokerage and research services provided. With respect to the Sub-Advisor,
Nuveen Investments
42
the Independent Board Members considered that the Sub-Advisor may benefit from its soft dollar arrangements pursuant to which it receives research from brokers that execute the Fund's portfolio transactions. The Independent Board Members noted that the Fund Advisers' profitability may be somewhat lower if they did not receive the research services pursuant to the soft dollar arrangements and had to acquire such services directly.
Based on their review, the Independent Board Members concluded that any indirect benefits received by a Fund Adviser as a result of its relationship with the Fund were reasonable and within acceptable parameters.
F. Other Considerations
The Independent Board Members did not identify any single factor discussed previously as all-important or controlling. The Board Members, including the Independent Board Members, unanimously concluded that the terms of each Advisory Agreement are fair and reasonable, that the respective Fund Adviser's fees are reasonable in light of the services provided to the Fund and that the Advisory Agreements be renewed.
Nuveen Investments
43
Reinvest Automatically
Easily and Conveniently
Nuveen makes reinvesting easy. A phone call is all it takes to set up your reinvestment account.
Nuveen Closed-End Funds Automatic Reinvestment Plan
Your Nuveen Closed-End Fund allows you to conveniently reinvest distributions in additional Fund shares.
By choosing to reinvest, you'll be able to invest money regularly and automatically, and watch your investment grow through the power of compounding. Just like distributions in cash, there may be times when income or capital gains taxes may be payable on distributions that are reinvested.
It is important to note that an automatic reinvestment plan does not ensure a profit, nor does it protect you against loss in a declining market.
Easy and convenient
To make recordkeeping easy and convenient, each quarter you'll receive a statement showing your total distributions, the date of investment, the shares acquired and the price per share, and the total number of shares you own.
How shares are purchased
The shares you acquire by reinvesting will either be purchased on the open market or newly issued by the Fund. If the shares are trading at or above net asset value at the time of valuation, the Fund will issue new shares at the greater of the net asset value or 95% of the then-current market price. If the shares are trading at less than net asset value, shares for your account will be purchased on the open market. If the Plan Agent begins purchasing Fund shares on the open market while shares are trading below net asset value, but the Fund's shares subsequently trade at or above their net asset value before the Plan Agent is able to complete its purchases, the Plan Agent may cease open-market purchases and may invest the uninvested portion of the distribution in newly-issued Fund shares at a price equal to the greater of the shares' net asset value or 95% of the shares' market value on the last business day immediately prior to the purchase date. Distributions received to purchase shares in the open market will normally be invested shortly after the distribution payment date. No interest will be paid on distributions awaiting reinvestment. Because the market price of the shares may increase before purchases are completed, the average purchase price per share may exceed the market price at the time of valuation, resulting in the acquisition of fewer shares than if the distribution had been paid in shares issued by the Fund. A pro rata portion of any applicable brokerage commissions on open market purchases will be paid
Nuveen Investments
44
by Plan participants. These commissions usually will be lower than those charged on individual transactions.
Flexible
You may change your distribution option or withdraw from the Plan at any time, should your needs or situation change.
You can reinvest whether your shares are registered in your name, or in the name of a brokerage firm, bank, or other nominee. Ask your financial advisor if his or her firm will participate on your behalf. Participants whose shares are registered in the name of one firm may not be able to transfer the shares to another firm and continue to participate in the Plan.
The Fund reserves the right to amend or terminate the Plan at any time. Although the Fund reserves the right to amend the Plan to include a service charge payable by the participants, there is no direct service charge to participants in the Plan at this time.
Call today to start reinvesting distributions
For more information on the Nuveen Automatic Reinvestment Plan or to enroll in or withdraw from the Plan, speak with your financial advisor or call us at (800) 257-8787.
Nuveen Investments
45
Glossary of Terms
Used in this Report
• Average Annual Total Return: This is a commonly used method to express an investment's performance over a particular, usually multi-year time period. It expresses the return that would have been necessary each year to equal the investment's actual cumulative performance (including change in NAV or market price and reinvested dividends and capital gains distributions, if any) over the time period being considered.
• Current Distribution Rate: Current distribution rate is based on the Fund's current annualized quarterly distribution divided by the Fund's current market price. The Fund's quarterly distributions to its shareholders may be comprised of ordinary income, net realized capital gains and, if at the end of the calendar year the Fund's cumulative net ordinary income and net realized gains are less than the amount of the Fund's distributions, a tax return of capital.
• Net Asset Value (NAV): A Fund's NAV per share is calculated by subtracting the liabilities of the Fund from its total assets and then dividing the remainder by the number of shares outstanding. Fund NAVs are calculated at the end of each business day.
Nuveen Investments
46
Notes
Nuveen Investments
47
Notes
Nuveen Investments
48
Notes
Nuveen Investments
49
Other Useful Information
Board of Trustees
John P. Amboian
Robert P. Bremner
Jack B. Evans
William C. Hunter
David J. Kundert
William J. Schneider
Judith M. Stockdale
Carole E. Stone
Virginia L. Stringer
Terence J. Toth
Fund Manager
Nuveen Fund Advisors, Inc.
333 West Wacker Drive
Chicago, IL 60606
Custodian
State Street Bank & Trust Company
Boston, MA
Transfer Agent and
Shareholder Services
State Street Bank & Trust Company
Nuveen Funds
P.O. Box 43071
Providence, RI 02940-3071
(800) 257-8787
Legal Counsel
Chapman and Cutler LLP
Chicago, IL
Independent Registered
Public Accounting Firm
PricewaterhouseCoopers LLP
Chicago, IL
Quarterly Portfolio of Investments And Proxy Voting Information
You may obtain (i) the Fund's quarterly portfolio of investments, (ii) information regarding how the Fund voted proxies relating to portfolio securities held during the most recent twelve-month period ended June 30, and (iii) a description of the policies and procedures that the Fund used to determine how to vote proxies relating to portfolio securities without charge, upon request, by calling Nuveen Investments toll-free at (800) 257-8787 or on Nuveen's website at www.nuveen.com.
You may also obtain this and other Fund information directly from the Securities and Exchange Commission (SEC). The SEC may charge a copying fee for this information. Visit the SEC on-line at http://www.sec.gov or in person at the SEC's Public Reference Room in Washington, D.C. Call the SEC at (202) 942-8090 for room hours and operation. You may also request Fund information by sending an e-mail request to publicinfo@sec.gov or by writing to the SEC's Public Reference Section at 100 F Street NE, Washington, D.C. 20549.
CEO Certification Disclosure
The Fund's Chief Executive Officer has submitted to the New York Stock Exchange (NYSE) the annual CEO certification as required by Section 303A.12(a) of the NYSE Listed Company Manual.
The Fund has filed with the SEC the certification of its Chief Executive Officer and Chief Financial Officer required by Section 302 of the Sarbanes-Oxley Act.
Share Information
The Fund intends to repurchase shares of its own common stock in the future at such times and in such amounts as is deemed advisable. During the period covered by this report, the Fund repurchased shares of its common stock as shown in the accompanying table.
| | | Common
Shares
Repurchased | |
| JGV | | | — | | |
Any future repurchases will be reported to shareholders in the next annual or semi-annual report.
Nuveen Investments
50


Nuveen Investments makes it easy, with the ultimate online resource.
At nuveen.com/understand, you have access to comprehensive educational tools, video libraries and daily pricing for Nuveen's more than 130* closed-end funds–so you can stay up to date on the latest income-investing news and information.
All the tools and resources you need on closed-end funds are just a click away. www.nuveen.com/understand
* There are risks inherent in any investment, including market risk, interest rate risk, credit risk, and the possible loss of principal. There can be no assurance that fund objectives will be achieved and income is not guaranteed. Closed-end funds frequently trade at a discount to their net asset value. Diversification does not ensure against loss.
* As of 5/31/11
Nuveen Investments:
Serving Investors for Generations
Distributed by
Nuveen Securities, LLC
333 West Wacker Drive
Chicago, IL 60606
www.nuveen.com/performance
Since 1898, financial advisors and their clients have relied on Nuveen Investments to provide dependable investment solutions through continued adherence to proven, long-term investing principles. Today, we offer a range of high quality equity and fixed-income solutions designed to be integral components of a well-diversified core portfolio.
Focused on meeting investor needs.
Nuveen Investments is a global investment management firm that seeks to help secure the long-term goals of institutions and high net worth investors as well as the consultants and financial advisors who serve them. We market our growing range of specialized investment solutions under the high-quality brands of HydePark, NWQ, Nuveen Asset Management, Santa Barbara, Symphony, Tradewinds and Winslow Capital. In total, Nuveen Investments managed approximately $210 billion of assets as of June 30, 2011.
Find out how we can help you.
To learn more about how the products and services of Nuveen Investments may be able to help you meet your financial goals, talk to your financial advisor, or call us at (800) 257-8787. Please read the information provided carefully before you invest. Investors should consider the investment objective and policies, risk considerations, charges and expenses of any investment carefully. Where applicable, be sure to obtain a prospectus, which contains this and other relevant information. To obtain a prospectus, please contact your securities representative or Nuveen Investments, 333 W. Wacker Dr., Chicago, IL 60606. Please read the prospectus carefully before you invest or send money.
Learn more about Nuveen Funds at: www.nuveen.com/performance
ESA-H-0611D
ITEM 2. CODE OF ETHICS.
Not applicable to this filing.
ITEM 3. AUDIT COMMITTEE FINANCIAL EXPERT.
Not applicable to this filing.
ITEM 4. PRINCIPAL ACCOUNTANT FEES AND SERVICES.
Not applicable to this filing.
ITEM 5. AUDIT COMMITTEE OF LISTED REGISTRANTS.
Not applicable to this filing.
ITEM 6. SCHEDULE OF INVESTMENTS.
(a) See Portfolio of Investments in Item 1.
(b) Not applicable.
ITEM 7. DISCLOSURE OF PROXY VOTING POLICIES AND PROCEDURES FOR CLOSED-END MANAGEMENT INVESTMENT COMPANIES.
Not applicable to this filing.
ITEM 8. PORTFOLIO MANAGERS OF CLOSED-END MANAGEMENT INVESTMENT COMPANIES.
Not applicable to this filing.
ITEM 9. PURCHASES OF EQUITY SECURITIES BY CLOSED-END MANAGEMENT INVESTMENT COMPANY AND AFFILIATED PURCHASERS.
Not applicable.
ITEM 10. SUBMISSION OF MATTERS TO A VOTE OF SECURITY HOLDERS.
There have been no material changes to the procedures by which shareholders may recommend nominees to the registrant’s Board of Directors or Trustees implemented after the registrant last provided disclosure in response to this Item.
ITEM 11. CONTROLS AND PROCEDURES.
(a) The registrant’s principal executive and principal financial officers, or persons performing similar functions, have concluded that the registrant’s disclosure controls and procedures (as defined in Rule 30a-3(c) under the Investment Company Act of 1940, as amended (the “1940 Act”) (17 CFR 270.30a-3(c))) are effective, as of a date within 90 days of the filing date of this report that includes the disclosure required by this paragraph, based on their evaluation of the controls and procedures required by Rule 30a-3(b) under the 1940 Act (17 CFR 270.30a-3(b)) and Rules 13a-15(b) or 15d-15(b) under the Securities Exchange Act of 1934, as amended (the “Exchange Act”)(17 CFR 240.13a-15(b) or 240.15d-15(b)).
(b) There were no changes in the registrant’s internal control over financial reporting (as defined in Rule 30a-3(d) under the 1940 Act (17 CFR 270.30a-3(d)) that occurred during the second fiscal quarter of the period covered by this report that has materially affected, or is reasonably likely to materially affect, the registrant’s internal control over financial reporting.
ITEM 12. EXHIBITS.
File the exhibits listed below as part of this Form.
(a)(1) Any code of ethics, or amendment thereto, that is the subject of the disclosure required by Item 2, to the extent that the registrant intends to satisfy the Item 2 requirements through filing of an exhibit: Not applicable to this filing.
(a)(2) A separate certification for each principal executive officer and principal financial officer of the registrant as required by Rule 30a-2(a) under the 1940 Act (17 CFR 270.30a-2(a)) in the exact form set forth below: See Ex-99.CERT attached hereto.
(a)(3) Any written solicitation to purchase securities under Rule 23c-1 under the 1940 Act (17 CFR 270.23c-1) sent or given during the period covered by the report by or on behalf of the registrant to 10 or more persons: Not applicable.
(b) If the report is filed under Section 13(a) or 15(d) of the Exchange Act, provide the certifications required by Rule 30a-2(b) under the 1940 Act (17 CFR 270.30a-2(b)); Rule 13a-14(b) or Rule 15d-14(b) under the Exchange Act (17 CFR 240.13a-14(b) or 240.15d-14(b)), and Section 1350 of Chapter 63 of Title 18 of the United States Code (18 U.S.C. 1350) as an exhibit. A certification furnished pursuant to this paragraph will not be deemed “filed” for purposes of Section 18 of the Exchange Act (15 U.S.C. 78r), or otherwise subject to the liability of that section. Such certification will not be deemed to be incorporated by reference into any filing under the Securities Act of 1933 or the Exchange Act, except to the extent that the registrant specifically incorporates it by reference: See Ex-99.906 CERT attached hereto.
SIGNATURES
Pursuant to the requirements of the Securities Exchange Act of 1934 and the Investment Company Act of 1940, the registrant has duly caused this report to be signed on its behalf by the undersigned, thereunto duly authorized.
(Registrant) Nuveen Global Value Opportunities Fund
By (Signature and Title) | /s/ Kevin J. McCarthy | |
| Kevin J. McCarthy | |
| (Vice President and Secretary) | |
Date: September 7, 2011
Pursuant to the requirements of the Securities Exchange Act of 1934 and the Investment Company Act of 1940, this report has been signed below by the following persons on behalf of the registrant and in the capacities and on the dates indicated.
By (Signature and Title) | /s/ Gifford R. Zimmerman | |
| Gifford R. Zimmerman | |
| Chief Administrative Officer | |
| (principal executive officer) | |
Date: September 7, 2011
By (Signature and Title) | /s/ Stephen D. Foy | |
| Stephen D. Foy | |
| Vice President and Controller | |
| (principal financial officer) | |
Date: September 7, 2011