UNITED STATES
SECURITIES AND EXCHANGE COMMISSION
Washington, D.C. 20549
FORM N-CSR
CERTIFIED SHAREHOLDER REPORT OF REGISTERED
MANAGEMENT INVESTMENT COMPANIES
Investment Company Act file number | 811-21903 |
|
Nuveen Global Value Opportunities Fund |
(Exact name of registrant as specified in charter) |
|
Nuveen Investments 333 West Wacker Drive Chicago, IL 60606 |
(Address of principal executive offices) (Zip code) |
|
Kevin J. McCarthy Nuveen Investments 333 West Wacker Drive Chicago, IL 60606 |
(Name and address of agent for service) |
|
Registrant’s telephone number, including area code: | (312) 917-7700 | |
|
Date of fiscal year end: | December 31 | |
|
Date of reporting period: | June 30, 2013 | |
| | | | | | |
Form N-CSR is to be used by management investment companies to file reports with the Commission not later than 10 days after the transmission to stockholders of any report that is required to be transmitted to stockholders under Rule 30e-1 under the Investment Company Act of 1940 (17 CFR 270.30e-1). The Commission may use the information provided on Form N-CSR in its regulatory, disclosure review, inspection, and policymaking roles.
A registrant is required to disclose the information specified by Form N-CSR, and the Commission will make this information public. A registrant is not required to respond to the collection of information contained in Form N-CSR unless the Form displays a currently valid Office of Management and Budget ("OMB") control number. Please direct comments concerning the accuracy of the information collection burden estimate and any suggestions for reducing the burden to Secretary, Securities and Exchange Commission, 450 Fifth Street, NW, Washington, DC 20549-0609. The OMB has reviewed this collection of information under the clearance requirements of 44 U.S.C. ss. 3507.
ITEM 1. REPORTS TO STOCKHOLDERS.

Nuveen Investments
Closed-End Funds
Potential for a High Level of Total Return from a Diversified Global
Portfolio Primarily Invested in Equity and Debt Securities.
Semi-Annual Report
June 30, 2013

Nuveen Global Value
Opportunities Fund
JGV

Nuveen makes things e-simple.
It only takes a minute to sign up for e-Reports. Once enrolled, you'll receive an e-mail as soon as your Nuveen Fund information is ready. No more waiting for delivery by regular mail. Just click on the link within the e-mail to see the report and save it on your computer if you wish.
Free e-Reports right to your e-mail!
www.investordelivery.com
If you receive your Nuveen Fund distributions and statements from your financial advisor or brokerage account.
OR
www.nuveen.com/accountaccess
If you receive your Nuveen Fund distributions and statements directly from Nuveen.

Letter to Shareholders | | | 4 | | |
Portfolio Managers' Comments | | | 5 | | |
Share Information | | | 7 | | |
Risk Considerations | | | 9 | | |
Performance Overview and Holding Summaries | | | 12 | | |
Shareholder Meeting Report | | | 14 | | |
Portfolio of Investments | | | 15 | | |
Statement of Assets & Liabilities | | | 20 | | |
Statement of Operations | | | 21 | | |
Statement of Changes in Net Assets | | | 22 | | |
Financial Highlights | | | 24 | | |
Notes to Financial Statements | | | 26 | | |
Annual Investment Management Agreement Approval Process | | | 34 | | |
Reinvest Automatically, Easily and Conveniently | | | 42 | | |
Glossary of Terms Used in this Report | | | 44 | | |
Additional Fund Information | | | 47 | | |

Dear Shareholders,
After nine years of serving as lead director and independent chairman of the Nuveen Fund Board, my term of office has come to an end as of June 30, 2013. It has been a privilege to use this space to communicate with you on some of the broad economic trends in the U.S. and abroad and how they are impacting the investment environment in which your funds operate. In addition, I have enjoyed offering some perspective on how your Board views the various Nuveen investment teams as they apply their investment disciplines in that investment environment.
My term has coincided with a particularly challenging period for both mutual fund sponsors and investors. Since 2000 there have been three periods of unusually strong stock market growth and two major market declines. Recent years have been characterized by a search for yield in fixed income securities to compensate for an extended period of very low interest rates. Funds are investing more in foreign and emerging markets that require extensive research capabilities to overcome the more limited transparency and higher volatility in those markets. New fund concepts often incorporate derivative financial instruments that offer efficient ways to hedge investment risk or gain exposure to selected markets. Fund trading teams operate in many new domestic and international venues with quite different characteristics. Electronic trading and global communication networks mean that fund managers must be able to thrive in financial markets that react instantaneously to newsworthy events and are more interconnected than ever.
Nuveen has committed additional resources to respond to these changes in the fund industry environment. It has added IT and research resources to assemble and evaluate the increased flow of detailed information on economies, markets and individual companies. Based on its experience during the financial crisis of 2008-09, Nuveen has expanded its resources dedicated to valuing and trading portfolio securities with a particular focus on stressed financial market conditions. It has added systems and experienced risk management professionals to work with investment teams to better help evaluate whether their funds' risk exposures are appropriate in view of the return targets. The investment teams have also reflected on recent experience to reaffirm or modify their investment disciplines. Finally, experienced professionals and IT resources have been added to address new regulatory requirements designed to better inform and protect investors. The Nuveen Fund Board has enthusiastically encouraged these initiatives.
The Board has always viewed itself as your representatives to assure that Nuveen brings together experienced people, proven technologies and effective processes designed to produce results that meet investor expectations. It is important to note that our activities are highlighted by the annual contract renewal process. Despite its somewhat formal language, I strongly encourage you to read the summary because it offers an insight into our oversight process. The report is included in the back of this shareholder report. The renewal process is very comprehensive and includes a number of evaluations and discussions between the Board and Nuveen during the year. The summary also describes what has been achieved across the Nuveen fund complex and at individual funds such as yours.
As I leave the chairmanship and resume my role as a member of the Board, please be assured that I and my fellow Board members will continue to hold your interests uppermost in our minds as we oversee the management of your funds and that we greatly appreciate your confidence in your Nuveen fund.
Very sincerely,

Robert P. Bremner
August 22, 2013
Nuveen Investments
4
Portfolio Managers' Comments
Nuveen Global Value Opportunities Fund (JGV)
The Fund's investment portfolio is managed by Tradewinds Global Investors, LLC, an affiliate of Nuveen Investments. Michael Hart, CFA and Ariane Mahler are portfolio managers of the Fund.
Effective August 1, 2013 (subsequent to the close of this reporting period) Rod Parsley assumed sole portfolio management responsibility for the Fund from Michael and Ariane. Rod joined Tradewinds in 2012 with 15 years of investment and analytical experience.
Here the portfolio managers speak about the management strategy and performance of the Fund for the six-month period ended June 30, 2013.
What key strategies were used to manage the Fund during this six-month reporting period ended June 30, 2013?
The Fund seeks a high level of total return by investing primarily in a diversified global portfolio of value equity securities, as well as corporate and governmental debt securities, and by opportunistically using leverage, primarily via writing (selling) options and shorting a small position in equities.
Under normal circumstances, the Fund will invest approximately 80% of its managed assets in equities and the remainder in debt. This mix will be actively managed based on market conditions, and the portfolio can range from substantially all equity to substantially all debt as circumstances warrant. Our basic investment philosophy continues to be to search for good or improving business franchises around the globe whose securities are selling at levels that we believe are below their intrinsic value.
The principles followed in managing the Fund's investments are designed to create portfolios built of companies with sustainable franchises, which we believe to be trading at a discount to their intrinsic worth. The characteristics of the Fund's portfolio tend to differ significantly from those of its benchmarks, given the bottom-up nature of the process. The Fund generally underperformed its benchmarks by a wide margin during the reporting period. Because of widespread fear driven by economic uncertainty, investors during the period were more focused on buying companies with strong short term earnings visibility, even if those companies were trading at elevated valuation levels, rather than those companies we believe offer good long term prospects and are undervalued in the market place. Notwithstanding the resulting poor performance of our investment strategies over the period, we remain committed to our long held value philosophy and research-centric process. We constantly reassess our holdings to determine sustainability of their
Certain statements in this report are forward-looking statements. Discussions of specific investments are for illustration only and are not intended as recommendations of individual investments. The forward-looking statements and other views expressed herein are those of the portfolio managers as of the date of this report. Actual future results or occurrences may differ significantly from those anticipated in any forward-looking statements and the views expressed herein are subject to change at any time, due to numerous market and other factors. The Fund disclaims any obligation to update publicly or revise any forward-looking statements or views expressed herein.
Ratings shown are the highest rating given by one of the following national rating agencies: Standard & Poor's, Moody's Investors Service, Inc. or Fitch, Inc. Credit ratings are subject to change. AAA, AA, A, and BBB are investment grade ratings; BB, B, CCC, CC, C and D are below investment grade ratings. Certain bonds backed by U.S. Government or agency securities are regarded as having an implied rating equal to the rating of such securities. Holdings designated N/R are not rated by these national rating agencies.
Nuveen Investments
5
business franchises, so we believe our companies have defensible market positions that will allow us to maintain our investment in them to a time when their compelling characteristics become more broadly accepted.
During this reporting period, we continued to be overweight the materials sectors. We increased our exposure in the financials and telecommunication services sectors. We also decreased our energy exposure. Within the equity and fixed asset classes, exposures remained generally unchanged, as measured at the beginning and end of the six-month reporting period. During the period, we covered our short equity positions, with the majority of the positions comprising half a percent or less of the portfolio.
How did the Fund perform during this six-month reporting period ended June 30, 2013?
The table in the Fund's Performance Overview and Holding Summaries section of this report provides total return performance for the Fund for the six-month, one-year, five-year and since inception periods ended June 30, 2013. The Fund's total returns at net asset value (NAV) underperformed both its comparative benchmark and the MSCI All Country World Index during the six-month reporting period.
This reporting period continued to be particularly challenging for JGV. The Fund's bottom-up, fundamental value style was out of favor for much of the period. In addition, the materials sector was the worst detractor for the period and led the Fund's NAV underperformance relative to the 80% MSCI ACWI/15% Barclays U.S. Aggregate Bond Index/5% Barclays U.S. High Yield Index benchmark during the period.
The sector's underperformance was led by the Fund's gold mine holdings, including Barrick Gold Corp., Kinross Gold Corp. and Newmont Mining Corp. During the reporting period, gold prices saw significant declines, from over $1,600 an ounce to just above $1,200 an ounce, the lowest level since August 2010. The sharp decline was the result of fears that the Federal Reserve would pull back on stimulus efforts, which in general, strengthens the dollar and weakens gold.
Gold miners should theoretically experience a premium due to operational leverage, they fared worst due to the weakness of gold prices. We believe this reflects reservations regarding the sustainability of gold commodity price growth, coupled with concerns about significantly rising costs of production.
The Fund's short equity holdings represented a limited percentage of the overall Fund, but the exposure detracted from the Fund's return during the period. As previously mentioned, we covered our relatively small short positions and focused on attractive investments on the long-equity side.
Downward pressures were mitigated by our holdings in the information technology sector, including Microsoft Corp, which helped to offset some of the underperformance from certain other sectors. Microsoft benefited from a very stable and growing enterprise business, which provides the firm with the majority of sales and earnings. Also helping performance was Electricite De France SA, which was the overall top contributor to performance. The company is the world's largest nuclear utility and gained market optimism from higher earnings guidance along with a potential increase in dividend.
Our covered call writing strategy detracted from the Fund's performance during the period given the positive equity market environment.
Nuveen Investments
6
Distribution Information
The following information regarding the Fund's distributions is current as of June 30, 2013, and likely will vary over time based on the Fund's investment activities and portfolio investment value changes.
During the current reporting period, the Fund's quarterly distributions to shareholders were as shown in the accompanying table.
| | Per Share
Amounts | |
| | JGV | |
March | | $ | 0.2900 | | |
June | | | 0.2650 | | |
Current Distribution Rate* | | | 8.21 | % | |
* Current Distribution Rate is based on the Fund's current annualized quarterly distribution divided by the Fund's current market price. The Fund's quarterly distributions to its shareholders may be comprised of ordinary income, net realized capital gains and, if at the end of the fiscal year the Fund's cumulative net ordinary income and net realized gains are less than the amount of the Fund's distributions, a return of capital for tax purposes.
The Fund has a managed distribution program. The goal of this program is to provide shareholders with relatively consistent and predictable cash flow by systematically converting the Fund's expected long-term return potential into regular distributions. As a result, regular distributions throughout the year are likely to include a portion of expected long-term gains (both realized and unrealized), along with net investment income.
Important points to understand about the managed distribution program are:
• The Fund seeks to establish a relatively stable distribution rate that roughly corresponds to the projected total return from its investment strategy over an extended period of time. However, you should not draw any conclusions about the Fund's past or future investment performance from its current distribution rate.
• Actual returns will differ from projected long-term returns (and therefore the Fund's distribution rate), at least over shorter time periods. Over a specific timeframe, the difference between actual returns and total distributions will be reflected in an increasing (returns exceed distributions) or a decreasing (distributions exceed returns) Fund net asset value.
• Each distribution is expected to be paid from some or all of the following sources:
• net investment income (regular interest and dividends),
• realized capital gains, and
• unrealized gains, or, in certain cases, a return of principal (non-taxable distributions).
• A non-taxable distribution is a payment of a portion of the Fund's capital. When the Fund's returns exceed distributions, it may represent portfolio gains generated, but not realized as a taxable capital gain. In periods when the Fund's returns fall short of distributions, the shortfall will represent a portion of your original principal, unless the shortfall is offset during other time periods over the life of your investment (previous or subsequent) when the Fund's total return exceeds distributions.
• Because distribution source estimates are updated during the year based on the Fund's performance and forecast for its current fiscal year (which is the calendar year for the Fund), estimates on the nature of your distribution provided at the time the distributions are paid may differ from both the tax information reported to you in your Fund's IRS Form 1099 statement provided at year end, as well as the ultimate economic sources of distributions over the life of your investment.
Nuveen Investments
7
The following table provides estimated information regarding the Fund's distributions and total return performance for the six months ended June 30, 2013. This information is provided on a tax basis rather than a generally accepted accounting principles (GAAP) basis. This information is intended to help you better understand whether the Fund's returns for the specified time period were sufficient to meet the Fund's distributions.
As of June 30, 2013 | | JGV | |
Inception date | | | 7/24/06 | | |
Six months ended June 30, 2013: | |
Per share distribution: | |
From net investment income | | $ | 0.26 | | |
From realized capital gains | | | 0.00 | | |
Return of capital | | | 0.30 | | |
Total per share distribution | | $ | 0.56 | | |
Annualized distribution rate on NAV | | | 8.02 | % | |
Average annual total returns: | |
Excluding retained gain tax credit/refund***: | |
6-Month (Cumulative) on NAV | | | (9.19 | )% | |
| 1-Year on NAV | | | (2.05 | )% | |
| 5-Year on NAV | | | 2.05 | % | |
Since inception on NAV | | | 3.56 | % | |
Including retained gain tax credit/refund***: | |
6-Month (Cumulative) on NAV | | | (9.19 | )% | |
| 1-Year on NAV | | | (2.05 | )% | |
| 5-Year on NAV | | | 2.05 | % | |
Since inception on NAV | | | 3.69 | % | |
*** The Fund elected to retain a portion of its realized long-term capital gains for the tax year ended December 31, 2007, and pay required federal corporate income taxes on this amount. As reported on Form 2439, shareholders on record date must include their pro-rata share of these gains on their applicable federal tax returns, and are entitled to take offsetting tax credits, for their pro-rata share of the taxes paid by the Fund. The total returns "Including retained gain tax credit/refund" include the economic benefit to shareholders on record date of these tax credits/refunds. The Fund had no retained capital gains for the tax years ended December 31, 2012 through December 31, 2008 or for the tax year ended December 31, 2006.
Share Repurchases
As of June 30, 2013, and since the inception of the Fund's repurchase program, the Fund has cumulatively repurchased and retired 191,600 shares, representing approximately 1.0% of its authorized shares for repurchase.
During the current reporting period, the Fund did not repurchase any of its outstanding common shares.
Share Other Information
As of June 30, 2013, and during the six-month reporting period, the Fund's share price was trading at a premium/(discount) to its NAV as shown in the accompanying table.
| | JGV | |
Share NAV | | $ | 13.96 | | |
Share Price | | $ | 12.91 | | |
Premium/(Discount) to NAV | | | (7.52 | )% | |
6-Month Average Premium/(Discount) to NAV | | | (7.52 | )% | |
Nuveen Investments
8
Fund shares are not guaranteed or endorsed by any bank or other insured depository institution, and are not federally insured by the Federal Deposit Insurance Corporation. Shares of closed-end funds are subject to investment risks, including the possible loss of principal invested. Past performance is no guarantee of future results. Fund common shares are subject to a variety of risks, including:
Investment, Market and Price Risk. An investment in common shares is subject to investment risk, including the possible loss of the entire principal amount that you invest. Your investment in common shares represents an indirect investment in the corporate securities owned by the Fund, which generally trade in the over-the-counter markets. Shares of closed-end investment companies like the Fund frequently trade at a discount to NAV. Your common shares at any point in time may be worth less than your original investment, even after taking into account the reinvestment of Fund dividends and distributions.
Tax Risk. The tax treatment of Fund distributions may be affected by new IRS interpretations of the Internal Revenue Code and future changes in tax laws and regulations. This is particularly true for funds employing a managed distribution program.
Common Stock Risk. Common stock returns often have experienced significant volatility.
Issuer Credit Risk. This is the risk that a security in the Fund's portfolio will fail to make dividend or interest payments when due.
Call Option Risks. The value of call options sold (written) by the Fund will fluctuate. The Fund may not participate in any appreciation of its equity portfolio as fully as it would if the Fund did not sell call options. In addition, the Fund will continue to bear the risk of declines in the value of the equity portfolio.
Derivatives Strategy Risk. Derivative securities, such as calls, puts, warrants, swaps and forwards, carry risks different from, and possibly greater than, the risks associated with the underlying investments.
Interest Rate Risk. Fixed-income securities such as bonds, preferred, convertible and other debt securities will decline in value if market interest rates rise.
Value Stock Risks. Value stocks are securities that the manager believes to be undervalued, or mispriced. If the manager's assessment of a company's prospects is wrong, the price of the company's common stock or other equity securities may fall, or may not approach the value that the manager has placed on them.
Convertible Securities Risk. Convertible securities generally offer lower interest or dividend yields than non-convertible fixed-income securities of similar credit quality.
Counterparty Risk. To the extent that the Fund's derivative investments are purchased or sold in over-the-counter transactions, the Fund will be exposed to the risk that counterparties to these transactions will be unable to meet their obligations.
Currency Risk. Changes in exchange rates will affect the value of the Fund's investments.
Warrants and Rights Risks. Warrants and rights are subject to the same market risks as common stocks, but are more volatile in price.
Non-U.S. Securities Risk. Investments in non-U.S securities involve special risks not typically associated with domestic investments including currency risk and adverse political, social and economic development. These risks often are magnified in emerging markets.
Nuveen Investments
9
Reinvestment Risk. If market interest rates decline, income earned from the Fund's portfolio may be reinvested at rates below that of the original bond that generated the income.
Nuveen Investments
10
Nuveen Investments
11
Nuveen Global Value Opportunities Fund (JGV)
Performance Overview and Holding Summaries as of June 30, 2013
Average Annual Total Returns as of June 30, 2013
| | | Cumulative | | Average Annual | |
| | | 6-Month | | 1-Year | | 5-Year | | Since
Inception1 | |
JGV at NAV | | | (9.19 | )% | | | (2.05 | )% | | | 2.05 | % | | | 3.56 | % | |
JGV at Share Price | | | (9.84 | )% | | | (1.64 | )% | | | 1.65 | % | | | 2.32 | % | |
JGV Blended Index (Comparative Benchmark) | | | 4.55 | % | | | 13.56 | % | | | 3.57 | % | | | 4.68 | % | |
MSCI All Country World Index | | | 6.05 | % | | | 16.57 | % | | | 2.30 | % | | | 3.81 | % | |
Average Annual Total Returns as of June 30, 20132 (including retained gain tax credit/refund)
| | Cumulative | | Average Annual | |
| | 6-Month | | 1-Year | | 5-Year | | Since
Inception1 | |
JGV at NAV | | | (9.19 | )% | | | (2.05 | )% | | | 2.05 | % | | | 3.69 | % | |
JGV at Share Price | | | (9.84 | )% | | | (1.64 | )% | | | 1.65 | % | | | 2.45 | % | |
Past performance is not predictive of future results. Current performance may be higher or lower than the data shown. Returns do not reflect the deduction of taxes that shareholders may have to pay on Fund distributions or upon the sale of Fund shares. Comparative index return information is provided for the Fund's shares at NAV only. Indexes are not available for direct investment.
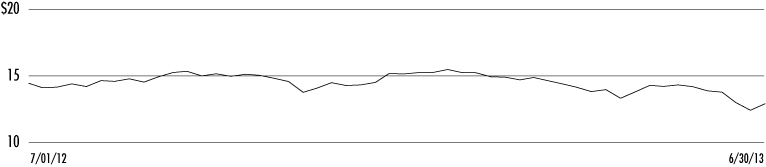
Common Share Price Performance — Weekly Closing Price
Nuveen Investments
12
Portfolio Allocation3,4
(as a % of total investments)
Common Stocks | | | 82.9 | % | |
Short-Term Investments | | | 8.3 | % | |
Corporate Bonds | | | 4.0 | % | |
Mortgage-Backed Securities | | | 2.0 | % | |
Convertible Bonds | | | 1.2 | % | |
Convertible Preferred Securities | | | 0.9 | % | |
Sovereign Debt | | | 0.7 | % | |
Warrants | | | 0.0 | %5 | |
Portfolio Composition3,4
(as a % of total investments)
Electric Utilities | | | 14.2 | % | |
Metals & Mining | | | 11.4 | % | |
Wireless Telecommunication Services | | | 9.4 | % | |
Oil, Gas & Consumable Fuels | | | 9.3 | % | |
Diversified Telecommunication
Services | | | 8.3 | % | |
Commercial Banks | | | 7.4 | % | |
Insurance | | | 5.3 | % | |
Capital Markets | | | 3.9 | % | |
Pharmaceuticals | | | 2.0 | % | |
Residentials | | | 2.0 | % | |
Short-Term Investments | | | 8.3 | % | |
Other | | | 18.5 | % | |
Country Allocation3,4
(as a % of total investments)
United States | | | 32.0 | % | |
France | | | 10.4 | % | |
Canada | | | 6.4 | % | |
Brazil | | | 5.9 | % | |
Italy | | | 4.4 | % | |
Russia | | | 4.3 | % | |
Switzerland | | | 4.0 | % | |
United Kingdom | | | 3.9 | % | |
Japan | | | 3.9 | % | |
India | | | 3.2 | % | |
Belgium | | | 2.9 | % | |
Egypt | | | 2.8 | % | |
Hong Kong | | | 2.5 | % | |
Portugal | | | 2.2 | % | |
Netherlands | | | 2.2 | % | |
Other | | | 9.0 | % | |
Refer to the Glossary of Terms Used in this Report for further definition of the terms used within this page.
1 Since inception returns are from 7/24/06.
2 As previously explained in the Share Distribution and Price Information section of this report, the Fund elected to retain a portion of its realized long-term capital gains for the tax year ended December 31, 2007, and pay required federal corporate income taxes on these amounts. These standardized total returns include the economic benefit to Common shareholders of record of this tax credit/refund. The Fund had no retained capital gains for the tax years ended December 31, 2012 through December 31, 2008 or for the tax year ended December 31, 2006.
3 Holdings are subject to change.
4 Excluding investments in derivatives.
5 Rounds to less than 0.1%.
Nuveen Investments
13
Shareholder Meeting Report
The annual meeting of shareholders was held in the offices of Nuveen Investments on April 3, 3013; at this meeting the shareholders were asked to vote on the election of Board Members.
| | JGV | |
| | Common
Shares | |
Approval of the Board Members was reached as follows: | |
William C. Hunter | |
For | | | 17,573,793 | | |
Withhold | | | 343,800 | | |
Total | | | 17,917,593 | | |
Judith M. Stockdale | |
For | | | 17,549,630 | | |
Withhold | | | 367,963 | | |
Total | | | 17,917,593 | | |
Carole E. Stone | |
For | | | 17,556,590 | | |
Withhold | | | 361,003 | | |
Total | | | 17,917,593 | | |
Virginia L. Stringer | |
For | | | 17,547,600 | | |
Withhold | | | 369,993 | | |
Total | | | 17,917,593 | | |
Nuveen Investments
14
Nuveen Global Value Opportunities Fund
Portfolio of Investments
June 30, 2013 (Unaudited)
| Shares | | Description (1) | | Value | |
| | | Common Stocks – 85.0% | |
| | | Aerospace & Defense – 0.9% | |
| | 492,000 | | | Finmeccanica SPA, (2) | | $ | 2,464,304 | | |
| | | Capital Markets – 4.0% | |
| | 148,000 | | | Credit Suisse Group AG, Sponsored ADR, (6) | | | 3,916,080 | | |
| | 1,333,437 | | | EFG-Hermes Holdings SAE | | | 1,407,647 | | |
| | 315,000 | | | UBS AG, (6) | | | 5,339,250 | | |
| | | Total Capital Markets | | | 10,662,977 | | |
| | | Commercial Banks – 7.0% | |
| | 594,000 | | | Banco Santander S.A. | | | 3,607,099 | | |
| | 418,000 | | | Bangkok Bank Public Co. Ltd, NVDR, WI/DD | | | 2,749,379 | | |
| | 218,000 | | | Bank of Baroda | | | 2,116,719 | | |
| | 87,500 | | | KB Financial Group Inc., Sponsored ADR | | | 2,592,625 | | |
| | 1,280,000 | | | Sberbank of Russia, PFD, (3) | | | 2,725,472 | | |
| | 1,050,000 | | | Sumitomo Mitsui Trust Holdings Incorporated | | | 4,901,694 | | |
| | | Total Commercial Banks | | | 18,692,988 | | |
| | | Communications Equipment – 0.9% | |
| | 652,500 | | | Nokia Corporation, Sponsored ADR, (2), (6) | | | 2,440,350 | | |
| | | Computers & Peripherals – 0.5% | |
| | 21,300 | | | Western Digital Corporation, (6) | | | 1,322,517 | | |
| | | Construction Materials – 0.9% | |
| | 1,533,000 | | | India Cements Ltd., GDR, Reg S, 144A | | | 1,464,015 | | |
| | 4,172,000 | | | Luks Group Vietnam Holdings Company Limited | | | 968,225 | | |
| | | Total Construction Materials | | | 2,432,240 | | |
| | | Diversified Telecommunication Services – 8.5% | |
| | 236,000 | | | Belgacom S.A. | | | 5,294,407 | | |
| | 117,500 | | | Nippon Telegraph and Telephone Corporation, ADR | | | 3,056,175 | | |
| | 1,394,920 | | | Telecom Egypt SAE | | | 2,288,877 | | |
| | 10,060,000 | | | Telecom Italia S.p.A. | | | 5,591,391 | | |
| | 165,000 | | | Telefonica Brasil S.A., PFD | | | 3,726,892 | | |
| | 147,000 | | | Vivendi S.A. | | | 2,784,033 | | |
| | | Total Diversified Telecommunication Services | | | 22,741,775 | | |
| | | Electric Utilities – 14.5% | |
| | 383,542 | | | Centrais Eletricas Brasileiras S.A., Sponsored ADR, Class B, PFD | | | 1,522,662 | | |
| | 1,880,000 | | | Centrais Eletricas Brasileiras S.A., Class B, PFD | | | 7,355,368 | | |
| | 1,915,000 | | | EDP—Energias de Portugal, S.A. | | | 6,169,330 | | |
| | 553,000 | | | Electricite de France S.A. | | | 12,837,848 | | |
| | 207,000 | | | Exelon Corporation | | | 6,392,160 | | |
| | 3,178,184 | | | RusHydro, Sponsored ADR | | | 4,649,683 | | |
| | | Total Electric Utilities | | | 38,927,051 | | |
Nuveen Investments
15
Nuveen Global Value Opportunities Fund (continued)
Portfolio of Investments June 30, 2013 (Unaudited)
| Shares | | Description (1) | | Value | |
| | | Electrical Equipment – 1.8% | |
| | 114,000 | | | Alstom S.A. | | $ | 3,733,443 | | |
| | 72,390 | | | Areva S.A. | | | 1,123,650 | | |
| | | Total Electrical Equipment | | | 4,857,093 | | |
| | | Electronic Equipment & Instruments – 1.4% | |
| | 201,500 | | | Ingram Micro, Inc., Class A, (2) | | | 3,826,485 | | |
| | | Energy Equipment & Services – 1.6% | |
| | 308,000 | | | Weatherford International Ltd, (2), (6) | | | 4,219,600 | | |
| | | Hotels, Restaurants & Leisure – 0.7% | |
| | 201,000 | | | Orascom Development Holding AG, (2) | | | 1,861,998 | | |
| | | Household Durables – 0.7% | |
| | 623,769 | | | Oriental Weavers Carpet | | | 1,777,284 | | |
| | | Insurance – 5.4% | |
| | 911,500 | | | Aegon N.V. | | | 6,097,184 | | |
| | 78,000 | | | Ageas N.V. | | | 2,738,736 | | |
| | 128,500 | | | American International Group, Inc. | | | 5,743,950 | | |
| | | Total Insurance | | | 14,579,870 | | |
| | | IT Services – 0.6% | |
| | 121,900 | | | SAIC, Inc., (6) | | | 1,698,067 | | |
| | | Metals & Mining – 10.6% | |
| | 880,000 | | | Banro Corporation, Private Stock, (2), (3) | | | 686,127 | | |
| | 770,000 | | | Banro Corporation, (2) | | | 577,500 | | |
| | 460,000 | | | Barrick Gold Corporation | | | 7,240,400 | | |
| | 144,000 | | | Freeport-McMoRan Copper & Gold, Inc. | | | 3,975,840 | | |
| | 230,000 | | | Impala Platinum Holdings Limited | | | 2,163,874 | | |
| | 950,000 | | | Kinross Gold Corporation, (6) | | | 4,845,000 | | |
| | 127,000 | | | Newmont Mining Corporation, (6) | | | 3,803,650 | | |
| | 200,000 | | | Silver Standard Resources, Inc., (2), (6) | | | 1,268,000 | | |
| | 654,717 | | | Turquoise Hill Resources Limited, (2) | | | 3,882,472 | | |
| | | Total Metals & Mining | | | 28,442,863 | | |
| | | Multiline Retail – 0.8% | |
| | 40,000 | | | Dollar Tree, Inc., (2), (6) | | | 2,033,600 | | |
| | | Oil, Gas & Consumable Fuels – 9.0% | |
| | 61,800 | | | Apache Corporation, (6) | | | 5,180,694 | | |
| | 544,000 | | | Arch Coal Inc., (6) | | | 2,056,320 | | |
| | 2,145 | | | Gazprom OAO, Sponsored ADR, (3) | | | 14,093 | | |
| | 676,000 | | | Gazprom OAO, Sponsored GDR | | | 4,448,080 | | |
| | 208,000 | | | Royal Dutch Shell PLC, Class B Shares | | | 6,883,939 | | |
| | 113,750 | | | Total S.A. | | | 5,553,089 | | |
| | | Total Oil, Gas & Consumable Fuels | | | 24,136,215 | | |
| | | Paper & Forest Products – 1.0% | |
| | 402,500 | | | Stora Enso Oyj, Class R Shares | | | 2,698,157 | | |
| | | Pharmaceuticals – 2.1% | |
| | 205,000 | | | Mitsubishi Tanabe Pharma Corporation | | | 2,656,029 | | |
| | 8,007,000 | | | United Laboratories International Holdings Ltd | | | 2,880,272 | | |
| | | Total Pharmaceuticals | | | 5,536,301 | | |
Nuveen Investments
16
| Shares | | Description (1) | | Value | |
| | | Real Estate Management & Development – 0.5% | |
| | 108,623 | | | Solidere, GDR, 144A, (3) | | $ | 1,217,664 | | |
| | | Semiconductors & Equipment – 1.9% | |
| | 211,000 | | | Intel Corporation | | | 5,110,420 | | |
| | | Software – 1.2% | |
| | 90,000 | | | Microsoft Corporation, (6) | | | 3,107,700 | | |
| | | Textiles, Apparel & Luxury Goods – 0.0% | |
| | 2,506,000 | | | China Hongxing Sports Limited, (4) | | | 14,216 | | |
| | | Tobacco – 0.8% | |
| | 170,000 | | | Eastern Tobacco Co. | | | 2,227,647 | | |
| | | Wireless Telecommunication Services – 7.7% | |
| | 1,045,000 | | | Bharti Airtel Limited | | | 5,106,740 | | |
| | 285,000 | | | China Mobile Limited | | | 2,983,735 | | |
| | 64,000 | | | Millicom International Cellular S.A. | | | 4,610,489 | | |
| | 222,000 | | | NII Holdings Inc., Class B, (2) | | | 1,480,740 | | |
| | 210,000 | | | TIM Participacoes S.A., Sponsored ADR | | | 3,906,000 | | |
| | 187,000 | | | Turkcell Iletisim Hizmetleri A.S., Sponsored ADR, (2) | | | 2,687,190 | | |
| | | Total Wireless Telecommunication Services | | | 20,774,894 | | |
| | | Total Common Stocks (cost $284,574,936) | | | 227,804,276 | | |
Principal
Amount (000) | | Description (1) | | Coupon | | Maturity | | Ratings (5) | | Value | |
| | | Mortgage-Backed Securities – 2.0% | |
| | | Residentials – 2.0% | |
$ | 10,141 | | | Fannie Mae Guaranteed REMIC Pass Through Certificates, Series 2011-16, (I/O) | | | 4.000 | % | | 3/25/26 | | Aaa | | $ | 720,793 | | |
| | 5,274 | | | Fannie Mae Mortgage Interest Strips, Series 345-17, (I/O) | | | 4.500 | % | | 5/01/20 | | Aaa | | | 328,932 | | |
| | 75 | | | Fannie Mae Mortgage Pool 100195 | | | 2.708 | % | | 8/20/22 | | Aaa | | | 75,050 | | |
| | 51 | | | Fannie Mae Mortgage Pool 713939 | | | 2.045 | % | | 4/01/33 | | Aaa | | | 53,583 | | |
| | 12 | | | Fannie Mae Mortgage Pool 708743 | | | 2.159 | % | | 6/01/33 | | Aaa | | | 12,919 | | |
| | 101 | | | Fannie Mae Mortgage Pool 776486 | | | 2.050 | % | | 3/01/34 | | Aaa | | | 106,983 | | |
| | 378 | | | Fannie Mae Mortgage Pool 816594 | | | 2.042 | % | | 2/01/35 | | Aaa | | | 400,221 | | |
| | 1,367 | | | Fannie Mae Real Estate Mortgage Investment Conduit, Pass Through Certificates,
Series 2011-81, (I/O) | | | 3.500 | % | | 8/25/26 | | Aaa | | | 156,112 | | |
| | 173 | | | Fannie Mae, Collateralized Mortgage Obligations, Series 2004-86, Class KI, (I/O) | | | 4.500 | % | | 5/25/19 | | Aaa | | | 4,792 | | |
| | 626 | | | Federal Home Loan Mortgage Corporation, Collateralized Mortgage Obligation,
Pool FH 780184 | | | 2.377 | % | | 1/01/33 | | Aaa | | | 664,143 | | |
| | 44 | | | Federal Home Loan Mortgage Corporation, Collateralized Mortgage Obligation,
Pool 780284 | | | 2.453 | % | | 2/01/33 | | Aaa | | | 44,098 | | |
| | 68 | | | Federal Home Loan Mortgage Corporation, Mortgage Pool 2890, Class KI, (I/O) | | | 4.500 | % | | 2/15/19 | | Aaa | | | 1,399 | | |
| | 205 | | | Federal Home Loan Mortgage Corporation, Mortgage Pool, FHR 2906 EI, (I/O) | | | 4.500 | % | | 1/15/19 | | Aaa | | | 5,926 | | |
| | 96 | | | Federal Home Loan Mortgage Corporation, Mortgage Pool, Series 2627 JI, (I/O) | | | 4.500 | % | | 5/15/18 | | Aaa | | | 5,510 | | |
| | 36 | | | Federal Home Loan Mortgage Corporation, Pool 789045 | | | 2.375 | % | | 2/01/32 | | Aaa | | | 38,446 | | |
| | 9,269 | | | Federal Home Loan Mortgage Corporation, REMIC, Series 3766, (I/O) | | | 3.500 | % | | 11/15/20 | | Aaa | | | 779,063 | | |
| | 6,413 | | | Federal Home Loan Mortgage Corporation, REMIC, Series 3879, (I/O) | | | 3.500 | % | | 3/15/26 | | Aaa | | | 639,018 | | |
| | 1,161 | | | Federal Home Loan Mortgage Corporation, REMIC, Series 3906, Class EI, (I/O) | | | 3.500 | % | | 5/15/26 | | Aaa | | | 135,844 | | |
| | 1,818 | | | Freddie Mac Multiclass Certificates, Series 3804, (I/O) | | | 3.500 | % | | 2/15/25 | | Aaa | | | 135,563 | | |
| | 2,111 | | | Freddie Mac Multiclass Certificates, Series 3855, (I/O) | | | 3.500 | % | | 1/15/25 | | Aaa | | | 141,485 | | |
| | 971 | | | GNMA Mortgage Pool G2 81832 | | | 1.625 | % | | 1/20/37 | | Aaa | | | 1,014,118 | | |
| | 40,390 | | | Total Residentials | | | | | | | | | | | | | | | 5,463,998 | | |
$ | 40,390 | | | Total Mortgage-Backed Securities (cost $6,558,505) | | | | | | | | | | | | | | | 5,463,998 | | |
Nuveen Investments
17
Nuveen Global Value Opportunities Fund (continued)
Portfolio of Investments June 30, 2013 (Unaudited)
| Shares | | Description (1) | | Coupon | | | | Ratings (5) | | Value | |
| | | Convertible Preferred Securities – 0.9% | |
| | | Communications Equipment – 0.9% | |
| | 2,550 | | | Lucent Technologies Capital Trust I | | | 7.750 | % | | | | | | CCC- | | $ | 2,409,750 | | |
| | | Total Convertible Preferred Securities (cost $1,521,120) | | | | | | | | | | | | | | | 2,409,750 | | |
Principal
Amount (000) | | Description (1) | | Coupon | | Maturity | | Ratings (5) | | Value | |
| | | Convertible Bonds – 1.2% | |
| | | Biotechnology – 1.2% | |
$ | 4,200 | | | Dendreon Corporation, Convertible Bond | | | 2.875 | % | | 1/15/16 | | N/R | | $ | 3,150,000 | | |
$ | 4,200 | | | Total Convertible Bonds (cost $3,543,409) | | | | | | | | | | | | | | | 3,150,000 | | |
Principal
Amount (000) | | Description (1) | | Coupon | | Maturity | | Ratings (5) | | Value | |
| | | Corporate Bonds – 4.1% | |
| | | Commercial Banks – 0.6% | |
$ | 900 | | | The State Export-Import Bank of the Ukraine, Loan Participations,
Series 2010, Reg S | | | 8.375 | % | | 4/27/15 | | | B | | | $ | 875,250 | | |
| | 900 | | | Ukraine Export-Import Bank Loan Participation with Credit Suisse International | | | 5.793 | % | | 2/09/16 | | Caa1 | | | 756,000 | | |
| | 1,800 | | | Total Commercial Banks | | | | | | | | | | | | | | | 1,631,250 | | |
| | | Metals & Mining – 1.1% | |
| | 4,400 | | | Banro Corporation, 144A | | | 10.000 | % | | 3/01/17 | | N/R | | | 2,860,000 | | |
| | | Oil, Gas & Consumable Fuels – 0.6% | |
| | 1,540 | | | Arch Coal Inc. | | | 8.750 | % | | 8/01/16 | | B- | | | 1,540,000 | | |
| | | Wireless Telecommunication Services – 1.8% | |
| | 6,400 | | | NII Capital Corporation | | | 7.625 | % | | 4/01/21 | | CCC | | | 4,976,000 | | |
$ | 14,140 | | | Total Corporate Bonds (cost $12,133,508) | | | | | | | | | | | | | | | 11,007,250 | | |
Principal
Amount (000) | | Description (1) | | Coupon | | Maturity | | Ratings (5) | | Value | |
| | | Sovereign Debt – 0.7% | |
| | | Argentina – 0.7% | |
$ | 3,000 | | | Province of Buenos Aires, 144A | | | 10.875 | % | | 1/26/21 | | B- | | $ | 1,965,000 | | |
| | | Total Sovereign Debt (cost $2,886,017) | | | | | | | | | | | | | | | 1,965,000 | | |
| Shares | | Description (1) | | | | | | | | Value | |
| | | Warrants – 0.0% | |
| | | Metals & Mining – 0.0% | |
| | 89,280 | | | Banro Corporation, 144A, (2), (3) | | | | | | | | | | | | | | $ | 4,464 | | |
| | | Total Warrants (cost $—) | | | | | | | | | | | | | | | 4,464 | | |
Nuveen Investments
18
Principal
Amount (000) | | Description (1) | | Coupon | | Maturity | | Value | |
| | | Short-Term Investments – 8.5% | |
$ | 22,847 | | | Repurchase Agreement with State Street Bank, dated 6/28/13, repurchase
price $22,846,607, collateralized by: $13,395,000 U.S. Treasury Notes, 0.625%,
due 5/31/17, value $13,181,644 and $7,860,000 U.S. Treasury Bonds, 5.250%,
due 2/15/29, value $10,126,439 | | | 0.010 | % | | 7/01/13 | | $ | 22,846,588 | | |
| | | Total Short-Term Investments (cost $22,846,588) | | | | | | | 22,846,588 | | |
| | | Total Investments (cost $334,064,083) – 102.4% | | | | | | | 274,651,326 | | |
| | | Other Assets Less Liabilities – (2.4)% (7) | | | | | | | (6,474,270 | ) | |
| | | Net Assets – 100% | | | | | | $ | 268,177,056 | | |
Investments in Derivatives as of June 30, 2013
Call Options Written outstanding:
Number of
Contracts | | Type | | Notional
Amount (8) | | Expiration
Date | | Strike
Price | | Value (7) | |
| | (618 | ) | | Apache Corporation | | $ | (5,253,000 | ) | | 1/18/14 | | $ | 85 | | | $ | (367,710 | ) | |
| | (2,720 | ) | | Arch Coal Inc. | | | (1,632,000 | ) | | 10/19/13 | | | 6 | | | | (35,360 | ) | |
| | (1,036 | ) | | Credit Suisse Group AG | | | (3,211,600 | ) | | 9/21/13 | | | 31 | | | | (20,720 | ) | |
| | (444 | ) | | Credit Suisse Group AG | | | (1,287,600 | ) | | 12/21/13 | | | 29 | | | | (55,500 | ) | |
| | (400 | ) | | Dollar Tree, Inc. | | | (1,800,000 | ) | | 8/17/13 | | | 45 | | | | (244,000 | ) | |
| | (2,030 | ) | | Kinross Gold Corporation | | | (1,827,000 | ) | | 8/17/13 | | | 9 | | | | (4,060 | ) | |
| | (4,750 | ) | | Kinross Gold Corporation | | | (2,850,000 | ) | | 11/16/13 | | | 6 | | | | (175,750 | ) | |
| | (900 | ) | | Microsoft Corporation | | | (2,970,000 | ) | | 8/17/13 | | | 33 | | | | (182,250 | ) | |
| | (950 | ) | | Newmont Mining Corporation | | | (3,135,000 | ) | | 8/17/13 | | | 33 | | | | (70,300 | ) | |
| | (320 | ) | | Newmont Mining Corporation | | | (1,088,000 | ) | | 12/21/13 | | | 34 | | | | (57,280 | ) | |
| | (6,525 | ) | | Nokia Corporation | | | (2,610,000 | ) | | 10/19/13 | | | 4 | | | | (212,063 | ) | |
| | (1,219 | ) | | SAIC, Inc. | | | (1,340,900 | ) | | 8/17/13 | | | 11 | | | | (237,705 | ) | |
| | (2,000 | ) | | Silver Standard Resources, Inc. | | | (2,600,000 | ) | | 9/21/13 | | | 13 | | | | (15,000 | ) | |
| | (1,575 | ) | | UBS AG | | | (2,835,000 | ) | | 12/21/13 | | | 18 | | | | (141,750 | ) | |
| | (1,540 | ) | | Weatherford International Ltd | | | (2,310,000 | ) | | 8/17/13 | | | 15 | | | | (44,660 | ) | |
| | (1,540 | ) | | Weatherford International Ltd | | | (1,848,000 | ) | | 1/18/14 | | | 12 | | | | (393,470 | ) | |
| | (213 | ) | | Western Digital Corporation | | | (1,278,000 | ) | | 7/20/13 | | | 60 | | | | (64,965 | ) | |
| | (28,780 | ) | | Total Call Options Written (premiums received $2,600,946) | | $ | (39,876,100 | ) | | | | | | | | | | $ | (2,322,543 | ) | |
For Fund portfolio compliance purposes, the Fund's industry classifications refer to any one or more of the industry sub-classifications used by one or more widely recognized market indexes or ratings group indexes, and/or as defined by Fund management. This definition may not apply for purposes of this report, which may combine industry sub-classifications into sectors for reporting ease.
(1) All percentages shown in the Portfolio of Investments are based on net assets.
(2) Non-income producing; issuer has not declared a dividend within the past twelve months.
(3) For fair value measurement disclosure purposes, Common Stock and Warrant classified as Level 2. See Notes to Financial Statements, Footnote 2—Investment Valuation and Fair Value Measurements for more information.
(4) Investment valued at fair value using methods determined in good faith by, or at the discretion of, the Board of Trustees. For fair value disclosure purposes, investment classified as Level 3. See Notes to Financial Statements, Footnote 2—Investment Valuation and Fair Value Measurements for more information.
(5) Ratings: Using the highest of Standard & Poor's Group ("Standard & Poor's"), Moody's Investors Service, Inc. ("Moody's") or Fitch, Inc. ("Fitch") rating. Ratings below BBB by Standard & Poor's, Baa by Moody's or BBB by Fitch are considered to be below investment grade. Holdings designated N/R are not rated by any of these national rating agencies.
(6) Investment, or portion of investment, has been pledged as collateral for call options written during and/or as of the end of the reporting period.
(7) Other Assets Less Liabilities includes the Value of derivative instruments as listed within Investments in Derivatives as of the end of the reporting period.
(8) For disclosure purposes, Notional Amount is calculated by multiplying the Number of Contracts by the Strike Price by 100.
144A Investment is exempt from registration under Rule 144A of the Securities Act of 1933, as amended. These investments may only be resold in transactions exempt from registration, which are normally those transactions with qualified institutional buyers.
WI/DD Investment, or portion of investment, purchased on a when-issued or delayed delivery basis.
Reg S Regulation S allows U.S. companies to sell securities to persons or entities located outside of the United States without registering those securities with the Securities and Exchange Commission. Specifically, Regulation S provides a safe harbor from the registration requirements of the Securities Act for the offers and sales of securities by both foreign and domestic issuers that are made outside the United States.
ADR American Depositary Receipt.
GDR Global Depositary Receipt.
NVDR Non-Voting Depositary Receipt.
I/O Interest only security.
N/R Not rated.
See accompanying notes to financial statements.
Nuveen Investments
19
Statement of
ASSETS & LIABILITIES
June 30, 2013 (Unaudited)
Assets | |
Investments, at value (cost $334,064,083) | | $ | 274,651,326 | | |
Cash | | | 121,901 | | |
Cash denominated in foreign currencies (cost $326,833) | | | 325,526 | | |
Deposits with brokers | | | 2,241,240 | | |
Receivables: | |
Dividends | | | 1,927,255 | | |
Interest | | | 680,864 | | |
Investments sold | | | 587,252 | | |
Paydowns | | | 2,022 | | |
Reclaims | | | 61,405 | | |
Other assets | | | 25,928 | | |
Total assets | | | 280,624,719 | | |
Liabilities | |
Call options written, at value (premiums received $2,600,946) | | | 2,322,543 | | |
Payables: | |
Dividends | | | 4,846,551 | | |
Investments purchased | | | 4,858,873 | | |
Accrued expenses: | |
Management fees | | | 221,157 | | |
Trustees fees | | | 23,086 | | |
Other | | | 175,453 | | |
Total liabilities | | | 12,447,663 | | |
Net assets | | $ | 268,177,056 | | |
Shares outstanding | | | 19,210,609 | | |
Net asset value per share outstanding | | $ | 13.96 | | |
Net assets consist of: | |
Shares, $.01 par value per share | | $ | 192,106 | | |
Paid-in surplus | | | 352,494,757 | | |
Undistributed (Over-distribution of) net investment income | | | (7,453,526 | ) | |
Accumulated net realized gain (loss) | | | (17,824,311 | ) | |
Net unrealized appreciation (depreciation) | | | (59,231,970 | ) | |
Net assets | | $ | 268,177,056 | | |
Authorized shares | | | Unlimited | | |
See accompanying notes to financial statements.
Nuveen Investments
20
Statement of
OPERATIONS
Six Months Ended June 30, 2013 (Unaudited)
Investment Income | |
Dividends (net of foreign tax withheld of $607,734) | | $ | 5,681,489 | | |
Interest | | | 1,068,308 | | |
Total investment income | | | 6,749,797 | | |
Expenses | |
Management fees | | | 1,426,545 | | |
Dividends on securities sold short | | | 20,598 | | |
Shareholder servicing agent fees and expenses | | | 541 | | |
Custodian fees and expenses | | | 175,599 | | |
Trustees fees and expenses | | | 3,712 | | |
Professional fees | | | 33,929 | | |
Shareholder reporting expenses | | | 43,962 | | |
Stock exchange listing fees | | | 4,258 | | |
Investor relations expenses | | | 37,390 | | |
Other expenses | | | 28,326 | | |
Total expenses | | | 1,774,860 | | |
Net investment income (loss) | | | 4,974,937 | | |
Realized and Unrealized Gain (Loss) | |
Net realized gain (loss) from: | | | |
Investments and foreign currency | | | (12,050,082 | ) | |
Call options written | | | 751,085 | | |
Securities sold short | | | (6,147,495 | ) | |
Change in net unrealized appreciation (depreciation) of: | | | |
Investments and foreign currency | | | (19,168,626 | ) | |
Call options written | | | (337,369 | ) | |
Securities sold short | | | 4,225,047 | | |
Net realized and unrealized gain (loss) | | | (32,727,440 | ) | |
Net increase (decrease) in net assets from operations | | $ | (27,752,503 | ) | |
See accompanying notes to financial statements.
Nuveen Investments
21
Statement of
CHANGES in NET ASSETS (Unaudited)
| | | Six Months
Ended
6/30/13 | | Year
Ended
12/31/12 | |
Operations | |
Net investment income (loss) | | $ | 4,974,937 | | | $ | 8,164,011 | | |
Net realized gain (loss) from: | |
Investments and foreign currency | | | (12,050,082 | ) | | | 3,184,706 | | |
Call options written | | | 751,085 | | | | 8,688,621 | | |
Put options purchased | | | — | | | | (150,006 | ) | |
Securities sold short | | | (6,147,495 | ) | | | (2,876,552 | ) | |
Change in net unrealized appreciation (depreciation) of: | |
Investments and foreign currency | | | (19,168,626 | ) | | | (9,617,925 | ) | |
Call options written | | | (337,369 | ) | | | (1,946,915 | ) | |
Put options purchased | | | — | | | | 149,336 | | |
Securities sold short | | | 4,225,047 | | | | 568,589 | | |
Net increase (decrease) in net assets from operations | | | (27,752,503 | ) | | | 6,163,865 | | |
Distributions to Shareholders | |
From and in excess of net investment income | | | (10,661,888 | ) | | | — | | |
From net investment income | | | — | | | | (9,486,440 | ) | |
From accumulated net realized gains | | | — | | | | (6,433,347 | ) | |
Return of capital | | | — | | | | (8,576,202 | ) | |
Increase (decrease) in net assets from distributions to shareholders | | | (10,661,888 | ) | | | (24,495,989 | ) | |
Capital Share Transactions | |
Cost of shares repurchased or retired | | | — | | | | (33,550 | ) | |
Net proceeds from shares issued to shareholders due to reinvestment of distributions | | | — | | | | — | | |
Net increase (decrease) in net assets from capital share transactions | | | — | | | | (33,550 | ) | |
Net increase (decrease) in net assets | | | (38,414,391 | ) | | | (18,365,674 | ) | |
Net assets at the beginning of period | | | 306,591,447 | | | | 324,957,121 | | |
Net assets at the end of period | | $ | 268,177,056 | | | $ | 306,591,447 | | |
Undistributed (Over-distribution of) net investment income at the end of period | | $ | (7,453,526 | ) | | $ | (1,766,575 | ) | |
See accompanying notes to financial statements.
Nuveen Investments
22
Nuveen Investments
23
Financial
HIGHLIGHTS (Unaudited)
Selected data for a share outstanding throughout each period:
| | | | |
| | | | | Investment Operations | | Less Distributions | | | | Total Returns | |
| | | Beginning
Net Asset
Value | | Net
Investment
Income
(Loss)(a) | | Net
Realized/
Unrealized
Gain (Loss) | | Total | | From Net
Investment
Income | | From
Accumulated
Net
Realized
Gains | | Return of
Capital | | Total | | Discount
from
Shares
Repurchased
and Retired | | Ending
Net Asset
Value | | Ending
Market
Value | | Based
on
Market
Value(b) | | Based
on
Net
Asset
Value(b) | |
Year Ended 12/31: | |
| | 2013 | (d) | | $ | 15.96 | | | $ | .26 | | | $ | (1.70 | ) | | $ | (1.44 | ) | | $ | (.56 | )*** | | $ | — | | | $ | — | | | $ | (.56 | ) | | $ | — | | | $ | 13.96 | | | $ | 12.91 | | | | (9.84 | )% | | | (9.19 | )% | |
| | 2012 | | | | 16.91 | | | | .42 | | | | (.10 | ) | | | .32 | | | | (.49 | ) | | | (.33 | ) | | | (.45 | ) | | | (1.27 | ) | | | — | * | | | 15.96 | | | | 14.91 | | | | (3.29 | ) | | | 2.03 | | |
| | 2011 | | | | 20.30 | | | | .46 | | | | (2.48 | ) | | | (2.02 | ) | | | (.83 | ) | | | (.46 | ) | | | (.08 | ) | | | (1.37 | ) | | | — | | | | 16.91 | | | | 16.76 | | | | (11.00 | ) | | | (10.28 | ) | |
| | 2010 | | | | 18.35 | | | | .36 | | | | 2.79 | | | | 3.15 | | | | (1.20 | ) | | | — | | | | — | | | | (1.20 | ) | | | — | * | | | 20.30 | | | | 20.30 | | | | 23.32 | | | | 17.75 | | |
| | 2009 | | | | 13.15 | | | | .43 | | | | 5.88 | | | | 6.31 | | | | (.92 | ) | | | (.19 | ) | | | — | | | | (1.11 | ) | | | — | * | | | 18.35 | | | | 17.53 | | | | 58.96 | | | | 48.93 | | |
| | 2008 | | | | 19.85 | | | | .46 | | | | (5.27 | ) | | | (4.81 | ) | | | (.43 | ) | | | (1.47 | ) | | | — | | | | (1.90 | ) | | | .01 | | | | 13.15 | | | | 11.89 | | | | (26.03 | ) | | | (24.85 | ) | |
(a) Per share Net Investment Income (Loss) is calculated using the average daily shares method.
Nuveen Investments
24
| | | Ratios/Supplemental Data | |
| | | | | Ratios to Average Net Assets(c) | | | |
| | | Ending Net
Assets (000) | | Expenses | | Net
Investment
Income (Loss) | | Portfolio
Turnover
Rate(e) | |
Year Ended 12/31: | |
| | 2013 | (d) | | $ | 268,177 | | | | 1.20 | %** | | | 3.37 | %** | | | 61 | % | |
| | 2012 | | | | 306,591 | | | | 1.20 | | | | 2.61 | | | | 51 | | |
| | 2011 | | | | 324,957 | | | | 1.16 | | | | 2.41 | | | | 92 | | |
| | 2010 | | | | 389,499 | | | | 1.15 | | | | 1.90 | | | | 76 | | |
| | 2009 | | | | 351,822 | | | | 1.16 | | | | 2.70 | | | | 38 | | |
| | 2008 | | | | 252,695 | | | | 1.14 | | | | 2.63 | | | | 60 | | |
(b) Total Return Based on Market Value is the combination of changes in the market price per share and the effect of reinvested dividend income and reinvested capital gains distributions, if any, at the average price paid per share at the time of reinvestment. The last dividend declared in the period, which is typically paid on the first business day of the following month, is assumed to be reinvested at the ending market price. The actual reinvestment for the last dividend declared in the period takes place over several days, and in some instances may not be based on the market price, so the actual reinvestment price may be different from the price used in the calculation. Total returns are not annualized.
Total Return Based on Net Asset Value is the combination of changes in net asset value, reinvested dividend income at net asset value and reinvested capital gains distributions at net asset value, if any. The last dividend declared in the period, which is typically paid on the first business day of the following month, is assumed to be reinvested at the ending net asset value. The actual reinvest price for the last dividend declared in the period may often be based on the Fund's market price (and not its net asset value), and therefore may be different from the price used in the calculation. Total returns are not annualized.
(c) Each ratio includes the effect of dividends expense on securities sold short as follows:
| | | Ratios of Dividends Expense on
Securities Sold Short to Average Net Assets | |
Year Ended 12/31: | |
| | 2013 | (d) | | | .01 | %** | |
| | 2012 | | | | .02 | | |
| | 2011 | | | | .03 | | |
| | 2010 | | | | .02 | | |
| | 2009 | | | | .02 | | |
| | 2008 | | | | .03 | | |
(d) For the six months ended June 30, 2013.
(e) Portfolio Turnover Rate is calculated based on the lesser of long-term purchases or sales (as disclosed in Footnote 5—Investment Transactions) divided by the average long-term market value during the period.
* Rounds to less than $.01 per share.
** Annualized
*** Represents distributions paid "From and in excess of net investment income" for the six months ended June 30, 2013.
See accompanying notes to financial statements.
Nuveen Investments
25
Notes to
FINANCIAL STATEMENTS (Unaudited)
1. General Information and Significant Accounting Policies
General Information
Nuveen Global Value Opportunities Fund (the "Fund") is registered under the Investment Company Act of 1940, as amended, as a diversified closed-end registered investment company. The Fund's shares are listed on the New York Stock Exchange ("NYSE") and trade under the ticker symbol "JGV." The Fund was organized as a Massachusetts business trust on May 17, 2006.
The Fund's investment adviser is Nuveen Fund Advisors, LLC (the "Adviser"), a wholly-owned subsidiary of Nuveen Investments, Inc. ("Nuveen"). The Adviser is responsible for the Fund's overall investment strategy and asset allocation decisions. The Adviser has entered into a sub-advisory agreement with Tradewinds Global Investors, LLC (the "Sub-Adviser"), an affiliate of Nuveen, under which the Sub-Adviser manages the investment portfolio of the Fund, including its options strategy.
The Fund's investment objective is to provide a high level of total return by investing primarily in a diversified global portfolio of value equity securities, as well as corporate and governmental debt securities and by opportunistically using leverage, primarily via writing (selling) call options and shorting a small position in equities.
Significant Accounting Policies
The following is a summary of significant accounting policies followed by the Fund in the preparation of its financial statements in accordance with U.S. generally accepted accounting principles ("U.S. GAAP").
Investment Transactions
Investment transactions are recorded on a trade date basis. Realized gains and losses from investment transactions are determined on the specific identification method, which is the same basis used for federal income tax purposes. Investments purchased on a when-issued/delayed delivery basis may have extended settlement periods. Any investments so purchased are subject to market fluctuation during this period. The Fund has instructed the custodian to earmark securities in the Fund's portfolio with a current value at least equal to the amount of the when-issued/delayed delivery purchase commitments. As of June 30, 2013, the Fund had outstanding when-issued/delayed purchase commitments of $2,680,189.
Investment Income
Dividend income on investments purchased and dividend expense on securities sold short are recorded on the ex-dividend date or, for foreign securities, when information is available. Interest income, which reflects the amortization of premiums and accretion of discounts for financial reporting purposes, is recorded on an accrual basis. Interest income also reflects paydown gains and losses, if any.
Professional Fees
Professional fees presented on the Statement of Operations consist of legal fees incurred in the normal course of operations, audit fees, tax consulting fees and, in some cases, workout expenditures. Workout expenditures are incurred in an attempt to protect or enhance an investment, or to pursue other claims or legal actions on behalf of Fund shareholders. Should the Fund receive a refund of workout expenditures paid in a prior reporting period, such amounts will be recognized as "Legal fee refund" on the Statement of Operations.
Dividends and Distributions to Shareholders
Distributions to shareholders are recorded on the ex-dividend date. The amount and timing of distributions are determined in accordance with federal income tax regulations, which may differ from U.S. GAAP.
The Fund makes quarterly cash distributions to shareholders of a stated dollar amount per share. Subject to approval and oversight by the Fund's Board of Trustees, the Fund seeks to maintain a stable distribution level designed to deliver the long-term return potential of the Fund's investment strategy through regular quarterly distributions (a "Managed Distribution Program"). Total distributions during a calendar year generally will be made from the Fund's net investment income, net realized capital gains and net unrealized capital gains in the Fund's portfolio, if any. The portion of distributions paid attributed to net unrealized gains, if any, is distributed from the Fund's assets and is treated by shareholders as a non-taxable distribution ("Return of Capital") for tax purposes. In the event that total distributions during a calendar year exceed the Fund's total return on net asset value, the difference will reduce net asset value per share. If the Fund's total return on net asset value exceeds total distributions during a calendar year, the excess will be reflected as an increase in net asset value per share. The final determination of the source and character of all
Nuveen Investments
26
distributions for the fiscal year is made after the end of the fiscal year and is reflected in the financial statements contained in the annual report as of December 31 each year.
The actual character of distributions made by the Fund during the fiscal year ended December 31, 2012 is reflected in the accompanying financial statements.
The distributions made by the Fund during the six months ended June 30, 2013, are provisionally classified as being "From and in excess of net investment income," and those distributions will be classified as being from net investment income, net realized capital gains and/or a return of capital for tax purposes after the fiscal year end. For purposes of calculating "Undistributed (Over-distribution of) net investment income" as of June 30, 2013, the distribution amounts provisionally classified as "From and in excess of net investment income" were treated as being entirely from net investment income. Consequently, the financial statements at June 30, 2013, reflect an over-distribution of net investment income.
Indemnifications
Under the Fund's organizational documents, its officers and trustees are indemnified against certain liabilities arising out of the performance of their duties to the Fund. In addition, in the normal course of business, the Fund enters into contracts that provide general indemnifications to other parties. The Fund's maximum exposure under these arrangements is unknown as this would involve future claims that may be made against the Fund that have not yet occurred. However, the Fund has not had prior claims or losses pursuant to these contracts and expects the risk of loss to be remote.
Netting Agreements
In the ordinary course of business, the Fund has entered into transactions subject to enforceable netting agreements or other similar arrangements ("netting agreements"). Generally, the right to offset in netting agreements allows the Fund to offset any exposure to a specific counterparty with any collateral received or delivered to that counterparty based on the terms of the agreements. Generally, the Fund manages its cash collateral and securities collateral on a counterparty basis. As of June 30, 2013, the Fund is not invested in any portfolio securities or derivative instruments with gross exposures recognized on the Statement of Assets and Liabilities that could be netted subject to the netting agreements.
Use of Estimates
The preparation of financial statements in conformity with U.S. GAAP requires management to make estimates and assumptions that affect the reported amounts of assets and liabilities at the date of the financial statements and the reported amounts of increases and decreases in net assets from operations during the reporting period. Actual results may differ from those estimates.
2. Investment Valuation and Fair Value Measurements
Investment Valuation
Common stocks and other equity-type securities are valued at the last sales price on the securities exchange on which such securities are primarily traded and are generally classified as Level 1 for fair value measurement purposes. Securities primarily traded on the NASDAQ National Market ("NASDAQ") are valued, except as indicated below, at the NASDAQ Official Closing Price and are generally classified as Level 1. However, securities traded on a securities exchange or NASDAQ for which there were no transactions on a given day or securities not listed on a securities exchange or NASDAQ are valued at the quoted bid price and are generally classified as level 2. Prices of certain American Depository Receipts ("ADR") held by the Fund that trade in the United States are valued based on the last traded price, official closing price, or the most recent bid price of the underlying non-U.S.-traded stock, adjusted as appropriate for the underlying-to-ADR conversion ratio and foreign exchange rate, and from time-to-time may also be adjusted further to take into account material events that may take place after the close of the local non-U.S. market but before the close of the NYSE. These securities may represent a transfer from a Level 1 to a Level 2 security.
Prices of fixed-income securities are provided by a pricing service approved by the Fund's Board of Trustees. These securities are generally classified as Level 2 for fair value measurement purposes. The pricing service establishes a security's fair value using methods that may include consideration of the following: yields or prices of investments of comparable quality, type of issue, coupon, maturity and rating, market quotes or indications of value from security dealers, evaluations of anticipated cash flows or collateral, general market conditions and other information and analysis, including the obligor's credit characteristics considered relevant. In pricing certain securities, particularly less liquid and lower quality securities, the pricing service may consider information about a security, its issuer, or market activity provided by the Adviser. These securities are generally classified as Level 2 or Level 3 depending on the priority of the significant inputs.
The value of exchange-traded options are based on the mean of the closing bid and ask prices. Exchange-traded options are generally classified as Level 1. Options traded in the over-the-counter market are valued using an evaluated mean price and are generally classified as Level 2.
Repurchase agreements are valued at contract amount plus accrued interest, which approximates market value. These securities are generally classified as Level 2.
Certain securities may not be able to be priced by the pre-established pricing methods as described above. Such securities may be valued by the Fund's Board of Trustees or its designee at fair value. These securities generally include, but are not limited to, restricted securities (securities which
Nuveen Investments
27
Notes to
FINANCIAL STATEMENTS (Unaudited) (continued)
may not be publicly sold without registration under the Securities Act of 1933, as amended) for which a pricing service is unable to provide a market price; securities whose trading has been formally suspended; debt securities that have gone into default and for which there is no current market quotation; a security whose market price is not available from a pre-established pricing source; a security with respect to which an event has occurred that is likely to materially affect the value of the security after the market has closed but before the calculation of a Fund's net asset value (as may be the case in non-U.S. markets on which the security is primarily traded) or make it difficult or impossible to obtain a reliable market quotation; and a security whose price, as provided by the pricing service, is not deemed to reflect the security's fair value. As a general principle, the fair value of security would appear to be the amount that the owner might reasonably expect to receive for it in a current sale. A variety of factors may be considered in determining the fair value of such securities, which may include consideration of the following: yields or prices of investments of comparable quality, type of issue, coupon, maturity and rating, market quotes or indications of value from security dealers, evaluations of anticipated cash flows or collateral, general market conditions and other information and analysis, including the obligor's credit characteristics considered relevant. These securities are classified as Level 2 or Level 3 depending on the priority of the significant inputs. Regardless of the method employed to value a particular security, all valuations are subject to review by the Fund's Board of Trustees or its designee.
Fair Value Measurements
Fair value is defined as the price that the Fund would receive upon selling an investment or transferring a liability in an orderly transaction to an independent buyer in the principal or most advantageous market for the investment. A three-tier hierarchy is used to maximize the use of observable market data and minimize the use of unobservable inputs and to establish classification of fair value measurements for disclosure purposes. Observable inputs reflect the assumptions market participants would use in pricing the asset or liability. Observable inputs are based on market data obtained from sources independent of the reporting entity. Unobservable inputs reflect the reporting entity's own assumptions about the assumptions market participants would use in pricing the asset or liability. Unobservable inputs are based on the best information available in the circumstances. The following is a summary of the three-tiered hierarchy of valuation input levels.
Level 1 — Inputs are unadjusted and prices are determined using quoted prices in active markets for identical securities.
Level 2 — Prices are determined using other significant observable inputs (including quoted prices for similar securities, interest rates, prepayment speeds, credit risk, etc.).
Level 3 — Prices are determined using significant unobservable inputs (including management's assumptions in determining the fair value of investments).
The inputs or methodologies used for valuing securities are not an indication of the risks associated with investing in those securities. The following is a summary of the Fund's fair value measurements as of the end of the reporting period:
| | | Level 1 | | Level 2 | | Level 3 | | Total | |
Long-Term Investments*: | |
Common Stocks | | $ | 223,146,704 | | | $ | 4,643,356 | | | $ | 14,216 | | | $ | 227,804,276 | | |
Mortgage-Backed Securities | | | — | | | | 5,463,998 | | | | — | | | | 5,463,998 | | |
Convertible Preferred Securities | | | — | | | | 2,409,750 | | | | — | | | | 2,409,750 | | |
Convertible Bonds | | | — | | | | 3,150,000 | | | | — | | | | 3,150,000 | | |
Corporate Bonds | | | — | | | | 11,007,250 | | | | — | | | | 11,007,250 | | |
Sovereign Debt | | | — | | | | 1,965,000 | | | | — | | | | 1,965,000 | | |
Warrants | | | — | | | | 4,464 | | | | — | | | | 4,464 | | |
Short-Term Investments: | |
Repurchase Agreements | | | — | | | | 22,846,588 | | | | — | | | | 22,846,588 | | |
Derivatives: | |
Call Options Written | | | (2,322,543 | ) | | | — | | | | — | | | | (2,322,543 | ) | |
Total | | $ | 220,824,161 | | | $ | 51,490,406 | | | $ | 14,216 | | | $ | 272,328,783 | | |
* Refer to the Fund's Portfolio of Investments for industry classifications, a breakdown of Common Stocks and Warrants classified as Level 2 and a breakdown of securities classified as Level 3.
The table below presents the transfers in and out of the three valuation levels for the Fund as of the end of the reporting period when compared to the valuation levels as of the end of the previous fiscal year. Changes in the leveling of investments are primarily due to changes in the observability of inputs or due to securities no longer being fair valued using methods determined in good faith by, or at the discretion of, the Board of Trustees.
Level 1 | | Level 2 | | Level 3 | |
| Transfers In | | (Transfers Out) | | Transfers In | | (Transfers Out) | | Transfers In | | (Transfers Out) | |
| $ | 70,156,192 | | | $ | — | | | $ | — | | | $ | (70,156,192 | ) | | $ | — | | | $ | — | | |
Nuveen Investments
28
The Nuveen funds' Board of Directors/Trustees is responsible for the valuation process and has delegated the oversight of the daily valuation process to the Adviser's Valuation Committee. The Valuation Committee, pursuant to the valuation policies and procedures adopted by the Board of Directors/Trustees, is responsible for making fair value determinations, evaluating the effectiveness of the funds' pricing policies, and reporting to the Board of Directors/Trustees. The Valuation Committee is aided in its efforts by the Adviser's dedicated Securities Valuation Team, which is responsible for administering the daily valuation process and applying fair value methodologies as approved by the Valuation Committee. When determining the reliability of independent pricing services for investments owned by the funds, the Valuation Committee, among other things, conducts due diligence reviews of the pricing services and monitors the quality of security prices received through various testing reports conducted by the Securities Valuation Team.
The Valuation Committee will consider pricing methodologies it deems relevant and appropriate when making a fair value determination, based on the facts and circumstances specific to the portfolio instrument. Fair value determinations generally will be derived as follows, using public or private market information:
(i.) If available, fair value determinations shall be derived by extrapolating from recent transactions or quoted prices for identical or comparable securities.
(ii.) If such information is not available, an analytical valuation methodology may be used based on other available information including, but not limited to: analyst appraisals, research reports, corporate action information, issuer financial statements and shelf registration statements. Such analytical valuation methodologies may include, but are not limited to: multiple of earnings, discount from market value of a similar freely-traded security, discounted cash flow analysis, book value or a multiple thereof, risk premium/yield analysis, yield to maturity and/or fundamental investment analysis.
The purchase price of a portfolio instrument will be used to fair value the instrument only if no other valuation methodology is available or deemed appropriate, and it is determined that the purchase price fairly reflects the instrument's current value.
For each portfolio security that has been fair valued pursuant to the policies adopted by the Board of Directors/Trustees, the fair value price is compared against the last available and next available market quotations. The Valuation Committee reviews the results of such testing and fair valuation occurrences are reported to the Board of Directors/Trustees.
3. Portfolio Securities and Investments in Derivatives
Portfolio Securities
Foreign Currency Transactions
To the extent that the Fund invests in securities and/or contracts that are denominated in a currency other than U.S. dollars, the Fund will be subject to currency risk, which is the risk that an increase in the U.S. dollar relative to the foreign currency will reduce returns or portfolio value. Generally, when the U.S. dollar rises in value against a foreign currency, the Fund's investments denominated in that currency will lose value because its currency is worth fewer U.S. dollars; the opposite effect occurs if the U.S. dollar falls in relative value. Investments and other assets and liabilities denominated in foreign currencies are converted into U.S. dollars on a spot (i.e. cash) basis at the spot rate prevailing in the foreign currency exchange market at the time of valuation. Purchases and sales of investments and income denominated in foreign currencies are translated into U.S. dollars on the respective dates of such transactions.
The books and records of the Fund are maintained in U.S. dollars. Foreign currencies, investments and other assets and liabilities are translated into U.S. dollars at 4:00 p.m. Eastern Time. Investment transactions, income and expenses are translated on the respective dates of such transactions. Net realized foreign currency gains and losses resulting from changes in exchange rates include foreign currency gains and losses between trade date and settlement date of the transactions, foreign currency transactions, and the difference between the amounts of interest and dividends recorded on the books of the Fund and the amounts actually received.
The realized gains and losses resulting from changes in foreign currency exchange rates and changes in foreign exchange rates associated with other assets and liabilities on investments, securities sold short and options written are recognized as a component of "Net realized gain (loss) from investments and foreign currency" on the Statement of Operations, when applicable.
The unrealized gains and losses resulting from changes in foreign currency exchange rates and changes in foreign exchange rates associated with other assets and liabilities on investments are recognized as a component of "Change in unrealized appreciation (depreciation) of investments and foreign currency" on the Statement of Operations, when applicable. The unrealized appreciation (depreciation) resulting from changes in foreign exchange rates associated with call options written, put options purchased and securities sold short are recognized as a component of "Change in net appreciation (depreciation) of call options written, put options purchased and securities sold short, respectively" on the Statement of Operations, when applicable.
Nuveen Investments
29
Notes to
FINANCIAL STATEMENTS (Unaudited) (continued)
Short Sales
To secure its obligation to deliver securities sold short, the Fund has instructed the custodian to segregate assets of the Fund as collateral with an equivalent amount of the securities sold short. The collateral required is determined by reference to the market value of the short positions and is recognized as a component of "Deposits with brokers" on the Statement of Assets and Liabilities. The Fund is obligated to pay to the party to which the securities were sold short, dividends declared on the stock by the issuer and recognizes such amounts as "Dividends on securities sold short" on the Statement of Operations. Short sales are valued daily and the corresponding unrealized gains or losses are recognized as a component of "Change in net unrealized appreciation (depreciation) of securities sold short" on the Statement of Operations.
Liabilities for securities sold short are reported at market value and recognized as "Securities sold short, at value" on the Statement of Assets and Liabilities, when applicable. Short sale transactions result in off-balance sheet risk because the ultimate obligation may exceed the related amounts shown on the Statement of Assets and Liabilities. The Fund will incur a loss if the price of the security increases between the date of the short sale and the date on which the Fund replaces the borrowed security. The Fund's loss on a short sale is potentially unlimited because there is no upward limit on the price a borrowed security could attain. The Fund will realize a gain if the price of the security declines between those dates. Gains and losses from securities sold short are recognized as a component of "Net realized gain (loss) from securities sold short" on the Statement of Operations.
Repurchase Agreements
In connection with transactions in repurchase agreements, it is the Fund's policy that its custodian take possession of the underlying collateral securities, the fair value of which exceeds the principal amount of the repurchase transaction, including accrued interest, at all times. If the counterparty defaults, and the fair value of the collateral declines, realization of the collateral may be delayed or limited.
Zero Coupon Securities
The Fund is authorized to invest in zero coupon securities. A zero coupon security does not pay a regular interest coupon to its holders during the life of the security. Tax-exempt income to the holder of the security comes from accretion of the difference between the original purchase price of the security at issuance and the par value of the security at maturity and is effectively paid at maturity. The market prices of zero coupon securities generally are more volatile than the market prices of securities that pay interest periodically.
Investments in Derivatives
The Fund is authorized to invest in certain derivative instruments, such as futures, options and swap contracts. The Fund will limit its investments in futures, options on futures and swap contracts to the extent necessary for the Adviser to claim the exclusion from regulation by the Commodity Futures Trading Commission as a commodity pool operator with respect to the Fund. Fund records derivative instruments at fair value, with changes in fair value recognized on the Statement of Operations, when applicable. Even though the Fund's investments in derivatives may represent economic hedges, they are not considered to be hedge transactions for financial reporting purposes.
Options Transactions
The purchase of put options involves the risk of loss of all or a part of the cash paid for the options (the premium). The market risk associated with purchasing put options is limited to the premium paid. The counterparty credit risk of purchasing options, however, needs also to take into account the current value of the option, as this is the performance expected from the counterparty. When the Fund purchases an option, an amount equal to the premium paid (the premium plus commission) is recognized as a component of "Call and/or Put options purchased, at value" on the Statement of Assets and Liabilities. When the Fund writes an option, an amount equal to the net premium received (the premium less commission) is recognized as a component of "Call and/or Put options written, at value" on the Statement of Assets and Liabilities and is subsequently adjusted to reflect the current value of the written option until the option is exercised or expires or the Fund enters into a closing purchase transaction. The changes in the value of options purchased during the fiscal period are recognized as a component of "Change in net unrealized appreciation (depreciation) of call and/or put options purchased" on the Statement of Operations. The changes in the value of options written during the fiscal period are recognized as a component of "Change in net unrealized appreciation (depreciation) of call and/or put options written" on the Statement of Operations. When an option is exercised or expires or a Fund enters into a closing purchase transaction, the difference between the net premium received and any amount paid at expiration or on executing a closing purchase transaction, including commission, is recognized as a component of "Net realized gain (loss) from call/put options purchased and/or written '" on the Statement of Operations. The Fund, as a writer of an option, has no control over whether the underlying instrument may be sold (called) or purchased (put) and as a result bears the risk of an unfavorable change in the market value of the instrument underlying the written option. There is also the risk the Fund may not be able to enter into a closing transaction because of an illiquid market.
During the six months ended June 30, 2013, the Fund wrote covered call options on individual stocks held in its portfolio as part of its overall management strategy.
Nuveen Investments
30
The Fund did not purchase call or put options or write put options during the six months ended June 30, 2013. The average notional amount of outstanding call options written during the six months ended June 30, 2013, were as follows:
Average notional amount of outstanding call options written* | | ( | $36,500,933 | ) | |
* The average notional amount is calculated based on the outstanding notional amount at the beginning of the fiscal year and at the end of each fiscal quarter within the current fiscal year.
The following table presents the fair value of all call options written by the Fund as of June 30, 2013, the location of these instruments on the Statement of Assets and Liabilities and the primary underlying risk exposure.
| | | | | Location on the Statement of Assets and Liabilities | |
Underlying | | Derivative | | Asset Derivatives | | (Liability) Derivatives | |
Risk Exposure | | Instrument | | Location | | Value | | Location | | Value | |
Equity price | | Options | | | — | | | $ | — | | | Call options written, at value | | ( | $2,322,543 | ) | |
The following table presents the amount of net realized gain (loss) and change in net unrealized appreciation (depreciation) recognized for the six months ended June 30, 2013, on call options written and the primary underlying risk exposure.
Underlying
Risk Exposure | | Derivative
Instrument | | Net Realized
Gain (Loss) | | Change in Net
Unrealized
Appreciation
(Depreciation) | |
| Equity price | | Options | | $ | 751,085 | | | $ | (337,369 | ) | |
Market and Counterparty Credit Risk
In the normal course of business the Fund may invest in financial instruments and enter into financial transactions where risk of potential loss exists due to changes in the market (market risk) or failure of the other party to the transaction to perform (counterparty credit risk). The potential loss could exceed the value of the financial assets recorded on the financial statements. Financial assets, which potentially expose the Fund to counterparty credit risk, consist principally of cash due from counterparties on forward, option and swap transactions, when applicable. The extent of the Fund's exposure to counterparty credit risk in respect to these financial assets approximates their carrying value as recorded on the Statement of Assets and Liabilities. Credit risk is generally higher when a non-exchange-traded financial instrument is involved because the counterparty for exchange-traded financial instruments is the exchange's clearinghouse.
The Fund helps manage counterparty credit risk by entering into agreements only with counterparties the Adviser believes have the financial resources to honor their obligations and by having the Adviser monitor the financial stability of the counterparties. Additionally, counterparties may be required to pledge collateral daily (based on the daily valuation of the financial asset) on behalf of the Fund with a value approximately equal to the amount of any unrealized gain above a pre-determined threshold. Reciprocally, when the Fund has an unrealized loss, the Fund has instructed the custodian to pledge assets of the Fund as collateral with a value approximately equal to the amount of the unrealized loss above a pre-determined threshold. Collateral pledges are monitored and subsequently adjusted if and when the valuations fluctuate, either up or down, by at least the pre-determined threshold amount.
4. Fund Shares
Transactions in shares were as follows:
| | | Six Months
Ended
6/30/13 | | Year
Ended
12/31/12 | |
Shares repurchased and retired | | | — | | | | (2,500 | ) | |
Weighted average: | |
Price per share repurchased and retired | | $ | — | | | $ | 13.40 | | |
Discount per share repurchased and retired | | | — | % | | | 12.53 | % | |
5. Investment Transactions
Purchases and sales (including maturities but excluding short-term investments and derivative transactions) during the six months ended June 30, 2013, aggregated $175,280,061 and $180,653,352, respectively.
Nuveen Investments
31
Notes to
FINANCIAL STATEMENTS (Unaudited) (continued)
Transactions in call options written during the six months ended June 30, 2013, were as follows:
| | | Number of
Contracts | | Premiums
Received | |
Outstanding, beginning of period | | | 25,388 | | | $ | 3,123,363 | | |
Call options written | | | 34,512 | | | | 3,316,658 | | |
Call options terminated in closing purchase transactions | | | (4,556 | ) | | | (641,285 | ) | |
Call options expired | | | (9,605 | ) | | | (1,266,935 | ) | |
Call options excercised | | | (16,959 | ) | | | (1,930,855 | ) | |
Outstanding, end of period | | | 28,780 | | | $ | 2,600,946 | | |
6. Income Tax Information
The Fund intends to distribute substantially all of its investment company taxable income to shareholders and to otherwise comply with the requirements of Subchapter M of the Internal Revenue Code applicable to regulated investment companies. In any year when the Fund realizes net capital gains, the Fund may choose to distribute all or a portion of its net capital gains to shareholders, or alternatively, to retain all or a portion of its net capital gains and pay federal corporate income taxes on such retained gains.
For all open tax years and all major taxing jurisdictions, management of the Fund has concluded that there are no significant uncertain tax positions that would require recognition in the financial statements. Open tax years are those that are open for examination by taxing authorities (i.e., generally the last four tax year ends and the interim tax period since then). Furthermore, management of the Fund is also not aware of any tax positions for which it is reasonably possible that the total amounts of unrecognized tax benefits will significantly change in the next twelve months.
The following information is presented on an income tax basis. Differences between amounts for financial statement and federal income tax purposes are primarily due to the recognition of unrealized gain for tax (mark-to-market) on passive foreign investment companies ("PFIC"), the treatment of paydown gains and losses, recognition of premium amortization and timing differences in recognizing certain gains and losses on investment transactions. To the extent that differences arise that are permanent in nature, such amounts are reclassified within the capital accounts as detailed below. Temporary differences do not require reclassification. Temporary and permanent differences do not impact the net asset value of the Fund.
As of June 30, 2013, the cost and unrealized appreciation (depreciation) of investments (excluding investments in derivatives), as determined on a federal income tax basis, were as follows:
Cost of investments | | $ | 336,188,395 | | |
Gross unrealized: | |
Appreciation | | $ | 8,683,313 | | |
Depreciation | | | (70,220,382 | ) | |
Net unrealized appreciation (depreciation) of investments | | $ | (61,537,069 | ) | |
Permanent differences, primarily due to return of capital distributions, foreign currency reclassifications, investments in PFICs, investments in interest-only mortgage backed securities, paydown adjustments and distribution character reclassifications, resulted in reclassifications among the Fund's components of net assets as of December 31, 2012, the Fund's last tax year end as follows:
Paid-in surplus | | $ | (8,576,202 | ) | |
Undistributed (Over-distribution of) net investment income | | | 15,664,911 | | |
Accumulated net realized gain (loss) | | | (7,088,709 | ) | |
The tax components of undistributed net ordinary income and net long-term capital gains as of December 31, 2012, the Fund's last tax year end, were as follows:
Undistributed net ordinary income | | $ | — | | |
Undistributed net long-term capital gains | | | — | | |
Nuveen Investments
32
The tax character of distributions paid during the Fund's last tax year ended December 31, 2012 were designated for purposes of the dividends paid deduction as follows:
Distributions from net ordinary income * | | $ | 15,919,787 | | |
Distributions from net long-term capital gains | | | — | | |
Return of capital | | | 8,576,202 | | |
* Net ordinary income consists of net taxable income derived from dividends, interest, and net short-term capital gains, if any.
Under the Regulated Investment Company Modernization Act of 2010, capital losses incurred by the Fund after December 31, 2010 will not be subject to expiration. During the Fund's last tax year ended December 31, 2012, there were no post-enactment capital losses generated.
7. Management Fees and Other Transactions with Affiliates
The Fund's management fee compensates the Adviser for overall investment advisory and administrative services and general office facilities. The Sub-Adviser is compensated for its services to the Fund from the management fees paid to the Adviser.
The Fund's management fee consists of two components—a fund-level fee, based only on the amount of assets within the Fund, and a complex-level fee, based on the aggregate amount of all eligible fund assets managed by the Adviser. This pricing structure enables Fund shareholders to benefit from growth in the assets within the Fund as well as from growth in the amount of complex-wide assets managed by the Adviser.
The annual fund-level fee, payable monthly, is calculated according to the following schedule:
Average Daily Managed Assets* | | Fund-Level Fee Rate | |
For the first $500 million | | | .8000 | % | |
For the next $500 million | | | .7750 | | |
For the next $500 million | | | .7500 | | |
For the next $500 million | | | .7250 | | |
For managed assets over $2 billion | | | .7000 | | |
The annual complex-level fee, payable monthly, is calculated according to the following schedule:
Complex-Level Managed Asset Breakpoint Level* | | Effective Rate at Breakpoint Level | |
| $55 billion | | | .2000 | % | |
| $56 billion | | | .1996 | | |
| $57 billion | | | .1989 | | |
| $60 billion | | | .1961 | | |
| $63 billion | | | .1931 | | |
| $66 billion | | | .1900 | | |
| $71 billion | | | .1851 | | |
| $76 billion | | | .1806 | | |
| $80 billion | | | .1773 | | |
| $91 billion | | | .1691 | | |
| $125 billion | | | .1599 | | |
| $200 billion | | | .1505 | | |
| $250 billion | | | .1469 | | |
| $300 billion | | | .1445 | | |
* For the fund-level and complex-level fees, managed assets include closed-end fund assets managed by the Adviser that are attributable to financial leverage. For these purposes, financial leverage includes the funds' use of preferred stock and borrowings and certain investments in the residual interest certificates (also called inverse floating rate securities) in tender option bond (TOB) trusts, including the portion of assets held by a TOB trust that has been effectively financed by the trust's issuance of floating rate securities, subject to an agreement by the Adviser as to certain funds to limit the amount of such assets for determining managed assets in certain circumstances. The complex-level fee is calculated based upon the aggregate daily managed assets of all Nuveen Funds that constitute "eligible assets." Eligible assets do not include assets attributable to investments in other Nuveen Funds or assets in excess of $2 billion added to the Nuveen Fund complex in connection with the Adviser's assumption of the management of the former First American Funds effective January 1, 2011. As of June 30, 2013, the complex-level fee rate for the Fund was .1679%.
The Fund pays no compensation directly to those of its trustees who are affiliated with the Adviser or to its officers, all of whom receive remuneration for their services to the Fund from the Adviser or its affiliates. The Board of Trustees has adopted a deferred compensation plan for independent trustees that enables trustees to elect to defer receipt of all or a portion of the annual compensation they are entitled to receive from certain Nuveen-advised funds. Under the plan, deferred amounts are treated as though equal dollar amounts had been invested in shares of select Nuveen-advised funds.
Nuveen Investments
33
Annual Investment Management
Agreement Approval Process (Unaudited)
The Board of Trustees (the "Board" and each Trustee, a "Board Member") of the Fund, including the Board Members who are not parties to the Fund's advisory or sub-advisory agreement or "interested persons" of any such parties (the "Independent Board Members"), is responsible for approving the advisory agreement (the "Investment Management Agreement") between the Fund and Nuveen Fund Advisors, LLC (the "Advisor") and the sub-advisory agreement (the "Sub-Advisory Agreement") between the Advisor and Tradewinds Global Investors, LLC (the "Sub-Advisor") (the Investment Management Agreement and the Sub-Advisory Agreement are referred to collectively as the "Advisory Agreements") and their periodic continuation. Pursuant to the Investment Company Act of 1940, as amended (the "1940 Act"), the Board is required to consider the continuation of the Advisory Agreements on an annual basis. Accordingly, at an in-person meeting held on May 20-22, 2013 (the "May Meeting"), the Board, including a majority of the Independent Board Members, considered and approved the continuation of the Advisory Agreements for the Fund for an additional one-year period.
In preparation for its considerations at the May Meeting, the Board requested and received extensive materials prepared in connection with the review of the Advisory Agreements. The materials provided a broad range of information regarding the Fund, the Advisor and the Sub-Advisor (the Advisor and the Sub-Advisor are collectively, the "Fund Advisers" and each, a "Fund Adviser"). As described in more detail below, the information provided included, among other things, a review of Fund performance, including Fund investment performance assessments against peer groups and appropriate benchmarks; a comparison of Fund fees and expenses relative to peers; a description and assessment of shareholder service levels for the Fund; a summary of the performance of certain service providers; a review of product initiatives and shareholder communications; and an analysis of the Advisor's profitability with comparisons to comparable peers in the managed fund business. As part of its annual review, the Board also held a separate meeting on April 17-18, 2013, to review the Fund's investment performance and consider an analysis provided by the Advisor of the Sub-Advisor which generally evaluated the Sub-Advisor's investment team, investment mandate, organizational structure and history, investment philosophy and process, performance of the Fund, and significant changes to the foregoing. As a result of its review of the materials and discussions, the Board presented the Advisor with questions and the Advisor responded.
The materials and information prepared in connection with the annual review of the Advisory Agreements supplement the information and analysis provided to the Board during the year. In this regard, throughout the year, the Board, acting directly or through its committees, regularly reviews the performance and various services provided by the Advisor and the Sub-Advisor. The Board meets at least quarterly as well as at other times as the need arises. At its quarterly meetings, the Board reviews reports by the Advisor regarding, among other things, fund performance, fund expenses, premium and discount levels of closed-end funds, the performance of the investment teams, and compliance, regulatory and risk management matters. In addition to regular reports, the Advisor provides special reports to the Board or a committee thereof from time to time to enhance the Board's understanding of various topics that impact some or all the Nuveen funds (such as accounting and financial statement presentations of the various forms of leverage that may be used by a closed-end fund or an update on the valuation policies and procedures), to update the Board on regulatory developments impacting the investment company industry or to update the Board on the business plans or other matters impacting the Advisor. The Board also meets with key investment personnel managing the fund portfolios during the year. In October 2011, the Board also created two standing committees (the Open-End Fund Committee and the Closed-End Fund Committee) to assist the full Board in monitoring and gaining a deeper insight into the distinctive business practices of open-end and closed-end funds. These Committees meet prior to each quarterly Board meeting, and the Advisor provides presentations to these Committees permitting them to delve further into specific matters or initiatives impacting the respective product line.
Nuveen Investments
34
In addition, the Board continues its program of seeking to have the Board Members or a subset thereof visit each sub-advisor to the Nuveen funds at least once over a multiple year rotation, meeting with key investment and business personnel. In addition, the ad hoc Securities Lending Committee of the Board met with certain service providers and the Audit Committee of the Board made a site visit to three pricing service providers.
The Board considers the information provided and knowledge gained at these meetings and visits during the year when performing its annual review of the Advisory Agreements. The Independent Board Members also are assisted throughout the process by independent legal counsel. Counsel provided materials describing applicable law and the duties of directors or trustees in reviewing advisory contracts. During the course of the year and during their deliberations regarding the review of advisory contracts, the Independent Board Members met with independent legal counsel in executive sessions without management present. In addition, it is important to recognize that the management arrangements for the Nuveen funds are the result of many years of review and discussion between the Independent Board Members and fund management and that the Board Members' conclusions may be based, in part, on their consideration of fee arrangements and other factors developed in previous years.
The Board considered all factors it believed relevant with respect to the Fund, including among other factors: (a) the nature, extent and quality of the services provided by the Fund Advisers, (b) the investment performance of the Fund and Fund Advisers, (c) the advisory fees and costs of the services to be provided to the Fund and the profitability of the Fund Advisers, (d) the extent of any economies of scale, (e) any benefits derived by the Fund Advisers from the relationship with the Fund and (f) other factors. Each Board Member may have accorded different weight to the various factors in reaching his or her conclusions with respect to the Fund's Advisory Agreements. The Independent Board Members did not identify any single factor as all important or controlling. The Independent Board Members' considerations were instead based on a comprehensive consideration of all the information presented. The principal factors considered by the Board and its conclusions are described below.
A. Nature, Extent and Quality of Services
In considering renewal of the Advisory Agreements, the Independent Board Members considered the nature, extent and quality of the Fund Adviser's services, including advisory services and the resulting Fund performance and administrative services. The Independent Board Members further considered the overall reputation and capabilities of the Advisor and its affiliates, the commitment of the Advisor to provide high quality service to the Fund, their overall confidence in the capability and integrity of the Advisor and its staff and the Advisor's responsiveness to questions and concerns raised by them. The Independent Board Members reviewed materials outlining, among other things, the Fund Adviser's organization and business; the types of services that the Fund Adviser or its affiliates provide to the Fund; the performance record of the Fund (as described in further detail below); and any applicable initiatives Nuveen had taken for the closed-end fund product line.
In considering advisory services, the Board recognized that the Advisor provides various oversight, administrative, compliance and other services for the Fund and the Sub-Advisor generally provides the portfolio investment management services to the Fund. In reviewing the portfolio management services provided to the Fund, the Board reviewed the materials provided by the Nuveen Investment Services Oversight Team analyzing, among other things, the Sub-Advisor's investment team and changes thereto, organization and history, assets under management, the investment team's philosophy and strategies in managing the Fund, developments affecting the Sub-Advisor or Fund and Fund performance. In this regard, the Board is closely monitoring the Sub-Advisor in light of management changes last year. The Independent Board Members also reviewed portfolio manager compensation arrangements to evaluate each Fund Adviser's ability to attract and retain high quality investment personnel, preserve stability, and reward performance but not provide an inappropriate incentive to take undue risks. In addition, the Board considered the Advisor's execution of its oversight responsibilities over the Sub-Advisor. Given the importance of compliance, the Independent Board
Nuveen Investments
35
Annual Investment Management Agreement
Approval Process (Unaudited) (continued)
Members also considered Nuveen's compliance program, including the report of the chief compliance officer regarding the Fund's compliance policies and procedures; the resources dedicated to compliance; and the record of compliance with the policies and procedures. Given the Advisor's emphasis on business risk, the Board also appointed an Independent Board Member as a point person to review and keep the Board apprised of developments in this area during the year.
In addition to advisory services, the Board considered the quality and extent of administrative and other non-investment advisory services the Advisor and its affiliates provide to the Fund, including product management, investment services (such as oversight of investment policies and procedures, risk management, and pricing), fund administration, oversight of service providers, shareholder services and communications, administration of Board relations, regulatory and portfolio compliance, legal support, managing leverage and promoting an orderly secondary market for common shares. The Board further recognized Nuveen's additional investments in personnel, including in compliance and risk management.
In reviewing the services provided, the Board considered the new services and service enhancements that the Advisor has implemented since the various advisory agreements were last reviewed. In reviewing the activities of 2012, the Board recognized the Advisor's focus on product rationalization for both closed-end and open-end funds during the year, consolidating certain Nuveen funds through mergers that were designed to improve efficiencies and economies of scale for shareholders, repositioning various Nuveen funds through updates in their investment policies and guidelines with the expectation of bringing greater value to shareholders, and liquidating certain Nuveen funds. The Board recognized the Advisor's significant investment in technology initiatives to, among other things, create a central repository for fund and other Nuveen product data, develop a group within the Advisor designed to handle and analyze fund performance data, and implement a data system to support the risk oversight group. The Board also recognized the enhancements in the valuation group within the Advisor, including upgrading the team and process and automating certain basic systems, and in the compliance group with the addition of personnel, particularly within the testing group. With the advent of the Open-End Fund Committee and Closed-End Fund Committee, the Board also noted the enhanced support and comprehensive in-depth presentations provided by the Advisor to these committees.
In addition to the foregoing actions, the Board also considered other initiatives related to the Nuveen closed-end funds, including the significant level of oversight and administration necessary to manage leverage that has become increasingly varied and complex and the ongoing redesign of technology systems to manage and track the various forms of leverage; continued capital management services, including developing shelf offering programs for various funds; the implementation of projects designed to enhance data integrity for information published on the web and to increase the use of data received from third parties to gain market intelligence; and the continued communication efforts with shareholders, fund analysts and financial advisers. With respect to the latter, the Independent Board Members noted Nuveen's continued commitment to supporting the secondary market for the common shares of its closed-end funds through a comprehensive secondary market communication program and campaigns designed to raise investor and analyst awareness and understanding of closed-end funds. Nuveen's support services included, among other things: developing materials covering the Nuveen closed-end fund product line and educational materials regarding closed-end funds; designing and executing various marketing campaigns; supporting and promoting the alternative minimum tax (AMT)-free funds; sponsoring and participating in conferences; communicating with closed-end fund analysts and financial advisors throughout the year; providing marketing and product updates for the closed-end funds; and maintaining and enhancing a closed-end fund website.
Based on their review, the Independent Board Members found that, overall, the nature, extent and quality of services provided to the Fund under each Advisory Agreement were satisfactory.
Nuveen Investments
36
B. The Investment Performance of the Fund and Fund Advisers
The Board, including the Independent Board Members, considered the performance history of the Fund over various time periods. The Board reviewed reports, including an analysis of the Fund's performance and the applicable investment team. In general, in considering a fund's performance, the Board recognized that a fund's performance can be reviewed through various measures including the fund's absolute return, the fund's return compared to the performance of other peer funds, and the fund's performance compared to its respective benchmark. Accordingly, the Board reviewed, among other things, the Fund's historic investment performance as well as information comparing the Fund's performance information with that of other funds (the "Performance Peer Group") and with recognized and/or customized benchmarks (i.e., benchmarks derived from multiple recognized benchmarks) for the quarter, one-, three- and five-year periods ending December 31, 2012 as well as performance information reflecting the first quarter of 2013. In addition, with respect to closed-end funds (such as the Fund), the Independent Board Members also reviewed historic premium and discount levels, including a summary of actions taken to address or discuss other developments affecting the secondary market discounts of various funds. This information supplemented the fund performance information provided to the Board at each of its quarterly meetings.
In evaluating performance, the Board recognized several factors that may impact the performance data as well as the consideration given to particular performance data. The Board recognized that the performance data reflects a snapshot of time, in this case as of the end of the most recent calendar year or quarter. The Board noted that selecting a different performance period could derive significantly different results. Further, the Board recognized that it is possible that long-term performance can be adversely affected by even one period of significant underperformance so that a single investment decision or theme has the ability to disproportionately affect long-term performance. The Independent Board Members also noted that the investment experience of a particular shareholder in the Nuveen funds will vary depending on when such shareholder invests in the applicable fund, the class held (if multiple classes are offered in a fund) and the performance of the fund (or respective class) during that shareholder's investment period.
With respect to the comparative performance information, the Board recognized that the usefulness of comparative performance data as a frame of reference to measure a fund's performance may be limited because the Performance Peer Group, among other things, does not adequately reflect the objectives and strategies of the fund, has a different investable universe, or the composition of the peer set may be limited in size or number as well as other factors. In this regard, the Board noted that the Advisor classified, in relevant part, the Performance Peer Groups of certain funds (including the Fund) as having significant differences from the funds but to still be somewhat relevant while the Performance Peer Groups of other funds were classified as having such significant differences as to be irrelevant. Accordingly, while the Board is cognizant of the relative performance of a fund's peer set and/or benchmark(s), the Board evaluated fund performance in light of the respective fund's investment objectives, investment parameters and guidelines and considered that the variations between the objectives and investment parameters or guidelines of the funds with their peers and/or benchmarks result in differences in performance results. In addition, with respect to any Nuveen funds for which the Board has identified performance concerns, the Board monitors such funds closely until performance improves, discusses with the Advisor the reasons for such results, considers those steps necessary or appropriate to address such issues, and reviews the results of any efforts undertaken.
In considering the performance data for the Fund, the Independent Board Members noted that the Fund lagged its peers and benchmarks over various periods. In this regard, although the Fund was in the first quartile and outperformed its benchmark for the five-year period, it was in the fourth quartile and underperformed its benchmark for the one- and three-year periods.
As noted above, for Nuveen funds with challenged performance, the Board considered and discussed the factors contributing to the results. In this regard, the Board recognized that the recent challenged performance of the Fund
Nuveen Investments
37
Annual Investment Management Agreement
Approval Process (Unaudited) (continued)
(and of certain other funds sub-advised by the Sub-Advisor) resulted, in part, from the departures of certain senior investment managers, the sale of portfolio securities to meet the subsequent redemptions, and certain portfolio holdings and sector positioning that further detracted from performance. The Board, however, recognized that the new co-chief investment officers of the Sub-Advisor have been in their leadership positions for only one year. They remain engaged in driving a renewed focus on portfolio construction, including instituting a more intense review of stocks or currencies that have fallen below a specified threshold, revisiting valuation approaches to analyzing a company or industry and encouraging more extensive collaboration among analysts and portfolio managers. The Board is encouraged by these steps and will continue to monitor management's progress on this agenda in general and for this Fund in particular as well as any further steps proposed or taken to address performance issues.
C. Fees, Expenses and Profitability
1. Fees and Expenses
The Board evaluated the management fees and expenses of the Fund reviewing, among other things, the Fund's gross management fee, net management fee and net expense ratio in absolute terms as well as compared to the fees and expenses of a comparable universe of funds provided by an independent fund data provider (the "Peer Universe") and any expense limitations.
The Independent Board Members further reviewed the methodology regarding the construction of the applicable Peer Universe. In reviewing the comparisons of fee and expense information, the Independent Board Members took into account that in certain instances various factors such as: the limited size and particular composition of the Peer Universe (including the inclusion of other Nuveen funds in the peer set); expense anomalies; changes in the funds comprising the Peer Universe from year to year; levels of reimbursement or fee waivers; the timing of information used; and the differences in the type and use of leverage may impact the comparative data, thereby limiting somewhat the ability to make a meaningful comparison with peers.
In reviewing the fee schedule for the Fund, the Independent Board Members also considered the fund-level and complex-wide breakpoint schedules (described in further detail below) and any fee waivers and reimbursements provided by Nuveen. In reviewing fees and expenses (excluding leverage costs and leveraged assets, as applicable), the Board considered the expenses and fees to be higher if they were over 10 basis points higher, slightly higher if they were approximately 6 to 10 basis points higher, in line if they were within approximately 5 basis points higher than the peer average and below if they were below the peer average of the Peer Universe. In reviewing the reports, the Board noted that the majority of the Nuveen funds were at, close to or below their peer set average based on the net total expense ratio.
The Independent Board Members noted that the Fund had a net management fee and a net expense ratio (including fee waivers and expense reimbursements) that were below its peer averages.
Based on their review of the fee and expense information provided, the Independent Board Members determined that the Fund's management fees were reasonable in light of the nature, extent and quality of services provided to it.
2. Comparisons with the Fees of Other Clients
The Board recognized that all Nuveen funds have a sub-advisor (which, in the case of the Fund, is an affiliated sub-advisor), and therefore, the overall fund management fee can be divided into two components, the fee retained by the Advisor and the fee paid to the sub-advisor. In general terms, the fee to the Advisor reflects the administrative services it provides to support the funds, and while some administrative services may occur at the sub-advisor level, the fee generally reflects the portfolio management services provided by the sub-advisor. The Independent Board Members reviewed information regarding the nature of services provided by the Advisor including through the
Nuveen Investments
38
Sub-Advisor, and the range of fees and average fee the Sub-Advisor assessed for such services to other clients. Such other clients include separately managed accounts (both retail and institutional accounts), foreign investment funds offered by Nuveen and funds that are not offered by Nuveen but are sub-advised by one of Nuveen's investment management teams. In evaluating the comparisons of fees, the Independent Board Members noted that the fee rates charged to the Fund and other clients vary, among other things, because of the different services involved and the additional regulatory and compliance requirements associated with registered investment companies, such as the Fund. Accordingly, the Independent Board Members considered the differences in the product types, including, but not limited to, the services provided, the structure and operations, product distribution and costs thereof, portfolio investment policies, investor profiles, account sizes and regulatory requirements. The Independent Board Members noted, in particular, that the range of services provided to the Fund (as discussed above) is much more extensive than that provided to separately managed accounts. Many of the additional administrative services provided by the Advisor are not required for institutional clients. The Independent Board Members further noted that the management fee rates of the foreign funds advised by the Advisor may vary due to, among other things, differences in the client base, governing bodies, operational complexities and services covered by the management fee. Given the inherent differences in the various products, particularly the extensive services provided to the Fund, the Independent Board Members believe such facts justify the different levels of fees.
3. Profitability of Fund Advisers
In conjunction with their review of fees, the Independent Board Members also considered the profitability of Nuveen for its advisory activities and its financial condition. The Independent Board Members reviewed the revenues and expenses of Nuveen's advisory activities for the last two calendar years, the allocation methodology used in preparing the profitability data and an analysis of the key drivers behind the changes in revenues and expenses that impacted profitability in 2012. The Independent Board Members noted this information supplemented the profitability information requested and received during the year to help keep them apprised of developments affecting profitability (such as changes in fee waivers and expense reimbursement commitments). In this regard, the Independent Board Members noted that they have an Independent Board Member serve as a point person to review and keep them apprised of changes to the profitability analysis and/or methodologies during the year. The Independent Board Members also considered Nuveen's revenues for advisory activities, expenses, and profit margin compared to that of various unaffiliated management firms with comparable assets under management (based on asset size and asset composition).
In reviewing profitability, the Independent Board Members recognized the Advisor's continued investment in its business to enhance its services, including capital improvements to investment technology, updated compliance systems, and additional personnel. In addition, in evaluating profitability, the Independent Board Members also recognized the subjective nature of determining profitability which may be affected by numerous factors including the allocation of expenses and that various allocation methodologies may each be reasonable but yield different results. Further, the Independent Board Members recognized the difficulties in making comparisons as the profitability of other advisers generally is not publicly available and the profitability information that is available for certain advisers or management firms may not be representative of the industry and may be affected by, among other things, the adviser's particular business mix, capital costs, types of funds managed and expense allocations. Notwithstanding the foregoing, the Independent Board Members reviewed Nuveen's methodology and assumptions for allocating expenses across product lines to determine profitability. Based on their review, the Independent Board Members concluded that the Advisor's level of profitability for its advisory activities was reasonable in light of the services provided.
The Independent Board Members also reviewed the Sub-Advisor's revenues, expenses and profitability margins (pre- and post-tax) for its advisory activities and the methodology used for allocating expenses among the internal
Nuveen Investments
39
Annual Investment Management Agreement
Approval Process (Unaudited) (continued)
sub-advisors. Based on their review, the Independent Board Members were satisfied that the Sub-Advisor's level of profitability was reasonable in light of the services provided.
In evaluating the reasonableness of the compensation, the Independent Board Members also considered other amounts paid to a Fund Adviser by the Fund as well as indirect benefits (such as soft dollar arrangements), if any, the Fund Adviser and its affiliates receive, or are expected to receive, that are directly attributable to the management of the Fund. See Section E below for additional information on indirect benefits a Fund Adviser may receive as a result of its relationship with the Fund. Based on their review of the overall fee arrangements of the Fund, the Independent Board Members determined that the advisory fees and expenses of the Fund were reasonable.
D. Economies of Scale and Whether Fee Levels Reflect These Economies of Scale
With respect to economies of scale, the Independent Board Members have recognized the potential benefits resulting from the costs of a fund being spread over a larger asset base, although economies of scale are difficult to measure and predict with precision, particularly on a fund-by-fund basis. One method to help ensure the shareholders share in these benefits is to include breakpoints in the advisory fee schedule. Generally, management fees for funds in the Nuveen complex are comprised of a fund-level component and a complex-level component, subject to certain exceptions. Accordingly, the Independent Board Members reviewed and considered the applicable fund-level breakpoints in the advisory fee schedules that reduce advisory fees as asset levels increase. Further, the Independent Board Members noted that although closed-end funds may from time-to-time make additional share offerings, the growth of their assets will occur primarily through the appreciation of such funds' investment portfolio.
In addition to fund-level advisory fee breakpoints, the Board also considered the Fund's complex-wide fee arrangement. Pursuant to the complex-wide fee arrangement, the fees of the funds in the Nuveen complex are generally reduced as the assets in the fund complex reach certain levels. The complex-wide fee arrangement seeks to provide the benefits of economies of scale to fund shareholders when total fund complex assets increase, even if assets of a particular fund are unchanged or have decreased. The approach reflects the notion that some of Nuveen's costs are attributable to services provided to all its funds in the complex and therefore all funds benefit if these costs are spread over a larger asset base. In addition, with the acquisition of the funds previously advised by FAF Advisors, Inc. at the end of 2010, the Board noted that a portion of such funds' assets at the time of acquisition were deemed eligible to be included in the complex-wide fee calculation in order to deliver fee savings to shareholders in the combined complex and such funds were subject to differing complex-level fee rates.
Based on their review, the Independent Board Members concluded that the breakpoint schedules and complex-wide fee arrangement were acceptable and reflect economies of scale to be shared with shareholders when assets under management increase.
E. Indirect Benefits
In evaluating fees, the Independent Board Members received and considered information regarding potential "fall out" or ancillary benefits the respective Fund Adviser or its affiliates may receive as a result of its relationship with the Fund. In this regard, the Independent Board Members considered any revenues received by affiliates of the Advisor for serving as co-manager in initial public offerings of new closed-end funds as well as revenues received in connection with secondary offerings.
In addition to the above, the Independent Board Members considered whether the Fund Advisers received any benefits from soft dollar arrangements whereby a portion of the commissions paid by the Fund for brokerage may be used to acquire research that may be useful to the Fund Adviser in managing the assets of the Fund and other clients. The Fund's portfolio transactions are determined by the Sub-Advisor. Accordingly, the Independent Board Members
Nuveen Investments
40
considered that the Sub-Advisor may benefit from its soft dollar arrangements pursuant to which it receives research from brokers that execute the Fund's portfolio transactions. With respect to fixed income securities, however, the Board recognized that such securities generally trade on a principal basis that does not generate soft dollar credits. Nevertheless, the Sub-Advisor may also engage in soft dollar arrangements on behalf of other clients, and the Fund as well as the Sub-Advisor may benefit from the research or other services received. Similarly, the Board recognized that the research received pursuant to soft dollar arrangements by the Sub-Advisor may also benefit the Fund and shareholders to the extent the research enhances the ability of the Sub-Advisor to manage the Fund. The Independent Board Members noted that the Sub-Advisor's profitability may be somewhat lower if it did not receive the research services pursuant to the soft dollar arrangements and had to acquire such services directly.
Based on their review, the Independent Board Members concluded that any indirect benefits received by a Fund Adviser as a result of its relationship with the Fund were reasonable and within acceptable parameters.
F. Other Considerations
The Independent Board Members did not identify any single factor discussed previously as all-important or controlling. The Board Members, including the Independent Board Members, unanimously concluded that the terms of each Advisory Agreement are fair and reasonable, that the respective Fund Adviser's fees are reasonable in light of the services provided to the Fund and that the Advisory Agreements be renewed.
Nuveen Investments
41
Reinvest Automatically,
Easily and Conveniently
Nuveen makes reinvesting easy. A phone call is all it takes to set up your reinvestment account.
Nuveen Closed-End Funds Automatic Reinvestment Plan
Your Nuveen Closed-End Fund allows you to conveniently reinvest distributions in additional Fund shares.
By choosing to reinvest, you'll be able to invest money regularly and automatically, and watch your investment grow through the power of compounding. Just like distributions in cash, there may be times when income or capital gains taxes may be payable on distributions that are reinvested.
It is important to note that an automatic reinvestment plan does not ensure a profit, nor does it protect you against loss in a declining market.
Easy and convenient
To make recordkeeping easy and convenient, each quarter you'll receive a statement showing your total distributions, the date of investment, the shares acquired and the price per share, and the total number of shares you own.
How shares are purchased
The shares you acquire by reinvesting will either be purchased on the open market or newly issued by the Fund. If the shares are trading at or above net asset value at the time of valuation, the Fund will issue new shares at the greater of the net asset value or 95% of the then-current market price. If the shares are trading at less than net asset value, shares for your account will be purchased on the open market. If the Plan Agent begins purchasing Fund shares on the open market while shares are trading below net asset value, but the Fund's shares subsequently trade at or above their net asset value before the Plan Agent is able to complete its purchases, the Plan Agent may cease open-market purchases and may invest the uninvested portion of the distribution in newly-issued Fund shares at a price equal to the greater of the shares' net asset value or 95% of the shares' market value on the last business day immediately prior to the purchase date. Distributions received to purchase shares in the open market will normally be invested shortly after the distribution payment date. No interest will be paid on distributions awaiting reinvestment. Because the market price of the shares may increase before purchases are completed, the average purchase price per share may exceed the market price at the time of valuation, resulting in the acquisition of fewer shares than if the distribution had been paid in shares issued by the Fund. A pro rata portion of any applicable brokerage commissions on open market purchases will be paid by Plan participants. These commissions usually will be lower than those charged on individual transactions.
Flexible
You may change your distribution option or withdraw from the Plan at any time, should your needs or situation change.
You can reinvest whether your shares are registered in your name, or in the name of a brokerage firm, bank, or other nominee. Ask your investment advisor if his or her firm will participate on your behalf. Participants whose shares are registered in the name of one firm may not be able to transfer the shares to another firm and continue to participate in the Plan.
The Fund reserves the right to amend or terminate the Plan at any time. Although the Fund reserves the right to amend the Plan to include a service charge payable by the participants, there is no direct service charge to participants in the Plan at this time.
Nuveen Investments
42
Call today to start reinvesting distributions
For more information on the Nuveen Automatic Reinvestment Plan or to enroll in or withdraw from the Plan, speak with your financial advisor or call us at (800) 257-8787.
Nuveen Investments
43
Glossary of Terms
Used in this Report
• Average Annual Total Return: This is a commonly used method to express an investment's performance over a particular, usually multi-year time period. It expresses the return that would have been necessary each year to equal the investment's actual cumulative performance (including change in NAV or market price and reinvested dividends and capital gains distributions, if any) over the time period being considered.
• Barclays High Yield Index: An index that covers the universe of fixed rate, non-investment grade debt. Pay-in-kind (PIK) bonds, Eurobonds, and debt issues from countries designated as emerging markets (e.g., Argentina, Brazil, Venezuela, etc. are excluded, but Canadian and global bonds (SEC registered) of issuers in non-EMG countries are included). Original issue zeroes, step-up coupon structures and 144-As are also included. Index returns assume reinvestment of distributions, but do not include the effects of any applicable sales charges or management fees.
• Barclays U.S. Aggregate Bond Index: A measure that represents securities that are SEC-registered, taxable and dollar denominated. The index covers the U.S. investment grade fixed rate bond market, with index components for government and corporate securities, mortgage pass-through securities, and asset-backed securities. Index returns assume reinvestment of distributions, but do not include the effects of any applicable sales charges or management fees.
• Comparative Benchmark: A blended return comprised of 1) 80% MSCI All Country World Index; 2) 15% Barclays U.S. Aggregate Bond Index; and 3) 5% Barclays High Yield Index. Returns assume reinvestment of distributions, but do not include the effects of any sales charges or management fees.
• Current Distribution Rate: An investment's current annualized distribution divided by its current market price.
• Gross Domestic Product (GDP): The total market value of all final goods and services produced in a country/region in a given year, equal to total consumer, investment and government spending, plus the value of exports, minus the value of imports.
• MSCI All Country World Index: The MSCI All Country World Index is published by Morgan Stanley Capital International, Inc. It is a free float-adjusted market capitalization index that is designed to measure global developed and emerging market equity performance. The index covers 49 developed and emerging market countries. Returns assume reinvestment of distributions, but do not include the effects of any sales charges or management fees.
• Net Asset Value (NAV): The net market value of all securities held in a portfolio.
• Net Asset Value (NAV) Per Share: The market value of one share of a mutual fund or closed-end fund. For a Fund, the NAV is calculated daily by taking the Fund's total assets (securities, cash, and accrued earnings), subtracting the Fund's liabilities, and dividing by the number of shares outstanding.
Nuveen Investments
44
Nuveen Investments
45
Nuveen Investments
46
Additional Fund Information
Board of Trustees
John P. Amboian
Robert P. Bremner
Jack B. Evans
William C. Hunter
David J. Kundert
William J. Schneider
Judith M. Stockdale
Carole E. Stone
Virginia L. Stringer
Terence J. Toth
Fund Manager
Nuveen Fund Advisors, LLC
333 West Wacker Drive
Chicago, IL 60606
Custodian
State Street Bank & Trust Company
Boston, MA
Transfer Agent and
Shareholder Services
State Street Bank & Trust Company
Nuveen Funds
P.O. Box 43071
Providence, RI 02940-3071
(800) 257-8787
Legal Counsel
Chapman and Cutler LLP
Chicago, IL
Independent Registered
Public Accounting Firm
PricewaterhouseCoopers LLP
Chicago, IL
Quarterly Form N-Q Portfolio of Investments Information
The Fund is required to file its complete schedule of portfolio holdings with the Securities and Exchange Commission (SEC) for the first and third quarters of each fiscal year on Form N-Q. You may obtain this information directly from the SEC. Visit the SEC on-line at http://www.sec.gov or in person at the SEC's Public Reference Room in Washington, D.C. Call the SEC toll-free at (800) SEC -0330 for room hours and operation.
Nuveen Funds' Proxy Voting Information
You may obtain (i) information regarding how each fund voted proxies relating to portfolio securities held during the most recent twelve-month period ended June 30, without charge, upon request, by calling Nuveen Investments toll-free at (800) 257-8787 or on Nuveen's website at www.nuveen.com and (ii) a description of the policies and procedures that each fund used to determine how to vote proxies relating to portfolio securities without charge, upon request, by calling Nuveen Investments toll free at (800) 257-8787. You may also obtain this information directly from the SEC. Visit the SEC on-line at http://www.sec.gov.
CEO Certification Disclosure
The Fund's Chief Executive Officer has submitted to the New York Stock Exchange (NYSE) the annual CEO certification as required by Section 303A.12(a) of the NYSE Listed Company Manual.
The Fund has filed with the SEC the certification of its Chief Executive Officer and Chief Financial Officer required by Section 302 of the Sarbanes-Oxley Act.
Share Information
The Fund intends to repurchase shares of its own common stock in the future at such times and in such amounts as is deemed advisable. During the period covered by this report, the Fund repurchased shares of its common stock as shown in the accompanying table.
| | | Common
Shares
Repurchased | |
JGV | | | — | | |
Any future repurchases will be reported to shareholders in the next annual or semi-annual report.
Nuveen Investments
47
Nuveen Investments:
Serving Investors for Generations
Since 1898, financial advisors and their clients have relied on Nuveen Investments to provide dependable investment solutions through continued adherence to proven, long-term investing principles. Today, we offer a range of high quality equity and fixed-income solutions designed to be integral components of a well-diversified core portfolio.
Focused on meeting investor needs.
Nuveen Investments provides high-quality investment services designed to help secure the long-term goals of institutional and individual investors as well as the consultants and financial advisors who serve them. Nuveen Investments markets a wide range of specialized investment solutions which provide investors access to capabilities of its high-quality boutique investment affiliates—Nuveen Asset Management, Symphony Asset Management, NWQ Investment Management Company, Santa Barbara Asset Management, Tradewinds Global Investors, Winslow Capital Management and Gresham Investment Management. In total, Nuveen Investments managed approximately $216 billion as of June 30, 2013.
Find out how we can help you.
To learn more about how the products and services of Nuveen Investments may be able to help you meet your financial goals, talk to your financial advisor, or call us at (800) 257-8787. Please read the information provided carefully before you invest. Investors should consider the investment objective and policies, risk considerations, charges and expenses of any investment carefully. Where applicable, be sure to obtain a prospectus, which contains this and other relevant information. To obtain a prospectus, please contact your securities representative or Nuveen Investments, 333 W. Wacker Dr., Chicago, IL 60606. Please read the prospectus carefully before you invest or send money.
Learn more about Nuveen Funds at: www.nuveen.com/cef
Distributed by
Nuveen Securities, LLC
333 West Wacker Drive
Chicago, IL 60606
www.nuveen.com/cef
ITEM 2. CODE OF ETHICS.
Not applicable to this filing.
ITEM 3. AUDIT COMMITTEE FINANCIAL EXPERT.
Not applicable to this filing.
ITEM 4. PRINCIPAL ACCOUNTANT FEES AND SERVICES.
Not applicable to this filing.
ITEM 5. AUDIT COMMITTEE OF LISTED REGISTRANTS.
Not applicable to this filing.
ITEM 6. SCHEDULE OF INVESTMENTS.
(a) See Portfolio of Investments in Item 1.
(b) Not applicable.
ITEM 7. DISCLOSURE OF PROXY VOTING POLICIES AND PROCEDURES FOR CLOSED-END MANAGEMENT INVESTMENT COMPANIES.
Not applicable to this filing.
ITEM 8. PORTFOLIO MANAGERS OF CLOSED-END MANAGEMENT INVESTMENT COMPANIES.
Not applicable to this filing.
ITEM 9. PURCHASES OF EQUITY SECURITIES BY CLOSED-END MANAGEMENT INVESTMENT COMPANY AND AFFILIATED PURCHASERS.
Not applicable.
ITEM 10. SUBMISSION OF MATTERS TO A VOTE OF SECURITY HOLDERS.
There have been no material changes to the procedures by which shareholders may recommend nominees to the registrant’s Board implemented after the registrant last provided disclosure in response to this Item.
ITEM 11. CONTROLS AND PROCEDURES.
(a) The registrant’s principal executive and principal financial officers, or persons performing similar functions, have concluded that the registrant’s disclosure controls and procedures (as defined in Rule 30a-3(c) under the Investment Company Act of 1940, as amended (the “1940 Act”) (17 CFR 270.30a-3(c))) are effective, as of a date within 90 days of the filing date of this report that includes the disclosure required by this paragraph, based on their evaluation of the controls and procedures required by Rule 30a-3(b) under the 1940 Act (17 CFR 270.30a-3(b)) and Rules 13a-15(b) or 15d-15(b) under the Securities Exchange Act of 1934, as amended (the “Exchange Act”)(17 CFR 240.13a-15(b) or 240.15d-15(b)).
(b) There were no changes in the registrant’s internal control over financial reporting (as defined in Rule 30a-3(d) under the 1940 Act (17 CFR 270.30a-3(d)) that occurred during the second fiscal quarter of the period covered by this report that has materially affected, or is reasonably likely to materially affect, the registrant’s internal control over financial reporting.
ITEM 12. EXHIBITS.
File the exhibits listed below as part of this Form.
(a)(1) Any code of ethics, or amendment thereto, that is the subject of the disclosure required by Item 2, to the extent that the registrant intends to satisfy the Item 2 requirements through filing of an exhibit: Not applicable to this filing.
(a)(2) A separate certification for each principal executive officer and principal financial officer of the registrant as required by Rule 30a-2(a) under the 1940 Act (17 CFR 270.30a-2(a)) in the exact form set forth below: See Ex-99.CERT attached hereto.
(a)(3) Any written solicitation to purchase securities under Rule 23c-1 under the 1940 Act (17 CFR 270.23c-1) sent or given during the period covered by the report by or on behalf of the registrant to 10 or more persons: Not applicable.
(b) If the report is filed under Section 13(a) or 15(d) of the Exchange Act, provide the certifications required by Rule 30a-2(b) under the 1940 Act (17 CFR 270.30a-2(b)); Rule 13a-14(b) or Rule 15d-14(b) under the Exchange Act (17 CFR 240.13a-14(b) or 240.15d-14(b)), and Section 1350 of Chapter 63 of Title 18 of the United States Code (18 U.S.C. 1350) as an exhibit. A certification furnished pursuant to this paragraph will not be deemed “filed” for purposes of Section 18 of the Exchange Act (15 U.S.C. 78r), or otherwise subject to the liability of that section. Such certification will not be deemed to be incorporated by reference into any filing under the Securities Act of 1933 or the Exchange Act, except to the extent that the registrant specifically incorporates it by reference: See Ex-99.906 CERT attached hereto.
SIGNATURES
Pursuant to the requirements of the Securities Exchange Act of 1934 and the Investment Company Act of 1940, the registrant has duly caused this report to be signed on its behalf by the undersigned, thereunto duly authorized.
(Registrant) Nuveen Global Value Opportunities Fund
By (Signature and Title) | /s/ Kevin J. McCarthy | |
| Kevin J. McCarthy | |
| (Vice President and Secretary) | |
Date: September 5, 2013
Pursuant to the requirements of the Securities Exchange Act of 1934 and the Investment Company Act of 1940, this report has been signed below by the following persons on behalf of the registrant and in the capacities and on the dates indicated.
By (Signature and Title) | /s/ Gifford R. Zimmerman | |
| Gifford R. Zimmerman | |
| Chief Administrative Officer | |
| (principal executive officer) | |
Date: September 5, 2013
By (Signature and Title) | /s/ Stephen D. Foy | |
| Stephen D. Foy | |
| Vice President and Controller | |
| (principal financial officer) | |
Date: September 5, 2013