UNITED STATES
SECURITIES AND EXCHANGE COMMISSION
Washington, D.C. 20549
FORM N-CSR
CERTIFIED SHAREHOLDER REPORT OF REGISTERED
MANAGEMENT INVESTMENT COMPANIES
| | |
| Investment Company Act file number | | 811-21903 |
Nuveen Global Equity Income Fund
(Exact name of registrant as specified in charter)
Nuveen Investments
333 West Wacker Drive, Chicago, IL 60606
(Address of principal executive offices) (Zip code)
Kevin J. McCarthy
Nuveen Investments
333 West Wacker Drive, Chicago, IL 60606
(Name and address of agent for service)
Registrant’s telephone number, including area code: (312) 917-7700
Date of fiscal year end: December 31
Date of reporting period: June 30, 2016
Form N-CSR is to be used by management investment companies to file reports with the Commission not later than 10 days after the transmission to stockholders of any report that is required to be transmitted to stockholders under Rule 30e-1 under the Investment Company Act of 1940 (17 CFR 270.30e-1). The Commission may use the information provided on Form N-CSR in its regulatory, disclosure review, inspection, and policy making roles.
A registrant is required to disclose the information specified by Form N-CSR, and the Commission will make this information public. A registrant is not required to respond to the collection of information contained in Form N-CSR unless the Form displays a currently valid Office of Management and Budget (“OMB”) control number. Please direct comments concerning the accuracy of the information collection burden estimate and any suggestions for reducing the burden to Secretary, Securities and Exchange Commission, 450 Fifth Street, NW, Washington, DC 20549-0609. The OMB has reviewed this collection of information under the clearance requirements of 44 U.S.C. ss.3507.
ITEM 1. REPORTS TO STOCKHOLDERS.
| | |
| | |  |
| Closed-End Funds | |
| | | | | | |
| | | | | | | Semi-Annual Report June 30, 2016 |
| | | |
| | | | | | |
| | | | | | | |
| JGV | | | | | | |
| Nuveen Global Equity Income Fund | | |
| | | | | | | |
| | | | | | | | | | | | |
| | | | | | |
| | | | |
| | | | | | | | |
| | | |
| | Life is Complex | | | | |
| |
| | Nuveen makes things e-simple. It only takes a minute to sign up for e-Reports. Once enrolled, you’ll receive an e-mail as soon as your Nuveen Fund information is ready—no more waiting for delivery by regular mail. Just click on the link within the e-mail to see the report and save it on your computer if you wish. |
| | |
| | Free e-Reports right to your e-mail! |
| |
| | www.investordelivery.com If you receive your Nuveen Fund dividends and statements from your financial advisor or brokerage account. |
| |
| or | | www.nuveen.com/accountaccess If you receive your Nuveen Fund dividends and statements directly from Nuveen. |
Table
of Contents
Chairman’s Letter
to Shareholders

Dear Shareholders,
The U.S. economy is now seven years into the recovery, but its pace remains stubbornly subpar compared to past recoveries. Economic data continues to be a mixed bag, as it has been throughout this expansion period. While the unemployment rate fell below its pre-recession level and wages have grown slightly, a surprisingly weak jobs growth report in May cast doubt over the future strength of the labor market. The June employment report was much stronger, however, easing fears that a significant downtrend was emerging. The housing market has improved markedly but its contribution to the recovery has been lackluster. Deflationary pressures, including the dramatic slide in commodity prices, have kept inflation much lower for longer than many expected.
U.S. growth remains modest, while economic conditions elsewhere continue to appear vulnerable. On June 23, 2016, the U.K. voted to leave the European Union, known as “Brexit.” The outcome surprised the global markets, leading to high levels of volatility across equities, fixed income and currencies in the days following the vote. Although the turbulence subsided not long after and many asset classes have largely recovered, uncertainties remain about the Brexit separation process and the economic and political impacts on the U.K., Europe and the rest of the world.
In the meantime, global central banks remain accommodative in efforts to bolster growth. The European Central Bank and Bank of Japan have been providing aggressive monetary stimulus, including adopting negative interest rates in both Europe and Japan, as their economies continue to lag the U.S.’s recovery. China’s policy makers have also continued to manage its slowdown, but investors are still worried about where the world’s second-largest economy might ultimately land.
Many of these ambiguities – both domestic and international – have kept the U.S. Federal Reserve (Fed) from raising short-term interest rates any further since December’s first and only increase thus far. While markets rallied earlier in the year on the widely held expectation that the Fed would defer any increases until June, the unusually weak May jobs report and the Brexit concerns compelled the Fed to hold rates steady at its June meeting. Although labor market conditions improved in June, Britain’s “leave” vote is expected to keep the Fed on hold until later in 2016.
With global economic growth still looking fairly fragile, during certain periods financial markets were volatile over the past year. Although sentiment has improved and conditions have generally recovered from the intense volatility seen in early 2016 and following the Brexit vote in June, we expect that turbulence remains on the horizon for the time being. In this environment, Nuveen remains committed to both managing downside risks and seeking upside potential. If you’re concerned about how resilient your investment portfolio might be, we encourage you to talk to your financial advisor.
On behalf of the other members of the Nuveen Fund Board, we look forward to continuing to earn your trust in the months and years ahead.
Sincerely,

William J. Schneider
Chairman of the Board
August 23, 2016
Portfolio Manager’s
Comments
Nuveen Global Equity Income Fund (JGV)
The Fund’s investment portfolio is managed by Tradewinds Global Investors, LLC, (Tradewinds), an affiliate of Nuveen Investments, Inc. Rod Parsley was the portfolio manager for the Fund.
During May 2016, the Board of the Nuveen Global Equity Income Fund (JGV) approved a plan to reorganize the Fund into the open-end Nuveen NWQ Global Equity Income Fund. The Board also approved the termination of the sub-advisory agreement between Nuveen Fund Advisors, LLC (NFAL) and Tradewinds for JGV, effective August 1, 2016, subsequent to the close of this reporting period.
Additionally, as of August 1, 2016, JGV is no longer managed by Rod Parsley. The Fund is currently managed by James T. Stephenson, CFA, a Managing Director, Portfolio Manager and Equity Analyst at NWQ and Thomas J. Ray, CFA, a Managing Director, Head of Fixed Income and Portfolio Manager at NWQ.
Here Rod Parsley reviews key management strategies and the Fund’s performance for the six-month reporting period ended June 30, 2016.
What key strategies were used to manage the Fund during this six-month reporting period ended June 30, 2016?
The Fund seeks total return and dividend income by investing primarily in a diversified global portfolio of value equity securities and by opportunistically writing covered-call options. Our basic investment philosophy continues to be searching for good business franchises around the globe whose securities are selling below their intrinsic value. All else being equal, the Fund favors stocks which pay dividends over those that do not.
The Fund’s portfolio manager and the Tradewinds research team found what they perceive to be significant value across many sectors globally, particularly in the generally volatile environment of 2016 thus far. We believe this has resulted in a differentiated and high conviction portfolio.
Covered-call options are primarily used to enhance yield. The Fund continued its use of covered-call options during the reporting period, and the portfolio manager will continue to opportunistically sell calls on a security-by-security basis.
The Fund also utilizes a currency hedging program, whereby the Fund systematically hedges the currency risk from its investments in non-U.S. dollar denominated foreign equity securities. These positions had a positive impact on performance during the reporting period.
Certain statements in this report are forward-looking statements. Discussions of specific investments are for illustration only and are not intended as recommendations of individual investments. The forward-looking statements and other views expressed herein are those of the portfolio manager as of the date of this report. Actual future results or occurrences may differ significantly from those anticipated in any forward-looking statements and the views expressed herein are subject to change at any time, due to numerous market and other factors. The Fund disclaims any obligation to update publicly or revise any forward-looking statements or views expressed herein.
For financial reporting purposes, the ratings disclosed are the highest rating given by one of the following national rating agencies: Standard & Poor’s (S&P), Moody’s Investors Service, Inc. (Moody’s) or Fitch, Inc. (Fitch). Credit ratings are subject to change. AAA, AA, A and BBB are investment grade ratings; BB, B, CCC, CC, C and D are below investment grade ratings. Certain bonds backed by U.S. Government or agency securities are regarded as having an implied rating equal to the rating of such securities. Holdings designated N/R are not rated by these national rating agencies.
Refer to the Glossary of Terms Used in this Report for further definition of the terms used within this section.
Portfolio Manager’s Comments (continued)
How did the Fund perform during this six-month reporting period ended June 30, 2016?
The table in the Performance Overview and Holding Summaries section of this report provides total returns for the six-month, one-year, five-year and since inception periods ended June 30, 2016. The Fund’s total return at net asset value (NAV) is compared with the performance of a corresponding market index. For the six-month reporting period ending June 30, 2016, the Fund’s common shares at NAV outperformed both its comparative Blended Benchmark and the MSCI All Country World Index.
While there were many market developments during the reporting period, Britain’s vote to leave the European Union, or “Brexit,” near the end of the reporting period attracted the bulk of investor attention. The heightened uncertainty generated by the widely unanticipated referendum results led to severe market declines in the days following, though some of those specific losses were recovered before the month closed. Some fairly immediate effects of Brexit included ratings agencies downgrading the U.K.’s credit rating, the Bank of England laying rhetorical groundwork for an interest rate cut and businesses considering moving operations out of the U.K.
Early in the reporting period, global equity markets had experienced elevated volatility due to investor concerns regarding prospective Federal Reserve tightening, continued weakness in oil prices, uncertainty regarding global growth (particularly in China) and the unexpected announcement of a negative interest rate policy from the Bank of Japan. Flight-to-safety effects could be seen in multiple areas, with defensive equity sectors and gold rising in value. In February, investors began finding solace in select countervailing factors, such as oil prices seeming to hit at least a short-term bottom, and a rally took place that lasted until the aforementioned British referendum results.
While the world post-Brexit may be likely to exhibit lower growth than previously expected, we see some cyclical companies representing attractive opportunities for patient investors who hold them through to a more stable period. As always, where political or economic disorder causes market disruptions we believe great values can be found, and many companies are trading at close to all-time-low valuations. Prudence during times of intensified uncertainty is also key, however. Accordingly, we’re selectively adding to some current positions.
The Fund’s relative sector allocation effects were positive over the reporting period, but favorable stock selections were a slightly stronger factor behind outperformance. Stock selections within the utilities, energy and health care sectors led contribution to relative performance. Performance was limited by unfavorable stock selections in the financials, industrials and consumer staples sectors.
Brazilian water and waste utility Companhia de Saneamento Basico do Estado de Sao Paulo (Sabesp) was the top contributor to performance during the reporting period. The company continues to benefit from reduced water rationing incentives and increased water consumption as higher rainfall during the year has helped to alleviate drought strain. Additionally, we believe Sabesp is poised to increase revenue through the resumption of local water payments and the reactivation of unpursued claims that had been suspended due to legal issues around rationing, the Brazilian elections, rising inflation and drought. Although the company is still challenged by devalued local currency and foreign debt issues, we believe operational enhancements position Sabesp to benefit when the effects of foreign currency improve.
Communications services company CenturyLink Inc. was another contributor to performance. Following slightly negative growth last year, the company released a strong earnings report during the first quarter of 2016 and beat earnings expectations by a significant margin. We find the company has generated strong free cash flow, allowing for share repurchases and what we view as an attractive dividend. We believe CenturyLink is still undervalued and possible improvements in its high-speed internet, Prism TV and data center businesses should provide opportunity for continued growth in the coming years.
Multi-national integrated oil/gas company Royal Dutch Shell PLC also contributed to performance. The company has benefited from oil prices improving significantly over much of the reporting period. Refining market margins grew as well, which also acted as a tailwind for the company. Shell has pivoted its business to place greater focus on less capital intensive, higher cash flow assets, and we believe investors have recognized this.
Swiss bank UBS Group AG was the top detractor from performance during the reporting period. The financials sector was notably weak during the early part of the reporting period, a generalized sell-off that certainly affected UBS. Additionally, the company announced poor financial results during the first quarter that set investors on edge. UBS also suffered from Brexit concerns and continued to receive pressure to make further cost structure improvements. We believe UBS has made reasonable headway in its restructuring, especially in light of the departure of three senior executives in an effort to streamline global operations. UBS will certainly be challenged as the full aftermath of Brexit is determined, but we believe the bank is making intelligent decisions that will position it to better meet these challenges over the long-term.
Scottish financial holding company Royal Bank of Scotland Group PLC was another detractor from performance. While we still believe the company is effectively transitioning away from high-capital-intensity, higher risk investment banking toward higher return, lower risk retail/commercial banking, the transition is taking an extended period, as we initially expected. Other investors have proven less patient with this transition, especially in an environment of extreme weakness for European banks and the repercussions of Brexit. However, we believe that the company has suffered from an undue amount of investor pessimism and we find Royal Bank of Scotland to be an increasingly attractive investment as it focuses on higher return operations.
Multi-national insurance company Ageas SA also detracted from performance, after having contributed during much of 2015. During the reporting period the company agreed to pay €1.2 billion to settle legacy Fortis claims. While this represents a substantial sum, we believe the company wisely removed a significant overhang that could now make it a more broadly attractive investment going forward.
As mentioned previously, the Fund continued to write call options on individual stocks held in its portfolio as part of its overall management strategy. The covered call writing strategy contributed negatively to the Fund’s performance during the period.
We also use foreign currency exchange forward contracts to manage foreign currency exposure. For example, the Fund may hedge positions in select currencies. These positions had a positive impact on performance during the reporting period.
Share
Information
DISTRIBUTION INFORMATION
The following information regarding the Fund’s distributions is current as of May 31, 2016, the date of the distribution data included within the Fund’s most recent distribution notice at the time this report was prepared. The Fund’s distribution levels may vary over time based on the Fund’s investment activities and portfolio investment value changes.
The Fund has adopted a managed distribution program. The goal of the Fund’s managed distribution program is to provide shareholders relatively consistent and predictable cash flow by systematically converting its expected long-term return potential into regular distributions. As a result, regular distributions throughout the year will likely include a portion of expected long-term and/or short-term gains (both realized and unrealized), along with net investment income.
Important points to understand about Nuveen fund managed distributions are:
| • | | The Fund seeks to establish a relatively stable common share distribution rate that roughly corresponds to the projected total return from its investment strategy over an extended period of time. However, you should not draw any conclusions about the Fund’s past or future investment performance from its current distribution rate. |
| • | | Actual common share returns will differ from projected long-term returns (and therefore the Fund’s distribution rate), at least over shorter time periods. Over a specific timeframe, the difference between actual returns and total distributions will be reflected in an increasing (returns exceed distributions) or a decreasing (distributions exceed returns) Fund net asset value. |
| • | | Each period’s distributions are expected to be paid from some or all of the following sources: |
| | • | | net investment income consisting of regular interest and dividends, |
| | • | | net realized gains from portfolio investments, and |
| | • | | unrealized gains, or, in certain cases, a return of principal (non-taxable distributions). |
| • | | A non-taxable distribution is a payment of a portion of the Fund’s capital. When the Fund’s returns exceed distributions, it may represent portfolio gains generated, but not realized as a taxable capital gain. In periods when the Fund’s returns fall short of distributions, it will represent a portion of your original principal unless the shortfall is offset during other time periods over the life of your investment (previous or subsequent) when the Fund’s total return exceeds distributions. |
| • | | Because distribution source estimates are updated throughout the current fiscal year based on the Fund’s performance, these estimates may differ from both the tax information reported to you in the Fund’s 1099 statement, as well as the ultimate economic sources of distributions over the life of your investment. |
The following table provides information regarding the Fund’s distributions and total return performance over various time periods. This information is intended to help you better understand whether the Fund’s returns for the specified time periods were sufficient to meet its distributions.
Data as of May 31, 2016
| | | | | | | | | | | | | | | | | | | | | | | | | | | | | | | | | | | | | | | | |
| | | Per Share Distribution | | | | | | | | | | | | | | | Annualized Total
Return on NAV | | | | |
Inception Date | | Quarterly | | | Monthly Equivalent | | | Monthly Net
Investment
Income1 | | | YTD Net Realized Gain/Loss2 | | | Inception Unrealized Gain/Loss2 | | | Current Distribution Rate on NAV3 | | | 1-Year | | | 5-Year | | | YTD | | | YTD Distribution Rate on NAV4 | |
7/2006 | | $ | 0.2340 | | | $ | 0.0780 | | | $ | 0.0307 | | | $ | 0.0616 | | | $ | (1.1113 | ) | | | 7.55 | % | | | (11.43 | )% | | | (2.42 | )% | | | 2.89 | % | | | 3.77 | % |
| 1 | Net investment income is expressed as a monthly amount using a six-month average. |
| 2 | These are approximations. Actual amounts may be more or less than amounts listed above. |
| 3 | Current distribution, annualized, expressed over the most recent month-end NAV. |
| 4 | Sum of year-to-date distributions expressed over the most recent month-end NAV. |
The following table provides estimates of the Fund’s distribution sources, reflecting year-to-date cumulative experience through the latest month-end. These estimates are for informational purposes only. The Fund attributes these estimates equally to each regular distribution throughout the year. Consequently, the estimated information shown below is for the current distribution, and also represents an updated estimate for all prior months in the year.
The amounts and sources of distributions reported in this notice are only estimates and are not being provided for tax reporting purposes. The actual amounts and character of the distributions for tax reporting purposes will be reported to shareholders on Form 1099-DIV which will be sent to shareholders shortly after calendar year-end. More details about the Fund’s distributions and the basis for these estimates are available on www.nuveen.com/cef.
Data as of May 31, 2016
| | | | | | | | | | | | | | | | | | | | | | | | | | | | | | |
| | | | Current Quarter | | | Calendar YTD | |
| | | | Estimated Source of Distribution | | | Estimated Per Share Amounts | |
Per Share
Distribution | | | Net
Investment
Income1 | | | Realized Gains | | | Return of Capital2 | | | Distributions3 | | | Net
Investment
Income1 | | | Realized Gains | | | Return of Capital2 | |
| | $0.2340 | | | | 42.3% | | | | 13.2% | | | | 44.5% | | | | $0.4680 | | | | $0.1982 | | | | $0.0616 | | | | $0.2082 | |
| 1 | Net investment income is a projection through the end of the current calendar quarter based on most recent month-end data. |
| 2 | Return of capital may represent unrealized gains, return of shareholder’s principal, or both. In certain circumstances, all or a portion of the return of capital may be characterized as ordinary income under federal tax law. The acutal tax characterization will be provided to shareholders on Form 1099-DIV shortly after claendar year-end. |
| 3 | Includes the most recent quarterly distribution declaration. |
SHARE REPURCHASES
During August 2016 (subsequent to the close of this reporting period), the Fund’s Board of Trustees reauthorized an open-market share repurchase program, allowing the Fund to repurchase an aggregate of up to approximately 10% of its outstanding shares.
As of June 30, 2016, and since the inception of the Fund’s repurchase program, the Fund has cumulatively repurchased and retired its outstanding shares as shown in the accompanying table.
| | | | |
| | | JGV | |
Shares cumulatively repurchased and retired | | | 625,700 | |
Shares authorized for repurchase | | | 1,905,000 | |
During the current reporting period, the Fund did not repurchase any of its outstanding shares.
Share Information (Unaudited) (continued)
OTHER SHARE INFORMATION
As of June 30, 2016, and during the current reporting period, the Fund’s share price was trading at a premium/(discount) to its NAV as shown in the accompanying table.
| | | | |
| | | JGV | |
NAV | | | $12.11 | |
Share price | | | $11.67 | |
Premium/(Discount) to NAV | | | (3.63 | )% |
6-month average premium/(discount) to NAV | | | (8.16 | )% |
Risk
Considerations
Fund shares are not guaranteed or endorsed by any bank or other insured depository institution, and are not federally insured by the Federal Deposit Insurance Corporation.
Nuveen Global Equity Income Fund (JGV)
Investing in closed-end funds involves risk; principal loss is possible. There is no guarantee the Fund’s investment objectives will be achieved. Closed-end fund shares may frequently trade at a discount or premium to their net asset value. Common stock returns often have experienced significant volatility. Foreign investments involve additional risks, including currency fluctuation if not hedged, political and economic instability, lack of liquidity and differing legal and accounting standards. The risks of foreign investments are magnified in emerging markets. The fund’s currency hedging strategy may not completely eliminate the fund’s currency exposure. For these and other risks, including counterparty risk and call option risk, please see the Fund’s web page at www.nuveen.com/JGV.
JGV
Nuveen Global Equity Income Fund
Performance Overview and Holding Summaries as of June 30, 2016
Refer to the Glossary of Terms Used in this Report for further definition of the terms used within this section.
Average Annual Total Returns as of June 30, 2016
| | | | | | | | | | | | | | | | |
| | | Cumulative | | | Average Annual | |
| | | 6-Month | | | 1-Year | | | 5-Year | | | Since
Inception | |
| JGV at NAV | | | 2.43% | | | | (7.24)% | | | | (2.02)% | | | | 3.25% | |
| JGV at Share Price | | | 11.34% | | | | 1.89% | | | | (2.08)% | | | | 3.08% | |
| Blended Benchmark | | | 2.33% | | | | (1.85)% | | | | 5.34% | | | | 5.01% | |
| MSCI All Country World Index | | | 1.23% | | | | (3.73)% | | | | 5.38% | | | | 4.48% | |
Average Annual Total Returns as of June 30, 20161
(including retained gain tax credit/refund)
| | | | | | | | | | | | | | | | |
| | | Cumulative | | | Average Annual | |
| | | 6-Month | | | 1-Year | | | 5-Year | | | Since
Inception | |
| JGV at NAV | | | 2.43% | | | | (7.24)% | | | | (2.02)% | | | | 3.33% | |
| JGV at Share Price | | | 11.34% | | | | 1.89% | | | | (2.08)% | | | | 3.16% | |
Since inception returns are from 7/24/06. Past performance is not predictive of future results. Current performance may be higher or lower than the data shown. Returns do not reflect the deduction of taxes that shareholders may have to pay on Fund distributions or upon the sale of Fund shares. Returns at NAV are net of Fund expenses, and assume reinvestment of distributions. Comparative index return information is provided for the Fund’s shares at NAV only. Indexes are not available for direct investment.
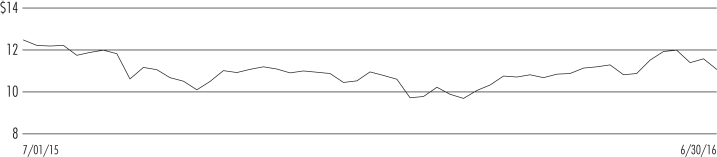
Share Price Performance — Weekly Closing Price
| 1 | The Fund elected to retain a portion of its realized long-term capital gains for the tax year ended December 31, 2007, and pay required federal corporate income taxes on these amounts. These standardized total returns include the economic benefit to shareholders of record of this tax credit/refund. The Fund had no retained capital gains for the tax years ended December 31, 2008 through December 31, 2015 or for the tax year ended December 31, 2006. |
This data relates to the securities held in the Fund’s portfolio of investments as of the end of the reporting period. It should not be construed as a measure of performance for the Fund itself. Holdings are subject to change.
Fund Allocation
(% of net assets)
| | | | |
| Common Stocks | | | 91.5% | |
| Mortgage-Backed Securities | | | 0.0% | |
| Repurchase Agreements | | | 11.3% | |
| Other Assets Less Liabilities | | | (2.8)% | |
Net Assets | | | 100% | |
Portfolio Composition
(% of total investments)1
| | | | |
| Oil, Gas & Consumable Fuels | | | 10.8% | |
| Diversified Telecommunication Services | | | 8.0% | |
| Insurance | | | 8.0% | |
| Pharmaceuticals | | | 7.5% | |
| Food Products | | | 7.4% | |
| Independent Power & Renewable Electricity Producers | | | 6.0% | |
| Banks | | | 5.5% | |
| Real Estate Investment Trust | | | 5.3% | |
| Automobiles | | | 5.2% | |
| Chemicals | | | 3.8% | |
| Semiconductors & Semiconductor Equipment | | | 2.7% | |
| Other | | | 18.8% | |
| Repurchase Agreements | | | 11.0% | |
Total | | | 100% | |
Top Five Issuers
(% of total long-term investments)1
| | | | |
| BP PLC | | | 4.8% | |
| Bunge Limited | | | 4.4% | |
| CenturyLink Inc. | | | 4.3% | |
| Royal Dutch Shell PLC, Class B Shares | | | 4.0% | |
| Agrium Inc. | | | 3.8% | |
Country Allocation
(% of total investments)1
| | | | |
United States | | | 58.1% | |
United Kingdom | | | 9.8% | |
Norway | | | 5.3% | |
Switzerland | | | 5.1% | |
Belgium | | | 3.8% | |
Denmark | | | 3.1% | |
Other | | | 14.8% | |
Total | | | 100% | |
| 1 | Excluding investments in derivatives. |
JGV
| | |
Nuveen Global Equity Income Fund | | |
Portfolio of Investments | | June 30, 2016 (Unaudited) |
| | | | | | | | | | | | | | | | | | | | |
| Shares | | | Description (1) | | | | | | | | | | | Value | |
| | | | | |
| | | | LONG-TERM INVESTMENTS – 91.5% | | | | | | | | | | | | | | | | |
| | | | | |
| | | | COMMON STOCKS – 91.5% | | | | | | | | | | | | | | | | |
| | | | | |
| | | | Automobiles – 5.3% | | | | | | | | | | | | |
| | | | | |
| | 273,000 | | | General Motors Company | | | | | | | | | | | | | | $ | 7,725,900 | |
| | 43,800 | | | Toyota Motor Corporation, Sponsored ADR | | | | | | | | | | | | | | | 4,379,562 | |
| | | | Total Automobiles | | | | | | | | | | | | | | | 12,105,462 | |
| | | | | |
| | | | Banks – 5.6% | | | | | | | | | | | | |
| | | | | |
| | 184,771 | | | ABN AMRO Group NV, (2) | | | | | | | | | | | | | | | 3,037,754 | |
| | 380,000 | | | Banco Bilbao Vizcaya Argentaria S.A Sponsored ADR | | | | | | | | | | | | | | | 2,181,200 | |
| | 935,000 | | | HSBC Holdings PLC, (2) | | | | | | | | | | | | | | | 5,792,838 | |
| | 800,000 | | | Royal Bank of Scotland Group PLC, (2), (3) | | | | | | | | | | | | | | | 1,812,922 | |
| | | | Total Banks | | | | | | | | | | | | | | | 12,824,714 | |
| | | | | |
| | | | Beverages – 2.0% | | | | | | | | | | | | |
| | | | | |
| | 47,700 | | | Carlsberg AS, B Shares, (2) | | | | | | | | | | | | | | | 4,550,959 | |
| | | | | |
| | | | Capital Markets – 2.7% | | | | | | | | | | | | |
| | | | | |
| | 468,000 | | | UBS Group AG | | | | | | | | | | | | | | | 6,065,280 | |
| | | | | |
| | | | Chemicals – 3.9% | | | | | | | | | | | | |
| | | | | |
| | 97,400 | | | Agrium Inc. | | | | | | | | | | | | | | | 8,806,908 | |
| | | | | |
| | | | Commercial Services & Supplies – 1.8% | | | | | | | | | | | | |
| | | | | |
| | 1,591,590 | | | Cape PLC, (2) | | | | | | | | | | | | | | | 4,083,449 | |
| | | | | |
| | | | Diversified Telecommunication Services – 8.3% | | | | | | | | | | | | |
| | | | | |
| | 343,500 | | | CenturyLink Inc., (4) | | | | | | | | | | | | | | | 9,964,935 | |
| | 168,501 | | | Telefonica S.A, (2), (3) | | | | | | | | | | | | | | | 1,599,717 | |
| | 436,000 | | | Telenor ASA, (2) | | | | | | | | | | | | | | | 7,217,111 | |
| | | | Total Diversified Telecommunication Services | | | | | | | | | | | | | | | 18,781,763 | |
| | | | | |
| | | | Electric Utilities – 1.3% | | | | | | | | | | | | |
| | | | | |
| | 78,500 | | | Exelon Corporation | | | | | | | | | | | | | | | 2,854,260 | |
| | | | | |
| | | | Food & Staples Retailing – 2.5% | | | | | | | | | | | | |
| | | | | |
| | 161,900 | | | Andersons, Inc. | | | | | | | | | | | | | | | 5,753,926 | |
| | | | | |
| | | | Food Products – 7.6% | | | | | | | | | | | | |
| | | | | |
| | 285,000 | | | Adecoagro SA, (3) | | | | | | | | | | | | | | | 3,126,450 | |
| | 52,500 | | | Archer-Daniels-Midland Company | | | | | | | | | | | | | | | 2,251,725 | |
| | 175,500 | | | Bunge Limited | | | | | | | | | | | | | | | 10,380,825 | |
| | 170,000 | | | MHP SA, 144A, GDR, (2) | | | | | | | | | | | | | | | 1,564,000 | |
| | | | Total Food Products | | | | | | | | | | | | | | | 17,323,000 | |
| | | | | |
| | | | Independent Power & Renewable Electricity Producers – 6.2% | | | | | | | | | | | | |
| | | | | |
| | 450,000 | | | AES Corporation | | | | | | | | | | | | | | | 5,616,000 | |
| | 325,000 | | | NRG Energy Inc. | | | | | | | | | | | | | | | 4,871,750 | |
| | 154,000 | | | Pattern Energy Group Inc. | | | | | | | | | | | | | | | 3,537,380 | |
| | | | Total Independent Power & Renewable Electricity Producers | | | | | | | | | | | | | | | 14,025,130 | |
| | | | | |
| | | | Insurance – 8.2% | | | | | | | | | | | | |
| | | | | |
| | 150,500 | | | Ageas SA, (2) | | | | | | | | | | | | | | | 5,231,269 | |
| | 102,500 | | | Axis Capital Holdings Limited | | | | | | | | | | | | | | | 5,637,500 | |
| | | | | | | | | | | | | | | | | | | | |
| Shares | | | Description (1) | | | | | | | | | | | Value | |
| | | | | |
| | | | Insurance (continued) | | | | | | | | | | | | |
| | | | | |
| | 249,832 | | | CNA Financial Corporation | | | | | | | | | | | | | | $ | 7,849,721 | |
| | | | Total Insurance | | | | | | | | | | | | | | | 18,718,490 | |
| | | | | |
| | | | Life Sciences Tools & Services – 1.1% | | | | | | | | | | | | |
| | | | | |
| | 55,000 | | | Agilent Technologies, Inc. | | | | | | | | | | | | | | | 2,439,800 | |
| | | | | |
| | | | Media – 1.7% | | | | | | | | | | | | |
| | | | | |
| | 166,000 | | | Interpublic Group of Companies, Inc. | | | | | | | | | | | | | | | 3,834,600 | |
| | | | | |
| | | | Oil, Gas & Consumable Fuels – 11.1% | | | | | | | | | | | | |
| | | | | |
| | 86,725 | | | Apache Corporation | | | | | | | | | | | | | | | 4,827,981 | |
| | 313,500 | | | BP PLC, Sponsored ADR | | | | | | | | | | | | | | | 11,132,385 | |
| | 335,000 | | | Royal Dutch Shell PLC, Class B Shares, (2) | | | | | | | | | | | | | | | 9,255,571 | |
| | | | Total Oil, Gas & Consumable Fuels | | | | | | | | | | | | | | | 25,215,937 | |
| | | | | |
| | | | Pharmaceuticals – 7.7% | | | | | | | | | | | | |
| | | | | |
| | 181,000 | | | Pfizer Inc. | | | | | | | | | | | | | | | 6,373,010 | |
| | 22,200 | | | Roche Holdings AG, (2) | | | | | | | | | | | | | | | 5,858,131 | |
| | 127,000 | | | Sanofi-Aventis, Sponsored ADR | | | | | | | | | | | | | | | 5,314,950 | |
| | | | Total Pharmaceuticals | | | | | | | | | | | | | | | 17,546,091 | |
| | | | | |
| | | | Real Estate Investment Trust – 5.4% | | | | | | | | | | | | |
| | | | | |
| | 386,000 | | | Colony Capital, Inc., Class A | | | | | | | | | | | | | | | 5,925,100 | |
| | 630,000 | | | Lexington Realty Trust | | | | | | | | | | | | | | | 6,369,300 | |
| | | | Total Real Estate Investment Trust | | | | | | | | | | | | | | | 12,294,400 | |
| | | | | |
| | | | Real Estate Management & Development – 1.2% | | | | | | | | | | | | |
| | | | | |
| | 460,000 | | | City Developments Limited, (2) | | | | | | | | | | | | | | | 2,795,350 | |
| | | | | |
| | | | Semiconductors & Semiconductor Equipment – 2.8% | | | | | | | | | | | | |
| | | | | |
| | 462,000 | | | Micron Technology, Inc., (3) | | | | | | | | | | | | | | | 6,357,120 | |
| | | | | |
| | | | Software – 2.0% | | | | | | | | | | | | |
| | | | | |
| | 236,000 | | | Infoblox, Incorporated, (3) | | | | | | | | | | | | | | | 4,427,360 | |
| | | | | |
| | | | Specialty Retail – 1.3% | | | | | | | | | | | | |
| | | | | |
| | 141,000 | | | DSW Inc., Class A | | | | | | | | | | | | | | | 2,986,380 | |
| | | | | |
| | | | Textiles, Apparel & Luxury Goods – 0.0% | | | | | | | | | | | | |
| | | | | |
| | 2,506,000 | | | China Hongxing Sports Limited, (5) | | | | | | | | | | | | | | | 2 | |
| | | | | |
| | | | Water Utilities – 1.8% | | | | | | | | | | | | |
| | | | |
| | 374,000 | | | Companhia de Saneamento Basico do Estado de Sao Paulo, Sponsored ADR, (3) | | | | | | | | | | | | 3,351,040 | |
| | 3,975,000 | | | Sound Global Ltd., (3), (5) | | | | | | | | | | | | | | | 763,428 | |
| | | | Total Water Utilities | | | | | | | | | | | | | | | 4,114,468 | |
| | | | Total Common Stocks (cost $232,515,078) | | | | | | | | | | | | | | | 207,904,849 | |
| | | | | |
Principal
Amount (000) | | | Description (1) | | Coupon | | | Maturity | | | Ratings (6) | | | Value | |
| | | | | |
| | | | MORTGAGE-BACKED SECURITIES – 0.0% | | | | | | | | | | | | |
| | | | | |
| $ | 25 | | | Fannie Mae Mortgage Pool 100195 | | | 2.610% | | | | 8/20/22 | | | | Aaa | | | $ | 24,564 | |
| $ | 25 | | | Total Mortgage-Backed Securities (cost $24,449) | | | | | | | | | | | | | | | 24,564 | |
| | | | Total Long-Term Investments (cost $232,539,527) | | | | | | | | | | | | | | | 207,929,413 | |
| | | | |
| JGV | | Nuveen Global Equity Income Fund | | |
| | Portfolio of Investments (continued) | | June 30, 2016 (Unaudited) |
| | | | | | | | | | | | | | | | | | | | |
Principal
Amount (000) | | | Description (1) | | Coupon | | | Maturity | | | | | | Value | |
| | | | | |
| | | | SHORT-TERM INVESTMENTS – 11.3% | | | | | | | | | | | | |
| | | | | |
| | | | REPURCHASE AGREEMENTS – 11.3% | | | | | | | | | | | | |
| | | | | |
| $ | 25,751 | | | Repurchase Agreement with Fixed Income Clearing Corporation, dated 6/30/16, repurchase price $25,751,025, collateralized by $23,775,000 U.S. Treasury Notes, 2.750%, due 11/15/23, value $26,271,375 | | | 0.030% | | | | 7/01/16 | | | | | | | $ | 25,751,004 | |
| | | | Total Short-Term Investments (cost $25,751,004) | | | | | | | | | | | | | | | 25,751,004 | |
| | | | Total Investments (cost $258,290,531) – 102.8% | | | | | | | | | | | | | | | 233,680,417 | |
| | | | Other Assets Less Liabilities – (2.8)% (7) | | | | | | | | | | | | | | | (6,268,989 | ) |
| | | | Net Assets – 100% | | | | | | | | | | | | | | $ | 227,411,428 | |
Investments in Derivatives as of June 30, 2016
Options Written
| | | | | | | | | | | | | | | | | | | | |
Number of
Contracts | | | Description | | Notional
Amount (8) | | | Expiration
Date | | | Strike
Price | | | Value | |
| | (250 | ) | | Agrium Inc. | | $ | (2,250,000 | ) | | | 7/15/16 | | | $ | 90 | | | $ | (56,250 | ) |
| | (640 | ) | | Exelon Corporation | | | (2,240,000 | ) | | | 7/15/16 | | | | 35 | | | | (92,800 | ) |
| | (890 | ) | | Total Options Written (premiums received $161,070) | | $ | (4,490,000 | ) | | | | | | | | | | $ | (149,050 | ) |
Forward Foreign Currency Exchange Contracts
| | | | | | | | | | | | | | | | | | | | | | | | |
Counterparty | | Currency Contracts to Deliver | | | Notional Amount (Local Currency) | | | In Exchange For Currency | | | Notional Amount (Local Currency) | | | Settlement Date | | | Unrealized Appreciation (Depreciation) (U.S. Dollars) | |
Morgan Stanley Capital Services LLC | | | Australian Dollar | | | | 4,900,589 | | | | U.S. Dollar | | | | 3,596,366 | | | | 7/29/2016 | | | $ | (55,256 | ) |
Morgan Stanley Capital Services LLC | | | Danish Krone | | | | 30,626,509 | | | | U.S. Dollar | | | | 4,524,752 | | | | 7/29/2016 | | | | (48,954 | ) |
Morgan Stanley Capital Services LLC | | | Euro | | | | 16,539,740 | | | | U.S. Dollar | | | | 18,175,487 | | | | 7/29/2016 | | | | (195,499 | ) |
Morgan Stanley Capital Services LLC | | | Hong Kong Dollar | | | | 6,099,973 | | | | U.S. Dollar | | | | 786,180 | | | | 7/29/2016 | | | | (332 | ) |
Morgan Stanley Capital Services LLC | | | Japanese Yen | | | | 490,463,156 | | | | U.S. Dollar | | | | 4,829,604 | | | | 7/29/2016 | | | | 76,596 | |
Morgan Stanley Capital Services LLC | | | Norwegian Krone | | | | 56,934,054 | | | | U.S. Dollar | | | | 6,618,284 | | | | 7/29/2016 | | | | (184,704 | ) |
Morgan Stanley Capital Services LLC | | | Pound Sterling | | | | 22,854,155 | | | | U.S. Dollar | | | | 30,061,441 | | | | 7/29/2016 | | | | (369,235 | ) |
Morgan Stanley Capital Services LLC | | | Singapore Dollar | | | | 4,145,670 | | | | U.S. Dollar | | | | 3,040,016 | | | | 7/29/2016 | | | | (36,868 | ) |
Morgan Stanley Capital Services LLC | | | Swiss Franc | | | | 5,568,964 | | | | U.S. Dollar | | | | 5,688,130 | | | | 7/29/2016 | | | | (23,708 | ) |
Morgan Stanley Capital Services LLC | | | U.S. Dollar | | | | 12,000 | | | | Australian Dollar | | | | 16,351 | | | | 7/29/2016 | | | | 183 | |
Morgan Stanley Capital Services LLC | | | U.S. Dollar | | | | 22,816 | | | | Hong Kong Dollar | | | | 176,994 | | | | 7/29/2016 | | | | 5 | |
Morgan Stanley Capital Services LLC | | | U.S. Dollar | | | | 248,547 | | | | Japanese Yen | | | | 25,237,391 | | | | 7/29/2016 | | | | (3,975 | ) |
Morgan Stanley Capital Services LLC | | | U.S. Dollar | | | | 250,292 | | | | Norwegian Krone | | | | 2,152,902 | | | | 7/29/2016 | | | | 6,956 | |
Morgan Stanley Capital Services LLC | | | U.S. Dollar | | | | 252,278 | | | | Singapore Dollar | | | | 343,896 | | | | 7/29/2016 | | | | 2,959 | |
Morgan Stanley Capital Services LLC | | | U.S. Dollar | | | | 303,103 | | | | Danish Krone | | | | 2,050,662 | | | | 7/29/2016 | | | | 3,139 | |
Morgan Stanley Capital Services LLC | | | U.S. Dollar | | | | 333,106 | | | | Swiss Franc | | | | 325,926 | | | | 7/29/2016 | | | | 1,182 | |
Morgan Stanley Capital Services LLC | | | U.S. Dollar | | | | 555,564 | | | | Pound Sterling | | | | 422,259 | | | | 7/29/2016 | | | | 6,680 | |
Morgan Stanley Capital Services LLC | | | U.S. Dollar | | | | 1,241,733 | | | | Euro | | | | 1,129,814 | | | | 7/29/2016 | | | | 13,171 | |
| | | | | | | | | | | | | | | | | | | | | | | $ | (807,660 | ) |
For Fund portfolio compliance purposes, the Fund’s industry classifications refer to any one or more of the industry sub-classifications used by one or more widely recognized market indexes or ratings group indexes, and/or as defined by Fund management. This definition may not apply for purposes of this report, which may combine industry sub-classifications into sectors for reporting ease.
| (1) | All percentages shown in the Portfolio of Investments are based on net assets. |
| (2) | For fair value measurement disclosure purposes, investment classified as Level 2. See Notes to Financial Statements, Note 2 – Investment Valuation and Fair Value Measurements for more information. |
| (3) | Non-income producing; issuer has not declared a dividend within the past twelve months. |
| (4) | Investment, or portion of investment, has been pledged as collateralize the net payment obligations for investments in derivatives. |
| (5) | Investment valued at fair value using methods determined in good faith by, or at the discretion of the Board. For fair value measurement disclosure purposes, investment classified as Level 3. See Notes to Financial Statements, Note 2 – Investment Valuation and Fair Value Measurements for more information. |
| (6) | For financial reporting purposes, the ratings disclosed are the highest of Standard & Poor’s Group (“Standard & Poor’s”), Moody’s Investors Service, Inc. (“Moody’s”) or Fitch, Inc. (“Fitch”) rating. Ratings below BBB by Standard & Poor’s, Baa by Moody’s or BBB by Fitch are considered to be below investment grade. Holdings designated N/R are not rated by any of these national rating agencies. |
| (7) | Other assets less liabilities includes the unrealized appreciation (depreciation) of certain over-the-counter (“OTC”) derivatives as presented on the Statement of Assets and Liabilities, when applicable. The unrealized appreciation (depreciation) of OTC-cleared and exchanged-traded derivatives is recognized as part of the cash collateral at brokers and/or the receivable or payable for variation margin as presented on the Statement of Assets and Liabilities, when applicable. Other assets less liabilities also includes the value of options as presented on the Statement of Assets and Liabilities. |
| (8) | For disclosure purposes, Notional Amount is calculated by multiplying the Number of Contracts by the Strike Price by 100. |
| 144A | Investment is exempt from registration under Rule 144A of the Securities Act of 1933, as amended. These investments may only be resold in transactions exempt from registration, which are normally those transactions with qualified institutional buyers. |
| ADR | American Depositary Receipt |
| GDR | Global Depositary Receipt |
See accompanying notes to financial statements.
| | | | | | |
Statement of Assets and Liabilities | | June 30, 2016 (Unaudited) |
| | | | |
Assets | | | | |
Long-term investments, at value (cost $232,539,527) | | $ | 207,929,413 | |
Short-term investments, at value (cost approximates value) | | | 25,751,004 | |
Receivable for: | | | | |
Dividends | | | 585,014 | |
Interest | | | 75 | |
Investments sold | | | 605,704 | |
Reclaims | | | 160,197 | |
Other assets | | | 33,778 | |
Total assets | | | 235,065,185 | |
Liabilities | | | | |
Options written, at value (premiums received $161,070) | | | 149,050 | |
Unrealized depreciation on forward foreign currency exchange contracts, net | | | 807,660 | |
Payable for: | | | | |
Dividends | | | 4,262,852 | |
Investments purchased | | | 2,089,494 | |
Accrued expenses: | | | | |
Management fees | | | 179,579 | |
Trustees fees | | | 29,998 | |
Other | | | 135,124 | |
Total liabilities | | | 7,653,757 | |
Net assets | | $ | 227,411,428 | |
Shares outstanding | | | 18,776,509 | |
Net asset value (“NAV”) per share outstanding | | $ | 12.11 | |
Net assets consist of: | | | | |
Shares, $0.01 par value per share | | $ | 187,765 | |
Paid-in surplus | | | 300,942,650 | |
Undistributed (Over-distribution of) net investment income | | | (5,257,748 | ) |
Accumulated net realized gain (loss) | | | (43,036,432 | ) |
Net unrealized appreciation (depreciation) | | | (25,424,807 | ) |
Net assets | | $ | 227,411,428 | |
Authorized shares | | | Unlimited | |
See accompanying notes to financial statements.
| | | | | | |
Statement of Operations | | Six Months Ended June 30, 2016 (Unaudited) |
| | | | |
Investment Income (net of foreign tax withheld of $230,459) | | $ | 4,800,113 | |
Expenses | | | | |
Management fees | | | 1,058,357 | |
Custodian fees | | | 60,104 | |
Trustees fees | | | 3,029 | |
Professional fees | | | 56,444 | |
Shareholder reporting expenses | | | 25,306 | |
Shareholder servicing agent fees | | | 214 | |
Stock exchange listing fees | | | 3,895 | |
Investor relations expenses | | | 27,957 | |
Other | | | 5,721 | |
Total expenses | | | 1,241,027 | |
Net investment income (loss) | | | 3,559,086 | |
Realized and Unrealized Gain (Loss) | | | | |
Net realized gain (loss) from: | | | | |
Investments and foreign currency | | | 3,608,162 | |
Forward foreign currency exchange contracts | | | (169,576 | ) |
Options written | | | 785,211 | |
Change in net unrealized appreciation (depreciation) of: | | | | |
Investments and foreign currency | | | (1,595,464 | ) |
Forward foreign currency exchange contracts | | | (807,660 | ) |
Options written | | | (12,087 | ) |
Net realized and unrealized gain (loss) | | | 1,808,586 | |
Net increase (decrease) in net assets from operations | | $ | 5,367,672 | |
See accompanying notes to financial statements.
| | | | | | |
Statement of Changes in Net Assets | | (Unaudited) |
| | | | | | | | |
| | | Six Months
Ended
6/30/2016 | | | Year
Ended
12/31/15 | |
Operations | | | | | | | | |
Net investment income (loss) | | $ | 3,559,086 | | | $ | 2,616,209 | |
Net realized gain (loss) from: | | | | | | | | |
Investments and foreign currency | | | 3,608,162 | | | | (9,120,883 | ) |
Forward foreign currency exchange contracts | | | (169,576 | ) | | | — | |
Options written | | | 785,211 | | | | 1,598,341 | |
Change in net unrealized appreciation (depreciation) of: | | | | | | | | |
Investments and foreign currency | | | (1,595,464 | ) | | | (20,586,377 | ) |
Forward foreign currency exchange contracts | | | (807,660 | ) | | | — | |
Options written | | | (12,087 | ) | | | 260,649 | |
Net increase (decrease) in net assets from operations | | | 5,367,672 | | | | (25,232,061 | ) |
Distributions to Shareholders | | | | | | | | |
From and in excess of net investment income | | | (8,787,406 | ) | | | — | |
From net investment income | | | — | | | | (2,634,017 | ) |
Return of capital | | | — | | | | (16,137,900 | ) |
Decrease in net assets from distributions to shareholders | | | (8,787,406 | ) | | | (18,771,917 | ) |
Capital Share Transactions | | | | | | | | |
Cost of shares repurchased or retired | | | — | | | | (2,901,378 | ) |
Net increase (decrease) in net assets from capital share transactions | | | — | | | | (2,901,378 | ) |
Net increase (decrease) in net assets | | | (3,419,734 | ) | | | (46,905,356 | ) |
Net assets at the beginning of period | | | 230,831,162 | | | | 277,736,518 | |
Net assets at the end of period | | $ | 227,411,428 | | | $ | 230,831,162 | |
Undistributed (Over-distribution of) net investment income at the end of period | | $ | (5,257,748 | ) | | $ | (29,428 | ) |
See accompanying notes to financial statements.
THIS PAGE INTENTIONALLY LEFT BLANK
Financial
Highlights (Unaudited)
Selected data for a share outstanding throughout each period:
| | | | | | | | | | | | | | | | | | | | | | | | | | | | | | | | | | | | | | | | | | | | |
| | | | | | Investment Operations | | | Less Distributions | | | | | | | | | | |
| | | Beginning
NAV | | | Net
Investment
Income
(Loss)(a) | | | Net
Realized/
Unrealized
Gain (Loss) | | | Total | | | From
Net
Investment
Income | | | From
Accumulated
Net
Realized
Gains | | | Return of
Capital | | | Total | | | Discount
from
Shares
Repurchased
and Retired | | | Ending
NAV | | | Ending
Share
Price | |
Year Ended 12/31: | |
2016(f) | | $ | 12.29 | | | $ | 0.19 | | | $ | 0.10 | | | $ | 0.29 | | | $ | (0.47 | )** | | $ | — | | | $ | — | | | $ | (0.47 | ) | | $ | — | | | $ | 12.11 | | | $ | 11.67 | |
2015 | | | 14.59 | | | | 0.14 | | | | (1.48 | ) | | | (1.34 | ) | | | (0.14 | ) | | | — | | | | (0.85 | ) | | | (0.99 | ) | | | 0.03 | | | | 12.29 | | | | 10.92 | |
2014 | | | 15.22 | | | | 0.23 | | | | 0.18 | | | | 0.41 | | | | (0.23 | ) | | | — | | | | (0.83 | ) | | | (1.06 | ) | | | 0.02 | | | | 14.59 | | | | 13.01 | |
2013 | | | 15.96 | | | | 0.35 | | | | — | * | | | 0.35 | | | | (0.37 | ) | | | — | | | | (0.72 | ) | | | (1.09 | ) | | | — | * | | | 15.22 | | | | 13.17 | |
2012 | | | 16.91 | | | | 0.42 | | | | (0.10 | ) | | | 0.32 | | | | (0.49 | ) | | | (0.33 | ) | | | (0.45 | ) | | | (1.27 | ) | | | — | * | | | 15.96 | | | | 14.91 | |
2011 | | | 20.30 | | | | 0.46 | | | | (2.48 | ) | | | (2.02 | ) | | | (0.83 | ) | | | (0.46 | ) | | | (0.08 | ) | | | (1.37 | ) | | | — | | | | 16.91 | | | | 16.76 | |
| | | | | | | | | | | | | | | | | | | | | | |
| | | | | | | Ratios/Supplemental Data | |
| Total Returns | | | | | | Ratios to Average Net Assets(c) | | | | |
Based
on
NAV(b) | | | Based
on
Share
Price(b) | | | Ending
Net Assets
(000) | | | Expenses | | | Net
Investment
Income (Loss) | | | Portfolio
Turnover
Rate(d) | |
| | | | | | | | | | | | | | | | | | | | | | |
| | 2.43 | % | | | 11.34 | % | | $ | 227,411 | | | | 1.13 | %*** | | | 3.24 | %*** | | | 22 | % |
| | (9.26 | ) | | | (8.61 | ) | | | 230,831 | | | | 1.09 | | | | 0.99 | | | | 99 | |
| | 2.75 | | | | 6.73 | | | | 277,737 | | | | 1.11 | | | | 1.54 | | | | 128 | |
| | 2.50 | | | | (4.24 | ) | | | 292,334 | | | | 1.16 | | | | 2.30 | | | | 143 | |
| | 2.03 | | | | (3.29 | ) | | | 306,591 | | | | 1.20 | | | | 2.61 | | | | 51 | |
| | (10.28 | ) | | | (11.00 | ) | | | 324,957 | | | | 1.16 | | | | 2.41 | | | | 92 | |
| (a) | Per share Net Investment Income (Loss) is calculated using the average daily shares method. |
| (b) | Total Return Based on NAV is the combination of changes in NAV, reinvested dividend income at NAV and reinvested capital gains distributions at NAV, if any. The last dividend declared in the period, which is typically paid on the first business day of the following month, is assumed to be reinvested at the ending NAV. The actual reinvest price for the last dividend declared in the period may often be based on the Fund’s market price (and not its NAV), and therefore may be different from the price used in the calculation. Total returns are not annualized. |
Total Return Based on Share Price is the combination of changes in the market price per share and the effect of reinvested dividend income and reinvested capital gains distributions, if any, at the average price paid per share at the time of reinvestment. The last dividend declared in the period, which is typically paid on the first business day of the following month, is assumed to be reinvested at the ending market price. The actual reinvestment for the last dividend declared in the period may take place over several days, and in some instances may not be based on the market price, so the actual reinvestment price may be different from the price used in the calculation. Total returns are not annualized.
| (c) | Each ratio includes the effect of dividends expense on securities sold short as follows: |
| | | | |
Ratios of Dividends Expense on
Securities Sold Short
to Average Net Assets(e) | |
Year Ended 12/31: | |
2013 | | | 0.01 | % |
2012 | | | 0.02 | |
2011 | | | 0.03 | |
| (d) | Portfolio Turnover Rate is calculated based on the lesser of long-term purchases or sales (as disclosed in Note 5 – Investment Transactions) divided by the average long-term market value during the period. |
| (e) | Effective for periods beginning after December 31, 2013, the Fund no longer makes short sales of securities. |
| (f) | For the six months ended June 30, 2016. |
| * | Rounds to less than $0.01 per share. |
| ** | Represents distributions paid “From and in excess of net investment income” for the six months ended June 30, 2016 (as described in Note 1 – General Information and Significant Accounting Policies, Dividends and Distributions to Shareholders). |
See accompanying notes to financial statements.
Notes to
Financial Statements (Unaudited)
1. General Information and Significant Accounting Policies
General Information
Fund Information
Nuveen Global Equity Income Fund, (the “Fund”) is registered under the Investment Company Act of 1940, as amended, as a diversified, closed-end management investment company. The Fund’s shares are listed on the New York Stock Exchange (“NYSE”) and trade under the ticker symbol “JGV.” The Fund was organized as a Massachusetts business trust on May 17, 2006.
The end of the reporting period for the Fund is June 30, 2016, and the period covered by these Notes to Financial Statements is the six months ended June 30, 2016 (the “current fiscal period”).
Investment Adviser
The Fund’s investment adviser is Nuveen Fund Advisors, LLC (the “Adviser”), a wholly-owned subsidiary of Nuveen Investments, Inc. (“Nuveen”). Nuveen is an operating division of TIAA Global Asset Management. The Adviser is responsible for the Fund’s overall investment strategy and asset allocation decisions. The Adviser has entered into a sub-advisory agreement with Tradewinds Global Investors, LLC (the “Sub-Adviser”), an affiliate of Nuveen, under which the Sub-Adviser manages the investment portfolio of the Fund, including its options strategy. Effective August 1, 2016 (subsequent to the close of this reporting period), the Adviser entered into a sub-advisory agreement with NWQ Investment Management Company, LLC (“NWQ”), an affiliate of Nuveen, under which NWQ will manage the investment portfolio of the Fund and the sub-advisory agreement with the Sub-Adviser was terminated.
Investment Objectives and Principal Investment Strategies
The Fund’s investment objective is to provide a high level of total return by investing primarily in a diversified global portfolio of value equity securities. The Fund invests at least 80% of its managed assets (as defined in Note 7 – Management Fees and Other Transactions with Affiliates) in equity securities of which at least 40% will be of non-U.S. companies. The Fund may also opportunistically write covered calls on up to 35% of the equity portfolio and may invest up to 10% of its managed assets in debt securities.
Fund Reorganization
In May 2016, the Nuveen funds’ Board of Trustees approved the reorganization of the Fund, into NWQ Global Equity Income Fund (the “Acquiring Fund”), an open-end fund organized as a series of Nuveen Investment Trust. Both the Acquiring Fund and the Fund are advised by the Adviser and NWQ and have similar investment mandates. In order for the reorganization to occur, it must be approved by the shareholders of the Fund.
If the Fund’s shareholders approve the reorganization, the Fund’s shareholders will receive shares of the Acquiring Fund of equal value immediately prior to the closing of the reorganization. After this reorganization, then-existing Fund shareholders will no longer own shares of the Fund, but instead will become shareholders of the Acquiring Fund. Consequently, those shareholders will no longer own shares of a closed-end fund trading on the New York Stock Exchange, but rather will own shares of an open-end fund. Investors can liquidate those shares by redeeming them with the Acquiring Fund, and can purchase additional shares from that fund.
A special meeting of the shareholders of the Fund for the purpose of voting on the proposed reorganization is scheduled for September 16, 2016. It is currently anticipated that reorganizing the Fund into the Acquiring Fund (if approved by shareholders) would occur shortly after the Fund’s shareholder meeting. Further information regarding the proposed reorganization is contained in proxy materials sent to Fund shareholders in late August 2016.
Also in May 2016, the Board of Trustees of the Acquiring Fund approved the reorganization of that fund with two open-end funds, Nuveen Tradewinds Value Opportunities Fund and Nuveen Tradewinds Global All-Cap Fund. If the shareholders of those funds approve their respective reorganizations, it is expected that those reorganizations would occur after the reorganization of the Fund into the Acquiring Fund.
Significant Accounting Policies
The Fund is an investment company and follows accounting and reporting guidance under Financial Accounting Standard Board (FASB) Accounting Standards Codification (ASC) Topic 946 “Financial Services – Investment Companies.” The following is a summary of significant accounting policies followed by the Fund in the preparation of its financial statements in accordance with accounting principles generally accepted in the United States of America (“U.S. GAAP”).
Investment Transactions
Investment transactions are recorded on a trade date basis. Realized gains and losses from investment transactions are determined on the specific identification method, which is the same basis used for federal income tax purposes. Investments purchased on a when-issued/delayed delivery basis may have extended settlement periods. Any investments so purchased are subject to market fluctuation during this period. The Fund has earmarked securities in its portfolio with a current value at least equal to the amount of the when-issued/delayed delivery purchase commitments.
As of the end of the reporting period, the Fund did not have any outstanding when-issued/delayed purchase commitments.
Investment Income
Dividend income is recorded on the ex-dividend date or, for foreign securities, when information is available. Interest income, which reflects the amortization of premiums and includes accretion of discounts for financial reporting purposes, is recorded on an accrual basis. Interest income also reflects paydown gains and losses, if any.
Professional Fees
Professional fees presented on the Statement of Operations consist of legal fees incurred in the normal course of operations, audit fees, tax consulting fees and, in some cases, workout expenditures. Workout expenditures are incurred in an attempt to protect or enhance an investment or to pursue other claims or legal actions on behalf of Fund shareholders. If a refund is received for workout expenditures paid in a prior reporting period, such amounts will be recognized as “Legal fee refund” on the Statement of Operations.
Dividends and Distributions to Common Shareholders
Distributions to common shareholders are recorded on the ex-dividend date. The amount and timing of distributions are determined in accordance with federal income tax regulations, which may differ from U.S. GAAP.
The Fund makes quarterly cash distributions to common shareholders of a stated dollar amount per share. Subject to approval and oversight by the Fund’s Board of Trustees (the “Board”), the Fund seeks to maintain a stable distribution level designed to deliver the long-term return potential of the Fund’s investment strategy through regular quarterly distributions (a “Managed Distribution Program”). Total distributions during a calendar year generally will be made from the Fund’s net investment income, net realized capital gains and net unrealized capital gains in the Fund’s portfolio, if any. The portion of distributions paid attributed to net unrealized gains, if any, is distributed from the Fund’s assets and is treated by shareholders as a nontaxable distribution (“return of capital”) for tax purposes. In the event that total distributions during a calendar year exceed the Fund’s total return on net asset value (“NAV”), the difference will reduce NAV per share. If the Fund’s total return on NAV exceeds total distributions during a calendar year, the excess will be reflected as an increase in NAV per share. The final determination of the source and character of all distributions paid by the Fund during the fiscal year is made after the end of the fiscal year and is reflected in the financial statements contained in the annual report as of December 31 each year.
The distributions made by the Fund during the current fiscal period are provisionally classified as being “From and in excess of net investment income,” and those distributions will be classified as being from net investment income, net realized capital gains and/or a return of capital for tax purposes after the fiscal year end. For purposes of calculating “Undistributed (Overdistribution of) net investment income” as of the end of the reporting period, the distribution amounts provisionally classified as “From and in excess of net investment income” were treated as being entirely from net investment income. Consequently, the financial statements as of the end of the reporting period, reflect an over-distribution of net investment income.
Indemnifications
Under the Fund’s organizational documents, its officers and trustees are indemnified against certain liabilities arising out of the performance of their duties to the Fund. In addition, in the normal course of business, the Fund enters into contracts that provide general indemnifications to other parties. The Fund’s maximum exposure under these arrangements is unknown as this would involve future claims that may be made against the Fund that have not yet occurred. However, the Fund has not had prior claims or losses pursuant to these contracts and expects the risk of loss to be remote.
Netting Agreements
In the ordinary course of business, the Fund may enter into transactions subject to enforceable master repurchase agreements, International Swaps and Derivative Association, Inc. (“ISDA”) master agreements or other similar arrangements (“netting agreements”). Generally, the right to offset in netting agreements allows the Fund to offset certain securities and derivatives with a specific counterparty, when applicable, as well as any collateral received or delivered to that counterparty based on the terms of the agreements. Generally, the Fund manages its cash collateral and securities collateral on a counterparty basis.
The Fund’s investments subject to netting agreements as of the end of the reporting period, if any, are further described in Note 3 – Portfolio Securities and Investments in Derivatives.
Notes to Financial Statements (Unaudited) (continued)
Use of Estimates
The preparation of financial statements in conformity with U.S. GAAP requires management to make estimates and assumptions that affect the reported amounts of assets and liabilities at the date of the financial statements and the reported amounts of increases and decreases in net assets from operations during the reporting period. Actual results may differ from those estimates.
2. Investment Valuation and Fair Value Measurements
The fair valuation input levels as described below are for fair value measurement purposes.
Fair value is defined as the price that would be received upon selling an investment or transferring a liability in an orderly transaction to an independent buyer in the principal or most advantageous market for the investment. A three-tier hierarchy is used to maximize the use of observable market data and minimize the use of unobservable inputs and to establish classification of fair value measurements for disclosure purposes. Observable inputs reflect the assumptions market participants would use in pricing the asset or liability. Observable inputs are based on market data obtained from sources independent of the reporting entity. Unobservable inputs reflect the reporting entity’s own assumptions about the assumptions market participants would use in pricing the asset or liability. Unobservable inputs are based on the best information available in the circumstances. The following is a summary of the three-tiered hierarchy of valuation input levels.
| | |
| Level 1 – | | Inputs are unadjusted and prices are determined using quoted prices in active markets for identical securities. |
| Level 2 – | | Prices are determined using other significant observable inputs (including quoted prices for similar securities, interest rates, prepayment speeds, credit risk, etc.). |
| Level 3 – | | Prices are determined using significant unobservable inputs (including management’s assumptions in determining the fair value of investments). |
Common stocks and other equity-type securities are valued at the last sales price on the securities exchange on which such securities are primarily traded and are generally classified as Level 1. Securities primarily traded on the NASDAQ National Market (“NASDAQ”) are valued at the NASDAQ Official Closing Price and are generally classified as Level 1. However, securities traded on a securities exchange or NASDAQ for which there were no transactions on a given day or securities not listed on a securities exchange or NASDAQ are valued at the quoted bid price and are generally classified as Level 2. Prices of certain American Depository Receipts (“ADR”) held by the Fund that trade in the United States are valued based on the last traded price, official closing price or the most recent bid price of the underlying non-U.S. traded stock, adjusted as appropriate for the underlying to ADR conversion ratio and foreign exchange rate, and from time-to-time may also be adjusted further to take into account material events that may take place after the close of the local non-U.S. market but before the close of the NYSE, which may represent a transfer from a Level 1 to a Level 2 security.
Prices of fixed-income securities are provided by an independent pricing service (“pricing service”) approved by the Board. The pricing service establishes a security’s fair value using methods that may include consideration of the following: yields or prices of investments of comparable quality, type of issue, coupon, maturity and rating, market quotes or indications of value from security dealers, evaluations of anticipated cash flows or collateral, general market conditions and other information and analysis, including the obligor’s credit characteristics considered relevant. These securities are generally classified as Level 2. In pricing certain securities, particularly less liquid and lower quality securities, the pricing service may consider information about a security, its issuer or market activity provided by the Adviser. These securities are generally classified as Level 2 or Level 3 depending on the observability of the significant inputs.
Prices of forward foreign currency exchange contracts are also provided by an independent pricing service approved by the Board using the same methods as described above, and are generally classified as Level 2.
Repurchase agreements are valued at contract amount plus accrued interest, which approximates market value. These securities are generally classified as Level 2.
The value of exchange-traded options are based on the mean of the closing bid and ask prices and are generally classified as Level 1. Options traded in the over-the-counter (“OTC”) market are valued using an evaluated mean price and are generally classified as Level 2.
Investments initially valued in currencies other than the U.S. dollar are converted to the U.S. dollar using exchange rates obtained from pricing services. As a result, the NAV of the Fund’s shares may be affected by changes in the value of currencies in relation to the U.S. dollar. The value of securities traded in markets outside the United States or denominated in currencies other than the U.S. dollar may be affected significantly on a day that the NYSE is closed and an investor is not able to purchase, redeem or exchange shares. If significant market events occur between the time of determination of the closing price of a foreign security on an exchange and the time that the Fund’s NAV is determined, or if under the Fund’s procedures, the closing price of a foreign security is not deemed to be reliable, the security would be valued at fair value as determined in accordance with procedures established in good faith by the Board. These securities are generally classified as Level 2 or Level 3 depending on the observability of the significant inputs.
Certain securities may not be able to be priced by the pre-established pricing methods as described above. Such securities may be valued by the Board and/or its appointee at fair value. These securities generally include, but are not limited to, restricted securities (securities which may not be publicly sold without registration under the Securities Act of 1933, as amended) for which a pricing service is unable to provide a market price; securities whose trading
has been formally suspended; debt securities that have gone into default and for which there is no current market quotation; a security whose market price is not available from a pre-established pricing source; a security with respect to which an event has occurred that is likely to materially affect the value of the security after the market has closed but before the calculation of the Fund’s NAV (as may be the case in non-U.S. markets on which the security is primarily traded) or make it difficult or impossible to obtain a reliable market quotation; and a security whose price, as provided by the pricing service, is not deemed to reflect the security’s fair value. As a general principle, the fair value of a security would appear to be the amount that the owner might reasonably expect to receive for it in a current sale. A variety of factors may be considered in determining the fair value of such securities, which may include consideration of the following: yields or prices of investments of comparable quality, type of issue, coupon, maturity and rating, market quotes or indications of value from security dealers, evaluations of anticipated cash flows or collateral, general market conditions and other information and analysis, including the obligor’s credit characteristics considered relevant. These securities are generally classified as Level 2 or Level 3 depending on the observability of the significant inputs. Regardless of the method employed to value a particular security, all valuations are subject to review by the Board and/or its appointee.
The inputs or methodologies used for valuing securities are not an indication of the risks associated with investing in those securities. The following is a summary of the Fund’s fair value measurements as of the end of the reporting period:
| | | | | | | | | | | | | | | | |
| | | Level 1 | | | Level 2 | | | Level 3 | | | Total | |
Long-Term Investments: | | | | | | | | | | | | | | | | |
Common Stocks* | | $ | 154,342,348 | | | $ | 52,799,071 | ** | | $ | 763,430 | ** | | $ | 207,904,849 | |
Mortgage-Backed Securities | | | — | | | | 24,564 | | | | — | | | | 24,564 | |
Short-Term Investments: | | | | | | | | | | | | | | | | |
Repurchase Agreements | | | — | | | | 25,751,004 | | | | — | | | | 25,751,004 | |
Investments in Derivatives: | | | | | | | | | | | | | | | | |
Options Written | | | (149,050 | ) | | | — | | | | — | | | | (149,050 | ) |
Forward Foreign Currency Exchange Contracts*** | | | — | | | | (807,660 | ) | | | — | | | | (807,660 | ) |
Total | | $ | 154,193,298 | | | $ | 77,766,979 | | | $ | 763,430 | | | $ | 232,723,707 | |
| * | Refer to the Fund’s Portfolio of Investments for industry classifications. |
| ** | Refer to the Fund’s Portfolio of Investments for securities classified as Level 2 and Level 3. |
| *** | Represents net unrealized appreciation (depreciation) as reported in the Fund’s Portfolio of Investments. |
The Board is responsible for the valuation process and has appointed the oversight of the daily valuation process to the Adviser’s Valuation Committee. The Valuation Committee, pursuant to the valuation policies and procedures adopted by the Board, is responsible for making fair value determinations, evaluating the effectiveness of the Fund’s pricing policies and reporting to the Board. The Valuation Committee is aided in its efforts by the Adviser’s dedicated Securities Valuation Team, which is responsible for administering the daily valuation process and applying fair value methodologies as approved by the Valuation Committee. When determining the reliability of independent pricing services for investments owned by the Fund, the Valuation Committee, among other things, conducts due diligence reviews of the pricing services and monitors the quality of security prices received through various testing reports conducted by the Securities Valuation Team.
The Valuation Committee will consider pricing methodologies it deems relevant and appropriate when making a fair value determination, based on the facts and circumstances specific to the portfolio instrument. Fair value determinations generally will be derived as follows, using public or private market information:
| | (i) | If available, fair value determinations shall be derived by extrapolating from recent transactions or quoted prices for identical or comparable securities. |
| | (ii) | If such information is not available, an analytical valuation methodology may be used based on other available information including, but not limited to: analyst appraisals, research reports, corporate action information, issuer financial statements and shelf registration statements. Such analytical valuation methodologies may include, but are not limited to: multiple of earnings, discount from market value of a similar freely-traded security, discounted cash flow analysis, book value or a multiple thereof, risk premium/yield analysis, yield to maturity and/or fundamental investment analysis. |
The purchase price of a portfolio instrument will be used to fair value the instrument only if no other valuation methodology is available or deemed appropriate, and it is determined that the purchase price fairly reflects the instrument’s current value.
For each portfolio security that has been fair valued pursuant to the policies adopted by the Board, the fair value price is compared against the last available and next available market quotations. The Valuation Committee reviews the results of such testing and fair valuation occurrences are reported to the Board.
Notes to Financial Statements (Unaudited) (continued)
3. Portfolio Securities and Investments in Derivatives
Portfolio Securities
Foreign Currency Transactions
To the extent that the Fund invests in securities and/or contracts that are denominated in a currency other than U.S. dollars, the Fund will be subject to currency risk, which is the risk that an increase in the U.S. dollar relative to the foreign currency will reduce returns or portfolio value. Generally, when the U.S. dollar rises in value against a foreign currency, the Fund’s investments denominated in that currency will lose value because its currency is worth fewer U.S. dollars; the opposite effect occurs if the U.S. dollar falls in relative value. Investments and other assets and liabilities denominated in foreign
currencies are converted into U.S dollars on a spot (i.e. cash) basis at the spot rate prevailing in the foreign currency exchange market at the time of valuation. Purchases and sales of investments and income denominated in foreign currencies are translated into U.S. dollars on the respective dates of such transactions.
As of the end of the reporting period, the Fund’s investments in non-U.S. securities were as follows:
| | | | | | | | |
| | | Value | | | % of Total
Investments | |
Country: | | | | | | | | |
United Kingdom | | $ | 22,821,594 | | | | 9.8 | % |
Norway | | | 12,293,326 | | | | 5.3 | |
Switzerland | | | 11,923,411 | | | | 5.1 | |
Belgium | | | 8,806,908 | | | | 3.8 | |
Denmark | | | 7,217,111 | | | | 3.1 | |
Other | | | 34,857,927 | | | | 14.8 | |
Total non-U.S. securities | | $ | 97,920,277 | | | | 41.9 | % |
The books and records of the Fund are maintained in U.S. dollars. Foreign currencies, assets and liabilities are translated into U.S. dollars at 4.00 p.m. Eastern Time. Investment transactions, income and expenses are translated on the respective dates of such transactions. Net realized foreign currency gains and losses resulting from changes in exchange rates include foreign currency gains and losses between trade date and settlement date of the transactions, foreign currency transactions and the difference between the amounts of interest and dividends recorded on the books of the Fund and the amounts actually received.
The realized gains and losses resulting from changes in foreign currency exchange rates and changes in foreign exchange rates associated with (i) investments, (ii) investments in derivatives and (iii) other assets and liabilities are recognized as a component of “Net realized gain (loss) from investments and foreign currency” on the Statement of Operations, when applicable.
The unrealized gains and losses resulting from changes in foreign currency exchange rates and changes in foreign exchange rates associated with (i) investments and (ii) other assets and liabilities are recognized as a component of “Change in net unrealized appreciation (depreciation) of investments and foreign currency” on the Statement of Operations, when applicable. The unrealized gains and losses resulting from changes in foreign exchange rates associated with investments in derivatives are recognized as a component of the respective derivative’s related “Change in net unrealized appreciation (depreciation)” on the Statement of Operations, when applicable.
Repurchase Agreements
In connection with transactions in repurchase agreements, it is the Fund’s policy that its custodian take possession of the underlying collateral securities, the fair value of which exceeds the principal amount of the repurchase transaction, including accrued interest, at all times. If the counterparty defaults, and the fair value of the collateral declines, realization of the collateral may be delayed or limited.
The following table presents the repurchase agreements for the Fund that are subject to netting agreements as of the end of the reporting period, and the collateral delivered related to those repurchase agreements.
| | | | | | | | | | | | |
| Counterparty | | Short-Term
Investments, at Value | | | Collateral
Pledged (From)
Counterparty* | | | Net
Exposure | |
Fixed Income Clearing Corporation | | $ | 25,751,004 | | | $ | (25,751,004 | ) | | $ | — | |
| * | As of the end of the reporting period, the value of the collateral pledged from the counterparty exceeded the value of the repurchase agreements. Refer to the Fund’s Portfolio of Investments for details on the repurchase agreements. |
Zero Coupon Securities
A zero coupon security does not pay a regular interest coupon to its holders during the life of the security. Income to the holder of the security comes from accretion of the difference between the original purchase price of the security at issuance and the par value of the security at maturity and is effectively paid at maturity. The market prices of zero coupon securities generally are more volatile than the market prices of securities that pay interest periodically.
Investments in Derivatives
The Fund is authorized to invest in certain derivative instruments, such as futures, options and swap contracts. The Fund limits its investments in futures, options on futures and swap contracts to the extent necessary for the Adviser to claim the exclusion from registration by the Commodity Futures Trading Commission as a commodity pool operator with respect to the Fund. The Fund records derivative instruments at fair value, with changes in fair value recognized on the Statement of Operations, when applicable. Even though the Fund’s investments in derivatives may represent economic hedges, they are not considered to be hedge transactions for financial reporting purposes.
Forward Foreign Currency Exchange Contracts
The Fund is authorized to enter into forward foreign currency exchange contracts (“forward contracts”) under two circumstances: (i) when the Fund enters into a contract for the purchase or sale of a security denominated in a foreign currency to “lock in” the U.S. exchange rate of the transaction, with such period being a short-dated contract covering the period between transaction date and settlement date; or (ii) when the Sub-Adviser believes that the currency of a particular foreign country may experience a substantial movement against the U.S. dollar or against another foreign currency.
A forward contract is an agreement between two parties to purchase or sell a specified quantity of a currency at or before a specified date in the future at a specified price. Forward contracts are typically traded in the OTC markets and all details of the contract are negotiated between the counterparties to the agreement. Accordingly, the forward contracts are valued by reference to the contracts traded in the OTC markets. The contractual obligations of a buyer or seller may generally be satisfied by taking or making physical delivery of the underlying currency, establishing an opposite position in the contract and recognizing the profit or loss on both positions simultaneously on the delivery date or, in some instances, paying a cash settlement before the designated date of delivery.
Forward contracts are valued daily at the forward rate. The net amount recorded on these transactions for each counterparty is recognized as a component of “Unrealized appreciation and/or depreciation on forward foreign currency exchange contracts (, net)” on the Statement of Assets and Liabilities. The change in value of the forward contracts during the reporting period is recognized as a component of “Change in net unrealized appreciation (depreciation) of forward foreign currency exchange contracts” on the Statement of Operations. When the contract is closed or offset with the same counterparty, the Fund recognizes the difference between the value of the contract at the time it was entered and the value at the time it was closed or offset as a component of “Net realized gain (loss) from forward foreign currency exchange contracts” on the Statement of Operations.
Forward contracts will generally not be entered into for terms greater than three months, but may have maturities of up to six months or more. The use of forward contracts does not eliminate fluctuations in the underlying prices of the Fund’s investment securities; however, it does establish a rate of exchange that can be achieved in the future. The use of forward contracts involves the risk that anticipated currency movements will not be accurately predicted. A forward contract would limit the risk of loss due to a decline in the value of a particular currency; however, it also would limit any potential gain that might result should the value of the currency increase instead of decrease. These contracts may involve market risk in excess of the unrealized appreciation or depreciation reflected on the Statement of Assets and Liabilities. Forward contracts are subject to counterparty risk if the counterparty fails to perform as specified in the contract due to financial impairment or other reason.
During the current fiscal period, the Fund invested in forward foreign currency exchange contracts to manage foreign currency exposure. For example, the Fund may reduce unwanted currency exposure from its equity portfolio, or it may hedge positions in select currencies.
The average notional amount of forward foreign currency exchange contracts outstanding during the current fiscal period was as follows:
| | | | |
Average notional amount of forward foreign currency exchange contracts outstanding* | | | $51,643,943 | |
| * | The average notional amount is calculated based on the outstanding notional at the beginning of the fiscal period and at the end of each fiscal quarter within the current fiscal period. |
The following table presents the fair value of forward foreign currency exchange contracts held by the Fund as of the end of the reporting period, the location of these instruments on the Statement of Assets and Liabilities and the primary underlying risk exposure.
| | | | | | | | | | | | | | | | | | |
| | | | | Location on the Statement of Assets and Liabilities | |
Underlying
Risk Exposure | | Derivative
Instrument | | Asset Derivatives | | | | | | (Liability) Derivatives | |
| | | Location | | Value | | | | | | Location | | Value | |
| Foreign currency exchange rate | | Forward
contracts | | — | | $ | — | | | | | | | Unrealized depreciation on forward foreign currency exchange contracts, net | | $ | 110,871 | |
| | | | | | | | | | | | | | | Unrealized depreciation on forward foreign currency exchange contracts, net | | | (918,531 | ) |
| Total | | | | | | $ | — | | | | | | | | | $ | (807,660 | ) |
Notes to Financial Statements (Unaudited) (continued)
The following table presents the forward foreign currency exchange contracts subject to netting agreements and the collateral delivered related to those forward foreign currency exchange contracts as of the end of the reporting period.
| | | | | | | | | | | | | | | | | | | | | | | | |
| Counterparty | | Gross
Unrealized
Appreciation
on Forward Foreign
Currency Exchange
Contracts* | | | Gross
Unrealized
(Depreciation)
on Forward Foreign
Currency Exchange
Contracts* | | | Amounts
Netted on
Statement
of Assets and
Liabilities | | | Net
Unrealized
Appreciation
(Depreciation) on
Forward Foreign
Currency Exchange
Contracts | | | Collateral
Pledged
to (from)
Counterparty | | | Net
Exposure | |
Morgan Stanley Capital Services LLC | | $ | 110,871 | | | $ | (918,531 | ) | | $ | 110,871 | | | $ | (807,660 | ) | | $ | — | | | $ | (807,660 | ) |
| * | Represents gross unrealized appreciation (depreciation) for the counterparty as reported in the Fund’s Portfolio of Investments. |
The following table presents the amount of net realized gain (loss) and change in net unrealized appreciation (depreciation) recognized on forward foreign currency exchange contracts on the Statement of Operations during the current fiscal period, and the primary underlying risk exposure.
| | | | | | | | | | |
| Underlying Risk Exposure | | Derivative
Instrument | | Net Realized Gain (Loss)
from Forward
Foreign Currency
Exchange Contracts | | | Change in Net
Unrealized Appreciation
(Depreciation) of
Forward Foreign Currency
Exchange Contracts | |
Foreign currency exchange rate | | Forward contracts | | $ | (169,576 | ) | | $ | (807,660 | ) |
Options Transactions
When the Fund writes an option, an amount equal to the net premium received (the premium less commission) is recognized as a component of “Options written, at value” on the Statement of Assets and Liabilities and is subsequently adjusted to reflect the current value of the written option until the option is exercised or expires or the Fund enters into a closing purchase transaction. The changes in the value of options written during the fiscal period are recognized as a component of “Change in net unrealized appreciation (depreciation) of options written” on the Statement of Operations. When an option is exercised or expires or the Fund enters into a closing purchase transaction, the difference between the net premium received and any amount paid at expiration or on executing a closing purchase transaction, including commission, is recognized as a component of “Net realized gain (loss) from options written” on the Statement of Operations. The Fund, as a writer of an option, has no control over whether the underlying instrument may be sold (called) and as a result bears the risk of an unfavorable change in the market value of the instrument underlying the written option. There is also the risk the Fund may not be able to enter into a closing transaction because of an illiquid market.
During the current fiscal period, the Fund continued to write call options on individual stocks held in its portfolio as part of its overall management strategy.
The average notional amount of outstanding options written during the current fiscal period were as follows:
| | | | |
Average notional amount of outstanding options written* | | | $(5,311,333) | |
| * | The average notional amount is calculated based on the outstanding notional at the beginning of the fiscal period and at the end of each fiscal quarter within the current fiscal period. |
The following table presents the fair value of all options written by the Fund as of the end of the reporting period, the location of these instruments on the Statement of Assets and Liabilities and the primary underlying risk exposure.
| | | | | | | | | | | | | | | | | | |
| | | | | Location on the Statement of Assets and Liabilities | |
Underlying Risk Exposure | | Derivative Instrument | | Asset Derivatives | | | | | | (Liability) Derivatives | |
| | | Location | | Value | | | | | | Location | | Value | |
| Equity price | | Options written | | — | | $ | — | | | | | | | Options written, at value | | $ | (149,050 | ) |
The following table presents the amount of net realized gain (loss) and change in net unrealized appreciation (depreciation) recognized on options written on the Statement of Operations during the current fiscal period and the primary underlying risk exposure.
| | | | | | | | | | |
| Underlying Risk Exposure | | Derivative Instrument | | Net Realized Gain (Loss) from
Options Written | | | Change in Net
Unrealized Appreciation
(Depreciation) of
Options Written | |
Equity price | | Options written | | | $785,211 | | | | $(12,087) | |
Market and Counterparty Credit Risk
In the normal course of business the Fund may invest in financial instruments and enter into financial transactions where risk of potential loss exists due to changes in the market (market risk) or failure of the other party to the transaction to perform (counterparty credit risk). The potential loss could exceed the value of the financial assets recorded on the financial statements. Financial assets, which potentially expose the Fund to counterparty credit risk, consist principally of cash due from counterparties on forward, option and swap transactions, when applicable. The extent of the Fund’s exposure to counterparty credit risk in respect to these financial assets approximates their carrying value as recorded on the Statement of Assets and Liabilities.
The Fund helps manage counterparty credit risk by entering into agreements only with counterparties the Adviser believes have the financial resources to honor their obligations and by having the Adviser monitor the financial stability of the counterparties. Additionally, counterparties may be required to pledge collateral daily (based on the daily valuation of the financial asset) on behalf of the Fund with a value approximately equal to the amount of any unrealized gain above a pre-determined threshold. Reciprocally, when the Fund has an unrealized loss, the Fund has instructed the custodian to pledge assets of the Fund as collateral with a value approximately equal to the amount of the unrealized loss above a pre-determined threshold. Collateral pledges are monitored and subsequently adjusted if and when the valuations fluctuate, either up or down, by at least the pre-determined threshold amount.
4. Fund Shares
Transactions in Fund shares during the current and prior fiscal period were as follows:
| | | | | | | | |
| | | Six Months
Ended
6/30/16 | | | Year
Ended
12/31/15 | |
Shares repurchased and retired | | | — | | | | (262,900 | ) |
Weighted average: | | | | | | | | |
Price per share repurchased and retired | | $ | — | | | $ | 11.02 | |
Discount per share repurchased and retired | | | — | % | | | 15.10 | % |
5. Investment Transactions
Long-term purchases and sales (including maturities but excluding derivative transactions) during the current fiscal period, aggregated $47,997,020 and $66,248,657, respectively.
Transactions in options written during the current fiscal period were as follows:
| | | | | | | | |
| | | Number of
Contracts | | | Premiums
Received | |
Options outstanding, beginning of period | | | 1,020 | | | $ | 112,847 | |
Options written | | | 6,095 | | | | 846,240 | |
Options terminated in closing purchase transactions | | | (2,120 | ) | | | (233,119 | ) |
Options expired | | | (1,760 | ) | | | (194,956 | ) |
Options exercised | | | (2,345 | ) | | | (369,942 | ) |
Options outstanding, end of period | | | 890 | | | $ | 161,070 | |
6. Income Tax Information
The Fund intends to distribute substantially all of its net investment company taxable income to shareholders and to otherwise comply with the requirements of Subchapter M of the Internal Revenue Code applicable to regulated investment companies. In any year when the Fund realizes net capital gains, the Fund may choose to distribute all or a portion of its net capital gains to shareholders, or alternatively, to retain all or a portion of its net capital gains and pay federal corporate income taxes on such retained gains.
For all open tax years and all major taxing jurisdictions, management of the Fund has concluded that there are no significant uncertain tax positions that would require recognition in the financial statements. Open tax years are those that are open for examination by taxing authorities (i.e., generally the last four tax year ends and the interim tax period since then). Furthermore, management of the Fund is also not aware of any tax positions for which it is reasonably possible that the total amounts of unrecognized tax benefits will significantly change in the next twelve months.
The following information is presented on an income tax basis. Differences between amounts for financial statement and federal income tax purposes are primarily due to the treatment of paydown gains and losses and timing differences in recognizing certain gains and losses on investment transactions. To the extent that differences arise that are permanent in nature, such amounts are reclassified within the capital accounts as detailed below. Temporary differences do not require reclassification. Temporary and permanent differences do not impact the NAV of the Fund.
Notes to Financial Statements (Unaudited) (continued)
As of June 30, 2016, the cost and unrealized appreciation (depreciation) of investments, (excluding investments in derivatives) as determined on a federal income tax basis, were as follows:
| | | | |
Cost of investments | | $ | 260,430,563 | |
Gross unrealized: | | | | |
Appreciation | | $ | 9,472,767 | |
Depreciation | | | (36,222,913 | ) |
Net unrealized appreciation (depreciation) of investments | | $ | (26,750,146 | ) |
Permanent differences, primarily due to paydowns, foreign currency transactions and investments in interest-only mortgage-backed securities, resulted in reclassifications among the Fund’s components of net assets as of December 31, 2015, the Fund’s last tax year end, as follows:
| | | | |
Paid-in surplus | | $ | — | |
Undistributed (Over-distribution of) net investment income | | | 1,208,942 | |
Accumulated net realized gain (loss) | | | (1,208,942 | ) |
|
The tax components of undistributed net ordinary income and net long-term capital gains as of December 31, 2015, the Fund’s last tax year end, were as follows: | |
Undistributed net ordinary income | | $ | — | |
Undistributed net long-term capital gains | | | — | |
The tax character of distributions paid during the Fund’s last tax year ended December 31, 2015, was designated for purposes of the dividends paid deduction as follows: | |
Distributions from net ordinary income1 | | $ | 2,634,017 | |
Distributions from net long-term capital gains | | | — | |
Return of capital | | | 16,137,900 | |
| 1 | Net ordinary income consists of net taxable income derived from dividends, interest, and net short-term capital gains, if any. |
As of December 31, 2015, the Fund’s last tax year end, the Fund had unused capital losses carrying forward available for federal income tax purposes to be applied against future capital gains, if any. The capital losses are not subject to expiration.
| | | | |
Capital losses to be carried forward – not subject to expiration | | | $45,120,197 | |
7. Management Fees and Other Transactions with Affiliates
Management Fees
The Fund’s management fee compensates the Adviser for overall investment advisory and administrative services and general office facilities. The Sub-Adviser is compensated for its services to the Fund from the management fees paid to the Adviser.
The Fund’s management fee consists of two components – a fund-level fee, based only on the amount of assets within the Fund, and a complex-level fee, based on the aggregate amount of all eligible fund assets managed by the Adviser. This pricing structure enables Fund shareholders to benefit from growth in the assets within the Fund as well as from growth in the amount of complex-wide assets managed by the Adviser.
The annual fund-level fee, payable monthly, is calculated according to the following schedule:
| | | | |
| Average Daily Managed Assets* | | Fund-Level Fee | |
For the first $500 million | | | 0.8000 | % |
For the next $500 million | | | 0.7750 | |
For the next $500 million | | | 0.7500 | |
For the next $500 million | | | 0.7250 | |
For managed assets over $2 billion | | | 0.7000 | |
The annual complex-level fee, payable monthly, is calculated by multiplying the current complex-wide fee rate, determined, according to the following schedule by the Fund’s daily managed assets:
| | | | |
| Complex-Level Managed Asset Breakpoint Level* | | Effective Rate at Breakpoint Level | |
$55 billion | | | 0.2000 | % |
$56 billion | | | 0.1996 | |
$57 billion | | | 0.1989 | |
$60 billion | | | 0.1961 | |
$63 billion | | | 0.1931 | |
$66 billion | | | 0.1900 | |
$71 billion | | | 0.1851 | |
$76 billion | | | 0.1806 | |
$80 billion | | | 0.1773 | |
$91 billion | | | 0.1691 | |
$125 billion | | | 0.1599 | |
$200 billion | | | 0.1505 | |
$250 billion | | | 0.1469 | |
$300 billion | | | 0.1445 | |
| * | For the complex-level fees, managed assets include closed-end fund assets managed by the Adviser that are attributable to certain types of leverage. For these purposes, leverage includes the funds’ use of preferred stock and borrowings and certain investments in the residual interest certificates (also called inverse floating rate securities) in tender option bond (TOB) trusts, including the portion of assets held by a TOB trust that has been effectively financed by the trust’s issuance of floating rate securities, subject to an agreement by the Adviser as to certain funds to limit the amount of such assets for determining managed assets in certain circumstances. The complex-level fee is calculated based upon the aggregate daily managed assets of all Nuveen Funds that constitute “eligible assets.” Eligible assets do not include assets attributable to investments in other Nuveen Funds or assets in excess of a determined amount (originally $2 billion) added to the Nuveen fund complex in connection with the Adviser’s assumption of the management of the former First American Funds effective January 1, 2011. As of June 30, 2016, the complex-level fee rate for the Fund was 0.1614%. |
Other Transactions with Affiliates
The Fund pays no compensation directly to those of its trustees who are affiliated with the Adviser or to its officers, all of whom receive remuneration for their services to the Fund from the Adviser or its affiliates. The Board has adopted a deferred compensation plan for independent trustees that enables trustees to elect to defer receipt of all or a portion of the annual compensation they are entitled to receive from certain Nuveen-advised funds. Under the plan, deferred amounts are treated as though equal dollar amounts had been invested in shares of select Nuveen-advised funds.
8. Subsequent Events
As previously noted in Note 1 – General Information and Significant Accounting Policies, Investment Adviser, effective August 1, 2016, the Adviser entered into a sub-advisory agreement with NWQ, an affiliate of Nuveen, under which NWQ will manage the investment portfolio of the Fund and the sub-advisory agreement with the Sub-Adviser was terminated.
Additional
Fund Information
| | | | | | | | | | |
| Board of Trustees | | | | | | | | | | |
| William Adams IV* | | Margo Cook** | | Jack B. Evans | | William C. Hunter | | David J. Kundert | | Albin F. Moschner*** |
| John K. Nelson | | William J. Schneider | | Judith M. Stockdale | | Carole E. Stone | | Terence J. Toth | | Margaret L. Wolff |
| * | Interested Board Member. |
| ** | Interested Board Member effective July 1, 2016. |
| *** | Effective July 1, 2016. |
| | | | | | | | |
| | | | | |
Fund Manager Nuveen Fund Advisors, LLC 333 West Wacker Drive Chicago, IL 60606 | | Custodian State Street Bank
& Trust Company One Lincoln Street Boston, MA 02111 | | Legal Counsel Chapman and Cutler LLP Chicago, IL 60603 | | Independent Registered
Public Accounting Firm PricewaterhouseCoopers LLP One North Wacker Drive Chicago, IL 60606 | | Transfer Agent and
Shareholder Services State Street Bank
& Trust Company Nuveen Funds P.O. Box 43071 Providence, RI 02940-3071 (800) 257-8787 |
Quarterly Form N-Q Portfolio of Investments Information
The Fund is required to file its complete schedule of portfolio holdings with the Securities and Exchange Commission (SEC) for the first and third quarters of each fiscal year on Form N-Q. You may obtain this information directly from the SEC. Visit the SEC on-line at http://www.sec.gov or in person at the SEC’s Public Reference Room in Washington, D.C. Call the SEC toll-free at (800) SEC-0330 for room hours and operation.
Nuveen Funds’ Proxy Voting Information
You may obtain (i) information regarding how each fund voted proxies relating to portfolio securities held during the most recent twelve-month period ended June 30, without charge, upon request, by calling Nuveen toll-free at (800) 257-8787 or on Nuveen’s website at www.nuveen.com and (ii) a description of the policies and procedures that each fund used to determine how to vote proxies relating to portfolio securities without charge, upon request, by calling Nuveen toll free at (800) 257-8787. You may also obtain this information directly from the SEC. Visit the SEC on-line at http://www.sec.gov.
CEO Certification Disclosure
The Fund’s Chief Executive Officer (CEO) has submitted to the New York Stock Exchange (NYSE) the annual CEO certification as required by Section 303A.12(a) of the NYSE Listed Company Manual. The Fund has filed with the SEC the certification of its CEO and Chief Financial Officer required by Section 302 of the Sarbanes-Oxley Act.
Share Repurchases
The Fund intends to repurchase, through its open-market share repurchase program, shares of its own common stock at such times and in such amounts as is deemed advisable. During the period covered by this report, the Fund repurchased shares of its common stock, as shown in the accompanying table. Any future repurchases will be reported to shareholders in the next annual or semi-annual report.
FINRA BrokerCheck
The Financial Industry Regulatory Authority (FINRA) provides information regarding the disciplinary history of FINRA member firms and associated investment professionals. This information as well as an investor brochure describing FINRA BrokerCheck is available to the public by calling the FINRA BrokerCheck Hotline number at (800) 289-9999 or by visiting www.FINRA.org.
Glossary of Terms
Used in this Report
| n | | Average Annual Total Return: This is a commonly used method to express an investment’s performance over a particular, usually multi-year time period. It expresses the return that would have been necessary each year to equal the investment’s actual cumulative performance (including change in NAV or market price and reinvested dividends and capital gains distributions, if any) over the time period being considered. |
| n | | Barclays High Yield Index: An index that covers the universe of fixed rate, non-investment grade debt. Pay-in-kind (PIK) bonds, Eurobonds, and debt issues from countries designated as emerging markets (e.g., Argentina, Brazil, Venezuela, etc. are excluded, but Canadian and global bonds (SEC registered) of issuers in non-EMG countries are included). Original issue zeroes, step-up coupon structures and 144-As are also included. Index returns assume reinvestment of distributions, but do not include the effects of any applicable sales charges or management fees. |
| n | | Barclays U.S. Aggregate Bond Index: A measure that represents securities that are SEC-registered, taxable and dollar denominated. The index covers the U.S. investment grade fixed rate bond market, with index components for government and corporate securities, mortgage pass-through securities, and asset-backed securities. Index returns assume reinvestment of distributions, but do not include the effects of any applicable sales charges or management fees. |
| n | | Blended Benchmark: A blended return comprised of 1) 80% MSCI All Country World Index; 2) 15% Barclays U.S. Aggregate Bond Index; and 3) 5% Barclays High Yield Index. Returns assume reinvestment of distributions, but do not include the effects of any sales charges or management fees. |
| n | | MSCI All Country World Index: The MSCI (Morgan Stanley Capital International) All Country World Index is published by Morgan Stanley Capital International, Inc. It is a free float-adjusted market capitalization index that is designed to measure global developed and emerging market equity performance. The index covers 49 developed and emerging market countries. Returns assume reinvestment of distributions, but do not include the effects of any sales charges or management fees. |
| n | | Net Asset Value (NAV) Per Share: A fund’s Net Assets is equal to its total assets (securities, cash, accrued earnings and receivables) less its total liabilities. NAV per share is equal to the fund’s Net Assets divided by its number of shares outstanding. |
Reinvest Automatically,
Easily and Conveniently
Nuveen makes reinvesting easy. A phone call is all it takes to set up your reinvestment account.
Nuveen Closed-End Funds Automatic Reinvestment Plan
Your Nuveen Closed-End Fund allows you to conveniently reinvest distributions in additional Fund shares.
By choosing to reinvest, you’ll be able to invest money regularly and automatically, and watch your investment grow through the power of compounding. Just like distributions in cash, there may be times when income or capital gains taxes may be payable on distributions that are reinvested.
It is important to note that an automatic reinvestment plan does not ensure a profit, nor does it protect you against loss in a declining market.
Easy and convenient
To make recordkeeping easy and convenient, each quarter you’ll receive a statement showing your total distributions, the date of investment, the shares acquired and the price per share, and the total number of shares you own.
How shares are purchased
The shares you acquire by reinvesting will either be purchased on the open market or newly issued by the Fund. If the shares are trading at or above net asset value at the time of valuation, the Fund will issue new shares at the greater of the net asset value or 95% of the then-current market price. If the shares are trading at less than net asset value, shares for your account will be purchased on the open market. If the Plan Agent begins purchasing Fund shares on the open market while shares are trading below net asset value, but the Fund’s shares subsequently trade at or above their net asset value before the Plan Agent is able to complete its purchases, the Plan Agent may cease open-market purchases and may invest the uninvested portion of the distribution in newly-issued Fund shares at a price equal to the greater of the shares’ net asset value or 95% of the shares’ market value on the last business day immediately prior to the purchase date. Distributions received to purchase shares in the open market will normally be invested shortly after the distribution payment date. No interest will be paid on distributions awaiting reinvestment. Because the market price of the shares may increase before purchases are completed, the average purchase price per share may exceed the market price at the time of valuation, resulting in the acquisition of fewer shares than if the distribution had been paid in shares issued by the Fund. A pro rata portion of any applicable brokerage commissions on open market purchases will be paid by Plan participants. These commissions usually will be lower than those charged on individual transactions.
Flexible
You may change your distribution option or withdraw from the Plan at any time, should your needs or situation change.
You can reinvest whether your shares are registered in your name, or in the name of a brokerage firm, bank, or other nominee. Ask your investment advisor if his or her firm will participate on your behalf. Participants whose shares are registered in the name of one firm may not be able to transfer the shares to another firm and continue to participate in the Plan.
The Fund reserves the right to amend or terminate the Plan at any time. Although the Fund reserves the right to amend the Plan to include a service charge payable by the participants, there is no direct service charge to participants in the Plan at this time.
Call today to start reinvesting distributions
For more information on the Nuveen Automatic Reinvestment Plan or to enroll in or withdraw from the Plan, speak with your financial advisor or call us at (800) 257-8787.
Annual Investment
Management Agreement Approval Process
The Board of Trustees (the “Board” and each Trustee is a “Board Member”) of the Nuveen Global Equity Income Fund (the “Fund”), including the Board Members who are not parties to the Fund’s advisory and sub-advisory agreements or “interested persons” of such parties (the “Independent Board Members”), is responsible for overseeing the performance of Nuveen Fund Advisors, LLC (the “Adviser”), the adviser to the Fund, and Tradewinds Global Investors, LLC (“Tradewinds”), the sub-adviser to the Fund, and determining whether to continue the Fund’s advisory and sub-advisory agreements.
During the course of the year, the Adviser discussed several proposals with the Board in connection with an internal reorganization, including a wind down of Tradewinds and the transfer of a number of Tradewinds’ existing equity mandates to NWQ Investment Management Company, LLC (“NWQ”). In connection with the foregoing, the Adviser recommended the following proposals (the “Restructuring Proposals”):
(a) the termination of Tradewinds as sub-adviser to the Fund effective August 1, 2016;
(b) the appointment of NWQ as sub-adviser to the Fund as of August 1, 2016 pursuant to an interim agreement; and
(c) the proposed merger of the Fund with and into a wholly-owned subsidiary of Nuveen NWQ Global Equity Income Fund (the “Merger”).
At the in-person meeting held on May 24-26, 2016 (the “May Meeting”), the Board, including a majority of the Independent Board Members, approved the renewal of the investment management agreement with the Adviser on behalf of the Fund (the “Investment Management Agreement”) for an additional one-year period.
The Board also approved the Restructuring Proposals. In connection with the Restructuring Proposals, the Board, as noted above, also approved NWQ as sub-adviser to the Fund on an interim basis pursuant to an interim agreement (the “Interim Sub-Advisory Agreement”). The Board further approved a longer term appointment of NWQ as sub-adviser for the Fund in case the Merger is not approved by the shareholders or does not occur prior to the expiration of the Interim Sub-Advisory Agreement. The new sub-advisory agreement with NWQ on behalf of the Fund is the “New Sub-Advisory Agreement.”
The Board’s considerations with respect to the renewal of the Investment Management Agreement with the Adviser on behalf of the Fund are set forth below followed by the approval of the New Sub-Advisory Agreement with NWQ on behalf of the Fund and the Interim Sub-Advisory Agreement. The Investment Management Agreement, New Sub-Advisory Agreement and Interim Sub-Advisory Agreement are collectively, the “Advisory Agreements.”
During the year, the Board and its Committees met regularly to receive materials and discuss a variety of topics impacting the Nuveen funds including, among other things, overall market conditions and market performance, Fund investment performance, brokerage execution, valuation of securities, compliance matters, securities lending, risk management and ongoing initiatives. The Board had established several standing Committees, including the Open-end Fund Committee and Closed-end Fund Committee, which permit the Board Members to delve further into the topics particularly relevant to the respective product line and enhance the Board’s effectiveness and oversight of the Fund. The Board also seeks to meet with each sub-adviser to the Nuveen funds and its investment team at least once over a multiple year rotation through site visits. The information and knowledge the Board gained throughout the year from the Board and Committee meetings, site visits and the related materials were relevant to the Board’s evaluation of the Advisory Agreements, and the Board took such information into account in its review of such agreements.
In addition to the materials received throughout the year, the Board received additional materials prepared specifically for its annual review of the advisory agreements in response to a request by independent legal counsel on behalf of the Independent Board Members. The materials addressed a variety of topics, including a description of the services provided by the Adviser; a review of Fund performance with a detailed focus on performance outliers; an analysis of the investment teams; an analysis of the fees and expense ratios of the Fund, including information comparing such fees and expenses to that of peer groups; an assessment of shareholder services for the Nuveen funds and of the performance of certain service providers; a review of
Annual Investment Management Agreement Approval Process (continued)
initiatives instituted or continued during the past year; a review of premium/discount trends as well as information regarding the profitability of the Adviser, the compensation of portfolio managers, and compliance and risk matters.
As part of its annual review, the Board held a separate meeting on April 12-13, 2016 to review the Fund’s investment performance and consider an analysis by the Adviser of the sub-advisers to the Nuveen funds, including Tradewinds and NWQ, examining, among other things, the teams’ assets under management, investment performance, investment approach, and the stability and structure of the respective sub-adviser’s organization and investment team. During the review, the Independent Board Members requested and received additional information from management. Throughout the year and throughout their review of the Fund’s advisory agreements, the Independent Board Members were assisted by independent legal counsel. The Independent Board Members met separately with independent legal counsel without management present and received a memorandum from such counsel outlining their fiduciary duties and legal standards in reviewing the investment advisory agreements. The Independent Board Members’ review of the Advisory Agreements reflected an ongoing process that incorporated the information and considerations that occurred over the years, including the most recent year, as well as the information specifically furnished for the renewal process. In deciding to renew the Investment Management Agreement and approve the new sub-advisory agreement with NWQ, the Independent Board Members did not identify a particular factor as controlling, but rather the decision reflected the comprehensive consideration of all the information presented.
The Board’s considerations with respect to the Investment Management Agreement on behalf of the Fund are set forth below followed by the considerations of the Interim Sub-Advisory Agreement and New Sub-Advisory Agreement with NWQ. The following summarizes the principal factors, but not all the factors, the Board considered in its review of the Advisory Agreements.
| I. | | Approval of Investment Management Agreement with the Adviser |
| A. | | Nature, Extent and Quality of Services |
In evaluating the renewal of the Investment Management Agreement, the Independent Board Members received and considered information regarding the nature, extent and quality of the Adviser’s services provided to the Fund and the initiatives undertaken during the past year by the Adviser. The Board recognized the comprehensive set of services the Adviser provided to manage and operate the Fund, including (a) product management (such as setting dividends, positioning the product in the marketplace, managing the relationships with the distribution platforms, maintaining and enhancing shareholder communications and reporting to the Board); (b) investment services (such as overseeing the sub-advisers and other service providers; analyzing investment performance and risks; overseeing risk management and disclosure; developing and interpreting investment policies; assisting in the development of products; helping to prepare financial statements and marketing disclosures; and overseeing trade execution); (c) fund administration (such as helping to prepare fund tax returns and complete other tax compliance matters; and helping to prepare regulatory filings and shareholder reports); (d) fund Board administration (such as preparing Board materials and organizing and providing assistance for Board meetings); (e) compliance (such as helping to devise and maintain a fund’s compliance program and related testing); and (f) legal support (such as helping to prepare registration statements and proxy statements, interpreting regulations and policies and overseeing fund activities).
The Board reviewed the continued investment the Adviser had made in its business to continue to strengthen the breadth and quality of its services to the benefit of the Nuveen funds. The Board noted the Adviser’s additional staffing in key areas that support the funds and the Board, including in investment services, operations, closed-end fund/structured products, fund governance, compliance, fund administration, product management, retail distribution and information technology. Among the enhancements to its services, the Board recognized the Adviser’s (a) expanded activities and support required as a result of regulatory developments, including in areas of compliance and reporting; (b) increased support for dividend management; (c) continued investment in its technical capabilities as the Adviser continued to build out a centralized fund data platform, enhance mobility and remote access capabilities, rationalize and upgrade software platforms, and automate certain regulatory liquidity determinations; (d) continued efforts to rationalize the product line through mergers, liquidations and re-positioning of Nuveen funds with the goal of increasing efficiencies, reducing costs, improving performance and addressing shareholder needs; (e) continued efforts to develop new lines of business designed to enhance the Nuveen product line and meet investor demands; and (f) continued commitment to enhance risk oversight, including the formation of the operational risk group to provide operational risk assessment, the access to platforms which provide better risk
reporting to support investment teams, and the development of a new team to initially review new products and major product initiatives. The Board also recognized the Adviser’s efforts to renegotiate certain fees of other service providers which culminated in reduced expenses for all funds for custody and accounting services without diminishing the breadth and quality of the services provided. The Board considered the Chief Compliance Officer’s report regarding the Adviser’s compliance program, the Adviser’s continued development, execution and management of its compliance program, and the additions to the compliance team to support the continued growth of the Nuveen fund family and address regulatory developments.
The Board also considered information highlighting the various initiatives that the Adviser had implemented or continued during the year to enhance or support the closed-end fund product line. The Board noted the Adviser’s continued efforts during 2015 (a) to rationalize the product line through mergers designed to help reduce product overlap, offer shareholders the potential for lower fees and enhanced investor acceptance, and address persistent discounts in the secondary market; (b) to conduct capital management services including share repurchases and/or share issuances throughout the year and monitoring market conditions to capitalize on such opportunities for the closed-end funds; and (c) to implement data-driven market analytics which, among other things, provided a better analysis of the shareholder base, enhanced the ability to monitor the closed-end funds versus peers and helped to understand trading discounts. The Board also considered the quality and breadth of Nuveen’s investment relations program through which Nuveen seeks to build awareness of, and educate investors and financial advisers with respect to, Nuveen closed-end funds which may help to build an active secondary market for the closed-end fund product line.
As noted, the Adviser also oversees the sub-adviser who primarily provides the portfolio advisory services to the Fund. The Board recognized the skill and competency of the Adviser in monitoring and analyzing the performance of the sub-adviser and managing the sub-advisory relationship, including the development of the Restructuring Proposals of the Fund.
Based on their review, the Independent Board Members found that, overall, the nature, extent and quality of services provided to the Fund under the Investment Management Agreement were satisfactory.
| B. | | The Investment Performance of the Fund and Adviser |
The Board considered the long-term and short-term performance history of the Fund. As noted above, the Board reviewed fund performance at its quarterly meetings throughout the year and took into account the information derived from the discussions with representatives of the Adviser about fund performance at these meetings. The Board also considered the Adviser’s analysis of fund performance with particular focus on performance outliers and the factors contributing to such performance and any steps the investment team had taken to address performance concerns. The Board reviewed, among other things, the Fund’s investment performance both on an absolute basis and in comparison to peer funds (the “Performance Peer Group”) and to a recognized benchmark for the quarter, one-, three- and five-year periods ending December 31, 2015, as well as performance information reflecting the first quarter of 2016. In evaluating performance information, the Board recognized the following factors may impact the performance data as well as the consideration to be given to particular performance data:
| | • | | The performance data reflected a snapshot in time, in this case as of the end of the most recent calendar year or quarter. A different performance period, however, could generate significantly different results. |
| | • | | Long-term performance can be adversely affected by even one period of significant underperformance so that a single investment decision or theme had the ability to disproportionately affect long-term performance. |
| | • | | Shareholders evaluate performance based on their own holding period which may differ from the performance period reviewed by the Board leading to different performance results. |
| | • | | The Board recognized the difficulty in establishing appropriate peer groups and benchmarks for certain funds. The Board noted that management classified the Performance Peer Groups as low, medium and high in relevancy and took the relevancy of the Performance Peer Group into account when considering the comparative performance data. If the Performance Peer Group differed somewhat from a fund, the Board recognized that the comparative performance data may be of limited value. The Board also recognized that a fund operated pursuant to its own investment objective(s), parameters and restrictions which may differ from that of the Performance Peer Group or benchmark and that these variations lead to differences in performance results. |
Annual Investment Management Agreement Approval Process (continued)
In addition to the foregoing, the Independent Board Members continued to recognize the importance of secondary market trading for the shares of closed-end funds. At the quarterly meetings as well as the May Meeting, the Independent Board Members (either at the Board level or through the Closed-end Fund Committee) reviewed, among other things, the premium or discount to net asset value of the Fund as of a specified date and over various periods as well as in comparison to the premium/discount average in its respective Lipper peer category. At the May Meeting and/or prior meetings, the Independent Board Members (either at the Board level or through the Closed-end Fund Committee) reviewed, among other things, an analysis by the Adviser of the key economic, market and competitive trends that affected the closed-end fund market and Nuveen closed-end funds, including the Fund, and considered any actions proposed or taken periodically by the Adviser to address trading discounts, such as share repurchases, fund reorganizations, and increasing fund awareness to investors. The Independent Board Members considered the evaluation of the premium and discount levels of the Nuveen closed-end funds to be a continuing priority in their oversight of the closed-end funds.
With respect to any Nuveen funds for which the Board has identified performance concerns, the Board monitors such funds closely until performance improves, discusses with the Adviser the reasons for such results, considers those steps necessary or appropriate to address such issues, and reviews the results of any efforts undertaken. With respect to the Fund, the Board noted that the Fund ranked in the fourth quartile and underperformed its benchmark in the one-, three- and five-year periods. The Board noted that the Fund’s performance had been challenged. The Board recognized that the stressed performance following the departure of certain senior management at Tradewinds in 2012 still dominated the longer-term three- and five-year periods. Since such time, the Board has reviewed the steps taken by the Adviser and/or Tradewinds to address the performance issues. As described in further detail below, the Board approved the Restructuring Proposals in connection with an internal reorganization, including a wind down of the operations of Tradewinds, determining that such proposals were in the best interests of the Fund.
| C. | | Fees, Expenses and Profitability |
The Board evaluated the management fees and other fees and expenses of the Fund. The Board reviewed, among other things, the gross and net management fees and net total expenses of the Fund (expressed as a percentage of average net assets) in absolute terms and also in comparison to the fee and expense levels of a comparable universe of funds (the “Peer Universe”) selected by an independent third-party fund data provider. The Independent Board Members also reviewed the methodology regarding the construction of the Peer Universe. In their evaluation of the management fee schedule, the Independent Board Members also considered the fund-level and complex-wide breakpoint schedules, as described in further detail below.
In reviewing the comparative fee and expense information, the Independent Board Members recognized that various factors such as the limited size and particular composition of the Peer Universe (including the inclusion of other Nuveen funds in the peer set); expense anomalies; changes in the funds comprising the Peer Universe from year to year; levels of reimbursement or fee waivers; the timing of information used; the differences in the type and use of leverage, if any; and differences in services provided can impact the usefulness of the comparative data in helping to assess the appropriateness of a fund’s fees and expenses. In addition, in reviewing a fund’s fees and expenses compared to the fees and expenses of its peers (excluding leverage costs and leveraged assets, if any), the Board generally considered a fund’s expenses and fees to be higher if they were over 10 basis points higher, slightly higher if they were 6 to 10 basis points higher, in line if they were within approximately 5 basis points higher than the peer average and below if they were below the peer average of the Peer Universe. The Board reviewed the net expense ratio in recognition that the net expense ratio generally best represented the net experience of the shareholders of a fund as it directly reflected the costs of investing in the respective fund. The Board noted that the majority of the Nuveen funds had a net expense ratio near or below the average of its peers. For funds with a net expense ratio of 6 basis points or higher than their respective peer average, the Independent Board Members reviewed the reasons for the outlier status and were satisfied with the explanation for the difference or with any steps taken to address the difference.
In its review, the Board noted that the Fund had a net management fee and net expense ratio below that of the peer average.
Based on their review of the fee and expense information provided, the Independent Board Members determined that the Fund’s management fees to the Adviser were reasonable in light of the nature, extent and quality of services provided to the Fund.
| | 2. | | Comparisons with the Fees of Other Clients |
The Board also reviewed information regarding the fee rates for other types of clients advised or sub-advised by the Adviser and/or affiliated sub-advisers. For the Adviser and/or affiliated sub-advisers, such other clients may include: separately managed accounts (such as retail, institutional or wrap accounts), hedge funds, other investment companies that are not offered by Nuveen but are sub-advised by one of Nuveen’s affiliated sub-advisers, foreign investment companies offered by Nuveen, and collective investment trusts.
The Board reviewed information regarding the different types of services provided to the Fund compared to that provided to these other clients which typically did not require the same breadth of day-to-day services required for registered funds. The Board further considered information regarding the differences in, among other things, investment policies, investor profiles, and account sizes between the Nuveen funds and the other types of clients. In addition, the Independent Board Members also recognized that the management fee rates of the foreign funds advised by the Adviser may also vary due to, among other things, differences in the client base, governing bodies, operational complexities and services covered by the management fee. The Independent Board Members recognized that the foregoing variations resulted in different economics among the product structures and culminated in varying management fees among the types of clients and funds.
The Board also was aware that since the Fund had a sub-adviser, the Fund’s management fee reflected two components, the fee retained by the Adviser for its services and the fee the Adviser paid to the sub-adviser. The Board noted that many of the administrative services provided to support the Fund by the Adviser may not be required to the same extent or at all for the institutional clients or other clients. In general, the Board noted that higher fee levels reflected higher levels of service provided by the Adviser and/or affiliates, increased investment management complexity, greater product management requirements and higher levels of business risk or some combination of the foregoing. Given the inherent differences in the various products, particularly the extensive services provided to the Fund, the Independent Board Members concluded such facts justify the different levels of fees.
| | 3. | | Profitability of Fund Advisers |
In conjunction with their review of fees, the Independent Board Members also considered the profitability of Nuveen for its advisory activities on an absolute basis and in comparison to other investment advisers. The Independent Board Members reviewed, among other things, Nuveen’s adjusted operating margins, the gross and net revenue margins (pre-tax and after-tax) for advisory activities for the Nuveen funds, and the revenues, expenses, and net income (pre-tax and after-tax) of Nuveen for each of the last two calendar years. The Independent Board Members reviewed an analysis of the key drivers behind the changes in revenues and expenses that impacted profitability in 2015. The Independent Board Members also noted that the sub-advisory fees for the Fund are paid by the Adviser, however, the Board recognized that Tradewinds and NWQ are affiliated with Nuveen. In their review, the Independent Board Members recognized that profitability data is rather subjective as various allocation methodologies may be reasonable to employ but yet yield different results. The Board also reviewed the results of certain alternative methodologies. The Board considered the allocation methodology employed to prepare the profitability data as well as a summary of the refinements to the methodology that had been adopted over the years which may limit some of the comparability of Nuveen’s revenue margins over time. Two Independent Board Members also served as point persons for the Board throughout the year to review and discuss the methodology employed to develop the profitability analysis and any proposed changes thereto and to keep the Board apprised of such changes during the year. In reviewing the profitability data, the Independent Board Members noted that Nuveen’s operating margin as well as its margins for its advisory activities to Nuveen funds for 2015 were consistent with such margins for 2014.
The Board also considered Nuveen’s adjusted operating margins compared to that of other comparable investment advisers (based on asset size and composition) with publicly available data. The Independent Board Members recognized, however, the limitations of the comparative data as the other advisers may have a different business mix, employ different allocation methodologies, have different capital structure and costs, may not be representative of the industry or other factors that limit the comparability of the profitability information. Nevertheless, the Independent Board Members noted that Nuveen’s adjusted operating margins appeared comparable to the adjusted margins of the peers.
Further, as the Adviser is a wholly-owned subsidiary of Nuveen which in turn is an operating division of TIAA Global Asset Management, the investment management arm of Teachers Insurance and Annuity Association of America (“TIAA-CREF”),
Annual Investment Management Agreement Approval Process (continued)
the Board reviewed a balance sheet for TIAA-CREF reflecting its assets, liabilities and capital and contingency reserves for the last two calendar years to have a better understanding of the financial stability and strength of the TIAA-CREF complex, together with Nuveen.
Based on the information provided, the Independent Board Members noted that the Adviser appeared to be sufficiently profitable to operate as a viable investment management firm and to honor its obligations as a sponsor of the Nuveen funds.
In evaluating the reasonableness of the compensation, the Independent Board Members also considered other amounts paid to the Adviser or its affiliates by the Nuveen funds as well as indirect benefits (such as soft dollar arrangements), if any, the Adviser and its affiliates received or were expected to receive that were directly attributable to the management of a Nuveen fund. See Section E below for additional information on indirect benefits the Adviser may receive as a result of its relationship with the Nuveen funds.
Based on their review, the Independent Board Members determined that the Adviser’s level of profitability was reasonable in light of the respective services provided.
| D. | | Economies of Scale and Whether Fee Levels Reflect These Economies of Scale |
The Independent Board Members recognized that as the assets of a particular fund or the Nuveen complex in the aggregate increase over time, economies of scale may be realized with respect to the management of the funds, and the Independent Board Members considered the extent to which these economies are shared with the funds and their shareholders. Although the Independent Board Members recognized that economies of scale are difficult to measure with precision, the Board noted that there were several acceptable means to share economies of scale, including through breakpoints in the management fee schedule reducing the fee rates as asset levels grow, fee waiver and expense limitation agreements and the Adviser’s investment in its business which can enhance the services provided to the funds. With respect to breakpoints, the Independent Board Members noted that subject to certain exceptions, the funds in the Nuveen complex pay a management fee to the Adviser which is generally comprised of a fund-level component and complex-level component. Subject to certain exceptions, the fund-level fee component declines as the assets of the particular fund grow and the complex-level fee component declines when eligible assets of all the funds in the Nuveen complex combined grow. With respect to closed-end funds such as the Fund, the Independent Board Members noted that although such funds may from time-to-time make additional share offerings, the growth of their assets would occur primarily through the appreciation of such funds’ investment portfolios. The complex-wide fee arrangement was designed to capture economies of scale achieved when total fund complex assets increase, even if the assets of a particular fund are unchanged or decrease. The approach reflected the notion that some of Nuveen’s costs were attributable to services provided to all its funds in the complex, and therefore all funds should benefit if these costs were spread over a larger asset base. The Independent Board Members reviewed the Fund’s breakpoint and complex-wide fee schedule.
In addition, the Independent Board Members recognized the Adviser’s ongoing investment in its business to expand or enhance the services provided to the Nuveen funds. The Independent Board Members noted, among other things, the additions to groups who play a key role in supporting the funds including in closed-end funds/structured products, fund administration, operations, fund governance, investment services, compliance, product management, retail distribution and technology. The Independent Board Members also recognized the investments in systems necessary to manage the funds including in areas of risk oversight, information technology and compliance.
Based on their review, the Independent Board Members concluded that the current fee structure was acceptable and reflected economies of scale to be shared with shareholders when assets under management increase.
The Independent Board Members received and considered information regarding other additional benefits the Adviser or its affiliates may receive as a result of their relationship with the Nuveen funds, including compensation paid to affiliates and research received in connection with brokerage transactions (i.e., soft dollar arrangements). In this regard, the Independent Board Members noted any revenues received by affiliates of the Adviser for serving as co-manager in initial public offerings of new closed-end funds and as underwriter on shelf offerings for certain existing funds.
In addition to the above, the Independent Board Members considered that the Fund’s portfolio transactions are allocated by the sub-adviser and that Tradewinds and NWQ (the proposed successor sub-adviser to Tradewinds), each an affiliate of the Adviser, may benefit from research received through soft-dollar arrangements when serving as sub-adviser to the Fund. Although the Board recognized NWQ and Tradewinds may benefit from a soft dollar arrangement as they do not have to pay for this research out of their own assets, the Board also recognized that the research may benefit the Fund to the extent it enhances the ability of a sub-adviser to manage the Fund.
Based on their review, the Independent Board Members concluded that any indirect benefits received by the Adviser or its affiliates as a result of the Adviser’s relationship with the Fund were reasonable and within acceptable parameters.
The Independent Board Members did not identify any single factor discussed previously as all-important or controlling. The Board Members, including the Independent Board Members, concluded that the terms of the Investment Management Agreement were fair and reasonable, that the Adviser’s fees were reasonable in light of the services provided to the Fund and that the Investment Management Agreement be renewed.
| II. | | Approval of the New Sub-Advisory Agreement with NWQ |
The Board of the Fund is responsible for overseeing the performance of the investment advisers to the Fund and determining whether to approve the Fund’s advisory arrangements, including sub-advisory arrangements. Tradewinds has served as sub-adviser to the Fund. During the course of the year, the Adviser discussed several proposals with the Fund’s Board in connection with a proposed internal reorganization, including the wind down of the operations of Tradewinds and the transfer of a number of Tradewinds’ existing equity mandates to NWQ. In light of the foregoing, the Adviser considered various options to provide the Fund’s shareholders with continued access to a comparable global equity income strategy. In this regard, the Adviser recommended, and the Board approved, the Merger of the Fund (hereafter, the “Target Fund”) into the Nuveen NWQ Global Equity Income Fund (the “Acquiring Fund”) which affords the Target Fund shareholders continued access to a global equity income strategy provided by NWQ that is comparable to the existing mandate of the Target Fund in terms of the Fund’s investment policies and provides the opportunity for improved performance over time. The Adviser also recommended, and the Board approved, the Interim Sub-Advisory Agreement pursuant to which NWQ would begin to serve as the new sub-adviser for the Target Fund to replace Tradewinds effective August 1, 2016 for a maximum of 150 days after its effective date. In the event the Merger is not completed at all, or is not completed prior to the expiration of the Interim Sub-Advisory Agreement, the Adviser also recommended, and the Board approved, the longer term appointment of NWQ as the sub-adviser to the Target Fund pursuant to the New Sub-Advisory Agreement.
During the course of various meetings, the Adviser made various presentations, and the Board received a variety of materials, relating to the proposed Merger, including, among other things: a description of the global equity income strategy of NWQ, a comparison of the historic performance of the Acquiring Fund (Class A) and the Target Fund, a comparison of the investment mandates of the Acquiring Fund and the Target Fund and an analysis of alternatives to the proposed Merger. In addition to the foregoing materials, the Board completed its annual review of advisory agreements on behalf of the Target Fund at the May Meeting and received extensive information regarding NWQ and the Target Fund including, among other things:
| | • | | the nature, extent and quality of services expected to be provided by NWQ; |
| | • | | the organization of NWQ, including the responsibilities of key investment personnel; |
| | • | | the expertise, background and investment approach of NWQ; |
| | • | | certain performance-related information (as described below); |
| | • | | the profitability of Nuveen and its affiliates (including NWQ) for their advisory activities; |
| | • | | the proposed sub-advisory fee of NWQ; |
| | • | | the expenses of the Target Fund, including comparisons of the Target Fund’s expense ratio with the expense ratios of comparable funds; and |
| | • | | the soft dollar practices of NWQ. |
Annual Investment Management Agreement Approval Process (continued)
At the May Meeting and prior meetings, the Adviser made presentations to and responded to questions from the Board. During these meetings, the Independent Board Members met privately with their legal counsel to, among other things, review the duties of the Board under the 1940 Act, the general principles of state law in reviewing and approving advisory contracts, the standards used by courts in determining whether investment company boards of directors have fulfilled their duties, factors to be considered in voting on advisory contracts and an adviser’s fiduciary duty with respect to advisory agreements and compensation. It is with this background that the Independent Board Members considered the New Sub-Advisory Agreement. As outlined in more detail below, the Independent Board Members considered all factors they believed relevant with respect to the Target Fund, including among other things: (1) the nature, extent and quality of the services to be provided by NWQ; (2) investment performance, as described below; (3) the sub-advisory fees and costs of the services to be provided and the profitability of NWQ; (4) the extent of any anticipated economies of scale; (5) any benefits expected to be derived by NWQ from its relationship with the Target Fund; and (6) other factors. Each Board Member may have accorded different weight to the various factors in reaching his or her conclusions with respect to the New Sub-Advisory Agreement. The principal factors considered by the Board and its conclusions are described below.
| A. | | Nature, Extent and Quality of Services |
In considering the New Sub-Advisory Agreement, the Independent Board Members considered the nature, extent and quality of services expected to be provided to the Target Fund by NWQ, including the portfolio management services. As NWQ already serves as a sub-adviser to other Nuveen funds overseen by the Board Members, the Board has a good understanding of NWQ’s organization, operations, personnel and services. As the Independent Board Members meet regularly throughout the year to oversee the Nuveen funds, including funds currently sub-advised by NWQ, the Independent Board Members also have relied upon their knowledge from their meetings and any other interactions throughout the year with respect to NWQ in evaluating the New Sub-Advisory Agreement.
At the May Meeting and/or at prior meetings, the Independent Board Members reviewed materials outlining, among other things, NWQ’s organization and business, the types of services that NWQ provides to the Nuveen funds and is expected to provide to the Target Fund; the experience of NWQ with a global equity income strategy; the historic performance of the funds sub-advised by NWQ; and NWQ’s investment team and its investment approach. In evaluating the services of NWQ, the Independent Board Members noted that the New Sub-Advisory Agreement was essentially an agreement for portfolio management services only and NWQ was not expected to supply significant administrative services to the Target Fund. The types of sub-advisory services to be provided by NWQ to the Target Fund under the New Sub-Advisory Agreement will be identical to those advisory services currently provided by Tradewinds to the Target Fund under the sub-advisory agreement with Tradewinds (the “Tradewinds Sub-Advisory Agreement”).
Based on their review, the Independent Board Members found that, overall, the nature, extent and quality of services expected to be provided to the Target Fund under the New Sub-Advisory Agreement were satisfactory and supported approval of the New Sub-Advisory Agreement.
| B. | | Investment Performance |
The Board noted that there is no performance record for the Target Fund with NWQ as the sub-adviser. The Independent Board Members, however, were familiar with the performance records of other Nuveen funds sub-advised by NWQ, including the Acquiring Fund, which employs a global equity income strategy comparable to the existing mandate of the Target Fund in terms of fund investment policies. In this regard, the Independent Board Members reviewed, among other things, the Acquiring Fund’s investment performance both on an absolute basis and in comparison to peer funds and recognized benchmarks for the quarter, one-, three- and five-year periods ending December 31, 2015 and March 31, 2016. The Board also reviewed the returns of the Class A shares for the Acquiring Fund for each of the last five calendar years and the average annualized returns for the one-, three- and five-year periods ending March 31, 2016.
| C. | | Fees, Expenses and Profitability |
In evaluating the management fees and expenses that the Target Fund was expected to bear, the Independent Board Members considered, among other things, the Target Fund’s management fees, its proposed sub-advisory fee arrangement
and its net total expense ratio (based on average net assets for the latest fiscal year) for the Target Fund, as well as the management fees and expense levels of a comparable group of peers selected by an independent third-party fund data provider. The Board recognized that the terms of the New Sub-Advisory Agreement with NWQ, subject to limited exceptions, were substantially identical to those of the Tradewinds Sub-Advisory Agreement. Accordingly, the Board recognized that NWQ’s pricing schedule for sub-advising the Target Fund would be the same as Tradewinds’ pricing schedule. The Board observed that the appointment of NWQ does not change the Target Fund’s management fee as the Adviser pays the sub-adviser out of the management fee it receives from the Target Fund. In addition, as NWQ already serves as sub-adviser to other Nuveen funds, the Independent Board Members were familiar with the sub-advisory fee NWQ assesses for such other funds. The Board further recognized that the Fund would bear the proxy solicitation costs attributed to seeking shareholder approval of the New-Sub Advisory Agreement.
| | 2. | | Comparisons with the Fees of Other Clients |
As noted, due to their experience with other Nuveen funds, the Independent Board Members were familiar with NWQ’s fee rate for portfolio management services provided to other comparable Nuveen funds (including the Acquiring Fund) and other clients (including retail wrap accounts, registered investment adviser accounts and institutional managed accounts). The Board reviewed the average fee and fee range that NWQ assessed these other clients.
Based on their review of the fee and expense information provided, the Independent Board Members determined that NWQ’s sub-advisory fee was reasonable in light of the nature, extent and quality of services to be provided to the Target Fund.
In conjunction with their annual review, the Independent Board Members considered the profitability of Nuveen and its affiliates for their advisory activities and financial condition. At the May Meeting, the Independent Board Members reviewed, among other things, NWQ’s revenues, expenses, and net revenue margins (pre- and post-tax) for its advisory activities to other Nuveen funds and the methodology for allocating expenses among the internal sub-advisers of Nuveen. The Independent Board Members noted this information supplemented the profitability information requested and received during the year to help keep them apprised of developments affecting profitability (such as changes in fee waivers and expense reimbursement commitments). In this regard, the Independent Board Members noted that they have two Independent Board Members to serve as point persons to review and keep the full Board apprised of changes to the profitability analysis and/or methodologies during the year. In evaluating profitability, the Independent Board Members have recognized the subjective nature of determining profitability which may be affected by numerous factors, including the allocation of expenses, and that various allocation methodologies may each be reasonable but yield different results. Based on their review, the Independent Board Members have determined that NWQ’s level of profitability is reasonable in light of the services to be provided.
In evaluating the reasonableness of the compensation, the Independent Board Members also considered any other amounts expected to be paid to NWQ as well as any indirect benefits (such as soft dollar arrangements), if any, NWQ and its affiliates are expected to receive that are directly attributable to the management of the Target Fund. See Section E below for additional information on indirect benefits NWQ and its affiliates may receive as a result of their relationship with the Target Fund. Based on their review of the overall arrangements of the Target Fund, the Independent Board Members determined that the sub-advisory fee of the Target Fund was reasonable.
| D. | | Economies of Scale and Whether Fee Levels Reflect These Economies of Scale |
With respect to economies of scale, the Independent Board Members have recognized the potential benefits resulting from the costs of a fund being spread over a larger asset base, although economies of scale are difficult to measure and predict with precision, particularly on a fund-by-fund basis. The Independent Board Members therefore considered whether the Target Fund could be expected to benefit from any economies of scale. One method to help ensure that shareholders share in these benefits is to include breakpoints in the advisory fee schedule. Generally, management fees for funds in the Nuveen complex to the Adviser are comprised of a fund-level component and a complex-level component. The complex-level component provides for additional breakpoints as assets in the fund complex increase. As the Target Fund pays the management fee to the Adviser and the Adviser in turn pays NWQ, however, the Board recognized that the sharing of
Annual Investment Management Agreement Approval Process (continued)
benefits from economies of scale is reflected in fund-level and complex-level breakpoints in the management fees at the Adviser level and the appointment of NWQ does not change the management fees paid by the Target Fund or the sharing of economies of scale reflected in such advisory fee schedule.
Considering the factors above, the Independent Board Members concluded that the proposed sub-advisory fee schedule was acceptable.
In evaluating fees, the Independent Board Members also considered information regarding potential “fall out” or ancillary benefits that NWQ or its affiliates may receive as a result of their relationship with the Target Fund. In this regard, with respect to closed-end funds, the Independent Board Members recognized that affiliates of NWQ may receive revenues for serving as co-manager in an initial public offering of new closed end funds as well as revenues received in connection with secondary offerings.
In addition to the above, the Independent Board Members considered whether NWQ will receive any benefits from soft dollar arrangements whereby a portion of the commissions paid by the Target Fund for brokerage may be used to acquire research that may be useful to NWQ in managing the assets of the Target Fund and other clients. The Independent Board Members noted that NWQ may benefit from soft dollar arrangements pursuant to which NWQ may receive research from brokers that execute the Target Fund’s portfolio transactions. Similarly, the Board recognized that the research received pursuant to soft dollar arrangements by NWQ may benefit the Target Fund and shareholders to the extent the research enhances the ability of NWQ to manage the Target Fund. The Independent Board Members further noted that NWQ’s profitability may be somewhat lower if it did not receive the research services pursuant to soft dollar arrangements and had to acquire such services directly.
Based on their review, the Independent Board Members concluded that any indirect benefits received by NWQ and its affiliates as a result of their relationship with the Target Fund were reasonable and within acceptable parameters.
| F. | | Approval of New Sub-Advisory Agreement |
The Independent Board Members did not identify any single factor discussed previously as all important or controlling. The Board Members, including a majority of the Independent Board Members, concluded that the terms of the New Sub-Advisory Agreement are fair and reasonable, that NWQ’s fees are reasonable in light of the services to be provided to the Target Fund and that the New Sub-Advisory Agreement should be and was approved. The Board unanimously recommended that shareholders approve the New Sub-Advisory Agreement.
| G. | | Approval of Interim Sub-Advisory Agreement |
At the May Meeting, the Board Members, including the Independent Board Members, unanimously approved the Interim Sub Advisory Agreement. The terms of the Interim Sub-Advisory Agreement with NWQ are substantially identical to those of the Tradewinds Sub-Advisory Agreement and New Sub-Advisory Agreement, except that the Interim Sub-Advisory Agreement will have a term expiring on the earlier of 150 days after its effective date or the date the Merger is consummated. In light of the foregoing, the Board Members, including the Independent Board Members, unanimously determined that the scope and quality of services to be provided to the Target Fund under the Interim Sub-Advisory Agreement with NWQ are at least equivalent to the scope and quality of services provided under the Tradewinds Sub-Advisory Agreement.
Notes
| | | | | | | | | | | | | | |
| | | | | | | | |
| | | | |
| | | | | | | | |
| | | | | | | | |
| | |
| | Nuveen: | | |
| | | | Serving Investors for Generations | | |
| | |
| | | | |
| | | | Since 1898, financial advisors and their clients have relied on Nuveen to provide dependable investment solutions through continued adherence to proven, long-term investing principles. Today, we offer a range of high quality equity and fixed-income solutions designed to be integral components of a well-diversified core portfolio. | | |
| | | |
| | | | | | |
| | | | | | Focused on meeting investor needs. Nuveen helps secure the long-term goals of individual investors and the advisors who serve them. As an operating division of TIAA Global Asset Management, Nuveen provides access to investment expertise from leading asset managers and solutions across traditional and alternative asset classes. Built on more than a century of industry leadership, Nuveen’s teams of experts align with clients’ specific financial needs and goals, demonstrating commitment to advisors and investors through market perspectives and wealth management and portfolio advisory services. Nuveen manages more than $239 billion in assets as of June 30, 2016. | | |
| | | | |
| | | | | | | | |
| | | | | | Find out how we can help you. To learn more about how the products and services of Nuveen may be able to help you meet your financial goals, talk to your financial advisor, or call us at (800) 257-8787. Please read the information provided carefully before you invest. Investors should consider the investment objective and policies, risk considerations, charges and expenses of any investment carefully. Where applicable, be sure to obtain a prospectus, which contains this and other relevant information. To obtain a prospectus, please contact your securities representative or Nuveen, 333 W. Wacker Dr., Chicago, IL 60606. Please read the prospectus carefully before you invest or send money. Learn more about Nuveen Funds at: www.nuveen.com/cef | | |
| | | | | | |
| | | | | | | | | | | | |
Distributed by Nuveen Securities, LLC | 333 West Wacker Drive | Chicago, IL 60606 | www.nuveen.com/cef
ESA-H-0616D 18677-INV-B-08/17
Item 2. Code of Ethics.
Not applicable to this filing.
Item 3. Audit Committee Financial Expert.
Not applicable to this filing.
Item 4. Principal Accountant Fees and Services.
Not applicable to this filing.
Item 5. Audit Committee of Listed Registrants.
Not applicable to this filing.
Item 6. Schedule of Investments.
(a) See Portfolio of Investments in Item 1.
(b) Not applicable.
Item 7. Disclosure of Proxy Voting Policies and Procedures for Closed-End Management Investment Companies.
Not applicable to this filing.
Item 8. Portfolio Managers of Closed-End Management Investment Companies.
Not applicable to this filing.
Item 9. Purchases of Equity Securities by Closed-End Management Investment Company and Affiliated Purchasers.
Not applicable.
Item 10. Submission of Matters to a Vote of Security Holders.
There have been no material changes to the procedures by which shareholders may recommend nominees to the registrant’s Board implemented after the registrant last provided disclosure in response to this item.
Item��11. Controls and Procedures.
| (a) | The registrant’s principal executive and principal financial officers, or persons performing similar functions, have concluded that the registrant’s disclosure controls and procedures (as defined in Rule 30a-3(c) under the Investment Company Act of 1940, as amended (the “1940 Act”) (17 CFR 270.30a-3(c))) are effective, as of a date within 90 days of the filing date of this report that includes the disclosure required by this paragraph, based on their evaluation of the controls and procedures required by Rule 30a-3(b) under the 1940 Act (17 CFR 270.30a-3(b)) and Rules 13a-15(b) or 15d-15(b) under the Securities Exchange Act of 1934, as amended (the “Exchange Act”) (17 CFR 240.13a-15(b) or 240.15d-15(b)). |
| (b) | There were no changes in the registrant’s internal control over financial reporting (as defined in Rule 30a-3(d) under the 1940 Act (17 CFR 270.30a-3(d)) that occurred during the second fiscal quarter of the period covered by this report that has materially affected, or is reasonably likely to materially affect, the registrant’s internal control over financial reporting. |
Item 12. Exhibits.
File the exhibits listed below as part of this Form.
(a)(1) Any code of ethics, or amendment thereto, that is the subject of the disclosure required by Item 2, to the extent that the registrant intends to satisfy the Item 2 requirements through filing of an exhibit: Not applicable to this filing.
(a)(2) A separate certification for each principal executive officer and principal financial officer of the registrant as required by Rule 30a-2(a) under the 1940 Act (17 CFR 270.30a-2(a)) in the exact form set forth below: See EX-99.CERT attached hereto.
(a)(3) Any written solicitation to purchase securities under Rule 23c-1 under the 1940 Act (17 CFR 270.23c-1) sent or given during the period covered by the report by or on behalf of the registrant to 10 or more persons: Not applicable.
(b) If the report is filed under Section 13(a) or 15(d) of the Exchange Act, provide the certifications required by Rule 30a-2 (b) under the 1940 Act (17 CFR 270.30a-2(b)), Rule 13a-14(b) or Rule 15d-14(b) under the Exchange Act (17 CFR 240.13a-14(b) or 240.15d-14(b)), and Section 1350 of Chapter 63 of Title 18 of the United States Code (18 U.S.C. 1350) as an Exhibit. A certification furnished pursuant to this paragraph will not be deemed “filed” for purposes of Section 18 of the Exchange Act (15 U.S.C. 78r), or otherwise subject to the liability of that section. Such certification will not be deemed to be incorporated by reference into any filing under the Securities Act of 1933 or the Exchange Act, except to the extent that the registration specifically incorporates it by reference: See EX-99.906 CERT attached hereto.
SIGNATURES
Pursuant to the requirements of the Securities Exchange Act of 1934 and the Investment Company Act of 1940, the registrant has duly caused this report to be signed on its behalf by the undersigned, thereunto duly authorized.
(Registrant) Nuveen Global Equity Income Fund
| | | | |
| By (Signature and Title) | | /s/ Kevin J. McCarthy | | |
| | Kevin J. McCarthy | | |
| | Vice President and Secretary | | |
Date: September 7, 2016
Pursuant to the requirements of the Securities Exchange Act of 1934 and the Investment Company Act of 1940, this report has been signed below by the following persons on behalf of the registrant and in the capacities and on the dates indicated.
| | | | |
| By (Signature and Title) | | /s/ Gifford R. Zimmerman | | |
| | Gifford R. Zimmerman | | |
| | Chief Administrative Officer | | |
| | (principal executive officer) | | |
Date: September 7, 2016
| | | | |
| By (Signature and Title) | | /s/ Stephen D. Foy | | |
| | Stephen D. Foy | | |
| | Vice President and Controller | | |
| | (principal financial officer) | | |
Date: September 7, 2016