United States
Securities and Exchange Commission
Washington, D.C. 20549
Form N-CSR
Certified Shareholder Report of Registered Management Investment Companies
811-21904
(Investment Company Act File Number)
Federated MDT Series
_______________________________________________________________
(Exact Name of Registrant as Specified in Charter)
Federated Investors Funds
4000 Ericsson Drive
Warrendale, Pennsylvania 15086-7561
(Address of Principal Executive Offices)
(412) 288-1900
(Registrant's Telephone Number)
John W. McGonigle, Esquire
Federated Investors Tower
1001 Liberty Avenue
Pittsburgh, Pennsylvania 15222-3779
(Name and Address of Agent for Service)
(Notices should be sent to the Agent for Service)
Date of Fiscal Year End: 07/31/2011
Date of Reporting Period: 07/31/2011
Item 1. Reports to Stockholders
 | | Annual Shareholder Report |
| | July 31, 2011 |
|
| Share Class | Ticker |
| A | QAACX |
| C | QCACX |
| R* | QKACX |
| IS | QIACX |
*formerly, Class K Shares
Federated MDT All Cap Core Fund
Fund Established 2002
A Portfolio of Federated MDT Series
Financial Highlights
Shareholder Expense Example
Management's Discussion of Fund Performance
Portfolio of Investments Summary Table
Portfolio of Investments
Statement of Assets and Liabilities
Statement of Operations
Statement of Changes in Net Assets
Notes to Financial Statements
Report of Independent Registered Public Accounting Firm
Board of Trustees and Trust Officers
Evaluation and Approval of Advisory Contract
Voting Proxies on Fund Portfolio Securities
Quarterly Portfolio Schedule
Financial Highlights – Class A Shares
(For a Share Outstanding Throughout Each Period)
| Year Ended July 31 | 2011 | 2010 | 2009 | 2008 | 20071 |
| Net Asset Value, Beginning of Period | $10.54 | $9.91 | $14.05 | $16.74 | $15.08 |
| Income From Investment Operations: | | | | | |
| Net investment income | 0.032 | 0.052 | 0.062 | 0.06 | 0.022 |
| Net realized and unrealized gain (loss) on investments | 1.96 | 0.67 | (4.15) | (1.56) | 2.18 |
| TOTAL FROM INVESTMENT OPERATIONS | 1.99 | 0.72 | (4.09) | (1.50) | 2.20 |
| Less Distributions: | | | | | |
| Distributions from net investment income | (0.05) | (0.09) | (0.05) | — | — |
| Distributions from net realized gain on investments | — | — | — | (1.19) | (0.54) |
| TOTAL DISTRIBUTIONS | (0.05) | (0.09) | (0.05) | (1.19) | (0.54) |
| Net Asset Value, End of Period | $12.48 | $10.54 | $9.91 | $14.05 | $16.74 |
| Total Return3 | 18.87% | 7.18% | (29.07)% | (9.98)% | 14.67% |
| Ratios to Average Net Assets: | | | | | |
| Net expenses | 1.34% | 1.29% | 1.34% | 1.29% | 1.36% |
| Net investment income | 0.21% | 0.44% | 0.64% | 0.43% | 0.13% |
| Expense waiver/reimbursement4 | 0.31% | 0.25% | 0.14% | 0.00%5 | 0.00%5 |
| Supplemental Data: | | | | | |
| Net assets, end of period (000 omitted) | $40,227 | $54,437 | $81,898 | $194,867 | $201,888 |
| Portfolio turnover | 154% | 135% | 290% | 199% | 225% |
| 1 | MDT All Cap Core Fund (the “Predecessor Fund”) was reorganized into Federated MDT All Cap Core Fund (the “Fund”) as of the close of business on December 8, 2006. Prior to the reorganization, the Fund had no investment operations. The Fund is the successor to the Predecessor Fund. The performance information and financial information presented incorporates the operations of the Predecessor Fund, which, as a result of the reorganization, are the Fund's operations. |
| 2 | Per share numbers have been calculated using the average shares method. |
| 3 | Based on net asset value, which does not reflect the sales charge, redemption fee or contingent deferred sales charge, if applicable. |
| 4 | This expense decrease is reflected in both the net expense and the net investment income ratios shown above. |
| 5 | Represents less than 0.01%. |
See Notes which are an integral part of the Financial Statements
Annual Shareholder Report1
Financial Highlights – Class C Shares
(For a Share Outstanding Throughout Each Period)
| Year Ended July 31 | 2011 | 2010 | 2009 | 2008 | 20071 |
| Net Asset Value, Beginning of Period | $10.27 | $9.66 | $13.73 | $16.51 | $14.99 |
| Income From Investment Operations: | | | | | |
| Net investment income (loss) | (0.07)2 | (0.04)2 | (0.02)2 | (0.04) | (0.11)2 |
| Net realized and unrealized gain (loss) on investments | 1.92 | 0.65 | (4.05) | (1.55) | 2.17 |
| TOTAL FROM INVESTMENT OPERATIONS | 1.85 | 0.61 | (4.07) | (1.59) | 2.06 |
| Less Distributions: | | | | | |
| Distributions from net investment income | — | (0.00)3 | — | — | — |
| Distributions from net realized gain on investments | — | — | — | (1.19) | (0.54) |
| TOTAL DISTRIBUTIONS | — | (0.00)3 | — | (1.19) | (0.54) |
| Net Asset Value, End of Period | $12.12 | $10.27 | $9.66 | $13.73 | $16.51 |
| Total Return4 | 18.01% | 6.33% | (29.64)% | (10.69)% | 13.81% |
| Ratios to Average Net Assets: | | | | | |
| Net expenses | 2.13% | 2.08% | 2.14% | 2.08% | 2.13% |
| Net investment income (loss) | (0.59)% | (0.36)% | (0.17)% | (0.36)% | (0.64)% |
| Expense waiver/reimbursement5 | 0.29% | 0.24% | 0.17% | 0.00%6 | 0.00%6 |
| Supplemental Data: | | | | | |
| Net assets, end of period (000 omitted) | $31,129 | $39,524 | $52,546 | $96,601 | $104,957 |
| Portfolio turnover | 154% | 135% | 290% | 199% | 225% |
| 1 | The Predecessor Fund was reorganized into the Fund as of the close of business on December 8, 2006. Prior to the reorganization, the Fund had no investment operations. The Fund is the successor to the Predecessor Fund. The performance information and financial information presented incorporates the operations of the Predecessor Fund, which, as a result of the reorganization, are the Fund's operations. |
| 2 | Per share numbers have been calculated using the average shares method. |
| 3 | Represents less than $0.01. |
| 4 | Based on net asset value, which does not reflect the sales charge, redemption fee or contingent deferred sales charge, if applicable. |
| 5 | This expense decrease is reflected in both the net expense and the net investment income (loss) ratios shown above. |
| 6 | Represents less than 0.01%. |
See Notes which are an integral part of the Financial Statements
Annual Shareholder Report2
Financial Highlights – Class R Shares
(For a Share Outstanding Throughout Each Period)
| Year Ended July 31, | Period
Ended
7/31/20071 |
| 2011 | 2010 | 2009 | 2008 |
| Net Asset Value, Beginning of Period | $10.52 | $9.91 | $14.10 | $16.86 | $16.82 |
| Income From Investment Operations: | | | | | |
| Net investment income (loss) | (0.04)2 | (0.01)2 | 0.012 | (0.00)3 | (0.03)2 |
| Net realized and unrealized gain (loss) on investments | 1.97 | 0.68 | (4.16) | (1.57) | 0.61 |
| TOTAL FROM INVESTMENT OPERATIONS | 1.93 | 0.67 | (4.15) | (1.57) | 0.58 |
| Less Distributions: | | | | | |
| Distributions from net investment income | (0.01) | (0.06) | (0.04) | — | — |
| Distributions from net realized gain on investments | — | — | — | (1.19) | (0.54) |
| TOTAL DISTRIBUTIONS | (0.01) | (0.06) | (0.04) | (1.19) | (0.54) |
| Net Asset Value, End of Period | $12.44 | $10.52 | $9.91 | $14.10 | $16.86 |
| Total Return4 | 18.33% | 6.71% | (29.42)% | (10.34)% | 3.52% |
| Ratios to Average Net Assets: | | | | | |
| Net expenses | 1.83% | 1.75% | 1.80% | 1.75% | 1.80%5 |
| Net investment income (loss) | (0.31)% | (0.09)% | 0.15% | (0.00)%6 | (0.30)%5 |
| Expense waiver/reimbursement7 | 0.19% | 0.18% | 0.11% | 0.00%6 | 0.02%5 |
| Supplemental Data: | | | | | |
| Net assets, end of period (000 omitted) | $2,973 | $2,300 | $1,937 | $1,393 | $135 |
| Portfolio turnover | 154% | 135% | 290% | 199% | 225%8 |
| 1 | Reflects operations for the period from December 12, 2006 (date of initial investment) to July 31, 2007. |
| 2 | Per share numbers have been calculated using the average shares method. |
| 3 | Represents less than $0.01. |
| 4 | Based on net asset value. Total returns for periods of less than one year are not annualized. |
| 5 | Computed on an annualized basis. |
| 6 | Represents less than 0.01%. |
| 7 | This expense decrease is reflected in both the net expense and the net investment income (loss) ratios shown above. |
| 8 | Portfolio turnover is calculated at the Fund level. Percentage indicated was calculated for the year ended July 31, 2007. |
See Notes which are an integral part of the Financial Statements
Annual Shareholder Report3
Financial Highlights – Institutional Shares
(For a Share Outstanding Throughout Each Period)
| Year Ended July 31 | 2011 | 2010 | 2009 | 2008 | 20071 |
| Net Asset Value, Beginning of Period | $10.66 | $10.02 | $14.22 | $16.88 | $15.17 |
| Income From Investment Operations: | | | | | |
| Net investment income | 0.052 | 0.082 | 0.092 | 0.10 | 0.072 |
| Net realized and unrealized gain (loss) on investments | 1.99 | 0.68 | (4.20) | (1.57) | 2.18 |
| TOTAL FROM INVESTMENT OPERATIONS | 2.04 | 0.76 | (4.11) | (1.47) | 2.25 |
| Less Distributions: | | | | | |
| Distributions from net investment income | (0.09) | (0.12) | (0.09) | — | — |
| Distributions from net realized gain on investments | — | — | — | (1.19) | (0.54) |
| TOTAL DISTRIBUTIONS | (0.09) | (0.12) | (0.09) | (1.19) | (0.54) |
| Net Asset Value, End of Period | $12.61 | $10.66 | $10.02 | $14.22 | $16.88 |
| Total Return3 | 19.14% | 7.54% | (28.84)% | (9.71)% | 14.92% |
| Ratios to Average Net Assets: | | | | | |
| Net expenses | 1.08% | 1.01% | 1.06% | 1.01% | 1.07% |
| Net investment income | 0.45% | 0.69% | 0.90% | 0.72% | 0.40% |
| Expense waiver/reimbursement4 | 0.19% | 0.20% | 0.12% | 0.00%5 | 0.01% |
| Supplemental Data: | | | | | |
| Net assets, end of period (000 omitted) | $43,197 | $41,958 | $50,031 | $86,681 | $85,128 |
| Portfolio turnover | 154% | 135% | 290% | 199% | 225% |
| 1 | The Predecessor Fund was reorganized into the Fund as of the close of business on December 8, 2006. Prior to the reorganization, the Fund had no investment operations. The Fund is the successor to the Predecessor Fund. The performance information and financial information presented incorporates the operations of the Predecessor Fund, which, as a result of the reorganization, are the Fund's operations. |
| 2 | Per share numbers have been calculated using the average shares method. |
| 3 | Based on net asset value. |
| 4 | This expense decrease is reflected in both the net expense and the net investment income ratios shown above. |
| 5 | Represents less than 0.01%. |
See Notes which are an integral part of the Financial Statements
Annual Shareholder Report4
Shareholder Expense Example (unaudited)
As a shareholder of the Fund, you incur two types of costs: (1) transaction costs, including sales charges (loads) on purchase or redemption payments; and (2) ongoing costs, including management fees and to the extent applicable, distribution (12b-1) fees and/or shareholder services fees and other Fund expenses. This Example is intended to help you to understand your ongoing costs (in dollars) of investing in the Fund and to compare these costs with the ongoing costs of investing in other mutual funds. It is based on an investment of $1,000 invested at the beginning of the period and held for the entire period from February 1, 2011 to July 31, 2011.
ACTUAL EXPENSES
The first section of the table below provides information about actual account values and actual expenses. You may use the information in this section, together with the amount you invested, to estimate the expenses that you incurred over the period. Simply divide your account value by $1,000 (for example, an $8,600 account value divided by $1,000 = 8.6), then multiply the result by the number in the first section under the heading entitled “Expenses Paid During Period” to estimate the expenses attributable to your investment during this period.
HYPOTHETICAL EXAMPLE FOR COMPARISON PURPOSES
The second section of the table below provides information about hypothetical account values and hypothetical expenses based on the Fund's actual expense ratio and an assumed rate of return of 5% per year before expenses, which is not the Fund's actual return. Thus, you should not use the hypothetical account values and expenses to estimate the actual ending account balance or your expenses for the period. Rather, these figures are required to be provided to enable you to compare the ongoing costs of investing in the Fund with other funds. To do so, compare this 5% hypothetical example with the 5% hypothetical examples that appear in the shareholder reports of the other funds.
Annual Shareholder Report
5
Please note that the expenses shown in the table are meant to highlight your ongoing costs only and do not reflect any transaction costs, such as sales charges (loads) on purchase or redemption payments. Therefore, the second section of the table is useful in comparing ongoing costs only, and will not help you determine the relative total costs of owning different funds. In addition, if these transaction costs were included, your costs would have been higher. | Beginning
Account Value
2/1/2011 | Ending
Account Value
7/31/2011 | Expenses Paid
During Period1 |
| Actual: | | | |
| Class A Shares | $1,000 | $996.00 | $6.68 |
| Class C Shares | $1,000 | $992.60 | $10.62 |
| Class R Shares | $1,000 | $993.60 | $9.19 |
| Institutional Shares | $1,000 | $996.80 | $5.50 |
Hypothetical (assuming a 5% return
before expenses): | | | |
| Class A Shares | $1,000 | $1,018.10 | $6.76 |
| Class C Shares | $1,000 | $1,014.13 | $10.74 |
| Class R Shares | $1,000 | $1,015.57 | $9.30 |
| Institutional Shares | $1,000 | $1,019.29 | $5.56 |
| 1 | Expenses are equal to the Fund's annualized net expense ratios, multiplied by the average account value over the period, multiplied by 181/365 (to reflect the one-half-year period). The annualized net expense ratios are as follows: |
| Class A Shares | 1.35% |
| Class C Shares | 2.15% |
| Class R Shares | 1.86% |
| Institutional Shares | 1.11% |
Annual Shareholder Report6
Performance data quoted represents past performance which is no guarantee of future results. Investment return and principal value will fluctuate so that an investor's shares, when redeemed, may be worth more or less than their original cost. Mutual fund performance changes over time and current performance may be lower or higher than what is stated. For current to the most recent month-end performance and after-tax returns, visit FederatedInvestors.com or call 1-800-341-7400.
Management's Discussion of Fund Performance (unaudited)
The Fund's total return for the 12-month reporting period ended July 31, 2011 was 18.87% for Class A Shares, 18.01% for Class C Shares, 18.33% for Class R Shares and 19.14% for Institutional Shares. The total return of the Russell 3000® Index (the “Russell 3000® ”),1 a broad-based securities market index, was 20.94% for the same period. The Fund's total return for the fiscal year reflected actual cash flows, transaction costs and other expenses, which were not reflected in the total return of the Russell 3000® ..
| 1 | The Russell 3000® offers investors access to the broad U.S. equity universe representing approximately 98% of the U.S. market. The Russell 3000 is constructed to provide a comprehensive, unbiased and stable barometer of the broad market, and is completely reconstituted annually to ensure that new and growing equities are reflected. The index is unmanaged, and unlike the Fund, is not affected by cash flows. The Russell 3000® is not adjusted to reflect sales charges, expenses or other fees that the Securities and Exchange Commission (SEC) requires to be reflected in the Fund's performance. It is not possible to invest directly in an index. |
Annual Shareholder Report7
Market Overview
During the 12-month reporting period ended July 31, 2011, domestic equity market performance was strong as evidenced by the 20.94% return on the Russell 3000. Mid-cap stocks led the way, during the reporting period, as demonstrated by the 24.51% return of the Russell Midcap® Index,2 which exceeded the 19.09% and 23.92% results for the Russell Top 200® Index,3 representing large-cap stocks, and the Russell 2000® Index,4 representing small-cap stocks, respectively. Growth stocks outperformed value stocks during the year with the Russell 3000® Growth Index5 returning 25.12% as compared to 16.90% for the Russell 3000 Value® Index.6
The best performing sectors in the Russell 3000® , during the reporting period were Energy (+43.50%), Consumer Discretionary (+28.72%), Materials (+28.27%), and Health Care (+23.84%). Underperforming sectors included Financials (+4.56%), Utilities (+15.43%), and Industrials (+17.69%).
| 2 | The Russell Midcap® Index measures the performance of the 800 smallest companies in the Russell 1000 Index and represents approximately 31% of the total market capitalization of the Russell 1000 Index. The index is unmanaged and, unlike the Fund, is not affected by cash flows. The index is not adjusted to reflect sales charges, expenses or other fees that the SEC requires to be reflected in the Fund's performance. It is not possible to invest directly in an index. |
| 3 | Russell Top 200® Index measures the performance of the 200 largest companies in the Russell 1000 Index and represents approximately 68% of the total market capitalization of the Russell 1000 Index. The index is unmanaged and, unlike the Fund, is not affected by cash flows. The index is not adjusted to reflect sales charges, expenses or other fees that the SEC requires to be reflected in the Fund's performance. It is not possible to invest directly in an index. |
| 4 | The Russell 2000® Index measures the performance of the 2,000 smallest companies in the Russell 3000 Index and represents approximately 10% of the total market capitalization of the Russell 3000 Index. The index is unmanaged and, unlike the Fund, is not affected by cash flows. The index is not adjusted to reflect sales charges, expenses or other fees that the SEC requires to be reflected in the Fund's performance. It is not possible to invest directly in an index. |
| 5 | The Russell 3000® Growth Index measures the performance of those Russell 3000 Index companies with higher price-to-book ratios and higher forecasted growth values. The stocks in this index are also members of either the Russell 1000 Growth or the Russell 2000 Growth indexes. The index is unmanaged and, unlike the Fund, is not affected by cash flows. The index is not adjusted to reflect sales charges, expenses or other fees that the SEC requires to be reflected in the Fund's performance. It is not possible to invest directly in an index. |
| 6 | The Russell 3000® Value Index measures the performance of those Russell 3000 Index companies with lower price-to-book ratios and lower forecasted growth values. The stocks in this index are also members of either the Russell 1000 Value or the Russell 2000 Value indexes. The index is unmanaged and, unlike the Fund, is not affected by cash flows. The index is not adjusted to reflect sales charges, expenses or other fees that the SEC requires to be reflected in the Fund's performance. It is not possible to invest directly in an index. |
Annual Shareholder Report8
Fund Performance
During the 12-month reporting period, the most significant positive factor in the Fund's performance relative to the Russell 3000® was an overweight in the Energy sector, which outperformed the Russell 3000® .. Stock selection in the Financials sector also contributed significantly to the Fund's performance. Stock selection in the Industrials and Materials sectors contributed more moderately to the Fund's performance. The most significant negative factor in the Fund's performance was an overweight in the Financials sector, which underperformed the Russell 3000® .. Stock selection in the Information Technology sector also detracted significantly. An underweight in the Health Care sector, which outperformed the Russell 3000® , detracted more moderately from relative performance.
Individual stocks detracting from the Fund's performance included ITT Educational Services, Schlumberger, Corning, PNC Financial and Murphy Oil.
Individual stocks contributing to the Fund's performance included Ameriprise Financial, Chesapeake Energy, Chevron, Netflix and DIRECTV.
Annual Shareholder Report9
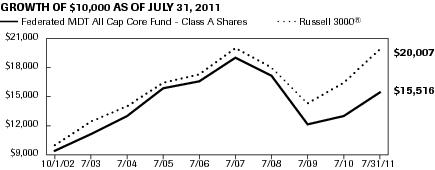
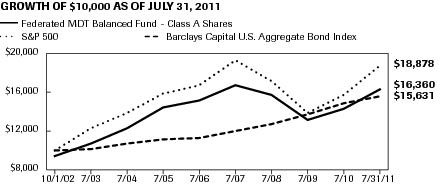
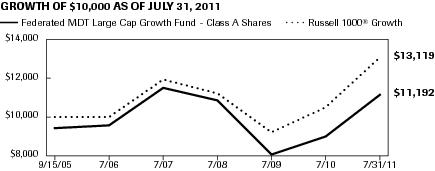
GROWTH OF A $10,000 INVESTMENT – CLASS A SHARES
The graph below illustrates the hypothetical investment of $10,0001 in the Federated MDT All Cap Core Fund2 (Class A Shares) (the “Fund”) from October 1, 2002 (start of performance) to July 31, 2011, compared to the Russell 3000® Index (Russell 3000® ).3
| Average Annual Total Returns for the Period Ended 7/31/2011 | |
| 1 Year | 12.37% |
| 5 Years | -2.49% |
| Start of Performance (10/1/2002)4 | 5.10% |
| Federated MDT All Cap Core Fund - Class A Shares | C000035043 | Russell 3000® | Lipper Multi-Cap Core Funds Index |
| 10/1/2002 | 9,450 | 10,000 | 10,000 |
| 7/31/2003 | 11,108 | 12,454 | 12,110 |
| 7/31/2004 | 13,056 | 14,111 | 13,753 |
| 7/31/2005 | 15,900 | 16,497 | 16,222 |
| 7/31/2006 | 16,630 | 17,345 | 17,044 |
| 7/31/2007 | 19,070 | 20,135 | 20,165 |
| 7/31/2008 | 17,169 | 18,057 | 17,925 |
| 7/31/2009 | 12,179 | 14,407 | 14,519 |
| 7/31/2010 | 13,053 | 16,543 | 16,682 |
| 7/31/2011 | 15,516 | 20,007 | 20,067 |
41 graphic description end -->
Performance data quoted represents past performance which is no guarantee of future results. Investment return and principal value will fluctuate so that an investor's shares, when redeemed, may be worth more or less than their original cost. Mutual fund performance changes over time and current performance may be lower or higher than what is stated. For current to the most recent month-end performance and after-tax returns, visit FederatedInvestors.com or call 1-800-341-7400. Returns shown do not reflect the deduction of taxes that a shareholder would pay on Fund distributions or the redemption of Fund shares. Mutual funds are not obligations of or guaranteed by any bank and are not federally insured. Total returns shown include the maximum sales charge of 5.50%.
Annual Shareholder Report
10
| 1 | Represents a hypothetical investment of $10,000 in the Fund after deducting the maximum sales charge of 5.50% ($10,000 investment minus $550 sales charge = $9,450). The Fund's performance assumes the reinvestment of all dividends and distributions. The Russell 3000® and the Lipper Multi-Cap Core Funds Index have been adjusted to reflect reinvestment of dividends on securities in the indexes. |
| 2 | The Fund is the successor to the MDT All Cap Core Fund pursuant to a reorganization that took place on December 8, 2006. Prior to that date, the Fund had no investment operations. Accordingly, the performance information shown for periods prior to that date is that of the MDT All Cap Core Fund. |
| 3 | The Russell 3000® offers investors access to the broad U.S. equity universe representing approximately 98% of the U.S. market. The Russell 3000® is constructed to provide a comprehensive, unbiased and stable barometer of the broad market, and is completely reconstituted annually to ensure that new and growing equities are reflected. The index is unmanaged and, unlike the Fund, is not affected by cash flows. It is not possible to invest directly in an index. The Russell 3000® is not adjusted to reflect sales charges, expenses or other fees that the Securities and Exchange Commission (SEC) requires to be reflected in the Fund's performance. |
| 4 | The start of performance date was October 1, 2002. Class A Shares of the Fund were offered beginning February 12, 2003. Performance results shown before that date are for the Fund's Institutional Shares and have been adjusted for the maximum sales charge and total annual operating expenses applicable to the Fund's Class A Shares. The Fund's Institutional Shares commenced operations on October 1, 2002. Subject to the expense adjustments described above, the Fund's Class A Shares annual returns would have been substantially similar to those of the Fund's Institutional Shares because Shares of each class are invested in the same portfolio of securities. |
Annual Shareholder Report11
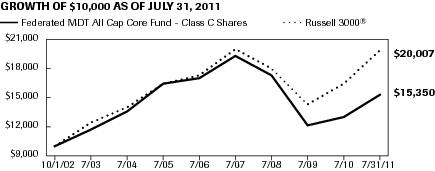
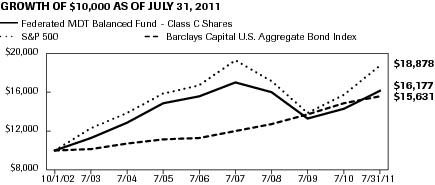
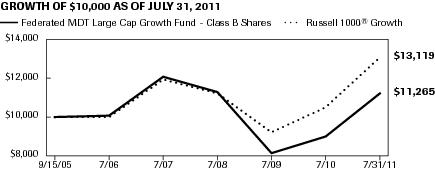
GROWTH OF A $10,000 INVESTMENT – CLASS C SHARES
The graph below illustrates the hypothetical investment of $10,0001 in the Federated MDT All Cap Core Fund2 (Class C Shares) (the “Fund”) from October 1, 2002 (start of performance) to July 31, 2011, compared to the Russell 3000® Index (Russell 3000® ).3
| Average Annual Total Returns for the Period Ended 7/31/2011 | |
| 1 Year | 17.01% |
| 5 Years | -2.14% |
| Start of Performance (10/1/2002)4 | 4.97% |
| Federated MDT All Cap Core Fund - Class C Shares | C000035044 | Russell 3000® | Lipper Multi-Cap Core Funds Index |
| 10/1/2002 | 10,000 | 10,000 | 10,000 |
| 7/31/2003 | 11,681 | 12,454 | 12,110 |
| 7/31/2004 | 13,628 | 14,111 | 13,753 |
| 7/31/2005 | 16,473 | 16,497 | 16,222 |
| 7/31/2006 | 17,107 | 17,345 | 17,044 |
| 7/31/2007 | 19,469 | 20,135 | 20,165 |
| 7/31/2008 | 17,387 | 18,057 | 17,925 |
| 7/31/2009 | 12,233 | 14,407 | 14,519 |
| 7/31/2010 | 13,007 | 16,543 | 16,682 |
| 7/31/2011 | 15,350 | 20,007 | 20,067 |
41 graphic description end -->
Performance data quoted represents past performance which is no guarantee of future results. Investment return and principal value will fluctuate so that an investor's shares, when redeemed, may be worth more or less than their original cost. Mutual fund performance changes over time and current performance may be lower or higher than what is stated. For current to the most recent month-end performance and after-tax returns, visit FederatedInvestors.com or call 1-800-341-7400. Returns shown do not reflect the deduction of taxes that a shareholder would pay on Fund distributions or the redemption of Fund shares. Mutual funds are not obligations of or guaranteed by any bank and are not federally insured. Total returns shown include the maximum contingent deferred sales charge (CDSC) of 1.00%, as applicable.
Annual Shareholder Report
12
| 1 | Represents a hypothetical investment of $10,000 in the Fund. The maximum CDSC is 1.00% on any redemption less than one year from the purchase date. The Fund's performance assumes the reinvestment of all dividends and distributions. The Russell 3000® and the Lipper Multi-Cap Core Funds Index have been adjusted to reflect reinvestment of dividends on securities in the indexes. |
| 2 | The Fund is the successor to the MDT All Cap Core Fund pursuant to a reorganization that took place on December 8, 2006. Prior to that date, the Fund had no investment operations. Accordingly, the performance information shown for periods prior to that date is that of the MDT All Cap Core Fund. |
| 3 | The Russell 3000® offers investors access to the broad U.S. equity universe representing approximately 98% of the U.S. market. The Russell 3000® is constructed to provide a comprehensive, unbiased and stable barometer of the broad market, and is completely reconstituted annually to ensure that new and growing equities are reflected. The index is unmanaged and, unlike the Fund, is not affected by cash flows. It is not possible to invest directly in an index. The Russell 3000® is not adjusted to reflect sales charges, expenses or other fees that the SEC requires to be reflected in the Fund's performance. |
| 4 | The start of performance date was October 1, 2002. Class C Shares of the Fund were offered beginning September 15, 2005. Performance results shown before that date are for the Fund's Institutional Shares and have been adjusted for the maximum CDSC and total annual operating expenses applicable to the Fund's Class C Shares. The Fund's Institutional Shares commenced operations on October 1, 2002. Subject to the expense adjustments described above, the Fund's Class C Shares annual returns would have been substantially similar to those of the Fund's Institutional Shares because Shares of each class are invested in the same portfolio of securities. |
Annual Shareholder Report13
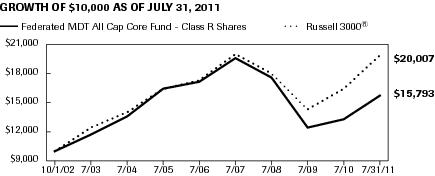
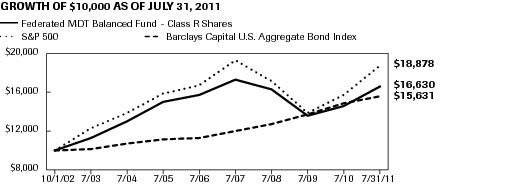
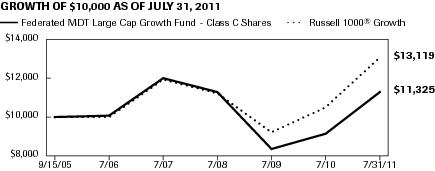
GROWTH OF A $10,000 INVESTMENT – CLASS R SHARES
The graph below illustrates the hypothetical investment of $10,0001 in the Federated MDT All Cap Core Fund (Class R Shares) (the “Fund”) from October 1, 2002 (start of performance) to July 31, 2011, compared to the Russell 3000® Index (Russell 3000® ).2
| Average Annual Total Returns for the Period Ended 7/31/2011 | |
| 1 Year | 18.33% |
| 5 Years | -1.76% |
| Start of Performance (10/1/2002)3 | 5.31% |
| Federated MDT All Cap Core Fund - Class R Shares | C000043497 | Russell 3000® | Lipper Multi-Cap Core Funds Index |
| 10/1/2002 | 10,000 | 10,000 | 10,000 |
| 7/31/2003 | 11,703 | 12,454 | 12,110 |
| 7/31/2004 | 13,682 | 14,111 | 13,753 |
| 7/31/2005 | 16,587 | 16,497 | 16,222 |
| 7/31/2006 | 17,262 | 17,345 | 17,044 |
| 7/31/2007 | 19,765 | 20,135 | 20,165 |
| 7/31/2008 | 17,722 | 18,057 | 17,925 |
| 7/31/2009 | 12,508 | 14,407 | 14,519 |
| 7/31/2010 | 13,347 | 16,543 | 16,682 |
| 7/31/2011 | 15,793 | 20,007 | 20,067 |
41 graphic description end -->
Performance data quoted represents past performance which is no guarantee of future results. Investment return and principal value will fluctuate so that an investor's shares, when redeemed, may be worth more or less than their original cost. Mutual fund performance changes over time and current performance may be lower or higher than what is stated. For current to the most recent month-end performance and after-tax returns, visit FederatedInvestors.com or call 1-800-341-7400. Returns shown do not reflect the deduction of taxes that a shareholder would pay on Fund distributions or the redemption of Fund shares. Mutual funds are not obligations of or guaranteed by any bank and are not federally insured.
Annual Shareholder Report
14
| 1 | The Fund's performance assumes the reinvestment of all dividends and distributions. The Russell 3000® and the Lipper Multi-Cap Core Funds Index have been adjusted to reflect reinvestment of dividends on securities in the indexes. |
| 2 | The Russell 3000® offers investors access to the broad U.S. equity universe representing approximately 98% of the U.S. market. The Russell 3000® is constructed to provide a comprehensive, unbiased and stable barometer of the broad market, and is completely reconstituted annually to ensure that new and growing equities are reflected. The index is unmanaged and, unlike the Fund, is not affected by cash flows. It is not possible to invest directly in an index. The Russell 3000® is not adjusted to reflect sales charges, expenses or other fees that the SEC requires to be reflected in the Fund's performance. |
| 3 | The start of performance date was October 1, 2002. Class R Shares of the Fund were offered beginning December 12, 2006. Performance results shown before that date are for the Fund's Institutional Shares and have been adjusted for the total annual operating expenses applicable to the Fund's Class R Shares. The Fund's Institutional Shares commenced operations on October 1, 2002. Subject to the expense adjustments described above, the Fund's Class R Shares annual returns would have been substantially similar to those of the Fund's Institutional Shares because Shares of each class are invested in the same portfolio of securities. |
Annual Shareholder Report15
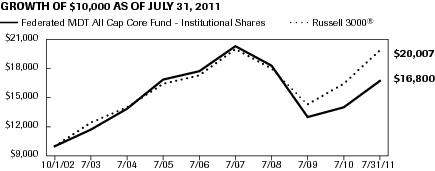
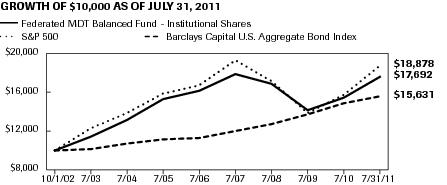
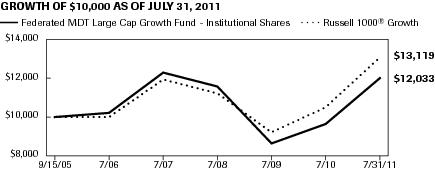
GROWTH OF A $10,000 INVESTMENT – INSTITUTIONAL SHARES
The graph below illustrates the hypothetical investment of $10,0001 in the Federated MDT All Cap Core Fund2 (Institutional Shares) (the “Fund”) from October 1, 2002 (start of performance) to July 31, 2011, compared to the Russell 3000® Index (Russell 3000® ).3
| Average Annual Total Returns for the Period Ended 7/31/2011 | |
| 1 Year | 19.14% |
| 5 Years | -1.11% |
| Start of Performance (10/1/2002) | 6.05% |
| Federated MDT All Cap Core Fund - Institutional Shares | C000035045 | Russell 3000® | Lipper Multi-Cap Core Funds Index |
| 10/1/2002 | 10,000 | 10,000 | 10,000 |
| 7/31/2003 | 11,775 | 12,454 | 12,110 |
| 7/31/2004 | 13,869 | 14,111 | 13,753 |
| 7/31/2005 | 16,939 | 16,497 | 16,222 |
| 7/31/2006 | 17,761 | 17,345 | 17,044 |
| 7/31/2007 | 20,410 | 20,135 | 20,165 |
| 7/31/2008 | 18,429 | 18,057 | 17,925 |
| 7/31/2009 | 13,113 | 14,407 | 14,519 |
| 7/31/2010 | 14,102 | 16,543 | 16,682 |
| 7/31/2011 | 16,800 | 20,007 | 20,067 |
41 graphic description end -->
Performance data quoted represents past performance which is no guarantee of future results. Investment return and principal value will fluctuate so that an investor's shares, when redeemed, may be worth more or less than their original cost. Mutual fund performance changes over time and current performance may be lower or higher than what is stated. For current to the most recent month-end performance and after-tax returns, visit FederatedInvestors.com or call 1-800-341-7400. Returns shown do not reflect the deduction of taxes that a shareholder would pay on Fund distributions or the redemption of Fund shares. Mutual funds are not obligations of or guaranteed by any bank and are not federally insured.
Annual Shareholder Report
16
| 1 | The Fund's performance assumes the reinvestment of all dividends and distributions. The Russell 3000® and the Lipper Multi-Cap Core Funds Index have been adjusted to reflect reinvestment of dividends on securities in the indexes. |
| 2 | The Fund is the successor to the MDT All Cap Core Fund pursuant to a reorganization that took place on December 8, 2006. Prior to that date, the Fund had no investment operations. Accordingly, the performance information shown for periods prior to that date is that of the MDT All Cap Core Fund. |
| 3 | The Russell 3000® offers investors access to the broad U.S. equity universe representing approximately 98% of the U.S. market. The Russell 3000® is constructed to provide a comprehensive, unbiased and stable barometer of the broad market, and is completely reconstituted annually to ensure that new and growing equities are reflected. The index is unmanaged and, unlike the Fund, is not affected by cash flows. It is not possible to invest directly in an index. The Russell 3000® is not adjusted to reflect sales charges, expenses or other fees that the SEC requires to be reflected in the Fund's performance. |
Annual Shareholder Report17
Portfolio of Investments Summary Table (unaudited)
At July 31, 2011, the Fund's industry composition1 was as follows:
| Industry Composition | Percentage of
Total Net Assets |
| Regional Banks | 5.3% |
| Oil Well Supply | 5.0% |
| Money Center Bank | 4.1% |
| Integrated International Oil | 3.7% |
| Discount Department Stores | 3.6% |
| Integrated Domestic Oil | 3.6% |
| Services to Medical Professionals | 3.5% |
| Broadcasting | 3.4% |
| Oil Refiner | 3.1% |
| Specialty Retailing | 3.0% |
| Computer Peripherals | 2.6% |
| Diversified Oil | 2.5% |
| Hotels and Motels | 2.5% |
| Personal Loans | 2.4% |
| AT&T Divestiture | 2.2% |
| Financial Services | 2.2% |
| Department Stores | 2.0% |
| Multi-Line Insurance | 2.0% |
| Agricultural Chemicals | 1.8% |
| Electronic Test/Measuring Equipment | 1.8% |
| Semiconductor Distribution | 1.8% |
| Building Supply Stores | 1.7% |
| Computers - Midrange | 1.7% |
| Internet Services | 1.6% |
| Oil Service, Explore & Drill | 1.6% |
| Software Packaged/Custom | 1.4% |
| Computer Stores | 1.3% |
| Crude Oil & Gas Production | 1.2% |
| Ethical Drugs | 1.2% |
| Cable & Wireless Television | 1.1% |
| Cable Television | 1.1% |
Annual Shareholder Report18
| Industry Composition | Percentage of
Total Net Assets |
| Multi-Industry Capital Goods | 1.1% |
| Pollution Control | 1.1% |
| Restaurants | 1.1% |
| Other2 | 19.3% |
| Cash Equivalents3 | 1.7% |
| Other Assets and Liabilities — Net4 | (0.3)% |
| TOTAL | 100.0% |
| 1 | Except for Cash Equivalents and Other Assets and Liabilities, industry classifications are based upon, and individual portfolio securities are assigned to, the classifications of the Global Industry Classification Standard (GICS) except that the Adviser assigns a classification to securities not classified by the GICS and to securities for which the Adviser does not have access to the classification made by the GICS. |
| 2 | For purposes of this table, industry classifications which constitute less than 1.0% of the Fund's total net assets have been aggregated under the designation “Other.” |
| 3 | Cash Equivalents include any investments in money market mutual funds and/or overnight repurchase agreements. |
| 4 | Assets, other than investments in securities, less liabilities. See Statement of Assets and Liabilities. |
Annual Shareholder Report19
Portfolio of Investments
July 31, 2011
| Shares | | | Value |
| | COMMON STOCKS – 98.6% | |
| | Agricultural Chemicals – 1.8% | |
| 29,900 | | Bunge Ltd. | 2,057,419 |
| 1,700 | | Scotts Miracle-Gro Co. | 85,782 |
| | TOTAL | 2,143,201 |
| | Airline — Regional – 0.7% | |
| 14,267 | 1 | Alaska Air Group, Inc. | 871,999 |
| | Aluminum – 0.2% | |
| 16,400 | 1 | Century Aluminum Co. | 213,528 |
| | Apparel – 0.3% | |
| 4,000 | 1 | Under Armour, Inc., Class A | 293,640 |
| 1,600 | 1 | Warnaco Group, Inc. | 85,280 |
| | TOTAL | 378,920 |
| | AT&T Divestiture – 2.2% | |
| 72,500 | | Verizon Communications, Inc. | 2,558,525 |
| | Auto Original Equipment Manufacturers – 0.4% | |
| 400 | 1 | AutoZone, Inc. | 114,180 |
| 3,700 | 1 | O'Reilly Automotive, Inc. | 220,150 |
| 2,200 | 1 | Tenneco Automotive, Inc. | 87,868 |
| | TOTAL | 422,198 |
| | Auto Part Replacement – 0.2% | |
| 3,500 | | Genuine Parts Co. | 186,060 |
| | Auto Rentals – 0.1% | |
| 600 | 1 | AMERCO | 54,084 |
| | Biotechnology – 0.2% | |
| 4,600 | 1 | Illumina, Inc. | 287,270 |
| | Broadcasting – 3.4% | |
| 78,089 | 1 | DIRECTV Group, Inc., Class A | 3,957,551 |
| | Building Supply Stores – 1.7% | |
| 44,300 | | Home Depot, Inc. | 1,547,399 |
| 20,500 | | Lowe's Cos., Inc. | 442,390 |
| | TOTAL | 1,989,789 |
| | Cable & Wireless Television – 1.1% | |
| 17,600 | 1 | Discovery Communications, Inc. | 700,480 |
| 8,300 | | Time Warner Cable, Inc. | 608,473 |
| | TOTAL | 1,308,953 |
Annual Shareholder Report20
| Shares | | | Value |
| | Cable Television – 1.1% | |
| 35,100 | | CBS Corp. (New), Class B | 960,687 |
| 6,900 | 1 | Liberty Global, Inc., Class A | 288,420 |
| | TOTAL | 1,249,107 |
| | Carpets – 0.1% | |
| 1,500 | 1 | Mohawk Industries, Inc. | 78,045 |
| | Clothing Stores – 0.6% | |
| 4,200 | | American Eagle Outfitters, Inc. | 55,188 |
| 4,800 | 1 | Fossil, Inc. | 603,216 |
| 3,400 | | Gap (The), Inc. | 65,586 |
| | TOTAL | 723,990 |
| | Commodity Chemicals – 0.4% | |
| 5,000 | | PPG Industries, Inc. | 421,000 |
| | Computer Peripherals – 2.6% | |
| 44,000 | 1 | NetApp, Inc. | 2,090,880 |
| 18,900 | 1 | Sandisk Corp. | 803,817 |
| 3,700 | 1 | Western Digital Corp. | 127,502 |
| | TOTAL | 3,022,199 |
| | Computer Services – 0.3% | |
| 11,134 | 1 | Synnex Corp. | 315,315 |
| | Computer Stores – 1.3% | |
| 46,849 | 1 | Ingram Micro, Inc., Class A | 869,049 |
| 2,100 | 1 | Insight Enterprises, Inc. | 35,343 |
| 13,862 | 1 | Tech Data Corp. | 646,939 |
| | TOTAL | 1,551,331 |
| | Computers - Midrange – 1.7% | |
| 56,900 | | Hewlett-Packard Co. | 2,000,604 |
| | Construction Machinery – 0.5% | |
| 21,300 | | Trinity Industries, Inc. | 634,527 |
| | Cosmetics & Toiletries – 0.9% | |
| 3,200 | | Avon Products, Inc. | 83,936 |
| 3,000 | | Estee Lauder Cos., Inc., Class A | 314,730 |
| 10,500 | 1 | Ulta Salon Cosmetics & Fragrance, Inc. | 661,815 |
| | TOTAL | 1,060,481 |
| | Crude Oil & Gas Production – 1.2% | |
| 41,902 | | Chesapeake Energy Corp. | 1,439,334 |
| | Defense Aerospace – 0.1% | |
| 3,900 | 1 | BE Aerospace, Inc. | 155,220 |
Annual Shareholder Report21
| Shares | | | Value |
| | Defense Electronics – 0.4% | |
| 7,800 | | Northrop Grumman Corp. | 471,978 |
| | Department Stores – 2.0% | |
| 11,800 | 1 | Kohl's Corp. | 645,578 |
| 5,800 | | Penney (J.C.) Co., Inc. | 178,408 |
| 2,800 | 1 | Sears Holdings Corp. | 195,076 |
| 26,700 | | Target Corp. | 1,374,783 |
| | TOTAL | 2,393,845 |
| | Discount Department Stores – 3.6% | |
| 80,300 | | Wal-Mart Stores, Inc. | 4,232,613 |
| | Diversified Leisure – 0.5% | |
| 4,400 | 1 | Coinstar, Inc. | 214,984 |
| 7,600 | 1 | Las Vegas Sands Corp. | 358,568 |
| | TOTAL | 573,552 |
| | Diversified Oil – 2.5% | |
| 45,500 | | Murphy Oil Corp. | 2,922,010 |
| | Drug Store – 0.9% | |
| 28,200 | | Walgreen Co. | 1,100,928 |
| | Electric & Electronic Original Equipment Manufacturers – 0.3% | |
| 10,200 | 1 | General Cable Corp. | 405,654 |
| | Electric Utility – 0.9% | |
| 38,600 | 1 | Calpine Corp. | 627,250 |
| 15,200 | | Portland General Electric Co. | 376,656 |
| | TOTAL | 1,003,906 |
| | Electronic Test/Measuring Equipment – 1.8% | |
| 50,900 | 1 | Agilent Technologies, Inc. | 2,145,944 |
| | Electronics Stores – 0.2% | |
| 8,700 | | Best Buy Co., Inc. | 240,120 |
| | Ethical Drugs – 1.2% | |
| 36,600 | | Eli Lilly & Co. | 1,401,780 |
| | Financial Services – 2.2% | |
| 51,500 | | Discover Financial Services | 1,318,915 |
| 4,000 | | Mastercard, Inc. | 1,213,000 |
| 2,700 | | Nelnet, Inc., Class A | 54,432 |
| | TOTAL | 2,586,347 |
| | Food Wholesaling – 0.3% | |
| 12,100 | | Sysco Corp. | 370,139 |
| | Grocery Chain – 0.6% | |
| 10,800 | | Kroger Co. | 268,596 |
Annual Shareholder Report22
| Shares | | | Value |
| 3,900 | | Safeway, Inc. | 78,663 |
| 5,700 | | Whole Foods Market, Inc. | 380,190 |
| | TOTAL | 727,449 |
| | Home Building – 0.1% | |
| 20,000 | 1 | Pulte Group, Inc. | 137,400 |
| | Home Products – 0.2% | |
| 1,800 | 1 | Energizer Holdings, Inc. | 145,152 |
| 1,400 | | Tupperware Brands Corp. | 87,486 |
| | TOTAL | 232,638 |
| | Hotels and Motels – 2.5% | |
| 3,000 | | Starwood Hotels & Resorts Worldwide, Inc. | 164,880 |
| 18,300 | | Wynn Resorts Ltd. | 2,812,344 |
| | TOTAL | 2,977,224 |
| | Household Appliances – 0.2% | |
| 3,500 | | Whirlpool Corp. | 242,305 |
| | Industrial Machinery – 0.7% | |
| 5,600 | | Graco, Inc. | 246,008 |
| 7,600 | 1 | Polypore International, Inc. | 516,800 |
| | TOTAL | 762,808 |
| | Integrated Domestic Oil – 3.6% | |
| 58,700 | | ConocoPhillips | 4,225,813 |
| | Integrated International Oil – 3.7% | |
| 41,511 | | Chevron Corp. | 4,317,974 |
| | Internet Services – 1.6% | |
| 6,800 | 1 | Ancestry.com, Inc. | 242,148 |
| 3,000 | 1 | Priceline.com, Inc. | 1,612,950 |
| | TOTAL | 1,855,098 |
| | Life Insurance – 0.8% | |
| 15,800 | | Prudential Financial, Inc. | 927,144 |
| | Meat Packing – 0.5% | |
| 28,300 | 1 | Smithfield Foods, Inc. | 623,166 |
| | Medical Technology – 0.1% | |
| 300 | 1 | Intuitive Surgical, Inc. | 120,165 |
| | Metal Fabrication – 0.4% | |
| 4,500 | | Mueller Industries, Inc. | 168,885 |
| 8,600 | 1 | RTI International Metals | 275,802 |
| | TOTAL | 444,687 |
Annual Shareholder Report23
| Shares | | | Value |
| | Miscellaneous Components – 0.6% | |
| 14,297 | 1 | Fairchild Semiconductor International, Inc., Class A | 214,598 |
| 6,300 | 1 | International Rectifier Corp. | 161,847 |
| 27,428 | 1 | Vishay Intertechnology, Inc. | 377,684 |
| | TOTAL | 754,129 |
| | Miscellaneous Food Products – 0.1% | |
| 6,500 | | Fresh Del Monte Produce, Inc. | 159,315 |
| | Miscellaneous Machinery – 0.6% | |
| 16,800 | | Fastenal Co. | 565,320 |
| 1,100 | | SPX Corp. | 82,764 |
| | TOTAL | 648,084 |
| | Money Center Bank – 4.1% | |
| 109,300 | | J.P. Morgan Chase & Co. | 4,421,185 |
| 9,000 | | State Street Corp. | 373,230 |
| | TOTAL | 4,794,415 |
| | Multi-Industry Capital Goods – 1.1% | |
| 5,100 | 1 | Ceradyne, Inc. | 165,291 |
| 59,700 | | General Electric Co. | 1,069,227 |
| | TOTAL | 1,234,518 |
| | Multi-Industry Transportation – 0.2% | |
| 3,100 | | FedEx Corp. | 269,328 |
| | Multi-Line Insurance – 2.0% | |
| 7,400 | 1 | CNO Financial Group, Inc. | 54,390 |
| 1,900 | | FBL Financial Group, Inc., Class A | 59,812 |
| 85,770 | | Lincoln National Corp. | 2,272,905 |
| | TOTAL | 2,387,107 |
| | Multiline Retail – 0.2% | |
| 6,000 | | Macy's, Inc. | 173,220 |
| | Newspaper Publishing – 0.1% | |
| 300 | | Washington Post Co., Class B | 120,690 |
| | Oil Refiner – 3.1% | |
| 17,200 | 1 | Tesoro Petroleum Corp. | 417,788 |
| 126,300 | | Valero Energy Corp. | 3,172,656 |
| | TOTAL | 3,590,444 |
| | Oil Service, Explore & Drill – 1.6% | |
| 13,000 | 1 | Comstock Resources, Inc. | 414,700 |
| 21,400 | 1 | Helix Energy Solutions Group, Inc. | 419,012 |
| 3,300 | 1 | Seacor Holdings, Inc. | 331,188 |
Annual Shareholder Report24
| Shares | | | Value |
| 11,800 | 1 | Unit Corp. | 708,118 |
| | TOTAL | 1,873,018 |
| | Oil Well Supply – 5.0% | |
| 4,600 | | Carbo Ceramics, Inc. | 717,922 |
| 76,900 | | Halliburton Co. | 4,208,737 |
| 10,600 | | Schlumberger Ltd. | 957,922 |
| | TOTAL | 5,884,581 |
| | Paint & Related Materials – 0.2% | |
| 2,400 | | Sherwin-Williams Co. | 185,208 |
| | Paper Products – 0.3% | |
| 5,700 | | Boise, Inc. | 39,501 |
| 10,500 | | International Paper Co. | 311,850 |
| | TOTAL | 351,351 |
| | Personal Loans – 2.4% | |
| 59,400 | | Capital One Financial Corp. | 2,839,320 |
| | Personnel Agency – 0.1% | |
| 1,600 | | Manpower, Inc. | 80,832 |
| | Pollution Control – 1.1% | |
| 26,300 | | Danaher Corp. | 1,291,593 |
| | Poultry Products – 0.1% | |
| 9,300 | | Tyson Foods, Inc., Class A | 163,308 |
| | Printed Circuit Boards – 0.0% | |
| 4,200 | 1 | Sanmina-SCI Corp. | 47,880 |
| | Property Liability Insurance – 0.1% | |
| 1,700 | | RLI Corp. | 107,355 |
| | Railroad – 0.4% | |
| 3,100 | 1 | Genesee & Wyoming, Inc., Class A | 170,624 |
| 5,500 | 1 | Kansas City Southern Industries, Inc. | 326,425 |
| | TOTAL | 497,049 |
| | Regional Banks – 5.3% | |
| 13,100 | | Associated Banc-Corp. | 178,815 |
| 8,500 | | BB&T Corp. | 218,280 |
| 100 | | Cathay Bancorp, Inc. | 1,386 |
| 5,700 | | Comerica, Inc. | 182,571 |
| 33,300 | | Huntington Bancshares, Inc. | 201,299 |
| 52,600 | | KeyCorp | 422,904 |
| 37,800 | | PNC Financial Services Group | 2,052,162 |
| 5,600 | | SunTrust Banks, Inc. | 137,144 |
Annual Shareholder Report25
| Shares | | | Value |
| 64,300 | | Wells Fargo & Co. | 1,796,542 |
| 48,500 | | Zions Bancorp | 1,062,150 |
| | TOTAL | 6,253,253 |
| | Restaurants – 1.1% | |
| 2,500 | 1 | BJ's Restaurants, Inc. | 115,925 |
| 1,200 | 1 | Buffalo Wild Wings, Inc. | 76,236 |
| 3,100 | 1 | Chipotle Mexican Grill, Inc. | 1,006,198 |
| 1,100 | 1 | Panera Bread Co. | 126,841 |
| | TOTAL | 1,325,200 |
| | Savings & Loan – 0.7% | |
| 68,900 | | People's United Financial, Inc. | 873,652 |
| | Securities Brokerage – 0.0% | |
| 2,800 | 1 | E*Trade Group, Inc. | 44,464 |
| | Semiconductor Distribution – 1.8% | |
| 32,113 | 1 | Arrow Electronics, Inc. | 1,115,927 |
| 34,015 | 1 | Avnet, Inc. | 996,639 |
| | TOTAL | 2,112,566 |
| | Semiconductor Manufacturing – 0.3% | |
| 5,100 | 1 | IPG Photonics Corp. | 306,969 |
| | Services to Medical Professionals – 3.5% | |
| 7,100 | | Aetna, Inc. | 294,579 |
| 2,300 | 1 | Coventry Health Care, Inc. | 73,600 |
| 10,300 | | Humana, Inc. | 768,174 |
| 5,400 | | Quest Diagnostics, Inc. | 291,654 |
| 27,900 | | UnitedHealth Group, Inc. | 1,384,677 |
| 18,473 | 1 | Wellpoint, Inc. | 1,247,851 |
| | TOTAL | 4,060,535 |
| | Shoes – 0.3% | |
| 3,800 | 1 | Deckers Outdoor Corp. | 377,150 |
| | Silver Production – 0.1% | |
| 2,700 | 1 | Coeur d'Alene Mines Corp. | 73,683 |
| | Soft Drinks – 0.6% | |
| 5,300 | | Coca-Cola Enterprises, Inc. | 148,983 |
| 13,800 | | Dr. Pepper Snapple Group, Inc. | 521,088 |
| | TOTAL | 670,071 |
| | Software Packaged/Custom – 1.4% | |
| 7,000 | | CA, Inc. | 156,100 |
| 3,400 | | Computer Sciences Corp. | 119,952 |
Annual Shareholder Report26
| Shares | | | Value |
| 1,200 | 1 | F5 Networks, Inc. | 112,176 |
| 6,200 | 1 | Informatica Corp. | 317,006 |
| 6,200 | 1 | Red Hat, Inc. | 260,896 |
| 6,400 | 1 | Symantec Corp. | 121,984 |
| 5,900 | 1 | VMware, Inc., Class A | 592,006 |
| | TOTAL | 1,680,120 |
| | Specialty Chemicals – 0.3% | |
| 2,500 | | Airgas, Inc. | 171,750 |
| 2,300 | | Ashland, Inc. | 140,852 |
| 200 | | Cabot Corp. | 7,820 |
| 2,200 | 1 | OM Group, Inc. | 79,816 |
| | TOTAL | 400,238 |
| | Specialty Machinery – 0.5% | |
| 7,500 | | Gardner Denver, Inc. | 639,675 |
| | Specialty Retailing – 3.0% | |
| 3,300 | | Abercrombie & Fitch Co., Class A | 241,296 |
| 2,100 | | Advance Auto Parts, Inc. | 115,437 |
| 2,200 | 1 | AutoNation, Inc. | 82,742 |
| 1,600 | 1 | Big Lots, Inc. | 55,728 |
| 63,087 | | CVS Caremark Corp. | 2,293,212 |
| 4,600 | 1 | Dollar General Corp. | 144,716 |
| 3,600 | | PetSmart, Inc. | 154,872 |
| 6,300 | | Staples, Inc. | 101,178 |
| 3,900 | 1 | Vera Bradley, Inc. | 141,453 |
| 2,000 | 1 | Vitamin Shoppe Industries, Inc. | 87,120 |
| 2,500 | | Williams-Sonoma, Inc. | 92,550 |
| | TOTAL | 3,510,304 |
| | Telecommunication Equipment & Services – 0.9% | |
| 11,000 | | Motorola, Inc. | 493,790 |
| 10,600 | | Qualcomm, Inc. | 580,668 |
| | TOTAL | 1,074,458 |
| | Truck Manufacturing – 0.1% | |
| 2,400 | 1 | Navistar International Corp. | 123,144 |
| | Undesignated Consumer Cyclicals – 0.2% | |
| 1,900 | 1 | Apollo Group, Inc., Class A | 96,577 |
| 1,000 | 1 | ITT Educational Services, Inc. | 85,670 |
| | TOTAL | 182,247 |
Annual Shareholder Report27
| Shares | | | Value |
| | Undesignated Health – 0.1% | |
| 2,200 | 1 | Cerner Corp. | 146,278 |
| | Uniforms – 0.1% | |
| 2,900 | | Cintas Corp. | 94,395 |
| | TOTAL COMMON STOCKS
(IDENTIFIED COST $109,076,616) | 115,867,065 |
| | MUTUAL FUND – 1.7% | |
| 2,027,952 | 2,3 | Federated Prime Value Obligations Fund, Institutional Shares, 0.13%
(AT NET ASSET VALUE) | 2,027,952 |
| | TOTAL INVESTMENTS — 100.3%
(IDENTIFIED COST $111,104,568)4 | 117,895,017 |
| | OTHER ASSETS AND LIABILITIES - NET — (0.3)%5 | (369,466) |
| | TOTAL NET ASSETS — 100% | $117,525,551 |
| 1 | Non-income producing security. |
| 2 | Affiliated holding. |
| 3 | 7-Day net yield. |
| 4 | The cost of investments for federal tax purposes amounts to $111,359,896. |
| 5 | Assets, other than investments in securities, less liabilities. See Statement of Assets and Liabilities. |
Note: The categories of investments are shown as a percentage of total net assets at July 31, 2011.
Various inputs are used in determining the value of the Fund's investments. These inputs are summarized in the three broad levels listed below:
Level 1 — quoted prices in active markets for identical securities. Including investment companies with daily net asset values, if applicable.
Level 2 — other significant observable inputs (including quoted prices for similar securities, interest rates, prepayment speeds, credit risk, etc.). Also includes securities valued at amortized cost.
Level 3 — significant unobservable inputs (including the Fund's own assumptions in determining the fair value of investments).
The inputs or methodology used for valuing securities are not an indication of the risk associated with investing in those securities.
As of July 31, 2011, all investments of the Fund utilized Level 1 inputs in valuing the Fund's assets carried at fair value.
See Notes which are an integral part of the Financial Statements
Annual Shareholder Report28
Statement of Assets and Liabilities
July 31, 2011
| Assets: | | |
| Total investments in securities, at value including $2,027,952 of investments in an affiliated holding (Note 5) (identified cost $111,104,568) | | $117,895,017 |
| Income receivable | | 148,533 |
| Receivable for investments sold | | 3,264,613 |
| Receivable for shares sold | | 80,558 |
| TOTAL ASSETS | | 121,388,721 |
| Liabilities: | | |
| Payable for investments purchased | $3,256,416 | |
| Payable for shares redeemed | 433,931 | |
| Payable for distribution services fee (Note 5) | 22,282 | |
| Payable for shareholder services fee (Note 5) | 22,259 | |
| Accrued expenses | 128,282 | |
| TOTAL LIABILITIES | | 3,863,170 |
| Net assets for 9,455,596 shares outstanding | | $117,525,551 |
| Net Assets Consist of: | | |
| Paid-in capital | | $241,427,353 |
| Net unrealized appreciation of investments | | 6,790,449 |
| Accumulated net realized loss on investments | | (130,759,964) |
| Undistributed net investment income | | 67,713 |
| TOTAL NET ASSETS | | $117,525,551 |
Annual Shareholder Report29
Statement of Assets and Liabilities — continued| Net Asset Value, Offering Price and Redemption Proceeds Per Share | | |
| Class A Shares: | | |
| Net asset value per share ($40,226,928 ÷ 3,222,813 shares outstanding), no par value, unlimited shares authorized | | $12.48 |
| Offering price per share (100/94.50 of $12.48) | | $13.21 |
| Redemption proceeds per share | | $12.48 |
| Class C Shares: | | |
| Net asset value per share ($31,128,503 ÷ 2,569,156 shares outstanding), no par value, unlimited shares authorized | | $12.12 |
| Offering price per share | | $12.12 |
| Redemption proceeds per share (99.00/100 of $12.12) | | $12.00 |
| Class R Shares: | | |
| Net asset value per share ($2,972,809 ÷ 239,062 shares outstanding), no par value, unlimited shares authorized | | $12.44 |
| Offering price per share | | $12.44 |
| Redemption proceeds per share | | $12.44 |
| Institutional Shares: | | |
| Net asset value per share ($43,197,311 ÷ 3,424,565 shares outstanding), no par value, unlimited shares authorized | | $12.61 |
| Offering price per share | | $12.61 |
| Redemption proceeds per share | | $12.61 |
See Notes which are an integral part of the Financial Statements
Annual Shareholder Report30
Statement of Operations
Year Ended July 31, 2011
| Investment Income: | | | |
| Dividends (including $3,710 received from an affiliated holding (Note 5)) | | | $1,999,327 |
| Expenses: | | | |
| Investment adviser fee (Note 5) | | $974,363 | |
| Administrative fee (Note 5) | | 270,000 | |
| Custodian fees | | 14,415 | |
| Transfer and dividend disbursing agent fees and expenses (Note 2) | | 288,349 | |
| Directors'/Trustees' fees | | 3,175 | |
| Auditing fees | | 22,579 | |
| Legal fees | | 6,848 | |
| Portfolio accounting fees | | 78,671 | |
| Distribution services fee (Note 5) | | 285,669 | |
| Shareholder services fee (Note 5) | | 205,654 | |
| Account administration fee (Note 2) | | 272 | |
| Share registration costs | | 61,392 | |
| Printing and postage | | 50,887 | |
| Insurance premiums | | 4,399 | |
| Miscellaneous | | 6,902 | |
| TOTAL EXPENSES | | 2,273,575 | |
| Waivers and Reimbursements: | | | |
| Waiver/reimbursement of investment adviser fee (Note 5) | $(194,280) | | |
| Waiver of administrative fee (Note 5) | (53,699) | | |
| Reimbursement of transfer and dividend disbursing agent fees and expenses (Note 2) | (94,755) | | |
| TOTAL WAIVERS AND REIMBURSEMENTS | | (342,734) | |
| Net expenses | | | 1,930,841 |
| Net investment income | | | 68,486 |
| Realized and Unrealized Gain on Investments: | | | |
| Net realized gain on investments | | | 21,524,570 |
| Net change in unrealized appreciation of investments | | | 824,024 |
| Net realized and unrealized gain on investments | | | 22,348,594 |
| Change in net assets resulting from operations | | | $22,417,080 |
See Notes which are an integral part of the Financial Statements
Annual Shareholder Report31
Statement of Changes in Net Assets
| Year Ended July 31 | 2011 | 2010 |
| Increase (Decrease) in Net Assets | | |
| Operations: | | |
| Net investment income | $68,486 | $472,044 |
| Net realized gain on investments | 21,524,570 | 19,644,910 |
| Net change in unrealized appreciation/depreciation of investments | 824,024 | (6,201,601) |
| CHANGE IN NET ASSETS RESULTING FROM OPERATIONS | 22,417,080 | 13,915,353 |
| Distributions to Shareholders: | | |
| Distributions from net investment income | | |
| Class A Shares | (193,416) | (583,973) |
| Class C Shares | — | (6,025) |
| Class R Shares | (1,842) | (12,200) |
| Institutional Shares | (276,596) | (533,214) |
| CHANGE IN NET ASSETS RESULTING FROM DISTRIBUTIONS TO SHAREHOLDERS | (471,854) | (1,135,412) |
| Share Transactions: | | |
| Proceeds from sale of shares | 22,465,156 | 19,532,139 |
| Proceeds from shares issued in connection with the tax-free transfer of assets from Federated MDT Tax Aware/All Cap Core Fund | — | 10,496,720 |
| Net asset value of shares issued to shareholders in payment of distributions declared | 434,830 | 1,068,819 |
| Cost of shares redeemed | (65,538,863) | (92,070,876) |
| CHANGE IN NET ASSETS RESULTING FROM SHARE TRANSACTIONS | (42,638,877) | (60,973,198) |
| Change in net assets | (20,693,651) | (48,193,257) |
| Net Assets: | | |
| Beginning of period | 138,219,202 | 186,412,459 |
| End of period (including undistributed net investment income of $67,713 and $471,081, respectively) | $117,525,551 | $138,219,202 |
See Notes which are an integral part of the Financial Statements
Annual Shareholder Report32
Notes to Financial Statements
July 31, 2011
1. ORGANIZATION
Federated MDT Series (the “Trust”) is registered under the Investment Company Act of 1940, as amended (the “Act”), as an open-end management investment company. The Trust consists of five portfolios. The financial statements included herein are only those of Federated MDT All Cap Core Fund (the “Fund”), a diversified portfolio. The financial statements of the other portfolios are presented separately. The assets of each portfolio are segregated and a shareholder's interest is limited to the portfolio in which shares are held. Each portfolio pays its own expenses. The Fund offers four classes of shares: Class A Shares, Class C Shares, Class R Shares and Institutional Shares. All shares of the Fund have equal rights with respect to voting, except on class-specific matters. The investment objective of the Fund is long-term capital appreciation.
Effective December 31, 2010, Class K Shares were renamed Class R Shares.
On March 19, 2010, the Fund acquired all of the net assets of Federated MDT Tax Aware/All Cap Core Fund (the “Acquired Fund”), an open-end investment company, in a tax-free reorganization in exchange for shares of the Fund, pursuant to a plan of reorganization approved by the Acquired Fund's shareholders on March 12, 2010. The purpose of the transaction was to combine two portfolios managed by Federated MDTA LLC with comparable investment objectives and strategies. For financial reporting purposes, assets received and shares issued by the Fund were recorded at fair value; however, the cost basis of the investments received from the Acquired Fund was carried forward to align ongoing reporting of the Fund's realized and unrealized gains and losses with amounts distributable to shareholders for tax purposes.
Assuming the acquisition had been completed on August 1, 2009, the beginning of the annual reporting period of the Fund, the Fund's pro forma results of operations for the year ended July 31, 2010, are as follows:
| Net investment income* | $501,149 |
| Net realized and unrealized gain (loss) on investments | $15,467,610 |
| Net increase in net assets resulting from operations | $15,968,759 |
| * | Net investment income includes $26,049 of pro forma eliminated expenses. |
Because the combined investment portfolios have been managed as a single integrated portfolio since the acquisition was completed, it is not practicable to separate the amounts of revenue and earnings of the Acquired Fund that has been included in the Fund's Statement of Operations since March 19, 2010. The Fund received net assets from the Acquired Fund as the result of the tax-free reorganization as follows:
Shares of the
Fund Issued | Acquired Fund
Net Assets
Received | Unrealized
Appreciation1 | Net Assets
of the Fund
Immediately
Prior to
Combination | Net Assets
of the Fund
Immediately
After Combination |
| 922,522 | $10,496,720 | $1,330,038 | $165,493,416 | $175,990,136 |
| 1 | Unrealized Appreciation is included in the Acquired Fund Net Assets Received amount shown above. |
Annual Shareholder Report33
2. SIGNIFICANT ACCOUNTING POLICIES
The following is a summary of significant accounting policies consistently followed by the Fund in the preparation of its financial statements. These policies are in conformity with U.S. generally accepted accounting principles (GAAP).
Investment Valuation
In calculating its net asset value (NAV), the Fund generally values investments as follows:
- Equity securities listed on an exchange or traded through a regulated market system are valued at their last reported sale price or official closing price in their principal exchange or market.
- Shares of other mutual funds are valued based upon their reported NAVs.
- Fixed-income securities acquired with remaining maturities greater than 60 days are fair valued using price evaluations provided by a pricing service approved by the Board of Trustees (the “Trustees”).
- Fixed-income securities acquired with remaining maturities of 60 days or less are valued at their cost (adjusted for the accretion of any discount or amortization of any premium), which approximates market value.
- Derivative contracts listed on exchanges are valued at their reported settlement or closing price.
- Over-the-counter (OTC) derivative contracts are fair valued using price evaluations provided by a pricing service approved by the Trustees.
- For securities that are fair valued in accordance with procedures established by and under the general supervision of the Trustees, certain factors may be considered such as: the purchase price of the security, information obtained by contacting the issuer, analysis of the issuer's financial statements or other available documents, fundamental analytical data, the nature and duration of restrictions on disposition, the movement of the market in which the security is normally traded and public trading in similar securities of the issuer or comparable issuers.
If the Fund cannot obtain a price or price evaluation from a pricing service for an investment, the Fund may attempt to value the investment based upon the mean of bid and asked quotations or fair value the investment based on price evaluations, from one or more dealers. If any price, quotation, price evaluation or other pricing source is not readily available when the NAV is calculated, the Fund uses the fair value of the investment determined in accordance with the procedures described below. There can be no assurance that the Fund could purchase or sell an investment at the price used to calculate the Fund's NAV.
Fair Valuation and Significant Events Procedures
The Trustees have authorized the use of pricing services to provide evaluations of the current fair value of certain investments for purposes of calculating the NAV. Factors considered by pricing services in evaluating an investment include the yields or prices of investments of comparable quality, coupon, maturity, call rights and other potential prepayments, terms and type, reported transactions, indications as to values from dealers and general market conditions. Some pricing services provide a single price evaluation reflecting the bid-side of the market for an investment (a “bid” evaluation). Other pricing services offer both bid evaluations and price evaluations indicative of a price between the prices bid and asked for the investment (a “mid” evaluation). The Fund normally uses bid evaluations for U.S. Treasury and Agency securities, mortgage-backed securities and municipal securities. The Fund Annual Shareholder Report
34
normally uses mid evaluations for other types of fixed-income securities and OTC derivative contracts. In the event that market quotations and price evaluations are not available for an investment, the fair value of the investment is determined in accordance with procedures adopted by the Trustees.The Trustees also have adopted procedures requiring an investment to be priced at its fair value whenever the Adviser determines that a significant event affecting the value of the investment has occurred between the time as of which the price of the investment would otherwise be determined and the time as of which the NAV is computed. An event is considered significant if there is both an affirmative expectation that the investment's value will change in response to the event and a reasonable basis for quantifying the resulting change in value. Examples of significant events that may occur after the close of the principal market on which a security is traded, or after the time of a price evaluation provided by a pricing service or a dealer, include:
- With respect to securities traded in foreign markets, significant trends in U.S. equity markets or in the trading of foreign securities index futures or options contracts;
- With respect to price evaluations of fixed-income securities determined before the close of regular trading on the NYSE, actions by the Federal Reserve Open Market Committee and other significant trends in U.S. fixed-income markets;
- Political or other developments affecting the economy or markets in which an issuer conducts its operations or its securities are traded; and
- Announcements concerning matters such as acquisitions, recapitalizations, litigation developments, a natural disaster affecting the issuer's operations or regulatory changes or market developments affecting the issuer's industry.
The Trustees have approved the use of a pricing service to determine the fair value of equity securities traded principally in foreign markets when the Adviser determines that there has been a significant trend in the U.S. equity markets or in index futures trading. For other significant events, the Fund may seek to obtain more current quotations or price evaluations from alternative pricing sources. If a reliable alternative pricing source is not available, the Fund will determine the fair value of the investment using another method approved by the Trustees.
Repurchase Agreements
The Fund may invest in repurchase agreements for short-term liquidity purposes. It is the policy of the Fund to require the other party to a repurchase agreement to transfer to the Fund's custodian or sub-custodian eligible securities or cash with a market value (after transaction costs) at least equal to the repurchase price to be paid under the repurchase agreement. The eligible securities are transferred to accounts with the custodian or sub-custodian in which the Fund holds a “securities entitlement” and exercises “control” as those terms are defined in the Uniform Commercial Code. The Fund has established procedures for monitoring the market value of the transferred securities and requiring the transfer of additional eligible securities if necessary to equal at least the repurchase price. These procedures also allow the other party to require securities to be transferred from the account to the extent that their market value exceeds the repurchase price or in exchange for other eligible securities of equivalent market value.
The insolvency of the other party or other failure to repurchase the securities may delay the disposition of the underlying securities or cause the Fund to receive less than the full repurchase price. Under the terms of the repurchase agreement, any amounts received by the Fund in excess of the repurchase price and related transaction costs must be remitted to the other party.
Annual Shareholder Report
35
The Fund may enter into repurchase agreements in which eligible securities are transferred into joint trading accounts maintained by the custodian or sub-custodian for investment companies and other clients advised by the Fund's Adviser and its affiliates. The Fund will participate on a pro rata basis with the other investment companies and clients in its share of the securities transferred under such repurchase agreements and in its share of proceeds from any repurchase or other disposition of such securities.Investment Income, Gains and Losses, Expenses and Distributions
Investment transactions are accounted for on a trade-date basis. Realized gains and losses from investment transactions are recorded on an identified-cost basis. Interest income and expenses are accrued daily. Dividend income and distributions to shareholders are recorded on the ex-dividend date. Foreign dividends are recorded on the ex-dividend date or when the Fund is informed of the ex-dividend date. Distributions of net investment income are declared and paid annually. Non-cash dividends included in dividend income, if any, are recorded at fair value. Investment income, realized and unrealized gains and losses, and certain fund-level expenses are allocated to each class based on relative average daily net assets, except that Class A Shares, Class C Shares, Class R Shares and Institutional Shares may bear distribution services fees, shareholder services fees, account administration fees and certain transfer and dividend disbursing agent fees unique to those classes. For the year ended July 31, 2011, transfer and dividend disbursing agent fees and account administration fees for the Fund were as follows:
| Transfer and
Dividend
Disbursing
Agent Fees
Incurred | Transfer and
Dividend
Disbursing
Agent Fees
Reimbursed | Account
Administration
Fees Incurred |
| Class A Shares | $126,207 | $(58,223) | $272 |
| Class C Shares | 99,117 | $(35,141) | — |
| Class R Shares | 10,394 | — | — |
| Institutional Shares | 52,631 | (1,391) | — |
| TOTAL | $288,349 | $(94,755) | $272 |
Dividends are declared separately for each class. No class has preferential dividend rights; differences in per share dividend rates are generally due to differences in separate class expenses.
Premium and Discount Amortization
All premiums and discounts on fixed-income securities are amortized/accreted using the effective interest rate method.
Federal Taxes
It is the Fund's policy to comply with the Subchapter M provision of the Internal Revenue Code (the “Code”) and to distribute to shareholders each year substantially all of its income. Accordingly, no provision for federal income tax is necessary. As of and during the year ended July 31, 2011, the Fund did not have a liability for any uncertain tax positions. The Fund recognizes interest and penalties, if any, related to tax liabilities as income tax expense in the Statement of Operations. As of July 31, 2011, tax years 2008 through 2011 remain subject to examination by the Fund's major tax jurisdictions, which include the United States of America and the Commonwealth of Massachusetts.
Annual Shareholder Report
36
The Fund may be subject to taxes imposed by governments of countries in which it invests. Such taxes are generally based on either income or gains earned or repatriated. The Fund accrues and applies such taxes to net investment income, net realized gains and net unrealized gains as income and/or gains are earned.When-Issued and Delayed Delivery Transactions
The Fund may engage in when-issued or delayed delivery transactions. The Fund records when-issued securities on the trade date and maintains security positions such that sufficient liquid assets will be available to make payment for the securities purchased. Securities purchased on a when-issued or delayed delivery basis are marked to market daily and begin earning interest on the settlement date. Losses may occur on these transactions due to changes in market conditions or the failure of counterparties to perform under the contract.
Other
The preparation of financial statements in conformity with GAAP requires management to make estimates and assumptions that affect the amounts of assets, liabilities, expenses and revenues reported in the financial statements. Actual results could differ from those estimated.
3. SHARES OF BENEFICIAL INTEREST
The following tables summarize share activity:
| Year Ended July 31 | 2011 | 2010 |
| Class A Shares: | Shares | Amount | Shares | Amount |
| Shares sold | 328,142 | $4,029,120 | 733,878 | $7,913,380 |
| Proceeds from shares issued in connection with the tax-free transfer of assets from Federated MDT Tax Aware/All Cap Core Fund | — | — | 412,781 | 4,701,779 |
| Shares issued to shareholders in payment of distributions declared | 15,294 | 183,529 | 50,820 | 561,556 |
| Shares redeemed | (2,285,365) | (27,236,700) | (4,301,121) | (46,491,567) |
NET CHANGE RESULTING
FROM CLASS A
SHARE TRANSACTIONS | (1,941,929) | $(23,024,051) | (3,103,642) | $(33,314,852) |
| Year Ended July 31 | 2011 | 2010 |
| Class C Shares: | Shares | Amount | Shares | Amount |
| Shares sold | 355,709 | $4,287,880 | 432,751 | $4,549,627 |
| Proceeds from shares issued in connection with the tax-free transfer of assets from Federated MDT Tax Aware/All Cap Core Fund | — | — | 180,943 | 2,013,838 |
| Shares issued to shareholders in payment of distributions declared | — | — | 481 | 5,204 |
| Shares redeemed | (1,633,873) | (18,969,226) | (2,207,745) | (23,182,102) |
NET CHANGE RESULTING
FROM CLASS C
SHARE TRANSACTIONS | (1,278,164) | $(14,681,346) | (1,593,570) | $(16,613,433) |
Annual Shareholder Report37
| Year Ended July 31 | 2011 | 2010 |
| Class R Shares: | Shares | Amount | Shares | Amount |
| Shares sold | 125,054 | $1,537,837 | 122,279 | $1,312,548 |
| Shares issued to shareholders in payment of distributions declared | 153 | 1,842 | 1,102 | 12,185 |
| Shares redeemed | (104,836) | (1,281,271) | (100,223) | (1,089,383) |
NET CHANGE RESULTING
FROM CLASS R
SHARE TRANSACTIONS | 20,371 | $258,408 | 23,158 | $235,350 |
| Year Ended July 31 | 2011 | 2010 |
| Institutional Shares: | Shares | Amount | Shares | Amount |
| Shares sold | 971,643 | $12,610,319 | 521,586 | $5,756,584 |
| Proceeds from shares issued in connection with the tax-free transfer of assets from Federated MDT Tax Aware/All Cap Core Fund | — | — | 328,798 | 3,781,103 |
| Shares issued to shareholders in payment of distributions declared | 20,599 | 249,459 | 43,895 | 489,874 |
| Shares redeemed | (1,504,407) | (18,051,666) | (1,951,339) | (21,307,824) |
NET CHANGE RESULTING
FROM INSTITUTIONAL
SHARE TRANSACTIONS | (512,165) | $(5,191,888) | (1,057,060) | $(11,280,263) |
NET CHANGE RESULTING
FROM TOTAL FUND
SHARE TRANSACTIONS | (3,711,887) | $(42,638,877) | (5,731,114) | $(60,973,198) |
4. FEDERAL TAX INFORMATION
The tax character of distributions as reported on the Statement of Changes in Net Assets for the years ended July 31, 2011 and 2010, was as follows:
| 2011 | 2010 |
| Ordinary income | $471,854 | $1,135,412 |
As of July 31, 2011, the components of distributable earnings on a tax basis were as follows:
| Undistributed ordinary income | $67,713 |
| Net unrealized appreciation | $6,535,121 |
| Capital loss carryforwards | $(130,504,636) |
The difference between book-basis and tax-basis net unrealized appreciation/depreciation is attributable to differing treatments for the deferral of losses on wash sales.
At July 31, 2011, the cost of investments for federal tax purposes was $111,359,896. The net unrealized appreciation of investments for federal tax purposes was $6,535,121. This consists of net unrealized appreciation from investments for those securities having an excess of value over cost of $9,883,180 and net unrealized depreciation from investments for those securities having an excess of cost over value of $3,348,059.
Annual Shareholder Report
38
At July 31, 2011, the Fund had a capital loss carryforward of $130,504,636 which will reduce the Fund's taxable income arising from future net realized gains on investments, if any, to the extent permitted by the Code and thus will reduce the amount of distributions to shareholders which would otherwise be necessary to relieve the Fund of any liability for federal income tax. Pursuant to the Code, such capital loss carryforward will expire as follows:| Expiration Year | Expiration Amount |
| 2016 | $436,199 |
| 2017 | $60,477,556 |
| 2018 | $69,590,881 |
Under the recently enacted Regulated Investment Company Modernization Act of 2010, the Fund will be permitted to carry forward capital losses incurred in taxable years beginning after December 22, 2010, for an unlimited period. However, any losses incurred during those future years will be required to be utilized prior to the losses incurred in pre-enactment tax years. As a result of this ordering rule, pre-enactment capital loss carryforwards may be more likely to expire unused. Additionally, post-enactment capital losses that are carried forward will retain their character as either short-term or long-term capital losses rather than being considered all short-term as under previous law.
As a result of the tax-free transfer of assets from Federated MDT Tax Aware/All Cap Core Fund, the utilization of certain capital loss carryforwards listed above may be limited.
The Fund used capital loss carryforwards of $21,309,275 to offset taxable capital gains realized during the year ended July 31, 2011.
5. INVESTMENT ADVISER FEE AND OTHER TRANSACTIONS WITH AFFILIATES
Investment Adviser Fee
Federated MDTA LLC is the Fund's investment adviser (the “Adviser”). The advisory agreement between the Fund and the Adviser provides for an annual fee equal to 0.75% of the Fund's average daily net assets. Subject to the terms described in the Expense Limitation note, the Adviser may voluntarily choose to waive any portion of its fee. For the year ended July 31, 2011, the Adviser waived $192,149 of its fee.
Administrative Fee
Federated Administrative Services (FAS), under the Administrative Services Agreement, provides the Fund with administrative personnel and services. The fee paid to FAS is based on the average aggregate daily net assets of certain Federated funds as specified below:
| Administrative Fee | Average Aggregate Daily Net Assets
of the Federated Funds |
| 0.150% | on the first $5 billion |
| 0.125% | on the next $5 billion |
| 0.100% | on the next $10 billion |
| 0.075% | on assets in excess of $20 billion |
Annual Shareholder Report39
The administrative fee received during any fiscal year shall be at least $150,000 per portfolio and $40,000 per each additional class of Shares. Subject to the terms described in the Expense Limitation note, FAS may voluntarily choose to waive any portion of its fee. For the year ended July 31, 2011, FAS waived $53,699 of its fee. The net fee paid to FAS was 0.166% of average daily net assets of the Fund. The Fund is currently being charged the minimum administrative fee; therefore the fee as a percentage of average daily net assets is greater than the amounts presented in the chart above.
Distribution Services Fee
The Fund has adopted a Distribution Plan (the “Plan”) pursuant to Rule 12b-1 under the Act. Under the terms of the Plan, the Fund will compensate Federated Securities Corp. (FSC), the principal distributor, from the daily net assets of the Fund's Class A Shares, Class C Shares and Class R Shares to finance activities intended to result in the sale of these shares. The Plan provides that the Fund may incur distribution expenses at the following percentages of average daily net assets annually, to compensate FSC:
| Share Class Name | Percentage of Average Daily
Net Assets of Class |
| Class A Shares | 0.05% |
| Class C Shares | 0.75% |
| Class R Shares | 0.50% |
Subject to the terms described in the Expense Limitation note, FSC may voluntarily choose to waive any portion of its fee. For the year ended July 31, 2011, distribution services fees for the Fund were as follows:
| Distribution Services
Fees Incurred |
| Class C Shares | $271,582 |
| Class R Shares | 14,087 |
| TOTAL | $285,669 |
When FSC receives fees, it may pay some or all of them to financial intermediaries whose customers purchase shares. For the year ended July 31, 2011, FSC retained $14,310 of fees paid by the Fund. For the year ended July 31, 2011, the Fund's Class A Shares did not incur a distribution services fee; however, it may begin to incur this fee upon approval of the Trustees.
Annual Shareholder Report
40
Sales ChargesFront-end sales charges and contingent deferred sales charges do not represent expenses of the Fund. They are deducted from the proceeds of sales of Fund shares prior to investment or from redemption proceeds prior to remittance, as applicable. For the year ended July 31, 2011, FSC retained $2,667 in sales charges from the sale of Class A Shares. FSC also retained $169 of CDSC relating to redemptions of Class C Shares.
Shareholder Services Fee
The Fund may pay fees (“Service Fees”) up to 0.25% of the average daily net assets of the Fund's Class A Shares and Class C Shares to financial intermediaries or to Federated Shareholder Services Company (FSSC) for providing services to shareholders and maintaining shareholder accounts. Subject to the terms described in the Expense Limitation note, FSSC may voluntarily reimburse the Fund for Service Fees. For the year ended July 31, 2011, Service Fees for the Fund were as follows:
| Service
Fees
Incurred |
| Class A Shares | $115,127 |
| Class C Shares | 90,527 |
| TOTAL | $205,654 |
For the year ended July 31, 2011, FSSC did not receive any fees paid by the Fund.
Expense Limitation
The Adviser and its affiliates (which may include FSC, FAS and FSSC) have voluntarily agreed to waive their fees and/or reimburse expenses so that the total annual fund operating expenses (as shown in the financial highlights) paid by the Fund's Class A Shares, Class C Shares, Class R Shares and Institutional Shares (after the voluntary waivers and reimbursements) will not exceed 1.35%, 2.15%, 1.85% and 1.10% (the “Fee Limit”), respectively, up to but not including the later of (the “Termination Date”): (a) October 1, 2012; or (b) the date of the Fund's next effective Prospectus. While the Adviser and its affiliates currently do not anticipate terminating or increasing these arrangements prior to the Termination Date, these arrangements may only be terminated or the Fee Limit increased prior to the Termination Date with the agreement of the Trustees.
General
Certain Officers and Trustees of the Trust are Officers and Directors or Trustees of the above companies.
Annual Shareholder Report
41
Transactions Involving Affiliated HoldingsAffiliated holdings are mutual funds which are managed by the Adviser or an affiliate of the Adviser. The Adviser has agreed to reimburse the Fund for certain investment adviser fees as a result of transactions in other affiliated mutual funds. For the year ended July 31, 2011, the Adviser reimbursed $2,131. Transactions involving the affiliated holding during the year ended July 31, 2011, were as follows:
| Federated
Prime Value
Obligations Fund,
Institutional Shares |
| Balance of Shares Held 7/31/2010 | 2,091,556 |
| Purchases/Additions | 48,744,440 |
| Sales/Reductions | 48,808,044 |
| Balance of Shares Held 7/31/2011 | 2,027,952 |
| Value | $2,027,952 |
| Dividend Income | $3,710 |
6. Investment TRANSACTIONS
Purchases and sales of investments, excluding long-term U.S. government securities and short-term obligations, for the year ended July 31, 2011, were as follows:
| Purchases | $195,932,249 |
| Sales | $238,411,502 |
7. LINE OF CREDIT
The Fund participates in a $100,000,000 unsecured, uncommitted revolving line of credit (LOC) agreement with PNC Bank. The LOC was made available for extraordinary or emergency purposes, primarily for financing redemption payments. Borrowings are charged interest at a rate offered to the Fund by PNC Bank at the time of the borrowing. As of July 31, 2011, there were no outstanding loans. During the year ended July 31, 2011, the Fund did not utilize the LOC.
8. INTERFUND LENDING
Pursuant to an Exemptive Order issued by the Securities and Exchange Commission, the Fund, along with other funds advised by subsidiaries of Federated Investors, Inc., may participate in an interfund lending program. This program provides an alternative credit facility allowing the Fund to borrow from other participating affiliated funds. As of July 31, 2011, there were no outstanding loans. During the year ended July 31, 2011, the program was not utilized.
9. RECENT ACCOUNTING PRONOUNCEMENTS
In April 2011, the Financial Accounting Standards Board (FASB) released Accounting Standards Update (ASU) No. 2011-03, “Reconsideration of Effective Control for Repurchase Agreements.” This ASU amends FASB Accounting Standards Codification (ASC) Topic 860, “Transfers and Servicing,” specifically the criteria required to determine whether a repurchase agreement and similar agreements should be accounted for as sales of financial assets or Annual Shareholder Report
42
secured borrowings with commitments. This ASU is effective for fiscal years and interim periods beginning after December 15, 2011. At this time, management is evaluating the implications of adopting ASU No. 2011-03 and its impact on the Fund's financial statements and the accompanying notes.In addition, in May 2011, FASB released ASU No. 2011-04, “Amendments to Achieve Common Fair Value Measurement and Disclosure Requirements in U.S. GAAP and IFRSs.” This ASU amends FASB ASC Topic 820, “Fair Value Measurement,” to establish common requirements for measuring fair value and for disclosing information about fair value measurements in accordance with GAAP. This ASU is effective for fiscal years and interim periods beginning after December 15, 2011. At this time, management is evaluating the implications of adopting ASU No. 2011-04 and its impact on the Fund's financial statements and the accompanying notes.
10. FEDERAL TAX INFORMATION (UNAUDITED)
For the fiscal year ended July 31, 2011, 100% of total income distributions made by the Fund are qualifying dividends which may be subject to a maximum tax rate of 15%, as provided for by the Jobs and Growth Tax Relief Act of 2003. Complete information is reported in conjunction with the reporting of your distributions on Form 1099-DIV.
Of the ordinary income distributions made by the Fund during the year ended July 31, 2011, 100% qualify for the dividend received deduction available to corporate shareholders.
Annual Shareholder Report43
Report of Independent Registered Public Accounting Firm
TO THE BOARD OF trustees OF Federated MDt series AND SHAREHOLDERS OF federated mdt all cap core fund:
We have audited the accompanying statement of assets and liabilities of Federated MDT All Cap Core Fund (the “Fund”) (one of the portfolios constituting Federated MDT Series), including the portfolio of investments, as of July 31, 2011, and the related statement of operations for the year then ended, the statement of changes in net assets for each of the two years in the period then ended, and the financial highlights for each of the periods indicated therein. These financial statements and financial highlights are the responsibility of the Fund's management. Our responsibility is to express an opinion on these financial statements and financial highlights based on our audits.
We conducted our audits in accordance with standards of the Public Company Accounting Oversight Board (United States). Those standards require that we plan and perform the audit to obtain reasonable assurance about whether the financial statements and financial highlights are free of material misstatement. We were not engaged to perform an audit of the Fund's internal control over financial reporting. Our audits included consideration of internal control over financial reporting as a basis for designing audit procedures that are appropriate in the circumstances, but not for the purpose of expressing an opinion on the effectiveness of the Fund's internal control over financial reporting. Accordingly, we express no such opinion. An audit also includes examining, on a test basis, evidence supporting the amounts and disclosures in the financial statements and financial highlights, assessing the accounting principles used and significant estimates made by management, and evaluating the overall financial statement presentation. Our procedures included confirmation of securities owned as of July 31, 2011, by correspondence with the custodian and others, or by other appropriate auditing procedures where replies from others were not received. We believe that our audits provide a reasonable basis for our opinion.
In our opinion, the financial statements and financial highlights referred to above present fairly, in all material respects, the financial position of Federated MDT All Cap Core Fund, a portfolio of Federated MDT Series, at July 31, 2011, the results of its operations for the year then ended, the changes in its net assets for each of the two years in the period then ended, and the financial highlights for each of the periods indicated therein, in conformity with U.S. generally accepted accounting principles.
Boston, Massachusetts
September 23, 2011
Annual Shareholder Report44
Board of Trustees and Trust Officers
The Board of Trustees is responsible for managing the Trust's business affairs and for exercising all the Trust's powers except those reserved for the shareholders. The following tables give information about each Trustee and the senior officers of the Fund. Where required, the tables separately list Trustees who are “interested persons” of the Fund (i.e., “Interested” Trustees) and those who are not (i.e., “Independent” Trustees). Unless otherwise noted, the address of each person listed is Federated Investors Tower, 1001 Liberty Avenue, Pittsburgh, PA 15222. The address of all Independent Trustees listed is 4000 Ericsson Drive, Warrendale, PA 15086-7561; Attention: Mutual Fund Board. As of December 31, 2010, the Trust comprised five portfolio(s), and the Federated Fund Family consisted of 43 investment companies (comprising 136 portfolios). Unless otherwise noted, each Officer is elected annually. Unless otherwise noted, each Trustee oversees all portfolios in the Federated Fund Family and serves for an indefinite term. The Fund's Statement of Additional Information includes additional information about Trust Trustees and is available, without charge and upon request, by calling 1-800-341-7400.
Interested TRUSTEES Background
Name
Birth Date
Positions Held with Trust
Date Service Began | Principal Occupation(s) for Past Five Years,
Other Directorships Held and Previous Position(s) |
John F. Donahue*
Birth Date: July 28, 1924
Trustee
Began serving: June 2006 | Principal Occupations: Director or Trustee of the Federated Fund Family; Chairman and Director, Federated Investors, Inc.; Chairman of the Federated Fund Family's Executive Committee.
Previous Positions: Chairman of the Federated Fund Family; Trustee, Federated Investment Management Company; Chairman and Director, Federated Investment Counseling. |
J. Christopher Donahue*
Birth Date: April 11, 1949
President and Trustee
Began serving: May 2006 | Principal Occupations: Principal Executive Officer and President of the Federated Fund Family; Director or Trustee of some of the Funds in the Federated Fund Family; President, Chief Executive Officer and Director, Federated Investors, Inc.; Chairman and Trustee, Federated Investment Management Company; Trustee, Federated Investment Counseling; Chairman and Director, Federated Global Investment Management Corp.; Chairman, Federated Equity Management Company of Pennsylvania and Passport Research, Ltd. (investment advisory subsidiary of Federated); Trustee, Federated Shareholder Services Company; Director, Federated Services Company.
Previous Positions: President, Federated Investment Counseling; President and Chief Executive Officer, Federated Investment Management Company, Federated Global Investment Management Corp. and Passport Research, Ltd. |
| * | Family relationships and reasons for “interested” status: John F. Donahue is the father of J. Christopher Donahue; both are “interested” due to their beneficial ownership of shares of Federated Investors, Inc. and the positions they hold with Federated and its subsidiaries. |
Annual Shareholder Report45
INDEPENDENT TRUSTEES Background
Name
Birth Date
Positions Held with Trust
Date Service Began | Principal Occupation(s) for Past Five Years,
Other Directorships Held, Previous Position(s) and Qualifications |
Nicholas P. Constantakis, CPA
Birth Date: September 3, 1939
Trustee
Began serving: June 2006 | Principal Occupation: Director or Trustee of the Federated Fund Family.
Other Directorship Held: Director and Chairman of the Audit Committee, Michael Baker Corporation (architecture, engineering and construction services).
Previous Position: Partner, Andersen Worldwide SC.
Qualifications: Public accounting and director experience. |
John F. Cunningham
Birth Date: March 5, 1943
Trustee
Began serving: June 2006 | Principal Occupation: Director or Trustee of the Federated Fund Family.
Other Directorships Held: Chairman, President and Chief Executive Officer, Cunningham & Co., Inc. (strategic business consulting); Trustee Associate, Boston College.
Previous Positions: Director, Redgate Communications and EMC Corporation (computer storage systems); Chairman of the Board and Chief Executive Officer, Computer Consoles, Inc.; President and Chief Operating Officer, Wang Laboratories; Director, First National Bank of Boston; Director, Apollo Computer, Inc.
Qualifications: Business management and director experience. |
Maureen Lally-Green
Birth Date: July 5, 1949
Trustee
Began serving: August 2009 | Principal Occupations: Director or Trustee of the Federated Fund Family; Director, Office of Church Relations, Diocese of Pittsburgh; Adjunct Professor of Law, Duquesne University School of Law.
Other Directorships Held: Director, Auberle; Trustee, St. Francis University; Director, Ireland Institute of Pittsburgh; Director, UPMC Mercy Hospital; Regent, St. Vincent Seminary; Director, Epilepsy Foundation of Western and Central Pennsylvania; Director, Saint Thomas More Society, Allegheny County; Director, Carlow University.
Previous Position: Pennsylvania Superior Court Judge.
Qualifications: Legal and director experience. |
Peter E. Madden
Birth Date: March 16, 1942
Trustee
Began serving: June 2006 | Principal Occupation: Director or Trustee, and Chairman of the Board of Directors or Trustees, of the Federated Fund Family.
Previous Positions: Representative, Commonwealth of Massachusetts General Court; President, Chief Operating Officer and Director, State Street Bank and Trust Company and State Street Corporation (retired); Director, VISA USA and VISA International; Chairman and Director, Massachusetts Bankers Association; Director, Depository Trust Corporation; Director, The Boston Stock Exchange.
Qualifications: Business management, mutual fund services and director experience. |
Annual Shareholder Report46
Name
Birth Date
Positions Held with Trust
Date Service Began | Principal Occupation(s) for Past Five Years,
Other Directorships Held, Previous Position(s) and Qualifications |
Charles F. Mansfield, Jr.
Birth Date: April 10, 1945
Trustee
Began serving: June 2006 | Principal Occupations: Director or Trustee and Chairman of the Audit Committee of the Federated Fund Family; Management Consultant.
Previous Positions: Chief Executive Officer, PBTC International Bank; Partner, Arthur Young & Company (now Ernst & Young LLP); Chief Financial Officer of Retail Banking Sector, Chase Manhattan Bank; Senior Vice President, HSBC Bank USA (formerly, Marine Midland Bank); Vice President, Citibank; Assistant Professor of Banking and Finance, Frank G. Zarb School of Business, Hofstra University; Executive Vice President, DVC Group, Inc. (marketing, communications and technology).
Qualifications: Banking, business management, education and director experience. |
R. James Nicholson
Birth Date: February 4, 1938
Trustee
Began serving: January 2008 | Principal Occupations: Director or Trustee of the Federated Fund Family; Senior Counsel, Brownstein Hyatt Farber Schrek, P.C.; Former Secretary of the U.S. Dept. of Veterans Affairs; Former U.S. Ambassador to the Holy See; Former Chairman of the Republican National Committee.
Other Directorships Held: Director, Horatio Alger Association; Director, The Daniels Fund.
Previous Positions: Colonel, U.S. Army Reserve; Partner, Calkins, Kramer, Grimshaw and Harring, P.C.; General Counsel, Colorado Association of Housing and Building; Chairman and CEO, Nicholson Enterprises, Inc. (real estate holding company); Chairman and CEO, Renaissance Homes of Colorado.
Qualifications: Legal, government, business management and director experience. |
Thomas M. O'Neill
Birth Date: June 14, 1951
Trustee
Began serving: October 2006 | Principal Occupations: Director or Trustee of the Federated Fund Family; Sole Proprietor, Navigator Management Company (investment and strategic consulting).
Other Directorships Held: Board of Overseers, Children's Hospital of Boston; Visiting Committee on Athletics, Harvard College.
Previous Positions: Chief Executive Officer and President, Managing Director and Chief Investment Officer, Fleet Investment Advisors; President and Chief Executive Officer, Aeltus Investment Management, Inc.; General Partner, Hellman, Jordan Management Co., Boston, MA; Chief Investment Officer, The Putnam Companies, Boston, MA; Credit Analyst and Lending Officer, Fleet Bank; Director and Consultant, EZE Castle Software (investment order management software); Director, Midway Pacific (lumber).
Qualifications: Business management, mutual fund, director and investment experience. |
Annual Shareholder Report47
Name
Birth Date
Positions Held with Trust
Date Service Began | Principal Occupation(s) for Past Five Years,
Other Directorships Held, Previous Position(s) and Qualifications |
John S. Walsh
Birth Date: November 28, 1957
Trustee
Began serving: June 2006 | Principal Occupations: Director or Trustee of the Federated Fund Family; President and Director, Heat Wagon, Inc. (manufacturer of construction temporary heaters); President and Director, Manufacturers Products, Inc. (distributor of portable construction heaters); President, Portable Heater Parts, a division of Manufacturers Products, Inc.
Previous Position: Vice President, Walsh & Kelly, Inc.
Qualifications: Business management and director experience. |
James F. Will
Birth Date: October 12, 1938
Trustee
Began serving: June 2006 | Principal Occupations: Director or Trustee of the Federated Fund Family; formerly, Vice Chancellor and President, Saint Vincent College.
Other Directorships Held: Trustee, Saint Vincent College; Director, Alleghany Corporation; Trustee, Wheeling Jesuit University; Director, Liberty Tire Recycling.
Previous Positions: Chairman, President and Chief Executive Officer, Armco, Inc.; President and Chief Executive Officer, Cyclops Industries; President and Chief Operating Officer, Kaiser Steel Corporation.
Qualifications: Business management, education and director experience. |
OFFICERS
Name
Birth Date
Positions Held with Trust
Date Service Began | Principal Occupation(s) for Past Five Years
and Previous Position(s) |
John W. McGonigle
Birth Date: October 26, 1938
Secretary
Began serving: May 2006 | Principal Occupations: Executive Vice President and Secretary of the Federated Fund Family; Vice Chairman, Executive Vice President, Secretary and Director, Federated Investors, Inc.
Previous Positions: Trustee, Federated Investment Management Company and Federated Investment Counseling; Director, Federated Global Investment Management Corp., Federated Services Company and Federated Securities Corp. |
Richard A. Novak
Birth Date: December 25, 1963
TREASURER
Began serving: May 2006 | Principal Occupations: Principal Financial Officer and Treasurer of the Federated Fund Family; Senior Vice President, Federated Administrative Services; Financial and Operations Principal for Federated Securities Corp., Edgewood Services, Inc. and Southpointe Distribution Services, Inc.
Previous Positions: Controller of Federated Investors, Inc.; Vice President, Finance of Federated Services Company; held various financial management positions within The Mercy Hospital of Pittsburgh; Auditor, Arthur Andersen & Co. |
Brian P. Bouda
Birth Date: February 28, 1947
CHIEF COMPLIANCE OFFICER AND SENIOR VICE PRESIDENT
Began serving: June 2006 | Principal Occupations: Senior Vice President and Chief Compliance Officer of the Federated Fund Family; Vice President and Chief Compliance Officer of Federated Investors, Inc. and Chief Compliance Officer of its subsidiaries. Mr. Bouda joined Federated in 1999 and is a member of the American Bar Association and the State Bar Association of Wisconsin. |
Annual Shareholder Report48
Evaluation and Approval of Advisory Contract – May 2011
federated mdt all cap core fund (the “Fund”)
The Fund's Board reviewed the Fund's investment advisory contract at meetings held in May 2011. The Board's decision regarding the contract reflects the exercise of its business judgment on whether to continue the existing arrangements.
In this connection, the Federated Funds' Board had previously appointed a Senior Officer, whose duties include specified responsibilities relating to the process by which advisory fees are to be charged to a Federated fund. The Senior Officer has the authority to retain consultants, experts, or staff as may be reasonably necessary to assist in the performance of his duties, reports directly to the Board, and may be terminated only with the approval of a majority of the independent members of the Board. The Senior Officer prepared and furnished to the Board an independent, written evaluation that covered topics discussed below (the “Evaluation”). The Board considered that Evaluation, along with other information, in deciding to approve the advisory contract.
During its review of the contract, the Board considered compensation and benefits received by the Adviser. This included the fees received for services provided to the Fund by other entities in the Federated organization and research services (if any) received by the Adviser from brokers that execute Federated fund trades, as well as advisory fees. The Board is also familiar with and considered judicial decisions concerning allegedly excessive investment advisory fees, which have indicated that the following factors may be relevant to an Adviser's fiduciary duty with respect to its receipt of compensation from a fund: the nature and quality of the services provided by the Adviser, including the performance of the fund; the Adviser's cost of providing the services; the extent to which the Adviser may realize “economies of scale” as a fund grows larger; any indirect benefits that may accrue to the Adviser and its affiliates as a result of the Adviser's relationship with a fund; performance and expenses of comparable funds; and the extent to which the independent Board members are fully informed about all facts the Board deems relevant bearing on the Adviser's services and fees. The Board further considered management fees (including any components thereof) charged to institutional and other clients of the Adviser for what might be viewed as like services, and the cost to the Adviser and its affiliates of supplying services pursuant to the management fee agreements, excluding any intra-corporate profit and profit margins of the Adviser and its affiliates for supplying such services. The Board was aware of these factors and was guided by them in its review of the Fund's advisory contract to the extent it considered them to be appropriate and relevant, as discussed further below.
Annual Shareholder Report
49
The Board considered and weighed these circumstances in light of its substantial accumulated experience in governing the Fund and working with Federated on matters relating to the Federated funds, and was assisted in its deliberations by independent legal counsel. Throughout the year, the Board has requested and received substantial and detailed information about the Fund and the Federated organization that was in addition to the extensive materials that comprise and accompany the Senior Officer's Evaluation. Federated provided much of this information at each regular meeting of the Board, and furnished additional information in connection with the particular meeting at which the Board's formal review of the advisory contract occurred. Between regularly scheduled meetings, the Board also received information on particular matters as the need arose. Thus, the Board's consideration of the advisory contract included review of the Senior Officer's Evaluation, accompanying data and additional information covering such matters as: the Adviser's investment philosophy, revenue, profitability, personnel and processes; investment and operating strategies; the Fund's short- and long-term performance (in absolute terms, both on a gross basis and net of expenses, as well as in relationship to its particular investment program and certain competitor or “peer group” funds and/or other benchmarks, as appropriate), and comments on the reasons for performance; the Fund's investment objectives; the Fund's expenses (including the advisory fee itself and the overall expense structure of the Fund, both in absolute terms and relative to similar and/or competing funds, with due regard for contractual or voluntary expense limitations); the use and allocation of brokerage commissions derived from trading the Fund's portfolio securities (if any); and the nature, quality and extent of the advisory and other services provided to the Fund by the Adviser and its affiliates. The Board also considered the preferences and expectations of Fund shareholders and their relative sophistication; the continuing state of competition in the mutual fund industry and market practices; the range of comparable fees for similar funds in the mutual fund industry; the Fund's relationship to the Federated family of funds which include a comprehensive array of funds with different investment objectives, policies and strategies which are available for exchange without the incurrence of additional sales charges; compliance and audit reports concerning the Federated funds and the Federated companies that service them (including communications from regulatory agencies), as well as Federated's responses to any issues raised therein; and relevant developments in the mutual fund industry and how the Federated funds and/or Federated are responding to them. The Board's evaluation process is evolutionary. The criteria considered and the emphasis placed on relevant criteria change in recognition of changing circumstances in the mutual fund marketplace.With respect to the Fund's performance and expenses in particular, the Board has found the use of comparisons to other mutual funds with comparable investment programs to be relevant, given the high degree of competition in the mutual fund business. The Board focused on comparisons with other similar Annual Shareholder Report
50
mutual funds more heavily than non-mutual fund products or services because it is believed that they are more relevant. For example, other mutual funds are the products most like the Fund, they are readily available to Fund shareholders as alternative investment vehicles, and they are the type of investment vehicle in fact chosen and maintained by the Fund's investors. The range of their fees and expenses therefore appears to be a generally reliable indication of what consumers have found to be reasonable in the precise marketplace in which the Fund competes. The Fund's ability to deliver competitive performance when compared to its peer group was a useful indicator of how the Adviser is executing the Fund's investment program, which in turn assisted the Board in reaching a conclusion that the nature, extent, and quality of the Adviser's investment management services were such as to warrant continuation of the advisory contract. In this regard, the Senior Officer has reviewed Federated's fees for providing advisory services to products outside the Federated family of funds (e.g., institutional and separate accounts). He concluded that mutual funds and institutional accounts are inherently different products. Those differences include, but are not limited to, different types of targeted investors; being subject to different laws and regulations; different legal structures; different average account sizes; different associated costs; different portfolio management techniques made necessary by different cash flows; and portfolio manager time spent in review of securities pricing. The Senior Officer did not consider these fee schedules to be determinative in judging the appropriateness of mutual fund advisory contracts.The Senior Officer reviewed information compiled by Federated, using data supplied by independent fund ranking organizations, regarding the performance of, and fees charged by, other mutual funds, noting his view that comparisons to fund peer groups are relevant in judging the reasonableness of proposed fees. He also observed that certain funds may exhibit important differences in their objectives and management techniques when compared to other funds placed in the same peer group by ranking organizations, noting in this connection that the Fund's quantitative investment program is of such a type.
The Fund's performance fell below the median of the relevant peer group for the one-year, three-year and five-year periods covered by the Evaluation. In addition, the Board was informed by the Adviser that, for the same periods, the Fund underperformed its benchmark index for the one-year period, underperformed its benchmark index for the three-year period and underperformed its benchmark index for the five-year period. The Board discussed the Fund's performance with the Adviser and recognized the efforts being undertaken by the Adviser. The Board will continue to monitor these efforts and the performance of the Fund.
The Board also received financial information about Federated, including information regarding the compensation and benefits Federated derived from its relationships with the Federated funds. This information covered not only the fees under the advisory contracts, but also fees received by Federated's Annual Shareholder Report
51
subsidiaries for providing other services to the Federated funds under separate contracts (e.g., for serving as the Federated funds' administrator). The information also detailed any indirect benefit Federated may derive from its receipt of research services from brokers who execute Federated fund trades. In addition, the Board considered the fact that, in order for a fund to be competitive in the marketplace, Federated and its affiliates frequently waived fees and/or reimbursed expenses and have disclosed to fund investors and/or indicated to the Board their intention to do so in the future, where appropriate. Moreover, the Board receives regular reporting as to the institution or elimination of these voluntary waivers.Federated furnished information, requested by the Senior Officer, that reported revenues on a fund-by-fund basis and made estimates of the allocation of expenses on a fund-by-fund basis, using allocation methodologies specified by the Senior Officer. The Senior Officer noted that, although they may apply consistent allocation processes, the inherent difficulties in allocating costs (and the unavoidable arbitrary aspects of that exercise) and the lack of consensus on how to allocate those costs may render such allocation information unreliable. The allocation information was considered in the analysis by the Board but was determined to be of limited use.
The Board and the Senior Officer also reviewed information compiled by Federated comparing profitability information for Federated to other publicly held fund management companies. In this regard, the Senior Officer noted the limited availability of such information, but nonetheless concluded that Federated's profit margins did not appear to be excessive and the Board agreed.
The Senior Officer's Evaluation also discussed the notion of possible realization of “economies of scale” as a fund grows larger. The Board considered in this regard that the Adviser has made significant and long-term investments in areas that support all of the Federated funds, such as personnel and processes for the portfolio management, compliance, internal audit, and risk management functions; and systems technology; and that the benefits of these efforts (as well as any economies, should they exist) were likely to be enjoyed by the fund complex as a whole. Finally, the Board also noted the absence of any applicable regulatory or industry guidelines on this subject, which (as discussed in the Senior Officer's Evaluation) is compounded by the lack of any common industry practice or general pattern with respect to structuring fund advisory fees with “breakpoints” that serve to reduce the fee as the fund attains a certain size. The Senior Officer did not recommend institution of breakpoints in pricing Federated's fund advisory services at this time.
It was noted in the materials for the Board meeting that for the period covered by the Evaluation, the Fund's investment advisory fee, after waivers and expense reimbursements, if any, was below the median of the relevant peer group. The Board reviewed the fees and other expenses of the Fund with the Adviser and was satisfied that the overall expense structure of the Fund remained competitive.
Annual Shareholder Report
52
The Senior Officer noted that, considering the totality of the circumstances, and all of the factors referenced within his Evaluation, he had concluded that, subject to comments and recommendations made within his Evaluation, his observations and the information accompanying the Evaluation supported a finding by the Board that the management fees for each of the funds are reasonable and that Federated appeared to provide appropriate administrative services to the Fund for the fees paid. Under these circumstances, no changes were recommended to, and no objection was raised to, the continuation of the Fund's advisory contract. The Board concluded that the nature, quality and scope of services provided the Fund by the Adviser and its affiliates were satisfactory.In its decision to continue an existing investment advisory contract, the Board was mindful of the potential disruptions of the Fund's operations and various risks, uncertainties and other effects that could occur as a result of a decision to terminate or not renew an advisory contract. In particular, the Board recognized that many shareholders have invested in the Fund on the strength of the Adviser's industry standing and reputation and with the expectation that the Adviser will have a continuing role in providing advisory services to the Fund. Thus, the Board's approval of the advisory contract reflected the fact that it is the shareholders who have effectively selected the Adviser by virtue of having invested in the Fund.
The Board based its decision to approve the advisory contract on the totality of the circumstances and relevant factors and with a view to past and future long-term considerations. Not all of the factors and considerations identified above were necessarily relevant to the Fund, nor did the Board consider any one of them to be determinative. With respect to the factors that were relevant, the Board's decision to approve the contract reflects its determination that Federated's performance and actions provided a satisfactory basis to support the decision to continue the existing arrangements.
Annual Shareholder Report53
Voting Proxies on Fund Portfolio Securities
A description of the policies and procedures that the Fund uses to determine how to vote proxies, if any, relating to securities held in the Fund's portfolio is available, without charge and upon request, by calling 1-800-341-7400. A report on “Form N-PX” of how the Fund voted any such proxies during the most recent 12-month period ended June 30 is available from Federated's website at FederatedInvestors.com. To access this information from the home page, select “View All” next to “Find Products.” Select a fund name and share class, if applicable, to go to the Fund Overview page. On the Fund Overview page, select the “Documents” tab. At the bottom of that page, select “Proxy Voting Record Report (Form N-PX).” Form N-PX filings are also available at the SEC's website at www.sec.gov.
Quarterly Portfolio Schedule
The Fund files with the SEC a complete schedule of its portfolio holdings, as of the close of the first and third quarters of its fiscal year, on “Form N-Q.” These filings are available on the SEC's website at www.sec.gov and may be reviewed and copied at the SEC's Public Reference Room in Washington, DC. (Call 1-800-SEC-0330 for information on the operation of the Public Reference Room.) You may also access this information from the “Products” section of Federated's website at FederatedInvestors.com. From the home page, select “View All” next to “Find Products.” Select a fund name and share class, if applicable, to go to the Fund Overview page. On the Fund Overview page, select the “Documents” tab. At the bottom of that page, select “Form N-Q.”
Annual Shareholder Report54
Mutual funds are not bank deposits or obligations, are not guaranteed by any bank and are not insured or guaranteed by the U.S. government, the Federal Deposit Insurance Corporation, the Federal Reserve Board or any other government agency. Investment in mutual funds involves investment risk, including the possible loss of principal.
This Report is authorized for distribution to prospective investors only when preceded or accompanied by the Fund's Prospectus, which contains facts concerning its objective and policies, management fees, expenses and other information.
Federated MDT All Cap Core Fund
Federated Investors Funds
4000 Ericsson Drive
Warrendale, PA 15086-7561
Contact us at FederatedInvestors.com
or call 1-800-341-7400.
Federated Securities Corp., Distributor
Cusip 31421R106
Cusip 31421R205
Cusip 31421R718
Cusip 31421R304
37309 (9/11)
Federated is a registered trademark of Federated Investors, Inc.
2011 © Federated Investors, Inc.
[Page Intentionally Left Blank]
| | Annual Shareholder Report |
| | July 31, 2011 |
|
| Share Class | Ticker |
| A | QABGX |
| C | QCBX |
| R* | QKBGX |
| IS | QIBGX |
*formerly, Class K Shares
Federated MDT Balanced Fund
Fund Established 2002
A Portfolio of Federated MDT Series
Financial Highlights
Shareholder Expense Example
Management's Discussion of Fund Performance
Portfolio of Investments Summary Tables
Portfolio of Investments
Statement of Assets and Liabilities
Statement of Operations
Statement of Changes in Net Assets
Notes to Financial Statements
Report of Independent Registered Public Accounting Firm
Board of Trustees and Trust Officers
Evaluation and Approval of Advisory Contract
Voting Proxies on Fund Portfolio Securities
Quarterly Portfolio Schedule
1
Financial Highlights – Class A Shares
(For a Share Outstanding Throughout Each Period)
| Year Ended July 31 | 2011 | 2010 | 2009 | 2008 | 20071 |
| Net Asset Value, Beginning of Period | $10.86 | $10.17 | $12.51 | $13.75 | $13.21 |
| Income From Investment Operations: | | | | | |
| Net investment income | 0.152 | 0.162 | 0.202 | 0.282 | 0.202 |
| Net realized and unrealized gain (loss) on investments, futures contracts, swap contracts and foreign currency transactions | 1.33 | 0.71 | (2.27) | (1.00) | 1.15 |
| TOTAL FROM INVESTMENT OPERATIONS | 1.48 | 0.87 | (2.07) | (0.72) | 1.35 |
| Less Distributions: | | | | | |
| Distributions from net investment income | (0.17) | (0.18) | (0.27) | (0.17) | (0.16) |
| Distributions from net realized gain on investments, futures contracts, swap contracts and foreign currency transactions | — | — | — | (0.35) | (0.65) |
| TOTAL DISTRIBUTIONS | (0.17) | (0.18) | (0.27) | (0.52) | (0.81) |
| Net Asset Value, End of Period | $12.17 | $10.86 | $10.17 | $12.51 | $13.75 |
| Total Return3 | 13.67% | 8.51% | (16.35)% | (5.60)% | 10.39% |
| Ratios to Average Net Assets: | | | | | |
| Net expenses | 1.28% | 1.21% | 1.30% | 1.31% | 1.40% |
| Net investment income | 1.27% | 1.47% | 2.03% | 2.08% | 1.42% |
| Expense waiver/reimbursement4 | 0.23% | 0.25% | 0.14% | 0.03% | 0.13% |
| Supplemental Data: | | | | | |
| Net assets, end of period (000 omitted) | $57,358 | $86,018 | $105,635 | $153,458 | $51,167 |
| Portfolio turnover | 139% | 130% | 231% | 158% | 174% |
| 1 | MDT Balanced Fund (the “Predecessor Fund”) was reorganized into Federated MDT Balanced Fund (the “Fund”) as of the close of business on December 8, 2006. Prior to the reorganization, the Fund had no investment operations. The Fund is the successor to the Predecessor Fund. The performance information and financial information presented incorporates the operations of the Predecessor Fund, which, as a result of the reorganization, are the Fund's operations. |
| 2 | Per share numbers have been calculated using the average shares method. |
| 3 | Based on net asset value, which does not reflect the sales charge, redemption fee or contingent deferred sales charge, if applicable. |
| 4 | This expense decrease is reflected in both the net expense and the net investment income ratios shown above. |
See Notes which are an integral part of the Financial Statements
Annual Shareholder Report1
Financial Highlights – Class C Shares
(For a Share Outstanding Throughout Each Period)
| Year Ended July 31 | 2011 | 2010 | 2009 | 2008 | 20071 |
| Net Asset Value, Beginning of Period | $10.70 | $10.03 | $12.30 | $13.60 | $13.13 |
| Income From Investment Operations: | | | | | |
| Net investment income | 0.062 | 0.082 | 0.132 | 0.192 | 0.092 |
| Net realized and unrealized gain (loss) on investments, futures contracts, swap contracts and foreign currency transactions | 1.31 | 0.69 | (2.23) | (1.00) | 1.14 |
| TOTAL FROM INVESTMENT OPERATIONS | 1.37 | 0.77 | (2.10) | (0.81) | 1.23 |
| Less Distributions: | | | | | |
| Distributions from net investment income | (0.08) | (0.10) | (0.17) | (0.14) | (0.11) |
| Distributions from net realized gain on investments, futures contracts, swap contracts and foreign currency transactions | — | — | — | (0.35) | (0.65) |
| TOTAL DISTRIBUTIONS | (0.08) | (0.10) | (0.17) | (0.49) | (0.76) |
| Net Asset Value, End of Period | $11.99 | $10.70 | $10.03 | $12.30 | $13.60 |
| Total Return3 | 12.85% | 7.63% | (16.95)% | (6.28)% | 9.50% |
| Ratios to Average Net Assets: | | | | | |
| Net expenses | 2.04% | 1.96% | 2.05% | 2.05% | 2.15% |
| Net investment income | 0.52% | 0.71% | 1.28% | 1.41% | 0.66% |
| Expense waiver/reimbursement4 | 0.19% | 0.22% | 0.10% | 0.03% | 0.16% |
| Supplemental Data: | | | | | |
| Net assets, end of period (000 omitted) | $45,512 | $49,907 | $55,582 | $82,033 | $15,775 |
| Portfolio turnover | 139% | 130% | 231% | 158% | 174% |
| 1 | The Predecessor Fund was reorganized into the Fund as of the close of business on December 8, 2006. Prior to the reorganization, the Fund had no investment operations. The Fund is the successor to the Predecessor Fund. The performance information and financial information presented incorporates the operations of the Predecessor Fund, which, as a result of the reorganization, are the Fund's operations. |
| 2 | Per share numbers have been calculated using the average shares method. |
| 3 | Based on net asset value, which does not reflect the sales charge, redemption fee or contingent deferred sales charge, if applicable. |
| 4 | This expense decrease is reflected in both the net expense and the net investment income ratios shown above. |
See Notes which are an integral part of the Financial Statements
Annual Shareholder Report2
Financial Highlights – Class R Shares
(For a Share Outstanding Throughout Each Period)
| Year Ended July 31, | Period
Ended
7/31/20071 |
| 2011 | 2010 | 2009 | 2008 |
| Net Asset Value, Beginning of Period | $10.83 | $10.14 | $12.51 | $13.77 | $14.28 |
| Income From Investment Operations: | | | | | |
| Net investment income | 0.092 | 0.102 | 0.152 | 0.202 | 0.052 |
| Net realized and unrealized gain (loss) on investments, futures contracts, swap contracts and foreign currency transactions | 1.32 | 0.72 | (2.27) | (0.98) | 0.26 |
| TOTAL FROM INVESTMENT OPERATIONS | 1.41 | 0.82 | (2.12) | (0.78) | 0.31 |
| Less Distributions: | | | | | |
| Distributions from net investment income | (0.12) | (0.13) | (0.25) | (0.13) | (0.17) |
| Distributions from net realized gain on investments, futures contracts, swap contracts and foreign currency transactions | — | — | — | (0.35) | (0.65) |
| TOTAL DISTRIBUTIONS | (0.12) | (0.13) | (0.25) | (0.48) | (0.82) |
| Net Asset Value, End of Period | $12.12 | $10.83 | $10.14 | $12.51 | $13.77 |
| Total Return3 | 13.08% | 8.01% | (16.75)% | (6.01)% | 2.33% |
| Ratios to Average Net Assets: | | | | | |
| Net expenses | 1.79% | 1.70% | 1.79% | 1.77% | 1.90%4 |
| Net investment income | 0.77% | 0.96% | 1.56% | 1.53% | 0.60%4 |
| Expense waiver/reimbursement5 | 0.17% | 0.21% | 0.09% | 0.02% | 0.05%4 |
| Supplemental Data: | | | | | |
| Net assets, end of period (000 omitted) | $665 | $673 | $597 | $708 | $18 |
| Portfolio turnover | 139% | 130% | 231% | 158% | 174%6 |
| 1 | Reflects operations for the period from December 12, 2006 (date of initial public investment) to July 31, 2007. |
| 2 | Per share numbers have been calculated using the average shares method. |
| 3 | Based on net asset value. Total returns for periods of less than one year are not annualized. |
| 4 | Computed on an annualized basis. |
| 5 | This expense decrease is reflected in both the net expense and the net investment income ratios shown above. |
| 6 | Portfolio turnover is calculated at the Fund level. Percentage indicated was calculated for the year ended July 31, 2007. |
See Notes which are an integral part of the Financial Statements
Annual Shareholder Report3
Financial Highlights – Institutional Shares
(For a Share Outstanding Throughout Each Period)
| Year Ended July 31 | 2011 | 2010 | 2009 | 2008 | 20071 |
| Net Asset Value, Beginning of Period | $10.90 | $10.21 | $12.57 | $13.79 | $13.23 |
| Income From Investment Operations: | | | | | |
| Net investment income | 0.182 | 0.192 | 0.232 | 0.302 | 0.242 |
| Net realized and unrealized gain (loss) on investments, futures contracts, swap contracts and foreign currency transactions | 1.34 | 0.71 | (2.28) | (0.98) | 1.14 |
| TOTAL FROM INVESTMENT OPERATIONS | 1.52 | 0.90 | (2.05) | (0.68) | 1.38 |
| Less Distributions: | | | | | |
| Distributions from net investment income | (0.21) | (0.21) | (0.31) | (0.19) | (0.17) |
| Distributions from net realized gain on investments, futures contracts, swap contracts and foreign currency transactions | — | — | — | (0.35) | (0.65) |
| TOTAL DISTRIBUTIONS | (0.21) | (0.21) | (0.31) | (0.54) | (0.82) |
| Net Asset Value, End of Period | $12.21 | $10.90 | $10.21 | $12.57 | $13.79 |
| Total Return3 | 13.99% | 8.74% | (16.13)% | (5.33)% | 10.61% |
| Ratios to Average Net Assets: | | | | | |
| Net expenses | 1.04% | 0.96% | 1.05% | 1.06% | 1.14% |
| Net investment income | 1.52% | 1.71% | 2.29% | 2.22% | 1.74% |
| Expense waiver/reimbursement4 | 0.18% | 0.21% | 0.09% | 0.03% | 0.17% |
| Supplemental Data: | | | | | |
| Net assets, end of period (000 omitted) | $47,473 | $49,127 | $50,161 | $71,949 | $81,634 |
| Portfolio turnover | 139% | 130% | 231% | 158% | 174% |
| 1 | The Predecessor Fund was reorganized into the Fund as of the close of business on December 8, 2006. Prior to the reorganization, the Fund had no investment operations. The Fund is the successor to the Predecessor Fund. The performance information and financial information presented incorporates the operations of the Predecessor Fund, which, as a result of the reorganization, are the Fund's operations. |
| 2 | Per share numbers have been calculated using the average shares method. |
| 3 | Based on net asset value. |
| 4 | This expense decrease is reflected in both the net expense and the net investment income ratios shown above. |
See Notes which are an integral part of the Financial Statements
Annual Shareholder Report4
Shareholder Expense Example (unaudited)
As a shareholder of the Fund, you incur two types of costs: (1) transaction costs, including sales charges (loads) on purchase or redemption payments; and (2) ongoing costs, including management fees and to the extent applicable, distribution (12b-1) fees and/or shareholder services fees and other Fund expenses. This Example is intended to help you to understand your ongoing costs (in dollars) of investing in the Fund and to compare these costs with the ongoing costs of investing in other mutual funds. It is based on an investment of $1,000 invested at the beginning of the period and held for the entire period from February 1, 2011 to July 31, 2011.
ACTUAL EXPENSES
The first section of the table below provides information about actual account values and actual expenses. You may use the information in this section, together with the amount you invested, to estimate the expenses that you incurred over the period. Simply divide your account value by $1,000 (for example, an $8,600 account value divided by $1,000 = 8.6), then multiply the result by the number in the first section under the heading entitled “Expenses Paid During Period” to estimate the expenses attributable to your investment during this period.
HYPOTHETICAL EXAMPLE FOR COMPARISON PURPOSES
The second section of the table below provides information about hypothetical account values and hypothetical expenses based on the Fund's actual expense ratio and an assumed rate of return of 5% per year before expenses, which is not the Fund's actual return. Thus, you should not use the hypothetical account values and expenses to estimate the actual ending account balance or your expenses for the period. Rather, these figures are required to be provided to enable you to compare the ongoing costs of investing in the Fund with other funds. To do so, compare this 5% hypothetical example with the 5% hypothetical examples that appear in the shareholder reports of the other funds.
Annual Shareholder Report
5
Please note that the expenses shown in the table are meant to highlight your ongoing costs only and do not reflect any transaction costs, such as sales charges (loads) on purchase or redemption payments. Therefore, the second section of the table is useful in comparing ongoing costs only, and will not help you determine the relative total costs of owning different funds. In addition, if these transaction costs were included, your costs would have been higher. | Beginning
Account Value
2/1/2011 | Ending
Account Value
7/31/2011 | Expenses Paid
During Period1 |
| Actual: | | | |
| Class A Shares | $1,000 | $1,011.60 | $6.48 |
| Class C Shares | $1,000 | $1,007.60 | $10.20 |
| Class R Shares | $1,000 | $1,009.20 | $9.02 |
| Institutional Shares | $1,000 | $1,013.30 | $5.24 |
Hypothetical (assuming a 5% return
before expenses): | | | |
| Class A Shares | $1,000 | $1,018.35 | $6.51 |
| Class C Shares | $1,000 | $1,014.63 | $10.24 |
| Class R Shares | $1,000 | $1,015.82 | $9.05 |
| Institutional Shares | $1,000 | $1,019.59 | $5.26 |
| 1 | Expenses are equal to the Fund's annualized net expense ratios, multiplied by the average account value over the period, multiplied by 181/365 (to reflect the one-half-year period). The annualized net expense ratios are as follows: |
| Class A Shares | 1.30% |
| Class C Shares | 2.05% |
| Class R Shares | 1.81% |
| Institutional Shares | 1.05% |
Annual Shareholder Report6
Performance data quoted represents past performance which is no guarantee of future results. Investment return and principal value will fluctuate so that an investor's shares, when redeemed, may be worth more or less than their original cost. Mutual fund performance changes over time and current performance may be lower or higher than what is stated. For current to the most recent month-end performance and after-tax returns, visit FederatedInvestors.com or call 1-800-341-7400.
Management's Discussion of Fund Performance (unaudited)
The Fund's total return, based on net asset value, for the 12-month reporting period ended July 31, 2011, was 13.67% for Class A Shares, 12.85% for Class C Shares, 13.08% for Class R Shares and 13.99% for Institutional Shares. Over the same period, the Standard & Poor's 500 Index1 (S&P 500) and the Barclays Capital U.S. Aggregate Bond Index,2 each a broad-based securities market index, returned 19.65% and 4.44%, respectively.
| 1 | The Standard & Poor's 500 Index is an unmanaged capitalization-weighted index of 500 stocks designed to measure performance of the broad domestic economy through changes in the aggregate market value of 500 stocks representing all major industries. Investments cannot be made directly in an index. |
| 2 | The Barclay's Capital U.S. Aggregate Bond Index is an unmanaged index composed of securities from the Barclay's Government/Corporate Bond Index, Mortgage-Backed Securities Index and the Asset-Backed Securities Index. Total return comprises price appreciation/depreciation and income as a percentage of the original investment. Indices are rebalanced monthly by market capitalization. Investments cannot be made directly in an index. |
Annual Shareholder Report7
MArket Overview
Over the reporting period, domestic equity market performance was strong as evidenced by the 20.94% return of the Russell 3000® Index,3 which represents the performance of the 3000 largest U.S. companies by market capitalization. Mid-cap stocks led the way as demonstrated by the 24.51% return of the Russell Midcap® Index,4 which exceeded the 19.09% and 23.92% results for the Russell Top 200® Index,5 representing large-cap stocks, and the Russell 2000® Index,6 representing small-cap stocks, respectively. Growth stocks outperformed value stocks during the year with the Russell 3000 Growth® Index7 returning 25.12% as compared to 16.90% for the Russell 3000® Value Index.8
| 3 | The Russell 3000® Index offers investors access to the broad U.S. equity universe representing approximately 98% of the U.S. market. The Russell 3000® Index is constructed to provide a comprehensive, unbiased and stable barometer of the broad market and is completely reconstituted annually to ensure new and growing equities are reflected. The index is unmanaged and investments cannot be made directly in an index. |
| 4 | The Russell Midcap® Index measures the performance of the 800 smallest companies in the Russell 1000® Index, which represent approximately 31% of the total market capitalization of the Russell 1000® Index. The index is unmanaged and investments cannot be made directly in an index. |
| 5 | The Russell Top 200® Index measures the performance of the 200 largest companies in the Russell 1000® Index, which represents approximately 68% of the total market capitalization of the Russell 1000® Index. The index is unmanaged and investments cannot be made directly in an index. |
| 6 | The Russell 2000® Index measures the performance of the 2,000 smallest companies in the Russell 3000® Index, which represents approximately 10% of the total market capitalization of the Russell 3000® Index. The index is unmanaged and investments cannot be made directly in an index. |
| 7 | The Russell 3000® Growth Index measures the performance of those Russell 3000® Index companies with higher price-to-book ratios and higher forecasted growth values. The stocks in this index are also members of either the Russell 1000® Growth or the Russell 2000® Growth indexes. The index is unmanaged and investments cannot be made directly in an index. |
| 8 | The Russell 3000® Value Index measures the performance of those Russell 3000® Index companies with lower price-to-book ratios and lower forecasted growth values. The stocks in this index are also members of either the Russell 1000® Value or the Russell 2000® Value indexes. The index is unmanaged and investments cannot be made directly in an index. |
Annual Shareholder Report
8
Real Estate Investment Trust (REIT) fundamentals benefited from the gradual improvement in employment conditions and a decline in interest rates which boosted property valuations. For the period, the Standard & Poor's U.S. REIT Index9 returned 24.16%.International equities10 in developed markets underperformed the domestic equity market during the period with the Morgan Stanley Capital International (MSCI) Europe, Australasia and Far East (EAFE) Index11 returning 17.17%. Emerging market12 equities had similar results with the MSCI Emerging Markets Free Index13 returning 17.45%.
It was a relatively calm period in fixed income markets as the economic recovery continued, albeit at a modest pace compared to prior recoveries. Credit-related sectors continued to show the easing of tensions as spreads narrowed in high yield, emerging markets, commercial mortgage backed securities (CMBS), and investment-grade corporate markets, but remained above previous cyclical lows. Total returns of all bond sectors were modestly positive with the return of the Barclays Capital U.S. Aggregate Bond Index at 4.44% for the period. Treasury rates for the longest maturity issues were up slightly, but declined as much as 0.30% for intermediate and shorter-term instruments.
| 9 | The S&P REIT Index tracks the market performance of U.S. Real Estate Investment Trusts, known as REITs. It consists of 100 REITs chosen for their liquidity and importance in representing a diversified real estate portfolio. Investments in REITs involve special risks associated with an investment in real estate, such as limited liquidity and interest rate risks. The index is unmanaged and investments cannot be made directly in an index. |
| 10 | International investing involves special risks including currency risk, increased volatility of foreign securities, political risks and differences in auditing and other financial standards. |
| 11 | The EAFE Index measures international equity performance. It comprises 22 MSCI country indices, representing the developed markets outside of North America. The index is unmanaged and investments cannot be made directly in an index. |
| 12 | Prices of emerging markets securities can be significantly more volatile than the prices of securities in developed countries, and currency risks and political risks are accentuated in emerging markets. |
| 13 | The MSCI Emerging Markets Free Index is an unmanaged index consisting of 21 emerging market countries. The index is unmanaged and investments cannot be made directly in an index. |
Annual Shareholder Report
9
ASSET ALLOCATIONDuring the 12-month reporting period, equity investments accounted for an average of approximately 67% of the portfolio while fixed income and cash investments accounted for an average of 33%. This emphasis on equities helped results particularly during the first six months when stocks made most of their gains. The allocation to equities was increased early in the period, funded primarily through a reduction in cash holdings. Within the Fund's equity portfolio, the allocations to emerging market equities and REIT investments were reduced marginally in favor of domestic equity investments.
EQUITIES
Domestic equity investments, which were managed using Federated MDT's proprietary Optimum Q Process, marginally underperformed the Russell 3000® Index during the 12-month reporting period. The most significant positive factor in the Fund's domestic equity performance relative to the Russell 3000® Index was an overweight in the Energy sector, which outperformed the index. Stock selection in the Financials, Industrials and Materials sectors also contributed positively. The most significant negative factor was an overweight in the Financials sector, which underperformed the Russell 3000® Index. Stock selection in the Information Technology and Health Care sectors also detracted significantly.
FIXED INCOME
The bond portion of the portfolio outperformed the Barclays Capital U.S. Aggregate Bond Index by a wide margin as a result of sector management and security selection. The duration call dragged down performance considerably and yield curve management was a very slight positive. Overweights in the best performing sectors were a big boost to performance along with a lower quality bias. Security selection added to performance in the CMBS, investment-grade corporates, and high yield14 areas. Security selection in the mortgage-backed securities (MBS)15 and emerging market sectors were the only broad sector drags to performance.
| 14 | High-yield, lower-rated securities generally entail greater market, credit and liquidity risk than investment-grade securities and may include higher volatility and higher risk of default. Bond prices are sensitive to changes in interest rates and a rise in interest rates can cause a decline in their prices. |
| 15 | The value of some mortgage-backed securities may be particularly sensitive to changes in prevailing interest rates, and although the securities are generally supported by some form of government or private insurance, there is no assurance that private guarantors or insurers will meet their obligations. |
Annual Shareholder Report10
GROWTH OF A $10,000 INVESTMENT – CLASS A SHARES
The graph below illustrates the hypothetical investment of $10,0001 in the Federated MDT Balanced Fund2 (Class A Shares) (the “Fund”) from October 1, 2002 (start of performance) to July 31, 2011, compared to the Standard and Poor's 500 Index (S&P 500)3 and the Barclays Capital U.S. Aggregate Bond Index (BCAB).3
| Average Annual Total Returns for the Period Ended 7/31/2011 | |
| 1 Year | 7.44% |
| 5 Years | 0.32% |
| Start of Performance (10/1/2002)4 | 5.73% |
| Federated MDT Balanced Fund - Class A Shares | C000035055 | S&P 500 | Lipper Mixed-Asset Target Allocation Growth Funds Index | Barclays Capital U.S. Aggregate Bond Index |
| 10/1/2002 | 9,450 | 10,000 | 10,000 | 10,000 |
| 7/31/2003 | 10,768 | 12,333 | 11,502 | 10,201 |
| 7/31/2004 | 12,393 | 13,956 | 12,892 | 10,695 |
| 7/31/2005 | 14,440 | 15,918 | 14,499 | 11,207 |
| 7/31/2006 | 15,213 | 16,770 | 15,438 | 11,371 |
| 7/31/2007 | 16,796 | 19,478 | 17,581 | 12,005 |
| 7/31/2008 | 15,855 | 17,317 | 16,396 | 12,744 |
| 7/31/2009 | 13,264 | 13,861 | 14,453 | 13,743 |
| 7/31/2010 | 14,392 | 15,778 | 16,258 | 14,968 |
| 7/31/2011 | 16,360 | 18,878 | 18,722 | 15,631 |
41 graphic description end -->
Performance data quoted represents past performance which is no guarantee of future results. Investment return and principal value will fluctuate so that an investor's shares, when redeemed, may be worth more or less than their original cost. Mutual fund performance changes over time and current performance may be lower or higher than what is stated. For current to the most recent month-end performance and after-tax returns, visit FederatedInvestors.com or call 1-800-341-7400. Returns shown do not reflect the deduction of taxes that a shareholder would pay on Fund distributions or the redemption of Fund shares. Mutual funds are not obligations of or guaranteed by any bank and are not federally insured. Total returns shown include the maximum sales charge of 5.50%.
Annual Shareholder Report11
| 1 | Represents a hypothetical investment of $10,000 in the Fund after deducting the maximum sales charge of 5.50% ($10,000 investment minus $550 sales charge = $9,450). The Fund's performance assumes the reinvestment of all dividends and distributions. The S&P 500, BCAB and the Lipper Mixed-Asset Target Allocation Growth Funds Index have been adjusted to reflect reinvestment of dividends on securities in the indexes. |
| 2 | The Fund is the successor to the MDT Balanced Fund pursuant to a reorganization that took place on December 8, 2006. Prior to that date, the Fund had no investment operations. Accordingly, the performance information shown for periods prior to that date is that of the MDT Balanced Fund. |
| 3 | The S&P 500 and the BCAB are not adjusted to reflect sales charges, expenses or other fees that the Securities and Exchange Commission (SEC) requires to be reflected in the Fund's performance. The indexes are unmanaged and, unlike the Fund, are not affected by cash flows. It is not possible to invest directly in an index. |
| 4 | The start of performance date was October 1, 2002. Class A Shares of the Fund were offered beginning September 15, 2005. Performance results shown before that date are for the Fund's Institutional Shares and have been adjusted for the maximum sales charge and total annual operating expenses applicable to the Fund's Class A Shares. The Fund's Institutional Shares commenced operations on October 1, 2002. Subject to the expense adjustments noted above, the Fund's Class A Shares annual returns would have been substantially similar to those of the Fund's Institutional Shares because shares of each class are invested in the same portfolio of securities. |
Annual Shareholder Report12
GROWTH OF A $10,000 INVESTMENT – CLASS C SHARES
The graph below illustrates the hypothetical investment of $10,0001 in the Federated MDT Balanced Fund2 (Class C Shares) (the “Fund”) from October 1, 2002 (start of performance) to July 31, 2011, compared to the Standard and Poor's 500 Index (S&P 500)3 and the Barclays Capital U.S. Aggregate Bond Index (BCAB).3
| Average Annual Total Returns for the Period Ended 7/31/2011 | |
| 1 Year | 11.85% |
| 5 Years | 0.69% |
| Start of Performance (10/1/2002)4 | 5.60% |
| Federated MDT Balanced Fund - Class C Shares | C000035044 | S&P 500 | Lipper Mixed-Asset Target Allocation Growth Funds Index | Barclays Capital U.S. Aggregate Bond Index |
| 10/1/2002 | 10,000 | 10,000 | 10,000 | 10,000 |
| 7/31/2003 | 11,324 | 12,333 | 11,502 | 10,201 |
| 7/31/2004 | 12,937 | 13,956 | 12,892 | 10,695 |
| 7/31/2005 | 14,961 | 15,918 | 14,499 | 11,207 |
| 7/31/2006 | 15,627 | 16,770 | 15,438 | 11,371 |
| 7/31/2007 | 17,112 | 19,478 | 17,581 | 12,005 |
| 7/31/2008 | 16,037 | 17,317 | 16,396 | 12,744 |
| 7/31/2009 | 13,319 | 13,861 | 14,453 | 13,743 |
| 7/31/2010 | 14,335 | 15,778 | 16,258 | 14,968 |
| 7/31/2011 | 16,177 | 18,878 | 18,722 | 15,631 |
41 graphic description end -->
Performance data quoted represents past performance which is no guarantee of future results. Investment return and principal value will fluctuate so that an investor's shares, when redeemed, may be worth more or less than their original cost. Mutual fund performance changes over time and current performance may be lower or higher than what is stated. For current to the most recent month-end performance and after-tax returns, visit FederatedInvestors.com or call 1-800-341-7400. Returns shown do not reflect the deduction of taxes that a shareholder would pay on Fund distributions or the redemption of Fund shares. Mutual funds are not obligations of or guaranteed by any bank and are not federally insured. Total returns shown include the maximum contingent deferred sales charge (CDSC) of 1.00%, as applicable.
Annual Shareholder Report13
| 1 | Represents a hypothetical investment of $10,000 in the Fund. The maximum CDSC is 1.00% on any redemption less than one year from the purchase date. The Fund's performance assumes the reinvestment of all dividends and distributions. The S&P 500, BCAB and Lipper Mixed-Asset Target Allocation Growth Funds Index have been adjusted to reflect reinvestment of dividends on securities in the indexes. |
| 2 | The Fund is the successor to the MDT Balanced Fund pursuant to a reorganization that took place on December 8, 2006. Prior to that date, the Fund had no investment operations. Accordingly, the performance information shown for periods prior to that date is that of the MDT Balanced Fund. |
| 3 | The S&P 500 and BCAB are not adjusted to reflect sales charges, expenses or other fees that the SEC requires to be reflected in the Fund's performance. The indexes are unmanaged and, unlike the Fund, are not affected by cash flows. It is not possible to invest directly in an index. |
| 4 | The start of performance date was October 1, 2002. Class C Shares of the Fund were offered beginning September 15, 2005. Performance results shown before that date are for the Fund's Institutional Shares and have been adjusted for the maximum CDSC and total annual operating expenses applicable to the Fund's Class C Shares. The Fund's Institutional Shares commenced operations on October 1, 2002. Subject to the expense adjustments noted above, the Fund's Class C Shares annual returns would have been substantially similar to those of the Fund's Institutional Shares because shares of each class are invested in the same portfolio of securities. |
Annual Shareholder Report14
GROWTH OF A $10,000 INVESTMENT – CLASS R SHARES
The graph below illustrates the hypothetical investment of $10,0001 in the Federated MDT Balanced Fund2 (Class R Shares) (the “Fund”) from October 1, 2002 (start of performance) to July 31, 2011, compared to the Standard and Poor's 500 Index (S&P 500)3 and the Barclays Capital U.S. Aggregate Bond Index (BCAB).3
| Average Annual Total Returns for the Period Ended 7/31/2011 | |
| 1 Year | 13.08% |
| 5 Years | 1.04% |
| Start of Performance (10/1/2002)4 | 5.93% |
| Federated MDT Balanced Fund - Class R Shares | C000043497 | S&P 500 | Lipper Mixed-Asset Target Allocation Growth Funds Index | Barclays Capital U.S. Aggregate Bond Index |
| 10/1/2002 | 10,000 | 10,000 | 10,000 | 10,000 |
| 7/31/2003 | 11,348 | 12,333 | 11,502 | 10,201 |
| 7/31/2004 | 12,996 | 13,956 | 12,892 | 10,695 |
| 7/31/2005 | 15,067 | 15,918 | 14,499 | 11,207 |
| 7/31/2006 | 15,794 | 16,770 | 15,438 | 11,371 |
| 7/31/2007 | 17,402 | 19,478 | 17,581 | 12,005 |
| 7/31/2008 | 16,355 | 17,317 | 16,396 | 12,744 |
| 7/31/2009 | 13,615 | 13,861 | 14,453 | 13,743 |
| 7/31/2010 | 14,706 | 15,778 | 16,258 | 14,968 |
| 7/31/2011 | 16,630 | 18,878 | 18,722 | 15,631 |
41 graphic description end -->
Performance data quoted represents past performance which is no guarantee of future results. Investment return and principal value will fluctuate so that an investor's shares, when redeemed, may be worth more or less than their original cost. Mutual fund performance changes over time and current performance may be lower or higher than what is stated. For current to the most recent month-end performance and after-tax returns, visit FederatedInvestors.com or call 1-800-341-7400. Returns shown do not reflect the deduction of taxes that a shareholder would pay on Fund distributions or the redemption of Fund shares. Mutual funds are not obligations of or guaranteed by any bank and are not federally insured.
Annual Shareholder Report15
| 1 | The Fund's performance assumes the reinvestment of all dividends and distributions. The S&P 500, BCAB and the Lipper Mixed-Asset Target Allocation Growth Funds Index have been adjusted to reflect reinvestment of dividends on securities in the indexes. |
| 2 | The Fund is the successor to the MDT Balanced Fund pursuant to a reorganization that took place on December 8, 2006. Prior to that date, the Fund had no investment operations. Accordingly, the performance information shown for periods prior to that date is that of the MDT Balanced Fund. |
| 3 | The S&P 500 and the BCAB are not adjusted to reflect sales charges, expenses or other fees that the SEC requires to be reflected in the Fund's performance. The indexes are unmanaged and, unlike the Fund, are not affected by cash flows. It is not possible to invest directly in an index. |
| 4 | The start of performance date was October 1, 2002. Class R Shares of the Fund were offered beginning December 12, 2006. Performance results shown before that date are for the Fund's Institutional Shares and have been adjusted for total annual operating expenses applicable to the Fund's Class R Shares. The Fund's Institutional Shares commenced operations on October 1, 2002. Subject to the expense adjustments noted above, the Fund's Class R Shares annual returns would have been substantially similar to those of the Fund's Institutional Shares because shares of each class are invested in the same portfolio of securities. |
Annual Shareholder Report16
GROWTH OF A $10,000 INVESTMENT – INSTITUTIONAL SHARES
The graph below illustrates the hypothetical investment of $10,0001 in the Federated MDT Balanced Fund2 (Institutional Shares) (the “Fund”) from October 1, 2002 (start of performance) to July 31, 2011, compared to the Standard and Poor's 500 Index (S&P 500)3 and the Barclays Capital U.S. Aggregate Bond Index (BCAB).3
| Average Annual Total Returns for the Period Ended 7/31/2011 | |
| 1 Year | 13.99% |
| 5 Years | 1.71% |
| Start of Performance (10/1/2002) | 6.67% |
| Federated MDT Balanced Fund - Institutional Shares | C000035045 | S&P 500 | Lipper Mixed-Asset Target Allocation Growth Funds Index | Barclays Capital U.S. Aggregate Bond Index |
| 10/1/2002 | 10,000 | 10,000 | 10,000 | 10,000 |
| 7/31/2003 | 11,418 | 12,333 | 11,502 | 10,201 |
| 7/31/2004 | 13,174 | 13,956 | 12,892 | 10,695 |
| 7/31/2005 | 15,388 | 15,918 | 14,499 | 11,207 |
| 7/31/2006 | 16,252 | 16,770 | 15,438 | 11,371 |
| 7/31/2007 | 17,977 | 19,478 | 17,581 | 12,005 |
| 7/31/2008 | 17,019 | 17,317 | 16,396 | 12,744 |
| 7/31/2009 | 14,274 | 13,861 | 14,453 | 13,743 |
| 7/31/2010 | 15,521 | 15,778 | 16,258 | 14,968 |
| 7/31/2011 | 17,692 | 18,878 | 18,722 | 15,631 |
41 graphic description end -->
Performance data quoted represents past performance which is no guarantee of future results. Investment return and principal value will fluctuate so that an investor's shares, when redeemed, may be worth more or less than their original cost. Mutual fund performance changes over time and current performance may be lower or higher than what is stated. For current to the most recent month-end performance and after-tax returns, visit FederatedInvestors.com or call 1-800-341-7400. Returns shown do not reflect the deduction of taxes that a shareholder would pay on Fund distributions or the redemption of Fund shares. Mutual funds are not obligations of or guaranteed by any bank and are not federally insured.
| 1 | The Fund's performance assumes the reinvestment of all dividends and distributions. The S&P 500, BCAB and the Lipper Mixed-Asset Target Allocation Growth Funds Index have been adjusted to reflect reinvestment of dividends on securities in the indexes. |
| 2 | The Fund is the successor to the MDT Balanced Fund pursuant to a reorganization that took place on December 8, 2006. Prior to that date, the Fund had no investment operations. Accordingly, the performance information shown for periods prior to that date is that of the MDT Balanced Fund. |
| 3 | The S&P 500 and BCAB are not adjusted to reflect sales charges, expenses or other fees that the SEC requires to be reflected in the Fund's performance. The indexes are unmanaged and, unlike the Fund, are not affected by cash flows. It is not possible to invest directly in an index. |
Annual Shareholder Report17
Portfolio of Investments Summary Tables (unaudited)
At July 31, 2011, the Fund's portfolio composition1 was as follows:
| Security Type | Percentage of
Total Net Assets |
| Domestic Equity Securities | 61.0% |
| Corporate Debt Securities | 18.1% |
| International Equity Securities (including International Exchange-Traded Funds) | 5.6% |
| Mortgage-Backed Securities | 5.4% |
| U.S. Treasury and Agency Securities2 | 2.7% |
| Collateralized Mortgage Obligations | 1.2% |
| Asset-Backed Securities | 1.1% |
| Foreign Debt Securities | 0.6% |
| Municipal Security | 0.1% |
| Cash Equivalents3 | 5.5% |
| Derivative Contracts4,5 | (0.0)% |
| Other Assets and Liabilities — Net6 | (1.3)% |
| TOTAL | 100.0% |
| 1 | See the Fund's Prospectus for a description of the principal types of securities in which the Fund invests. As of the date specified above, the Fund owned shares of one or more affiliated investment companies. For purposes of this table, the affiliated investment company (other than an affiliated money market mutual fund) is not treated as a single portfolio security, but rather the Fund is treated as owning a pro rata portion of each security and each other asset and liability owned by the affiliated investment company. Accordingly, the percentages of total net assets shown in the table will differ from those presented on the Portfolio of Investments. |
| 2 | Also includes $168,673 held in U.S. Treasuries pledged as collateral to ensure the Fund is able to satisfy the obligations of its outstanding futures contracts. |
| 3 | Cash Equivalents include any investments in money market mutual funds and/or overnight repurchase agreements. |
| 4 | Represents less than 0.1%. |
| 5 | Based upon net unrealized appreciation (depreciation) or value of the derivative contracts as applicable. Derivative contracts may consist of futures, forwards, options and swaps. The impact of a derivative contract on the Fund's performance may be larger than its unrealized appreciation (depreciation) or value may indicate. In many cases, the notional value or amount of a derivative contract may provide a better indication of the contract's significance to the portfolio. More complete information regarding the Fund's direct investments in derivative contracts, including unrealized appreciation (depreciation), value and notional values or amounts of such contracts, can be found in the table at the end of the Portfolio of Investments included in this Report. |
| 6 | Assets, other than investments in securities and derivative contracts, less liabilities. See Statement of Assets and Liabilities. |
Annual Shareholder Report
18
At July 31, 2011, the Fund's industry composition7 for its equity securities (excluding international exchange-traded funds) was as follows:| Industry Composition | Percentage of
Equity Securities |
| Regional Banks | 5.0% |
| Real Estate Investment Trusts | 4.9% |
| Oil Well Supply | 4.6% |
| Money Center Bank | 3.7% |
| Services to Medical Professionals | 3.6% |
| Discount Department Stores | 3.3% |
| Integrated Domestic Oil | 3.3% |
| Oil Refiner | 3.0% |
| Broadcasting | 2.9% |
| Computer Peripherals | 2.6% |
| Specialty Retailing | 2.3% |
| Diversified Oil | 2.2% |
| Financial Services | 2.1% |
| Hotels and Motels | 2.1% |
| Personal Loans | 2.1% |
| AT&T Divestiture | 2.0% |
| Multi-Line Insurance | 2.0% |
| Department Stores | 1.9% |
| Agricultural Chemicals | 1.8% |
| Crude Oil & Gas Production | 1.8% |
| Electronic Test/ Manufacturing Equipment | 1.8% |
| Software Packaged/Custom | 1.8% |
| Integrated International Oil | 1.7% |
| Oil Service, Explore & Drill | 1.6% |
| Building Supply Stores | 1.5% |
| Computers — Midrange | 1.5% |
| Internet Services | 1.5% |
| Semiconductor Distribution | 1.4% |
| Multi-Industry Capital Goods | 1.2% |
Annual Shareholder Report19
| Industry Composition | Percentage of
Equity Securities |
| Cable TV | 1.1% |
| Ethical Drugs | 1.1% |
| Restaurants | 1.1% |
| Cosmetics & Toiletries | 1.0% |
| Pollution Control | 1.0% |
| Other8 | 23.5% |
| TOTAL | 100.0% |
| 7 | Industry classifications are based upon, and individual portfolio securities are assigned to, the classifications of the Global Industry Classification Standard (GICS) except that the Adviser assigns a classification to securities not classified by the GICS and to securities for which the Adviser does not have access to the classification made by the GICS. |
| 8 | For purposes of this table, industry classifications which constitute less than 1.0% of the Fund's equity securities have been aggregated under the designation “Other.” |
Annual Shareholder Report20
Portfolio of Investments
July 31, 2011
Principal
Amount
or Shares | | | Value |
| | COMMON STOCKS – 61.6% | |
| | Agricultural Chemicals – 1.1% | |
| 23,100 | | Bunge Ltd. | 1,589,511 |
| 1,100 | | Scotts Co. | 55,506 |
| | TOTAL | 1,645,017 |
| | Airline — Regional – 0.4% | |
| 9,700 | 1 | Alaska Air Group, Inc. | 592,864 |
| | Aluminum – 0.2% | |
| 17,506 | 1 | Century Aluminum Co. | 227,928 |
| | Apparel – 0.4% | |
| 3,836 | 1 | Ann, Inc. | 99,506 |
| 1,767 | 1 | Carter's, Inc. | 59,194 |
| 2,503 | 1 | Express, Inc. | 56,167 |
| 476 | | Oxford Industries, Inc. | 18,650 |
| 551 | 1 | True Religion Apparel, Inc. | 18,563 |
| 3,100 | 1 | Under Armour, Inc., Class A | 227,571 |
| 2,883 | 1 | Warnaco Group, Inc. | 153,664 |
| | TOTAL | 633,315 |
| | AT&T Divestiture – 1.2% | |
| 52,100 | | Verizon Communications | 1,838,609 |
| | Auto Original Equipment Manufacturers – 0.3% | |
| 200 | 1 | AutoZone, Inc. | 57,090 |
| 734 | 1 | Dana Holding Corp. | 12,236 |
| 1,429 | | Meritor, Inc. | 19,292 |
| 2,900 | 1 | O'Reilly Automotive, Inc. | 172,550 |
| 783 | | Sun Hydraulics, Inc. | 22,323 |
| 3,563 | 1 | Tenneco Automotive, Inc. | 142,306 |
| | TOTAL | 425,797 |
| | Auto Dealerships – 0.0% | |
| 601 | | Group 1 Automotive, Inc. | 28,626 |
| | Auto Part Replacement – 0.1% | |
| 2,500 | | Genuine Parts Co. | 132,900 |
| | Auto Rentals – 0.1% | |
| 556 | 1 | AMERCO | 50,118 |
| 2,695 | 1 | Avis Budget Group, Inc. | 40,721 |
Annual Shareholder Report21
Principal
Amount
or Shares | | | Value |
| 2,026 | 1 | United Rentals, Inc. | 46,618 |
| | TOTAL | 137,457 |
| | Biotechnology – 0.2% | |
| 383 | 1 | Air Methods Corp. | 26,848 |
| 4,100 | 1 | Illumina, Inc. | 256,045 |
| 751 | 1 | Medicines Co. | 11,250 |
| 1,036 | 1 | Parexel International Corp. | 21,269 |
| 722 | 1 | Questcor Pharmaceuticals, Inc. | 22,418 |
| | TOTAL | 337,830 |
| | Broadcasting –��1.8 | |
| 53,600 | 1 | DIRECTV — Class A | 2,716,448 |
| | Building Materials – 0.0% | |
| 243 | 1 | Trex Co., Inc. | 5,122 |
| 796 | | Watsco, Inc. | 47,107 |
| | TOTAL | 52,229 |
| | Building Supply Stores – 0.9% | |
| 31,200 | | Home Depot, Inc. | 1,089,816 |
| 15,100 | | Lowe's Cos., Inc. | 325,858 |
| | TOTAL | 1,415,674 |
| | Business Services – 0.1% | |
| 1,875 | 1 | Wright Express Corp. | 92,250 |
| | Cable & Wireless Television – 0.6% | |
| 13,700 | 1 | Discovery Communications, Inc. | 545,260 |
| 3,900 | | Time Warner Cable, Inc. | 285,909 |
| | TOTAL | 831,169 |
| | Cable TV – 0.7% | |
| 26,500 | | CBS Corp., Class B | 725,305 |
| 6,800 | 1 | Liberty Global, Inc., Class A | 284,240 |
| | TOTAL | 1,009,545 |
| | Carpets – 0.0% | |
| 289 | | Interface, Inc. | 4,630 |
| 1,100 | 1 | Mohawk Industries, Inc. | 57,233 |
| | TOTAL | 61,863 |
| | Clothing Stores – 0.4% | |
| 1,884 | 1 | Aeropostale, Inc. | 31,746 |
| 3,300 | | American Eagle Outfitters, Inc. | 43,362 |
| 506 | | Cato Corp., Class A | 14,077 |
Annual Shareholder Report22
Principal
Amount
or Shares | | | Value |
| 3,200 | 1 | Fossil, Inc. | 402,144 |
| 5,700 | | Gap (The), Inc. | 109,953 |
| 936 | 1 | Jos A. Bank Clothiers, Inc. | 48,026 |
| | TOTAL | 649,308 |
| | Commodity Chemicals – 0.3% | |
| 738 | | Newmarket Corp. | 121,047 |
| 3,900 | | PPG Industries, Inc. | 328,380 |
| | TOTAL | 449,427 |
| | Computer Peripherals – 1.6% | |
| 5,212 | 1 | Fortinet, Inc. | 105,908 |
| 32,400 | 1 | NetApp, Inc. | 1,539,648 |
| 16,000 | 1 | Sandisk Corp. | 680,480 |
| 954 | | Silicon Graphics International Corp. | 13,614 |
| 516 | 1 | Synaptics, Inc. | 12,678 |
| 2,800 | 1 | Western Digital Corp. | 96,488 |
| | TOTAL | 2,448,816 |
| | Computer Services – 0.2% | |
| 263 | 1 | CACI International, Inc., Class A | 15,538 |
| 1,113 | 1 | Manhattan Associates, Inc. | 41,515 |
| 7,500 | 1 | Synnex Corp. | 212,400 |
| 866 | 1 | Unisys Corp. | 17,987 |
| | TOTAL | 287,440 |
| | Computer Stores – 0.4% | |
| 2,557 | 1 | Insight Enterprises, Inc. | 43,034 |
| 11,300 | 1 | Tech Data Corp. | 527,371 |
| | TOTAL | 570,405 |
| | Computers - Midrange – 1.0% | |
| 40,700 | | Hewlett-Packard Co. | 1,431,012 |
| | Construction Machinery – 0.3% | |
| 309 | | NACCO Industries, Inc., Class A | 28,082 |
| 14,900 | | Trinity Industries, Inc. | 443,871 |
| | TOTAL | 471,953 |
| | Cosmetics & Toiletries – 0.6% | |
| 2,100 | | Avon Products, Inc. | 55,083 |
| 2,600 | | Estee Lauder Cos., Inc., Class A | 272,766 |
| 1,845 | 1 | Revlon, Inc., Class A | 31,070 |
| 4,396 | 1 | Sally Beauty Holdings, Inc. | 75,611 |
Annual Shareholder Report23
Principal
Amount
or Shares | | | Value |
| 8,099 | 1 | Ulta Salon Cosmetics & Fragrance, Inc. | 510,480 |
| | TOTAL | 945,010 |
| | Consumer Goods – 0.0% | |
| 781 | | Pool Corp. | 20,892 |
| | Crude Oil & Gas Production – 1.1% | |
| 1,169 | | Berry Petroleum Co., Class A | 67,042 |
| 40,200 | | Chesapeake Energy Corp. | 1,380,870 |
| 721 | 1 | Clayton Williams Energy, Inc. | 47,817 |
| 306 | 1 | Gulfport Energy Corp. | 11,157 |
| 1,291 | 1 | Rosetta Resources, Inc. | 66,835 |
| 1,620 | 1 | Stone Energy Corp. | 52,585 |
| 2,144 | | W&T Offshore, Inc. | 58,102 |
| | TOTAL | 1,684,408 |
| | Defense Aerospace – 0.1% | |
| 1,400 | 1 | Aerovironment, Inc. | 40,362 |
| 2,900 | 1 | BE Aerospace, Inc. | 115,420 |
| 320 | | Heico Corp. | 16,723 |
| | TOTAL | 172,505 |
| | Defense Electronics – 0.2% | |
| 6,000 | | Northrop Grumman Corp. | 363,060 |
| | Department Stores – 1.2% | |
| 8,900 | 1 | Kohl's Corp. | 486,919 |
| 3,600 | | Penney (J.C.) Co., Inc. | 110,736 |
| 2,832 | 1 | Saks, Inc. | 30,416 |
| 2,200 | 1 | Sears Holdings Corp. | 153,274 |
| 19,200 | | Target Corp. | 988,608 |
| | TOTAL | 1,769,953 |
| | Discount Department Stores – 2.0% | |
| 242 | | PriceSmart, Inc. | 14,162 |
| 57,500 | | Wal-Mart Stores, Inc. | 3,030,825 |
| | TOTAL | 3,044,987 |
| | Diversified Leisure – 0.3% | |
| 3,864 | 1 | Coinstar, Inc. | 188,795 |
| 5,600 | 1 | Las Vegas Sand Corp. | 264,208 |
| | TOTAL | 453,003 |
| | Diversified Oil – 1.4% | |
| 32,100 | | Murphy Oil Corp. | 2,061,462 |
Annual Shareholder Report24
Principal
Amount
or Shares | | | Value |
| | Drug Stores – 0.5% | |
| 20,700 | | Walgreen Co. | 808,128 |
| | Education and Training Services – 0.2% | |
| 1,500 | 1 | Apollo Group, Inc., Class A | 76,245 |
| 388 | 1 | Capella Education Co. | 16,587 |
| 800 | 1 | ITT Educational Services, Inc. | 68,536 |
| 419 | | Strayer Education, Inc. | 50,971 |
| | TOTAL | 212,339 |
| | Electric & Electronic Original Equipment Manufacturers – 0.1% | |
| 601 | 1 | Altra Holdings, Inc. | 13,366 |
| 2,500 | 1 | General Cable Corp. | 99,425 |
| | TOTAL | 112,791 |
| | Electric Utility – 0.6% | |
| 33,000 | 1 | Calpine Corp. | 536,250 |
| 11,900 | | Portland General Electric Co. | 294,882 |
| | TOTAL | 831,132 |
| | Electrical Equipment – 0.1% | |
| 784 | | Belden, Inc. | 28,891 |
| 1,135 | 1 | Littelfuse, Inc. | 57,987 |
| | TOTAL | 86,878 |
| | Electronic Instruments – 0.0% | |
| 308 | | Computer Programs and Systems, Inc. | 22,607 |
| 218 | 1 | FEI Co. | 7,203 |
| 281 | 1 | OYO Geospace Corp. | 28,502 |
| | TOTAL | 58,312 |
| | Electronic Test/Measuring Equipment – 1.1% | |
| 39,800 | 1 | Agilent Technologies, Inc. | 1,677,968 |
| 713 | | MTS Systems Corp. | 28,099 |
| | TOTAL | 1,706,067 |
| | Electronics Stores – 0.1% | |
| 7,300 | | Best Buy Co., Inc. | 201,480 |
| | Ethical Drugs – 0.7% | |
| 26,900 | | Lilly (Eli) & Co. | 1,030,270 |
| | Financial Services – 1.3% | |
| 774 | | Deluxe Corp. | 18,220 |
| 35,300 | | Discover Financial Services | 904,033 |
| 3,400 | | Mastercard, Inc., Class A | 1,031,050 |
Annual Shareholder Report25
Principal
Amount
or Shares | | | Value |
| 1,900 | | Nelnet, Inc., Class A | 38,304 |
| | TOTAL | 1,991,607 |
| | Food Wholesaling – 0.2% | |
| 8,100 | | Sysco Corp. | 247,779 |
| | Furniture – 0.1% | |
| 1,105 | 1 | Select Comfort Corp. | 18,586 |
| 1,972 | 1 | Tempur-Pedic International, Inc. | 142,004 |
| | TOTAL | 160,590 |
| | Generic Drugs – 0.1% | |
| 1,211 | 1 | Impax Laboratories, Inc. | 25,649 |
| 1,441 | 1 | Jazz Pharmaceuticals, Inc. | 58,317 |
| 1,003 | | Medicis Pharmaceutical Corp., Class A | 37,292 |
| 817 | 1 | Par Pharmaceutical Cos, Inc. | 26,463 |
| | TOTAL | 147,721 |
| | Grocery Chain – 0.5% | |
| 757 | | Casey's General Stores, Inc. | 34,065 |
| 8,200 | | Kroger Co. | 203,934 |
| 960 | | Ruddick Corp. | 40,224 |
| 7,100 | | Safeway, Inc. | 143,207 |
| 5,100 | | Whole Foods Market, Inc. | 340,170 |
| | TOTAL | 761,600 |
| | Health Care – 0.0% | |
| 511 | 1 | HealthSouth Corp. | 12,468 |
| | Health Care Technology – 0.0% | |
| 231 | 1 | athenahealth, Inc. | 13,581 |
| | Home Building – 0.1% | |
| 15,900 | 1 | Pulte Group, Inc. | 109,233 |
| | Home Health Care – 0.0% | |
| 334 | 1 | Amerigroup Corp. | 18,370 |
| 431 | 1 | Wellcare Health Plans, Inc. | 18,899 |
| | TOTAL | 37,269 |
| | Home Products – 0.2% | |
| 900 | 1 | Energizer Holdings, Inc. | 72,576 |
| 2,953 | | Tupperware Brands Corp. | 184,533 |
| | TOTAL | 257,109 |
| | Hospitals – 0.0% | |
| 867 | | Ensign Group, Inc. | 24,623 |
Annual Shareholder Report26
Principal
Amount
or Shares | | | Value |
| | Hotels – 0.1% | |
| 2,200 | | Starwood Hotels & Resorts | 120,912 |
| | Hotels and Motels – 1.3% | |
| 12,600 | | Wynn Resorts Ltd. | 1,936,368 |
| | Household Appliances – 0.1% | |
| 2,600 | | Whirlpool Corp. | 179,998 |
| | Industrial Machinery – 0.5% | |
| 782 | | Actuant Corp. | 19,323 |
| 337 | | Gorman Rupp Co. | 10,980 |
| 4,400 | | Graco, Inc. | 193,292 |
| 7,552 | 1 | Polypore International, Inc. | 513,536 |
| | TOTAL | 737,131 |
| | Integrated Domestic Oil – 2.0% | |
| 42,300 | | ConocoPhillips | 3,045,177 |
| | Integrated International Oil – 1.0% | |
| 14,900 | | Chevron Corp. | 1,549,898 |
| | International Bank – 0.1% | |
| 1,977 | 1 | Signature Bank | 116,959 |
| | Internet Services – 0.9% | |
| 6,699 | 1 | Ancestry.com, Inc. | 238,551 |
| 2,100 | 1 | Priceline.com, Inc. | 1,129,065 |
| 343 | 1 | Travelzoo, Inc. | 18,111 |
| | TOTAL | 1,385,727 |
| | Leasing – 0.0% | |
| 717 | 1 | RSC Holdings, Inc. | 8,561 |
| | Life Insurance – 0.3% | |
| 8,500 | | Prudential Financial | 498,780 |
| | Machined Parts Original Equipment Manufacturers – 0.0% | |
| 956 | | Applied Industrial Technologies, Inc. | 30,516 |
| | Mail Order – 0.0% | |
| 202 | 1 | HSN, Inc. | 6,603 |
| | Maritime – 0.0% | |
| 1,297 | | Frontline Ltd. | 14,916 |
| 557 | | Golar LNG Ltd. | 21,238 |
| | TOTAL | 36,154 |
| | Meat Packing – 0.4% | |
| 24,600 | 1 | Smithfield Foods, Inc. | 541,692 |
Annual Shareholder Report27
Principal
Amount
or Shares | | | Value |
| | Medical Supplies – 0.1% | |
| 482 | 1 | Medidata Solutions, Inc. | 9,847 |
| 316 | 1 | Orthofix International NV | 13,345 |
| 1,352 | | Owens & Minor, Inc. | 41,236 |
| 1,236 | | Steris Corp. | 43,248 |
| | TOTAL | 107,676 |
| | Medical Technology – 0.4% | |
| 554 | 1 | Arthrocare Corporation | 18,310 |
| 5,500 | 1 | Edwards Lifesciences Corp. | 392,425 |
| 654 | 1 | Integra Lifesciences Corp. | 29,476 |
| 200 | 1 | Intuitive Surgical, Inc. | 80,110 |
| | TOTAL | 520,321 |
| | Metal Fabrication – 0.2% | |
| 1,271 | | Barnes Group, Inc. | 30,949 |
| 895 | | Mueller Industries, Inc. | 33,589 |
| 5,800 | 1 | RTI International Metals | 186,006 |
| 3,743 | | Worthington Industries, Inc. | 78,491 |
| | TOTAL | 329,035 |
| | Miscellaneous Communications – 0.0% | |
| 2,029 | 1 | Leap Wireless International, Inc. | 27,310 |
| | Miscellaneous Components – 0.4% | |
| 11,200 | 1 | Fairchild Semiconductor International, Inc., Class A | 168,112 |
| 4,800 | 1 | International Rectifier Corp. | 123,312 |
| 1,111 | 1 | MKS Instruments, Inc. | 27,719 |
| 1,305 | 1 | TriMas Corp. | 31,281 |
| 22,000 | 1 | Vishay Intertechnology, Inc. | 302,940 |
| | TOTAL | 653,364 |
| | Miscellaneous Food Products – 0.1% | |
| 5,400 | | Fresh Del Monte Produce, Inc. | 132,354 |
| | Miscellaneous Machinery – 0.1% | |
| 644 | 1 | Colfax Corp. | 17,433 |
| 2,336 | | Nordson Corp. | 119,206 |
| 900 | | SPX Corp. | 67,716 |
| | TOTAL | 204,355 |
| | Miscellaneous Metals – 0.0% | |
| 508 | | Haynes International, Inc. | 31,821 |
| | Money Center Bank – 2.3% | |
| 1,500 | | International Bancshares Corp. | 25,230 |
Annual Shareholder Report28
Principal
Amount
or Shares | | | Value |
| 77,500 | | JPMorgan Chase & Co. | 3,134,875 |
| 7,500 | | State Street Corp. | 311,025 |
| | TOTAL | 3,471,130 |
| | Multi-Industry Basic – 0.1% | |
| 4,135 | | Olin Corp. | 86,463 |
| | Multi-Industry Capital Goods – 0.7% | |
| 1,423 | | Acuity Brands, Inc. Holding Company | 69,286 |
| 4,100 | 1 | Ceradyne, Inc. | 132,881 |
| 48,800 | | General Electric Co. | 874,008 |
| | TOTAL | 1,076,175 |
| | Multi-Industry Transportation – 0.2% | |
| 1,572 | | Brinks Co. (The) | 46,909 |
| 2,800 | | FedEx Corp. | 243,264 |
| | TOTAL | 290,173 |
| | Multi-Line Insurance – 1.2% | |
| 3,400 | 1 | CNO Financial Group, Inc. | 24,990 |
| 1,300 | | FBL Financial Group, Inc., Class A | 40,924 |
| 67,300 | | Lincoln National Corp. | 1,783,450 |
| | TOTAL | 1,849,364 |
| | Multi-Line Retail – 0.1% | |
| 5,800 | | Macy's, Inc. | 167,446 |
| | Newspaper Publishing – 0.1% | |
| 200 | | Washington Post Co., Class B | 80,460 |
| | Nickel – 0.1% | |
| 3,740 | 1 | Globe Specialty Metals, Inc. | 86,319 |
| | Office Furniture – 0.1% | |
| 524 | | HNI Corp. | 10,957 |
| 2,551 | | Knoll, Inc. | 46,556 |
| 804 | | Miller Herman, Inc. | 18,500 |
| | TOTAL | 76,013 |
| | Office Supplies – 0.0% | |
| 675 | | United Stationers, Inc. | 21,661 |
| | Oil, Gas & Consumable Fuels – 0.0% | |
| 2,042 | 1 | CVR Energy, Inc. | 54,828 |
| | Oil Refiner – 1.8% | |
| 12,300 | 1 | Tesoro Petroleum Corp. | 298,767 |
Annual Shareholder Report29
Principal
Amount
or Shares | | | Value |
| 97,800 | | Valero Energy Corp. | 2,456,736 |
| 700 | 1 | Western Refining, Inc. | 14,301 |
| | TOTAL | 2,769,804 |
| | Oil Service, Explore & Drill – 1.0% | |
| 332 | 1 | Basic Energy Services, Inc. | 10,754 |
| 1,389 | 1 | Complete Production Services, Inc. | 54,004 |
| 9,900 | 1 | Comstock Resources, Inc. | 315,810 |
| 14,800 | 1 | Helix Energy Solutions Group, Inc. | 289,784 |
| 2,400 | 1 | SEACOR Holdings, Inc. | 240,864 |
| 9,000 | 1 | Unit Corp. | 540,090 |
| | TOTAL | 1,451,306 |
| | Oil Well Supply – 2.8% | |
| 4,223 | | Carbo Ceramics, Inc. | 659,084 |
| 51,300 | | Halliburton Co. | 2,807,649 |
| 4,907 | | RPC, Inc. | 115,903 |
| 7,600 | | Schlumberger Ltd. | 686,812 |
| | TOTAL | 4,269,448 |
| | Other Communications Equipment – 0.0% | |
| 361 | 1 | Netgear, Inc. | 11,881 |
| | Packaged Food – 0.0% | |
| 447 | 1 | United Natural Foods, Inc. | 18,662 |
| | Paint & Related Materials – 0.1% | |
| 741 | 1 | Ferro Corp. | 9,648 |
| 1,700 | | Sherwin-Williams Co. | 131,189 |
| | TOTAL | 140,837 |
| | Paper Products – 0.2% | |
| 5,800 | 1 | Boise, Inc. | 40,194 |
| 8,100 | | International Paper Co. | 240,570 |
| 346 | | Rock-Tenn Co. | 21,265 |
| | TOTAL | 302,029 |
| | Personal & Household – 0.1% | |
| 2,029 | | Nu Skin Enterprises, Inc. | 76,169 |
| | Personal Loans – 1.3% | |
| 40,800 | | Capital One Financial Corp. | 1,950,240 |
| 204 | | Cash America International, Inc. | 11,416 |
| | TOTAL | 1,961,656 |
Annual Shareholder Report30
Principal
Amount
or Shares | | | Value |
| | Personnel Agency – 0.0% | |
| 1,200 | | Manpower, Inc. | 60,624 |
| | Photo-Optical Component-Equipment – 0.3% | |
| 1,487 | | Cognex Corp. | 50,484 |
| 582 | 1 | Coherent, Inc. | 27,953 |
| 1,658 | 1 | II-VI, Inc. | 41,500 |
| 5,453 | 1 | IPG Photonics Corp. | 328,216 |
| | TOTAL | 448,153 |
| | Pollution Control – 0.6% | |
| 269 | | CLARCOR, Inc. | 11,852 |
| 18,500 | | Danaher Corp. | 908,535 |
| | TOTAL | 920,387 |
| | Poultry Products – 0.1% | |
| 7,800 | | Tyson Foods, Inc., Class A | 136,968 |
| | Printed Circuit Boards – 0.1% | |
| 7,000 | 1 | Sanmina-SCI Corporation | 79,800 |
| | Printing – 0.0% | |
| 340 | 1 | Consolidated Graphics, Inc. | 17,541 |
| | Property Liability Insurance – 0.1% | |
| 1,300 | | RLI Corp. | 82,095 |
| | Railroad – 0.2% | |
| 2,666 | 1 | Genesee & Wyoming, Inc., Class A | 146,737 |
| 2,900 | 1 | Kansas City Southern Industries, Inc. | 172,115 |
| | TOTAL | 318,852 |
| | Real Estate Investment Trusts – 3.0% | |
| 1,700 | | Alexandria Real Estate Equities, Inc. | 139,400 |
| 5,000 | | American Campus Communities, Inc. | 186,100 |
| 16,000 | | American Capital Agency Corp. | 446,720 |
| 56,000 | | Annaly Capital Management, Inc. | 939,680 |
| 1,600 | | Boston Properties, Inc. | 171,776 |
| 9,600 | | Digital Realty Trust, Inc. | 587,616 |
| 27,056 | | Host Hotels & Resorts, Inc. | 428,838 |
| 12,500 | | Plum Creek Timber Co., Inc. | 477,750 |
| 9,820 | | ProLogis, Inc. | 349,887 |
| 1,991 | | Simon Property Group, Inc. | 239,935 |
| 15,000 | | Tanger Factory Outlet Centers, Inc. | 411,750 |
| 3,000 | | Taubman Centers, Inc. | 179,700 |
| | TOTAL | 4,559,152 |
Annual Shareholder Report31
Principal
Amount
or Shares | | | Value |
| | Recreational Goods – 0.0% | |
| 676 | | Sturm Ruger & Co., Inc. | 18,468 |
| | Recreational Vehicles – 0.0% | |
| 95 | | Polaris Industries, Inc. | 11,262 |
| | Regional Banks – 3.1% | |
| 9,100 | | Associated Banc Corp. | 124,215 |
| 5,400 | | BB&T Corp. | 138,672 |
| 200 | | Cathay Bancorp, Inc. | 2,772 |
| 5,200 | | Comerica, Inc. | 166,556 |
| 24,300 | | Huntington Bancshares, Inc. | 146,894 |
| 39,400 | | KeyCorp | 316,776 |
| 32,000 | | PNC Financial Services Group | 1,737,280 |
| 4,500 | | SunTrust Banks, Inc. | 110,205 |
| 45,500 | | Wells Fargo & Co. | 1,271,270 |
| 28,700 | | Zions Bancorp | 628,530 |
| | TOTAL | 4,643,170 |
| | Restaurant – 0.7% | |
| 2,000 | 1 | BJ's Restaurants, Inc. | 92,740 |
| 1,009 | 1 | Buffalo Wild Wings, Inc. | 64,102 |
| 2,100 | 1 | Chipotle Mexican Grill, Inc. | 681,618 |
| 794 | | Cracker Barrel Old Country Store, Inc. | 35,817 |
| 657 | | P. F. Chang's China Bistro, Inc. | 21,635 |
| 800 | 1 | Panera Bread Co. | 92,248 |
| | TOTAL | 988,160 |
| | Roofing & Wallboard – 0.0% | |
| 609 | 1 | Beacon Roofing Supply, Inc. | 13,020 |
| | Rubber – 0.0% | |
| 1,097 | | Cooper Tire & Rubber Co. | 18,495 |
| | Savings & Loan – 0.4% | |
| 51,200 | | People's United Financial, Inc. | 649,216 |
| | Securities Brokerage – 0.0% | |
| 2,200 | 1 | E*Trade Financial Corp. | 34,936 |
| | Semiconductor Distribution – 0.9% | |
| 23,300 | 1 | Arrow Electronics, Inc. | 809,675 |
| 18,300 | 1 | Avnet, Inc. | 536,190 |
| | TOTAL | 1,345,865 |
| | Semiconductor Manufacturing – 0.0% | |
| 397 | 1 | Omnivision Technologies, Inc. | 11,608 |
Annual Shareholder Report32
Principal
Amount
or Shares | | | Value |
| | Semiconductor Manufacturing Equipment – 0.1% | |
| 1,982 | 1 | Brooks Automation, Inc. | 18,849 |
| 3,838 | 1 | GT Solar International, Inc. | 52,350 |
| 1,112 | 1 | Mentor Graphics Corp. | 12,710 |
| 1,810 | 1 | Veeco Instruments, Inc. | 72,020 |
| | TOTAL | 155,929 |
| | Services to Medical Professionals – 2.2% | |
| 5,800 | | Aetna, Inc. | 240,642 |
| 309 | 1 | Centene Corp. | 10,138 |
| 1,600 | 1 | Coventry Health Care, Inc. | 51,200 |
| 9,800 | | Humana, Inc. | 730,884 |
| 1,323 | 1 | PSS World Medical, Inc. | 31,659 |
| 4,100 | | Quest Diagnostics, Inc. | 221,441 |
| 22,800 | | UnitedHealth Group, Inc. | 1,131,564 |
| 13,200 | 1 | Wellpoint, Inc. | 891,660 |
| | TOTAL | 3,309,188 |
| | Shoes – 0.4% | |
| 4,419 | 1 | CROCs, Inc. | 138,447 |
| 896 | 1 | DSW, Inc. | 47,470 |
| 2,900 | 1 | Deckers Outdoor Corp. | 287,825 |
| 1,749 | | Wolverine World Wide, Inc. | 66,235 |
| | TOTAL | 539,977 |
| | Silver Production – 0.0% | |
| 1,900 | 1 | Coeur d'Alene Mines Corp. | 51,851 |
| | Soft Drinks – 0.3% | |
| 4,600 | 1 | Coca-Cola Enterprises, Inc. | 129,306 |
| 9,700 | | Dr. Pepper Snapple Group, Inc. | 366,272 |
| | TOTAL | 495,578 |
| | Software Packaged/Custom – 1.1% | |
| 692 | 1 | ACI Worldwide, Inc. | 25,023 |
| 649 | 1 | Acxiom Corp. | 8,917 |
| 1,469 | 1 | Aspen Technology, Inc. | 22,770 |
| 1,009 | 1 | Blue Coat Systems, Inc. | 20,331 |
| 580 | 1 | BroadSoft, Inc. | 16,942 |
| 6,200 | | CA, Inc. | 138,260 |
| 2,200 | | Computer Sciences Corp. | 77,616 |
| 422 | 1 | Dealertrack Holdings, Inc. | 9,786 |
| 600 | 1 | F5 Networks, Inc. | 56,088 |
Annual Shareholder Report33
Principal
Amount
or Shares | | | Value |
| 4,500 | 1 | Informatica Corp. | 230,085 |
| 806 | | Marketaxess Holdings, Inc. | 21,061 |
| 2,016 | 1 | Parametric Technology Corp. | 41,912 |
| 959 | 1 | Progress Software Corp. | 23,112 |
| 2,285 | 1 | Quest Software, Inc. | 43,369 |
| 5,700 | 1 | Red Hat, Inc. | 239,856 |
| 4,800 | 1 | Symantec Corp. | 91,488 |
| 4,400 | 1 | VMware, Inc., Class A | 441,496 |
| 3,833 | 1 | ValueClick, Inc. | 69,224 |
| 404 | 1 | Verint Systems, Inc. | 13,744 |
| 1,937 | 1 | Websense, Inc. | 43,931 |
| | TOTAL | 1,635,011 |
| | Specialty Chemicals – 0.4% | |
| 1,900 | | Airgas, Inc. | 130,530 |
| 1,800 | | Ashland, Inc. | 110,232 |
| 432 | | Chemed Corp. | 26,270 |
| 1,527 | 1 | LSB Industries, Inc. | 60,683 |
| 1,700 | 1 | OM Group, Inc. | 61,676 |
| 2,428 | 1 | Rockwood Holdings, Inc. | 146,821 |
| | TOTAL | 536,212 |
| | Specialty Machinery – 0.3% | |
| 5,600 | | Gardner Denver, Inc. | 477,624 |
| | Specialty Retailing – 1.4% | |
| 415 | | Aaron's, Inc. | 10,462 |
| 2,800 | | Abercrombie & Fitch Co., Class A | 204,736 |
| 1,500 | | Advance Auto Parts, Inc. | 82,455 |
| 1,165 | | Ascena Retail Group, Inc. | 37,653 |
| 1,800 | 1 | AutoNation, Inc. | 67,698 |
| 2,400 | 1 | Big Lots, Inc. | 83,592 |
| 26,200 | | CVS Corp. | 952,370 |
| 3,300 | 1 | Dollar General Corp. | 103,818 |
| 344 | 1 | Dorman Products, Inc. | 12,291 |
| 262 | | Finish Line, Inc., Class A | 5,581 |
| 493 | 1 | Lumber Liquidators Holdings, Inc. | 7,745 |
| 2,649 | | Penske Automotive Group, Inc. | 58,622 |
| 2,300 | | PetSmart, Inc. | 98,946 |
| 5,000 | | Staples, Inc. | 80,300 |
Annual Shareholder Report34
Principal
Amount
or Shares | | | Value |
| 1,085 | | Tractor Supply Co. | 71,523 |
| 3,000 | 1 | Vera Bradley, Inc. | 108,810 |
| 2,288 | 1 | Vitamin Shoppe Industries, Inc. | 99,665 |
| 1,700 | | Williams-Sonoma, Inc. | 62,934 |
| | TOTAL | 2,149,201 |
| | Telecommunication Equipment & Services – 0.5% | |
| 595 | | Adtran, Inc. | 19,688 |
| 1,778 | 1 | Anixter International, Inc. | 110,983 |
| 1,001 | 1 | Brightpoint, Inc. | 9,099 |
| 7,800 | | Motorola Solutions, Inc. | 350,142 |
| 4,400 | | Qualcomm, Inc. | 241,032 |
| | TOTAL | 730,944 |
| | Toys & Games – 0.0% | |
| 2,500 | | Mattel, Inc. | 66,650 |
| | Truck Manufacturing – 0.0% | |
| 1,300 | 1 | Navistar International Corp. | 66,703 |
| | Trucking – 0.1% | |
| 2,426 | 1 | Old Dominion Freight Lines, Inc. | 89,883 |
| | Uniforms – 0.0% | |
| 2,000 | | Cintas Corp. | 65,100 |
| | TOTAL COMMON STOCKS
(IDENTIFIED COST $89,586,721) | 93,004,298 |
| | Asset-Backed Securities – 1.1% | |
| $375,000 | | Master Owner Trust 2011-1 A1, Series 2011-1, 1.056%, 1/15/2016 | 376,193 |
| 250,000 | | Banc of America Commercial Mortgage, Inc. 2007-4 A4, 5.742%, 2/10/2051 | 271,265 |
| 29,591 | | CS First Boston Mortgage Securities Corp. 2002-HE4 AF, 5.510%, 8/25/2032 | 24,544 |
| 250,000 | | Ford Credit Floorplan Master Owner Trust 2011-1, Series 2011-1, 0.786%, 2/15/2016 | 250,169 |
| 100,000 | | Merrill Lynch Mortgage Trust 2008-C1 AM, 6.461%, 2/12/2051 | 99,546 |
| 150,000 | | Merrill Lynch Mortgage Trust 2008-C1, Series 2008-C1, 5.425%, 2/12/2051 | 153,838 |
| 250,000 | | Merrill Lynch/Countrywide Commercial Mortgage 2007-6, 5.485%, 3/12/2051 | 268,208 |
| 140,000 | | Morgan Stanley Capital I 2006-IQ12 A4, 5.332%, 12/15/2043 | 150,749 |
| 50,000 | 2,3 | SMART Series 2011-1US Trust A2B, 0.936%, 4/14/2013 | 50,007 |
| | TOTAL ASSET-BACKED SECURITIES
(IDENTIFIED COST $1,595,516) | 1,644,519 |
Annual Shareholder Report35
Principal
Amount
or Shares | | | Value |
| | Collateralized Mortgage Obligations – 0.8% | |
| $2,108 | | Bear Stearns Mortgage Securities, Inc. 1997-6 1A, 7.098%, 3/25/2031 | 2,158 |
| 410,000 | | Citigroup/Deutsche Bank Commercial Mortgage 2007-CD4 A3, 5.293%, 12/11/2049 | 423,062 |
| 450,000 | 2,3 | Federal Home Loan Mortgage Corp., 4.998%, 5/10/2021 | 446,874 |
| 7,115 | | Federal Home Loan Mortgage Corp. REMIC 1311 K, 7.000%, 7/15/2022 | 7,972 |
| 14,843 | | Federal Home Loan Mortgage Corp. REMIC 1384 D, 7.000%, 9/15/2022 | 17,086 |
| 6,375 | | Federal Home Loan Mortgage Corp. REMIC 1595 D, 7.000%, 10/15/2013 | 6,629 |
| 31,957 | | Federal Home Loan Mortgage Corp. REMIC 2497 JH, 6.000%, 9/15/2032 | 35,877 |
| 33,886 | | Federal National Mortgage Association REMIC 1993-113 SB, 7/25/2023 | 39,167 |
| 3,160 | | Federal National Mortgage Association REMIC 2001-37 GA, 8.000%, 7/25/2016 | 3,442 |
| 7,779 | | Federal National Mortgage Association REMIC 2003-35 UC, 3.750%, 5/25/2033 | 8,218 |
| 23,994 | | Government National Mortgage Association REMIC 2002-17 B, 6.000%, 3/20/2032 | 27,017 |
| 195,437 | 2,3 | JPMorgan Chase Commercial Mortgage Securities 2010-C1 A1, 3.853%, 6/15/2043 | 203,155 |
| 50,000 | 2,3 | Morgan Stanley Capital I 2011-C1 B, 5.257%, 9/15/2047 | 51,565 |
| | TOTAL COLLATERALIZED MORTGAGE OBLIGATIONS
(IDENTIFIED COST $1,251,254) | 1,272,222 |
| | Corporate Bonds – 14.3% | |
| | Basic Industry - Chemicals – 0.4% | |
| 100,000 | | Albemarle Corp., Sr. Note, 5.100%, 02/01/2015 | 109,787 |
| 70,000 | | Dow Chemical Co., Note, 8.550%, 05/15/2019 | 92,458 |
| 2,000 | | Du Pont (E.I.) de Nemours & Co., 5.000%, 01/15/2013 | 2,126 |
| 30,000 | | Du Pont (E.I.) de Nemours & Co., 6.000%, 07/15/2018 | 35,677 |
| 20,000 | 2,3 | Incitec Pivot Finance LLC, Company Guarantee, 4.000%, 12/07/2015 | 20,763 |
| 35,000 | 2,3 | Incitec Pivot Finance LLC, Company Guarantee, Series 144A, 6.000%, 12/10/2019 | 38,226 |
| 70,000 | | RPM International, Inc., 6.500%, 02/15/2018 | 79,315 |
| 55,000 | | RPM International, Inc., Sr. Unsecd. Note, 6.125%, 10/15/2019 | 60,384 |
| 75,000 | | Rohm & Haas Co., 6.000%, 09/15/2017 | 87,291 |
| 30,000 | | Sherwin-Williams Co., 3.125%, 12/15/2014 | 31,782 |
| | TOTAL | 557,809 |
| | Basic Industry - Metals & Mining – 0.7% | |
| 50,000 | | Alcan, Inc., 5.000%, 06/01/2015 | 55,890 |
Annual Shareholder Report36
Principal
Amount
or Shares | | | Value |
| $85,000 | | Alcoa, Inc., Note, 5.550%, 02/01/2017 | 93,085 |
| 80,000 | | Allegheny Technologies, Inc., Sr. Note, 9.375%, 06/01/2019 | 104,109 |
| 15,000 | | Anglogold Ashanti Holdings PLC, Sr. Note, 6.500%, 04/15/2040 | 14,687 |
| 10,000 | | ArcelorMittal, 6.125%, 6/01/2018 | 11,024 |
| 100,000 | | ArcelorMittal, Sr. Unsecd. Note, 5.250%, 08/05/2020 | 102,064 |
| 150,000 | | BHP Finance (USA), Inc., Company Guarantee, 5.250%, 12/15/2015 | 172,197 |
| 130,000 | | Barrick Gold Corp., Sr. Unsecd. Note, 6.950%, 4/01/2019 | 159,270 |
| 40,000 | | Carpenter Technology Corp., Sr. Unsecd. Note, 5.200%, 07/15/2021 | 40,995 |
| 50,000 | | Newmont Mining Corp., Company Guarantee, 5.875%, 04/01/2035 | 52,190 |
| 85,000 | | Rio Tinto Finance USA Ltd., Company Guarantee, 6.500%, 07/15/2018 | 102,259 |
| 20,000 | | Southern Copper Corp., Note, 6.750%, 04/16/2040 | 21,263 |
| 60,000 | | Worthington Industries, Inc., Sr. Unsecd. Note, 6.500%, 04/15/2020 | 66,478 |
| | TOTAL | 995,511 |
| | Basic Industry - Paper – 0.1% | |
| 20,000 | | International Paper Co., Bond, 7.300%, 11/15/2039 | 23,142 |
| 105,000 | | International Paper Co., Sr. Unsecd. Note, 7.500%, 08/15/2021 | 128,905 |
| 20,000 | | Plum Creek Timberlands LP, Sr. Unsecd. Note, 4.700%, 03/15/2021 | 20,371 |
| 50,000 | | Weyerhaeuser Co., Deb., 7.375%, 03/15/2032 | 53,837 |
| | TOTAL | 226,255 |
| | Capital Goods - Aerospace & Defense – 0.1% | |
| 50,000 | 2,3 | BAE Systems Holdings, Inc., 5.200%, 08/15/2015 | 55,084 |
| 40,000 | | Goodrich Corp., Sr. Unsecd. Note, 3.600%, 02/01/2021 | 39,524 |
| 30,000 | | Lockheed Martin Corp., Sr. Note, 4.121%, 03/14/2013 | 31,693 |
| 20,000 | | Raytheon Co., Sr. Note, 4.400%, 02/15/2020 | 21,353 |
| | TOTAL | 147,654 |
| | Capital Goods - Building Materials – 0.1% | |
| 105,000 | | Masco Corp., Sr. Unsecd. Note, 7.125%, 03/15/2020 | 107,362 |
| 40,000 | | Valmont Industries, Inc., Sr. Unsecd. Note, 6.625%, 04/20/2020 | 45,718 |
| | TOTAL | 153,080 |
| | Capital Goods - Diversified Manufacturing – 0.5% | |
| 15,000 | | Avery Dennison Corp., Sr. Unsecd. Note, 5.375%, 04/15/2020 | 16,459 |
| 60,000 | | Dover Corp., Note, 5.450%, 03/15/2018 | 68,977 |
| 30,000 | | Emerson Electric Co., 4.875%, 10/15/2019 | 33,467 |
| 100,000 | | Emerson Electric Co., Unsecd. Note, 5.750%, 11/01/2011 | 101,342 |
| 160,000 | | Harsco Corp., 5.750%, 05/15/2018 | 181,417 |
| 80,000 | | Hubbell, Inc., 5.950%, 06/01/2018 | 93,580 |
| 60,000 | | Ingersoll-Rand Global Holding Co. Ltd., 6.875%, 08/15/2018 | 73,313 |
Annual Shareholder Report37
Principal
Amount
or Shares | | | Value |
| $50,000 | | Pentair, Inc., Company Guarantee, 5.000%, 05/15/2021 | 51,865 |
| 90,000 | | Roper Industries, Inc., 6.625%, 08/15/2013 | 99,665 |
| 40,000 | 2,3 | Textron Financial Corp., Jr. Sub. Note, 6.000%, 02/15/2067 | 34,800 |
| 15,000 | | Thomas & Betts Corp., Sr. Unsecd. Note, 5.625%, 11/15/2021 | 16,722 |
| 45,000 | | Tyco International Finance SA, Note, 4.125%, 10/15/2014 | 48,496 |
| | TOTAL | 820,103 |
| | Capital Goods - Environmental – 0.1% | |
| 85,000 | | Republic Services, Inc., Company Guarantee, Series WI, 5.500%, 09/15/2019 | 95,602 |
| 25,000 | | Waste Management, Inc., 7.375%, 03/11/2019 | 31,051 |
| | TOTAL | 126,653 |
| | Capital Goods - Packaging – 0.0% | |
| 30,000 | | Sonoco Products Co., Sr. Unsecd. Note, 5.750%, 11/01/2040 | 30,935 |
| | Communications - Media & Cable – 0.4% | |
| 200,000 | | Comcast Corp., Company Guarantee, 6.500%, 01/15/2017 | 238,328 |
| 20,000 | | Cox Communications, Inc., 7.125%, 10/01/2012 | 21,392 |
| 75,000 | | Cox Communications, Inc., Unsecd. Note, 5.450%, 12/15/2014 | 84,124 |
| 50,000 | | DIRECTV Holdings LLC, Company Guarantee, 6.375%, 03/01/2041 | 54,840 |
| 100,000 | | Time Warner Cable, Inc., Company Guarantee, 6.750%, 06/15/2039 | 114,345 |
| 30,000 | | Time Warner Cable, Inc., Company Guarantee, 8.250%, 04/01/2019 | 38,419 |
| 25,000 | | Time Warner Cable, Inc., Sr. Unsecd. Note, 5.850%, 05/01/2017 | 28,739 |
| | TOTAL | 580,187 |
| | Communications - Media Noncable – 0.2% | |
| 25,000 | | Discovery Communications LLC, Company Guarantee, 5.050%, 06/01/2020 | 27,544 |
| 25,000 | | Moody's Corp., Sr. Unsecd. Note, 5.500%, 09/01/2020 | 26,504 |
| 75,000 | | News America Holdings, Inc., Company Guarantee, 8.000%, 10/17/2016 | 90,796 |
| 100,000 | 2,3 | Pearson Funding Two PLC, Sr. Unsecd. Note, Series 144A, 4.000%, 05/17/2016 | 105,579 |
| | TOTAL | 250,423 |
| | Communications - Telecom Wireless – 0.5% | |
| 150,000 | | AT&T Wireless Services, Inc., 8.750%, 03/01/2031 | 218,113 |
| 100,000 | | America Movil S.A.B. de C.V., Note, 5.750%, 01/15/2015 | 112,920 |
| 100,000 | | Cingular Wireless LLC, Sr. Note, 6.500%, 12/15/2011 | 101,845 |
| 100,000 | 2,3 | Crown Castle Towers LLC, Sr. Secd. Note, Series 144A, 5.495%, 01/15/2017 | 109,506 |
| 30,000 | 2,3 | SBA Tower Trust, Series 144A, 5.101%, 04/15/2017 | 31,652 |
Annual Shareholder Report38
Principal
Amount
or Shares | | | Value |
| $100,000 | | Vodafone Group PLC, Note, 5.625%, 02/27/2017 | 114,716 |
| | TOTAL | 688,752 |
| | Communications - Telecom Wirelines – 0.3% | |
| 100,000 | | CenturyLink, Inc., Sr. Unsecd. Note, 6.450%, 06/15/2021 | 103,358 |
| 125,000 | | Deutsche Telekom International Finance BV, 4.875%, 07/08/2014 | 137,095 |
| 40,000 | | France Telecom SA, Sr. Unsecd. Note, 5.375%, 07/08/2019 | 45,915 |
| 30,000 | | Telefonica Emisiones Sau, Company Guarantee, 5.462%, 02/16/2021 | 30,365 |
| 60,000 | | Verizon Communications, Inc., Sr. Unsecd. Note, 6.350%, 04/01/2019 | 72,455 |
| | TOTAL | 389,188 |
| | Consumer Cyclical - Automotive – 0.2% | |
| 100,000 | 2,3 | American Honda Finance Corp., 4.625%, 04/02/2013 | 105,825 |
| 75,000 | | DaimlerChrysler North America Holding Corp., 6.500%, 11/15/2013 | 83,481 |
| 10,000 | | DaimlerChrysler North America Holding Corp., Company Guarantee, 8.500%, 01/18/2031 | 13,910 |
| 20,000 | 2,3 | Harley-Davidson Financial Services, Inc., Company Guarantee, Series 144A, 3.875%, 03/15/2016 | 20,683 |
| 25,000 | | Johnson Controls, Inc., Sr. Unsecd. Note, 5.000%, 03/30/2020 | 27,296 |
| 80,000 | 2,3 | Nissan Motor Acceptance Corp., Note, 4.500%, 01/30/2015 | 85,469 |
| 20,000 | 2,3 | RCI Banque SA, Sr. Unsecd. Note, Series 144A, 4.600%, 04/12/2016 | 20,920 |
| | TOTAL | 357,584 |
| | Consumer Cyclical - Entertainment – 0.3% | |
| 200,000 | 2 | Football Trust V, Pass Thru Cert., 5.350%, 10/05/2020 | 216,485 |
| 90,000 | 2,3 | NBC Universal, Inc., Sr. Unsecd. Note, Series 144A, 5.150%, 04/30/2020 | 97,862 |
| 60,000 | | Time Warner, Inc., Company Guarantee, 6.200%, 03/15/2040 | 64,709 |
| 40,000 | | Time Warner, Inc., Company Guarantee, 6.250%, 03/29/2041 | 43,406 |
| 10,000 | | Viacom, Inc., Sr. Unsecd. Note, 3.500%, 04/01/2017 | 10,410 |
| | TOTAL | 432,872 |
| | Consumer Cyclical - Lodging – 0.1% | |
| 50,000 | | Choice Hotels International, Inc., Company Guarantee, 5.700%, 08/28/2020 | 52,366 |
| 100,000 | | Wyndham Worldwide Corp., Sr. Unsecd. Note, 6.000%, 12/01/2016 | 108,780 |
| | TOTAL | 161,146 |
| | Consumer Cyclical - Retailers – 0.3% | |
| 70,000 | | Best Buy Co., Inc., Sr. Unsecd. Note, 6.750%, 07/15/2013 | 76,400 |
| 190,000 | | CVS Caremark Corp., Sr. Unsecd. Note, 5.750%, 06/01/2017 | 220,087 |
| 30,000 | | Home Depot, Inc., Sr. Unsecd. Note, 5.950%, 04/01/2041 | 32,588 |
| 85,000 | | JC Penney Corp., Inc., Sr. Unsecd. Note, 5.750%, 02/15/2018 | 87,338 |
Annual Shareholder Report39
Principal
Amount
or Shares | | | Value |
| $25,000 | | Kohl's Corp., Unsecd. Note, 7.375%, 10/15/2011 | 25,358 |
| 10,000 | | O'Reilly Automotive, Inc., Company Guarantee, 4.875%, 01/14/2021 | 10,400 |
| 20,000 | | Wal-Mart Stores, Inc., Sr. Unsecd. Note, 5.625%, 04/15/2041 | 22,164 |
| 40,000 | | Wal-Mart Stores, Inc., Sr. Unsecd. Note, 6.200%, 04/15/2038 | 47,051 |
| | TOTAL | 521,386 |
| | Consumer Cyclical - Services – 0.0% | |
| 10,000 | | eBay, Inc., Sr. Unsecd. Note, 3.250%, 10/15/2020 | 9,706 |
| 15,000 | | Expedia, Inc., Company Guarantee, 5.950%, 08/15/2020 | 15,027 |
| | TOTAL | 24,733 |
| | Consumer Non-Cyclical - Food/Beverage – 0.7% | |
| 100,000 | 2,3 | Bacardi Ltd., Sr. Note, 7.450%, 04/01/2014 | 115,482 |
| 100,000 | | Bottling Group LLC, Note, 5.500%, 04/01/2016 | 116,517 |
| 30,000 | | Coca-Cola Enterprises, Inc., 4.250%, 03/01/2015 | 33,031 |
| 60,000 | | Diageo Capital PLC, Company Guarantee, 7.375%, 01/15/2014 | 69,168 |
| 30,000 | | Dr. Pepper Snapple Group, Inc., Company Guarantee, 2.350%, 12/21/2012 | 30,578 |
| 90,000 | | General Mills, Inc., Note, 5.700%, 02/15/2017 | 105,123 |
| 135,000 | | Kellogg Co., 4.250%, 03/06/2013 | 142,350 |
| 40,000 | | Kellogg Co., Sr. Unsub., 5.125%, 12/03/2012 | 42,381 |
| 75,000 | | Kraft Foods, Inc., Note, 5.250%, 10/01/2013 | 81,699 |
| 110,000 | | Kraft Foods, Inc., Note, 6.250%, 06/01/2012 | 115,266 |
| 90,000 | | Kraft Foods, Inc., Sr. Unsecd. Note, 6.125%, 02/01/2018 | 106,642 |
| 75,000 | | PepsiCo, Inc., 4.650%, 02/15/2013 | 79,666 |
| 20,000 | | Ralcorp Holdings, Inc., Sr. Secd. Note, 6.625%, 08/15/2039 | 20,574 |
| 20,000 | | Sysco Corp., Sr. Note, 5.375%, 03/17/2019 | 23,018 |
| 50,000 | | Sysco Corp., Sr. Unsecd. Note, 4.200%, 02/12/2013 | 52,674 |
| | TOTAL | 1,134,169 |
| | Consumer Non-Cyclical - Health Care – 0.3% | |
| 40,000 | | Baxter International, Inc., 6.250%, 12/01/2037 | 48,022 |
| 50,000 | | Boston Scientific Corp., 4.500%, 01/15/2015 | 53,947 |
| 75,000 | | Boston Scientific Corp., 6.000%, 01/15/2020 | 85,646 |
| 20,000 | | Express Scripts, Inc., Sr. Unsecd. Note, 7.250%, 6/15/2019 | 24,207 |
| 40,000 | | Life Technologies Corp., Sr. Note, 3.375%, 03/01/2013 | 41,267 |
| 90,000 | | Quest Diagnostics, Inc., Sr. Unsecd. Note, 6.400%, 07/01/2017 | 106,635 |
| 50,000 | | Thermo Fisher Scientific, Inc., Sr. Unsecd. Note, 2.150%, 12/28/2012 | 51,014 |
| 10,000 | | Zimmer Holdings, Inc., Sr. Note, 5.750%, 11/30/2039 | 10,756 |
| | TOTAL | 421,494 |
Annual Shareholder Report40
Principal
Amount
or Shares | | | Value |
| | Consumer Non-Cyclical - Pharmaceuticals – 0.3% | |
| $40,000 | | Bio-Rad Laboratories, Inc., Sr. Unsecd. Note, 4.875%, 12/15/2020 | 41,050 |
| 125,000 | | Eli Lilly & Co., Unsecd. Note, 6.570%, 01/01/2016 | 149,711 |
| 100,000 | | Genentech, Inc., Note, 4.750%, 07/15/2015 | 112,084 |
| 40,000 | | Gilead Sciences, Inc., Sr. Unsecd. Note, 4.500%, 04/01/2021 | 41,810 |
| 30,000 | | Pfizer, Inc., Sr. Unsecd. Note, 6.200%, 03/15/2019 | 36,458 |
| | TOTAL | 381,113 |
| | Consumer Non-Cyclical - Products – 0.1% | |
| 10,000 | | Clorox Co., Sr. Unsecd. Note, 3.550%, 11/01/2015 | 10,253 |
| 20,000 | | Hasbro, Inc., Sr. Unsecd. Note, 6.350%, 03/15/2040 | 21,372 |
| 75,000 | | Philips Electronics NV, 5.750%, 03/11/2018 | 85,950 |
| 80,000 | | Whirlpool Corp., 5.500%, 03/01/2013 | 84,742 |
| | TOTAL | 202,317 |
| | Consumer Non-Cyclical - Supermarkets – 0.0% | |
| 40,000 | | Kroger Co., Bond, 6.900%, 04/15/2038 | 48,005 |
| | Consumer Non-Cyclical - Tobacco – 0.1% | |
| 70,000 | | Altria Group, Inc., 9.250%, 08/06/2019 | 93,384 |
| 30,000 | | Philip Morris International, Inc., 5.650%, 05/16/2018 | 34,877 |
| | TOTAL | 128,261 |
| | Energy - Independent – 0.4% | |
| 100,000 | | Apache Corp., Sr. Unsecd. Note, 5.100%, 09/01/2040 | 102,067 |
| 50,000 | | Canadian Natural Resources Ltd., 4.900%, 12/01/2014 | 55,799 |
| 30,000 | | Devon Financing Corp., Company Guarantee, 6.875%, 09/30/2011 | 30,304 |
| 30,000 | | EOG Resources, Inc., Note, 5.625%, 06/01/2019 | 34,878 |
| 150,000 | | Petroleos Mexicanos, Company Guarantee, Series WI, 4.875%, 03/15/2015 | 163,485 |
| 15,000 | | Petroleos Mexicanos, Company Guarantee, Series WI, 6.000%, 03/05/2020 | 16,658 |
| 10,000 | | Talisman Energy, Inc., Sr. Unsecd. Note, 3.750%, 02/01/2021 | 9,843 |
| 75,000 | | XTO Energy, Inc., 6.375%, 06/15/2038 | 96,098 |
| 60,000 | | XTO Energy, Inc., 6.750%, 08/01/2037 | 80,448 |
| | TOTAL | 589,580 |
| | Energy - Integrated – 0.2% | |
| 30,000 | | BP Capital Markets America, Inc., Company Guarantee, 4.200%, 06/15/2018 | 31,229 |
| 20,000 | | BP Capital Markets PLC, Company Guarantee, 3.125%, 10/01/2015 | 21,055 |
| 40,000 | | BP Capital Markets PLC, Company Guarantee, 4.742%, 03/11/2021 | 43,499 |
| 100,000 | | Hess Corp., Sr. Unsecd. Note, 5.600%, 02/15/2041 | 102,733 |
| 100,000 | | Husky Oil Ltd., Deb., 7.550%, 11/15/2016 | 120,746 |
Annual Shareholder Report41
Principal
Amount
or Shares | | | Value |
| $30,000 | | Petrobras International Finance Co., Company Guarantee, 6.750%, 01/27/2041 | 33,748 |
| | TOTAL | 353,010 |
| | Energy - Oil Field Services – 0.1% | |
| 15,000 | | Nabors Industries, Inc., Company Guarantee, 5.000%, 9/15/2020 | 15,751 |
| 15,000 | | Nabors Industries, Inc., Company Guarantee, 9.250%, 01/15/2019 | 19,640 |
| 15,000 | | Noble Holding International Ltd., Company Guarantee, 4.900%, 08/01/2020 | 16,129 |
| 80,000 | | Weatherford International Ltd., 6.000%, 03/15/2018 | 90,643 |
| | TOTAL | 142,163 |
| | Energy - Refining – 0.1% | |
| 10,000 | 2,3 | Marathon Petroleum Corp., Sr. Unsecd. Note, Series 144A, 6.500%, 03/01/2041 | 10,771 |
| 115,000 | | Valero Energy Corp., 7.500%, 04/15/2032 | 136,664 |
| 10,000 | | Valero Energy Corp., 9.375%, 03/15/2019 | 13,216 |
| 35,000 | | Valero Energy Corp., Note, 4.750%, 04/01/2014 | 37,657 |
| | TOTAL | 198,308 |
| | Financial Institution - Banking – 1.9% | |
| 20,000 | | Associated Banc-Corp., Sr. Unsecd. Note, 5.125%, 03/28/2016 | 21,235 |
| 60,000 | | Bank of America Corp., Note, 4.500%, 4/01/2015 | 62,913 |
| 250,000 | | Bank of America Corp., Sr. Note, 7.375%, 5/15/2014 | 280,507 |
| 125,000 | 2,3 | Barclays Bank PLC, 5.926%, 9/29/2049 | 112,885 |
| 130,000 | 4 | Bear Stearns Cos., Inc., Sr. Unsecd. Note, 7.250%, 02/01/2018 | 157,062 |
| 50,000 | | Capital One Financial Corp., Sr. Note, 7.375%, 05/23/2014 | 57,049 |
| 100,000 | | Citigroup, Inc., Sr. Unsecd. Note, 4.587%, 12/15/2015 | 107,062 |
| 20,000 | | Citigroup, Inc., Sr. Unsecd. Note, 6.000%, 12/13/2013 | 21,735 |
| 155,000 | | Citigroup, Inc., Sr. Unsecd. Note, 6.875%, 03/05/2038 | 175,536 |
| 25,000 | | City National Corp., Note, 5.250%, 09/15/2020 | 26,182 |
| 40,000 | 2,3 | Commonwealth Bank of Australia, Sr. Unsecd. Note, Series 144A, 3.750%, 10/15/2014 | 42,359 |
| 150,000 | | Credit Suisse First Boston USA, Inc., 5.125%, 01/15/2014 | 163,675 |
| 40,000 | | Deutsche Bank AG London, Sr. Unsecd. Note, 3.250%, 01/11/2016 | 40,958 |
| 20,000 | | Fifth Third Bancorp, Sr. Unsecd. Note, 3.625%, 01/25/2016 | 20,643 |
| 50,000 | | Goldman Sachs Group, Inc., 6.000%, 05/01/2014 | 54,898 |
| 25,000 | | Goldman Sachs Group, Inc., 6.125%, 02/15/2033 | 25,630 |
| 75,000 | | Goldman Sachs Group, Inc., Bond, 5.150%, 01/15/2014 | 80,268 |
| 70,000 | | Goldman Sachs Group, Inc., Sr. Unsecd. Note, 5.125%, 01/15/2015 | 75,615 |
| 170,000 | | Goldman Sachs Group, Inc., Sr. Unsecd. Note, 6.150%, 4/01/2018 | 187,501 |
Annual Shareholder Report42
Principal
Amount
or Shares | | | Value |
| $50,000 | | HSBC Holdings PLC, Sr. Unsecd. Note, 5.100%, 04/05/2021 | 52,926 |
| 10,000 | | Huntington Bancshares, Inc., Sub. Note, 7.000%, 12/15/2020 | 11,519 |
| 100,000 | | JPMorgan Chase & Co., Sub. Note, 5.125%, 09/15/2014 | 108,316 |
| 90,000 | | M & T Bank Corp., 5.375%, 05/24/2012 | 93,390 |
| 120,000 | | Morgan Stanley, Sr. Unsecd. Note, 3.800%, 04/29/2016 | 121,107 |
| 35,000 | | Morgan Stanley, Sr. Unsecd. Note, 5.950%, 12/28/2017 | 38,076 |
| 70,000 | | Morgan Stanley, Sr. Unsecd. Note, 6.000%, 04/28/2015 | 76,981 |
| 110,000 | | Morgan Stanley, Sr. Unsecd. Note, 6.625%, 04/01/2018 | 122,502 |
| 30,000 | | Northern Trust Corp., 4.625%, 05/01/2014 | 32,889 |
| 100,000 | | PNC Funding Corp., Sub. Note, 5.625%, 02/01/2017 | 111,154 |
| 100,000 | 2,3 | Santander US Debt SA Unipersonal, Bank Guarantee, Series 144A, 3.781%, 10/07/2015 | 94,493 |
| 20,000 | | SunTrust Banks, Inc., Sr. Unsecd. Note, 3.600%, 04/15/2016 | 20,534 |
| 25,000 | | Suntrust Capital VIII, Jr. Sub. Note, 6.100%, 12/15/2036 | 24,452 |
| 30,000 | | Wachovia Corp., 5.750%, 02/01/2018 | 33,794 |
| 70,000 | | Westpac Banking Corp., Sr. Unsecd. Note, 4.875%, 11/19/2019 | 74,564 |
| 100,000 | | Wilmington Trust Corp., Sub. Note, 8.500%, 04/02/2018 | 122,259 |
| | TOTAL | 2,852,669 |
| | Financial Institution - Brokerage – 0.6% | |
| 100,000 | | BlackRock, Inc., 6.250%, 09/15/2017 | 118,445 |
| 20,000 | 2,3 | CME Group Index Services LLC, Company Guarantee, Series 144A, 4.400%, 03/15/2018 | 21,743 |
| 20,000 | 2,3 | Cantor Fitzgerald LP, Bond, Series 144A, 7.875%, 10/15/2019 | 22,395 |
| 45,000 | | Charles Schwab Corp., Sr. Unsecd. Note, 4.950%, 06/01/2014 | 49,602 |
| 120,000 | | Eaton Vance Corp., 6.500%, 10/02/2017 | 141,598 |
| 150,000 | 2,3 | FMR LLC, Bond, 7.570%, 6/15/2029 | 176,754 |
| 80,000 | | Janus Capital Group, Inc., Sr. Note, 6.700%, 06/15/2017 | 88,810 |
| 25,000 | | Jefferies Group, Inc., Sr. Unsecd. Note, 6.875%, 04/15/2021 | 27,475 |
| 60,000 | | Jefferies Group, Inc., Sr. Unsecd. Note, 8.500%, 07/15/2019 | 72,050 |
| 55,000 | | Raymond James Financial, Inc., 8.600%, 08/15/2019 | 67,372 |
| 50,000 | | TD Ameritrade Holding Corp., Company Guarantee, 4.150%, 12/01/2014 | 53,519 |
| | TOTAL | 839,763 |
| | Financial Institution - Finance Noncaptive – 0.9% | |
| 100,000 | | American Express Co., 4.875%, 07/15/2013 | 106,487 |
| 65,000 | | American Express Co., Sr. Unsecd. Note, 8.125%, 05/20/2019 | 83,731 |
| 150,000 | | American Express Credit Corp., 5.875%, 05/02/2013 | 161,477 |
| 110,000 | | Berkshire Hathaway, Inc., Company Guarantee, 5.000%, 08/15/2013 | 119,068 |
Annual Shareholder Report43
Principal
Amount
or Shares | | | Value |
| $120,000 | | Capital One Capital IV, 6.745%, 02/17/2037 | 121,500 |
| 5,000 | | Capital One Capital V, 10.250%, 08/15/2039 | 5,321 |
| 10,000 | | Capital One Capital VI, 8.875%, 05/15/2040 | 10,507 |
| 410,000 | | General Electric Capital Corp., 5.625%, 05/01/2018 | 458,691 |
| 100,000 | | HSBC Finance Capital Trust IX, Note, 5.911%, 11/30/2035 | 93,000 |
| 200,000 | 2,3 | ILFC E-Capital Trust I, Floating Rate Note — Sr. Sub Note, 5.740%, 12/21/2065 | 168,198 |
| 60,000 | 2,3 | Macquarie Group Ltd., Sr. Unsecd. Note, Series 144A, 6.000%, 01/14/2020 | 61,186 |
| | TOTAL | 1,389,166 |
| | Financial Institution - Insurance - Health – 0.1% | |
| 50,000 | | UnitedHealth Group, Inc., Sr. Unsecd. Note, 6.000%, 02/15/2018 | 58,471 |
| 50,000 | | Wellpoint, Inc., 5.850%, 01/15/2036 | 53,093 |
| | TOTAL | 111,564 |
| | Financial Institution - Insurance - Life – 0.5% | |
| 100,000 | | AXA-UAP, Sub. Note, 8.600%, 12/15/2030 | 121,463 |
| 10,000 | | Aflac, Inc., Sr. Unsecd. Note, 6.900%, 12/17/2039 | 10,828 |
| 35,000 | | Aflac, Inc., Sr. Unsecd. Note, 8.500%, 05/15/2019 | 44,118 |
| 15,000 | | Lincoln National Corp., Sr. Note, 7.000%, 06/15/2040 | 17,494 |
| 80,000 | 2,3 | Massachusetts Mutual Life Insurance Co., Sub. Note, 8.875%, 06/01/2039 | 114,496 |
| 70,000 | | MetLife, Inc., 6.750%, 06/01/2016 | 83,128 |
| 10,000 | | MetLife, Inc., Jr. Sub. Note, 10.750%, 08/01/2069 | 14,200 |
| 50,000 | 2,3 | New York Life Insurance Co., Sub. Note, 6.750%, 11/15/2039 | 58,941 |
| 85,000 | 2,3 | Pacific Life Global Funding, Sr. Secd. Note, 5.150%, 4/15/2013 | 90,301 |
| 15,000 | 2,3 | Penn Mutual Life Insurance Co., Sr. Note, Series 144A, 7.625%, 06/15/2040 | 17,202 |
| 85,000 | | Prudential Financial, Inc., 6.625%, 12/01/2037 | 95,731 |
| 50,000 | | Prudential Financial, Inc., Sr. Unsecd. Note, 6.200%, 11/15/2040 | 53,584 |
| | TOTAL | 721,486 |
| | Financial Institution - Insurance - P&C – 0.4% | |
| 90,000 | | ACE INA Holdings, Inc., 5.600%, 05/15/2015 | 101,117 |
| 1,000 | | ACE INA Holdings, Inc., Sr. Note, 5.700%, 02/15/2017 | 1,137 |
| 100,000 | | Allstate Corp., Unsecd. Note, 5.000%, 08/15/2014 | 110,995 |
| 75,000 | | CNA Financial Corp., 6.500%, 08/15/2016 | 85,393 |
| 30,000 | | CNA Financial Corp., Sr. Unsecd. Note, 7.350%, 11/15/2019 | 35,123 |
| 20,000 | | Chubb Corp., Sr. Note, 5.750%, 05/15/2018 | 23,133 |
| 100,000 | 2,3 | Liberty Mutual Group, Inc., Unsecd. Note, 5.750%, 03/15/2014 | 106,658 |
Annual Shareholder Report44
Principal
Amount
or Shares | | | Value |
| $65,000 | 2,3 | Nationwide Mutual Insurance Co., Sub. Note, Series 144A, 9.375%, 08/15/2039 | 82,471 |
| 50,000 | | The Travelers Cos., Inc., Sr. Unsecd. Note, 5.500%, 12/01/2015 | 56,915 |
| | TOTAL | 602,942 |
| | Financial Institution - REITs – 0.4% | |
| 40,000 | | AMB Property LP, 6.300%, 06/01/2013 | 43,019 |
| 15,000 | | Avalonbay Communities, Inc., Sr. Unsecd. Note, Series MTN, 5.700%, 03/15/2017 | 17,228 |
| 55,000 | | Boston Properties LP, Sr. Unsecd. Note, 5.875%, 10/15/2019 | 62,285 |
| 20,000 | | Equity One, Inc., Bond, 6.000%, 09/15/2017 | 21,648 |
| 20,000 | | Equity One, Inc., Sr. Unsecd. Note, 6.250%, 12/15/2014 | 21,998 |
| 40,000 | | Health Care REIT, Inc., Sr. Unsecd. Note, 6.125%, 04/15/2020 | 44,140 |
| 75,000 | | Liberty Property LP, 6.625%, 10/01/2017 | 87,786 |
| 100,000 | | Prologis, Sr. Unsecd. Note, 5.500%, 04/01/2012 | 101,535 |
| 20,000 | | Regency Centers LP, Company Guarantee, 4.800%, 04/15/2021 | 20,703 |
| 95,000 | | Simon Property Group LP, 6.125%, 05/30/2018 | 109,121 |
| 35,000 | | Simon Property Group LP, 6.750%, 05/15/2014 | 39,726 |
| 30,000 | | Tanger Properties LP, Sr. Unsecd. Note, 6.125%, 06/01/2020 | 34,083 |
| | TOTAL | 603,272 |
| | Media - Non-Cable – 0.0% | |
| 10,000 | | Interpublic Group of Cos., Inc., Sr. Unsecd. Note, 10.000%, 07/15/2017 | 11,863 |
| | Sovereign – 0.2% | |
| 40,000 | | Corp Andina De Fomento, Sr. Unsecd. Note, 3.750%, 01/15/2016 | 40,804 |
| 150,000 | | Province of Saskatchewan Canada, Unsecd. Note, 9.125%, 02/15/2021 | 218,791 |
| | TOTAL | 259,595 |
| | Technology – 0.7% | |
| 40,000 | | BMC Software, Inc., 7.250%, 06/01/2018 | 47,137 |
| 50,000 | | Cisco Systems, Inc., Sr. Unsecd. Note, 3.150%, 03/14/2017 | 52,269 |
| 60,000 | | Cisco Systems, Inc., Sr. Unsecd. Note, 5.500%, 02/22/2016 | 69,408 |
| 100,000 | | Dell Computer Corp., Deb., 7.100%, 04/15/2028 | 119,077 |
| 90,000 | | Fiserv, Inc., Sr. Note, 6.800%, 11/20/2017 | 106,077 |
| 65,000 | | Harris Corp., 5.950%, 12/01/2017 | 75,029 |
| 110,000 | | Hewlett-Packard Co., Note, 5.400%, 03/01/2017 | 127,717 |
| 100,000 | | IBM Corp., Deb., 8.375%, 11/01/2019 | 137,215 |
| 10,000 | | Juniper Networks, Inc., Sr. Unsecd. Note, 5.950%, 03/15/2041 | 10,647 |
| 70,000 | | KLA-Tencor Corp., 6.900%, 05/01/2018 | 80,935 |
| 30,000 | | Maxim Integrated Products, Inc., Note, 3.450%, 06/14/2013 | 31,057 |
Annual Shareholder Report45
Principal
Amount
or Shares | | | Value |
| $150,000 | | Oracle Corp., 6.500%, 04/15/2038 | 184,285 |
| | TOTAL | 1,040,853 |
| | Transportation - Airlines – 0.1% | |
| 75,000 | | Southwest Airlines Co., 6.500%, 03/01/2012 | 77,302 |
| 70,000 | | Southwest Airlines Co., Sr. Unsecd. Note, 5.125%, 03/01/2017 | 76,485 |
| | TOTAL | 153,787 |
| | Transportation - Railroads – 0.2% | |
| 75,000 | | Burlington Northern Santa Fe Corp., 4.875%, 01/15/2015 | 83,381 |
| 50,000 | | Burlington Northern Santa Fe Corp., Deb., 5.750%, 05/01/2040 | 54,192 |
| 100,000 | | Canadian Pacific RR, 7.125%, 10/15/2031 | 122,127 |
| 50,000 | | Union Pacific Corp., 4.875%, 01/15/2015 | 55,534 |
| | TOTAL | 315,234 |
| | Transportation - Services – 0.1% | |
| 90,000 | 2,3 | Enterprise Rent-A-Car USA Finance Co., 6.375%, 10/15/2017 | 106,264 |
| 60,000 | | Ryder System, Inc., Sr. Unsecd. Note, 3.150%, 03/02/2015 | 62,423 |
| 30,000 | | United Parcel Service, Inc., Sr. Unsecd. Note, 3.125%, 01/15/2021 | 29,935 |
| | TOTAL | 198,622 |
| | Utility - Electric – 1.1% | |
| 150,000 | | Alabama Power Co., 5.700%, 02/15/2033 | 164,559 |
| 70,000 | | Appalachian Power Co., Sr. Unsecd. Note, 7.950%, 01/15/2020 | 90,940 |
| 100,000 | | Cleveland Electric Illuminating Co., Sr. Unsecd. Note, 5.950%, 12/15/2036 | 101,931 |
| 105,000 | | Commonwealth Edison Co., 1st Mtg. Bond, 5.800%, 03/15/2018 | 120,192 |
| 5,000 | | Consolidated Edison Co., Sr. Unsecd. Note, 6.650%, 04/01/2019 | 6,158 |
| 10,000 | | Duke Energy Ohio, Inc., 1st Mtg. Bond, 2.100%, 06/15/2013 | 10,237 |
| 60,000 | 2,3 | Electricite De France SA, 5.500%, 1/26/2014 | 66,347 |
| 45,000 | 2,3 | Electricite De France SA, Note, Series 144A, 5.600%, 01/27/2040 | 47,697 |
| 100,000 | | Exelon Generation Co. LLC, Note, 5.350%, 01/15/2014 | 108,948 |
| 50,000 | | FirstEnergy Solutions Corp., Company Guarantee, 4.800%, 2/15/2015 | 54,494 |
| 40,000 | | FirstEnergy Solutions Corp., Company Guarantee, 6.050%, 8/15/2021 | 44,951 |
| 10,000 | | Great Plains Energy, Inc., Note, 4.850%, 06/01/2021 | 10,377 |
| 30,123 | 2,3 | Great River Energy, 1st Mtg. Note, 5.829%, 07/01/2017 | 33,552 |
| 25,000 | | KCP&L Greater Missouri Operations Co., Sr. Unsecd. Note, 11.875%, 07/01/2012 | 27,463 |
| 40,000 | | National Rural Utilities Cooperative Finance Corp., 5.450%, 02/01/2018 | 45,837 |
| 90,000 | | National Rural Utilities Cooperative Finance Corp., Collateral Trust, 5.500%, 07/01/2013 | 98,011 |
Annual Shareholder Report46
Principal
Amount
or Shares | | | Value |
| $80,000 | | Northern States Power Co., MN, 1st Mtg. Bond, 5.250%, 03/01/2018 | 90,959 |
| 50,000 | | PPL Energy Supply LLC, Sr. Unsecd. Note, 6.000%, 12/15/2036 | 51,856 |
| 20,000 | | PSEG Power LLC, Company Guarantee, 2.500%, 04/15/2013 | 20,395 |
| 75,000 | | PSI Energy, Inc., Bond, 6.050%, 06/15/2016 | 87,011 |
| 50,000 | | Progress Energy, Inc., 7.050%, 03/15/2019 | 61,758 |
| 10,000 | | TECO Finance, Inc., Company Guarantee, 5.150%, 03/15/2020 | 10,871 |
| 40,000 | | UIL Holdings Corp., Sr. Unsecd. Note, 4.625%, 10/01/2020 | 40,149 |
| 90,000 | | Union Electric Co., 6.000%, 04/01/2018 | 103,068 |
| 80,000 | | Virginia Electric & Power Co., Sr. Unsecd. Note, 5.000%, 06/30/2019 | 88,962 |
| 90,000 | | Virginia Electric & Power Co., Sr. Unsecd. Note, 5.100%, 11/30/2012 | 95,135 |
| | TOTAL | 1,681,858 |
| | Utility - Natural Gas Distributor – 0.1% | |
| 40,000 | | Atmos Energy Corp., 5.125%, 01/15/2013 | 42,347 |
| 20,000 | | Atmos Energy Corp., 8.500%, 03/15/2019 | 26,141 |
| 10,000 | 2,3 | Florida Gas Transmission Co. LLC, Sr. Unsecd. Note, Series 144A, 5.450%, 07/15/2020 | 11,044 |
| 55,000 | | Sempra Energy, Sr. Unsecd. Note, 6.500%, 06/01/2016 | 65,409 |
| | TOTAL | 144,941 |
| | Utility - Natural Gas Pipelines – 0.4% | |
| 75,000 | | Duke Capital Corp., Sr. Note, 6.250%, 02/15/2013 | 80,774 |
| 40,000 | | Enbridge, Inc., Sr. Note, 5.600%, 04/01/2017 | 45,992 |
| 65,000 | | Enterprise Products Operating LLC, Company Guarantee, Series O, 9.750%, 1/31/2014 | 78,040 |
| 100,000 | | Enterprise Products Operating LP, Company Guarantee, 5.900%, 04/15/2013 | 107,494 |
| 80,000 | | Kinder Morgan Energy Partners LP, Note, 6.550%, 09/15/2040 | 88,456 |
| 100,000 | | Kinder Morgan Energy Partners LP, Sr. Unsecd. Note, 5.800%, 03/15/2035 | 100,149 |
| 40,000 | | Williams Partners LP, 5.250%, 03/15/2020 | 43,817 |
| 30,000 | | Williams Partners LP, Sr. Unsecd. Note, 4.125%, 11/15/2020 | 30,049 |
| | TOTAL | 574,771 |
| | TOTAL CORPORATE BONDS
(IDENTIFIED COST $19,523,201) | 21,565,077 |
| | FOREIGN GOVERNMENT/AGENCY – 0.1% | |
| | Sovereign – 0.1% | |
| 75,000 | | United Mexican States, 6.625%, 03/03/2015
(IDENTIFIED COST $78,615) | 87,750 |
Annual Shareholder Report47
Principal
Amount
or Shares | | | Value |
| | GOVERNMENT AGENCY – 1.9% | |
| $2,750,000 | | Federal National Mortgage Association, 4.375%, 3/15/2013
(IDENTIFIED COST $2,790,340) | 2,928,281 |
| | Mortgage-Backed Securities – 0.0% | |
| | Federal National Mortgage Association – 0.0% | |
| 4,757 | | Federal National Mortgage Association Pool 408761, 7.000%, 12/1/2012 | 4,918 |
| 4,694 | | Federal National Mortgage Association Pool 512255, 7.500%, 9/1/2014 | 5,032 |
| 7,481 | | Federal National Mortgage Association Pool 609554, 7.500%, 10/1/2016 | 8,257 |
| | TOTAL MORTGAGE-BACKED SECURITIES
(IDENTIFIED COST $17,483) | 18,207 |
| | MUNICIPAL SECURITY – 0.1% | |
| | Municipal Services – 0.1% | |
| 70,000 | | Chicago, IL Metropolitan Water Reclamation District, Direct Payment Taxable Limited GO Build America Bonds, 5.720%, 12/01/2038
(IDENTIFIED COST $70,000) | 75,178 |
| | U.S. Treasury – 0.8% | |
| 1,032,810 | | U.S. Treasury Inflation-Protected Note, Series A-2021, 1.125%, 1/15/2021 | 1,113,417 |
| 150,000 | 5 | United States Treasury Note, 4.125%, 5/15/2015 | 168,673 |
| | TOTAL U.S. TREASURY
(IDENTIFIED COST $1,220,485) | 1,282,090 |
| | EXCHANGE-TRADED FUNDS – 5.0% | |
| 55,500 | | iShares MSCI Emerging Market Index Fund | 2,616,825 |
| 84,000 | | iShares MSCI EAFE Index Fund | 4,926,600 |
| | TOTAL EXCHANGE-TRADED FUNDS
(IDENTIFIED COST $4,462,792) | 7,543,425 |
| | MUTUAL FUNDS – 14.7%6 | |
| 42,579 | | Emerging Markets Fixed Income Core Fund | 1,251,452 |
| 836,010 | | Federated Mortgage Core Portfolio | 8,493,859 |
| 7,041,024 | 7 | Federated Prime Value Obligations Fund, Institutional Shares, 0.13% | 7,041,024 |
| 80,475 | | Federated Project and Trade Finance Core Fund | 810,388 |
| 691,081 | | High Yield Bond Portfolio | 4,554,227 |
| | TOTAL MUTUAL FUNDS
(IDENTIFIED COST $21,039,974) | 22,150,950 |
| | TOTAL INVESTMENTS — 100.4%
(IDENTIFIED COST $141,636,381)8 | 151,571,997 |
| | OTHER ASSETS AND LIABILITIES - NET — (0.4)%9 | (563,562) |
| | TOTAL NET ASSETS — 100% | $151,008,435 |
Annual Shareholder Report
48
At July 31, 2011, the Fund had the following outstanding futures contracts:| Description | Number of
Contracts | Notional
Value | Expiration
Date | Unrealized
Appreciation/
(Depreciation) |
1 United States Treasury Note 10-Year
Long Futures | 20 | $2,513,750 | September 2011 | $47,769 |
1 United States Treasury Bond 30-Year
Long Futures | 19 | $2,434,375 | September 2011 | $82,490 |
1 United States Treasury Note 2-Year
Short Futures | 100 | $21,992,188 | September 2011 | $(113,841) |
1 United States Treasury Note 5-Year
Short Futures | 10 | $1,214,453 | September 2011 | $(25,920) |
| NET UNREALIZED DEPRECIATION ON FUTURES CONTRACTS | $(9,502) |
At July 31, 2011, the Fund had the following open swap contract:
Credit Default
Swap Counterparty | Banc of America
Securities LLC |
| Reference Entity | Series 15 Investment Grade Index |
| Buy/Sell | Buy |
| Pay/Receive Fixed Rate | 1.00% |
| Expiration Date | 12/20/2015 |
| Implied Credit Spread at 7/31/201110 | 0.97% |
| Notional Amount | $5,000,000 |
| Market Value | $(37,654) |
| Upfront Premiums Received | $31,216 |
| Unrealized Depreciation | $(6,438) |
Net Unrealized Depreciation on Futures Contracts and Swap Contract is included in “Other Assets and Liabilities — Net.”
| 1 | Non-income producing security. |
| 2 | Denotes a restricted security that either: (a) cannot be offered for public sale without first being registered, or being able to take advantage of an exemption from registration, under the Securities Act of 1933; or (b) is subject to a contractual restriction on public sales. At July 31, 2011, these restricted securities amounted to $3,255,694, which represented 2.2% of total net assets. |
| 3 | Denotes a restricted security that may be resold without restriction to “qualified institutional buyers” as defined in Rule 144A under the Securities Act of 1933 and that the Fund has determined to be liquid under criteria established by the Fund's Board of Trustees (the “Trustees”). At July 31, 2011, these liquid restricted securities amounted to $3,039,209 which represented 2.0% of total net assets. |
| 4 | JPMorgan Chase & Co. has fully and unconditionally guaranteed Bear Stearns' outstanding registered debt securities. |
| 5 | Pledged as collateral to ensure the Fund is able to satisfy the obligations of its outstanding futures contracts. |
| 6 | Affiliated holdings. |
| 7 | 7-Day net yield. |
Annual Shareholder Report49
| 8 | The cost of investments for federal tax purposes amounts to $142,122,832. |
| 9 | Assets, other than investments in securities, less liabilities. See Statement of Assets and Liabilities. |
| 10 | Implied credit spreads, represented in absolute terms, utilized in determining the market value of credit default swap agreements serve as an indicator of the current status of the payment/performance risk and represent the likelihood or risk of default for the credit derivative. The implied credit spread of a particular referenced entity reflects the cost of buying/selling protection and may include upfront payments required to be made to enter into the agreement. Wider credit spreads represent a deterioration of the referenced entity's credit soundness and a greater likelihood or risk of default or other credit event occurring as defined under the terms of the agreement. A credit spread identified as “Defaulted” indicates a credit event has occurred for the referenced entity or obligation. |
Note: The categories of investments are shown as a percentage of total net assets at July 31, 2011.
Various inputs are used in determining the value of the Fund's investments. These inputs are summarized in the three broad levels listed below:
Level 1 — quoted prices in active markets for identical securities, including investment companies with daily net asset values, if applicable.
Level 2 — other significant observable inputs (including quoted prices for similar securities, interest rates, prepayment speeds, credit risk, etc.). Also includes securities valued at amortized cost.
Level 3 — significant unobservable inputs (including the Fund's own assumptions in determining the fair value of investments).
The inputs or methodology used for valuing securities are not an indication of the risk associated with investing in those securities.
Annual Shareholder Report
50
The following is a summary of the inputs used, as of July 31, 2011, in valuing the Fund's assets carried at fair value:| Valuation Inputs | | | | |
| Level 1 —
Quoted
Prices and
Investments in
Mutual Funds1 | Level 2 —
Other
Significant
Observable
Inputs | Level 3 —
Significant
Unobservable
Inputs | Total |
| Equity Securities: | | | | |
| Common Stocks | | | | |
| Domestic | $92,135,633 | $ — | $ — | $92,135,633 |
| International | 868,665 | — | — | 868,665 |
| Debt Securities: | | | | |
| Asset-Backed Securities | — | 1,644,519 | — | 1,644,519 |
| Collateralized Mortgage Obligations | — | 1,272,222 | — | 1,272,222 |
| Corporate Bonds | — | 21,565,077 | — | 21,565,077 |
| Foreign Government/Agency | — | 87,750 | — | 87,750 |
| Government Agency | — | 2,928,281 | — | 2,928,281 |
| Mortgage-Backed Securities | — | 18,207 | — | 18,207 |
| Municipal Security | — | 75,178 | — | 75,178 |
| U.S. Treasury | — | 1,282,090 | — | 1,282,090 |
| Exchange-Traded Funds | 7,543,425 | — | — | 7,543,425 |
| Mutual Funds | 21,340,562 | 810,3882 | — | 22,150,950 |
| TOTAL SECURITIES | $121,888,285 | $29,683,712 | $ — | $151,571,997 |
| OTHER FINANCIAL INSTRUMENTS3 | $(9,502) | $(37,654) | $ — | $(47,156) |
| 1 | Emerging Markets Fixed Income Core Fund, Federated Mortgage Core Portfolio and High Yield Bond Portfolio are affiliated holdings offered only to registered investment companies and other accredited investors. |
| 2 | Includes $760,627 of a security transferred from Level 1 to Level 2 because the adviser determined that this security more appropriately meets the definition of Level 2. Transfer shown represents the value of the security at the beginning of the period. |
| 3 | Other financial instruments include futures contracts and a swap contract. |
Annual Shareholder Report
51
Following is a reconciliation of assets in which significant unobservable inputs (Level 3) were used in determining fair value: | Investments in
Collateralized
Mortgage
Obligations |
| Balance as of August 1, 2010 | $750,000 |
| Realized gain (loss) | 20,156 |
| Change in unrealized appreciation/depreciation | 155,313 |
| (Sales) | (925,469) |
| Balance as of July 31, 2011 | $ — |
| The total change in unrealized appreciation (depreciation) included in the Statement of Operations attributable to investments still held at July 31, 2011. | $ — |
The following acronyms are used throughout this portfolio:
| GO | — General Obligation |
| MTN | — Medium Term Note |
| REIT(s) | — Real Estate Investment Trust(s) |
| REMIC | — Real Estate Mortgage Investment Conduit |
See Notes which are an integral part of the Financial Statements
Annual Shareholder Report52
Statement of Assets and Liabilities
July 31, 2011
| Assets: | | |
| Total investments in securities, at value including $22,150,950 of investments in affiliated holdings (Note 5) (identified cost $141,636,381) | | $151,571,997 |
| Cash | | 3,256 |
| Income receivable | | 489,363 |
| Receivable for investments sold | | 1,969,104 |
| Receivable for shares sold | | 58,615 |
| Receivable for daily variation margin | | 31,922 |
| TOTAL ASSETS | | 154,124,257 |
| Liabilities: | | |
| Payable for investments purchased | $2,614,340 | |
| Payable for shares redeemed | 238,881 | |
| Swaps, at value (premiums received $31,216) | 37,654 | |
| Payable for periodic payments on swap contracts | 5,833 | |
| Payable for distribution services fee (Note 5) | 30,193 | |
| Payable for shareholder services fee (Note 5) | 45,545 | |
| Accrued expenses | 143,376 | |
| TOTAL LIABILITIES | | 3,115,822 |
| Net assets for 12,449,972 shares outstanding | | $151,008,435 |
| Net Assets Consist of: | | |
| Paid-in capital | | $198,910,299 |
| Net unrealized appreciation of investments, futures contracts and swap contracts | | 9,919,676 |
| Accumulated net realized loss on investments, futures contracts, swap contracts and foreign currency transactions | | (58,761,097) |
| Undistributed net investment income | | 939,557 |
| TOTAL NET ASSETS | | $151,008,435 |
Annual Shareholder Report53
Statement of Assets and Liabilities — continued| Net Asset Value, Offering Price and Redemption Proceeds Per Share | | |
| Class A Shares: | | |
| Net asset value per share ($57,358,364 ÷ 4,712,697 shares outstanding), no par value, unlimited shares authorized | | $12.17 |
| Offering price per share (100/94.50 of $12.17) | | $12.88 |
| Redemption proceeds per share | | $12.17 |
| Class C Shares: | | |
| Net asset value per share ($45,512,001 ÷ 3,794,453 shares outstanding), no par value, unlimited shares authorized | | $11.99 |
| Offering price per share | | $11.99 |
| Redemption proceeds per share (99.00/100 of $11.99) | | $11.87 |
| Class R Shares: | | |
| Net asset value per share ($664,941 ÷ 54,850 shares outstanding), no par value, unlimited shares authorized | | $12.12 |
| Offering price per share | | $12.12 |
| Redemption proceeds per share | | $12.12 |
| Institutional Shares: | | |
| Net asset value per share ($47,473,129 ÷ 3,887,972 shares outstanding), no par value, unlimited shares authorized | | $12.21 |
| Offering price per share | | $12.21 |
| Redemption proceeds per share | | $12.21 |
See Notes which are an integral part of the Financial Statements
Annual Shareholder Report54
Statement of Operations
Year Ended July 31, 2011
| Investment Income: | | | |
Dividends (including $855,541 received from affiliated
holdings (Note 5)) | | | $2,708,753 |
| Interest | | | 1,552,997 |
| Investment income allocated from affiliated partnership (Note 5) | | | 106,166 |
| TOTAL INCOME | | | 4,367,916 |
| Expenses: | | | |
| Investment adviser fee (Note 5) | | $1,281,252 | |
| Administrative fee (Note 5) | | 270,000 | |
| Custodian fees | | 41,215 | |
Transfer and dividend disbursing agent fees and
expenses (Note 2) | | 245,716 | |
| Directors'/Trustees' fees | | 3,704 | |
| Auditing fees | | 25,525 | |
| Legal fees | | 4,657 | |
| Portfolio accounting fees | | 129,470 | |
| Distribution services fee (Note 5) | | 369,727 | |
| Shareholder services fee (Note 5) | | 213,109 | |
| Account administration fee (Note 2) | | 74,280 | |
| Share registration costs | | 62,225 | |
| Printing and postage | | 54,296 | |
| Insurance premiums | | 4,503 | |
| Miscellaneous | | 11,462 | |
| TOTAL EXPENSES | | 2,791,141 | |
Annual Shareholder Report55
Statement of Operations — continued| Waivers and Reimbursements: | | | |
| Waiver/reimbursement of investment adviser fee (Note 5) | $(247,065) | | |
| Waiver of administrative fee (Note 5) | (53,290) | | |
| Reimbursement of transfer and dividend disbursing agent fees and expenses (Note 2 and Note 5) | (48,940) | | |
| TOTAL WAIVERS AND REIMBURSEMENTS | | $(349,295) | |
| Net expenses | | | $2,441,846 |
| Net investment income | | | 1,926,070 |
Realized and Unrealized Gain (Loss) on Investments,
Futures Contracts, Swap Contracts and Foreign
Currency Transactions: | | | |
| Net realized gain on investments (including realized gain of $524,459 on sales of investments in affiliated holdings) (Note 5) | | | 20,838,571 |
| Net realized loss on futures contracts | | | (154,825) |
| Net realized loss on swap contracts | | | (31,667) |
| Net realized gain on investments and foreign currency transactions allocated from affiliated partnership (Note 5) | | | 26,702 |
| Realized gain distribution from affiliated investment company shares (Note 5) | | | 861 |
| Net change in unrealized appreciation of investments | | | 35,845 |
| Net change in unrealized depreciation of futures contracts | | | 31,364 |
| Net change in unrealized depreciation of swap contracts | | | (6,438) |
| Net realized and unrealized gain on investments, futures contracts, swap contracts and foreign currency transactions | | | 20,740,413 |
| Change in net assets resulting from operations | | | $22,666,483 |
See Notes which are an integral part of the Financial Statements
Annual Shareholder Report56
Statement of Changes in Net Assets
| Year Ended July 31 | 2011 | 2010 |
| Increase (Decrease) in Net Assets | | |
| Operations: | | |
| Net investment income | $1,926,070 | $2,747,662 |
| Net realized gain on investments including allocations from partnership, futures contracts, swap contracts and foreign currency transactions | 20,679,642 | 17,849,968 |
| Net change in unrealized appreciation/depreciation of investments, futures contracts and swap contracts | 60,771 | (3,013,704) |
| CHANGE IN NET ASSETS RESULTING FROM OPERATIONS | 22,666,483 | 17,583,926 |
| Distributions to Shareholders: | | |
| Distributions from net investment income | | |
| Class A Shares | (961,404) | (1,641,566) |
| Class C Shares | (341,788) | (499,916) |
| Class R Shares | (7,358) | (6,715) |
| Institutional Shares | (885,615) | (983,561) |
| CHANGE IN NET ASSETS RESULTING FROM DISTRIBUTIONS TO SHAREHOLDERS | (2,196,165) | (3,131,758) |
| Share Transactions: | | |
| Proceeds from sale of shares | 11,439,970 | 16,651,096 |
| Net asset value of shares issued to shareholders in payment of distributions declared | 2,004,100 | 2,868,027 |
| Cost of shares redeemed | (68,630,880) | (60,220,635) |
| CHANGE IN NET ASSETS RESULTING FROM SHARE TRANSACTIONS | (55,186,810) | (40,701,512) |
| Change in net assets | (34,716,492) | (26,249,344) |
| Net Assets: | | |
| Beginning of period | 185,724,927 | 211,974,271 |
| End of period (including undistributed net investment income of $939,557 and $1,232,270, respectively) | $151,008,435 | $185,724,927 |
See Notes which are an integral part of the Financial Statements
Annual Shareholder Report57
Notes to Financial Statements
July 31, 2011
1. ORGANIZATION
Federated MDT Series (the “Trust”) is registered under the Investment Company Act of 1940, as amended (the “Act”), as an open-end management investment company. The Trust consists of five portfolios. The financial statements included herein are only those of Federated MDT Balanced Fund (the “Fund”), a diversified portfolio. The financial statements of the other portfolios are presented separately. The assets of each portfolio are segregated and a shareholder's interest is limited to the portfolio in which shares are held. Each portfolio pays its own expenses. The Fund offers four classes of shares: Class A Shares, Class C Shares, Class R Shares and Institutional Shares. All shares of the Fund have equal rights with respect to voting, except on class-specific matters. The investment objective of the Fund is the possibility of long-term growth of capital and income.
2. SIGNIFICANT ACCOUNTING POLICIES
The following is a summary of significant accounting policies consistently followed by the Fund in the preparation of its financial statements. These policies are in conformity with U.S. generally accepted accounting principles (GAAP).
Investment Valuation
In calculating its net asset value (NAV), the Fund generally values investments as follows:
- Equity securities listed on an exchange or traded through a regulated market system are valued at their last reported sale price or official closing price in their principal exchange or market.
- Fixed-income securities acquired with remaining maturities greater than 60 days are fair valued using price evaluations provided by a pricing service approved by the Trustees.
- Fixed-income securities acquired with remaining maturities of 60 days or less are valued at their cost (adjusted for the accretion of any discount or amortization of any premium), which approximates market value.
- Shares of other mutual funds are valued based upon their reported NAVs.
- Derivative contracts listed on exchanges are valued at their reported settlement or closing price.
- Over-the-counter (OTC) derivative contracts are fair valued using price evaluations provided by a pricing service approved by the Trustees.
- For securities that are fair valued in accordance with procedures established by and under the general supervision of the Trustees, certain factors may be considered such as: the purchase price of the security, information obtained by contacting the issuer, analysis of the issuer's financial statements or other available documents, fundamental analytical data, the nature and duration of restrictions on disposition, the movement of the market in which the security is normally traded and public trading in similar securities of the issuer or comparable issuers.
If the Fund cannot obtain a price or price evaluation from a pricing service for an investment, the Fund may attempt to value the investment based upon the mean of bid and asked quotations or fair value the investment based on price evaluations, from one or more dealers. If any price, quotation, price evaluation or other pricing source is not readily available when the NAV is calculated, the Fund uses the fair value of the investment determined in accordance with the procedures described below. There can be no assurance that the Fund could purchase or sell an investment at the price used to calculate the Fund's NAV.
Annual Shareholder Report
58
Fair Valuation and Significant Events ProceduresThe Trustees have authorized the use of pricing services to provide evaluations of the current fair value of certain investments for purposes of calculating the NAV. Factors considered by pricing services in evaluating an investment include the yields or prices of investments of comparable quality, coupon, maturity, call rights and other potential prepayments, terms and type, reported transactions, indications as to values from dealers and general market conditions. Some pricing services provide a single price evaluation reflecting the bid-side of the market for an investment (a “bid” evaluation). Other pricing services offer both bid evaluations and price evaluations indicative of a price between the prices bid and asked for the investment (a “mid” evaluation). The Fund normally uses bid evaluations for U.S. Treasury and Agency securities, mortgage-backed securities and municipal securities. The Fund normally uses mid evaluations for other types of fixed-income securities and OTC derivative contracts. In the event that market quotations and price evaluations are not available for an investment, the fair value of the investment is determined in accordance with procedures adopted by the Trustees.
The Trustees also have adopted procedures requiring an investment to be priced at its fair value whenever the Adviser determines that a significant event affecting the value of the investment has occurred between the time as of which the price of the investment would otherwise be determined and the time as of which the NAV is computed. An event is considered significant if there is both an affirmative expectation that the investment's value will change in response to the event and a reasonable basis for quantifying the resulting change in value. Examples of significant events that may occur after the close of the principal market on which a security is traded, or after the time of a price evaluation provided by a pricing service or a dealer, include:
- With respect to securities traded in foreign markets, significant trends in U.S. equity markets or in the trading of foreign securities index futures or options contracts;
- With respect to price evaluations of fixed-income securities determined before the close of regular trading on the NYSE, actions by the Federal Reserve Open Market Committee and other significant trends in U.S. fixed-income markets;
- Political or other developments affecting the economy or markets in which an issuer conducts its operations or its securities are traded; and
- Announcements concerning matters such as acquisitions, recapitalizations, litigation developments, a natural disaster affecting the issuer's operations or regulatory changes or market developments affecting the issuer's industry.
The Trustees have approved the use of a pricing service to determine the fair value of equity securities traded principally in foreign markets when the Adviser determines that there has been a significant trend in the U.S. equity markets or in index futures trading. For other significant events, the Fund may seek to obtain more current quotations or price evaluations from alternative pricing sources. If a reliable alternative pricing source is not available, the Fund will determine the fair value of the investment using another method approved by the Trustees.
Repurchase Agreements
The Fund may invest in repurchase agreements for short-term liquidity purposes. It is the policy of the Fund to require the other party to a repurchase agreement to transfer to the Fund's custodian or sub-custodian eligible securities or cash with a market value (after transaction costs) at least equal to the repurchase price to be paid under the repurchase agreement. The eligible securities are transferred to accounts with the custodian or sub-custodian in which the Fund holds a “securities entitlement” and exercises “control” as those Annual Shareholder Report
59
terms are defined in the Uniform Commercial Code. The Fund has established procedures for monitoring the market value of the transferred securities and requiring the transfer of additional eligible securities if necessary to equal at least the repurchase price. These procedures also allow the other party to require securities to be transferred from the account to the extent that their market value exceeds the repurchase price or in exchange for other eligible securities of equivalent market value.The insolvency of the other party or other failure to repurchase the securities may delay the disposition of the underlying securities or cause the Fund to receive less than the full repurchase price. Under the terms of the repurchase agreement, any amounts received by the Fund in excess of the repurchase price and related transaction costs must be remitted to the other party.
The Fund may enter into repurchase agreements in which eligible securities are transferred into joint trading accounts maintained by the custodian or sub-custodian for investment companies and other clients advised by the Fund's Adviser and its affiliates. The Fund will participate on a pro rata basis with the other investment companies and clients in its share of the securities transferred under such repurchase agreements and in its share of proceeds from any repurchase or other disposition of such securities.
Investment Income, Gains and Losses, Expenses and Distributions
Investment transactions are accounted for on a trade-date basis. Realized gains and losses from investment transactions are recorded on an identified-cost basis. Interest income and expenses are accrued daily. Dividend income and distributions to shareholders are recorded on the ex-dividend date. Foreign dividends are recorded on the ex-dividend date or when the Fund is informed of the ex-dividend date. Distributions of net investment income are declared and paid annually. Non-cash dividends included in dividend income, if any, are recorded at fair value. The Fund invests in Emerging Markets Fixed Income Core Fund (EMCORE), a portfolio of Federated Core Trust II, L.P., which is a limited partnership established under the laws of the state of Delaware. The Fund records daily its proportionate share of income, expenses, realized and unrealized gains and losses from EMCORE. Investment income, realized and unrealized gains and losses, and certain fund-level expenses are allocated to each class based on relative average daily net assets, except that Class A Shares, Class C Shares, Class R Shares and Institutional Shares may bear distribution services fees, shareholder services fees, account administration fees and certain transfer and dividend disbursing agent fees unique to those classes. For the year ended July 31, 2011, transfer and dividend disbursing agent fees and account administration fees for the Fund were as follows:
| Transfer and
Dividend
Disbursing Agent
Fees Incurred | Transfer and
Dividend
Disbursing Agent
Fees Reimbursed | Account
Administration
Fees Incurred |
| Class A Shares | $125,270 | $(38,651) | $16,517 |
| Class C Shares | 61,693 | (7,112) | 57,763 |
| Class R Shares | 2,458 | — | — |
| Institutional Shares | 56,295 | (3,177) | — |
| TOTAL | $245,716 | $(48,940) | $74,280 |
Annual Shareholder Report60
Dividends are declared separately for each class. No class has preferential dividend rights; differences in per share dividend rates are generally due to differences in separate class expenses.
Premium and Discount Amortization/Paydown Gains and Losses
All premiums and discounts on fixed-income securities, other than mortgage-backed securities, are amortized/accreted using the effective interest rate method. Gains and losses realized on principal payment of mortgage-backed securities (paydown gains and losses) are classified as part of investment income.
Federal Taxes
It is the Fund's policy to comply with the Subchapter M provision of the Internal Revenue Code (the “Code”) and to distribute to shareholders each year substantially all of its income. Accordingly, no provision for federal income tax is necessary. As of and during the year ended July 31, 2011, the Fund did not have a liability for any uncertain tax positions. The Fund recognizes interest and penalties, if any, related to tax liabilities as income tax expense in the Statement of Operations. As of July 31, 2011, tax years 2008 through 2011 remain subject to examination by the Fund's major tax jurisdictions, which include the United States of America and the Commonwealth of Massachusetts.
The Fund may be subject to taxes imposed by governments of countries in which it invests. Such taxes are generally based on either income or gains earned or repatriated. The Fund accrues and applies such taxes to net investment income, net realized gains and net unrealized gains as income and/or gains are earned.
When-Issued and Delayed Delivery Transactions
The Fund may engage in when-issued or delayed delivery transactions. The Fund records when-issued securities on the trade date and maintains security positions such that sufficient liquid assets will be available to make payment for the securities purchased. Securities purchased on a when-issued or delayed delivery basis are marked to market daily and begin earning interest on the settlement date. Losses may occur on these transactions due to changes in market conditions or the failure of counterparties to perform under the contract.
Swap Contracts
Swap contracts involve two parties that agree to exchange the returns (or the differential in rates of return) earned or realized on particular predetermined investments, instruments, indices or other measures. The gross returns to be exchanged or “swapped” between parties are generally calculated with respect to a “notional amount” for a predetermined period of time. The Fund enters into interest rate, total return, credit default, currency and other swap agreements. Risks may arise upon entering into swap agreements from the potential inability of the counterparties to meet the terms of their contract from unanticipated changes in the value of the swap agreement.
Annual Shareholder Report
61
The Fund uses credit default swaps to manage exposure to a given issuer or sector by either selling protection to increase exposure, or buying protection to reduce exposure. The “buyer” in a credit default swap is obligated to pay the “seller” a periodic stream of payments over the term of the contract provided that no event of default on an underlying reference obligation has occurred. If an event of default occurs, the seller must pay the buyer the full notional value, or the “par value,” of the reference obligation in exchange for the reference obligation. In connection with these agreements, securities may be identified as collateral in accordance with the terms of the respective swap agreements to provide assets of value and recourse in the event of default or bankruptcy/insolvency. Recovery values are assumed by market makers considering either industry standard recovery rates or entity specific factors and considerations until a credit event occurs. If a credit event has occurred, the recovery value is typically determined by a facilitated auction whereby a minimum number of allowable broker bids, together with a specific valuation method, are used to calculate the settlement value. The maximum amount of the payment that may occur, as a result of a credit event payable by the protection seller, is equal to the notional amount of the underlying index or security. The Fund's maximum risk of loss from counterparty credit risk, either as the protection buyer or as the protection seller, is the fair value of the contract. This risk is mitigated by having a master netting arrangement between the Fund and the counterparty and by the posting of collateral by the counterparty to the Fund to cover the Fund's exposure to the counterparty.Upfront payments received or paid by the Fund will be reflected as an asset or liability on the Statement of Assets and Liabilities. Changes in the value of swap contracts are included in “Swaps, at value” on the Statement of Assets and Liabilities, and periodic payments are reported as “Net realized gain (loss) on swap contracts” on the Statement of Operations.
Swap contracts outstanding at period end are listed after the Fund's Portfolio of Investments.
Futures Contracts
The Fund purchases and sells financial futures contracts to manage cash flows, enhance yield and to potentially reduce transaction costs. Upon entering into a financial futures contract with a broker, the Fund is required to deposit in a segregated account a specified amount of cash or U.S. government securities. Futures contracts are valued daily and unrealized gains or losses are recorded in a “variation margin” account. Daily, the Fund receives from or pays to the broker a specified amount of cash based upon changes in the variation margin account. When a contract is closed, the Fund recognizes a realized gain or loss. Futures contracts have market risks, including the risk that the change in the value of the contract may not correlate with the changes in the value of the underlying securities. There is minimal counterparty risk to the Fund since futures are exchange traded and the exchange's clearinghouse, as counterparty to all exchange traded futures, guarantees the futures against default.
Futures contracts outstanding at period end are listed after the Fund's Portfolio of Investments.
Annual Shareholder Report
62
Foreign Currency Translation
The accounting records of the Fund are maintained in U.S. dollars. All assets and liabilities denominated in foreign currencies (FCs) are translated into U.S. dollars based on the rates of exchange of such currencies against U.S. dollars on the date of valuation. Purchases and sales of securities, income and expenses are translated at the rate of exchange quoted on the respective date that such transactions are recorded. The Fund does not isolate that portion of the results of operations resulting from changes in foreign exchange rates on investments from the fluctuations arising from changes in market prices of securities held. Such fluctuations are included with the net realized and unrealized gain or loss from investments.
Reported net realized foreign exchange gains or losses arise from sales of portfolio securities, sales and maturities of short-term securities, sales of FCs, currency gains or losses realized between the trade and settlement dates on securities transactions, the difference between the amounts of dividends, interest and foreign withholding taxes recorded on the Fund's books, and the U.S. dollar equivalent of the amounts actually received or paid. Net unrealized foreign exchange gains and losses arise from changes in the value of assets and liabilities other than investments in securities at fiscal year end, resulting from changes in the exchange rate.
Restricted Securities
The Fund may purchase securities which are considered restricted. Restricted securities are securities that either: (a) cannot be offered for public sale without first being registered, or being able to take advantage of an exemption from registration, under the Securities Act of 1933; or (b) are subject to contractual restrictions on public sales. In some cases, when a security cannot be offered for public sale without first being registered, the issuer of the restricted security has agreed to register such securities for resale, at the issuer's expense, either upon demand by the Fund or in connection with another registered offering of the securities. Many such restricted securities may be resold in the secondary market in transactions exempt from registration. Restricted securities may be determined to be liquid under criteria established by the Trustees. The Fund will not incur any registration costs upon such resales. The Fund's restricted securities are valued at the price provided by dealers in the secondary market or, if no market prices are available, at the fair value as determined in accordance with procedures established by and under the general supervision of the Trustees.
Additional information on restricted securities, excluding securities purchased under Rule 144A, if applicable, that have been deemed liquid by the Trustees, held at July 31, 2011, is as follows:
| Security | Acquisition Date | Cost | Market Value |
| Football Trust V, Pass Thru Cert., 5.350%, 10/05/2020 | 3/24/2010 | $200,000 | $216,485 |
Annual Shareholder Report
63
Additional Disclosure Related to Derivative Instruments| Fair Value of Derivative Instruments |
| Asset | Liability |
| Statement of
Assets and
Liabilities
Location | Fair
Value | Statement of
Assets and
Liabilities
Location | Fair
Value |
Derivatives not accounted for as hedging instruments
under ASC Topic 815 | | | | |
| Interest rate contracts | Receivable for daily
variation margin | $(9,502)* | — | $ — |
| Credit contracts | — | $ — | Swaps, at value | $37,654 |
Total derivatives not accounted
for as hedging instruments
under ASC Topic 815 | | $(9,502) | | $37,654 |
| * | Includes cumulative appreciation/depreciation of futures contracts as reported in the footnotes to the Portfolio of Investments. Only the current day's variation margin is reported within the Statement of Assets and Liabilities. |
The Effect of Derivative Instruments on the Statement of Operations for the Year Ended July 31, 2011
| Amount of Realized Gain or (Loss) on Derivatives Recognized in Income |
| Credit
Default
Swaps | Futures | Total |
| Interest rate contracts | $ — | $(154,825) | $(154,825) |
| Credit contracts | (31,667) | — | (31,667) |
| TOTAL | $(31,667) | $(154,825) | $(186,492) |
| Change in Unrealized Appreciation or (Depreciation) on Derivatives Recognized in Income |
| Credit
Default
Swaps | Futures | Total |
| Interest rate contracts | $ — | $31,364 | $31,364 |
| Credit contracts | (6,438) | — | (6,438) |
| TOTAL | $(6,438) | $31,364 | $24,926 |
Other
The preparation of financial statements in conformity with GAAP requires management to make estimates and assumptions that affect the amounts of assets, liabilities, expenses and revenues reported in the financial statements. Actual results could differ from those estimated.
Annual Shareholder Report
64
3. SHARES OF BENEFICIAL INTERESTThe following tables summarize share activity:
| Year Ended July 31 | 2011 | 2010 |
| Class A Shares: | Shares | Amount | Shares | Amount |
| Shares sold | 657,966 | $7,743,593 | 1,052,939 | $11,450,865 |
| Shares issued to shareholders in payment of distributions declared | 71,917 | 845,744 | 131,800 | 1,459,023 |
| Shares redeemed | (3,939,209) | (46,147,902) | (3,647,156) | (39,741,622) |
NET CHANGE RESULTING FROM
CLASS A SHARE TRANSACTIONS | (3,209,326) | $(37,558,565) | (2,462,417) | $(26,831,734) |
| Year Ended July 31 | 2011 | 2010 |
| Class C Shares: | Shares | Amount | Shares | Amount |
| Shares sold | 186,375 | $2,166,666 | 261,716 | $2,829,228 |
| Shares issued to shareholders in payment of distributions declared | 27,581 | 321,040 | 43,376 | 474,964 |
| Shares redeemed | (1,082,382) | (12,553,195) | (1,183,883) | (12,747,262) |
NET CHANGE RESULTING FROM
CLASS C SHARE TRANSACTIONS | (868,426) | $(10,065,489) | (878,791) | $(9,443,070) |
| Year Ended July 31 | 2011 | 2010 |
| Class R Shares: | Shares | Amount | Shares | Amount |
| Shares sold | 3,648 | $44,081 | 16,886 | $185,714 |
| Shares issued to shareholders in payment of distributions declared | 626 | 7,358 | 607 | 6,715 |
| Shares redeemed | (11,620) | (138,465) | (14,159) | (153,680) |
NET CHANGE RESULTING FROM
CLASS R SHARE TRANSACTIONS | (7,346) | $(87,026) | 3,334 | $38,749 |
| Year Ended July 31 | 2011 | 2010 |
| Institutional Shares: | Shares | Amount | Shares | Amount |
| Shares sold | 124,795 | $1,485,630 | 200,627 | $2,185,289 |
| Shares issued to shareholders in payment of distributions declared | 70,455 | 829,958 | 83,618 | 927,325 |
| Shares redeemed | (814,570) | (9,791,318) | (690,117) | (7,578,071) |
NET CHANGE RESULTING FROM
INSTITUTIONAL SHARE TRANSACTIONS | (619,320) | $(7,475,730) | (405,872) | $(4,465,457) |
NET CHANGE RESULTING FROM
TOTAL FUND SHARE TRANSACTIONS | (4,704,418) | $(55,186,810) | (3,743,746) | $(40,701,512) |
Annual Shareholder Report65
4. FEDERAL TAX INFORMATION
The timing and character of income and capital gain distributions are determined in accordance with income tax regulations, which may differ from GAAP. These differences are due primarily to differing treatments for partnership income, swap contracts, litigation payments and discount accretion/premium amortization on debt securities.
For the year ended July 31, 2011, permanent differences identified and reclassified among the components of net assets were as follows:
| Increase (Decrease) |
| Paid-In Capital | Undistributed
Net Investment
Income (Loss) | Accumulated
Net Realized
Gain (Loss) |
| $(3,162) | $(22,618) | $25,780 |
Net investment income (loss), net realized gains (losses), and net assets were not affected by this reclassification.
The tax character of distributions as reported on the Statement of Changes in Net Assets for the years ended July 31, 2011 and 2010, was as follows:
| 2011 | 2010 |
| Ordinary income | $2,196,165 | $3,131,758 |
As of July 31, 2011, the components of distributable earnings on a tax basis were as follows:
| Undistributed ordinary income | $960,008 |
| Net unrealized appreciation | $9,449,268 |
| Capital loss carryforwards and deferrals | $(58,311,140) |
The difference between book-basis and tax-basis net unrealized appreciation/depreciation is attributable to differing treatments for the deferral of losses on wash sales, deferral of paydowns, discount accretion/premium amortization on debt securities, defaulted securities and partnership investments.
At July 31, 2011, the cost of investments for federal tax purposes was $142,122,832. The net unrealized appreciation of investments for federal tax purposes excluding any unrealized appreciation/depreciation resulting from futures contracts and swap contracts was $9,449,165. This consists of net unrealized appreciation from investments for those securities having an excess of value over cost of $13,567,247 and net unrealized depreciation from investments for those securities having an excess of cost over value of $4,118,082.
Annual Shareholder Report
66
At July 31, 2011, the Fund had a capital loss carryforward of $58,271,651 which will reduce the Fund's taxable income arising from future net realized gains on investments, if any, to the extent permitted by the Code and thus will reduce the amount of distributions to shareholders which would otherwise be necessary to relieve the Fund of any liability for federal income tax. Pursuant to the Code, such capital loss carryforward will expire as follows:| Expiration Year | Expiration Amount |
| 2017 | $27,291,745 |
| 2018 | $30,979,906 |
Under the recently enacted Regulated Investment Company Modernization Act of 2010, the Fund will be permitted to carry forward capital losses incurred in taxable years beginning after December 22, 2010 for an unlimited period. However, any losses incurred during those future years will be required to be utilized prior to the losses incurred in pre-enactment tax years. As a result of this ordering rule, pre-enactment capital loss carryforwards may be more likely to expire unused. Additionally, post-enactment capital losses that are carried forward will retain their character as either short-term or long-term capital losses rather than being considered all short-term as under previous law.
The Fund used capital loss carryforwards of $20,174,166 to offset taxable capital gains realized during the year ended July 31, 2011.
Under current tax regulations, capital losses on securities transactions realized after October 31 may be deferred and treated as occurring on the first day of the following fiscal year. As of the year ended July 31, 2011, for federal income tax purposes, post October losses of $26,889 were deferred to August 1, 2011.
As of July 31, 2011, for federal income tax purposes, the Fund had $12,600 in straddle loss deferrals.
5. INVESTMENT ADVISER FEE AND OTHER TRANSACTIONS WITH AFFILIATES
Investment Adviser Fee
Federated MDTA LLC is the Fund's investment adviser (the “Adviser”). The advisory agreement between the Fund and the Adviser provides for an annual fee equal to 0.75% of the Fund's average daily net assets. Subject to the terms described in the Expense Limitation note, the Adviser may voluntarily choose to waive any portion of its fee. For the year ended July 31, 2011, the Adviser voluntarily waived $238,553 of its fee. In addition, for the year ended July 31, 2011, an affiliate of the Adviser voluntarily reimbursed $48,940 of transfer and dividend disbursing agent fees and expenses.
Certain of the Fund's assets are managed by Federated Investment Management Company (the “Sub-Adviser”). Under the terms of a sub-advisory agreement between the Adviser and the Sub-Adviser, the Sub-Adviser receives an allocable portion of the Fund's adviser fee. The fee is paid by the Adviser out of its resources and is not an incremental Fund expense. For the year ended July 31, 2011, the Sub-Adviser earned a fee of $129,672.
Annual Shareholder Report
67
Administrative Fee
Federated Administrative Services (FAS), under the Administrative Services Agreement, provides the Fund with administrative personnel and services. The fee paid to FAS is based on the average aggregate daily net assets of certain Federated funds as specified below:
| Administrative Fee | Average Aggregate Daily Net Assets
of the Federated Funds |
| 0.150% | on the first $5 billion |
| 0.125% | on the next $5 billion |
| 0.100% | on the next $10 billion |
| 0.075% | on assets in excess of $20 billion |
The administrative fee received during any fiscal year shall be at least $150,000 per portfolio and $40,000 per each additional class of Shares. Subject to the terms described in the Expense Limitation note, FAS may voluntarily choose to waive any portion of its fee. For the year ended July 31, 2011, the net fee paid to FAS was 0.127% of average daily net assets of the Fund. FAS waived $53,290 of its fee.
Distribution Services Fee
The Fund has adopted a Distribution Plan (the “Plan”) pursuant to Rule 12b-1 under the Act. Under the terms of the Plan, the Fund will compensate Federated Securities Corp. (FSC), the principal distributor, from the daily net assets of the Fund's Class A Shares, Class C Shares and Class R Shares to finance activities intended to result in the sale of these shares. The Plan provides that the Fund may incur distribution expenses at the following percentages of average daily net assets annually, to compensate FSC:
| Share Class Name | Percentage of Average Daily
Net Assets of Class |
| Class A Shares | 0.05% |
| Class C Shares | 0.75% |
| Class R Shares | 0.50% |
Subject to the terms described in the Expense Limitation note, FSC may voluntarily choose to waive any portion of its fee. For the year ended July 31, 2011, distribution services fees for the Fund were as follows:
| Distribution Services
Fees Incurred |
| Class C Shares | $366,260 |
| Class R Shares | 3,467 |
| TOTAL | $369,727 |
When FSC receives fees, it may pay some or all of them to financial intermediaries whose customers purchase shares. For the year ended July 31, 2011, FSC retained $23,935 of fees paid by the Fund. For the year ended July 31, 2011, the Fund's Class A Shares did not incur a distribution services fee; however it may begin to incur this fee upon approval of the Trustees.
Annual Shareholder Report
68
Sales Charges
Front-end sales charges and contingent deferred sales charges (CDSC) do not represent expenses of the Fund. They are deducted from the proceeds of sales of Fund shares prior to investment or from redemption proceeds prior to remittance, as applicable. For the year ended July 31, 2011, FSC retained $3,220 in sales charges from the sale of Class A Shares. FSC also retained $212 of CDSC relating to redemptions of Class C Shares.
Shareholder Services Fee
The Fund may pay fees (“Service Fees”) up to 0.25% of the average daily net assets of the Fund's Class A Shares and Class C Shares to financial intermediaries or to Federated Shareholder Services Company (FSSC) for providing services to shareholders and maintaining shareholder accounts. Subject to the terms described in the Expense Limitation note, FSSC may voluntarily reimburse the Fund for Service Fees. For the year ended July 31, 2011, Service Fees for the Fund were as follows:
| Service Fees
Incurred |
| Class A Shares | $151,605 |
| Class C Shares | 61,504 |
| TOTAL | $213,109 |
For the year ended July 31, 2011, FSSC did not receive any fees paid by the Fund.
Expense Limitation
The Adviser and its affiliates (which may include FSC, FAS and FSSC) have voluntarily agreed to waive their fees and/or reimburse expenses so that the total annual fund operating expenses (as shown in the financial highlights) paid by the Fund's Class A Shares, Class C Shares, Class R Shares and Institutional Shares (after the voluntary waivers and/or reimbursements) will not exceed 1.30%, 2.05%, 1.80% and 1.05% (the “Fee Limit”), respectively, up to but not including the later of (the “Termination Date”): (a) October 1, 2012; or (b) the date of the Fund's next effective Prospectus. While the Adviser and its affiliates currently do not anticipate terminating or increasing these arrangements prior to the Termination Date, these arrangements may only be terminated or the Fee Limit increased prior to the Termination Date with the agreement of the Trustees.
General
Certain Officers and Trustees of the Trust are Officers and Directors or Trustees of the above companies.
Annual Shareholder Report
69
Transactions Involving Affiliated HoldingsAffiliated holdings are mutual funds which are managed by the Adviser or an affiliate of the Adviser. The Adviser has agreed to reimburse the Fund for certain investment adviser fees as a result of transactions in other affiliated mutual funds. For the year ended July 31, 2011, the Adviser reimbursed $8,512. Transactions involving the affiliated holdings during the year ended July 31, 2011, were as follows:
| Emerging
Markets
Fixed
Income
Core Fund | Federated
Mortgage
Core
Portfolio | Federated
Prime
Value
Obligations
Fund,
Institutional
Shares | Federated
Project
and Trade
Finance
Core Fund | High Yield
Bond
Portfolio | Total of
Affiliated
Transactions |
| Balance of Shares Held 7/31/2010 | 85,774 | 885,577 | 14,180,603 | 76,445 | 812,740 | 16,041,139 |
| Purchases/Additions | — | 182,102 | 65,607,831 | 4,030 | 115,099 | 65,909,062 |
| Sales/Reductions | 43,195 | 231,669 | 72,747,410 | — | 236,758 | 73,259,032 |
| Balance of Shares Held 7/31/2011 | 42,579 | 836,010 | 7,041,024 | 80,475 | 691,081 | 8,691,169 |
| Value | $1,251,452 | $8,493,859 | $7,041,024 | $810,388 | $4,554,227 | $22,150,950 |
| Dividend Income/Allocated Investment Income | $106,166 | $345,661 | $15,236 | $40,202 | $454,442 | $961,707 |
Capital Gain Distributions/
Allocated Gains | $26,702 | $ — | $ — | $861 | $ — | $27,563 |
6. Investment TRANSACTIONS
Purchases and sales of investments, excluding long-term U.S. government securities and short-term obligations, for the year ended July 31, 2011, were as follows:
| Purchases | $225,363,450 |
| Sales | $264,775,226 |
7. LINE OF CREDIT
The Fund participates in a $100,000,000 unsecured, uncommitted revolving line of credit (LOC) agreement with PNC Bank. The LOC was made available for extraordinary or emergency purposes, primarily for financing redemption payments. Borrowings are charged interest at a rate offered to the Fund by PNC Bank at the time of the borrowing. As of July 31, 2011, there were no outstanding loans. During the year ended July 31, 2011, the Fund did not utilize the LOC.
Annual Shareholder Report
70
8. INTERFUND LENDINGPursuant to an Exemptive Order issued by the Securities and Exchange Commission, the Fund, along with other funds advised by subsidiaries of Federated Investors, Inc., may participate in an interfund lending program. This program provides an alternative credit facility allowing the Fund to borrow from other participating affiliated funds. As of July 31, 2011, there were no outstanding loans. During the year ended July 31, 2011, the program was not utilized.
9. RECENT ACCOUNTING PRONOUNCEMENTS
In April 2011, the Financial Accounting Standards Board (FASB) released Accounting Standards Update (ASU) No. 2011-03, “Reconsideration of Effective Control for Repurchase Agreements.” This ASU amends FASB Accounting Standards Codification (ASC) Topic 860, “Transfers and Servicing”; specifically the criteria required to determine whether a repurchase agreement and similar agreements should be accounted for as sales of financial assets or secured borrowings with commitments. This ASU is effective for fiscal years and interim periods beginning after December 15, 2011. At this time, management is evaluating the implications of adopting ASU No. 2011-03 and its impact on the Fund's financial statements and the accompanying notes.
In addition, in May 2011, FASB released ASU No. 2011-04, “Amendments to Achieve Common Fair Value Measurement and Disclosure Requirements in U.S. GAAP and IFRSs.” This ASU amends FASB ASC Topic 820, “Fair Value Measurement,” to establish common requirements for measuring fair value and for disclosing information about fair value measurements in accordance with GAAP. This ASU is effective for fiscal years and interim periods beginning after December 15, 2011. At this time, management is evaluating the implications of adopting ASU No. 2011-04 and its impact on the Fund's financial statements and the accompanying notes.
10. FEDERAL TAX INFORMATION (UNAUDITED)
For the fiscal year ended July 31, 2011, 83.41% of total ordinary income distributions made by the Fund are qualifying dividends which may be subject to a maximum tax rate of 15%, as provided for by the Jobs and Growth Tax Relief Act of 2003. Complete information is reported in conjunction with the reporting of your distributions on Form 1099-DIV.
Of the ordinary income distributions made by the Fund during the year ended July 31, 2011, 73.69% qualify for the dividend received deduction available to corporate shareholders.
Annual Shareholder Report71
Report of Independent Registered Public Accounting Firm
TO THE BOARD OF trustees OF Federated MDt series AND SHAREHOLDERS OF federated mdt Balanced fund:
We have audited the accompanying statement of assets and liabilities of Federated MDT Balanced Fund (the “Fund”) (one of the portfolios constituting Federated MDT Series), including the portfolio of investments, as of July 31, 2011, and the related statement of operations for the year then ended, the statement of changes in net assets for each of the two years in the period then ended, and the financial highlights for each of the periods indicated therein. These financial statements and financial highlights are the responsibility of the Fund's management. Our responsibility is to express an opinion on these financial statements and financial highlights based on our audits.
We conducted our audits in accordance with standards of the Public Company Accounting Oversight Board (United States). Those standards require that we plan and perform the audit to obtain reasonable assurance about whether the financial statements and financial highlights are free of material misstatement. We were not engaged to perform an audit of the Fund's internal control over financial reporting. Our audits included consideration of internal control over financial reporting as a basis for designing audit procedures that are appropriate in the circumstances, but not for the purpose of expressing an opinion on the effectiveness of the Fund's internal control over financial reporting. Accordingly, we express no such opinion. An audit also includes examining, on a test basis, evidence supporting the amounts and disclosures in the financial statements and financial highlights, assessing the accounting principles used and significant estimates made by management, and evaluating the overall financial statement presentation. Our procedures included confirmation of securities owned as of July 31, 2011, by correspondence with the custodian and others, or by other appropriate auditing procedures where replies from others were not received. We believe that our audits provide a reasonable basis for our opinion.
In our opinion, the financial statements and financial highlights referred to above present fairly, in all material respects, the financial position of Federated MDT Balanced Fund, a portfolio of Federated MDT Series, at July 31, 2011, the results of its operations for the year then ended, the changes in its net assets for each of the two years in the period then ended, and the financial highlights for each of the periods indicated therein, in conformity with U.S. generally accepted accounting principles.
Boston, Massachusetts
September 23, 2011
Annual Shareholder Report72
Board of Trustees and Trust Officers
The Board of Trustees is responsible for managing the Trust's business affairs and for exercising all the Trust's powers except those reserved for the shareholders. The following tables give information about each Trustee and the senior officers of the Fund. Where required, the tables separately list Trustees who are “interested persons” of the Fund (i.e., “Interested” Trustees) and those who are not (i.e., “Independent” Trustees). Unless otherwise noted, the address of each person listed is Federated Investors Tower, 1001 Liberty Avenue, Pittsburgh, PA 15222. The address of all Independent Trustees listed is 4000 Ericsson Drive, Warrendale, PA 15086-7561; Attention: Mutual Fund Board. As of December 31, 2010, the Trust comprised five portfolio(s), and the Federated Fund Family consisted of 43 investment companies (comprising 136 portfolios). Unless otherwise noted, each Officer is elected annually. Unless otherwise noted, each Trustee oversees all portfolios in the Federated Fund Family and serves for an indefinite term. The Fund's Statement of Additional Information includes additional information about Trust Trustees and is available, without charge and upon request, by calling 1-800-341-7400.
Interested TRUSTEES Background
Name
Birth Date
Positions Held with Trust
Date Service Began | Principal Occupation(s) for Past Five Years,
Other Directorships Held and Previous Position(s) |
John F. Donahue*
Birth Date: July 28, 1924
Trustee
Began serving: June 2006 | Principal Occupations: Director or Trustee of the Federated Fund Family; Chairman and Director, Federated Investors, Inc.; Chairman of the Federated Fund Family's Executive Committee.
Previous Positions: Chairman of the Federated Fund Family; Trustee, Federated Investment Management Company; Chairman and Director, Federated Investment Counseling. |
J. Christopher Donahue*
Birth Date: April 11, 1949
President and Trustee
Began serving: May 2006 | Principal Occupations: Principal Executive Officer and President of the Federated Fund Family; Director or Trustee of some of the Funds in the Federated Fund Family; President, Chief Executive Officer and Director, Federated Investors, Inc.; Chairman and Trustee, Federated Investment Management Company; Trustee, Federated Investment Counseling; Chairman and Director, Federated Global Investment Management Corp.; Chairman, Federated Equity Management Company of Pennsylvania and Passport Research, Ltd. (investment advisory subsidiary of Federated); Trustee, Federated Shareholder Services Company; Director, Federated Services Company.
Previous Positions: President, Federated Investment Counseling; President and Chief Executive Officer, Federated Investment Management Company, Federated Global Investment Management Corp. and Passport Research, Ltd. |
| * | Family relationships and reasons for “interested” status: John F. Donahue is the father of J. Christopher Donahue; both are “interested” due to their beneficial ownership of shares of Federated Investors, Inc. and the positions they hold with Federated and its subsidiaries. |
Annual Shareholder Report73
INDEPENDENT TRUSTEES Background
Name
Birth Date
Positions Held with Trust
Date Service Began | Principal Occupation(s) for Past Five Years,
Other Directorships Held, Previous Position(s) and Qualifications |
Nicholas P. Constantakis, CPA
Birth Date: September 3, 1939
Trustee
Began serving: June 2006 | Principal Occupation: Director or Trustee of the Federated Fund Family.
Other Directorship Held: Director and Chairman of the Audit Committee, Michael Baker Corporation (architecture, engineering and construction services).
Previous Position: Partner, Andersen Worldwide SC.
Qualifications: Public accounting and director experience. |
John F. Cunningham
Birth Date: March 5, 1943
Trustee
Began serving: June 2006 | Principal Occupation: Director or Trustee of the Federated Fund Family.
Other Directorships Held: Chairman, President and Chief Executive Officer, Cunningham & Co., Inc. (strategic business consulting); Trustee Associate, Boston College.
Previous Positions: Director, Redgate Communications and EMC Corporation (computer storage systems); Chairman of the Board and Chief Executive Officer, Computer Consoles, Inc.; President and Chief Operating Officer, Wang Laboratories; Director, First National Bank of Boston; Director, Apollo Computer, Inc.
Qualifications: Business management and director experience. |
Maureen Lally-Green
Birth Date: July 5, 1949
Trustee
Began serving: August 2009 | Principal Occupations: Director or Trustee of the Federated Fund Family; Director, Office of Church Relations, Diocese of Pittsburgh; Adjunct Professor of Law, Duquesne University School of Law.
Other Directorships Held: Director, Auberle; Trustee, St. Francis University; Director, Ireland Institute of Pittsburgh; Director, UPMC Mercy Hospital; Regent, St. Vincent Seminary; Director, Epilepsy Foundation of Western and Central Pennsylvania; Director, Saint Thomas More Society, Allegheny County; Director, Carlow University.
Previous Position: Pennsylvania Superior Court Judge.
Qualifications: Legal and director experience. |
Peter E. Madden
Birth Date: March 16, 1942
Trustee
Began serving: June 2006 | Principal Occupation: Director or Trustee, and Chairman of the Board of Directors or Trustees, of the Federated Fund Family.
Previous Positions: Representative, Commonwealth of Massachusetts General Court; President, Chief Operating Officer and Director, State Street Bank and Trust Company and State Street Corporation (retired); Director, VISA USA and VISA International; Chairman and Director, Massachusetts Bankers Association; Director, Depository Trust Corporation; Director, The Boston Stock Exchange.
Qualifications: Business management, mutual fund services and director experience. |
Annual Shareholder Report74
Name
Birth Date
Positions Held with Trust
Date Service Began | Principal Occupation(s) for Past Five Years,
Other Directorships Held, Previous Position(s) and Qualifications |
Charles F. Mansfield, Jr.
Birth Date: April 10, 1945
Trustee
Began serving: June 2006 | Principal Occupations: Director or Trustee and Chairman of the Audit Committee of the Federated Fund Family; Management Consultant.
Previous Positions: Chief Executive Officer, PBTC International Bank; Partner, Arthur Young & Company (now Ernst & Young LLP); Chief Financial Officer of Retail Banking Sector, Chase Manhattan Bank; Senior Vice President, HSBC Bank USA (formerly, Marine Midland Bank); Vice President, Citibank; Assistant Professor of Banking and Finance, Frank G. Zarb School of Business, Hofstra University; Executive Vice President, DVC Group, Inc. (marketing, communications and technology).
Qualifications: Banking, business management, education and director experience. |
R. James Nicholson
Birth Date: February 4, 1938
Trustee
Began serving: January 2008 | Principal Occupations: Director or Trustee of the Federated Fund Family; Senior Counsel, Brownstein Hyatt Farber Schrek, P.C.; Former Secretary of the U.S. Dept. of Veterans Affairs; Former U.S. Ambassador to the Holy See; Former Chairman of the Republican National Committee.
Other Directorships Held: Director, Horatio Alger Association; Director, The Daniels Fund.
Previous Positions: Colonel, U.S. Army Reserve; Partner, Calkins, Kramer, Grimshaw and Harring, P.C.; General Counsel, Colorado Association of Housing and Building; Chairman and CEO, Nicholson Enterprises, Inc. (real estate holding company); Chairman and CEO, Renaissance Homes of Colorado.
Qualifications: Legal, government, business management and director experience. |
Thomas M. O'Neill
Birth Date: June 14, 1951
Trustee
Began serving: October 2006 | Principal Occupations: Director or Trustee of the Federated Fund Family; Sole Proprietor, Navigator Management Company (investment and strategic consulting).
Other Directorships Held: Board of Overseers, Children's Hospital of Boston; Visiting Committee on Athletics, Harvard College.
Previous Positions: Chief Executive Officer and President, Managing Director and Chief Investment Officer, Fleet Investment Advisors; President and Chief Executive Officer, Aeltus Investment Management, Inc.; General Partner, Hellman, Jordan Management Co., Boston, MA; Chief Investment Officer, The Putnam Companies, Boston, MA; Credit Analyst and Lending Officer, Fleet Bank; Director and Consultant, EZE Castle Software (investment order management software); Director, Midway Pacific (lumber).
Qualifications: Business management, mutual fund, director and investment experience. |
Annual Shareholder Report75
Name
Birth Date
Positions Held with Trust
Date Service Began | Principal Occupation(s) for Past Five Years,
Other Directorships Held, Previous Position(s) and Qualifications |
John S. Walsh
Birth Date: November 28, 1957
Trustee
Began serving: June 2006 | Principal Occupations: Director or Trustee of the Federated Fund Family; President and Director, Heat Wagon, Inc. (manufacturer of construction temporary heaters); President and Director, Manufacturers Products, Inc. (distributor of portable construction heaters); President, Portable Heater Parts, a division of Manufacturers Products, Inc.
Previous Position: Vice President, Walsh & Kelly, Inc.
Qualifications: Business management and director experience. |
James F. Will
Birth Date: October 12, 1938
Trustee
Began serving: June 2006 | Principal Occupations: Director or Trustee of the Federated Fund Family; formerly, Vice Chancellor and President, Saint Vincent College.
Other Directorships Held: Trustee, Saint Vincent College; Director, Alleghany Corporation; Trustee, Wheeling Jesuit University; Director, Liberty Tire Recycling.
Previous Positions: Chairman, President and Chief Executive Officer, Armco, Inc.; President and Chief Executive Officer, Cyclops Industries; President and Chief Operating Officer, Kaiser Steel Corporation.
Qualifications: Business management, education and director experience. |
OFFICERS
Name
Birth Date
Positions Held with Trust
Date Service Began | Principal Occupation(s) for Past Five Years
and Previous Position(s) |
John W. McGonigle
Birth Date: October 26, 1938
Secretary
Began serving: May 2006 | Principal Occupations: Executive Vice President and Secretary of the Federated Fund Family; Vice Chairman, Executive Vice President, Secretary and Director, Federated Investors, Inc.
Previous Positions: Trustee, Federated Investment Management Company and Federated Investment Counseling; Director, Federated Global Investment Management Corp., Federated Services Company and Federated Securities Corp. |
Richard A. Novak
Birth Date: December 25, 1963
TREASURER
Began serving: May 2006 | Principal Occupations: Principal Financial Officer and Treasurer of the Federated Fund Family; Senior Vice President, Federated Administrative Services; Financial and Operations Principal for Federated Securities Corp., Edgewood Services, Inc. and Southpointe Distribution Services, Inc.
Previous Positions: Controller of Federated Investors, Inc.; Vice President, Finance of Federated Services Company; held various financial management positions within The Mercy Hospital of Pittsburgh; Auditor, Arthur Andersen & Co. |
Brian P. Bouda
Birth Date: February 28, 1947
CHIEF COMPLIANCE OFFICER AND SENIOR VICE PRESIDENT
Began serving: June 2006 | Principal Occupations: Senior Vice President and Chief Compliance Officer of the Federated Fund Family; Vice President and Chief Compliance Officer of Federated Investors, Inc. and Chief Compliance Officer of its subsidiaries. Mr. Bouda joined Federated in 1999 and is a member of the American Bar Association and the State Bar Association of Wisconsin. |
Annual Shareholder Report76
Evaluation and Approval of Advisory Contract – May 2011
federated mdt balanced fund (the “Fund”)
The Fund's Board reviewed the Fund's investment advisory and subadvisory contracts at meetings held in May 2011. The Board's decision regarding these contracts reflects the exercise of its business judgment on whether to continue the existing arrangements.
In this connection, the Federated Funds' Board had previously appointed a Senior Officer, whose duties include specified responsibilities relating to the process by which advisory fees are to be charged to a Federated fund. The Senior Officer has the authority to retain consultants, experts, or staff as may be reasonably necessary to assist in the performance of his duties, reports directly to the Board, and may be terminated only with the approval of a majority of the independent members of the Board. The Senior Officer prepared and furnished to the Board an independent, written evaluation that covered topics discussed below (the “Evaluation”). The Board considered that Evaluation, along with other information, in deciding to approve the advisory and subadvisory contracts.
During its review of these contracts, the Board considered compensation and benefits received by the Adviser and subadviser. This included the fees received for services provided to the Fund by other entities in the Federated organization and research services (if any) received by the Adviser from brokers that execute Federated fund trades, as well as advisory fees. The Board is also familiar with and considered judicial decisions concerning allegedly excessive investment advisory fees, which have indicated that the following factors may be relevant to an Adviser's fiduciary duty with respect to its receipt of compensation from a fund: the nature and quality of the services provided by the Adviser, including the performance of the fund; the Adviser's cost of providing the services; the extent to which the Adviser may realize “economies of scale” as a fund grows larger; any indirect benefits that may accrue to the Adviser and its affiliates as a result of the Adviser's relationship with a fund; performance and expenses of comparable funds; and the extent to which the independent Board members are fully informed about all facts the Board deems relevant bearing on the Adviser's services and fees. The Board further considered management fees (including any components thereof) charged to institutional and other clients of the Adviser and subadviser for what might be viewed as like services, and the cost to the Adviser and its affiliates of supplying services pursuant to the management fee agreements, excluding any intra-corporate profit and profit margins of the Adviser and its affiliates for supplying such services. The Board was aware of these factors and was guided by them in its review of the Fund's advisory and subadvisory contracts to the extent it considered them to be appropriate and relevant, as discussed further below.
Annual Shareholder Report
77
The Board considered and weighed these circumstances in light of its substantial accumulated experience in governing the Fund and working with Federated on matters relating to the Federated funds, and was assisted in its deliberations by independent legal counsel. Throughout the year, the Board has requested and received substantial and detailed information about the Fund and the Federated organization that was in addition to the extensive materials that comprise and accompany the Senior Officer's Evaluation. Federated provided much of this information at each regular meeting of the Board, and furnished additional information in connection with the particular meeting at which the Board's formal review of the advisory and subadvisory contracts occurred. Between regularly scheduled meetings, the Board also received information on particular matters as the need arose. Thus, the Board's consideration of the advisory and subadvisory contracts included review of the Senior Officer's Evaluation, accompanying data and additional information covering such matters as: the Adviser's and subadviser's investment philosophy, revenue, profitability, personnel and processes; investment and operating strategies; the Fund's short- and long-term performance (in absolute terms, both on a gross basis and net of expenses, as well as in relationship to its particular investment program and certain competitor or “peer group” funds and/or other benchmarks, as appropriate), and comments on the reasons for performance; the Fund's investment objectives; the Fund's expenses (including the advisory fee itself and the overall expense structure of the Fund, both in absolute terms and relative to similar and/or competing funds, with due regard for contractual or voluntary expense limitations); the use and allocation of brokerage commissions derived from trading the Fund's portfolio securities (if any); and the nature, quality and extent of the advisory and other services provided to the Fund by the Adviser and its affiliates. The Board also considered the preferences and expectations of Fund shareholders and their relative sophistication; the continuing state of competition in the mutual fund industry and market practices; the range of comparable fees for similar funds in the mutual fund industry; the Fund's relationship to the Federated family of funds which include a comprehensive array of funds with different investment objectives, policies and strategies which are available for exchange without the incurrence of additional sales charges; compliance and audit reports concerning the Federated funds and the Federated companies that service them (including communications from regulatory agencies), as well as Federated's responses to any issues raised therein; and relevant developments in the mutual fund industry and how the Federated funds and/or Federated are responding to them. The Board's evaluation process is evolutionary. The criteria considered and the emphasis placed on relevant criteria change in recognition of changing circumstances in the mutual fund marketplace.Annual Shareholder Report
78
With respect to the Fund's performance and expenses in particular, the Board has found the use of comparisons to other mutual funds with comparable investment programs to be relevant, given the high degree of competition in the mutual fund business. The Board focused on comparisons with other similar mutual funds more heavily than non-mutual fund products or services because it is believed that they are more relevant. For example, other mutual funds are the products most like the Fund, they are readily available to Fund shareholders as alternative investment vehicles, and they are the type of investment vehicle in fact chosen and maintained by the Fund's investors. The range of their fees and expenses therefore appears to be a generally reliable indication of what consumers have found to be reasonable in the precise marketplace in which the Fund competes. The Fund's ability to deliver competitive performance when compared to its peer group was a useful indicator of how the Adviser is executing the Fund's investment program, which in turn assisted the Board in reaching a conclusion that the nature, extent, and quality of the Adviser's investment management services were such as to warrant continuation of the advisory contract. In this regard, the Senior Officer has reviewed Federated's fees for providing advisory services to products outside the Federated family of funds (e.g., institutional and separate accounts). He concluded that mutual funds and institutional accounts are inherently different products. Those differences include, but are not limited to, different types of targeted investors; being subject to different laws and regulations; different legal structures; different average account sizes; different associated costs; different portfolio management techniques made necessary by different cash flows; and portfolio manager time spent in review of securities pricing. The Senior Officer did not consider these fee schedules to be determinative in judging the appropriateness of mutual fund advisory contracts.The Senior Officer reviewed information compiled by Federated, using data supplied by independent fund ranking organizations, regarding the performance of, and fees charged by, other mutual funds, noting his view that comparisons to fund peer groups are relevant in judging the reasonableness of proposed fees. He also observed that certain funds may exhibit important differences in their objectives and management techniques when compared to other funds placed in the same peer group by ranking organizations, noting in this connection that the Fund's quantitative investment program is of such a type.
The Fund's performance fell below the median of the relevant peer group for the one-year, three-year and five-year periods covered by the Evaluation. The Board discussed the Fund's performance with the Adviser and recognized the efforts being undertaken by the Adviser. The Board will continue to monitor these efforts and the performance of the Fund.
The Board also received financial information about Federated, including information regarding the compensation and benefits Federated derived from its relationships with the Federated funds. This information covered not only the fees under the advisory contracts, but also fees received by Federated's Annual Shareholder Report
79
subsidiaries for providing other services to the Federated funds under separate contracts (e.g., for serving as the Federated funds' administrator). The information also detailed any indirect benefit Federated may derive from its receipt of research services from brokers who execute Federated fund trades. In addition, the Board considered the fact that, in order for a fund to be competitive in the marketplace, Federated and its affiliates frequently waived fees and/or reimbursed expenses and have disclosed to fund investors and/or indicated to the Board their intention to do so in the future, where appropriate. Moreover, the Board receives regular reporting as to the institution or elimination of these voluntary waivers.Federated furnished information, requested by the Senior Officer, that reported revenues on a fund-by-fund basis and made estimates of the allocation of expenses on a fund-by-fund basis, using allocation methodologies specified by the Senior Officer. The Senior Officer noted that, although they may apply consistent allocation processes, the inherent difficulties in allocating costs (and the unavoidable arbitrary aspects of that exercise) and the lack of consensus on how to allocate those costs may render such allocation information unreliable. The allocation information was considered in the analysis by the Board but was determined to be of limited use.
The Board and the Senior Officer also reviewed information compiled by Federated comparing profitability information for Federated to other publicly held fund management companies. In this regard, the Senior Officer noted the limited availability of such information, but nonetheless concluded that Federated's profit margins did not appear to be excessive and the Board agreed.
The Senior Officer's Evaluation also discussed the notion of possible realization of “economies of scale” as a fund grows larger. The Board considered in this regard that the Adviser has made significant and long-term investments in areas that support all of the Federated funds, such as personnel and processes for the portfolio management, compliance, internal audit, and risk management functions; and systems technology; and that the benefits of these efforts (as well as any economies, should they exist) were likely to be enjoyed by the fund complex as a whole. Finally, the Board also noted the absence of any applicable regulatory or industry guidelines on this subject, which (as discussed in the Senior Officer's Evaluation) is compounded by the lack of any common industry practice or general pattern with respect to structuring fund advisory fees with “breakpoints” that serve to reduce the fee as the fund attains a certain size. The Senior Officer did not recommend institution of breakpoints in pricing Federated's fund advisory services at this time.
It was noted in the materials for the Board meeting that for the period covered by the Evaluation, the Fund's investment advisory fee, after waivers and expense reimbursements, if any, was below the median of the relevant peer group. The Board reviewed the fees and other expenses of the Fund with the Adviser and was satisfied that the overall expense structure of the Fund remained competitive.
Annual Shareholder Report
80
The Senior Officer noted that, considering the totality of the circumstances, and all of the factors referenced within his Evaluation, he had concluded that, subject to comments and recommendations made within his Evaluation, his observations and the information accompanying the Evaluation supported a finding by the Board that the management fees for each of the funds are reasonable and that Federated appeared to provide appropriate administrative services to the Fund for the fees paid. Under these circumstances, no changes were recommended to, and no objection was raised to, the continuation of the Fund's advisory and subadvisory contracts. The Board concluded that the nature, quality and scope of services provided the Fund by the Adviser and its affiliates were satisfactory.In its decision to continue an existing investment advisory contract, the Board was mindful of the potential disruptions of the Fund's operations and various risks, uncertainties and other effects that could occur as a result of a decision to terminate or not renew an advisory contract. In particular, the Board recognized that many shareholders have invested in the Fund on the strength of the Adviser's industry standing and reputation and with the expectation that the Adviser will have a continuing role in providing advisory services to the Fund. Thus, the Board's approval of the advisory contract reflected the fact that it is the shareholders who have effectively selected the Adviser by virtue of having invested in the Fund.
The Board based its decision to approve the advisory and subadvisory contracts on the totality of the circumstances and relevant factors and with a view to past and future long-term considerations. Not all of the factors and considerations identified above were necessarily relevant to the Fund, nor did the Board consider any one of them to be determinative. With respect to the factors that were relevant, the Board's decision to approve the contract reflects its determination that Federated's performance and actions provided a satisfactory basis to support the decision to continue the existing arrangements.
Annual Shareholder Report81
Voting Proxies on Fund Portfolio Securities
A description of the policies and procedures that the Fund uses to determine how to vote proxies, if any, relating to securities held in the Fund's portfolio is available, without charge and upon request, by calling 1-800-341-7400. A report on “Form N-PX” of how the Fund voted any such proxies during the most recent 12-month period ended June 30 is available from Federated's website at FederatedInvestors.com. To access this information from the home page, select “View All” next to “Find Products.” Select a fund name and share class, if applicable, to go to the Fund Overview page. On the Fund Overview page, select the “Documents” tab. At the bottom of that page, select “Proxy Voting Record Report (Form N-PX).” Form N-PX filings are also available at the SEC's website at www.sec.gov.
Quarterly Portfolio Schedule
The Fund files with the SEC a complete schedule of its portfolio holdings, as of the close of the first and third quarters of its fiscal year, on “Form N-Q.” These filings are available on the SEC's website at www.sec.gov and may be reviewed and copied at the SEC's Public Reference Room in Washington, DC. (Call 1-800-SEC-0330 for information on the operation of the Public Reference Room.) You may also access this information from the “Products” section of Federated's website at FederatedInvestors.com. From the home page, select “View All” next to “Find Products.” Select a fund name and share class, if applicable, to go to the Fund Overview page. On the Fund Overview page, select the “Documents” tab. At the bottom of that page, select “Form N-Q.”
Annual Shareholder Report82
Mutual funds are not bank deposits or obligations, are not guaranteed by any bank and are not insured or guaranteed by the U.S. government, the Federal Deposit Insurance Corporation, the Federal Reserve Board or any other government agency. Investment in mutual funds involves investment risk, including the possible loss of principal.
This Report is authorized for distribution to prospective investors only when preceded or accompanied by the Fund's Prospectus, which contains facts concerning its objective and policies, management fees, expenses and other information.
Federated MDT Balanced Fund
Federated Investors Funds
4000 Ericsson Drive
Warrendale, PA 15086-7561
Contact us at FederatedInvestors.com
or call 1-800-341-7400.
Federated Securities Corp., Distributor
Cusip 31421R841
Cusip 31421R833
Cusip 31421R692
Cusip 31421R825
37326 (9/11)
Federated is a registered trademark of Federated Investors, Inc.
2011 © Federated Investors, Inc.
| | Annual Shareholder Report |
| | July 31, 2011 |
|
| Share Class | Ticker |
| A | QALGX |
| B | QBLGX |
| C | QCLGX |
| IS | QILGX |
Federated MDT Large Cap Growth Fund
Fund Established 2005
A Portfolio of Federated MDT Series
Financial Highlights
Shareholder Expense Example
Management's Discussion of Fund Performance
Portfolio of Investments Summary Table
Portfolio of Investments
Statement of Assets and Liabilities
Statement of Operations
Statement of Changes in Net Assets
Notes to Financial Statements
Report of Independent Registered Public Accounting Firm
Board of Trustees and Trust Officers
Evaluation and Approval of Advisory Contract
Voting Proxies on Fund Portfolio Securities
Quarterly Portfolio Schedule
Financial Highlights – Class A Shares
(For a Share Outstanding Throughout Each Period)
| Year Ended July 31 | 2011 | 2010 | 2009 | 2008 | 20071 |
| Net Asset Value, Beginning of Period | $8.45 | $7.60 | $10.23 | $12.12 | $10.17 |
| Income From Investment Operations: | | | | | |
| Net investment income (loss) | (0.03)2 | (0.01)2 | 0.002,3 | (0.06)2 | (0.14)2 |
| Net realized and unrealized gain (loss) on investments | 2.08 | 0.86 | (2.63) | (0.48) | 2.20 |
| TOTAL FROM INVESTMENT OPERATIONS | 2.05 | 0.85 | (2.63) | (0.54) | 2.06 |
| Less Distributions: | | | | | |
| Distributions from net realized gain on investments | — | — | — | (1.35) | (0.11) |
| Net Asset Value, End of Period | $10.50 | $8.45 | $7.60 | $10.23 | $12.12 |
| Total Return4 | 24.26% | 11.18% | (25.71)% | (5.76)% | 20.38% |
| Ratios to Average Net Assets: | | | | | |
| Net expenses | 1.50% | 1.50% | 1.50% | 1.50% | 1.50% |
| Net investment income (loss) | (0.28)% | (0.08)% | 0.04% | (0.49)% | (1.14)% |
| Expense waiver/reimbursement5 | 0.74% | 0.55% | 0.52% | 0.14% | 2.30% |
| Supplemental Data: | | | | | |
| Net assets, end of period (000 omitted) | $44,762 | $45,993 | $68,963 | $102,600 | $88,826 |
| Portfolio turnover | 208% | 217% | 380% | 320% | 630% |
| 1 | MDT Large Cap Growth Fund (the “Predecessor Fund”) was reorganized into Federated MDT Large Cap Growth Fund (the “Fund”) as of the close of business on December 8, 2006. Prior to the reorganization, the Fund had no investment operations. The Fund is the Successor to the Predecessor Fund. The performance information and financial information presented incorporates the operations of the Predecessor Fund, which, as a result of the reorganization, are the Fund's operations. |
| 2 | Per share numbers have been calculated using the average shares method. |
| 3 | Represents less than $0.01. |
| 4 | Based on net asset value, which does not reflect the sales charge, redemption fee or contingent deferred sales charge, if applicable. |
| 5 | This expense decrease is reflected in both the net expense and the net investment income (loss) ratios shown above. |
See Notes which are an integral part of the Financial Statements
Annual Shareholder Report1
Financial Highlights – Class B Shares
(For a Share Outstanding Throughout Each Period)
| Year Ended July 31, | Period
Ended
7/31/20071 |
| 2011 | 2010 | 2009 | 2008 |
| Net Asset Value, Beginning of Period | $8.30 | $7.53 | $10.21 | $12.18 | $11.48 |
| Income From Investment Operations: | | | | | |
| Net investment income (loss) | (0.10)2 | (0.07)2 | (0.05)2 | (0.14)2 | (0.08)2 |
| Net realized and unrealized gain (loss) on investments | 2.04 | 0.84 | (2.63) | (0.48) | 0.78 |
| TOTAL FROM INVESTMENT OPERATIONS | 1.94 | 0.77 | (2.68) | (0.62) | 0.70 |
| Less Distributions: | | | | | |
| Distributions from net realized gain on investments | — | — | — | (1.35) | — |
| Net Asset Value, End of Period | $10.24 | $8.30 | $7.53 | $10.21 | $12.18 |
| Total Return3 | 23.37% | 10.23% | (26.25)% | (6.43)% | 6.10% |
| Ratios to Average Net Assets: | | | | | |
| Net expenses | 2.25% | 2.25% | 2.25% | 2.25% | 2.24%4 |
| Net investment income (loss) | (1.04)% | (0.86)% | (0.72)% | (1.22)% | (1.95)%4 |
| Expense waiver/reimbursement5 | 0.74% | 0.56% | 0.52% | 0.14% | 0.54%4 |
| Supplemental Data: | | | | | |
| Net assets, end of period (000 omitted) | $6,680 | $7,506 | $8,532 | $22,138 | $46,933 |
| Portfolio turnover | 208% | 217% | 380% | 320% | 630%6 |
| 1 | Reflects operations for the period from March 29, 2007 (date of initial investment) to July 31, 2007. |
| 2 | Per share numbers have been calculated using the average shares method. |
| 3 | Based on net asset value, which does not reflect the sales charge, redemption fee or contingent deferred sales charge, if applicable. Total returns for periods of less than one year are not annualized. |
| 4 | Computed on an annualized basis. |
| 5 | This expense decrease is reflected in both the net expense and the net investment income (loss) ratios shown above. |
| 6 | Portfolio turnover is calculated at the Fund level. Percentage indicated was calculated for the year ended July 31, 2007. |
See Notes which are an integral part of the Financial Statements
Annual Shareholder Report2
Financial Highlights – Class C Shares
(For a Share Outstanding Throughout Each Period)
| Year Ended July 31 | 2011 | 2010 | 2009 | 2008 | 20071 |
| Net Asset Value, Beginning of Period | $8.12 | $7.37 | $9.99 | $11.94 | $10.10 |
| Income From Investment Operations: | | | | | |
| Net investment income (loss) | (0.10)2 | (0.07)2 | (0.05)2 | (0.13)2 | (0.22)2 |
| Net realized and unrealized gain (loss) on investments | 2.00 | 0.82 | (2.57) | (0.47) | 2.17 |
| TOTAL FROM INVESTMENT OPERATIONS | 1.90 | 0.75 | (2.62) | (0.60) | 1.95 |
| Less Distributions: | | | | | |
| Distributions from net realized gain on investments | — | — | — | (1.35) | (0.11) |
| Net Asset Value, End of Period | $10.02 | $8.12 | $7.37 | $9.99 | $11.94 |
| Total Return3 | 23.40% | 10.18% | (26.23)% | (6.39)% | 19.42% |
| Ratios to Average Net Assets: | | | | | |
| Net expenses | 2.25% | 2.25% | 2.25% | 2.22% | 2.25% |
| Net investment income (loss) | (1.05)% | (0.86)% | (0.71)% | (1.21)% | (1.83)% |
| Expense waiver/reimbursement4 | 0.74% | 0.56% | 0.52% | 0.14% | 5.64% |
| Supplemental Data: | | | | | |
| Net assets, end of period (000 omitted) | $7,564 | $6,816 | $7,333 | $14,895 | $14,388 |
| Portfolio turnover | 208% | 217% | 380% | 320% | 630% |
| 1 | The Predecessor Fund was reorganized into the Fund as of the close of business on December 8, 2006. Prior to the reorganization, the Fund had no investment operations. The Fund is the Successor to the Predecessor Fund. The performance information and financial information presented incorporates the operations of the Predecessor Fund, which, as a result of the reorganization, are the Fund's operations. |
| 2 | Per share numbers have been calculated using the average shares method. |
| 3 | Based on net asset value, which does not reflect the sales charge, redemption fee or contingent deferred sales charge, if applicable. |
| 4 | This expense decrease is reflected in both the net expense and the net investment income (loss) ratios shown above. |
See Notes which are an integral part of the Financial Statements
Annual Shareholder Report3
Financial Highlights – Institutional Shares
(For a Share Outstanding Throughout Each Period)
| Year Ended July 31 | 2011 | 2010 | 2009 | 2008 | 20071 |
| Net Asset Value, Beginning of Period | $8.57 | $7.70 | $10.33 | $12.20 | $10.20 |
| Income From Investment Operations: | | | | | |
| Net investment income (loss) | (0.00)2,3 | 0.012 | 0.022 | (0.03)2 | (0.03)2 |
| Net realized and unrealized gain (loss) on investments | 2.11 | 0.86 | (2.65) | (0.49) | 2.14 |
| TOTAL FROM INVESTMENT OPERATIONS | 2.11 | 0.87 | (2.63) | (0.52) | 2.11 |
| Less Distributions: | | | | | |
| Distributions from net realized gain on investments | — | — | — | (1.35) | (0.11) |
| Net Asset Value, End of Period | $10.68 | $8.57 | $7.70 | $10.33 | $12.20 |
| Total Return4 | 24.62% | 11.30% | (25.46)% | (5.55)% | 20.81% |
| Ratios to Average Net Assets: | | | | | |
| Net expenses | 1.25% | 1.25% | 1.25% | 1.25% | 1.25% |
| Net investment income (loss) | (0.05)% | 0.14% | 0.28% | (0.28)% | (0.29)% |
| Expense waiver/reimbursement5 | 0.74% | 0.56% | 0.52% | 0.14% | 19.41% |
| Supplemental Data: | | | | | |
| Net assets, end of period (000 omitted) | $4,565 | $4,179 | $4,769 | $6,280 | $1,798 |
| Portfolio turnover | 208% | 217% | 380% | 320% | 630% |
| 1 | The Predecessor Fund was reorganized into The Fund as of the close of business on December 8, 2006. Prior to the reorganization, the Fund had no investment operations. The Fund is the Successor to the Predecessor Fund. The performance information and financial information presented incorporates the operations of the Predecessor Fund, which, as a result of the reorganization, are the Fund's operations. |
| 2 | Per share numbers have been calculated using the average shares method. |
| 3 | Represents less than $0.01. |
| 4 | Based on net asset value. |
| 5 | This expense decrease is reflected in both the net expense and the net investment income (loss) ratios shown above. |
See Notes which are an integral part of the Financial Statements
Annual Shareholder Report4
Shareholder Expense Example (unaudited)
As a shareholder of the Fund, you incur two types of costs: (1) transaction costs, including sales charges (loads) on purchase or redemption payments; and (2) ongoing costs, including management fees and to the extent applicable, distribution (12b-1) fees and/or shareholder services fees and other Fund expenses. This Example is intended to help you to understand your ongoing costs (in dollars) of investing in the Fund and to compare these costs with the ongoing costs of investing in other mutual funds. It is based on an investment of $1,000 invested at the beginning of the period and held for the entire period from February 1, 2011 to July 31, 2011.
ACTUAL EXPENSES
The first section of the table below provides information about actual account values and actual expenses. You may use the information in this section, together with the amount you invested, to estimate the expenses that you incurred over the period. Simply divide your account value by $1,000 (for example, an $8,600 account value divided by $1,000 = 8.6), then multiply the result by the number in the first section under the heading entitled “Expenses Paid During Period” to estimate the expenses attributable to your investment during this period.
HYPOTHETICAL EXAMPLE FOR COMPARISON PURPOSES
The second section of the table below provides information about hypothetical account values and hypothetical expenses based on the Fund's actual expense ratio and an assumed rate of return of 5% per year before expenses, which is not the Fund's actual return. Thus, you should not use the hypothetical account values and expenses to estimate the actual ending account balance or your expenses for the period. Rather, these figures are required to be provided to enable you to compare the ongoing costs of investing in the Fund with other funds. To do so, compare this 5% hypothetical example with the 5% hypothetical examples that appear in the shareholder reports of the other funds.
Annual Shareholder Report
5
Please note that the expenses shown in the table are meant to highlight your ongoing costs only and do not reflect any transaction costs, such as sales charges (loads) on purchase or redemption payments. Therefore, the second section of the table is useful in comparing ongoing costs only, and will not help you determine the relative total costs of owning different funds. In addition, if these transaction costs were included, your costs would have been higher. | Beginning
Account Value
2/1/2011 | Ending
Account Value
7/31/2011 | Expenses Paid
During Period1 |
| Actual: | | | |
| Class A Shares | $1,000 | $1,060.60 | $7.66 |
| Class B Shares | $1,000 | $1,056.80 | $11.47 |
| Class C Shares | $1,000 | $1,057.00 | $11.53 |
| Institutional Shares | $1,000 | $1,062.70 | $6.39 |
Hypothetical (assuming a 5% return
before expenses): | | | |
| Class A Shares | $1,000 | $1,017.36 | $7.50 |
| Class B Shares | $1,000 | $1,013.64 | $11.23 |
| Class C Shares | $1,000 | $1,013.59 | $11.28 |
| Institutional Shares | $1,000 | $1,018.60 | $6.26 |
| 1 | Expenses are equal to the Fund's annualized net expense ratios, multiplied by the average account value over the period, multiplied by 181/365 (to reflect the one-half-year period). The annualized net expense ratios are as follows: |
| Class A Shares | 1.50% |
| Class B Shares | 2.25% |
| Class C Shares | 2.26% |
| Institutional Shares | 1.25% |
Annual Shareholder Report6
Performance data quoted represents past performance which is no guarantee of future results. Investment return and principal value will fluctuate so that an investor's shares, when redeemed, may be worth more or less than their original cost. Mutual fund performance changes over time and current performance may be lower or higher than what is stated. For current to the most recent month-end performance and after-tax returns, visit FederatedInvestors.com or call 1-800-341-7400.
Management's Discussion of Fund Performance (unaudited)
During the 12-month reporting period ended July 31, 2011, the Fund's total return based on net asset value was 24.26% for Class A Shares, 23.37% for Class B Shares, 23.40% for Class C Shares and 24.62% for the Institutional Shares. The total return of the Russell 1000® Growth Index,1 a broad-based securities market index (the “Russell 1000® Growth”), was 24.76% for the same reporting period. The Fund's total return for the fiscal year reflected actual cash flows, transaction costs and other expenses which were not reflected in the total return of the Russell 1000® Growth.
| 1 | The Russell 1000® Growth measures the performance of those Russell 1000® companies with higher price-to-book ratios and higher forecasted growth values. The index is unmanaged, and unlike the Fund, is not affected by cash flows. The Russell 1000® Growth is not adjusted to reflect sales charges, expenses or other fees that the Securities and Exchange Commission (SEC) requires to be reflected in the Fund's performance. It is not possible to invest directly in an index. |
Annual Shareholder Report
7
MARKET OVERVIEWDuring the 12-month reporting period, domestic equity market performance was strong as evidenced by the 20.94% return of the Russell 3000® Index,2 which represents the performance of the 3,000 largest U.S. companies by market capitalization. Mid-cap stocks led the way during the reporting period as demonstrated by the 24.51% return of the Russell Midcap® Index,3 which exceeded the 19.09% and 23.92% results for the Russell Top 200® Index,4 representing large-cap stocks and the Russell 2000® Index,5 representing small-cap stocks, respectively. Growth stocks outperformed value stocks during the fiscal year with the Russell 3000® Growth Index6 returning 25.12% as compared to 16.90% for the Russell 3000 Value® Index.7
The best performing sectors in the Russell 1000 Growth during the reporting period were Energy (+42.94%), Consumer Discretionary (+33.54%) and Materials (+29.09%). Underperforming sectors included Telecommunications Services (+11.98%), Utilities (+14.19%) and Financials (+15.51%).
| 2 | The Russell 3000® Index offers investors access to the broad U.S. equity universe representing approximately 98% of the U.S. market. The Russell 3000® Index is constructed to provide a comprehensive, unbiased and stable barometer of the broad market and is completely reconstituted annually to ensure new and growing equities are reflected. The index is unmanaged and, unlike the Fund, is not affected by cash flows. The index is not adjusted to reflect sales charges, expenses or other fees that the SEC requires to be reflected in the Fund's performance. It is not possible to invest directly in an index. |
| 3 | The Russell Midcap® Index measures the performance of the 800 smallest companies in the Russell 1000® Index and represents approximately 31% of the total market capitalization of the Russell 1000® Index. The index is unmanaged and, unlike the Fund, is not affected by cash flows. The index is not adjusted to reflect sales charges, expenses or other fees that the SEC requires to be reflected in the Fund's performance. It is not possible to invest directly in an index. |
| 4 | The Russell Top 200® Index measures the performance of the 200 largest companies in the Russell 1000® Index and represents approximately 68% of the total market capitalization of the Russell 1000® Index. The index is unmanaged and, unlike the Fund, is not affected by cash flows. The index is not adjusted to reflect sales charges, expenses or other fees that the SEC requires to be reflected in the Fund's performance. It is not possible to invest directly in an index. |
| 5 | The Russell 2000® Index measures the performance of the 2,000 smallest companies in the Russell 3000® Index and represents approximately 10% of the total market capitalization of the Russell 3000® Index. The index is unmanaged and, unlike the Fund, is not affected by cash flows. The index is not adjusted to reflect sales charges, expenses or other fees that the SEC requires to be reflected in the Fund's performance. It is not possible to invest directly in an index. |
| 6 | The Russell 3000® Growth Index measures the performance of those Russell 3000® Index companies with higher price-to-book ratios and higher forecasted growth values. The stocks in this index are also members of either the Russell 1000® Growth or the Russell 2000® Growth indexes. The index is unmanaged and, unlike the Fund, is not affected by cash flows. The index is not adjusted to reflect sales charges, expenses or other fees that the SEC requires to be reflected in the Fund's performance. It is not possible to invest directly in an index. |
| 7 | The Russell 3000® Value Index measures the performance of those Russell 3000® Index companies with lower price-to-book ratios and lower forecasted growth values. The stocks in this index are also members of either the Russell 1000® Value or the Russell 2000® Value indexes. The index is unmanaged and, unlike the Fund, is not affected by cash flows. The index is not adjusted to reflect sales charges, expenses or other fees that the SEC requires to be reflected in the Fund's performance. It is not possible to invest directly in an index. |
Annual Shareholder Report
8
FUND PERFORMANCEDuring the 12-month reporting period, the most significant positive factor in the Fund's performance relative to the Russell 1000 Growth was stock selection in the Consumer Staples sector. Stock selection in the Industrials, Consumer Discretionary and Energy sectors also contributed significantly to the Fund's performance. An overweight in the Consumer Discretionary sector, which outperformed the Russell 1000® Growth, contributed more moderately. An underweight in the Financials sector, which underperformed the Russell 1000 Growth, also contributed moderately. The most significant negative factor in the Fund's performance was stock selection in the Information Technology sector. An underweight in the Energy sector, which outperformed the Russell 1000 Growth, also detracted significantly. An overweight in the Information Technology sector, which underperformed the Russell 1000 Growth, detracted more moderately from relative performance.
Relative performance can be affected by securities that are held in both the Fund and the Russell 1000 Growth (but with different weightings) as well as securities that are not included in both. Individual stocks detracting from the Fund's performance included Apple,8 Exxon,8 Schlumberger,8 Amazon,9 and Edwards Lifesciences.
Individual stocks contributing to the Fund's performance included Netflix, Piceline.com, Danaher, Petrohawk Energy and Lorillard.
| 8 | Underweighted in the portfolio as compared to the Russell 1000® Growth. |
| 9 | No exposure in the portfolio as compared to the Russell 1000® Growth. |
Annual Shareholder Report9
GROWTH OF A $10,000 INVESTMENT – CLASS A SHARES
The graph below illustrates the hypothetical investment of $10,0001 in the Federated MDT Large Cap Growth Fund2 (Class A Shares) (the “Fund”) from September 15, 2005 (start of performance) to July 31, 2011, compared to the Russell 1000® Growth Index (Russell 1000® Growth).3
| Average Annual Total Returns for the Period Ended 7/31/2011 | |
| 1 Year | 17.45% |
| 5 Years | 1.92% |
| Start of Performance (9/15/2005) | 1.94% |
| Federated MDT Large Cap Growth Fund - Class A Shares | C000035049 | Russell 1000® Growth | Lipper Large Cap Growth Funds Index |
| 9/15/2005 | 9,450 | 10,000 | 10,000 |
| 7/31/2006 | 9,621 | 10,027 | 9,864 |
| 7/31/2007 | 11,570 | 11,979 | 11,607 |
| 7/31/2008 | 10,905 | 11,225 | 11,039 |
| 7/31/2009 | 8,101 | 9,253 | 8,889 |
| 7/31/2010 | 9,007 | 10,516 | 9,938 |
| 7/31/2011 | 11,192 | 13,119 | 12,281 |
41 graphic description end -->
Performance data quoted represents past performance which is no guarantee of future results. Investment return and principal value will fluctuate so that an investor's Shares, when redeemed, may be worth more or less than their original cost. Mutual fund performance changes over time and current performance may be lower or higher than what is stated. For current to the most recent month-end performance and after-tax returns, visit FederatedInvestors.com or call 1-800-341-7400. Returns shown do not reflect the deduction of taxes that a shareholder would pay on Fund distributions or the redemption of Fund Shares. Mutual funds are not obligations of or guaranteed by any bank and are not federally insured. Total returns shown include the maximum sales charge of 5.50%.
Annual Shareholder Report
10
| 1 | Represents a hypothetical investment of $10,000 in the Fund after deducting the maximum sales charge of 5.50% ($10,000 investment minus $550 sales charge = $9,450). The Fund's performance assumes the reinvestment of all dividends and distributions. The Russell 1000® Growth and the Lipper Large-Cap Growth Funds Index have been adjusted to reflect reinvestment of dividends on securities in the indexes. |
| 2 | The Fund is the successor to the MDT Large Cap Growth Fund pursuant to a reorganization that took place on December 8, 2006. Prior to that date, the Fund had no investment operations. Accordingly, the performance information shown for the periods prior to that date is that of the MDT Large Cap Growth Fund. |
| 3 | The Russell 1000® Growth measures the performance of those Russell 1000 companies with higher price-to-book ratios and higher forecasted growth values. The index is unmanaged and, unlike the Fund, is not affected by cash flows. The Russell 1000® Growth is not adjusted to reflect sales charges, expenses or other fees that the Securities and Exchange Commission (SEC) requires to be reflected in the Fund's performance. It is not possible to invest directly in an index. |
Annual Shareholder Report11
GROWTH OF A $10,000 INVESTMENT – CLASS B SHARES
The graph below illustrates the hypothetical investment of $10,0001 in the Federated MDT Large Cap Growth Fund2 (Class B Shares) (the “Fund”) from September 15, 2005 (start of performance) to July 31, 2011, compared to the Russell 1000® Growth Index (Russell 1000® Growth).3
| Average Annual Total Returns for the Period Ended 7/31/2011 | |
| 1 Year | 17.87% |
| 5 Years | 1.99% |
| Start of Performance (9/15/2005)4 | 2.05% |
| Federated MDT Large Cap Growth Fund - Class B Shares | C000049171 | Russell 1000® Growth | Lipper Large Cap Growth Funds Index |
| 9/15/2005 | 10,000 | 10,000 | 10,000 |
| 7/31/2006 | 10,117 | 10,027 | 9,864 |
| 7/31/2007 | 12,111 | 11,979 | 11,607 |
| 7/31/2008 | 11,332 | 11,225 | 11,039 |
| 7/31/2009 | 8,131 | 9,253 | 8,889 |
| 7/31/2010 | 9,046 | 10,516 | 9,938 |
| 7/31/2011 | 11,265 | 13,119 | 12,281 |
41 graphic description end -->
Performance data quoted represents past performance which is no guarantee of future results. Investment return and principal value will fluctuate so that an investor's Shares, when redeemed, may be worth more or less than their original cost. Mutual fund performance changes over time and current performance may be lower or higher than what is stated. For current to the most recent month-end performance and after-tax returns, visit FederatedInvestors.com or call 1-800-341-7400. Returns shown do not reflect the deduction of taxes that a shareholder would pay on Fund distributions or the redemption of Fund Shares. Mutual funds are not obligations of or guaranteed by any bank and are not federally insured. Total returns shown include the maximum contingent deferred sales charge (CDSC) of 5.50%, as applicable.
Annual Shareholder Report
12
| 1 | Represents a hypothetical investment of $10,000 in the Fund. The maximum CDSC is 5.50% on any redemption less than one year from the purchase date. The Fund's performance assumes the reinvestment of all dividends and distributions. The Russell 1000® Growth and the Lipper Large-Cap Growth Funds Index have been adjusted to reflect reinvestment of dividends on securities in the indexes. |
| 2 | The Fund is the successor to the MDT Large Cap Growth Fund pursuant to a reorganization that took place on December 8, 2006. Prior to that date, the Fund had no investment operations. Accordingly, the performance information shown for the periods prior to that date is that of the MDT Large Cap Growth Fund. |
| 3 | The Russell 1000® Growth measures the performance of those Russell 1000 companies with higher price-to-book ratios and higher forecasted growth values. The Russell 1000® Growth is not adjusted to reflect sales charges, expenses or other fees that the SEC requires to be reflected in the Fund's performance. It is not possible to invest directly in an index. |
| 4 | The start of performance date was September 15, 2005. Class B Shares of the Fund were offered beginning March 29, 2007. Performance results shown before that date are for the Fund's Institutional Shares and have been adjusted for the maximum CDSC and total annual operating expenses applicable to the Fund's Class B Shares. The Fund's Institutional Shares commenced operations September 15, 2005. Subject to the expense adjustments described above, the Fund's Class B Shares annual returns would have been substantially similar to those of the Fund's Institutional Shares because Shares of each class are invested in the same portfolio of securities. |
Annual Shareholder Report13
GROWTH OF A $10,000 INVESTMENT – CLASS C SHARES
The graph below illustrates the hypothetical investment of $10,0001 in the Federated MDT Large Cap Growth Fund2 (Class C Shares) (the “Fund”) from September 15, 2005 (start of performance) to July 31, 2011, compared to the Russell 1000® Growth Index (Russell 1000® Growth).3
| Average Annual Total Returns for the Period Ended 7/31/2011 | |
| 1 Year | 22.40% |
| 5 Years | 2.30% |
| Start of Performance (9/15/2005) | 2.14% |
| Federated MDT Large Cap Growth Fund - Class C Shares | C000035050 | Russell 1000® Growth | Lipper Large Cap Growth Funds Index |
| 9/15/2005 | 10,000 | 10,000 | 10,000 |
| 7/31/2006 | 10,110 | 10,027 | 9,864 |
| 7/31/2007 | 12,062 | 11,979 | 11,607 |
| 7/31/2008 | 11,291 | 11,225 | 11,039 |
| 7/31/2009 | 8,330 | 9,253 | 8,889 |
| 7/31/2010 | 9,178 | 10,516 | 9,938 |
| 7/31/2011 | 11,325 | 13,119 | 12,281 |
41 graphic description end -->
Performance data quoted represents past performance which is no guarantee of future results. Investment return and principal value will fluctuate so that an investor's Shares, when redeemed, may be worth more or less than their original cost. Mutual fund performance changes over time and current performance may be lower or higher than what is stated. For current to the most recent month-end performance and after-tax returns, visit FederatedInvestors.com or call 1-800-341-7400. Returns shown do not reflect the deduction of taxes that a shareholder would pay on Fund distributions or the redemption of Fund Shares. Mutual funds are not obligations of or guaranteed by any bank and are not federally insured. Total returns shown include the maximum contingent deferred sales charge (CDSC) of 1.00%, as applicable.
Annual Shareholder Report
14
| 1 | Represents a hypothetical investment of $10,000 in the Fund. The maximum CDSC is 1.00% on any redemption less than one year from the purchase date. The Fund's performance assumes the reinvestment of all dividends and distributions. The Russell 1000® Growth and the Lipper Large-Cap Growth Funds Index have been adjusted to reflect reinvestment of dividends on securities in the indexes. |
| 2 | The Fund is the successor to the MDT Large Cap Growth Fund pursuant to a reorganization that took place on December 8, 2006. Prior to that date, the Fund had no investment operations. Accordingly, the performance information shown for the periods prior to that date is that of the MDT Large Cap Growth Fund. |
| 3 | The Russell 1000® Growth measures the performance of those Russell 1000 companies with higher price-to-book ratios and higher forecasted growth values. The Russell 1000® Growth is not adjusted to reflect sales charges, expenses or other fees that the SEC requires to be reflected in the Fund's performance. It is not possible to invest directly in an index. |
Annual Shareholder Report15
GROWTH OF A $10,000 INVESTMENT – INSTITUTIONAL SHARES
The graph below illustrates the hypothetical investment of $10,0001 in the Federated MDT Large Cap Growth Fund2 (Institutional Shares) (the “Fund”) from September 15, 2005 (start of performance) to July 31, 2011, compared to the Russell 1000® Growth Index (Russell 1000® Growth).3
| Average Annual Total Returns for the Period Ended 7/31/2011 | |
| 1 Year | 24.62% |
| 5 Years | 3.34% |
| Start of Performance (9/15/2005) | 3.20% |
| Federated MDT Large Cap Growth Fund - Institutional Shares | C000035051 | Russell 1000® Growth | Lipper Large Cap Growth Funds Index |
| 9/15/2005 | 10,000 | 10,000 | 10,000 |
| 7/31/2006 | 10,210 | 10,027 | 9,864 |
| 7/31/2007 | 12,322 | 11,979 | 11,607 |
| 7/31/2008 | 11,639 | 11,225 | 11,039 |
| 7/31/2009 | 8,676 | 9,253 | 8,889 |
| 7/31/2010 | 9,656 | 10,516 | 9,938 |
| 7/31/2011 | 12,033 | 13,119 | 12,281 |
41 graphic description end -->
Performance data quoted represents past performance which is no guarantee of future results. Investment return and principal value will fluctuate so that an investor's shares, when redeemed, may be worth more or less than their original cost. Mutual fund performance changes over time and current performance may be lower or higher than what is stated. For current to the most recent month-end performance and after-tax returns, visit FederatedInvestors.com or call 1-800-341-7400. Returns shown do not reflect the deduction of taxes that a shareholder would pay on Fund distributions or the redemption of Fund shares. Mutual funds are not obligations of or guaranteed by any bank and are not federally insured.
Annual Shareholder Report
16
| 1 | The Fund's performance assumes the reinvestment of all dividends and distributions. The Russell 1000® Growth and Lipper Large-Cap Growth Funds Index have been adjusted to reflect reinvestment of dividends on securities in the indexes. |
| 2 | The Fund is the successor to the MDT Large Cap Growth Fund pursuant to a reorganization that took place on December 8, 2006. Prior to that date, the Fund had no investment operations. Accordingly, the performance information shown for the periods prior to that date is that of the MDT Large Cap Growth Fund. |
| 3 | The Russell 1000® Growth measures the performance of those Russell 1000 companies with higher price-to-book ratios and higher forecasted growth values. The Russell 1000® Growth is not adjusted to reflect sales charges, expenses or other fees that the SEC requires to be reflected in the Fund's performance. It is not possible to invest directly in an index. |
Annual Shareholder Report17
Portfolio of Investments Summary Table (unaudited)
At July 31, 2011, the Fund's industry composition1 was follows:
| Industry Composition | Percentage of
Total Net Assets |
| Software Packaged/Custom | 7.9% |
| Oil Well Supply | 7.7% |
| Biotechnology | 6.1% |
| Soft Drinks | 5.9% |
| Hotels and Motels | 4.9% |
| Crude Oil & Gas Production | 4.7% |
| Computers — Low End | 4.1% |
| Financial Services | 3.6% |
| Discount Department Stores | 3.5% |
| Medical Technology | 3.4% |
| Commodity Chemicals | 3.2% |
| Cosmetics & Toiletries | 3.1% |
| Internet Services | 2.6% |
| Electronic Test/Measuring Equipment | 2.0% |
| Construction Machinery | 1.8% |
| Diversified Leisure | 1.6% |
| Food Wholesaling | 1.6% |
| Specialty Retailing | 1.5% |
| Stainless Steel Producer | 1.5% |
| Undesignated Consumer Durables | 1.5% |
| Computer Services | 1.4% |
| Oil Service, Explore & Drill | 1.4% |
| Auto Manufacturing | 1.3% |
| Grocery Chain | 1.3% |
| Undesignated Health | 1.3% |
| Cable & Wireless Television | 1.1% |
| Metals & Mining | 1.1% |
| Other Communications Equipment | 1.1% |
| Restaurant | 1.1% |
| Paint & Related Materials | 1.0% |
| Other2 | 14.1% |
| Cash Equivalents3 | 1.8% |
| Other Assets and Liabilities — Net4 | (0.2)% |
| TOTAL | 100.0% |
Annual Shareholder Report
18
| 1 | Except for Cash Equivalents and Other Assets and Liabilities, industry classifications are based upon, and individual portfolio securities are assigned to, the classifications of the Global Industry Classification Standard (GICS) except that the Adviser assigns a classification to securities not classified by the GICS and to securities for which the Adviser does not have access to the classification made by the GICS. |
| 2 | For purposes of this table, industry classifications which constitute less than 1.0% of the Fund's total net assets have been aggregated under the designation “Other.” |
| 3 | Cash Equivalents include any investments in money market mutual funds and/or overnight repurchase agreements. |
| 4 | Assets, other than investments in securities, less liabilities. See Statement of Assets and Liabilities. |
Annual Shareholder Report19
Portfolio of Investments
July 31, 2011
| Shares | | | Value |
| | COMMON STOCKS – 98.4% | |
| | Agricultural Chemicals – 0.7% | |
| 9,074 | | Scotts Miracle-Gro Co. | 457,874 |
| | Apparel – 0.3% | |
| 2,555 | 1 | Under Armour, Inc., Class A | 187,563 |
| | Auto Manufacturing – 1.3% | |
| 50,096 | 1 | Ford Motor Co. | 611,672 |
| 4,859 | 1 | TRW Automotive Holdings Corp. | 245,234 |
| | TOTAL | 856,906 |
| | Biotechnology – 6.1% | |
| 15,573 | 1 | Alexion Pharmaceuticals, Inc. | 884,546 |
| 15,899 | 1 | BioMarin Pharmaceutical, Inc. | 496,526 |
| 19,033 | 1 | Celgene Corp. | 1,128,657 |
| 21,798 | 1 | Illumina, Inc. | 1,361,285 |
| | TOTAL | 3,871,014 |
| | Broadcasting – 0.5% | |
| 6,464 | 1 | DIRECTV Group, Inc., Class A | 327,595 |
| | Cable & Wireless Television – 1.1% | |
| 18,018 | 1 | Discovery Communications, Inc. | 717,116 |
| | Cable TV – 0.7% | |
| 17,114 | | CBS Corp. (New), Class B | 468,410 |
| | Commodity Chemicals – 3.2% | |
| 11,200 | | Kronos Worldwide, Inc. | 346,752 |
| 18,374 | | PPG Industries, Inc. | 1,547,091 |
| 6,401 | | RPM International, Inc. | 134,933 |
| | TOTAL | 2,028,776 |
| | Computer Peripherals – 0.4% | |
| 5,573 | 1 | NetApp, Inc. | 264,829 |
| | Computer Services – 1.4% | |
| 9,163 | 1 | Cognizant Technology Solutions Corp. | 640,219 |
| 8,724 | 1 | Riverbed Technology, Inc. | 249,768 |
| | TOTAL | 889,987 |
| | Computers - Low End – 4.1% | |
| 4,878 | 1 | Apple, Inc. | 1,904,761 |
| 43,269 | 1 | Dell, Inc. | 702,689 |
| | TOTAL | 2,607,450 |
Annual Shareholder Report20
| Shares | | | Value |
| | Construction Machinery – 1.8% | |
| 11,805 | | Caterpillar, Inc. | 1,166,216 |
| | Cosmetics & Toiletries – 3.1% | |
| 3,216 | | Avon Products, Inc. | 84,355 |
| 11,703 | | Estee Lauder Cos., Inc., Class A | 1,227,762 |
| 9,928 | 1 | Ulta Salon Cosmetics & Fragrance, Inc. | 625,762 |
| | TOTAL | 1,937,879 |
| | Crude Oil & Gas Production – 4.7% | |
| 14,478 | | Cabot Oil & Gas Corp., Class A | 1,072,530 |
| 22,210 | | EXCO Resources, Inc. | 353,361 |
| 10,577 | | Range Resources Corp. | 689,198 |
| 11,832 | | SM Energy Co. | 891,541 |
| | TOTAL | 3,006,630 |
| | Discount Department Stores – 3.5% | |
| 42,757 | | Wal-Mart Stores, Inc. | 2,253,721 |
| | Diversified Leisure – 1.6% | |
| 5,875 | 1 | Bally Technologies, Inc. | 231,651 |
| 17,055 | 1 | Las Vegas Sands Corp. | 804,655 |
| | TOTAL | 1,036,306 |
| | Electrical Equipment – 0.6% | |
| 7,801 | 1 | WESCO International, Inc. | 395,433 |
| | Electronic Instruments – 0.6% | |
| 10,403 | 1 | Trimble Navigation Ltd. | 370,139 |
| | Electronic Test/Measuring Equipment – 2.0% | |
| 29,414 | 1 | Agilent Technologies, Inc. | 1,240,094 |
| | Ethical Drugs – 0.8% | |
| 10,458 | | Abbott Laboratories | 536,705 |
| | Financial Services – 3.6% | |
| 5,352 | | Mastercard, Inc. | 1,622,994 |
| 7,661 | | Visa, Inc., Class A | 655,322 |
| | TOTAL | 2,278,316 |
| | Food Wholesaling – 1.6% | |
| 32,605 | | Sysco Corp. | 997,387 |
| | Grocery Chain – 1.3% | |
| 32,442 | | Kroger Co. | 806,832 |
| | Home Products – 0.2% | |
| 1,992 | | Tupperware Brands Corp. | 124,480 |
| | Hotels and Motels – 4.9% | |
| 21,114 | 1 | MGM Mirage, Inc. | 319,033 |
Annual Shareholder Report21
| Shares | | | Value |
| 24,848 | | Starwood Hotels & Resorts Worldwide, Inc. | 1,365,646 |
| 1 | | Wyndham Worldwide Corp. | 35 |
| 9,183 | | Wynn Resorts Ltd. | 1,411,243 |
| | TOTAL | 3,095,957 |
| | Industrial Machinery – 0.6% | |
| 4,505 | | Graco, Inc. | 197,905 |
| 2,400 | 1 | Polypore International, Inc. | 163,200 |
| | TOTAL | 361,105 |
| | Internet Services – 2.6% | |
| 458 | 1 | NetFlix, Inc. | 121,823 |
| 2,806 | 1 | Priceline.com, Inc. | 1,508,646 |
| | TOTAL | 1,630,469 |
| | Medical Technology – 3.4% | |
| 17,488 | 1 | Edwards Lifesciences Corp. | 1,247,769 |
| 976 | 1 | Intuitive Surgical, Inc. | 390,937 |
| 13,799 | | Medtronic, Inc. | 497,454 |
| | TOTAL | 2,136,160 |
| | Metals & Mining – 1.1% | |
| 8,047 | | Cliffs Natural Resources, Inc. | 722,781 |
| | Miscellaneous Communications – 0.6% | |
| 129 | 1 | Equinix, Inc. | 13,477 |
| 10,685 | 1 | Gartner Group, Inc., Class A | 394,383 |
| | TOTAL | 407,860 |
| | Miscellaneous Metals – 0.3% | |
| 5,228 | | Kennametal, Inc. | 206,140 |
| | Office Equipment – 0.7% | |
| 19,522 | | Pitney Bowes, Inc. | 420,699 |
| | Office Supplies – 0.6% | |
| 11,485 | | Avery Dennison Corp. | 362,352 |
| | Oil Service, Explore & Drill – 1.4% | |
| 9,774 | 1 | Concho Resources, Inc. | 914,651 |
| | Oil Well Supply – 7.7% | |
| 14,763 | | Baker Hughes, Inc. | 1,142,361 |
| 4,789 | | Carbo Ceramics, Inc. | 747,419 |
| 44,044 | | Halliburton Co. | 2,410,528 |
| 6,375 | | Schlumberger Ltd. | 576,109 |
| | TOTAL | 4,876,417 |
Annual Shareholder Report22
| Shares | | | Value |
| | Other Communications Equipment – 1.1% | |
| 18,017 | | Harris Corp. | 718,338 |
| | Paint & Related Materials – 1.0% | |
| 7,994 | | Sherwin-Williams Co. | 616,897 |
| | Printing – 0.3% | |
| 11,646 | | Donnelley (R.R.) & Sons Co. | 219,061 |
| | Railroad – 0.6% | |
| 5,943 | 1 | Kansas City Southern Industries, Inc. | 352,717 |
| | Restaurant – 1.1% | |
| 2,134 | 1 | Chipotle Mexican Grill, Inc. | 692,654 |
| | Semiconductor Manufacturing – 0.5% | |
| 5,753 | 1 | IPG Photonics Corp. | 346,273 |
| | Services to Medical Professionals – 0.1% | |
| 601 | | Quest Diagnostics, Inc. | 32,460 |
| | Shoes – 0.8% | |
| 5,086 | 1 | Deckers Outdoor Corp. | 504,785 |
| | Soft Drinks – 5.9% | |
| 33,494 | 1 | Coca-Cola Enterprises, Inc. | 941,516 |
| 17,266 | | Dr. Pepper Snapple Group, Inc. | 651,964 |
| 33,936 | | PepsiCo, Inc. | 2,173,262 |
| | TOTAL | 3,766,742 |
| | Software Packaged/Custom – 7.9% | |
| 35,613 | | CA, Inc. | 794,170 |
| 8,995 | 1 | F5 Networks, Inc. | 840,853 |
| 12,263 | 1 | Informatica Corp. | 627,007 |
| 20,698 | 1 | Red Hat, Inc. | 870,972 |
| 36,865 | 1 | Symantec Corp. | 702,647 |
| 12,024 | 1 | VMware, Inc., Class A | 1,206,488 |
| | TOTAL | 5,042,137 |
| | Specialty Machinery – 0.7% | |
| 5,252 | | Gardner Denver, Inc. | 447,943 |
| | Specialty Retailing – 1.5% | |
| 10,262 | | Expedia, Inc. | 325,203 |
| 12,306 | | Nordstrom, Inc. | 617,269 |
| | TOTAL | 942,472 |
| | Stainless Steel Producer – 1.5% | |
| 16,095 | | Allegheny Technologies, Inc. | 936,568 |
| | Telecommunication Equipment & Services – 0.7% | |
| 4,663 | 1 | Acme Packet, Inc. | 274,744 |
Annual Shareholder Report23
| Shares | | | Value |
| 3,641 | | Qualcomm, Inc. | 199,454 |
| | TOTAL | 474,198 |
| | Toys & Games – 0.8% | |
| 18,008 | | Mattel, Inc. | 480,093 |
| | Truck Manufacturing – 0.9% | |
| 11,022 | 1 | Navistar International Corp. | 565,539 |
| | Undesignated Consumer Cyclicals – 0.6% | |
| 3,076 | 1 | Apollo Group, Inc., Class A | 156,353 |
| 2,505 | 1 | ITT Educational Services, Inc. | 214,603 |
| | TOTAL | 370,956 |
| | Undesignated Consumer Durables – 1.5% | |
| 7,994 | | Walter Industries, Inc. | 979,825 |
| | Undesignated Health – 1.3% | |
| 12,144 | 1 | Cerner Corp. | 807,455 |
| | Wireless Telecommunication Services – 0.5% | |
| 19,023 | 1 | MetroPCS Communications, Inc. | 309,694 |
| | TOTAL COMMON STOCKS
(IDENTIFIED COST $59,590,693) | 62,569,056 |
| | MUTUAL FUND – 1.8% | |
| 1,155,856 | 2,3 | Federated Prime Value Obligations Fund, Institutional Shares, 0.13%
(AT NET ASSET VALUE) | 1,155,856 |
| | TOTAL INVESTMENTS — 100.2%
(IDENTIFIED COST $60,746,549)4 | 63,724,912 |
| | OTHER ASSETS AND LIABILITIES - NET — (0.2)%5 | (154,308) |
| | TOTAL NET ASSETS — 100% | $63,570,604 |
| 1 | Non-income producing security. |
| 2 | Affiliated holding. |
| 3 | 7-Day net yield. |
| 4 | The cost of investments for federal tax purposes amounts to $60,925,546. |
| 5 | Assets, other than investments in securities, less liabilities. See Statement of Assets and Liabilities. |
Note: The categories of investments are shown as a percentage of total net assets at July 31, 2011.
Annual Shareholder Report
24
Various inputs are used in determining the value of the Fund's investments. These inputs are summarized in the three broad levels listed below:Level 1 — quoted prices in active markets for identical securities. Including investment companies with daily net asset values, if applicable.
Level 2 — other significant observable inputs (including quoted prices for similar securities, interest rates, prepayment speeds, credit risk, etc.). Also includes securities valued at amortized cost.
Level 3 — significant unobservable inputs (including the Fund's own assumptions in determining the fair value of investments).
The inputs or methodology used for valuing securities are not an indication of the risk associated with investing in those securities.
As of July 31, 2011, all investments of the Fund utilized Level 1 inputs in valuing the Fund's assets carried at fair value.
See Notes which are an integral part of the Financial Statements
Annual Shareholder Report25
Statement of Assets and Liabilities
July 31, 2011
| Assets: | | |
| Total investments in securities, at value including $1,155,856 of investments in an affiliated holding (Note 5) (identified cost $60,746,549) | | $63,724,912 |
| Income receivable | | 21,154 |
| Receivable for investments sold | | 2,900,646 |
| Receivable for shares sold | | 91,658 |
| TOTAL ASSETS | | 66,738,370 |
| Liabilities: | | |
| Payable for investments purchased | $2,763,233 | |
| Payable for shares redeemed | 247,243 | |
| Payable for distribution services fee (Note 5) | 9,722 | |
| Payable for shareholder services fee (Note 5) | 26,108 | |
| Accrued expenses | 121,460 | |
| TOTAL LIABILITIES | | 3,167,766 |
| Net assets for 6,096,584 shares outstanding | | $63,570,604 |
| Net Assets Consist of: | | |
| Paid-in capital | | $83,173,019 |
| Net unrealized appreciation of investments | | 2,978,363 |
| Accumulated net realized loss on investments | | (22,580,778) |
| TOTAL NET ASSETS | | $63,570,604 |
Annual Shareholder Report26
Statement of Assets and Liabilities — continued| Net Asset Value, Offering Price and Redemption Proceeds Per Share | | |
| Class A Shares: | | |
| Net asset value per share ($44,762,266 ÷ 4,262,519 shares outstanding), no par value, unlimited shares authorized | | $10.50 |
| Offering price per share (100/94.50 of $10.50) | | $11.11 |
| Redemption proceeds per share | | $10.50 |
| Class B Shares: | | |
| Net asset value per share ($6,679,532 ÷ 651,984 shares outstanding), no par value, unlimited shares authorized | | $10.24 |
| Offering price per share | | $10.24 |
| Redemption proceeds per share (94.50/100 of $10.24) | | $9.68 |
| Class C Shares: | | |
| Net asset value per share ($7,563,570 ÷ 754,620 shares outstanding), no par value, unlimited shares authorized | | $10.02 |
| Offering price per share | | $10.02 |
| Redemption proceeds per share (99.00/100 of $10.02) | | $9.92 |
| Institutional Shares: | | |
| Net asset value per share ($4,565,236 ÷ 427,461 shares outstanding), no par value, unlimited shares authorized | | $10.68 |
| Offering price per share | | $10.68 |
| Redemption proceeds per share | | $10.68 |
See Notes which are an integral part of the Financial Statements
Annual Shareholder Report27
Statement of Operations
Year Ended July 31, 2011
| Investment Income: | | | |
| Dividends (including $1,966 received from an affiliated holding (Note 5)) | | | $796,887 |
| Interest | | | 809 |
| TOTAL INCOME | | | 797,696 |
| Expenses: | | | |
| Investment adviser fee (Note 5) | | $490,961 | |
| Administrative fee (Note 5) | | 270,000 | |
| Custodian fees | | 12,101 | |
| Transfer and dividend disbursing agent fees and expenses | | 315,589 | |
| Directors'/Trustees' fees | | 2,802 | |
| Auditing fees | | 22,524 | |
| Legal fees | | 6,731 | |
| Portfolio accounting fees | | 79,605 | |
| Distribution services fee (Note 5) | | 112,217 | |
| Shareholder services fee (Note 5) | | 149,556 | |
| Account administration fee (Note 2) | | 909 | |
| Share registration costs | | 55,870 | |
| Printing and postage | | 40,951 | |
| Insurance premiums | | 4,258 | |
| Miscellaneous | | 6,516 | |
| TOTAL EXPENSES | | 1,570,590 | |
| Waivers and Reimbursement (Note 5): | | | |
| Waiver/reimbursement of investment adviser fee | $(432,605) | | |
| Waiver of administrative fee | (54,343) | | |
| TOTAL WAIVERS AND REIMBURSEMENT | | (486,948) | |
| Net expenses | | | 1,083,642 |
| Net investment income (loss) | | | (285,946) |
| Realized and Unrealized Gain (Loss) on Investments: | | | |
| Net realized gain on investments | | | 14,733,709 |
| Net change in unrealized appreciation of investments | | | (324,024) |
| Net realized and unrealized gain on investments | | | 14,409,685 |
| Change in net assets resulting from operations | | | $14,123,739 |
See Notes which are an integral part of the Financial Statements
Annual Shareholder Report28
Statement of Changes in Net Assets
| Year Ended July 31 | 2011 | 2010 |
| Increase (Decrease) in Net Assets | | |
| Operations: | | |
| Net investment income (loss) | $(285,946) | $(178,522) |
| Net realized gain on investments | 14,733,709 | 16,280,057 |
| Net change in unrealized appreciation/depreciation of investments | (324,024) | (6,276,555) |
| CHANGE IN NET ASSETS RESULTING FROM OPERATIONS | 14,123,739 | 9,824,980 |
| Share Transactions: | | |
| Proceeds from sale of shares | 10,132,396 | 20,131,474 |
| Cost of shares redeemed | (25,179,540) | (55,060,157) |
| CHANGE IN NET ASSETS RESULTING FROM SHARE TRANSACTIONS | (15,047,144) | (34,928,683) |
| Change in net assets | (923,405) | (25,103,703) |
| Net Assets: | | |
| Beginning of period | 64,494,009 | 89,597,712 |
| End of period | $63,570,604 | $64,494,009 |
See Notes which are an integral part of the Financial Statements
Annual Shareholder Report29
Notes to Financial Statements
July 31, 2011
1. ORGANIZATION
Federated MDT Series (the “Trust”) is registered under the Investment Company Act of 1940, as amended (the “Act”), as an open-end management investment company. The Trust consists of five portfolios. The financial statements included herein are only those of Federated MDT Large Cap Growth Fund (the “Fund”), a diversified portfolio. The financial statements of the other portfolios are presented separately. The assets of each portfolio are segregated and a shareholder's interest is limited to the portfolio in which shares are held. Each portfolio pays its own expenses. The Fund offers four classes of shares: Class A Shares, Class B Shares, Class C Shares and Institutional Shares. All shares of the Fund have equal rights with respect to voting, except on class-specific matters. The investment objective of the Fund is long-term capital appreciation.
2. SIGNIFICANT ACCOUNTING POLICIES
The following is a summary of significant accounting policies consistently followed by the Fund in the preparation of its financial statements. These policies are in conformity with U.S. generally accepted accounting principles (GAAP).
Investment Valuation
In calculating its net asset value (NAV), the Fund generally values investments as follows:
- Equity securities listed on an exchange or traded through a regulated market system are valued at their last reported sale price or official closing price in their principal exchange or market.
- Shares of other mutual funds are valued based upon their reported NAVs.
- Derivative contracts listed on exchanges are valued at their reported settlement or closing price.
- Over-the-counter (OTC) derivative contracts are fair valued using price evaluations provided by a pricing service approved by the Board of Trustees (the “Trustees”).
- Fixed-income securities acquired with remaining maturities greater than 60 days are fair valued using price evaluations provided by a pricing service approved by the Trustees.
- Fixed-income securities acquired with remaining maturities of 60 days or less are valued at their cost (adjusted for the accretion of any discount or amortization of any premium), which approximates market value.
- For securities that are fair valued in accordance with procedures established by and under the general supervision of the Trustees, certain factors may be considered such as: the purchase price of the security, information obtained by contacting the issuer, analysis of the issuer's financial statements or other available documents, fundamental analytical data, the nature and duration of restrictions on disposition, the movement of the market in which the security is normally traded and public trading in similar securities of the issuer or comparable issuers.
If the Fund cannot obtain a price or price evaluation from a pricing service for an investment, the Fund may attempt to value the investment based upon the mean of bid and asked quotations or fair value the investment based on price evaluations, from one or more dealers. If any price, quotation, price evaluation or other pricing source is not readily available when the NAV is calculated, the Fund uses the fair value of the investment determined in accordance with the procedures described below. There can be no assurance that the Fund could purchase or sell an investment at the price used to calculate the Fund's NAV.
Annual Shareholder Report
30
Fair Valuation and Significant Events ProceduresThe Trustees have authorized the use of pricing services to provide evaluations of the current fair value of certain investments for purposes of calculating the NAV. Factors considered by pricing services in evaluating an investment include the yields or prices of investments of comparable quality, coupon, maturity, call rights and other potential prepayments, terms and type, reported transactions, indications as to values from dealers and general market conditions. Some pricing services provide a single price evaluation reflecting the bid-side of the market for an investment (a “bid” evaluation). Other pricing services offer both bid evaluations and price evaluations indicative of a price between the prices bid and asked for the investment (a “mid” evaluation). The Fund normally uses bid evaluations for U.S. Treasury and Agency securities, mortgage-backed securities and municipal securities. The Fund normally uses mid evaluations for other types of fixed-income securities and OTC derivative contracts. In the event that market quotations and price evaluations are not available for an investment, the fair value of the investment is determined in accordance with procedures adopted by the Trustees.
The Trustees also have adopted procedures requiring an investment to be priced at its fair value whenever the Adviser determines that a significant event affecting the value of the investment has occurred between the time as of which the price of the investment would otherwise be determined and the time as of which the NAV is computed. An event is considered significant if there is both an affirmative expectation that the investment's value will change in response to the event and a reasonable basis for quantifying the resulting change in value. Examples of significant events that may occur after the close of the principal market on which a security is traded, or after the time of a price evaluation provided by a pricing service or a dealer, include:
- With respect to securities traded in foreign markets, significant trends in U.S. equity markets or in the trading of foreign securities index futures or options contracts;
- With respect to price evaluations of fixed-income securities determined before the close of regular trading on the NYSE, actions by the Federal Reserve Open Market Committee and other significant trends in U.S. fixed-income markets;
- Political or other developments affecting the economy or markets in which an issuer conducts its operations or its securities are traded; and
- Announcements concerning matters such as acquisitions, recapitalizations, litigation developments, a natural disaster affecting the issuer's operations or regulatory changes or market developments affecting the issuer's industry.
The Trustees have approved the use of a pricing service to determine the fair value of equity securities traded principally in foreign markets when the Adviser determines that there has been a significant trend in the U.S. equity markets or in index futures trading. For other significant events, the Fund may seek to obtain more current quotations or price evaluations from alternative pricing sources. If a reliable alternative pricing source is not available, the Fund will determine the fair value of the investment using another method approved by the Trustees.
Repurchase Agreements
The Fund may invest in repurchase agreements for short-term liquidity purposes. It is the policy of the Fund to require the other party to a repurchase agreement to transfer to the Fund's custodian or sub-custodian eligible securities or cash with a market value (after transaction costs) at least equal to the repurchase price to be paid under the repurchase agreement. The eligible securities are transferred to accounts with the custodian or sub-custodian in which the Fund holds a “securities entitlement” and exercises “control” as those Annual Shareholder Report
31
terms are defined in the Uniform Commercial Code. The Fund has established procedures for monitoring the market value of the transferred securities and requiring the transfer of additional eligible securities if necessary to equal at least the repurchase price. These procedures also allow the other party to require securities to be transferred from the account to the extent that their market value exceeds the repurchase price or in exchange for other eligible securities of equivalent market value.The insolvency of the other party or other failure to repurchase the securities may delay the disposition of the underlying securities or cause the Fund to receive less than the full repurchase price. Under the terms of the repurchase agreement, any amounts received by the Fund in excess of the repurchase price and related transaction costs must be remitted to the other party.
The Fund may enter into repurchase agreements in which eligible securities are transferred into joint trading accounts maintained by the custodian or sub-custodian for investment companies and other clients advised by the Fund's Adviser and its affiliates. The Fund will participate on a pro rata basis with the other investment companies and clients in its share of the securities transferred under such repurchase agreements and in its share of proceeds from any repurchase or other disposition of such securities.
Investment Income, Gains and Losses, Expenses and Distributions
Investment transactions are accounted for on a trade-date basis. Realized gains and losses from investment transactions are recorded on an identified-cost basis. Interest income and expenses are accrued daily. Dividend income and distributions to shareholders are recorded on the ex-dividend date. Foreign dividends are recorded on the ex-dividend date or when the Fund is informed of the ex-dividend date. Distributions of net investment income, if any, are declared and paid annually. Non-cash dividends included in dividend income, if any, are recorded at fair value. Investment income, realized and unrealized gains and losses, and certain fund-level expenses are allocated to each class based on relative average daily net assets, except that Class A Shares, Class B Shares, Class C Shares and Institutional Shares may bear distribution services fees, shareholder services fees and account administration fees unique to those classes. For the year ended July 31, 2011, account administration fees for the Fund were as follows:
| Account
Administration
Fees Incurred |
| Class A Shares | $770 |
| Class C Shares | 139 |
| TOTAL | $909 |
Dividends are declared separately for each class. No class has preferential dividend rights; differences in per share dividend rates are generally due to differences in separate class expenses.
Premium and Discount Amortization
All premiums and discounts on fixed-income securities are amortized/accreted using the effective interest rate method.
Annual Shareholder Report
32
Federal TaxesIt is the Fund's policy to comply with the Subchapter M provision of the Internal Revenue Code (the “Code”) and to distribute to shareholders each year substantially all of its income. Accordingly, no provision for federal income tax is necessary. As of and during the year ended July 31, 2011, the Fund did not have a liability for any uncertain tax positions. The Fund recognizes interest and penalties, if any, related to tax liabilities as income tax expense in the Statement of Operations. As of July 31, 2011, tax years 2008 through 2011 remain subject to examination by the Fund's major tax jurisdictions, which include the United States of America and the Commonwealth of Massachusetts.
When-Issued and Delayed Delivery Transactions
The Fund may engage in when-issued or delayed delivery transactions. The Fund records when-issued securities on the trade date and maintains security positions such that sufficient liquid assets will be available to make payment for the securities purchased. Securities purchased on a when-issued or delayed delivery basis are marked to market daily and begin earning interest on the settlement date. Losses may occur on these transactions due to changes in market conditions or the failure of counterparties to perform under the contract.
Other
The preparation of financial statements in conformity with GAAP requires management to make estimates and assumptions that affect the amounts of assets, liabilities, expenses and revenues reported in the financial statements. Actual results could differ from those estimated.
3. SHARES OF BENEFICIAL INTEREST
The following tables summarize share activity:
| Year Ended July 31 | 2011 | 2010 |
| Class A Shares: | Shares | Amount | Shares | Amount |
| Shares sold | 497,745 | $4,919,437 | 1,729,634 | $14,253,526 |
| Shares redeemed | (1,681,082) | (16,079,618) | (5,353,095) | (45,047,810) |
NET CHANGE RESULTING
FROM CLASS A
SHARE TRANSACTIONS | (1,183,337) | $(11,160,181) | (3,623,461) | $(30,794,284) |
| Year Ended July 31 | 2011 | 2010 |
| Class B Shares: | Shares | Amount | Shares | Amount |
| Shares sold | 142,838 | $1,355,108 | 238,449 | $1,975,151 |
| Shares redeemed | (395,142) | (3,795,078) | (467,487) | (3,852,446) |
NET CHANGE RESULTING
FROM CLASS B
SHARE TRANSACTIONS | (252,304) | $(2,439,970) | (229,038) | $(1,877,295) |
Annual Shareholder Report33
| Year Ended July 31 | 2011 | 2010 |
| Class C Shares: | Shares | Amount | Shares | Amount |
| Shares sold | 196,147 | $1,868,043 | 140,643 | $1,149,562 |
| Shares redeemed | (280,790) | (2,640,242) | (296,687) | (2,398,094) |
NET CHANGE RESULTING
FROM CLASS C
SHARE TRANSACTIONS | (84,643) | $(772,199) | (156,044) | $(1,248,532) |
| Year Ended July 31 | 2011 | 2010 |
| Institutional Shares: | Shares | Amount | Shares | Amount |
| Shares sold | 195,505 | $1,989,808 | 317,649 | $2,753,235 |
| Shares redeemed | (255,680) | (2,664,602) | (449,603) | (3,761,807) |
NET CHANGE RESULTING
FROM INSTITUTIONAL
SHARE TRANSACTIONS | (60,175) | $(674,794) | (131,954) | $(1,008,572) |
NET CHANGE RESULTING
FROM TOTAL FUND
SHARE TRANSACTIONS | (1,580,459) | $(15,047,144) | (4,140,497) | $(34,928,683) |
4. FEDERAL TAX INFORMATION
The timing and character of income and capital gain distributions are determined in accordance with income tax regulations, which may differ from GAAP. These differences are due to differing treatments for net operating loss.
For the year ended July 31, 2011, permanent differences identified and reclassified among the components of net assets were as follows:
| Increase (Decrease) |
| Paid-In Capital | Undistributed
Net Investment
Income (Loss) |
| $(285,946) | $285,946 |
Net investment income (loss), net realized gains (losses), and net assets were not affected by this reclassification.
As of July 31, 2011, the components of distributable earnings on a tax basis were as follows:
| Net unrealized appreciation | $2,799,366 |
| Capital loss carryforwards | $(22,401,781) |
The difference between book-basis and tax-basis net unrealized appreciation/depreciation is attributable to differing treatments for the deferral of losses on wash sales.
At July 31, 2011, the cost of investments for federal tax purposes was $60,925,546. The net unrealized appreciation of investments for federal tax purposes was $2,799,366. This consists of net unrealized appreciation from investments for those securities having an excess of value over cost of $4,614,540 and net unrealized depreciation from investments for those securities having an excess of cost over value of $1,815,174.
Annual Shareholder Report
34
At July 31, 2011, the Fund had a capital loss carryforward of $22,401,781 which will reduce the Fund's taxable income arising from future net realized gains on investments, if any, to the extent permitted by the Code and thus will reduce the amount of distributions to shareholders which would otherwise be necessary to relieve the Fund of any liability for federal income tax. Pursuant to the Code, such capital loss carryforward will expire as follows:| Expiration Year | Expiration Amount |
| 2017 | $20,801,154 |
| 2018 | $1,600,627 |
Under the recently enacted Regulated Investment Company Modernization Act of 2010, the Fund will be permitted to carry forward capital losses incurred in taxable years beginning after December 22, 2010, for an unlimited period. However, any losses incurred during those future years will be required to be utilized prior to the losses incurred in pre-enactment tax years. As a result of this ordering rule, pre-enactment capital loss carryforwards may be more likely to expire unused. Additionally, post-enactment capital losses that are carried forward will retain their character as either short-term or long-term capital losses rather than being considered all short-term as under previous law.
The Fund used capital loss carryforwards of $14,783,558 to offset taxable capital gains realized during the year ended July 31, 2011.
5. INVESTMENT ADVISER FEE AND OTHER TRANSACTIONS WITH AFFILIATES
Investment Adviser Fee
Federated MDTA LLC is the Fund's investment adviser (the “Adviser”). The advisory agreement between the Fund and the Adviser provides for an annual fee equal to 0.75% of the Fund's average daily net assets. Subject to the terms described in the Expense Limitation note, the Adviser may voluntarily choose to waive any portion of its fee. For the year ended July 31, 2011, the Adviser voluntarily waived $431,432 of its fee.
Administrative Fee
Federated Administrative Services (FAS), under the Administrative Services Agreement, provides the Fund with administrative personnel and services. The fee paid to FAS is based on the average aggregate daily net assets of certain Federated funds as specified below:
| Administrative Fee | Average Aggregate Daily Net Assets
of the Federated Funds |
| 0.150% | on the first $5 billion |
| 0.125% | on the next $5 billion |
| 0.100% | on the next $10 billion |
| 0.075% | on assets in excess of $20 billion |
The administrative fee received during any fiscal year shall be at least $150,000 per portfolio and $40,000 per each additional class of Shares. Subject to the terms described in the Expense Limitation note, FAS may voluntarily choose to waive any portion of its fee. For the year ended July 31, 2011, FAS waived $54,343 of its fee. The net fee paid to FAS was 0.329% of average daily net assets of the Fund. The Fund is currently being charged the minimum administrative fee; therefore the fee as a percentage of average daily net assets is greater than the amounts presented in the chart above.
Annual Shareholder Report
35
Distribution Services FeeThe Fund has adopted a Distribution Plan (the “Plan”) pursuant to Rule 12b-1 under the Act. Under the terms of the Plan, the Fund will compensate Federated Securities Corp. (FSC), the principal distributor, from the daily net assets of the Fund's Class A Shares, Class B Shares and Class C Shares to finance activities intended to result in the sale of these shares. The Plan provides that the Fund may incur distribution expenses at the following percentages of average daily net assets annually, to compensate FSC:
| Share Class Name | Percentage of Average Daily
Net Assets of Class |
| Class A Shares | 0.05% |
| Class B Shares | 0.75% |
| Class C Shares | 0.75% |
Subject to the terms described in the Expense Limitation note, FSC may voluntarily choose to waive any portion of its fee. For the year ended July 31, 2011, distribution services fees for the Fund were as follows:
| Distribution Services
Fees Incurred |
| Class B Shares | $56,592 |
| Class C Shares | 55,625 |
| TOTAL | $112,217 |
When FSC receives fees, it may pay some or all of them to financial intermediaries whose customers purchase shares. For the year ended July 31, 2011, FSC retained $7,111 of fees paid by the Fund. For the year ended July 31, 2011, the Fund's Class A Shares did not incur a distribution services fee; however, it may begin to incur this fee upon approval of the Trustees.
Sales Charges
Front-end sales charges and contingent deferred sales charges (CDSC) do not represent expenses of the Fund. They are deducted from the proceeds of sales of Fund shares prior to investment or from redemption proceeds prior to remittance, as applicable. For the year ended July 31, 2011, FSC retained $2,285 in sales charges from the sale of Class A Shares. FSC also retained $144 of CDSC relating to redemptions of Class C Shares.
Annual Shareholder Report
36
Shareholder Services FeeThe Fund may pay fees (“Service Fees”) up to 0.25% of the average daily net assets of the Fund's Class A Shares, Class B Shares and Class C Shares to financial intermediaries or to Federated Shareholder Services Company (FSSC) for providing services to shareholders and maintaining shareholder accounts. Financial intermediaries may include a company affiliated with management of Federated Investors, Inc. A financial intermediary affiliated with management of Federated Investors, Inc. received $3,124 of Service Fees for the year ended July 31, 2011. Subject to the terms described in the Expense Limitation note, FSSC may voluntarily reimburse the Fund for Service Fees. For the year ended July 31, 2011, Service Fees for the Fund were as follows:
| Service
Fees
Incurred |
| Class A Shares | $112,290 |
| Class B Shares | 18,864 |
| Class C Shares | 18,402 |
| TOTAL | $149,556 |
For the year ended July 31, 2010, FSSC received $3,621 of fees paid by the Fund.
Expense Limitation
The Adviser and its affiliates (which may include FSC, FAS and FSSC) have voluntarily agreed to waive their fees and/or reimburse expenses so that the total annual fund operating expenses (as shown in the financial highlights) paid by the Fund's Class A Shares, Class B Shares, Class C Shares and Institutional Shares (after the voluntary waivers and reimbursements) will not exceed 1.50%, 2.25%, 2.25% and 1.25% (the “Fee Limit”), respectively, up to but not including the later of (the “Termination Date”): (a) October 1, 2012; or (b) the date of the Fund's next effective Prospectus. While the Adviser and its affiliates currently do not anticipate terminating or increasing these arrangements prior to the Termination Date, these arrangements may only be terminated or the Fee Limit increased prior to the Termination Date with the agreement of the Trustees.
General
Certain Officers and Trustees of the Fund are Officers and Directors or Trustees of the above companies.
Annual Shareholder Report
37
Transactions Involving Affiliated HoldingsAffiliated holdings are mutual funds which are managed by the Adviser or an affiliate of the Adviser. The Adviser has agreed to reimburse the Fund for certain investment adviser fees as a result of transactions in other affiliated mutual funds. For the year ended July 31, 2011, the Adviser reimbursed $1,173. Transactions involving the affiliated holding during the year ended July 31, 2011, were as follows:
| Federated Prime Value
Obligations Fund,
Institutional Shares |
| Balance of Shares Held 7/31/2010 | 1,104,117 |
| Purchases/Additions | 17,663,559 |
| Sales/Reductions | 17,611,820 |
| Balance of Shares Held 7/31/2011 | 1,155,856 |
| Value | $1,155,856 |
| Dividend Income | $1,966 |
6. Investment TRANSACTIONS
Purchases and sales of investments, excluding long-term U.S. government securities and short-term obligations, for the year ended July 31, 2011, were as follows:
| Purchases | $133,827,873 |
| Sales | $149,181,224 |
7. LINE OF CREDIT
The Fund participates in a $100,000,000 unsecured, uncommitted revolving line of credit (LOC) agreement with PNC Bank. The LOC was made available for extraordinary or emergency purposes, primarily for financing redemption payments. Borrowings are charged interest at a rate offered to the Fund by PNC Bank at the time of the borrowing. As of July 31, 2011, there were no outstanding loans. During the year ended July 31, 2011, the Fund did not utilize the LOC.
8. INTERFUND LENDING
Pursuant to an Exemptive Order issued by the Securities and Exchange Commission, the Fund, along with other funds advised by subsidiaries of Federated Investors, Inc., may participate in an interfund lending program. This program provides an alternative credit facility allowing the Fund to borrow from other participating affiliated funds. As of July 31, 2011, there were no outstanding loans. During the year ended July 31, 2011, the program was not utilized.
9. RECENT ACCOUNTING PRONOUNCEMENTS
In April 2011, the Financial Accounting Standards Board (FASB) released Accounting Standards Update (ASU) No. 2011-03, “Reconsideration of Effective Control for Repurchase Agreements.” This ASU amends FASB Accounting Standards Codification (ASC) Topic 860, “Transfers and Servicing”; specifically the criteria required to determine whether a repurchase agreement and similar agreements should be accounted for as sales of financial assets or Annual Shareholder Report
38
secured borrowings with commitments. This ASU is effective for fiscal years and interim periods beginning after December 15, 2011. At this time, management is evaluating the implications of adopting ASU No. 2011-03 and its impact on the Fund's financial statements and the accompanying notes.In addition, in May 2011, FASB released ASU No. 2011-04, “Amendments to Achieve Common Fair Value Measurement and Disclosure Requirements in U.S. GAAP and IFRSs.” This ASU amends FASB ASC Topic 820, “Fair Value Measurement,” to establish common requirements for measuring fair value and for disclosing information about fair value measurements in accordance with GAAP. This ASU is effective for fiscal years and interim periods beginning after December 15, 2011. At this time, management is evaluating the implications of adopting ASU No. 2011-04 and its impact on the Fund's financial statements and the accompanying notes.
Annual Shareholder Report39
Report of Independent Registered Public Accounting Firm
TO THE BOARD OF trustees OF Federated MDt series AND SHAREHOLDERS OF federated mdt large cap growth fund:
We have audited the accompanying statement of assets and liabilities of Federated MDT Large Cap Growth Fund (the “Fund”) (one of the portfolios constituting Federated MDT Series), including the portfolio of investments, as of July 31, 2011, and the related statement of operations for the year then ended, the statement of changes in net assets for each of the two years in the period then ended, and the financial highlights for each of the periods indicated therein. These financial statements and financial highlights are the responsibility of the Fund's management. Our responsibility is to express an opinion on these financial statements and financial highlights based on our audits.
We conducted our audits in accordance with standards of the Public Company Accounting Oversight Board (United States). Those standards require that we plan and perform the audit to obtain reasonable assurance about whether the financial statements and financial highlights are free of material misstatement. We were not engaged to perform an audit of the Fund's internal control over financial reporting. Our audits included consideration of internal control over financial reporting as a basis for designing audit procedures that are appropriate in the circumstances, but not for the purpose of expressing an opinion on the effectiveness of the Fund's internal control over financial reporting. Accordingly, we express no such opinion. An audit also includes examining, on a test basis, evidence supporting the amounts and disclosures in the financial statements and financial highlights, assessing the accounting principles used and significant estimates made by management, and evaluating the overall financial statement presentation. Our procedures included confirmation of securities owned as of July 31, 2011, by correspondence with the custodian and others, or by other appropriate auditing procedures where replies from others were not received. We believe that our audits provide a reasonable basis for our opinion.
In our opinion, the financial statements and financial highlights referred to above present fairly, in all material respects, the financial position of Federated MDT Large Cap Growth Fund, a portfolio of Federated MDT Series, at July 31, 2011, the results of its operations for the year then ended, the changes in its net assets for each of the two years in the period then ended, and the financial highlights for each of the periods indicated therein, in conformity with U.S. generally accepted accounting principles.
Boston, Massachusetts
September 23, 2011
Annual Shareholder Report40
Board of Trustees and Trust Officers
The Board of Trustees is responsible for managing the Trust's business affairs and for exercising all the Trust's powers except those reserved for the shareholders. The following tables give information about each Trustee and the senior officers of the Fund. Where required, the tables separately list Trustees who are “interested persons” of the Fund (i.e., “Interested” Trustees) and those who are not (i.e., “Independent” Trustees). Unless otherwise noted, the address of each person listed is Federated Investors Tower, 1001 Liberty Avenue, Pittsburgh, PA 15222. The address of all Independent Trustees listed is 4000 Ericsson Drive, Warrendale, PA 15086-7561; Attention: Mutual Fund Board. As of December 31, 2010, the Trust comprised five portfolio(s), and the Federated Fund Family consisted of 43 investment companies (comprising 136 portfolios). Unless otherwise noted, each Officer is elected annually. Unless otherwise noted, each Trustee oversees all portfolios in the Federated Fund Family and serves for an indefinite term. The Fund's Statement of Additional Information includes additional information about Trust Trustees and is available, without charge and upon request, by calling 1-800-341-7400.
Interested TRUSTEES Background
Name
Birth Date
Positions Held with Trust
Date Service Began | Principal Occupation(s) for Past Five Years,
Other Directorships Held and Previous Position(s) |
John F. Donahue*
Birth Date: July 28, 1924
Trustee
Began serving: June 2006 | Principal Occupations: Director or Trustee of the Federated Fund Family; Chairman and Director, Federated Investors, Inc.; Chairman of the Federated Fund Family's Executive Committee.
Previous Positions: Chairman of the Federated Fund Family; Trustee, Federated Investment Management Company; Chairman and Director, Federated Investment Counseling. |
J. Christopher Donahue*
Birth Date: April 11, 1949
President and Trustee
Began serving: May 2006 | Principal Occupations: Principal Executive Officer and President of the Federated Fund Family; Director or Trustee of some of the Funds in the Federated Fund Family; President, Chief Executive Officer and Director, Federated Investors, Inc.; Chairman and Trustee, Federated Investment Management Company; Trustee, Federated Investment Counseling; Chairman and Director, Federated Global Investment Management Corp.; Chairman, Federated Equity Management Company of Pennsylvania and Passport Research, Ltd. (investment advisory subsidiary of Federated); Trustee, Federated Shareholder Services Company; Director, Federated Services Company.
Previous Positions: President, Federated Investment Counseling; President and Chief Executive Officer, Federated Investment Management Company, Federated Global Investment Management Corp. and Passport Research, Ltd. |
| * | Family relationships and reasons for “interested” status: John F. Donahue is the father of J. Christopher Donahue; both are “interested” due to their beneficial ownership of shares of Federated Investors, Inc. and the positions they hold with Federated and its subsidiaries. |
Annual Shareholder Report41
INDEPENDENT TRUSTEES Background
Name
Birth Date
Positions Held with Trust
Date Service Began | Principal Occupation(s) for Past Five Years,
Other Directorships Held, Previous Position(s) and Qualifications |
Nicholas P. Constantakis, CPA
Birth Date: September 3, 1939
Trustee
Began serving: June 2006 | Principal Occupation: Director or Trustee of the Federated Fund Family.
Other Directorship Held: Director and Chairman of the Audit Committee, Michael Baker Corporation (architecture, engineering and construction services).
Previous Position: Partner, Andersen Worldwide SC.
Qualifications: Public accounting and director experience. |
John F. Cunningham
Birth Date: March 5, 1943
Trustee
Began serving: June 2006 | Principal Occupation: Director or Trustee of the Federated Fund Family.
Other Directorships Held: Chairman, President and Chief Executive Officer, Cunningham & Co., Inc. (strategic business consulting); Trustee Associate, Boston College.
Previous Positions: Director, Redgate Communications and EMC Corporation (computer storage systems); Chairman of the Board and Chief Executive Officer, Computer Consoles, Inc.; President and Chief Operating Officer, Wang Laboratories; Director, First National Bank of Boston; Director, Apollo Computer, Inc.
Qualifications: Business management and director experience. |
Maureen Lally-Green
Birth Date: July 5, 1949
Trustee
Began serving: August 2009 | Principal Occupations: Director or Trustee of the Federated Fund Family; Director, Office of Church Relations, Diocese of Pittsburgh; Adjunct Professor of Law, Duquesne University School of Law.
Other Directorships Held: Director, Auberle; Trustee, St. Francis University; Director, Ireland Institute of Pittsburgh; Director, UPMC Mercy Hospital; Regent, St. Vincent Seminary; Director, Epilepsy Foundation of Western and Central Pennsylvania; Director, Saint Thomas More Society, Allegheny County; Director, Carlow University.
Previous Position: Pennsylvania Superior Court Judge.
Qualifications: Legal and director experience. |
Peter E. Madden
Birth Date: March 16, 1942
Trustee
Began serving: June 2006 | Principal Occupation: Director or Trustee, and Chairman of the Board of Directors or Trustees, of the Federated Fund Family.
Previous Positions: Representative, Commonwealth of Massachusetts General Court; President, Chief Operating Officer and Director, State Street Bank and Trust Company and State Street Corporation (retired); Director, VISA USA and VISA International; Chairman and Director, Massachusetts Bankers Association; Director, Depository Trust Corporation; Director, The Boston Stock Exchange.
Qualifications: Business management, mutual fund services and director experience. |
Annual Shareholder Report42
Name
Birth Date
Positions Held with Trust
Date Service Began | Principal Occupation(s) for Past Five Years,
Other Directorships Held, Previous Position(s) and Qualifications |
Charles F. Mansfield, Jr.
Birth Date: April 10, 1945
Trustee
Began serving: June 2006 | Principal Occupations: Director or Trustee and Chairman of the Audit Committee of the Federated Fund Family; Management Consultant.
Previous Positions: Chief Executive Officer, PBTC International Bank; Partner, Arthur Young & Company (now Ernst & Young LLP); Chief Financial Officer of Retail Banking Sector, Chase Manhattan Bank; Senior Vice President, HSBC Bank USA (formerly, Marine Midland Bank); Vice President, Citibank; Assistant Professor of Banking and Finance, Frank G. Zarb School of Business, Hofstra University; Executive Vice President, DVC Group, Inc. (marketing, communications and technology).
Qualifications: Banking, business management, education and director experience. |
R. James Nicholson
Birth Date: February 4, 1938
Trustee
Began serving: January 2008 | Principal Occupations: Director or Trustee of the Federated Fund Family; Senior Counsel, Brownstein Hyatt Farber Schrek, P.C.; Former Secretary of the U.S. Dept. of Veterans Affairs; Former U.S. Ambassador to the Holy See; Former Chairman of the Republican National Committee.
Other Directorships Held: Director, Horatio Alger Association; Director, The Daniels Fund.
Previous Positions: Colonel, U.S. Army Reserve; Partner, Calkins, Kramer, Grimshaw and Harring, P.C.; General Counsel, Colorado Association of Housing and Building; Chairman and CEO, Nicholson Enterprises, Inc. (real estate holding company); Chairman and CEO, Renaissance Homes of Colorado.
Qualifications: Legal, government, business management and director experience. |
Thomas M. O'Neill
Birth Date: June 14, 1951
Trustee
Began serving: October 2006 | Principal Occupations: Director or Trustee of the Federated Fund Family; Sole Proprietor, Navigator Management Company (investment and strategic consulting).
Other Directorships Held: Board of Overseers, Children's Hospital of Boston; Visiting Committee on Athletics, Harvard College.
Previous Positions: Chief Executive Officer and President, Managing Director and Chief Investment Officer, Fleet Investment Advisors; President and Chief Executive Officer, Aeltus Investment Management, Inc.; General Partner, Hellman, Jordan Management Co., Boston, MA; Chief Investment Officer, The Putnam Companies, Boston, MA; Credit Analyst and Lending Officer, Fleet Bank; Director and Consultant, EZE Castle Software (investment order management software); Director, Midway Pacific (lumber).
Qualifications: Business management, mutual fund, director and investment experience. |
Annual Shareholder Report43
Name
Birth Date
Positions Held with Trust
Date Service Began | Principal Occupation(s) for Past Five Years,
Other Directorships Held, Previous Position(s) and Qualifications |
John S. Walsh
Birth Date: November 28, 1957
Trustee
Began serving: June 2006 | Principal Occupations: Director or Trustee of the Federated Fund Family; President and Director, Heat Wagon, Inc. (manufacturer of construction temporary heaters); President and Director, Manufacturers Products, Inc. (distributor of portable construction heaters); President, Portable Heater Parts, a division of Manufacturers Products, Inc.
Previous Position: Vice President, Walsh & Kelly, Inc.
Qualifications: Business management and director experience. |
James F. Will
Birth Date: October 12, 1938
Trustee
Began serving: June 2006 | Principal Occupations: Director or Trustee of the Federated Fund Family; formerly, Vice Chancellor and President, Saint Vincent College.
Other Directorships Held: Trustee, Saint Vincent College; Director, Alleghany Corporation; Trustee, Wheeling Jesuit University; Director, Liberty Tire Recycling.
Previous Positions: Chairman, President and Chief Executive Officer, Armco, Inc.; President and Chief Executive Officer, Cyclops Industries; President and Chief Operating Officer, Kaiser Steel Corporation.
Qualifications: Business management, education and director experience. |
OFFICERS
Name
Birth Date
Positions Held with Trust
Date Service Began | Principal Occupation(s) for Past Five Years
and Previous Position(s) |
John W. McGonigle
Birth Date: October 26, 1938
Secretary
Began serving: May 2006 | Principal Occupations: Executive Vice President and Secretary of the Federated Fund Family; Vice Chairman, Executive Vice President, Secretary and Director, Federated Investors, Inc.
Previous Positions: Trustee, Federated Investment Management Company and Federated Investment Counseling; Director, Federated Global Investment Management Corp., Federated Services Company and Federated Securities Corp. |
Richard A. Novak
Birth Date: December 25, 1963
Treasurer
Began serving: May 2006 | Principal Occupations: Principal Financial Officer and Treasurer of the Federated Fund Family; Senior Vice President, Federated Administrative Services; Financial and Operations Principal for Federated Securities Corp., Edgewood Services, Inc. and Southpointe Distribution Services, Inc.
Previous Positions: Controller of Federated Investors, Inc.; Vice President, Finance of Federated Services Company; held various financial management positions within The Mercy Hospital of Pittsburgh; Auditor, Arthur Andersen & Co. |
Brian P. Bouda
Birth Date: February 28, 1947
CHIEF COMPLIANCE OFFICER AND SENIOR VICE PRESIDENT
Began serving: June 2006 | Principal Occupations: Senior Vice President and Chief Compliance Officer of the Federated Fund Family; Vice President and Chief Compliance Officer of Federated Investors, Inc. and Chief Compliance Officer of its subsidiaries. Mr. Bouda joined Federated in 1999 and is a member of the American Bar Association and the State Bar Association of Wisconsin. |
Annual Shareholder Report44
Evaluation and Approval of Advisory Contract – May 2011
federated mdt large cap growth fund (the “Fund”)
The Fund's Board reviewed the Fund's investment advisory contract at meetings held in May 2011. The Board's decision regarding the contract reflects the exercise of its business judgment on whether to continue the existing arrangements.
In this connection, the Federated Funds' Board had previously appointed a Senior Officer, whose duties include specified responsibilities relating to the process by which advisory fees are to be charged to a Federated fund. The Senior Officer has the authority to retain consultants, experts, or staff as may be reasonably necessary to assist in the performance of his duties, reports directly to the Board, and may be terminated only with the approval of a majority of the independent members of the Board. The Senior Officer prepared and furnished to the Board an independent, written evaluation that covered topics discussed below (the “Evaluation”). The Board considered that Evaluation, along with other information, in deciding to approve the advisory contract.
During its review of the contract, the Board considered compensation and benefits received by the Adviser. This included the fees received for services provided to the Fund by other entities in the Federated organization and research services (if any) received by the Adviser from brokers that execute Federated fund trades, as well as advisory fees. The Board is also familiar with and considered judicial decisions concerning allegedly excessive investment advisory fees, which have indicated that the following factors may be relevant to an Adviser's fiduciary duty with respect to its receipt of compensation from a fund: the nature and quality of the services provided by the Adviser, including the performance of the fund; the Adviser's cost of providing the services; the extent to which the Adviser may realize “economies of scale” as a fund grows larger; any indirect benefits that may accrue to the Adviser and its affiliates as a result of the Adviser's relationship with a fund; performance and expenses of comparable funds; and the extent to which the independent Board members are fully informed about all facts the Board deems relevant bearing on the Adviser's services and fees. The Board further considered management fees (including any components thereof) charged to institutional and other clients of the Adviser for what might be viewed as like services, and the cost to the Adviser and its affiliates of supplying services pursuant to the management fee agreements, excluding any intra-corporate profit and profit margins of the Adviser and its affiliates for supplying such services. The Board was aware of these factors and was guided by them in its review of the Fund's advisory contract to the extent it considered them to be appropriate and relevant, as discussed further below.
Annual Shareholder Report
45
The Board considered and weighed these circumstances in light of its substantial accumulated experience in governing the Fund and working with Federated on matters relating to the Federated funds, and was assisted in its deliberations by independent legal counsel. Throughout the year, the Board has requested and received substantial and detailed information about the Fund and the Federated organization that was in addition to the extensive materials that comprise and accompany the Senior Officer's Evaluation. Federated provided much of this information at each regular meeting of the Board, and furnished additional information in connection with the particular meeting at which the Board's formal review of the advisory contract occurred. Between regularly scheduled meetings, the Board also received information on particular matters as the need arose. Thus, the Board's consideration of the advisory contract included review of the Senior Officer's Evaluation, accompanying data and additional information covering such matters as: the Adviser's investment philosophy, revenue, profitability, personnel and processes; investment and operating strategies; the Fund's short- and long-term performance (in absolute terms, both on a gross basis and net of expenses, as well as in relationship to its particular investment program and certain competitor or “peer group” funds and/or other benchmarks, as appropriate), and comments on the reasons for performance; the Fund's investment objectives; the Fund's expenses (including the advisory fee itself and the overall expense structure of the Fund, both in absolute terms and relative to similar and/or competing funds, with due regard for contractual or voluntary expense limitations); the use and allocation of brokerage commissions derived from trading the Fund's portfolio securities (if any); and the nature, quality and extent of the advisory and other services provided to the Fund by the Adviser and its affiliates. The Board also considered the preferences and expectations of Fund shareholders and their relative sophistication; the continuing state of competition in the mutual fund industry and market practices; the range of comparable fees for similar funds in the mutual fund industry; the Fund's relationship to the Federated family of funds which include a comprehensive array of funds with different investment objectives, policies and strategies which are available for exchange without the incurrence of additional sales charges; compliance and audit reports concerning the Federated funds and the Federated companies that service them (including communications from regulatory agencies), as well as Federated's responses to any issues raised therein; and relevant developments in the mutual fund industry and how the Federated funds and/or Federated are responding to them. The Board's evaluation process is evolutionary. The criteria considered and the emphasis placed on relevant criteria change in recognition of changing circumstances in the mutual fund marketplace.With respect to the Fund's performance and expenses in particular, the Board has found the use of comparisons to other mutual funds with comparable investment programs to be relevant, given the high degree of competition in the mutual fund business. The Board focused on comparisons with other similar Annual Shareholder Report
46
mutual funds more heavily than non-mutual fund products or services because it is believed that they are more relevant. For example, other mutual funds are the products most like the Fund, they are readily available to Fund shareholders as alternative investment vehicles, and they are the type of investment vehicle in fact chosen and maintained by the Fund's investors. The range of their fees and expenses therefore appears to be a generally reliable indication of what consumers have found to be reasonable in the precise marketplace in which the Fund competes. The Fund's ability to deliver competitive performance when compared to its peer group was a useful indicator of how the Adviser is executing the Fund's investment program, which in turn assisted the Board in reaching a conclusion that the nature, extent, and quality of the Adviser's investment management services were such as to warrant continuation of the advisory contract. In this regard, the Senior Officer has reviewed Federated's fees for providing advisory services to products outside the Federated family of funds (e.g., institutional and separate accounts). He concluded that mutual funds and institutional accounts are inherently different products. Those differences include, but are not limited to, different types of targeted investors; being subject to different laws and regulations; different legal structures; different average account sizes; different associated costs; different portfolio management techniques made necessary by different cash flows; and portfolio manager time spent in review of securities pricing. The Senior Officer did not consider these fee schedules to be determinative in judging the appropriateness of mutual fund advisory contracts.The Senior Officer reviewed information compiled by Federated, using data supplied by independent fund ranking organizations, regarding the performance of, and fees charged by, other mutual funds, noting his view that comparisons to fund peer groups are relevant in judging the reasonableness of proposed fees. He also observed that certain funds may exhibit important differences in their objectives and management techniques when compared to other funds placed in the same peer group by ranking organizations, noting in this connection that the Fund's quantitative investment program is of such a type.
The Fund's performance fell below the median of the relevant peer group for the one-year, three-year and five-year periods covered by the Evaluation. In addition, the Board was informed by the Adviser that, for the same periods, the Fund underperformed its benchmark index for the one-year period, underperformed its benchmark index for the three-year period and underperformed its benchmark index for the five-year period. The Board discussed the Fund's performance with the Adviser and recognized the efforts being undertaken by the Adviser. The Board will continue to monitor these efforts and the performance of the Fund.
The Board also received financial information about Federated, including information regarding the compensation and benefits Federated derived from its relationships with the Federated funds. This information covered not only the fees under the advisory contracts, but also fees received by Federated's Annual Shareholder Report
47
subsidiaries for providing other services to the Federated funds under separate contracts (e.g., for serving as the Federated funds' administrator). The information also detailed any indirect benefit Federated may derive from its receipt of research services from brokers who execute Federated fund trades. In addition, the Board considered the fact that, in order for a fund to be competitive in the marketplace, Federated and its affiliates frequently waived fees and/or reimbursed expenses and have disclosed to fund investors and/or indicated to the Board their intention to do so in the future, where appropriate. Moreover, the Board receives regular reporting as to the institution or elimination of these voluntary waivers.Federated furnished information, requested by the Senior Officer, that reported revenues on a fund-by-fund basis and made estimates of the allocation of expenses on a fund-by-fund basis, using allocation methodologies specified by the Senior Officer. The Senior Officer noted that, although they may apply consistent allocation processes, the inherent difficulties in allocating costs (and the unavoidable arbitrary aspects of that exercise) and the lack of consensus on how to allocate those costs may render such allocation information unreliable. The allocation information was considered in the analysis by the Board but was determined to be of limited use.
The Board and the Senior Officer also reviewed information compiled by Federated comparing profitability information for Federated to other publicly held fund management companies. In this regard, the Senior Officer noted the limited availability of such information, but nonetheless concluded that Federated's profit margins did not appear to be excessive and the Board agreed.
The Senior Officer's Evaluation also discussed the notion of possible realization of “economies of scale” as a fund grows larger. The Board considered in this regard that the Adviser has made significant and long-term investments in areas that support all of the Federated funds, such as personnel and processes for the portfolio management, compliance, internal audit, and risk management functions; and systems technology; and that the benefits of these efforts (as well as any economies, should they exist) were likely to be enjoyed by the fund complex as a whole. Finally, the Board also noted the absence of any applicable regulatory or industry guidelines on this subject, which (as discussed in the Senior Officer's Evaluation) is compounded by the lack of any common industry practice or general pattern with respect to structuring fund advisory fees with “breakpoints” that serve to reduce the fee as the fund attains a certain size. The Senior Officer did not recommend institution of breakpoints in pricing Federated's fund advisory services at this time.
It was noted in the materials for the Board meeting that for the period covered by the Evaluation, the Fund's investment advisory fee, after waivers and expense reimbursements, if any, was below the median of the relevant peer group. The Board reviewed the fees and other expenses of the Fund with the Adviser and was satisfied that the overall expense structure of the Fund remained competitive.
Annual Shareholder Report
48
The Senior Officer noted that, considering the totality of the circumstances, and all of the factors referenced within his Evaluation, he had concluded that, subject to comments and recommendations made within his Evaluation, his observations and the information accompanying the Evaluation supported a finding by the Board that the management fees for each of the funds are reasonable and that Federated appeared to provide appropriate administrative services to the Fund for the fees paid. Under these circumstances, no changes were recommended to, and no objection was raised to, the continuation of the Fund's advisory contract. The Board concluded that the nature, quality and scope of services provided the Fund by the Adviser and its affiliates were satisfactory.In its decision to continue an existing investment advisory contract, the Board was mindful of the potential disruptions of the Fund's operations and various risks, uncertainties and other effects that could occur as a result of a decision to terminate or not renew an advisory contract. In particular, the Board recognized that many shareholders have invested in the Fund on the strength of the Adviser's industry standing and reputation and with the expectation that the Adviser will have a continuing role in providing advisory services to the Fund. Thus, the Board's approval of the advisory contract reflected the fact that it is the shareholders who have effectively selected the Adviser by virtue of having invested in the Fund.
The Board based its decision to approve the advisory contract on the totality of the circumstances and relevant factors and with a view to past and future long-term considerations. Not all of the factors and considerations identified above were necessarily relevant to the Fund, nor did the Board consider any one of them to be determinative. With respect to the factors that were relevant, the Board's decision to approve the contract reflects its determination that Federated's performance and actions provided a satisfactory basis to support the decision to continue the existing arrangements.
Annual Shareholder Report49
Voting Proxies on Fund Portfolio Securities
A description of the policies and procedures that the Fund uses to determine how to vote proxies, if any, relating to securities held in the Fund's portfolio is available, without charge and upon request, by calling 1-800-341-7400. A report on “Form N-PX” of how the Fund voted any such proxies during the most recent 12-month period ended June 30 is available from Federated's website at FederatedInvestors.com. To access this information from the home page, select “View All” next to “Find Products.” Select a fund name and share class, if applicable, to go to the Fund Overview page. On the Fund Overview page, select the “Documents” tab. At the bottom of that page, select “Proxy Voting Record Report (Form N-PX).” Form N-PX filings are also available at the SEC's website at www.sec.gov.
Quarterly Portfolio Schedule
The Fund files with the SEC a complete schedule of its portfolio holdings, as of the close of the first and third quarters of its fiscal year, on “Form N-Q.” These filings are available on the SEC's website at www.sec.gov and may be reviewed and copied at the SEC's Public Reference Room in Washington, DC. (Call 1-800-SEC-0330 for information on the operation of the Public Reference Room.) You may also access this information from the “Products” section of Federated's website at FederatedInvestors.com. From the home page, select “View All” next to “Find Products.” Select a fund name and share class, if applicable, to go to the Fund Overview page. On the Fund Overview page, select the “Documents” tab. At the bottom of that page, select “Form N-Q.”
Annual Shareholder Report50
Mutual funds are not bank deposits or obligations, are not guaranteed by any bank and are not insured or guaranteed by the U.S. government, the Federal Deposit Insurance Corporation, the Federal Reserve Board or any other government agency. Investment in mutual funds involves investment risk, including the possible loss of principal.
This Report is authorized for distribution to prospective investors only when preceded or accompanied by the Fund's Prospectus, which contains facts concerning its objective and policies, management fees, expenses and other information.
Federated MDT Large Cap Growth Fund
Federated Investors Funds
4000 Ericsson Drive
Warrendale, PA 15086-7561
Contact us at FederatedInvestors.com
or call 1-800-341-7400.
Federated Securities Corp., Distributor
Cusip 31421R700
Cusip 31421R684
Cusip 31421R809
Cusip 31421R882
37329 (9/11)
Federated is a registered trademark of Federated Investors, Inc.
2011 © Federated Investors, Inc.
| | Annual Shareholder Report |
| | July 31, 2011 |
|
| Share Class | Ticker |
| A | QASCX |
| C | QCSCX |
| IS | QISCX |
Federated MDT Small Cap Core Fund
Fund Established 2005
A Portfolio of Federated MDT Series
Financial Highlights
Shareholder Expense Example
Management's Discussion of Fund Performance
Portfolio of Investments Summary Table
Portfolio of Investments
Statement of Assets and Liabilities
Statement of Operations
Statement of Changes in Net Assets
Notes to Financial Statements
Report of Independent Registered Public Accounting Firm
Board of Trustees and Trust Officers
Evaluation and Approval of Advisory Contract
Voting Proxies on Fund Portfolio Securities
Quarterly Portfolio Schedule
Financial Highlights – Class A Shares
(For a Share Outstanding Throughout Each Period)
| Year Ended July 31 | 2011 | 2010 | 2009 | 2008 | 20071 |
| Net Asset Value, Beginning of Period | $7.55 | $6.58 | $10.21 | $13.22 | $11.11 |
| Income From Investment Operations: | | | | | |
| Net investment income (loss) | (0.09)2 | (0.06)2 | (0.04)2 | (0.08)2 | (0.10)2 |
| Net realized and unrealized gain (loss) on investments | 2.42 | 1.03 | (3.59) | (2.22) | 2.21 |
| TOTAL FROM INVESTMENT OPERATIONS | 2.33 | 0.97 | (3.63) | (2.30) | 2.11 |
| Less Distributions: | | | | | |
| Distributions from net realized gain on investments | — | — | — | (0.71) | — |
| Net Asset Value, End of Period | $9.88 | $7.55 | $6.58 | $10.21 | $13.22 |
| Total Return3 | 30.86% | 14.74% | (35.55)% | (18.09)% | 18.99% |
| Ratios to Average Net Assets: | | | | | |
| Net expenses | 1.75% | 1.75% | 1.74% | 1.75% | 1.75% |
| Net investment income (loss) | (0.96)% | (0.77)% | (0.53)% | (0.68)% | (0.77)% |
| Expense waiver/reimbursement4 | 3.75% | 5.41% | 5.73% | 3.85% | 7.96% |
| Supplemental Data: | | | | | |
| Net assets, end of period (000 omitted) | $3,469 | $3,184 | $1,652 | $2,623 | $2,414 |
| Portfolio turnover | 210% | 192% | 222% | 243% | 237% |
| 1 | The MDT Small Cap Core Fund (the “Predecessor Fund”) was reorganized into Federated MDT Small Cap Core Fund (the “Fund”) as of the close of business on December 8, 2006. Prior to the reorganization, the Fund had no investment operations. The Fund is the successor to the Predecessor Fund. The performance information and financial information presented incorporates the operations of the Predecessor Fund, which, as a result of the reorganization, are the Fund's operations. |
| 2 | Per share numbers have been calculated using the average shares method. |
| 3 | Based on net asset value, which does not reflect the sales charge, redemption fee or contingent deferred sales charge, if applicable. |
| 4 | This expense decrease is reflected in both the net expense and the net investment income (loss) ratios shown above. |
See Notes which are an integral part of the Financial Statements
Annual Shareholder Report1
Financial Highlights – Class C Shares
(For a Share Outstanding Throughout Each Period)
| Year Ended July 31 | 2011 | 2010 | 2009 | 2008 | 20071 |
| Net Asset Value, Beginning of Period | $7.28 | $6.39 | $9.99 | $13.04 | $11.05 |
| Income From Investment Operations: | | | | | |
| Net investment income (loss) | (0.15)2 | (0.11)2 | (0.08)2 | (0.16)2 | (0.19)2 |
| Net realized and unrealized gain (loss) on investments | 2.32 | 1.00 | (3.52) | (2.18) | 2.18 |
| TOTAL FROM INVESTMENT OPERATIONS | 2.17 | 0.89 | (3.60) | (2.34) | 1.99 |
| Less Distributions: | | | | | |
| Distributions from net realized gain on investments | — | — | — | (0.71) | — |
| Net Asset Value, End of Period | $9.45 | $7.28 | $6.39 | $9.99 | $13.04 |
| Total Return3 | 29.81% | 13.93% | (36.04)% | (18.66)% | 18.01% |
| Ratios to Average Net Assets: | | | | | |
| Net expenses | 2.50% | 2.50% | 2.49% | 2.46% | 2.50% |
| Net investment income (loss) | (1.70)% | (1.53)% | (1.29)% | (1.40)% | (1.52)% |
| Expense waiver/reimbursement4 | 3.78% | 5.13% | 5.61% | 3.90% | 8.63% |
| Supplemental Data: | | | | | |
| Net assets, end of period (000 omitted) | $2,978 | $3,258 | $1,366 | $2,759 | $3,299 |
| Portfolio turnover | 210% | 192% | 222% | 243% | 237% |
| 1 | The Predecessor Fund was reorganized into the Fund as of the close of business on December 8, 2006. Prior to the reorganization, the Fund had no investment operations. The Fund is the successor to the Predecessor Fund. The performance information and financial information presented incorporates the operations of the Predecessor Fund, which, as a result of the reorganization, are the Fund's operations. |
| 2 | Per share numbers have been calculated using the average shares method. |
| 3 | Based on net asset value, which does not reflect the sales charge, redemption fee or contingent deferred sales charge, if applicable. |
| 4 | This expense decrease is reflected in both the net expense and the net investment income (loss) ratios shown above. |
See Notes which are an integral part of the Financial Statements
Annual Shareholder Report2
Financial Highlights – Institutional Shares
(For a Share Outstanding Throughout Each Period)
| Year Ended July 31 | 2011 | 2010 | 2009 | 2008 | 20071 |
| Net Asset Value, Beginning of Period | $7.63 | $6.63 | $10.28 | $13.28 | $11.14 |
| Income From Investment Operations: | | | | | |
| Net investment income (loss) | (0.06)2 | (0.04)2 | (0.02)2 | (0.05)2 | (0.07)2 |
| Net realized and unrealized gain (loss) on investments | 2.43 | 1.04 | (3.63) | (2.24) | 2.21 |
| TOTAL FROM INVESTMENT OPERATIONS | 2.37 | 1.00 | (3.65) | (2.29) | 2.14 |
| Less Distributions: | | | | | |
| Distributions from net realized gain on investments | — | — | — | (0.71) | — |
| Net Asset Value, End of Period | $10.00 | $7.63 | $6.63 | $10.28 | $13.28 |
| Total Return3 | 31.06% | 15.08% | (35.51)% | (17.92)% | 19.21% |
| Ratios to Average Net Assets: | | | | | |
| Net expenses | 1.50% | 1.50% | 1.49% | 1.50% | 1.50% |
| Net investment income (loss) | (0.71)% | (0.52)% | (0.30)% | (0.43)% | (0.51)% |
| Expense waiver/reimbursement4 | 3.79% | 5.56% | 5.22% | 3.55% | 8.14% |
| Supplemental Data: | | | | | |
| Net assets, end of period (000 omitted) | $4,836 | $5,727 | $3,319 | $10,064 | $3,595 |
| Portfolio turnover | 210% | 192% | 222% | 243% | 237% |
| 1 | The Predecessor Fund was reorganized into the Fund as of the close of business on December 8, 2006. Prior to the reorganization, the Fund had no investment operations. The Fund is the successor to the Predecessor Fund. The performance information and financial information presented incorporates the operations of the Predecessor Fund, which, as a result of the reorganization, are the Fund's operations. |
| 2 | Per share numbers have been calculated using the average shares method. |
| 3 | Based on net asset value. |
| 4 | This expense decrease is reflected in both the net expense and the net investment income (loss) ratios shown above. |
See Notes which are an integral part of the Financial Statements
Annual Shareholder Report3
Shareholder Expense Example (unaudited)
As a shareholder of the Fund, you incur two types of costs: (1) transaction costs, including sales charges (loads) on purchase or redemption payments; and (2) ongoing costs, including management fees and to the extent applicable, distribution (12b-1) fees and/or shareholder services fees and other Fund expenses. This Example is intended to help you to understand your ongoing costs (in dollars) of investing in the Fund and to compare these costs with the ongoing costs of investing in other mutual funds. It is based on an investment of $1,000 invested at the beginning of the period and held for the entire period from February 1, 2011 to July 31, 2011.
ACTUAL EXPENSES
The first section of the table below provides information about actual account values and actual expenses. You may use the information in this section, together with the amount you invested, to estimate the expenses that you incurred over the period. Simply divide your account value by $1,000 (for example, an $8,600 account value divided by $1,000 = 8.6), then multiply the result by the number in the first section under the heading entitled “Expenses Paid During Period” to estimate the expenses attributable to your investment during this period.
HYPOTHETICAL EXAMPLE FOR COMPARISON PURPOSES
The second section of the table below provides information about hypothetical account values and hypothetical expenses based on the Fund's actual expense ratio and an assumed rate of return of 5% per year before expenses, which is not the Fund's actual return. Thus, you should not use the hypothetical account values and expenses to estimate the actual ending account balance or your expenses for the period. Rather, these figures are required to be provided to enable you to compare the ongoing costs of investing in the Fund with other funds. To do so, compare this 5% hypothetical example with the 5% hypothetical examples that appear in the shareholder reports of the other funds.
Annual Shareholder Report
4
Please note that the expenses shown in the table are meant to highlight your ongoing costs only and do not reflect any transaction costs, such as sales charges (loads) on purchase or redemption payments. Therefore, the second section of the table is useful in comparing ongoing costs only, and will not help you determine the relative total costs of owning different funds. In addition, if these transaction costs were included, your costs would have been higher. | Beginning
Account Value
2/1/2011 | Ending
Account Value
7/31/2011 | Expenses Paid
During Period1 |
| Actual: | | | |
| Class A Shares | $1,000 | $1,058.90 | $8.93 |
| Class C Shares | $1,000 | $1,054.70 | $12.74 |
| Institutional Shares | $1,000 | $1,059.30 | $7.66 |
Hypothetical (assuming a 5% return
before expenses): | | | |
| Class A Shares | $1,000 | $1,016.12 | $8.75 |
| Class C Shares | $1,000 | $1,012.40 | $12.47 |
| Institutional Shares | $1,000 | $1,017.36 | $7.50 |
| 1 | Expenses are equal to the Fund's annualized net expense ratios, multiplied by the average account value over the period, multiplied by 181/365 (to reflect the one-half-year period). The annualized net expense ratios are as follows: |
| Class A Shares | 1.75% |
| Class C Shares | 2.50% |
| Institutional Shares | 1.50% |
Annual Shareholder Report5
Performance data quoted represents past performance which is no guarantee of future results. Investment return and principal value will fluctuate so that an investor's shares, when redeemed, may be worth more or less than their original cost. Mutual fund performance changes over time and current performance may be lower or higher than what is stated. For current to the most recent month-end performance and after-tax returns, visit FederatedInvestors.com or call 1-800-341-7400.
Management's Discussion of Fund Performance (unaudited)
During the 12-month reporting period ended July 31, 2011, the Fund's total return was 30.86% for Class A Shares, 29.81% for Class C Shares and 31.06% for Institutional Shares, based on net asset value. The total return of the Russell 2000® Index,1 a broad-based securities market index (the “Russell 2000”), was 23.92% for the same reporting period. The Fund's total return for the fiscal year reflected actual cash flows, transaction costs and other fees which were not reflected in the total return of the Russell 2000.
| 1 | The Russell 2000® Index measures the performance of the 2,000 smallest companies in the Russell 3000® Index, which represents approximately 10% of the total market capitalization of the Russell 3000® Index. The index is unmanaged, and, unlike the fund, is not affected by cash flows. The index is not adjusted to reflect sales charges, expenses or other fees that the Securities and Exchange Commission (SEC) requires to be reflected in the fund's performance. It is not possible to invest directly in an index. |
Annual Shareholder Report6
MARKET OVERVIEW
During the 12-month reporting period, domestic equity market performance was strong as evidenced by the 20.94% return of the Russell 3000® Index,2 which represents the performance of the 3,000 largest U.S. companies by market capitalization. Mid-cap stocks led the way as demonstrated by the 24.51% return of the Russell Midcap® Index,3 which exceeded the 19.09% and 23.92% results for the Russell Top 200® Index,4 representing large-cap stocks, and the Benchmark, respectively. Growth stocks outperformed value stocks during the year with the Russell 3000® Growth Index5 returning 25.12% as compared to 16.90% for the Russell 3000 Value® Index.6
The best performing sectors in the Russell 2000 during the period were Energy (+57.08%), Materials (+35.06%) and Health Care (+28.78%). Underperforming sectors included Financials (+11.89%), Consumer Staples (+18.92%) and Utilities (+19.02%).
| 2 | The Russell 3000® Index offers investors access to the broad U.S. equity universe representing approximately 98% of the U.S. market. The Russell 3000® Index is constructed to provide a comprehensive, unbiased and stable barometer of the broad market and is completely reconstituted annually to ensure new and growing equities are reflected. The index is unmanaged, and, unlike the fund, is not affected by cash flows. The index is not adjusted to reflect sales charges, expenses or other fees that the SEC requires to be reflected in the fund's performance. It is not possible to invest directly in an index. |
| 3 | The Russell Midcap® Index measures the performance of the 800 smallest companies in the Russell 1000® Index and represents approximately 31% of the total market capitalization of the Russell 1000® Index. The index is unmanaged, and, unlike the fund, is not affected by cash flows. The index is not adjusted to reflect sales charges, expenses or other fees that the SEC requires to be reflected in the fund's performance. It is not possible to invest directly in an index. |
| 4 | The Russell Top 200® Index measures the performance of the 200 largest companies in the Russell 1000® Index and represents approximately 68% of the total market capitalization of the Russell 1000® Index. The index is unmanaged, and, unlike the fund, is not affected by cash flows. The index is not adjusted to reflect sales charges, expenses or other fees that the SEC requires to be reflected in the fund's performance. It is not possible to invest directly in an index. |
| 5 | The Russell 3000® Growth Index measures the performance of those Russell 3000 Index companies with higher price-to-book ratios and higher forecasted growth values. The stocks in this index are also members of either the Russell 1000® Growth or the Russell 2000® Growth indexes. The index is unmanaged, and, unlike the fund, is not affected by cash flows. The index is not adjusted to reflect sales charges, expenses or other fees that the SEC requires to be reflected in the fund's performance. It is not possible to invest directly in an index. |
| 6 | The Russell 3000® Value Index measures the performance of those Russell 3000® Index companies with lower price-to-book ratios and lower forecasted growth values. The stocks in this index are also members of either the Russell 1000® Value or the Russell 2000® Value indexes. The index is unmanaged, and, unlike the fund, is not affected by cash flows. The index is not adjusted to reflect sales charges, expenses or other fees that the SEC requires to be reflected in the fund's performance. It is not possible to invest directly in an index. |
Annual Shareholder Report7
FUND PERFORMANCE
During the 12-month reporting period, the most significant positive factor in the Fund's performance relative to the Russell 2000 was stock selection in the Consumer Discretionary and Health Care sectors. Stock selection in Energy, Industrials and Materials also contributed significantly. An overweight in Energy, which outperformed the Russell 2000, also contributed moderately. The most significant negative factor in the Fund's performance was stock selection in the Information Technology sector. An underweight in the Health Care sector, which outperformed the Russell 2000, detracted moderately from relative performance. An overweight in the Consumer Discretionary sector, which underperformed the Russell 2000, also detracted moderately from relative performance.
Individual stocks detracting from the performance included Coinstar, Skechers, Georgia Gulf, Timberland and Wellcare.
Individual stocks contributing to the Fund's performance included Tempur-Pedic, Rockwood Holdings, Polypore, Polaris and Ulta Salon.
Annual Shareholder Report8
GROWTH OF A $10,000 INVESTMENT – CLASS A SHARES
The graph below illustrates the hypothetical investment of $10,0001 in the Federated MDT Small Cap Core Fund2 (Class A Shares) (the “Fund”) from September 15, 2005 (start of performance) to July 31, 2011, compared to the Russell 2000® Index.3
| Average Annual Total Returns for the Period Ended 7/31/2011 | |
| 1 Year | 23.65% |
| 5 Years | -2.28% |
| Start of Performance (9/15/2005) | -0.16% |
| Federated MDT Small Cap Core Fund - Class A Shares | C000035058 | Russell 2000 Index | Lipper Small-Cap Core Funds Index |
| 9/15/2005 | 9,450 | 10,000 | 10,000 |
| 7/31/2006 | 10,499 | 10,619 | 10,493 |
| 7/31/2007 | 12,494 | 11,906 | 12,059 |
| 7/31/2008 | 10,234 | 11,107 | 11,037 |
| 7/31/2009 | 6,596 | 8,805 | 8,984 |
| 7/31/2010 | 7,569 | 10,427 | 10,685 |
| 7/31/2011 | 9,905 | 12,922 | 13,279 |
41 graphic description end -->
Performance data quoted represents past performance which is no guarantee of future results. Investment return and principal value will fluctuate so that an investor's shares, when redeemed, may be worth more or less than their original cost. Mutual fund performance changes over time and current performance may be lower or higher than what is stated. For current to the most recent month-end performance and after-tax returns, visit FederatedInvestors.com or call 1-800-341-7400. Returns shown do not reflect the deduction of taxes that a shareholder would pay on Fund distributions or the redemption of Fund shares. Mutual funds are not obligations of or guaranteed by any bank and are not federally insured. Total returns shown include the maximum sales charge of 5.50%.
| 1 | Represents a hypothetical investment of $10,000 in the Fund after deducting the maximum sales charge of 5.50% ($10,000 investment minus $550 sales charge = $9,450). The Fund's performance assumes the reinvestment of all dividends and distributions. The Russell 2000® Index and the Lipper Small-Cap Core Funds Index have been adjusted to reflect reinvestment of dividends on securities in the indexes. |
| 2 | The Fund is the successor to the MDT Small Cap Core Fund pursuant to a reorganization that took place on December 6, 2006. Prior to that date, the Fund had no investment operations. Accordingly, the performance information shown for periods prior to that date is that of the MDT Small Cap Core Fund. |
| 3 | The Russell 2000® Index measures the performance of those Russell 2,000 smallest companies in the Russell 3000® Index, which represents approximately 10% of the total market capitalization of the Russell 3000 Index. The index is not adjusted to reflect sales charges, expenses or other fees that the Securities and Exchange Commission (SEC) requires to be reflected in the Fund's performance. It is not possible to invest directly in an index. |
Annual Shareholder Report9
GROWTH OF A $10,000 INVESTMENT – CLASS C SHARES
The graph below illustrates the hypothetical investment of $10,0001 in the Federated MDT Small Cap Core Fund2 (Class C Shares) (the “Fund”) from September 15, 2005 (start of performance) to July 31, 2011, compared to the Russell 2000® Index.3
| Average Annual Total Returns for the Period Ended 7/31/2011 | |
| 1 Year | 28.81% |
| 5 Years | -1.91% |
| Start of Performance (9/15/2005) | 0.06% |
| Federated MDT Small Cap Core Fund - Class C Shares | C000035059 | Russell 2000 Index | Lipper Small-Cap Core Funds Index |
| 9/15/2005 | 10,000 | 10,000 | 10,000 |
| 7/31/2006 | 11,050 | 10,619 | 10,493 |
| 7/31/2007 | 13,040 | 11,906 | 12,059 |
| 7/31/2008 | 10,606 | 11,107 | 11,037 |
| 7/31/2009 | 6,784 | 8,805 | 8,984 |
| 7/31/2010 | 7,729 | 10,427 | 10,685 |
| 7/31/2011 | 10,033 | 12,922 | 13,279 |
41 graphic description end -->
Performance data quoted represents past performance which is no guarantee of future results. Investment return and principal value will fluctuate so that an investor's shares, when redeemed, may be worth more or less than their original cost. Mutual fund performance changes over time and current performance may be lower or higher than what is stated. For current to the most recent month-end performance and after-tax returns, visit FederatedInvestors.com or call 1-800-341-7400. Returns shown do not reflect the deduction of taxes that a shareholder would pay on Fund distributions or the redemption of Fund shares. Mutual funds are not obligations of or guaranteed by any bank and are not federally insured. Total returns shown include the maximum contingent deferred sales charge (CDSC) of 1.00%, as applicable.
| 1 | Represents a hypothetical investment of $10,000 in the Fund. The maximum CDSC is 1.00% on any redemption less than one year from the purchase date. The Fund's performance assumes the reinvestment of all dividends and distributions. The Russell 2000® Index and the Lipper Small-Cap Core Funds Index have been adjusted to reflect reinvestment of dividends on securities in the indexes. |
| 2 | The Fund is the successor to the MDT Small Cap Core Fund pursuant to a reorganization that took place on December 6, 2006. Prior to that date, the Fund had no investment operations. Accordingly, the performance information shown for periods prior to that date is that of the MDT Small Cap Core Fund. |
| 3 | The Russell 2000® Index measures the performance of those Russell 2,000 smallest companies in the Russell 3000® Index, which represents approximately 10% of the total market capitalization of the Russell 3000 Index. The index is not adjusted to reflect sales charges, expenses or other fees that the SEC requires to be reflected in the Fund's performance. It is not possible to invest directly in an index. |
Annual Shareholder Report10
GROWTH OF A $10,000 INVESTMENT – INSTITUTIONAL SHARES
The graph below illustrates the hypothetical investment of $10,0001 in the Federated MDT Small Cap Core Fund2 (Institutional Shares) (the “Fund”) from September 15, 2005 (start of performance) to July 31, 2011, compared to the Russell 2000® Index.3
| Average Annual Total Returns for the Period Ended 7/31/2011 | |
| 1 Year | 31.06% |
| 5 Years | -0.98% |
| Start of Performance (9/15/2005) | 1.00% |
| Federated MDT Small Cap Core Fund - Institutional Shares | C000035060 | Russell 2000 Index | Lipper Small-Cap Core Funds Index |
| 9/15/2005 | 10,000 | 10,000 | 10,000 |
| 7/31/2006 | 11,140 | 10,619 | 10,493 |
| 7/31/2007 | 13,280 | 11,906 | 12,059 |
| 7/31/2008 | 10,900 | 11,107 | 11,037 |
| 7/31/2009 | 7,030 | 8,805 | 8,984 |
| 7/31/2010 | 8,090 | 10,427 | 10,685 |
| 7/31/2011 | 10,603 | 12,922 | 13,279 |
41 graphic description end -->
Performance data quoted represents past performance which is no guarantee of future results. Investment return and principal value will fluctuate so that an investor's shares, when redeemed, may be worth more or less than their original cost. Mutual fund performance changes over time and current performance may be lower or higher than what is stated. For current to the most recent month-end performance and after-tax returns, visit FederatedInvestors.com or call 1-800-341-7400. Returns shown do not reflect the deduction of taxes that a shareholder would pay on Fund distributions or the redemption of Fund shares. Mutual funds are not obligations of or guaranteed by any bank and are not federally insured.
| 1 | Represents a hypothetical investment of $10,000 in the Fund. The Fund's performance assumes the reinvestment of all dividends and distributions. The Russell 2000® Index and the Lipper Small-Cap Core Funds Index have been adjusted to reflect reinvestment of dividends on securities in the indexes. |
| 2 | The Fund is the successor to the MDT Small Cap Core Fund pursuant to a reorganization that took place on December 6, 2006. Prior to that date, the Fund had no investment operations. Accordingly, the performance information shown for periods prior to that date is that of the MDT Small Cap Core Fund. |
| 3 | The Russell 2000® Index measures the performance of those Russell 2,000 smallest companies in the Russell 3000® Index, which represents approximately 10% of the total market capitalization of the Russell 3000 Index. The index is not adjusted to reflect sales charges, expenses or other fees that the SEC requires to be reflected in the Fund's performance. It is not possible to invest directly in an index. |
Annual Shareholder Report11
Portfolio of Investments Summary Table (unaudited)
At July 31, 2011, the Fund's industry composition1 was as follows:
| Industry Composition | Percentage of
Total Net Assets |
| Specialty Chemicals | 5.1% |
| Property Liability Insurance | 4.2% |
| Crude Oil & Gas Production | 3.4% |
| Semiconductor Manufacturing Equipment | 2.8% |
| Clothing Stores | 2.4% |
| Undesignated Consumer Cyclicals | 2.4% |
| Auto Original Equipment Manufacturers | 2.3% |
| Multi-Line Insurance | 2.2% |
| Metal Fabrication | 2.1% |
| Photo-Optical Component-Equipment | 2.1% |
| Regional Banks | 2.1% |
| Financial Services | 2.0% |
| Electrical Equipment | 1.9% |
| Oil Service, Explore & Drill | 1.9% |
| Software Packaged/Custom | 1.9% |
| Generic Drugs | 1.8% |
| Biotechnology | 1.7% |
| Computer Peripherals | 1.7% |
| Home Health Care | 1.7% |
| Airline — Regional | 1.6% |
| Furniture | 1.6% |
| Industrial Machinery | 1.6% |
| Life Insurance | 1.6% |
| Paper Products | 1.6% |
| Restaurant | 1.6% |
| Commodity Chemicals | 1.5% |
| Construction Machinery | 1.5% |
| Department Stores | 1.5% |
| Oil Refiner | 1.5% |
| Telecommunication Equipment & Services | 1.5% |
| Multi-Industry Capital Goods | 1.4% |
| Savings & Loan | 1.4% |
| Electronic Instruments | 1.3% |
| Hotels and Motels | 1.3% |
| Greeting Cards | 1.1% |
| Printing | 1.1% |
| Specialty Machinery | 1.1% |
Annual Shareholder Report12
| Industry Composition | Percentage of
Total Net Assets |
| Miscellaneous Components | 1.0% |
| Oil Well Supply | 1.0% |
| Other2 | 25.4% |
| Cash Equivalents3 | 1.0% |
| Other Assets and Liabilities — Net4 | 0.1% |
| TOTAL | 100.0% |
| 1 | Except for Cash Equivalents and Other Assets and Liabilities, industry classifications are based upon, and individual portfolio securities are assigned to, the classifications of the Global Industry Classification Standard (GICS) except that the Adviser assigns a classification to securities not classified by the GICS and to securities for which the Adviser does not have access to the classification made by the GICS. |
| 2 | For purposes of this table, industry classifications which constitute less than 1.0% of the Fund's total net assets have been aggregated under the designation “Other.” |
| 3 | Cash Equivalents include any investments in money market mutual funds and/or overnight repurchase agreements. |
| 4 | Assets, other than investments in securities, less liabilities. See Statement of Assets and Liabilities. |
Annual Shareholder Report13
Portfolio of Investments
July 31, 2011
| Shares | | | Value |
| | COMMON STOCKS – 98.9% | |
| | Accident & Health Insurance – 0.1% | |
| 632 | 1 | Triple-S Management Corp., Class B | 13,632 |
| | Agricultural Machinery – 0.4% | |
| 738 | | Lindsay Manufacturing Co. | 46,715 |
| | Airline - National – 0.9% | |
| 1,449 | 1 | Atlas Air Worldwide Holdings, Inc. | 75,913 |
| 3,493 | 1 | US Airways Group, Inc. | 21,796 |
| | TOTAL | 97,709 |
| | Airline - Regional – 1.6% | |
| 2,594 | 1 | Alaska Air Group, Inc. | 158,545 |
| 1,773 | | SkyWest, Inc. | 22,801 |
| | TOTAL | 181,346 |
| | Aluminum – 0.2% | |
| 1,455 | 1 | Century Aluminum Co. | 18,944 |
| | Apparel – 0.7% | |
| 695 | | Oxford Industries, Inc. | 27,230 |
| 767 | 1 | Under Armour, Inc., Class A | 56,306 |
| | TOTAL | 83,536 |
| | Auto Original Equipment Manufacturers – 2.3% | |
| 6,742 | 1 | American Axle & Manufacturing Holdings, Inc. | 77,331 |
| 9,665 | 1 | Dana Holding Corp. | 161,116 |
| 1,248 | | Superior Industries International, Inc. | 25,259 |
| | TOTAL | 263,706 |
| | Auto Part Replacement – 0.7% | |
| 5,792 | | Standard Motor Products, Inc. | 82,246 |
| | Auto Rentals – 0.8% | |
| 948 | 1 | AMERCO | 85,453 |
| | Biotechnology – 1.7% | |
| 1,715 | 1 | Enzon, Inc. | 16,670 |
| 615 | 1 | Ista Pharmaceuticals, Inc. | 3,056 |
| 834 | 1 | Targacept, Inc. | 17,047 |
| 8,363 | 1 | ViroPharma, Inc. | 151,203 |
| | TOTAL | 187,976 |
Annual Shareholder Report14
| Shares | | | Value |
| | Business Services – 0.3% | |
| 823 | 1 | DG FastChannel, Inc. | 23,258 |
| 506 | 1 | Exlservice Holding, Inc. | 11,810 |
| | TOTAL | 35,068 |
| | Business Software & Services – 0.3% | |
| 2,525 | 1 | Convergys Corp. | 31,411 |
| | Carpets – 0.4% | |
| 4,860 | 1 | Culp, Inc. | 43,254 |
| | Cellular Communications – 0.1% | |
| 1,176 | 1 | TeleNav, Inc. | 11,795 |
| | Cement – 0.3% | |
| 827 | 1 | Astec Industries, Inc. | 31,029 |
| | Clothing Stores – 2.4% | |
| 2,764 | 1 | Aeropostale, Inc. | 46,573 |
| 3,841 | | Bebe Stores, Inc. | 28,462 |
| 1,347 | | Cato Corp., Class A | 37,474 |
| 7,302 | 1 | Charming Shoppes, Inc. | 29,938 |
| 1,546 | | Mens Wearhouse, Inc. | 50,693 |
| 5,170 | 1 | New York & Co. | 28,228 |
| 5,060 | | Stein Mart, Inc. | 48,070 |
| | TOTAL | 269,438 |
| | Cogeneration – 0.2% | |
| 1,085 | | Amtech Systems, Inc. | 19,476 |
| | Commodity Chemicals – 1.5% | |
| 3,352 | 1 | Georgia Gulf Corp. | 67,174 |
| 586 | | Newmarket Corp. | 96,116 |
| | TOTAL | 163,290 |
| | Computer Networking – 0.3% | |
| 5,074 | 1 | Cray, Inc. | 30,647 |
| | Computer Peripherals – 1.7% | |
| 10,954 | 1 | Imation Corp. | 91,137 |
| 4,364 | 1 | RadiSys Corp. | 34,650 |
| 1,703 | | Silicon Graphics, Inc. | 24,302 |
| 1,862 | 1 | Synaptics, Inc. | 45,750 |
| | TOTAL | 195,839 |
| | Computer Services – 0.3% | |
| 1,752 | 1 | Unisys Corp. | 36,389 |
Annual Shareholder Report15
| Shares | | | Value |
| | Computer Stores – 0.5% | |
| 1,809 | 1 | Insight Enterprises, Inc. | 30,445 |
| 2,808 | 1 | PC Connections, Inc. | 21,958 |
| | TOTAL | 52,403 |
| | Construction Machinery – 1.5% | |
| 1,825 | | NACCO Industries, Inc., Class A | 165,856 |
| | Cosmetics & Toiletries – 0.8% | |
| 2,380 | 1 | Revlon, Inc. | 40,079 |
| 849 | 1 | Ulta Salon Cosmetics & Fragrance, Inc. | 53,513 |
| | TOTAL | 93,592 |
| | Crude Oil & Gas Production – 3.4% | |
| 685 | 1 | Bill Barrett Corp. | 34,086 |
| 3,747 | 1 | CVR Energy, Inc. | 100,607 |
| 622 | 1 | Rosetta Resources, Inc. | 32,201 |
| 5,235 | 1 | Stone Energy Corp. | 169,928 |
| 1,881 | | W&T Offshore, Inc. | 50,975 |
| | TOTAL | 387,797 |
| | Defense Electronics – 0.6% | |
| 3,908 | | Miller Industries, Inc. | 64,013 |
| | Department Stores – 1.5% | |
| 3,014 | | Dillards, Inc., Class A | 169,568 |
| | Diversified Leisure – 0.4% | |
| 4,874 | 1 | Town Sports International Holdings, Inc. | 44,548 |
| | Education & Training Services – 1.3% | |
| 5,934 | 1 | Bridgepoint Education, Inc. | 146,926 |
| | Electric Utility – 0.1% | |
| 543 | | Avista Corp. | 13,689 |
| | Electrical Equipment – 1.9% | |
| 3,883 | 1 | Coleman Cable, Inc. | 51,178 |
| 1,613 | | Encore Wire Corp. | 35,502 |
| 3,811 | 1 | EnerSys, Inc. | 121,876 |
| | TOTAL | 208,556 |
| | Electronic Instruments – 1.3% | |
| 3,258 | 1 | FEI Co. | 107,644 |
| 1,378 | | SL Industries, Inc. | 33,568 |
| | TOTAL | 141,212 |
Annual Shareholder Report16
| Shares | | | Value |
| | Electronic Test/Measuring Equipment – 0.7% | |
| 381 | | MTS Systems Corp. | 15,015 |
| 3,383 | 1 | Multi-Fineline Electronix, Inc. | 68,709 |
| | TOTAL | 83,724 |
| | Electronics Stores – 0.0% | |
| 153 | 1 | Rex Stores Corp. | 2,636 |
| | Financial Services – 2.0% | |
| 8,597 | | Advance America Cash Advance, Inc. | 60,609 |
| 772 | 1 | America's Car-Mart, Inc. | 26,125 |
| 3,010 | | Deluxe Corp. | 70,855 |
| 119 | | Lakeland Financial Corp. | 2,683 |
| 3,477 | | Nelnet, Inc., Class A | 70,096 |
| | TOTAL | 230,368 |
| | Food Wholesaling – 0.2% | |
| 658 | | Nash Finch Co. | 23,556 |
| | Furniture – 1.6% | |
| 6,260 | 1 | Select Comfort Corp. | 105,293 |
| 1,117 | 1 | Tempur-Pedic International, Inc. | 80,435 |
| | TOTAL | 185,728 |
| | Generic Drugs – 1.8% | |
| 2,847 | 1 | Hi-Tech Pharmacal Co., Inc. | 80,542 |
| 1,309 | 1 | Jazz Pharmaceuticals, Inc. | 52,975 |
| 2,038 | 1 | Par Pharmaceutical Cos., Inc. | 66,011 |
| | TOTAL | 199,528 |
| | Greeting Cards – 1.1% | |
| 5,629 | | American Greetings Corp., Class A | 124,795 |
| | Health Care – 0.2% | |
| 996 | 1 | USANA, Inc. | 27,241 |
| | Home Health Care – 1.7% | |
| 1,747 | 1 | Amedisys, Inc. | 45,178 |
| 3,411 | 1 | Wellcare Health Plans, Inc. | 149,572 |
| | TOTAL | 194,750 |
| | Hotels and Motels – 1.3% | |
| 6,339 | | Ameristar Casinos, Inc. | 140,726 |
| | Industrial Machinery – 1.6% | |
| 5,768 | | Albany International Corp., Class A | 153,256 |
| 662 | | Twin Disc, Inc. | 25,156 |
| | TOTAL | 178,412 |
Annual Shareholder Report17
| Shares | | | Value |
| | Insurance Brokerage – 0.1% | |
| 654 | | AmTrust Financial Services, Inc. | 15,186 |
| | Internet Services – 0.8% | |
| 501 | 1 | Ancestry.com, Inc. | 17,841 |
| 1,327 | 1 | Travelzoo, Inc. | 70,065 |
| | TOTAL | 87,906 |
| | Jewelry Stores – 0.7% | |
| 5,150 | | Movado Group, Inc. | 83,327 |
| | Life Insurance – 1.6% | |
| 6,162 | | American Equity Investment Life Holding Co. | 73,143 |
| 3,133 | | Delphi Financial Group, Inc., Class A | 84,340 |
| 1,041 | | Primerica, Inc. | 22,507 |
| | TOTAL | 179,990 |
| | Long-Term Care Centers – 0.4% | |
| 4,918 | 1 | Sunrise Senior Living, Inc. | 43,377 |
| | Magazine Publishing – 0.8% | |
| 3,122 | | Meredith Corp. | 93,192 |
| | Mail Order – 0.5% | |
| 3,761 | 1 | Systemax, Inc. | 61,267 |
| | Maritime – 0.3% | |
| 844 | | Golar LNG Ltd. | 32,182 |
| | Metal Fabrication – 2.1% | |
| 939 | | Mueller Industries, Inc. | 35,241 |
| 2,776 | | NN, Inc. | 32,701 |
| 7,793 | | Worthington Industries, Inc. | 163,419 |
| | TOTAL | 231,361 |
| | Metals & Mining – 0.1% | |
| 664 | 1 | Horsehead Holding Corp. | 7,417 |
| | Miscellaneous Communications – 0.4% | |
| 4,615 | 1 | InfoSpace.com, Inc. | 43,981 |
| | Miscellaneous Components – 1.0% | |
| 2,555 | 1 | MKS Instruments, Inc. | 63,747 |
| 3,028 | 1 | Nanometrics, Inc. | 51,143 |
| | TOTAL | 114,890 |
| | Miscellaneous Food Products – 0.8% | |
| 3,020 | | Fresh Del Monte Produce, Inc. | 74,020 |
| 442 | | Imperial Sugar Co. | 10,201 |
| | TOTAL | 84,221 |
Annual Shareholder Report18
| Shares | | | Value |
| | Miscellaneous Machinery – 0.7% | |
| 1,056 | 1 | Colfax Corp. | 28,586 |
| 1,724 | | Curtiss Wright Corp. | 55,099 |
| | TOTAL | 83,685 |
| | Miscellaneous Metals – 0.3% | |
| 587 | | Haynes International, Inc. | 36,770 |
| | Multi-Industry Basic – 0.9% | |
| 3,482 | 1 | Graphic Packaging Holding Co. | 17,236 |
| 4,108 | | Olin Corp. | 85,898 |
| | TOTAL | 103,134 |
| | Multi-Industry Capital Goods – 1.4% | |
| 3,238 | 1 | Ceradyne, Inc. | 104,944 |
| 4,450 | 1 | Lydall, Inc. | 53,756 |
| | TOTAL | 158,700 |
| | Multi-Line Insurance – 2.2% | |
| 18,937 | 1 | CNO Financial Group, Inc. | 139,187 |
| 276 | | EMC Insurance Group, Inc. | 5,153 |
| 3,456 | | FBL Financial Group, Inc., Class A | 108,795 |
| | TOTAL | 253,135 |
| | Natural Gas Production – 0.5% | |
| 9,213 | 1 | VAALCO Energy, Inc. | 61,359 |
| | Offshore Driller – 0.4% | |
| 1,018 | | Bristow Group, Inc. | 49,353 |
| | Oil Refiner – 1.5% | |
| 3,748 | | Alon USA Energy, Inc. | 45,576 |
| 939 | | Delek US Holdings, Inc. | 15,606 |
| 5,316 | 1 | Western Refining, Inc. | 108,606 |
| | TOTAL | 169,788 |
| | Oil Service, Explore & Drill – 1.9% | |
| 2,027 | 1 | Basic Energy Services, Inc. | 65,655 |
| 2,340 | 1 | Complete Production Services, Inc. | 90,979 |
| 2,806 | 1 | Helix Energy Solutions Group, Inc. | 54,941 |
| | TOTAL | 211,575 |
| | Oil Well Supply – 1.0% | |
| 424 | | Carbo Ceramics, Inc. | 66,174 |
| 1,802 | | RPC, Inc. | 42,563 |
| | TOTAL | 108,737 |
| | Optical Reading Equipment – 0.3% | |
| 2,502 | 1 | Newport Corp. | 38,881 |
Annual Shareholder Report19
| Shares | | | Value |
| | Other Communications Equipment – 0.7% | |
| 2,324 | 1 | Netgear, Inc. | 76,483 |
| | Other Steel Producer – 0.4% | |
| 3,995 | 1 | Gibraltar Industries, Inc. | 41,069 |
| | Packaged Foods – 0.5% | |
| 4,242 | 1 | Dole Food Co., Inc. | 60,194 |
| | Paint & Related Materials – 0.3% | |
| 2,288 | 1 | Ferro Corp. | 29,790 |
| | Paper Products – 1.6% | |
| 6,935 | 1 | Boise, Inc. | 48,060 |
| 946 | | Buckeye Technologies, Inc. | 25,438 |
| 3,310 | 1 | Kadant, Inc. | 87,086 |
| 1,139 | | Neenah Paper, Inc. | 22,996 |
| | TOTAL | 183,580 |
| | Photo-Optical Component-Equipment – 2.1% | |
| 3,473 | 1 | II-VI, Inc. | 86,929 |
| 2,476 | 1 | IPG Photonics Corp. | 149,031 |
| | TOTAL | 235,960 |
| | Pollution Control – 0.1% | |
| 266 | 1 | Layne Christensen Co. | 7,796 |
| | Printed Circuit Boards – 0.7% | |
| 5,460 | 1 | Benchmark Electronics, Inc. | 79,989 |
| | Printing – 1.1% | |
| 4,563 | 1 | Valassis Communications, Inc. | 122,288 |
| | Property Liability Insurance – 4.2% | |
| 1,284 | 1 | Enstar Group Ltd. | 135,642 |
| 7,137 | | Horace Mann Educators Corp. | 103,915 |
| 8,819 | | Meadowbrook Insurance Group, Inc. | 82,898 |
| 1,829 | | National Interstate Corp. | 40,988 |
| 1,114 | 1 | ProAssurance Corp. | 77,590 |
| 218 | | RLI Corp. | 13,767 |
| 859 | | Selective Insurance Group, Inc. | 14,079 |
| | TOTAL | 468,879 |
| | Recreational Goods – 0.3% | |
| 1,287 | 1 | Steinway Musical Instruments | 37,310 |
| | Recreational Vehicles – 0.6% | |
| 602 | | Polaris Industries, Inc., Class A | 71,367 |
Annual Shareholder Report20
| Shares | | | Value |
| | Regional Banks – 2.1% | |
| 398 | | Alliance Financial Corp. | 12,820 |
| 3,768 | | Ameris Bancorp | 38,132 |
| 584 | | Enterprise Financial Services Corp. | 8,147 |
| 1,868 | | Financial Institutions, Inc. | 31,326 |
| 1,100 | | First Community Bancshares, Inc. | 13,849 |
| 4,346 | | First Merchants Corp. | 38,897 |
| 520 | | Home Bancshares, Inc. | 12,256 |
| 2,403 | | Republic Bancorp, Inc. | 43,518 |
| 378 | 1 | SVB Financial Group | 23,066 |
| 646 | | The First of Long Island Corp. | 17,164 |
| | TOTAL | 239,175 |
| | Rental & Leasing Services – 0.6% | |
| 2,599 | | Rent-A-Center, Inc. | 70,303 |
| | Restaurant – 1.6% | |
| 1,279 | | Cracker Barrel Old Country Store, Inc. | 57,696 |
| 430 | 1 | DineEquity, Inc. | 22,403 |
| 3,042 | 1 | Red Robin Gourmet Burgers | 104,705 |
| | TOTAL | 184,804 |
| | Rubber – 0.4% | |
| 2,338 | | Cooper Tire & Rubber Co. | 39,419 |
| | Savings & Loan – 1.4% | |
| 3,535 | | Banner Corp. | 65,468 |
| 1,446 | 1 | BofI Holding, Inc. | 20,237 |
| 5,124 | | Flushing Financial Corp. | 63,128 |
| 865 | | OceanFirst Financial Corp. | 11,634 |
| | TOTAL | 160,467 |
| | Securities Brokerage – 0.5% | |
| 3,913 | 1 | Interactive Brokers Group, Inc., Class A | 59,243 |
| | Semiconductor Distribution – 0.1% | |
| 1,307 | 1 | FormFactor, Inc. | 12,011 |
| | Semiconductor Manufacturing – 0.9% | |
| 622 | 1 | Monolithic Power Systems | 8,391 |
| 2,677 | | Richardson Electronics Ltd. | 39,700 |
| 3,553 | 1 | Rudolph Technologies, Inc. | 30,520 |
| 2,519 | 1 | Triquint Semiconductor, Inc. | 18,943 |
| | TOTAL | 97,554 |
Annual Shareholder Report21
| Shares | | | Value |
| | Semiconductor Manufacturing Equipment – 2.8% | |
| 2,719 | 1 | Advanced Energy Industries, Inc. | 28,848 |
| 7,591 | 1 | Entegris, Inc. | 65,055 |
| 5,648 | 1 | GT Solar International, Inc. | 77,039 |
| 3,649 | 1 | Kulicke & Soffa Industries | 33,571 |
| 578 | | LTX-Credence Corp. | 4,156 |
| 3,390 | 1 | Mentor Graphics Corp. | 38,748 |
| 665 | 1 | Ultratech, Inc. | 17,523 |
| 1,340 | 1 | Veeco Instruments, Inc. | 53,318 |
| | TOTAL | 318,258 |
| | Services to Medical Professionals – 0.3% | |
| 4,861 | 1 | BioScrip, Inc. | 34,902 |
| | Shoes – 0.3% | |
| 2,449 | 1 | Collective Brands, Inc. | 28,849 |
| | Silver Production – 0.2% | |
| 691 | 1 | Coeur d'Alene Mines Corp. | 18,857 |
| | Software Packaged/Custom – 1.9% | |
| 3,650 | 1 | Aspen Technology, Inc. | 56,575 |
| 7,657 | 1 | Electronics for Imaging, Inc. | 131,777 |
| 808 | 1 | Tibco Software, Inc. | 21,040 |
| | TOTAL | 209,392 |
| | Specialty Chemicals – 5.1% | |
| 1,423 | 1 | Kraton Performance Polymers, Inc. | 51,370 |
| 1,887 | 1 | LSB Industries, Inc. | 74,989 |
| 4,259 | 1 | OM Group, Inc. | 154,517 |
| 272 | 1 | Polypore International, Inc. | 18,496 |
| 2,797 | 1 | Rockwood Holdings, Inc. | 169,135 |
| 2,641 | 1 | TPC Group, Inc. | 106,036 |
| | TOTAL | 574,543 |
| | Specialty Machinery – 1.1% | |
| 2,407 | | Cascade Corp. | 120,326 |
| | Specialty Retailing – 0.9% | |
| 669 | 1 | Body Central Corp. | 14,376 |
| 2,606 | | Lithia Motors, Inc., Class A | 53,788 |
| 2,068 | | Natures Sunshine Products, Inc. | 34,515 |
| | TOTAL | 102,679 |
Annual Shareholder Report22
| Shares | | | Value |
| | Telecommunication Equipment & Services – 1.5% | |
| 2,616 | 1 | Anixter International, Inc. | 163,290 |
| 219 | 1 | Oplink Communications, Inc. | 3,697 |
| | TOTAL | 166,987 |
| | Telephone Utility – 0.4% | |
| 11,781 | 1 | Vonage Holdings Corp. | 47,242 |
| | Toys & Games – 0.8% | |
| 5,368 | 1 | JAKKS Pacific, Inc. | 93,672 |
| | TOTAL COMMON STOCKS
(IDENTIFIED COST $10,494,613) | 11,155,325 |
| | MUTUAL FUND – 1.0% | |
| 116,597 | 2,3 | Federated Prime Value Obligations Fund, Institutional Shares, 0.13%
(AT NET ASSET VALUE) | 116,597 |
| | TOTAL INVESTMENTS — 99.9%
(IDENTIFIED COST $10,611,210)4 | 11,271,922 |
| | OTHER ASSETS AND LIABILITIES - NET — 0.1%5 | 10,377 |
| | TOTAL NET ASSETS — 100% | $11,282,299 |
| 1 | Non-income producing security. |
| 2 | Affiliated company. |
| 3 | 7-Day net yield. |
| 4 | The cost of investments for federal tax purposes was $10,656,245. |
| 5 | Assets, other than investments in securities, less liabilities. See Statement of Assets and Liabilities. |
Note: The categories of investments are shown as a percentage of total net assets at July 31, 2011.
Various inputs are used in determining the value of the Fund's investments. These inputs are summarized in the three broad levels listed below:
Level 1 — quoted prices in active markets for identical securities, including investment companies with daily net asset values, if applicable.
Level 2 — other significant observable inputs (including quoted prices for similar securities, interest rates, prepayment speeds, credit risk, etc.). Also includes securities valued at amortized cost.
Level 3 �� significant unobservable inputs (including the Fund's own assumptions in determining the fair value of investments).
The inputs or methodology used for valuing securities are not an indication of the risk associated with investing in those securities.
As of July 31, 2011, all investments of the Fund utilized Level 1 inputs in valuing the Fund's assets carried at fair value.
See Notes which are an integral part of the Financial Statements
Annual Shareholder Report23
Statement of Assets and Liabilities
July 31, 2011
| Assets: | | |
| Total investments in securities, at value including $116,597 of investments in an affiliated holding (Note 5) (identified cost $10,611,210) | | $11,271,922 |
| Income receivable | | 1,001 |
| Receivable for investments sold | | 419,093 |
| Receivable for shares sold | | 19,668 |
| TOTAL ASSETS | | 11,711,684 |
| Liabilities: | | |
| Payable for investments purchased | $310,236 | |
| Payable for shares redeemed | 36,846 | |
| Payable for Directors'/Trustees' fees | 119 | |
| Payable for auditing fees | 22,500 | |
| Payable for distribution services fee (Note 5) | 2,007 | |
| Payable for shareholder services fee (Note 5) | 3,329 | |
| Payable for share registration costs | 33,415 | |
| Accrued expenses | 20,933 | |
| TOTAL LIABILITIES | | 429,385 |
| Net assets for 1,149,737 shares outstanding | | $11,282,299 |
| Net Assets Consist of: | | |
| Paid-in capital | | $22,403,613 |
| Net unrealized appreciation of investments | | 660,712 |
| Accumulated net realized loss on investments | | (11,782,026) |
| TOTAL NET ASSETS | | $11,282,299 |
| Net Asset Value, Offering Price and Redemption Proceeds Per Share | | |
| Class A Shares: | | |
Net asset value per share ($3,468,536 ÷ 351,205 shares outstanding),
no par value, unlimited shares authorized | | $9.88 |
| Offering price per share (100/94.50 of $9.88) | | $10.46 |
| Redemption proceeds per share | | $9.88 |
| Class C Shares: | | |
Net asset value per share ($2,978,059 ÷ 315,160 shares outstanding),
no par value, unlimited shares authorized | | $9.45 |
| Offering price per share | | $9.45 |
| Redemption proceeds per share (99.00/100 of $9.45) | | $9.36 |
| Institutional Shares: | | |
Net asset value per share ($4,835,704 ÷ 483,372 shares outstanding),
no par value, unlimited shares authorized | | $10.00 |
| Offering price per share | | $10.00 |
| Redemption proceeds per share | | $10.00 |
See Notes which are an integral part of the Financial Statements
Annual Shareholder Report24
Statement of Operations
Year Ended July 31, 2011
| Investment Income: | | | |
| Dividends (including $330 received from an affiliated holding (Note 5)) | | | $96,067 |
| Expenses: | | | |
| Investment adviser fee (Note 5) | | $138,645 | |
| Administrative fee (Note 5) | | 230,000 | |
| Custodian fees | | 16,608 | |
| Transfer and dividend disbursing agent fees and expenses | | 66,930 | |
| Directors'/Trustees' fees | | 2,166 | |
| Auditing fees | | 22,525 | |
| Legal fees | | 7,312 | |
| Portfolio accounting fees | | 68,093 | |
| Distribution services fee (Note 5) | | 23,750 | |
| Shareholder services fee (Note 5) | | 16,323 | |
| Share registration costs | | 45,682 | |
| Printing and postage | | 30,164 | |
| Insurance premiums | | 4,152 | |
| Miscellaneous | | 4,296 | |
| TOTAL EXPENSES | | 676,646 | |
| Waivers and Reimbursements (Note 5): | | | |
| Waiver/reimbursement of investment adviser fee | $(138,645) | | |
| Waiver of administrative fee | (44,880) | | |
| Reimbursement of other operating expenses | (271,710) | | |
| TOTAL WAIVERS AND REIMBURSEMENTS | | (455,235) | |
| Net expenses | | | 221,411 |
| Net investment income (loss) | | | (125,344) |
| Realized and Unrealized Gain (Loss) on Investments: | | | |
| Net realized gain on investments | | | 3,964,172 |
| Net change in unrealized appreciation of investments | | | (563,516) |
| Net realized and unrealized gain on investments | | | 3,400,656 |
| Change in net assets resulting from operations | | | $3,275,312 |
See Notes which are an integral part of the Financial Statements
Annual Shareholder Report25
Statement of Changes in Net Assets
| Year Ended July 31 | 2011 | 2010 |
| Increase (Decrease) in Net Assets | | |
| Operations: | | |
| Net investment income (loss) | $(125,344) | $(72,256) |
| Net realized gain on investments | 3,964,172 | 986,994 |
| Net change in unrealized appreciation/depreciation of investments | (563,516) | (201,554) |
| CHANGE IN NET ASSETS RESULTING FROM OPERATIONS | 3,275,312 | 713,184 |
| Share Transactions: | | |
| Proceeds from sale of shares | 1,967,566 | 3,144,064 |
| Proceeds from shares issued in connection with the tax-free transfer of assets from Federated MDT Small Cap Value Fund | — | 7,116,211 |
| Cost of shares redeemed | (6,130,287) | (5,140,601) |
| CHANGE IN NET ASSETS RESULTING FROM SHARE TRANSACTIONS | (4,162,721) | 5,119,674 |
| Change in net assets | (887,409) | 5,832,858 |
| Net Assets: | | |
| Beginning of period | 12,169,708 | 6,336,850 |
| End of period (including accumulated net investment income (loss) of $0 and $(3,987), respectively) | $11,282,299 | $12,169,708 |
See Notes which are an integral part of the Financial Statements
Annual Shareholder Report26
Notes to Financial Statements
July 31, 2011
1. ORGANIZATION
Federated MDT Series (the “Trust”) is registered under the Investment Company Act of 1940, as amended (the “Act”), as an open-end management investment company. The Trust consists of five portfolios. The financial statements included herein are only those of Federated MDT Small Cap Core Fund (the “Fund”), a diversified portfolio. The financial statements of the other portfolios are presented separately. The assets of each portfolio are segregated and a shareholder's interest is limited to the portfolio in which shares are held. Each portfolio pays its own expenses. The Fund offers three classes of shares: Class A Shares, Class C Shares and Institutional Shares. All shares of the Fund have equal rights with respect to voting, except on class-specific matters. The investment objective of the Fund is long-term capital appreciation.
On March 19, 2010, the Fund acquired all of the net assets of Federated MDT Small Cap Value Fund (the “Acquired Fund”), an open-end investment company in a tax-free reorganization in exchange for shares of the Fund, pursuant to a plan of reorganization approved by the Acquired Fund's shareholders on March 5, 2010. The purpose of the transaction was to combine two portfolios managed by Federated MDTA LLC with comparable investment objectives and strategies. For financial reporting purposes, assets received and shares issued by the Fund were recorded at fair value; however, the cost basis of the investments received from the Acquired Fund was carried forward to align ongoing reporting of the Fund's realized and unrealized gains and losses with amounts distributable to shareholders for tax purposes.
Assuming the acquisition had been completed on August 1, 2009, the beginning of the annual reporting period of the Fund, the Fund's pro forma results of operations for the year ended July 31, 2010, are as follows:
| Net investment income (loss) | $(105,218) |
| Net realized and unrealized gain on investments | $3,582,803 |
| Net increase in net assets resulting from operations | $3,477,585 |
Because the combined investment portfolios have been managed as a single integrated portfolio since the acquisition was completed, it is not practicable to separate the amounts of revenue and earnings of the Acquired Fund that has been included in the Fund's Statement of Operations since March 19, 2010. The Fund received net assets from the Acquired Fund as the result of the tax-free reorganization as follows:
Shares of the
Fund Issued | Acquired
Fund Net Assets
Received | Unrealized
Appreciation1 | Net Assets
of the Fund
Immediately
Prior to
Combination | Net Assets
of the Fund
Immediately
After
Combination |
| 926,935 | $7,116,211 | $939,977 | $6,665,919 | $13,782,130 |
| 1 | Unrealized Appreciation is included in the Acquired Fund Net Assets Received amount shown above. |
Annual Shareholder Report27
2. SIGNIFICANT ACCOUNTING POLICIES
The following is a summary of significant accounting policies consistently followed by the Fund in the preparation of its financial statements. These policies are in conformity with U.S. generally accepted accounting principles (GAAP).
Investment Valuation
In calculating its net asset value (NAV), the Fund generally values investments as follows:
- Equity securities listed on an exchange or traded through a regulated market system are valued at their last reported sale price or official closing price in their principal exchange or market.
- Shares of other mutual funds are valued based upon their reported NAVs.
- Fixed-income securities acquired with remaining maturities greater than 60 days are fair valued using price evaluations provided by a pricing service approved by the Fund's Board of Trustees (the “Trustees”).
- Fixed-income securities acquired with remaining maturities of 60 days or less are valued at their cost (adjusted for the accretion of any discount or amortization of any premium), which approximates market value.
- Derivative contracts listed on exchanges are valued at their reported settlement or closing price.
- Over-the-counter (OTC) derivative contracts are fair valued using price evaluations provided by a pricing service approved by the Trustees.
- For securities that are fair valued in accordance with procedures established by and under the general supervision of the Trustees, certain factors may be considered such as: the purchase price of the security, information obtained by contacting the issuer, analysis of the issuer's financial statements or other available documents, fundamental analytical data, the nature and duration of restrictions on disposition, the movement of the market in which the security is normally traded and public trading in similar securities of the issuer or comparable issuers.
If the Fund cannot obtain a price or price evaluation from a pricing service for an investment, the Fund may attempt to value the investment based upon the mean of bid and asked quotations or fair value the investment based on price evaluations, from one or more dealers. If any price, quotation, price evaluation or other pricing source is not readily available when the NAV is calculated, the Fund uses the fair value of the investment determined in accordance with the procedures described below. There can be no assurance that the Fund could purchase or sell an investment at the price used to calculate the Fund's NAV.
Fair Valuation and Significant Events Procedures
The Trustees have authorized the use of pricing services to provide evaluations of the current fair value of certain investments for purposes of calculating the NAV. Factors considered by pricing services in evaluating an investment include the yields or prices of investments of comparable quality, coupon, maturity, call rights and other potential prepayments, terms and type, reported transactions, indications as to values from dealers and general market conditions. Some pricing services provide a single price evaluation reflecting the bid-side of the market for an investment (a “bid” evaluation). Other pricing services offer both bid evaluations and price evaluations indicative of a price between the prices bid and asked for the investment (a “mid” evaluation). The Fund normally uses bid evaluations for U.S. Treasury and Agency securities, mortgage-backed securities and municipal securities. The Fund Annual Shareholder Report
28
normally uses mid evaluations for other types of fixed-income securities and OTC derivative contracts. In the event that market quotations and price evaluations are not available for an investment, the fair value of the investment is determined in accordance with procedures adopted by the Trustees.The Trustees also have adopted procedures requiring an investment to be priced at its fair value whenever the Adviser determines that a significant event affecting the value of the investment has occurred between the time as of which the price of the investment would otherwise be determined and the time as of which the NAV is computed. An event is considered significant if there is both an affirmative expectation that the investment's value will change in response to the event and a reasonable basis for quantifying the resulting change in value. Examples of significant events that may occur after the close of the principal market on which a security is traded or after the time of a price evaluation provided by a pricing service or a dealer, include:
- With respect to securities traded in foreign markets, significant trends in U.S. equity markets or in the trading of foreign securities index futures or options contracts;
- With respect to price evaluations of fixed-income securities determined before the close of regular trading on the NYSE, actions by the Federal Reserve Open Market Committee and other significant trends in U.S. fixed-income markets;
- Political or other developments affecting the economy or markets in which an issuer conducts its operations or its securities are traded; and
- Announcements concerning matters such as acquisitions, recapitalizations, litigation developments, a natural disaster affecting the issuer's operations or regulatory changes or market developments affecting the issuer's industry.
The Trustees have approved the use of a pricing service to determine the fair value of equity securities traded principally in foreign markets when the Adviser determines that there has been a significant trend in the U.S. equity markets or in index futures trading. For other significant events, the Fund may seek to obtain more current quotations or price evaluations from alternative pricing sources. If a reliable alternative pricing source is not available, the Fund will determine the fair value of the investment using another method approved by the Trustees.
Repurchase Agreements
The Fund may invest in repurchase agreements for short-term liquidity purposes. It is the policy of the Fund to require the other party to a repurchase agreement to transfer to the Fund's custodian or sub-custodian eligible securities or cash with a market value (after transaction costs) at least equal to the repurchase price to be paid under the repurchase agreement. The eligible securities are transferred to accounts with the custodian or sub-custodian in which the Fund holds a “securities entitlement” and exercises “control” as those terms are defined in the Uniform Commercial Code. The Fund has established procedures for monitoring the market value of the transferred securities and requiring the transfer of additional eligible securities if necessary to equal at least the repurchase price. These procedures also allow the other party to require securities to be transferred from the account to the extent that their market value exceeds the repurchase price or in exchange for other eligible securities of equivalent market value.
The insolvency of the other party or other failure to repurchase the securities may delay the disposition of the underlying securities or cause the Fund to receive less than the full repurchase price. Under the terms of the repurchase agreement, any amounts received by the Fund in excess of the repurchase price and related transaction costs must be remitted to the other party.
Annual Shareholder Report
29
The Fund may enter into repurchase agreements in which eligible securities are transferred into joint trading accounts maintained by the custodian or sub-custodian for investment companies and other clients advised by the Fund's Adviser and its affiliates. The Fund will participate on a pro rata basis with the other investment companies and clients in its share of the securities transferred under such repurchase agreements and in its share of proceeds from any repurchase or other disposition of such securities.Investment Income, Gains and Losses, Expenses and Distributions
Investment transactions are accounted for on a trade-date basis. Realized gains and losses from investment transactions are recorded on an identified-cost basis. Interest income and expenses are accrued daily. Dividend income and distributions to shareholders are recorded on the ex-dividend date. Foreign dividends are recorded on the ex-dividend date or when the Fund is informed of the ex-dividend date. Distributions of net investment income, if any, are declared and paid annually. Non-cash dividends included in dividend income, if any, are recorded at fair value. Investment income, realized gains and losses, and certain fund-level expenses are allocated to each class based on relative average daily net assets, except that Class A Shares, Class C Shares and Institutional Shares may bear distribution services fees and shareholder services fees unique to those classes. Dividends are declared separately for each class. No class has preferential dividend rights; differences in per share dividend rates are generally due to differences in separate class expenses.
Premium and Discount Amortization
All premiums and discounts on fixed-income securities are amortized/accreted using the effective interest rate method.
Federal Taxes
It is the Fund's policy to comply with the Subchapter M provision of the Internal Revenue Code (the “Code”) and to distribute to shareholders each year substantially all of its income. Accordingly, no provision for federal income tax is necessary. As of and during the year ended July 31, 2011, the Fund did not have a liability for any uncertain tax positions. The Fund recognizes interest and penalties, if any, related to tax liabilities as income tax expense in the Statement of Operations. As of July 31, 2011, tax years 2008 through 2011 remain subject to examination by the Fund's major tax jurisdictions, which include the United States of America and the Commonwealth of Massachusetts.
The Fund may be subject to taxes imposed by governments of countries in which it invests. Such taxes are generally based on either income or gains earned or repatriated. The Fund accrues and applies such taxes to net investment income, net realized gains and net unrealized gains as income and/or gains are earned.
When-Issued and Delayed Delivery Transactions
The Fund may engage in when-issued or delayed delivery transactions. The Fund records when-issued securities on the trade date and maintains security positions such that sufficient liquid assets will be available to make payment for the securities purchased. Securities purchased on a when-issued or delayed delivery basis are marked to market daily and begin earning interest on the settlement date. Losses may occur on these transactions due to changes in market conditions or the failure of counterparties to perform under the contract.
Annual Shareholder Report
30
OtherThe preparation of financial statements in conformity with GAAP requires management to make estimates and assumptions that affect the amounts of assets, liabilities, expenses and revenues reported in the financial statements. Actual results could differ from those estimated.
3. SHARES OF BENEFICIAL INTEREST
The following tables summarize share activity:
| Year Ended July 31 | 2011 | 2010 |
| Class A Shares: | Shares | Amount | Shares | Amount |
| Shares sold | 94,156 | $934,802 | 105,402 | $776,141 |
Proceeds from shares issued in connection with
the tax-free transfer of assets from Federated
MDT Small Cap Value Fund | — | — | 246,717 | 1,912,141 |
| Shares redeemed | (164,528) | (1,482,746) | (181,648) | (1,368,024) |
NET CHANGE RESULTING FROM
CLASS A SHARE TRANSACTIONS | (70,372) | $(547,944) | 170,471 | $1,320,258 |
| Year Ended July 31 | 2011 | 2010 |
| Class C Shares: | Shares | Amount | Shares | Amount |
| Shares sold | 34,730 | $323,061 | 62,891 | $431,962 |
Proceeds from shares issued in connection with
the tax-free transfer of assets from Federated
MDT Small Cap Value Fund | — | — | 349,550 | 2,618,217 |
| Shares redeemed | (167,010) | (1,449,906) | (178,711) | (1,283,216) |
NET CHANGE RESULTING FROM
CLASS C SHARE TRANSACTIONS | (132,280) | $(1,126,845) | 233,730 | $1,766,963 |
| Year Ended July 31 | 2011 | 2010 |
| Institutional Shares: | Shares | Amount | Shares | Amount |
| Shares sold | 70,439 | $709,703 | 266,476 | $1,935,961 |
Proceeds from shares issued in connection with
the tax-free transfer of assets from Federated
MDT Small Cap Value Fund | — | — | 330,668 | 2,585,853 |
| Shares redeemed | (337,454) | (3,197,635) | (347,032) | (2,489,361) |
NET CHANGE RESULTING FROM
INSTITUTIONAL SHARE TRANSACTIONS | (267,015) | $(2,487,932) | 250,112 | $2,032,453 |
NET CHANGE RESULTING FROM
TOTAL FUND SHARE TRANSACTIONS | (469,667) | $(4,162,721) | 654,313 | $5,119,674 |
4. FEDERAL TAX INFORMATION
The timing and character of income and capital gain distributions are determined in accordance with income tax regulations, which may differ from GAAP. These differences are due to differing treatments for net operating loss and gain on final sale of passive foreign investment companies.
Annual Shareholder Report
31
For the year ended July 31, 2011, permanent differences identified and reclassified among the components of net assets were as follows:| Increase (Decrease) |
| Paid-In Capital | Undistributed
Net Investment
Income (Loss) | Accumulated
Net Realized
Gain (Loss) |
| $(121,848) | $129,331 | $(7,483) |
Net investment income (loss), net realized gains (losses), and net assets were not affected by this reclassification.
As of July 31, 2011, the components of distributable earnings on a tax basis were as follows:
| Net unrealized appreciation | $615,677 |
| Capital loss carryforwards | $(11,736,991) |
The difference between book-basis and tax-basis net unrealized appreciation/depreciation is attributable to differing treatments for the deferral of losses on wash sales.
At July 31, 2011, the cost of investments for federal tax purposes was $10,656,245. The net unrealized appreciation of investments for federal tax purposes was $615,677. This consists of net unrealized appreciation from investments for those securities having an excess of value over cost of $1,141,706 and net unrealized depreciation from investments for those securities having an excess of cost over value of $526,029.
At July 31, 2011, the Fund had a capital loss carryforward of $11,736,991 which will reduce the Fund's taxable income arising from future net realized gains on investments, if any, to the extent permitted by the Code and thus will reduce the amount of distributions to shareholders which would otherwise be necessary to relieve the Fund of any liability for federal income tax. Pursuant to the Code, such capital loss carryforward will expire as follows:
| Expiration Year | Expiration Amount |
| 2016 | $504,080 |
| 2017 | $6,139,530 |
| 2018 | $5,093,381 |
Under the recently enacted Regulated Investment Company Modernization Act of 2010, the Fund will be permitted to carry forward capital losses incurred in taxable years beginning after December 22, 2010, for an unlimited period. However, any losses incurred during those future years will be required to be utilized prior to the losses incurred in pre-enactment tax years. As a result of this ordering rule, pre-enactment capital loss carryforwards may be more likely to expire unused. Additionally, post-enactment capital losses that are carried forward will retain their character as either short-term or long-term capital losses rather than being considered all short-term as under previous law.
As a result of the tax-free transfer of assets from Federated MDT Small Cap Value Fund, the use of certain capital loss carryforwards listed above may be limited.
The Fund used capital loss carryforwards of $3,955,276 to offset taxable capital gains realized during the year ended July 31, 2011.
Annual Shareholder Report
32
5. INVESTMENT ADVISER FEE AND OTHER TRANSACTIONS WITH AFFILIATESInvestment Adviser Fee
Federated MDTA LLC is the Fund's investment adviser (the “Adviser”). The advisory agreement between the Fund and the Adviser provides for an annual fee equal to 1.15% of the Fund's average daily net assets. Subject to the terms described in the Expense Limitation note, the Adviser may voluntarily choose to waive any portion of its fee and/or reimburse certain operating expenses of the Fund. For the year ended July 31, 2011, the Adviser voluntarily waived $138,449 of its fee and voluntarily reimbursed $271,710 of other operating expenses.
Administrative Fee
Federated Administrative Services (FAS), under the Administrative Services Agreement, provides the Fund with administrative personnel and services. The fee paid to FAS is based on the average aggregate daily net assets of certain Federated funds as specified below:
| Administrative Fee | Average Aggregate Daily Net Assets
of the Federated Funds |
| 0.150% | on the first $5 billion |
| 0.125% | on the next $5 billion |
| 0.100% | on the next $10 billion |
| 0.075% | on assets in excess of $20 billion |
The administrative fee received during any fiscal year shall be at least $150,000 per portfolio and $40,000 per each additional class of Shares. Subject to the terms described in the Expense Limitation note, FAS may voluntarily choose to waive any portion of its fee. For the year ended July 31, 2011, FAS waived $44,880 of its fee. The net fee paid to FAS was 1.535% of average daily net assets of the Fund. The Fund is currently being charged the minimum administrative fee; therefore the fee as a percentage of average daily net assets is greater than the amounts presented in the chart above.
Distribution Services Fee
The Fund has adopted a Distribution Plan (the “Plan”) pursuant to Rule 12b-1 under the Act. Under the terms of the Plan, the Fund will compensate Federated Securities Corp. (FSC), the principal distributor, from the daily net assets of the Fund's Class A Shares and Class C Shares to finance activities intended to result in the sale of these shares. The Plan provides that the Fund may incur distribution expenses at the following percentages of average daily net assets annually, to compensate FSC:
| Share Class Name | Percentage of Average Daily
Net Assets of Class |
| Class A Shares | 0.05% |
| Class C Shares | 0.75% |
Annual Shareholder Report
33
Subject to the terms described in the Expense Limitation note, FSC may voluntarily choose to waive any portion of its fee. For the year ended July 31, 2011, distribution services fees for the Fund were as follows: | Distribution Services
Fees Incurred |
| Class C Shares | $23,750 |
When FSC receives fees, it may pay some or all of them to financial intermediaries whose customers purchase shares. For the year ended July 31, 2011, FSC retained $755 of fees paid by the Fund. For the year ended July 31, 2011, the Fund's Class A Shares did not incur a distribution services fee; however, it may begin to incur this fee upon approval of the Trustees.
Sales Charges
Front-end sales charges and contingent deferred sales charges (CDSC) do not represent expenses of the Fund. They are deducted from the proceeds of sales of Fund shares prior to investment or from redemption proceeds prior to remittance, as applicable. For the year ended July 31, 2011, FSC retained $1,530 in sales charges from the sale of Class A Shares. FSC also retained $81 of CDSC relating to redemptions of Class C Shares.
Shareholder Services Fee
The Fund may pay fees (“Service Fees”) up to 0.25% of the average daily net assets of the Fund's Class A Shares and Class C Shares to financial intermediaries or to Federated Shareholder Services Company (FSSC) for providing services to shareholders and maintaining shareholder accounts. Subject to the terms described in the Expense Limitation note, FSSC may voluntarily reimburse the Fund for Service Fees. For the year ended July 31, 2011, Service Fees for the Fund were as follows:
| Service Fees
Incurred |
| Class A Shares | $8,406 |
| Class C Shares | 7,917 |
| TOTAL | $16,323 |
For the year ended July 31, 2011, FSSC received $192 of fees paid by the Fund.
Expense Limitation
Effective October 1, 2011, the Adviser and its affiliates (which may include FSC, FAS and FSSC) have voluntarily agreed to waive their fees and/or reimburse expenses so that the total annual fund operating expenses (as shown in the financial highlights) paid by the Fund's Class A Shares, Class C Shares and Institutional Shares (after the voluntary waivers and reimbursements) will not exceed 1.70%, 2.45% and 1.45% (the “Fee Limit”), respectively, up to but not including the later of (the “Termination Date”): (a) October 1, 2012; or (b) the date of the Fund's next effective Prospectus. While the Adviser and its affiliates currently do not anticipate terminating or increasing these arrangements prior to the Termination Date, these arrangements may only be terminated or the Fee Limit increased prior to the Termination Date with the agreement of the Trustees.
Annual Shareholder Report
34
General
Certain Officers and Trustees of the Trust are Officers and Directors or Trustees of the above companies.
Transactions Involving Affiliated Holdings
Affiliated holdings are mutual funds which are managed by the Adviser or an affiliate of the Adviser. The Adviser has agreed to reimburse the Fund for certain investment adviser fees as a result of transactions in other affiliated mutual funds. For the year ended July 31, 2011, the Adviser reimbursed $196. Transactions involving the affiliated holding during the year ended July 31, 2011, were as follows:
| Federated Prime Value
Obligations Fund,
Institutional Shares |
| Balance of Shares Held 7/31/2010 | 258,202 |
| Purchases/Additions | 3,997,659 |
| Sales/Reductions | 4,139,264 |
| Balance of Shares Held 7/31/2011 | 116,597 |
| Value | $116,597 |
| Dividend Income | $330 |
6. Investment TRANSACTIONS
Purchases and sales of investments, excluding long-term U.S. government securities and short-term obligations for the year ended July 31, 2011, were as follows:
| Purchases | $24,890,423 |
| Sales | $29,110,655 |
7. LINE OF CREDIT
The Fund participates in a $100,000,000 unsecured, uncommitted revolving line of credit (LOC) agreement with PNC Bank. The LOC was made available for extraordinary or emergency purposes, primarily for financing redemption payments. Borrowings are charged interest at a rate offered to the Fund by PNC Bank at the time of the borrowing. As of July 31, 2011, there were no outstanding loans. During the year ended July 31, 2011, the Fund did not utilize the LOC.
8. INTERFUND LENDING
Pursuant to an Exemptive Order issued by the Securities and Exchange Commission, the Fund, along with other funds advised by subsidiaries of Federated Investors, Inc., may participate in an interfund lending program. This program provides an alternative credit facility allowing the Fund to borrow from other participating affiliated funds. As of July 31, 2011, there were no outstanding loans. During the year ended July 31, 2011, the program was not utilized.
Annual Shareholder Report
35
9. RECENT ACCOUNTING PRONOUNCEMENTSIn April 2011, the Financial Accounting Standards Board (FASB) released Accounting Standards Update (ASU) No. 2011-03, “Reconsideration of Effective Control for Repurchase Agreements.” This ASU amends FASB Accounting Standards Codification (ASC) Topic 860, “Transfers and Servicing”; specifically the criteria required to determine whether a repurchase agreement and similar agreements should be accounted for as sales of financial assets or secured borrowings with commitments. This ASU is effective for fiscal years and interim periods beginning after December 15, 2011. At this time, management is evaluating the implications of adopting ASU No. 2011-03 and its impact on the Fund's financial statements and the accompanying notes.
In addition, in May 2011, FASB released ASU No. 2011-04, “Amendments to Achieve Common Fair Value Measurement and Disclosure Requirements in U.S. GAAP and IFRSs.” This ASU amends FASB ASC Topic 820, “Fair Value Measurement,” to establish common requirements for measuring fair value and for disclosing information about fair value measurements in accordance with GAAP. This ASU is effective for fiscal years and interim periods beginning after December 15, 2011. At this time, management is evaluating the implications of adopting ASU No. 2011-04 and its impact on the Fund's financial statements and the accompanying notes.
Annual Shareholder Report36
Report of Independent Registered Public Accounting Firm
TO THE BOARD OF trustees OF Federated MDt series AND SHAREHOLDERS OF federated mdt Small cap core fund:
We have audited the accompanying statement of assets and liabilities of Federated MDT Small Cap Core Fund (the “Fund”) (one of the portfolios constituting Federated MDT Series), including the portfolio of investments, as of July 31, 2011, and the related statement of operations for the year then ended, the statement of changes in net assets for each of the two years in the period then ended, and the financial highlights for each of the periods indicated therein. These financial statements and financial highlights are the responsibility of the Fund's management. Our responsibility is to express an opinion on these financial statements and financial highlights based on our audits.
We conducted our audits in accordance with standards of the Public Company Accounting Oversight Board (United States). Those standards require that we plan and perform the audit to obtain reasonable assurance about whether the financial statements and financial highlights are free of material misstatement. We were not engaged to perform an audit of the Fund's internal control over financial reporting. Our audits included consideration of internal control over financial reporting as a basis for designing audit procedures that are appropriate in the circumstances, but not for the purpose of expressing an opinion on the effectiveness of the Fund's internal control over financial reporting. Accordingly, we express no such opinion. An audit also includes examining, on a test basis, evidence supporting the amounts and disclosures in the financial statements and financial highlights, assessing the accounting principles used and significant estimates made by management, and evaluating the overall financial statement presentation. Our procedures included confirmation of securities owned as of July 31, 2011, by correspondence with the custodian and others or by other appropriate auditing procedures where replies from others were not received. We believe that our audits provide a reasonable basis for our opinion.
In our opinion, the financial statements and financial highlights referred to above present fairly, in all material respects, the financial position of Federated MDT Small Cap Core Fund, a portfolio of Federated MDT Series, at July 31, 2011, the results of its operations for the year then ended, the changes in its net assets for each of the two years in the period then ended, and the financial highlights for the periods indicated therein, in conformity with U.S. generally accepted accounting principles.
Boston, Massachusetts
September 23, 2011
Annual Shareholder Report37
Board of Trustees and Trust Officers
The Board of Trustees is responsible for managing the Trust's business affairs and for exercising all the Trust's powers except those reserved for the shareholders. The following tables give information about each Trustee and the senior officers of the Fund. Where required, the tables separately list Trustees who are “interested persons” of the Fund (i.e., “Interested” Trustees) and those who are not (i.e., “Independent” Trustees). Unless otherwise noted, the address of each person listed is Federated Investors Tower, 1001 Liberty Avenue, Pittsburgh, PA 15222. The address of all Independent Trustees listed is 4000 Ericsson Drive, Warrendale, PA 15086-7561; Attention: Mutual Fund Board. As of December 31, 2010, the Trust comprised five portfolio(s), and the Federated Fund Family consisted of 43 investment companies (comprising 136 portfolios). Unless otherwise noted, each Officer is elected annually. Unless otherwise noted, each Trustee oversees all portfolios in the Federated Fund Family and serves for an indefinite term. The Fund's Statement of Additional Information includes additional information about Trust Trustees and is available, without charge and upon request, by calling 1-800-341-7400.
Interested TRUSTEES Background
Name
Birth Date
Positions Held with Trust
Date Service Began | Principal Occupation(s) for Past Five Years,
Other Directorships Held and Previous Position(s) |
John F. Donahue*
Birth Date: July 28, 1924
Trustee
Began serving: June 2006 | Principal Occupations: Director or Trustee of the Federated Fund Family; Chairman and Director, Federated Investors, Inc.; Chairman of the Federated Fund Family's Executive Committee.
Previous Positions: Chairman of the Federated Fund Family; Trustee, Federated Investment Management Company; Chairman and Director, Federated Investment Counseling. |
J. Christopher Donahue*
Birth Date: April 11, 1949
President and Trustee
Began serving: May 2006 | Principal Occupations: Principal Executive Officer and President of the Federated Fund Family; Director or Trustee of some of the Funds in the Federated Fund Family; President, Chief Executive Officer and Director, Federated Investors, Inc.; Chairman and Trustee, Federated Investment Management Company; Trustee, Federated Investment Counseling; Chairman and Director, Federated Global Investment Management Corp.; Chairman, Federated Equity Management Company of Pennsylvania and Passport Research, Ltd. (investment advisory subsidiary of Federated); Trustee, Federated Shareholder Services Company; Director, Federated Services Company.
Previous Positions: President, Federated Investment Counseling; President and Chief Executive Officer, Federated Investment Management Company, Federated Global Investment Management Corp. and Passport Research, Ltd. |
| * | Family relationships and reasons for “interested” status: John F. Donahue is the father of J. Christopher Donahue; both are “interested” due to their beneficial ownership of shares of Federated Investors, Inc. and the positions they hold with Federated and its subsidiaries. |
Annual Shareholder Report38
INDEPENDENT TRUSTEES Background
Name
Birth Date
Positions Held with Trust
Date Service Began | Principal Occupation(s) for Past Five Years,
Other Directorships Held, Previous Position(s) and Qualifications |
Nicholas P. Constantakis, CPA
Birth Date: September 3, 1939
Trustee
Began serving: June 2006 | Principal Occupation: Director or Trustee of the Federated Fund Family.
Other Directorship Held: Director and Chairman of the Audit Committee, Michael Baker Corporation (architecture, engineering and construction services).
Previous Position: Partner, Andersen Worldwide SC.
Qualifications: Public accounting and director experience. |
John F. Cunningham
Birth Date: March 5, 1943
Trustee
Began serving: June 2006 | Principal Occupation: Director or Trustee of the Federated Fund Family.
Other Directorships Held: Chairman, President and Chief Executive Officer, Cunningham & Co., Inc. (strategic business consulting); Trustee Associate, Boston College.
Previous Positions: Director, Redgate Communications and EMC Corporation (computer storage systems); Chairman of the Board and Chief Executive Officer, Computer Consoles, Inc.; President and Chief Operating Officer, Wang Laboratories; Director, First National Bank of Boston; Director, Apollo Computer, Inc.
Qualifications: Business management and director experience. |
Maureen Lally-Green
Birth Date: July 5, 1949
Trustee
Began serving: August 2009 | Principal Occupations: Director or Trustee of the Federated Fund Family; Director, Office of Church Relations, Diocese of Pittsburgh; Adjunct Professor of Law, Duquesne University School of Law.
Other Directorships Held: Director, Auberle; Trustee, St. Francis University; Director, Ireland Institute of Pittsburgh; Director, UPMC Mercy Hospital; Regent, St. Vincent Seminary; Director, Epilepsy Foundation of Western and Central Pennsylvania; Director, Saint Thomas More Society, Allegheny County; Director, Carlow University.
Previous Position: Pennsylvania Superior Court Judge.
Qualifications: Legal and director experience. |
Peter E. Madden
Birth Date: March 16, 1942
Trustee
Began serving: June 2006 | Principal Occupation: Director or Trustee, and Chairman of the Board of Directors or Trustees, of the Federated Fund Family.
Previous Positions: Representative, Commonwealth of Massachusetts General Court; President, Chief Operating Officer and Director, State Street Bank and Trust Company and State Street Corporation (retired); Director, VISA USA and VISA International; Chairman and Director, Massachusetts Bankers Association; Director, Depository Trust Corporation; Director, The Boston Stock Exchange.
Qualifications: Business management, mutual fund services and director experience. |
Annual Shareholder Report39
Name
Birth Date
Positions Held with Trust
Date Service Began | Principal Occupation(s) for Past Five Years,
Other Directorships Held, Previous Position(s) and Qualifications |
Charles F. Mansfield, Jr.
Birth Date: April 10, 1945
Trustee
Began serving: June 2006 | Principal Occupations: Director or Trustee and Chairman of the Audit Committee of the Federated Fund Family; Management Consultant.
Previous Positions: Chief Executive Officer, PBTC International Bank; Partner, Arthur Young & Company (now Ernst & Young LLP); Chief Financial Officer of Retail Banking Sector, Chase Manhattan Bank; Senior Vice President, HSBC Bank USA (formerly, Marine Midland Bank); Vice President, Citibank; Assistant Professor of Banking and Finance, Frank G. Zarb School of Business, Hofstra University; Executive Vice President, DVC Group, Inc. (marketing, communications and technology).
Qualifications: Banking, business management, education and director experience. |
R. James Nicholson
Birth Date: February 4, 1938
Trustee
Began serving: January 2008 | Principal Occupations: Director or Trustee of the Federated Fund Family; Senior Counsel, Brownstein Hyatt Farber Schrek, P.C.; Former Secretary of the U.S. Dept. of Veterans Affairs; Former U.S. Ambassador to the Holy See; Former Chairman of the Republican National Committee.
Other Directorships Held: Director, Horatio Alger Association; Director, The Daniels Fund.
Previous Positions: Colonel, U.S. Army Reserve; Partner, Calkins, Kramer, Grimshaw and Harring, P.C.; General Counsel, Colorado Association of Housing and Building; Chairman and CEO, Nicholson Enterprises, Inc. (real estate holding company); Chairman and CEO, Renaissance Homes of Colorado.
Qualifications: Legal, government, business management and director experience. |
Thomas M. O'Neill
Birth Date: June 14, 1951
Trustee
Began serving: October 2006 | Principal Occupations: Director or Trustee of the Federated Fund Family; Sole Proprietor, Navigator Management Company (investment and strategic consulting).
Other Directorships Held: Board of Overseers, Children's Hospital of Boston; Visiting Committee on Athletics, Harvard College.
Previous Positions: Chief Executive Officer and President, Managing Director and Chief Investment Officer, Fleet Investment Advisors; President and Chief Executive Officer, Aeltus Investment Management, Inc.; General Partner, Hellman, Jordan Management Co., Boston, MA; Chief Investment Officer, The Putnam Companies, Boston, MA; Credit Analyst and Lending Officer, Fleet Bank; Director and Consultant, EZE Castle Software (investment order management software); Director, Midway Pacific (lumber).
Qualifications: Business management, mutual fund, director and investment experience. |
Annual Shareholder Report40
Name
Birth Date
Positions Held with Trust
Date Service Began | Principal Occupation(s) for Past Five Years,
Other Directorships Held, Previous Position(s) and Qualifications |
John S. Walsh
Birth Date: November 28, 1957
Trustee
Began serving: June 2006 | Principal Occupations: Director or Trustee of the Federated Fund Family; President and Director, Heat Wagon, Inc. (manufacturer of construction temporary heaters); President and Director, Manufacturers Products, Inc. (distributor of portable construction heaters); President, Portable Heater Parts, a division of Manufacturers Products, Inc.
Previous Position: Vice President, Walsh & Kelly, Inc.
Qualifications: Business management and director experience. |
James F. Will
Birth Date: October 12, 1938
Trustee
Began serving: June 2006 | Principal Occupations: Director or Trustee of the Federated Fund Family; formerly, Vice Chancellor and President, Saint Vincent College.
Other Directorships Held: Trustee, Saint Vincent College; Director, Alleghany Corporation; Trustee, Wheeling Jesuit University; Director, Liberty Tire Recycling.
Previous Positions: Chairman, President and Chief Executive Officer, Armco, Inc.; President and Chief Executive Officer, Cyclops Industries; President and Chief Operating Officer, Kaiser Steel Corporation.
Qualifications: Business management, education and director experience. |
OFFICERS
Name
Birth Date
Positions Held with Trust
Date Service Began | Principal Occupation(s) for Past Five Years
and Previous Position(s) |
John W. McGonigle
Birth Date: October 26, 1938
Secretary
Began serving: May 2006 | Principal Occupations: Executive Vice President and Secretary of the Federated Fund Family; Vice Chairman, Executive Vice President, Secretary and Director, Federated Investors, Inc.
Previous Positions: Trustee, Federated Investment Management Company and Federated Investment Counseling; Director, Federated Global Investment Management Corp., Federated Services Company and Federated Securities Corp. |
Richard A. Novak
Birth Date: December 25, 1963
Treasurer
Began serving: May 2006 | Principal Occupations: Principal Financial Officer and Treasurer of the Federated Fund Family; Senior Vice President, Federated Administrative Services; Financial and Operations Principal for Federated Securities Corp., Edgewood Services, Inc. and Southpointe Distribution Services, Inc.
Previous Positions: Controller of Federated Investors, Inc.; Vice President, Finance of Federated Services Company; held various financial management positions within The Mercy Hospital of Pittsburgh; Auditor, Arthur Andersen & Co. |
Brian P. Bouda
Birth Date: February 28, 1947
CHIEF COMPLIANCE OFFICER AND SENIOR VICE PRESIDENT
Began serving: June 2006 | Principal Occupations: Senior Vice President and Chief Compliance Officer of the Federated Fund Family; Vice President and Chief Compliance Officer of Federated Investors, Inc. and Chief Compliance Officer of its subsidiaries. Mr. Bouda joined Federated in 1999 and is a member of the American Bar Association and the State Bar Association of Wisconsin. |
Annual Shareholder Report41
Evaluation and Approval of Advisory Contract – May 2011
federated mdt small cap core fund (the “Fund”)
The Fund's Board reviewed the Fund's investment advisory contract at meetings held in May 2011. The Board's decision regarding the contract reflects the exercise of its business judgment on whether to continue the existing arrangements.
In this connection, the Federated Funds' Board had previously appointed a Senior Officer, whose duties include specified responsibilities relating to the process by which advisory fees are to be charged to a Federated fund. The Senior Officer has the authority to retain consultants, experts, or staff as may be reasonably necessary to assist in the performance of his duties, reports directly to the Board, and may be terminated only with the approval of a majority of the independent members of the Board. The Senior Officer prepared and furnished to the Board an independent, written evaluation that covered topics discussed below (the “Evaluation”). The Board considered that Evaluation, along with other information, in deciding to approve the advisory contract.
During its review of the contract, the Board considered compensation and benefits received by the Adviser. This included the fees received for services provided to the Fund by other entities in the Federated organization and research services (if any) received by the Adviser from brokers that execute Federated fund trades, as well as advisory fees. The Board is also familiar with and considered judicial decisions concerning allegedly excessive investment advisory fees, which have indicated that the following factors may be relevant to an Adviser's fiduciary duty with respect to its receipt of compensation from a fund: the nature and quality of the services provided by the Adviser, including the performance of the fund; the Adviser's cost of providing the services; the extent to which the Adviser may realize “economies of scale” as a fund grows larger; any indirect benefits that may accrue to the Adviser and its affiliates as a result of the Adviser's relationship with a fund; performance and expenses of comparable funds; and the extent to which the independent Board members are fully informed about all facts the Board deems relevant bearing on the Adviser's services and fees. The Board further considered management fees (including any components thereof) charged to institutional and other clients of the Adviser for what might be viewed as like services, and the cost to the Adviser and its affiliates of supplying services pursuant to the management fee agreements, excluding any intra-corporate profit and profit margins of the Adviser and its affiliates for supplying such services. The Board was aware of these factors and was guided by them in its review of the Fund's advisory contract to the extent it considered them to be appropriate and relevant, as discussed further below.
Annual Shareholder Report
42
The Board considered and weighed these circumstances in light of its substantial accumulated experience in governing the Fund and working with Federated on matters relating to the Federated funds, and was assisted in its deliberations by independent legal counsel. Throughout the year, the Board has requested and received substantial and detailed information about the Fund and the Federated organization that was in addition to the extensive materials that comprise and accompany the Senior Officer's Evaluation. Federated provided much of this information at each regular meeting of the Board, and furnished additional information in connection with the particular meeting at which the Board's formal review of the advisory contract occurred. Between regularly scheduled meetings, the Board also received information on particular matters as the need arose. Thus, the Board's consideration of the advisory contract included review of the Senior Officer's Evaluation, accompanying data and additional information covering such matters as: the Adviser's investment philosophy, revenue, profitability, personnel and processes; investment and operating strategies; the Fund's short- and long-term performance (in absolute terms, both on a gross basis and net of expenses, as well as in relationship to its particular investment program and certain competitor or “peer group” funds and/or other benchmarks, as appropriate), and comments on the reasons for performance; the Fund's investment objectives; the Fund's expenses (including the advisory fee itself and the overall expense structure of the Fund, both in absolute terms and relative to similar and/or competing funds, with due regard for contractual or voluntary expense limitations); the use and allocation of brokerage commissions derived from trading the Fund's portfolio securities (if any); and the nature, quality and extent of the advisory and other services provided to the Fund by the Adviser and its affiliates. The Board also considered the preferences and expectations of Fund shareholders and their relative sophistication; the continuing state of competition in the mutual fund industry and market practices; the range of comparable fees for similar funds in the mutual fund industry; the Fund's relationship to the Federated family of funds which include a comprehensive array of funds with different investment objectives, policies and strategies which are available for exchange without the incurrence of additional sales charges; compliance and audit reports concerning the Federated funds and the Federated companies that service them (including communications from regulatory agencies), as well as Federated's responses to any issues raised therein; and relevant developments in the mutual fund industry and how the Federated funds and/or Federated are responding to them. The Board's evaluation process is evolutionary. The criteria considered and the emphasis placed on relevant criteria change in recognition of changing circumstances in the mutual fund marketplace.With respect to the Fund's performance and expenses in particular, the Board has found the use of comparisons to other mutual funds with comparable investment programs to be relevant, given the high degree of competition in the mutual fund business. The Board focused on comparisons with other similar Annual Shareholder Report
43
mutual funds more heavily than non-mutual fund products or services because it is believed that they are more relevant. For example, other mutual funds are the products most like the Fund, they are readily available to Fund shareholders as alternative investment vehicles, and they are the type of investment vehicle in fact chosen and maintained by the Fund's investors. The range of their fees and expenses therefore appears to be a generally reliable indication of what consumers have found to be reasonable in the precise marketplace in which the Fund competes. The Fund's ability to deliver competitive performance when compared to its peer group was a useful indicator of how the Adviser is executing the Fund's investment program, which in turn assisted the Board in reaching a conclusion that the nature, extent, and quality of the Adviser's investment management services were such as to warrant continuation of the advisory contract. In this regard, the Senior Officer has reviewed Federated's fees for providing advisory services to products outside the Federated family of funds (e.g., institutional and separate accounts). He concluded that mutual funds and institutional accounts are inherently different products. Those differences include, but are not limited to, different types of targeted investors; being subject to different laws and regulations; different legal structures; different average account sizes; different associated costs; different portfolio management techniques made necessary by different cash flows; and portfolio manager time spent in review of securities pricing. The Senior Officer did not consider these fee schedules to be determinative in judging the appropriateness of mutual fund advisory contracts.The Senior Officer reviewed information compiled by Federated, using data supplied by independent fund ranking organizations, regarding the performance of, and fees charged by, other mutual funds, noting his view that comparisons to fund peer groups are relevant in judging the reasonableness of proposed fees. He also observed that certain funds may exhibit important differences in their objectives and management techniques when compared to other funds placed in the same peer group by ranking organizations, noting in this connection that the Fund's quantitative investment program is of such a type.
The Fund's performance fell below the median of the relevant peer group for the one-year, three-year and five-year periods covered by the Evaluation. In addition, the Board was informed by the Adviser that, for the same periods, the Fund underperformed its benchmark index for the one-year period, underperformed its benchmark index for the three-year period and underperformed its benchmark index for the five-year period. The Board discussed the Fund's performance with the Adviser and recognized the efforts being undertaken by the Adviser. The Board will continue to monitor these efforts and the performance of the Fund.
The Board also received financial information about Federated, including information regarding the compensation and benefits Federated derived from its relationships with the Federated funds. This information covered not only the fees under the advisory contracts, but also fees received by Federated's Annual Shareholder Report
44
subsidiaries for providing other services to the Federated funds under separate contracts (e.g., for serving as the Federated funds' administrator). The information also detailed any indirect benefit Federated may derive from its receipt of research services from brokers who execute Federated fund trades. In addition, the Board considered the fact that, in order for a fund to be competitive in the marketplace, Federated and its affiliates frequently waived fees and/or reimbursed expenses and have disclosed to fund investors and/or indicated to the Board their intention to do so in the future, where appropriate. Moreover, the Board receives regular reporting as to the institution or elimination of these voluntary waivers.Federated furnished information, requested by the Senior Officer, that reported revenues on a fund-by-fund basis and made estimates of the allocation of expenses on a fund-by-fund basis, using allocation methodologies specified by the Senior Officer. The Senior Officer noted that, although they may apply consistent allocation processes, the inherent difficulties in allocating costs (and the unavoidable arbitrary aspects of that exercise) and the lack of consensus on how to allocate those costs may render such allocation information unreliable. The allocation information was considered in the analysis by the Board but was determined to be of limited use.
The Board and the Senior Officer also reviewed information compiled by Federated comparing profitability information for Federated to other publicly held fund management companies. In this regard, the Senior Officer noted the limited availability of such information, but nonetheless concluded that Federated's profit margins did not appear to be excessive and the Board agreed.
The Senior Officer's Evaluation also discussed the notion of possible realization of “economies of scale” as a fund grows larger. The Board considered in this regard that the Adviser has made significant and long-term investments in areas that support all of the Federated funds, such as personnel and processes for the portfolio management, compliance, internal audit, and risk management functions; and systems technology; and that the benefits of these efforts (as well as any economies, should they exist) were likely to be enjoyed by the fund complex as a whole. Finally, the Board also noted the absence of any applicable regulatory or industry guidelines on this subject, which (as discussed in the Senior Officer's Evaluation) is compounded by the lack of any common industry practice or general pattern with respect to structuring fund advisory fees with “breakpoints” that serve to reduce the fee as the fund attains a certain size. The Senior Officer did not recommend institution of breakpoints in pricing Federated's fund advisory services at this time.
It was noted in the materials for the Board meeting that for the period covered by the Evaluation, the Fund's investment advisory fee was waived in its entirety. The Board reviewed the contractual fee rate and other expenses of the Fund with the Adviser and was satisfied that the overall expense structure of the Fund remained competitive.
Annual Shareholder Report
45
The Senior Officer noted that, considering the totality of the circumstances, and all of the factors referenced within his Evaluation, he had concluded that, subject to comments and recommendations made within his Evaluation, his observations and the information accompanying the Evaluation supported a finding by the Board that the management fees for each of the funds are reasonable and that Federated appeared to provide appropriate administrative services to the Fund for the fees paid. Under these circumstances, no changes were recommended to, and no objection was raised to, the continuation of the Fund's advisory contract. The Board concluded that the nature, quality and scope of services provided the Fund by the Adviser and its affiliates were satisfactory.In its decision to continue an existing investment advisory contract, the Board was mindful of the potential disruptions of the Fund's operations and various risks, uncertainties and other effects that could occur as a result of a decision to terminate or not renew an advisory contract. In particular, the Board recognized that many shareholders have invested in the Fund on the strength of the Adviser's industry standing and reputation and with the expectation that the Adviser will have a continuing role in providing advisory services to the Fund. Thus, the Board's approval of the advisory contract reflected the fact that it is the shareholders who have effectively selected the Adviser by virtue of having invested in the Fund.
The Board based its decision to approve the advisory contract on the totality of the circumstances and relevant factors and with a view to past and future long-term considerations. Not all of the factors and considerations identified above were necessarily relevant to the Fund, nor did the Board consider any one of them to be determinative. With respect to the factors that were relevant, the Board's decision to approve the contract reflects its determination that Federated's performance and actions provided a satisfactory basis to support the decision to continue the existing arrangements.
Annual Shareholder Report46
Voting Proxies on Fund Portfolio Securities
A description of the policies and procedures that the Fund uses to determine how to vote proxies, if any, relating to securities held in the Fund's portfolio is available, without charge and upon request, by calling 1-800-341-7400. A report on “Form N-PX” of how the Fund voted any such proxies during the most recent 12-month period ended June 30 is available from Federated's website at FederatedInvestors.com. To access this information from the home page, select “View All” next to “Find Products.” Select a fund name and share class, if applicable, to go to the Fund Overview page. On the Fund Overview page, select the “Documents” tab. At the bottom of that page, select “Proxy Voting Record Report (Form N-PX).” Form N-PX filings are also available at the SEC's website at www.sec.gov.
Quarterly Portfolio Schedule
The Fund files with the SEC a complete schedule of its portfolio holdings, as of the close of the first and third quarters of its fiscal year, on “Form N-Q.” These filings are available on the SEC's website at www.sec.gov and may be reviewed and copied at the SEC's Public Reference Room in Washington, DC. (Call 1-800-SEC-0330 for information on the operation of the Public Reference Room.) You may also access this information from the “Products” section of Federated's website at FederatedInvestors.com. From the home page, select “View All” next to “Find Products.” Select a fund name and share class, if applicable, to go to the Fund Overview page. On the Fund Overview page, select the “Documents” tab. At the bottom of that page, select “Form N-Q.”
Annual Shareholder Report47
Mutual funds are not bank deposits or obligations, are not guaranteed by any bank and are not insured or guaranteed by the U.S. government, the Federal Deposit Insurance Corporation, the Federal Reserve Board or any other government agency. Investment in mutual funds involves investment risk, including the possible loss of principal.
This Report is authorized for distribution to prospective investors only when preceded or accompanied by the Fund's Prospectus, which contains facts concerning its objective and policies, management fees, expenses and other information.
Federated MDT Small Cap Core Fund
Federated Investors Funds
4000 Ericsson Drive
Warrendale, PA 15086-7561
Contact us at FederatedInvestors.com
or call 1-800-341-7400.
Federated Securities Corp., Distributor
Cusip 31421R817
Cusip 31421R791
Cusip 31421R783
37328 (9/11)
Federated is a registered trademark of Federated Investors, Inc.
2011 © Federated Investors, Inc.
| | Annual Shareholder Report |
| | July 31, 2011 |
|
| Share Class | Ticker |
| A | QASGX |
| B | QBSGX |
| C | QCSGX |
| IS | QISGX |
Federated MDT Small Cap Growth Fund
Fund Established 2005
A Portfolio of Federated MDT Series
Financial Highlights
Shareholder Expense Example
Management's Discussion of Fund Performance
Portfolio of Investments Summary Table
Portfolio of Investments
Statement of Assets and Liabilities
Statement of Operations
Statement of Changes in Net Assets
Notes to Financial Statements
Report of Independent Registered Public Accounting Firm
Board of Trustees and Trust Officers
Evaluation and Approval of Advisory Contract
Voting Proxies on Fund Portfolio Securities
Quarterly Portfolio Schedule
Financial Highlights – Class A Shares
(For a Share Outstanding Throughout Each Period)
| Year Ended July 31 | 2011 | 2010 | 2009 | 2008 | 20071 |
| Net Asset Value, Beginning of Period | $8.74 | $7.85 | $11.57 | $12.95 | $10.59 |
| Income From Investment Operations: | | | | | |
| Net investment income (loss) | (0.13)2 | (0.10)2 | (0.08)2 | (0.14)2 | (0.14)2 |
Net realized and unrealized gain
(loss) on investments and foreign currency transactions | 3.51 | 0.99 | (3.64) | (1.17) | 2.50 |
| TOTAL FROM INVESTMENT OPERATIONS | 3.38 | 0.89 | (3.72) | (1.31) | 2.36 |
| Less Distributions: | | | | | |
| Distributions from net realized gain on investments | — | — | — | (0.07) | — |
| Regulatory Settlement Proceeds | — | — | 0.003 | — | — |
| Net Asset Value, End of Period | $12.12 | $8.74 | $7.85 | $11.57 | $12.95 |
| Total Return4 | 38.67% | 11.34% | (32.15)%5 | (10.20)% | 22.29% |
| Ratios to Average Net Assets: | | | | | |
| Net expenses | 1.75% | 1.75% | 1.75% | 1.75% | 1.75% |
| Net investment income (loss) | (1.18)% | (1.17)% | (1.04)% | (1.20)% | (1.16)% |
| Expense waiver/reimbursement6 | 1.14% | 1.22% | 1.02% | 1.05% | 25.97% |
| Supplemental Data: | | | | | |
| Net assets, end of period (000 omitted) | $25,634 | $19,822 | $21,682 | $31,874 | $532 |
| Portfolio turnover | 154% | 142% | 244% | 212% | 157% |
| 1 | MDT Small Cap Growth Fund (the “Predecessor Fund”) was reorganized into Federated MDT Small Cap Growth Fund (the “Fund”) as of the close of business on December 8, 2006. Prior to the reorganization, the Fund had no investment operations. The Fund is the successor to the Predecessor Fund. The performance information and financial information presented incorporates the operations of the Predecessor Fund, which, as a result of the reorganization, are the Fund's operations. |
| 2 | Per share numbers have been calculated using the average shares method. |
| 3 | Represents less than $0.01. |
| 4 | Based on net asset value, which does not reflect the sales charge, redemption fee or contingent deferred sales charge, if applicable. |
| 5 | During the period, the Fund received a regulatory settlement from an unaffiliated third party, which had an impact of 0.09% on the total return. |
| 6 | This expense decrease is reflected in both the net expense and the net investment income (loss) ratios shown above. |
See Notes which are an integral part of the Financial Statements
Annual Shareholder Report1
Financial Highlights – Class B Shares
(For a Share Outstanding Throughout Each Period)
| Year Ended July 31, | Period
Ended
7/31/20081 |
| 2011 | 2010 | 2009 |
| Net Asset Value, Beginning of Period | $8.65 | $7.81 | $11.61 | $11.26 |
| Income From Investment Operations: | | | | |
| Net investment income (loss) | (0.21)2 | (0.16)2 | (0.14)2 | (0.09)2 |
| Net realized and unrealized gain (loss) on investments and foreign currency transactions | 3.46 | 1.00 | (3.66) | 0.44 |
| TOTAL FROM INVESTMENT OPERATIONS | 3.25 | 0.84 | (3.80) | 0.35 |
| Regulatory Settlement Proceeds | — | — | 0.003 | — |
| Net Asset Value, End of Period | $11.90 | $8.65 | $7.81 | $11.61 |
| Total Return4 | 37.57% | 10.76% | (32.73)% | 3.11% |
| Ratios to Average Net Assets: | | | | |
| Net expenses | 2.50% | 2.50% | 2.50% | 2.50%5 |
| Net investment income (loss) | (1.93)% | (1.92)% | (1.75)% | (1.96)%5 |
| Expense waiver/reimbursement6 | 1.15% | 1.22% | 1.02% | 1.05%5 |
| Supplemental Data: | | | | |
| Net assets, end of period (000 omitted) | $2,541 | $2,350 | $3,088 | $9,811 |
| Portfolio turnover | 154% | 142% | 244% | 212%7 |
| 1 | Reflects operations for the period from March 18, 2008 (date of initial investment) to July 31, 2008. |
| 2 | Per share numbers have been calculated using the average shares method. |
| 3 | Represents less than $0.01. |
| 4 | Based on net asset value, which does not reflect the sales charge, redemption fee or contingent deferred sales charge, if applicable. Total returns for periods of less than one year are not annualized. |
| 5 | Computed on an annualized basis. |
| 6 | This expense decrease is reflected in both the net expense and the net investment income (loss) ratios shown above. |
| 7 | Portfolio turnover is calculated at the Fund level. Percentage indicated was calculated for the year ended July 31, 2008. |
See Notes which are an integral part of the Financial Statements
Annual Shareholder Report2
Financial Highlights – Class C Shares
(For a Share Outstanding Throughout Each Period)
| Year Ended July 31 | 2011 | 2010 | 2009 | 2008 | 20071 |
| Net Asset Value, Beginning of Period | $8.43 | $7.62 | $11.32 | $12.77 | $10.52 |
| Income From Investment Operations: | | | | | |
| Net investment income (loss) | (0.21)2 | (0.16)2 | (0.14)2 | (0.22)2 | (0.23)2 |
Net realized and unrealized gain
(loss) on investments and foreign currency transactions | 3.38 | 0.97 | (3.56) | (1.16) | 2.48 |
| TOTAL FROM INVESTMENT OPERATIONS | 3.17 | 0.81 | (3.70) | (1.38) | 2.25 |
| Less Distributions: | | | | | |
| Distributions from net realized gain on investments | — | — | — | (0.07) | — |
| Regulatory Settlement Proceeds | — | — | 0.003 | — | — |
| Net Asset Value, End of Period | $11.60 | $8.43 | $7.62 | $11.32 | $12.77 |
| Total Return4 | 37.60% | 10.63% | (32.69)% | (10.89)% | 21.39% |
| Ratios to Average Net Assets: | | | | | |
| Net expenses | 2.50% | 2.49% | 2.50% | 2.47% | 2.50% |
| Net investment income (loss) | (1.94)% | (1.91)% | (1.79)% | (1.93)% | (1.92)% |
| Expense waiver/reimbursement5 | 1.13% | 1.22% | 1.02% | 1.07% | 27.07% |
| Supplemental Data: | | | | | |
| Net assets, end of period (000 omitted) | $4,663 | $2,795 | $4,069 | $6,450 | $702 |
| Portfolio turnover | 154% | 142% | 244% | 212% | 157% |
| 1 | The Predecessor Fund was reorganized into the Fund as of the close of business on December 8, 2006. Prior to the reorganization, the Fund had no investment operations. The Fund is the successor to the Predecessor Fund. The performance information and financial information presented incorporates the operations of the Predecessor Fund, which, as a result of the reorganization, are the Fund's operations. |
| 2 | Per share numbers have been calculated using the average shares method. |
| 3 | Represents less than $0.01. |
| 4 | Based on net asset value, which does not reflect the sales charge, redemption fee or contingent deferred sales charge, if applicable. |
| 5 | This expense decrease is reflected in both the net expense and the net investment income (loss) ratios shown above. |
See Notes which are an integral part of the Financial Statements
Annual Shareholder Report3
Financial Highlights – Institutional Shares
(For a Share Outstanding Throughout Each Period)
| Year Ended July 31 | 2011 | 2010 | 2009 | 2008 | 20071 |
| Net Asset Value, Beginning of Period | $8.85 | $7.93 | $11.66 | $13.02 | $10.61 |
| Income From Investment Operations: | | | | | |
| Net investment income (loss) | (0.10)2 | (0.08)2 | (0.06)2 | (0.11)2 | (0.13)2 |
Net realized and unrealized gain
(loss) on investments and foreign currency transactions | 3.56 | 1.00 | (3.67) | (1.18) | 2.54 |
| TOTAL FROM INVESTMENT OPERATIONS | 3.46 | 0.92 | (3.73) | (1.29) | 2.41 |
| Less Distributions: | | | | | |
| Distributions from net realized gain on investments | — | — | — | (0.07) | — |
| Regulatory Settlement Proceeds | — | — | 0.003 | — | — |
| Net Asset Value, End of Period | $12.31 | $8.85 | $7.93 | $11.66 | $13.02 |
| Total Return4 | 39.10% | 11.60% | (31.99)% | (9.99)% | 22.71% |
| Ratios to Average Net Assets: | | | | | |
| Net expenses | 1.50% | 1.50% | 1.50% | 1.50% | 1.50% |
| Net investment income (loss) | (0.92)% | (0.92)% | (0.80)% | (0.91)% | (1.03)% |
| Expense waiver/reimbursement5 | 1.15% | 1.22% | 1.02% | 1.09% | 5.58% |
| Supplemental Data: | | | | | |
| Net assets, end of period (000 omitted) | $29,395 | $27,039 | $39,246 | $62,209 | $16,245 |
| Portfolio turnover | 154% | 142% | 244% | 212% | 157% |
| 1 | The Predecessor Fund was reorganized into the Fund as of the close of business on December 8, 2006. Prior to the reorganization, the Fund had no investment operations. The Fund is the successor to the Predecessor Fund. The performance information and financial information presented incorporates the operations of the Predecessor Fund, which, as a result of the reorganization, are the Fund's operations. |
| 2 | Per share numbers have been calculated using the average shares method. |
| 3 | Represents less than $0.01. |
| 4 | Based on net asset value. |
| 5 | This expense decrease is reflected in both the net expense and the net investment income (loss) ratios shown above. |
See Notes which are an integral part of the Financial Statements
Annual Shareholder Report4
Shareholder Expense Example (unaudited)
As a shareholder of the Fund, you incur two types of costs: (1) transaction costs, including sales charges (loads) on purchase or redemption payments; and (2) ongoing costs, including management fees and to the extent applicable, distribution (12b-1) fees and/or shareholder services fees and other Fund expenses. This Example is intended to help you to understand your ongoing costs (in dollars) of investing in the Fund and to compare these costs with the ongoing costs of investing in other mutual funds. It is based on an investment of $1,000 invested at the beginning of the period and held for the entire period from February 1, 2011 to July 31, 2011.
ACTUAL EXPENSES
The first section of the table below provides information about actual account values and actual expenses. You may use the information in this section, together with the amount you invested, to estimate the expenses that you incurred over the period. Simply divide your account value by $1,000 (for example, an $8,600 account value divided by $1,000 = 8.6), then multiply the result by the number in the first section under the heading entitled “Expenses Paid During Period” to estimate the expenses attributable to your investment during this period.
HYPOTHETICAL EXAMPLE FOR COMPARISON PURPOSES
The second section of the table below provides information about hypothetical account values and hypothetical expenses based on the Fund's actual expense ratio and an assumed rate of return of 5% per year before expenses, which is not the Fund's actual return. Thus, you should not use the hypothetical account values and expenses to estimate the actual ending account balance or your expenses for the period. Rather, these figures are required to be provided to enable you to compare the ongoing costs of investing in the Fund with other funds. To do so, compare this 5% hypothetical example with the 5% hypothetical examples that appear in the shareholder reports of the other funds.
Annual Shareholder Report
5
Please note that the expenses shown in the table are meant to highlight your ongoing costs only and do not reflect any transaction costs, such as sales charges (loads) on purchase or redemption payments. Therefore, the second section of the table is useful in comparing ongoing costs only, and will not help you determine the relative total costs of owning different funds. In addition, if these transaction costs were included, your costs would have been higher. | Beginning
Account Value
2/1/2011 | Ending
Account Value
7/31/2011 | Expenses Paid
During Period1 |
| Actual: | | | |
| Class A Shares | $1,000 | $1,098.80 | $9.11 |
| Class B Shares | $1,000 | $1,095.80 | $12.99 |
| Class C Shares | $1,000 | $1,095.40 | $12.99 |
| Institutional Shares | $1,000 | $1,101.10 | $7.81 |
Hypothetical (assuming a 5% return
before expenses): | | | |
| Class A Shares | $1,000 | $1,016.12 | $8.75 |
| Class B Shares | $1,000 | $1,012.40 | $12.47 |
| Class C Shares | $1,000 | $1,012.40 | $12.47 |
| Institutional Shares | $1,000 | $1,017.36 | $7.50 |
| 1 | Expenses are equal to the Fund's annualized net expense ratios, multiplied by the average account value over the period, multiplied by 181/365 (to reflect the one-half-year period). The annualized net expense ratios are as follows: |
| Class A Shares | 1.75% |
| Class B Shares | 2.50% |
| Class C Shares | 2.50% |
| Institutional Shares | 1.50% |
Annual Shareholder Report6
Performance data quoted represents past performance which is no guarantee of future results. Investment return and principal value will fluctuate so that an investor's shares, when redeemed, may be worth more or less than their original cost. Mutual fund performance changes over time and current performance may be lower or higher than what is stated. For current to the most recent month-end performance and after-tax returns, visit FederatedInvestors.com or call 1-800-341-7400.
Management's Discussion of Fund Performance (unaudited)
The Fund's total return, based on net asset value, for the 12-month reporting period ended July 31, 2011, was 38.67% for Class A Shares, 37.57% for Class B Shares, 37.60% for Class C Shares and 39.10% for Institutional Shares.1 The total returns of the Russell 2000® Growth Index,2 a broad-based securities market index (“Russell 2000® Growth”) was 29.32% for the reporting period. The Fund's total returns for the fiscal year reflected actual cash flows, transaction costs and other expenses which were not reflected in the total return of the Russell or Lipper indexes.
| 1 | Small company stocks may be less liquid and subject to greater price volatility than large capitalization stocks. |
| 2 | The Russell 2000® Growth measures the performance of those Russell 2000® companies with higher price-to-book ratios and higher forecasted growth values. The index is unmanaged, and unlike the Fund, is not affected by cash flows. The index is not adjusted to reflect sales charges, expenses or other fees that the Securities and Exchange Commission (SEC) requires to be reflected in the Fund's performance. It is not possible to invest directly in an index. |
..
Annual Shareholder Report
7
MARKET OVERVIEWOver the reporting period, domestic equity market performance was strong as evidenced by the 20.94% return on the Russell 3000® Index,3 which represents the performance of the 3,000 largest U.S. companies by market capitalization. Mid-cap stocks led the way during the 12-month reporting period, as demonstrated by the 24.51% return of the Russell Midcap® Index,4 which exceeded the 19.09% and 23.92% results for the Russell Top 200® Index,5 representing large-cap stocks, and the Russell 2000® Growth Index,6 representing small-cap stocks, respectively. Growth stocks outperformed value stocks during the fiscal year with the Russell 3000® Growth Index7 returning 25.12% as compared to 16.90% for the Russell 3000® Value Index.8
The best performing sectors in the Russell 2000® Growth during the period were Energy (+69.74%), Information Technology (+31.00%) and Materials (+30.10%). Underperforming sectors included Utilities (-2.54%), Industrials (+22.51%) and Consumer Discretionary (+23.33%).
| 3 | The Russell 3000® Index offers investors access to the broad U.S. equity universe representing approximately 98% of the U.S. Market. The Russell 3000® is constructed to provide a comprehensive, unbiased and stable barometer of the broad market, and is complete reconstituted annually to ensure that new and growing equities are reflected. The index is unmanaged and, unlike the Fund, is not affected by cash flows. The index is not adjusted to reflect sales charges, expenses or other fees that the SEC requires to be reflected in the Fund's performance. It is not possible to invest directly in an index. |
| 4 | The Russell Midcap® Index measures the performance of the 800 smallest companies in the Russell 1000® Index and represents approximately 31% of the total market capitalization of the Russell 1000® Index. The index is unmanaged and, unlike the Fund, is not affected by cash flows. The index is not adjusted to reflect sales charges, expenses or other fees that the SEC requires to be reflected in the Fund's performance. It is not possible to invest directly in an index. |
| 5 | The Russell Top 200® Index measures the performance of the 200 largest companies in the Russell 1000® Index and represents approximately 68% of the total market capitalization of the Russell 1000® Index. The index is unmanaged and, unlike the Fund, is not affected by cash flows. The index is not adjusted to reflect sales charges, expenses or other fees that the SEC requires to be reflected in the Fund's performance. It is not possible to invest directly in an index. |
| 6 | The Russell 2000® Index measures the performance of the 2,000 smallest companies in the Russell 3000® Index and represents approximately 10% of the total market capitalization of the Russell 3000® Index. The index is unmanaged and, unlike the Fund, is not affected by cash flows. The index is not adjusted to reflect sales charges, expenses or other fees that the SEC requires to be reflected in the Fund's performance. It is not possible to invest directly in an index. |
| 7 | The Russell 3000® Growth Index measures the performance of those Russell 3000® Index companies with higher price-to-book ratios and higher forecasted growth values. The stocks in this index are also members of either the Russell 1000® Growth or the Russell 2000® Growth indexes. The index is unmanaged and, unlike the Fund, is not affected by cash flows. The index is not adjusted to reflect sales charges, expenses or other fees that the SEC requires to be reflected in the Fund's performance. It is not possible to invest directly in an index. |
| 8 | The Russell 3000® Value Index measures the performance of those Russell 3000® Index companies with lower price-to-book ratios and lower forecasted growth values. The stocks in this index are also members of either the Russell 1000® Value or the Russell 2000® Value indexes. The index is unmanaged and, unlike the Fund, is not affected by cash flows. The index is not adjusted to reflect sales charges, expenses or other fees that the SEC requires to be reflected in the Fund's performance. It is not possible to invest directly in an index. |
Annual Shareholder Report8
FUND PERFORMANCE
During the 12-month reporting period, the most significant positive factor in the Fund's performance was stock selection in the Consumer Discretionary sector. Stock selection in the Health Care, Industrials and Materials sectors also contributed significantly. An underweight in the Health Care sector contributed more moderately. An overweight in the Information Technology sector also contributed moderately. The most significant negative factor in the Fund's performance was an overweight in the Consumer Staples sector.
Individual stocks detracting from the Fund's performance during the reporting period included InterDigital, Coinstar, NewMarket, Avis Budget and Olin.
Individual stocks contributing to the Fund's performance during the reporting period included Tempur-Pedic, Polypore, Fossil, Rockwood Holdings and Tractor Supply.
Annual Shareholder Report9
GROWTH OF A $10,000 INVESTMENT – CLASS A SHARES
The graph below illustrates the hypothetical investment of $10,0001 in the Federated MDT Small Cap Growth Fund2 (Class A Shares) (the “Fund”) from September 15, 2005 (start of performance) to July 31, 2011, compared to the Russell 2000® Growth Index (Russell 2000® Growth).3
| Average Annual Total Returns for the Period Ended 7/31/2011 | |
| 1 Year | 31.03% |
| 5 Years | 1.68% |
| Start of Performance (9/15/2005) | 2.43% |
| Federated MDT Small Cap Growth Fund - Class A Shares | C000035061 | Russell 2000 Growth | Lipper Small-Cap Growth Funds Index |
| 9/15/2005 | 9,450 | 10,000 | 10,000 |
| 7/31/2006 | 10,009 | 10,280 | 10,096 |
| 7/31/2007 | 12,240 | 12,011 | 12,067 |
| 7/31/2008 | 10,992 | 11,559 | 10,715 |
| 7/31/2009 | 7,458 | 9,148 | 8,592 |
| 7/31/2010 | 8,303 | 10,677 | 10,016 |
| 7/31/2011 | 11,514 | 13,807 | 12,894 |
41 graphic description end -->
Performance data quoted represents past performance which is no guarantee of future results. Investment return and principal value will fluctuate so that an investor's shares, when redeemed, may be worth more or less than their original cost. Mutual fund performance changes over time and current performance may be lower or higher than what is stated. For current to the most recent month-end performance and after-tax returns, visit FederatedInvestors.com or call 1-800-341-7400. Returns shown do not reflect the deduction of taxes that a shareholder would pay on Fund distributions or the redemption of Fund shares. Mutual funds are not obligations of or guaranteed by any bank and are not federally insured. Total returns shown include the maximum sales charge of 5.50%.
Annual Shareholder Report
10
| 1 | Represents a hypothetical investment of $10,000 in the Fund after deducting the maximum sales charge of 5.50% ($10,000 investment minus $550 sales charge = $9,450). The Fund's performance assumes the reinvestment of all dividends and distributions. The Russell 2000® Growth and the Lipper Small-Cap Growth Funds Index have been adjusted to reflect reinvestment of dividends on securities in the indexes. |
| 2 | The Fund is the successor to the MDT Small Cap Growth Fund pursuant to a reorganization that took place on December 8, 2006. Prior to that date, the Fund had no investment operations. Accordingly, the performance information shown for periods prior to that date is that of the MDT Small Cap Growth Fund. |
| 3 | The Russell 2000® Growth measures the performance of those Russell 2000 companies with higher price-to-book ratios and higher forecasted growth values. The Russell 2000® Growth is unmanaged and, unlike the Fund, is not affected by cash flows. The index is not adjusted to reflect sales charges, expenses or other fees that the Securities and Exchange Commission (SEC) requires to be reflected in the Fund's performance. It is not possible to invest directly in an index. |
Annual Shareholder Report11
GROWTH OF A $10,000 INVESTMENT – CLASS B SHARES
The graph below illustrates the hypothetical investment of $10,0001 in the Federated MDT Small Cap Growth Fund2,3 (Class B Shares) (the “Fund”) from September 15, 2005 (start of performance) to July 31, 2011, compared to the Russell 2000® Growth Index (Russell 2000® Growth).4
| Average Annual Total Returns for the Period Ended 7/31/2011 | |
| 1 Year | 32.07% |
| 5 Years | 1.73% |
| Start of Performance (9/15/2005) | 2.51% |
| Federated MDT Small Cap Growth Fund - Class B Shares | C000058510 | Russell 2000 Growth | Lipper Small-Cap Growth Funds Index |
| 9/15/2005 | 10,000 | 10,000 | 10,000 |
| 7/31/2006 | 10,518 | 10,280 | 10,096 |
| 7/31/2007 | 12,780 | 12,011 | 12,067 |
| 7/31/2008 | 11,383 | 11,559 | 10,715 |
| 7/31/2009 | 7,657 | 9,148 | 8,592 |
| 7/31/2010 | 8,481 | 10,677 | 10,016 |
| 7/31/2011 | 11,567 | 13,807 | 12,894 |
41 graphic description end -->
Performance data quoted represents past performance which is no guarantee of future results. Investment return and principal value will fluctuate so that an investor's shares, when redeemed, may be worth more or less than their original cost. Mutual fund performance changes over time and current performance may be lower or higher than what is stated. For current to the most recent month-end performance and after-tax returns, visit FederatedInvestors.com or call 1-800-341-7400. Returns shown do not reflect the deduction of taxes that a shareholder would pay on Fund distributions or the redemption of Fund shares. Mutual funds are not obligations of or guaranteed by any bank and are not federally insured. Total returns shown include the maximum contingent deferred sales charge (CDSC) of 5.50%, as applicable.
Annual Shareholder Report
12
| 1 | Represents a hypothetical investment of $10,000 in the Fund. The maximum CDSC is 5.50% on any redemption less than one year from the purchase date. The Fund's performance assumes the reinvestment of all dividends and distributions. The Russell 2000® Growth and the Lipper Small-Cap Growth Funds Index have been adjusted to reflect reinvestment of dividends on securities in the indexes. |
| 2 | The start of performance date was September 15, 2005. Class B Shares of the Fund were offered beginning March 17, 2008. Performance results shown before that date are for the Fund's Institutional Shares and have been adjusted for the total annual operating expenses applicable to the Fund's Class B Shares. The Fund's Institutional Shares commenced operations on September 15, 2005. Subject to the expense adjustments described above, the Class B Shares annual returns would have been substantially similar to those of the Fund's Institutional Shares because shares of each class are invested in the same portfolio of securities. |
| 3 | The Fund is the successor to the MDT Small Cap Growth Fund Pursuant to a reorganization that took place on December 8, 2006. Prior to that date, the Fund had no investment operations. Accordingly, the performance information shown for periods prior to that date is that of the MDT Small Cap Growth Fund. |
| 4 | The Russell 2000® Growth measures the performance of those Russell 2000 companies with higher price-to-book ratios and higher forecasted growth values. The Russell 2000® Growth is not adjusted to reflect sales charges, expenses or other fees that the SEC requires to be reflected in the Fund's performance. The index is unmanaged and, unlike the Fund, is not affected by cash flows. The index is not adjusted to reflect sales charges, expenses or other fees that the SEC requires to be reflected in the Fund's performance. It is not possible to invest directly in an index. |
Annual Shareholder Report13
GROWTH OF A $10,000 INVESTMENT – CLASS C SHARES
The graph below illustrates the hypothetical investment of $10,0001 in the Federated MDT Small Cap Growth Fund2 (Class C Shares) (the “Fund”) from September 15, 2005 (start of performance) to July 31, 2011, compared to the Russell 2000® Growth Index (Russell 2000® Growth).3
| Average Annual Total Returns for the Period Ended 7/31/2011 | |
| 1 Year | 36.60% |
| 5 Years | 2.08% |
| Start of Performance (9/15/2005) | 2.65% |
| Federated MDT Small Cap Growth Fund - Class C Shares | C000035062 | Russell 2000 Growth | Lipper Small-Cap Growth Funds Index |
| 9/15/2005 | 10,000 | 10,000 | 10,000 |
| 7/31/2006 | 10,520 | 10,280 | 10,096 |
| 7/31/2007 | 12,770 | 12,011 | 12,067 |
| 7/31/2008 | 11,379 | 11,559 | 10,715 |
| 7/31/2009 | 7,660 | 9,148 | 8,592 |
| 7/31/2010 | 8,474 | 10,677 | 10,016 |
| 7/31/2011 | 11,661 | 13,807 | 12,894 |
41 graphic description end -->
Performance data quoted represents past performance which is no guarantee of future results. Investment return and principal value will fluctuate so that an investor's shares, when redeemed, may be worth more or less than their original cost. Mutual fund performance changes over time and current performance may be lower or higher than what is stated. For current to the most recent month-end performance and after-tax returns, visit FederatedInvestors.com or call 1-800-341-7400. Returns shown do not reflect the deduction of taxes that a shareholder would pay on Fund distributions or the redemption of Fund shares. Mutual funds are not obligations of or guaranteed by any bank and are not federally insured. Total returns shown include the maximum contingent deferred sales charge (CDSC) of 1.00%, as applicable.
Annual Shareholder Report
14
| 1 | Represents a hypothetical investment of $10,000 in the Fund. The maximum CDSC is 1.00% on any redemption less than one year from the purchase date. The Fund's performance assumes the reinvestment of all dividends and distributions. The Russell 2000® Growth and the Lipper Small-Cap Growth Funds Index have been adjusted to reflect reinvestment of dividends on securities in the indexes. |
| 2 | The Fund is the successor to the MDT Small Cap Growth Fund pursuant to a reorganization that took place on December 8, 2006. Prior to that date, the Fund had no investment operations. Accordingly, the performance information shown for periods prior to that date is that of the MDT Small Cap Growth Fund. |
| 3 | The Russell 2000® Growth measures the performance of those Russell 2000 companies with higher price-to-book rtios and higher forcasted growth values. The Russell 2000® Growth is not adjusted to reflect sales charges, expenses or other fees that the SEC requires to be reflected in the Fund's performance. The index is unmanaged and, unlike the Fund, is not affected by cash flows. The index is not adjusted to reflect sales charges, expenses or other fees that the SEC requires to be reflected in the Fund's performance. It is not possible to invest directly in an index. |
Annual Shareholder Report15
GROWTH OF A $10,000 INVESTMENT – INSTITUTIONAL SHARES
The graph below illustrates the hypothetical investment of $10,0001 in the Federated MDT Small Cap Growth Fund2 (Institutional Shares) (the “Fund”) from September 15, 2005 (start of performance) to July 31, 2011, compared to the Russell 2000® Growth Index (Russell 2000® Growth).3
| Average Annual Total Returns for the Period Ended 7/31/2011 | |
| 1 Year | 39.10% |
| 5 Years | 3.12% |
| Start of Performance (9/15/2005) | 3.69% |
| Federated MDT Small Cap Growth Fund - Institutional Shares | C000035063 | Russell 2000 Growth | Lipper Small-Cap Growth Funds Index |
| 9/15/2005 | 10,000 | 10,000 | 10,000 |
| 7/31/2006 | 10,610 | 10,280 | 10,096 |
| 7/31/2007 | 13,020 | 12,011 | 12,067 |
| 7/31/2008 | 11,720 | 11,559 | 10,715 |
| 7/31/2009 | 7,970 | 9,148 | 8,592 |
| 7/31/2010 | 8,895 | 10,677 | 10,016 |
| 7/31/2011 | 12,373 | 13,807 | 12,894 |
41 graphic description end -->
Performance data quoted represents past performance which is no guarantee of future results. Investment return and principal value will fluctuate so that an investor's shares, when redeemed, may be worth more or less than their original cost. Mutual fund performance changes over time and current performance may be lower or higher than what is stated. For current to the most recent month-end performance and after-tax returns, visit FederatedInvestors.com or call 1-800-341-7400. Returns shown do not reflect the deduction of taxes that a shareholder would pay on Fund distributions or the redemption of Fund shares. Mutual funds are not obligations of or guaranteed by any bank and are not federally insured.
Annual Shareholder Report
16
| 1 | Represents a hypothetical investment of $10,000 in the Fund. The Fund's performance assumes the reinvestment of all dividends and distributions. The Russell 2000® Growth and the Lipper Small-Cap Growth Funds Index have been adjusted to reflect reinvestment of dividends on securities in the indexes. |
| 2 | The Fund is the successor to the MDT Small Cap Growth Fund pursuant to a reorganization that took place on December 8, 2006. Prior to that date, the Fund had no investment operations. Accordingly, the performance information shown for periods prior to that date is that of the MDT Small Cap Growth Fund. |
| 3 | The Russell 2000® Growth measures the performance of those Russell 2000 companies with higher price-to-book rtios and higher forcasted growth values. The Russell 2000® Growth is not adjusted to reflect sales charges, expenses or other fees that the SEC requires to be reflected in the Fund's performance. The index is unmanaged and, unlike the Fund, is not affected by cash flows. The index is not adjusted to reflect sales charges, expenses or other fees that the SEC requires to be reflected in the Fund's performance. It is not possible to invest directly in an index. |
Annual Shareholder Report17
Portfolio of Investments Summary Table (unaudited)
At July 31, 2011, the Fund's industry composition1 was as follows:
| Industry Composition | Percentage of
Total Net Assets |
| Undesignated Consumer Cyclicals | 5.4% |
| Apparel | 5.2% |
| Software Packaged/Custom | 5.2% |
| Crude Oil & Gas Production | 4.6% |
| Shoes | 4.0% |
| Specialty Retailing | 3.9% |
| Oil Well Supply | 3.7% |
| Photo-Optical Component-Equipment | 3.4% |
| Specialty Chemicals | 3.4% |
| Furniture | 2.4% |
| Industrial Machinery | 2.3% |
| Semiconductor Manufacturing Equipment | 2.3% |
| Generic Drugs | 2.2% |
| Computer Peripherals | 2.1% |
| Telecommunication Equipment & Services | 2.1% |
| Metal Frabrication | 2.0% |
| Miscellaneous Machinery | 2.0% |
| Auto Original Equipment Manufacturers | 1.9% |
| Cosmetics & Toiletries | 1.9% |
| Home Products | 1.8% |
| Commodity Chemicals | 1.7% |
| International Bank | 1.7% |
| Nickel | 1.7% |
| Medical Supplies | 1.6% |
| Clothing Stores | 1.5% |
| Trucking | 1.4% |
| Electrical Equipment | 1.3% |
| Multi-Industry Basic | 1.3% |
| Office Furniture | 1.2% |
| Grocery Chain | 1.1% |
| Multi-Industry Capital Goods | 1.1% |
| Restaurant | 1.1% |
| Internet Services | 1.0% |
Annual Shareholder Report18
| Industry Composition | Percentage of
Total Net Assets |
| Oil Service, Explore & Drill | 1.0% |
| Other2 | 18.1% |
| Cash Equivalents3 | 1.8% |
| Other Assets and Liabilities — Net4 | (0.4)% |
| TOTAL | 100.0% |
| 1 | Except for Cash Equivalents and Other Assets and Liabilities, industry classifications are based upon, and individual portfolio securities are assigned to, the classifications of the Global Industry Classification Standard (GICS) except that the Adviser assigns a classification to securities not classified by the GICS and to securities for which the Adviser does not have access to the classification made by the GICS. |
| 2 | For purposes of this table, industry classifications which constitute less than 1.0% of the Fund's total net assets have been aggregated under the designation “Other.” |
| 3 | Cash Equivalents include any investments in money market mutual funds and/or overnight repurchase agreements. |
| 4 | Assets, other than investments in securities, less liabilities. See Statement of Assets and Liabilities. |
Annual Shareholder Report19
Portfolio of Investments
July 31, 2011
| Shares | | | Value |
| | COMMON STOCKS – 98.6% | |
| | Aluminum – 0.5% | |
| 24,236 | 1 | Century Aluminum Co. | 315,553 |
| | Apparel – 5.2% | |
| 34,693 | 1 | Ann, Inc. | 899,936 |
| 16,558 | 1 | Carter's, Inc. | 554,693 |
| 23,053 | 1 | Express, Inc. | 517,309 |
| 4,132 | | Oxford Industries, Inc. | 161,892 |
| 5,776 | 1 | True Religion Apparel, Inc. | 194,594 |
| 17,074 | 1 | Warnaco Group, Inc. | 910,044 |
| | TOTAL | 3,238,468 |
| | Auto Original Equipment Manufacturers – 1.9% | |
| 5,796 | 1 | Dana Holding Corp. | 96,619 |
| 13,665 | | Meritor, Inc. | 184,478 |
| 6,456 | | Sun Hydraulics Corp. | 184,061 |
| 18,379 | 1 | Tenneco Automotive, Inc. | 734,057 |
| | TOTAL | 1,199,215 |
| | Auto Rentals – 0.7% | |
| 527 | 1 | AMERCO | 47,504 |
| 17,109 | 1 | United Rentals, Inc. | 393,678 |
| | TOTAL | 441,182 |
| | Biotechnology – 0.6% | |
| 1,160 | 1 | Air Methods Corp. | 81,316 |
| 4,335 | 1 | Medicines Co. | 64,938 |
| 6,751 | 1 | Questcor Pharmaceuticals, Inc. | 209,619 |
| | TOTAL | 355,873 |
| | Building Materials – 0.8% | |
| 924 | 1 | Trex Co., Inc. | 19,478 |
| 8,015 | | Watsco, Inc. | 474,328 |
| | TOTAL | 493,806 |
| | Business Services – 0.2% | |
| 2,225 | 1 | Athenahealth, Inc. | 130,808 |
| | Carpets – 0.2% | |
| 7,821 | | Interface, Inc. | 125,292 |
| | Clothing Stores – 1.5% | |
| 18,829 | 1 | Aeropostale, Inc. | 317,269 |
| 5,235 | | Cato Corp., Class A | 145,638 |
Annual Shareholder Report20
| Shares | | | Value |
| 8,915 | 1 | Jos A. Bank Clothiers, Inc. | 457,428 |
| | TOTAL | 920,335 |
| | Commodity Chemicals – 1.7% | |
| 6,632 | | Newmarket Corp. | 1,087,781 |
| | Computer Peripherals – 2.1% | |
| 48,642 | 1 | Fortinet, Inc. | 988,406 |
| 10,234 | | Silicon Graphics, Inc. | 146,039 |
| 6,913 | 1 | Synaptics, Inc. | 169,852 |
| | TOTAL | 1,304,297 |
| | Computer Services – 0.9% | |
| 9,899 | 1 | Manhattan Associates, Inc. | 369,233 |
| 8,120 | 1 | Unisys Corp. | 168,652 |
| | TOTAL | 537,885 |
| | Computer Stores – 0.2% | |
| 6,322 | 1 | Insight Enterprises, Inc. | 106,399 |
| | Construction Machinery – 0.4% | |
| 2,952 | | NACCO Industries, Inc., Class A | 268,278 |
| | Cosmetics & Toiletries – 1.9% | |
| 16,427 | 1 | Revlon, Inc. | 276,630 |
| 36,734 | 1 | Sally Beauty Holdings, Inc. | 631,825 |
| 3,963 | 1 | Ulta Salon Cosmetics & Fragrance, Inc. | 249,788 |
| | TOTAL | 1,158,243 |
| | Crude Oil & Gas Production – 4.6% | |
| 12,108 | | Berry Petroleum Co., Class A | 694,394 |
| 6,587 | 1 | Clayton Williams Energy, Inc. | 436,850 |
| 3,041 | 1 | Gulfport Energy Corp. | 110,875 |
| 12,558 | 1 | Rosetta Resources, Inc. | 650,128 |
| 13,768 | 1 | Stone Energy Corp. | 446,909 |
| 19,484 | | W&T Offshore, Inc. | 528,016 |
| | TOTAL | 2,867,172 |
| | Defense Aerospace – 0.4% | |
| 2,649 | | Heico Corp. | 138,437 |
| 2,809 | | Kaman Corp., Class A | 100,056 |
| | TOTAL | 238,493 |
| | Department Stores – 0.5% | |
| 27,056 | 1 | Saks, Inc. | 290,581 |
| | Discount Department Stores – 0.1% | |
| 1,523 | | PriceSmart, Inc. | 89,126 |
Annual Shareholder Report21
| Shares | | | Value |
| | Diversified Leisure – 0.5% | |
| 6,442 | 1 | Coinstar, Inc. | 314,756 |
| | Electrical Equipment – 1.3% | |
| 7,536 | | Belden, Inc. | 277,702 |
| 10,338 | 1 | Littelfuse, Inc. | 528,168 |
| | TOTAL | 805,870 |
| | Electronic Instruments – 0.8% | |
| 2,643 | | Computer Programs & Systems, Inc. | 193,996 |
| 2,502 | 1 | FEI Co. | 82,666 |
| 2,153 | 1 | OYO Geospace Corp. | 218,379 |
| | TOTAL | 495,041 |
| | Electronic Test/Measuring Equipment – 0.4% | |
| 6,434 | | MTS Systems Corp. | 253,564 |
| | Financial Services – 0.3% | |
| 8,147 | | Deluxe Corp. | 191,780 |
| | Furniture – 2.4% | |
| 9,990 | 1 | Select Comfort Corp. | 168,032 |
| 18,676 | 1 | Tempur-Pedic International, Inc. | 1,344,859 |
| | TOTAL | 1,512,891 |
| | Generic Drugs – 2.2% | |
| 11,521 | 1 | Impax Laboratories, Inc. | 244,015 |
| 13,045 | 1 | Jazz Pharmaceuticals, Inc. | 527,931 |
| 9,722 | | Medicis Pharmaceutical Corp., Class A | 361,464 |
| 7,796 | 1 | Par Pharmaceutical Cos., Inc. | 252,512 |
| | TOTAL | 1,385,922 |
| | Grocery Chain – 1.1% | |
| 6,753 | | Casey's General Stores, Inc. | 303,885 |
| 9,159 | | Ruddick Corp. | 383,762 |
| | TOTAL | 687,647 |
| | Home Health Care – 0.6% | |
| 3,535 | 1 | Amerigroup Corp. | 194,425 |
| 3,827 | 1 | Wellcare Health Plans, Inc. | 167,814 |
| | TOTAL | 362,239 |
| | Home Products – 1.8% | |
| 18,249 | | Tupperware Brands Corp. | 1,140,380 |
| | Hospitals – 0.4% | |
| 7,770 | | Ensign Group, Inc. | 220,668 |
| | Industrial Machinery – 2.3% | |
| 6,785 | | Actuant Corp. | 167,657 |
Annual Shareholder Report22
| Shares | | | Value |
| 2,476 | | Gorman Rupp Co. | 80,668 |
| 17,294 | 1 | Polypore International, Inc. | 1,175,992 |
| | TOTAL | 1,424,317 |
| | International Bank – 1.7% | |
| 18,023 | 1 | Signature Bank | 1,066,241 |
| | Internet Services – 1.0% | |
| 12,598 | 1 | Ancestry.com, Inc. | 448,615 |
| 2,905 | 1 | Travelzoo, Inc. | 153,384 |
| | TOTAL | 601,999 |
| | Leasing – 0.1% | |
| 7,124 | 1 | RSC Holdings, Inc. | 85,061 |
| | Machined Parts Original Equipment Manufacturers – 0.5% | |
| 9,680 | | Applied Industrial Technologies, Inc. | 308,986 |
| | Mail Order – 0.2% | |
| 3,621 | 1 | HSN, Inc. | 118,370 |
| | Maritime – 0.6% | |
| 13,355 | | Frontline Ltd. | 153,582 |
| 5,267 | 1 | Golar LNG Ltd. | 200,831 |
| | TOTAL | 354,413 |
| | Medical Supplies – 1.6% | |
| 3,558 | 1 | Medidata Solutions, Inc. | 72,690 |
| 2,960 | 1 | Orthofix International NV | 125,001 |
| 12,897 | | Owens & Minor, Inc. | 393,359 |
| 11,564 | | Steris Corp. | 404,624 |
| | TOTAL | 995,674 |
| | Medical Technology – 0.8% | |
| 6,876 | 1 | Arthrocare Corp. | 227,252 |
| 6,195 | 1 | Integra Lifesciences Corp. | 279,208 |
| | TOTAL | 506,460 |
| | Metal Fabrication – 2.0% | |
| 12,002 | | Barnes Group, Inc. | 292,248 |
| 6,479 | | Mueller Industries, Inc. | 243,157 |
| 33,538 | | Worthington Industries, Inc. | 703,292 |
| | TOTAL | 1,238,697 |
| | Miscellaneous Communications – 0.4% | |
| 17,232 | 1 | Leap Wireless International, Inc. | 231,943 |
| | Miscellaneous Components – 0.8% | |
| 9,011 | 1 | MKS Instruments, Inc. | 224,824 |
Annual Shareholder Report23
| Shares | | | Value |
| 12,410 | 1 | TriMas Corp. | 297,468 |
| | TOTAL | 522,292 |
| | Miscellaneous Machinery – 2.0% | |
| 6,914 | 1 | Colfax Corp. | 187,162 |
| 20,708 | | Nordson Corp. | 1,056,729 |
| | TOTAL | 1,243,891 |
| | Miscellaneous Metals – 0.1% | |
| 1,298 | 1 | Materion Corp. | 49,480 |
| | Multi-Industry Basic – 1.3% | |
| 38,878 | | Olin Corp. | 812,939 |
| | Multi-Industry Capital Goods – 1.1% | |
| 12,815 | | Acuity Brands, Inc. | 623,962 |
| 3,482 | 1 | Mistras Group, Inc. | 59,403 |
| | TOTAL | 683,365 |
| | Multi-Industry Transportation – 0.7% | |
| 15,589 | | Brinks Co. (The) | 465,176 |
| | Nickel – 1.7% | |
| 33,858 | 1 | Globe Specialty Metals, Inc. | 781,443 |
| 4,115 | | Haynes International, Inc. | 257,763 |
| | TOTAL | 1,039,206 |
| | Office Furniture – 1.2% | |
| 5,610 | | HNI Corp. | 117,305 |
| 23,535 | | Knoll, Inc. | 429,514 |
| 9,351 | | Miller Herman, Inc. | 215,166 |
| | TOTAL | 761,985 |
| | Office Supplies – 0.3% | |
| 6,634 | | United Stationers, Inc. | 212,885 |
| | Oil Gas & Consumable Fuels – 0.8% | |
| 18,761 | 1 | CVR Energy, Inc. | 503,733 |
| | Oil Refiner – 0.2% | |
| 4,729 | 1 | Western Refining, Inc. | 96,613 |
| | Oil Service, Explore & Drill – 1.0% | |
| 2,438 | 1 | Basic Energy Services, Inc. | 78,967 |
| 13,880 | 1 | Complete Production Services, Inc. | 539,654 |
| | TOTAL | 618,621 |
| | Oil Well Supply – 3.7% | |
| 7,654 | | Carbo Ceramics, Inc. | 1,194,560 |
Annual Shareholder Report24
| Shares | | | Value |
| 47,959 | | RPC, Inc. | 1,132,791 |
| | TOTAL | 2,327,351 |
| | Other Communications Equipment – 0.2% | |
| 3,550 | 1 | Netgear, Inc. | 116,830 |
| | Packaged Foods – 0.3% | |
| 4,548 | 1 | United Natural Foods, Inc. | 189,879 |
| | Paint & Related Materials – 0.1% | |
| 7,299 | 1 | Ferro Corp. | 95,033 |
| | Photo-Optical Component-Equipment – 3.4% | |
| 15,462 | | Cognex Corp. | 524,935 |
| 5,137 | 1 | Coherent, Inc. | 246,730 |
| 18,316 | 1 | II-VI, Inc. | 458,449 |
| 14,982 | 1 | IPG Photonics Corp. | 901,767 |
| | TOTAL | 2,131,881 |
| | Pollution Control – 0.2% | |
| 2,459 | | CLARCOR, Inc. | 108,344 |
| | Printing – 0.3% | |
| 3,401 | 1 | Consolidated Graphics, Inc. | 175,458 |
| | Railroad – 0.1% | |
| 1,727 | 1 | Genesee & Wyoming, Inc., Class A | 95,054 |
| | Recreational Goods – 0.3% | |
| 6,918 | | Sturm Ruger & Co., Inc. | 189,000 |
| | Recreational Vehicles – 0.4% | |
| 4,929 | | Brunswick Corp. | 107,600 |
| 996 | | Polaris Industries, Inc., Class A | 118,076 |
| | TOTAL | 225,676 |
| | Restaurant – 1.1% | |
| 1,927 | 1 | Buffalo Wild Wings, Inc. | 122,422 |
| 7,671 | | Cracker Barrel Old Country Store, Inc. | 346,039 |
| 6,120 | | P. F. Chang's China Bistro, Inc. | 201,532 |
| | TOTAL | 669,993 |
| | Roofing & Wallboard – 0.2% | |
| 6,847 | 1 | Beacon Roofing Supply, Inc. | 146,389 |
| | Rubber – 0.3% | |
| 9,452 | | Cooper Tire & Rubber Co. | 159,361 |
| | Semiconductor Manufacturing – 0.3% | |
| 2,240 | 1 | Omnivision Technologies, Inc. | 65,498 |
Annual Shareholder Report25
| Shares | | | Value |
| 13,710 | 1 | Triquint Semiconductor, Inc. | 103,099 |
| | TOTAL | 168,597 |
| | Semiconductor Manufacturing Equipment – 2.3% | |
| 18,799 | 1 | Brooks Automation, Inc. | 178,779 |
| 34,401 | 1 | GT Solar International, Inc. | 469,230 |
| 8,517 | 1 | Mentor Graphics Corp. | 97,349 |
| 16,560 | 1 | Veeco Instruments, Inc. | 658,922 |
| | TOTAL | 1,404,280 |
| | Services to Medical Professionals – 0.8% | |
| 4,424 | 1 | Centene Corp. | 145,152 |
| 12,902 | 1 | PSS World Medical, Inc. | 308,745 |
| 2,807 | 1 | PharMerica Corp. | 35,845 |
| | TOTAL | 489,742 |
| | Shoes – 4.0% | |
| 42,221 | 1 | CROCs, Inc. | 1,322,784 |
| 9,611 | 1 | DSW, Inc., Class A | 509,191 |
| 17,141 | | Wolverine World Wide, Inc. | 649,129 |
| | TOTAL | 2,481,104 |
| | Software Packaged/Custom – 5.2% | |
| 5,567 | 1 | ACI Worldwide, Inc. | 201,303 |
| 6,396 | 1 | Acxiom Corp. | 87,881 |
| 11,235 | 1 | Aspen Technology, Inc. | 174,142 |
| 10,528 | 1 | Blue Coat Systems, Inc. | 212,139 |
| 4,601 | 1 | BroadSoft, Inc. | 134,395 |
| 4,130 | 1 | DealerTrack Holdings, Inc. | 95,775 |
| 6,464 | | Marketaxess Holdings, Inc. | 168,904 |
| 20,587 | 1 | Parametric Technology Corp. | 428,004 |
| 9,050 | 1 | Progress Software Corp. | 218,105 |
| 19,987 | 1 | Quest Software, Inc. | 379,353 |
| 35,792 | 1 | ValueClick, Inc. | 646,404 |
| 2,865 | 1 | Verint Systems, Inc. | 97,467 |
| 18,482 | 1 | Websense, Inc. | 419,172 |
| | TOTAL | 3,263,044 |
| | Specialty Chemicals – 3.4% | |
| 4,033 | | Chemed Corp. | 245,247 |
| 13,220 | 1 | LSB Industries, Inc. | 525,363 |
| 22,339 | 1 | Rockwood Holdings, Inc. | 1,350,839 |
| | TOTAL | 2,121,449 |
Annual Shareholder Report26
| Shares | | | Value |
| | Specialty Retailing – 3.9% | |
| 2,114 | | Aaron's, Inc. | 53,294 |
| 15,007 | | Ascena Retail Group, Inc. | 485,026 |
| 3,669 | 1 | Dorman Products, Inc. | 131,093 |
| 2,592 | | Finish Line, Inc., Class A | 55,210 |
| 3,445 | 1 | Kirkland's, Inc. | 37,172 |
| 2,989 | 1 | Lumber Liquidators, Inc. | 46,957 |
| 22,119 | | Penske Automotive Group, Inc. | 489,493 |
| 12,987 | | Tractor Supply Co. | 856,103 |
| 6,327 | 1 | Vitamin Shoppe Industries, Inc. | 275,604 |
| | TOTAL | 2,429,952 |
| | Telecommunication Equipment & Services – 2.1% | |
| 6,089 | | Adtran, Inc. | 201,485 |
| 16,231 | 1 | Anixter International, Inc. | 1,013,139 |
| 8,553 | 1 | Brightpoint, Inc. | 77,747 |
| | TOTAL | 1,292,371 |
| | Trucking – 1.4% | |
| 22,880 | 1 | Old Dominion Freight Lines, Inc. | 847,704 |
| | Undesignated Consumer Cyclicals – 5.4% | |
| 24,224 | 1 | Avis Budget Group, Inc. | 366,025 |
| 5,764 | 1 | Bridgepoint Education, Inc. | 142,717 |
| 2,651 | 1 | Capella Education Co. | 113,330 |
| 20,100 | | Nu Skin Enterprises, Inc., Class A | 754,554 |
| 10,510 | 1 | Parexel International Corp. | 215,770 |
| 8,208 | | Pool Corp. | 219,564 |
| 3,999 | | Strayer Education, Inc. | 486,478 |
| 21,928 | 1 | Wright Express Corp. | 1,078,858 |
| | TOTAL | 3,377,296 |
| | Undesignated Consumer Durables – 0.5% | |
| 6,148 | | Group 1 Automotive, Inc. | 292,829 |
| | Undesignated Health – 0.1% | |
| 3,464 | 1 | HealthSouth Corp. | 84,522 |
| | TOTAL COMMON STOCKS
(IDENTIFIED COST $51,860,028) | 61,365,031 |
Annual Shareholder Report27
| Shares | | | Value |
| | MUTUAL FUND – 1.8% | |
| 1,095,096 | 2,3 | Federated Prime Value Obligations Fund, Institutional Shares, 0.13%
(AT NET ASSET VALUE) | 1,095,096 |
| | TOTAL INVESTMENTS — 100.4%
(IDENTIFIED COST $52,955,124)4 | 62,460,127 |
| | OTHER ASSETS AND LIABILITIES - NET — (0.4)%5 | (226,435) |
| | TOTAL NET ASSETS — 100% | $62,233,692 |
| 1 | Non-income producing security. |
| 2 | Affiliated holding. |
| 3 | 7-Day net yield. |
| 4 | The cost for federal tax purposes amounts to $53,032,284. |
| 5 | Assets, other than investments in securities, less liabilities. See Statement of Assets and Liabilities. |
Note: The categories of investments are shown as a percentage of total net assets at July 31, 2011.
Various inputs are used in determining the value of the Fund's investments. These inputs are summarized in the three broad levels listed below:
Level 1 — quoted prices in active markets for identical securities, including investment companies with daily net asset values, if applicable.
Level 2 — other significant observable inputs (including quoted prices for similar securities, interest rates, prepayment speeds, credit risk, etc.). Also includes securities valued at amortized cost.
Level 3 — significant unobservable inputs (including the Fund's own assumptions in determining the fair value of investments).
The inputs or methodology used for valuing securities are not an indication of the risk associated with investing in those securities.
As of July 31, 2011, all investments of the Fund utilized Level 1 inputs in valuing the Fund's assets carried at fair value.
See Notes which are an integral part of the Financial Statements
Annual Shareholder Report28
Statement of Assets and Liabilities
July 31, 2011
| Assets: | | |
| Total investments in securities, at value including $1,095,096 of investments in an affiliated holding (Note 5) (identified cost $52,955,124) | | $62,460,127 |
| Cash | | 169 |
| Income receivable | | 16,184 |
| Receivable for investments sold | | 1,263,670 |
| Receivable for shares sold | | 92,618 |
| TOTAL ASSETS | | 63,832,768 |
| Liabilities: | | |
| Payable for investments purchased | $1,270,989 | |
| Payable for shares redeemed | 178,477 | |
| Payable for transfer and dividend disbursing agent fees and expenses | 54,621 | |
| Payable for distribution services fee (Note 5) | 4,673 | |
| Payable for shareholder services fee (Note 5) | 17,561 | |
| Accrued expenses | 72,755 | |
| TOTAL LIABILITIES | | 1,599,076 |
| Net assets for 5,118,833 shares outstanding | | $62,233,692 |
| Net Assets Consist of: | | |
| Paid-in capital | | $81,583,261 |
| Net unrealized appreciation of investments | | 9,505,003 |
| Accumulated net realized loss on investments and foreign currency transactions | | (28,854,572) |
| TOTAL NET ASSETS | | $62,233,692 |
Annual Shareholder Report29
Statement of Assets and Liabilities — continued| Net Asset Value, Offering Price and Redemption Proceeds Per Share | | |
| Class A Shares: | | |
| Net asset value per share ($25,634,061 ÷ 2,114,496 shares outstanding), no par value, unlimited shares authorized | | $12.12 |
| Offering price per share (100/94.50 of $12.12) | | $12.83 |
| Redemption proceeds per share | | $12.12 |
| Class B Shares: | | |
| Net asset value per share ($2,541,350 ÷ 213,644 shares outstanding), no par value, unlimited shares authorized | | $11.90 |
| Offering price per share | | $11.90 |
| Redemption proceeds per share (94.50/100 of $11.90) | | $11.25 |
| Class C Shares: | | |
| Net asset value per share ($4,662,896 ÷ 402,030 shares outstanding), no par value, unlimited shares authorized | | $11.60 |
| Offering price per share | | $11.60 |
| Redemption proceeds per share (99.00/100 of $11.60) | | $11.48 |
| Institutional Shares: | | |
| Net asset value per share ($29,395,385 ÷ 2,388,663 shares outstanding), no par value, unlimited shares authorized | | $12.31 |
| Offering price per share | | $12.31 |
| Redemption proceeds per share | | $12.31 |
See Notes which are an integral part of the Financial Statements
Annual Shareholder Report30
Statement of Operations
Year Ended July 31, 2011
| Investment Income: | | | |
| Dividends (including $1,984 received from an affiliated holding (Note 5)) | | | $339,296 |
| Expenses: | | | |
| Investment adviser fee (Note 5) | | $678,656 | |
| Administrative fee (Note 5) | | 270,000 | |
| Custodian fees | | 20,125 | |
| Transfer and dividend disbursing agent fees and expenses | | 365,265 | |
| Directors'/Trustees' fees | | 2,463 | |
| Auditing fees | | 22,531 | |
| Legal fees | | 6,727 | |
| Portfolio accounting fees | | 80,380 | |
| Distribution services fee (Note 5) | | 45,321 | |
| Shareholder services fee (Note 5) | | 74,167 | |
| Account administration fee (Note 2) | | 541 | |
| Share registration costs | | 55,137 | |
| Printing and postage | | 51,507 | |
| Insurance premiums | | 4,233 | |
| Miscellaneous | | 6,449 | |
| TOTAL EXPENSES | | 1,683,502 | |
| Waivers and Reimbursement (Note 5): | | | |
| Waiver/reimbursement of investment adviser fee | $(621,383) | | |
| Waiver of administrative fee | (54,408) | | |
| Waiver of distribution services fee | (100) | | |
| TOTAL WAIVERS AND REIMBURSEMENT | | (675,891) | |
| Net expenses | | | 1,007,611 |
| Net investment income (loss) | | | (668,315) |
| Realized and Unrealized Gain on Investments: | | | |
| Net realized gain on investments | | | 16,788,945 |
| Net change in unrealized appreciation of investments | | | 2,272,284 |
| Net realized and unrealized gain on investments | | | 19,061,229 |
| Change in net assets resulting from operations | | | $18,392,914 |
See Notes which are an integral part of the Financial Statements
Annual Shareholder Report31
Statement of Changes in Net Assets
| Year Ended July 31 | 2011 | 2010 |
| Increase (Decrease) in Net Assets | | |
| Operations: | | |
| Net investment income (loss) | $(668,315) | $(666,795) |
| Net realized gain on investments and foreign currency transactions | 16,788,945 | 10,358,241 |
| Net change in unrealized appreciation/depreciation of investments and translation of assets and liabilities in foreign currency | 2,272,284 | (2,811,790) |
| CHANGE IN NET ASSETS RESULTING FROM OPERATIONS | 18,392,914 | 6,879,656 |
| Share Transactions: | | |
| Proceeds from sale of shares | 14,184,989 | 11,120,568 |
| Cost of shares redeemed | (22,350,403) | (34,080,159) |
| CHANGE IN NET ASSETS RESULTING FROM SHARE TRANSACTIONS | (8,165,414) | (22,959,591) |
| Change in net assets | 10,227,500 | (16,079,935) |
| Net Assets: | | |
| Beginning of period | 52,006,192 | 68,086,127 |
| End of period | $62,233,692 | $52,006,192 |
See Notes which are an integral part of the Financial Statements
Annual Shareholder Report32
Notes to Financial Statements
July 31, 2011
1. ORGANIZATION
Federated MDT Series (the “Trust”) is registered under the Investment Company Act of 1940, as amended (the “Act”), as an open-end management investment company. The Trust consists of five portfolios. The financial statements included herein are only those of Federated MDT Small Cap Growth Fund (the “Fund”), a diversified portfolio. The financial statements of the other portfolios are presented separately. The assets of each portfolio are segregated and a shareholder's interest is limited to the portfolio in which shares are held. Each portfolio pays its own expenses. The Fund offers four classes of shares: Class A Shares, Class B Shares, Class C Shares and Institutional Shares. All shares of the Fund have equal rights with respect to voting, except on class-specific matters. The investment objective of the Fund is to provide long-term capital appreciation.
2. SIGNIFICANT ACCOUNTING POLICIES
The following is a summary of significant accounting policies consistently followed by the Fund in the preparation of its financial statements. These policies are in conformity with U.S. generally accepted accounting principles (GAAP).
Investment Valuation
In calculating its net asset value (NAV), the Fund generally values investments as follows:
- Equity securities listed on an exchange or traded through a regulated market system are valued at their last reported sale price or official closing price in their principal exchange or market.
- Shares of other mutual funds are valued based upon their reported NAVs.
- Fixed-income securities acquired with remaining maturities greater than 60 days are fair valued using price evaluations provided by a pricing service approved by the Board of Trustees (the “Trustees”).
- Fixed-income securities acquired with remaining maturities of 60 days or less are valued at their cost (adjusted for the accretion of any discount or amortization of any premium), which approximates market value.
- Derivative contracts listed on exchanges are valued at their reported settlement or closing price.
- Over-the-counter (OTC) derivative contracts are fair valued using price evaluations provided by a pricing service approved by the Trustees.
- For securities that are fair valued in accordance with procedures established by and under the general supervision of the Trustees, certain factors may be considered such as: the purchase price of the security, information obtained by contacting the issuer, analysis of the issuer's financial statements or other available documents, fundamental analytical data, the nature and duration of restrictions on disposition, the movement of the market in which the security is normally traded and public trading in similar securities of the issuer or comparable issuers.
Annual Shareholder Report
33
If the Fund cannot obtain a price or price evaluation from a pricing service for an investment, the Fund may attempt to value the investment based upon the mean of bid and asked quotations or fair value the investment based on price evaluations, from one or more dealers. If any price, quotation, price evaluation or other pricing source is not readily available when the NAV is calculated, the Fund uses the fair value of the investment determined in accordance with the procedures described below. There can be no assurance that the Fund could purchase or sell an investment at the price used to calculate the Fund's NAV.Fair Valuation and Significant Events Procedures
The Trustees have authorized the use of pricing services to provide evaluations of the current fair value of certain investments for purposes of calculating the NAV. Factors considered by pricing services in evaluating an investment include the yields or prices of investments of comparable quality, coupon, maturity, call rights and other potential prepayments, terms and type, reported transactions, indications as to values from dealers and general market conditions. Some pricing services provide a single price evaluation reflecting the bid-side of the market for an investment (a “bid” evaluation). Other pricing services offer both bid evaluations and price evaluations indicative of a price between the prices bid and asked for the investment (a “mid” evaluation). The Fund normally uses bid evaluations for U.S. Treasury and Agency securities, mortgage-backed securities and municipal securities. The Fund normally uses mid evaluations for other types of fixed-income securities and OTC derivative contracts. In the event that market quotations and price evaluations are not available for an investment, the fair value of the investment is determined in accordance with procedures adopted by the Trustees.
The Trustees also have adopted procedures requiring an investment to be priced at its fair value whenever the Adviser determines that a significant event affecting the value of the investment has occurred between the time as of which the price of the investment would otherwise be determined and the time as of which the NAV is computed. An event is considered significant if there is both an affirmative expectation that the investment's value will change in response to the event and a reasonable basis for quantifying the resulting change in value. Examples of significant events that may occur after the close of the principal market on which a security is traded, or after the time of a price evaluation provided by a pricing service or a dealer, include:
- With respect to securities traded in foreign markets, significant trends in U.S. equity markets or in the trading of foreign securities index futures or options contracts;
- With respect to price evaluations of fixed-income securities determined before the close of regular trading on the NYSE, actions by the Federal Reserve Open Market Committee and other significant trends in U.S. fixed-income markets;
- Political or other developments affecting the economy or markets in which an issuer conducts its operations or its securities are traded; and
- Announcements concerning matters such as acquisitions, recapitalizations, litigation developments, a natural disaster affecting the issuer's operations or regulatory changes or market developments affecting the issuer's industry.
The Trustees have approved the use of a pricing service to determine the fair value of equity securities traded principally in foreign markets when the Adviser determines that there has been a significant trend in the U.S. equity markets or in index futures trading. For other significant events, the Fund may seek to obtain more current quotations or price evaluations from alternative pricing sources. If a reliable alternative pricing source is not available, the Fund will determine the fair value of the investment using another method approved by the Trustees.
Annual Shareholder Report
34
Repurchase AgreementsThe Fund may invest in repurchase agreements for short-term liquidity purposes. It is the policy of the Fund to require the other party to a repurchase agreement to transfer to the Fund's custodian or sub-custodian eligible securities or cash with a market value (after transaction costs) at least equal to the repurchase price to be paid under the repurchase agreement. The eligible securities are transferred to accounts with the custodian or sub-custodian in which the Fund holds a “securities entitlement” and exercises “control” as those terms are defined in the Uniform Commercial Code. The Fund has established procedures for monitoring the market value of the transferred securities and requiring the transfer of additional eligible securities if necessary to equal at least the repurchase price. These procedures also allow the other party to require securities to be transferred from the account to the extent that their market value exceeds the repurchase price or in exchange for other eligible securities of equivalent market value.
The insolvency of the other party or other failure to repurchase the securities may delay the disposition of the underlying securities or cause the Fund to receive less than the full repurchase price. Under the terms of the repurchase agreement, any amounts received by the Fund in excess of the repurchase price and related transaction costs must be remitted to the other party.
The Fund may enter into repurchase agreements in which eligible securities are transferred into joint trading accounts maintained by the custodian or sub-custodian for investment companies and other clients advised by the Fund's Adviser and its affiliates. The Fund will participate on a pro rata basis with the other investment companies and clients in its share of the securities transferred under such repurchase agreements and in its share of proceeds from any repurchase or other disposition of such securities.
Investment Income, Gains and Losses, Expenses and Distributions
Investment transactions are accounted for on a trade-date basis. Realized gains and losses from investment transactions are recorded on an identified-cost basis. Interest income and expenses are accrued daily. Dividend income and distributions to shareholders are recorded on the ex-dividend date. Foreign dividends are recorded on the ex-dividend date or when the Fund is informed of the ex-dividend date. Distributions of net investment income, if any, are declared and paid annually. Non-cash dividends included in dividend income, if any, are recorded at fair value. Investment income, realized and unrealized gains and losses, and certain fund-level expenses are allocated to each class based on relative average daily net assets, except that Class A Shares, Class B Shares, Class C Shares and Institutional Shares may bear distribution services fees, shareholder services fees and account administration fees unique to those classes. For the year ended July 31, 2011, account administration fees for the Fund were as follows:
| Account
Administration
Fees Incurred |
| Class A Shares | $307 |
| Class C Shares | 234 |
| TOTAL | $541 |
Dividends are declared separately for each class. No class has preferential dividend rights; differences in per share dividend rates are generally due to differences in separate class expenses.
Annual Shareholder Report
35
Premium and Discount AmortizationAll premiums and discounts on fixed-income securities are amortized/accreted using the effective interest rate method.
Federal Taxes
It is the Fund's policy to comply with the Subchapter M provision of the Internal Revenue Code (the “Code”) and to distribute to shareholders each year substantially all of its income. Accordingly, no provision for federal income tax is necessary. As of and during the year ended July 31, 2011, the Fund did not have a liability for any uncertain tax positions. The Fund recognizes interest and penalties, if any, related to tax liabilities as income tax expense in the Statement of Operations. As of July 31, 2011, tax years 2008 through 2011 remain subject to examination by the Fund's major tax jurisdictions, which include the United States of America and the Commonwealth of Massachusetts.
When-Issued and Delayed Delivery Transactions
The Fund may engage in when-issued or delayed delivery transactions. The Fund records when-issued securities on the trade date and maintains security positions such that sufficient liquid assets will be available to make payment for the securities purchased. Securities purchased on a when-issued or delayed delivery basis are marked to market daily and begin earning interest on the settlement date. Losses may occur on these transactions due to changes in market conditions or the failure of counterparties to perform under the contract.
Foreign Currency Translation
The accounting records of the Fund are maintained in U.S. dollars. All assets and liabilities denominated in foreign currencies (FCs) are translated into U.S. dollars based on the rates of exchange of such currencies against U.S. dollars on the date of valuation. Purchases and sales of securities, income and expenses are translated at the rate of exchange quoted on the respective date that such transactions are recorded. The Fund does not isolate that portion of the results of operations resulting from changes in foreign exchange rates on investments from the fluctuations arising from changes in market prices of securities held. Such fluctuations are included with the net realized and unrealized gain or loss from investments.
Reported net realized foreign exchange gains or losses arise from sales of portfolio securities, sales and maturities of short-term securities, sales of FCs, currency gains or losses realized between the trade and settlement dates on securities transactions, the difference between the amounts of dividends, interest and foreign withholding taxes recorded on the Fund's books, and the U.S. dollar equivalent of the amounts actually received or paid. Net unrealized foreign exchange gains and losses arise from changes in the value of assets and liabilities other than investments in securities at fiscal year end, resulting from changes in the exchange rate.
Other
The preparation of financial statements in conformity with GAAP requires management to make estimates and assumptions that affect the amounts of assets, liabilities, expenses and revenues reported in the financial statements. Actual results could differ from those estimated.
Annual Shareholder Report
36
3. SHARES OF BENEFICIAL INTERESTThe following tables summarize share activity:
| Year Ended July 31 | 2011 | 2010 |
| Class A Shares: | Shares | Amount | Shares | Amount |
| Shares sold | 338,623 | $3,939,179 | 220,893 | $1,830,136 |
| Shares redeemed | (490,937) | (5,523,025) | (717,292) | (5,945,335) |
NET CHANGE RESULTING
FROM CLASS A
SHARE TRANSACTIONS | (152,314) | $(1,583,846) | (496,399) | $(4,115,199) |
| Year Ended July 31 | 2011 | 2010 |
| Class B Shares: | Shares | Amount | Shares | Amount |
| Shares sold | 43,028 | $480,622 | 30,468 | $256,443 |
| Shares redeemed | (101,250) | (1,082,656) | (153,798) | (1,269,484) |
NET CHANGE RESULTING
FROM CLASS B
SHARE TRANSACTIONS | (58,222) | $(602,034) | (123,330) | $(1,013,041) |
| Year Ended July 31 | 2011 | 2010 |
| Class C Shares: | Shares | Amount | Shares | Amount |
| Shares sold | 146,991 | $1,747,238 | 41,076 | $333,177 |
| Shares redeemed | (76,505) | (788,663) | (243,542) | (1,956,318) |
NET CHANGE RESULTING
FROM CLASS C
SHARE TRANSACTIONS | 70,486 | $958,575 | (202,466) | $(1,623,141) |
| Year Ended July 31 | 2011 | 2010 |
| Institutional Shares: | Shares | Amount | Shares | Amount |
| Shares sold | 699,851 | $8,017,950 | 1,036,441 | $8,700,812 |
| Shares redeemed | (1,364,704) | (14,956,059) | (2,934,270) | (24,909,022) |
NET CHANGE RESULTING
FROM INSTITUTIONAL
SHARE TRANSACTIONS | (664,853) | $(6,938,109) | (1,897,829) | $(16,208,210) |
NET CHANGE RESULTING
FROM TOTAL FUND
SHARE TRANSACTIONS | (804,903) | $(8,165,414) | (2,720,024) | $(22,959,591) |
4. FEDERAL TAX INFORMATION
The timing and character of income and capital gain distributions are determined in accordance with income tax regulations, which may differ from GAAP. These differences are due primarily to differing treatments for litigation payments and net operating loss.
Annual Shareholder Report
37
For the year ended July 31, 2011, permanent differences identified and reclassified among the components of net assets were as follows:| Increase (Decrease) |
| Paid-In Capital | Undistributed
Net Investment
Income (Loss) | Accumulated
Net Realized
Gain (Loss) |
| $(671,899) | $668,315 | $3,584 |
Net investment income (loss), net realized gains (losses), and net assets were not affected by this reclassification.
As of July 31, 2011, the components of distributable earnings on a tax basis were as follows:
| Net unrealized appreciation | $9,427,843 |
| Capital loss carryforwards | $(28,777,412) |
The difference between book-basis and tax-basis net unrealized appreciation/depreciation is attributable to differing treatments for the deferral of losses on wash sales.
At July 31, 2011, the cost of investments for federal tax purposes was $53,032,284. The net unrealized appreciation of investments for federal tax purposes was $9,427,843. This consists of net unrealized appreciation from investments for those securities having an excess of value over cost of $62,382,967 and net unrealized depreciation from investments for those securities having an excess of cost over value of $52,955,124.
At July 31, 2011, the Fund had a capital loss carryforward of $28,777,412 which will reduce the Fund's taxable income arising from future net realized gains on investments, if any, to the extent permitted by the Code and thus will reduce the amount of distributions to shareholders which would otherwise be necessary to relieve the Fund of any liability for federal income tax. Pursuant to the Code, such capital loss carryforward will expire as follows:
| Expiration Year | Expiration Amount |
| 2017 | $3,319,329 |
| 2018 | $25,458,083 |
Under the recently enacted Regulated Investment Company Modernization Act of 2010, the Fund will be permitted to carry forward capital losses incurred in taxable years beginning after December 22, 2010, for an unlimited period. However, any losses incurred during those future years will be required to be utilized prior to the losses incurred in pre-enactment tax years. As a result of this ordering rule, pre-enactment capital loss carryforwards may be more likely to expire unused. Additionally, post-enactment capital losses that are carried forward will retain their character as either short-term or long-term capital losses rather than being considered all short-term as under previous law.
The Fund used capital loss carryforwards of $16,766,939 to offset taxable capital gains realized during the year ended July 31, 2011.
Annual Shareholder Report
38
5. INVESTMENT ADVISER FEE AND OTHER TRANSACTIONS WITH AFFILIATESInvestment Adviser Fee
Federated MDTA LLC is the Fund's investment adviser (the “Adviser”). The advisory agreement between the Fund and the Adviser provides for an annual fee equal to 1.15% of the Fund's average daily net assets. Subject to the terms described in the Expense Limitation note, the Adviser may voluntarily choose to waive any portion of its fee. For the year ended July 31, 2011, the Adviser voluntarily waived $620,212 of its fee.
Administrative Fee
Federated Administrative Services (FAS), under the Administrative Services Agreement, provides the Fund with administrative personnel and services. The fee paid to FAS is based on the average aggregate daily net assets of certain Federated funds as specified below:
| Administrative Fee | Average Aggregate Daily Net Assets
of the Federated Funds |
| 0.150% | on the first $5 billion |
| 0.125% | on the next $5 billion |
| 0.100% | on the next $10 billion |
| 0.075% | on assets in excess of $20 billion |
The administrative fee received during any fiscal year shall be at least $150,000 per portfolio and $40,000 per each additional class of Shares. Subject to the terms described in the Expense Limitation note, FAS may voluntarily choose to waive any portion of its fee. For the year ended July 31, 2011, FAS waived $54,408 of its fee. The net fee paid to FAS was 0.365% of average daily net assets of the Fund. The Fund is currently being charged the minimum administrative fee; therefore the fee as a percentage of average daily net assets is greater than the amounts presented in the chart above.
Distribution Services Fee
The Fund has adopted a Distribution Plan (the “Plan”) pursuant to Rule 12b-1 under the Act. Under the terms of the Plan, the Fund will compensate Federated Securities Corp. (FSC), the principal distributor, from the daily net assets of the Fund's Class A Shares, Class B Shares and Class C Shares to finance activities intended to result in the sale of these shares. The Plan provides that the Fund may incur distribution expenses at the following percentages of average daily net assets annually, to compensate FSC:
| Share Class Name | Percentage of Average Daily
Net Assets of Class |
| Class A Shares | 0.05% |
| Class B Shares | 0.75% |
| Class C Shares | 0.75% |
Annual Shareholder Report
39
Subject to the terms described in the Expense Limitation note, FSC may voluntarily choose to waive any portion of its fee. For the year ended July 31, 2011, distribution services fees for the Fund were as follows: | Distribution Services
Fees Incurred | Distribution Services
Fees Waived |
| Class B Shares | $19,245 | $ — |
| Class C Shares | 26,076 | (100) |
| TOTAL | $45,321 | $(100) |
When FSC receives fees, it may pay some or all of them to financial intermediaries whose customers purchase shares. For the year ended July 31, 2011, FSC retained $4,345 of fees paid by the Fund. For the year ended July 31, 2011, the Fund's Class A Shares did not incur a distribution services fee; however, it may begin to incur this fee upon approval of the Trustees.
Sales Charges
Front-end sales charges and contingent deferred sales charges do not represent expenses of the Fund. They are deducted from the proceeds of sales of Fund shares prior to investment or from redemption proceeds prior to remittance, as applicable. For the year ended July 31, 2011, FSC retained $3,372 in sales charges from the sale of Class A Shares.
Shareholder Services Fee
The Fund may pay fees (“Service Fees”) up to 0.25% of the average daily net assets of the Fund's Class A Shares, Class B Shares and Class C Shares to financial intermediaries or to Federated Shareholder Services Company (FSSC) for providing services to shareholders and maintaining shareholder accounts. Subject to the terms described in the Expense Limitation note, FSSC may voluntarily reimburse the Fund for Service Fees. For the year ended July 31, 2011, Service Fees for the Fund were as follows:
| Service
Fees
Incurred |
| Class A Shares | $59,294 |
| Class B Shares | 6,415 |
| Class C Shares | 8,458 |
| TOTAL | $74,167 |
For the year ended July 31, 2011, FSSC received $2,512 of fees paid by the Fund.
Expense Limitation
The Adviser and its affiliates (which may include FSC, FAS and FSSC) have voluntarily agreed to waive their fees and/or reimburse expenses so that the total annual fund operating expenses (as shown in the financial highlights) paid by the Fund's Class A Shares, Class B Shares, Class C Shares and Institutional Shares (after the voluntary waivers and reimbursements) will not exceed 1.75%, 2.50%, 2.50% and 1.50% (the “Fee Limit”), respectively, up to but not including the later of (the “Termination Date”): (a) October 1, 2012; or (b) the date of the Fund's next effective Prospectus. While the Adviser and its affiliates currently do not anticipate terminating or increasing these arrangements prior to the Termination Date, these arrangements may only be terminated or the Fee Limit increased prior to the Termination Date with the agreement of the Trustees.
Annual Shareholder Report
40
GeneralCertain Officers and Trustees of the Trust are Officers and Directors or Trustees of the above companies.
Transactions Involving Affiliated Holdings
Affiliated holdings are mutual funds which are managed by the Adviser or an affiliate of the Adviser. The Adviser has agreed to reimburse the Fund for certain investment adviser fees as a result of transactions in other affiliated mutual funds. For the year ended July 31, 2011, the Adviser reimbursed $1,171. Transactions involving the affiliated holding during the year ended July 31, 2011, were as follows:
| Federated
Prime Value
Obligations
Fund,
Institutional
Shares |
| Balance of Shares Held 7/31/2010 | 761,970 |
| Purchases/Additions | 14,364,263 |
| Sales/Reductions | 14,031,137 |
| Balance of Shares Held 7/31/2011 | 1,095,096 |
| Value | $1,095,096 |
| Dividend Income | $1,984 |
6. Investment TRANSACTIONS
Purchases and sales of investments, excluding long-term U.S. government securities and short-term obligations, for the year ended July 31, 2011, were as follows:
| Purchases | $89,247,057 |
| Sales | $98,157,744 |
7. LINE OF CREDIT
The Fund participates in a $100,000,000 unsecured, uncommitted revolving line of credit (LOC) agreement with PNC Bank. The LOC was made available for extraordinary or emergency purposes, primarily for financing redemption payments. Borrowings are charged interest at a rate offered to the Fund by PNC Bank at the time of the borrowing. As of July 31, 2011, there were no outstanding loans. During the year ended July 31, 2011, the Fund did not utilize the LOC.
8. INTERFUND LENDING
Pursuant to an Exemptive Order issued by the Securities and Exchange Commission, the Fund, along with other funds advised by subsidiaries of Federated Investors, Inc., may participate in an interfund lending program. This program provides an alternative credit facility allowing the Fund to borrow from other participating affiliated funds. As of July 31, 2011, there were no outstanding loans. During the year ended July 31, 2011, the program was not utilized.
Annual Shareholder Report
41
9. RECENT ACCOUNTING PRONOUNCEMENTSIn April 2011, the Financial Accounting Standards Board (FASB) released Accounting Standards Update (ASU) No. 2011-03, “Reconsideration of Effective Control for Repurchase Agreements.” This ASU amends FASB Accounting Standards Codification (ASC) Topic 860, “Transfers and Servicing”; specifically the criteria required to determine whether a repurchase agreement and similar agreements should be accounted for as sales of financial assets or secured borrowings with commitments. This ASU is effective for fiscal years and interim periods beginning after December 15, 2011. At this time, management is evaluating the implications of adopting ASU No. 2011-03 and its impact on the Fund's financial statements and the accompanying notes.
In addition, in May 2011, FASB released ASU No. 2011-04, “Amendments to Achieve Common Fair Value Measurement and Disclosure Requirements in U.S. GAAP and IFRSs.” This ASU amends FASB ASC Topic 820, “Fair Value Measurement,” to establish common requirements for measuring fair value and for disclosing information about fair value measurements in accordance with GAAP. This ASU is effective for fiscal years and interim periods beginning after December 15, 2011. At this time, management is evaluating the implications of adopting ASU No. 2011-04 and its impact on the Fund's financial statements and the accompanying notes.
Annual Shareholder Report42
Report of Independent Registered Public Accounting Firm
TO THE BOARD OF trustees OF Federated MDt series AND SHAREHOLDERS OF federated mdt Small cap growth fund:
We have audited the accompanying statement of assets and liabilities of Federated MDT Small Cap Growth Fund (the “Fund”) (one of the portfolios constituting Federated MDT Series), including the portfolio of investments, as of July 31, 2011, and the related statement of operations for the year then ended, the statement of changes in net assets for each of the two years in the period then ended, and the financial highlights for the periods therein. These financial statements and financial highlights are the responsibility of the Fund's management. Our responsibility is to express an opinion on these financial statements and financial highlights based on our audits.
We conducted our audits in accordance with standards of the Public Company Accounting Oversight Board (United States). Those standards require that we plan and perform the audit to obtain reasonable assurance about whether the financial statements and financial highlights are free of material misstatement. We were not engaged to perform an audit of the Fund's internal control over financial reporting. Our audits included consideration of internal control over financial reporting as a basis for designing audit procedures that are appropriate in the circumstances, but not for the purpose of expressing an opinion on the effectiveness of the Fund's internal control over financial reporting. Accordingly, we express no such opinion. An audit also includes examining, on a test basis, evidence supporting the amounts and disclosures in the financial statements and financial highlights, assessing the accounting principles used and significant estimates made by management, and evaluating the overall financial statement presentation. Our procedures included confirmation of securities owned as of July 31, 2011, by correspondence with the custodian and others, or by other appropriate auditing procedures where replies from others were not received. We believe that our audits provide a reasonable basis for our opinion.
In our opinion, the financial statements and financial highlights referred to above present fairly, in all material respects, the financial position of Federated MDT Small Cap Growth Fund, a portfolio of Federated MDT Series, at July 31, 2011, the results of its operations for the year then ended, the changes in its net assets for each of the two years in the period then ended, and the financial highlights for the periods therein, in conformity with U.S. generally accepted accounting principles.
Boston, Massachusetts
September 23, 2011
Annual Shareholder Report43
Board of Trustees and Trust Officers
The Board of Trustees is responsible for managing the Trust's business affairs and for exercising all the Trust's powers except those reserved for the shareholders. The following tables give information about each Trustee and the senior officers of the Fund. Where required, the tables separately list Trustees who are “interested persons” of the Fund (i.e., “Interested” Trustees) and those who are not (i.e., “Independent” Trustees). Unless otherwise noted, the address of each person listed is Federated Investors Tower, 1001 Liberty Avenue, Pittsburgh, PA 15222. The address of all Independent Trustees listed is 4000 Ericsson Drive, Warrendale, PA 15086-7561; Attention: Mutual Fund Board. As of December 31, 2010, the Trust comprised five portfolio(s), and the Federated Fund Family consisted of 43 investment companies (comprising 136 portfolios). Unless otherwise noted, each Officer is elected annually. Unless otherwise noted, each Trustee oversees all portfolios in the Federated Fund Family and serves for an indefinite term. The Fund's Statement of Additional Information includes additional information about Trust Trustees and is available, without charge and upon request, by calling 1-800-341-7400.
Interested TRUSTEES Background
Name
Birth Date
Positions Held with Trust
Date Service Began | Principal Occupation(s) for Past Five Years,
Other Directorships Held and Previous Position(s) |
John F. Donahue*
Birth Date: July 28, 1924
Trustee
Began serving: June 2006 | Principal Occupations: Director or Trustee of the Federated Fund Family; Chairman and Director, Federated Investors, Inc.; Chairman of the Federated Fund Family's Executive Committee.
Previous Positions: Chairman of the Federated Fund Family; Trustee, Federated Investment Management Company; Chairman and Director, Federated Investment Counseling. |
J. Christopher Donahue*
Birth Date: April 11, 1949
President and Trustee
Began serving: June 2006 | Principal Occupations: Principal Executive Officer and President of the Federated Fund Family; Director or Trustee of some of the Funds in the Federated Fund Family; President, Chief Executive Officer and Director, Federated Investors, Inc.; Chairman and Trustee, Federated Investment Management Company; Trustee, Federated Investment Counseling; Chairman and Director, Federated Global Investment Management Corp.; Chairman, Federated Equity Management Company of Pennsylvania and Passport Research, Ltd. (investment advisory subsidiary of Federated); Trustee, Federated Shareholder Services Company; Director, Federated Services Company.
Previous Positions: President, Federated Investment Counseling; President and Chief Executive Officer, Federated Investment Management Company, Federated Global Investment Management Corp. and Passport Research, Ltd. |
| * | Family relationships and reasons for “interested” status: John F. Donahue is the father of J. Christopher Donahue; both are “interested” due to their beneficial ownership of shares of Federated Investors, Inc. and the positions they hold with Federated and its subsidiaries. |
Annual Shareholder Report44
INDEPENDENT TRUSTEES Background
Name
Birth Date
Positions Held with Trust
Date Service Began | Principal Occupation(s) for Past Five Years,
Other Directorships Held, Previous Position(s) and Qualifications |
Nicholas P. Constantakis, CPA
Birth Date: September 3, 1939
Trustee
Began serving: June 2006 | Principal Occupation: Director or Trustee of the Federated Fund Family.
Other Directorship Held: Director and Chairman of the Audit Committee, Michael Baker Corporation (architecture, engineering and construction services).
Previous Position: Partner, Andersen Worldwide SC.
Qualifications: Public accounting and director experience. |
John F. Cunningham
Birth Date: March 5, 1943
Trustee
Began serving: June 2006 | Principal Occupation: Director or Trustee of the Federated Fund Family.
Other Directorships Held: Chairman, President and Chief Executive Officer, Cunningham & Co., Inc. (strategic business consulting); Trustee Associate, Boston College.
Previous Positions: Director, Redgate Communications and EMC Corporation (computer storage systems); Chairman of the Board and Chief Executive Officer, Computer Consoles, Inc.; President and Chief Operating Officer, Wang Laboratories; Director, First National Bank of Boston; Director, Apollo Computer, Inc.
Qualifications: Business management and director experience. |
Maureen Lally-Green
Birth Date: July 5, 1949
Trustee
Began serving: August 2009 | Principal Occupations: Director or Trustee of the Federated Fund Family; Director, Office of Church Relations, Diocese of Pittsburgh; Adjunct Professor of Law, Duquesne University School of Law.
Other Directorships Held: Director, Auberle; Trustee, St. Francis University; Director, Ireland Institute of Pittsburgh; Director, UPMC Mercy Hospital; Regent, St. Vincent Seminary; Director, Epilepsy Foundation of Western and Central Pennsylvania; Director, Saint Thomas More Society, Allegheny County; Director, Carlow University.
Previous Position: Pennsylvania Superior Court Judge.
Qualifications: Legal and director experience. |
Peter E. Madden
Birth Date: March 16, 1942
Trustee
Began serving: June 2006 | Principal Occupation: Director or Trustee, and Chairman of the Board of Directors or Trustees, of the Federated Fund Family.
Previous Positions: Representative, Commonwealth of Massachusetts General Court; President, Chief Operating Officer and Director, State Street Bank and Trust Company and State Street Corporation (retired); Director, VISA USA and VISA International; Chairman and Director, Massachusetts Bankers Association; Director, Depository Trust Corporation; Director, The Boston Stock Exchange.
Qualifications: Business management, mutual fund services and director experience. |
Annual Shareholder Report45
Name
Birth Date
Positions Held with Trust
Date Service Began | Principal Occupation(s) for Past Five Years,
Other Directorships Held, Previous Position(s) and Qualifications |
Charles F. Mansfield, Jr.
Birth Date: April 10, 1945
Trustee
Began serving: June 2006 | Principal Occupations: Director or Trustee and Chairman of the Audit Committee of the Federated Fund Family; Management Consultant.
Previous Positions: Chief Executive Officer, PBTC International Bank; Partner, Arthur Young & Company (now Ernst & Young LLP); Chief Financial Officer of Retail Banking Sector, Chase Manhattan Bank; Senior Vice President, HSBC Bank USA (formerly, Marine Midland Bank); Vice President, Citibank; Assistant Professor of Banking and Finance, Frank G. Zarb School of Business, Hofstra University; Executive Vice President, DVC Group, Inc. (marketing, communications and technology).
Qualifications: Banking, business management, education and director experience. |
R. James Nicholson
Birth Date: February 4, 1938
Trustee
Began serving: January 2008 | Principal Occupations: Director or Trustee of the Federated Fund Family; Senior Counsel, Brownstein Hyatt Farber Schrek, P.C.; Former Secretary of the U.S. Dept. of Veterans Affairs; Former U.S. Ambassador to the Holy See; Former Chairman of the Republican National Committee.
Other Directorships Held: Director, Horatio Alger Association; Director, The Daniels Fund.
Previous Positions: Colonel, U.S. Army Reserve; Partner, Calkins, Kramer, Grimshaw and Harring, P.C.; General Counsel, Colorado Association of Housing and Building; Chairman and CEO, Nicholson Enterprises, Inc. (real estate holding company); Chairman and CEO, Renaissance Homes of Colorado.
Qualifications: Legal, government, business management and director experience. |
Thomas M. O'Neill
Birth Date: June 14, 1951
Trustee
Began serving: October 2006 | Principal Occupations: Director or Trustee of the Federated Fund Family; Sole Proprietor, Navigator Management Company (investment and strategic consulting).
Other Directorships Held: Board of Overseers, Children's Hospital of Boston; Visiting Committee on Athletics, Harvard College.
Previous Positions: Chief Executive Officer and President, Managing Director and Chief Investment Officer, Fleet Investment Advisors; President and Chief Executive Officer, Aeltus Investment Management, Inc.; General Partner, Hellman, Jordan Management Co., Boston, MA; Chief Investment Officer, The Putnam Companies, Boston, MA; Credit Analyst and Lending Officer, Fleet Bank; Director and Consultant, EZE Castle Software (investment order management software); Director, Midway Pacific (lumber).
Qualifications: Business management, mutual fund, director and investment experience. |
Annual Shareholder Report46
Name
Birth Date
Positions Held with Trust
Date Service Began | Principal Occupation(s) for Past Five Years,
Other Directorships Held, Previous Position(s) and Qualifications |
John S. Walsh
Birth Date: November 28, 1957
Trustee
Began serving: June 2006 | Principal Occupations: Director or Trustee of the Federated Fund Family; President and Director, Heat Wagon, Inc. (manufacturer of construction temporary heaters); President and Director, Manufacturers Products, Inc. (distributor of portable construction heaters); President, Portable Heater Parts, a division of Manufacturers Products, Inc.
Previous Position: Vice President, Walsh & Kelly, Inc.
Qualifications: Business management and director experience. |
James F. Will
Birth Date: October 12, 1938
Trustee
Began serving: June 2006 | Principal Occupations: Director or Trustee of the Federated Fund Family; formerly, Vice Chancellor and President, Saint Vincent College.
Other Directorships Held: Trustee, Saint Vincent College; Director, Alleghany Corporation; Trustee, Wheeling Jesuit University; Director, Liberty Tire Recycling.
Previous Positions: Chairman, President and Chief Executive Officer, Armco, Inc.; President and Chief Executive Officer, Cyclops Industries; President and Chief Operating Officer, Kaiser Steel Corporation.
Qualifications: Business management, education and director experience. |
OFFICERS
Name
Birth Date
Positions Held with Trust
Date Service Began | Principal Occupation(s) for Past Five Years
and Previous Position(s) |
John W. McGonigle
Birth Date: October 26, 1938
Secretary
Began serving: May 2006 | Principal Occupations: Executive Vice President and Secretary of the Federated Fund Family; Vice Chairman, Executive Vice President, Secretary and Director, Federated Investors, Inc.
Previous Positions: Trustee, Federated Investment Management Company and Federated Investment Counseling; Director, Federated Global Investment Management Corp., Federated Services Company and Federated Securities Corp. |
Richard A. Novak
Birth Date: December 25, 1963
TREASURER
Began serving: May 2006 | Principal Occupations: Principal Financial Officer and Treasurer of the Federated Fund Family; Senior Vice President, Federated Administrative Services; Financial and Operations Principal for Federated Securities Corp., Edgewood Services, Inc. and Southpointe Distribution Services, Inc.
Previous Positions: Controller of Federated Investors, Inc.; Vice President, Finance of Federated Services Company; held various financial management positions within The Mercy Hospital of Pittsburgh; Auditor, Arthur Andersen & Co. |
Brian P. Bouda
Birth Date: February 28, 1947
CHIEF COMPLIANCE OFFICER AND SENIOR VICE PRESIDENT
Began serving: June 2006 | Principal Occupations: Senior Vice President and Chief Compliance Officer of the Federated Fund Family; Vice President and Chief Compliance Officer of Federated Investors, Inc. and Chief Compliance Officer of its subsidiaries. Mr. Bouda joined Federated in 1999 and is a member of the American Bar Association and the State Bar Association of Wisconsin. |
Annual Shareholder Report47
Evaluation and Approval of Advisory Contract – May 2011
federated mdt small cap growth fund (the “Fund”)
The Fund's Board reviewed the Fund's investment advisory contract at meetings held in May 2011. The Board's decision regarding the contract reflects the exercise of its business judgment on whether to continue the existing arrangements.
In this connection, the Federated Funds' Board had previously appointed a Senior Officer, whose duties include specified responsibilities relating to the process by which advisory fees are to be charged to a Federated fund. The Senior Officer has the authority to retain consultants, experts, or staff as may be reasonably necessary to assist in the performance of his duties, reports directly to the Board, and may be terminated only with the approval of a majority of the independent members of the Board. The Senior Officer prepared and furnished to the Board an independent, written evaluation that covered topics discussed below (the “Evaluation”). The Board considered that Evaluation, along with other information, in deciding to approve the advisory contract.
During its review of the contract, the Board considered compensation and benefits received by the Adviser. This included the fees received for services provided to the Fund by other entities in the Federated organization and research services (if any) received by the Adviser from brokers that execute Federated fund trades, as well as advisory fees. The Board is also familiar with and considered judicial decisions concerning allegedly excessive investment advisory fees, which have indicated that the following factors may be relevant to an Adviser's fiduciary duty with respect to its receipt of compensation from a fund: the nature and quality of the services provided by the Adviser, including the performance of the fund; the Adviser's cost of providing the services; the extent to which the Adviser may realize “economies of scale” as a fund grows larger; any indirect benefits that may accrue to the Adviser and its affiliates as a result of the Adviser's relationship with a fund; performance and expenses of comparable funds; and the extent to which the independent Board members are fully informed about all facts the Board deems relevant bearing on the Adviser's services and fees. The Board further considered management fees (including any components thereof) charged to institutional and other clients of the Adviser for what might be viewed as like services, and the cost to the Adviser and its affiliates of supplying services pursuant to the management fee agreements, excluding any intra-corporate profit and profit margins of the Adviser and its affiliates for supplying such services. The Board was aware of these factors and was guided by them in its review of the Fund's advisory contract to the extent it considered them to be appropriate and relevant, as discussed further below.
Annual Shareholder Report
48
The Board considered and weighed these circumstances in light of its substantial accumulated experience in governing the Fund and working with Federated on matters relating to the Federated funds, and was assisted in its deliberations by independent legal counsel. Throughout the year, the Board has requested and received substantial and detailed information about the Fund and the Federated organization that was in addition to the extensive materials that comprise and accompany the Senior Officer's Evaluation. Federated provided much of this information at each regular meeting of the Board, and furnished additional information in connection with the particular meeting at which the Board's formal review of the advisory contract occurred. Between regularly scheduled meetings, the Board also received information on particular matters as the need arose. Thus, the Board's consideration of the advisory contract included review of the Senior Officer's Evaluation, accompanying data and additional information covering such matters as: the Adviser's investment philosophy, revenue, profitability, personnel and processes; investment and operating strategies; the Fund's short- and long-term performance (in absolute terms, both on a gross basis and net of expenses, as well as in relationship to its particular investment program and certain competitor or “peer group” funds and/or other benchmarks, as appropriate), and comments on the reasons for performance; the Fund's investment objectives; the Fund's expenses (including the advisory fee itself and the overall expense structure of the Fund, both in absolute terms and relative to similar and/or competing funds, with due regard for contractual or voluntary expense limitations); the use and allocation of brokerage commissions derived from trading the Fund's portfolio securities (if any); and the nature, quality and extent of the advisory and other services provided to the Fund by the Adviser and its affiliates. The Board also considered the preferences and expectations of Fund shareholders and their relative sophistication; the continuing state of competition in the mutual fund industry and market practices; the range of comparable fees for similar funds in the mutual fund industry; the Fund's relationship to the Federated family of funds which include a comprehensive array of funds with different investment objectives, policies and strategies which are available for exchange without the incurrence of additional sales charges; compliance and audit reports concerning the Federated funds and the Federated companies that service them (including communications from regulatory agencies), as well as Federated's responses to any issues raised therein; and relevant developments in the mutual fund industry and how the Federated funds and/or Federated are responding to them. The Board's evaluation process is evolutionary. The criteria considered and the emphasis placed on relevant criteria change in recognition of changing circumstances in the mutual fund marketplace.With respect to the Fund's performance and expenses in particular, the Board has found the use of comparisons to other mutual funds with comparable investment programs to be relevant, given the high degree of competition in the mutual fund business. The Board focused on comparisons with other similar Annual Shareholder Report
49
mutual funds more heavily than non-mutual fund products or services because it is believed that they are more relevant. For example, other mutual funds are the products most like the Fund, they are readily available to Fund shareholders as alternative investment vehicles, and they are the type of investment vehicle in fact chosen and maintained by the Fund's investors. The range of their fees and expenses therefore appears to be a generally reliable indication of what consumers have found to be reasonable in the precise marketplace in which the Fund competes. The Fund's ability to deliver competitive performance when compared to its peer group was a useful indicator of how the Adviser is executing the Fund's investment program, which in turn assisted the Board in reaching a conclusion that the nature, extent, and quality of the Adviser's investment management services were such as to warrant continuation of the advisory contract. In this regard, the Senior Officer has reviewed Federated's fees for providing advisory services to products outside the Federated family of funds (e.g., institutional and separate accounts). He concluded that mutual funds and institutional accounts are inherently different products. Those differences include, but are not limited to, different types of targeted investors; being subject to different laws and regulations; different legal structures; different average account sizes; different associated costs; different portfolio management techniques made necessary by different cash flows; and portfolio manager time spent in review of securities pricing. The Senior Officer did not consider these fee schedules to be determinative in judging the appropriateness of mutual fund advisory contracts.The Senior Officer reviewed information compiled by Federated, using data supplied by independent fund ranking organizations, regarding the performance of, and fees charged by, other mutual funds, noting his view that comparisons to fund peer groups are relevant in judging the reasonableness of proposed fees. He also observed that certain funds may exhibit important differences in their objectives and management techniques when compared to other funds placed in the same peer group by ranking organizations, noting in this connection that the Fund's quantitative investment program is of such a type.
For the periods covered by the Evaluation, the Fund's performance for the one-year period was above the median of the relevant peer group, and the Fund's performance fell below the median of the relevant peer group for the three- and five-year periods. In addition, the Board was informed by the Adviser that, for the same periods, the Fund outperformed its benchmark index for the one-year period, underperformed its benchmark index for the three-year period and underperformed its benchmark index for the five-year period. The Board discussed the Fund's performance with the Adviser and recognized the efforts being undertaken by the Adviser. The Board will continue to monitor these efforts and the performance of the Fund.
Annual Shareholder Report
50
The Board also received financial information about Federated, including information regarding the compensation and benefits Federated derived from its relationships with the Federated funds. This information covered not only the fees under the advisory contracts, but also fees received by Federated's subsidiaries for providing other services to the Federated funds under separate contracts (e.g., for serving as the Federated funds' administrator). The information also detailed any indirect benefit Federated may derive from its receipt of research services from brokers who execute Federated fund trades. In addition, the Board considered the fact that, in order for a fund to be competitive in the marketplace, Federated and its affiliates frequently waived fees and/or reimbursed expenses and have disclosed to fund investors and/or indicated to the Board their intention to do so in the future, where appropriate. Moreover, the Board receives regular reporting as to the institution or elimination of these voluntary waivers.Federated furnished information, requested by the Senior Officer, that reported revenues on a fund-by-fund basis and made estimates of the allocation of expenses on a fund-by-fund basis, using allocation methodologies specified by the Senior Officer. The Senior Officer noted that, although they may apply consistent allocation processes, the inherent difficulties in allocating costs (and the unavoidable arbitrary aspects of that exercise) and the lack of consensus on how to allocate those costs may render such allocation information unreliable. The allocation information was considered in the analysis by the Board but was determined to be of limited use.
The Board and the Senior Officer also reviewed information compiled by Federated comparing profitability information for Federated to other publicly held fund management companies. In this regard, the Senior Officer noted the limited availability of such information, but nonetheless concluded that Federated's profit margins did not appear to be excessive and the Board agreed.
The Senior Officer's Evaluation also discussed the notion of possible realization of “economies of scale” as a fund grows larger. The Board considered in this regard that the Adviser has made significant and long-term investments in areas that support all of the Federated funds, such as personnel and processes for the portfolio management, compliance, internal audit, and risk management functions; and systems technology; and that the benefits of these efforts (as well as any economies, should they exist) were likely to be enjoyed by the fund complex as a whole. Finally, the Board also noted the absence of any applicable regulatory or industry guidelines on this subject, which (as discussed in the Senior Officer's Evaluation) is compounded by the lack of any common industry practice or general pattern with respect to structuring fund advisory fees with “breakpoints” that serve to reduce the fee as the fund attains a certain size. The Senior Officer did not recommend institution of breakpoints in pricing Federated's fund advisory services at this time.
Annual Shareholder Report
51
It was noted in the materials for the Board meeting that for the period covered by the Evaluation, the Fund's investment advisory fee was waived in its entirety. The Board reviewed the contractual fee rate and other expenses of the Fund with the Adviser and was satisfied that the overall expense structure of the Fund remained competitive.The Senior Officer noted that, considering the totality of the circumstances, and all of the factors referenced within his Evaluation, he had concluded that, subject to comments and recommendations made within his Evaluation, his observations and the information accompanying the Evaluation supported a finding by the Board that the management fees for each of the funds are reasonable and that Federated appeared to provide appropriate administrative services to the Fund for the fees paid. Under these circumstances, no changes were recommended to, and no objection was raised to, the continuation of the Fund's advisory contract. The Board concluded that the nature, quality and scope of services provided the Fund by the Adviser and its affiliates were satisfactory.
In its decision to continue an existing investment advisory contract, the Board was mindful of the potential disruptions of the Fund's operations and various risks, uncertainties and other effects that could occur as a result of a decision to terminate or not renew an advisory contract. In particular, the Board recognized that many shareholders have invested in the Fund on the strength of the Adviser's industry standing and reputation and with the expectation that the Adviser will have a continuing role in providing advisory services to the Fund. Thus, the Board's approval of the advisory contract reflected the fact that it is the shareholders who have effectively selected the Adviser by virtue of having invested in the Fund.
The Board based its decision to approve the advisory contract on the totality of the circumstances and relevant factors and with a view to past and future long-term considerations. Not all of the factors and considerations identified above were necessarily relevant to the Fund, nor did the Board consider any one of them to be determinative. With respect to the factors that were relevant, the Board's decision to approve the contract reflects its determination that Federated's performance and actions provided a satisfactory basis to support the decision to continue the existing arrangements.
Annual Shareholder Report52
Voting Proxies on Fund Portfolio Securities
A description of the policies and procedures that the Fund uses to determine how to vote proxies, if any, relating to securities held in the Fund's portfolio is available, without charge and upon request, by calling 1-800-341-7400. A report on “Form N-PX” of how the Fund voted any such proxies during the most recent 12-month period ended June 30 is available from Federated's website at FederatedInvestors.com. To access this information from the home page, select “View All” next to “Find Products.” Select a fund name and share class, if applicable, to go to the Fund Overview page. On the Fund Overview page, select the “Documents” tab. At the bottom of that page, select “Proxy Voting Record Report (Form N-PX).” Form N-PX filings are also available at the SEC's website at www.sec.gov.
Quarterly Portfolio Schedule
The Fund files with the SEC a complete schedule of its portfolio holdings, as of the close of the first and third quarters of its fiscal year, on “Form N-Q.” These filings are available on the SEC's website at www.sec.gov and may be reviewed and copied at the SEC's Public Reference Room in Washington, DC. (Call 1-800-SEC-0330 for information on the operation of the Public Reference Room.) You may also access this information from the “Products” section of Federated's website at FederatedInvestors.com. From the home page, select “View All” next to “Find Products.” Select a fund name and share class, if applicable, to go to the Fund Overview page. On the Fund Overview page, select the “Documents” tab. At the bottom of that page, select “Form N-Q.”
Annual Shareholder Report53
Notes [Page Intentionally Left Blank]
Notes [Page Intentionally Left Blank]
Notes [Page Intentionally Left Blank]
Notes [Page Intentionally Left Blank]
Notes [Page Intentionally Left Blank]
Notes [Page Intentionally Left Blank]
Mutual funds are not bank deposits or obligations, are not guaranteed by any bank and are not insured or guaranteed by the U.S. government, the Federal Deposit Insurance Corporation, the Federal Reserve Board or any other government agency. Investment in mutual funds involves investment risk, including the possible loss of principal.
This Report is authorized for distribution to prospective investors only when preceded or accompanied by the Fund's Prospectus, which contains facts concerning its objective and policies, management fees, expenses and other information.
Federated MDT Small Cap Growth Fund
Federated Investors Funds
4000 Ericsson Drive
Warrendale, PA 15086-7561
Contact us at FederatedInvestors.com
or call 1-800-341-7400.
Federated Securities Corp., Distributor
Cusip 31421R775
Cusip 31421R676
Cusip 31421R767
Cusip 31421R759
37313 (9/11)
Federated is a registered trademark of Federated Investors, Inc.
2011 © Federated Investors, Inc.
Item 2. Code of Ethics
(a) As of the end of the period covered by this report, the registrant has adopted a code of ethics (the "Section 406 Standards for Investment Companies - Ethical Standards for Principal Executive and Financial Officers") that applies to the registrant's Principal Executive Officer and Principal Financial Officer; the registrant's Principal Financial Officer also serves as the Principal Accounting Officer.
(c) Not Applicable
(d) Not Applicable
(e) Not Applicable
(f)(3) The registrant hereby undertakes to provide any person, without charge, upon request, a copy of the code of ethics. To request a copy of the code of ethics, contact the registrant at 1-800-341-7400, and ask for a copy of the Section 406 Standards for Investment Companies - Ethical Standards for Principal Executive and Financial Officers.
Item 3. Audit Committee Financial Expert
The registrant's Board has determined that each of the following members of the Board's Audit Committee is an “audit committee financial expert,” and is "independent," for purposes of this Item: Nicholas P. Constantakis, Charles F. Mansfield, Jr., Thomas M. O'Neill and John S. Walsh.
Item 4. Principal Accountant Fees and Services
(a) Audit Fees billed to the registrant for the two most recent fiscal years:
Fiscal year ended 2011 - $115,500
Fiscal year ended 2010 – $115,500
(b) Audit-Related Fees billed to the registrant for the two most recent fiscal years:
Fiscal year ended 2011 - $122
Fiscal year ended 2010 – $280
Travel to Audit Committee Meetings.
Amount requiring approval of the registrant’s audit committee pursuant to paragraph (c)(7)(ii) of Rule 2-01 of Regulation S-X, $0 and $11,876, respectively. Fiscal year ended 2010- Audit consents issued for N-14 merger documents.
(c) Tax Fees billed to the registrant for the two most recent fiscal years:
Fiscal year ended 2011 - $0
Fiscal year ended 2010 - $0
Amount requiring approval of the registrant’s audit committee pursuant to paragraph (c)(7)(ii) of Rule 2-01 of Regulation S-X, $14,714 and $0, respectively. Fiscal year ended 2011- Tax preparation fees for fiscal year end 2010.
(d) All Other Fees billed to the registrant for the two most recent fiscal years:
Fiscal year ended 2011 - $0
Fiscal year ended 2010 - $0
Amount requiring approval of the registrant’s audit committee pursuant to paragraph (c)(7)(ii) of Rule 2-01 of Regulation S-X, $32,907 and $22,374, respectively. Fiscal year ended 2011- Service fee for analysis of potential Passive Foreign Investment Company holdings. Fiscal year ended 2010- Service fee for analysis of potential Passive Foreign Investment Company holdings.
(e)(1) Audit Committee Policies regarding Pre-approval of Services.
The Audit Committee is required to pre-approve audit and non-audit services performed by the independent auditor in order to assure that the provision of such services do not impair the auditor’s independence. Unless a type of service to be provided by the independent auditor has received general pre-approval, it will require specific pre-approval by the Audit Committee. Any proposed services exceeding pre-approved cost levels will require specific pre-approval by the Audit Committee.
Certain services have the general pre-approval of the Audit Committee. The term of the general pre-approval is 12 months from the date of pre-approval, unless the Audit Committee specifically provides for a different period. The Audit Committee will annually review the services that may be provided by the independent auditor without obtaining specific pre-approval from the Audit Committee and may grant general pre-approval for such services. The Audit Committee will revise the list of general pre-approved services from time to time, based on subsequent determinations. The Audit Committee will not delegate its responsibilities to pre-approve services performed by the independent auditor to management.
The Audit Committee has delegated pre-approval authority to its Chairman. The Chairman will report any pre-approval decisions to the Audit Committee at its next scheduled meeting. The Committee will designate another member with such pre-approval authority when the Chairman is unavailable.
AUDIT SERVICES
The annual Audit services engagement terms and fees will be subject to the specific pre-approval of the Audit Committee. The Audit Committee must approve any changes in terms, conditions and fees resulting from changes in audit scope, registered investment company (RIC) structure or other matters.
In addition to the annual Audit services engagement specifically approved by the Audit Committee, the Audit Committee may grant general pre-approval for other Audit Services, which are those services that only the independent auditor reasonably can provide. The Audit Committee has pre-approved certain Audit services, all other Audit services must be specifically pre-approved by the Audit Committee.
AUDIT-RELATED SERVICES
Audit-related services are assurance and related services that are reasonably related to the performance of the audit or review of the Company’s financial statements or that are traditionally performed by the independent auditor. The Audit Committee believes that the provision of Audit-related services does not impair the independence of the auditor, and has pre-approved certain Audit-related services, all other Audit-related services must be specifically pre-approved by the Audit Committee.
TAX SERVICES
The Audit Committee believes that the independent auditor can provide Tax services to the Company such as tax compliance, tax planning and tax advice without impairing the auditor’s independence. However, the Audit Committee will not permit the retention of the independent auditor in connection with a transaction initially recommended by the independent auditor, the purpose of which may be tax avoidance and the tax treatment of which may not be supported in the Internal Revenue Code and related regulations. The Audit Committee has pre-approved certain Tax services, all Tax services involving large and complex transactions must be specifically pre-approved by the Audit Committee.
ALL OTHER SERVICES
With respect to the provision of services other than audit, review or attest services the pre-approval requirement is waived if:
(1) The aggregate amount of all such services provided constitutes no more than five percent of the total amount of revenues paid by the registrant, the registrant’s adviser (not including any sub-adviser whose role is primarily portfolio management and is subcontracted with or overseen by another investment adviser), and any entity controlling, controlled by, or under common control with the investment adviser that provides ongoing services to the registrant to its accountant during the fiscal year in which the services are provided;
(2) Such services were not recognized by the registrant, the registrant’s adviser (not including any sub-adviser whose role is primarily portfolio management and is subcontracted with or overseen by another investment adviser), and any entity controlling, controlled by, or under common control with the investment adviser that provides ongoing services to the registrant at the time of the engagement to be non-audit services; and
(3) Such services are promptly brought to the attention of the Audit Committee of the issuer and approved prior to the completion of the audit by the Audit Committee or by one or more members of the Audit Committee who are members of the board of directors to whom authority to grant such approvals has been delegated by the Audit Committee.
The Audit Committee may grant general pre-approval to those permissible non-audit services classified as All Other services that it believes are routine and recurring services, and would not impair the independence of the auditor.
The SEC’s rules and relevant guidance should be consulted to determine the precise definitions of prohibited non-audit services and the applicability of exceptions to certain of the prohibitions.
PRE-APPROVAL FEE LEVELS
Pre-approval fee levels for all services to be provided by the independent auditor will be established annually by the Audit Committee. Any proposed services exceeding these levels will require specific pre-approval by the Audit Committee.
PROCEDURES
Requests or applications to provide services that require specific approval by the Audit Committee will be submitted to the Audit Committee by both the independent auditor and the Principal Accounting Officer and/or Internal Auditor, and must include a joint statement as to whether, in their view, the request or application is consistent with the SEC’s rules on auditor independence.
(e)(2) Percentage of services identified in items 4(b) through 4(d) that were approved by the registrants audit committee pursuant to paragraph (c)(7)(i)(C) of Rule 2-01 of Regulation S-X:
4(b)
Fiscal year ended 2011 – 0%
Fiscal year ended 2010 – 0%
Percentage of services provided to the registrants investment adviser and any entity controlling, controlled by, or under common control with the investment adviser that provides ongoing services to the registrant that were approved by the registrants audit committee pursuant to paragraph (c)(7)(i)(C) of Rule 2-01 of Regulation S-X, 0% and 0% respectively.
4(c)
Fiscal year ended 2011 – 0%
Fiscal year ended 2010 – 0%
Percentage of services provided to the registrants investment adviser and any entity controlling, controlled by, or under common control with the investment adviser that provides ongoing services to the registrant that were approved by the registrants audit committee pursuant to paragraph (c)(7)(i)(C) of Rule 2-01 of Regulation S-X, 0% and 0% respectively.
4(d)
Fiscal year ended 2011 – 0%
Fiscal year ended 2010 – 0%
Percentage of services provided to the registrants investment adviser and any entity controlling, controlled by, or under common control with the investment adviser that provides ongoing services to the registrant that were approved by the registrants audit committee pursuant to paragraph (c)(7)(i)(C) of Rule 2-01 of Regulation S-X, 0% and 0% respectively.
(f) NA
(g) Non-Audit Fees billed to the registrant, the registrant’s investment adviser, and certain entities controlling, controlled by or under common control with the investment adviser:
Fiscal year ended 2011 - $326,625
Fiscal year ended 2010 - $418,705
(h) The registrant’s Audit Committee has considered that the provision of non-audit services that were rendered to the registrant’s adviser (not including any sub-adviser whose role is primarily portfolio management and is subcontracted with or overseen by another investment adviser), and any entity controlling, controlled by, or under common control with the investment adviser that provides ongoing services to the registrant that were not pre-approved pursuant to paragraph (c)(7)(ii) of Rule 2-01 of Regulation S-X is compatible with maintaining the principal accountant’s independence.
Item 5. Audit Committee of Listed Registrants
Not Applicable
Item 6. Schedule of Investments
Not Applicable
Item 7. Disclosure of Proxy Voting Policies and Procedures for Closed-End Management Investment Companies
Not Applicable
Item 8. Portfolio Managers of Closed-End Management Investment Companies
Not Applicable
Item 9. Purchases of Equity Securities by Closed-End Management Investment Company and Affiliated Purchasers
Not Applicable
Item 10. Submission of Matters to a Vote of Security Holders
Not Applicable
Item 11. Controls and Procedures
(a) The registrant’s President and Treasurer have concluded that the
registrant’s disclosure controls and procedures (as defined in rule 30a-3(c) under the Act) are effective in design and operation and are sufficient to form the basis of the certifications required by Rule 30a-(2) under the Act, based on their evaluation of these disclosure controls and procedures within 90 days of the filing date of this report on Form N-CSR.
(b) There were no changes in the registrant’s internal control over financial reporting (as defined in rule 30a-3(d) under the Act) during the second fiscal quarter of the period covered by this report that have materially affected, or are reasonably likely to materially affect, the registrant’s internal control over financial reporting.
Item 12. Exhibits
SIGNATURES
Pursuant to the requirements of the Securities Exchange Act of 1934 and the Investment Company Act of 1940, the registrant has duly caused this report to be signed on its behalf by the undersigned, thereunto duly authorized.
Registrant Federated MDT Series
By /S/ Richard A. Novak
Richard A. Novak, Principal Financial Officer
Date September 21, 2011
Pursuant to the requirements of the Securities Exchange Act of 1934 and the Investment Company Act of 1940, this report has been signed below by the following persons on behalf of the registrant and in the capacities and on the dates indicated.
By /S/ J. Christopher Donahue
J. Christopher Donahue, Principal Executive Officer
Date September 21, 2011
By /S/ Richard A. Novak
Richard A. Novak, Principal Financial Officer
Date September 21, 2011