United States
Securities and Exchange Commission
Washington, D.C. 20549
Amended
Form N-CSR
Certified Shareholder Report of Registered Management Investment Companies
811-21904
(Investment Company Act File Number)
Federated MDT Series
_______________________________________________________________
(Exact Name of Registrant as Specified in Charter)
Federated Investors Funds
4000 Ericsson Drive
Warrendale, Pennsylvania 15086-7561
(Address of Principal Executive Offices)
(412) 288-1900
(Registrant's Telephone Number)
John W. McGonigle, Esquire
Federated Investors Tower
1001 Liberty Avenue
Pittsburgh, Pennsylvania 15222-3779
(Name and Address of Agent for Service)
(Notices should be sent to the Agent for Service)
Date of Fiscal Year End: 07/31/2012
Date of Reporting Period: 07/31/2012
Item 1. Reports to Stockholders

Annual Shareholder Report
July 31, 2012
| Share Class | Ticker |
| A | QASCX |
| C | QCSCX |
| Institutional | QISCX |
Federated MDT Small Cap Core Fund
Fund Established 2005
A Portfolio of Federated MDT Series
Dear Valued Shareholder,
I am pleased to present the Annual Shareholder Report for your fund covering the period from August 1, 2011 through July 31, 2012. This report includes Management's Discussion of Fund Performance, a complete listing of your fund's holdings, performance information and financial statements along with other important fund information.
In addition, our website, FederatedInvestors.com, offers easy access to Federated resources that include timely fund updates, economic and market insights from our investment strategists, and financial planning tools. We invite you to register to take full advantage of its capabilities.
Thank you for investing with Federated. I hope you find this information useful and look forward to keeping you informed.
Sincerely,
J. Christopher Donahue, President
Not FDIC Insured • May Lose Value • No Bank Guarantee
Management's Discussion of Fund Performance (unaudited)
The Fund's total return, based on net asset value, for the 12-month reporting period ended July 31, 2012 was -3.64% for Class A Shares, -4.34% for Class C Shares and -3.30% for Institutional Shares. The total return of the Russell 2000® Index (Russell 2000®),1 a broad-based securities market index, was 0.19% for the same period. The Fund's total return for the fiscal year reflected actual cash flows, transaction costs and other fees which were not reflected in the total return of the Russell 2000®.
MARKET OVERVIEW
During the 12-month reporting period, domestic equity market performance was favorable as evidenced by the 7.33% return on the Russell 3000 Index.2 Large-cap stocks led the way, as demonstrated by the 10.41% return of the Russell Top 200® Index,3 exceeding by far the 2.28% and 0.19% results for the Russell Midcap® Index,4 representing the mid-cap stocks, and the Russell 2000®, representing small-cap stocks,5 respectively. Growth stocks outperformed value stocks slightly during the year with the Russell 3000® Growth Index6 returning 7.55% as compared to 7.09% for the Russell 3000® Value Index.7
The best performing sectors in the Russell 2000® during the period were Utilities(+14.17%), Health Care (+10.39%) and Financials (+9.07%). Underperforming sectors included Energy (-27.27%), Materials (-12.26%) and Industrials (-2.85%).
FUND PERFORMANCE
During the reporting period, the most significant positive factor in the Fund's performance relative to the Russell 2000® was stock selection in the Transportation, Financials and Consumer Durables sectors. The most significant negative factors in the Fund's performance were underweights in the Health Care and Utilities sectors, which outperformed the Russell 2000®, and unfavorable stock selection in those sectors. Poor stock selection and overweights in the Materials and Industrials sectors, which underperformed the Russell 2000®, also detracted moderately from relative performance.
Individual stocks enhancing the Fund's performance included US Airways Group, Arctic Cat, Wellcare Health Plans, Cray and Rent-A-Center.
Individual stocks detracting from the performance included Bridgepoint Education, GT Advanced Technologies, Twin Disc, TPC Group and ManTech International.
Annual Shareholder Report
| 1 | The Russell 2000® Index measures the performance of the 2,000 smallest companies in the Russell 3000®Index, which represents approximately 7% of the total market capitalization of the Russell 3000®Index. The index is unmanaged, and it is not possible to invest directly in an index. |
| 2 | The Russell 3000® Index offers investors access to the broad U.S. equity universe representing approximately 98% of the U.S. market. The Russell 3000® Index is constructed to provide a comprehensive, unbiased and stable barometer of the broad market and is completely reconstituted annually to ensure new and growing equities are reflected. The index is unmanaged, and it is not possible to invest directly in an index. |
| 3 | The Russell Top 200® Index measures the performance of the 200 largest companies in the Russell 1000® Index and represents approximately 66% of the total market capitalization of the Russell 1000® Index. The index is unmanaged, and it is not possible to invest directly in an index. |
| 4 | The Russell Midcap® Index measures the performance of the 800 smallest companies in the Russell 1000® Index and represents approximately 27% of the total market capitalization of the Russell 1000® Index. The index is unmanaged, and it is not possible to invest directly in an index. |
| 5 | Small company stocks may be less liquid and subject to greater price volatility than large capitalization stocks. |
| 6 | The Russell 3000® Growth Index measures the performance of those Russell 3000 Index companies with higher price-to-book ratios and higher forecasted growth values. The stocks in this index are also members of either the Russell 1000® Growth or the Russell 2000® Growth indexes. The index is unmanaged, and it is not possible to invest directly in an index. |
| 7 | The Russell 3000® Value Index measures the performance of those Russell 3000® Index companies with lower price-to-book ratios and lower forecasted growth values. The stocks in this index are also members of either the Russell 1000® Value or the Russell 2000® Value indexes. The index is unmanaged, and it is not possible to invest directly in an index. |
Annual Shareholder Report
FUND PERFORMANCE AND GROWTH OF A $10,000 INVESTMENT
The Average Annual Total Return table below shows returns for each class averaged over the stated periods. The graphs below illustrate the hypothetical investment of $10,0001 in the Federated MDT Small Cap Core Fund2 (the “Fund”) from September 15, 2005 (start of performance) to July 31, 2012, compared to the Russell 2000® Index.3
Average Annual Total Returns for the Periods Ended 7/31/2012
(returns reflect all applicable sales charges and contingent deferred sales charges as specified below in footnote #1)
| Share Class | 1 Year | 5 Years | Start of
Performance* |
| Class A Shares | -8.99% | -6.31% | -0.68% |
| Class C Shares | -5.30% | -5.95% | -0.60% |
| Institutional Shares | -3.30% | -5.04% | 0.36% |
| * | The Fund's start of performance date was September 15, 2005. |
Performance data quoted represents past performance which is no guarantee of future results. Investment return and principal value will fluctuate so that an investor's shares, when redeemed, may be worth more or less than their original cost. Mutual fund performance changes over time and current performance may be lower or higher than what is stated. For current to the most recent month-end performance and after-tax returns, visit FederatedInvestors.com or call 1-800-341-7400. Returns shown do not reflect the deduction of taxes that a shareholder would pay on Fund distributions or the redemption of Fund shares. Mutual funds are not obligations of or guaranteed by any bank and are not federally insured.
Growth of a $10,000 INVESTMENT–CLASS A SHARES
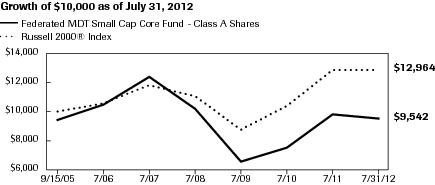
| Federated MDT Small Cap Core Fund - Class A Shares | C000035058 | Russell 2000® Index |
| 9/15/2005 | 9,450 | 10,000 |
| 7/31/2006 | 10,499 | 10,633 |
| 7/31/2007 | 12,493 | 11,922 |
| 7/31/2008 | 10,234 | 11,122 |
| 7/31/2009 | 6,595 | 8,817 |
| 7/31/2010 | 7,567 | 10,442 |
| 7/31/2011 | 9,903 | 12,940 |
| 7/31/2012 | 9,542 | 12,964 |
41 graphic description end -->
| ■ | Total returns shown include the maximum sales charge of 5.50% ($10,000 investment minus $550 sales charge = $9,450). |
Annual Shareholder Report
Growth of a $10,000 INVESTMENT–CLASS C SHARES
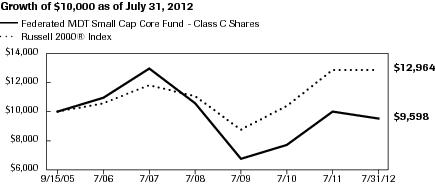
| Federated MDT Small Cap Core Fund - Class C Shares | C000035059 | Russell 2000® Index |
| 9/15/2005 | 10,000 | 10,000 |
| 7/31/2006 | 11,050 | 10,633 |
| 7/31/2007 | 13,040 | 11,922 |
| 7/31/2008 | 10,606 | 11,122 |
| 7/31/2009 | 6,784 | 8,817 |
| 7/31/2010 | 7,729 | 10,442 |
| 7/31/2011 | 10,033 | 12,940 |
| 7/31/2012 | 9,598 | 12,964 |
41 graphic description end -->
| ■ | Total returns shown include the maximum contingent deferred sales charge of 1.00%, as applicable. |
Growth of a $10,000 INVESTMENT–INSTITUTIONAL SHARES
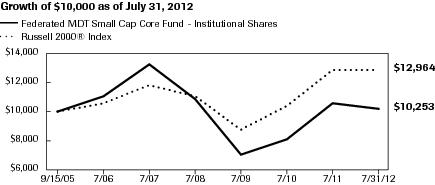
| Federated MDT Small Cap Core Fund - Institutional Shares | C000035060 | Russell 2000® Index |
| 9/15/2005 | 10,000 | 10,000 |
| 7/31/2006 | 11,140 | 10,633 |
| 7/31/2007 | 13,280 | 11,922 |
| 7/31/2008 | 10,900 | 11,122 |
| 7/31/2009 | 7,030 | 8,817 |
| 7/31/2010 | 8,090 | 10,442 |
| 7/31/2011 | 10,603 | 12,940 |
| 7/31/2012 | 10,253 | 12,964 |
41 graphic description end -->
| 1 | Represents a hypothetical investment of $10,000 in the Fund after deducting applicable sales charges: For Class A Shares, the maximum sales charge of 5.50% ($10,000 investment minus $550 sales charge = $9,450); for Class C Shares, a 1.00% contingent deferred sales charge would be applied on any redemption less than one year from the purchase date. The Fund's performance assumes the reinvestment of all dividends and distributions. The Russell 2000® Index has been adjusted to reflect reinvestment of dividends on securities in the index. |
| 2 | The Fund is a successor to MDT Small Cap Core Fund pursuant to a reorganization that took place on December 8, 2006. Prior to that date, the Fund had no investment operations. Accordingly, the performance information shown for periods prior to that date is that of the MDT Small Cap Core Fund. |
| 3 | The Russell 2000® Index measures the performance of the 2,000 smallest companies in the Russell 3000® Index, which represents approximately 10% of the total market capitalization of the Russell 3000® Index. The index is not adjusted to reflect sales charges, expenses or other fees that the Securities and Exchange Commission requires to be reflected in the Fund's performance. It is not possible to invest directly in an index. |
Annual Shareholder Report
Portfolio of Investments Summary Table (unaudited)
At July 31, 2012, the Fund's industry composition1 was as follows:
| Industry Composition | Percentage of
Total Net Assets |
| Regional Banks | 5.3% |
| Financial Services | 4.5% |
| Specialty Retailing | 4.0% |
| Computer Services | 3.7% |
| Paper Products | 2.4% |
| Specialty Chemicals | 2.4% |
| Miscellaneous Components | 2.3% |
| Oil Service, Explore & Drill | 2.3% |
| Miscellaneous Food Products | 2.1% |
| Oil Refiner | 1.9% |
| Airline - Regional | 1.8% |
| Other Tobacco Products | 1.8% |
| Auto Original Equipment Manufacturers | 1.7% |
| Biotechnology | 1.7% |
| Crude Oil & Gas Production | 1.7% |
| Electrical Equipment | 1.7% |
| Hotels and Motels | 1.7% |
| Airline - National | 1.6% |
| Apparel | 1.6% |
| Professional Services | 1.6% |
| Property Liability Insurance | 1.6% |
| Diversified Leisure | 1.5% |
| Personal Loans | 1.5% |
| Software Packaged/Custom | 1.5% |
| Auto Rentals | 1.4% |
| Life Insurance | 1.4% |
| Education & Training Services | 1.3% |
| Printing | 1.3% |
| Telecommunication Equipment & Services | 1.3% |
| Generic Drugs | 1.2% |
| Multi-Line Insurance | 1.2% |
| Office Supplies | 1.2% |
| Recreational Vehicles | 1.2% |
| Rubber | 1.2% |
| Semiconductor Manufacturing | 1.2% |
| Clothing Stores | 1.1% |
| Construction Machinery | 1.1% |
Annual Shareholder Report
| Industry Composition | Percentage of
Total Net Assets |
| Health Care | 1.1% |
| Commodity Chemicals | 1.0% |
| Computer Networking | 1.0% |
| Defense Electronics | 1.0% |
| Medical Supplies | 1.0% |
| Metal Fabrication | 1.0% |
| Recreational Goods | 1.0% |
| Toys & Games | 1.0% |
| Other2 | 20.3% |
| Cash Equivalents3 | 1.8% |
| Other Assets and Liabilities—Net4 | (0.2)% |
| TOTAL | 100.0% |
| 1 | Except for Cash Equivalents and Other Assets and Liabilities, industry classifications are based upon, and individual portfolio securities are assigned to, the classifications of the Global Industry Classification Standard (GICS) except that the Adviser assigns a classification to securities not classified by the GICS and to securities for which the Adviser does not have access to the classification made by the GICS. |
| 2 | For purposes of this table, industry classifications which constitute less than 1.0% of the Fund's total net assets have been aggregated under the designation “Other.” |
| 3 | Cash Equivalents include any investments in money market mutual funds and/or overnight repurchase agreements. |
| 4 | Assets, other than investments in securities, less liabilities. See Statement of Assets and Liabilities.
|
Annual Shareholder Report
Portfolio of Investments
July 31, 2012
| Shares | | | Value |
| | COMMON STOCKS—98.4% | |
| | Accident & Health Insurance—0.1% | |
| 1,087 | 1 | Triple-S Management Corp., Class B | $19,805 |
| | Agricultural Machinery—0.2% | |
| 534 | | Lindsay Manufacturing Co. | 37,861 |
| | Airline - National—1.6% | |
| 19,427 | 1 | Jet Blue Airways Corp. | 107,043 |
| 13,570 | 1 | US Airways Group, Inc. | 155,512 |
| | TOTAL | 262,555 |
| | Airline - Regional—1.8% | |
| 6,676 | 1 | Alaska Air Group, Inc. | 232,659 |
| 674 | 1 | Allegiant Travel Co. | 47,894 |
| 5,614 | 1 | Republic Airways Holdings, Inc. | 25,544 |
| | TOTAL | 306,097 |
| | Aluminum—0.2% | |
| 554 | | Kaiser Aluminum Corp. | 30,215 |
| 1,454 | | Noranda Aluminum, Inc. | 9,059 |
| | TOTAL | 39,274 |
| | Apparel—1.6% | |
| 5,237 | 1 | Express, Inc. | 84,316 |
| 1,249 | 1 | Iconix Brand Group, Inc. | 22,145 |
| 3,720 | 1 | Warnaco Group, Inc. | 158,695 |
| | TOTAL | 265,156 |
| | Auto Original Equipment Manufacturers—1.7% | |
| 11,958 | | Dana Holding Corp. | 157,606 |
| 4,292 | 1 | Modine Manufacturing Co. | 28,799 |
| 3,454 | 1 | Tenneco Automotive, Inc. | 101,168 |
| | TOTAL | 287,573 |
| | Auto Rentals—1.4% | |
| 2,502 | 1 | AMERCO | 233,687 |
| | Biotechnology—1.7% | |
| 7,850 | 1 | Cambrex Corp. | 72,456 |
| 12,413 | | PDL BioPharma, Inc. | 84,284 |
| 2,179 | 1 | Questcor Pharmaceuticals, Inc. | 80,340 |
| 1,434 | 1 | Theravance, Inc. | 41,772 |
| | TOTAL | 278,852 |
Annual Shareholder Report
| Shares | | | Value |
| | COMMON STOCKS—continued | |
| | Broadcasting—0.5% | |
| 2,504 | 1 | Fisher Communications, Inc. | $80,028 |
| | Building Materials—0.1% | |
| 669 | | Universal Forest Products, Inc. | 21,361 |
| | Business Services—0.1% | |
| 700 | 1 | Euronet Worldwide, Inc. | 12,796 |
| | Carpets—0.2% | |
| 3,365 | | Culp, Inc. | 33,650 |
| | Cement—0.5% | |
| 1,959 | | Eagle Materials, Inc. | 68,075 |
| 488 | | Texas Industries, Inc. | 20,384 |
| | TOTAL | 88,459 |
| | Clothing Stores—1.1% | |
| 2,550 | 1 | Citi Trends, Inc. | 38,326 |
| 3,800 | | Mens Wearhouse, Inc. | 103,550 |
| 7,586 | 1 | New York & Co. | 34,516 |
| | TOTAL | 176,392 |
| | Commercial Services—0.0% | |
| 377 | 1 | Darling International, Inc. | 6,228 |
| | Commodity Chemicals—1.0% | |
| 2,494 | | Innospec, Inc. | 77,613 |
| 385 | | Newmarket Corp. | 88,504 |
| | TOTAL | 166,117 |
| | Computer Networking—1.0% | |
| 1,951 | | Black Box Corp. | 51,975 |
| 9,449 | 1 | Cray, Inc. | 117,451 |
| | TOTAL | 169,426 |
| | Computer Peripherals—0.3% | |
| 8,723 | 1 | Emulex Corp. | 56,438 |
| | Computer Services—3.7% | |
| 4,359 | 1 | CACI International, Inc., Class A | 246,066 |
| 5,344 | 1 | Synnex Corp. | 180,787 |
| 778 | | Syntel, Inc. | 45,225 |
| 7,130 | 1 | Unisys Corp. | 138,536 |
| | TOTAL | 610,614 |
| | Computer Stores—0.6% | |
| 8,469 | 1 | PC Connections, Inc. | 100,696 |
| | Construction Machinery—1.1% | |
| 1,770 | | NACCO Industries, Inc., Class A | 177,266 |
Annual Shareholder Report
| Shares | | | Value |
| | COMMON STOCKS—continued | |
| | Cosmetics & Toiletries—0.2% | |
| 2,393 | 1 | Revlon, Inc. | $34,818 |
| | Crude Oil & Gas Production—1.7% | |
| 4,955 | 1 | Energy Partners Ltd. | 83,740 |
| 6,185 | | Energy XXI (Bermuda) Ltd. | 192,848 |
| | TOTAL | 276,588 |
| | Defense Aerospace—0.5% | |
| 3,068 | 1 | Hexcel Corp. | 71,454 |
| 265 | | Triumph Group, Inc. | 16,570 |
| | TOTAL | 88,024 |
| | Defense Electronics—1.0% | |
| 10,275 | | Miller Industries, Inc. | 168,716 |
| | Diversified Leisure—1.5% | |
| 5,494 | 1 | Carmike Cinemas, Inc. | 76,367 |
| 667 | 1 | Coinstar, Inc. | 31,676 |
| 5,032 | 1 | Isle of Capri Casinos, Inc. | 29,538 |
| 7,817 | 1 | Multimedia Games Holding Company, Inc. | 110,610 |
| | TOTAL | 248,191 |
| | Education & Training Services—1.3% | |
| 5,336 | 1 | Bridgepoint Education, Inc. | 48,558 |
| 1,324 | 1 | Capella Education Co. | 35,112 |
| 9,085 | 1 | Corinthian Colleges, Inc. | 18,352 |
| 2,844 | 1 | ITT Educational Services, Inc. | 110,404 |
| | TOTAL | 212,426 |
| | Electric & Electronic Original Equipment Manufacturers—0.6% | |
| 3,580 | 1 | General Cable Corp. | 93,545 |
| | Electrical Equipment—1.7% | |
| 6,855 | 1 | EnerSys, Inc. | 234,098 |
| 1,128 | | Robbins & Myers, Inc. | 51,708 |
| | TOTAL | 285,806 |
| | Electronics Stores—0.2% | |
| 2,255 | 1 | Rex Stores Corp. | 39,801 |
| | Ethical Drugs—0.4% | |
| 2,572 | 1 | Auxilium Pharmaceutical, Inc. | 69,290 |
| | Financial Services—4.5% | |
| 8,823 | | Deluxe Corp. | 249,867 |
| 2,917 | 1 | Encore Capital Group, Inc. | 81,676 |
| 4,664 | 1 | Global Cash Access LLC | 30,130 |
| 8,258 | | MainSource Financial Group, Inc. | 96,454 |
Annual Shareholder Report
| Shares | | | Value |
| | COMMON STOCKS—continued | |
| | Financial Services—continued | |
| 10,526 | | Nelnet, Inc., Class A | $247,466 |
| 455 | 1 | Portfolio Recovery Associates, Inc. | 38,529 |
| | TOTAL | 744,122 |
| | Food Wholesaling—0.3% | |
| 1,552 | | Nash Finch Co. | 29,736 |
| 9,751 | | SUPERVALU, Inc. | 24,085 |
| | TOTAL | 53,821 |
| | Generic Drugs—1.2% | |
| 4,151 | 1 | Hi-Tech Pharmacal Co., Inc. | 142,628 |
| 2,450 | 1 | Impax Laboratories, Inc. | 54,439 |
| | TOTAL | 197,067 |
| | Greeting Cards—0.6% | |
| 7,686 | | American Greetings Corp., Class A | 102,147 |
| | Health Care—1.1% | |
| 3,881 | 1 | USANA, Inc. | 174,567 |
| | Home Building—0.4% | |
| 1,846 | | M.D.C. Holdings, Inc. | 58,814 |
| | Home Health Care—0.2% | |
| 4,016 | 1 | Gentiva Health Services, Inc. | 26,747 |
| | Hospitals—0.5% | |
| 7,891 | 1 | Select Medical Holdings Corp. | 84,039 |
| | Hotels and Motels—1.7% | |
| 9,699 | | Ameristar Casinos, Inc. | 163,622 |
| 2,026 | | Six Flags Entertainment Corp. | 116,718 |
| | TOTAL | 280,340 |
| | Household Appliances—0.2% | |
| 5,775 | 1 | hhgregg, Inc. | 39,732 |
| | Industrial Machinery—0.4% | |
| 3,343 | | Twin Disc, Inc. | 65,456 |
| | Insurance Brokerage—0.4% | |
| 1,513 | | AmTrust Financial Services, Inc. | 45,072 |
| 5,200 | | Crawford & Co., Class B | 21,008 |
| | TOTAL | 66,080 |
| | Internet Services—0.8% | |
| 7,313 | 1 | Overstock.com, Inc. | 58,796 |
| 3,824 | 1 | Tree.com, Inc. | 49,406 |
| 6,969 | | United Online, Inc. | 29,549 |
| | TOTAL | 137,751 |
Annual Shareholder Report
| Shares | | | Value |
| | COMMON STOCKS—continued | |
| | Life Insurance—1.4% | |
| 6,924 | | American Equity Investment Life Holding Co. | $80,803 |
| 2,989 | | Primerica, Inc. | 81,809 |
| 5,868 | | Symetra Financial Corp. | 68,245 |
| | TOTAL | 230,857 |
| | Machine Tools—0.3% | |
| 2,328 | 1 | Hurco Co., Inc. | 47,491 |
| | Machined Parts Original Equipment Manufacturers—0.6% | |
| 4,578 | | Titan International, Inc. | 94,627 |
| | Maritime—0.5% | |
| 7,711 | | Frontline Ltd. | 28,531 |
| 1,363 | | TAL International Group, Inc. | 46,546 |
| | TOTAL | 75,077 |
| | Medical Supplies—1.0% | |
| 2,798 | 1 | Align Technology, Inc. | 95,020 |
| 4,691 | | Invacare Corp. | 66,096 |
| | TOTAL | 161,116 |
| | Medical Technology—0.6% | |
| 281 | 1 | Abaxis, Inc. | 10,029 |
| 3,466 | 1 | Cynosure, Inc., Class A | 86,789 |
| | TOTAL | 96,818 |
| | Metal Fabrication—1.0% | |
| 2,058 | 1 | NN, Inc. | 18,522 |
| 6,985 | | Worthington Industries, Inc. | 151,575 |
| | TOTAL | 170,097 |
| | Miscellaneous Components—2.3% | |
| 15,110 | 1 | Amkor Technology, Inc. | 80,536 |
| 7,180 | 1 | Pericom Semiconductor Corp. | 57,727 |
| 1,139 | | Power Integrations, Inc. | 40,138 |
| 10,147 | 1 | Qlogic Corp. | 117,097 |
| 8,349 | 1 | Vishay Intertechnology, Inc. | 82,405 |
| | TOTAL | 377,903 |
| | Miscellaneous Food Products—2.1% | |
| 8,120 | | Fresh Del Monte Produce, Inc. | 198,940 |
| 4,058 | | The Anderson's, Inc. | 154,082 |
| | TOTAL | 353,022 |
| | Miscellaneous Machinery—0.5% | |
| 1,586 | | John Bean Technologies Corp. | 23,235 |
Annual Shareholder Report
| Shares | | | Value |
| | COMMON STOCKS—continued | |
| | Miscellaneous Machinery—continued | |
| 5,734 | 1 | TMS International Corp. | $56,078 |
| | TOTAL | 79,313 |
| | Miscellaneous Metals—0.2% | |
| 1,661 | | Materion Corp | 32,605 |
| | Money Center Bank—0.3% | |
| 2,400 | | MidWestOne Financial Group, Inc. | 51,072 |
| | Multi-Industry Basic—0.3% | |
| 2,276 | | Olin Corp. | 46,066 |
| | Multi-Industry Capital Goods—0.2% | |
| 5 | 1 | DXP Enterprises, Inc. | 221 |
| 3,151 | 1 | Lydall, Inc. | 40,207 |
| | TOTAL | 40,428 |
| | Multi-Industry Transportation—0.9% | |
| 6,147 | | Brinks Co. (The) | 142,610 |
| | Multi-Line Insurance—1.2% | |
| 3,310 | | Alterra Capital Holdings Ltd. | 77,024 |
| 3,610 | | FBL Financial Group, Inc., Class A | 111,730 |
| 771 | | Tower Group, Inc. | 14,371 |
| | TOTAL | 203,125 |
| | Natural Gas Production—0.3% | |
| 6,168 | 1 | VAALCO Energy, Inc. | 45,211 |
| | Office Supplies—1.2% | |
| 9,163 | 1 | Acco Brands Corp. | 77,611 |
| 44 | | Ennis Business Forms, Inc. | 631 |
| 4,626 | | United Stationers, Inc. | 116,621 |
| | TOTAL | 194,863 |
| | Offshore Driller—0.1% | |
| 3,142 | 1 | Newpark Resources, Inc. | 21,460 |
| | Oil Refiner—1.9% | |
| 6,816 | | Alon USA Energy, Inc. | 74,431 |
| 9,973 | | Western Refining, Inc. | 234,664 |
| | TOTAL | 309,095 |
| | Oil Service, Explore & Drill—2.3% | |
| 4,194 | 1 | C&J Energy Services, Inc. | 78,763 |
| 13,527 | 1 | Helix Energy Solutions Group, Inc. | 241,863 |
| 13,337 | 1 | Parker Drilling Co. | 61,750 |
| | TOTAL | 382,376 |
Annual Shareholder Report
| Shares | | | Value |
| | COMMON STOCKS—continued | |
| | Optical Reading Equipment—0.4% | |
| 2,060 | 1 | ScanSource, Inc. | $59,472 |
| | Other Tobacco Products—1.8% | |
| 1,590 | | Schweitzer-Mauduit International, Inc. | 108,279 |
| 4,263 | | Universal Corp. | 194,137 |
| | TOTAL | 302,416 |
| | Packaged Foods—0.6% | |
| 8,178 | 1 | Dole Food Co., Inc. | 96,255 |
| | Paint & Related Materials—0.0% | |
| 2,288 | 1 | Ferro Corp. | 7,024 |
| | Paper Products—2.4% | |
| 17,407 | 1 | Boise, Inc. | 128,812 |
| 2,908 | | Buckeye Technologies, Inc. | 87,589 |
| 6,817 | | Neenah Paper, Inc. | 183,104 |
| | TOTAL | 399,505 |
| | Personal Loans—1.5% | |
| 4,976 | | Cash America International, Inc. | 190,680 |
| 725 | 1 | World Acceptance Corp. | 51,671 |
| | TOTAL | 242,351 |
| | Personnel Agency—0.8% | |
| 1,826 | | Barrett Business Services, Inc. | 47,695 |
| 7,535 | | Kelly Services, Inc., Class A | 89,365 |
| | TOTAL | 137,060 |
| | Plastic—0.6% | |
| 4,664 | | Schulman (A.), Inc. | 101,955 |
| | Printed Circuit Boards—0.7% | |
| 4,567 | 1 | Sanmina-SCI Corp. | 39,002 |
| 6,540 | 1 | TTM Technologies | 71,548 |
| | TOTAL | 110,550 |
| | Printing—1.3% | |
| 1,417 | 1 | Consolidated Graphics, Inc. | 33,597 |
| 2,394 | | Quad Graphics, Inc. | 36,844 |
| 6,383 | 1 | Valassis Communications, Inc. | 143,936 |
| | TOTAL | 214,377 |
| | Professional Services—1.6% | |
| 4,481 | | Carriage Services, Inc. | 36,207 |
| 3,970 | 1 | FTI Consulting, Inc. | 101,354 |
| 6,903 | | Hillenbrand, Inc. | 119,353 |
| | TOTAL | 256,914 |
Annual Shareholder Report
| Shares | | | Value |
| | COMMON STOCKS—continued | |
| | Property Liability Insurance—1.6% | |
| 116 | 1 | American Safety Insurance Holdings, Ltd. | $2,071 |
| 5,930 | | Meadowbrook Insurance Group, Inc. | 41,747 |
| 1,374 | | Platinum Underwriters Holdings Ltd. | 52,239 |
| 1,854 | | ProAssurance Corp. | 166,063 |
| | TOTAL | 262,120 |
| | Recreational Goods—1.0% | |
| 15,903 | 1 | Smith & Wesson Holding Corp. | 160,620 |
| | Recreational Vehicles—1.2% | |
| 4,355 | 1 | Arctic Cat, Inc. | 191,620 |
| | Regional Banks—5.3% | |
| 7,422 | 1 | Citizens Banking Corp. | 133,596 |
| 3,174 | | Enterprise Financial Services Corp. | 39,834 |
| 3,399 | | Financial Institutions, Inc. | 58,463 |
| 7,229 | 1 | First BanCorp | 27,326 |
| 11,071 | | First Merchants Corp. | 157,540 |
| 9,418 | 1 | Hanmi Financial Corp. | 103,127 |
| 3,206 | | Heartland Financial USA, Inc. | 83,773 |
| 4,104 | | Peoples Bancorp, Inc. | 89,713 |
| 3,270 | | Republic Bancorp, Inc. | 77,205 |
| 1,005 | | Southside Bancshares, Inc. | 20,964 |
| 12,745 | 1 | Wilshire Bancorp, Inc. | 80,803 |
| | TOTAL | 872,344 |
| | Restaurant—0.2% | |
| 634 | 1 | Papa Johns International, Inc. | 32,340 |
| | Roofing & Wallboard—0.2% | |
| 2,142 | 1 | USG Corp. | 34,786 |
| | Rubber—1.2% | |
| 11,787 | | Cooper Tire & Rubber Co. | 205,919 |
| | Semiconductor Manufacturing—1.2% | |
| 2,143 | 1 | Cirrus Logic, Inc. | 78,798 |
| 4,450 | 1 | Omnivision Technologies, Inc. | 62,389 |
| 5,751 | 1 | Spansion, Inc. | 58,948 |
| | TOTAL | 200,135 |
| | Semiconductor Manufacturing Equipment—0.7% | |
| 7,153 | 1 | Mentor Graphics Corp. | 109,298 |
| | Shoes—0.3% | |
| 3,507 | 1 | CROCs, Inc. | 53,832 |
Annual Shareholder Report
| Shares | | | Value |
| | COMMON STOCKS—continued | |
| | Silver Production—0.1% | |
| 828 | 1 | Coeur d'Alene Mines Corp. | $13,505 |
| | Software Packaged/Custom—1.5% | |
| 4,319 | 1 | CSG Systems International, Inc. | 76,144 |
| 4,868 | | ManTech International Corp., Class A | 106,755 |
| 1,662 | 1 | SS&C Technologies Holdings, Inc. | 40,387 |
| 2,170 | 1 | Websense, Inc. | 32,572 |
| | TOTAL | 255,858 |
| | Specialty Chemicals—2.4% | |
| 14,176 | 1 | Chemtura Corp. | 191,660 |
| 2,409 | | Koppers Holdings, Inc. | 79,352 |
| 2,896 | 1 | LSB Industries, Inc. | 93,049 |
| 4,748 | 1 | Omnova Solutions, Inc. | 34,565 |
| | TOTAL | 398,626 |
| | Specialty Machinery—0.7% | |
| 2,449 | | Cascade Corp. | 115,372 |
| | Specialty Retailing—4.0% | |
| 2,020 | 1 | Asbury Automotive Group, Inc. | 52,843 |
| 4,807 | 1 | Conn's, Inc. | 85,805 |
| 1,421 | | GNC Acquisition Holdings, Inc. | 54,751 |
| 1,109 | 1 | Hibbett Sports, Inc. | 67,394 |
| 3,065 | | Lithia Motors, Inc., Class A | 85,391 |
| 1,217 | 1 | Lumber Liquidators, Inc. | 51,467 |
| 6,864 | 1 | MarineMax, Inc. | 51,068 |
| 3,820 | | Natures Sunshine Products, Inc. | 59,057 |
| 6,013 | | Sonic Automotive, Inc. | 102,943 |
| 814 | 1 | Vitamin Shoppe Industries, Inc. | 44,705 |
| | TOTAL | 655,424 |
| | Telecommunication Equipment & Services—1.3% | |
| 3,381 | 1 | Anixter International, Inc. | 192,413 |
| 325 | 1 | Mastec, Inc. | 5,187 |
| 1,527 | 1 | Ubiquiti Networks, Inc. | 21,592 |
| | TOTAL | 219,192 |
| | Telephone Utility—0.7% | |
| 4,613 | 1 | Hawaiian Telcom Holdco, Inc. | 83,034 |
| 21,665 | 1 | Vonage Holdings Corp. | 38,780 |
| | TOTAL | 121,814 |
| | Textiles Apparel & Luxury Goods—0.7% | |
| 3,345 | | R.G. Barry Corp. | 44,556 |
Annual Shareholder Report
| Shares | | | Value |
| | COMMON STOCKS—continued | |
| | Textiles Apparel & Luxury Goods—continued | |
| 4,218 | | The Jones Group, Inc. | $44,584 |
| 2,412 | 1 | Unifi, Inc. | 26,725 |
| | TOTAL | 115,865 |
| | Toys & Games—1.0% | |
| 14,140 | 1 | Leapfrog Enterprises, Inc. | 162,469 |
| | Water Utility—0.3% | |
| 15,389 | | Mueller Water Products, Inc. | 54,477 |
| | TOTAL COMMON STOCKS
(IDENTIFIED COST $15,710,572) | 16,296,946 |
| | MUTUAL FUND—1.8% | |
| 296,930 | 2,3 | Federated Prime Value Obligations Fund, Institutional Shares, 0.22%
(AT NET ASSET VALUE) | 296,930 |
| | TOTAL INVESTMENTS—100.2%
(IDENTIFIED COST $16,007,502)4 | 16,593,876 |
| | OTHER ASSETS AND LIABILITIES - NET—(0.2)%5 | (35,455) |
| | TOTAL NET ASSETS—100% | $16,558,421 |
| 1 | Non-income producing security. |
| 2 | Affiliated holding. |
| 3 | 7-Day net yield. |
| 4 | The cost of investments for federal tax purposes amounts to $16,077,448. |
| 5 | Assets, other than investments in securities, less liabilities. See Statement of Assets and Liabilities. |
Note: The categories of investments are shown as a percentage of total net assets at July 31, 2012.
Various inputs are used in determining the value of the Fund's investments. These inputs are summarized in the three broad levels listed below:
Level 1—quoted prices in active markets for identical securities, including investment companies with daily net asset values, if applicable.
Level 2—other significant observable inputs (including quoted prices for similar securities, interest rates, prepayment speeds, credit risk, etc.). Also includes securities valued at amortized cost.
Level 3—significant unobservable inputs (including the Fund's own assumptions in determining the fair value of investments).
The inputs or methodology used for valuing securities are not an indication of the risk associated with investing in those securities.
As of July 31, 2012, all investments of the Fund utilized Level 1 inputs in valuing the Fund's assets carried at fair value.
See Notes which are an integral part of the Financial Statements
Annual Shareholder Report
Financial Highlights–Class A Shares
(For a Share Outstanding Throughout Each Period)
| Year Ended July 31 | 2012 | 2011 | 2010 | 2009 | 2008 |
| Net Asset Value, Beginning of Period | $9.88 | $7.55 | $6.58 | $10.21 | $13.22 |
| Income From Investment Operations: | | | | | |
| Net investment income (loss) | (0.06)1 | (0.09)1 | (0.06)1 | (0.04)1 | (0.08)1 |
| Net realized and unrealized gain (loss) on investments | (0.30) | 2.42 | 1.03 | (3.59) | (2.22) |
| TOTAL FROM INVESTMENT OPERATIONS | (0.36) | 2.33 | 0.97 | (3.63) | (2.30) |
| Less Distributions: | | | | | |
| Distributions from net realized gain on investments | — | — | — | — | (0.71) |
| Net Asset Value, End of Period | $9.52 | $9.88 | $7.55 | $6.58 | $10.21 |
| Total Return2 | (3.64)% | 30.86% | 14.74% | (35.55)% | (18.09)% |
| Ratios to Average Net Assets: | | | | | |
| Net expenses | 1.71% | 1.75% | 1.75% | 1.74% | 1.75% |
| Net investment income (loss) | (0.65)% | (0.96)% | (0.77)% | (0.53)% | (0.68)% |
| Expense waiver/reimbursement3 | 4.24% | 3.75% | 5.41% | 5.73% | 3.85% |
| Supplemental Data: | | | | | |
| Net assets, end of period (000 omitted) | $2,550 | $3,469 | $3,184 | $1,652 | $2,623 |
| Portfolio turnover | 200% | 210% | 192% | 222% | 243% |
| 1 | Per share numbers have been calculated using the average shares method. |
| 2 | Based on net asset value, which does not reflect the sales charge, redemption fee or contingent deferred sales charge, if applicable. |
| 3 | This expense decrease is reflected in both the net expense and the net investment income (loss) ratios shown above. |
See Notes which are an integral part of the Financial Statements
Annual Shareholder Report
Financial Highlights–Class C Shares
(For a Share Outstanding Throughout Each Period)
| Year Ended July 31 | 2012 | 2011 | 2010 | 2009 | 2008 |
| Net Asset Value, Beginning of Period | $9.45 | $7.28 | $6.39 | $9.99 | $13.04 |
| Income From Investment Operations: | | | | | |
| Net investment income (loss) | (0.12)1 | (0.15)1 | (0.11)1 | (0.08)1 | (0.16)1 |
| Net realized and unrealized gain (loss) on investments | (0.29) | 2.32 | 1.00 | (3.52) | (2.18) |
| TOTAL FROM INVESTMENT OPERATIONS | (0.41) | 2.17 | 0.89 | (3.60) | (2.34) |
| Less Distributions: | | | | | |
| Distributions from net realized gain on investments | — | — | — | — | (0.71) |
| Net Asset Value, End of Period | $9.04 | $9.45 | $7.28 | $6.39 | $9.99 |
| Total Return2 | (4.34)% | 29.81% | 13.93% | (36.04)% | (18.66)% |
| Ratios to Average Net Assets: | | | | | |
| Net expenses | 2.46% | 2.50% | 2.50% | 2.49% | 2.46% |
| Net investment income (loss) | (1.41)% | (1.70)% | (1.53)% | (1.29)% | (1.40)% |
| Expense waiver/reimbursement3 | 4.24% | 3.78% | 5.13% | 5.61% | 3.90% |
| Supplemental Data: | | | | | |
| Net assets, end of period (000 omitted) | $2,358 | $2,978 | $3,258 | $1,366 | $2,759 |
| Portfolio turnover | 200% | 210% | 192% | 222% | 243% |
| 1 | Per share numbers have been calculated using the average shares method. |
| 2 | Based on net asset value, which does not reflect the sales charge, redemption fee or contingent deferred sales charge, if applicable. |
| 3 | This expense decrease is reflected in both the net expense and the net investment income (loss) ratios shown above. |
See Notes which are an integral part of the Financial Statements
Annual Shareholder Report
Financial Highlights–Institutional Shares
(For a Share Outstanding Throughout Each Period)
| Year Ended July 31 | 2012 | 2011 | 2010 | 2009 | 2008 |
| Net Asset Value, Beginning of Period | $10.00 | $7.63 | $6.63 | $10.28 | $13.28 |
| Income From Investment Operations: | | | | | |
| Net investment income (loss) | (0.04)1 | (0.06)1 | (0.04)1 | (0.02)1 | (0.05)1 |
| Net realized and unrealized gain (loss) on investments | (0.29) | 2.43 | 1.04 | (3.63) | (2.24) |
| TOTAL FROM INVESTMENT OPERATIONS | (0.33) | 2.37 | 1.00 | (3.65) | (2.29) |
| Less Distributions: | | | | | |
| Distributions from net realized gain on investments | — | — | — | — | (0.71) |
| Net Asset Value, End of Period | $9.67 | $10.00 | $7.63 | $6.63 | $10.28 |
| Total Return2 | (3.30)% | 31.06% | 15.08% | (35.51)% | (17.92)% |
| Ratios to Average Net Assets: | | | | | |
| Net expenses | 1.46% | 1.50% | 1.50% | 1.49% | 1.50% |
| Net investment income (loss) | (0.44)% | (0.71)% | (0.52)% | (0.30)% | (0.43)% |
| Expense waiver/reimbursement3 | 3.77% | 3.79% | 5.56% | 5.22% | 3.55% |
| Supplemental Data: | | | | | |
| Net assets, end of period (000 omitted) | $11,650 | $4,836 | $5,727 | $3,319 | $10,064 |
| Portfolio turnover | 200% | 210% | 192% | 222% | 243% |
| 1 | Per share numbers have been calculated using the average shares method. |
| 2 | Based on net asset value. |
| 3 | This expense decrease is reflected in both the net expense and the net investment income (loss) ratios shown above. |
See Notes which are an integral part of the Financial Statements
Annual Shareholder Report
Statement of Assets and Liabilities
July 31, 2012
| Assets: | | |
| Total investment in securities, at value including $296,930 of investment in an affiliated holding (Note 5) (identified cost $16,007,502) | | $16,593,876 |
| Income receivable | | 4,663 |
| Receivable for investments sold | | 444,727 |
| Receivable for shares sold | | 2,701 |
| TOTAL ASSETS | | 17,045,967 |
| Liabilities: | | |
| Payable for investments purchased | $423,807 | |
| Payable for shares redeemed | 6,706 | |
| Payable to adviser (Note 5) | 1,691 | |
| Payable for auditing fees | 23,400 | |
| Payable for portfolio accounting fees | 11,190 | |
| Payable for distribution services fee (Note 5) | 1,520 | |
| Payable for shareholder services fee (Note 5) | 2,267 | |
| Accrued expenses | 16,965 | |
| TOTAL LIABILITIES | | 487,546 |
| Net assets for 1,733,818 shares outstanding | | $16,558,421 |
| Net Assets Consist of: | | |
| Paid-in capital | | $27,819,949 |
| Net unrealized appreciation of investments | | 586,374 |
| Accumulated net realized loss on investments | | (11,791,462) |
| Accumulated net investment income (loss) | | (56,440) |
| TOTAL NET ASSETS | | $16,558,421 |
Annual Shareholder Report
Statement of Assets and Liabilities–continued
| Net Asset Value, Offering Price and Redemption Proceeds Per Share | | |
| Class A Shares: | | |
| Net asset value per share ($2,549,800 ÷ 267,805 shares outstanding), no par value, unlimited shares authorized | | $9.52 |
| Offering price per share (100/94.50 of $9.52) | | $10.07 |
| Redemption proceeds per share | | $9.52 |
| Class C Shares: | | |
| Net asset value per share ($2,358,253 ÷ 260,828 shares outstanding), no par value, unlimited shares authorized | | $9.04 |
| Offering price per share | | $9.04 |
| Redemption proceeds per share (99.00/100 of $9.04) | | $8.95 |
| Institutional Shares: | | |
| Net asset value per share ($11,650,368 ÷ 1,205,185 shares outstanding), no par value, unlimited shares authorized | | $9.67 |
| Offering price per share | | $9.67 |
| Redemption proceeds per share | | $9.67 |
See Notes which are an integral part of the Financial Statements
Annual Shareholder Report
Statement of Operations
Year Ended July 31, 2012
| Investment Income: | | | |
| Dividends (including $358 received from an affiliated holding (Note 5) and net of foreign taxes withheld of $284) | | | $111,607 |
| Expenses: | | | |
| Investment adviser fee (Note 5) | | $123,792 | |
| Administrative fee (Note 5) | | 230,000 | |
| Custodian fees | | 26,553 | |
| Transfer and dividend disbursing agent fees and expenses | | 40,781 | |
| Directors'/Trustees' fees | | 1,510 | |
| Auditing fees | | 23,400 | |
| Legal fees | | 6,663 | |
| Portfolio accounting fees | | 67,876 | |
| Distribution services fee (Note 5) | | 18,386 | |
| Shareholder services fee (Note 5) | | 13,005 | |
| Share registration costs | | 38,339 | |
| Printing and postage | | 20,413 | |
| Insurance premiums | | 3,856 | |
| Miscellaneous | | 4,673 | |
| TOTAL EXPENSES | | 619,247 | |
| Waivers and Reimbursements (Note 5): | | | |
| Waiver/reimbursement of investment adviser fee | $(123,792) | | |
| Waiver of administrative fee | (44,892) | | |
| Reimbursement of other operating expenses | (261,783) | | |
| TOTAL WAIVERS AND REIMBURSEMENTS | | (430,467) | |
| Net expenses | | | 188,780 |
| Net investment income (loss) | | | (77,173) |
| Realized and Unrealized Loss on Investments: | | | |
| Net realized loss on investments | | | (9,436) |
| Net change in unrealized appreciation of investments | | | (74,338) |
| Net realized and unrealized loss on investments | | | (83,774) |
| Change in net assets resulting from operations | | | $(160,947) |
See Notes which are an integral part of the Financial Statements
Annual Shareholder Report
Statement of Changes in Net Assets
| Year Ended July 31 | 2012 | 2011 |
| Increase (Decrease) in Net Assets | | |
| Operations: | | |
| Net investment income (loss) | $(77,173) | $(125,344) |
| Net realized gain (loss) on investments | (9,436) | 3,964,172 |
| Net change in unrealized appreciation/depreciation of investments | (74,338) | (563,516) |
| CHANGE IN NET ASSETS RESULTING FROM OPERATIONS | (160,947) | 3,275,312 |
| Share Transactions: | | |
| Proceeds from sale of shares | 8,745,470 | 1,967,566 |
| Cost of shares redeemed | (3,308,401) | (6,130,287) |
| CHANGE IN NET ASSETS RESULTING FROM SHARE TRANSACTIONS | 5,437,069 | (4,162,721) |
| Change in net assets | 5,276,122 | (887,409) |
| Net Assets: | | |
| Beginning of period | 11,282,299 | 12,169,708 |
| End of period (including accumulated net investment income (loss) of $(56,440) and $0, respectively) | $16,558,421 | $11,282,299 |
See Notes which are an integral part of the Financial Statements
Annual Shareholder Report
Notes to Financial Statements
July 31, 2012
1. ORGANIZATION
Federated MDT Series (the “Trust”) is registered under the Investment Company Act of 1940, as amended (the “Act”), as an open-end management investment company. The Trust consists of five portfolios. The financial statements included herein are only those of Federated MDT Small Cap Core Fund (the “Fund”), a diversified portfolio. The financial statements of the other portfolios are presented separately. The assets of each portfolio are segregated and a shareholder's interest is limited to the portfolio in which shares are held. Each portfolio pays its own expenses. The Fund offers three classes of shares: Class A Shares, Class C Shares and Institutional Shares. All shares of the Fund have equal rights with respect to voting, except on class-specific matters. The investment objective of the Fund is long-term capital appreciation.
2. SIGNIFICANT ACCOUNTING POLICIES
The following is a summary of significant accounting policies consistently followed by the Fund in the preparation of its financial statements. These policies are in conformity with U.S. generally accepted accounting principles (GAAP).
Investment Valuation
In calculating its net asset value (NAV), the Fund generally values investments as follows:
| ■ | Equity securities listed on an exchange or traded through a regulated market system are valued at their last reported sale price or official closing price in their principal exchange or market. |
| ■ | Shares of other mutual funds are valued based upon their reported NAVs. |
| ■ | Fixed-income securities acquired with remaining maturities greater than 60 days are fair valued using price evaluations provided by a pricing service approved by the Fund's Board of Trustees (the “Trustees”). |
| ■ | Fixed-income securities acquired with remaining maturities of 60 days or less are valued at their cost (adjusted for the accretion of any discount or amortization of any premium), which approximates market value. |
| ■ | Derivative contracts listed on exchanges are valued at their reported settlement or closing price. |
| ■ | Over-the-counter (OTC) derivative contracts are fair valued using price evaluations provided by a pricing service approved by the Trustees. |
| ■ | For securities that are fair valued in accordance with procedures established by and under the general supervision of the Trustees, certain factors may be considered such as: the purchase price of the security, information obtained by contacting the issuer, analysis of the issuer's financial statements or other available documents, fundamental analytical data, the nature and duration of restrictions on disposition, the movement of the market in which the security is normally traded and public trading in similar securities of the issuer or comparable issuers. |
If the Fund cannot obtain a price or price evaluation from a pricing service for an investment, the Fund may attempt to value the investment based upon the mean of bid and asked quotations or fair value the investment based on price evaluations, from one or more dealers. If any price, quotation, price evaluation or other pricing source is not readily available when the NAV is calculated, the Fund uses the fair value of the investment determined in accordance with the procedures described below. There can be no assurance that the Fund could purchase or sell an investment at the price used to calculate the Fund's NAV.
Annual Shareholder Report
Fair Valuation and Significant Events Procedures
The Trustees have appointed a Valuation Committee comprised of officers of the Fund, Federated MDTA LLC (“Adviser”) or an affiliated adviser, and others to determine fair value of securities and in overseeing the calculation of the NAV. The Trustees have also authorized the use of pricing services recommended by the Valuation Committee to provide fair value evaluations of the current value of certain investments for purposes of calculating the NAV. The Valuation Committee employs various methods for reviewing third-party pricing service evaluations including periodic reviews of third-party pricing services' policies, procedures and valuation methods (including key inputs and assumptions), transactional back-testing, comparisons of evaluations of different pricing services, and review of price challenges by the Adviser based on recent market activity. In the event that market quotations and price evaluations are not available for an investment, the Valuation Committee determines the fair value of the investment in accordance with procedures adopted by the Trustees. The Trustees periodically review and approve the fair valuations made by the Valuation Committee and any changes made to the procedures.
Factors considered by pricing services in evaluating an investment include the yields or prices of investments of comparable quality, coupon, maturity, call rights and other potential prepayments, terms and type, reported transactions, indications as to values from dealers and general market conditions. Some pricing services provide a single price evaluation reflecting the bid-side of the market for an investment (a “bid” evaluation). Other pricing services offer both bid evaluations and price evaluations indicative of a price between the prices bid and asked for the investment (a “mid” evaluation). The Fund normally uses bid evaluations for U.S. Treasury and Agency securities, mortgage-backed securities and municipal securities. The Fund normally uses mid evaluations for other types of fixed-income securities and OTC derivative contracts. In the event that market quotations and price evaluations are not available for an investment, the fair value of the investment is determined in accordance with procedures adopted by the Trustees.
The Trustees also have adopted procedures requiring an investment to be priced at its fair value whenever the Adviser determines that a significant event affecting the value of the investment has occurred between the time as of which the price of the investment would otherwise be determined and the time as of which the NAV is computed. An event is considered significant if there is both an affirmative expectation that the investment's value will change in response to the event and a reasonable basis for quantifying the resulting change in value. Examples of significant events that may occur after the close of the principal market on which a security is traded, or after the time of a price evaluation provided by a pricing service or a dealer, include:
| ■ | With respect to securities traded in foreign markets, significant trends in U.S. equity markets or in the trading of foreign securities index futures or options contracts; |
| ■ | With respect to price evaluations of fixed-income securities determined before the close of regular trading on the NYSE, actions by the Federal Reserve Open Market Committee and other significant trends in U.S. fixed-income markets; |
| ■ | Political or other developments affecting the economy or markets in which an issuer conducts its operations or its securities are traded; and |
| ■ | Announcements concerning matters such as acquisitions, recapitalizations, litigation developments, a natural disaster affecting the issuer's operations or regulatory changes or market developments affecting the issuer's industry. |
Annual Shareholder Report
The Trustees have approved the use of a pricing service to determine the fair value of equity securities traded principally in foreign markets when the Adviser determines that there has been a significant trend in the U.S. equity markets or in index futures trading. For other significant events, the Fund may seek to obtain more current quotations or price evaluations from alternative pricing sources. If a reliable alternative pricing source is not available, the Fund will determine the fair value of the investment using another method approved by the Trustees.
Repurchase Agreements
The Fund may invest in repurchase agreements for short-term liquidity purposes. It is the policy of the Fund to require the other party to a repurchase agreement to transfer to the Fund's custodian or sub-custodian eligible securities or cash with a market value (after transaction costs) at least equal to the repurchase price to be paid under the repurchase agreement. The eligible securities are transferred to accounts with the custodian or sub-custodian in which the Fund holds a “securities entitlement” and exercises “control” as those terms are defined in the Uniform Commercial Code. The Fund has established procedures for monitoring the market value of the transferred securities and requiring the transfer of additional eligible securities if necessary to equal at least the repurchase price. These procedures also allow the other party to require securities to be transferred from the account to the extent that their market value exceeds the repurchase price or in exchange for other eligible securities of equivalent market value.
The insolvency of the other party or other failure to repurchase the securities may delay the disposition of the underlying securities or cause the Fund to receive less than the full repurchase price. Under the terms of the repurchase agreement, any amounts received by the Fund in excess of the repurchase price and related transaction costs must be remitted to the other party.
The Fund may enter into repurchase agreements in which eligible securities are transferred into joint trading accounts maintained by the custodian or sub-custodian for investment companies and other clients advised by the Fund's Adviser and its affiliates. The Fund will participate on a pro rata basis with the other investment companies and clients in its share of the securities transferred under such repurchase agreements and in its share of proceeds from any repurchase or other disposition of such securities.
Investment Income, Gains and Losses, Expenses and Distributions
Investment transactions are accounted for on a trade-date basis. Realized gains and losses from investment transactions are recorded on an identified-cost basis. Interest income and expenses are accrued daily. Dividend income and distributions to shareholders are recorded on the ex-dividend date. Foreign dividends are recorded on the ex-dividend date or when the Fund is informed of the ex-dividend date. Distributions of net investment income, if any, are declared and paid annually. Non-cash dividends included in dividend income, if any, are recorded at fair value. Investment income, realized and unrealized gains and losses, and certain fund-level expenses are allocated to each class based on relative average daily net assets, except that Class A Shares, Class C Shares and Institutional Shares may bear distribution services fees and shareholder services fees unique to those classes. Dividends are declared separately for each class. No class has preferential dividend rights; differences in per share dividend rates are generally due to differences in separate class expenses.
Annual Shareholder Report
Premium and Discount Amortization
All premiums and discounts on fixed-income securities are amortized/accreted using the effective interest rate method.
Federal Taxes
It is the Fund's policy to comply with the Subchapter M provision of the Internal Revenue Code (the “Code”) and to distribute to shareholders each year substantially all of its income. Accordingly, no provision for federal income tax is necessary. As of and during the year ended July 31, 2012, the Fund did not have a liability for any uncertain tax positions. The Fund recognizes interest and penalties, if any, related to tax liabilities as income tax expense in the Statement of Operations. As of July 31, 2012, tax years 2009 through 2012 remain subject to examination by the Fund's major tax jurisdictions, which include the United States of America and the Commonwealth of Massachusetts.
The Fund may be subject to taxes imposed by governments of countries in which it invests. Such taxes are generally based on either income or gains earned or repatriated. The Fund accrues and applies such taxes to net investment income, net realized gains and net unrealized gains as income and/or gains are earned.
When-Issued and Delayed Delivery Transactions
The Fund may engage in when-issued or delayed delivery transactions. The Fund records when-issued securities on the trade date and maintains security positions such that sufficient liquid assets will be available to make payment for the securities purchased. Securities purchased on a when-issued or delayed delivery basis are marked to market daily and begin earning interest on the settlement date. Losses may occur on these transactions due to changes in market conditions or the failure of counterparties to perform under the contract.
Other
The preparation of financial statements in conformity with GAAP requires management to make estimates and assumptions that affect the amounts of assets, liabilities, expenses and revenues reported in the financial statements. Actual results could differ from those estimated.
3. SHARES OF BENEFICIAL INTEREST
The following tables summarize share activity:
| Year Ended July 31 | 2012 | 2011 |
| Class A Shares: | Shares | Amount | Shares | Amount |
| Shares sold | 37,994 | $344,850 | 94,156 | $934,802 |
| Shares redeemed | (121,394) | (1,100,407) | (164,528) | (1,482,746) |
| NET CHANGE RESULTING FROM CLASS A SHARE TRANSACTIONS | (83,400) | $(755,557) | (70,372) | $(547,944) |
| Year Ended July 31 | 2012 | 2011 |
| Class C Shares: | Shares | Amount | Shares | Amount |
| Shares sold | 9,770 | $85,422 | 34,730 | $323,061 |
| Shares redeemed | (64,102) | (552,087) | (167,010) | (1,449,906) |
| NET CHANGE RESULTING FROM CLASS C SHARE TRANSACTIONS | (54,332) | $(466,665) | (132,280) | $(1,126,845) |
Annual Shareholder Report
| Year Ended July 31 | 2012 | 2011 |
| Institutional Shares: | Shares | Amount | Shares | Amount |
| Shares sold | 898,001 | $8,315,198 | 70,439 | $709,703 |
| Shares redeemed | (176,188) | (1,655,907) | (337,454) | (3,197,635) |
| NET CHANGE RESULTING FROM INSTITUTIONAL SHARE TRANSACTIONS | 721,813 | $6,659,291 | (267,015) | $(2,487,932) |
| NET CHANGE RESULTING FROM TOTAL FUND SHARE TRANSACTIONS | 584,081 | $5,437,069 | (469,667) | $(4,162,721) |
4. FEDERAL TAX INFORMATION
The timing and character of income and capital gain distributions are determined in accordance with income tax regulations, which may differ from GAAP. These differences are due to differing treatments for net operating losses.
For the year ended July 31, 2012, permanent differences identified and reclassified among the components of net assets were as follows:
| Increase (Decrease) |
| Paid-In Capital | Undistributed
Net Investment
Income (Loss) |
| $(20,733) | $20,733 |
Net investment income (loss), net realized gains (losses), and net assets were not affected by this reclassification.
As of July 31, 2012, the components of distributable earnings on a tax basis were as follows:
| Net unrealized appreciation | $516,428 |
| Capital loss carryforwards and deferrals | $(11,777,956) |
The difference between book-basis and tax-basis net unrealized appreciation/depreciation is attributable to differing treatments for the deferral of losses on wash sales.
At July 31, 2012, the cost of investments for federal tax purposes was $16,077,448. The net unrealized appreciation of investments for federal tax purposes was $516,428. This consists of net unrealized appreciation from investments for those securities having an excess of value over cost of $1,334,860 and net unrealized depreciation from investments for those securities having an excess of cost over value of $818,432.
At July 31, 2012, the Fund had a capital loss carryforward of $11,721,516 which will reduce the Fund's taxable income arising from future net realized gains on investments, if any, to the extent permitted by the Code, thereby reducing the amount of distributions to shareholders which would otherwise be necessary to relieve the Fund of any liability for federal income tax. Pursuant to the Code, a net capital loss incurred in taxable years beginning on or before December 22, 2010, is characterized as short-term and may be carried forward for a maximum of eight tax years (“Carryforward Limit”), whereas a net capital loss incurred in taxable years beginning after December 22, 2010, retains its character as either short-term or long-term, does not expire and is required to be utilized prior to the losses which have a Carryforward Limit.
Annual Shareholder Report
The following schedule summarizes the Fund's capital loss carryforwards and expiration years:
| Expiration Year | Short-Term | Long-Term | Total |
| 2016 | $488,605 | N/A | $488,605 |
| 2017 | $6,139,530 | N/A | $6,139,530 |
| 2018 | $5,093,381 | N/A | $5,093,381 |
The Fund used capital loss carryforwards of $15,475 to offset taxable capital gains realized during the year ended July 31, 2012.
Under current tax law, late-year ordinary loss realized after December 31 through the end of the Fund's fiscal year (“Late Year Ordinary Loss”) may be deferred, in whole or in part, and treated as occurring on the first day of the following fiscal year. As of July 31, 2012, for federal income tax purposes, a Late Year Ordinary Loss of $56,440 was deferred to August 1, 2012.
5. INVESTMENT ADVISER FEE AND OTHER TRANSACTIONS WITH AFFILIATES
Investment Adviser Fee
The advisory agreement between the Fund and the Adviser provides for an annual fee equal to 1.15% of the Fund's average daily net assets. Subject to the terms described in the Expense Limitation note, the Adviser may voluntarily choose to waive any portion of its fee and/or reimburse certain operating expenses of the Fund. For the year ended July 31, 2012, the Adviser voluntarily waived $123,580 of its fee and voluntarily reimbursed $261,783 of other operating expenses.
Administrative Fee
Federated Administrative Services (FAS), under the Administrative Services Agreement, provides the Fund with administrative personnel and services. The fee paid to FAS is based on the average aggregate daily net assets of certain Federated funds as specified below:
| Administrative Fee | Average Aggregate Daily Net Assets
of the Federated Funds |
| 0.150% | on the first $5 billion |
| 0.125% | on the next $5 billion |
| 0.100% | on the next $10 billion |
| 0.075% | on assets in excess of $20 billion |
The administrative fee received during any fiscal year shall be at least $150,000 per portfolio and $40,000 per each additional class of Shares. Subject to the terms described in the Expense Limitation note, FAS may voluntarily choose to waive any portion of its fee. For the year ended July 31, 2012, FAS waived $44,892 of its fee. The net fee paid to FAS was 1.720% of average daily net assets of the Fund. The Fund is currently being charged the minimum administrative fee; therefore the fee as a percentage of average daily net assets is greater than the amounts presented in the chart above.
Annual Shareholder Report
Distribution Services Fee
The Fund has adopted a Distribution Plan (the “Plan”) pursuant to Rule 12b-1 under the Act. Under the terms of the Plan, the Fund will compensate Federated Securities Corp. (FSC), the principal distributor, from the daily net assets of the Fund's Class A Shares and Class C Shares to finance activities intended to result in the sale of these shares. The Plan provides that the Fund may incur distribution expenses at the following percentages of average daily net assets annually, to compensate FSC:
| Share Class Name | Percentage of Average Daily
Net Assets of Class |
| Class A Shares | 0.05% |
| Class C Shares | 0.75% |
Subject to the terms described in the Expense Limitation note, FSC may voluntarily choose to waive any portion of its fee. For the year ended July 31, 2012, distribution services fees for the Fund were as follows:
| Distribution Services
Fees Incurred |
| Class C Shares | $18,386 |
When FSC receives fees, it may pay some or all of them to financial intermediaries whose customers purchase shares. For the year ended July 31, 2012, FSC retained $1,504 of fees paid by the Fund. For the year ended July 31, 2012, the Fund's Class A Shares did not incur a distribution services fee; however, it may begin to incur this fee upon approval of the Trustees.
Sales Charges
Front-end sales charges and contingent deferred sales charges (CDSC) do not represent expenses of the Fund. They are deducted from the proceeds of sales of Fund shares prior to investment or from redemption proceeds prior to remittance, as applicable. For the year ended July 31, 2012, FSC retained $1,051 in sales charges from the sale of Class A Shares.
Shareholder Services Fee
The Fund may pay fees (“Service Fees”) up to 0.25% of the average daily net assets of the Fund's Class A Shares and Class C Shares to financial intermediaries or to Federated Shareholder Services Company (FSSC) for providing services to shareholders and maintaining shareholder accounts. Subject to the terms described in the Expense Limitation note, FSSC may voluntarily reimburse the Fund for Service Fees. For the year ended July 31, 2012, Service Fees for the Fund were as follows:
| Service
Fees
Incurred |
| Class A Shares | $6,876 |
| Class C Shares | 6,129 |
| TOTAL | $13,005 |
For the year ended July 31, 2012, FSSC received $214 of fees paid by the Fund.
Annual Shareholder Report
Expense Limitation
The Adviser and its affiliates (which may include FSC, FAS and FSSC) have voluntarily agreed to waive their fees and/or reimburse expenses so that the total annual fund operating expenses (as shown in the financial highlights) paid by the Fund's Class A Shares, Class C Shares and Institutional Shares (after the voluntary waivers and reimbursements) will not exceed 1.70%, 2.45% and 1.45% (the “Fee Limit”), respectively, up to but not including the later of (the “Termination Date”): (a) October 1, 2013; or (b) the date of the Fund's next effective Prospectus. While the Adviser and its affiliates currently do not anticipate terminating or increasing these arrangements prior to the Termination Date, these arrangements may only be terminated or the Fee Limit increased prior to the Termination Date with the agreement of the Trustees.
General
Certain Officers and Trustees of the Trust are Officers and Directors or Trustees of the above companies.
Transactions Involving Affiliated Holdings
Affiliated holdings are mutual funds which are managed by the Adviser or an affiliate of the Adviser. The Adviser has agreed to reimburse the Fund for certain investment adviser fees as a result of transactions in other affiliated mutual funds. For the year ended July 31, 2012, the Adviser reimbursed $212. Transactions involving the affiliated holding during the year ended July 31, 2012, were as follows:
| Federated Prime Value
Obligations Fund,
Institutional Shares |
| Balance of Shares Held 7/31/2011 | 116,597 |
| Purchases/Additions | 3,570,494 |
| Sales/Reductions | 3,390,161 |
| Balance of Shares Held 7/31/2012 | 296,930 |
| Value | $296,930 |
| Dividend Income | $358 |
6. PURCHASE IN-KIND
On May 24, 2012, the Fund received an in-kind subscription of securities and other assets of $7,784,999 in exchange for 842,532 shares of the Fund's Institutional Shares.
7. Investment TRANSACTIONS
Purchases and sales of investments, excluding long-term U.S. government securities, short-term obligations and purchases in-kind, for the year ended July 31, 2012, were as follows:
| Purchases | $22,212,447 |
| Sales | $24,639,296 |
Annual Shareholder Report
8. LINE OF CREDIT
The Fund participates in a $100,000,000 unsecured, uncommitted revolving line of credit (LOC) agreement with PNC Bank. The LOC was made available for extraordinary or emergency purposes, primarily for financing redemption payments. Borrowings are charged interest at a rate offered to the Fund by PNC Bank at the time of the borrowing. As of July 31, 2012, there were no outstanding loans. During the year ended July 31, 2012, the Fund did not utilize the LOC.
9. INTERFUND LENDING
Pursuant to an Exemptive Order issued by the Securities and Exchange Commission, the Fund, along with other funds advised by subsidiaries of Federated Investors, Inc., may participate in an interfund lending program. This program provides an alternative credit facility allowing the Fund to borrow from other participating affiliated funds. As of July 31, 2012, there were no outstanding loans. During the year ended July 31, 2012, the program was not utilized.
10. Subsequent events
On August 15, 2012, the Trustees approved the elimination of minimum administrative personnel and services fees effective September 1, 2012. Prior to this date, the administrative fee received during any fiscal year was at least $150,000 per portfolio and $40,000 per each additional class of Shares.
Management has evaluated subsequent events through the date the financial statements were issued, and determined that no additional events have occurred that require disclosure.
Annual Shareholder Report
Report of Independent Registered Public Accounting Firm
TO THE BOARD OF trustees OF Federated MDt series AND SHAREHOLDERS OF federated mdt Small cap core fund:
We have audited the accompanying statement of assets and liabilities of Federated MDT Small Cap Core Fund (the “Fund”) (one of the portfolios constituting Federated MDT Series), including the portfolio of investments, as of July 31, 2012, and the related statement of operations for the year then ended, the statement of changes in net assets for each of the two years in the period then ended, and the financial highlights for each of the five years in the period then ended. These financial statements and financial highlights are the responsibility of the Fund's management. Our responsibility is to express an opinion on these financial statements and financial highlights based on our audits.
We conducted our audits in accordance with standards of the Public Company Accounting Oversight Board (United States). Those standards require that we plan and perform the audit to obtain reasonable assurance about whether the financial statements and financial highlights are free of material misstatement. We were not engaged to perform an audit of the Fund's internal control over financial reporting. Our audits included consideration of internal control over financial reporting as a basis for designing audit procedures that are appropriate in the circumstances, but not for the purpose of expressing an opinion on the effectiveness of the Fund's internal control over financial reporting. Accordingly, we express no such opinion. An audit also includes examining, on a test basis, evidence supporting the amounts and disclosures in the financial statements and financial highlights, assessing the accounting principles used and significant estimates made by management, and evaluating the overall financial statement presentation. Our procedures included confirmation of securities owned as of July 31, 2012, by correspondence with the custodian and others, or by other appropriate auditing procedures where replies from others were not received. We believe that our audits provide a reasonable basis for our opinion.
In our opinion, the financial statements and financial highlights referred to above present fairly, in all material respects, the financial position of Federated MDT Small Cap Core Fund, a portfolio of Federated MDT Series, at July 31, 2012, the results of its operations for the year then ended, the changes in its net assets for each of the two years in the period then ended, and the financial highlights for each of the five years in the period then ended, in conformity with U.S. generally accepted accounting principles.
Boston, Massachusetts
September 24, 2012
Annual Shareholder Report
Shareholder Expense Example (unaudited)
As a shareholder of the Fund, you incur two types of costs: (1) transaction costs, including sales charges (loads) on purchase or redemption payments; and (2) ongoing costs, including management fees and to the extent applicable, distribution (12b-1) fees and/or shareholder services fees and other Fund expenses. This Example is intended to help you to understand your ongoing costs (in dollars) of investing in the Fund and to compare these costs with the ongoing costs of investing in other mutual funds. It is based on an investment of $1,000 invested at the beginning of the period and held for the entire period from February 1, 2012 to July 31, 2012.
ACTUAL EXPENSES
The first section of the table below provides information about actual account values and actual expenses. You may use the information in this section, together with the amount you invested, to estimate the expenses that you incurred over the period. Simply divide your account value by $1,000 (for example, an $8,600 account value divided by $1,000 = 8.6), then multiply the result by the number in the first section under the heading entitled “Expenses Paid During Period” to estimate the expenses attributable to your investment during this period.
HYPOTHETICAL EXAMPLE FOR COMPARISON PURPOSES
The second section of the table below provides information about hypothetical account values and hypothetical expenses based on the Fund's actual expense ratio and an assumed rate of return of 5% per year before expenses, which is not the Fund's actual return. Thus, you should not use the hypothetical account values and expenses to estimate the actual ending account balance or your expenses for the period. Rather, these figures are required to be provided to enable you to compare the ongoing costs of investing in the Fund with other funds. To do so, compare this 5% hypothetical example with the 5% hypothetical examples that appear in the shareholder reports of the other funds.
Annual Shareholder Report
Please note that the expenses shown in the table are meant to highlight your ongoing costs only and do not reflect any transaction costs, such as sales charges (loads) on purchase or redemption payments. Therefore, the second section of the table is useful in comparing ongoing costs only, and will not help you determine the relative total costs of owning different funds. In addition, if these transaction costs were included, your costs would have been higher.
| Beginning
Account Value
2/1/2012 | Ending
Account Value
7/31/2012 | Expenses Paid
During Period1 |
| Actual: | | | |
| Class A Shares | $1,000 | $988.60 | $8.41 |
| Class C Shares | $1,000 | $984.70 | $12.09 |
| Institutional Shares | $1,000 | $989.80 | $7.22 |
Hypothetical (assuming a 5% return
before expenses): | | | |
| Class A Shares | $1,000 | $1,016.41 | $8.52 |
| Class C Shares | $1,000 | $1,012.68 | $12.26 |
| Institutional Shares | $1,000 | $1,017.60 | $7.32 |
| 1 | Expenses are equal to the Fund's annualized net expense ratios, multiplied by the average account value over the period, multiplied by 182/366 (to reflect the one-half-year period). The annualized net expense ratios are as follows: |
| Class A Shares | 1.70% |
| Class C Shares | 2.45% |
| Institutional Shares | 1.46% |
Annual Shareholder Report
Board of Trustees and Trust Officers
The Board of Trustees is responsible for managing the Trust's business affairs and for exercising all the Trust's powers except those reserved for the shareholders. The following tables give information about each Trustee and the senior officers of the Fund. Where required, the tables separately list Trustees who are “interested persons” of the Fund (i.e., “Interested” Trustees) and those who are not (i.e., “Independent” Trustees). Unless otherwise noted, the address of each person listed is Federated Investors Tower, 1001 Liberty Avenue, Pittsburgh, PA 15222. The address of all Independent Trustees listed is 4000 Ericsson Drive, Warrendale, PA 15086-7561; Attention: Mutual Fund Board. As of December 31, 2011, the Trust comprised five portfolio(s), and the Federated Fund Family consisted of 43 investment companies (comprising 134 portfolios). Unless otherwise noted, each Officer is elected annually. Unless otherwise noted, each Trustee oversees all portfolios in the Federated Fund Family and serves for an indefinite term. The Fund's Statement of Additional Information includes additional information about Trust Trustees and is available, without charge and upon request, by calling 1-800-341-7400.
Interested TRUSTEES Background
Name
Birth Date
Positions Held with Trust
Date Service Began | Principal Occupation(s) for Past Five Years,
Other Directorships Held and Previous Position(s) |
John F. Donahue*
Birth Date: July 28, 1924
Trustee
Began serving: June 2006 | Principal Occupations: Director or Trustee of the Federated Fund Family; Chairman and Director, Federated Investors, Inc.; Chairman of the Federated Fund Family's Executive Committee.
Previous Positions: Chairman of the Federated Fund Family; Trustee, Federated Investment Management Company; Chairman and Director, Federated Investment Counseling. |
J. Christopher Donahue*
Birth Date: April 11, 1949
President and Trustee
Began serving: May 2006 | Principal Occupations: Principal Executive Officer and President of the Federated Fund Family; Director or Trustee of some of the Funds in the Federated Fund Family; President, Chief Executive Officer and Director, Federated Investors, Inc.; Chairman and Trustee, Federated Investment Management Company; Trustee, Federated Investment Counseling; Chairman and Director, Federated Global Investment Management Corp.; Chairman, Federated Equity Management Company of Pennsylvania and Passport Research, Ltd. (investment advisory subsidiary of Federated); Trustee, Federated Shareholder Services Company; Director, Federated Services Company.
Previous Positions: President, Federated Investment Counseling; President and Chief Executive Officer, Federated Investment Management Company, Federated Global Investment Management Corp. and Passport Research, Ltd. |
| * | Family relationships and reasons for “interested” status: John F. Donahue is the father of J. Christopher Donahue; both are “interested” due to their beneficial ownership of shares of Federated Investors, Inc. and the positions they hold with Federated and its subsidiaries. |
Annual Shareholder Report
INDEPENDENT TRUSTEES Background
Name
Birth Date
Positions Held with Trust
Date Service Began | Principal Occupation(s) for Past Five Years,
Other Directorships Held, Previous Position(s) and Qualifications |
Nicholas P. Constantakis, CPA
Birth Date: September 3, 1939
Trustee
Began serving: June 2006 | Principal Occupation: Director or Trustee of the Federated Fund Family.
Other Directorship Held: Director, Chairman of the Audit Committee, and member of the Compensation Committee, Michael Baker Corporation (architecture, engineering and construction services).
Previous Position: Partner, Andersen Worldwide SC.
Qualifications: Public accounting and director experience. |
John F. Cunningham
Birth Date: March 5, 1943
Trustee
Began serving: June 2006 | Principal Occupation: Director or Trustee of the Federated Fund Family.
Other Directorships Held: Chairman, President and Chief Executive Officer, Cunningham & Co., Inc. (strategic business consulting); Trustee Associate, Boston College.
Previous Positions: Director, Redgate Communications and EMC Corporation (computer storage systems); Chairman of the Board and Chief Executive Officer, Computer Consoles, Inc.; President and Chief Operating Officer, Wang Laboratories; Director, First National Bank of Boston; Director, Apollo Computer, Inc.
Qualifications: Business management and director experience. |
Maureen Lally-Green
Birth Date: July 5, 1949
Trustee
Began serving: August 2009 | Principal Occupations: Director or Trustee of the Federated Fund Family; Director, Office of Church Relations, Diocese of Pittsburgh; Adjunct Professor of Law, Duquesne University School of Law.
Other Directorships Held: Director, Auberle; Member, Pennsylvania State Board of Education; Director, Saint Vincent College; Director, Ireland Institute of Pittsburgh; Chair and Director, UPMC Mercy Hospital; Regent, St. Vincent Seminary; Director, Epilepsy Foundation of Western and Central Pennsylvania; Director, Saint Thomas More Society, Allegheny County; Director, Our Campaign for the Church Alive, Inc.
Previous Position: Pennsylvania Superior Court Judge.
Qualifications: Legal and director experience. |
Peter E. Madden
Birth Date: March 16, 1942
Trustee
Began serving: June 2006 | Principal Occupation: Director or Trustee, and Chairman of the Board of Directors or Trustees, of the Federated Fund Family.
Previous Positions: Representative, Commonwealth of Massachusetts General Court; President, Chief Operating Officer and Director, State Street Bank and Trust Company and State Street Corporation (retired); Director, VISA USA and VISA International; Chairman and Director, Massachusetts Bankers Association; Director, Depository Trust Corporation; Director, The Boston Stock Exchange.
Qualifications: Business management, mutual fund services and director experience. |
Annual Shareholder Report
Name
Birth Date
Positions Held with Trust
Date Service Began | Principal Occupation(s) for Past Five Years,
Other Directorships Held, Previous Position(s) and Qualifications |
Charles F. Mansfield, Jr.
Birth Date: April 10, 1945
Trustee
Began serving: June 2006 | Principal Occupations: Director or Trustee of the Federated Fund Family; Management Consultant.
Previous Positions: Chief Executive Officer, PBTC International Bank; Partner, Arthur Young & Company (now Ernst & Young LLP); Chief Financial Officer of Retail Banking Sector, Chase Manhattan Bank; Senior Vice President, HSBC Bank USA (formerly Marine Midland Bank); Vice President, Citibank; Assistant Professor of Banking and Finance, Frank G. Zarb School of Business, Hofstra University; Executive Vice President, DVC Group, Inc. (marketing, communications and technology).
Qualifications: Banking, business management, education and director experience. |
Thomas M. O'Neill
Birth Date: June 14, 1951
Trustee
Began serving: October 2006 | Principal Occupations: Director or Trustee, Vice Chairman of the Audit Committee of the Federated Fund Family; Sole Proprietor, Navigator Management Company (investment and strategic consulting).
Other Directorships Held: Board of Overseers, Children's Hospital of Boston; Visiting Committee on Athletics, Harvard College; Board of Directors, Medicines for Humanity; Board of Directors, The Golisano Children's Museum of Naples, Florida.
Previous Positions: Chief Executive Officer and President, Managing Director and Chief Investment Officer, Fleet Investment Advisors; President and Chief Executive Officer, Aeltus Investment Management, Inc.; General Partner, Hellman, Jordan Management Co., Boston, MA; Chief Investment Officer, The Putnam Companies, Boston, MA; Credit Analyst and Lending Officer, Fleet Bank; Director and Consultant, EZE Castle Software (investment order management software); Director, Midway Pacific (lumber).
Qualifications: Business management, mutual fund, director and investment experience. |
John S. Walsh
Birth Date: November 28, 1957
Trustee
Began serving: June 2006 | Principal Occupations: Director or Trustee, Chairman of the Audit Committee of the Federated Fund Family; President and Director, Heat Wagon, Inc. (manufacturer of construction temporary heaters); President and Director, Manufacturers Products, Inc. (distributor of portable construction heaters); President, Portable Heater Parts, a division of Manufacturers Products, Inc.
Previous Position: Vice President, Walsh & Kelly, Inc.
Qualifications: Business management and director experience. |
Annual Shareholder Report
OFFICERS
Name
Birth Date
Address
Positions Held with Trust
Date Service Began | Principal Occupation(s) for Past Five Years
and Previous Position(s) |
John W. McGonigle
Birth Date: October 26, 1938
Secretary
Began serving: May 2006 | Principal Occupations: Executive Vice President and Secretary of the Federated Fund Family; Vice Chairman, Executive Vice President, Secretary and Director, Federated Investors, Inc.
Previous Positions: Trustee, Federated Investment Management Company and Federated Investment Counseling; Director, Federated Global Investment Management Corp., Federated Services Company and Federated Securities Corp. |
Richard A. Novak
Birth Date: December 25, 1963
Treasurer
Began serving: May 2006 | Principal Occupations: Principal Financial Officer and Treasurer of the Federated Fund Family; Senior Vice President, Federated Administrative Services; Financial and Operations Principal for Federated Securities Corp., Edgewood Services, Inc. and Southpointe Distribution Services, Inc.
Previous Positions: Controller of Federated Investors, Inc.; Vice President, Finance of Federated Services Company; held various financial management positions within The Mercy Hospital of Pittsburgh; Auditor, Arthur Andersen & Co. |
Brian P. Bouda
Birth Date: February 28, 1947
CHIEF COMPLIANCE OFFICER AND SENIOR VICE PRESIDENT
Began serving: June 2006 | Principal Occupations: Senior Vice President and Chief Compliance Officer of the Federated Fund Family; Vice President and Chief Compliance Officer of Federated Investors, Inc. and Chief Compliance Officer of its subsidiaries. Mr. Bouda joined Federated in 1999 and is a member of the American Bar Association and the State Bar Association of Wisconsin. |
Stephen F. Auth
Birth Date: September 3, 1956
450 Lexington Avenue
Suite 3700
New York, NY 10017-3943
CHIEF INVESTMENT OFFICER
Began serving: June 2012 | Principal Occupations: Stephen F. Auth is Chief Investment Officer of this Fund and various other Funds in the Federated Fund Complex; Executive Vice President, Federated Investment Counseling, Federated Global Investment Management Corp. and Federated Equity Management Company of Pennsylvania.
Previous Positions: Executive Vice President, Federated Investment Management Company and Passport Research, Ltd. (investment advisory subsidiary of Federated); Senior Vice President, Global Portfolio Management Services Division; Senior Vice President, Federated Investment Management Company and Passport Research, Ltd.; Senior Managing Director and Portfolio Manager, Prudential Investments. |
Daniel Mahr
Birth Date: April 9, 1981
125 High Street
Oliver Tower
21st Floor
Boston, MA 02110-2704
Vice President
Began serving: June 2012 | Principal Occupations: Daniel Mahr has been the Fund's Portfolio Manager since August 2008. Mr. Mahr joined the MDT Advisers Investment Team in 2002. As Managing Director, Research, he is responsible for leading the Investment Team as it relates to the ongoing design, development and implementation of the Optimum Q Process. He is Vice President of the Trust with respect to the Fund. Mr. Mahr received his A.B., Computer Science from Harvard College and his S.M., Computer Science from Harvard University. |
Annual Shareholder Report
Evaluation and Approval of Advisory Contract–May 2012
FEDERATED MDT SMALL CAP CORE FUND (the “Fund”)
Following a review and recommendation of approval by the Fund's independent trustees, the Fund's Board reviewed and approved at its May 2012 meetings the Fund's investment advisory contract for an additional one-year term. The Board's decision regarding the contract reflects the exercise of its business judgment on whether to continue the existing arrangements.
In this connection, the Federated Funds' Board had previously appointed a Senior Officer, whose duties include specified responsibilities relating to the process by which advisory fees are to be charged to a Federated fund. The Senior Officer has the authority to retain consultants, experts, or staff as may be reasonably necessary to assist in the performance of his duties, reports directly to the Board, and may be terminated only with the approval of a majority of the independent members of the Board. The Senior Officer prepared and furnished to the Board an independent, written evaluation that covered topics discussed below (the “Evaluation”). The Board considered that Evaluation, along with other information, in deciding to approve the advisory contract.
The Board is also familiar with and considered judicial decisions concerning allegedly excessive investment advisory fees, which have indicated that the following factors may be relevant to an Adviser's fiduciary duty with respect to its receipt of compensation from a fund: the nature and quality of the services provided by the Adviser to a fund and its shareholders, including the performance and expenses of the fund and of comparable funds; the Adviser's cost of providing the services, including the profitability to the Adviser of providing advisory services to a fund; the extent to which the Adviser may realize “economies of scale” as a fund grows larger and, if such economies exist, whether they have been shared with a fund and its shareholders; any “fall-out financial benefits” that accrue to the Adviser because of its relationship with a fund (including research services received from brokers that execute fund trades and any fees paid to affiliates of the Adviser for services rendered to a fund); comparative fee structures, including a comparison of fees paid to the Adviser with those paid by similar funds; and the extent to which the Board members are fully informed about all facts the Board deems relevant to its consideration of the Adviser's services and fees. Consistent with these judicial decisions, the Board also considered management fees (including any components thereof) charged to institutional and other clients of the Adviser for what might be viewed as like services. The Board was aware of these factors and was guided by them in its review of the Fund's advisory contract to the extent it considered them to be appropriate and relevant, as discussed further below.
Annual Shareholder Report
The Board considered and weighed these circumstances in light of its substantial accumulated experience in governing the Fund and working with Federated on matters relating to the Federated funds, and was assisted in its deliberations by independent legal counsel. Throughout the year, and in connection with its May meetings, the Board requested and received substantial and detailed information about the Fund and the Federated organization that was in addition to the extensive materials that comprise and accompany the Senior Officer's Evaluation. Federated provided much of this information at each regular meeting of the Board, and furnished additional substantial information in connection with the May meeting at which the Board's formal review of the advisory contract occurred. At this May meeting, senior management of the Adviser also met with the independent trustees and their counsel to discuss the materials presented and any other matters thought relevant by the Adviser or the trustees. Between regularly scheduled meetings, the Board also received information on particular matters as the need arose. Thus, the Board's consideration of the advisory contract included review of the Senior Officer's Evaluation, accompanying data and additional information covering such matters as: the Adviser's investment philosophy, revenue, profitability, personnel and processes; investment and operating strategies; the Fund's short- and long-term performance (in absolute terms, both on a gross basis and net of expenses, as well as in relationship to its particular investment program and certain competitor or “peer group” funds and/or other benchmarks, as appropriate), and comments on the reasons for performance; the Fund's investment objectives; the Fund's expenses (including the advisory fee itself and the overall expense structure of the Fund, both in absolute terms and relative to similar and/or competing funds, with due regard for contractual or voluntary expense limitations); the use and allocation of brokerage commissions derived from trading the Fund's portfolio securities (if any); and the nature, quality and extent of the advisory and other services provided to the Fund by the Adviser and its affiliates. The Board also considered the preferences and expectations of Fund shareholders; the entrepreneurial risk assumed by the Adviser in sponsoring the funds; the continuing state of competition in the mutual fund industry and market practices; the range of comparable fees for similar funds in the mutual fund industry; the Fund's relationship to the Federated family of funds which include a comprehensive array of funds with different investment objectives, policies and strategies which are available for exchange without the incurrence of additional sales charges; compliance and audit reports concerning the Federated funds and the Federated companies that service them (including communications from regulatory agencies), as well as Federated's responses to any issues raised therein; and relevant developments in the mutual fund industry and how the Federated funds and/or Federated are responding to them. The Board's evaluation process is evolutionary. The criteria considered and the emphasis placed on relevant criteria change in recognition of changing circumstances in the mutual fund marketplace.
Annual Shareholder Report
While mindful that courts have cautioned against giving such comparisons too much weight, the Board has found the use of comparisons of the Fund's fees and expenses to other mutual funds with comparable investment programs to be relevant, given the high degree of competition in the mutual fund business. The Board focused on comparisons with other similar mutual funds more heavily than non-mutual fund products or services because it is believed that they are more relevant. For example, other mutual funds are the products most like the Fund, they are readily available to Fund shareholders as alternative investment vehicles, and they are the type of investment vehicle in fact chosen and maintained by the Fund's investors. The range of their fees and expenses therefore appears to be a generally reliable indication of what consumers have found to be reasonable in the precise marketplace in which the Fund competes. In this regard, the Senior Officer has reviewed Federated's fees for providing advisory services to products outside the Federated family of funds (e.g., institutional and separate accounts). He concluded that mutual funds and institutional accounts are inherently different products. Those differences include, but are not limited to, different types of targeted investors; being subject to different laws and regulations; different legal structures; different average account sizes; different associated costs; different portfolio management techniques made necessary by different cash flows; and portfolio manager time spent in review of securities pricing. The Senior Officer did not consider these fee schedules to be determinative in judging the appropriateness of mutual fund advisory contracts.
The Fund's ability to deliver competitive performance when compared to its peer group was also deemed to be relevant by the Board as a useful indicator of how the Adviser is executing the Fund's investment program, which in turn assisted the Board in reaching a conclusion that the nature, extent, and quality of the Adviser's investment management services were such as to warrant continuation of the advisory contract.
The Senior Officer reviewed information compiled by Federated, using data supplied by independent fund ranking organizations, regarding the performance of, and fees charged by, other mutual funds, noting his view that comparisons to fund peer groups are relevant in judging the reasonableness of proposed fees. He also observed that certain funds may exhibit important differences in their objectives and management techniques when compared to other funds placed in the same peer group by ranking organizations, noting in this connection that the Fund's quantitative investment program is of such a type.
Annual Shareholder Report
For the periods covered by the Evaluation, the Fund's performance for the one-year period was above the median of the relevant peer group, and the Fund's performance fell below the median of the relevant peer group for the three-year and five-year periods. In addition, the Board was informed by the Adviser that, for the same periods, the Fund outperformed its benchmark index for the one-year period, underperformed its benchmark index for the three-year period and underperformed its benchmark index for the five-year period. The Board discussed the Fund's performance with the Adviser and recognized the efforts being undertaken by the Adviser. The Board will continue to monitor these efforts and the performance of the Fund.
The Board also received financial information about Federated, including information regarding the compensation and benefits Federated derived from its relationships with the Federated funds. This information covered not only the fees under the advisory contracts, but also fees received by Federated's subsidiaries for providing other services to the Federated funds under separate contracts (e.g., for serving as the Federated funds' administrator). The information also detailed any indirect benefit Federated may derive from its receipt of research services from brokers who execute Federated fund trades. In addition, the Board considered the fact that, in order for a fund to be competitive in the marketplace, Federated and its affiliates frequently waived fees and/or reimbursed expenses and have disclosed to fund investors and/or indicated to the Board their intention to do so in the future, where appropriate. Moreover, the Board receives regular reporting as to the institution or elimination of these voluntary waivers.
Federated furnished information, requested by the Senior Officer, that reported revenues on a fund-by-fund basis and made estimates of the allocation of expenses on a fund-by-fund basis, using allocation methodologies specified by the Senior Officer. The Senior Officer noted that, although they may apply consistent allocation processes, the inherent difficulties in allocating costs (and the unavoidable arbitrary aspects of that exercise) and the lack of consensus on how to allocate those costs may render such allocation information unreliable. The allocation information was considered in the analysis by the Board but was determined to be of limited use.
The Board and the Senior Officer also reviewed information compiled by Federated comparing profitability information for Federated to other publicly held fund management companies. In this regard, the Senior Officer noted the limited availability of such information, but nonetheless concluded that Federated's profit margins did not appear to be excessive.
The Senior Officer's Evaluation also discussed the notion of possible realization of “economies of scale” as a fund grows larger. The Board considered in this regard that the Adviser has made significant and long-term investments in areas that support all of the Federated funds, such as personnel and processes for the portfolio management, shareholder services, compliance, internal audit, and risk management functions; and systems technology; and that the benefits of
Annual Shareholder Report
these efforts (as well as any economies, should they exist) were likely to be enjoyed by the fund complex as a whole. Finally, the Board also noted the absence of any applicable regulatory or industry guidelines on this subject, which (as discussed in the Senior Officer's Evaluation) is compounded by the lack of any common industry practice or general pattern with respect to structuring fund advisory fees with “breakpoints” that serve to reduce the fee as the fund attains a certain size. The Senior Officer did not recommend institution of breakpoints in pricing Federated's fund advisory services at this time.
It was noted in the materials for the Board meeting that for the period covered by the Evaluation, the Fund's investment advisory fee was waived in its entirety. The Board reviewed the contractual fee rate and other expenses of the Fund with the Adviser and was satisfied that the overall expense structure of the Fund remained competitive.
The Senior Officer noted that, considering the totality of the circumstances, and all of the factors referenced within his Evaluation, he had concluded that, subject to comments and recommendations made within his Evaluation, his observations and the information accompanying the Evaluation supported a finding by the Board that the management fees for each of the funds was reasonable and that Federated appeared to provide appropriate advisory and administrative services to the Fund for the fees paid. Under these circumstances, no changes were recommended to, and no objection was raised to, the continuation of the Fund's advisory contract.
In its decision to continue an existing investment advisory contract, the Board was mindful of the potential disruptions of the Fund's operations and various risks, uncertainties and other effects that could occur as a result of a decision to terminate or not renew an advisory contract. In particular, the Board recognized that many shareholders have invested in the Fund on the strength of the Adviser's industry standing and reputation and with the expectation that the Adviser will have a continuing role in providing advisory services to the Fund. Thus, the Board's approval of the advisory contract reflected the fact that it is the shareholders who have effectively selected the Adviser by virtue of having invested in the Fund. The Board concluded that, in light of the factors discussed above, including the nature, quality and scope of the services provided to the Fund by the Adviser and its affiliates, continuation of the advisory contract was appropriate.
The Board based its decision to approve the advisory contract on the totality of the circumstances and relevant factors and with a view to past and future long-term considerations. Not all of the factors and considerations identified above were necessarily relevant to the Fund, nor did the Board consider any one of them to be determinative. With respect to the factors that were relevant, the Board's decision to approve the contract reflects its determination that Federated's performance and actions provided a satisfactory basis to support the decision to continue the existing arrangements.
Annual Shareholder Report
Voting Proxies on Fund Portfolio Securities
A description of the policies and procedures that the Fund uses to determine how to vote proxies, if any, relating to securities held in the Fund's portfolio is available, without charge and upon request, by calling 1-800-341-7400. A report on “Form N-PX” of how the Fund voted any such proxies during the most recent 12-month period ended June 30 is available from Federated's website at FederatedInvestors.com. To access this information from the home page, select “All” under “Asset Classes.” Select a fund name and share class, if applicable, to go to the Fund Overview page. On the Fund Overview page, select the “Documents” tab. At the bottom of that page, select “Proxy Voting Record Report (Form N-PX).” Form N-PX filings are also available at the SEC's website at www.sec.gov.
Quarterly Portfolio Schedule
The Fund files with the SEC a complete schedule of its portfolio holdings, as of the close of the first and third quarters of its fiscal year, on “Form N-Q.” These filings are available on the SEC's website at www.sec.gov and may be reviewed and copied at the SEC's Public Reference Room in Washington, DC. (Call 1-800-SEC-0330 for information on the operation of the Public Reference Room.) You may also access this information from the “Products” section of Federated's website at FederatedInvestors.com. From the home page, select “All” under “Asset Classes.” Select a fund name and share class, if applicable, to go to the Fund Overview page. On the Fund Overview page, select the “Documents” tab. At the bottom of that page, select “Form N-Q.”
Annual Shareholder Report
Mutual funds are not bank deposits or obligations, are not guaranteed by any bank and are not insured or guaranteed by the U.S. government, the Federal Deposit Insurance Corporation, the Federal Reserve Board or any other government agency. Investment in mutual funds involves investment risk, including the possible loss of principal.
This Report is authorized for distribution to prospective investors only when preceded or accompanied by the Fund's Prospectus, which contains facts concerning its objective and policies, management fees, expenses and other information.
Federated MDT Small Cap Core Fund
Federated Investors Funds
4000 Ericsson Drive
Warrendale, PA 15086-7561
Contact us at FederatedInvestors.com
or call 1-800-341-7400.
Federated Securities Corp., Distributor
CUSIP 31421R817
CUSIP 31421R791
CUSIP 31421R783
37328 (9/12)
Federated is a registered trademark of Federated Investors, Inc.
2012 ©Federated Investors, Inc.
Item 12. Exhibits
(a)(1) Code of Ethics- Not Applicable to this Annual Report.
(a)(2) Certifications of Principal Executive Officer and Principal Financial Officer.
(a)(3) Not Applicable.
(b) Certifications pursuant to 18 U.S.C. Section 1350.
SIGNATURES
Pursuant to the requirements of the Securities Exchange Act of 1934 and the Investment Company Act of 1940, the registrant has duly caused this report to be signed on its behalf by the undersigned, thereunto duly authorized.
Registrant Federated MDT Series
By /S/ Richard A. Novak
Richard A. Novak, Principal Financial Officer
Date September 28, 2012
Pursuant to the requirements of the Securities Exchange Act of 1934 and the Investment Company Act of 1940, this report has been signed below by the following persons on behalf of the registrant and in the capacities and on the dates indicated.
By /S/ J. Christopher Donahue
J. Christopher Donahue, Principal Executive Officer
Date September 28, 2012
By /S/ Richard A. Novak
Richard A. Novak, Principal Financial Officer
Date September 28, 2012