United States
Securities and Exchange Commission
Washington, D.C. 20549
Form N-CSR
Certified Shareholder Report of Registered Management Investment Companies
811-21904
(Investment Company Act File Number)
Federated MDT Series
_______________________________________________________________
(Exact Name of Registrant as Specified in Charter)
Federated Investors Funds
4000 Ericsson Drive
Warrendale, Pennsylvania 15086-7561
(Address of Principal Executive Offices)
(412) 288-1900
(Registrant's Telephone Number)
John W. McGonigle, Esquire
Federated Investors Tower
1001 Liberty Avenue
Pittsburgh, Pennsylvania 15222-3779
(Name and Address of Agent for Service)
(Notices should be sent to the Agent for Service)
Date of Fiscal Year End: 07/31/14
Date of Reporting Period: 07/31/14
Item 1. Reports to Stockholders

Annual Shareholder Report
July 31, 2014
| Share Class | Ticker |
| A | QAACX |
| C | QCACX |
| R | QKACX |
| Institutional | QIACX |
Federated MDT All Cap Core Fund
Fund Established 2002
A Portfolio of Federated MDT Series
Dear Valued Shareholder,
I am pleased to present the Annual Shareholder Report for your fund covering the period from August 1, 2013 through July 31, 2014. This report includes Management's Discussion of Fund Performance, a complete listing of your fund's holdings, performance information and financial statements along with other important fund information.
In addition, our website, FederatedInvestors.com, offers easy access to Federated resources that include timely fund updates, economic and market insights from our investment strategists, and financial planning tools. We invite you to register to take full advantage of its capabilities.
Thank you for investing with Federated. I hope you find this information useful and look forward to keeping you informed.
Sincerely,
J. Christopher Donahue, President
Not FDIC Insured • May Lose Value • No Bank Guarantee
CONTENTS
| 1 |
| 6 |
| 8 |
| 22 |
| 26 |
| 28 |
| 29 |
| 30 |
| 39 |
| 40 |
| 42 |
| 47 |
| 53 |
| 53 |
Management's Discussion of Fund Performance (unaudited)
The total return of Federated MDT All Cap Core Fund (the “Fund”), based on net asset value, for the 12-month reporting period ended July 31, 2014, was 19.21% for Class A Shares, 18.25% for Class C Shares, 18.68% for Class R Shares and 19.54% for Institutional Shares. The total return for the Russell 3000® Index (R3000),1 the Fund's broad-based securities market index, was 16.37% for the same period. The total return of the Morningstar Large Blend Funds Average (MLBFA),2 a peer group average for the Fund, was 15.53% during the same period. The Fund's and MLBFA's total returns for the most recently completed fiscal year reflected actual cash flows, transaction costs and other expenses, which were not reflected in the total return of the R3000.
During the reporting period, the Fund's investment strategy focused on stock selection. This was the most significant factor affecting the Fund's performance relative to the R3000 during the period.
The following discussion will focus on the performance of the Fund's Institutional Shares.
Market Overview
During the 12-month reporting period, domestic equity market performance was very strong as evidenced by the 16.37% return on the R3000. Large-cap stocks led the way with the Russell Top 200® Index3 returning 17.38%, closely followed by mid-cap stocks with a 16.36% return on the Russell Midcap® Index4. Small-cap stocks5 posted a moderate gain with the Russell 2000® Index6 returning 8.56%. Growth stocks outperformed value stocks during the reporting period with the Russell 3000® Growth Index,7 returning 17.89% as compared to 14.87% for the Russell 3000® Value Index.8
The best performing sectors in the R3000 during the reporting period were Information Technology (26.05%), Materials (21.17%), Health Care (20.92%) and Energy (19.40%). Underperforming sectors during the same period included Consumer Staples (7.42%) and Utilities (8.92%).
Annual Shareholder Report
STOCK SELECTION
The overweighting of outperforming fundamental factor combinations along with strong stock selection within those combinations contributed most to performance during the 12-month reporting period. The top contributing combinations included stocks with high value and improving earnings projections and stocks with high value and highly repeatable earnings. The Fund's sector exposures continued to remain close to R3000 weights, but with a small underweight in Information Technology which detracted from Fund performance. Strong stock selection in the Industrials, Health Care and Consumer Staples sectors made significant contributions to Fund performance. The most significant negative factor in the Fund's performance was the necessary exposure to cash (2.10%) which underperformed the equity market.
Individual stocks enhancing the Fund's performance during the reporting period included Trinity Industries Incorporated, Hewlett-Packard Company and Western Digital Corporation.
Individual stocks detracting from the Fund's performance during the reporting period included Apple Incorporated, Microsoft Corporation and Google Incorporated, which all outperformed the R3000. Apple was not held by the Fund; Microsoft and Google were underweighted relative to the R3000.
| 1 | Please see the footnotes to the line graphs below for definitions of, and further information about, the Russell 3000® Index. |
| 2 | Morningstar has assigned the Fund to the Morningstar Large Cap Value Funds Average peer group, however, the MLBFA is being used for comparison purposes. The Fund invests in both value and growth stocks and therefore the Fund's Adviser believes that the MLBFA is more reflective of the Fund's investment style. Please see the footnotes to the line graphs below for definitions of, and further information about, the MLBFA. |
| 3 | The Russell Top 200® Index measures the performance of the largest cap segment of the U.S. equity universe. The Russell Top 200® Index is a subset of the Russell 3000® Index. It includes approximately 200 of the largest securities based on a combination of their market cap and current index membership and represents approximately 68% of the U.S. market. The Russell Top 200® Index is constructed to provide a comprehensive and unbiased barometer for this very large cap segment and is completely reconstituted annually to ensure new and growing equities are reflected. The Russell Top 200 Index is unmanaged, and it is not possible to invest directly in an index. |
| 4 | The Russell Midcap® Index measures the performance of the mid-cap segment of the U.S. equity universe. The Russell Midcap® Index is a subset of the Russell 1000® Index. It includes approximately 800 of the smallest securities based on a combination of their market cap and current index membership. The Russell Midcap® Index represents approximately 31% of the total market capitalization of the Russell 1000® companies. The Russell Midcap® Index is constructed to provide a comprehensive and unbiased barometer for the mid-cap segment. The Russell Midcap Index is completely reconstituted annually to ensure larger stocks do not distort the performance and characteristics of the true mid-cap opportunity set. The Russell Midcap Index is unmanaged, and it is not possible to invest directly in an index. |
Annual Shareholder Report
| 5 | Small-cap stocks may be less liquid and subject to greater price volatility than large-cap stocks. |
| 6 | The Russell 2000® Index measures the performance of the small-cap segment of the U.S. equity universe. The Russell 2000® Index is a subset of the Russell 3000® Index representing approximately 10% of the total market capitalization of that index. It includes approximately 2000 of the smallest securities based on a combination of their market cap and current index membership. The Russell 2000® Index is constructed to provide a comprehensive and unbiased small-cap barometer and is completely reconstituted annually to ensure larger stocks do not distort the performance and characteristics of the true small-cap opportunity set. The Russell 2000 Index is unmanaged, and it is not possible to invest directly in an index. |
| 7 | The Russell 3000® Growth Index measures the performance of the broad growth segment of the U.S. equity universe. It includes those Russell 3000® Index companies with higher price-to-book ratios and higher forecasted growth values. The Russell 3000® Growth Index is constructed to provide a comprehensive, unbiased, and stable barometer of the broad growth market. The Russell 3000® Growth Index is completely reconstituted annually to ensure new and growing equities are included and that the represented companies continue to reflect growth characteristics. The Russell 3000 Growth Index is unmanaged, and it is not possible to invest directly in an index. |
| 8 | The Russell 3000® Value Index measures the performance of the broad value segment of U.S. equity value universe. It includes those Russell 3000® Index companies with lower price-to-book ratios and lower forecasted growth values. The Russell 3000® Value Index is constructed to provide a comprehensive, unbiased, and stable barometer of the broad value market. The Russell 3000® Value Index is completely reconstituted annually to ensure new and growing equities are included and that the represented companies continue to reflect value characteristics. The Russell 3000 Value Index is unmanaged, and it is not possible to invest directly in an index. |
Annual Shareholder Report
FUND PERFORMANCE AND GROWTH OF A $10,000 INVESTMENT
The graph below illustrates the hypothetical investment of $10,0001 in the Federated MDT All Cap Core Fund2 (the “Fund”) from July 31, 2004 to July 31, 2014, compared to the Russell 3000® Index (R3000)3 and the Morningstar Large Blend Funds Average (MLBFA).4 The Average Annual Total Return table below shows returns for each class averaged over the stated periods.
Growth of a $10,000 Investment
Growth of $10,000 as of July 31, 2014
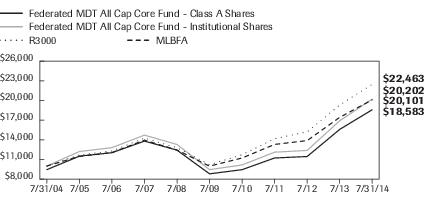
| Federated MDT All Cap Core Fund - | Class A Shares | Institutional Shares | R3000 | MLBFA |
| F | F | I | I |
| 7/31/2004 | 9,450 | 10,000 | 10,000 | 10,000 |
| 7/31/2005 | 11,509 | 12,214 | 11,691 | 11,472 |
| 7/31/2006 | 12,037 | 12,806 | 12,292 | 12,049 |
| 7/31/2007 | 13,803 | 14,717 | 14,269 | 13,952 |
| 7/31/2008 | 12,425 | 13,288 | 12,796 | 12,445 |
| 7/31/2009 | 8,813 | 9,455 | 10,209 | 9,986 |
| 7/31/2010 | 9,446 | 10,168 | 11,722 | 11,231 |
| 7/31/2011 | 11,229 | 12,114 | 14,177 | 13,296 |
| 7/31/2012 | 11,454 | 12,384 | 15,215 | 13,876 |
| 7/31/2013 | 15,588 | 16,900 | 19,303 | 17,423 |
| 7/31/2014 | 18,583 | 20,202 | 22,463 | 20,101 |
41 graphic description end -->
| ■ | Total returns shown include the maximum sales charge of 5.50% ($10,000 investment minus $550 sales charge = $9,450). |
The Fund offers multiple share classes whose performance may be greater than or less than its other share class(es) due to differences in sales charges and expenses. See the Average Annual Total Return table below for the returns of additional classes not shown in the line graph above.
Average Annual Total Returns for the Period Ended 7/31/2014
(returns reflect all applicable sales charges and contingent deferred sales charges as specified below in footnote #1)
| | 1 Year | 5 Years | 10 Years |
| Class A Shares5 | 12.68% | 14.78% | 6.39% |
| Class C Shares5 | 17.25% | 15.17% | 6.16% |
| Class R Shares5 | 18.68% | 15.54% | 6.53% |
| Institutional Shares | 19.54% | 16.40% | 7.29% |
| R3000 | 16.37% | 17.08% | 8.43% |
| MLBFA | 15.53% | 15.35% | 7.52% |
Annual Shareholder Report
Performance data quoted represents past performance which is no guarantee of future results. Investment return and principal value will fluctuate so that an investor's shares, when redeemed, may be worth more or less than their original cost. Mutual fund performance changes over time and current performance may be lower or higher than what is stated. For current to the most recent month-end performance and after-tax returns, visit FederatedInvestors.com or call 1-800-341-7400. Returns shown do not reflect the deduction of taxes that a shareholder would pay on Fund distributions or the redemption of Fund shares. Mutual funds are not obligations of or guaranteed by any bank and are not federally insured.
| 1 | Represents a hypothetical investment of $10,000 in the Fund after deducting applicable sales charges: for Class A Shares, the maximum sales charge of 5.50% ($10,000 investment minus $550 sales charge = $9,450); for Class C Shares a 1.00% contingent deferred sales charge would be applied on any redemption less than one year from the purchase date. The Fund's performance assumes the reinvestment of all dividends and distributions. The R3000 has been adjusted to reflect reinvestment of dividends of securities. |
| 2 | The Fund is the successor to the MDT All Cap Core Fund pursuant to a reorganization that took place on December 8, 2006. Prior to that date, the Fund had no investment operations. Accordingly, the performance information shown for periods prior to that date is that of the MDT All Cap Core Fund. |
| 3 | The R3000 measures the performance of the largest 3,000 U.S. companies representing approximately 98% of the investable U.S. equity market. The R3000 is constructed to provide a comprehensive, unbiased, and stable barometer of the broad market and is completely reconstituted annually to ensure new and growing equities are reflected. The index is unmanaged and, unlike the Fund, is not affected by cash flows. It is not possible to invest directly in an index. The R3000 is not adjusted to reflect sales charges, expenses or other fees that the Securities and Exchange Commission requires to be reflected in the Fund's performance. |
| 4 | Morningstar figures represent the average of the total returns reported by all the mutual funds designated by Morningstar as falling into the respective category indicated. They do not reflect sales charges. |
| 5 | The start of performance date for the Fund's Class A Shares, Class C Shares and Class R Shares was October 1, 2002. Class A Shares, Class C Shares and Class R Shares commenced operations on February 12, 2003, September 15, 2005 and December 12, 2006, respectively. Performance results shown before those dates are for the Fund's Institutional Shares and have been adjusted for the maximum sales charge, maximum contingent deferred sales charge and total annual operating expenses applicable to each class. The Fund's Institutional Shares commenced operations on October 1, 2002. Subject to the expense adjustments described above, the Class A Shares, Class C Shares and Class R Shares annual returns would be substantially similar to those of the Institutional Shares because Shares of each class are invested in the same portfolio of securities. |
Annual Shareholder Report
Portfolio of Investments Summary Table (unaudited)
At July 31, 2014, the Fund's industry composition1 was as follows:
| Industry Composition | Percentage of
Total Net Assets |
| Regional Banks | 4.5% |
| Money Center Bank | 3.8% |
| Biotechnology | 3.6% |
| Services to Medical Professionals | 3.3% |
| Property Liability Insurance | 2.8% |
| Electric Utility | 2.4% |
| Software Packaged/Custom | 2.2% |
| Computer Peripherals | 2.1% |
| Integrated Domestic Oil | 2.1% |
| Crude Oil & Gas Production | 2.0% |
| Defense Aerospace | 2.0% |
| Specialty Retailing | 2.0% |
| Computer Stores | 1.8% |
| Construction Machinery | 1.8% |
| Department Stores | 1.8% |
| Ethical Drugs | 1.8% |
| Commodity Chemicals | 1.7% |
| Defense Electronics | 1.6% |
| Telecommunication Equipment & Services | 1.6% |
| Multi-Line Insurance | 1.5% |
| Oil Refiner | 1.5% |
| Computers - Midrange | 1.4% |
| Integrated International Oil | 1.4% |
| Life Insurance | 1.4% |
| Medical Supplies | 1.4% |
| Semiconductor Distribution | 1.4% |
| Financial Services | 1.3% |
| Soft Drinks | 1.3% |
| Clothing Stores | 1.1% |
| Securities Brokerage | 1.1% |
| AT&T Divestiture | 1.0% |
| Semiconductor Manufacturing | 1.0% |
| Other2 | 36.3% |
| Cash Equivalents3 | 2.5% |
| Other Assets and Liabilities—Net4 | (0.5)% |
| TOTAL | 100.0% |
Annual Shareholder Report
| 1 | Except for Cash Equivalents and Other Assets and Liabilities, industry classifications are based upon, and individual portfolio securities are assigned to, the classifications of the Global Industry Classification Standard (GICS) except that the Adviser assigns a classification to securities not classified by the GICS and to securities for which the Adviser does not have access to the classification made by the GICS. |
| 2 | For purposes of this table, industry classifications which constitute less than 1.0% of the Fund's total net assets have been aggregated under the designation “Other”. |
| 3 | Cash Equivalents include any investments in money market mutual funds and/or overnight repurchase agreements. |
| 4 | Assets, other than investments in securities, less liabilities. See Statement of Assets and Liabilities. |
Annual Shareholder Report
Portfolio of Investments
July 31, 2014
| Shares | | | Value |
| | | COMMON STOCKS—98.0% | |
| | | Agricultural Chemicals—0.6% | |
| 7,000 | | Bunge Ltd. | $551,880 |
| 200 | 1 | Graham Holdings Co. | 137,150 |
| 2,500 | | Scotts Miracle-Gro Co. | 133,000 |
| | | TOTAL | 822,030 |
| | | Agricultural Machinery—0.8% | |
| 5,400 | | AGCO Corp. | 263,034 |
| 11,500 | | Deere & Co. | 978,765 |
| | | TOTAL | 1,241,799 |
| | | Airline - National—0.5% | |
| 17,100 | 1 | United Continental Holdings, Inc. | 793,269 |
| | | Airline - Regional—0.7% | |
| 10,000 | | Alaska Air Group, Inc. | 439,700 |
| 19,400 | | Southwest Airlines Co. | 548,632 |
| | | TOTAL | 988,332 |
| | | Airlines—0.6% | |
| 25,000 | | Delta Air Lines, Inc. | 936,500 |
| | | Apparel—0.4% | |
| 2,000 | 1 | Ann, Inc. | 73,500 |
| 1,300 | | Carter's, Inc. | 99,528 |
| 2,300 | | Guess ?, Inc. | 59,823 |
| 4,900 | | V.F. Corp. | 300,223 |
| | | TOTAL | 533,074 |
| | | AT&T Divestiture—1.0% | |
| 33,400 | | AT&T, Inc. | 1,188,706 |
| 6,700 | | Verizon Communications, Inc. | 337,814 |
| | | TOTAL | 1,526,520 |
| | | Auto Components—0.5% | |
| 12,500 | | Goodyear Tire & Rubber Co. | 314,625 |
| 4,100 | | Lear Corp. | 386,097 |
| | | TOTAL | 700,722 |
| | | Auto Manufacturing—0.7% | |
| 26,800 | | Ford Motor Co. | 456,136 |
| 5,000 | 1 | TRW Automotive Holdings Corp. | 511,450 |
| | | TOTAL | 967,586 |
Annual Shareholder Report
| Shares | | | Value |
| | | COMMON STOCKS—continued | |
| | | Auto Original Equipment Manufacturers—0.9% | |
| 300 | 1 | AutoZone, Inc. | $155,109 |
| 15,600 | | Johnson Controls, Inc. | 736,944 |
| 1,800 | 1 | O'Reilly Automotive, Inc. | 270,000 |
| 2,200 | 1 | Tenneco Automotive, Inc. | 140,140 |
| | | TOTAL | 1,302,193 |
| | | Auto Rentals—0.5% | |
| 6,700 | 1 | United Rentals, Inc. | 709,530 |
| | | Biotechnology—3.6% | |
| 6,800 | 1 | Alexion Pharmaceuticals, Inc. | 1,081,132 |
| 1,400 | | Amgen, Inc. | 178,346 |
| 3,200 | 1 | Biogen Idec, Inc. | 1,070,048 |
| 6,400 | 1 | Celgene Corp. | 557,760 |
| 13,300 | 1 | Gilead Sciences, Inc. | 1,217,615 |
| 4,500 | 1 | Illumina, Inc. | 719,595 |
| 1,500 | 1 | Regeneron Pharmaceuticals, Inc. | 474,330 |
| | | TOTAL | 5,298,826 |
| | | Broadcasting—0.8% | |
| 13,589 | 1 | DIRECTV Group, Inc. | 1,169,334 |
| | | Building Materials—0.3% | |
| 4,200 | | Fortune Brands Home & Security, Inc. | 158,718 |
| 3,300 | | Lennox International, Inc. | 281,556 |
| | | TOTAL | 440,274 |
| | | Building Supply Stores—0.5% | |
| 4,300 | | Home Depot, Inc. | 347,655 |
| 7,700 | | Lowe's Cos., Inc. | 368,445 |
| | | TOTAL | 716,100 |
| | | Cable TV—0.6% | |
| 5,300 | | Time Warner, Inc. | 440,006 |
| 6,000 | | Viacom, Inc., Class B | 496,020 |
| | | TOTAL | 936,026 |
| | | Capital Markets—0.2% | |
| 5,800 | | Franklin Resources, Inc. | 314,070 |
| | | Closed End Fund—0.4% | |
| 4,500 | 1 | Berkshire Hathaway, Inc. | 564,435 |
| | | Clothing Stores—1.1% | |
| 1,700 | | Children's Place, Inc./The | 85,340 |
| 14,000 | | Gap (The), Inc. | 561,540 |
| 4,900 | | Hanesbrands, Inc. | 478,779 |
Annual Shareholder Report
| Shares | | | Value |
| | | COMMON STOCKS—continued | |
| | | Clothing Stores—continued | |
| 5,300 | 1 | Michael Kors Holdings Ltd. | $431,844 |
| | | TOTAL | 1,557,503 |
| | | Commodity Chemicals—1.7% | |
| 4,600 | | Celanese Corp. | 267,766 |
| 5,200 | | Dow Chemical Co. | 265,564 |
| 4,400 | | Eastman Chemical Co. | 346,632 |
| 7,800 | | LyondellBasell Industries NV | 828,750 |
| 1,500 | | PPG Industries, Inc. | 297,540 |
| 3,000 | | RPM International, Inc. | 132,540 |
| 4,800 | | Westlake Chemical Corp. | 419,472 |
| | | TOTAL | 2,558,264 |
| | | Communications Equipment—0.3% | |
| 20,800 | | Juniper Networks, Inc. | 489,632 |
| | | Computer Peripherals—2.1% | |
| 6,400 | | Lexmark International, Inc., Class A | 307,392 |
| 19,800 | | NetApp, Inc. | 769,032 |
| 9,200 | | Sandisk Corp. | 843,732 |
| 12,000 | | Western Digital Corp. | 1,197,960 |
| | | TOTAL | 3,118,116 |
| | | Computer Services—0.3% | |
| 4,100 | | Global Payments, Inc. | 284,007 |
| 2,634 | 1 | Synnex Corp. | 169,893 |
| | | TOTAL | 453,900 |
| | | Computer Stores—1.8% | |
| 10,800 | | GameStop Corp. | 453,276 |
| 42,649 | 1 | Ingram Micro, Inc., Class A | 1,224,026 |
| 2,100 | 1 | Insight Enterprises, Inc. | 55,167 |
| 13,862 | 1 | Tech Data Corp. | 870,395 |
| | | TOTAL | 2,602,864 |
| | | Computers - High End—0.8% | |
| 6,500 | | IBM Corp. | 1,245,855 |
| | | Computers - Midrange—1.4% | |
| 59,700 | | Hewlett-Packard Co. | 2,125,917 |
| | | Construction Machinery—1.8% | |
| 6,300 | | Caterpillar, Inc. | 634,725 |
| 4,900 | | Joy Global, Inc. | 290,374 |
| 38,200 | | Trinity Industries, Inc. | 1,667,048 |
| | | TOTAL | 2,592,147 |
Annual Shareholder Report
| Shares | | | Value |
| | | COMMON STOCKS—continued | |
| | | Cosmetics & Toiletries—0.7% | |
| 21,400 | | Avon Products, Inc. | $282,480 |
| 3,800 | | Estee Lauder Cos., Inc., Class A | 279,148 |
| 3,300 | | International Flavors & Fragrances, Inc. | 333,267 |
| 5,400 | 1 | Sally Beauty Holdings, Inc. | 140,130 |
| | | TOTAL | 1,035,025 |
| | | Crude Oil & Gas Production—2.0% | |
| 11,200 | | Apache Corp. | 1,149,792 |
| 22,200 | | Chesapeake Energy Corp. | 585,414 |
| 6,700 | | Devon Energy Corp. | 505,850 |
| 6,100 | | EOG Resources, Inc. | 667,584 |
| | | TOTAL | 2,908,640 |
| | | Defense Aerospace—2.0% | |
| 3,200 | | Alliant Techsystems, Inc. | 415,776 |
| 5,900 | 1 | B/E Aerospace, Inc. | 502,326 |
| 2,700 | | Boeing Co. | 325,296 |
| 5,500 | | General Dynamics Corp. | 642,235 |
| 6,800 | | Lockheed Martin Corp. | 1,135,396 |
| | | TOTAL | 3,021,029 |
| | | Defense Electronics—1.6% | |
| 3,500 | | L-3 Communications Holdings, Inc. | 367,360 |
| 10,300 | | Northrop Grumman Corp. | 1,269,681 |
| 7,300 | | Raytheon Co. | 662,621 |
| | | TOTAL | 2,299,662 |
| | | Department Stores—1.8% | |
| 2,600 | | Dillards, Inc., Class A | 309,972 |
| 14,900 | | Kohl's Corp. | 797,746 |
| 16,600 | | Macy's, Inc. | 959,314 |
| 10,900 | | Target Corp. | 649,531 |
| | | TOTAL | 2,716,563 |
| | | Discount Department Stores—0.7% | |
| 5,400 | | Foot Locker, Inc. | 256,662 |
| 9,700 | | Wal-Mart Stores, Inc. | 713,726 |
| | | TOTAL | 970,388 |
| | | Diversified Leisure—0.6% | |
| 7,200 | | Las Vegas Sands Corp. | 531,720 |
| 6,200 | | Royal Caribbean Cruises Ltd. | 369,830 |
| | | TOTAL | 901,550 |
Annual Shareholder Report
| Shares | | | Value |
| | | COMMON STOCKS—continued | |
| | | Diversified Oil—0.9% | |
| 9,000 | | Murphy Oil Corp. | $559,170 |
| 7,500 | | Occidental Petroleum Corp. | 732,825 |
| | | TOTAL | 1,291,995 |
| | | Diversified Tobacco—0.3% | |
| 11,500 | | Altria Group, Inc. | 466,900 |
| | | Drug Stores—0.5% | |
| 10,200 | | Walgreen Co. | 701,454 |
| | | Education & Training Services—0.3% | |
| 11,000 | 1 | Apollo Group, Inc., Class A | 307,230 |
| 2,100 | | DeVry Education Group, Inc. | 83,937 |
| 1,500 | 1 | ITT Educational Services, Inc. | 21,345 |
| | | TOTAL | 412,512 |
| | | Electric Utilities—0.2% | |
| 4,500 | | Duke Energy Corp. | 324,585 |
| | | Electric Utility—2.4% | |
| 24,600 | | AES Corp. | 359,406 |
| 9,400 | | American Electric Power Co., Inc. | 488,706 |
| 13,400 | | Edison International | 734,320 |
| 9,700 | | Entergy Corp. | 706,451 |
| 17,500 | | Exelon Corp. | 543,900 |
| 2,900 | | PPL Corp. | 95,671 |
| 16,700 | | Public Service Enterprises Group, Inc. | 587,339 |
| | | TOTAL | 3,515,793 |
| | | Electrical - Radio & TV—0.3% | |
| 4,300 | | Harman International Industries, Inc. | 466,765 |
| | | Electrical Equipment—0.1% | |
| 4,200 | 1 | Sanmina Corp. | 97,818 |
| | | Electronic Equipment Instruments & Components—0.2% | |
| 4,600 | | Garmin Ltd. | 253,184 |
| | | Electronic Test/Measuring Equipment—0.0% | |
| 1,800 | 1 | Itron, Inc. | 64,764 |
| | | Electronics Stores—0.3% | |
| 16,800 | | Best Buy Co., Inc. | 499,464 |
| | | Ethical Drugs—1.8% | |
| 7,200 | | Abbott Laboratories | 303,264 |
| 11,400 | | Eli Lilly & Co. | 696,084 |
| 4,400 | | Johnson & Johnson | 440,396 |
| 2,100 | | Merck & Co., Inc. | 119,154 |
Annual Shareholder Report
| Shares | | | Value |
| | | COMMON STOCKS—continued | |
| | | Ethical Drugs—continued | |
| 27,500 | | Pfizer, Inc. | $789,250 |
| 3,700 | 1 | United Therapeutics Corp. | 336,478 |
| | | TOTAL | 2,684,626 |
| | | Financial Services—1.3% | |
| 500 | | American Express Co. | 44,000 |
| 6,500 | | Ameriprise Financial, Inc. | 777,400 |
| 1,600 | | BlackRock, Inc. | 487,568 |
| 9,500 | | Discover Financial Services | 580,070 |
| 2,500 | | Nelnet, Inc., Class A | 103,075 |
| | | TOTAL | 1,992,113 |
| | | Food Wholesaling—0.3% | |
| 5,900 | | Ingredion, Inc. | 434,417 |
| | | Gas Utilities—0.1% | |
| 2,300 | | EQT Corp. | 215,786 |
| | | Generic Drugs—0.3% | |
| 7,600 | 1 | Mylan, Inc. | 375,212 |
| | | Grocery Chain—0.9% | |
| 25,700 | | Kroger Co. | 1,258,786 |
| | | Health Care Providers & Services—0.2% | |
| 4,600 | 1 | Express Scripts Holding Co. | 320,390 |
| | | Home Products—0.9% | |
| 4,100 | | Energizer Holdings, Inc. | 470,516 |
| 2,600 | | Kimberly-Clark Corp. | 270,062 |
| 9,100 | | Newell Rubbermaid, Inc. | 295,568 |
| 4,600 | | Tupperware Brands Corp. | 334,788 |
| | | TOTAL | 1,370,934 |
| | | Hotels—0.4% | |
| 5,000 | | Marriott International, Inc., Class A | 323,550 |
| 3,600 | | Wyndham Worldwide Corp. | 271,980 |
| | | TOTAL | 595,530 |
| | | Hotels and Motels—0.1% | |
| 400 | | Wynn Resorts Ltd. | 85,280 |
| | | Hotels Restaurants & Leisure—0.2% | |
| 12,300 | 1 | MGM Resorts International | 330,132 |
| | | Household Appliances—0.7% | |
| 7,500 | | Whirlpool Corp. | 1,069,800 |
| | | Household Durables—0.3% | |
| 4,600 | | Stanley Black & Decker, Inc. | 402,270 |
Annual Shareholder Report
| Shares | | | Value |
| | | COMMON STOCKS—continued | |
| | | Industrial Machinery—0.5% | |
| 4,500 | | Huntington Ingalls Industries, Inc. | $409,140 |
| 9,100 | | Terex Corp. | 314,041 |
| | | TOTAL | 723,181 |
| | | Integrated Domestic Oil—2.1% | |
| 17,600 | | ConocoPhillips | 1,452,000 |
| 8,200 | | Hess Corp. | 811,636 |
| 21,900 | | Marathon Oil Corp. | 848,625 |
| | | TOTAL | 3,112,261 |
| | | Integrated International Oil—1.4% | |
| 8,300 | | Chevron Corp. | 1,072,692 |
| 9,500 | | Exxon Mobil Corp. | 939,930 |
| | | TOTAL | 2,012,622 |
| | | Internet Services—0.6% | |
| 4,500 | | IAC Interactive Corp. | 302,400 |
| 700 | 1 | NetFlix, Inc. | 295,904 |
| 200 | 1 | Priceline.com, Inc. | 248,490 |
| | | TOTAL | 846,794 |
| | | Life Insurance—1.4% | |
| 15,100 | | Assured Guaranty Ltd. | 337,032 |
| 4,700 | | MetLife, Inc. | 247,220 |
| 7,400 | | Principal Financial Group, Inc. | 367,632 |
| 11,700 | | Prudential Financial, Inc. | 1,017,549 |
| 2,900 | | StanCorp Financial Group, Inc. | 174,986 |
| | | TOTAL | 2,144,419 |
| | | Machinery—0.4% | |
| 2,600 | | Dover Corp. | 222,976 |
| 6,600 | | OshKosh Truck Corp. | 305,052 |
| | | TOTAL | 528,028 |
| | | Mail Order—0.1% | |
| 2,200 | | HSN, Inc. | 122,958 |
| | | Medical Supplies—1.4% | |
| 4,100 | 1 | Align Technology, Inc. | 222,261 |
| 7,600 | | Baxter International, Inc. | 567,644 |
| 7,400 | | Cardinal Health, Inc. | 530,210 |
| 7,400 | 1 | HCA, Inc. | 483,294 |
| 1,500 | | McKesson Corp. | 287,790 |
| | | TOTAL | 2,091,199 |
Annual Shareholder Report
| Shares | | | Value |
| | | COMMON STOCKS—continued | |
| | | Medical Technology—0.6% | |
| 7,300 | | Medtronic, Inc. | $450,702 |
| 6,500 | | St. Jude Medical, Inc. | 423,735 |
| | | TOTAL | 874,437 |
| | | Miscellaneous Components—0.3% | |
| 27,428 | | Vishay Intertechnology, Inc. | 404,015 |
| | | Miscellaneous Food Products—0.6% | |
| 13,800 | | Archer-Daniels-Midland Co. | 640,320 |
| 7,300 | | Fresh Del Monte Produce, Inc. | 218,562 |
| | | TOTAL | 858,882 |
| | | Money Center Bank—3.8% | |
| 62,500 | | Bank of America Corp. | 953,125 |
| 15,700 | | Bank of New York Mellon Corp. | 612,928 |
| 13,800 | | Citigroup, Inc. | 674,958 |
| 29,600 | | JPMorgan Chase & Co. | 1,707,032 |
| 14,000 | | State Street Corp. | 986,160 |
| 14,700 | | U.S. Bancorp | 617,841 |
| | | TOTAL | 5,552,044 |
| | | Motion Pictures—0.6% | |
| 9,500 | | Walt Disney Co. | 815,860 |
| | | Multi-Industry Capital Goods—0.6% | |
| 2,100 | | 3M Co. | 295,869 |
| 16,300 | | General Electric Co. | 409,945 |
| 5,600 | | Textron, Inc. | 203,672 |
| | | TOTAL | 909,486 |
| | | Multi-Industry Transportation—0.2% | |
| 2,100 | | FedEx Corp. | 308,448 |
| | | Multi-Line Insurance—1.5% | |
| 9,600 | | Allstate Corp. | 561,120 |
| 15,500 | | American International Group, Inc. | 805,690 |
| 5,500 | | CIGNA Corp. | 495,220 |
| 7,900 | | Lincoln National Corp. | 413,881 |
| | | TOTAL | 2,275,911 |
| | | Multi-Utilities—0.3% | |
| 7,900 | | Consolidated Edison Co. | 443,111 |
| | | Mutual Fund Adviser—0.5% | |
| 1,200 | 1 | Affiliated Managers Group | 239,100 |
| 3,600 | | T. Rowe Price Group, Inc. | 279,576 |
Annual Shareholder Report
| Shares | | | Value |
| | | COMMON STOCKS—continued | |
| | | Mutual Fund Adviser—continued | |
| 3,700 | | Waddell & Reed Financial, Inc., Class A | $195,323 |
| | | TOTAL | 713,999 |
| | | Office Electronics—0.2% | |
| 20,300 | | Xerox Corp. | 269,178 |
| | | Office Equipment—0.3% | |
| 14,800 | | Pitney Bowes, Inc. | 400,488 |
| | | Office Supplies—0.1% | |
| 4,500 | | Avery Dennison Corp. | 212,445 |
| | | Oil Gas & Consumable Fuels—0.8% | |
| 11,000 | | Phillips 66 | 892,210 |
| 4,500 | | SM Energy Co. | 353,430 |
| | | TOTAL | 1,245,640 |
| | | Oil Refiner—1.5% | |
| 11,600 | | HollyFrontier Corp. | 545,316 |
| 7,900 | | Marathon Petroleum Corp. | 659,492 |
| 19,000 | | Valero Energy Corp. | 965,200 |
| | | TOTAL | 2,170,008 |
| | | Oil Service, Explore & Drill—0.5% | |
| 6,400 | | Helmerich & Payne, Inc. | 680,064 |
| | | Oil Well Supply—0.8% | |
| 5,900 | | Baker Hughes, Inc. | 405,743 |
| 3,900 | | Halliburton Co. | 269,061 |
| 5,600 | | National-Oilwell, Inc. | 453,824 |
| | | TOTAL | 1,128,628 |
| | | Other Communications Equipment—0.8% | |
| 7,600 | | Harris Corp. | 518,852 |
| 11,800 | | Skyworks Solutions, Inc. | 598,968 |
| | | TOTAL | 1,117,820 |
| | | Packaged Foods—0.8% | |
| 20,300 | | ConAgra Foods, Inc. | 611,639 |
| 4,400 | | Kellogg Co. | 263,252 |
| 9,400 | | Mondelez International, Inc. | 338,400 |
| | | TOTAL | 1,213,291 |
| | | Paper & Forest Products—0.1% | |
| 5,600 | | Domtar, Corp. | 201,152 |
| | | Paper Products—0.5% | |
| 7,800 | | International Paper Co. | 370,500 |
Annual Shareholder Report
| Shares | | | Value |
| | | COMMON STOCKS—continued | |
| | | Paper Products—continued | |
| 3,600 | | Rock-Tenn Co. | $357,948 |
| | | TOTAL | 728,448 |
| | | Personal & Household—0.2% | |
| 5,800 | | Nu Skin Enterprises, Inc., Class A | 340,402 |
| | | Personal Loans—0.7% | |
| 13,700 | | Capital One Financial Corp. | 1,089,698 |
| | | Personnel Agency—0.3% | |
| 4,500 | | Manpower, Inc. | 350,505 |
| 3,400 | | Robert Half International, Inc. | 165,410 |
| | | TOTAL | 515,915 |
| | | Pharmaceuticals—0.2% | |
| 6,300 | | AbbVie, Inc. | 329,742 |
| | | Poultry Products—0.1% | |
| 2,400 | | Sanderson Farms, Inc. | 218,616 |
| | | Printing—0.1% | |
| 9,700 | | Donnelley (R.R.) & Sons Co. | 168,392 |
| | | Property Liability Insurance—2.8% | |
| 6,900 | | Ace Ltd. | 690,690 |
| 4,500 | | Chubb Corp. | 390,195 |
| 5,200 | | Everest Re Group Ltd. | 810,732 |
| 10,700 | | HCC Insurance Holdings, Inc. | 499,476 |
| 5,200 | | PartnerRe Ltd. | 542,672 |
| 3,900 | | Platinum Underwriters Holdings Ltd. | 228,540 |
| 11,200 | | The Travelers Cos., Inc. | 1,003,072 |
| | | TOTAL | 4,165,377 |
| | | Railroad—0.2% | |
| 3,700 | | Union Pacific Corp. | 363,747 |
| | | Recreational Vehicles—0.1% | |
| 1,400 | | Polaris Industries, Inc., Class A | 206,556 |
| | | Regional Banks—4.5% | |
| 23,300 | | BB&T Corp. | 862,566 |
| 1,700 | | City National Corp. | 127,925 |
| 7,300 | | Comerica, Inc. | 366,898 |
| 29,600 | | Fifth Third Bancorp | 606,208 |
| 17,200 | | Huntington Bancshares, Inc. | 168,904 |
| 30,200 | | KeyCorp | 408,908 |
| 12,900 | | PNC Financial Services Group | 1,065,024 |
| 9,100 | 1 | Popular, Inc. | 290,290 |
Annual Shareholder Report
| Shares | | | Value |
| | | COMMON STOCKS—continued | |
| | | Regional Banks—continued | |
| 2,600 | 1 | SVB Financial Group | $283,452 |
| 22,700 | | SunTrust Banks, Inc. | 863,735 |
| 29,100 | | Wells Fargo & Co. | 1,481,190 |
| 7,200 | | Zions Bancorp | 207,504 |
| | | TOTAL | 6,732,604 |
| | | Rental & Leasing Services—0.1% | |
| 3,200 | | Rent-A-Center, Inc. | 76,608 |
| | | Restaurants—0.4% | |
| 800 | 1 | Chipotle Mexican Grill, Inc. | 538,000 |
| | | Road & Rail—0.2% | |
| 2,700 | | Norfolk Southern Corp. | 274,482 |
| | | Securities Brokerage—1.1% | |
| 6,600 | | Goldman Sachs Group, Inc. | 1,140,942 |
| 10,700 | | Morgan Stanley | 346,038 |
| 6,000 | | TD Ameritrade Holding Corp. | 192,720 |
| | | TOTAL | 1,679,700 |
| | | Semiconductor Distribution—1.4% | |
| 25,913 | 1 | Arrow Electronics, Inc. | 1,501,658 |
| 14,515 | | Avnet, Inc. | 614,420 |
| | | TOTAL | 2,116,078 |
| | | Semiconductor Manufacturing—1.0% | |
| 23,500 | | Intel Corp. | 796,415 |
| 5,500 | 1 | Omnivision Technologies, Inc. | 123,200 |
| 12,800 | | Texas Instruments, Inc. | 592,000 |
| | | TOTAL | 1,511,615 |
| | | Semiconductors & Semiconductor Equipment—0.3% | |
| 11,100 | | Broadcom Corp. | 424,686 |
| | | Services to Medical Professionals—3.3% | |
| 8,200 | | Aetna, Inc. | 635,746 |
| 2,000 | 1 | Henry Schein, Inc. | 232,500 |
| 7,600 | | Humana, Inc. | 894,140 |
| 3,100 | 1 | Laboratory Corp. of America Holdings | 321,439 |
| 2,800 | | Omnicare, Inc. | 175,000 |
| 7,600 | | Quest Diagnostics, Inc. | 464,360 |
| 12,700 | | UnitedHealth Group, Inc. | 1,029,335 |
| 10,773 | | Wellpoint, Inc. | 1,182,983 |
| | | TOTAL | 4,935,503 |
Annual Shareholder Report
| Shares | | | Value |
| | | COMMON STOCKS—continued | |
| | | Soft Drinks—1.3% | |
| 14,400 | | Coca-Cola Enterprises, Inc. | $654,480 |
| 13,800 | | Dr. Pepper Snapple Group, Inc. | 810,888 |
| 5,700 | | PepsiCo, Inc. | 502,170 |
| | | TOTAL | 1,967,538 |
| | | Software Packaged/Custom—2.2% | |
| 19,200 | | CA, Inc. | 554,496 |
| 2,000 | 1 | Commvault Systems, Inc. | 96,040 |
| 7,300 | | Computer Sciences Corp. | 455,447 |
| 11,700 | 1 | Electronic Arts, Inc. | 393,120 |
| 2,700 | 1 | F5 Networks, Inc. | 303,993 |
| 14,900 | | Oracle Corp. | 601,811 |
| 35,500 | | Symantec Corp. | 839,930 |
| | | TOTAL | 3,244,837 |
| | | Specialty Chemicals—0.7% | |
| 2,500 | | Airgas, Inc. | 267,300 |
| 4,200 | | Ashland, Inc. | 439,530 |
| 12,400 | | Huntsman Corp. | 323,020 |
| | | TOTAL | 1,029,850 |
| | | Specialty Retailing—2.0% | |
| 8,000 | | Abercrombie & Fitch Co., Class A | 314,720 |
| 2,600 | 1 | AutoNation, Inc. | 138,632 |
| 8,100 | 1 | Bed Bath & Beyond, Inc. | 512,649 |
| 2,900 | | Big Lots, Inc. | 126,875 |
| 13,887 | | CVS Caremark Corp. | 1,060,411 |
| 4,500 | 1 | Dollar General Corp. | 248,535 |
| 3,800 | | GNC Acquisition Holdings, Inc. | 124,678 |
| 2,700 | | Nordstrom, Inc. | 186,921 |
| 16,300 | | Staples, Inc. | 188,917 |
| 1,400 | | Williams-Sonoma, Inc. | 93,898 |
| | | TOTAL | 2,996,236 |
| | | Technology Hardware & Equipment—0.2% | |
| 11,900 | | EMC Corp. | 348,670 |
| | | Telecommunication Equipment & Services—1.6% | |
| 2,400 | 1 | Anixter International, Inc. | 206,328 |
| 29,900 | | Cisco Systems, Inc. | 754,377 |
| 22,800 | | Corning, Inc. | 448,020 |
| 12,300 | | Qualcomm, Inc. | 906,510 |
| | | TOTAL | 2,315,235 |
Annual Shareholder Report
| Shares | | | Value |
| | | COMMON STOCKS—continued | |
| | | Telephone Utility—0.7% | |
| 26,200 | | CenturyLink, Inc. | $1,028,088 |
| | | Textiles Apparel & Luxury Goods—0.3% | |
| 3,700 | | PVH Corp. | 407,666 |
| | | Toys & Games—0.5% | |
| 7,600 | | Hasbro, Inc. | 379,696 |
| 10,400 | | Mattel, Inc. | 368,420 |
| | | TOTAL | 748,116 |
| | | Undesignated Consumer Cyclicals—0.3% | |
| 8,300 | | Herbalife Ltd. | 434,920 |
| 2,100 | | Weight Watchers International, Inc. | 45,549 |
| | | TOTAL | 480,469 |
| | | Uniforms—0.6% | |
| 6,500 | | Cintas Corp. | 406,900 |
| 6,900 | | Lam Research Corp. | 483,000 |
| | | TOTAL | 889,900 |
| | | TOTAL COMMON STOCKS
(IDENTIFIED COST $115,010,901) | 145,037,328 |
| | | INVESTMENT COMPANY—2.5% | |
| 3,599,784 | 2,3 | Federated Prime Value Obligations Fund, Institutional Shares, 0.07%
(AT NET ASSET VALUE) | 3,599,784 |
| | | TOTAL INVESTMENTS—100.5%
(IDENTIFIED COST $118,610,685)4 | 148,637,112 |
| | | OTHER ASSETS AND LIABILITIES - NET—(0.5)%5 | (671,433) |
| | | TOTAL NET ASSETS—100% | $147,965,679 |
| 1 | Non-income-producing security. |
| 2 | Affiliated holding. |
| 3 | 7-day net yield. |
| 4 | The cost of investments for federal tax purposes amounts to $118,740,467. |
| 5 | Assets, other than investments in securities, less liabilities. See Statement of Assets and Liabilities. |
Note: The categories of investments are shown as a percentage of total net assets at July 31, 2014.
Annual Shareholder Report
Various inputs are used in determining the value of the Fund's investments. These inputs are summarized in the three broad levels listed below:
Level 1—quoted prices in active markets for identical securities, including investment companies with daily net asset values, if applicable.
Level 2—other significant observable inputs (including quoted prices for similar securities, interest rates, prepayment speeds, credit risk, etc.). Also includes securities valued at amortized cost.
Level 3—significant unobservable inputs (including the Fund's own assumptions in determining the fair value of investments).
The inputs or methodology used for valuing securities are not an indication of the risk associated with investing in those securities.
As of July 31, 2014, all investments of the Fund utilized Level 1 inputs in valuing the Fund's assets carried at fair value.
See Notes which are an integral part of the Financial Statements
Annual Shareholder Report
Financial Highlights–Class A Shares
(For a Share Outstanding Throughout Each Period)
| Year Ended July 31 | 2014 | 2013 | 2012 | 2011 | 2010 |
| Net Asset Value, Beginning of Period | $17.26 | $12.73 | $12.48 | $10.54 | $9.91 |
| Income From Investment Operations: | | | | | |
| Net investment income | 0.081 | 0.091 | 0.061 | 0.031 | 0.051 |
| Net realized and unrealized gain on investments | 3.23 | 4.49 | 0.19 | 1.96 | 0.67 |
| TOTAL FROM INVESTMENT OPERATIONS | 3.31 | 4.58 | 0.25 | 1.99 | 0.72 |
| Less Distributions: | | | | | |
| Distributions from net investment income | (0.10) | (0.05) | — | (0.05) | (0.09) |
| Net Asset Value, End of Period | $20.47 | $17.26 | $12.73 | $12.48 | $10.54 |
| Total Return2 | 19.21% | 36.10% | 2.00% | 18.87% | 7.18% |
| Ratios to Average Net Assets: | | | | | |
| Net expenses | 1.35% | 1.35% | 1.35% | 1.34% | 1.29% |
| Net investment income | 0.41% | 0.59% | 0.48% | 0.21% | 0.44% |
| Expense waiver/reimbursement3 | 0.08% | 0.16% | 0.40% | 0.31% | 0.25% |
| Supplemental Data: | | | | | |
| Net assets, end of period (000 omitted) | $44,678 | $34,092 | $29,365 | $40,227 | $54,437 |
| Portfolio turnover | 31% | 99% | 164% | 154% | 135% |
| 1 | Per share numbers have been calculated using the average shares method. |
| 2 | Based on net asset value, which does not reflect the sales charge, redemption fee or contingent deferred sales charge, if applicable. |
| 3 | This expense decrease is reflected in both the net expense and the net investment income ratios shown above. |
See Notes which are an integral part of the Financial Statements
Annual Shareholder Report
Financial Highlights–Class C Shares
(For a Share Outstanding Throughout Each Period)
| Year Ended July 31 | 2014 | 2013 | 2012 | 2011 | 2010 |
| Net Asset Value, Beginning of Period | $16.55 | $12.26 | $12.12 | $10.27 | $9.66 |
| Income From Investment Operations: | | | | | |
| Net investment income (loss) | (0.07)1 | (0.03)1 | (0.04)1 | (0.07)1 | (0.04)1 |
| Net realized and unrealized gain on investments | 3.09 | 4.32 | 0.18 | 1.92 | 0.65 |
| TOTAL FROM INVESTMENT OPERATIONS | 3.02 | 4.29 | 0.14 | 1.85 | 0.61 |
| Less Distributions: | | | | | |
| Distributions from net investment income | — | — | — | — | (0.00)2 |
| Net Asset Value, End of Period | $19.57 | $16.55 | $12.26 | $12.12 | $10.27 |
| Total Return3 | 18.25% | 34.99% | 1.16% | 18.01% | 6.33% |
| Ratios to Average Net Assets: | | | | | |
| Net expenses | 2.15% | 2.15% | 2.15% | 2.13% | 2.08% |
| Net investment income (loss) | (0.38)% | (0.21)% | (0.32)% | (0.59)% | (0.36)% |
| Expense waiver/reimbursement4 | 0.06% | 0.11% | 0.36% | 0.29% | 0.24% |
| Supplemental Data: | | | | | |
| Net assets, end of period (000 omitted) | $35,052 | $27,674 | $24,440 | $31,129 | $39,524 |
| Portfolio turnover | 31% | 99% | 164% | 154% | 135% |
| 1 | Per share numbers have been calculated using the average shares method. |
| 2 | Represents less than $0.01. |
| 3 | Based on net asset value, which does not reflect the sales charge, redemption fee or contingent deferred sales charge, if applicable. |
| 4 | This expense decrease is reflected in both the net expense and the net investment income (loss) ratios shown above. |
See Notes which are an integral part of the Financial Statements
Annual Shareholder Report
Financial Highlights–Class R Shares
(For a Share Outstanding Throughout Each Period)
| Year Ended July 31 | 2014 | 2013 | 2012 | 2011 | 2010 |
| Net Asset Value, Beginning of Period | $17.09 | $12.62 | $12.44 | $10.52 | $9.91 |
| Income From Investment Operations: | | | | | |
| Net investment income (loss) | (0.01)1 | 0.021 | (0.00)1,2 | (0.04)1 | (0.01)1 |
| Net realized and unrealized gain on investments | 3.20 | 4.45 | 0.18 | 1.97 | 0.68 |
| TOTAL FROM INVESTMENT OPERATIONS | 3.19 | 4.47 | 0.18 | 1.93 | 0.67 |
| Less Distributions: | | | | | |
| Distributions from net investment income | (0.03) | — | — | (0.01) | (0.06) |
| Net Asset Value, End of Period | $20.25 | $17.09 | $12.62 | $12.44 | $10.52 |
| Total Return3 | 18.68% | 35.42% | 1.45% | 18.33% | 6.71% |
| Ratios to Average Net Assets: | | | | | |
| Net expenses | 1.81% | 1.83% | 1.85% | 1.83% | 1.75% |
| Net investment income (loss) | (0.05)% | 0.11% | (0.02)% | (0.31)% | (0.09)% |
| Expense waiver/reimbursement4 | 0.00%5 | 0.02% | 0.25% | 0.19% | 0.18% |
| Supplemental Data: | | | | | |
| Net assets, end of period (000 omitted) | $5,467 | $4,089 | $2,718 | $2,973 | $2,300 |
| Portfolio turnover | 31% | 99% | 164% | 154% | 135% |
| 1 | Per share numbers have been calculated using the average shares method. |
| 2 | Represents less than $0.01. |
| 3 | Based on net asset value. |
| 4 | This expense decrease is reflected in both the net expense and the net investment income (loss) ratios shown above. |
| 5 | Represents less than 0.01%. |
See Notes which are an integral part of the Financial Statements
Annual Shareholder Report
Financial Highlights–Institutional Shares
(For a Share Outstanding Throughout Each Period)
| Year Ended July 31 | 2014 | 2013 | 2012 | 2011 | 2010 |
| Net Asset Value, Beginning of Period | $17.45 | $12.87 | $12.61 | $10.66 | $10.02 |
| Income From Investment Operations: | | | | | |
| Net investment income | 0.131 | 0.121 | 0.091 | 0.051 | 0.081 |
| Net realized and unrealized gain on investments | 3.27 | 4.55 | 0.19 | 1.99 | 0.68 |
| TOTAL FROM INVESTMENT OPERATIONS | 3.40 | 4.67 | 0.28 | 2.04 | 0.76 |
| Less Distributions: | | | | | |
| Distributions from net investment income | (0.14) | (0.09) | (0.02) | (0.09) | (0.12) |
| Net Asset Value, End of Period | $20.71 | $17.45 | $12.87 | $12.61 | $10.66 |
| Total Return2 | 19.54% | 36.46% | 2.23% | 19.14% | 7.54% |
| Ratios to Average Net Assets: | | | | | |
| Net expenses | 1.10% | 1.10% | 1.10% | 1.08% | 1.01% |
| Net investment income | 0.65% | 0.84% | 0.73% | 0.45% | 0.69% |
| Expense waiver/reimbursement3 | 0.00%4 | 0.05% | 0.27% | 0.19% | 0.20% |
| Supplemental Data: | | | | | |
| Net assets, end of period (000 omitted) | $62,770 | $39,932 | $39,101 | $43,197 | $41,958 |
| Portfolio turnover | 31% | 99% | 164% | 154% | 135% |
| 1 | Per share numbers have been calculated using the average shares method. |
| 2 | Based on net asset value. |
| 3 | This expense decrease is reflected in both the net expense and the net investment income ratios shown above. |
| 4 | Represents less than 0.01%. |
See Notes which are an integral part of the Financial Statements
Annual Shareholder Report
Statement of Assets and Liabilities
July 31, 2014
| Assets: | | |
| Total investment in securities, at value including $3,599,784 of investment in an affiliated holding (Note 5) (identified cost $118,610,685) | | $148,637,112 |
| Income receivable | | 113,069 |
| Receivable for shares sold | | 224,394 |
| TOTAL ASSETS | | 148,974,575 |
| Liabilities: | | |
| Payable for investments purchased | $791,598 | |
| Payable for shares redeemed | 61,971 | |
| Payable for transfer agent fee | 38,505 | |
| Payable for distribution services fee (Note 5) | 25,194 | |
| Payable for other service fees (Notes 2 and 5) | 19,097 | |
| Payable for share registration costs | 25,750 | |
| Accrued expenses (Note 5) | 46,781 | |
| TOTAL LIABILITIES | | 1,008,896 |
| Net assets for 7,275,604 shares outstanding | | $147,965,679 |
| Net Assets Consist of: | | |
| Paid-in capital | | $220,052,204 |
| Net unrealized appreciation of investments | | 30,026,427 |
| Accumulated net realized loss on investments | | (102,447,697) |
| Undistributed net investment income | | 334,745 |
| TOTAL NET ASSETS | | $147,965,679 |
Annual Shareholder Report
Statement of Assets and Liabilities–continued
| Net Asset Value, Offering Price and Redemption Proceeds Per Share | | |
| Class A Shares: | | |
| Net asset value per share ($44,677,766 ÷ 2,183,047 shares outstanding), no par value, unlimited shares authorized | | $20.47 |
| Offering price per share (100/94.50 of $20.47) | | $21.66 |
| Redemption proceeds per share | | $20.47 |
| Class C Shares: | | |
| Net asset value per share ($35,051,656 ÷ 1,791,187 shares outstanding), no par value, unlimited shares authorized | | $19.57 |
| Offering price per share | | $19.57 |
| Redemption proceeds per share (99.00/100 of $19.57) | | $19.37 |
| Class R Shares: | | |
| Net asset value per share ($5,466,612 ÷ 269,980 shares outstanding), no par value, unlimited shares authorized | | $20.25 |
| Offering price per share | | $20.25 |
| Redemption proceeds per share | | $20.25 |
| Institutional Shares: | | |
| Net asset value per share ($62,769,645 ÷ 3,031,390 shares outstanding), no par value, unlimited shares authorized | | $20.71 |
| Offering price per share | | $20.71 |
| Redemption proceeds per share | | $20.71 |
See Notes which are an integral part of the Financial Statements
Annual Shareholder Report
Statement of Operations
Year Ended July 31, 2014
| Investment Income: | | | |
| Dividends (including $1,690 received from an affiliated holding (Note 5)) | | | $2,138,129 |
| Expenses: | | | |
| Investment adviser fee (Note 5) | | $911,171 | |
| Administrative fee (Note 5) | | 94,908 | |
| Custodian fees | | 10,294 | |
| Transfer agent fee (Note 2) | | 180,170 | |
| Directors'/Trustees' fees (Note 5) | | 1,570 | |
| Auditing fees | | 23,800 | |
| Legal fees | | 14,057 | |
| Portfolio accounting fees | | 80,532 | |
| Distribution services fee (Note 5) | | 260,427 | |
| Other service fees (Notes 2 and 5) | | 177,709 | |
| Share registration costs | | 49,495 | |
| Printing and postage | | 36,709 | |
| Miscellaneous (Note 5) | | 13,357 | |
| TOTAL EXPENSES | | 1,854,199 | |
| Reimbursements: | | | |
| Reimbursement of investment adviser fee (Note 5) | $(3,059) | | |
Reimbursement of other operating expenses
(Notes 2 and 5) | (48,300) | | |
| TOTAL REIMBURSEMENTS | | (51,359) | |
| Net expenses | | | 1,802,840 |
| Net investment income | | | 335,289 |
| Realized and Unrealized Gain on Investments: | | | |
| Net realized gain on investments | | | 9,164,512 |
| Net change in unrealized appreciation of investments | | | 10,835,601 |
| Net realized and unrealized gain on investments | | | 20,000,113 |
| Change in net assets resulting from operations | | | $20,335,402 |
See Notes which are an integral part of the Financial Statements
Annual Shareholder Report
Statement of Changes in Net Assets
| Year Ended July 31 | 2014 | 2013 |
| Increase (Decrease) in Net Assets | | |
| Operations: | | |
| Net investment income | $335,289 | $486,387 |
| Net realized gain on investments | 9,164,512 | 16,243,619 |
| Net change in unrealized appreciation/depreciation of investments | 10,835,601 | 14,544,294 |
| CHANGE IN NET ASSETS RESULTING FROM OPERATIONS | 20,335,402 | 31,274,300 |
| Distributions to Shareholders: | | |
| Distributions from net investment income | | |
| Class A Shares | (197,693) | (106,540) |
| Class R Shares | (7,299) | — |
| Institutional Shares | (281,875) | (261,222) |
| CHANGE IN NET ASSETS RESULTING FROM DISTRIBUTIONS TO SHAREHOLDERS | (486,867) | (367,762) |
| Share Transactions: | | |
| Proceeds from sale of shares | 49,369,736 | 11,741,209 |
| Net asset value of shares issued to shareholders in payment of distributions declared | 472,234 | 356,920 |
| Cost of shares redeemed | (27,511,670) | (32,842,623) |
| CHANGE IN NET ASSETS RESULTING FROM SHARE TRANSACTIONS | 22,330,300 | (20,744,494) |
| Change in net assets | 42,178,835 | 10,162,044 |
| Net Assets: | | |
| Beginning of period | 105,786,844 | 95,624,800 |
| End of period (including undistributed net investment income of $334,745 and $486,323, respectively) | $147,965,679 | $105,786,844 |
See Notes which are an integral part of the Financial Statements
Annual Shareholder Report
Notes to Financial Statements
July 31, 2014
1. ORGANIZATION
Federated MDT Series (the “Trust”) is registered under the Investment Company Act of 1940, as amended (the “Act”), as an open-end management investment company. The Trust consists of five portfolios. The financial statements included herein are only those of Federated MDT All Cap Core Fund (the “Fund”), a diversified portfolio. The financial statements of the other portfolios are presented separately. The assets of each portfolio are segregated and a shareholder's interest is limited to the portfolio in which shares are held. Each portfolio pays its own expenses. The Fund offers four classes of shares: Class A Shares, Class C Shares, Class R Shares and Institutional Shares. All shares of the Fund have equal rights with respect to voting, except on class-specific matters. The investment objective of the Fund is long-term capital appreciation.
2. SIGNIFICANT ACCOUNTING POLICIES
The following is a summary of significant accounting policies consistently followed by the Fund in the preparation of its financial statements. These policies are in conformity with U.S. generally accepted accounting principles (GAAP).
Investment Valuation
In calculating its net asset value (NAV), the Fund generally values investments as follows:
| ■ | Equity securities listed on an exchange or traded through a regulated market system are valued at their last reported sale price or official closing price in their principal exchange or market. |
| ■ | Shares of other mutual funds or non-exchange-traded investment companies are valued based upon their reported NAVs. |
| ■ | Fixed-income securities acquired with remaining maturities greater than 60 days are fair valued using price evaluations provided by a pricing service approved by the Board of Trustees (the “Trustees”). |
| ■ | Fixed-income securities and repurchase agreements acquired with remaining maturities of 60 days or less are valued at their amortized cost (adjusted for the accretion of any discount or amortization of any premium), unless the issuer's creditworthiness is impaired or other factors indicate that amortized cost is not an accurate estimate of the investment's fair value, in which case it would be valued in the same manner as a longer-term security. |
| ■ | Derivative contracts listed on exchanges are valued at their reported settlement or closing price. |
| ■ | Over-the-counter (OTC) derivative contracts are fair valued using price evaluations provided by a pricing service approved by the Trustees. |
| ■ | For securities that are fair valued in accordance with procedures established by and under the general supervision of the Trustees, certain factors may be considered such as: the purchase price of the security, information obtained by contacting the issuer, analysis of the issuer's financial statements or other available documents, fundamental analytical data, the nature and duration of restrictions on disposition, the movement of the market in which the security is normally traded and public trading in similar securities of the issuer or comparable issuers. |
Annual Shareholder Report
If the Fund cannot obtain a price or price evaluation from a pricing service for an investment, the Fund may attempt to value the investment based upon the mean of bid and asked quotations or fair value the investment based on price evaluations, from one or more dealers. If any price, quotation, price evaluation or other pricing source is not readily available when the NAV is calculated, or if the Fund cannot obtain price evaluations from a pricing service or from more than one dealer for an investment within a reasonable period of time as set forth in the Fund's valuation policies and procedures, the Fund uses the fair value of the investment determined in accordance with the procedures described below. There can be no assurance that the Fund could purchase or sell an investment at the price used to calculate the Fund's NAV.
Fair Valuation Procedures
The Trustees have appointed a Valuation Committee comprised of officers of the Fund, Federated MDTA LLC (“Adviser”) and certain of the Adviser's affiliated companies to determine fair value of securities and in overseeing the calculation of the NAV. The Trustees have also authorized the use of pricing services recommended by the Valuation Committee to provide fair value evaluations of the current value of certain investments for purposes of calculating the NAV. The Valuation Committee employs various methods for reviewing third-party pricing-service evaluations including periodic reviews of third-party pricing services' policies, procedures and valuation methods (including key inputs and assumptions), transactional back-testing, comparisons of evaluations of different pricing services and review of price challenges by the Adviser based on recent market activity. In the event that market quotations and price evaluations are not available for an investment, the Valuation Committee determines the fair value of the investment in accordance with procedures adopted by the Trustees. The Trustees periodically review and approve the fair valuations made by the Valuation Committee and any changes made to the procedures.
Factors considered by pricing services in evaluating an investment include the yields or prices of investments of comparable quality, coupon, maturity, call rights and other potential prepayments, terms and type, reported transactions, indications as to values from dealers and general market conditions. Some pricing services provide a single price evaluation reflecting the bid-side of the market for an investment (a “bid” evaluation). Other pricing services offer both bid evaluations and price evaluations indicative of a price between the prices bid and asked for the investment (a “mid” evaluation). The Fund normally uses bid evaluations for U.S. Treasury and Agency securities, mortgage-backed securities and municipal securities. The Fund normally uses mid evaluations for other types of fixed-income securities and OTC derivative contracts. In the event that market quotations and price evaluations are not available for an investment, the fair value of the investment is determined in accordance with procedures adopted by the Trustees.
Repurchase Agreements
The Fund may invest in repurchase agreements for short-term liquidity purposes. It is the policy of the Fund to require the other party to a repurchase agreement to transfer to the Fund's custodian or sub-custodian eligible securities or cash with a market value (after transaction costs) at least equal to the repurchase price to be paid under the repurchase agreement. The eligible securities are transferred to accounts with the custodian or sub-custodian in which the Fund holds a “securities entitlement” and exercises “control” as those terms are defined in the Uniform Commercial Code. The Fund has established procedures for monitoring the market value of the transferred securities and requiring the transfer of
Annual Shareholder Report
additional eligible securities if necessary to equal at least the repurchase price. These procedures also allow the other party to require securities to be transferred from the account to the extent that their market value exceeds the repurchase price or in exchange for other eligible securities of equivalent market value.
The insolvency of the other party or other failure to repurchase the securities may delay the disposition of the underlying securities or cause the Fund to receive less than the full repurchase price. Under the terms of the repurchase agreement, any amounts received by the Fund in excess of the repurchase price and related transaction costs must be remitted to the other party.
The Fund may enter into repurchase agreements in which eligible securities are transferred into joint trading accounts maintained by the custodian or sub-custodian for investment companies and other clients advised by the Fund's Adviser and its affiliates. The Fund will participate on a pro rata basis with the other investment companies and clients in its share of the securities transferred under such repurchase agreements and in its share of proceeds from any repurchase or other disposition of such securities.
Investment Income, Gains and Losses, Expenses and Distributions
Investment transactions are accounted for on a trade-date basis. Realized gains and losses from investment transactions are recorded on an identified-cost basis. Interest income and expenses are accrued daily. Dividend income and distributions to shareholders are recorded on the ex-dividend date. Foreign dividends are recorded on the ex-dividend date or when the Fund is informed of the ex-dividend date. Distributions of net investment income are declared and paid annually. Non-cash dividends included in dividend income, if any, are recorded at fair value. Investment income, realized and unrealized gains and losses and certain fund-level expenses are allocated to each class based on relative average daily net assets, except that Class A Shares, Class C Shares, Class R Shares and Institutional Shares may bear distribution services fees, other service fees and transfer agent fees unique to those classes. For the year ended July 31, 2014, transfer agent fees for the Fund were as follows:
| | Transfer
Agent Fees
Incurred | Transfer
Agent Fees
Reimbursed |
| Class A Shares | $66,136 | $(30,506) |
| Class C Shares | $61,821 | $(17,794) |
| Class R Shares | $13,732 | $— |
| Institutional Shares | $38,481 | $— |
| TOTAL | $180,170 | $(48,300) |
Annual Shareholder Report
Other Service Fees
The Fund may pay other service fees up to 0.25% of the average daily net assets of the Fund's Class A Shares and Class C Shares to unaffiliated financial intermediaries or to Federated Shareholder Services Company (FSSC) for providing services to shareholders and maintaining shareholder accounts. Subject to the terms described in the Expense Limitation note, FSSC may voluntarily reimburse the Fund for other service fees. For the year ended July 31, 2014, other service fees for the Fund were as follows:
| | Other Service
Fees
Incurred |
| Class A Shares | $98,630 |
| Class C Shares | 79,079 |
| TOTAL | $177,709 |
Dividends are declared separately for each class. No class has preferential dividend rights; differences in per share dividend rates are generally due to differences in separate class expenses.
Premium and Discount Amortization
All premiums and discounts on fixed-income securities are amortized/accreted using the effective-interest-rate method.
Federal Taxes
It is the Fund's policy to comply with the Subchapter M provision of the Internal Revenue Code (the “Code”) and to distribute to shareholders each year substantially all of its income. Accordingly, no provision for federal income tax is necessary. As of and during the year ended July 31, 2014, the Fund did not have a liability for any uncertain tax positions. The Fund recognizes interest and penalties, if any, related to tax liabilities as income tax expense in the Statement of Operations. As of July 31, 2014, tax years 2011 through 2014 remain subject to examination by the Fund's major tax jurisdictions, which include the United States of America and the Commonwealth of Massachusetts.
The Fund may be subject to taxes imposed by governments of countries in which it invests. Such taxes are generally based on either income or gains earned or repatriated. The Fund accrues and applies such taxes to net investment income, net realized gains and net unrealized gains as income and/or gains are earned.
When-Issued and Delayed-Delivery Transactions
The Fund may engage in when-issued or delayed-delivery transactions. The Fund records when-issued securities on the trade date and maintains security positions such that sufficient liquid assets will be available to make payment for the securities purchased. Securities purchased on a when-issued or delayed-delivery basis are marked to market daily and begin earning interest on the settlement date. Losses may occur on these transactions due to changes in market conditions or the failure of counterparties to perform under the contract.
Other
The preparation of financial statements in conformity with GAAP requires management to make estimates and assumptions that affect the amounts of assets, liabilities, expenses and revenues reported in the financial statements. Actual results could differ from those estimated.
Annual Shareholder Report
3. SHARES OF BENEFICIAL INTEREST
The following tables summarize share activity:
| Year Ended July 31 | 2014 | 2013 |
| Class A Shares: | Shares | Amount | Shares | Amount |
| Shares sold | 642,335 | $12,308,397 | 231,485 | $3,568,491 |
| Shares issued to shareholders in payment of distributions declared | 9,944 | 190,534 | 7,539 | 102,227 |
| Shares redeemed | (444,825) | (8,470,347) | (570,687) | (8,308,541) |
| NET CHANGE RESULTING FROM CLASS A SHARE TRANSACTIONS | 207,454 | $4,028,584 | (331,663) | $(4,637,823) |
| Year Ended July 31 | 2014 | 2013 |
| Class C Shares: | Shares | Amount | Shares | Amount |
| Shares sold | 489,748 | $8,920,830 | 266,944 | $3,858,944 |
| Shares redeemed | (370,986) | (6,763,414) | (588,695) | (8,276,741) |
| NET CHANGE RESULTING FROM CLASS C SHARE TRANSACTIONS | 118,762 | $2,157,416 | (321,751) | $(4,417,797) |
| Year Ended July 31 | 2014 | 2013 |
| Class R Shares: | Shares | Amount | Shares | Amount |
| Shares sold | 135,839 | $2,583,244 | 92,593 | $1,367,905 |
| Shares issued to shareholders in payment of distributions declared | 384 | 7,299 | — | — |
| Shares redeemed | (105,525) | (1,968,844) | (68,716) | (1,004,027) |
| NET CHANGE RESULTING FROM CLASS R SHARE TRANSACTIONS | 30,698 | $621,699 | 23,877 | $363,878 |
| Year Ended July 31 | 2014 | 2013 |
| Institutional Shares: | Shares | Amount | Shares | Amount |
| Shares sold | 1,276,458 | $25,557,265 | 199,183 | $2,945,869 |
| Shares issued to shareholders in payment of distributions declared | 14,181 | 274,401 | 18,604 | 254,693 |
| Shares redeemed | (547,542) | (10,309,065) | (967,066) | (15,253,314) |
| NET CHANGE RESULTING FROM INSTITUTIONAL SHARE TRANSACTIONS | 743,097 | $15,522,601 | (749,279) | $(12,052,752) |
| NET CHANGE RESULTING FROM TOTAL FUND SHARE TRANSACTIONS | 1,100,011 | $22,330,300 | (1,378,816) | $(20,744,494) |
4. FEDERAL TAX INFORMATION
The tax character of distributions as reported on the Statement of Changes in Net Assets for the years ended July 31, 2014 and 2013 was as follows:
| | 2014 | 2013 |
| Ordinary income | $486,867 | $367,762 |
Annual Shareholder Report
As of July 31, 2014, the components of distributable earnings on a tax basis were as follows:
| Undistributed ordinary income | $334,745 |
| Net unrealized appreciation | $29,896,645 |
| Capital loss carryforwards | $(102,317,915) |
The difference between book-basis and tax-basis net unrealized appreciation/depreciation is attributable to differing treatments for the deferral of losses on wash sales.
At July 31, 2014, the cost of investments for federal tax purposes was $118,740,467. The net unrealized appreciation of investments for federal tax purposes was $29,896,645. This consists of net unrealized appreciation from investments for those securities having an excess of value over cost of $31,783,108 and net unrealized depreciation from investments for those securities having an excess of cost over value of $1,886,463.
At July 31, 2014, the Fund had a capital loss carryforward of $102,317,915 which will reduce the Fund's taxable income arising from future net realized gains on investments, if any, to the extent permitted by the Code, thereby reducing the amount of distributions to shareholders which would otherwise be necessary to relieve the Fund of any liability for federal income tax. Pursuant to the Code, a net capital loss incurred in taxable years beginning on or before December 22, 2010, is characterized as short-term and may be carried forward for a maximum of eight tax years (“Carryforward Limit”), whereas a net capital loss incurred in taxable years beginning after December 22, 2010, retains its character as either short-term or long-term, does not expire and is required to be utilized prior to the losses which have a Carryforward Limit.
The following schedule summarizes the Fund's capital loss carryforwards and expiration years:
| Expiration Year | Short-Term | Long-Term | Total |
| 2017 | $32,727,034 | NA | $32,727,034 |
| 2018 | $69,590,881 | NA | $69,590,881 |
As a result of the tax-free transfer of assets from Federated MDT Tax Aware/All Cap Core Fund, the use of certain capital loss carryforwards listed above may be limited.
The Fund used capital loss carryforwards of $9,157,025 to offset capital gains realized during the year ended July 31, 2014.
5. INVESTMENT ADVISER FEE AND OTHER TRANSACTIONS WITH AFFILIATES
Investment Adviser Fee
The advisory agreement between the Fund and the Adviser provides for an annual fee equal to 0.75% of the Fund's average daily net assets. Subject to the terms described in the Expense Limitation note, the Adviser may voluntarily choose to waive any portion of its fee and/or reimburse certain operating expenses of the Fund. For the year ended July 31, 2014, the Adviser voluntarily reimbursed $48,300 of transfer agent fees.
Annual Shareholder Report
Administrative Fee
Federated Administrative Services (FAS), under the Administrative Services Agreement, provides the Fund with administrative personnel and services. For purposes of determining the appropriate rate breakpoint, “Investment Complex” is defined as all of the Federated Funds subject to a fee under the Administrative Services Agreement. The fee paid to FAS is based on the average daily net assets of the Investment Complex as specified below, plus certain out-of-pocket expenses:
| Administrative Fee | Average Daily Net Assets
of the Investment Complex |
| 0.150% | on the first $5 billion |
| 0.125% | on the next $5 billion |
| 0.100% | on the next $10 billion |
| 0.075% | on assets in excess of $20 billion |
Subject to the terms described in the Expense Limitation note, FAS may voluntarily choose to waive any portion of its fee. For the year ended July 31, 2014, the annualized fee paid to FAS was 0.078% of average daily net assets of the Fund.
Distribution Services Fee
The Fund has adopted a Distribution Plan (the “Plan”) pursuant to Rule 12b-1 under the Act. Under the terms of the Plan, the Fund will compensate Federated Securities Corp. (FSC), the principal distributor, from the daily net assets of the Fund's Class A Shares, Class C Shares and Class R Shares to finance activities intended to result in the sale of these shares. The Plan provides that the Fund may incur distribution expenses at the following percentages of average daily net assets annually, to compensate FSC:
| Share Class Name | Percentage of Average Daily
Net Assets of Class |
| Class A Shares | 0.05% |
| Class C Shares | 0.75% |
| Class R Shares | 0.50% |
Subject to the terms described in the Expense Limitation note, FSC may voluntarily choose to waive any portion of its fee. For the year ended July 31, 2014, distribution services fees for the Fund were as follows:
| | Distribution
Services Fees
Incurred |
| Class C Shares | $237,236 |
| Class R Shares | 23,191 |
| TOTAL | $260,427 |
When FSC receives fees, it may pay some or all of them to financial intermediaries whose customers purchase shares. For the year ended July 31, 2014, FSC retained $25,313 of fees paid by the Fund. For the year ended July 31, 2014, the Fund's Class A Shares did not incur a distribution services fee; however, it may begin to incur this fee upon approval of the Trustees.
Annual Shareholder Report
Sales Charges
Front-end sales charges and contingent deferred sales charges (CDSC) do not represent expenses of the Fund. They are deducted from the proceeds of sales of Fund shares prior to investment or from redemption proceeds prior to remittance, as applicable. For the year ended July 31, 2014, FSC retained $9,432 in sales charges from the sale of Class A Shares. FSC also retained $1,563 of CDSC relating to redemptions of Class C Shares.
Other Service Fees
For the year ended July 31, 2014, FSSC received $3,572 of the other service fees disclosed in Note 2.
Expense Limitation
The Adviser and certain of its affiliates (which may include FSC, FAS and FSSC) on their own initiative have agreed to waive their respective fees and/or reimburse expenses so that the total annual fund operating expenses (as shown in the financial highlights, excluding expenses allocated from affiliated partnerships, extraordinary expenses and proxy-related expenses paid by the Fund, if any) paid by the Fund's Class A Shares, Class C Shares and Institutional Shares (after the voluntary waivers and reimbursements) will not exceed 1.35%, 2.15% and 1.10% (the “Fee Limit”), respectively, up to but not including the later of (the “Termination Date”): (a) October 1, 2015; or (b) the date of the Fund's next effective Prospectus. While the Adviser and its applicable affiliates currently do not anticipate terminating or increasing these arrangements prior to the Termination Date, these arrangements may only be terminated or the Fee Limit increased prior to the Termination Date with the agreement of the Trustees.
General
Certain Officers and Trustees of the Trust are Officers and Directors or Trustees of certain of the above companies. To efficiently facilitate payment, Directors'/Trustees' fees and certain expenses related to conducting meetings of the Directors/Trustees and other miscellaneous expenses are paid by an affiliate of the Adviser which in due course are reimbursed by the Fund. Such expenses may be included in Accrued and Miscellaneous Expenses on the Statement of Assets and Liabilities and Statement of Operations, respectively.
Transactions Involving Affiliated Holdings
Affiliated holdings are investment companies which are managed by the Adviser or an affiliate of the Adviser. The Adviser has agreed to reimburse the Fund for certain investment adviser fees as a result of transactions in other affiliated investment companies. For the year ended July 31, 2014, the Adviser reimbursed $3,059. Transactions involving the affiliated holding during the year ended July 31, 2014, were as follows:
| | Federated
Prime Value
Obligations Fund,
Institutional Shares |
| Balance of Shares Held 7/31/2013 | 2,182,008 |
| Purchases/Additions | 42,417,265 |
| Sales/Reductions | (40,999,489) |
| Balance of Shares Held 7/31/2014 | 3,599,784 |
| Value | $3,599,784 |
Annual Shareholder Report
| | Federated
Prime Value
Obligations Fund,
Institutional Shares |
| Dividend Income | $1,690 |
6. Investment TRANSACTIONS
Purchases and sales of investments, excluding long-term U.S. government securities and short-term obligations, for the year ended July 31, 2014, were as follows:
| Purchases | $58,464,367 |
| Sales | $36,936,348 |
7. LINE OF CREDIT
The Fund participates in a $100,000,000 unsecured, uncommitted revolving line of credit (LOC) agreement with PNC Bank. The LOC was made available for extraordinary or emergency purposes, primarily for financing redemption payments. Borrowings are charged interest at a rate offered to the Fund by PNC Bank at the time of the borrowing. As of July 31, 2014, there were no outstanding loans. During the year ended July 31, 2014, the Fund did not utilize the LOC.
8. INTERFUND LENDING
Pursuant to an Exemptive Order issued by the Securities and Exchange Commission, the Fund, along with other funds advised by subsidiaries of Federated Investors, Inc., may participate in an interfund lending program. This program provides an alternative credit facility allowing the Fund to borrow from other participating affiliated funds. As of July 31, 2014, there were no outstanding loans. During the year ended July 31, 2014, the program was not utilized.
9. FEDERAL TAX INFORMATION (UNAUDITED)
For the fiscal year ended July 31, 2014, 100% of total income distributions made by the Fund are qualifying dividends which may be subject to a maximum tax rate of 15%, as provided for by the Jobs and Growth Tax Relief Act of 2003. Complete information is reported in conjunction with the reporting of your distributions on Form 1099-DIV.
Of the ordinary income distributions made by the Fund during the year ended July 31, 2014, 100% qualify for the dividend received deduction available to corporate shareholders.
Annual Shareholder Report
Report of Independent Registered Public Accounting Firm
TO THE BOARD OF trustees OF Federated MDt series AND SHAREHOLDERS OF federated mdt all cap core fund:
We have audited the accompanying statement of assets and liabilities of Federated MDT All Cap Core Fund (the “Fund”) (one of the portfolios constituting Federated MDT Series), including the portfolio of investments, as of July 31, 2014, and the related statement of operations for the year then ended, the statement of changes in net assets for each of the two years in the period then ended, and the financial highlights for each of the five years in the period then ended. These financial statements and financial highlights are the responsibility of the Fund's management. Our responsibility is to express an opinion on these financial statements and financial highlights based on our audits.
We conducted our audits in accordance with standards of the Public Company Accounting Oversight Board (United States). Those standards require that we plan and perform the audit to obtain reasonable assurance about whether the financial statements and financial highlights are free of material misstatement. We were not engaged to perform an audit of the Fund's internal control over financial reporting. Our audits included consideration of internal control over financial reporting as a basis for designing audit procedures that are appropriate in the circumstances, but not for the purpose of expressing an opinion on the effectiveness of the Fund's internal control over financial reporting. Accordingly, we express no such opinion. An audit also includes examining, on a test basis, evidence supporting the amounts and disclosures in the financial statements and financial highlights, assessing the accounting principles used and significant estimates made by management, and evaluating the overall financial statement presentation. Our procedures included confirmation of securities owned as of July 31, 2014 by correspondence with the custodian and others, or by other appropriate auditing procedures where replies from others were not received. We believe that our audits provide a reasonable basis for our opinion.
In our opinion, the financial statements and financial highlights referred to above present fairly, in all material respects, the financial position of Federated MDT All Cap Core Fund, a portfolio of Federated MDT Series, at July 31, 2014, the results of its operations for the year then ended, the changes in its net assets for each of the two years in the period then ended, and the financial highlights for each of the five years in the period then ended, in conformity with U.S. generally accepted accounting principles.
Boston, Massachusetts
September 23, 2014
Annual Shareholder Report
Shareholder Expense Example (unaudited)
As a shareholder of the Fund, you incur two types of costs: (1) transaction costs, including sales charges (loads) on purchase or redemption payments; and (2) ongoing costs, including management fees and to the extent applicable, distribution (12b-1) fees and/or other service fees and other Fund expenses. This Example is intended to help you to understand your ongoing costs (in dollars) of investing in the Fund and to compare these costs with the ongoing costs of investing in other mutual funds. It is based on an investment of $1,000 invested at the beginning of the period and held for the entire period from February 1, 2014 to July 31, 2014.
ACTUAL EXPENSES
The first section of the table below provides information about actual account values and actual expenses. You may use the information in this section, together with the amount you invested, to estimate the expenses that you incurred over the period. Simply divide your account value by $1,000 (for example, an $8,600 account value divided by $1,000 = 8.6), then multiply the result by the number in the first section under the heading entitled “Expenses Paid During Period” to estimate the expenses attributable to your investment during this period.
HYPOTHETICAL EXAMPLE FOR COMPARISON PURPOSES
The second section of the table below provides information about hypothetical account values and hypothetical expenses based on the Fund's actual expense ratio and an assumed rate of return of 5% per year before expenses, which is not the Fund's actual return. Thus, you should not use the hypothetical account values and expenses to estimate the actual ending account balance or your expenses for the period. Rather, these figures are required to be provided to enable you to compare the ongoing costs of investing in the Fund with other funds. To do so, compare this 5% hypothetical example with the 5% hypothetical examples that appear in the shareholder reports of the other funds.
Annual Shareholder Report
Please note that the expenses shown in the table are meant to highlight your ongoing costs only and do not reflect any transaction costs, such as sales charges (loads) on purchase or redemption payments. Therefore, the second section of the table is useful in comparing ongoing costs only, and will not help you determine the relative total costs of owning different funds. In addition, if these transaction costs were included, your costs would have been higher.
| | Beginning
Account Value
2/1/2014 | Ending
Account Value
7/31/2014 | Expenses Paid
During Period1 |
| Actual: | | | |
| Class A Shares | $1,000 | $1,099.40 | $7.03 |
| Class C Shares | $1,000 | $1,095.10 | $11.17 |
| Class R Shares | $1,000 | $1,097.00 | $9.46 |
| Institutional Shares | $1,000 | $1,101.00 | $5.73 |
Hypothetical (assuming a 5% return
before expenses): | | | |
| Class A Shares | $1,000 | $1,018.10 | $6.76 |
| Class C Shares | $1,000 | $1,014.13 | $10.74 |
| Class R Shares | $1,000 | $1,015.77 | $9.10 |
| Institutional Shares | $1,000 | $1,019.34 | $5.51 |
| 1 | Expenses are equal to the Fund's annualized net expense ratios, multiplied by the average account value over the period, multiplied by 181/365 (to reflect the one-half-year period). The annualized net expense ratios are as follows: |
| | |
| Class A Shares | 1.35% |
| Class C Shares | 2.15% |
| Class R Shares | 1.82% |
| Institutional Shares | 1.10% |
Annual Shareholder Report
Board of Trustees and Trust Officers
The Board of Trustees is responsible for managing the Trust's business affairs and for exercising all the Trust's powers except those reserved for the shareholders. The following tables give information about each Trustee and the senior officers of the Fund. Where required, the tables separately list Trustees who are “interested persons” of the Fund (i.e., “Interested” Trustees) and those who are not (i.e., “Independent” Trustees). Unless otherwise noted, the address of each person listed is Federated Investors Tower, 1001 Liberty Avenue, Pittsburgh, PA 15222. The address of all Independent Trustees listed is 4000 Ericsson Drive, Warrendale, PA 15086-7561; Attention: Mutual Fund Board. As of December 31, 2013, the Trust comprised five portfolio(s), and the Federated Fund Family consisted of 42 investment companies (comprising 135 portfolios). Unless otherwise noted, each Officer is elected annually. Unless otherwise noted, each Trustee oversees all portfolios in the Federated Fund Family and serves for an indefinite term. The Fund's Statement of Additional Information includes additional information about Trust Trustees and is available, without charge and upon request, by calling 1-800-341-7400.
Interested TRUSTEES Background
Name
Birth Date
Positions Held with Trust
Date Service Began | Principal Occupation(s) for Past Five Years,
Other Directorships Held and Previous Position(s) |
John F. Donahue*
Birth Date: July 28, 1924
Trustee
Began serving: June 2006 | Principal Occupations: Director or Trustee of the Federated Fund Family; Chairman and Director, Federated Investors, Inc.; Chairman of the Federated Fund Family's Executive Committee.
Previous Positions: Chairman of the Federated Fund Family; Trustee, Federated Investment Management Company; Chairman and Director, Federated Investment Counseling. |
J. Christopher Donahue*
Birth Date: April 11, 1949
President and Trustee
Began serving: May 2006 | Principal Occupations: Principal Executive Officer and President of certain of the Funds in the Federated Fund Family; Director or Trustee of the Funds in the Federated Fund Family; President, Chief Executive Officer and Director, Federated Investors, Inc.; Chairman and Trustee, Federated Investment Management Company; Trustee, Federated Investment Counseling; Chairman and Director, Federated Global Investment Management Corp.; Chairman, Federated Equity Management Company of Pennsylvania and Passport Research, Ltd. (investment advisory subsidiary of Federated); Trustee, Federated Shareholder Services Company; Director, Federated Services Company.
Previous Positions: President, Federated Investment Counseling; President and Chief Executive Officer, Federated Investment Management Company, Federated Global Investment Management Corp. and Passport Research, Ltd. |
| * | Family relationships and reasons for “interested” status: John F. Donahue is the father of J. Christopher Donahue; both are “interested” due to their beneficial ownership of shares of Federated Investors, Inc. and the positions they hold with Federated and its subsidiaries. |
Annual Shareholder Report
INDEPENDENT TRUSTEES Background
Name
Birth Date
Positions Held with Trust
Date Service Began | Principal Occupation(s) for Past Five Years,
Other Directorships Held, Previous Position(s) and Qualifications |
John T. Collins
Birth Date: January 24, 1947
Trustee
Began serving: October 2013 | Principal Occupations: Director or Trustee of the Federated Fund Family; Chairman and CEO, The Collins Group, Inc. (a private equity firm).
Other Directorships Held: Chairman Emeriti, Bentley University; Director, Sterling Suffolk Downs, Inc.; Former Director, National Association of Printers and Lithographers.
Previous Positions: Director and Audit Committee Member, Bank of America Corp.
Qualifications: Business management and director experience. |
Maureen Lally-Green
Birth Date: July 5, 1949
Trustee
Began serving: August 2009 | Principal Occupations: Director or Trustee of the Federated Fund Family; Associate General Secretary and Director, Office for Church Relations, Diocese of Pittsburgh; Adjunct Professor of Law, Duquesne University School of Law; Superior Court of Pennsylvania (service began 1998 and ended July 2009).
Other Directorships Held: Director, Consol Energy (service started June 2013); Director, Auberle (service ended December 2013); Member, Pennsylvania State Board of Education; Director, Saint Vincent College; Director, Ireland Institute of Pittsburgh (service ended December 2013); Director and Chair, UPMC Mercy Hospital; Regent, St. Vincent Seminary; Director, Epilepsy Foundation of Western and Central Pennsylvania; Director, Saint Thomas More Society (service ended December 2013); Director, Our Campaign for the Church Alive!, Inc.; Director, Pennsylvania Bar Institute (2013-present); Director, Cardinal Wuerl North Catholic High School (2013-present).
Previous Position: Professor of Law, Duquesne University School of Law, Pittsburgh (1983-1998).
Qualifications: Legal and director experience. |
Peter E. Madden
Birth Date: March 16, 1942
Trustee
Began serving: June 2006 | Principal Occupation: Director or Trustee, and Chairman of the Board of Directors or Trustees, of the Federated Fund Family.
Previous Positions: Representative, Commonwealth of Massachusetts General Court; President, Chief Operating Officer and Director, State Street Bank and Trust Company and State Street Corporation (retired); Director, VISA USA and VISA International; Chairman and Director, Massachusetts Bankers Association; Director, Depository Trust Corporation; Director, The Boston Stock Exchange.
Qualifications: Business management, mutual fund services and director experience. |
Annual Shareholder Report
Name
Birth Date
Positions Held with Trust
Date Service Began | Principal Occupation(s) for Past Five Years,
Other Directorships Held, Previous Position(s) and Qualifications |
Charles F. Mansfield, Jr.
Birth Date: April 10, 1945
Trustee
Began serving: June 2006 | Principal Occupations: Director or Trustee of the Federated Fund Family; Management Consultant.
Previous Positions: Chief Executive Officer, PBTC International Bank; Partner, Arthur Young & Company (now Ernst & Young LLP); Chief Financial Officer of Retail Banking Sector, Chase Manhattan Bank; Senior Vice President, HSBC Bank USA (formerly Marine Midland Bank); Vice President, Citibank; Assistant Professor of Banking and Finance, Frank G. Zarb School of Business, Hofstra University; Executive Vice President, DVC Group, Inc. (marketing, communications and technology).
Qualifications: Banking, business management, education and director experience. |
Thomas M. O'Neill
Birth Date: June 14, 1951
Trustee
Began serving: October 2006 | Principal Occupations: Director or Trustee, Vice Chairman of the Audit Committee of the Federated Fund Family; Sole Proprietor, Navigator Management Company (investment and strategic consulting).
Other Directorships Held: Board of Overseers, Children's Hospital of Boston; Visiting Committee on Athletics, Harvard College; Board of Directors, Medicines for Humanity; Board of Directors, The Golisano Children's Museum of Naples, Florida.
Previous Positions: Chief Executive Officer and President, Managing Director and Chief Investment Officer, Fleet Investment Advisors; President and Chief Executive Officer, Aeltus Investment Management, Inc.; General Partner, Hellman, Jordan Management Co., Boston, MA; Chief Investment Officer, The Putnam Companies, Boston, MA; Credit Analyst and Lending Officer, Fleet Bank; Director and Consultant, EZE Castle Software (investment order management software); Director, Midway Pacific (lumber).
Qualifications: Business management, mutual fund, director and investment experience. |
P. Jerome Richey
Birth Date: February 23, 1949
Trustee
Began serving: October 2013 | Principal Occupations: Director or Trustee of the Federated Fund Family; General Counsel, University of Pittsburgh.
Other Directorships Held: Board Chairman, Epilepsy Foundation of Western Pennsylvania; Board Member, World Affairs Council of Pittsburgh.
Previous Positions: Chief Legal Officer and Executive Vice President, CONSOL Energy Inc.; Shareholder, Buchanan Ingersoll & Rooney PC (a law firm).
Qualifications: Business management, legal and director experience. |
Annual Shareholder Report
Name
Birth Date
Positions Held with Trust
Date Service Began | Principal Occupation(s) for Past Five Years,
Other Directorships Held, Previous Position(s) and Qualifications |
John S. Walsh
Birth Date: November 28, 1957
Trustee
Began serving: June 2006 | Principal Occupations: Director or Trustee, Chairman of the Audit Committee of the Federated Fund Family; President and Director, Heat Wagon, Inc. (manufacturer of construction temporary heaters); President and Director, Manufacturers Products, Inc. (distributor of portable construction heaters); President, Portable Heater Parts, a division of Manufacturers Products, Inc.
Previous Position: Vice President, Walsh & Kelly, Inc.
Qualifications: Business management and director experience. |
OFFICERS
Name
Birth Date
Address
Positions Held with Trust
Date Service Began | Principal Occupation(s) for Past Five Years
and Previous Position(s) |
John W. McGonigle
Birth Date: October 26, 1938
Secretary
Officer since: May 2006 | Principal Occupations: Executive Vice President and Secretary of the Federated Fund Family; Vice Chairman, Executive Vice President, Secretary and Director, Federated Investors, Inc.
Previous Positions: Trustee, Federated Investment Management Company and Federated Investment Counseling; Director, Federated Global Investment Management Corp., Federated Services Company and Federated Securities Corp. |
Lori A. Hensler
Birth Date: January 6, 1967
TREASURER
Officer since: April 2013 | Principal Occupations: Principal Financial Officer and Treasurer of the Federated Fund Family; Senior Vice President, Federated Administrative Services; Financial and Operations Principal for Federated Securities Corp. and Edgewood Services, Inc.; and Assistant Treasurer, Federated Investors Trust Company. Ms. Hensler has received the Certified Public Accountant designation.
Previous Positions: Controller of Federated Investors, Inc.; Senior Vice President and Assistant Treasurer, Federated Investors Management Company; Treasurer, Federated Investors Trust Company; Assistant Treasurer, Federated Administrative Services, Federated Administrative Services, Inc., Federated Securities Corp., Edgewood Services, Inc., Federated Advisory Services Company, Federated Equity Management Company of Pennsylvania, Federated Global Investment Management Corp., Federated Investment Counseling, Federated Investment Management Company, Passport Research, Ltd., and Federated MDTA, LLC; Financial and Operations Principal for Federated Securities Corp., Edgewood Services, Inc. and Southpointe Distribution Services, Inc. |
Annual Shareholder Report
Name
Birth Date
Address
Positions Held with Trust
Date Service Began | Principal Occupation(s) for Past Five Years
and Previous Position(s) |
Peter J. Germain
Birth Date: September 3, 1959
CHIEF LEGAL OFFICER
Officer since: June 2006 | Principal Occupations: Mr. Germain is Chief Legal Officer of the Federated Fund Family. He is General Counsel and Vice President, Federated Investors, Inc.; President, Federated Administrative Services and Federated Administrative Services, Inc.; Vice President, Federated Securities Corp.; Secretary, Federated Private Asset Management, Inc.; and Secretary, Retirement Plan Service Company of America. Mr. Germain joined Federated in 1984 and is a member of the Pennsylvania Bar Association.
Previous Positions: Deputy General Counsel, Special Counsel, Managing Director of Mutual Fund Services, Federated Investors, Inc.; Senior Vice President, Federated Services Company; and Senior Corporate Counsel, Federated Investors, Inc. |
Stephen F. Auth
Birth Date: September 3, 1956
450 Lexington Avenue
Suite 3700
New York, NY 10017-3943
CHIEF INVESTMENT OFFICER
Officer since: June 2012 | Principal Occupations: Stephen F. Auth is Chief Investment Officer of various Funds in the Federated Fund Family; Executive Vice President, Federated Investment Counseling, Federated Global Investment Management Corp. and Federated Equity Management Company of Pennsylvania.
Previous Positions: Executive Vice President, Federated Investment Management Company and Passport Research, Ltd. (investment advisory subsidiary of Federated); Senior Vice President, Global Portfolio Management Services Division; Senior Vice President, Federated Investment Management Company and Passport Research, Ltd.; Senior Managing Director and Portfolio Manager, Prudential Investments. |
Brian P. Bouda
Birth Date: February 28, 1947
CHIEF COMPLIANCE OFFICER AND SENIOR VICE PRESIDENT
Officer since: June 2006 | Principal Occupations: Senior Vice President and Chief Compliance Officer of the Federated Fund Family; Vice President and Chief Compliance Officer of Federated Investors, Inc. and Chief Compliance Officer of certain of its subsidiaries. Mr. Bouda joined Federated in 1999 and is a member of the American Bar Association and the State Bar Association of Wisconsin.
Previous Positions: Served in Senior Management positions with a large regional banking organization. |
Daniel Mahr
Birth Date: April 9, 1981
125 High Street
Oliver Tower
21st Floor
Boston, MA 02110-2704
Vice President
Officer since: June 2012
Portfolio Manager since:
August 2008 | Principal Occupations: Daniel Mahr has been the Fund's Portfolio Manager since August 2008. Mr. Mahr joined the MDT Advisers Investment Team in 2002. As Managing Director, Research, he is responsible for leading the Investment Team as it relates to the ongoing design, development and implementation of the Optimum Q Process. He is Vice President of the Trust with respect to the Fund. Mr. Mahr received his A.B., Computer Science from Harvard College and his S.M., Computer Science from Harvard University. |
Annual Shareholder Report
Evaluation and Approval of Advisory Contract–May 2014
Federated MDT All Cap Core Fund (the “Fund”)
Following a review and recommendation of approval by the Fund's independent trustees, the Fund's Board reviewed and approved at its May 2014 meetings the Fund's investment advisory contract for an additional one-year term. The Board's decision regarding the contract reflects the exercise of its business judgment on whether to continue the existing arrangements.
In this connection, the Federated Funds' Board had previously appointed a Senior Officer, whose duties include specified responsibilities relating to the process by which advisory fees are to be charged to a Federated fund. The Senior Officer has the authority to retain consultants, experts, or staff as may be reasonably necessary to assist in the performance of his duties, reports directly to the Board, and may be terminated only with the approval of a majority of the independent members of the Board. The Senior Officer prepared and furnished to the Board an independent, written evaluation that covered topics discussed below (the “Evaluation”). The Board considered that Evaluation, along with other information, in deciding to approve the advisory contract.
The Board is also familiar with and considered judicial decisions concerning allegedly excessive investment advisory fees, which have indicated that the following factors may be relevant to an Adviser's fiduciary duty with respect to its receipt of compensation from a fund: the nature and quality of the services provided by the Adviser to a fund and its shareholders, including the performance and expenses of the fund and of comparable funds; the Adviser's cost of providing the services, including the profitability to the Adviser of providing advisory services to a fund; the extent to which the Adviser may realize “economies of scale” as a fund grows larger and, if such economies exist, whether they have been shared with a fund and its shareholders or the family of funds; any “fall-out financial benefits” that accrue to the Adviser because of its relationship with a fund (including research services received from brokers that execute fund trades and any fees paid to affiliates of the Adviser for services rendered to a fund); comparative fee structures, including a comparison of fees paid to the Adviser with those paid by similar funds; and the extent of care, conscientiousness and independence with which the Board members perform their duties and their expertise, including whether they are fully informed about all facts the Board deems relevant to its consideration of the Adviser's services and fees. The Board noted that SEC disclosure requirements regarding the basis for the Board's approval of the Fund's advisory contract generally track the factors listed above. Consistent with these judicial decisions and SEC disclosure requirements, the Board also considered management fees charged to
Annual Shareholder Report
institutional and other clients of the Adviser for what might be viewed as like services. The Board was aware of these factors and was guided by them in its review of the Fund's advisory contract to the extent it considered them to be appropriate and relevant, as discussed further below.
The Board considered and weighed these circumstances in light of its substantial accumulated experience in governing the Fund and working with Federated on matters relating to the Federated funds, and was assisted in its deliberations by independent legal counsel. Throughout the year, and in connection with its May meetings, the Board requested and received substantial and detailed information about the Fund and the Federated organization that was in addition to the extensive materials that comprise and accompany the Senior Officer's Evaluation. Federated provided much of this information at each regular meeting of the Board, and furnished additional substantial information in connection with the May meeting at which the Board's formal review of the advisory contract occurred. At this May meeting, senior management of the Adviser also met with the independent trustees and their counsel to discuss the materials presented and any other matters thought relevant by the Adviser or the trustees. Between regularly scheduled meetings, the Board also received information on particular matters as the need arose. Thus, the Board's consideration of the advisory contract included review of the Senior Officer's Evaluation, accompanying data and additional information covering such matters as: the Adviser's investment philosophy, revenue, profitability, personnel and processes; investment and operating strategies; the Fund's short- and long-term performance (in absolute terms, both on a gross basis and net of expenses, as well as in relationship to its particular investment program and certain competitor or “peer group” funds and/or other benchmarks, as appropriate), and comments on the reasons for performance; the Fund's investment objectives; the Fund's expenses (including the advisory fee itself and the overall expense structure of the Fund, both in absolute terms and relative to similar and/or competing funds, with due regard for contractual or voluntary expense limitations); the use and allocation of brokerage commissions derived from trading the Fund's portfolio securities (if any); and the nature, quality and extent of the advisory and other services provided to the Fund by the Adviser and its affiliates. The Board also considered the preferences and expectations of Fund shareholders; the entrepreneurial risk assumed by the Adviser in sponsoring the funds; the continuing state of competition in the mutual fund industry and market practices; the range of comparable fees for similar funds in the mutual fund industry; the Fund's relationship to the Federated family of funds which include a comprehensive array of funds with different investment objectives, policies and strategies which are available for exchange without the incurrence of additional sales charges; compliance and audit reports concerning the Federated funds and the Federated companies that service them (including communications from regulatory agencies), as well as Federated's responses to any issues raised therein; and relevant developments in
Annual Shareholder Report
the mutual fund industry and how the Federated funds and/or Federated are responding to them. The Board's evaluation process is evolutionary. The criteria considered and the emphasis placed on relevant criteria change in recognition of changing circumstances in the mutual fund marketplace.
While mindful that courts have cautioned against giving such comparisons too much weight, the Board has found the use of comparisons of the Fund's fees and expenses to other mutual funds with comparable investment programs to be relevant. In this regard, the Board was presented with, and considered, information regarding the contractual advisory fee rates, net advisory fee rates and total expense ratios relative to a fund's peers. The Board focused on comparisons with other similar mutual funds more heavily than non-mutual fund products or services because it is believed that they are more relevant. For example, other mutual funds are the products most like the Fund, they are readily available to Fund shareholders as alternative investment vehicles, and they are the type of investment vehicle in fact chosen and maintained by the Fund's investors. The range of their fees and expenses therefore appears to be a relevant indicator of what consumers have found to be reasonable in the precise marketplace in which the Fund competes.
The Board reviewed the contractual advisory fee rate, net advisory fee rate where partially waived and other expenses of the Fund and noted the position of the Fund's fee rates relative to its peers. In this regard, the Board noted that the contractual advisory fee rate was above the median of the relevant peer group, but the Board noted the applicable waivers and reimbursements and that the overall expense structure of the Fund remained competitive. In this regard, the Board had been previously advised that, while comparisons to fund peer groups are relevant in judging the reasonableness of advisory fees, the Fund's quantitative focus makes fee and expense comparisons particularly difficult. Although the Fund's advisory fee was above the median of the peer range, the peer group of funds varied widely in their complexity, and the management of the Fund is among the more complex relative to its peers. The Board will continue to monitor advisory fees and other expenses borne by the Fund.
By contrast, the Senior Officer has reviewed Federated's fees for providing advisory services to products outside the Federated family of funds (e.g., institutional and separate accounts and sub-adviser services). He concluded that mutual funds and institutional accounts are inherently different products. Those differences include, but are not limited to, different types of targeted investors; being subject to different laws and regulations; different legal structures; different average account sizes and portfolio management techniques made necessary by different cash flows and different associated costs; and the time spent by portfolio managers and their teams, funds financial services, legal, compliance and risk management in reviewing securities pricing, addressing
Annual Shareholder Report
different administrative responsibilities, addressing different degrees of risk associated with management and a variety of different costs. The Senior Officer did not consider these fee schedules to be determinative in judging the appropriateness of mutual fund advisory fees.
The Fund's ability to deliver competitive performance when compared to its peer group was also deemed to be relevant by the Board as a useful indicator of how the Adviser is executing the Fund's investment program, which in turn was one of the Board's considerations in reaching a conclusion that the nature, extent, and quality of the Adviser's investment management services were such as to warrant continuation of the advisory contract.
The Senior Officer reviewed information compiled by Federated, using data supplied by independent fund ranking organizations, regarding the performance of, and fees charged by, other mutual funds, noting his view that comparisons to fund peer groups may be helpful, though not conclusive, in judging the reasonableness of proposed fees. The Board considered, in evaluating such comparisons, that in some cases individual funds may exhibit significant and unique differences in their objectives and management techniques when compared to other funds within an industry peer group, and that the Senior Officer had specifically noted that the Fund's quantitative investment program is of such a type.
For the periods covered by the Evaluation, the Fund's performance for the both the one-year and three-year periods was above the median of the relevant peer group, and the Fund's performance was at the median of the relevant peer group for the five-year period. In addition, the Board was informed by the Adviser that, for the same periods, the Fund outperformed its benchmark index for the one-year period, outperformed its benchmark index for the three-year period and underperformed its benchmark index for the five-year period. The Board discussed the Fund's performance with the Adviser and recognized the efforts being undertaken by the Adviser. The Board will continue to monitor these efforts and the performance of the Fund in the context of the other factors considered relevant by the Board.
The Board also received financial information about Federated, including information regarding the compensation and benefits Federated derived from its relationships with the Federated funds. This information covered not only the fees under the advisory contracts, but also fees received by Federated's subsidiaries for providing other services to the Federated funds under separate contracts (e.g., for serving as the Federated funds' administrator). The information also detailed any indirect benefit Federated may derive from its receipt of research services from brokers who execute Federated fund trades. In addition, the Board considered the fact that, in order for a fund to be competitive in the marketplace, Federated and its affiliates frequently waived fees and/or reimbursed expenses and have disclosed to fund investors and/or indicated to the Board their intention to do so in the future, where appropriate. Moreover, the Board receives regular reporting as to the institution, adjustment
Annual Shareholder Report
or elimination of these voluntary waivers. In addition, following discussions regarding the Senior Officer's May 2013 recommendations, Federated made meaningful reductions to gross advisory fees for several funds. At the Board meeting in May 2014, the Senior Officer proposed, and the Board approved, reductions in the contractual advisory fees of certain other funds.
Federated furnished information, requested by the Senior Officer, that reported revenues on a fund-by-fund basis and made estimates of the allocation of expenses on a fund-by-fund basis, using allocation methodologies specified by the Senior Officer. The Senior Officer noted that, while these cost allocation reports apply consistent allocation processes, the inherent difficulties in allocating costs continues to cause the Senior Officer to question the precision of the process and to conclude that such reports may be unreliable, since a single change in an allocation estimate may dramatically alter the resulting estimate of cost and/or profitability of a fund and may produce unintended consequences. The allocation information, including the Senior Officer's view that fund-by-fund estimations may be unreliable, was considered in the analysis by the Board.
The Board and the Senior Officer also reviewed information compiled by Federated comparing profitability information for Federated to other publicly held fund management companies. In this regard, the Senior Officer concluded that Federated's profit margins did not appear to be excessive.
The Senior Officer's Evaluation also discussed the notion of possible realization of “economies of scale” as a fund grows larger. The Board considered in this regard that the Adviser has made significant and long-term investments in areas that support all of the Federated family of funds, such as personnel and processes for the portfolio management, shareholder services, compliance, internal audit, and risk management functions; and systems technology; and that the benefits of these efforts (as well as any economies, should they exist) were likely to be enjoyed by the fund family as a whole. Finally, the Board also noted the absence of any applicable regulatory or industry guidelines on this subject, which (as discussed in the Senior Officer's Evaluation) is compounded by the lack of any common industry practice or general pattern with respect to structuring fund advisory fees with “breakpoints” that serve to reduce the fee as the fund attains a certain size.
The Senior Officer noted that, subject to the comments and recommendations made within his Evaluation, his observations and the information accompanying the Evaluation supported a finding by the Board that the management fees for each of the funds were reasonable. Under these circumstances, no changes were recommended to, and no objection was raised to, the continuation of the Fund's advisory contract.
In its decision to continue an existing investment advisory contract, the Board was mindful of the potential disruptions of the Fund's operations and various risks, uncertainties and other effects that could occur as a result of a decision to terminate or not renew an advisory contract. In particular, the Board recognized that many shareholders have invested in the Fund on the strength of the
Annual Shareholder Report
Adviser's industry standing and reputation and with the expectation that the Adviser will have a continuing role in providing advisory services to the Fund. Thus, the Board's approval of the advisory contract reflected the fact that it is the shareholders who have effectively selected the Adviser by virtue of having invested in the Fund. The Board concluded that, in light of the factors discussed above, including the nature, quality and scope of the services provided to the Fund by the Adviser and its affiliates, continuation of the advisory contract was appropriate.
The Board based its decision to approve the advisory contract on the totality of the circumstances and relevant factors and with a view to past and future long-term considerations. Not all of the factors and considerations identified above were necessarily relevant to the Fund, nor did the Board consider any one of them to be determinative. With respect to the factors that were relevant, the Board's decision to approve the contract reflects its determination that Federated's performance and actions provided a satisfactory basis to support the decision to continue the existing arrangements.
Annual Shareholder Report
Voting Proxies on Fund Portfolio Securities
A description of the policies and procedures that the Fund uses to determine how to vote proxies, if any, relating to securities held in the Fund's portfolio is available, without charge and upon request, by calling 1-800-341-7400. A report on “Form N-PX” of how the Fund voted any such proxies during the most recent 12-month period ended June 30 is available via the Proxy Voting Record (Form N-PX) link associated with the Fund and share class name at www.FederatedInvestors.com/FundInformation. Form N-PX filings are also available at the SEC's website at www.sec.gov.
Quarterly Portfolio Schedule
The Fund files with the SEC a complete schedule of its portfolio holdings, as of the close of the first and third quarters of its fiscal year, on “Form N-Q.” These filings are available on the SEC's website at www.sec.gov and may be reviewed and copied at the SEC's Public Reference Room in Washington, DC. (Call 1-800-SEC-0330 for information on the operation of the Public Reference Room.) You may also access this information via the link to the Fund and share class name at www.FederatedInvestors.com/FundInformation.
Annual Shareholder Report
Mutual funds are not bank deposits or obligations, are not guaranteed by any bank and are not insured or guaranteed by the U.S. government, the Federal Deposit Insurance Corporation, the Federal Reserve Board or any other government agency. Investment in mutual funds involves investment risk, including the possible loss of principal.
This Report is authorized for distribution to prospective investors only when preceded or accompanied by the Fund's Prospectus, which contains facts concerning its objective and policies, management fees, expenses and other information.
Federated MDT All Cap Core Fund
Federated Investors Funds
4000 Ericsson Drive
Warrendale, PA 15086-7561
Contact us at FederatedInvestors.com
or call 1-800-341-7400.
Federated Securities Corp., Distributor
CUSIP 31421R106
CUSIP 31421R205
CUSIP 31421R718
CUSIP 31421R304
37309 (9/14)
Federated is a registered trademark of Federated Investors, Inc.
2014 ©Federated Investors, Inc.
Annual Shareholder Report
July 31, 2014
| Share Class | Ticker |
| A | QABGX |
| C | QCBGX |
| R | QKBGX |
| Institutional | QIBGX |
Federated MDT Balanced Fund
Fund Established 2002
A Portfolio of Federated MDT Series
Dear Valued Shareholder,
I am pleased to present the Annual Shareholder Report for your fund covering the period from August 1, 2013 through July 31, 2014. This report includes Management's Discussion of Fund Performance, a complete listing of your fund's holdings, performance information and financial statements along with other important fund information.
In addition, our website, FederatedInvestors.com, offers easy access to Federated resources that include timely fund updates, economic and market insights from our investment strategists, and financial planning tools. We invite you to register to take full advantage of its capabilities.
Thank you for investing with Federated. I hope you find this information useful and look forward to keeping you informed.
Sincerely,
J. Christopher Donahue, President
Not FDIC Insured • May Lose Value • No Bank Guarantee
CONTENTS
| 1 |
| 8 |
| 11 |
| 36 |
| 40 |
| 42 |
| 44 |
| 45 |
| 57 |
| 58 |
| 60 |
| 65 |
| 71 |
| 71 |
Management's Discussion of Fund Performance (unaudited)
The total return of Federated MDT Balanced Fund (the “Fund”), based on net asset value, for the 12-month reporting period ended July 31, 2014, was 13.06% for Class A Shares, 12.14% for Class C Shares, 13.30% for Institutional Shares and 12.72% for Class R Shares. Over the same period, the Fund's custom blended benchmark (“Blended Index”),1 which consists of a 60%/40% blend of the Standard & Poor's 500 Index (S&P 500)2 and the Barclays U.S. Aggregate Bond Index (BAB),3 returned 11.69%. The total return of the Morningstar Moderate Allocation Funds Average (MMAFA),4 a peer group average for the Fund, was 10.59% during the period. The Fund's and the MMACA's total returns for the most recently completed fiscal year reflected actual cash flows, transaction costs and other expenses, which were not reflected in the total return of the Blended Index.
During the reporting period, the Fund's investment strategy focused on asset allocation, security selection within the equity segment of the portfolio and sector and yield curve positioning within the fixed-income segment of the portfolio. These were the most significant factors affecting the Fund's performance relative to the Blended Index during the reporting period.
The following discussion will focus on the performance of the Fund's Institutional Shares.
MArket Overview
During the 12-month reporting period, domestic equity market performance was very strong as evidenced by the 16.37% return on the Russell 3000® Index.5 Large-cap stocks led the way with the Russell Top 200® Index6 returning 17.38%, closely followed by mid-cap stocks with a 16.36% return on the Russell Midcap® Index.7 Small-cap stocks8 posted a moderate gain with the Russell 2000® Index9 returning 8.56%. Growth stocks outperformed value stocks during the reporting period with the Russell 3000® Growth Index10 returning 17.89% as compared to 14.87% for the Russell 3000® Value Index.11
International equities12 in developed markets underperformed the domestic equity market during the reporting period with the Morgan Stanley Capital International (MSCI) Europe, Australasia and Far East (EAFE) Index13 returning 15.07%. Emerging market14 equities performed slightly better, but still trailed returns on domestic equities with the MSCI Emerging Markets Index15 returning 15.32% during the reporting period.
Real Estate Investment Trust (REIT)16 fundamentals benefited from improvement in employment conditions while valuations fluctuated with the increase in longer term interest rates late in 2013 and subsequent decline thus far in 2014. Over the reporting period, the MSCI US REIT Index17 returned 12.55%.
Annual Shareholder Report
Interest rates at intermediate maturities moved higher over the reporting period while those at the long-end of the treasury curve finished largely unchanged causing the overall curve to flatten. Credit sensitive instruments performed well as spreads relative to U.S. treasury instruments declined. For the period the BAB returned 3.97%.
ASSET ALLOCATION
During the 12-month reporting period, equity investments accounted for an average of approximately 67% of the portfolio, while fixed-income and cash investments accounted for an average of 33%. Though allocations fluctuated with the swings in the market, the Fund remained overweight in equities and underweight in bonds relative to its typical 60%/40% posture, which helped performance during the period. The allocation to cash was larger than normal in an effort to reduce the Fund's overall exposure to interest rate risk. This contributed negatively to performance as the return on fixed income investments exceeded the return on cash. Within the equity allocation, REIT investments were increased late in the period while the mix between domestic and international was consistently weighted towards domestic.
EQUITIES
Domestic equity investments, which were managed using Federated MDT's proprietary Optimum Q process, outperformed the Russell 3000® Index during the reporting period. Investments in the Industrials, Consumer Staples and Health Care sectors were the most significant positive factors in the Fund's domestic equity performance relative to the Russell 3000® Index, while investments in the Information Technology sector were the most significant negative contributor to relative results.
FIXED INCOME
During the 12-month reporting period, the fixed-income portion of the Fund outperformed the BAB with sector management as the most significant contributor to relative results. Overweight positions in high yield,18 investment-grade credit and emerging market debt all helped performance during the period. Alternatively, the flatter yield curve with higher short- and intermediate-term rates hurt Fund performance as the portfolio was positioned for the curve to steepen.
| 1 | The Fund's Blended Index, which reflects 60% of the S&P 500 and 40% of the BAB, is being used for comparison purposes because, although it is not the Fund's broad-based securities market index, the Fund's Adviser believes it is more reflective of the Fund's balanced investment style. |
| 2 | Please see the footnotes to the line graphs below for definitions of, and further information about, the S&P 500 Index, one of the Fund's broad-based securities market indices. The S&P 500's return for the 12-month reporting period was 16.93%. |
| 3 | Please see the footnotes to the line graphs below for definitions of, and further information about, the BAB, one of the Fund's broad-based securities market indices. The BAB's return for the 12-month reporting period was 3.97%. |
Annual Shareholder Report
| 4 | Please see the footnotes to the line graphs below for definitions of, and further information about, the MMAFA. |
| 5 | The Russell 3000® Index measures the performance of the largest 3,000 U.S. companies representing approximately 98% of the investable U.S. equity market. The Russell 3000® Index is constructed to provide a comprehensive, unbiased, and stable barometer of the broad market and is completely reconstituted annually to ensure new and growing equities are reflected. The index is unmanaged, and it is not possible to invest directly in an index. |
| 6 | The Russell Top 200® Index measures the performance of the largest cap segment of the U.S. equity universe. The Russell Top 200® Index is a subset of the Russell 3000® Index. It includes approximately 200 of the largest securities based on a combination of their market cap and current index membership and represents approximately 68% of the U.S. market. The Russell Top 200® Index is constructed to provide a comprehensive and unbiased barometer for this very large cap segment and is completely reconstituted annually to ensure new and growing equities are reflected. The index is unmanaged, and it is not possible to invest directly in an index. |
| 7 | The Russell Midcap® Index measures the performance of the mid-cap segment of the U.S. equity universe. The Russell Midcap® Index is a subset of the Russell 1000® Index. It includes approximately 800 of the smallest securities based on a combination of their market cap and current index membership. The Russell Midcap® Index represents approximately 31% of the total market capitalization of the Russell 1000® companies. The Russell Midcap® Index is constructed to provide a comprehensive and unbiased barometer for the mid-cap segment. The Russell Midcap Index is completely reconstituted annually to ensure larger stocks do not distort the performance and characteristics of the true mid-cap opportunity set. The index is unmanaged, and it is not possible to invest directly in an index. |
| 8 | Small-cap stocks may be less liquid and subject to greater price volatility than large-cap stocks. |
| 9 | The Russell 2000® Index measures the performance of the small-cap segment of the U.S. equity universe. The Russell 2000® Index is a subset of the Russell 3000® Index representing approximately 10% of the total market capitalization of that index. It includes approximately 2000 of the smallest securities based on a combination of their market cap and current index membership. The Russell 2000® Index is constructed to provide a comprehensive and unbiased small-cap barometer and is completely reconstituted annually to ensure larger stocks do not distort the performance and characteristics of the true small-cap opportunity set. The index is unmanaged, and it is not possible to invest directly in an index. |
| 10 | The Russell 3000® Growth Index measures the performance of the broad growth segment of the U.S. equity universe. It includes those Russell 3000® Index companies with higher price-to-book ratios and higher forecasted growth values. The Russell 3000® Growth Index is constructed to provide a comprehensive, unbiased and stable barometer of the broad growth market. The Russell 3000® Growth Index is completely reconstituted annually to ensure new and growing equities are included and that the represented companies continue to reflect growth characteristics. The index is unmanaged, and it is not possible to invest directly in an index. |
| 11 | The Russell 3000® Value Index measures the performance of the broad value segment of U.S. equity value universe. It includes those Russell 3000® Index companies with lower price-to-book ratios and lower forecasted growth values. The Russell 3000® Value Index is constructed to provide a comprehensive, unbiased and stable barometer of the broad value market. The Russell 3000® Value Index is completely reconstituted annually to ensure new and growing equities are included and that the represented companies continue to reflect value characteristics. The index is unmanaged, and it is not possible to invest directly in an index. |
| 12 | International investing involves special risks including currency risk, increased volatility of foreign securities, political risks and differences in auditing and other financial standards. |
| 13 | The MSCI EAFE Index measures international equity performance. It comprises 22 MSCI country indices, representing the developed markets outside of North America. The index is unmanaged, and it is not possible to invest directly in an index. |
| 14 | Prices of emerging markets securities can be significantly more volatile than the prices of securities in developed countries, and currency risks and political risks are accentuated in emerging markets. |
| 15 | The MSCI Emerging Markets Index is an unmanaged index consisting of 21 emerging market countries. The index is unmanaged, and it is not possible to invest directly in an index. |
Annual Shareholder Report
| 16 | Investments in real estate investment trusts (REITs) involve special risks associated with an investment in real estate, such as limited liquidity and interest rate risks. |
| 17 | The MSCI US REIT Index broadly and fairly represents the equity REIT opportunity set with proper investability screens to ensure that the index is investable and replicable. The index represents approximately 85% of the US REIT universe. The index is unmanaged, and it is not possible to invest directly in an index. |
| 18 | High-yield, lower-rated securities generally entail greater market, credit and liquidity risk than investment-grade securities and may include higher volatility and higher risk of default. Bond prices are sensitive to changes in interest rates, and a rise in interest rates can cause a decline in their prices. |
Annual Shareholder Report
FUND PERFORMANCE AND GROWTH OF A $10,000 INVESTMENT
The graph below illustrates the hypothetical investment of $10,0001 in the Federated MDT Balanced Fund2 from July 31, 2004 to July 31, 2014, compared to the Standard and Poor's 500 Index (S&P 500),3 the Barclays U.S. Aggregate Bond Index (BAB),4 60% S&P 500/40% BAB (Blended Index) and the Morningstar Moderate Allocation Funds Average (MMAFA).5 The Average Annual Total Return table below shows returns for each class averaged over the stated periods.
Growth of a $10,000 Investment
Growth of $10,000 as of July 31, 2014
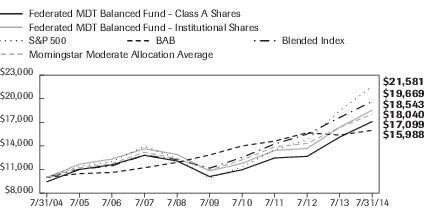
| Federated MDT Balanced Fund - | Class A Shares | Institutional Shares | S&P 500 | BAB | Blended Index | Morningstar Moderate Allocation Average |
| F | F | I | I | I | I |
| 7/31/2004 | 9,450 | 10,000 | 10,000 | 10,000 | 10,000 | 10,000 |
| 7/31/2005 | 11,011 | 11,681 | 11,405 | 10,479 | 11,037 | 11,215 |
| 7/31/2006 | 11,600 | 12,337 | 12,019 | 10,632 | 11,461 | 11,768 |
| 7/31/2007 | 12,805 | 13,646 | 13,958 | 11,225 | 12,825 | 13,197 |
| 7/31/2008 | 12,088 | 12,919 | 12,410 | 11,915 | 12,274 | 12,373 |
| 7/31/2009 | 10,112 | 10,835 | 9,933 | 12,850 | 11,175 | 10,930 |
| 7/31/2010 | 10,972 | 11,782 | 11,307 | 13,995 | 12,542 | 12,229 |
| 7/31/2011 | 12,473 | 13,430 | 13,529 | 14,616 | 14,248 | 13,876 |
| 7/31/2012 | 12,679 | 13,682 | 14,764 | 15,676 | 15,503 | 14,321 |
| 7/31/2013 | 15,124 | 16,367 | 18,455 | 15,378 | 17,610 | 16,356 |
| 7/31/2014 | 17,099 | 18,543 | 21,581 | 15,988 | 19,669 | 18,040 |
41 graphic description end -->
| ■ | Total returns shown include the maximum sales charge of 5.50% ($10,000 investment minus $550 sales charge = $9,450). |
The Fund offers multiple share classes whose performance may be greater than or less than its other share class(es) due to differences in sales charges and expenses. See the Average Annual Total Return table below for the returns of additional classes not shown in the line graph above.
Annual Shareholder Report
Average Annual Total Returns for the Periods Ended 7/31/2014
(returns reflect all applicable sales charges and contingent deferred sales charges as specified below in footnote #1)
| | 1 Year | 5 Years | 10 Years |
| Class A Shares6 | 6.81% | 9.83% | 5.51% |
| Class C Shares6 | 11.14% | 10.24% | 5.30% |
| Class R Shares6 | 12.72% | 10.61% | 5.66% |
| Institutional Shares6 | 13.30% | 11.35% | 6.37% |
| S&P 500 | 16.94% | 16.79% | 8.00% |
| BAB | 3.97% | 4.47% | 4.80% |
| Blended Index | 11.69% | 11.97% | 7.00% |
| MMAFA | 10.59% | 10.96% | 6.51% |
Performance data quoted represents past performance which is no guarantee of future results. Investment return and principal value will fluctuate so that an investor's shares, when redeemed, may be worth more or less than their original cost. Mutual fund performance changes over time and current performance may be lower or higher than what is stated. For current to the most recent month-end performance and after-tax returns, visit FederatedInvestors.com or call 1-800-341-7400. Returns shown do not reflect the deduction of taxes that a shareholder would pay on Fund distributions or the redemption of Fund shares. Mutual funds are not obligations of or guaranteed by any bank and are not federally insured.
| 1 | Represents a hypothetical investment of $10,000 in the Fund after deducting applicable sales charges: for Class A Shares, the maximum sales charge of 5.50% ($10,000 investment minus $550 sales charge = $9,450); for Class C Shares, a 1.00% contingent deferred sales charge would be applied on any redemption less than one year from the purchase date. The Fund's performance assumes the reinvestment of all dividends and distributions. The S&P 500 and BAB and MMAA have been adjusted to reflect reinvestment of dividends on securities in the indexes. |
| 2 | The Fund is the successor to the MDT Balanced Fund pursuant to a reorganization that took place on December 8, 2006. Prior to that date, the Fund had no investment operations. Accordingly, the performance information shown for periods prior to that date is that of the MDT Balanced Fund. |
| 3 | The S&P 500 Index, a broad-based securities market index of the Fund, is an unmanaged capitalization-weighted index of 500 stocks designed to measure performance of the broad domestic economy through changes in the aggregate market value of 500 stocks representing all major industries. The S&P 500 is unmanaged and, unlike the Fund, is not affected by cash flows. It is not possible to invest directly in an index. The S&P 500 is not adjusted to reflect sales charges, expenses or other fees that the Securities and Exchange Commission requires to be reflected in the Fund's performance. |
Annual Shareholder Report
| 4 | The BAB Index, a broad-based securities market index of the Fund, is an unmanaged index composed of securities from the Barclay's Government/Corporate Bond Index, Mortgage-Backed Securities Index and the Asset-Backed Securities Index. Total return comprises price appreciation/depreciation and income as a percentage of the original investment. Indices are rebalanced monthly by market capitalization. The BAB is unmanaged and, unlike the Fund, is not affected by cash flows. It is not possible to invest directly in an index. The BAB is not adjusted to reflect sales charges, expenses or other fees that the Securities and Exchange Commission requires to be reflected in the Fund's performance. |
| 5 | Morningstar figures represent the average of the total returns reported by all the mutual funds designated by Morningstar as falling into the respective category indicated. Morningstar figures do not reflect sales charges. It is not possible to invest directly in an average. |
| 6 | The start of performance date for the Fund's Class A Shares, Class C Shares and Class R Shares was October 1, 2002. Class A Shares and Class C Shares commenced operations on September 15, 2005, and Class R Shares commenced operations on December 12, 2006, respectively. Performance results shown before those dates are for the Fund's Institutional Shares and have been adjusted for the maximum sales charges, maximum contingent deferred sales charges and total annual operating expenses applicable to each class. The Fund's Institutional Shares commenced operations on October 1, 2002. Subject to the expense adjustments noted above, the Fund's Class A Shares, Class C Shares and Class R Shares annual returns would be substantially similar to those of the Institutional Shares because Shares of each class are invested in the same portfolio of securities. |
Annual Shareholder Report
Portfolio of Investments Summary Tables (unaudited)
At July 31, 2014, the Fund's portfolio composition1 was as follows:
| Security Type | Percentage of
Total Net Assets |
| Domestic Equity Securities | 55.9% |
| Corporate Debt Securities | 15.0% |
| International Equity Securities (including International Exchange-Traded Fund) | 10.4% |
| Mortgage-Backed Securities2 | 5.3% |
| Collateralized Mortgage Obligations | 2.2% |
| U.S. Treasury Securities3 | 2.0% |
| Asset-Backed Securities | 1.3% |
| Trade Finance Agreements | 1.0% |
| Commercial Mortgage-Backed Securities | 0.3% |
| Foreign Debt Securities | 0.2% |
| Municipal Bond | 0.1% |
| Floating Rate Loan4 | 0.0% |
| Derivative Contracts4,5 | 0.0% |
| Other Security Types4,6 | 0.0% |
| Cash Equivalents7 | 7.3% |
| Other Assets and Liabilities—Net8 | (1.0)% |
| TOTAL | 100.0% |
| 1 | See the Fund's Prospectus for a description of the principal types of securities in which the Fund invests. As of the date specified above, the Fund owned shares of one or more affiliated investment companies. For purposes of this table, the affiliated investment company (other than an affiliated money market mutual fund) is not treated as a single portfolio security, but rather the Fund is treated as owning a pro rata portion of each security and each other asset and liability owned by the affiliated investment company. Accordingly, the percentages of total net assets shown in the table will differ from those presented on the Portfolio of Investments. |
| 2 | For purposes of this table, Mortgage-Backed Securities include mortgage-backed securities guaranteed by Government Sponsored Entities and adjustable rate mortgage-backed securities. |
| 3 | Also includes $90,703 held in U.S. Treasuries pledged as collateral to ensure the Fund is able to satisfy the obligations of its outstanding futures contracts. |
| 4 | Represents less than 0.1%. |
| 5 | Based upon net unrealized appreciation (depreciation) or value of the derivative contracts as applicable. Derivative contracts may consist of futures, forwards, options and swaps. The impact of a derivative contract on the Fund's performance may be larger than its unrealized appreciation (depreciation) or value may indicate. In many cases, the notional value or amount of a derivative contract may provide a better indication of the contract's significance to the portfolio. More complete information regarding the Fund's direct investments in derivative contracts, including unrealized appreciation (depreciation), value and notional values or amounts of such contracts, can be found in the table at the end of the Portfolio of Investments included in this Report. |
| 6 | Other Security Types consist of purchased call options and purchased put options. |
| 7 | Cash Equivalents include any investments in money market mutual funds and/or overnight repurchase agreements. |
| 8 | Assets, other than investments in securities and derivative contracts, less liabilities. See Statement of Assets and Liabilities. |
Annual Shareholder Report
At July 31, 2014, the Fund's industry composition9 for its equity securities (excluding exchange-traded funds) was as follows:
| Industry Composition | Percentage of
Equity Securities |
| Oil Gas & Consumable Fuels | 8.4% |
| Banks | 7.6% |
| Real Estate Investment Trusts | 6.5% |
| Health Care Providers & Services | 5.0% |
| Insurance | 5.0% |
| Technology Hardware Storage & Peripherals | 4.4% |
| Electronic Equipment Instruments & Components | 3.8% |
| Aerospace & Defense | 3.6% |
| Specialty Retail | 3.6% |
| Capital Markets | 3.4% |
| Biotechnology | 3.1% |
| Machinery | 3.1% |
| Food & Staples Retailing | 2.7% |
| Chemicals | 2.6% |
| Multiline Retail | 2.3% |
| Diversified Telecommunication Services | 2.0% |
| Food Products | 1.9% |
| Communications Equipment | 1.8% |
| Semiconductors & Semiconductor Equipment | 1.8% |
| Pharmaceuticals | 1.7% |
| Airlines | 1.6% |
| Electric Utilities | 1.6% |
| Household Durables | 1.5% |
| Software | 1.5% |
| Auto Components | 1.3% |
| Beverages | 1.3% |
| Media | 1.3% |
| Consumer Finance | 1.1% |
| IT Services | 1.1% |
| Energy Equipment & Services | 1.0% |
Annual Shareholder Report
| Industry Composition | Percentage of
Equity Securities |
| Health Care Equipment & Supplies | 1.0% |
| Personal Products | 1.0% |
| Textiles Apparel & Luxury Goods | 1.0% |
| Other10 | 9.4% |
| TOTAL | 100.0% |
| 9 | Industry classifications are based upon, and individual portfolio securities are assigned to, the classifications of the Global Industry Classification Standard (GICS) except that the Adviser assigns a classification to securities not classified by the GICS and to securities for which the Adviser does not have access to the classification made by the GICS. |
| 10 | For purposes of this table, industry classifications which constitute less than 1.0% of the Fund's equity securities have been aggregated under the designation “Other.” |
Annual Shareholder Report
Portfolio of Investments
July 31, 2014
Shares or
Principal
Amount | | | Value |
| | | COMMON STOCKS—58.1% | |
| | | Aerospace & Defense—2.1% | |
| 1,700 | | Alliant Techsystems, Inc. | $220,881 |
| 2,300 | 1 | B/E Aerospace, Inc. | 195,822 |
| 900 | | Boeing Co. | 108,432 |
| 1,500 | | General Dynamics Corp. | 175,155 |
| 1,500 | | Huntington Ingalls Industries, Inc. | 136,380 |
| 2,400 | | L-3 Communications Holdings, Inc. | 251,904 |
| 3,500 | | Lockheed Martin Corp. | 584,395 |
| 6,900 | | Northrop Grumman Corp. | 850,563 |
| 3,800 | | Raytheon Co. | 344,926 |
| 1,600 | | Textron, Inc. | 58,192 |
| | | TOTAL | 2,926,650 |
| | | Air Freight & Logistics—0.1% | |
| 1,100 | | FedEx Corp. | 161,568 |
| | | Airlines—0.9% | |
| 6,600 | | Alaska Air Group, Inc. | 290,202 |
| 9,700 | | Delta Air Lines, Inc. | 363,362 |
| 7,800 | | Southwest Airlines Co. | 220,584 |
| 9,800 | 1 | United Continental Holdings, Inc. | 454,622 |
| | | TOTAL | 1,328,770 |
| | | Auto Components—0.8% | |
| 7,100 | | Goodyear Tire & Rubber Co. | 178,707 |
| 5,900 | | Johnson Controls, Inc. | 278,716 |
| 3,300 | | Lear Corp. | 310,761 |
| 1,800 | 1 | TRW Automotive Holdings Corp. | 184,122 |
| 1,800 | 1 | Tenneco, Inc. | 114,660 |
| | | TOTAL | 1,066,966 |
| | | Automobiles—0.2% | |
| 19,700 | | Ford Motor Co. | 335,294 |
| | | Banks—4.4% | |
| 12,700 | | BB&T Corp. | 470,154 |
| 37,800 | | Bank of America Corp. | 576,450 |
| 8,000 | | Citigroup, Inc. | 391,280 |
| 5,200 | | Comerica, Inc. | 261,352 |
| 20,900 | | Fifth Third Bancorp | 428,032 |
Annual Shareholder Report
Shares or
Principal
Amount | | | Value |
| | | COMMON STOCKS—continued | |
| | | Banks—continued | |
| 13,300 | | Huntington Bancshares, Inc. | $130,606 |
| 16,600 | | JPMorgan Chase & Co. | 957,322 |
| 21,000 | | KeyCorp | 284,340 |
| 7,800 | | PNC Financial Services Group | 643,968 |
| 6,300 | 1 | Popular, Inc. | 200,970 |
| 19,500 | | SunTrust Banks, Inc. | 741,975 |
| 8,000 | | U.S. Bancorp | 336,240 |
| 13,800 | | Wells Fargo & Co. | 702,420 |
| 2,400 | | Zions Bancorp | 69,168 |
| | | TOTAL | 6,194,277 |
| | | Beverages—0.7% | |
| 7,500 | | Coca-Cola Enterprises, Inc. | 340,875 |
| 7,900 | | Dr. Pepper Snapple Group, Inc. | 464,204 |
| 2,600 | | PepsiCo, Inc. | 229,060 |
| | | TOTAL | 1,034,139 |
| | | Biotechnology—1.8% | |
| 3,500 | 1 | Alexion Pharmaceuticals, Inc. | 556,465 |
| 300 | | Amgen, Inc. | 38,217 |
| 1,600 | 1 | Biogen Idec, Inc. | 535,024 |
| 2,900 | 1 | Celgene Corp. | 252,735 |
| 7,200 | 1 | Gilead Sciences, Inc. | 659,160 |
| 500 | 1 | Regeneron Pharmaceuticals, Inc. | 158,110 |
| 3,300 | 1 | United Therapeutics Corp. | 300,102 |
| | | TOTAL | 2,499,813 |
| | | Building Products—0.1% | |
| 200 | | Fortune Brands Home & Security, Inc. | 7,558 |
| 2,200 | | Lennox International, Inc. | 187,704 |
| | | TOTAL | 195,262 |
| | | Capital Markets—2.0% | |
| 800 | 1 | Affiliated Managers Group | 159,400 |
| 4,600 | | Ameriprise Financial, Inc. | 550,160 |
| 300 | | Blackrock, Inc. | 91,419 |
| 1,600 | | Franklin Resources, Inc. | 86,640 |
| 4,000 | | Goldman Sachs Group, Inc. | 691,480 |
| 7,600 | | Morgan Stanley | 245,784 |
| 7,600 | | State Street Corp. | 535,344 |
Annual Shareholder Report
Shares or
Principal
Amount | | | Value |
| | | COMMON STOCKS—continued | |
| | | Capital Markets—continued | |
| 10,900 | | The Bank of New York Mellon Corp. | $425,536 |
| | | TOTAL | 2,785,763 |
| | | Chemicals—1.5% | |
| 1,000 | | Airgas, Inc. | 106,920 |
| 3,300 | | Ashland, Inc. | 345,345 |
| 1,500 | | Dow Chemical Co. | 76,605 |
| 2,000 | | Eastman Chemical Co. | 157,560 |
| 8,400 | | Huntsman Corp. | 218,820 |
| 5,500 | | LyondellBasell Industries NV - Class - A | 584,375 |
| 1,000 | | PPG Industries, Inc. | 198,360 |
| 2,100 | | RPM International, Inc. | 92,778 |
| 1,600 | | Scotts Co. | 85,120 |
| 2,800 | | Westlake Chemical Corp. | 244,692 |
| | | TOTAL | 2,110,575 |
| | | Commercial Services—0.3% | |
| 1,500 | | Cintas Corp. | 93,900 |
| 7,600 | | Donnelley (R.R.) & Sons Co. | 131,936 |
| 10,000 | | Pitney Bowes, Inc. | 270,600 |
| | | TOTAL | 496,436 |
| | | Communications Equipment—1.1% | |
| 21,300 | | Cisco Systems, Inc. | 537,399 |
| 5,900 | | Harris Corp. | 402,793 |
| 8,200 | | Juniper Networks, Inc. | 193,028 |
| 4,700 | | Qualcomm, Inc. | 346,390 |
| | | TOTAL | 1,479,610 |
| | | Consumer Finance—0.6% | |
| 6,100 | | Capital One Financial Corp. | 485,194 |
| 5,900 | | Discover Financial Services | 360,254 |
| 1,600 | | Nelnet, Inc., Class A | 65,968 |
| | | TOTAL | 911,416 |
| | | Containers & Packaging—0.2% | |
| 2,800 | | Avery Dennison Corp. | 132,188 |
| 1,800 | | Rock-Tenn Co. | 178,974 |
| | | TOTAL | 311,162 |
| | | Diversified Consumer Services—0.4% | |
| 8,100 | 1 | Apollo Education Group, Inc. | 226,233 |
| 1,500 | | DeVry Education Group, Inc. | 59,955 |
Annual Shareholder Report
Shares or
Principal
Amount | | | Value |
| | | COMMON STOCKS—continued | |
| | | Diversified Consumer Services—continued | |
| 300 | 1 | Graham Holdings, Co. | $205,725 |
| 1,200 | 1 | ITT Educational Services, Inc. | 17,076 |
| | | TOTAL | 508,989 |
| | | Diversified Financial Services—0.2% | |
| 2,200 | 1 | Berkshire Hathaway, Inc., Class B | 275,946 |
| | | Diversified Telecommunication Services—1.1% | |
| 21,000 | | AT&T, Inc. | 747,390 |
| 18,800 | | CenturyLink, Inc. | 737,712 |
| 2,400 | | Verizon Communications | 121,008 |
| | | TOTAL | 1,606,110 |
| | | Electric Utilities—1.0% | |
| 3,400 | | American Electric Power Co., Inc. | 176,766 |
| 7,000 | | Edison International | 383,600 |
| 5,600 | | Entergy Corp. | 407,848 |
| 9,500 | | Exelon Corp. | 295,260 |
| 2,300 | | PPL Corp. | 75,877 |
| | | TOTAL | 1,339,351 |
| | | Electronic Equipment Instruments & Components—2.2% | |
| 1,900 | 1 | Anixter International, Inc. | 163,343 |
| 16,800 | 1 | Arrow Electronics, Inc. | 973,560 |
| 7,100 | | Avnet, Inc. | 300,543 |
| 9,700 | | Corning, Inc. | 190,605 |
| 4,700 | 1 | Ingram Micro, Inc., Class A | 134,890 |
| 1,900 | 1 | Insight Enterprises, Inc. | 49,913 |
| 1,400 | 1 | Itron, Inc. | 50,372 |
| 7,000 | 1 | Sanmina Corp. | 163,030 |
| 11,300 | 1 | Tech Data Corp. | 709,527 |
| 22,000 | | Vishay Intertechnology, Inc. | 324,060 |
| | | TOTAL | 3,059,843 |
| | | Energy Equipment & Services—0.6% | |
| 2,800 | | Baker Hughes, Inc. | 192,556 |
| 100 | | Bristow Group, Inc. | 7,137 |
| 4,200 | | Helmerich & Payne, Inc. | 446,292 |
| 1,900 | | National-Oilwell, Inc. | 153,976 |
| | | TOTAL | 799,961 |
| | | Food & Staples Retailing—1.6% | |
| 7,300 | | CVS Corp. | 557,428 |
Annual Shareholder Report
Shares or
Principal
Amount | | | Value |
| | | COMMON STOCKS—continued | |
| | | Food & Staples Retailing—continued | |
| 20,000 | | Kroger Co. | $979,600 |
| 3,800 | | Wal-Mart Stores, Inc. | 279,604 |
| 5,800 | | Walgreen Co. | 398,866 |
| | | TOTAL | 2,215,498 |
| | | Food Products—1.1% | |
| 9,300 | | Archer-Daniels-Midland Co. | 431,520 |
| 3,100 | | Bunge Ltd. | 244,404 |
| 9,700 | | ConAgra Foods, Inc. | 292,261 |
| 4,500 | | Fresh Del Monte Produce, Inc. | 134,730 |
| 3,700 | | Ingredion, Inc. | 272,431 |
| 2,900 | | Kellogg Co. | 173,507 |
| | | TOTAL | 1,548,853 |
| | | Health Care Equipment & Supplies—0.6% | |
| 3,800 | | Abbott Laboratories | 160,056 |
| 3,000 | | Baxter International, Inc. | 224,070 |
| 3,600 | | Medtronic, Inc. | 222,264 |
| 3,600 | | St. Jude Medical, Inc. | 234,684 |
| | | TOTAL | 841,074 |
| | | Health Care Providers & Services—2.8% | |
| 4,500 | | Aetna, Inc. | 348,885 |
| 5,100 | | CIGNA Corp. | 459,204 |
| 5,300 | | Cardinal Health, Inc. | 379,745 |
| 2,200 | 1 | Express Scripts Holding Co. | 153,230 |
| 3,100 | 1 | HCA Holdings, Inc. | 202,461 |
| 500 | 1 | Henry Schein, Inc. | 58,125 |
| 4,900 | | Humana, Inc. | 576,485 |
| 2,100 | 1 | Laboratory Corp. of America Holdings | 217,749 |
| 500 | | McKesson Corp. | 95,930 |
| 4,600 | | Quest Diagnostics, Inc. | 281,060 |
| 6,700 | | UnitedHealth Group, Inc. | 543,035 |
| 6,100 | | Wellpoint, Inc. | 669,841 |
| | | TOTAL | 3,985,750 |
| | | Hotels Restaurants & Leisure—0.5% | |
| 2,600 | | Las Vegas Sand Corp. | 192,010 |
| 2,800 | | Royal Caribbean Cruises, Ltd. | 167,020 |
| 4,100 | | Wyndham Worldwide Corp. | 309,755 |
| | | TOTAL | 668,785 |
Annual Shareholder Report
Shares or
Principal
Amount | | | Value |
| | | COMMON STOCKS—continued | |
| | | Household Durables—0.9% | |
| 2,200 | | Harman International Industries, Inc. | $238,810 |
| 3,800 | | Newell Rubbermaid, Inc. | 123,424 |
| 2,600 | | Tupperware Brands Corp. | 189,228 |
| 4,800 | | Whirlpool Corp. | 684,672 |
| | | TOTAL | 1,236,134 |
| | | Household Products—0.2% | |
| 3,100 | | Energizer Holdings, Inc. | 355,756 |
| | | Independent Power and Renewable Electricity Producers—0.2% | |
| 15,600 | | AES Corp. | 227,916 |
| | | Industrial Conglomerates—0.3% | |
| 1,500 | | 3M Co. | 211,335 |
| 11,100 | | General Electric Co. | 279,165 |
| | | TOTAL | 490,500 |
| | | Insurance—2.9% | |
| 3,000 | | Ace, Ltd. | 300,300 |
| 8,600 | | American International Group, Inc. | 447,028 |
| 1,200 | | Chubb Corp. | 104,052 |
| 3,200 | | Everest Re Group Ltd. | 498,912 |
| 9,400 | | HCC Insurance Holdings, Inc. | 438,792 |
| 3,400 | | MetLife, Inc. | 178,840 |
| 4,700 | | PartnerRe Ltd. | 490,492 |
| 3,600 | | Platinum Underwriters Holdings Ltd. | 210,960 |
| 7,300 | | Prudential Financial | 634,881 |
| 1,900 | | StanCorp Financial Group, Inc. | 114,646 |
| 7,500 | | The Travelers Cos, Inc. | 671,700 |
| | | TOTAL | 4,090,603 |
| | | Internet & Catalog Retail—0.1% | |
| 1,300 | | HSN, Inc. | 72,657 |
| 300 | 1 | NetFlix, Inc. | 126,816 |
| | | TOTAL | 199,473 |
| | | Internet Software & Services—0.1% | |
| 1,500 | | IAC Interactive Corp. | 100,800 |
| | | IT Services—0.6% | |
| 4,000 | | Amdocs Ltd. | 181,360 |
| 5,400 | | Computer Sciences Corp. | 336,906 |
| 2,400 | | Global Payments, Inc. | 166,248 |
Annual Shareholder Report
Shares or
Principal
Amount | | | Value |
| | | COMMON STOCKS—continued | |
| | | IT Services—continued | |
| 14,300 | | Xerox Corp. | $189,618 |
| | | TOTAL | 874,132 |
| | | Leisure Equipment & Products—0.3% | |
| 3,200 | | Hasbro, Inc. | 159,872 |
| 4,800 | | Mattel, Inc. | 170,040 |
| 700 | | Polaris Industries, Inc. | 103,278 |
| | | TOTAL | 433,190 |
| | | Life Sciences Tools & Services—0.3% | |
| 2,400 | 1 | Illumina, Inc. | 383,784 |
| | | Machinery—1.8% | |
| 4,100 | | AGCO Corp. | 199,711 |
| 2,400 | | Caterpillar, Inc. | 241,800 |
| 6,000 | | Deere & Co. | 510,660 |
| 4,300 | | Joy Global, Inc. | 254,818 |
| 3,100 | | OshKosh Truck Corp. | 143,282 |
| 6,200 | | Terex Corp. | 213,962 |
| 22,500 | | Trinity Industries, Inc. | 981,900 |
| | | TOTAL | 2,546,133 |
| | | Media—0.8% | |
| 6,700 | 1 | DirecTV | 576,535 |
| 2,300 | | Viacom, Inc., Class B - New | 190,141 |
| 3,500 | | Walt Disney Co. | 300,580 |
| | | TOTAL | 1,067,256 |
| | | Multi-Utilities—0.4% | |
| 4,600 | | Ameren Corp. | 176,870 |
| 2,500 | | Consolidated Edison Co. | 140,225 |
| 6,800 | | Public Service Enterprises Group, Inc. | 239,156 |
| | | TOTAL | 556,251 |
| | | Multi-Line Retail—1.3% | |
| 2,400 | | Big Lots, Inc. | 105,000 |
| 10,400 | | Kohl's Corp. | 556,816 |
| 11,000 | | Macy's, Inc. | 635,690 |
| 1,500 | | Nordstrom, Inc. | 103,845 |
| 100 | 1 | Sears Holdings Corp. | 3,815 |
| 7,200 | | Target Corp. | 429,048 |
| | | TOTAL | 1,834,214 |
Annual Shareholder Report
Shares or
Principal
Amount | | | Value |
| | | COMMON STOCKS—continued | |
| | | Oil Gas & Consumable Fuels—4.9% | |
| 6,000 | | Apache Corp. | $615,960 |
| 6,400 | | Chesapeake Energy Corp. | 168,768 |
| 4,400 | | Chevron Corp. | 568,656 |
| 11,200 | | ConocoPhillips | 924,000 |
| 3,500 | | Devon Energy Corp. | 264,250 |
| 2,800 | | EOG Resources, Inc. | 306,432 |
| 500 | | EQT Corp. | 46,910 |
| 4,300 | | Exxon Mobil Corp. | 425,442 |
| 3,200 | | Hess Corp. | 316,736 |
| 6,700 | | HollyFrontier Corp. | 314,967 |
| 14,900 | | Marathon Oil Corp. | 577,375 |
| 4,300 | | Marathon Petroleum Corp. | 358,964 |
| 5,400 | | Murphy Oil Corp. | 335,502 |
| 4,400 | | Occidental Petroleum Corp. | 429,924 |
| 6,500 | | Phillips 66 | 527,215 |
| 13,900 | | Valero Energy Corp. | 706,120 |
| | | TOTAL | 6,887,221 |
| | | Paper & Forest Products—0.3% | |
| 3,600 | | Domtar Corp. | 129,312 |
| 5,300 | | International Paper Co. | 251,750 |
| | | TOTAL | 381,062 |
| | | Personal Products—0.6% | |
| 9,700 | | Avon Products, Inc. | 128,040 |
| 2,200 | | Estee Lauder Cos., Inc., Class A | 161,612 |
| 5,400 | | Herbalife Ltd. | 282,960 |
| 4,300 | | Nu Skin Enterprises, Inc. | 252,367 |
| | | TOTAL | 824,979 |
| | | Pharmaceuticals—1.0% | |
| 2,500 | | AbbVie, Inc. | 130,850 |
| 2,400 | | Johnson & Johnson | 240,216 |
| 6,400 | | Lilly (Eli) & Co. | 390,784 |
| 300 | | Merck & Co., Inc. | 17,022 |
| 4,300 | 1 | Mylan, Inc. | 212,291 |
| 14,000 | | Pfizer, Inc. | 401,800 |
| | | TOTAL | 1,392,963 |
| | | Poultry Products—0.1% | |
| 1,300 | | Sanderson Farms, Inc. | 118,417 |
Annual Shareholder Report
Shares or
Principal
Amount | | | Value |
| | | COMMON STOCKS—continued | |
| | | Professional Services—0.4% | |
| 1,700 | | Dun & Bradstreet Corp. | $187,051 |
| 3,500 | | Manpower Group, Inc. | 272,615 |
| 3,000 | | Robert Half International, Inc. | 145,950 |
| | | TOTAL | 605,616 |
| | | Real Estate Investment Trusts—3.8% | |
| 6,400 | | American Tower Corp. | 604,096 |
| 3,000 | | Boston Properties, Inc. | 358,350 |
| 21,000 | | Cousins Properties, Inc. | 259,980 |
| 22,000 | | DCT Industrial Trust, Inc. | 172,260 |
| 8,000 | | Douglas Emmett, Inc. | 227,920 |
| 2,700 | | EastGroup Properties, Inc. | 168,372 |
| 5,300 | | Extra Space Storage, Inc. | 274,169 |
| 23,000 | | Host Hotels & Resorts, Inc. | 500,020 |
| 58,900 | | Kite Realty Group Trust | 359,290 |
| 10,000 | | Pebblebrook Hotel Trust | 364,000 |
| 4,200 | | Post Properties, Inc. | 227,640 |
| 2,500 | | SL Green Realty Corp. | 269,500 |
| 51,000 | 1 | Strategic Hotels & Resorts, Inc. | 581,910 |
| 38,000 | | Sunstone Hotel Investors, Inc. | 539,220 |
| 3,700 | | Vornado Realty Trust | 392,274 |
| | | TOTAL | 5,299,001 |
| | | Restaurant—0.1% | |
| 300 | 1 | Chipotle Mexican Grill, Inc. | 201,750 |
| | | Road & Rail—0.1% | |
| 1,700 | | Union Pacific Corp. | 167,127 |
| | | Semiconductors & Semiconductor Equipment—1.0% | |
| 6,800 | | Broadcom Corp. | 260,168 |
| 14,400 | | Intel Corp. | 488,016 |
| 3,700 | | Lam Research Corp. | 259,000 |
| 4,200 | | Skyworks Solutions, Inc. | 213,192 |
| 4,700 | | Texas Instruments, Inc. | 217,375 |
| | | TOTAL | 1,437,751 |
| | | Software—0.9% | |
| 14,300 | | CA, Inc. | 412,984 |
| 4,500 | 1 | Electronic Arts, Inc. | 151,200 |
| 6,600 | | Oracle Corp. | 266,574 |
Annual Shareholder Report
Shares or
Principal
Amount | | | Value |
| | | COMMON STOCKS—continued | |
| | | Software—continued | |
| 16,000 | | Symantec Corp. | $378,560 |
| | | TOTAL | 1,209,318 |
| | | Specialty Chemicals—0.1% | |
| 800 | | International Flavors & Fragrances, Inc. | 80,792 |
| | | Specialty Retail—2.1% | |
| 5,200 | | Abercrombie & Fitch Co., Class A | 204,568 |
| 1,400 | 1 | Ann, Inc. | 51,450 |
| 1,800 | 1 | AutoNation, Inc. | 95,976 |
| 300 | 1 | AutoZone, Inc. | 155,109 |
| 2,600 | 1 | Bed Bath & Beyond, Inc. | 164,554 |
| 7,100 | | Best Buy Co., Inc. | 211,083 |
| 1,200 | | Children's Place, Inc./The | 60,240 |
| 4,700 | | Foot Locker, Inc. | 223,391 |
| 2,600 | | GNC Acquisition Holdings, Inc. | 85,306 |
| 7,400 | | GameStop Corp. | 310,578 |
| 8,200 | | Gap (The), Inc. | 328,902 |
| 3,800 | | Guess ?, Inc. | 98,838 |
| 2,000 | | Home Depot, Inc. | 161,700 |
| 6,100 | | Lowe's Cos., Inc. | 291,885 |
| 1,400 | 1 | O'Reilly Automotive, Inc. | 210,000 |
| 2,300 | | Rent-A-Center, Inc. | 55,062 |
| 3,900 | 1 | Sally Beauty Holdings, Inc. | 101,205 |
| 13,300 | | Staples, Inc. | 154,147 |
| | | TOTAL | 2,963,994 |
| | | Technology Hardware Storage & Peripherals—2.6% | |
| 1,600 | | Diebold, Inc. | 60,288 |
| 4,200 | | EMC Corp. Mass | 123,060 |
| 33,300 | | Hewlett-Packard Co. | 1,185,813 |
| 3,800 | | International Business Machines Corp. | 728,346 |
| 2,800 | | Lexmark International, Inc. | 134,484 |
| 8,700 | | NetApp, Inc. | 337,908 |
| 4,200 | | Sandisk Corp. | 385,182 |
| 6,400 | | Western Digital Corp. | 638,912 |
| | | TOTAL | 3,593,993 |
| | | Textiles Apparel & Luxury Goods—0.6% | |
| 1,700 | | Carter's, Inc. | 130,152 |
| 5,300 | | Hanesbrands, Inc. | 517,863 |
Annual Shareholder Report
Shares or
Principal
Amount | | | Value |
| | | COMMON STOCKS—continued | |
| | | Textiles Apparel & Luxury Goods—continued | |
| 1,600 | | PVH Corp. | $176,288 |
| | | TOTAL | 824,303 |
| | | Tobacco—0.1% | |
| 3,400 | | Altria Group, Inc. | 138,040 |
| | | Trading Companies & Distributors—0.3% | |
| 3,400 | 1 | United Rentals, Inc. | 360,060 |
| | | TOTAL COMMON STOCKS
(IDENTIFIED COST $63,517,417) | 81,570,390 |
| | | ASSET-BACKED SECURITIES—1.2% | |
| $300,000 | | BMW Vehicle Trust 2014-1, A4, 0.99%, 08/21/2017 | 300,055 |
| 250,000 | | Bank of America Credit Card Trust 2014-A2, A, 0.422%, 09/16/2019 | 250,462 |
| 25,115 | | CS First Boston Mortgage Securities Corp. 2002-HE4, AF, 5.51%, 08/25/2032 | 27,483 |
| 250,000 | | Citibank Credit Card Issuance Trust 2014-A2, A2, 1.02%, 02/22/2019 | 248,977 |
| 300,000 | | Discover Card Master Trust I 2012—B3, B3, 0.602%, 05/15/2018 | 300,579 |
| 400,000 | | GE Dealer Floorplan Master Note Trust 2012-3, A, 0.646%, 06/20/2017 | 401,141 |
| 100,000 | | Navient Student Loan Trust 2014-1, A2, 0.497%, 03/27/2023 | 100,094 |
| 25,000 | | Santander Drive Auto Receivables Trust 2013-1, D, 2.27%, 01/15/2019 | 25,204 |
| | | TOTAL ASSET-BACKED SECURITIES
(IDENTIFIED COST $1,649,945) | 1,653,995 |
| | | COLLATERALIZED MORTGAGE OBLIGATIONS—1.1% | |
| | | Commercial Mortgage—1.1% | |
| 1,176 | | Bear Stearns Mortgage Securities, Inc., 1997-6 1A, 6.366%, 3/25/2031 | 1,217 |
| 200,000 | | Citigroup Commercial Mortgage Trust 2013-GC11 B, 3.732%, 4/10/2046 | 198,632 |
| 70,000 | | Commercial Mortgage Pass-Through Certificates 2012-CR1 AM, 3.912%, 5/15/2045 | 73,033 |
| 125,000 | | Commercial Mortgage Pass-Through Certificates 2012-CR1 B, 4.612%, 5/15/2045 | 133,317 |
| 200,000 | 2,3 | Commercial Mortgage Trust 2013-CR8 B, 3.969%, 6/10/2046 | 202,778 |
| 200,000 | 2,3 | FREMF Mortgage Trust 2013-K25, B, 3.617%, 11/25/2045 | 198,496 |
| 3,643 | | Federal Home Loan Mortgage Corp. REMIC 1311 K, 7.000%, 7/15/2022 | 4,013 |
| 7,020 | | Federal Home Loan Mortgage Corp. REMIC 1384 D, 7.000%, 9/15/2022 | 7,876 |
| 12,429 | | Federal Home Loan Mortgage Corp. REMIC 2497 JH, 6.000%, 9/15/2032 | 13,927 |
| 16,080 | | Federal National Mortgage Association REMIC 1993-113 SB, 9.749%, 7/25/2023 | 17,909 |
Annual Shareholder Report
Shares or
Principal
Amount | | | Value |
| | | COLLATERALIZED MORTGAGE OBLIGATIONS—continued | |
| | | Commercial Mortgage—continued | |
| $723 | | Federal National Mortgage Association REMIC 2001-37 GA, 8.000%, 7/25/2016 | $750 |
| 2,993 | | Federal National Mortgage Association REMIC 2003-35 UC, 3.750%, 5/25/2033 | 3,134 |
| 100,000 | | GS Mortgage Securities Corp. II 2012-GCJ7 AS, 4.085%, 5/10/2045 | 105,747 |
| 135,000 | | GS Mortgage Securities Corp. II 2012-GCJ7 B, 4.74%, 5/10/2045 | 145,426 |
| 11,479 | | Government National Mortgage Association REMIC 2002-17 B, 6.000%, 3/20/2032 | 12,827 |
| 100,000 | | Merrill Lynch Mortgage Trust 2008-C1 AM, 6.283%, 2/12/2051 | 114,046 |
| 50,000 | | Morgan Stanley Capital I 2007-IQ16 AM, 6.089%, 12/12/2049 | 56,077 |
| 100,000 | | Morgan Stanley Capital I 2012-C4 AS, 3.773%, 3/15/2045 | 103,491 |
| 150,000 | 2,3 | UBS-Barclays Commercial Mortgage Trust 2013-C6 B, 3.875%, 4/10/2046 | 150,519 |
| 25,000 | | WF-RBS Commercial Mortgage Trust 2012-C6 B, 4.697%, 4/15/2045 | 26,781 |
| | | TOTAL COLLATERALIZED MORTGAGE OBLIGATIONS
(IDENTIFIED COST $1,540,935) | 1,569,996 |
| | | CORPORATE BONDS—12.1% | |
| | | Basic Industry - Chemicals—0.2% | |
| 100,000 | | Albemarle Corp., Sr. Note, 5.100%, 02/01/2015 | 102,159 |
| 20,000 | 2,3 | Incitec Pivot Finance LLC, Company Guarantee, Series 144A, 4.000%, 12/07/2015 | 20,719 |
| 35,000 | 2,3 | Incitec Pivot Finance LLC, Company Guarantee, Series 144A, 6.000%, 12/10/2019 | 39,584 |
| 70,000 | | RPM International, Inc., 6.500%, 02/15/2018 | 79,788 |
| 20,000 | | RPM International, Inc., Sr. Unsecd. Note, 6.125%, 10/15/2019 | 22,871 |
| 22,000 | | Rohm & Haas Co., 6.000%, 09/15/2017 | 24,880 |
| 30,000 | | Sherwin-Williams Co., 3.125%, 12/15/2014 | 30,297 |
| | | TOTAL | 320,298 |
| | | Basic Industry - Metals & Mining—0.8% | |
| 50,000 | | Alcan, Inc., 5.000%, 06/01/2015 | 51,824 |
| 100,000 | | Alcoa, Inc., 5.870%, 02/23/2022 | 108,763 |
| 80,000 | | Allegheny Technologies, Inc., Sr. Note, 9.375%, 06/01/2019 | 99,370 |
| 15,000 | | Anglogold Ashanti Holdings PLC, Sr. Note, 6.500%, 04/15/2040 | 14,268 |
| 100,000 | | Anglogold Ashanti Holdings PLC, Sr. Unsecd. Note, 5.125%, 08/01/2022 | 97,580 |
| 100,000 | | Anglogold Ashanti Holdings PLC, Sr. Unsecd. Note, 8.500%, 07/30/2020 | 113,525 |
| 62,000 | | Carpenter Technology Corp., Sr. Unsecd. Note, 4.450%, 03/01/2023 | 63,657 |
| 40,000 | | Carpenter Technology Corp., Sr. Unsecd. Note, 5.200%, 07/15/2021 | 42,838 |
Annual Shareholder Report
Shares or
Principal
Amount | | | Value |
| | | CORPORATE BONDS—continued | |
| | | Basic Industry - Metals & Mining—continued | |
| $20,000 | 2,3 | Newcrest Finance Property Ltd., Sr. Unsecd. Note, Series 144A, 4.200%, 10/01/2022 | $18,889 |
| 100,000 | | Reliance Steel & Aluminum Co., Sr. Unsecd. Note, 4.500%, 04/15/2023 | 102,698 |
| 85,000 | | Rio Tinto Finance USA Ltd., Company Guarantee, 6.500%, 07/15/2018 | 99,555 |
| 150,000 | | Rio Tinto Finance USA Ltd., Sr. Unsecd. Note, 2.250%, 12/14/2018 | 151,703 |
| 20,000 | | Southern Copper Corp., Note, 6.750%, 04/16/2040 | 22,000 |
| 160,000 | | Worthington Industries, Inc., Sr. Unsecd. Note, 6.500%, 04/15/2020 | 181,047 |
| | | TOTAL | 1,167,717 |
| | | Basic Industry - Paper—0.0% | |
| 10,000 | | Plum Creek Timberlands LP, Sr. Unsecd. Note, 3.250%, 03/15/2023 | 9,544 |
| 20,000 | | Plum Creek Timberlands LP, Sr. Unsecd. Note, 4.700%, 03/15/2021 | 21,776 |
| | | TOTAL | 31,320 |
| | | Capital Goods - Aerospace & Defense—0.3% | |
| 50,000 | 2,3 | BAE Systems Holdings, Inc., Series 144A, 5.200%, 8/15/2015 | 52,100 |
| 211,000 | 2,3 | Embraer Overseas Ltd., Sr. Unsecd. Note, Series 144A, 5.696%, 09/16/2023 | 228,408 |
| 20,000 | | Raytheon Co., Sr. Note, 4.400%, 02/15/2020 | 22,009 |
| 10,000 | | Rockwell Collins, Inc., Sr. Unsecd. Note, 3.100%, 11/15/2021 | 10,064 |
| 50,000 | | Textron, Inc., Sr. Unsecd. Note, 4.300%, 03/01/2024 | 51,557 |
| | | TOTAL | 364,138 |
| | | Capital Goods - Building Materials—0.0% | |
| 40,000 | | Valmont Industries, Inc., Sr. Unsecd. Note, 6.625%, 04/20/2020 | 47,285 |
| | | Capital Goods - Construction Machinery—0.0% | |
| 40,000 | | AGCO Corp., Sr. Unsecd. Note, 5.875%, 12/01/2021 | 45,374 |
| | | Capital Goods - Diversified Manufacturing—0.4% | |
| 15,000 | | ABB Finance USA, Inc., Sr. Unsecd. Note, 2.875%, 05/08/2022 | 14,842 |
| 15,000 | | Avery Dennison Corp., Sr. Unsecd. Note, 5.375%, 04/15/2020 | 15,759 |
| 60,000 | | Dover Corp., Note, 5.450%, 03/15/2018 | 67,312 |
| 30,000 | | Emerson Electric Co., 4.875%, 10/15/2019 | 33,902 |
| 200,000 | | General Electric Co., Sr. Unsecd. Note, 4.125%, 10/09/2042 | 198,893 |
| 80,000 | | Hubbell, Inc., 5.950%, 06/01/2018 | 91,542 |
| 50,000 | | Pentair, Ltd., Company Guarantee, 5.000%, 05/15/2021 | 55,052 |
| 40,000 | 2,3 | Textron Financial Corp., Jr. Sub. Note, Series 144A, 6.000%, 2/15/2067 | 36,400 |
| 15,000 | | Thomas & Betts Corp., Sr. Unsecd. Note, 5.625%, 11/15/2021 | 17,473 |
| | | TOTAL | 531,175 |
| | | Capital Goods - Environmental—0.1% | |
| 85,000 | | Republic Services, Inc., Company Guarantee, Series WI, 5.500%, 09/15/2019 | 97,045 |
Annual Shareholder Report
Shares or
Principal
Amount | | | Value |
| | | CORPORATE BONDS—continued | |
| | | Capital Goods - Environmental—continued | |
| $25,000 | | Waste Management, Inc., 7.375%, 03/11/2019 | $30,438 |
| | | TOTAL | 127,483 |
| | | Capital Goods - Packaging—0.0% | |
| 45,000 | | Packaging Corp. of America, Sr. Unsecd. Note, 3.900%, 06/15/2022 | 46,169 |
| 10,000 | | Rock-Tenn Co., Sr. Unsecd. Note, 4.000%, 03/01/2023 | 10,207 |
| 10,000 | | Rock-Tenn Co., Sr. Unsecd. Note, 4.450%, 03/01/2019 | 10,839 |
| | | TOTAL | 67,215 |
| | | Communications - Cable & Satellite—0.1% | |
| 24,000 | | Cox Communications, Inc., Unsecd. Note, 5.450%, 12/15/2014 | 24,426 |
| 90,000 | | NBC Universal, Inc., Sr. Unsecd. Note, 5.150%, 04/30/2020 | 102,531 |
| 30,000 | | Time Warner Cable, Inc., Company Guarantee, 8.250%, 04/01/2019 | 37,728 |
| | | TOTAL | 164,685 |
| | | Communications - Media & Entertainment—0.5% | |
| 75,000 | | 21st Century Fox America, Inc., Sr. Unsecd. Note, 5.400%, 10/01/2043 | 81,915 |
| 25,000 | | Discovery Communications LLC, Company Guarantee, 5.050%, 06/01/2020 | 27,921 |
| 30,000 | | Interpublic Group of Cos., Inc., Sr. Unsecd. Note, 2.250%, 11/15/2017 | 30,412 |
| 25,000 | | Moody's Corp., Sr. Unsecd. Note, 5.500%, 09/01/2020 | 28,273 |
| 75,000 | | News America Holdings, Inc., Company Guarantee, 8.000%, 10/17/2016 | 86,107 |
| 20,000 | | Omnicom Group, Inc., Sr. Unsecd. Note, 3.625%, 05/01/2022 | 20,387 |
| 100,000 | 2,3 | Pearson Funding Two PLC, Sr. Unsecd. Note, Series 144A, 4.000%, 05/17/2016 | 104,849 |
| 30,000 | | Viacom, Inc., 2.500%, 09/01/2018 | 30,482 |
| 25,000 | | Viacom, Inc., Sr. Unsecd. Note, 2.500%, 12/15/2016 | 25,724 |
| 100,000 | | Viacom, Inc., Sr. Unsecd. Note, 3.875%, 04/01/2024 | 100,679 |
| 150,000 | | WPP Finance 2010, Sr. Unsecd. Note, 5.625%, 11/15/2043 | 163,386 |
| | | TOTAL | 700,135 |
| | | Communications - Telecom Wireless—0.5% | |
| 50,000 | | America Movil S.A.B. de C.V., 3.125%, 07/16/2022 | 48,650 |
| 100,000 | | America Movil S.A.B. de C.V., Note, 5.750%, 01/15/2015 | 102,274 |
| 100,000 | | American Tower Corp., Sr. Unsecd. Note, 3.400%, 02/15/2019 | 103,779 |
| 50,000 | | American Tower Corp., Sr. Unsecd. Note, 4.500%, 01/15/2018 | 54,111 |
| 100,000 | 2,3 | Crown Castle Towers LLC, Sr. Secd. Note, Series 144A, 5.495%, 01/15/2017 | 107,752 |
| 90,000 | | Orange SA, Sr. Unsecd. Note, 5.375%, 07/08/2019 | 102,112 |
| 30,000 | 2,3 | SBA Tower Trust, Series 144A, 5.101%, 04/17/2017 | 32,006 |
Annual Shareholder Report
Shares or
Principal
Amount | | | Value |
| | | CORPORATE BONDS—continued | |
| | | Communications - Telecom Wireless—continued | |
| $90,000 | | Telefonaktiebolaget LM Ericsson, Sr. Unsecd. Note, 4.125%, 05/15/2022 | $93,746 |
| | | TOTAL | 644,430 |
| | | Communications - Telecom Wirelines—0.3% | |
| 10,000 | | CenturyLink, Inc., Sr. Unsecd. Note, 7.65%, 3/15/2042 | 10,100 |
| 90,000 | | Verizon Communications, Inc., Sr. Unsecd. Note, 4.150%, 03/15/2024 | 93,260 |
| 175,000 | | Verizon Communications, Inc., Sr. Unsecd. Note, 5.150%, 09/15/2023 | 193,778 |
| 60,000 | | Verizon Communications, Inc., Sr. Unsecd. Note, 6.350%, 04/01/2019 | 70,519 |
| | | TOTAL | 367,657 |
| | | Consumer Cyclical - Automotive—0.4% | |
| 175,000 | | American Honda Finance Corp., 0.404%, 7/14/2017 | 175,023 |
| 10,000 | | DaimlerChrysler North America Holding Corp., Company Guarantee, 8.500%, 01/18/2031 | 15,105 |
| 100,000 | | Ford Motor Co., Sr. Unsecd. Note, 4.750%, 01/15/2043 | 100,726 |
| 20,000 | 2,3 | Harley-Davidson Financial Services, Inc., Company Guarantee, Series 144A, 3.875%, 03/15/2016 | 20,964 |
| 10,000 | 2,3 | Harley-Davidson Financial Services, Inc., Sr. Unsecd. Note, Series 144A, 2.700%, 03/15/2017 | 10,321 |
| 100,000 | 2,3 | Hyundai Capital America, Sr. Unsecd. Note, Series 144A, 2.875%, 08/09/2018 | 102,487 |
| 65,000 | 2,3 | RCI Banque SA, Sr. Unsecd. Note, 3.500%, 04/03/2018 | 67,406 |
| 20,000 | 2,3 | RCI Banque SA, Sr. Unsecd. Note, Series 144A, 4.600%, 04/12/2016 | 21,135 |
| | | TOTAL | 513,167 |
| | | Consumer Cyclical - Leisure—0.1% | |
| 200,000 | 2 | Football Trust V, Pass Thru Cert., Series 144A, 5.35%, 10/05/2020 | 216,104 |
| | | Consumer Cyclical - Lodging—0.1% | |
| 30,000 | | Hyatt Hotels Corp., Sr. Unsecd. Note, 3.375%, 07/15/2023 | 29,200 |
| 50,000 | | Marriott International, Inc., Sr. Unsecd. Note, 3.000%, 03/01/2019 | 51,627 |
| | | TOTAL | 80,827 |
| | | Consumer Cyclical - Retailers—0.3% | |
| 50,000 | | Advance Auto Parts, Inc., 4.500%, 12/01/2023 | 52,553 |
| 10,000 | | O'Reilly Automotive, Inc., Company Guarantee, 4.875%, 01/14/2021 | 10,912 |
| 300,000 | | Wal-Mart Stores, Inc., Sr. Unsecd. Note, 4.300%, 04/22/2044 | 301,565 |
| | | TOTAL | 365,030 |
| | | Consumer Cyclical - Services—0.1% | |
| 65,000 | | Expedia, Inc., Company Guarantee, 5.950%, 08/15/2020 | 73,336 |
Annual Shareholder Report
Shares or
Principal
Amount | | | Value |
| | | CORPORATE BONDS—continued | |
| | | Consumer Cyclical - Services—continued | |
| $10,000 | | University of Southern California, Sr. Unsecd. Note, 5.250%, 10/01/2111 | $12,014 |
| | | TOTAL | 85,350 |
| | | Consumer Non-Cyclical - Food/Beverage—0.5% | |
| 100,000 | | Bottling Group LLC, Note, 5.500%, 04/01/2016 | 107,970 |
| 50,000 | | ConAgra Foods, Inc., Sr. Unsecd. Note, 3.200%, 01/25/2023 | 48,753 |
| 175,000 | | ConAgra Foods, Inc., Sr. Unsecd. Note, 4.650%, 01/25/2043 | 173,951 |
| 200,000 | 2,3 | Kerry Group Financial Services, Sr. Unsecd. Note, Series 144A, 3.200%, 04/09/2023 | 192,797 |
| 25,000 | | Mondelez International, Inc., Sr. Unsecd. Note, 4.000%, 02/01/2024 | 26,004 |
| 20,000 | | Sysco Corp., Sr. Note, 5.375%, 03/17/2019 | 22,595 |
| 30,000 | | The Coca-Cola Co., Sr. Unsecd. Note, Series WI, 1.800%, 09/01/2016 | 30,658 |
| 50,000 | | Tyson Foods, Inc., Sr. Unsecd. Note, 4.500%, 06/15/2022 | 52,672 |
| | | TOTAL | 655,400 |
| | | Consumer Non-Cyclical - Health Care—0.1% | |
| 40,000 | | Baxter International, Inc., 6.250%, 12/01/2037 | 51,076 |
| 10,000 | | Laboratory Corp. of America Holdings, Sr. Unsecd. Note, 3.750%, 08/23/2022 | 10,106 |
| 70,000 | | Stryker Corp., Sr. Unsecd. Note, 1.300%, 04/01/2018 | 68,885 |
| 10,000 | | Zimmer Holdings, Inc., Sr. Note, 5.750%, 11/30/2039 | 11,662 |
| | | TOTAL | 141,729 |
| | | Consumer Non-Cyclical - Pharmaceuticals—0.0% | |
| 10,000 | | Dentsply International, Inc., Sr. Unsecd. Note, 2.750%, 08/15/2016 | 10,326 |
| 30,000 | | Pfizer, Inc., Sr. Unsecd. Note, 6.200%, 03/15/2019 | 35,282 |
| | | TOTAL | 45,608 |
| | | Consumer Non-Cyclical - Products—0.0% | |
| 10,000 | | Clorox Co., Sr. Unsecd. Note, 3.550%, 11/01/2015 | 10,339 |
| | | Consumer Non-Cyclical - Tobacco—0.1% | |
| 24,000 | | Altria Group, Inc., 9.250%, 08/06/2019 | 31,499 |
| 30,000 | | Altria Group, Inc., Sr. Unsecd. Note, 4.000%, 01/31/2024 | 30,622 |
| 30,000 | | Philip Morris International, Inc., 5.650%, 05/16/2018 | 34,159 |
| | | TOTAL | 96,280 |
| | | Energy - Independent—0.2% | |
| 50,000 | | Canadian Natural Resources Ltd., 4.900%, 12/01/2014 | 50,737 |
| 30,000 | | EOG Resources, Inc., Note, 5.625%, 06/01/2019 | 34,607 |
| 25,000 | 2,3 | Petroleos Mexicanos, Sr. Unsecd. Note, 4.875%, 01/18/2024 | 26,562 |
| 75,000 | | XTO Energy, Inc., 6.375%, 06/15/2038 | 102,529 |
Annual Shareholder Report
Shares or
Principal
Amount | | | Value |
| | | CORPORATE BONDS—continued | |
| | | Energy - Independent—continued | |
| $60,000 | | XTO Energy, Inc., 6.750%, 08/01/2037 | $86,523 |
| | | TOTAL | 300,958 |
| | | Energy - Integrated—0.3% | |
| 30,000 | | BP Capital Markets America, Inc., Company Guarantee, 4.200%, 06/15/2018 | 32,282 |
| 20,000 | | BP Capital Markets PLC, Company Guarantee, 3.125%, 10/01/2015 | 20,601 |
| 75,000 | | Husky Energy, Inc., 4.000%, 04/15/2024 | 77,505 |
| 100,000 | | Husky Oil Ltd., Deb., 7.550%, 11/15/2016 | 114,099 |
| 90,000 | | Petrobras Global Finance BV, Sr. Unsecd. Note, 4.375%, 05/20/2023 | 85,766 |
| 20,000 | | Petrobras International Finance Co., Sr. Unsecd. Note, 2.875%, 02/06/2015 | 20,213 |
| 50,000 | | Petrobras International Finance Co., Sr. Unsecd. Note, 5.375%, 01/27/2021 | 51,753 |
| 20,000 | | Phillips 66, Sr. Unsecd. Note, 1.950%, 03/05/2015 | 20,180 |
| 50,000 | | Phillips 66, Sr. Unsecd. Note, 4.300%, 04/01/2022 | 53,275 |
| | | TOTAL | 475,674 |
| | | Energy - Midstream—0.2% | |
| 75,000 | | Energy Transfer Partners LP, Sr. Unsecd. Note, 4.900%, 02/01/2024 | 80,304 |
| 10,000 | 2,3 | Florida Gas Transmission Co. LLC, Sr. Unsecd. Note, Series 144A, 5.450%, 07/15/2020 | 11,174 |
| 150,000 | | Kinder Morgan Energy Partners LP, Sr. Unsecd. Note, 5.000%, 03/01/2043 | 144,729 |
| 20,000 | 2,3 | Texas Eastern Transmission LP, Sr. Unsecd. Note, Series 144A, 2.800%, 10/15/2022 | 18,834 |
| 40,000 | | Williams Partners LP, 5.250%, 03/15/2020 | 44,776 |
| 30,000 | | Williams Partners LP, Sr. Unsecd. Note, 4.125%, 11/15/2020 | 31,782 |
| | | TOTAL | 331,599 |
| | | Energy - Oil Field Services—0.1% | |
| 15,000 | | Nabors Industries, Inc., Company Guarantee, 5.000%, 09/15/2020 | 16,693 |
| 20,000 | | Nabors Industries, Inc., Sr. Unsecd. Note, 4.625%, 09/15/2021 | 21,623 |
| 50,000 | | Nabors Industries, Inc., Sr. Unsecd. Note, 5.100%, 09/15/2023 | 54,898 |
| 15,000 | | Noble Holding International Ltd., Company Guarantee, 4.900%, 08/01/2020 | 16,408 |
| | | TOTAL | 109,622 |
| | | Energy - Refining—0.1% | |
| 10,000 | | Marathon Petroleum Corp., Sr. Unsecd. Note, 6.500%, 03/01/2041 | 12,186 |
| 30,000 | | Valero Energy Corp., 7.500%, 04/15/2032 | 39,978 |
| 10,000 | | Valero Energy Corp., 9.375%, 03/15/2019 | 13,003 |
Annual Shareholder Report
Shares or
Principal
Amount | | | Value |
| | | CORPORATE BONDS—continued | |
| | | Energy - Refining—continued | |
| $95,000 | | Valero Energy Corp., Sr. Unsecd. Note, 6.625%, 06/15/2037 | $116,058 |
| | | TOTAL | 181,225 |
| | | Financial Institution - Banking—2.8% | |
| 74,000 | | American Express Co., 2.650%, 12/02/2022 | 71,527 |
| 50,000 | | American Express Credit Corp., Sr. Unsecd. Note, Series MTN, 2.800%, 09/19/2016 | 51,969 |
| 40,000 | | Associated Banc-Corp., Sr. Unsecd. Note, 5.125%, 03/28/2016 | 42,392 |
| 50,000 | | BB&T Corp., Sr. Unsecd. Note, Series MTN, 2.250%, 02/01/2019 | 50,311 |
| 60,000 | | Bank of America Corp., Sr. Unsecd. Note, 4.500%, 04/01/2015 | 61,575 |
| 100,000 | | Bank of America Corp., Sr. Unsecd. Note, 5.000%, 05/13/2021 | 110,663 |
| 50,000 | | Bank of Montreal, Sr. Unsecd. Note, Series MTN, 1.450%, 04/09/2018 | 49,245 |
| 20,000 | | Citigroup, Inc., Sr. Unsecd. Note, 4.450%, 01/10/2017 | 21,461 |
| 100,000 | | Citigroup, Inc., Sr. Unsecd. Note, 4.587%, 12/15/2015 | 105,142 |
| 25,000 | | City National Corp., Sr. Unsecd. Note, 5.250%, 09/15/2020 | 27,895 |
| 30,000 | | Comerica, Inc., 3.800%, 7/22/2026 | 29,748 |
| 40,000 | 2,3 | Commonwealth Bank of Australia, Sr. Unsecd. Note, Series 144A, 3.750%, 10/15/2014 | 40,275 |
| 40,000 | | Deutsche Bank AG London, Sr. Unsecd. Note, 3.250%, 01/11/2016 | 41,405 |
| 200,000 | | Fifth Third Bancorp, Sr. Unsecd. Note, 1.350%, 06/01/2017 | 200,032 |
| 20,000 | | Fifth Third Bancorp, Sr. Unsecd. Note, 3.625%, 01/25/2016 | 20,829 |
| 275,000 | | Goldman Sachs Group, Inc., Sr. Unsecd. Note, 3.625%, 01/22/2023 | 273,543 |
| 70,000 | | Goldman Sachs Group, Inc., Sr. Unsecd. Note, 5.125%, 01/15/2015 | 71,430 |
| 25,000 | | Goldman Sachs Group, Inc., Sr. Unsecd. Note, 6.125%, 02/15/2033 | 30,005 |
| 30,000 | | Goldman Sachs Group, Inc., Sr. Unsecd. Note, 6.150%, 04/01/2018 | 34,138 |
| 150,000 | | Goldman Sachs Group, Inc., Sr. Unsecd. Note, 6.250%, 02/01/2041 | 181,431 |
| 50,000 | | HSBC Holdings PLC, Sr. Unsecd. Note, 5.100%, 04/05/2021 | 56,660 |
| 200,000 | | HSBC Holdings PLC, Sub. Note, 5.250%, 03/14/2044 | 212,877 |
| 150,000 | | HSBC USA, Inc., Sr. Unsecd. Note, 2.375%, 02/13/2015 | 151,574 |
| 250,000 | | Huntington National Bank, Sr. Unsecd. Note, 2.200%, 04/01/2019 | 249,154 |
| 175,000 | | JPMorgan Chase & Co., Sr. Unsecd. Note, 4.850%, 02/01/2044 | 183,235 |
| 400,000 | | JPMorgan Chase & Co., Sub. Note, 3.375%, 05/01/2023 | 389,236 |
| 250,000 | | Manufacturers & Traders T, Sr. Unsecd. Note, Series BKNT, 0.534%, 7/25/2017 | 250,032 |
| 65,000 | | Morgan Stanley, Sr. Unsecd. Note, 4.750%, 03/22/2017 | 70,404 |
| 150,000 | | Morgan Stanley, Sr. Unsecd. Note, 6.375%, 07/24/2042 | 189,200 |
| 175,000 | | Morgan Stanley, Sub. Note, 4.100%, 05/22/2023 | 175,784 |
| 20,000 | | Murray Street Investment Trust I, Sr. Unsecd. Note, 4.647%, 03/09/2017 | 21,541 |
Annual Shareholder Report
Shares or
Principal
Amount | | | Value |
| | | CORPORATE BONDS—continued | |
| | | Financial Institution - Banking—continued | |
| $100,000 | 2,3 | Santander US Debt SA Unipersonal, Bank Guarantee, Series 144A, 3.781%, 10/07/2015 | $103,040 |
| 30,000 | | Wachovia Corp., Sr. Unsecd. Note, 5.75%, 2/01/2018 | 34,032 |
| 70,000 | | Westpac Banking Corp., Sr. Unsecd. Note, 4.875%, 11/19/2019 | 78,604 |
| 100,000 | | Wilmington Trust Corp., Sub. Note, 8.500%, 04/02/2018 | 121,052 |
| | | TOTAL | 3,801,441 |
| | | Financial Institution - Broker/Asset Mgr/Exchange—0.3% | |
| 20,000 | 2,3 | CME Group Index Services LLC, Company Guarantee, Series 144A, 4.400%, 03/15/2018 | 21,776 |
| 80,000 | | Janus Capital Group, Inc., Sr. Note, 6.700%, 06/15/2017 | 90,075 |
| 40,000 | | Jefferies Group LLC, Sr. Unsecd. Note, 6.500%, 01/20/2043 | 45,165 |
| 125,000 | | Jefferies Group LLC, Sr. Unsecd. Note, 6.875%, 04/15/2021 | 148,400 |
| 13,000 | | Raymond James Financial, Inc., Sr. Unsecd. Note, 5.625%, 04/01/2024 | 14,580 |
| 50,000 | | TD Ameritrade Holding Corp., Company Guarantee, 4.150%, 12/01/2014 | 50,604 |
| | | TOTAL | 370,600 |
| | | Financial Institution - Finance Companies—0.2% | |
| 30,000 | | General Electric Capital Corp., Sr. Unsecd. Note, Series MTN, 3.100%, 01/09/2023 | 29,783 |
| 200,000 | 2,3 | ILFC E-Capital Trust I, Floating Rate Note - Sr. Sub Note, Series 144A, 5.020%, 12/21/2065 | 193,000 |
| | | TOTAL | 222,783 |
| | | Financial Institution - Insurance - Health—0.1% | |
| 50,000 | | UnitedHealth Group, Inc., Sr. Unsecd. Note, 6.000%, 02/15/2018 | 57,310 |
| 50,000 | | Wellpoint, Inc., 5.850%, 01/15/2036 | 59,312 |
| | | TOTAL | 116,622 |
| | | Financial Institution - Insurance - Life—0.7% | |
| 200,000 | | Aflac, Inc., Sr. Unsecd. Note, 3.625%, 06/15/2023 | 203,591 |
| 10,000 | | Aflac, Inc., Sr. Unsecd. Note, 6.900%, 12/17/2039 | 13,315 |
| 25,000 | | American International Group, 4.5%, 7/16/2044 | 24,763 |
| 35,000 | | American International Group, Inc., Sr. Unsecd. Note, 4.125%, 02/15/2024 | 36,476 |
| 150,000 | | American International Group, Inc., Sr. Unsecd. Note, 6.250%, 05/01/2036 | 186,432 |
| 10,000 | | Lincoln National Corp., Sr. Unsecd. Note, 4.200%, 03/15/2022 | 10,623 |
| 10,000 | | MetLife, Inc., Jr. Sub. Note, 10.75%, 8/01/2039 | 16,088 |
| 250,000 | | MetLife, Inc., Sr. Unsecd. Note, 3.600%, 04/10/2024 | 253,811 |
| 15,000 | 2,3 | Penn Mutual Life Insurance Co., Sr. Note, Series 144A, 7.625%, 06/15/2040 | 20,370 |
Annual Shareholder Report
Shares or
Principal
Amount | | | Value |
| | | CORPORATE BONDS—continued | |
| | | Financial Institution - Insurance - Life—continued | |
| $10,000 | | Principal Financial Group, Inc., Sr. Unsecd. Note, 3.125%, 05/15/2023 | $9,727 |
| 10,000 | | Principal Financial Group, Inc., Sr. Unsecd. Note, 3.300%, 09/15/2022 | 9,938 |
| 150,000 | | Prudential Financial, Inc., Sr. Unsecd. Note, Series MTN, 5.625%, 05/12/2041 | 174,075 |
| 50,000 | | Prudential Financial, Inc., Sr. Unsecd. Note, Series MTN, 6.200%, 11/15/2040 | 62,405 |
| | | TOTAL | 1,021,614 |
| | | Financial Institution - Insurance - P&C—0.3% | |
| 90,000 | | ACE INA Holdings, Inc., 5.600%, 05/15/2015 | 93,571 |
| 1,000 | | ACE INA Holdings, Inc., Sr. Note, 5.700%, 02/15/2017 | 1,112 |
| 75,000 | | CNA Financial Corp., 6.500%, 08/15/2016 | 83,129 |
| 30,000 | | CNA Financial Corp., Sr. Unsecd. Note, 7.350%, 11/15/2019 | 36,749 |
| 20,000 | | Chubb Corp., Sr. Note, 5.750%, 05/15/2018 | 22,757 |
| 100,000 | 2,3 | Liberty Mutual Group, Inc., Series 144A, 4.85%, 8/01/2044 | 99,602 |
| 65,000 | 2,3 | Nationwide Mutual Insurance Co., Sub. Note, Series 144A, 9.375%, 08/15/2039 | 101,566 |
| 50,000 | | The Travelers Cos., Inc., Sr. Unsecd. Note, 5.500%, 12/01/2015 | 53,222 |
| | | TOTAL | 491,708 |
| | | Financial Institution - REIT - Apartment—0.0% | |
| 15,000 | | Avalonbay Communities, Inc., Sr. Unsecd. Note, Series MTN, 5.700%, 03/15/2017 | 16,675 |
| 20,000 | | Post Apartment Homes LP, Sr. Unsecd. Note, 3.375%, 12/01/2022 | 19,456 |
| 10,000 | | UDR, Inc., Company Guarantee, 4.625%, 01/10/2022 | 10,816 |
| | | TOTAL | 46,947 |
| | | Financial Institution - REIT - Healthcare—0.1% | |
| 40,000 | | Health Care REIT, Inc., Sr. Unsecd. Note, 6.125%, 04/15/2020 | 46,345 |
| 50,000 | | Healthcare Trust of America, 3.700%, 04/15/2023 | 49,128 |
| | | TOTAL | 95,473 |
| | | Financial Institution - REIT - Office—0.1% | |
| 50,000 | | Alexandria Real Estate Equities, Inc., Sr. Unsecd. Note, 3.900%, 06/15/2023 | 49,671 |
| 50,000 | | Alexandria Real Estate Equities, Inc., Sr. Unsecd. Note, 4.600%, 04/01/2022 | 52,698 |
| 55,000 | | Boston Properties LP, Sr. Unsecd. Note, 5.875%, 10/15/2019 | 63,809 |
| | | TOTAL | 166,178 |
| | | Financial Institution - REIT - Other—0.1% | |
| 75,000 | | Liberty Property LP, 6.625%, 10/01/2017 | 85,323 |
| 50,000 | | ProLogis LP, Sr. Unsecd. Note, 3.350%, 02/01/2021 | 50,431 |
Annual Shareholder Report
Shares or
Principal
Amount | | | Value |
| | | CORPORATE BONDS—continued | |
| | | Financial Institution - REIT - Other—continued | |
| $75,000 | | WP Carey, Inc., Sr. Unsecd. Note, 4.600%, 04/01/2024 | $77,379 |
| | | TOTAL | 213,133 |
| | | Financial Institution - REIT - Retail—0.1% | |
| 20,000 | | Equity One, Inc., Bond, 6.000%, 09/15/2017 | 22,251 |
| 20,000 | | Regency Centers LP, Company Guarantee, 4.800%, 04/15/2021 | 21,866 |
| 30,000 | | Tanger Properties LP, Sr. Unsecd. Note, 6.125%, 06/01/2020 | 34,926 |
| | | TOTAL | 79,043 |
| | | Sovereign—0.0% | |
| 30,000 | | Corp Andina De Fomento, Sr. Unsecd. Note, 4.375%, 06/15/2022 | 32,100 |
| | | Technology—0.3% | |
| 15,000 | | Agilent Technologies, Inc., Sr. Unsecd. Note, 3.200%, 10/01/2022 | 14,488 |
| 45,000 | | Apple, Inc., Sr. Unsecd. Note, 1.000%, 05/03/2018 | 44,044 |
| 30,000 | | Apple, Inc., Sr. Unsecd. Note, 2.400%, 05/03/2023 | 28,361 |
| 60,000 | | Cisco Systems, Inc., Sr. Unsecd. Note, 5.500%, 02/22/2016 | 64,559 |
| 20,000 | | Corning, Inc., Unsecd. Note, 4.750%, 03/15/2042 | 21,217 |
| 100,000 | | Fidelity National Information Services, Inc., Sr. Unsecd. Note, 3.500%, 04/15/2023 | 98,606 |
| 20,000 | | Hewlett-Packard Co., Sr. Unsecd. Note, 3.300%, 12/09/2016 | 20,967 |
| 20,000 | | Ingram Micro, Inc., Sr. Unsecd. Note, 5.000%, 08/10/2022 | 20,919 |
| 25,000 | | Juniper Networks, Inc., Sr. Unsecd. Note, 4.500%, 03/15/2024 | 25,820 |
| 10,000 | | Juniper Networks, Inc., Sr. Unsecd. Note, 5.950%, 03/15/2041 | 10,908 |
| 10,000 | | Verisk Analytics, Inc., Sr. Unsecd. Note, 4.125%, 09/12/2022 | 10,303 |
| 25,000 | | Verisk Analytics, Inc., Sr. Unsecd. Note, 4.875%, 01/15/2019 | 26,818 |
| 20,000 | | Xerox Corp., Sr. Unsecd. Note, 2.950%, 03/15/2017 | 20,811 |
| | | TOTAL | 407,821 |
| | | Transportation - Airlines—0.1% | |
| 130,000 | | Southwest Airlines Co., Sr. Unsecd. Note, 5.125%, 03/01/2017 | 141,111 |
| | | Transportation - Railroads—0.1% | |
| 75,000 | | Burlington Northern Santa Fe Corp., 4.875%, 01/15/2015 | 76,512 |
| 50,000 | | Burlington Northern Santa Fe Corp., Deb., 5.750%, 05/01/2040 | 59,913 |
| 30,000 | | Kansas City Southern de Mexico SA de CV, Sr. Unsecd. Note, 3.000%, 05/15/2023 | 28,422 |
| | | TOTAL | 164,847 |
| | | Transportation - Services—0.2% | |
| 90,000 | 2,3 | Enterprise Rent-A-Car USA Finance Co., Series 144A, 6.375%, 10/15/2017 | 103,166 |
| 50,000 | | Ryder System, Inc., Sr. Unsecd. Note, Series MTN, 2.450%, 11/15/2018 | 50,635 |
| 60,000 | | Ryder System, Inc., Sr. Unsecd. Note, Series MTN, 3.150%, 03/02/2015 | 60,929 |
Annual Shareholder Report
Shares or
Principal
Amount | | | Value |
| | | CORPORATE BONDS—continued | |
| | | Transportation - Services—continued | |
| $30,000 | | United Parcel Service, Inc., Sr. Unsecd. Note, 3.125%, 01/15/2021 | $31,130 |
| | | TOTAL | 245,860 |
| | | Utility - Electric—0.6% | |
| 70,000 | | Appalachian Power Co., Sr. Unsecd. Note, 7.950%, 01/15/2020 | 88,656 |
| 100,000 | | Cleveland Electric Illuminating Co., Sr. Unsecd. Note, 5.950%, 12/15/2036 | 114,041 |
| 5,000 | | Consolidated Edison Co., Sr. Unsecd. Note, 6.650%, 04/01/2019 | 5,980 |
| 70,000 | 2,3 | Electricite de France SA, Note, Series 144A, 5.600%, 01/27/2040 | 80,001 |
| 100,000 | | Exelon Generation Co. LLC, Sr. Unsecd. Note, 4.250%, 06/15/2022 | 103,799 |
| 25,000 | | FirstEnergy Corp., Sr. Unsecd. Note, 4.250%, 03/15/2023 | 24,842 |
| 30,000 | | FirstEnergy Solutions Corp., Company Guarantee, 6.050%, 08/15/2021 | 33,101 |
| 10,000 | | Great Plains Energy, Inc., Note, 4.850%, 06/01/2021 | 11,024 |
| 14,571 | 2,3 | Great River Energy, 1st Mtg. Note, Series 144A, 5.829%, 7/01/2017 | 15,797 |
| 25,000 | | National Rural Utilities Cooperative Finance Corp., Sr. Unsecd. Note, 8.000%, 03/01/2032 | 36,213 |
| 50,000 | | NextEra Energy Capital Holdings, Inc., Sr. Unsecd. Note, 2.700%, 09/15/2019 | 50,725 |
| 80,000 | | Northern States Power Co., MN, 1st Mtg. Bond, 5.250%, 03/01/2018 | 89,428 |
| 25,000 | | PSEG Power LLC, Sr. Unsecd. Note, 4.300%, 11/15/2023 | 26,031 |
| 75,000 | | PSI Energy, Inc., Bond, 6.050%, 06/15/2016 | 81,992 |
| 50,000 | | Progress Energy, Inc., 7.050%, 03/15/2019 | 60,329 |
| 10,000 | | TECO Finance, Inc., Company Guarantee, 5.150%, 03/15/2020 | 11,214 |
| 40,000 | | UIL Holdings Corp., Sr. Unsecd. Note, 4.625%, 10/01/2020 | 41,770 |
| | | TOTAL | 874,943 |
| | | Utility - Natural Gas—0.2% | |
| 20,000 | | Atmos Energy Corp., 8.500%, 03/15/2019 | 25,377 |
| 50,000 | | Enbridge Energy Partners LP, Sr. Unsecd. Note, 4.200%, 09/15/2021 | 53,096 |
| 40,000 | | Enbridge, Inc., Sr. Note, 5.600%, 04/01/2017 | 44,326 |
| 65,000 | | National Fuel Gas Co., Sr. Unsecd. Note, 3.750%, 03/01/2023 | 64,023 |
| 55,000 | | Sempra Energy, Sr. Unsecd. Note, 6.500%, 06/01/2016 | 60,478 |
| | | TOTAL | 247,300 |
| | | TOTAL CORPORATE BONDS
(IDENTIFIED COST $16,039,673) | 16,927,348 |
| | | FOREIGN GOVERNMENTS/AGENCY—0.1% | |
| | | Sovereign—0.1% | |
| 75,000 | | United Mexican States, 6.625%, 03/03/2015
(IDENTIFIED COST $75,639) | 77,137 |
Annual Shareholder Report
Shares or
Principal
Amount | | | Value |
| | | MORTGAGE-BACKED SECURITIES—0.0% | |
| | | Federal National Mortgage Association—0.0% | |
| $121 | | Federal National Mortgage Association Pool 512255, 7.500%, 9/1/2014 | $121 |
| 3,531 | | Federal National Mortgage Association Pool 609554, 7.500%, 10/1/2016 | 3,732 |
| | | TOTAL MORTGAGE-BACKED SECURITIES
(IDENTIFIED COST $3,788) | 3,853 |
| | | MUNICIPAL BOND—0.1% | |
| | | Municipal Services—0.1% | |
| 70,000 | | Chicago, IL Metropolitan Water Reclamation District, Direct Payment Taxable Limited GO Build America Bonds, 5.720%, 12/01/2038
(IDENTIFIED COST $70,000) | 83,831 |
| | | U.S. TREASURY—2.0% | |
| 255,165 | | U.S. Treasury Inflation-Protected Bond, 1.375%, 2/15/2044 | 282,326 |
| 525,490 | | U.S. Treasury Inflation-Protected Note, 0.125%, 1/15/2022 | 525,752 |
| 150,000 | | United States Treasury Bond, 3.375%, 5/15/2044 | 151,500 |
| 50,000 | | United States Treasury Bond, 3.625%, 2/15/2044 | 52,913 |
| 100,000 | | United States Treasury Note, 0.375%, 3/31/2016 | 99,994 |
| 650,000 | 4 | United States Treasury Note, 0.875%, 11/30/2016 | 652,444 |
| 500,000 | | United States Treasury Note, 1.250%, 10/31/2018 | 493,115 |
| 500,000 | | United States Treasury Note, 3.500%, 5/15/2020 | 542,748 |
| | | TOTAL U.S. TREASURY
(IDENTIFIED COST $2,833,306) | 2,800,792 |
| | | EXCHANGE-TRADED FUND—8.2% | |
| 173,500 | | iShares MSCI EAFE ETF
(IDENTIFIED COST $9,998,277) | 11,553,365 |
| | | INVESTMENT COMPANIES—16.9%5 | |
| 32,075 | | Emerging Markets Fixed Income Core Fund | 1,144,502 |
| 978,522 | | Federated Mortgage Core Portfolio | 9,648,225 |
| 7,716,911 | 6 | Federated Prime Value Obligations Fund, Institutional Shares, 0.07% | 7,716,911 |
| 185,252 | | Federated Project and Trade Finance Core Fund | 1,783,981 |
| 523,412 | | High Yield Bond Portfolio | 3,449,285 |
| | | TOTAL INVESTMENT COMPANIES
(IDENTIFIED COST $23,976,890) | 23,742,904 |
| | | TOTAL INVESTMENTS—99.8%
(IDENTIFIED COST $119,705,870)7 | 139,983,611 |
| | | OTHER ASSETS AND LIABILITIES - NET—0.2%8 | 303,903 |
| | | TOTAL NET ASSETS—100% | $140,287,514 |
Annual Shareholder Report
At July 31, 2014, the Fund had the following outstanding futures contracts:
| Description | Number of
Contracts | Notional
Value | Expiration
Date | Unrealized
Appreciation/
(Depreciation) |
| 1United States Treasury Long Bond Long Futures | 3 | $412,219 | September 2014 | $4,493 |
| 1United States Treasury Bond Ultra Long Futures | 2 | $301,688 | September 2014 | $6,996 |
| 1United States Treasury Note 2-Year Long Futures | 44 | $9,654,563 | September 2014 | $(6,141) |
| 1United States Treasury Note 5-Year Short Futures | 35 | $4,159,258 | September 2014 | $26,171 |
| 1United States Treasury Note 10-Year Short Futures | 45 | $5,607,422 | September 2014 | $16,227 |
| NET UNREALIZED APPRECIATION ON FUTURES CONTRACTS | $47,746 |
Net Unrealized Appreciation on Futures Contracts is included in “Other Assets and Liabilities—Net.”
| 1 | Non-income-producing security. |
| 2 | Denotes a restricted security that either: (a) cannot be offered for public sale without first being registered, or being able to take advantage of an exemption from registration, under the Securities Act of 1933; or (b) is subject to a contractual restriction on public sales. At July 31, 2014, these restricted securities amounted to $2,658,877, which represented 1.9% of total net assets. |
| 3 | Denotes a restricted security that may be resold without restriction to “qualified institutional buyers” as defined in Rule 144A under the Securities Act of 1933 and that the Fund has determined to be liquid under criteria established by the Fund's Board of Trustees (the “Trustees”). At July 31, 2014, these liquid restricted securities amounted to $2,442,773, which represented 1.7% of total net assets. |
| 4 | All or a portion of this security is pledged as collateral to ensure the Fund is able to satisfy the obligations of its outstanding futures contracts. |
| 5 | Affiliated holdings. |
| 6 | 7-day net yield. |
| 7 | The cost of investments for federal tax purposes amounts to $119,453,107. |
| 8 | Assets, other than investments in securities, less liabilities. See Statement of Assets and Liabilities. |
Note: The categories of investments are shown as a percentage of total net assets at July 31, 2014.
Various inputs are used in determining the value of the Fund's investments. These inputs are summarized in the three broad levels listed below:
Level 1—quoted prices in active markets for identical securities, including investment companies with daily net asset values, if applicable.
Level 2—other significant observable inputs (including quoted prices for similar securities, interest rates, prepayment speeds, credit risk, etc.). Also includes securities valued at amortized cost.
Level 3—significant unobservable inputs (including the Fund's own assumptions in determining the fair value of investments).
The inputs or methodology used for valuing securities are not an indication of the risk associated with investing in those securities.
Annual Shareholder Report
The following is a summary of the inputs used, as of July 31, 2014, in valuing the Fund's assets carried at fair value:
| Valuation Inputs |
| | Level 1—
Quoted
Prices and
Investments
in Certain
Investment
Companies | Level 2—
Other
Significant
Observable
Inputs | Level 3—
Significant
Unobservable
Inputs | Total |
| Equity Securities: | | | | |
| Common Stocks | | | | |
| Domestic | $78,518,311 | $— | $— | $78,518,311 |
| International | 3,052,079 | — | — | 3,052,079 |
| Debt Securities: | | | | |
| Asset-Backed Securities | — | 1,653,995 | — | 1,653,995 |
| Collateralized Mortgage Obligations | — | 1,569,996 | — | 1,569,996 |
| Corporate Bonds | — | 16,927,348 | — | 16,927,348 |
| Foreign Government/Agency | — | 77,137 | — | 77,137 |
| Mortgage-Backed Securities | — | 3,853 | — | 3,853 |
| Municipal Bond | — | 83,831 | — | 83,831 |
| U.S. Treasury | — | 2,800,792 | — | 2,800,792 |
| Exchange-Traded Fund | 11,553,365 | — | — | 11,553,365 |
| Investment Companies1 | 21,958,923 | 1,783,981 | — | 23,742,904 |
| TOTAL SECURITIES | $115,082,678 | $24,900,933 | $— | $139,983,611 |
| OTHER FINANCIAL INSTRUMENTS2 | $47,746 | $— | $— | $47,746 |
| 1 | Emerging Markets Fixed Income Core Fund, Federated Mortgage Core Portfolio, Federated Project and Trade Finance Core Fund and High Yield Bond Portfolio are affiliated holdings offered only to registered investment companies and other accredited investors. Federated Project and Trade Finance Core Fund is classified as Level 2 due to the fact that the price of shares redeemed will be determined as of the closing net asset value (the NAV) of the fund up to twenty-four days after receipt of a shareholder redemption request. |
| 2 | Other financial instruments include futures contracts. |
The following acronyms are used throughout this portfolio:
| GO | —General Obligation |
| MTN | —Medium Term Note |
| REIT | —Real Estate Investments Trust |
| REMIC | —Real Estate Mortgage Investment Conduit |
See Notes which are an integral part of the Financial Statements
Annual Shareholder Report
Financial Highlights–Class A Shares
(For a Share Outstanding Throughout Each Period)
| Year Ended July 31 | 2014 | 2013 | 2012 | 2011 | 2010 |
| Net Asset Value, Beginning of Period | $14.35 | $12.20 | $12.17 | $10.86 | $10.17 |
| Income From Investment Operations: | | | | | |
| Net investment income | 0.171 | 0.141 | 0.171 | 0.151 | 0.161 |
| Net realized and unrealized gain on investments, futures contracts, swap contracts and foreign currency transactions | 1.70 | 2.19 | 0.02 | 1.33 | 0.71 |
| TOTAL FROM INVESTMENT OPERATIONS | 1.87 | 2.33 | 0.19 | 1.48 | 0.87 |
| Less Distributions: | | | | | |
| Distributions from net investment income | (0.15) | (0.18) | (0.16) | (0.17) | (0.18) |
| Net Asset Value, End of Period | $16.07 | $14.35 | $12.20 | $12.17 | $10.86 |
| Total Return2 | 13.06% | 19.28% | 1.65% | 13.67% | 8.51% |
| Ratios to Average Net Assets: | | | | | |
| Net expenses | 1.30% | 1.30% | 1.30% | 1.28% | 1.21% |
| Net investment income | 1.10% | 1.10% | 1.43% | 1.27% | 1.47% |
| Expense waiver/reimbursement3 | 0.10% | 0.11% | 0.28% | 0.23% | 0.25% |
| Supplemental Data: | | | | | |
| Net assets, end of period (000 omitted) | $55,634 | $50,340 | $48,774 | $57,358 | $86,018 |
| Portfolio turnover | 34% | 105% | 149% | 139% | 130% |
| 1 | Per share numbers have been calculated using the average shares method. |
| 2 | Based on net asset value, which does not reflect the sales charge, redemption fee or contingent deferred sales charge, if applicable. |
| 3 | This expense decrease is reflected in both the net expense and the net investment income ratios shown above. |
See Notes which are an integral part of the Financial Statements
Annual Shareholder Report
Financial Highlights–Class C Shares
(For a Share Outstanding Throughout Each Period)
| Year Ended July 31 | 2014 | 2013 | 2012 | 2011 | 2010 |
| Net Asset Value, Beginning of Period | $14.16 | $12.03 | $11.99 | $10.70 | $10.03 |
| Income From Investment Operations: | | | | | |
| Net investment income | 0.051 | 0.041 | 0.081 | 0.061 | 0.081 |
| Net realized and unrealized gain on investments, futures contracts, swap contracts and foreign currency transactions | 1.67 | 2.16 | 0.03 | 1.31 | 0.69 |
| TOTAL FROM INVESTMENT OPERATIONS | 1.72 | 2.20 | 0.11 | 1.37 | 0.77 |
| Less Distributions: | | | | | |
| Distributions from net investment income | (0.04) | (0.07) | (0.07) | (0.08) | (0.10) |
| Net Asset Value, End of Period | $15.84 | $14.16 | $12.03 | $11.99 | $10.70 |
| Total Return2 | 12.14% | 18.41% | 0.93% | 12.85% | 7.63% |
| Ratios to Average Net Assets: | | | | | |
| Net expenses | 2.05% | 2.05% | 2.05% | 2.04% | 1.96% |
| Net investment income | 0.34% | 0.36% | 0.68% | 0.52% | 0.71% |
| Expense waiver/reimbursement3 | 0.07% | 0.08% | 0.24% | 0.19% | 0.22% |
| Supplemental Data: | | | | | |
| Net assets, end of period (000 omitted) | $34,522 | $35,450 | $34,193 | $45,512 | $49,907 |
| Portfolio turnover | 34% | 105% | 149% | 139% | 130% |
| 1 | Per share numbers have been calculated using the average shares method. |
| 2 | Based on net asset value, which does not reflect the sales charge, redemption fee or contingent deferred sales charge, if applicable. |
| 3 | This expense decrease is reflected in both the net expense and the net investment income ratios shown above. |
See Notes which are an integral part of the Financial Statements
Annual Shareholder Report
Financial Highlights–Class R Shares
(For a Share Outstanding Throughout Each Period)
| Year Ended July 31 | 2014 | 2013 | 2012 | 2011 | 2010 |
| Net Asset Value, Beginning of Period | $14.33 | $12.17 | $12.12 | $10.83 | $10.14 |
| Income From Investment Operations: | | | | | |
| Net investment income | 0.131 | 0.091 | 0.111 | 0.091 | 0.101 |
| Net realized and unrealized gain on investments, futures contracts, swap contracts and foreign currency transactions | 1.69 | 2.19 | 0.03 | 1.32 | 0.72 |
| TOTAL FROM INVESTMENT OPERATIONS | 1.82 | 2.28 | 0.14 | 1.41 | 0.82 |
| Less Distributions: | | | | | |
| Distributions from net investment income | (0.10) | (0.12) | (0.09) | (0.12) | (0.13) |
| Net Asset Value, End of Period | $16.05 | $14.33 | $12.17 | $12.12 | $10.83 |
| Total Return2 | 12.72% | 18.84% | 1.19% | 13.08% | 8.01% |
| Ratios to Average Net Assets: | | | | | |
| Net expenses | 1.57% | 1.69% | 1.80% | 1.79% | 1.70% |
| Net investment income | 0.84% | 0.70% | 0.93% | 0.77% | 0.96% |
| Expense waiver/reimbursement3 | 0.05% | 0.06% | 0.22% | 0.17% | 0.21% |
| Supplemental Data: | | | | | |
| Net assets, end of period (000 omitted) | $464 | $417 | $526 | $665 | $673 |
| Portfolio turnover | 34% | 105% | 149% | 139% | 130% |
| 1 | Per share numbers have been calculated using the average shares method. |
| 2 | Based on net asset value. |
| 3 | This expense decrease is reflected in both the net expense and the net investment income ratios shown above. |
See Notes which are an integral part of the Financial Statements
Annual Shareholder Report
Financial Highlights–Institutional Shares
(For a Share Outstanding Throughout Each Period)
| Year Ended July 31 | 2014 | 2013 | 2012 | 2011 | 2010 |
| Net Asset Value, Beginning of Period | $14.39 | $12.23 | $12.21 | $10.90 | $10.21 |
| Income From Investment Operations: | | | | | |
| Net investment income | 0.211 | 0.181 | 0.201 | 0.181 | 0.191 |
| Net realized and unrealized gain on investments, futures contracts, swap contracts and foreign currency transactions | 1.69 | 2.19 | 0.02 | 1.34 | 0.71 |
| TOTAL FROM INVESTMENT OPERATIONS | 1.90 | 2.37 | 0.22 | 1.52 | 0.90 |
| Less Distributions: | | | | | |
| Distributions from net investment income | (0.18) | (0.21) | (0.20) | (0.21) | (0.21) |
| Net Asset Value, End of Period | $16.11 | $14.39 | $12.23 | $12.21 | $10.90 |
| Total Return2 | 13.30% | 19.63% | 1.87% | 13.99% | 8.74% |
| Ratios to Average Net Assets: | | | | | |
| Net expenses | 1.05% | 1.05% | 1.05% | 1.04% | 0.96% |
| Net investment income | 1.35% | 1.35% | 1.69% | 1.52% | 1.71% |
| Expense waiver/reimbursement3 | 0.06% | 0.07% | 0.23% | 0.18% | 0.21% |
| Supplemental Data: | | | | | |
| Net assets, end of period (000 omitted) | $49,667 | $46,365 | $43,341 | $47,473 | $49,127 |
| Portfolio turnover | 34% | 105% | 149% | 139% | 130% |
| 1 | Per share numbers have been calculated using the average shares method. |
| 2 | Based on net asset value. |
| 3 | This expense decrease is reflected in both the net expense and the net investment income ratios shown above. |
See Notes which are an integral part of the Financial Statements
Annual Shareholder Report
Statement of Assets and Liabilities
July 31, 2014
| Assets: | | |
| Total investment in securities, at value including $23,742,904 of investment in affiliated holdings (Note 5) (identified cost $119,705,870) | | $139,983,611 |
| Income receivable | | 281,257 |
| Receivable for investments sold | | 597,289 |
| Receivable for shares sold | | 54,265 |
| Receivable for daily variation margin | | 5,672 |
| TOTAL ASSETS | | 140,922,094 |
| Liabilities: | | |
| Payable for investments purchased | $349,017 | |
| Payable for shares redeemed | 96,720 | |
| Payable for transfer agent fee (Note 2) | 28,628 | |
| Payable for auditing fees | 29,400 | |
| Payable for portfolio accounting fees | 18,366 | |
| Payable for distribution services fee (Note 5) | 22,823 | |
| Payable for other service fees (Notes 2 and 5) | 48,633 | |
| Payable for share registration costs | 32,987 | |
| Accrued expenses (Note 5) | 8,006 | |
| TOTAL LIABILITIES | | 634,580 |
| Net assets for 8,752,605 shares outstanding | | $140,287,514 |
| Net Assets Consist of: | | |
| Paid-in capital | | $151,956,946 |
| Net unrealized appreciation of investments and futures contracts | | 20,325,487 |
| Accumulated net realized loss on investments and futures contracts | | (32,908,735) |
| Undistributed net investment income | | 913,816 |
| TOTAL NET ASSETS | | $140,287,514 |
Annual Shareholder Report
Statement of Assets and Liabilities–continued
| Net Asset Value, Offering Price and Redemption Proceeds Per Share | | |
| Class A Shares: | | |
| Net asset value per share ($55,634,052 ÷ 3,462,394 shares outstanding), no par value, unlimited shares authorized | | $16.07 |
| Offering price per share (100/94.50 of $16.07) | | $17.01 |
| Redemption proceeds per share | | $16.07 |
| Class C Shares: | | |
| Net asset value per share ($34,521,886 ÷ 2,178,825 shares outstanding), no par value, unlimited shares authorized | | $15.84 |
| Offering price per share | | $15.84 |
| Redemption proceeds per share (99.00/100 of $15.84) | | $15.68 |
| Class R Shares: | | |
Net asset value per share ($464,260 ÷ 28,920 shares outstanding), no par
value, unlimited shares authorized | | $16.05 |
| Offering price per share | | $16.05 |
| Redemption proceeds per share | | $16.05 |
| Institutional Shares: | | |
| Net asset value per share ($49,667,316 ÷ 3,082,466 shares outstanding), no par value, unlimited shares authorized | | $16.11 |
| Offering price per share | | $16.11 |
| Redemption proceeds per share | | $16.11 |
See Notes which are an integral part of the Financial Statements
Annual Shareholder Report
Statement of Operations
Year Ended July 31, 2014
| Investment Income: | | | |
| Dividends (including $612,136 received from affiliated holdings (Note 5)) | | | $2,423,064 |
| Interest | | | 786,882 |
| Investment income allocated from affiliated partnership (Note 5) | | | 98,621 |
| TOTAL INCOME | | | 3,308,567 |
| Expenses: | | | |
| Investment adviser fee (Note 5) | | $1,031,931 | |
| Administrative fee (Note 5) | | 107,482 | |
| Custodian fees | | 25,580 | |
| Transfer agent fee (Note 2) | | 140,620 | |
| Directors'/Trustees' fees (Note 5) | | 1,716 | |
| Auditing fees | | 29,401 | |
| Legal fees | | 14,057 | |
| Portfolio accounting fees | | 111,169 | |
| Distribution services fee (Note 5) | | 269,514 | |
| Other service fees (Notes 2 and 5) | | 214,247 | |
| Share registration costs | | 52,472 | |
| Printing and postage | | 37,857 | |
| Miscellaneous (Note 5) | | 16,203 | |
| TOTAL EXPENSES | | 2,052,249 | |
Annual Shareholder Report
Statement of Operations–continued
| Waiver and Reimbursements: | | | |
| Waiver/reimbursement of investment adviser fee (Note 5) | $(66,761) | | |
| Reimbursement of other operating expenses (Notes 2 and 5) | (42,623) | | |
| TOTAL WAIVER AND REIMBURSEMENTS | | (109,384) | |
| Net expenses | | | 1,942,865 |
| Net investment income | | | 1,365,702 |
| Realized and Unrealized Gain (Loss) on Investments and Futures Contracts: | | | |
| Net realized gain on investments (including realized gain of $389,971 on sales of investments in affiliated holdings (Note 5)) | | | $8,494,569 |
| Net realized loss on futures contracts | | | (308,948) |
| Net realized gain on investments, futures contracts, swap contracts and foreign currency transactions allocated from affiliated partnership (Note 5) | | | 24,420 |
| Realized gain distribution from affiliated investment company shares (Note 5) | | | 38,424 |
| Net change in unrealized appreciation of investments | | | 6,823,007 |
| Net change in unrealized depreciation of futures contracts | | | 160,107 |
| Net realized and unrealized gain on investments and futures contracts | | | 15,231,579 |
| Change in net assets resulting from operations | | | $16,597,281 |
See Notes which are an integral part of the Financial Statements
Annual Shareholder Report
Statement of Changes in Net Assets
| Year Ended July 31 | 2014 | 2013 |
| Increase (Decrease) in Net Assets | | |
| Operations: | | |
| Net investment income | $1,365,702 | $1,266,929 |
| Net realized gain on investments including allocations from partnership and futures contracts | 8,248,465 | 15,112,927 |
| Net change in unrealized appreciation/depreciation of investments and futures contracts | 6,983,114 | 6,259,259 |
| CHANGE IN NET ASSETS RESULTING FROM OPERATIONS | 16,597,281 | 22,639,115 |
| Distributions to Shareholders: | | |
| Distributions from net investment income | | |
| Class A Shares | (505,105) | (667,680) |
| Class C Shares | (91,490) | (196,512) |
| Class R Shares | (2,791) | (4,965) |
| Institutional Shares | (583,702) | (706,650) |
| CHANGE IN NET ASSETS RESULTING FROM DISTRIBUTIONS TO SHAREHOLDERS | (1,183,088) | (1,575,807) |
| Share Transactions: | | |
| Proceeds from sale of shares | 15,880,319 | 11,415,128 |
| Net asset value of shares issued to shareholders in payment of distributions declared | 1,085,218 | 1,433,859 |
| Cost of shares redeemed | (24,662,752) | (28,175,403) |
| CHANGE IN NET ASSETS RESULTING FROM SHARE TRANSACTIONS | (7,697,215) | (15,326,416) |
| Change in net assets | 7,716,978 | 5,736,892 |
| Net Assets: | | |
| Beginning of period | 132,570,536 | 126,833,644 |
| End of period (including undistributed net investment income of $913,816 and $734,024, respectively) | $140,287,514 | $132,570,536 |
See Notes which are an integral part of the Financial Statements
Annual Shareholder Report
Notes to Financial Statements
July 31, 2014
1. ORGANIZATION
Federated MDT Series (the “Trust”) is registered under the Investment Company Act of 1940, as amended (the “Act”), as an open-end management investment company. The Trust consists of five portfolios. The financial statements included herein are only those of Federated MDT Balanced Fund (the “Fund”), a diversified portfolio. The financial statements of the other portfolios are presented separately. The assets of each portfolio are segregated and a shareholder's interest is limited to the portfolio in which shares are held. Each portfolio pays its own expenses. The Fund offers four classes of shares: Class A Shares, Class C Shares, Class R Shares and Institutional Shares. All shares of the Fund have equal rights with respect to voting, except on class-specific matters. The investment objective of the Fund is the possibility of long-term growth of capital and income.
2. SIGNIFICANT ACCOUNTING POLICIES
The following is a summary of significant accounting policies consistently followed by the Fund in the preparation of its financial statements. These policies are in conformity with U.S. generally accepted accounting principles (GAAP).
Investment Valuation
In calculating its net asset value (NAV), the Fund generally values investments as follows:
| ■ | Equity securities listed on an exchange or traded through a regulated market system are valued at their last reported sale price or official closing price in their principal exchange or market. |
| ■ | Fixed-income securities acquired with remaining maturities greater than 60 days are fair valued using price evaluations provided by a pricing service approved by the Trustees. |
| ■ | Fixed-income securities and repurchase agreements acquired with remaining maturities of 60 days or less are valued at their amortized cost (adjusted for the accretion of any discount or amortization of any premium), unless the issuer's creditworthiness is impaired or other factors indicate that amortized cost is not an accurate estimate of the investment's fair value, in which case it would be valued in the same manner as a longer-term security. |
| ■ | Shares of other mutual funds or non-exchange-traded investment companies are valued based upon their reported NAVs. |
| ■ | Derivative contracts listed on exchanges are valued at their reported settlement or closing price. |
| ■ | Over-the-counter (OTC) derivative contracts are fair valued using price evaluations provided by a pricing service approved by the Trustees. |
| ■ | For securities that are fair valued in accordance with procedures established by and under the general supervision of the Trustees, certain factors may be considered such as: the purchase price of the security, information obtained by contacting the issuer, analysis of the issuer's financial statements or other available documents, fundamental analytical data, the nature and duration of restrictions on disposition, the movement of the market in which the security is normally traded and public trading in similar securities of the issuer or comparable issuers. |
If the Fund cannot obtain a price or price evaluation from a pricing service for an investment, the Fund may attempt to value the investment based upon the mean of bid and asked quotations or fair value the investment based on price evaluations, from one or more dealers. If any price, quotation, price evaluation or other pricing source is not readily available when the
Annual Shareholder Report
NAV is calculated, or if the Fund cannot obtain price evaluations from a pricing service or from more than one dealer for an investment within a reasonable period of time as set forth in the Fund's valuation policies and procedures, the Fund uses the fair value of the investment determined in accordance with the procedures described below. There can be no assurance that the Fund could purchase or sell an investment at the price used to calculate the Fund's NAV.
Fair Valuation and Significant Events Procedures
The Trustees have appointed a Valuation Committee comprised of officers of the Fund, Federated MDTA LLC (“Adviser”) and certain of the Adviser's affiliated companies to determine fair value of securities and in overseeing the calculation of the NAV. The Trustees have also authorized the use of pricing services recommended by the Valuation Committee to provide fair value evaluations of the current value of certain investments for purposes of calculating the NAV. The Valuation Committee employs various methods for reviewing third-party pricing-service evaluations including periodic reviews of third-party pricing services' policies, procedures and valuation methods (including key inputs and assumptions), transactional back-testing, comparisons of evaluations of different pricing services, and review of price challenges by the Adviser based on recent market activity. In the event that market quotations and price evaluations are not available for an investment, the Valuation Committee determines the fair value of the investment in accordance with procedures adopted by the Trustees. The Trustees periodically review and approve the fair valuations made by the Valuation Committee and any changes made to the procedures.
Factors considered by pricing services in evaluating an investment include the yields or prices of investments of comparable quality, coupon, maturity, call rights and other potential prepayments, terms and type, reported transactions, indications as to values from dealers and general market conditions. Some pricing services provide a single price evaluation reflecting the bid-side of the market for an investment (a “bid” evaluation). Other pricing services offer both bid evaluations and price evaluations indicative of a price between the prices bid and asked for the investment (a “mid” evaluation). The Fund normally uses bid evaluations for U.S. Treasury and Agency securities, mortgage-backed securities and municipal securities. The Fund normally uses mid evaluations for other types of fixed-income securities and OTC derivative contracts. In the event that market quotations and price evaluations are not available for an investment, the fair value of the investment is determined in accordance with procedures adopted by the Trustees.
The Trustees also have adopted procedures requiring an investment to be priced at its fair value whenever the Adviser determines that a significant event affecting the value of the investment has occurred between the time as of which the price of the investment would otherwise be determined and the time as of which the NAV is computed. An event is considered significant if there is both an affirmative expectation that the investment's value will change in response to the event and a reasonable basis for quantifying the resulting change in value. Examples of significant events that may occur after the close of the principal market on which a security is traded, or after the time of a price evaluation provided by a pricing service or a dealer, include:
| ■ | With respect to securities traded in foreign markets, significant trends in U.S. equity markets or in the trading of foreign securities index futures contracts; |
| ■ | Political or other developments affecting the economy or markets in which an issuer conducts its operations or its securities are traded; and |
Annual Shareholder Report
| ■ | Announcements concerning matters such as acquisitions, recapitalizations, litigation developments, a natural disaster affecting the issuer's operations or regulatory changes or market developments affecting the issuer's industry. |
The Trustees have approved the use of a pricing service to determine the fair value of equity securities traded principally in foreign markets when the Adviser determines that there has been a significant trend in the U.S. equity markets or in index futures trading. For other significant events, the Fund may seek to obtain more current quotations or price evaluations from alternative pricing sources. If a reliable alternative pricing source is not available, the Fund will determine the fair value of the investment using another method approved by the Trustees.
Repurchase Agreements
The Fund may invest in repurchase agreements for short-term liquidity purposes. It is the policy of the Fund to require the other party to a repurchase agreement to transfer to the Fund's custodian or sub-custodian eligible securities or cash with a market value (after transaction costs) at least equal to the repurchase price to be paid under the repurchase agreement. The eligible securities are transferred to accounts with the custodian or sub-custodian in which the Fund holds a “securities entitlement” and exercises “control” as those terms are defined in the Uniform Commercial Code. The Fund has established procedures for monitoring the market value of the transferred securities and requiring the transfer of additional eligible securities if necessary to equal at least the repurchase price. These procedures also allow the other party to require securities to be transferred from the account to the extent that their market value exceeds the repurchase price or in exchange for other eligible securities of equivalent market value.
The insolvency of the other party or other failure to repurchase the securities may delay the disposition of the underlying securities or cause the Fund to receive less than the full repurchase price. Under the terms of the repurchase agreement, any amounts received by the Fund in excess of the repurchase price and related transaction costs must be remitted to the other party.
The Fund may enter into repurchase agreements in which eligible securities are transferred into joint trading accounts maintained by the custodian or sub-custodian for investment companies and other clients advised by the Fund's Adviser and its affiliates. The Fund will participate on a pro rata basis with the other investment companies and clients in its share of the securities transferred under such repurchase agreements and in its share of proceeds from any repurchase or other disposition of such securities.
Investment Income, Gains and Losses, Expenses and Distributions
Investment transactions are accounted for on a trade-date basis. Realized gains and losses from investment transactions are recorded on an identified-cost basis. Interest income and expenses are accrued daily. Dividend income and distributions to shareholders are recorded on the ex-dividend date. Foreign dividends are recorded on the ex-dividend date or when the Fund is informed of the ex-dividend date. Positive or negative inflation adjustments on Treasury Inflation-Protected Securities are included in interest income. Distributions of net investment income are declared and paid annually. Non-cash dividends included in dividend income, if any, are recorded at fair value. The Fund invests in Emerging Markets Fixed Income Core Fund (EMCORE), a portfolio of Federated Core Trust II, L.P., which is a limited partnership established under the laws of the state of Delaware. The Fund records daily its proportionate share of income, expenses, realized and unrealized gains and losses from EMCORE. Investment income, realized and unrealized gains and losses, and certain fund-level expenses
Annual Shareholder Report
are allocated to each class based on relative average daily net assets, except that Class A Shares, Class C Shares, Class R Shares and Institutional Shares may bear distribution services fees, other service fees and certain transfer agent fees unique to those classes. For the year ended July 31, 2014, transfer agent fees for the Fund were as follows:
| | Transfer
Agent Fees
Incurred | Transfer
Agent Fees
Reimbursed |
| Class A Shares | $70,845 | $(29,950) |
| Class C Shares | 33,789 | (8,667) |
| Class R Shares | 344 | — |
| Institutional Shares | 35,642 | (4,006) |
| TOTAL | $140,620 | $(42,623) |
Other Service Fees
The Fund may pay other service fees up to 0.25% of the average daily net assets of the Fund's Class A Shares and Class C Shares to unaffiliated financial intermediaries or to Federated Shareholder Services Company (FSSC) for providing services to shareholders and maintaining shareholder accounts. Subject to the terms described in the Expense Limitation note, FSSC may voluntarily reimburse the Fund for other service fees. For the year ended July 31, 2014, other service fees for the Fund were as follows:
| | Other
Service Fees
Incurred |
| Class A Shares | $126,740 |
| Class C Shares | 87,507 |
| TOTAL | $214,247 |
Dividends are declared separately for each class. No class has preferential dividend rights; differences in per share dividend rates are generally due to differences in separate class expenses.
Premium and Discount Amortization/Paydown Gains and Losses
All premiums and discounts on fixed-income securities, other than mortgage-backed securities, are amortized/accreted using the effective-interest-rate method. Gains and losses realized on principal payment of mortgage-backed securities (paydown gains and losses) are classified as part of investment income.
Federal Taxes
It is the Fund's policy to comply with the Subchapter M provision of the Internal Revenue Code (the “Code”) and to distribute to shareholders each year substantially all of its income. Accordingly, no provision for federal income tax is necessary. As of and during the year ended July 31, 2014, the Fund did not have a liability for any uncertain tax positions. The Fund recognizes interest and penalties, if any, related to tax liabilities as income tax expense in the Statement of Operations. As of July 31, 2014, tax years 2011 through 2014 remain subject to examination by the Fund's major tax jurisdictions, which include the United States of America and the Commonwealth of Massachusetts.
Annual Shareholder Report
When-Issued and Delayed-Delivery Transactions
The Fund may engage in when-issued or delayed-delivery transactions. The Fund records when-issued securities on the trade date and maintains security positions such that sufficient liquid assets will be available to make payment for the securities purchased. Securities purchased on a when-issued or delayed-delivery basis are marked to market daily and begin earning interest on the settlement date. Losses may occur on these transactions due to changes in market conditions or the failure of counterparties to perform under the contract.
Futures Contracts
The Fund purchases and sells financial futures contracts to manage duration and yield curve exposure. Upon entering into a financial futures contract with a broker, the Fund is required to deposit in a segregated account a specified amount of cash or U.S. government securities. Futures contracts are valued daily and unrealized gains or losses are recorded in a “variation margin” account. Daily, the Fund receives from or pays to the broker a specified amount of cash based upon changes in the variation margin account. When a contract is closed, the Fund recognizes a realized gain or loss. Futures contracts have market risks, including the risk that the change in the value of the contract may not correlate with the changes in the value of the underlying securities. There is minimal counterparty risk to the Fund since futures are exchange traded and the exchange's clearinghouse, as counterparty to all exchange traded futures, guarantees the futures against default.
Futures contracts outstanding at period end are listed after the Fund's Portfolio of Investments.
The average notional value of long and short futures contracts held by the Fund throughout the period was $14,602,066 and $20,707,640, respectively. This is based on amounts held as of each month-end throughout the fiscal period.
Restricted Securities
The Fund may purchase securities which are considered restricted. Restricted securities are securities that either: (a) cannot be offered for public sale without first being registered, or being able to take advantage of an exemption from registration, under the Securities Act of 1933; or (b) are subject to contractual restrictions on public sales. In some cases, when a security cannot be offered for public sale without first being registered, the issuer of the restricted security has agreed to register such securities for resale, at the issuer's expense, either upon demand by the Fund or in connection with another registered offering of the securities. Many such restricted securities may be resold in the secondary market in transactions exempt from registration. Restricted securities may be determined to be liquid under criteria established by the Trustees. The Fund will not incur any registration costs upon such resales. The Fund's restricted securities, like other securities, are priced in accordance with procedures established by and under the general supervision of the Trustees.
Additional information on restricted securities, excluding securities purchased under Rule 144A that have been deemed liquid by the Trustees, if applicable, held at July 31, 2014, is as follows:
| Security | Acquisition
Date | Cost | Market
Value |
| Football Trust V, Pass Thru Cert., Series 144A, 5.350%, 10/05/2020 | 3/24/2010 | $200,000 | $216,104 |
Annual Shareholder Report
Additional Disclosure Related to Derivative Instruments
| Fair Value of Derivative Instruments | |
| | Asset |
| | Statement of
Assets and
Liabilities
Location | Fair
Value |
| Derivatives not accounted for as hedging instruments under ASC Topic 815 | | |
| Interest rate contracts | Receivable for daily
variation margin | $47,746* |
| * | Includes cumulative appreciation of futures contracts as reported in the footnotes to the Portfolio of Investments. Only the current day's variation margin is reported within the Statement of Assets and Liabilities. |
The Effect of Derivative Instruments on the Statement of Operations for the Year Ended July 31, 2014
| Amount of Realized Gain or (Loss) on Derivatives Recognized in Income |
| | Futures |
| Interest rate contracts | $(308,948) |
| Change in Unrealized Appreciation or (Depreciation) on Derivatives Recognized in Income |
| | Futures |
| Interest rate contracts | $160,107 |
Other
The preparation of financial statements in conformity with GAAP requires management to make estimates and assumptions that affect the amounts of assets, liabilities, expenses and revenues reported in the financial statements. Actual results could differ from those estimated.
3. SHARES OF BENEFICIAL INTEREST
The following tables summarize share activity:
| Year Ended July 31 | 2014 | 2013 |
| Class A Shares: | Shares | Amount | Shares | Amount |
| Shares sold | 643,550 | $9,836,746 | 527,475 | $6,996,469 |
| Shares issued to shareholders in payment of distributions declared | 29,125 | 445,325 | 46,305 | 582,053 |
| Shares redeemed | (717,458) | (10,905,514) | (1,064,068) | (14,149,462) |
NET CHANGE RESULTING FROM
CLASS A SHARE TRANSACTIONS | (44,783) | $(623,443) | (490,288) | $(6,570,940) |
Annual Shareholder Report
| Year Ended July 31 | 2014 | 2013 |
| Class C Shares: | Shares | Amount | Shares | Amount |
| Shares sold | 218,934 | $3,310,479 | 182,902 | $2,406,143 |
| Shares issued to shareholders in payment of distributions declared | 5,709 | 86,485 | 14,589 | 181,786 |
| Shares redeemed | (549,307) | (8,354,126) | (536,360) | (6,939,271) |
NET CHANGE RESULTING FROM
CLASS C SHARE TRANSACTIONS | (324,664) | $(4,957,162) | (338,869) | $(4,351,342) |
| Year Ended July 31 | 2014 | 2013 |
| Class R Shares: | Shares | Amount | Shares | Amount |
| Shares sold | 2,339 | $35,057 | 3,579 | $48,415 |
| Shares issued to shareholders in payment of distributions declared | 182 | 2,791 | 395 | 4,965 |
| Shares redeemed | (2,669) | (40,215) | (18,107) | (245,247) |
NET CHANGE RESULTING FROM
CLASS R SHARE TRANSACTIONS | (148) | $ (2,367) | (14,133) | $(191,867) |
| Year Ended July 31 | 2014 | 2013 |
| Institutional Shares: | Shares | Amount | Shares | Amount |
| Shares sold | 175,356 | $2,698,037 | 146,925 | $1,964,101 |
| Shares issued to shareholders in payment of distributions declared | 35,965 | 550,617 | 52,824 | 665,055 |
| Shares redeemed | (350,470) | (5,362,897) | (520,558) | (6,841,423) |
NET CHANGE RESULTING FROM
INSTITUTIONAL SHARE TRANSACTIONS | (139,149) | $(2,114,243) | (320,809) | $(4,212,267) |
NET CHANGE RESULTING FROM
TOTAL FUND SHARE TRANSACTIONS | (508,744) | $(7,697,215) | (1,164,099) | $(15,326,416) |
4. FEDERAL TAX INFORMATION
The timing and character of income and capital gain distributions are determined in accordance with income tax regulations, which may differ from GAAP. These differences are due to differing treatments for foreign currency transactions, allocated income from partnerships, fair fund settlements, short-term capital gain distributions from regulated investment companies, swap income and discount accretion/premium amortization on debt securities.
For the year ended July 31, 2014, permanent differences identified and reclassified among the components of net assets were as follows:
| Increase (Decrease) |
| Paid-In Capital | Undistributed
Net Investment
Income (Loss) | Accumulated
Net Realized
Gain (Loss) |
| $(2,813) | $(2,822) | $5,635 |
Annual Shareholder Report
Net investment income (loss), net realized gains (losses), and net assets were not affected by this reclassification.
The tax character of distributions as reported on the Statement of Changes in Net Assets for the years ended July 31, 2014 and 2013, was as follows:
| | 2014 | 2013 |
| Ordinary income1 | $1,183,088 | $1,575,807 |
| 1 | For tax purposes, short-term capital gain distributions are considered ordinary income distributions. |
| | |
As of July 31, 2014, the components of distributable earnings on a tax basis were as follows:
| Undistributed ordinary income2 | $913,816 |
| Net unrealized appreciation | $20,530,504 |
| Capital loss carryforwards | $(33,113,752) |
| 2 | For tax purposes, short-term capital gains are considered ordinary income in determining distributable earnings. |
| | |
The difference between book-basis and tax-basis net unrealized appreciation/depreciation is attributable to differing treatments for the deferral of losses on wash sales, deferral of paydown losses, discount accretion/premium amortization on debt securities, defaulted securities and partnership investments.
At July 31, 2014, the cost of investments for federal tax purposes was $119,453,107. The net unrealized appreciation of investments for federal tax purposes excluding any unrealized appreciation/depreciation resulting from futures contracts was $20,530,504. This consists of net unrealized appreciation from investments for those securities having an excess of value over cost of $22,003,368 and net unrealized depreciation from investments for those securities having an excess of cost over value of $1,472,864.
At July 31, 2014, the Fund had a capital loss carryforward of $33,113,752 which will reduce the Fund's taxable income arising from future net realized gains on investments, if any, to the extent permitted by the Code, thereby reducing the amount of distributions to shareholders which would otherwise be necessary to relieve the Fund of any liability for federal income tax. Pursuant to the Code, a net capital loss incurred in taxable years beginning on or before December 22, 2010, is characterized as short-term and may be carried forward for a maximum of eight tax years (“Carryforward Limit”), whereas a net capital loss incurred in taxable years beginning after December 22, 2010, retains its character as either short-term or long-term, does not expire and is required to be utilized prior to the losses which have a Carryforward Limit.
The following schedule summarizes the Fund's capital loss carryforwards and expiration years:
| Expiration Year | Short-Term | Long-Term | Total |
| 2017 | $2,133,846 | NA | $2,133,846 |
| 2018 | $30,979,906 | NA | $30,979,906 |
The Fund used capital loss carryforwards of $8,158,860 to offset capital gains realized during the year ended July 31, 2014.
Annual Shareholder Report
5. INVESTMENT ADVISER FEE AND OTHER TRANSACTIONS WITH AFFILIATES
Investment Adviser Fee
The advisory agreement between the Fund and the Adviser provides for an annual fee equal to 0.75% of the Fund's average daily net assets. Subject to the terms described in the Expense Limitation note, the Adviser may voluntarily choose to waive any portion of its fee. For the year ended July 31, 2014, the Adviser voluntarily waived $56,964 of its fee and voluntarily reimbursed $42,623 of transfer agent fees.
Certain of the Fund's assets are managed by Federated Investment Management Company (the “Sub-Adviser”). Under the terms of a sub-advisory agreement between the Adviser and the Sub-Adviser, the Sub-Adviser receives an allocable portion of the Fund's adviser fee. The fee is paid by the Adviser out of its resources and is not an incremental Fund expense. For the year ended July 31, 2014, the Sub-Adviser earned a fee of $93,738.
Administrative Fee
Federated Administrative Services (FAS), under the Administrative Services Agreement, provides the Fund with administrative personnel and services. For purposes of determining the appropriate rate breakpoint, “Investment Complex” is defined as all of the Federated Funds subject to a fee under the Administrative Services Agreement. The fee paid to FAS is based on the average daily net assets of the Investment Complex as specified below, plus certain out-of-pocket expenses:
| Administrative Fee | Average Daily Net Assets
of the Investment Complex |
| 0.150% | on the first $5 billion |
| 0.125% | on the next $5 billion |
| 0.100% | on the next $10 billion |
| 0.075% | on assets in excess of $20 billion |
Subject to the terms described in the Expense Limitation note, FAS may voluntarily choose to waive any portion of its fee. For the year ended July 31, 2014, the annualized fee paid to FAS was 0.078% of average daily net assets of the Fund.
Distribution Services Fee
The Fund has adopted a Distribution Plan (the “Plan”) pursuant to Rule 12b-1 under the Act. Under the terms of the Plan, the Fund will compensate Federated Securities Corp. (FSC), the principal distributor, from the daily net assets of the Fund's Class A Shares, Class C Shares and Class R Shares to finance activities intended to result in the sale of these shares. The Plan provides that the Fund may incur distribution expenses at the following percentages of average daily net assets annually, to compensate FSC:
| Share Class Name | Percentage of Average Daily
Net Assets of Class |
| Class A Shares | 0.05% |
| Class C Shares | 0.75% |
| Class R Shares | 0.50% |
Annual Shareholder Report
Subject to the terms described in the Expense Limitation note, FSC may voluntarily choose to waive any portion of its fee. For the year ended July 31, 2014, distribution services fees for the Fund were as follows:
| | Distribution
Services Fees
Incurred |
| Class C Shares | $267,310 |
| Class R Shares | 2,204 |
| TOTAL | $269,514 |
When FSC receives fees, it may pay some or all of them to financial intermediaries whose customers purchase shares. For the year ended July 31, 2014, FSC retained $25,358 of fees paid by the Fund. For the year ended July 31, 2014, the Fund's Class A Shares did not incur a distribution services fee; however, it may begin to incur this fee upon approval of the Trustees.
Sales Charges
Front-end sales charges and contingent deferred sales charges (CDSC) do not represent expenses of the Fund. They are deducted from the proceeds of sales of Fund shares prior to investment or from redemption proceeds prior to remittance, as applicable. For the year ended July 31, 2014, FSC retained $9,973 in sales charges from the sale of Class A Shares. FSC also retained $669 of CDSC relating to redemptions of Class C Shares.
Other Service Fees
FSSC received $6,654 of the other service fees disclosed in Note 2.
Expense Limitation
The Adviser and certain of its affiliates (which may include FSC, FAS and FSSC) on their own initiative have agreed to waive their respective fees and/or reimburse expenses so that the total annual fund operating expenses (as shown in the financial highlights, excluding expenses allocated from affiliated partnerships, extraordinary expenses and proxy-related expenses paid by the Fund, if any) paid by the Fund's Class A Shares, Class C Shares and Institutional Shares (after the voluntary waivers and/or reimbursements) will not exceed 1.30%, 2.05% and 1.05% (the “Fee Limit”), respectively, up to but not including the later of (the “Termination Date”): (a) October 1, 2015; or (b) the date of the Fund's next effective Prospectus. While the Adviser and its applicable affiliates currently do not anticipate terminating or increasing these arrangements prior to the Termination Date, these arrangements may only be terminated or the Fee Limit increased prior to the Termination Date with the agreement of the Trustees.
General
Certain Officers and Trustees of the Fund are Officers and Directors or Trustees of certain of the above companies. To efficiently facilitate payment, Directors'/Trustees' fees and certain expenses related to conducting meetings of the Directors/Trustees and other miscellaneous expenses are paid by an affiliate of the Adviser which in due course are reimbursed by the Fund. Such expenses may be included in Accrued and Miscellaneous Expenses on the Statement of Assets and Liabilities and Statement of Operations, respectively.
Annual Shareholder Report
Transactions Involving Affiliated Holdings
Affiliated holdings are investment companies which are managed by the Adviser or an affiliate of the Adviser. The Adviser has agreed to reimburse the Fund for certain investment adviser fees as a result of transactions in other affiliated investment companies. For the year ended July 31, 2014, the Adviser reimbursed $9,797. Transactions involving the affiliated holdings during the year ended July 31, 2014, were as follows:
| | Emerging
Markets
Fixed
Income
Core
Fund | Federated
Mortgage
Core
Portfolio | Federated
Prime
Value
Obligations
Fund,
Institutional
Shares | Federated
Project
and Trade
Finance
Core
Fund | High
Yield
Bond
Portfolio | Total of
Affiliated
Transactions |
| Balance of Shares Held 7/31/2013 | 55,577 | 821,021 | 7,453,957 | 133,659 | 576,194 | 9,040,408 |
| Purchases/Additions | 5,982 | 157,501 | 35,911,660 | 51,593 | 83,622 | 36,210,358 |
| Sales/Reductions | (29,484) | — | (35,648,706) | — | (136,404) | (35,814,594) |
| Balance of Shares Held 7/31/2014 | 32,075 | 978,522 | 7,716,911 | 185,252 | 523,412 | 9,436,172 |
| Value | $1,144,502 | $9,648,225 | $7,716,911 | $1,783,981 | $3,449,285 | $23,742,904 |
| Dividend Income/ Allocated Investment Income | $98,621 | $272,085 | $5,586 | $62,511 | $271,954 | $710,757 |
| Realized Gain Distribution/ Allocated Net Realized Gain | $24,420 | $— | $— | $3,002 | $35,422 | $62,844 |
6. Investment TRANSACTIONS
Purchases and sales of investments, excluding long-term U.S. government securities and short-term obligations, for the year ended July 31, 2014, were as follows:
| Purchases | $41,492,485 |
| Sales | $45,995,805 |
7. LINE OF CREDIT
The Fund participates in a $100,000,000 unsecured, uncommitted revolving line of credit (LOC) agreement with PNC Bank. The LOC was made available for extraordinary or emergency purposes, primarily for financing redemption payments. Borrowings are charged interest at a rate offered to the Fund by PNC Bank at the time of the borrowing. As of July 31, 2014, there were no outstanding loans. During the year ended July 31, 2014, the Fund did not utilize the LOC.
Annual Shareholder Report
8. INTERFUND LENDING
Pursuant to an Exemptive Order issued by the Securities and Exchange Commission, the Fund, along with other funds advised by subsidiaries of Federated Investors, Inc., may participate in an interfund lending program. This program provides an alternative credit facility allowing the Fund to borrow from other participating affiliated funds. As of July 31, 2014, there were no outstanding loans. During the year ended July 31, 2014, the program was not utilized.
9. FEDERAL TAX INFORMATION (UNAUDITED)
For the fiscal year ended July 31, 2014, 100% of total income distributions made by the Fund are qualifying dividends which may be subject to a maximum tax rate of 15%, as provided for by the Jobs and Growth Tax Relief Act of 2003. Complete information is reported in conjunction with the reporting of your distributions on Form 1099-DIV.
Of the ordinary income distributions made by the Fund during the year ended July 31, 2014, 98.52% qualify for the dividend received deduction available to corporate shareholders.
Annual Shareholder Report
Report of Independent Registered Public Accounting Firm
TO THE BOARD OF trustees OF Federated MDt series AND SHAREHOLDERS OF federated mdt Balanced fund:
We have audited the accompanying statement of assets and liabilities of Federated MDT Balanced Fund (the “Fund”) (one of the portfolios constituting Federated MDT Series), including the portfolio of investments, as of July 31, 2014, and the related statement of operations for the year then ended, the statement of changes in net assets for each of the two years in the period then ended, and the financial highlights for each of the five years in the period then ended. These financial statements and financial highlights are the responsibility of the Fund's management. Our responsibility is to express an opinion on these financial statements and financial highlights based on our audits.
We conducted our audits in accordance with standards of the Public Company Accounting Oversight Board (United States). Those standards require that we plan and perform the audit to obtain reasonable assurance about whether the financial statements and financial highlights are free of material misstatement. We were not engaged to perform an audit of the Fund's internal control over financial reporting. Our audits included consideration of internal control over financial reporting as a basis for designing audit procedures that are appropriate in the circumstances, but not for the purpose of expressing an opinion on the effectiveness of the Fund's internal control over financial reporting. Accordingly, we express no such opinion. An audit also includes examining, on a test basis, evidence supporting the amounts and disclosures in the financial statements and financial highlights, assessing the accounting principles used and significant estimates made by management, and evaluating the overall financial statement presentation. Our procedures included confirmation of securities owned as of July 31, 2014, by correspondence with the custodian and others, or by other appropriate auditing procedures where replies from others were not received. We believe that our audits provide a reasonable basis for our opinion.
In our opinion, the financial statements and financial highlights referred to above present fairly, in all material respects, the financial position of Federated MDT Balanced Fund, a portfolio of Federated MDT Series, at July 31, 2014, the results of its operations for the year then ended, the changes in its net assets for each of the two years in the period then ended, and the financial highlights for each of the five years in the period ten ended, in conformity with U.S. generally accepted accounting principles.
Boston, Massachusetts
September 23, 2014
Annual Shareholder Report
Shareholder Expense Example (unaudited)
As a shareholder of the Fund, you incur two types of costs: (1) transaction costs, including sales charges (loads) on purchase or redemption payments; and (2) ongoing costs, including management fees and to the extent applicable, distribution (12b-1) fees and/or other service fees and other Fund expenses. This Example is intended to help you to understand your ongoing costs (in dollars) of investing in the Fund and to compare these costs with the ongoing costs of investing in other mutual funds. It is based on an investment of $1,000 invested at the beginning of the period and held for the entire period from February 1, 2014 to July 31, 2014.
ACTUAL EXPENSES
The first section of the table below provides information about actual account values and actual expenses. You may use the information in this section, together with the amount you invested, to estimate the expenses that you incurred over the period. Simply divide your account value by $1,000 (for example, an $8,600 account value divided by $1,000 = 8.6), then multiply the result by the number in the first section under the heading entitled “Expenses Paid During Period” to estimate the expenses attributable to your investment during this period.
HYPOTHETICAL EXAMPLE FOR COMPARISON PURPOSES
The second section of the table below provides information about hypothetical account values and hypothetical expenses based on the Fund's actual expense ratio and an assumed rate of return of 5% per year before expenses, which is not the Fund's actual return. Thus, you should not use the hypothetical account values and expenses to estimate the actual ending account balance or your expenses for the period. Rather, these figures are required to be provided to enable you to compare the ongoing costs of investing in the Fund with other funds. To do so, compare this 5% hypothetical example with the 5% hypothetical examples that appear in the shareholder reports of the other funds.
Annual Shareholder Report
Please note that the expenses shown in the table are meant to highlight your ongoing costs only and do not reflect any transaction costs, such as sales charges (loads) on purchase or redemption payments. Therefore, the second section of the table is useful in comparing ongoing costs only, and will not help you determine the relative total costs of owning different funds. In addition, if these transaction costs were included, your costs would have been higher.
| | Beginning
Account Value
2/1/2014 | Ending
Account Value
7/31/2014 | Expenses Paid
During Period1 |
| Actual: | | | |
| Class A Shares | $1,000 | $1,069.90 | $6.67 |
| Class C Shares | $1,000 | $1,065.20 | $10.50 |
| Class R Shares | $1,000 | $1,067.90 | $7.95 |
| Institutional Shares | $1,000 | $1,070.40 | $5.39 |
Hypothetical (assuming a 5% return
before expenses): | | | |
| Class A Shares | $1,000 | $1,018.35 | $6.51 |
| Class C Shares | $1,000 | $1,014.63 | $10.24 |
| Class R Shares | $1,000 | $1,017.11 | $7.75 |
| Institutional Shares | $1,000 | $1,019.59 | $5.26 |
| 1 | Expenses are equal to the Fund's annualized net expense ratios, multiplied by the average account value over the period, multiplied by 181/365 (to reflect the one-half-year period). The annualized net expense ratios are as follows: |
| | |
| Class A Shares | 1.30% |
| Class C Shares | 2.05% |
| Class R Shares | 1.55% |
| Institutional Shares | 1.05% |
Annual Shareholder Report
Board of Trustees and Trust Officers
The Board of Trustees is responsible for managing the Trust's business affairs and for exercising all the Trust's powers except those reserved for the shareholders. The following tables give information about each Trustee and the senior officers of the Fund. Where required, the tables separately list Trustees who are “interested persons” of the Fund (i.e., “Interested” Trustees) and those who are not (i.e., “Independent” Trustees). Unless otherwise noted, the address of each person listed is Federated Investors Tower, 1001 Liberty Avenue, Pittsburgh, PA 15222. The address of all Independent Trustees listed is 4000 Ericsson Drive, Warrendale, PA 15086-7561; Attention: Mutual Fund Board. As of December 31, 2013, the Trust comprised five portfolio(s), and the Federated Fund Family consisted of 42 investment companies (comprising 135 portfolios). Unless otherwise noted, each Officer is elected annually. Unless otherwise noted, each Trustee oversees all portfolios in the Federated Fund Family and serves for an indefinite term. The Fund's Statement of Additional Information includes additional information about Trust Trustees and is available, without charge and upon request, by calling 1-800-341-7400.
Interested TRUSTEES Background
Name
Birth Date
Positions Held with Trust
Date Service Began | Principal Occupation(s) for Past Five Years,
Other Directorships Held and Previous Position(s) |
John F. Donahue*
Birth Date: July 28, 1924
Trustee
Began serving: June 2006 | Principal Occupations: Director or Trustee of the Federated Fund Family; Chairman and Director, Federated Investors, Inc.; Chairman of the Federated Fund Family's Executive Committee.
Previous Positions: Chairman of the Federated Fund Family; Trustee, Federated Investment Management Company; Chairman and Director, Federated Investment Counseling. |
J. Christopher Donahue*
Birth Date: April 11, 1949
President and Trustee
Began serving: May 2006 | Principal Occupations: Principal Executive Officer and President of certain of the Funds in the Federated Fund Family; Director or Trustee of the Funds in the Federated Fund Family; President, Chief Executive Officer and Director, Federated Investors, Inc.; Chairman and Trustee, Federated Investment Management Company; Trustee, Federated Investment Counseling; Chairman and Director, Federated Global Investment Management Corp.; Chairman, Federated Equity Management Company of Pennsylvania and Passport Research, Ltd. (investment advisory subsidiary of Federated); Trustee, Federated Shareholder Services Company; Director, Federated Services Company.
Previous Positions: President, Federated Investment Counseling; President and Chief Executive Officer, Federated Investment Management Company, Federated Global Investment Management Corp. and Passport Research, Ltd. |
| * | Family relationships and reasons for “interested” status: John F. Donahue is the father of J. Christopher Donahue; both are “interested” due to their beneficial ownership of shares of Federated Investors, Inc. and the positions they hold with Federated and its subsidiaries. |
Annual Shareholder Report
INDEPENDENT TRUSTEES Background
Name
Birth Date
Positions Held with Trust
Date Service Began | Principal Occupation(s) for Past Five Years,
Other Directorships Held, Previous Position(s) and Qualifications |
John T. Collins
Birth Date: January 24, 1947
Trustee
Began serving: October 2013 | Principal Occupations: Director or Trustee of the Federated Fund Family; Chairman and CEO, The Collins Group, Inc. (a private equity firm).
Other Directorships Held: Chairman Emeriti, Bentley University; Director, Sterling Suffolk Downs, Inc.; Former Director, National Association of Printers and Lithographers.
Previous Positions: Director and Audit Committee Member, Bank of America Corp.
Qualifications: Business management and director experience. |
Maureen Lally-Green
Birth Date: July 5, 1949
Trustee
Began serving: August 2009 | Principal Occupations: Director or Trustee of the Federated Fund Family; Associate General Secretary and Director, Office for Church Relations, Diocese of Pittsburgh; Adjunct Professor of Law, Duquesne University School of Law; Superior Court of Pennsylvania (service began 1998 and ended July 2009).
Other Directorships Held: Director, Consol Energy (service started June 2013); Director, Auberle (service ended December 2013); Member, Pennsylvania State Board of Education; Director, Saint Vincent College; Director, Ireland Institute of Pittsburgh (service ended December 2013); Director and Chair, UPMC Mercy Hospital; Regent, St. Vincent Seminary; Director, Epilepsy Foundation of Western and Central Pennsylvania; Director, Saint Thomas More Society (service ended December 2013); Director, Our Campaign for the Church Alive!, Inc.; Director, Pennsylvania Bar Institute (2013-present); Director, Cardinal Wuerl North Catholic High School (2013-present).
Previous Position: Professor of Law, Duquesne University School of Law, Pittsburgh (1983-1998).
Qualifications: Legal and director experience. |
Peter E. Madden
Birth Date: March 16, 1942
Trustee
Began serving: June 2006 | Principal Occupation: Director or Trustee, and Chairman of the Board of Directors or Trustees, of the Federated Fund Family.
Previous Positions: Representative, Commonwealth of Massachusetts General Court; President, Chief Operating Officer and Director, State Street Bank and Trust Company and State Street Corporation (retired); Director, VISA USA and VISA International; Chairman and Director, Massachusetts Bankers Association; Director, Depository Trust Corporation; Director, The Boston Stock Exchange.
Qualifications: Business management, mutual fund services and director experience. |
Annual Shareholder Report
Name
Birth Date
Positions Held with Trust
Date Service Began | Principal Occupation(s) for Past Five Years,
Other Directorships Held, Previous Position(s) and Qualifications |
Charles F. Mansfield, Jr.
Birth Date: April 10, 1945
Trustee
Began serving: June 2006 | Principal Occupations: Director or Trustee of the Federated Fund Family; Management Consultant.
Previous Positions: Chief Executive Officer, PBTC International Bank; Partner, Arthur Young & Company (now Ernst & Young LLP); Chief Financial Officer of Retail Banking Sector, Chase Manhattan Bank; Senior Vice President, HSBC Bank USA (formerly Marine Midland Bank); Vice President, Citibank; Assistant Professor of Banking and Finance, Frank G. Zarb School of Business, Hofstra University; Executive Vice President, DVC Group, Inc. (marketing, communications and technology).
Qualifications: Banking, business management, education and director experience. |
Thomas M. O'Neill
Birth Date: June 14, 1951
Trustee
Began serving: October 2006 | Principal Occupations: Director or Trustee, Vice Chairman of the Audit Committee of the Federated Fund Family; Sole Proprietor, Navigator Management Company (investment and strategic consulting).
Other Directorships Held: Board of Overseers, Children's Hospital of Boston; Visiting Committee on Athletics, Harvard College; Board of Directors, Medicines for Humanity; Board of Directors, The Golisano Children's Museum of Naples, Florida.
Previous Positions: Chief Executive Officer and President, Managing Director and Chief Investment Officer, Fleet Investment Advisors; President and Chief Executive Officer, Aeltus Investment Management, Inc.; General Partner, Hellman, Jordan Management Co., Boston, MA; Chief Investment Officer, The Putnam Companies, Boston, MA; Credit Analyst and Lending Officer, Fleet Bank; Director and Consultant, EZE Castle Software (investment order management software); Director, Midway Pacific (lumber).
Qualifications: Business management, mutual fund, director and investment experience. |
P. Jerome Richey
Birth Date: February 23, 1949
Trustee
Began serving: October 2013 | Principal Occupations: Director or Trustee of the Federated Fund Family; General Counsel, University of Pittsburgh.
Other Directorships Held: Board Chairman, Epilepsy Foundation of Western Pennsylvania; Board Member, World Affairs Council of Pittsburgh.
Previous Positions: Chief Legal Officer and Executive Vice President, CONSOL Energy Inc.; Shareholder, Buchanan Ingersoll & Rooney PC (a law firm).
Qualifications: Business management, legal and director experience. |
Annual Shareholder Report
Name
Birth Date
Positions Held with Trust
Date Service Began | Principal Occupation(s) for Past Five Years,
Other Directorships Held, Previous Position(s) and Qualifications |
John S. Walsh
Birth Date: November 28, 1957
Trustee
Began serving: June 2006 | Principal Occupations: Director or Trustee, Chairman of the Audit Committee of the Federated Fund Family; President and Director, Heat Wagon, Inc. (manufacturer of construction temporary heaters); President and Director, Manufacturers Products, Inc. (distributor of portable construction heaters); President, Portable Heater Parts, a division of Manufacturers Products, Inc.
Previous Position: Vice President, Walsh & Kelly, Inc.
Qualifications: Business management and director experience. |
OFFICERS
Name
Birth Date
Address
Positions Held with Trust
Date Service Began | Principal Occupation(s) for Past Five Years
and Previous Position(s) |
John W. McGonigle
Birth Date: October 26, 1938
Secretary
Officer since: May 2006 | Principal Occupations: Executive Vice President and Secretary of the Federated Fund Family; Vice Chairman, Executive Vice President, Secretary and Director, Federated Investors, Inc.
Previous Positions: Trustee, Federated Investment Management Company and Federated Investment Counseling; Director, Federated Global Investment Management Corp., Federated Services Company and Federated Securities Corp. |
Lori A. Hensler
Birth Date: January 6, 1967
TREASURER
Officer since: April 2013 | Principal Occupations: Principal Financial Officer and Treasurer of the Federated Fund Family; Senior Vice President, Federated Administrative Services; Financial and Operations Principal for Federated Securities Corp. and Edgewood Services, Inc.; and Assistant Treasurer, Federated Investors Trust Company. Ms. Hensler has received the Certified Public Accountant designation.
Previous Positions: Controller of Federated Investors, Inc.; Senior Vice President and Assistant Treasurer, Federated Investors Management Company; Treasurer, Federated Investors Trust Company; Assistant Treasurer, Federated Administrative Services, Federated Administrative Services, Inc., Federated Securities Corp., Edgewood Services, Inc., Federated Advisory Services Company, Federated Equity Management Company of Pennsylvania, Federated Global Investment Management Corp., Federated Investment Counseling, Federated Investment Management Company, Passport Research, Ltd., and Federated MDTA, LLC; Financial and Operations Principal for Federated Securities Corp., Edgewood Services, Inc. and Southpointe Distribution Services, Inc. |
Annual Shareholder Report
Name
Birth Date
Address
Positions Held with Trust
Date Service Began | Principal Occupation(s) for Past Five Years
and Previous Position(s) |
Peter J. Germain
Birth Date: September 3, 1959
CHIEF LEGAL OFFICER
Officer since: June 2006 | Principal Occupations: Mr. Germain is Chief Legal Officer of the Federated Fund Family. He is General Counsel and Vice President, Federated Investors, Inc.; President, Federated Administrative Services and Federated Administrative Services, Inc.; Vice President, Federated Securities Corp.; Secretary, Federated Private Asset Management, Inc.; and Secretary, Retirement Plan Service Company of America. Mr. Germain joined Federated in 1984 and is a member of the Pennsylvania Bar Association.
Previous Positions: Deputy General Counsel, Special Counsel, Managing Director of Mutual Fund Services, Federated Investors, Inc.; Senior Vice President, Federated Services Company; and Senior Corporate Counsel, Federated Investors, Inc. |
Brian P. Bouda
Birth Date: February 28, 1947
CHIEF COMPLIANCE OFFICER AND SENIOR VICE PRESIDENT
Officer since: June 2006 | Principal Occupations: Senior Vice President and Chief Compliance Officer of the Federated Fund Family; Vice President and Chief Compliance Officer of Federated Investors, Inc. and Chief Compliance Officer of certain of its subsidiaries. Mr. Bouda joined Federated in 1999 and is a member of the American Bar Association and the State Bar Association of Wisconsin.
Previous Positions: Served in Senior Management positions with a large regional banking organization. |
Stephen F. Auth
Birth Date: September 3, 1956
450 Lexington Avenue
Suite 3700
New York, NY 10017-3943
CHIEF INVESTMENT OFFICER
Officer since: June 2012 | Principal Occupations: Stephen F. Auth is Chief Investment Officer of various Funds in the Federated Fund Family; Executive Vice President, Federated Investment Counseling, Federated Global Investment Management Corp. and Federated Equity Management Company of Pennsylvania.
Previous Positions: Executive Vice President, Federated Investment Management Company and Passport Research, Ltd. (investment advisory subsidiary of Federated); Senior Vice President, Global Portfolio Management Services Division; Senior Vice President, Federated Investment Management Company and Passport Research, Ltd.; Senior Managing Director and Portfolio Manager, Prudential Investments. |
John F. Sherman
Birth Date: August 28, 1967
125 High Street
Oliver Tower
21st Floor
Boston, MA 02110-2704
Vice President
Officer since: June 2012
Portfolio Manager since: October 2002 | Principal Occupations: John F. Sherman has been the Fund's Portfolio Manager since October 2002. Mr. Sherman joined MDT Advisers Investment Team in 2000. He is Vice President of the Trust with respect to the Fund. Mr. Sherman is a member of the CFA Institute and the Boston Security Analysts Society. He received a B.S.B.A. from North Adams State College and an M.B.A. from Boston University Graduate School of Management. |
Annual Shareholder Report
Evaluation and Approval of Advisory Contract–May 2014
Federated MDT Balanced Fund (the “Fund”)
Following a review and recommendation of approval by the Fund's independent trustees, the Fund's Board reviewed and approved at its May 2014 meetings the Fund's investment advisory and subadvisory contracts for an additional one-year term. The Board's decision regarding these contracts reflects the exercise of its business judgment on whether to continue the existing arrangements.
In this connection, the Federated Funds' Board had previously appointed a Senior Officer, whose duties include specified responsibilities relating to the process by which advisory fees are to be charged to a Federated fund. The Senior Officer has the authority to retain consultants, experts, or staff as may be reasonably necessary to assist in the performance of his duties, reports directly to the Board, and may be terminated only with the approval of a majority of the independent members of the Board. The Senior Officer prepared and furnished to the Board an independent, written evaluation that covered topics discussed below (the “Evaluation”). The Board considered that Evaluation, along with other information, in deciding to approve the advisory and subadvisory contracts.
The Board is also familiar with and considered judicial decisions concerning allegedly excessive investment advisory fees, which have indicated that the following factors may be relevant to an Adviser's fiduciary duty with respect to its receipt of compensation from a fund: the nature and quality of the services provided by the Adviser to a fund and its shareholders, including the performance and expenses of the fund and of comparable funds; the Adviser's cost of providing the services, including the profitability to the Adviser of providing advisory services to a fund; the extent to which the Adviser may realize “economies of scale” as a fund grows larger and, if such economies exist, whether they have been shared with a fund and its shareholders or the family of funds; any “fall-out financial benefits” that accrue to the Adviser because of its relationship with a fund (including research services received from brokers that execute fund trades and any fees paid to affiliates of the Adviser for services rendered to a fund); comparative fee structures, including a comparison of fees paid to the Adviser with those paid by similar funds; and the extent of care, conscientiousness and independence with which the Board members perform their duties and their expertise, including whether they are fully informed about all facts the Board deems relevant to its consideration of the Adviser's services and fees. The Board noted that SEC disclosure requirements regarding the basis for the Board's approval of the Fund's advisory contract generally track the factors listed above. Consistent with these judicial decisions and SEC disclosure requirements, the Board also considered management fees charged to institutional and other clients of the Adviser and subadviser for what might be
Annual Shareholder Report
viewed as like services. The Board was aware of these factors and was guided by them in its review of the Fund's advisory and subadvisory contracts to the extent it considered them to be appropriate and relevant, as discussed further below.
The Board considered and weighed these circumstances in light of its substantial accumulated experience in governing the Fund and working with Federated on matters relating to the Federated funds, and was assisted in its deliberations by independent legal counsel. Throughout the year, and in connection with its May meetings, the Board requested and received substantial and detailed information about the Fund and the Federated organization that was in addition to the extensive materials that comprise and accompany the Senior Officer's Evaluation. Federated provided much of this information at each regular meeting of the Board, and furnished additional substantial information in connection with the May meeting at which the Board's formal review of the advisory and subadvisory contracts occurred. At this May meeting, senior management of the Adviser also met with the independent trustees and their counsel to discuss the materials presented and any other matters thought relevant by the Adviser or the trustees. Between regularly scheduled meetings, the Board also received information on particular matters as the need arose. Thus, the Board's consideration of the advisory and subadvisory contracts included review of the Senior Officer's Evaluation, accompanying data and additional information covering such matters as: the Adviser's and subadviser's investment philosophy, revenue, profitability, personnel and processes; investment and operating strategies; the Fund's short- and long-term performance (in absolute terms, both on a gross basis and net of expenses, as well as in relationship to its particular investment program and certain competitor or “peer group” funds and/or other benchmarks, as appropriate), and comments on the reasons for performance; the Fund's investment objectives; the Fund's expenses (including the advisory fee itself and the overall expense structure of the Fund, both in absolute terms and relative to similar and/or competing funds, with due regard for contractual or voluntary expense limitations); the use and allocation of brokerage commissions derived from trading the Fund's portfolio securities (if any); and the nature, quality and extent of the advisory and other services provided to the Fund by the Adviser and its affiliates. The Board also considered the preferences and expectations of Fund shareholders; the entrepreneurial risk assumed by the Adviser in sponsoring the funds; the continuing state of competition in the mutual fund industry and market practices; the range of comparable fees for similar funds in the mutual fund industry; the Fund's relationship to the Federated family of funds which include a comprehensive array of funds with different investment objectives, policies and strategies which are available for exchange without the incurrence of additional sales charges; compliance and audit reports concerning the Federated funds and the Federated companies that service them (including communications from regulatory agencies), as well as Federated's responses to any issues raised therein;
Annual Shareholder Report
and relevant developments in the mutual fund industry and how the Federated funds and/or Federated are responding to them. The Board's evaluation process is evolutionary. The criteria considered and the emphasis placed on relevant criteria change in recognition of changing circumstances in the mutual fund marketplace.
While mindful that courts have cautioned against giving such comparisons too much weight, the Board has found the use of comparisons of the Fund's fees and expenses to other mutual funds with comparable investment programs to be relevant. In this regard, the Board was presented with, and considered, information regarding the contractual advisory fee rates, net advisory fee rates and total expense ratios relative to a fund's peers. The Board focused on comparisons with other similar mutual funds more heavily than non-mutual fund products or services because it is believed that they are more relevant. For example, other mutual funds are the products most like the Fund, they are readily available to Fund shareholders as alternative investment vehicles, and they are the type of investment vehicle in fact chosen and maintained by the Fund's investors. The range of their fees and expenses therefore appears to be a relevant indicator of what consumers have found to be reasonable in the precise marketplace in which the Fund competes.
The Board reviewed the contractual advisory fee rate, net advisory fee rate where partially waived and other expenses of the Fund and noted the position of the Fund's fee rates relative to its peers. In this regard, the Board noted that the contractual advisory fee rate was above the median of the relevant peer group, but the Board noted the applicable waivers and reimbursements and that the overall expense structure of the Fund remained competitive. In this regard, the Board had been previously advised that, while comparisons to fund peer groups are relevant in judging the reasonableness of advisory fees, the Fund's quantitative focus makes fee and expense comparisons particularly difficult. Although the Fund's advisory fee was above the median of the peer range, the peer group of funds varied widely in their complexity, and the management of the Fund is among the more complex relative to its peers. The Board will continue to monitor advisory fees and other expenses borne by the Fund.
By contrast, the Senior Officer has reviewed Federated's fees for providing advisory services to products outside the Federated family of funds (e.g., institutional and separate accounts and sub-adviser services). He concluded that mutual funds and institutional accounts are inherently different products. Those differences include, but are not limited to, different types of targeted investors; being subject to different laws and regulations; different legal structures; different average account sizes; and portfolio management techniques made necessary by different cash flows and different associated costs; and the time spent by portfolio managers and their teams, funds financial services, legal, compliance and risk management in reviewing securities pricing, addressing
Annual Shareholder Report
different administrative responsibilities, addressing different degrees of risk associated with management and a variety of different costs. The Senior Officer did not consider these fee schedules to be determinative in judging the appropriateness of mutual fund advisory fees.
The Fund's ability to deliver competitive performance when compared to its peer group was also deemed to be relevant by the Board as a useful indicator of how the Adviser is executing the Fund's investment program, which in turn was one of the Board's considerations in reaching a conclusion that the nature, extent, and quality of the Adviser's investment management services were such as to warrant continuation of the advisory and subadvisory contracts.
The Senior Officer reviewed information compiled by Federated, using data supplied by independent fund ranking organizations, regarding the performance of, and fees charged by, other mutual funds, noting his view that comparisons to fund peer groups may be helpful, though not conclusive, in judging the reasonableness of proposed fees. The Board considered, in evaluating such comparisons, that in some cases individual funds may exhibit significant and unique differences in their objectives and management techniques when compared to other funds within an industry peer group, and that the Senior Officer had specifically noted that the Fund's quantitative investment program is of such a type.
For the periods covered by the Evaluation, the Fund's performance for both the one-year and three-year periods was above the median of the relevant peer group, and the Fund's performance fell below the median of the relevant peer group for the five-year period. The Board discussed the Fund's performance with the Adviser and recognized the efforts being undertaken by the Adviser. The Board will continue to monitor these efforts and the performance of the Fund in the context of the other factors considered relevant by the Board.
The Board also received financial information about Federated, including information regarding the compensation and benefits Federated derived from its relationships with the Federated funds. This information covered not only the fees under the advisory contracts, but also fees received by Federated's subsidiaries for providing other services to the Federated funds under separate contracts (e.g., for serving as the Federated funds' administrator). The information also detailed any indirect benefit Federated may derive from its receipt of research services from brokers who execute Federated fund trades. In addition, the Board considered the fact that, in order for a fund to be competitive in the marketplace, Federated and its affiliates frequently waived fees and/or reimbursed expenses and have disclosed to fund investors and/or indicated to the Board their intention to do so in the future, where appropriate. Moreover, the Board receives regular reporting as to the institution, adjustment or elimination of these voluntary waivers. . In addition, following discussions
Annual Shareholder Report
regarding the Senior Officer's May 2013 recommendations, Federated made meaningful reductions to gross advisory fees for several funds. At the Board meeting in May 2014, the Senior Officer proposed, and the Board approved, reductions in the contractual advisory fees of certain other funds.
Federated furnished information, requested by the Senior Officer, that reported revenues on a fund-by-fund basis and made estimates of the allocation of expenses on a fund-by-fund basis, using allocation methodologies specified by the Senior Officer. The Senior Officer noted that, while these cost allocation reports apply consistent allocation processes, the inherent difficulties in allocating costs continues to cause the Senior Officer to question the precision of the process and to conclude that such reports may be unreliable, since a single change in an allocation estimate may dramatically alter the resulting estimate of cost and/or profitability of a fund and may produce unintended consequences. The allocation information, including the Senior Officer's view that fund-by-fund estimations may be unreliable, was considered in the analysis by the Board.
The Board and the Senior Officer also reviewed information compiled by Federated comparing profitability information for Federated to other publicly held fund management companies. In this regard, the Senior Officer concluded that Federated's profit margins did not appear to be excessive.
The Senior Officer's Evaluation also discussed the notion of possible realization of “economies of scale” as a fund grows larger. The Board considered in this regard that the Adviser has made significant and long-term investments in areas that support all of the Federated family of funds, such as personnel and processes for the portfolio management, shareholder services, compliance, internal audit, and risk management functions; and systems technology; and that the benefits of these efforts (as well as any economies, should they exist) were likely to be enjoyed by the fund family as a whole. Finally, the Board also noted the absence of any applicable regulatory or industry guidelines on this subject, which (as discussed in the Senior Officer's Evaluation) is compounded by the lack of any common industry practice or general pattern with respect to structuring fund advisory fees with “breakpoints” that serve to reduce the fee as the fund attains a certain size.
The Senior Officer noted that, subject to the comments and recommendations made within his Evaluation, his observations and the information accompanying the Evaluation supported a finding by the Board that the management fees for each of the funds were reasonable. Under these circumstances, no changes were recommended to, and no objection was raised to, the continuation of the Fund's advisory and subadvisory contracts.
In its decision to continue an existing investment advisory contract, the Board was mindful of the potential disruptions of the Fund's operations and various risks, uncertainties and other effects that could occur as a result of a decision to terminate or not renew an advisory contract. In particular, the Board recognized that many shareholders have invested in the Fund on the strength of the Adviser's industry standing and reputation and with the expectation that the
Annual Shareholder Report
Adviser will have a continuing role in providing advisory services to the Fund. Thus, the Board's approval of the advisory contract reflected the fact that it is the shareholders who have effectively selected the Adviser by virtue of having invested in the Fund. The Board concluded that, in light of the factors discussed above, including the nature, quality and scope of the services provided to the Fund by the Adviser and its affiliates, continuation of the advisory contract was appropriate.
The Board based its decision to approve the advisory and subadvisory contracts on the totality of the circumstances and relevant factors and with a view to past and future long-term considerations. Not all of the factors and considerations identified above were necessarily relevant to the Fund, nor did the Board consider any one of them to be determinative. With respect to the factors that were relevant, the Board's decision to approve the contract reflects its determination that Federated's performance and actions provided a satisfactory basis to support the decision to continue the existing arrangements.
Annual Shareholder Report
Voting Proxies on Fund Portfolio Securities
A description of the policies and procedures that the Fund uses to determine how to vote proxies, if any, relating to securities held in the Fund's portfolio is available, without charge and upon request, by calling 1-800-341-7400. A report on “Form N-PX” of how the Fund voted any such proxies during the most recent 12-month period ended June 30 is available via the Proxy Voting Record (Form N-PX) link associated with the Fund and share class name at www.FederatedInvestors.com/FundInformation. Form N-PX filings are also available at the SEC's website at www.sec.gov.
Quarterly Portfolio Schedule
The Fund files with the SEC a complete schedule of its portfolio holdings, as of the close of the first and third quarters of its fiscal year, on “Form N-Q.” These filings are available on the SEC's website at www.sec.gov and may be reviewed and copied at the SEC's Public Reference Room in Washington, DC. (Call 1-800-SEC-0330 for information on the operation of the Public Reference Room.) You may also access this information via the link to the Fund and share class name at www.FederatedInvestors.com/FundInformation.
Annual Shareholder Report
Mutual funds are not bank deposits or obligations, are not guaranteed by any bank and are not insured or guaranteed by the U.S. government, the Federal Deposit Insurance Corporation, the Federal Reserve Board or any other government agency. Investment in mutual funds involves investment risk, including the possible loss of principal.
This Report is authorized for distribution to prospective investors only when preceded or accompanied by the Fund's Prospectus, which contains facts concerning its objective and policies, management fees, expenses and other information.
Federated MDT Balanced Fund
Federated Investors Funds
4000 Ericsson Drive
Warrendale, PA 15086-7561
Contact us at FederatedInvestors.com
or call 1-800-341-7400.
Federated Securities Corp., Distributor
CUSIP 31421R841
CUSIP 31421R833
CUSIP 31421R692
CUSIP 31421R825
37326 (9/14)
Federated is a registered trademark of Federated Investors, Inc.
2014 ©Federated Investors, Inc.
Annual Shareholder Report
July 31, 2014
| Share Class | Ticker |
| A | QALGX |
| B | QBLGX |
| C | QCLGX |
| Institutional | QILGX |
Federated MDT Large Cap Growth Fund
Fund Established 2005
A Portfolio of Federated MDT Series
Dear Valued Shareholder,
I am pleased to present the Annual Shareholder Report for your fund covering the period from August 1, 2013 through July 31, 2014. This report includes Management's Discussion of Fund Performance, a complete listing of your fund's holdings, performance information and financial statements along with other important fund information.
In addition, our website, FederatedInvestors.com, offers easy access to Federated resources that include timely fund updates, economic and market insights from our investment strategists, and financial planning tools. We invite you to register to take full advantage of its capabilities.
Thank you for investing with Federated. I hope you find this information useful and look forward to keeping you informed.
Sincerely,
J. Christopher Donahue, President
Not FDIC Insured • May Lose Value • No Bank Guarantee
CONTENTS
| 1 |
| 6 |
| 8 |
| 18 |
| 22 |
| 24 |
| 25 |
| 26 |
| 35 |
| 36 |
| 38 |
| 43 |
| 49 |
| 49 |
Management's Discussion of Fund Performance (unaudited)
The total return of Federated MDT Large Cap Growth Fund (the “Fund”), based on net asset value, for the 12-month reporting period ended July 31, 2014, was 18.92% for Class A Shares, 18.08% for Class B Shares, 18.10% for Class C Shares and 19.24% for the Institutional Shares. The total return for the Russell 1000® Growth Index (R1000G),1 the Fund's broad-based securities market index, was 18.69% for the same period. The total return of the Morningstar Large Growth Funds Average (MLGFA),2 a peer group average for the Fund, was 17.52% during the same period. The Fund's and MLGFA's total returns for the most recently completed fiscal year reflected actual cash flows, transaction costs and other expenses, which were not reflected in the total return of the R1000G.
During the reporting period, the Fund's investment strategy focused on stock selection. This was the most significant factor affecting the Fund's performance relative to the R1000G during the period.
The following discussion will focus on the performance of the Fund's Institutional Shares.
MARKET OVERVIEW
During the 12-month reporting period, domestic equity market performance was very strong as evidenced by the 16.37% return on the Russell 3000® Index.3 Large-cap stocks led the way with the Russell Top 200® Index4 returning 17.38%, closely followed by mid-cap stocks with a 16.36% return on the Russell Midcap® Index.5 Small-cap stocks6 posted a moderate gain with the Russell 2000® Index7 returning 8.56%. Growth stocks outperformed value stocks during the reporting period with the Russell 3000® Growth Index8 returning 17.89%, compared to 14.87% for the Russell 3000® Value Index.9
The best performing sectors in the R1000G during the reporting period were Energy (28.58%), Information Technology (26.24%) and Health Care (25.99%). Underperforming sectors during the same period included Consumer Staples (6.16%), Telecommunications Services (12.20%) and Consumer Discretionary (12.66%).
Annual Shareholder Report
STOCK SELECTION
When looking at the Fund from the point of view of fundamental characteristics, the most significant driver of Fund performance during the 12-month reporting period was holding stocks with improving earnings projections, followed by strong stock selection among stocks with very high repeatable earnings and high value. However, overweighting stocks with very high repeatable earnings, but not high value detracted the most from Fund performance. With respect to sectors, favorable stock selection in the Health Care and Industrials sectors contributed positively to Fund performance. Although the Fund's investment process focused on individual stock selection and not sector weighting, a small underweight in Information Technology, one of the top performing sectors, contributed negatively to Fund performance. The Fund was underweight in several of the largest Information Technology stocks, including Apple Incorporated, Microsoft Corporation, Facebook Incorporated and Google Incorporated. Another negative factor in the Fund's performance was the necessary allocation (1.95%) to cash, which underperformed the strong equity market significantly.
Individual stocks enhancing the Fund's performance during the reporting period included Intel Corporation, Western Digital Corporation and Cardinal Health Incorporated.
Individual stocks detracting from the Fund's performance during the reporting period included Apple Incorporated and Microsoft Corporation, which were both underweighted relative to the R1000G.
| 1 | Please see the footnotes to the line graphs below for definitions of, and further information about, the R1000G. |
| 2 | Please see the footnotes to the line graphs below for definitions of, and further information about, the MLGFA. |
| 3 | The Russell 3000® Index measures the performance of the largest 3,000 U.S. companies representing approximately 98% of the investable U.S. equity market. The Russell 3000® Index is constructed to provide a comprehensive, unbiased and stable barometer of the broad market, and is completely reconstituted annually to ensure new and growing equities are reflected. The index is unmanaged, and it is not possible to invest directly in an index. |
| 4 | The Russell Top 200® Index measures the performance of the largest cap segment of the U.S. equity universe. The Russell Top 200® Index is a subset of the Russell 3000® Index. It includes approximately 200 of the largest securities based on a combination of their market cap and current index membership and represents approximately 68% of the U.S. market. The Russell Top 200® Index is constructed to provide a comprehensive and unbiased barometer for this very large cap segment and is completely reconstituted annually to ensure new and growing equities are reflected. The index is unmanaged, and it is not possible to invest directly in an index. |
| 5 | The Russell Midcap® Index measures the performance of the mid-cap segment of the U.S. equity universe. The Russell Midcap® Index is a subset of the Russell 1000® Index. It includes approximately 800 of the smallest securities based on a combination of their market cap and current index membership. The Russell Midcap® Index represents approximately 31% of the total market capitalization of the Russell 1000® companies. The Russell Midcap® Index is constructed to provide a comprehensive and unbiased barometer for the mid-cap segment. The Russell Midcap Index is completely reconstituted annually to ensure larger stocks do not distort the performance and characteristics of the true mid-cap opportunity set. The index is unmanaged, and it is not possible to invest directly in an index. |
| 6 | Small-cap stocks may be less liquid and subject to greater price volatility than large-cap stocks. |
Annual Shareholder Report
| 7 | The Russell 2000® Index measures the performance of the small-cap segment of the U.S. equity universe. The Russell 2000® Index is a subset of the Russell 3000® Index representing approximately 10% of the total market capitalization of that index. It includes approximately 2000 of the smallest securities based on a combination of their market cap and current index membership. The Russell 2000® Index is constructed to provide a comprehensive and unbiased small-cap barometer and is completely reconstituted annually to ensure larger stocks do not distort the performance and characteristics of the true small-cap opportunity set. The index is unmanaged, and it is not possible to invest directly in an index. |
| 8 | The Russell 3000® Growth Index measures the performance of the broad growth segment of the U.S. equity universe. It includes those Russell 3000® Index companies with higher price-to-book ratios and higher forecasted growth values. The Russell 3000® Growth Index is constructed to provide a comprehensive, unbiased and stable barometer of the broad growth market. The Russell 3000 Growth Index is completely reconstituted annually to ensure new and growing equities are included and that the represented companies continue to reflect growth characteristics. The index is unmanaged, and it is not possible to invest directly in an index. |
| 9 | The Russell 3000® Value Index measures the performance of the broad value segment of U.S. equity value universe. It includes those Russell 3000® Index companies with lower price-to-book ratios and lower forecasted growth values. The Russell 3000® Value Index is constructed to provide a comprehensive, unbiased and stable barometer of the broad value market. The Russell 3000 Value Index is completely reconstituted annually to ensure new and growing equities are included and that the represented companies continue to reflect value characteristics. The index is unmanaged, and it is not possible to invest directly in an index. |
Annual Shareholder Report
FUND PERFORMANCE AND GROWTH OF A $10,000 INVESTMENT
The graph below illustrates the hypothetical investment of $10,0001 in the Federated MDT Large Cap Growth Fund2 (the “Fund”) from September 15, 2005 (start of performance) to July 31, 2014, compared to the Russell 1000® Growth Index (R1000G)3 and the Morningstar Large Growth Funds Average (MLGFA).4 The Average Annual Total Return table below shows returns for each class averaged over the stated periods.
Growth of a $10,000 Investment
Growth of $10,000 as of July 31, 2014
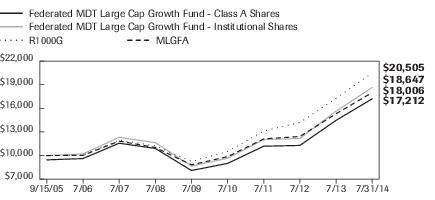
| Federated MDT Large Cap Growth Fund - | Class A Shares | Institutional Shares | R1000G | MLGFA |
| F | F | I | I |
| 9/15/2005 | 9,450 | 10,000 | 10,000 | 10,000 |
| 7/31/2006 | 9,620 | 10,210 | 10,027 | 10,033 |
| 7/31/2007 | 11,569 | 12,322 | 11,979 | 11,836 |
| 7/31/2008 | 10,903 | 11,639 | 11,225 | 11,022 |
| 7/31/2009 | 8,100 | 8,676 | 9,253 | 8,823 |
| 7/31/2010 | 9,006 | 9,656 | 10,516 | 9,859 |
| 7/31/2011 | 11,190 | 12,033 | 13,119 | 12,116 |
| 7/31/2012 | 11,286 | 12,169 | 14,203 | 12,422 |
| 7/31/2013 | 14,473 | 15,639 | 17,277 | 15,312 |
| 7/31/2014 | 17,212 | 18,647 | 20,505 | 18,006 |
41 graphic description end -->
| ■ | Total returns shown for Class A Shares include the maximum sales charge of 5.50% ($10,000 investment minus $550 sales charge = $9,450). |
The Fund offers multiple share classes whose performance may be greater than or less than its other share class(es) due to differences in sales charges and expenses. See the Average Annual Return table below for the returns of additional classes not shown in the line graph above.
Average Annual Total Returns for the Period Ended 7/31/2014
(returns reflect all applicable sales charges and contingent deferred sales charge as specified below in footnote #1)
| | 1 Year | 5 Years | Start of
Performance* |
| Class A Shares | 12.39% | 14.97% | 6.31% |
| Class B Shares5 | 12.58% | 15.17% | 6.31% |
| Class C Shares | 17.10% | 15.38% | 6.18% |
| Institutional Shares | 19.24% | 16.54% | 7.27% |
| R1000G | 18.69% | 17.25% | 8.43% |
| MLGFA | 17.52% | 15.64% | 6.90% |
| * | The Fund's start of performance date was September 15, 2005. |
| | |
Annual Shareholder Report
Performance data quoted represents past performance which is no guarantee of future results. Investment return and principal value will fluctuate so that an investor's shares, when redeemed, may be worth more or less than their original cost. Mutual fund performance changes over time and current performance may be lower or higher than what is stated. For current to the most recent month-end performance and after-tax returns, visit FederatedInvestors.com or call 1-800-341-7400. Returns shown do not reflect the deduction of taxes that a shareholder would pay on Fund distributions or the redemption of Fund shares. Mutual funds are not obligations of or guaranteed by any bank and are not federally insured.
| 1 | Represents a hypothetical investment of $10,000 in the Fund after deducting applicable sales charges: for Class A Shares, the maximum sales charge of 5.50% ($10,000 investment minus $550 sales charges = $9,450); for Class B Shares, the maximum contingent deferred sales charge is 5.50% on any redemption less than one year from the purchase date; for Class C Shares, a 1.00% contingent deferred sales charge would be applied to any redemption less than one year from the purchase date. The Fund's performance assumes the reinvestment of all dividends and distributions. The R1000G has been adjusted to reflect reinvestment of dividends on securities. |
| 2 | The Fund is the successor to the MDT Large Cap Growth Fund pursuant to a reorganization that took place on December 8, 2006. Prior to that date, the Fund had no investment operations. Accordingly, the performance information shown for the periods prior to that date is that of the MDT Large Cap Growth Fund. |
| 3 | The R1000G measures the performance of the large-cap growth segment of the U.S. equity universe. It includes those Russell 1000® Index companies with higher price-to-book ratios and higher forecasted growth values. The R1000G is constructed to provide a comprehensive and unbiased barometer for the large-cap growth segment. The R1000G is completely reconstituted annually to ensure new and growing equities are included and that the represented companies continue to reflect growth characteristics. The R1000G is unmanaged and, unlike the Fund, is not affected by cash flows. It is not possible to invest directly in an index. The R1000G is not adjusted to reflect sales charges, expenses or other fees that the Securities and Exchange Commission requires to be reflected in the Fund's performance. |
| 4 | Morningstar figures represent the average of the total returns reported by all the mutual funds designated by Morningstar as falling into the respective category indicated. They do not reflect sales charges. |
| 5 | The start of performance date for the Fund was September 15, 2005. Class B Shares of the Fund were offered beginning March 29, 2007. Performance results shown before that date are for the Fund's Institutional Shares and have been adjusted for the maximum contingent deferred sales charge and total annual operating expenses applicable to the Fund's Class B Shares. The Fund's Institutional Shares commenced operations on September 15, 2005. Subject to the expense adjustments described above, the Fund's Class B Shares annual returns would have been substantially similar to those of the Fund's Institutional Shares because Shares of each class are invested in the same portfolio of securities. |
Annual Shareholder Report
Portfolio of Investments Summary Table (unaudited)
At July 31, 2014, the Fund's industry composition1 was follows:
| Industry Composition | Percentage of
Total Net Assets |
| Biotechnology | 4.8% |
| Software Packaged/Custom | 4.6% |
| Soft Drinks | 4.0% |
| Specialty Retailing | 3.9% |
| Technology Hardware Storage & Peripherals | 3.7% |
| Computers—Low End | 2.8% |
| Internet Services | 2.8% |
| Crude Oil & Gas Production | 2.5% |
| Semiconductor Manufacturing | 2.3% |
| Textiles, Apparel & Luxury Goods | 2.2% |
| Clothing Stores | 2.0% |
| Defense Aerospace | 1.9% |
| Medical Supplies | 1.8% |
| Food Products | 1.7% |
| Health Care Providers & Services | 1.7% |
| Toys & Games | 1.7% |
| Computers—High End | 1.6% |
| Broadcasting | 1.5% |
| Commodity Chemicals | 1.5% |
| Financial Services | 1.5% |
| Construction Machinery | 1.4% |
| Other Communications Equipment | 1.4% |
| Grocery Chain | 1.3% |
| Hotels and Motels | 1.3% |
| Mutual Fund Adviser | 1.3% |
| Agricultural Machinery | 1.2% |
| Airlines | 1.2% |
| Drug Stores | 1.2% |
| Life Insurance | 1.2% |
| Telecommunication Equipment & Services | 1.2% |
| Discount Department Stores | 1.1% |
| Department Stores | 1.0% |
| Ethical Drugs | 1.0% |
| Other2 | 31.9% |
| Cash Equivalents3 | 1.9% |
| Other Assets and Liabilities—Net4 | (0.1)% |
| TOTAL | 100.0% |
Annual Shareholder Report
| 1 | Except for Cash Equivalents and Other Assets and Liabilities, industry classifications are based upon, and individual portfolio securities are assigned to, the classifications of the Global Industry Classification Standard (GICS) except that the Adviser assigns a classification to securities not classified by the GICS and to securities for which the Adviser does not have access to the classification made by the GICS. |
| 2 | For purposes of this table, industry classifications which constitute less than 1.0% of the Fund's total net assets have been aggregated under the designation “Other.” |
| 3 | Cash Equivalents include any investments in money market mutual funds and/or overnight repurchase agreements. |
| 4 | Assets, other than investments in securities, less liabilities. See Statement of Assets and Liabilities. |
Annual Shareholder Report
Portfolio of Investments
July 31, 2014
| Shares | | | Value |
| | | COMMON STOCKS—98.2% | |
| | | Aerospace & Defense—0.2% | |
| 1,800 | | Huntington Ingalls Industries, Inc. | $163,656 |
| | | Agricultural Chemicals—0.5% | |
| 8,035 | | Scotts Miracle-Gro Co. | 427,462 |
| | | Agricultural Machinery—1.2% | |
| 11,800 | | Deere & Co. | 1,004,298 |
| | | Air Freight & Logistics—0.6% | |
| 3,700 | | FedEx Corp. | 543,456 |
| | | Airline - National—0.9% | |
| 17,327 | 1 | United Continental Holdings, Inc. | 803,800 |
| | | Airline - Regional—0.4% | |
| 7,400 | | Alaska Air Group, Inc. | 325,378 |
| | | Airlines—1.2% | |
| 1,100 | | Copa Holdings SA, Class A | 167,057 |
| 13,700 | | Delta Air Lines, Inc. | 513,202 |
| 5,700 | | Southwest Airlines Co. | 161,196 |
| 2,400 | 1 | Spirit Airlines, Inc. | 157,008 |
| | | TOTAL | 998,463 |
| | | Apparel—0.3% | |
| 3,700 | | L Brands, Inc. | 214,489 |
| | | AT&T Divestiture—0.9% | |
| 15,136 | | Verizon Communications, Inc. | 763,157 |
| | | Auto Components—0.4% | |
| 14,600 | | Goodyear Tire & Rubber Co. | 367,482 |
| | | Auto Manufacturing—0.5% | |
| 25,317 | | Ford Motor Co. | 430,895 |
| | | Auto Original Equipment Manufacturers—0.2% | |
| 2,400 | | BorgWarner, Inc. | 149,400 |
| | | Auto Part Replacement—0.9% | |
| 8,907 | | Genuine Parts Co. | 737,678 |
| | | Auto Rentals—0.6% | |
| 5,100 | 1 | United Rentals, Inc. | 540,090 |
| | | Baking—0.3% | |
| 12,348 | | Flowers Foods, Inc. | 235,723 |
| | | Biotechnology—4.8% | |
| 6,400 | 1 | Alexion Pharmaceuticals, Inc. | 1,017,536 |
Annual Shareholder Report
| Shares | | | Value |
| | | COMMON STOCKS—continued | |
| | | Biotechnology—continued | |
| 2,400 | 1 | Biogen Idec, Inc. | $802,536 |
| 11,700 | 1 | Gilead Sciences, Inc. | 1,071,135 |
| 3,700 | 1 | Illumina, Inc. | 591,667 |
| 2,300 | 1 | Medivation, Inc. | 170,729 |
| 5,900 | 1 | Myriad Genetics, Inc. | 212,990 |
| 1,500 | 1 | Pharmacyclics, Inc. | 180,660 |
| | | TOTAL | 4,047,253 |
| | | Broadcasting—1.5% | |
| 14,653 | 1 | DIRECTV Group, Inc. | 1,260,891 |
| | | Building Materials—0.3% | |
| 6,000 | | Fortune Brands Home & Security, Inc. | 226,740 |
| | | Cable TV—0.3% | |
| 3,600 | | Viacom, Inc., Class B | 297,612 |
| | | Capital Markets—0.4% | |
| 5,900 | | Franklin Resources, Inc. | 319,485 |
| | | Chemicals—0.9% | |
| 1,700 | | Eastman Chemical Co. | 133,926 |
| 5,900 | | LyondellBasell Industries NV | 626,875 |
| | | TOTAL | 760,801 |
| | | Clothing Stores—2.0% | |
| 20,915 | | Gap (The), Inc. | 838,901 |
| 9,129 | | Hanesbrands, Inc. | 891,994 |
| | | TOTAL | 1,730,895 |
| | | Commodity Chemicals—1.5% | |
| 4,200 | | DuPont (E.I.) de Nemours & Co. | 270,102 |
| 15,925 | | RPM International, Inc. | 703,567 |
| 3,400 | | Westlake Chemical Corp. | 297,126 |
| | | TOTAL | 1,270,795 |
| | | Computer Services—0.5% | |
| 1,000 | 1 | Cognizant Technology Solutions Corp. | 49,050 |
| 2,600 | 1 | Fiserv, Inc. | 160,342 |
| 3,500 | | Global Payments, Inc. | 242,445 |
| | | TOTAL | 451,837 |
| | | Computers - High End—1.6% | |
| 7,200 | | IBM Corp. | 1,380,024 |
| | | Computers - Low End—2.8% | |
| 24,865 | | Apple, Inc. | 2,376,348 |
Annual Shareholder Report
| Shares | | | Value |
| | | COMMON STOCKS—continued | |
| | | Construction Machinery—1.4% | |
| 6,700 | | Caterpillar, Inc. | $675,025 |
| 8,900 | | Joy Global, Inc. | 527,414 |
| | | TOTAL | 1,202,439 |
| | | Cosmetics & Toiletries—0.9% | |
| 15,906 | | Avon Products, Inc. | 209,959 |
| 5,600 | | Estee Lauder Cos., Inc., Class A | 411,376 |
| 5,600 | 1 | Sally Beauty Holdings, Inc. | 145,320 |
| | | TOTAL | 766,655 |
| | | Crude Oil & Gas Production—2.5% | |
| 9,600 | | EOG Resources, Inc. | 1,050,624 |
| 6,083 | 1 | Newfield Exploration Co. | 245,145 |
| 1,000 | | Pioneer Natural Resources, Inc. | 221,460 |
| 5,700 | | SM Energy Co. | 447,678 |
| 4,700 | 1 | Southwestern Energy Co. | 190,726 |
| | | TOTAL | 2,155,633 |
| | | Defense Aerospace—1.9% | |
| 4,908 | 1 | B/E Aerospace, Inc. | 417,867 |
| 2,900 | | Boeing Co. | 349,392 |
| 5,100 | | Lockheed Martin Corp. | 851,547 |
| | | TOTAL | 1,618,806 |
| | | Department Stores—1.0% | |
| 2,000 | | Dillards, Inc., Class A | 238,440 |
| 9,900 | | Target Corp. | 589,941 |
| | | TOTAL | 828,381 |
| | | Discount Department Stores—1.1% | |
| 500 | | Family Dollar Stores, Inc. | 37,375 |
| 11,832 | | Wal-Mart Stores, Inc. | 870,599 |
| | | TOTAL | 907,974 |
| | | Diversified Consumer Services—0.2% | |
| 4,500 | | Block (H&R), Inc. | 144,585 |
| | | Diversified Leisure—0.5% | |
| 5,700 | | Las Vegas Sands Corp. | 420,945 |
| | | Diversified Tobacco—0.2% | |
| 3,600 | | Altria Group, Inc. | 146,160 |
| | | Drug Stores—1.2% | |
| 14,800 | | Walgreen Co. | 1,017,796 |
| | | Education & Training Services—0.2% | |
| 5,400 | 1 | Apollo Group, Inc., Class A | 150,822 |
Annual Shareholder Report
| Shares | | | Value |
| | | COMMON STOCKS—continued | |
| | | Education & Training Services—continued | |
| 3,604 | 1 | ITT Educational Services, Inc. | $51,285 |
| | | TOTAL | 202,107 |
| | | Electrical - Radio & TV—0.3% | |
| 2,000 | | Harman International Industries, Inc. | 217,100 |
| | | Electrical Equipment—0.3% | |
| 3,400 | | Emerson Electric Co. | 216,410 |
| | | Ethical Drugs—1.0% | |
| 8,791 | | Eli Lilly & Co. | 536,778 |
| 3,600 | 1 | United Therapeutics Corp. | 327,384 |
| | | TOTAL | 864,162 |
| | | Financial Services—1.5% | |
| 3,600 | | American Express Co. | 316,800 |
| 1,100 | | BlackRock, Inc. | 335,203 |
| 4,000 | | Lazard Ltd., Class A | 209,200 |
| 6,700 | 1 | Verifone Systems, Inc. | 224,517 |
| 12,400 | | Western Union Co. | 216,628 |
| | | TOTAL | 1,302,348 |
| | | Food Products—1.7% | |
| 17,200 | | ConAgra Foods, Inc. | 518,236 |
| 11,000 | | Kellogg Co. | 658,130 |
| 4,700 | | Kraft Foods Group, Inc. | 251,849 |
| | | TOTAL | 1,428,215 |
| | | Gas Utilities—0.8% | |
| 6,800 | | EQT Corp. | 637,976 |
| | | Grocery Chain—1.3% | |
| 16,677 | | Kroger Co. | 816,839 |
| 7,500 | | Whole Foods Market, Inc. | 286,650 |
| | | TOTAL | 1,103,489 |
| | | Health Care Equipment & Supplies—0.2% | |
| 2,600 | | Stryker Corp. | 207,402 |
| | | Health Care Providers & Services—1.7% | |
| 5,500 | 1 | Express Scripts Holding Co. | 383,075 |
| 5,000 | 1 | HCA, Inc. | 326,550 |
| 5,800 | 1 | Laboratory Corp. of America Holdings | 601,402 |
| 2,900 | 1 | Quintiles Transnational Holdings, Inc. | 159,297 |
| | | TOTAL | 1,470,324 |
| | | Home Products—0.3% | |
| 3,600 | | Tupperware Brands Corp. | 262,008 |
Annual Shareholder Report
| Shares | | | Value |
| | | COMMON STOCKS—continued | |
| | | Hotels and Motels—1.3% | |
| 4,700 | | Marriott International, Inc., Class A | $304,137 |
| 6,200 | | Wyndham Worldwide Corp. | 468,410 |
| 1,400 | | Wynn Resorts Ltd. | 298,480 |
| | | TOTAL | 1,071,027 |
| | | Household Durables—0.5% | |
| 200 | 1 | NVR, Inc. | 225,292 |
| 5,200 | | Newell Rubbermaid, Inc. | 168,896 |
| | | TOTAL | 394,188 |
| | | Industrial Machinery—0.7% | |
| 1,800 | | Dover Corp. | 154,368 |
| 5,000 | | Ingersoll-Rand PLC, Class A | 293,950 |
| 1,100 | | Valmont Industries, Inc. | 160,193 |
| | | TOTAL | 608,511 |
| | | Insurance—0.2% | |
| 1,800 | | Aon PLC | 151,848 |
| | | Internet Services—2.8% | |
| 12,400 | 1 | eBay, Inc. | 654,720 |
| 1,100 | 1 | Google, Inc. | 637,505 |
| 13,000 | | IAC Interactive Corp. | 873,600 |
| 400 | 1 | NetFlix, Inc. | 169,088 |
| | | TOTAL | 2,334,913 |
| | | IT Services—0.6% | |
| 4,300 | | Accenture PLC | 340,904 |
| 4,500 | | Paychex, Inc. | 184,545 |
| | | TOTAL | 525,449 |
| | | Life Insurance—1.2% | |
| 12,000 | | Prudential Financial, Inc. | 1,043,640 |
| | | Media—0.4% | |
| 3,800 | | Walt Disney Co. | 326,344 |
| | | Medical Supplies—1.8% | |
| 900 | | Allergan, Inc. | 149,274 |
| 1,300 | | Bard (C.R.), Inc. | 193,999 |
| 1,900 | | Baxter International, Inc. | 141,911 |
| 1,900 | | Becton, Dickinson & Co. | 220,856 |
| 9,348 | | Cardinal Health, Inc. | 669,784 |
| 3,400 | | Patterson Cos., Inc. | 132,634 |
| | | TOTAL | 1,508,458 |
Annual Shareholder Report
| Shares | | | Value |
| | | COMMON STOCKS—continued | |
| | | Medical Technology—0.8% | |
| 9,932 | | St. Jude Medical, Inc. | $647,467 |
| | | Miscellaneous Components—0.2% | |
| 2,100 | | Amphenol Corp., Class A | 201,957 |
| | | Miscellaneous Machinery—0.1% | |
| 400 | | Rockwell Automation, Inc. | 44,664 |
| | | Multi-Industry Capital Goods—0.3% | |
| 1,200 | | 3M Co. | 169,068 |
| 1,400 | | Honeywell International, Inc. | 128,562 |
| | | TOTAL | 297,630 |
| | | Multi-Line Insurance—0.8% | |
| 18,000 | | Allied World Assurance Holdings Ltd. | 648,180 |
| | | Multiline Retail—0.5% | |
| 7,500 | | Macy's, Inc. | 433,425 |
| | | Mutual Fund Adviser—1.3% | |
| 2,400 | 1 | Affiliated Managers Group | 478,200 |
| 6,000 | | T. Rowe Price Group, Inc. | 465,960 |
| 2,300 | | Waddell & Reed Financial, Inc., Class A | 121,417 |
| | | TOTAL | 1,065,577 |
| | | Office Equipment—0.9% | |
| 28,428 | | Pitney Bowes, Inc. | 769,262 |
| | | Office Supplies—0.6% | |
| 11,485 | | Avery Dennison Corp. | 542,207 |
| | | Offshore Driller—0.2% | |
| 1,900 | | Oceaneering International, Inc. | 129,029 |
| | | Oil Gas & Consumable Fuels—0.6% | |
| 2,900 | | Marathon Petroleum Corp. | 242,092 |
| 3,100 | | Phillips 66 | 251,441 |
| | | TOTAL | 493,533 |
| | | Oil Refiner—0.2% | |
| 3,500 | | CVR Energy, Inc. | 164,780 |
| | | Oil Service, Explore & Drill—0.6% | |
| 3,400 | | Helmerich & Payne, Inc. | 361,284 |
| 4,200 | | Patterson-UTI Energy, Inc. | 144,270 |
| | | TOTAL | 505,554 |
| | | Oil Well Supply—0.9% | |
| 4,100 | 1 | Cameron International Corp. | 290,731 |
| 100 | 1 | Dril-Quip, Inc. | 10,077 |
| 5,300 | | Halliburton Co. | 365,647 |
Annual Shareholder Report
| Shares | | | Value |
| | | COMMON STOCKS—continued | |
| | | Oil Well Supply—continued | |
| 800 | | Schlumberger Ltd. | $86,712 |
| | | TOTAL | 753,167 |
| | | Other Communications Equipment—1.4% | |
| 10,717 | | Harris Corp. | 731,650 |
| 700 | 1 | SBA Communications Corp. | 74,851 |
| 8,200 | | Skyworks Solutions, Inc. | 416,232 |
| | | TOTAL | 1,222,733 |
| | | Outpatient Clinics—0.2% | |
| 2,100 | 1 | DaVita HealthCare Partners, Inc. | 147,924 |
| | | Paper Products—0.9% | |
| 5,200 | | International Paper Co. | 247,000 |
| 5,200 | | Rock-Tenn Co. | 517,036 |
| | | TOTAL | 764,036 |
| | | Personal & Household—0.4% | |
| 5,300 | | Nu Skin Enterprises, Inc., Class A | 311,057 |
| | | Personal Products—0.4% | |
| 3,600 | | Kimberly-Clark Corp. | 373,932 |
| | | Pharmaceuticals—0.4% | |
| 6,600 | | AbbVie, Inc. | 345,444 |
| | | Plastic Containers—0.6% | |
| 15,128 | 1 | Owens-Illinois, Inc. | 471,842 |
| | | Pollution Control—0.1% | |
| 800 | | Danaher Corp. | 59,104 |
| | | Printing—0.2% | |
| 11,646 | | Donnelley (R.R.) & Sons Co. | 202,175 |
| | | Professional Services—0.3% | |
| 2,200 | | Dun & Bradstreet Corp. | 242,066 |
| | | Property Liability Insurance—0.7% | |
| 6,906 | | The Travelers Cos., Inc. | 618,501 |
| | | Railroad—0.8% | |
| 4,400 | | Union Pacific Corp. | 432,564 |
| 3,000 | | Wabtec Corp. | 242,040 |
| | | TOTAL | 674,604 |
| | | Restaurant—0.3% | |
| 4,700 | | Darden Restaurants, Inc. | 219,725 |
| | | Restaurants—0.5% | |
| 600 | 1 | Chipotle Mexican Grill, Inc. | 403,500 |
Annual Shareholder Report
| Shares | | | Value |
| | | COMMON STOCKS—continued | |
| | | Semiconductor Manufacturing—2.3% | |
| 19,500 | | Broadcom Corp. | $746,070 |
| 35,931 | | Intel Corp. | 1,217,702 |
| | | TOTAL | 1,963,772 |
| | | Semiconductors & Semiconductor Equipment—0.8% | |
| 7,300 | | Microchip Technology, Inc. | 328,646 |
| 8,200 | | Texas Instruments, Inc. | 379,250 |
| | | TOTAL | 707,896 |
| | | Services to Medical Professionals—0.3% | |
| 2,300 | 1 | Henry Schein, Inc. | 267,375 |
| | | Soft Drinks—4.0% | |
| 19,594 | | Coca-Cola Enterprises, Inc. | 890,547 |
| 25,130 | | Dr. Pepper Snapple Group, Inc. | 1,476,639 |
| 11,910 | | PepsiCo, Inc. | 1,049,271 |
| | | TOTAL | 3,416,457 |
| | | Software Packaged/Custom—4.6% | |
| 35,613 | | CA, Inc. | 1,028,504 |
| 2,300 | 1 | Commvault Systems, Inc. | 110,446 |
| 10,700 | 1 | Electronic Arts, Inc. | 359,520 |
| 3,400 | 1 | F5 Networks, Inc. | 382,806 |
| 6,700 | | Microsoft Corp. | 289,172 |
| 10,400 | | Oracle Corp. | 420,056 |
| 53,408 | | Symantec Corp. | 1,263,633 |
| | | TOTAL | 3,854,137 |
| | | Specialty Chemicals—0.3% | |
| 2,500 | | Airgas, Inc. | 267,300 |
| | | Specialty Retailing—3.9% | |
| 800 | 1 | AutoZone, Inc. | 413,624 |
| 7,400 | 1 | Bed Bath & Beyond, Inc. | 468,346 |
| 5,900 | | Big Lots, Inc. | 258,125 |
| 1,500 | | Costco Wholesale Corp. | 176,310 |
| 5,300 | 1 | Dollar General Corp. | 292,719 |
| 5,000 | | Expedia, Inc. | 397,100 |
| 4,516 | | GNC Acquisition Holdings, Inc. | 148,170 |
| 8,300 | | Lowe's Cos., Inc. | 397,155 |
| 6,136 | | Nordstrom, Inc. | 424,795 |
| 4,200 | | PetSmart, Inc. | 286,188 |
| | | TOTAL | 3,262,532 |
Annual Shareholder Report
| Shares | | | Value |
| | | COMMON STOCKS—continued | |
| | | Technology Hardware Storage & Peripherals—3.7% | |
| 20,400 | | EMC Corp. | $597,720 |
| 19,800 | | NetApp, Inc. | 769,032 |
| 7,700 | | Sandisk Corp. | 706,167 |
| 4,300 | 1 | Teradata Corp. | 181,288 |
| 8,800 | | Western Digital Corp. | 878,504 |
| | | TOTAL | 3,132,711 |
| | | Telecommunication Equipment & Services—1.2% | |
| 6,400 | | Motorola, Inc. | 407,552 |
| 8,200 | | Qualcomm, Inc. | 604,340 |
| | | TOTAL | 1,011,892 |
| | | Telephone Utility—0.4% | |
| 28,204 | | Windstream Corp. | 323,218 |
| | | Textiles Apparel & Luxury Goods—2.2% | |
| 12,800 | | Coach, Inc. | 442,368 |
| 2,700 | 1 | Fossil, Inc. | 264,600 |
| 1,200 | 1 | Michael Kors Holdings Ltd. | 97,776 |
| 4,700 | | PVH Corp. | 517,846 |
| 3,300 | | Ralph Lauren Corp. | 514,338 |
| | | TOTAL | 1,836,928 |
| | | Tobacco—0.3% | |
| 2,700 | | Philip Morris International, Inc. | 221,427 |
| | | Toys & Games—1.7% | |
| 19,065 | | Hasbro, Inc. | 952,487 |
| 14,800 | | Mattel, Inc. | 524,290 |
| | | TOTAL | 1,476,777 |
| | | Trading Companies & Distributors—0.4% | |
| 1,400 | | Grainger (W.W.), Inc. | 329,210 |
| | | Truck Manufacturing—0.4% | |
| 2,400 | | Cummins, Inc. | 334,536 |
| | | Undesignated Consumer Cyclicals—0.8% | |
| 5,300 | 1 | Avis Budget Group, Inc. | 297,807 |
| 6,300 | | Herbalife Ltd. | 330,120 |
| 3,300 | | Weight Watchers International, Inc. | 71,577 |
| | | TOTAL | 699,504 |
| | | Uniforms—0.3% | |
| 4,736 | | Cintas Corp. | 296,474 |
| | | TOTAL COMMON STOCKS
(IDENTIFIED COST $69,038,521) | 83,068,622 |
Annual Shareholder Report
| Shares | | | Value |
| | | INVESTMENT COMPANY—1.9% | |
| 1,586,489 | 2,3 | Federated Prime Value Obligations Fund, Institutional Shares, 0.07%
(AT NET ASSET VALUE) | $1,586,489 |
| | | TOTAL INVESTMENTS—100.1%
(IDENTIFIED COST $70,625,010)4 | 84,655,111 |
| | | OTHER ASSETS AND LIABILITIES - NET—(0.1)%5 | (69,468) |
| | | TOTAL NET ASSETS—100% | $84,585,643 |
| 1 | Non-income-producing security. |
| 2 | Affiliated holding. |
| 3 | 7-day net yield. |
| 4 | The cost of investments for federal tax purposes amounts to $70,620,282. |
| 5 | Assets, other than investments in securities, less liabilities. See Statement of Assets and Liabilities. |
Note: The categories of investments are shown as a percentage of total net assets at July 31, 2014.
Various inputs are used in determining the value of the Fund's investments. These inputs are summarized in the three broad levels listed below:
Level 1—quoted prices in active markets for identical securities, including investment companies with daily net asset values, if applicable.
Level 2—other significant observable inputs (including quoted prices for similar securities, interest rates, prepayment speeds, credit risk, etc.). Also includes securities valued at amortized cost.
Level 3—significant unobservable inputs (including the Fund's own assumptions in determining the fair value of investments).
The inputs or methodology used for valuing securities are not an indication of the risk associated with investing in those securities.
As of July 31, 2014, all investments of the Fund utilized Level 1 inputs in valuing the Fund's assets carried at fair value.
See Notes which are an integral part of the Financial Statements
Annual Shareholder Report
Financial Highlights–Class A Shares
(For a Share Outstanding Throughout Each Period)
| Year Ended July 31 | 2014 | 2013 | 2012 | 2011 | 2010 |
| Net Asset Value, Beginning of Period | $13.58 | $10.59 | $10.50 | $8.45 | $7.60 |
| Income From Investment Operations: | | | | | |
| Net investment income (loss)1 | 0.03 | 0.04 | (0.02) | (0.03) | (0.01) |
| Net realized and unrealized gain on investments | 2.54 | 2.95 | 0.11 | 2.08 | 0.86 |
| TOTAL FROM INVESTMENT OPERATIONS | 2.57 | 2.99 | 0.09 | 2.05 | 0.85 |
| Net Asset Value, End of Period | $16.15 | $13.58 | $10.59 | $10.50 | $8.45 |
| Total Return2 | 18.92% | 28.23% | 0.86% | 24.26% | 11.18% |
| Ratios to Average Net Assets: | | | | | |
| Net expenses | 1.50% | 1.50% | 1.50% | 1.50% | 1.50% |
| Net investment income (loss) | 0.17% | 0.34% | (0.23)% | (0.28)% | (0.08)% |
| Expense waiver/reimbursement3 | 0.11% | 0.27% | 0.78% | 0.74% | 0.55% |
| Supplemental Data: | | | | | |
| Net assets, end of period (000 omitted) | $54,573 | $49,018 | $40,676 | $44,762 | $45,993 |
| Portfolio turnover | 51% | 135% | 258% | 208% | 217% |
| 1 | Per share numbers have been calculated using the average shares method. |
| 2 | Based on net asset value, which does not reflect the sales charge, redemption fee or contingent deferred sales charge, if applicable. |
| 3 | This expense decrease is reflected in both the net expense and the net investment income (loss) ratios shown above. |
See Notes which are an integral part of the Financial Statements
Annual Shareholder Report
Financial Highlights–Class B Shares
(For a Share Outstanding Throughout Each Period)
| Year Ended July 31 | 2014 | 2013 | 2012 | 2011 | 2010 |
| Net Asset Value, Beginning of Period | $13.05 | $10.25 | $10.24 | $8.30 | $7.53 |
| Income From Investment Operations: | | | | | |
| Net investment income (loss)1 | (0.09) | (0.05) | (0.10) | (0.10) | (0.07) |
| Net realized and unrealized gain on investments | 2.45 | 2.85 | 0.11 | 2.04 | 0.84 |
| TOTAL FROM INVESTMENT OPERATIONS | 2.36 | 2.80 | 0.01 | 1.94 | 0.77 |
| Net Asset Value, End of Period | $15.41 | $13.05 | $10.25 | $10.24 | $8.30 |
| Total Return2 | 18.08% | 27.32% | 0.10% | 23.37% | 10.23% |
| Ratios to Average Net Assets: | | | | | |
| Net expenses | 2.25% | 2.25% | 2.25% | 2.25% | 2.25% |
| Net investment income (loss) | (0.59)% | (0.44)% | (0.98)% | (1.04)% | (0.86)% |
| Expense waiver/reimbursement3 | 0.11% | 0.26% | 0.78% | 0.74% | 0.56% |
| Supplemental Data: | | | | | |
| Net assets, end of period (000 omitted) | $10,519 | $7,428 | $4,932 | $6,680 | $7,506 |
| Portfolio turnover | 51% | 135% | 258% | 208% | 217% |
| 1 | Per share numbers have been calculated using the average shares method. |
| 2 | Based on net asset value, which does not reflect the sales charge, redemption fee or contingent deferred sales charge, if applicable. |
| 3 | This expense decrease is reflected in both the net expense and the net investment income (loss) ratios shown above. |
See Notes which are an integral part of the Financial Statements
Annual Shareholder Report
Financial Highlights–Class C Shares
(For a Share Outstanding Throughout Each Period)
| Year Ended July 31 | 2014 | 2013 | 2012 | 2011 | 2010 |
| Net Asset Value, Beginning of Period | $12.76 | $10.03 | $10.02 | $8.12 | $7.37 |
| Income From Investment Operations: | | | | | |
| Net investment income (loss)1 | (0.08) | (0.05) | (0.09) | (0.10) | (0.07) |
| Net realized and unrealized gain on investments | 2.39 | 2.78 | 0.10 | 2.00 | 0.82 |
| TOTAL FROM INVESTMENT OPERATIONS | 2.31 | 2.73 | 0.01 | 1.90 | 0.75 |
| Net Asset Value, End of Period | $15.07 | $12.76 | $10.03 | $10.02 | $8.12 |
| Total Return2 | 18.10% | 27.22% | 0.10% | 23.40% | 10.18% |
| Ratios to Average Net Assets: | | | | | |
| Net expenses | 2.25% | 2.25% | 2.25% | 2.25% | 2.25% |
| Net investment income (loss) | (0.59)% | (0.43)% | (0.98)% | (1.05)% | (0.86)% |
| Expense waiver/reimbursement3 | 0.11% | 0.27% | 0.78% | 0.74% | 0.56% |
| Supplemental Data: | | | | | |
| Net assets, end of period (000 omitted) | $11,991 | $9,830 | $7,001 | $7,564 | $6,816 |
| Portfolio turnover | 51% | 135% | 258% | 208% | 217% |
| 1 | Per share numbers have been calculated using the average shares method. |
| 2 | Based on net asset value, which does not reflect the sales charge, redemption fee or contingent deferred sales charge, if applicable. |
| 3 | This expense decrease is reflected in both the net expense and the net investment income (loss) ratios shown above. |
See Notes which are an integral part of the Financial Statements
Annual Shareholder Report
Financial Highlights–Institutional Shares
(For a Share Outstanding Throughout Each Period)
| Year Ended July 31 | 2014 | 2013 | 2012 | 2011 | 2010 |
| Net Asset Value, Beginning of Period | $13.88 | $10.80 | $10.68 | $8.57 | $7.70 |
| Income From Investment Operations: | | | | | |
| Net investment income (loss)1 | 0.06 | 0.07 | 0.002 | (0.00)2 | 0.01 |
| Net realized and unrealized gain on investments | 2.61 | 3.01 | 0.12 | 2.11 | 0.86 |
| TOTAL FROM INVESTMENT OPERATIONS | 2.67 | 3.08 | 0.12 | 2.11 | 0.87 |
| Net Asset Value, End of Period | $16.55 | $13.88 | $10.80 | $10.68 | $8.57 |
| Total Return3 | 19.24% | 28.52% | 1.12% | 24.62% | 11.30% |
| Ratios to Average Net Assets: | | | | | |
| Net expenses | 1.25% | 1.25% | 1.25% | 1.25% | 1.25% |
| Net investment income (loss) | 0.40% | 0.58% | 0.02% | (0.05)% | 0.14% |
| Expense waiver/reimbursement4 | 0.10% | 0.27% | 0.78% | 0.74% | 0.56% |
| Supplemental Data: | | | | | |
| Net assets, end of period (000 omitted) | $7,502 | $5,002 | $3,774 | $4,565 | $4,179 |
| Portfolio turnover | 51% | 135% | 258% | 208% | 217% |
| 1 | Per share numbers have been calculated using the average shares method. |
| 2 | Represents less than $0.01. |
| 3 | Based on net asset value. |
| 4 | This expense decrease is reflected in both the net expense and the net investment income (loss) ratios shown above. |
See Notes which are an integral part of the Financial Statements
Annual Shareholder Report
Statement of Assets and Liabilities
July 31, 2014
| Assets: | | |
| Total investment in securities, at value including $1,586,489 of investment in an affiliated holding (Note 5) (identified cost $70,625,010) | | $84,655,111 |
| Income receivable | | 61,741 |
| Receivable for investments sold | | 847,283 |
| Receivable for shares sold | | 62,069 |
| TOTAL ASSETS | | 85,626,204 |
| Liabilities: | | |
| Payable for investments purchased | $629,460 | |
| Payable for shares redeemed | 252,169 | |
| Payable for transfer agent fee | 35,913 | |
| Payable for distribution services fee (Note 5) | 14,687 | |
| Payable for other service fees (Notes 2 and 5) | 31,366 | |
| Payable for share registration costs | 33,593 | |
| Accrued expenses (Note 5) | 43,373 | |
| TOTAL LIABILITIES | | 1,040,561 |
| Net assets for 5,311,196 shares outstanding | | $84,585,643 |
| Net Assets Consist of: | | |
| Paid-in capital | | $74,577,557 |
| Net unrealized appreciation of investments | | 14,030,101 |
| Accumulated net realized loss on investments | | (4,023,743) |
| Undistributed net investment income | | 1,728 |
| TOTAL NET ASSETS | | $84,585,643 |
Annual Shareholder Report
Statement of Assets and Liabilities–continued
| Net Asset Value, Offering Price and Redemption Proceeds Per Share | | |
| Class A Shares: | | |
| Net asset value per share ($54,572,705 ÷ 3,379,267 shares outstanding), no par value, unlimited shares authorized | | $16.15 |
| Offering price per share (100/94.50 of $16.15) | | $17.09 |
| Redemption proceeds per share | | $16.15 |
| Class B Shares: | | |
| Net asset value per share ($10,519,128 ÷ 682,831 shares outstanding), no par value, unlimited shares authorized | | $15.41 |
| Offering price per share | | $15.41 |
| Redemption proceeds per share (94.50/100 of $15.41) | | $14.56 |
| Class C Shares: | | |
| Net asset value per share ($11,991,469 ÷ 795,765 shares outstanding), no par value, unlimited shares authorized | | $15.07 |
| Offering price per share | | $15.07 |
| Redemption proceeds per share (99.00/100 of $15.07) | | $14.92 |
| Institutional Shares: | | |
| Net asset value per share ($7,502,341 ÷ 453,333 shares outstanding), no par value, unlimited shares authorized | | $16.55 |
| Offering price per share | | $16.55 |
| Redemption proceeds per share | | $16.55 |
See Notes which are an integral part of the Financial Statements
Annual Shareholder Report
Statement of Operations
Year Ended July 31, 2014
| Investment Income: | | | |
| Dividends (including $1,034 received from an affiliated holding (Note 5)) | | | $1,362,063 |
| Expenses: | | | |
| Investment adviser fee (Note 5) | | $611,234 | |
| Administrative fee (Note 5) | | 63,664 | |
| Custodian fees | | 10,794 | |
| Transfer agent fee | | 199,022 | |
| Directors'/Trustees' fees (Note 5) | | 1,378 | |
| Auditing fees | | 23,800 | |
| Legal fees | | 14,057 | |
| Portfolio accounting fees | | 80,209 | |
| Distribution services fee (Note 5) | | 152,578 | |
| Other service fees (Notes 2 and 5) | | 185,683 | |
| Share registration costs | | 56,072 | |
| Printing and postage | | 38,171 | |
| Miscellaneous (Note 5) | | 10,861 | |
| TOTAL EXPENSES | | 1,447,523 | |
| Waiver and Reimbursements: | | | |
| Waiver/reimbursement of investment adviser fee (Note 5) | $(86,544) | | |
| Reimbursement of other operating expenses (Notes 2 and 5) | (115) | | |
| TOTAL WAIVER AND REIMBURSEMENTS | | (86,659) | |
| Net expenses | | | 1,360,864 |
| Net investment income | | | 1,199 |
| Realized and Unrealized Gain on Investments: | | | |
| Net realized gain on investments | | | 9,927,275 |
| Net change in unrealized appreciation of investments | | | 3,832,873 |
| Net realized and unrealized gain on investments | | | 13,760,148 |
| Change in net assets resulting from operations | | | $13,761,347 |
See Notes which are an integral part of the Financial Statements
Annual Shareholder Report
Statement of Changes in Net Assets
| Year Ended July 31 | 2014 | 2013 |
| Increase (Decrease) in Net Assets | | |
| Operations: | | |
| Net investment income | $1,199 | $110,130 |
| Net realized gain on investments | 9,927,275 | 8,367,659 |
| Net change in unrealized appreciation/depreciation of investments | 3,832,873 | 7,058,250 |
| CHANGE IN NET ASSETS RESULTING FROM OPERATIONS | 13,761,347 | 15,536,039 |
| Share Transactions: | | |
| Proceeds from sale of shares | 19,199,689 | 12,798,303 |
| Cost of shares redeemed | (19,653,204) | (13,440,268) |
| CHANGE IN NET ASSETS RESULTING FROM SHARE TRANSACTIONS | (453,515) | (641,965) |
| Change in net assets | 13,307,832 | 14,894,074 |
| Net Assets: | | |
| Beginning of period | 71,277,811 | 56,383,737 |
| End of period (including undistributed net investment income of $1,728 and $0, respectively) | $84,585,643 | $71,277,811 |
See Notes which are an integral part of the Financial Statements
Annual Shareholder Report
Notes to Financial Statements
July 31, 2014
1. ORGANIZATION
Federated MDT Series (the “Trust”) is registered under the Investment Company Act of 1940, as amended (the “Act”), as an open-end management investment company. The Trust consists of five portfolios. The financial statements included herein are only those of Federated MDT Large Cap Growth Fund (the “Fund”), a diversified portfolio. The financial statements of the other portfolios are presented separately. The assets of each portfolio are segregated and a shareholder's interest is limited to the portfolio in which shares are held. Each portfolio pays its own expenses. The Fund offers four classes of shares: Class A Shares, Class B Shares, Class C Shares and Institutional Shares. All shares of the Fund have equal rights with respect to voting, except on class-specific matters. The investment objective of the Fund is long-term capital appreciation.
2. SIGNIFICANT ACCOUNTING POLICIES
The following is a summary of significant accounting policies consistently followed by the Fund in the preparation of its financial statements. These policies are in conformity with U.S. generally accepted accounting principles (GAAP).
Investment Valuation
In calculating its net asset value (NAV), the Fund generally values investments as follows:
| ■ | Equity securities listed on an exchange or traded through a regulated market system are valued at their last reported sale price or official closing price in their principal exchange or market. |
| ■ | Shares of other mutual funds or non-exchange-traded investment companies are valued based upon their reported NAVs. |
| ■ | Derivative contracts listed on exchanges are valued at their reported settlement or closing price. |
| ■ | Over-the-counter (OTC) derivative contracts are fair valued using price evaluations provided by a pricing service approved by the Board of Trustees (the “Trustees”). |
| ■ | Fixed-income securities acquired with remaining maturities greater than 60 days are fair valued using price evaluations provided by a pricing service approved by the Trustees. |
| ■ | Fixed-income securities and repurchase agreements acquired with remaining maturities of 60 days or less are valued at their amortized cost (adjusted for the accretion of any discount or amortization of any premium), unless the issuer's creditworthiness is impaired or other factors indicate that amortized cost is not an accurate estimate of the investment's fair value, in which case it would be valued in the same manner as a longer-term security. |
| ■ | For securities that are fair valued in accordance with procedures established by and under the general supervision of the Trustees, certain factors may be considered such as: the purchase price of the security, information obtained by contacting the issuer, analysis of the issuer's financial statements or other available documents, fundamental analytical data, the nature and duration of restrictions on disposition, the movement of the market in which the security is normally traded and public trading in similar securities of the issuer or comparable issuers. |
If the Fund cannot obtain a price or price evaluation from a pricing service for an investment, the Fund may attempt to value the investment based upon the mean of bid and asked quotations or fair value the investment based on price evaluations, from one or more dealers. If any price, quotation, price evaluation or other pricing source is not readily available when the
Annual Shareholder Report
NAV is calculated, or if the Fund cannot obtain price evaluations from a pricing service or from more than one dealer for an investment within a reasonable period of time as set forth in the Fund's valuation policies and procedures, the Fund uses the fair value of the investment determined in accordance with the procedures described below. There can be no assurance that the Fund could purchase or sell an investment at the price used to calculate the Fund's NAV.
Fair Valuation Procedures
The Trustees have appointed a Valuation Committee comprised of officers of the Fund, Federated MDTA LLC (“Adviser”) and certain of the Adviser's affiliated companies to determine fair value of securities and in overseeing the calculation of the NAV. The Trustees have also authorized the use of pricing services recommended by the Valuation Committee to provide fair value evaluations of the current value of certain investments for purposes of calculating the NAV. The Valuation Committee employs various methods for reviewing third-party pricing-service evaluations including periodic reviews of third-party pricing services' policies, procedures and valuation methods (including key inputs and assumptions), transactional back-testing, comparisons of evaluations of different pricing services, and review of price challenges by the Adviser based on recent market activity. In the event that market quotations and price evaluations are not available for an investment, the Valuation Committee determines the fair value of the investment in accordance with procedures adopted by the Trustees. The Trustees periodically review and approve the fair valuations made by the Valuation Committee and any changes made to the procedures.
Factors considered by pricing services in evaluating an investment include the yields or prices of investments of comparable quality, coupon, maturity, call rights and other potential prepayments, terms and type, reported transactions, indications as to values from dealers and general market conditions. Some pricing services provide a single price evaluation reflecting the bid-side of the market for an investment (a “bid” evaluation). Other pricing services offer both bid evaluations and price evaluations indicative of a price between the prices bid and asked for the investment (a “mid” evaluation). The Fund normally uses bid evaluations for U.S. Treasury and Agency securities, mortgage-backed securities and municipal securities. The Fund normally uses mid evaluations for other types of fixed-income securities and OTC derivative contracts. In the event that market quotations and price evaluations are not available for an investment, the fair value of the investment is determined in accordance with procedures adopted by the Trustees.
Repurchase Agreements
The Fund may invest in repurchase agreements for short-term liquidity purposes. It is the policy of the Fund to require the other party to a repurchase agreement to transfer to the Fund's custodian or sub-custodian eligible securities or cash with a market value (after transaction costs) at least equal to the repurchase price to be paid under the repurchase agreement. The eligible securities are transferred to accounts with the custodian or sub-custodian in which the Fund holds a “securities entitlement” and exercises “control” as those terms are defined in the Uniform Commercial Code. The Fund has established procedures for monitoring the market value of the transferred securities and requiring the transfer of additional eligible securities if necessary to equal at least the repurchase price. These procedures also allow the other party to require securities to be transferred from the account to the extent that their market value exceeds the repurchase price or in exchange for other eligible securities of equivalent market value.
Annual Shareholder Report
The insolvency of the other party or other failure to repurchase the securities may delay the disposition of the underlying securities or cause the Fund to receive less than the full repurchase price. Under the terms of the repurchase agreement, any amounts received by the Fund in excess of the repurchase price and related transaction costs must be remitted to the other party.
The Fund may enter into repurchase agreements in which eligible securities are transferred into joint trading accounts maintained by the custodian or sub-custodian for investment companies and other clients advised by the Fund's Adviser and its affiliates. The Fund will participate on a pro rata basis with the other investment companies and clients in its share of the securities transferred under such repurchase agreements and in its share of proceeds from any repurchase or other disposition of such securities.
Investment Income, Gains and Losses, Expenses and Distributions
Investment transactions are accounted for on a trade-date basis. Realized gains and losses from investment transactions are recorded on an identified-cost basis. Interest income and expenses are accrued daily. Dividend income and distributions to shareholders are recorded on the ex-dividend date. Foreign dividends are recorded on the ex-dividend date or when the Fund is informed of the ex-dividend date. Distributions of net investment income, if any, are declared and paid annual. Non-cash dividends included in dividend income, if any, are recorded at fair value. Investment income, realized and unrealized gains and losses, and certain fund-level expenses are allocated to each class based on relative average daily net assets, except that Class A Shares, Class B Shares and Class C Shares may bear distribution services fees and other service fees unique to those classes.
Other Service Fees
The Fund may pay other service fees up to 0.25% of the average daily net assets of the Fund's Class A Shares, Class B Shares and Class C Shares to unaffiliated financial intermediaries or to Federated Shareholder Services Company (FSSC) for providing services to shareholders and maintaining shareholder accounts. Subject to the terms described in the Expense Limitation note, FSSC may voluntarily reimburse the Fund for other service fees. For the year ended July 31, 2014, other service fees for the Fund were as follows:
| | Other Service
Fees Incurred | Other Service
Fees Reimbursed |
| Class A Shares | $134,811 | $— |
| Class B Shares | 22,885 | (115) |
| Class C Shares | 27,987 | — |
| TOTAL | $185,683 | $(115) |
Dividends are declared separately for each class. No class has preferential dividend rights; differences in per share dividend rates are generally due to differences in separate class expenses.
Premium and Discount Amortization
All premiums and discounts on fixed-income securities are amortized/accreted using the effective-interest-rate method.
Annual Shareholder Report
Federal Taxes
It is the Fund's policy to comply with the Subchapter M provision of the Internal Revenue Code (the “Code”) and to distribute to shareholders each year substantially all of its income. Accordingly, no provision for federal income tax is necessary. As of and during the year ended July 31, 2014, the Fund did not have a liability for any uncertain tax positions. The Fund recognizes interest and penalties, if any, related to tax liabilities as income tax expense in the Statement of Operations. As of July 31, 2014, tax years 2011 through 2014 remain subject to examination by the Fund's major tax jurisdictions, which include the United States of America and the Commonwealth of Massachusetts.
When-Issued and Delayed-Delivery Transactions
The Fund may engage in when-issued or delayed-delivery transactions. The Fund records when-issued securities on the trade date and maintains security positions such that sufficient liquid assets will be available to make payment for the securities purchased. Securities purchased on a when-issued or delayed-delivery basis are marked to market daily and begin earning interest on the settlement date. Losses may occur on these transactions due to changes in market conditions or the failure of counterparties to perform under the contract.
Other
The preparation of financial statements in conformity with GAAP requires management to make estimates and assumptions that affect the amounts of assets, liabilities, expenses and revenues reported in the financial statements. Actual results could differ from those estimated.
3. SHARES OF BENEFICIAL INTEREST
The following tables summarize share activity:
| Year Ended July 31 | 2014 | 2013 |
| Class A Shares: | Shares | Amount | Shares | Amount |
| Shares sold | 647,555 | $9,705,466 | 427,339 | $5,091,052 |
| Shares redeemed | (878,609) | (13,510,867) | (658,699) | (7,736,460) |
NET CHANGE RESULTING FROM
CLASS A SHARE TRANSACTIONS | (231,054) | $(3,805,401) | (231,360) | $(2,645,408) |
| Year Ended July 31 | 2014 | 2013 |
| Class B Shares: | Shares | Amount | Shares | Amount |
| Shares sold | 259,358 | 3,740,207 | 311,135 | $3,500,256 |
| Shares redeemed | (145,811) | (2,107,202) | (222,897) | (2,512,835) |
NET CHANGE RESULTING FROM
CLASS B SHARE TRANSACTIONS | 113,547 | $1,633,005 | 88,238 | $987,421 |
| Year Ended July 31 | 2014 | 2013 |
| Class C Shares: | Shares | Amount | Shares | Amount |
| Shares sold | 220,874 | $3,158,663 | 280,843 | $3,155,642 |
| Shares redeemed | (195,227) | (2,816,945) | (208,807) | (2,310,108) |
NET CHANGE RESULTING FROM
CLASS C SHARE TRANSACTIONS | 25,647 | $341,718 | 72,036 | $845,534 |
Annual Shareholder Report
| Year Ended July 31 | 2014 | 2013 |
| Institutional Shares: | Shares | Amount | Shares | Amount |
| Shares sold | 170,790 | $2,595,353 | 85,726 | $1,051,353 |
| Shares redeemed | (77,873) | (1,218,190) | (74,931) | (880,865) |
NET CHANGE RESULTING
FROM INSTITUTIONAL
SHARE TRANSACTIONS | 92,917 | $1,377,163 | 10,795 | $170,488 |
NET CHANGE RESULTING
FROM TOTAL FUND
SHARE TRANSACTIONS | 1,057 | $(453,515) | (60,291) | $(641,965) |
4. FEDERAL TAX INFORMATION
The timing and character of income and capital gain distributions are determined in accordance with income tax regulations, which may differ from GAAP. These differences are due to differing treatments for non-taxable dividends and litigation payments.
For the year ended July 31, 2014, permanent differences identified and reclassified among the components of net assets were as follows:
| Increase (Decrease) |
| Paid-In Capital | Undistributed
Net Investment
Income (Loss) | Accumulated
Net Realized
Gain (Loss) |
| $(2,956) | $529 | $2,427 |
Net investment income (loss), net realized gains (losses), and net assets were not affected by this reclassification.
As of July 31, 2014, the components of distributable earnings on a tax basis were as follows:
| Net unrealized appreciation | $14,034,829 |
| Capital loss carryforwards and deferrals | $(4,026,743) |
The difference between book-basis and tax-basis net unrealized appreciation/depreciation is attributable to differing treatments for the deferral of losses on wash sales, non-taxable dividends and partnership investments.
At July 31, 2014, the cost of investments for federal tax purposes was $70,620,282. The net unrealized appreciation of investments for federal tax purposes was $14,034,829. This consists of net unrealized appreciation from investments for those securities having an excess of value over cost of $15,406,637 and net unrealized depreciation from investments for those securities having an excess of cost over value of $1,371,808.
At July 31, 2014, the Fund had a capital loss carryforward of $4,024,875 which will reduce the Fund's taxable income arising from future net realized gains on investments, if any, to the extent permitted by the Code, thereby reducing the amount of distributions to shareholders which would otherwise be necessary to relieve the Fund of any liability for federal income tax. Pursuant to the Code, a net capital loss incurred in taxable years beginning on or before December 22, 2010, is characterized as short-term and may be carried forward for a maximum
Annual Shareholder Report
of eight tax years (“Carryforward Limit”), whereas a net capital loss incurred in taxable years beginning after December 22, 2010, retains its character as either short-term or long-term, does not expire and is required to be utilized prior to the losses which have a Carryforward Limit.
The following schedule summarizes the Fund's capital loss carryforwards and expiration years:
| Expiration Year | Short-Term | Long-Term | Total |
| 2017 | $2,424,248 | NA | $2,424,248 |
| 2018 | $1,600,627 | NA | $1,600,627 |
The Fund used capital loss carryforwards of $9,913,886 to offset capital gains realized during the year ended July 31, 2014.
Under current tax rules, a late-year ordinary loss may be deferred, in whole or in part, and treated as occurring on the first day of the following fiscal year. As of July 31, 2014, for federal income tax purposes, a late year ordinary loss of $1,868 was deferred to August 1, 2014.
5. INVESTMENT ADVISER FEE AND OTHER TRANSACTIONS WITH AFFILIATES
Investment Adviser Fee
The advisory agreement between the Fund and the Adviser provides for an annual fee equal to 0.75% of the Fund's average daily net assets. Subject to the terms described in the Expense Limitation note, the Adviser may voluntarily choose to waive any portion of its fee. For the year ended July 31, 2014, the Adviser voluntarily waived $84,727 of its fee.
Administrative Fee
Federated Administrative Services (FAS), under the Administrative Services Agreement, provides the Fund with administrative personnel and services. For purposes of determining the appropriate rate breakpoint, “Investment Complex” is defined as all of the Federated Funds subject to a fee under the Administrative Services Agreement. The fee paid to FAS is based on the average daily net assets of the Investment Complex as specified below, plus certain out-of-pocket expenses:
| Administrative Fee | Average Daily Net Assets
of the Investment Complex |
| 0.150% | on the first $5 billion |
| 0.125% | on the next $5 billion |
| 0.100% | on the next $10 billion |
| 0.075% | on assets in excess of $20 billion |
Subject to the terms described in the Expense Limitation note, FAS may voluntarily choose to waive any portion of its fee. For the year ended July 31, 2014, the annualized fee paid to FAS was 0.078% of average daily net assets of the Fund.
Annual Shareholder Report
Distribution Services Fee
The Fund has adopted a Distribution Plan (the “Plan”) pursuant to Rule 12b-1 under the Act. Under the terms of the Plan, the Fund will compensate Federated Securities Corp. (FSC), the principal distributor, from the daily net assets of the Fund's Class A Shares, Class B Shares and Class C Shares to finance activities intended to result in the sale of these shares. The Plan provides that the Fund may incur distribution expenses at the following percentages of average daily net assets annually, to compensate FSC:
| Share Class Name | Percentage of Average Daily
Net Assets of Class |
| Class A Shares | 0.05% |
| Class B Shares | 0.75% |
| Class C Shares | 0.75% |
Subject to the terms described in the Expense Limitation note, FSC may voluntarily choose to waive any portion of its fee. For the year ended July 31, 2014, distribution services fees for the Fund were as follows:
| | Distribution Services
Fees Incurred |
| Class B Shares | $68,656 |
| Class C Shares | 83,922 |
| TOTAL | $152,578 |
When FSC receives fees, it may pay some or all of them to financial intermediaries whose customers purchase shares. For the year ended July 31, 2014, FSC retained $38,780 of fees paid by the Fund. For the year ended July 31, 2014, the Fund's Class A Shares did not incur a distribution services fee; however, it may begin to incur this fee upon approval of the Trustees.
Sales Charges
Front-end sales charges and contingent deferred sales charges (CDSC) do not represent expenses of the Fund. They are deducted from the proceeds of sales of Fund shares prior to investment or from redemption proceeds prior to remittance, as applicable. For the year ended July 31, 2014, FSC retained $4,252 in sales charges from the sale of Class A Shares. FSC also retained $4,707 of CDSC relating to redemptions of Class B Shares and $900 relating to redemptions of Class C Shares.
Other Service Fees
For the year ended July 31, 2014, FSSC received $18,107 and reimbursed $115 of the other service fees disclosed in Note 2.
Annual Shareholder Report
Expense Limitation
The Adviser and certain of its affiliates (which may include FSC, FAS and FSSC) on their own initiative have agreed to waive their respective fees and/or reimburse expenses so that the total annual fund operating expenses (as shown in the financial highlights, excluding expenses allocated from affiliated partnerships, extraordinary expenses, and proxy-related expenses paid by the Fund, if any) paid by the Fund's Class A Shares, Class B Shares, Class C Shares and Institutional Shares (after the voluntary waivers and/or reimbursements) will not exceed 1.50%, 2.25%, 2.25% and 1.25% (the “Fee Limit”), respectively, up to but not including the later of (the “Termination Date”): (a) October 31, 2015; or (b) the date of the Fund's next effective Prospectus. While the Adviser and its applicable affiliates currently do not anticipate terminating or increasing these arrangements prior to the Termination Date, these arrangements may only be terminated or the Fee Limit increased prior to the Termination Date with the agreement of the Trustees.
General
Certain Officers and Trustees of the Fund are Officers and Directors or Trustees of certain of the above companies. To efficiently facilitate payment, Directors'/Trustees' fees and certain expenses related to conducting meetings of the Directors/Trustees and other miscellaneous expenses are paid by an affiliate of the Adviser which in due course are reimbursed by the Fund. Such expenses may be included in Accrued and Miscellaneous Expenses on the Statement of Assets and Liabilities and Statement of Operations, respectively.
Transactions Involving Affiliated Holdings
Affiliated holdings are investment companies which are managed by the Adviser or an affiliate of the Adviser. The Adviser has agreed to reimburse the Fund for certain investment adviser fees as a result of transactions in other affiliated investment companies. For the year ended July 31, 2014, the Adviser reimbursed $1,817. Transactions involving the affiliated holding during the year ended July 31, 2014, were as follows:
| | Federated
Prime Value
Obligations Fund,
Institutional Shares |
| Balance of Shares Held 7/13/2013 | 1,252,177 |
| Purchases/Additions | 13,589,318 |
| Sales/Reductions | (13,255,006) |
| Balance of Shares Held 7/31/2014 | 1,586,489 |
| Value | $1,586,489 |
| Dividend Income | $1,034 |
6. Investment TRANSACTIONS
Purchases and sales of investments, excluding long-term U.S. government securities and short-term obligations, for the year ended July 31, 2014, were as follows:
| Purchases | $40,642,116 |
| Sales | $41,014,598 |
Annual Shareholder Report
7. LINE OF CREDIT
The Fund participates in a $100,000,000 unsecured, uncommitted revolving line of credit (LOC) agreement with PNC Bank. The LOC was made available for extraordinary or emergency purposes, primarily for financing redemption payments. Borrowings are charged interest at a rate offered to the Fund by PNC Bank at the time of the borrowing. As of July 31, 2014, there were no outstanding loans. During the year ended July 31, 2014, the Fund did not utilize the LOC.
8. INTERFUND LENDING
Pursuant to an Exemptive Order issued by the Securities and Exchange Commission, the Fund, along with other funds advised by subsidiaries of Federated Investors, Inc., may participate in an interfund lending program. This program provides an alternative credit facility allowing the Fund to borrow from other participating affiliated funds. As of July 31, 2014, there were no outstanding loans. During the year ended July 31, 2014, the program was not utilized.
Annual Shareholder Report
Report of Independent Registered Public Accounting Firm
TO THE BOARD OF trustees OF Federated MDt series AND SHAREHOLDERS OF federated mdt large cap growth fund:
We have audited the accompanying statement of assets and liabilities of Federated MDT Large Cap Growth Fund (the “Fund”) (one of the portfolios constituting Federated MDT Series), including the portfolio of investments, as of July 31, 2014, and the related statement of operations for the year then ended, the statement of changes in net assets for each of the two years in the period then ended, and the financial highlights for each of the five years in the period then ended. These financial statements and financial highlights are the responsibility of the Fund's management. Our responsibility is to express an opinion on these financial statements and financial highlights based on our audits.
We conducted our audits in accordance with standards of the Public Company Accounting Oversight Board (United States). Those standards require that we plan and perform the audit to obtain reasonable assurance about whether the financial statements and financial highlights are free of material misstatement. We were not engaged to perform an audit of the Fund's internal control over financial reporting. Our audits included consideration of internal control over financial reporting as a basis for designing audit procedures that are appropriate in the circumstances, but not for the purpose of expressing an opinion on the effectiveness of the Fund's internal control over financial reporting. Accordingly, we express no such opinion. An audit also includes examining, on a test basis, evidence supporting the amounts and disclosures in the financial statements and financial highlights, assessing the accounting principles used and significant estimates made by management, and evaluating the overall financial statement presentation. Our procedures included confirmation of securities owned as of July 31, 2014, by correspondence with the custodian and others, or by other appropriate auditing procedures where replies from others were not received. We believe that our audits provide a reasonable basis for our opinion.
In our opinion, the financial statements and financial highlights referred to above present fairly, in all material respects, the financial position of Federated MDT Large Cap Growth Fund, a portfolio of Federated MDT Series, at July 31, 2014, the results of its operations for the year then ended, the changes in its net assets for each of the two years in the period then ended, and the financial highlights for each of the five years in the period then ended, in conformity with U.S. generally accepted accounting principles.
Boston, Massachusetts
September 23, 2014
Annual Shareholder Report
Shareholder Expense Example (unaudited)
As a shareholder of the Fund, you incur two types of costs: (1) transaction costs, including sales charges (loads) on purchase or redemption payments; and (2) ongoing costs, including management fees and to the extent applicable, distribution (12b-1) fees and/or other service fees and other Fund expenses. This Example is intended to help you to understand your ongoing costs (in dollars) of investing in the Fund and to compare these costs with the ongoing costs of investing in other mutual funds. It is based on an investment of $1,000 invested at the beginning of the period and held for the entire period from February 1, 2014 to July 31, 2014.
ACTUAL EXPENSES
The first section of the table below provides information about actual account values and actual expenses. You may use the information in this section, together with the amount you invested, to estimate the expenses that you incurred over the period. Simply divide your account value by $1,000 (for example, an $8,600 account value divided by $1,000 = 8.6), then multiply the result by the number in the first section under the heading entitled “Expenses Paid During Period” to estimate the expenses attributable to your investment during this period.
HYPOTHETICAL EXAMPLE FOR COMPARISON PURPOSES
The second section of the table below provides information about hypothetical account values and hypothetical expenses based on the Fund's actual expense ratio and an assumed rate of return of 5% per year before expenses, which is not the Fund's actual return. Thus, you should not use the hypothetical account values and expenses to estimate the actual ending account balance or your expenses for the period. Rather, these figures are required to be provided to enable you to compare the ongoing costs of investing in the Fund with other funds. To do so, compare this 5% hypothetical example with the 5% hypothetical examples that appear in the shareholder reports of the other funds.
Annual Shareholder Report
Please note that the expenses shown in the table are meant to highlight your ongoing costs only and do not reflect any transaction costs, such as sales charges (loads) on purchase or redemption payments. Therefore, the second section of the table is useful in comparing ongoing costs only, and will not help you determine the relative total costs of owning different funds. In addition, if these transaction costs were included, your costs would have been higher.
| | Beginning
Account Value
2/1/2014 | Ending
Account Value
7/31/2014 | Expenses Paid
During Period1 |
| Actual: | | | |
| Class A Shares | $1,000 | $1,076.70 | $7.72 |
| Class B Shares | $1,000 | $1,073.10 | $11.57 |
| Class C Shares | $1,000 | $1,072.60 | $11.56 |
| Institutional Shares | $1,000 | $1,078.20 | $6.44 |
Hypothetical (assuming a 5% return
before expenses): | | | |
| Class A Shares | $1,000 | $1,017.36 | $7.50 |
| Class B Shares | $1,000 | $1,013.64 | $11.23 |
| Class C Shares | $1,000 | $1,013.64 | $11.23 |
| Institutional Shares | $1,000 | $1,018.60 | $6.26 |
| 1 | Expenses are equal to the Fund's annualized net expense ratios, multiplied by the average account value over the period, multiplied by 181/365 (to reflect the one-half-year period). The annualized net expense ratios are as follows: |
| | |
| Class A Shares | 1.50% |
| Class B Shares | 2.25% |
| Class C Shares | 2.25% |
| Institutional Shares | 1.25% |
Annual Shareholder Report
Board of Trustees and Trust Officers
The Board of Trustees is responsible for managing the Trust's business affairs and for exercising all the Trust's powers except those reserved for the shareholders. The following tables give information about each Trustee and the senior officers of the Fund. Where required, the tables separately list Trustees who are “interested persons” of the Fund (i.e., “Interested” Trustees) and those who are not (i.e., “Independent” Trustees). Unless otherwise noted, the address of each person listed is Federated Investors Tower, 1001 Liberty Avenue, Pittsburgh, PA 15222. The address of all Independent Trustees listed is 4000 Ericsson Drive, Warrendale, PA 15086-7561; Attention: Mutual Fund Board. As of December 31, 2013, the Trust comprised five portfolio(s), and the Federated Fund Family consisted of 42 investment companies (comprising 135 portfolios). Unless otherwise noted, each Officer is elected annually. Unless otherwise noted, each Trustee oversees all portfolios in the Federated Fund Family and serves for an indefinite term. The Fund's Statement of Additional Information includes additional information about Trust Trustees and is available, without charge and upon request, by calling 1-800-341-7400.
Interested TRUSTEES Background
Name
Birth Date
Positions Held with Trust
Date Service Began | Principal Occupation(s) for Past Five Years,
Other Directorships Held and Previous Position(s) |
John F. Donahue*
Birth Date: July 28, 1924
Trustee
Began serving: June 2006 | Principal Occupations: Director or Trustee of the Federated Fund Family; Chairman and Director, Federated Investors, Inc.; Chairman of the Federated Fund Family's Executive Committee.
Previous Positions: Chairman of the Federated Fund Family; Trustee, Federated Investment Management Company; Chairman and Director, Federated Investment Counseling. |
J. Christopher Donahue*
Birth Date: April 11, 1949
President and Trustee
Began serving: May 2006 | Principal Occupations: Principal Executive Officer and President of certain of the Funds in the Federated Fund Family; Director or Trustee of the Funds in the Federated Fund Family; President, Chief Executive Officer and Director, Federated Investors, Inc.; Chairman and Trustee, Federated Investment Management Company; Trustee, Federated Investment Counseling; Chairman and Director, Federated Global Investment Management Corp.; Chairman, Federated Equity Management Company of Pennsylvania and Passport Research, Ltd. (investment advisory subsidiary of Federated); Trustee, Federated Shareholder Services Company; Director, Federated Services Company.
Previous Positions: President, Federated Investment Counseling; President and Chief Executive Officer, Federated Investment Management Company, Federated Global Investment Management Corp. and Passport Research, Ltd. |
| * | Family relationships and reasons for “interested” status: John F. Donahue is the father of J. Christopher Donahue; both are “interested” due to their beneficial ownership of shares of Federated Investors, Inc. and the positions they hold with Federated and its subsidiaries. |
Annual Shareholder Report
INDEPENDENT TRUSTEES Background
Name
Birth Date
Positions Held with Trust
Date Service Began | Principal Occupation(s) for Past Five Years,
Other Directorships Held, Previous Position(s) and Qualifications |
John T. Collins
Birth Date: January 24, 1947
Trustee
Began serving: October 2013 | Principal Occupations: Director or Trustee of the Federated Fund Family; Chairman and CEO, The Collins Group, Inc. (a private equity firm).
Other Directorships Held: Chairman Emeriti, Bentley University; Director, Sterling Suffolk Downs, Inc.; Former Director, National Association of Printers and Lithographers.
Previous Positions: Director and Audit Committee Member, Bank of America Corp.
Qualifications: Business management and director experience. |
Maureen Lally-Green
Birth Date: July 5, 1949
Trustee
Began serving: August 2009 | Principal Occupations: Director or Trustee of the Federated Fund Family; Associate General Secretary and Director, Office for Church Relations, Diocese of Pittsburgh; Adjunct Professor of Law, Duquesne University School of Law; Superior Court of Pennsylvania (service began 1998 and ended July 2009).
Other Directorships Held: Director, Consol Energy (service started June 2013); Director, Auberle (service ended December 2013); Member, Pennsylvania State Board of Education; Director, Saint Vincent College; Director, Ireland Institute of Pittsburgh (service ended December 2013); Director and Chair, UPMC Mercy Hospital; Regent, St. Vincent Seminary; Director, Epilepsy Foundation of Western and Central Pennsylvania; Director, Saint Thomas More Society (service ended December 2013); Director, Our Campaign for the Church Alive!, Inc.; Director, Pennsylvania Bar Institute (2013-present); Director, Cardinal Wuerl North Catholic High School (2013-present).
Previous Position: Professor of Law, Duquesne University School of Law, Pittsburgh (1983-1998).
Qualifications: Legal and director experience. |
Peter E. Madden
Birth Date: March 16, 1942
Trustee
Began serving: June 2006 | Principal Occupation: Director or Trustee, and Chairman of the Board of Directors or Trustees, of the Federated Fund Family.
Previous Positions: Representative, Commonwealth of Massachusetts General Court; President, Chief Operating Officer and Director, State Street Bank and Trust Company and State Street Corporation (retired); Director, VISA USA and VISA International; Chairman and Director, Massachusetts Bankers Association; Director, Depository Trust Corporation; Director, The Boston Stock Exchange.
Qualifications: Business management, mutual fund services and director experience. |
Annual Shareholder Report
Name
Birth Date
Positions Held with Trust
Date Service Began | Principal Occupation(s) for Past Five Years,
Other Directorships Held, Previous Position(s) and Qualifications |
Charles F. Mansfield, Jr.
Birth Date: April 10, 1945
Trustee
Began serving: June 2006 | Principal Occupations: Director or Trustee of the Federated Fund Family; Management Consultant.
Previous Positions: Chief Executive Officer, PBTC International Bank; Partner, Arthur Young & Company (now Ernst & Young LLP); Chief Financial Officer of Retail Banking Sector, Chase Manhattan Bank; Senior Vice President, HSBC Bank USA (formerly Marine Midland Bank); Vice President, Citibank; Assistant Professor of Banking and Finance, Frank G. Zarb School of Business, Hofstra University; Executive Vice President, DVC Group, Inc. (marketing, communications and technology).
Qualifications: Banking, business management, education and director experience. |
Thomas M. O'Neill
Birth Date: June 14, 1951
Trustee
Began serving: October 2006 | Principal Occupations: Director or Trustee, Vice Chairman of the Audit Committee of the Federated Fund Family; Sole Proprietor, Navigator Management Company (investment and strategic consulting).
Other Directorships Held: Board of Overseers, Children's Hospital of Boston; Visiting Committee on Athletics, Harvard College; Board of Directors, Medicines for Humanity; Board of Directors, The Golisano Children's Museum of Naples, Florida.
Previous Positions: Chief Executive Officer and President, Managing Director and Chief Investment Officer, Fleet Investment Advisors; President and Chief Executive Officer, Aeltus Investment Management, Inc.; General Partner, Hellman, Jordan Management Co., Boston, MA; Chief Investment Officer, The Putnam Companies, Boston, MA; Credit Analyst and Lending Officer, Fleet Bank; Director and Consultant, EZE Castle Software (investment order management software); Director, Midway Pacific (lumber).
Qualifications: Business management, mutual fund, director and investment experience. |
P. Jerome Richey
Birth Date: February 23, 1949
Trustee
Began serving: October 2013 | Principal Occupations: Director or Trustee of the Federated Fund Family; General Counsel, University of Pittsburgh.
Other Directorships Held: Board Chairman, Epilepsy Foundation of Western Pennsylvania; Board Member, World Affairs Council of Pittsburgh.
Previous Positions: Chief Legal Officer and Executive Vice President, CONSOL Energy Inc.; Shareholder, Buchanan Ingersoll & Rooney PC (a law firm).
Qualifications: Business management, legal and director experience. |
Annual Shareholder Report
Name
Birth Date
Positions Held with Trust
Date Service Began | Principal Occupation(s) for Past Five Years,
Other Directorships Held, Previous Position(s) and Qualifications |
John S. Walsh
Birth Date: November 28, 1957
Trustee
Began serving: June 2006 | Principal Occupations: Director or Trustee, Chairman of the Audit Committee of the Federated Fund Family; President and Director, Heat Wagon, Inc. (manufacturer of construction temporary heaters); President and Director, Manufacturers Products, Inc. (distributor of portable construction heaters); President, Portable Heater Parts, a division of Manufacturers Products, Inc.
Previous Position: Vice President, Walsh & Kelly, Inc.
Qualifications: Business management and director experience. |
OFFICERS
Name
Birth Date
Address
Positions Held with Trust
Date Service Began | Principal Occupation(s) for Past Five Years
and Previous Position(s) |
John W. McGonigle
Birth Date: October 26, 1938
Secretary
Officer since: May 2006 | Principal Occupations: Executive Vice President and Secretary of the Federated Fund Family; Vice Chairman, Executive Vice President, Secretary and Director, Federated Investors, Inc.
Previous Positions: Trustee, Federated Investment Management Company and Federated Investment Counseling; Director, Federated Global Investment Management Corp., Federated Services Company and Federated Securities Corp. |
Lori A. Hensler
Birth Date: January 6, 1967
TREASURER
Officer since: April 2013 | Principal Occupations: Principal Financial Officer and Treasurer of the Federated Fund Family; Senior Vice President, Federated Administrative Services; Financial and Operations Principal for Federated Securities Corp. and Edgewood Services, Inc.; and Assistant Treasurer, Federated Investors Trust Company. Ms. Hensler has received the Certified Public Accountant designation.
Previous Positions: Controller of Federated Investors, Inc.; Senior Vice President and Assistant Treasurer, Federated Investors Management Company; Treasurer, Federated Investors Trust Company; Assistant Treasurer, Federated Administrative Services, Federated Administrative Services, Inc., Federated Securities Corp., Edgewood Services, Inc., Federated Advisory Services Company, Federated Equity Management Company of Pennsylvania, Federated Global Investment Management Corp., Federated Investment Counseling, Federated Investment Management Company, Passport Research, Ltd., and Federated MDTA, LLC; Financial and Operations Principal for Federated Securities Corp., Edgewood Services, Inc. and Southpointe Distribution Services, Inc. |
Annual Shareholder Report
Name
Birth Date
Address
Positions Held with Trust
Date Service Began | Principal Occupation(s) for Past Five Years
and Previous Position(s) |
Peter J. Germain
Birth Date: September 3, 1959
CHIEF LEGAL OFFICER
Officer since: June 2006 | Principal Occupations: Mr. Germain is Chief Legal Officer of the Federated Fund Family. He is General Counsel and Vice President, Federated Investors, Inc.; President, Federated Administrative Services and Federated Administrative Services, Inc.; Vice President, Federated Securities Corp.; Secretary, Federated Private Asset Management, Inc.; and Secretary, Retirement Plan Service Company of America. Mr. Germain joined Federated in 1984 and is a member of the Pennsylvania Bar Association.
Previous Positions: Deputy General Counsel, Special Counsel, Managing Director of Mutual Fund Services, Federated Investors, Inc.; Senior Vice President, Federated Services Company; and Senior Corporate Counsel, Federated Investors, Inc. |
Stephen F. Auth
Birth Date: September 3, 1956
450 Lexington Avenue
Suite 3700
New York, NY 10017-3943
CHIEF INVESTMENT OFFICER
Officer since: June 2012 | Principal Occupations: Stephen F. Auth is Chief Investment Officer of various Funds in the Federated Fund Family; Executive Vice President, Federated Investment Counseling, Federated Global Investment Management Corp. and Federated Equity Management Company of Pennsylvania.
Previous Positions: Executive Vice President, Federated Investment Management Company and Passport Research, Ltd. (investment advisory subsidiary of Federated); Senior Vice President, Global Portfolio Management Services Division; Senior Vice President, Federated Investment Management Company and Passport Research, Ltd.; Senior Managing Director and Portfolio Manager, Prudential Investments. |
Brian P. Bouda
Birth Date: February 28, 1947
CHIEF COMPLIANCE OFFICER AND SENIOR VICE PRESIDENT
Officer since: June 2006 | Principal Occupations: Senior Vice President and Chief Compliance Officer of the Federated Fund Family; Vice President and Chief Compliance Officer of Federated Investors, Inc. and Chief Compliance Officer of certain of its subsidiaries. Mr. Bouda joined Federated in 1999 and is a member of the American Bar Association and the State Bar Association of Wisconsin.
Previous Positions: Served in Senior Management positions with a large regional banking organization. |
Daniel Mahr
Birth Date: April 9, 1981
125 High Street
Oliver Tower
21st Floor
Boston, MA 02110-2704
Vice President
Officer since: June 2012
Portfolio Manager since:
August 2008 | Principal Occupations: Daniel Mahr has been the Fund's Portfolio Manager since August 2008. Mr. Mahr joined the MDT Advisers Investment Team in 2002. As Managing Director, Research, he is responsible for leading the Investment Team as it relates to the ongoing design, development and implementation of the Optimum Q Process. He is Vice President of the Trust with respect to the Fund. Mr. Mahr received his A.B., Computer Science from Harvard College and his S.M., Computer Science from Harvard University. |
Annual Shareholder Report
Evaluation and Approval of Advisory Contract–May 2014
Federated MDT Large Cap Growth Fund (the “Fund”)
Following a review and recommendation of approval by the Fund's independent trustees, the Fund's Board reviewed and approved at its May 2014 meetings the Fund's investment advisory contract for an additional one-year term. The Board's decision regarding the contract reflects the exercise of its business judgment on whether to continue the existing arrangements.
In this connection, the Federated Funds' Board had previously appointed a Senior Officer, whose duties include specified responsibilities relating to the process by which advisory fees are to be charged to a Federated fund. The Senior Officer has the authority to retain consultants, experts, or staff as may be reasonably necessary to assist in the performance of his duties, reports directly to the Board, and may be terminated only with the approval of a majority of the independent members of the Board. The Senior Officer prepared and furnished to the Board an independent, written evaluation that covered topics discussed below (the “Evaluation”). The Board considered that Evaluation, along with other information, in deciding to approve the advisory contract.
The Board is also familiar with and considered judicial decisions concerning allegedly excessive investment advisory fees, which have indicated that the following factors may be relevant to an Adviser's fiduciary duty with respect to its receipt of compensation from a fund: the nature and quality of the services provided by the Adviser to a fund and its shareholders, including the performance and expenses of the fund and of comparable funds; the Adviser's cost of providing the services, including the profitability to the Adviser of providing advisory services to a fund; the extent to which the Adviser may realize “economies of scale” as a fund grows larger and, if such economies exist, whether they have been shared with a fund and its shareholders or the family of funds; any “fall-out financial benefits” that accrue to the Adviser because of its relationship with a fund (including research services received from brokers that execute fund trades and any fees paid to affiliates of the Adviser for services rendered to a fund); comparative fee structures, including a comparison of fees paid to the Adviser with those paid by similar funds; and the extent of care, conscientiousness and independence with which the Board members perform their duties and their expertise, including whether they are fully informed about all facts the Board deems relevant to its consideration of the Adviser's services and fees. The Board noted that SEC disclosure requirements regarding the basis for the Board's approval of the Fund's advisory contract generally track the factors listed above. Consistent with these judicial decisions and SEC disclosure requirements, the Board also considered management fees charged to
Annual Shareholder Report
institutional and other clients of the Adviser for what might be viewed as like services. The Board was aware of these factors and was guided by them in its review of the Fund's advisory contract to the extent it considered them to be appropriate and relevant, as discussed further below.
The Board considered and weighed these circumstances in light of its substantial accumulated experience in governing the Fund and working with Federated on matters relating to the Federated funds, and was assisted in its deliberations by independent legal counsel. Throughout the year, and in connection with its May meetings, the Board requested and received substantial and detailed information about the Fund and the Federated organization that was in addition to the extensive materials that comprise and accompany the Senior Officer's Evaluation. Federated provided much of this information at each regular meeting of the Board, and furnished additional substantial information in connection with the May meeting at which the Board's formal review of the advisory contract occurred. At this May meeting, senior management of the Adviser also met with the independent trustees and their counsel to discuss the materials presented and any other matters thought relevant by the Adviser or the trustees. Between regularly scheduled meetings, the Board also received information on particular matters as the need arose. Thus, the Board's consideration of the advisory contract included review of the Senior Officer's Evaluation, accompanying data and additional information covering such matters as: the Adviser's investment philosophy, revenue, profitability, personnel and processes; investment and operating strategies; the Fund's short- and long-term performance (in absolute terms, both on a gross basis and net of expenses, as well as in relationship to its particular investment program and certain competitor or “peer group” funds and/or other benchmarks, as appropriate), and comments on the reasons for performance; the Fund's investment objectives; the Fund's expenses (including the advisory fee itself and the overall expense structure of the Fund, both in absolute terms and relative to similar and/or competing funds, with due regard for contractual or voluntary expense limitations); the use and allocation of brokerage commissions derived from trading the Fund's portfolio securities (if any); and the nature, quality and extent of the advisory and other services provided to the Fund by the Adviser and its affiliates. The Board also considered the preferences and expectations of Fund shareholders; the entrepreneurial risk assumed by the Adviser in sponsoring the funds; the continuing state of competition in the mutual fund industry and market practices; the range of comparable fees for similar funds in the mutual fund industry; the Fund's relationship to the Federated family of funds which include a comprehensive array of funds with different investment objectives, policies and strategies which are available for exchange without the incurrence of additional sales charges; compliance and audit reports concerning the Federated funds and the Federated companies that service them (including communications from regulatory agencies), as well as Federated's responses to any issues raised therein; and relevant developments in
Annual Shareholder Report
the mutual fund industry and how the Federated funds and/or Federated are responding to them. The Board's evaluation process is evolutionary. The criteria considered and the emphasis placed on relevant criteria change in recognition of changing circumstances in the mutual fund marketplace.
While mindful that courts have cautioned against giving such comparisons too much weight, the Board has found the use of comparisons of the Fund's fees and expenses to other mutual funds with comparable investment programs to be relevant. In this regard, the Board was presented with, and considered, information regarding the contractual advisory fee rates, net advisory fee rates and total expense ratios relative to a fund's peers. The Board focused on comparisons with other similar mutual funds more heavily than non-mutual fund products or services because it is believed that they are more relevant. For example, other mutual funds are the products most like the Fund, they are readily available to Fund shareholders as alternative investment vehicles, and they are the type of investment vehicle in fact chosen and maintained by the Fund's investors. The range of their fees and expenses therefore appears to be a relevant indicator of what consumers have found to be reasonable in the precise marketplace in which the Fund competes.
The Board reviewed the contractual advisory fee rate, net advisory fee rate where partially waived and other expenses of the Fund and noted the position of the Fund's fee rates relative to its peers. In this regard, the Board noted that the contractual advisory fee rate was above the median of the relevant peer group, but the Board noted the applicable waivers and reimbursements and that the overall expense structure of the Fund remained competitive. In this regard, the Board had been previously advised that, while comparisons to fund peer groups are relevant in judging the reasonableness of advisory fees, the Fund's quantitative focus makes fee and expense comparisons particularly difficult. Although the Fund's advisory fee was above the median of the peer range, the peer group of funds varied widely in their complexity, and the management of the Fund is among the more complex relative to its peers. The Board will continue to monitor advisory fees and other expenses borne by the Fund.
By contrast, the Senior Officer has reviewed Federated's fees for providing advisory services to products outside the Federated family of funds (e.g., institutional and separate accounts and sub-adviser services). He concluded that mutual funds and institutional accounts are inherently different products. Those differences include, but are not limited to, different types of targeted investors; being subject to different laws and regulations; different legal structures; different average account sizes and portfolio management techniques made necessary by different cash flows and different associated costs; and the time spent by portfolio managers and their teams, funds financial services, legal, compliance and risk management in reviewing securities pricing, addressing
Annual Shareholder Report
different administrative responsibilities, addressing different degrees of risk associated with management and a variety of different costs. The Senior Officer did not consider these fee schedules to be determinative in judging the appropriateness of mutual fund advisory fees.
The Fund's ability to deliver competitive performance when compared to its peer group was also deemed to be relevant by the Board as a useful indicator of how the Adviser is executing the Fund's investment program, which in turn was one of the Board's considerations in reaching a conclusion that the nature, extent, and quality of the Adviser's investment management services were such as to warrant continuation of the advisory contract.
The Senior Officer reviewed information compiled by Federated, using data supplied by independent fund ranking organizations, regarding the performance of, and fees charged by, other mutual funds, noting his view that comparisons to fund peer groups may be helpful, though not conclusive, in judging the reasonableness of proposed fees. The Board considered, in evaluating such comparisons, that in some cases individual funds may exhibit significant and unique differences in their objectives and management techniques when compared to other funds within an industry peer group, and that the Senior Officer had specifically noted that the Fund's quantitative investment program is of such a type.
For the periods covered by the Evaluation, the Fund's performance for both the one-year and three-year periods was above the median of the relevant peer group, and the Fund's performance fell below the median of the relevant peer group for the five-year period. In addition, the Board was informed by the Adviser that, for the same periods, the Fund outperformed its benchmark index for the one-year period, outperformed its benchmark index for the three-year period and underperformed its benchmark index for the five-year period. The Board discussed the Fund's performance with the Adviser and recognized the efforts being undertaken by the Adviser. The Board will continue to monitor these efforts and the performance of the Fund in the context of the other factors considered relevant by the Board.
The Board also received financial information about Federated, including information regarding the compensation and benefits Federated derived from its relationships with the Federated funds. This information covered not only the fees under the advisory contracts, but also fees received by Federated's subsidiaries for providing other services to the Federated funds under separate contracts (e.g., for serving as the Federated funds' administrator). The information also detailed any indirect benefit Federated may derive from its receipt of research services from brokers who execute Federated fund trades. In addition, the Board considered the fact that, in order for a fund to be competitive in the marketplace, Federated and its affiliates frequently waived fees and/or reimbursed expenses and have disclosed to fund investors and/or indicated to the Board their intention to do so in the future, where appropriate. Moreover, the Board receives regular reporting as to the institution, adjustment
Annual Shareholder Report
or elimination of these voluntary waivers. In addition, following discussions regarding the Senior Officer's May 2013 recommendations, Federated made meaningful reductions to gross advisory fees for several funds. At the Board meeting in May 2014, the Senior Officer proposed, and the Board approved, reductions in the contractual advisory fees of certain other funds.
Federated furnished information, requested by the Senior Officer, that reported revenues on a fund-by-fund basis and made estimates of the allocation of expenses on a fund-by-fund basis, using allocation methodologies specified by the Senior Officer. The Senior Officer noted that, while these cost allocation reports apply consistent allocation processes, the inherent difficulties in allocating costs continues to cause the Senior Officer to question the precision of the process and to conclude that such reports may be unreliable, since a single change in an allocation estimate may dramatically alter the resulting estimate of cost and/or profitability of a fund and may produce unintended consequences. The allocation information, including the Senior Officer's view that fund-by-fund estimations may be unreliable, was considered in the analysis by the Board.
The Board and the Senior Officer also reviewed information compiled by Federated comparing profitability information for Federated to other publicly held fund management companies. In this regard, the Senior Officer concluded that Federated's profit margins did not appear to be excessive.
The Senior Officer's Evaluation also discussed the notion of possible realization of “economies of scale” as a fund grows larger. The Board considered in this regard that the Adviser has made significant and long-term investments in areas that support all of the Federated family of funds, such as personnel and processes for the portfolio management, shareholder services, compliance, internal audit, and risk management functions; and systems technology; and that the benefits of these efforts (as well as any economies, should they exist) were likely to be enjoyed by the fund family as a whole. Finally, the Board also noted the absence of any applicable regulatory or industry guidelines on this subject, which (as discussed in the Senior Officer's Evaluation) is compounded by the lack of any common industry practice or general pattern with respect to structuring fund advisory fees with “breakpoints” that serve to reduce the fee as the fund attains a certain size.
The Senior Officer noted that, subject to the comments and recommendations made within his Evaluation, his observations and the information accompanying the Evaluation supported a finding by the Board that the management fees for each of the funds were reasonable. Under these circumstances, no changes were recommended to, and no objection was raised to, the continuation of the Fund's advisory contract.
In its decision to continue an existing investment advisory contract, the Board was mindful of the potential disruptions of the Fund's operations and various risks, uncertainties and other effects that could occur as a result of a decision to terminate or not renew an advisory contract. In particular, the Board recognized that many shareholders have invested in the Fund on the strength of the
Annual Shareholder Report
Adviser's industry standing and reputation and with the expectation that the Adviser will have a continuing role in providing advisory services to the Fund. Thus, the Board's approval of the advisory contract reflected the fact that it is the shareholders who have effectively selected the Adviser by virtue of having invested in the Fund. The Board concluded that, in light of the factors discussed above, including the nature, quality and scope of the services provided to the Fund by the Adviser and its affiliates, continuation of the advisory contract was appropriate.
The Board based its decision to approve the advisory contract on the totality of the circumstances and relevant factors and with a view to past and future long-term considerations. Not all of the factors and considerations identified above were necessarily relevant to the Fund, nor did the Board consider any one of them to be determinative. With respect to the factors that were relevant, the Board's decision to approve the contract reflects its determination that Federated's performance and actions provided a satisfactory basis to support the decision to continue the existing arrangements.
Annual Shareholder Report
Voting Proxies on Fund Portfolio Securities
A description of the policies and procedures that the Fund uses to determine how to vote proxies, if any, relating to securities held in the Fund's portfolio is available, without charge and upon request, by calling 1-800-341-7400. A report on “Form N-PX” of how the Fund voted any such proxies during the most recent 12-month period ended June 30 is available via the Proxy Voting Record (Form N-PX) link associated with the Fund and share class name at www.FederatedInvestors.com/FundInformation. Form N-PX filings are also available at the SEC's website at www.sec.gov.
Quarterly Portfolio Schedule
The Fund files with the SEC a complete schedule of its portfolio holdings, as of the close of the first and third quarters of its fiscal year, on “Form N-Q.” These filings are available on the SEC's website at www.sec.gov and may be reviewed and copied at the SEC's Public Reference Room in Washington, DC. (Call 1-800-SEC-0330 for information on the operation of the Public Reference Room.) You may also access this information via the link to the Fund and share class name at www.FederatedInvestors.com/FundInformation.
Annual Shareholder Report
Mutual funds are not bank deposits or obligations, are not guaranteed by any bank and are not insured or guaranteed by the U.S. government, the Federal Deposit Insurance Corporation, the Federal Reserve Board or any other government agency. Investment in mutual funds involves investment risk, including the possible loss of principal.
This Report is authorized for distribution to prospective investors only when preceded or accompanied by the Fund's Prospectus, which contains facts concerning its objective and policies, management fees, expenses and other information.
Federated MDT Large Cap Growth Fund
Federated Investors Funds
4000 Ericsson Drive
Warrendale, PA 15086-7561
Contact us at FederatedInvestors.com
or call 1-800-341-7400.
Federated Securities Corp., Distributor
CUSIP 31421R700
CUSIP 31421R684
CUSIP 31421R809
CUSIP 31421R882
37329 (9/14)
Federated is a registered trademark of Federated Investors, Inc.
2014 ©Federated Investors, Inc.
Annual Shareholder Report
July 31, 2014
| Share Class | Ticker |
| A | QASCX |
| C | QCSCX |
| Institutional | QISCX |
Federated MDT Small Cap Core Fund
Fund Established 2005
A Portfolio of Federated MDT Series
Dear Valued Shareholder,
I am pleased to present the Annual Shareholder Report for your fund covering the period from August 1, 2013 through July 31, 2014. This report includes Management's Discussion of Fund Performance, a complete listing of your fund's holdings, performance information and financial statements along with other important fund information.
In addition, our website, FederatedInvestors.com, offers easy access to Federated resources that include timely fund updates, economic and market insights from our investment strategists, and financial planning tools. We invite you to register to take full advantage of its capabilities.
Thank you for investing with Federated. I hope you find this information useful and look forward to keeping you informed.
Sincerely,
J. Christopher Donahue, President
Not FDIC Insured • May Lose Value • No Bank Guarantee
CONTENTS
| 1 |
| 5 |
| 7 |
| 21 |
| 24 |
| 25 |
| 26 |
| 27 |
| 36 |
| 37 |
| 39 |
| 44 |
| 50 |
| 50 |
Management's Discussion of Fund Performance (unaudited)
The total return of Federated MDT Small Cap Core Fund (the “Fund”), based on net asset value, for the 12-month reporting period ended July 31, 2014 was 10.00% for Class A Shares, 9.22% for Class C Shares and 10.33% for Institutional Shares. The total return for the Russell 2000® Index (R2000),1 the Fund's broad-based securities market index, was 8.56% for the same period. The total return of the Morningstar Small Blend Funds Average (MSBFA),2 a peer group average for the Fund, was 9.76% during the same period. The Fund's and MSBFA's total returns for the most recently completed fiscal year reflected actual cash flows, transaction costs and other expenses, which were not reflected in the total return of the R2000.
During the reporting period, the Fund's investment strategy focused on stock selection. This was the most significant factor affecting the Fund's performance relative to the R2000 during the period.
The following discussion will focus on the performance of the Fund's Institutional Shares.
MARKET OVERVIEW
During the 12-month reporting period, domestic equity market performance was very strong as evidenced by the 16.37% return on the Russell 3000® Index.3 Large-cap stocks led the way with the Russell Top 200® Index4 returning 17.38%, closely followed by mid-cap stocks with a 16.36% return on the Russell Midcap® Index.5 Small-cap stocks6 posted a moderate gain with the Russell 2000® Index7 returning 8.56%. Growth stocks outperformed value stocks during the reporting period with the Russell 3000® Growth Index,8 returning 17.89% as compared to 14.87% for the Russell 3000® Value Index.9
The best performing sectors in the R2000 during the reporting period were Energy (18.82%), Health Care (12.60%) and Materials (11.35%). Underperforming sectors during the same period included Telecommunication Services (-0.09%), Consumer Discretionary (1.44%) and Utilities (6.25%).
STOCK SELECTION
When looking at the strategy from the point of view of fundamental characteristics, Fund performance during the 12-month reporting period was driven by overweighting stocks with high value and moderate analyst conviction followed by good stock selection among stocks with high analyst conviction and improving earnings. Stocks with low to moderate value and moderate analyst conviction detracted the most from performance. Although the Fund's sector exposures remained close to the R2000, good stock selection in the Industrials and Consumer Discretionary sectors contributed significantly to Fund performance. A significant negative factor in the Fund's performance was the necessary exposure to cash (2.1% as a percentage of the Fund's market value) which underperformed the equity market.
Annual Shareholder Report
Individual stocks enhancing the Fund's performance during the reporting period included Ubiquiti Networks Incorporated, Greenbrier Companies Incorporated and Green Plains Incorporated.
Individual stocks detracting from the Fund's performance during the reporting period included ITT Educational Services and Dexcom Incorporated.
| 1 | Please see the footnotes to the line graphs below for definitions of, and further information about, the R2000. |
| 2 | Please see the footnotes to the line graphs below for definitions of, and further information about, the MSBFA. |
| 3 | The Russell 3000® Index measures the performance of the largest 3,000 U.S. companies representing approximately 98% of the investable U.S. equity market. The Russell 3000® Index is constructed to provide a comprehensive, unbiased, and stable barometer of the broad market and is completely reconstituted annually to ensure new and growing equities are reflected. The index is unmanaged, and it is not possible to invest directly in an index. |
| 4 | The Russell Top 200® Index measures the performance of the largest cap segment of the U.S. equity universe. The Russell Top 200® Index is a subset of the Russell 3000® Index. It includes approximately 200 of the largest securities based on a combination of their market cap and current index membership and represents approximately 68% of the U.S. market. The Russell Top 200® Index is constructed to provide a comprehensive and unbiased barometer for this very large cap segment and is completely reconstituted annually to ensure new and growing equities are reflected. The index is unmanaged, and it is not possible to invest directly in an index. |
| 5 | The Russell Midcap® Index measures the performance of the mid-cap segment of the U.S. equity universe. The Russell Midcap® Index is a subset of the Russell 1000® Index. It includes approximately 800 of the smallest securities based on a combination of their market cap and current index membership. The Russell Midcap® Index represents approximately 31% of the total market capitalization of the Russell 1000® companies. The Russell Midcap® Index is constructed to provide a comprehensive and unbiased barometer for the mid-cap segment. The Russell Midcap® Index is completely reconstituted annually to ensure larger stocks do not distort the performance and characteristics of the true mid-cap opportunity set. The index is unmanaged, and it is not possible to invest directly in an index. |
| 6 | Small-cap stocks may be less liquid and subject to greater price volatility than large-cap stocks. |
| 7 | The Russell 2000® Index measures the performance of the small-cap segment of the U.S. equity universe. The Russell 2000® Index is a subset of the Russell 3000® Index representing approximately 10% of the total market capitalization of that index. It includes approximately 2000 of the smallest securities based on a combination of their market cap and current index membership. The Russell 2000® Index is constructed to provide a comprehensive and unbiased small-cap barometer and is completely reconstituted annually to ensure larger stocks do not distort the performance and characteristics of the true small-cap opportunity set. The index is unmanaged, and it is not possible to invest directly in an index. |
| 8 | The Russell 3000® Growth Index measures the performance of the broad growth segment of the U.S. equity universe. It includes those Russell 3000® Index companies with higher price-to-book ratios and higher forecasted growth values. The Russell 3000® Growth Index is constructed to provide a comprehensive, unbiased and stable barometer of the broad growth market. The Russell 3000® Growth Index is completely reconstituted annually to ensure new and growing equities are included and that the represented companies continue to reflect growth characteristics. The index is unmanaged, and it is not possible to invest directly in an index. |
| 9 | The Russell 3000® Value Index measures the performance of the broad value segment of the U.S. equity value universe. It includes those Russell 3000® Index companies with lower price-to-book ratios and lower forecasted growth values. The Russell 3000® Value Index is constructed to provide a comprehensive, unbiased and stable barometer of the broad value market. The Russell 3000® Value Index is completely reconstituted annually to ensure new and growing equities are included and that the represented companies continue to reflect value characteristics. The index is unmanaged, and it is not possible to invest directly in an index. |
Annual Shareholder Report
FUND PERFORMANCE AND GROWTH OF A $10,000 INVESTMENT
The graph below illustrates the hypothetical investment of $10,0001 in the Federated MDT Small Cap Core Fund2 from September 15, 2005 (start of performance) to July 31, 2014, compared to the Russell 2000® Index (R2000)3 and the Morningstar Small Blend Funds Average (MSBFA).4 The Average Annual Total Return table below shows returns for each class averaged over the stated periods.
Growth of a $10,000 INVESTMENT
Growth of $10,000 as of July 31, 2014
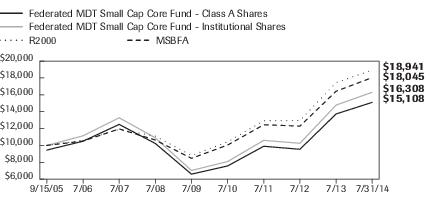
| Federated MDT Small Cap Core Fund - | Class A Shares | Institutional Shares | R2000 | MSBFA |
| F | F | I | I |
| 9/15/2005 | 9,450 | 10,000 | 10,000 | 10,000 |
| 7/31/2006 | 10,499 | 11,140 | 10,619 | 10,516 |
| 7/31/2007 | 12,493 | 13,280 | 11,906 | 11,959 |
| 7/31/2008 | 10,234 | 10,900 | 11,107 | 10,643 |
| 7/31/2009 | 6,595 | 7,030 | 8,805 | 8,470 |
| 7/31/2010 | 7,567 | 8,090 | 10,427 | 10,046 |
| 7/31/2011 | 9,903 | 10,603 | 12,922 | 12,451 |
| 7/31/2012 | 9,542 | 10,253 | 12,947 | 12,291 |
| 7/31/2013 | 13,732 | 14,781 | 17,447 | 16,423 |
| 7/31/2014 | 15,108 | 16,308 | 18,941 | 18,045 |
41 graphic description end -->
| ■ | Total returns shown include the maximum sales charge of 5.50% ($10,000 investment minus $550 sales charge = $9,450). |
The Fund offers multiple shares classes whose performance may be greater than or less than its other share class(es) due to differences in sales charges and expenses. See the Average Annual Total Returns table below for the returns of additional classes not shown in the line graph above.
Average Annual Total Returns for the Periods Ended 7/31/2014
(returns reflect all applicable sales charges and contingent deferred sales charges as specified below in footnote #1)
| | 1 Year | 5 Years | Start of
Performance* |
| Class A Shares | 3.93% | 16.71% | 4.76% |
| Class C Shares | 8.22% | 17.15% | 4.65% |
| Institutional Shares | 10.33% | 18.33% | 5.66% |
| R2000 | 8.56% | 16.56% | 7.46% |
| MSBFA | 9.76% | 16.46% | 7.01% |
| * | The Fund's start of performance date was September 15, 2005. |
Annual Shareholder Report
Performance data quoted represents past performance which is no guarantee of future results. Investment return and principal value will fluctuate so that an investor's shares, when redeemed, may be worth more or less than their original cost. Mutual fund performance changes over time and current performance may be lower or higher than what is stated. For current to the most recent month-end performance and after-tax returns, visit FederatedInvestors.com or call 1-800-341-7400. Returns shown do not reflect the deduction of taxes that a shareholder would pay on Fund distributions or the redemption of Fund shares. Mutual funds are not obligations of or guaranteed by any bank and are not federally insured.
| 1 | Represents a hypothetical investment of $10,000 in the Fund after deducting applicable sales charges: for Class A Shares, the maximum sales charge of 5.50% ($10,000 investment minus $550 sales charge = $9,450); for Class C Shares, a 1.00% contingent deferred sales charge would be applied on any redemption less than one year from the purchase date. The Fund's performance assumes the reinvestment of all dividends and distributions. The R2000 and MSBFA have been adjusted to reflect reinvestment of dividends on securities. |
| 2 | The Fund is the successor to MDT Small Cap Core Fund pursuant to a reorganization that took place on December 8, 2006. Prior to that date, the Fund had no investment operations. Accordingly, the performance information shown for periods prior to that date is that of the MDT Small Cap Core Fund. |
| 3 | The R2000 measures the performance of the small-cap segment of the U.S. equity universe. The R2000 is a subset of the Russell 3000® Index representing approximately 10% of the total market capitalization of that index. It includes approximately 2000 of the smallest securities based on a combination of their market cap and current index membership. The R2000 is constructed to provide a comprehensive and unbiased small-cap barometer and is completely reconstituted annually to ensure larger stocks do not distort the performance and characteristics of the true small-cap opportunity set. The R2000 is unmanaged and, unlike the Fund, is not affected by cash flows. It is not possible to invest directly in an index. The R2000 is not adjusted to reflect sales charges, expenses or other fees that the Securities and Exchange Commission requires to be reflected in the Fund's performance. |
| 4 | Morningstar figures represent the average of the total returns reported by all the mutual funds designated by Morningstar as falling into the respective category indicated. They do not reflect sales charges. |
Annual Shareholder Report
Portfolio of Investments Summary Table (unaudited)
At July 31, 2014, the Fund's industry composition1 was as follows:
| Industry Composition | Percentage of
Total Net Assets |
| Regional Banks | 9.1% |
| Financial Services | 4.3% |
| Software Packaged/Custom | 3.4% |
| Semiconductor Manufacturing | 2.7% |
| Savings & Loan | 2.6% |
| Multi-Line Insurance | 2.1% |
| Property Liability Insurance | 2.1% |
| Specialty Retailing | 2.1% |
| Medical Technology | 2.0% |
| Oil Service, Explore & Drill | 1.9% |
| Miscellaneous Components | 1.7% |
| Biotechnology | 1.6% |
| Services to Medical Professionals | 1.6% |
| Auto Original Equipment Manufacturers | 1.5% |
| Education & Training Services | 1.5% |
| Building Materials | 1.3% |
| Computer Networking | 1.3% |
| Shoes | 1.3% |
| Apparel | 1.2% |
| Electric Utility | 1.2% |
| Electronic Equipment Instruments & Components | 1.2% |
| Poultry Products | 1.2% |
Annual Shareholder Report
| Industry Composition | Percentage of
Total Net Assets |
| Commercial Services | 1.1% |
| Electrical Equipment | 1.1% |
| Internet Services | 1.1% |
| Internet Software & Services | 1.1% |
| Medical Supplies | 1.1% |
| Personnel Agency | 1.1% |
| Securities Brokerage | 1.1% |
| Computer Stores | 1.0% |
| Ethical Drugs | 1.0% |
| Miscellaneous Food Products | 1.0% |
| Plastic | 1.0% |
| Other2 | 37.7% |
| Cash Equivalents3 | 2.0% |
| Other Assets and Liabilities—Net4 | (0.3)% |
| TOTAL | 100.0% |
| 1 | Except for Cash Equivalents and Other Assets and Liabilities, industry classifications are based upon, and individual portfolio securities are assigned to, the classifications of the Global Industry Classification Standard (GICS) except that the Adviser assigns a classification to securities not classified by the GICS and to securities for which the Adviser does not have access to the classification made by the GICS. |
| 2 | For purposes of this table, industry classifications which constitute less than 1.0% of the Fund's total net assets have been aggregated under the designation “Other.” |
| 3 | Cash Equivalents include any investments in money market mutual funds and/or overnight repurchase agreements. |
| 4 | Assets, other than investments in securities, less liabilities. See Statement of Assets and Liabilities. |
Annual Shareholder Report
Portfolio of Investments
July 31, 2014
| Shares | | | Value |
| | | COMMON STOCKS—98.3% | |
| | | Accident & Health Insurance—0.1% | |
| 1,487 | 1 | Triple-S Management Corp., Class B | $25,695 |
| | | Advertising—0.1% | |
| 1,800 | 1 | Conversant, Inc. | 42,066 |
| | | Agricultural Machinery—0.3% | |
| 1,700 | | Alamo Group, Inc. | 80,801 |
| | | Airline - National—0.6% | |
| 17,840 | 1 | Jet Blue Airways Corp. | 191,245 |
| | | Airline - Regional—0.7% | |
| 712 | | Alaska Air Group, Inc. | 31,307 |
| 7,314 | 1 | Republic Airways Holdings, Inc. | 72,701 |
| 4,427 | | SkyWest, Inc. | 47,324 |
| 900 | 1 | Spirit Airlines, Inc. | 58,878 |
| | | TOTAL | 210,210 |
| | | Aluminum—0.1% | |
| 500 | | Kaiser Aluminum Corp. | 38,610 |
| | | Apparel—1.2% | |
| 1,500 | | Columbia Sportswear Co. | 112,140 |
| 700 | 1 | G-III Apparel Group Ltd. | 54,369 |
| 4,800 | 1 | Iconix Brand Group, Inc. | 202,704 |
| | | TOTAL | 369,213 |
| | | Auto Original Equipment Manufacturers—1.5% | |
| 3,800 | 1 | Gentherm, Inc. | 159,030 |
| 9,700 | 1 | Meritor, Inc. | 121,929 |
| 3,300 | 1 | Stoneridge, Inc. | 36,201 |
| 500 | | Strattec Security Corp. | 31,415 |
| 1,754 | 1 | Tenneco Automotive, Inc. | 111,730 |
| | | TOTAL | 460,305 |
| | | Auto Part Replacement—0.7% | |
| 2,700 | 1 | Motorcar Parts and Accessories, Inc. | 60,102 |
| 4,385 | | Standard Motor Products, Inc. | 158,079 |
| | | TOTAL | 218,181 |
| | | Automotive—0.6% | |
| 1,200 | | Remy International, Inc. | 26,616 |
| 4,600 | 1 | Tower International, Inc. | 144,900 |
| | | TOTAL | 171,516 |
Annual Shareholder Report
| Shares | | | Value |
| | | COMMON STOCKS—continued | |
| | | Biotechnology—1.6% | |
| 10,900 | 1 | Affymetrix, Inc. | $93,740 |
| 2,800 | 1 | Anika Therapeutics, Inc. | 117,768 |
| 1,800 | 1 | Enanta Pharmaceuticals, Inc. | 67,698 |
| 9,500 | 1 | Repligen Corp. | 199,215 |
| | | TOTAL | 478,421 |
| | | Book Publishing—0.4% | |
| 3,400 | | Scholastic Corp. | 120,428 |
| | | Building Materials—1.3% | |
| 2,800 | | Aaon, Inc. | 54,936 |
| 2,100 | 1 | Drew Industries, Inc. | 94,500 |
| 1,200 | 1 | Nortek, Inc. | 95,724 |
| 2,300 | 1 | Patrick Industries, Inc. | 95,795 |
| 1,200 | | Universal Forest Products, Inc. | 52,536 |
| | | TOTAL | 393,491 |
| | | Business Services—0.5% | |
| 2,700 | 1 | Euronet Worldwide, Inc. | 135,108 |
| | | Clothing Stores—0.4% | |
| 1,800 | | Children's Place, Inc./The | 90,360 |
| 2,700 | | Stein Mart, Inc. | 35,046 |
| | | TOTAL | 125,406 |
| | | Commercial Services—1.1% | |
| 6,300 | 1 | Parexel International Corp. | 337,428 |
| | | Communications Equipment—0.4% | |
| 5,800 | 1 | Polycom, Inc. | 74,356 |
| 8,900 | 1 | Shoretel, Inc. | 55,002 |
| | | TOTAL | 129,358 |
| | | Computer Networking—1.3% | |
| 2,151 | | Black Box Corp. | 44,526 |
| 4,000 | 1 | NetScout Systems, Inc. | 170,120 |
| 7,100 | 1 | Super Micro Computer, Inc. | 185,807 |
| | | TOTAL | 400,453 |
| | | Computer Peripherals—0.3% | |
| 5,800 | 1 | Aruba Networks, Inc. | 103,588 |
| | | Computer Services—0.9% | |
| 2,100 | 1 | EPAM Systems, Inc. | 81,186 |
| 4,000 | 1 | Manhattan Associates, Inc. | 117,440 |
| 3,900 | 1 | Sykes Enterprises, Inc. | 80,730 |
| | | TOTAL | 279,356 |
Annual Shareholder Report
| Shares | | | Value |
| | | COMMON STOCKS—continued | |
| | | Computer Stores—1.0% | |
| 5,971 | 1 | Insight Enterprises, Inc. | $156,858 |
| 6,869 | 1 | PC Connections, Inc. | 140,334 |
| | | TOTAL | 297,192 |
| | | Construction & Engineering—0.5% | |
| 3,400 | 1 | Pike Electric Corp. | 27,404 |
| 4,600 | 1 | Tutor Perini Corp. | 125,258 |
| | | TOTAL | 152,662 |
| | | Cosmetics & Toiletries—0.3% | |
| 1,700 | 1 | Helen of Troy Ltd. | 91,171 |
| | | Crude Oil & Gas Production—0.2% | |
| 500 | 1 | Clayton Williams Energy, Inc. | 53,205 |
| | | Dairy Products—0.7% | |
| 3,100 | | Cal-Maine Foods, Inc. | 220,720 |
| | | Defense Aerospace—0.7% | |
| 4,300 | | AAR Corp. | 115,670 |
| 1,500 | 1 | Ducommun, Inc. | 41,475 |
| 1,500 | | Kaman Corp., Class A | 60,015 |
| | | TOTAL | 217,160 |
| | | Department Stores—0.0% | |
| 1,100 | | Bon-Ton Stores, Inc. | 10,230 |
| | | Diversified Financials—0.2% | |
| 5,100 | | Janus Capital Group, Inc. | 58,089 |
| | | Diversified Leisure—0.1% | |
| 1,900 | 1 | Live Nation, Inc. | 44,099 |
| | | Drug Stores—0.3% | |
| 12,200 | 1 | Rite Aid Corp. | 81,618 |
| | | Education & Training Services—1.5% | |
| 2,600 | 1 | Grand Canyon Education, Inc. | 111,800 |
| 6,344 | 1 | ITT Educational Services, Inc. | 90,275 |
| 4,600 | 1 | Strayer Education, Inc. | 238,372 |
| | | TOTAL | 440,447 |
| | | Electric & Electronic Original Equipment Manufacturers—0.6% | |
| 7,700 | | General Cable Corp. | 171,171 |
| | | Electric Utility—1.2% | |
| 200 | | Avista Corp. | 6,206 |
| 2,700 | | Empire Distribution Electric Co. | 66,177 |
| 3,200 | | Idacorp, Inc. | 171,360 |
| 1,300 | | Otter Tail Corp. | 36,348 |
Annual Shareholder Report
| Shares | | | Value |
| | | COMMON STOCKS—continued | |
| | | Electric Utility—continued | |
| 2,600 | | Portland General Electric Co. | $83,018 |
| | | TOTAL | 363,109 |
| | | Electrical - Radio & TV—0.5% | |
| 3,000 | 1 | Universal Electronics, Inc. | 142,890 |
| | | Electrical Equipment—1.1% | |
| 3,600 | | Brady (W.H.) Co. | 94,140 |
| 3,600 | | EnerSys, Inc. | 228,348 |
| | | TOTAL | 322,488 |
| | | Electronic Equipment Instruments & Components—1.2% | |
| 1,800 | 1 | Itron, Inc. | 64,764 |
| 13,067 | 1 | Sanmina Corp. | 304,330 |
| | | TOTAL | 369,094 |
| | | Electronics Stores—0.7% | |
| 2,500 | 1 | Rex Stores Corp. | 210,875 |
| | | Energy Equipment & Services—0.4% | |
| 2,500 | | Exterran Holdings, Inc. | 105,625 |
| | | Ethical Drugs—1.0% | |
| 10,698 | 1 | PharMerica Corp. | 288,739 |
| | | Financial Services—4.3% | |
| 10,600 | | Boston Private Financial Holdings | 132,288 |
| 800 | 1 | Cardtronics, Inc. | 30,848 |
| 6,335 | | Deluxe Corp. | 348,488 |
| 3,000 | 1 | Global Cash Access LLC | 25,110 |
| 2,100 | 1 | Huron Consulting Group, Inc. | 126,924 |
| 2,900 | | Lakeland Financial Corp. | 105,531 |
| 9,058 | | MainSource Financial Group, Inc. | 147,917 |
| 2,807 | | Nelnet, Inc., Class A | 115,733 |
| 3,900 | 1 | Outerwall, Inc. | 214,578 |
| 2,700 | | Provident Financial Services, Inc. | 45,117 |
| | | TOTAL | 1,292,534 |
| | | Food Wholesaling—0.5% | |
| 6,400 | 1 | Omega Protein Corp. | 89,728 |
| 5,800 | 1 | SUPERVALU, Inc. | 53,186 |
| | | TOTAL | 142,914 |
| | | Furniture—0.4% | |
| 4,400 | | Haverty Furniture Cos., Inc. | 97,812 |
| 2,259 | | Kimball International, Inc., Class B | 35,624 |
| | | TOTAL | 133,436 |
Annual Shareholder Report
| Shares | | | Value |
| | | COMMON STOCKS—continued | |
| | | Gas Distributor—0.4% | |
| 2,300 | | New Jersey Resources Corp. | $117,484 |
| | | Generic Drugs—0.4% | |
| 5,400 | 1 | Impax Laboratories, Inc. | 126,306 |
| | | Grocery Chain—0.1% | |
| 1,600 | | Ingles Markets, Inc., Class A | 39,232 |
| | | Health Care Equipment & Supplies—0.3% | |
| 6,000 | 1 | Merit Medical Systems, Inc. | 77,040 |
| 400 | 1 | Zeltiq Aesthetics, Inc. | 8,096 |
| | | TOTAL | 85,136 |
| | | Home Health Care—0.6% | |
| 400 | 1 | Addus Homecare Corp. | 8,856 |
| 3,200 | 1 | Providence Service Corp. | 126,752 |
| 500 | 1 | Wellcare Health Plans, Inc. | 31,190 |
| | | TOTAL | 166,798 |
| | | Home Products—0.3% | |
| 3,000 | 1 | Libbey, Inc. | 78,120 |
| | | Hospitals—0.6% | |
| 11,191 | | Select Medical Holdings Corp. | 173,908 |
| | | Hotels Restaurants & Leisure—0.4% | |
| 2,000 | 1 | Marriott Vacations Worldwide Corp. | 115,100 |
| | | Household Appliances—0.1% | |
| 3,342 | 1 | hhgregg, Inc. | 23,762 |
| | | Industrial Machinery—0.2% | |
| 1,900 | | Columbus McKinnon Corp. | 44,175 |
| | | Industrial Services—0.2% | |
| 5,100 | 1 | Willbros. Group, Inc. | 59,109 |
| | | Insurance—0.0% | |
| 400 | | Kemper Corp. | 13,844 |
| | | Insurance Brokerage—0.7% | |
| 3,600 | | AmTrust Financial Services, Inc. | 153,504 |
| 5,400 | | Crawford & Co., Class B | 49,680 |
| | | TOTAL | 203,184 |
| | | Integrated Domestic Oil—0.3% | |
| 10,100 | 1 | Callon Petroleum Corp. | 99,788 |
| | | International Bank—0.1% | |
| 1,400 | 1 | Preferred Bank Los Angeles, CA | 31,066 |
| | | Internet Services—1.1% | |
| 3,400 | | j2 Global, Inc. | 166,328 |
Annual Shareholder Report
| Shares | | | Value |
| | | COMMON STOCKS—continued | |
| | | Internet Services—continued | |
| 1,900 | 1 | Orbitz Worldwide, Inc. | $16,815 |
| 5,700 | 1 | Web.com Group, Inc. | 151,335 |
| | | TOTAL | 334,478 |
| | | Internet Software & Services—1.1% | |
| 4,900 | 1 | LogMeIn, Inc. | 199,479 |
| 2,500 | 1 | VistaPrint Ltd. | 123,150 |
| | | TOTAL | 322,629 |
| | | IT Services—0.3% | |
| 5,500 | 1 | Moneygram International, Inc. | 79,475 |
| | | Jewelry Stores—0.3% | |
| 2,300 | | Movado Group, Inc. | 94,139 |
| | | Leasing—0.2% | |
| 2,700 | 1 | Willis Lease Finance Corp. | 61,506 |
| | | Life Insurance—0.8% | |
| 1,300 | 1 | Phoenix Companies, Inc. | 72,033 |
| 6,768 | | Symetra Financial Corp. | 154,310 |
| | | TOTAL | 226,343 |
| | | Machine Tools—0.1% | |
| 900 | | Hurco Co., Inc. | 28,899 |
| | | Machined Parts Original Equipment Manufacturers—0.3% | |
| 2,100 | | Applied Industrial Technologies, Inc. | 101,766 |
| | | Machinery—0.8% | |
| 3,000 | | Douglas Dynamics, Inc. | 50,100 |
| 2,500 | | Hyster-Yale Materials Handling, Inc. | 200,250 |
| | | TOTAL | 250,350 |
| | | Magazine Publishing—0.1% | |
| 600 | | Meredith Corp. | 27,552 |
| | | Medical Supplies—1.1% | |
| 200 | | CONMED Corp. | 7,800 |
| 3,500 | | Invacare Corp. | 52,395 |
| 1,600 | 1 | NuVasive, Inc. | 59,808 |
| 1,600 | | Owens & Minor, Inc. | 52,944 |
| 700 | | PetMed Express, Inc. | 9,590 |
| 2,800 | | Steris Corp. | 142,464 |
| | | TOTAL | 325,001 |
| | | Medical Technology—2.0% | |
| 4,900 | 1 | Greatbatch Technologies, Inc. | 242,599 |
| 5,400 | 1 | Masimo Corp. | 130,032 |
Annual Shareholder Report
| Shares | | | Value |
| | | COMMON STOCKS—continued | |
| | | Medical Technology—continued | |
| 6,900 | 1 | Natus Medical, Inc. | $198,513 |
| 2,800 | 1 | PhotoMedex, Inc. | 30,212 |
| | | TOTAL | 601,356 |
| | | Metal Fabrication—0.8% | |
| 3,958 | | NN, Inc. | 114,782 |
| 1,500 | | Olympic Steel, Inc. | 32,895 |
| 2,300 | | Worthington Industries, Inc. | 87,975 |
| | | TOTAL | 235,652 |
| | | Metals & Mining—0.3% | |
| 1,800 | | US Silica Holdings, Inc. | 101,196 |
| | | Mini-Mill Producer—0.3% | |
| 5,200 | | Commercial Metals Corp. | 89,648 |
| | | Miscellaneous Communications—0.7% | |
| 8,200 | | West Corp. | 211,314 |
| | | Miscellaneous Components—1.7% | |
| 14,600 | 1 | Amkor Technology, Inc. | 129,210 |
| 5,700 | 1 | International Rectifier Corp. | 141,588 |
| 1,500 | 1 | Proto Labs, Inc. | 121,500 |
| 14,400 | 1 | Qlogic Corp. | 131,040 |
| | | TOTAL | 523,338 |
| | | Miscellaneous Food Products—1.0% | |
| 5,500 | | Fresh Del Monte Produce, Inc. | 164,670 |
| 2,650 | | The Anderson's, Inc. | 143,153 |
| | | TOTAL | 307,823 |
| | | Miscellaneous Machinery—0.4% | |
| 1,900 | | Curtiss Wright Corp. | 120,669 |
| | | Miscellaneous Metals—0.1% | |
| 1,300 | | Materion Corp. | 42,003 |
| | | Money Center Bank—0.0% | |
| 178 | | MidWestOne Financial Group, Inc. | 4,183 |
| | | Multi-Industry Basic—0.4% | |
| 10,800 | 1 | Graphic Packaging Holding Co. | 129,600 |
| | | Multi-Industry Transportation—0.4% | |
| 4,500 | | Brinks Co. (The) | 120,780 |
| | | Multi-Line Insurance—2.1% | |
| 9,435 | | CNO Financial Group, Inc. | 152,658 |
| 2,975 | | FBL Financial Group, Inc., Class A | 127,271 |
| 6,525 | | Montpelier Re Holdings Ltd. | 192,683 |
Annual Shareholder Report
| Shares | | | Value |
| | | COMMON STOCKS—continued | |
| | | Multi-Line Insurance—continued | |
| 1,600 | 1 | Navigators Group, Inc. | $97,280 |
| 1,400 | | Safety Insurance Group, Inc. | 70,014 |
| | | TOTAL | 639,906 |
| | | Mutual Fund Adviser—0.4% | |
| 1,500 | | GAMCO Investors, Inc., Class A | 114,945 |
| | | Natural Gas Production—0.2% | |
| 7,863 | 1 | VAALCO Energy, Inc. | 54,255 |
| | | Nickel—0.1% | |
| 900 | | Globe Specialty Metals, Inc. | 17,127 |
| | | Office Supplies—0.5% | |
| 3,526 | | United Stationers, Inc. | 136,033 |
| | | Oil Gas & Consumable Fuels—0.3% | |
| 3,300 | | Comstock Resources, Inc. | 78,078 |
| | | Oil Refiner—0.3% | |
| 3,522 | | Delek US Holdings, Inc. | 102,913 |
| | | Oil Service, Explore & Drill—1.9% | |
| 10,100 | 1 | Basic Energy Services, Inc. | 242,299 |
| 7,300 | 1 | Helix Energy Solutions Group, Inc. | 185,639 |
| 2,000 | 1 | Matrix Services Co. | 53,700 |
| 7,000 | 1 | Pioneer Energy Services Corp. | 102,970 |
| | | TOTAL | 584,608 |
| | | Oil Well Supply—0.2% | |
| 800 | | Park-Ohio Holdings Corp. | 47,488 |
| | | Other Communications Equipment—0.2% | |
| 2,100 | 1 | Netgear, Inc. | 65,751 |
| | | Paper & Forest Products—0.3% | |
| 3,200 | 1 | Boise Cascade Co. | 90,080 |
| | | Paper Products—0.8% | |
| 1,900 | | Kadant, Inc. | 72,466 |
| 2,300 | | Neenah Paper, Inc. | 114,126 |
| 3,400 | 1 | Xerium Technologies, Inc. | 44,200 |
| | | TOTAL | 230,792 |
| | | Personal Loans—0.2% | |
| 500 | 1 | Credit Acceptance Corp. | 56,863 |
| | | Personnel Agency—1.1% | |
| 1,500 | 1 | AMN Healthcare Services, Inc. | 19,650 |
| 6,500 | | KForce Com, Inc. | 129,285 |
| 3,435 | | Kelly Services, Inc., Class A | 54,754 |
Annual Shareholder Report
| Shares | | | Value |
| | | COMMON STOCKS—continued | |
| | | Personnel Agency—continued | |
| 1,400 | | Maximus, Inc. | $57,904 |
| 3,100 | 1 | On Assignment, Inc. | 83,731 |
| | | TOTAL | 345,324 |
| | | Pharmaceuticals—0.3% | |
| 2,200 | 1 | Akorn, Inc. | 74,646 |
| | | Photo-Optical Component-Equipment—0.2% | |
| 1,600 | | Cognex Corp. | 65,568 |
| | | Plastic—1.0% | |
| 1,200 | | Polyone Corp. | 45,540 |
| 6,600 | | Schulman (A.), Inc. | 262,284 |
| | | TOTAL | 307,824 |
| | | Poultry Products—1.2% | |
| 4,800 | 1 | Pilgrim's Pride Corp. | 134,208 |
| 2,600 | | Sanderson Farms, Inc. | 236,834 |
| | | TOTAL | 371,042 |
| | | Printed Circuit Boards—0.5% | |
| 4,000 | 1 | Benchmark Electronics, Inc. | 96,600 |
| 11,747 | 1 | Sigma Designs, Inc. | 49,807 |
| | | TOTAL | 146,407 |
| | | Printing—0.1% | |
| 1,594 | | Quad Graphics, Inc. | 33,665 |
| | | Professional Services—0.2% | |
| 2,100 | 1 | ICF International, Inc. | 72,597 |
| | | Property Liability Insurance—2.1% | |
| 2,770 | | Argo Group International Holdings Ltd. | 137,974 |
| 600 | 1 | Enstar Group Ltd. | 82,800 |
| 3,800 | | Horace Mann Educators Corp. | 108,870 |
| 6,100 | | OneBeacon Insurance Group Ltd. | 90,280 |
| 2,774 | | Platinum Underwriters Holdings Ltd. | 162,556 |
| 2,100 | | Selective Insurance Group, Inc. | 46,809 |
| | | TOTAL | 629,289 |
| | | Psychiatric Centers—0.0% | |
| 200 | 1 | Acadia Healthcare Co., Inc. | 9,532 |
| | | Railroad—0.6% | |
| 3,000 | | Greenbrier Cos., Inc. | 193,350 |
| | | Recreational Goods—0.3% | |
| 1,700 | 1 | Smith & Wesson Holding Corp. | 20,995 |
Annual Shareholder Report
| Shares | | | Value |
| | | COMMON STOCKS—continued | |
| | | Recreational Goods—continued | |
| 1,600 | | Sturm Ruger & Co., Inc. | $79,936 |
| | | TOTAL | 100,931 |
| | | Regional Banks—9.1% | |
| 1,700 | | Ameris Bancorp | 37,128 |
| 2,000 | | Arrow Financial Corp. | 50,800 |
| 1,900 | | BBCN Bancorp, Inc. | 28,538 |
| 1,200 | | BancFirst Corp. | 73,080 |
| 3,700 | | Bancorpsouth, Inc. | 77,219 |
| 5,300 | | Cathay Bancorp, Inc. | 135,627 |
| 5,800 | | Central Pacific Financial Corp. | 103,820 |
| 1,870 | | Community Trust Bancorp, Inc. | 65,431 |
| 3,074 | | Enterprise Financial Services Corp. | 53,641 |
| 2,099 | | Financial Institutions, Inc. | 46,598 |
| 5,600 | | First Financial Bancorp | 91,504 |
| 4,400 | | First Interstate BancSystem, Inc., Class A | 114,840 |
| 5,100 | | First Merchants Corp. | 101,643 |
| 7,999 | | First Midwest Bancorp, Inc. | 129,600 |
| 2,300 | | Great Southern Bancorp, Inc. | 71,714 |
| 2,900 | | Hancock Holding Co. | 94,076 |
| 2,180 | | Hanmi Financial Corp. | 46,042 |
| 2,800 | | MidSouth Bancorp, Inc. | 54,600 |
| 3,900 | | NBT Bancorp, Inc. | 91,143 |
| 5,000 | | OFG Bancorp. | 79,800 |
| 880 | | Peoples Bancorp, Inc. | 20,530 |
| 5,700 | | PrivateBancorp, Inc. | 164,160 |
| 2,800 | | S & T Bancorp, Inc. | 68,124 |
| 1,800 | | Sandy Spring Bancorp, Inc. | 42,138 |
| 1,900 | | Simmons 1st National Corp., Class A | 75,297 |
| 3,570 | | Southside Bancshares, Inc. | 104,637 |
| 4,100 | | Susquehanna Bankshares, Inc. | 41,738 |
| 1,500 | | Tompkins Financial Corporation | 66,720 |
| 3,800 | | Trustmark Corp. | 87,514 |
| 7,700 | | United Community Banks, Inc. | 127,435 |
| 700 | | Univest Corp. | 13,244 |
| 2,500 | | Wesbanco, Inc. | 74,700 |
| 6,700 | 1 | Western Alliance Bancorp | 153,430 |
| 5,457 | | Wilshire Bancorp, Inc. | 51,405 |
Annual Shareholder Report
| Shares | | | Value |
| | | COMMON STOCKS—continued | |
| | | Regional Banks—continued | |
| 2,300 | | Wintrust Financial Corp. | $106,559 |
| | | TOTAL | 2,744,475 |
| | | Rental & Leasing Services—0.1% | |
| 680 | | Rent-A-Center, Inc. | 16,279 |
| | | Restaurant—0.6% | |
| 800 | 1 | Buffalo Wild Wings, Inc. | 116,256 |
| 1,200 | 1 | Red Robin Gourmet Burgers | 77,232 |
| | | TOTAL | 193,488 |
| | | Road & Rail—0.2% | |
| 2,300 | | Knight Transportation, Inc. | 55,108 |
| | | Rubber—0.3% | |
| 3,600 | | Cooper Tire & Rubber Co. | 104,004 |
| | | Savings & Loan—2.6% | |
| 2,737 | | Banner Corp. | 110,137 |
| 1,000 | 1 | BofI Holding, Inc. | 74,590 |
| 2,000 | | First Defiance Financial Corp. | 54,020 |
| 7,300 | 1 | Flagstar Bancorp, Inc. | 133,590 |
| 2,300 | | Flushing Financial Corp. | 42,734 |
| 1,500 | | Glacier Bancorp, Inc. | 39,720 |
| 1,500 | | MB Financial, Inc. | 40,410 |
| 6,448 | | Provident Financial Holdings, Inc. | 91,884 |
| 1,500 | | WSFS Financial Corp. | 107,385 |
| 3,200 | | Webster Financial Corp. Waterbury | 91,744 |
| | | TOTAL | 786,214 |
| | | Securities Brokerage—1.1% | |
| 5,900 | 1 | Investment Technology Group, Inc. | 107,911 |
| 4,600 | 1 | Piper Jaffray Cos., Inc. | 237,360 |
| | | TOTAL | 345,271 |
| | | Semiconductor Distribution—0.6% | |
| 1,000 | 1 | Tyler Technologies, Inc. | 90,730 |
| 9,200 | 1 | Ultra Clean Holdings, Inc. | 79,764 |
| | | TOTAL | 170,494 |
| | | Semiconductor Manufacturing—2.7% | |
| 10,000 | 1 | Cirrus Logic, Inc. | 224,300 |
| 8,100 | 1 | Integrated Device Technology, Inc. | 116,316 |
| 2,100 | | Monolithic Power Systems | 86,604 |
| 9,910 | 1 | Omnivision Technologies, Inc. | 221,984 |
Annual Shareholder Report
| Shares | | | Value |
| | | COMMON STOCKS—continued | |
| | | Semiconductor Manufacturing—continued | |
| 4,200 | 1 | Plexus Corp. | $165,186 |
| | | TOTAL | 814,390 |
| | | Semiconductor Manufacturing Equipment—0.4% | |
| 5,953 | | Mentor Graphics Corp. | 117,572 |
| | | Semiconductors & Semiconductor Equipment—0.8% | |
| 3,200 | 1 | Cavium Networks, Inc. | 149,280 |
| 6,600 | | Intersil Holding Corp. | 84,678 |
| | | TOTAL | 233,958 |
| | | Services to Medical Professionals—1.6% | |
| 1,300 | 1 | Bio-Reference Laboratories, Inc. | 40,807 |
| 3,600 | 1 | MedAssets, Inc. | 76,464 |
| 2,700 | 1 | Team Health Holdings, Inc. | 152,685 |
| 4,000 | 1 | WebMD Health Corp., Class A | 199,320 |
| | | TOTAL | 469,276 |
| | | Shoes—1.3% | |
| 2,100 | | Brown Shoe Co., Inc. | 59,199 |
| 759 | 1 | Genesco, Inc. | 57,889 |
| 5,500 | 1 | Skechers USA, Inc., Class A | 286,935 |
| | | TOTAL | 404,023 |
| | | Software Packaged/Custom—3.4% | |
| 3,800 | 1 | Aspen Technology, Inc. | 165,072 |
| 619 | | CSG Systems International, Inc. | 16,119 |
| 6,100 | 1 | Constant Contact, Inc. | 189,893 |
| 8,300 | | Ebix, Inc. | 104,248 |
| 1,030 | 1 | ePlus, Inc. | 56,331 |
| 1,500 | 1 | IGATE Capital Corp. | 53,520 |
| 3,200 | 1 | Omnicell, Inc. | 87,680 |
| 3,800 | 1 | PTC, Inc. | 136,648 |
| 3,900 | | Pegasystems, Inc. | 83,343 |
| 5,500 | 1 | Take-Two Interactive Software, Inc. | 123,090 |
| | | TOTAL | 1,015,944 |
| | | Specialty Chemicals—0.5% | |
| 1,000 | | Chemed Corp. | 101,850 |
| 2,100 | 1 | Kraton Performance Polymers, Inc. | 43,281 |
| 608 | 1 | Omnova Solutions, Inc. | 4,907 |
| | | TOTAL | 150,038 |
| | | Specialty Machinery—0.4% | |
| 2,600 | | Woodward Governor Co. | 129,896 |
Annual Shareholder Report
| Shares | | | Value |
| | | COMMON STOCKS—continued | |
| | | Specialty Retail—0.7% | |
| 9,500 | 1 | Barnes & Noble, Inc. | $197,790 |
| | | Specialty Retailing—2.1% | |
| 3,283 | 1 | Asbury Automotive Group, Inc. | 221,701 |
| 5,300 | | Big 5 Sporting Goods Corp. | 52,523 |
| 700 | 1 | Dorman Products, Inc. | 30,366 |
| 4,500 | | Finish Line, Inc., Class A | 118,305 |
| 400 | 1 | Kirkland's, Inc. | 7,524 |
| 1,200 | | Lithia Motors, Inc., Class A | 106,620 |
| 600 | | Penske Automotive Group, Inc. | 27,870 |
| 3,200 | | Stage Stores, Inc. | 57,664 |
| | | TOTAL | 622,573 |
| | | Technology Services—0.3% | |
| 1,300 | | VSE Corporation | 77,441 |
| | | Telecommunication Equipment & Services—0.7% | |
| 289 | 1 | Anixter International, Inc. | 24,845 |
| 700 | 1 | CIENA Corp. | 13,671 |
| 1,700 | | Comtech Telecommunications Corp. | 57,460 |
| 4,300 | 1 | NeuStar, Inc., Class A | 119,798 |
| | | TOTAL | 215,774 |
| | | Telephone Utility—0.4% | |
| 10,400 | | Inteliquent, Inc. | 110,344 |
| | | Textiles Apparel & Luxury Goods—0.4% | |
| 4,000 | 1 | Unifi, Inc. | 114,560 |
| | | Thrifts & Mortgage Finance—0.1% | |
| 2,200 | | EverBank Financial Corp. | 41,800 |
| | | Truck Manufacturing—0.2% | |
| 3,700 | | Federal Signal Corp. | 53,502 |
| | | Undesignated Consumer Cyclicals—0.7% | |
| 2,300 | | ABM Industries, Inc. | 56,603 |
| 7,400 | | Weight Watchers International, Inc. | 160,506 |
| | | TOTAL | 217,109 |
| | | Undesignated Consumer Staples—0.5% | |
| 5,200 | 1 | Medifast, Inc. | 149,292 |
| | | Undesignated Energy—0.5% | |
| 1,100 | | Green Plains, Inc. | 41,239 |
| 4,600 | | Ormat Technologies, Inc. | 118,634 |
| | | TOTAL | 159,873 |
Annual Shareholder Report
| Shares | | | Value |
| | | COMMON STOCKS—continued | |
| | | Wireless Communications—0.4% | |
| 2,800 | | InterDigital, Inc. | $123,452 |
| | | TOTAL COMMON STOCKS
(IDENTIFIED COST $28,808,444) | 29,640,013 |
| | | INVESTMENT COMPANY—2.0% | |
| 608,213 | 2,3 | Federated Prime Value Obligations Fund, Institutional Shares, 0.07%
(AT NET ASSET VALUE) | 608,213 |
| | | TOTAL INVESTMENTS—100.3%
(IDENTIFIED COST $29,416,657)4 | 30,248,226 |
| | | OTHER ASSETS AND LIABILITIES - NET—(0.3)%5 | (77,716) |
| | | TOTAL NET ASSETS—100% | $30,170,510 |
| 1 | Non-income-producing security. |
| 2 | Affiliated holding. |
| 3 | 7-day net yield. |
| 4 | The cost of investments for federal tax purposes amounts to $29,469,046. |
| 5 | Assets, other than investments in securities, less liabilities. See Statement of Assets and Liabilities. |
Note: The categories of investments are shown as a percentage of total net assets at July 31, 2014.
Various inputs are used in determining the value of the Fund's investments. These inputs are summarized in the three broad levels listed below:
Level 1—quoted prices in active markets for identical securities, including investment companies with daily net asset values, if applicable.
Level 2—other significant observable inputs (including quoted prices for similar securities, interest rates, prepayment speeds, credit risk, etc.). Also includes securities valued at amortized cost.
Level 3—significant unobservable inputs (including the Fund's own assumptions in determining the fair value of investments).
The inputs or methodology used for valuing securities are not an indication of the risk associated with investing in those securities.
As of July 31, 2014, all investments of the Fund utilized Level 1 inputs in valuing the Fund's assets carried at fair value.
See Notes which are an integral part of the Financial Statements
Annual Shareholder Report
Financial Highlights–Class A Shares
(For a Share Outstanding Throughout Each Period)
| Year Ended July 31 | 2014 | 2013 | 2012 | 2011 | 2010 |
| Net Asset Value, Beginning of Period | $13.70 | $9.52 | $9.88 | $7.55 | $6.58 |
| Income From Investment Operations: | | | | | |
| Net investment income (loss) | (0.12)1 | (0.01)1 | (0.06)1 | (0.09)1 | (0.06)1 |
| Net realized and unrealized gain (loss) on investments | 1.49 | 4.19 | (0.30) | 2.42 | 1.03 |
| TOTAL FROM INVESTMENT OPERATIONS | 1.37 | 4.18 | (0.36) | 2.33 | 0.97 |
| Net Asset Value, End of Period | $15.07 | $13.70 | $9.52 | $9.88 | $7.55 |
| Total Return2 | 10.00% | 43.91% | (3.64)% | 30.86% | 14.74% |
| Ratios to Average Net Assets: | | | | | |
| Net expenses | 1.70% | 1.70% | 1.71% | 1.75% | 1.75% |
| Net investment income (loss) | (0.77)% | (0.05)% | (0.65)% | (0.96)% | (0.77)% |
| Expense waiver/reimbursement3 | 0.52% | 1.09% | 4.24% | 3.75% | 5.41% |
| Supplemental Data: | | | | | |
| Net assets, end of period (000 omitted) | $5,346 | $3,694 | $2,550 | $3,469 | $3,184 |
| Portfolio turnover | 174% | 184% | 200% | 210% | 192% |
| 1 | Per share numbers have been calculated using the average shares method. |
| 2 | Based on net asset value, which does not reflect the sales charge, redemption fee or contingent deferred sales charge, if applicable. |
| 3 | This expense decrease is reflected in both the net expense and the net investment income (loss) ratios shown above. |
See Notes which are an integral part of the Financial Statements
Annual Shareholder Report
Financial Highlights–Class C Shares
(For a Share Outstanding Throughout Each Period)
| Year Ended July 31 | 2014 | 2013 | 2012 | 2011 | 2010 |
| Net Asset Value, Beginning of Period | $12.91 | $9.04 | $9.45 | $7.28 | $6.39 |
| Income From Investment Operations: | | | | | |
| Net investment income (loss) | (0.21)1 | (0.09)1 | (0.12)1 | (0.15)1 | (0.11)1 |
| Net realized and unrealized gain (loss) on investments | 1.40 | 3.96 | (0.29) | 2.32 | 1.00 |
| TOTAL FROM INVESTMENT OPERATIONS | 1.19 | 3.87 | (0.41) | 2.17 | 0.89 |
| Net Asset Value, End of Period | $14.10 | $12.91 | $9.04 | $9.45 | $7.28 |
| Total Return2 | 9.22% | 42.81% | (4.34)% | 29.81% | 13.93% |
| Ratios to Average Net Assets: | | | | | |
| Net expenses | 2.45% | 2.45% | 2.46% | 2.50% | 2.50% |
| Net investment income (loss) | (1.50)% | (0.81)% | (1.41)% | (1.70)% | (1.53)% |
| Expense waiver/reimbursement3 | 0.54% | 1.11% | 4.24% | 3.78% | 5.13% |
| Supplemental Data: | | | | | |
| Net assets, end of period (000 omitted) | $3,338 | $2,636 | $2,358 | $2,978 | $3,258 |
| Portfolio turnover | 174% | 184% | 200% | 210% | 192% |
| 1 | Per share numbers have been calculated using the average shares method. |
| 2 | Based on net asset value, which does not reflect the sales charge, redemption fee or contingent deferred sales charge, if applicable. |
| 3 | This expense decrease is reflected in both the net expense and the net investment income (loss) ratios shown above. |
See Notes which are an integral part of the Financial Statements
Annual Shareholder Report
Financial Highlights–Institutional Shares
(For a Share Outstanding Throughout Each Period)
| Year Ended July 31 | 2014 | 2013 | 2012 | 2011 | 2010 |
| Net Asset Value, Beginning of Period | $13.94 | $9.67 | $10.00 | $7.63 | $6.63 |
| Income From Investment Operations: | | | | | |
| Net investment income (loss) | (0.08)1 | 0.031 | (0.04)1 | (0.06)1 | (0.04)1 |
| Net realized and unrealized gain (loss) on investments | 1.52 | 4.24 | (0.29) | 2.43 | 1.04 |
| TOTAL FROM INVESTMENT OPERATIONS | 1.44 | 4.27 | (0.33) | 2.37 | 1.00 |
| Net Asset Value, End of Period | $15.38 | $13.94 | $9.67 | $10.00 | $7.63 |
| Total Return2 | 10.33% | 44.16% | (3.30)% | 31.06% | 15.08% |
| Ratios to Average Net Assets: | | | | | |
| Net expenses | 1.45% | 1.45% | 1.46% | 1.50% | 1.50% |
| Net investment income (loss) | (0.51)% | 0.23% | (0.44)% | (0.71)% | (0.52)% |
| Expense waiver/reimbursement3 | 0.52% | 1.10% | 3.77% | 3.79% | 5.56% |
| Supplemental Data: | | | | | |
| Net assets, end of period (000 omitted) | $21,486 | $14,084 | $11,650 | $4,836 | $5,727 |
| Portfolio turnover | 174% | 184% | 200% | 210% | 192% |
| 1 | Per share numbers have been calculated using the average shares method. |
| 2 | Based on net asset value. |
| 3 | This expense decrease is reflected in both the net expense and the net investment income (loss) ratios shown above. |
See Notes which are an integral part of the Financial Statements
Annual Shareholder Report
Statement of Assets and Liabilities
July 31, 2014
| Assets: | | |
| Total investment in securities, at value including $608,213 of investment in an affiliated holding (Note 5) (identified cost $29,416,657) | | $30,248,226 |
| Income receivable | | 6,552 |
| Receivable for investments sold | | 693,939 |
| Receivable for shares sold | | 40,973 |
| TOTAL ASSETS | | 30,989,690 |
| Liabilities: | | |
| Payable for investments purchased | $720,477 | |
| Payable for shares redeemed | 14,874 | |
| Payable for auditing fees | 23,800 | |
| Payable for distribution services fee (Note 5) | 2,511 | |
| Payable for other service fees (Notes 2 and 5) | 4,178 | |
| Payable for share registration costs | 28,426 | |
| Accrued expenses (Note 5) | 24,914 | |
| TOTAL LIABILITIES | | 819,180 |
| Net assets for 1,988,630 shares outstanding | | $30,170,510 |
| Net Assets Consist of: | | |
| Paid-in capital | | $31,413,479 |
| Net unrealized appreciation of investments | | 831,569 |
| Accumulated net realized loss on investments | | (1,905,233) |
| Accumulated net investment income (loss) | | (169,305) |
| TOTAL NET ASSETS | | $30,170,510 |
| Net Asset Value, Offering Price and Redemption Proceeds Per Share | | |
| Class A Shares: | | |
| Net asset value per share ($5,346,142 ÷ 354,765 shares outstanding), no par value, unlimited shares authorized | | $15.07 |
| Offering price per share (100/94.50 of $15.07) | | $15.95 |
| Redemption proceeds per share | | $15.07 |
| Class C Shares: | | |
| Net asset value per share ($3,338,032 ÷ 236,747 shares outstanding), no par value, unlimited shares authorized | | $14.10 |
| Offering price per share | | $14.10 |
| Redemption proceeds per share (99.00/100 of $14.10) | | $13.96 |
| Institutional Shares: | | |
| Net asset value per share ($21,486,336 ÷ 1,397,118 shares outstanding), no par value, unlimited shares authorized | | $15.38 |
| Offering price per share | | $15.38 |
| Redemption proceeds per share | | $15.38 |
See Notes which are an integral part of the Financial Statements
Annual Shareholder Report
Statement of Operations
Year Ended July 31, 2014
| Investment Income: | | | |
| Dividends (including $420 received from an affiliated holding (Note 5) and net of foreign taxes withheld of $85) | | | $306,171 |
| Expenses: | | | |
| Investment adviser fee (Note 5) | | $374,612 | |
| Administrative fee (Note 5) | | 25,447 | |
| Custodian fees | | 19,905 | |
| Transfer agent fee | | 41,508 | |
| Directors'/Trustees' fees (Note 5) | | 1,216 | |
| Auditing fees | | 23,800 | |
| Legal fees | | 14,057 | |
| Portfolio accounting fees | | 68,346 | |
| Distribution services fee (Note 5) | | 29,384 | |
| Other service fees (Notes 2 and 5) | | 24,276 | |
| Share registration costs | | 44,316 | |
| Printing and postage | | 20,821 | |
| Miscellaneous (Note 5) | | 10,469 | |
| TOTAL EXPENSES | | 698,157 | |
| Waiver/reimbursement of investment adviser fee (Note 5) | | (170,564) | |
| Net expenses | | | 527,593 |
| Net investment income (loss) | | | (221,422) |
| Realized and Unrealized Gain (Loss) on Investments: | | | |
| Net realized gain on investments | | | 5,669,313 |
| Net change in unrealized appreciation of investments | | | (2,326,839) |
| Net realized and unrealized gain on investments | | | 3,342,474 |
| Change in net assets resulting from operations | | | $3,121,052 |
See Notes which are an integral part of the Financial Statements
Annual Shareholder Report
Statement of Changes in Net Assets
| Year Ended July 31 | 2014 | 2013 |
| Increase (Decrease) in Net Assets | | |
| Operations: | | |
| Net investment income (loss) | $(221,422) | $7,721 |
| Net realized gain on investments | 5,669,313 | 3,764,471 |
| Net change in unrealized appreciation/depreciation of investments | (2,326,839) | 2,572,034 |
| CHANGE IN NET ASSETS RESULTING FROM OPERATIONS | 3,121,052 | 6,344,226 |
| Share Transactions: | | |
| Proceeds from sale of shares | 25,049,675 | 2,885,582 |
| Cost of shares redeemed | (18,414,284) | (5,374,162) |
| CHANGE IN NET ASSETS RESULTING FROM SHARE TRANSACTIONS | 6,635,391 | (2,488,580) |
| Change in net assets | 9,756,443 | 3,855,646 |
| Net Assets: | | |
| Beginning of period | 20,414,067 | 16,558,421 |
| End of period (including accumulated net investment income (loss) of $(169,305) and $(50,143), respectively) | $30,170,510 | $20,414,067 |
See Notes which are an integral part of the Financial Statements
Annual Shareholder Report
Notes to Financial Statements
July 31, 2014
1. ORGANIZATION
Federated MDT Series (the “Trust”) is registered under the Investment Company Act of 1940, as amended (the “Act”), as an open-end management investment company. The Trust consists of five portfolios. The financial statements included herein are only those of Federated MDT Small Cap Core Fund (the “Fund”), a diversified portfolio. The financial statements of the other portfolios are presented separately. The assets of each portfolio are segregated and a shareholder's interest is limited to the portfolio in which shares are held. Each portfolio pays its own expenses. The Fund offers three classes of shares: Class A Shares, Class C Shares and Institutional Shares. All shares of the Fund have equal rights with respect to voting, except on class-specific matters. The investment objective of the Fund is long-term capital appreciation.
2. SIGNIFICANT ACCOUNTING POLICIES
The following is a summary of significant accounting policies consistently followed by the Fund in the preparation of its financial statements. These policies are in conformity with U.S. generally accepted accounting principles (GAAP).
Investment Valuation
In calculating its net asset value (NAV), the Fund generally values investments as follows:
| ■ | Equity securities listed on an exchange or traded through a regulated market system are valued at their last reported sale price or official closing price in their principal exchange or market. |
| ■ | Shares of other mutual funds or non-exchange-traded investment companies are valued based upon their reported NAVs. |
| ■ | Fixed-income securities acquired with remaining maturities greater than 60 days are fair valued using price evaluations provided by a pricing service approved by the Fund's Board of Trustees (the “Trustees”). |
| ■ | Fixed-income securities and repurchase agreements acquired with remaining maturities of 60 days or less are valued at their amortized cost (adjusted for the accretion of any discount or amortization of any premium), unless the issuer's creditworthiness is impaired or other factors indicate that amortized cost is not an accurate estimate of the investment's fair value, in which case it would be valued in the same manner as a longer-term security. |
| ■ | Derivative contracts listed on exchanges are valued at their reported settlement or closing price. |
| ■ | Over-the-counter (OTC) derivative contracts are fair valued using price evaluations provided by a pricing service approved by the Trustees. |
| ■ | For securities that are fair valued in accordance with procedures established by and under the general supervision of the Trustees, certain factors may be considered such as: the purchase price of the security, information obtained by contacting the issuer, analysis of the issuer's financial statements or other available documents, fundamental analytical data, the nature and duration of restrictions on disposition, the movement of the market in which the security is normally traded and public trading in similar securities of the issuer or comparable issuers. |
If the Fund cannot obtain a price or price evaluation from a pricing service for an investment, the Fund may attempt to value the investment based upon the mean of bid and asked quotations or fair value the investment based on price evaluations from one or more dealers. If any price, quotation, price evaluation or other pricing source is not readily available when the
Annual Shareholder Report
NAV is calculated, or if the Fund cannot obtain price evaluations from a pricing service or from more than one dealer for an investment within a reasonable period of time as set forth in the Fund's valuation policies and procedures, the Fund uses the fair value of the investment determined in accordance with the procedures described below. There can be no assurance that the Fund could purchase or sell an investment at the price used to calculate the Fund's NAV.
Fair Valuation
The Trustees have appointed a Valuation Committee comprised of officers of the Fund, Federated MDTA LLC (“Adviser”) and certain of the Adviser's affiliated companies to determine fair value of securities and in overseeing the calculation of the NAV. The Trustees have also authorized the use of pricing services recommended by the Valuation Committee to provide fair value evaluations of the current value of certain investments for purposes of calculating the NAV. The Valuation Committee employs various methods for reviewing third-party pricing-service evaluations including periodic reviews of third-party pricing services' policies, procedures and valuation methods (including key inputs and assumptions), transactional back-testing, comparisons of evaluations of different pricing services, and review of price challenges by the Adviser based on recent market activity. In the event that market quotations and price evaluations are not available for an investment, the Valuation Committee determines the fair value of the investment in accordance with procedures adopted by the Trustees. The Trustees periodically review and approve the fair valuations made by the Valuation Committee and any changes made to the procedures.
Factors considered by pricing services in evaluating an investment include the yields or prices of investments of comparable quality, coupon, maturity, call rights and other potential prepayments, terms and type, reported transactions, indications as to values from dealers and general market conditions. Some pricing services provide a single price evaluation reflecting the bid-side of the market for an investment (a “bid” evaluation). Other pricing services offer both bid evaluations and price evaluations indicative of a price between the prices bid and asked for the investment (a “mid” evaluation). The Fund normally uses bid evaluations for U.S. Treasury and Agency securities, mortgage-backed securities and municipal securities. The Fund normally uses mid evaluations for other types of fixed-income securities and OTC derivative contracts. In the event that market quotations and price evaluations are not available for an investment, the fair value of the investment is determined in accordance with procedures adopted by the Trustees.
Repurchase Agreements
The Fund may invest in repurchase agreements for short-term liquidity purposes. It is the policy of the Fund to require the other party to a repurchase agreement to transfer to the Fund's custodian or sub-custodian eligible securities or cash with a market value (after transaction costs) at least equal to the repurchase price to be paid under the repurchase agreement. The eligible securities are transferred to accounts with the custodian or sub-custodian in which the Fund holds a “securities entitlement” and exercises “control” as those terms are defined in the Uniform Commercial Code. The Fund has established procedures for monitoring the market value of the transferred securities and requiring the transfer of additional eligible securities if necessary to equal at least the repurchase price. These procedures also allow the other party to require securities to be transferred from the account to the extent that their market value exceeds the repurchase price or in exchange for other eligible securities of equivalent market value.
Annual Shareholder Report
The insolvency of the other party or other failure to repurchase the securities may delay the disposition of the underlying securities or cause the Fund to receive less than the full repurchase price. Under the terms of the repurchase agreement, any amounts received by the Fund in excess of the repurchase price and related transaction costs must be remitted to the other party.
The Fund may enter into repurchase agreements in which eligible securities are transferred into joint trading accounts maintained by the custodian or sub-custodian for investment companies and other clients advised by the Fund's Adviser and its affiliates. The Fund will participate on a pro rata basis with the other investment companies and clients in its share of the securities transferred under such repurchase agreements and in its share of proceeds from any repurchase or other disposition of such securities.
Investment Income, Gains and Losses, Expenses and Distributions
Investment transactions are accounted for on a trade-date basis. Realized gains and losses from investment transactions are recorded on an identified-cost basis. Interest income and expenses are accrued daily. Dividend income and distributions to shareholders are recorded on the ex-dividend date. Distributions of net investment income, if any, are declared and paid annually. Non-cash dividends included in dividend income, if any, are recorded at fair value. Investment income, realized and unrealized gains and losses, and certain fund-level expenses are allocated to each class based on relative average daily net assets, except that Class A Shares and Class C Shares may bear distribution services fees and other service fees unique to those classes.
Other Service Fees
The Fund may pay other service fees up to 0.25% of the average daily net assets of the Fund's Class A Shares and Class C Shares to unaffiliated financial intermediaries or to Federated Shareholder Services Company (FSSC) for providing services to shareholders and maintaining shareholder accounts. Subject to the terms described in the Expense Limitation note, FSSC may voluntarily reimburse the Fund for other service fees. For the year ended July 31, 2014, other service fees for the Fund were as follows:
| | Other Service
Fees
Incurred |
| Class A Shares | $14,511 |
| Class C Shares | 9,765 |
| TOTAL | $24,276 |
Dividends are declared separately for each class. No class has preferential dividend rights; differences in per share dividend rates are generally due to differences in separate class expenses.
Premium and Discount Amortization
All premiums and discounts on fixed-income securities are amortized/accreted using the effective-interest-rate method.
Annual Shareholder Report
Federal Taxes
It is the Fund's policy to comply with the Subchapter M provision of the Internal Revenue Code (the “Code”) and to distribute to shareholders each year substantially all of its income. Accordingly, no provision for federal income tax is necessary. As of and during the year ended July 31, 2014, the Fund did not have a liability for any uncertain tax positions. The Fund recognizes interest and penalties, if any, related to tax liabilities as income tax expense in the Statement of Operations. As of July 31, 2014, tax years 2011 through 2014 remain subject to examination by the Fund's major tax jurisdictions, which include the United States of America and the Commonwealth of Massachusetts.
When-Issued and Delayed-Delivery Transactions
The Fund may engage in when-issued or delayed-delivery transactions. The Fund records when-issued securities on the trade date and maintains security positions such that sufficient liquid assets will be available to make payment for the securities purchased. Securities purchased on a when-issued or delayed-delivery basis are marked to market daily and begin earning interest on the settlement date. Losses may occur on these transactions due to changes in market conditions or the failure of counterparties to perform under the contract.
Other
The preparation of financial statements in conformity with GAAP requires management to make estimates and assumptions that affect the amounts of assets, liabilities, expenses and revenues reported in the financial statements. Actual results could differ from those estimated.
3. SHARES OF BENEFICIAL INTEREST
The following tables summarize share activity:
| Year Ended July 31 | 2014 | 2013 |
| Class A Shares: | Shares | Amount | Shares | Amount |
| Shares sold | 476,541 | $7,334,303 | 58,995 | $721,385 |
| Shares redeemed | (391,487) | (6,138,103) | (57,089) | (645,446) |
| NET CHANGE RESULTING FROM CLASS A SHARE TRANSACTIONS | 85,054 | $1,196,200 | 1,906 | $75,939 |
| Year Ended July 31 | 2014 | 2013 |
| Class C Shares: | Shares | Amount | Shares | Amount |
| Shares sold | 122,191 | $1,646,975 | 31,008 | $338,769 |
| Shares redeemed | (89,622) | (1,298,266) | (87,658) | (873,316) |
NET CHANGE RESULTING FROM
CLASS C SHARE TRANSACTIONS | 32,569 | $348,709 | (56,650) | $(534,547) |
Annual Shareholder Report
| Year Ended July 31 | 2014 | 2013 |
| Institutional Shares: | Shares | Amount | Shares | Amount |
| Shares sold | 1,086,642 | $16,068,397 | 154,932 | $1,825,428 |
| Shares redeemed | (699,809) | (10,977,915) | (349,832) | (3,855,400) |
NET CHANGE RESULTING FROM
INSTITUTIONAL SHARE TRANSACTIONS | 386,833 | $5,090,482 | (194,900) | $(2,029,972) |
| NET CHANGE RESULTING FROM TOTAL FUND SHARE TRANSACTIONS | 504,456 | $6,635,391 | (249,644) | $(2,488,580) |
4. FEDERAL TAX INFORMATION
The timing and character of income and capital gain distributions are determined in accordance with income tax regulations, which may differ from GAAP. These differences are due to differing treatments for net operating losses.
For the year ended July 31, 2014, permanent differences identified and reclassified among the components of net assets were as follows:
| Increase (Decrease) |
| Paid-In Capital | Undistributed
Net Investment
Income (Loss) |
| $(102,260) | $102,260 |
Net investment income (loss), net realized gains (losses), and net assets were not affected by this reclassification.
As of July 31, 2014, the components of distributable earnings on a tax basis were as follows:
| Net unrealized appreciation | $779,180 |
| Capital loss carryforwards and deferrals | $(2,022,149) |
The difference between book-basis and tax-basis net unrealized appreciation/depreciation is attributable to differing treatments for the deferral of losses on wash sales.
At July 31, 2014, the cost of investments for federal tax purposes was $29,469,046. The net unrealized appreciation of investments for federal tax purposes was $779,180. This consists of net unrealized appreciation from investments for those securities having an excess of value over cost of $2,335,046 and net unrealized depreciation from investments for those securities having an excess of cost over value of $1,555,866.
At July 31, 2014, the Fund had a capital loss carryforward of $1,852,844 which will reduce the Fund's taxable income arising from future net realized gains on investments, if any, to the extent permitted by the Code, thereby reducing the amount of distributions to shareholders which would otherwise be necessary to relieve the Fund of any liability for federal income tax. Pursuant to the Code, a net capital loss incurred in taxable years beginning on or before December 22, 2010, is characterized as short-term and may be carried forward for a maximum of eight tax years (“Carryforward Limit”), whereas a net capital loss incurred in taxable years beginning after December 22, 2010, retains its character as either short-term or long-term, does not expire and is required to be utilized prior to the losses which have a Carryforward Limit.
Annual Shareholder Report
The following schedule summarizes the Fund's capital loss carryforwards and expiration years:
| Expiration Year | Short-Term | Long-Term | Total |
| 2018 | $1,852,844 | NA | $1,852,844 |
The Fund used capital loss carryforwards of $5,692,198 to offset capital gains realized during the year ended July 31, 2014.
Under current tax rules, a late-year ordinary loss may be deferred, in whole or in part, and treated as occurring on the first day of the following fiscal year. As of July 31, 2014, for federal income tax purposes, a late year ordinary loss of $169,305 was deferred to August 1, 2014.
5. INVESTMENT ADVISER FEE AND OTHER TRANSACTIONS WITH AFFILIATES
Investment Adviser Fee
The advisory agreement between the Fund and the Adviser provides for an annual fee equal to 1.15% of the Fund's average daily net assets. Subject to the terms described in the Expense Limitation note, the Adviser may voluntarily choose to waive any portion of its fee. For the year ended July 31, 2014, the Adviser voluntarily waived $169,811 of its fee.
Administrative Fee
Federated Administrative Services (FAS), under the Administrative Services Agreement, provides the Fund with administrative personnel and services. For purposes of determining the appropriate rate breakpoint, “Investment Complex” is defined as all of the Federated Funds subject to a fee under the Administrative Services Agreement. The fee paid to FAS is based on the average daily net assets of the Investment Complex as specified below, plus certain out-of-pocket expenses:
| Administrative Fee | Average Daily Net Assets
of the Investment Complex |
| 0.150% | on the first $5 billion |
| 0.125% | on the next $5 billion |
| 0.100% | on the next $10 billion |
| 0.075% | on assets in excess of $20 billion |
Subject to the terms described in the Expense Limitation note, FAS may voluntarily choose to waive any portion of its fee. For the year ended July 31, 2014, the annualized fee paid to FAS was 0.078% of average daily net assets of the Fund.
Annual Shareholder Report
Distribution Services Fee
The Fund has adopted a Distribution Plan (the “Plan”) pursuant to Rule 12b-1 under the Act. Under the terms of the Plan, the Fund will compensate Federated Securities Corp. (FSC), the principal distributor, from the daily net assets of the Fund's Class A Shares and Class C Shares to finance activities intended to result in the sale of these shares. The Plan provides that the Fund may incur distribution expenses at the following percentages of average daily net assets annually, to compensate FSC:
| Share Class Name | Percentage of Average Daily
Net Assets of Class |
| Class A Shares | 0.05% |
| Class C Shares | 0.75% |
Subject to the terms described in the Expense Limitation note, FSC may voluntarily choose to waive any portion of its fee. For the year ended July 31, 2014, distribution services fees for the Fund were as follows:
| | Distribution Services
Fees Incurred |
| Class C Shares | $29,384 |
When FSC receives fees, it may pay some or all of them to financial intermediaries whose customers purchase shares. For the year ended July 31, 2014, FSC retained $7,570 of fees paid by the Fund. For the year ended July 31, 2014, the Fund's Class A Shares did not incur a distribution services fee; however, it may begin to incur this upon approval of the Trustees.
Sales Charges
Front-end sales charges and contingent deferred sales charges (CDSC) do not represent expenses of the Fund. They are deducted from the proceeds of sales of Fund shares prior to investment or from redemption proceeds prior to remittance, as applicable. For the year ended July 31, 2014, FSC retained $3,454 in sales charges from the sale of Class A Shares. FSC also retained $7,500 of CDSC relating to redemptions of Class A Shares and $7,849 relating to redemptions of Class C Shares.
Other Service Fees
For the year ended July 31, 2014, FSSC received $386 of the other service fees disclosed in Note 2.
Expense Limitation
The Adviser and certain of its affiliates (which may include FSC, FAS and FSSC) on their own initiative have agreed to waive their respective fees and/or reimburse expenses so that the total annual fund operating expenses (as shown in the financial highlights, excluding expenses allocated from partnerships, extraordinary expenses and proxy-related expenses paid by the Fund, if any) paid by the Fund's Class A Shares, Class C Shares and Institutional Shares (after the voluntary waivers and/or reimbursements) will not exceed 1.70%, 2.45% and 1.45% (the “Fee Limit”), respectively, up to but not including the later of (the “Termination Date”): (a) October 1, 2015; or (b) the date of the Fund's next effective Prospectus. While the Adviser and its applicable affiliates currently do not anticipate terminating or increasing these arrangements prior to the Termination Date, these arrangements may only be terminated or the Fee Limit increased prior to the Termination Date with the agreement of the Trustees.
Annual Shareholder Report
General
Certain Officers and Trustees of the Trust are Officers and Directors or Trustees of certain of the above companies. To efficiently facilitate payment, Directors'/Trustees' fees and certain expenses related to conducting meetings of the Directors/Trustees and other miscellaneous expenses are paid by an affiliate of the Adviser which in due course are reimbursed by the Fund. Such expenses may be included in Accrued and Miscellaneous Expenses on the Statement of Assets and Liabilities and Statement of Operations, respectively.
Transactions Involving Affiliated Companies and Affiliated Holdings
An affiliated company is a company in which the Fund, alone or in combination with other affiliated funds, has ownership of at least 5% of the voting shares. Transactions with affiliated companies during the year ended July 31, 2014, were as follows:
| Affiliates | Balance of
Shares Held
7/31/2013 | Purchases/
Additions | Sales/
Reductions | Balance of
Shares Held
7/31/2014 | Value |
| *Tower International, Inc. | 2,800 | 3,100 | (1,300) | 4,600 | $144,900 |
| RPX Corp. | 3,000 | 1,500 | (4,500) | — | — |
| *Repligen Corp. | 3,900 | 9,500 | (3,900) | 9,500 | $199,215 |
| TOTAL OF AFFILIATED COMPANIES | 9,700 | 14,100 | (9,700) | 14,100 | $344,115 |
*
At July 31, 2014, the security is no longer considered an affiliated company.
Affiliated holdings are investment companies which are managed by the Adviser or an affiliate of the Adviser. The Adviser has agreed to reimburse the Fund for certain investment adviser fees as a result of transactions in other affiliated investment companies. For the year ended July 31, 2014, the Adviser reimbursed $753. Transactions involving the affiliated holding during the year ended July 31, 2014, were as follows:
| | Federated
Prime Value
Obligations Fund,
Institutional Shares |
| Balance of Shares Held 7/31/2013 | 485,617 |
| Purchases/Additions | 15,889,876 |
| Sales/Reductions | (15,767,280) |
| Balance of Shares Held 7/31/2014 | 608,213 |
| Value | $608,213 |
| Dividend Income | $420 |
6. Investment TRANSACTIONS
Purchases and sales of investments, excluding long-term U.S. government securities and short-term obligations, for the year ended July 31, 2014, were as follows:
| Purchases | $61,058,909 |
| Sales | $54,843,778 |
Annual Shareholder Report
7. LINE OF CREDIT
The Fund participates in a $100,000,000 unsecured, uncommitted revolving line of credit (LOC) agreement with PNC Bank. The LOC was made available for extraordinary or emergency purposes, primarily for financing redemption payments. Borrowings are charged interest at a rate offered to the Fund by PNC Bank at the time of the borrowing. As of July 31, 2014, there were no outstanding loans. During the year ended July 31, 2014, the Fund did not utilize the LOC.
8. INTERFUND LENDING
Pursuant to an Exemptive Order issued by the Securities and Exchange Commission, the Fund, along with other funds advised by subsidiaries of Federated Investors, Inc., may participate in an interfund lending program. This program provides an alternative credit facility allowing the Fund to borrow from other participating affiliated funds. As of July 31, 2014, there were no outstanding loans. During the year ended July 31, 2014, the program was not utilized.
Annual Shareholder Report
Report of Independent Registered Public Accounting Firm
TO THE BOARD OF trustees OF Federated MDt series AND SHAREHOLDERS OF federated mdt Small cap core fund:
We have audited the accompanying statement of assets and liabilities of Federated MDT Small Cap Core Fund (the “Fund”) (one of the portfolios constituting Federated MDT Series), including the portfolio of investments, as of July 31, 2014, and the related statement of operations for the year then ended, the statement of changes in net assets for each of the two years in the period then ended, and the financial highlights for each of the five years in the period then ended. These financial statements and financial highlights are the responsibility of the Fund's management. Our responsibility is to express an opinion on these financial statements and financial highlights based on our audits.
We conducted our audits in accordance with standards of the Public Company Accounting Oversight Board (United States). Those standards require that we plan and perform the audit to obtain reasonable assurance about whether the financial statements and financial highlights are free of material misstatement. We were not engaged to perform an audit of the Fund's internal control over financial reporting. Our audits included consideration of internal control over financial reporting as a basis for designing audit procedures that are appropriate in the circumstances, but not for the purpose of expressing an opinion on the effectiveness of the Fund's internal control over financial reporting. Accordingly, we express no such opinion. An audit also includes examining, on a test basis, evidence supporting the amounts and disclosures in the financial statements and financial highlights, assessing the accounting principles used and significant estimates made by management, and evaluating the overall financial statement presentation. Our procedures included confirmation of securities owned as of July 31, 2014, by correspondence with the custodian and others, or by other appropriate auditing procedures where replies from others were not received. We believe that our audits provide a reasonable basis for our opinion.
In our opinion, the financial statements and financial highlights referred to above present fairly, in all material respects, the financial position of Federated MDT Small Cap Core Fund, a portfolio of Federated MDT Series, at July 31, 2014, the results of its operations for the year then ended, the changes in its net assets for each of the two years in the period then ended, and the financial highlights for each of the five years in the period then ended, in conformity with U.S. generally accepted accounting principles.
Boston, Massachusetts
September 23, 2014
Annual Shareholder Report
Shareholder Expense Example (unaudited)
As a shareholder of the Fund, you incur two types of costs: (1) transaction costs, including sales charges (loads) on purchase or redemption payments; and (2) ongoing costs, including management fees and to the extent applicable, distribution (12b-1) fees and/or other service fees and other Fund expenses. This Example is intended to help you to understand your ongoing costs (in dollars) of investing in the Fund and to compare these costs with the ongoing costs of investing in other mutual funds. It is based on an investment of $1,000 invested at the beginning of the period and held for the entire period from February 1, 2014 to July 31, 2014.
ACTUAL EXPENSES
The first section of the table below provides information about actual account values and actual expenses. You may use the information in this section, together with the amount you invested, to estimate the expenses that you incurred over the period. Simply divide your account value by $1,000 (for example, an $8,600 account value divided by $1,000 = 8.6), then multiply the result by the number in the first section under the heading entitled “Expenses Paid During Period” to estimate the expenses attributable to your investment during this period.
HYPOTHETICAL EXAMPLE FOR COMPARISON PURPOSES
The second section of the table below provides information about hypothetical account values and hypothetical expenses based on the Fund's actual expense ratio and an assumed rate of return of 5% per year before expenses, which is not the Fund's actual return. Thus, you should not use the hypothetical account values and expenses to estimate the actual ending account balance or your expenses for the period. Rather, these figures are required to be provided to enable you to compare the ongoing costs of investing in the Fund with other funds. To do so, compare this 5% hypothetical example with the 5% hypothetical examples that appear in the shareholder reports of the other funds.
Annual Shareholder Report
Please note that the expenses shown in the table are meant to highlight your ongoing costs only and do not reflect any transaction costs, such as sales charges (loads) on purchase or redemption payments. Therefore, the second section of the table is useful in comparing ongoing costs only, and will not help you determine the relative total costs of owning different funds. In addition, if these transaction costs were included, your costs would have been higher.
| | Beginning
Account Value
2/1/2014 | Ending
Account Value
7/31/2014 | Expenses Paid
During Period1 |
| Actual: | | | |
| Class A Shares | $1,000 | $1,012.80 | $8.48 |
| Class C Shares | $1,000 | $1,008.60 | $12.20 |
| Institutional Shares | $1,000 | $1,013.80 | $7.24 |
Hypothetical (assuming a 5% return
before expenses): | | | |
| Class A Shares | $1,000 | $1,016.36 | $8.50 |
| Class C Shares | $1,000 | $1,012.65 | $12.23 |
| Institutional Shares | $1,000 | $1,017.60 | $7.25 |
| 1 | Expenses are equal to the Fund's annualized net expense ratios, multiplied by the average account value over the period, multiplied by 181/365 (to reflect the one-half-year period). The annualized net expense ratios are as follows: |
| | |
| Class A Shares | 1.70% |
| Class C Shares | 2.45% |
| Institutional Shares | 1.45% |
Annual Shareholder Report
Board of Trustees and Trust Officers
The Board of Trustees is responsible for managing the Trust's business affairs and for exercising all the Trust's powers except those reserved for the shareholders. The following tables give information about each Trustee and the senior officers of the Fund. Where required, the tables separately list Trustees who are “interested persons” of the Fund (i.e., “Interested” Trustees) and those who are not (i.e., “Independent” Trustees). Unless otherwise noted, the address of each person listed is Federated Investors Tower, 1001 Liberty Avenue, Pittsburgh, PA 15222. The address of all Independent Trustees listed is 4000 Ericsson Drive, Warrendale, PA 15086-7561; Attention: Mutual Fund Board. As of December 31, 2013, the Trust comprised five portfolio(s), and the Federated Fund Family consisted of 42 investment companies (comprising 135 portfolios). Unless otherwise noted, each Officer is elected annually. Unless otherwise noted, each Trustee oversees all portfolios in the Federated Fund Family and serves for an indefinite term. The Fund's Statement of Additional Information includes additional information about Trust Trustees and is available, without charge and upon request, by calling 1-800-341-7400.
Interested TRUSTEES Background
Name
Birth Date
Positions Held with Trust
Date Service Began | Principal Occupation(s) for Past Five Years,
Other Directorships Held and Previous Position(s) |
John F. Donahue*
Birth Date: July 28, 1924
Trustee
Began serving: June 2006 | Principal Occupations: Director or Trustee of the Federated Fund Family; Chairman and Director, Federated Investors, Inc.; Chairman of the Federated Fund Family's Executive Committee.
Previous Positions: Chairman of the Federated Fund Family; Trustee, Federated Investment Management Company; Chairman and Director, Federated Investment Counseling. |
J. Christopher Donahue*
Birth Date: April 11, 1949
President and Trustee
Began serving: May 2006 | Principal Occupations: Principal Executive Officer and President of certain of the Funds in the Federated Fund Family; Director or Trustee of the Funds in the Federated Fund Family; President, Chief Executive Officer and Director, Federated Investors, Inc.; Chairman and Trustee, Federated Investment Management Company; Trustee, Federated Investment Counseling; Chairman and Director, Federated Global Investment Management Corp.; Chairman, Federated Equity Management Company of Pennsylvania and Passport Research, Ltd. (investment advisory subsidiary of Federated); Trustee, Federated Shareholder Services Company; Director, Federated Services Company.
Previous Positions: President, Federated Investment Counseling; President and Chief Executive Officer, Federated Investment Management Company, Federated Global Investment Management Corp. and Passport Research, Ltd. |
| * | Family relationships and reasons for “interested” status: John F. Donahue is the father of J. Christopher Donahue; both are “interested” due to their beneficial ownership of shares of Federated Investors, Inc. and the positions they hold with Federated and its subsidiaries. |
Annual Shareholder Report
INDEPENDENT TRUSTEES Background
Name
Birth Date
Positions Held with Trust
Date Service Began | Principal Occupation(s) for Past Five Years,
Other Directorships Held, Previous Position(s) and Qualifications |
John T. Collins
Birth Date: January 24, 1947
Trustee
Began serving: October 2013 | Principal Occupations: Director or Trustee of the Federated Fund Family; Chairman and CEO, The Collins Group, Inc. (a private equity firm).
Other Directorships Held: Chairman Emeriti, Bentley University; Director, Sterling Suffolk Downs, Inc.; Former Director, National Association of Printers and Lithographers.
Previous Positions: Director and Audit Committee Member, Bank of America Corp.
Qualifications: Business management and director experience. |
Maureen Lally-Green
Birth Date: July 5, 1949
Trustee
Began serving: August 2009 | Principal Occupations: Director or Trustee of the Federated Fund Family; Associate General Secretary and Director, Office for Church Relations, Diocese of Pittsburgh; Adjunct Professor of Law, Duquesne University School of Law; Superior Court of Pennsylvania (service began 1998 and ended July 2009).
Other Directorships Held: Director, Consol Energy (service started June 2013); Director, Auberle (service ended December 2013); Member, Pennsylvania State Board of Education; Director, Saint Vincent College; Director, Ireland Institute of Pittsburgh (service ended December 2013); Director and Chair, UPMC Mercy Hospital; Regent, St. Vincent Seminary; Director, Epilepsy Foundation of Western and Central Pennsylvania; Director, Saint Thomas More Society (service ended December 2013); Director, Our Campaign for the Church Alive!, Inc.; Director, Pennsylvania Bar Institute (2013-present); Director, Cardinal Wuerl North Catholic High School (2013-present).
Previous Position: Professor of Law, Duquesne University School of Law, Pittsburgh (1983-1998).
Qualifications: Legal and director experience. |
Peter E. Madden
Birth Date: March 16, 1942
Trustee
Began serving: June 2006 | Principal Occupation: Director or Trustee, and Chairman of the Board of Directors or Trustees, of the Federated Fund Family.
Previous Positions: Representative, Commonwealth of Massachusetts General Court; President, Chief Operating Officer and Director, State Street Bank and Trust Company and State Street Corporation (retired); Director, VISA USA and VISA International; Chairman and Director, Massachusetts Bankers Association; Director, Depository Trust Corporation; Director, The Boston Stock Exchange.
Qualifications: Business management, mutual fund services and director experience. |
Annual Shareholder Report
Name
Birth Date
Positions Held with Trust
Date Service Began | Principal Occupation(s) for Past Five Years,
Other Directorships Held, Previous Position(s) and Qualifications |
Charles F. Mansfield, Jr.
Birth Date: April 10, 1945
Trustee
Began serving: June 2006 | Principal Occupations: Director or Trustee of the Federated Fund Family; Management Consultant.
Previous Positions: Chief Executive Officer, PBTC International Bank; Partner, Arthur Young & Company (now Ernst & Young LLP); Chief Financial Officer of Retail Banking Sector, Chase Manhattan Bank; Senior Vice President, HSBC Bank USA (formerly Marine Midland Bank); Vice President, Citibank; Assistant Professor of Banking and Finance, Frank G. Zarb School of Business, Hofstra University; Executive Vice President, DVC Group, Inc. (marketing, communications and technology).
Qualifications: Banking, business management, education and director experience. |
Thomas M. O'Neill
Birth Date: June 14, 1951
Trustee
Began serving: October 2006 | Principal Occupations: Director or Trustee, Vice Chairman of the Audit Committee of the Federated Fund Family; Sole Proprietor, Navigator Management Company (investment and strategic consulting).
Other Directorships Held: Board of Overseers, Children's Hospital of Boston; Visiting Committee on Athletics, Harvard College; Board of Directors, Medicines for Humanity; Board of Directors, The Golisano Children's Museum of Naples, Florida.
Previous Positions: Chief Executive Officer and President, Managing Director and Chief Investment Officer, Fleet Investment Advisors; President and Chief Executive Officer, Aeltus Investment Management, Inc.; General Partner, Hellman, Jordan Management Co., Boston, MA; Chief Investment Officer, The Putnam Companies, Boston, MA; Credit Analyst and Lending Officer, Fleet Bank; Director and Consultant, EZE Castle Software (investment order management software); Director, Midway Pacific (lumber).
Qualifications: Business management, mutual fund, director and investment experience. |
P. Jerome Richey
Birth Date: February 23, 1949
Trustee
Began serving: October 2013 | Principal Occupations: Director or Trustee of the Federated Fund Family; General Counsel, University of Pittsburgh.
Other Directorships Held: Board Chairman, Epilepsy Foundation of Western Pennsylvania; Board Member, World Affairs Council of Pittsburgh.
Previous Positions: Chief Legal Officer and Executive Vice President, CONSOL Energy Inc.; Shareholder, Buchanan Ingersoll & Rooney PC (a law firm).
Qualifications: Business management, legal and director experience. |
Annual Shareholder Report
Name
Birth Date
Positions Held with Trust
Date Service Began | Principal Occupation(s) for Past Five Years,
Other Directorships Held, Previous Position(s) and Qualifications |
John S. Walsh
Birth Date: November 28, 1957
Trustee
Began serving: June 2006 | Principal Occupations: Director or Trustee, Chairman of the Audit Committee of the Federated Fund Family; President and Director, Heat Wagon, Inc. (manufacturer of construction temporary heaters); President and Director, Manufacturers Products, Inc. (distributor of portable construction heaters); President, Portable Heater Parts, a division of Manufacturers Products, Inc.
Previous Position: Vice President, Walsh & Kelly, Inc.
Qualifications: Business management and director experience. |
OFFICERS
Name
Birth Date
Address
Positions Held with Trust
Date Service Began | Principal Occupation(s) for Past Five Years
and Previous Position(s) |
John W. McGonigle
Birth Date: October 26, 1938
Secretary
Officer since: May 2006 | Principal Occupations: Executive Vice President and Secretary of the Federated Fund Family; Vice Chairman, Executive Vice President, Secretary and Director, Federated Investors, Inc.
Previous Positions: Trustee, Federated Investment Management Company and Federated Investment Counseling; Director, Federated Global Investment Management Corp., Federated Services Company and Federated Securities Corp. |
Lori A. Hensler
Birth Date: January 6, 1967
TREASURER
Officer since: April 2013 | Principal Occupations: Principal Financial Officer and Treasurer of the Federated Fund Family; Senior Vice President, Federated Administrative Services; Financial and Operations Principal for Federated Securities Corp. and Edgewood Services, Inc.; and Assistant Treasurer, Federated Investors Trust Company. Ms. Hensler has received the Certified Public Accountant designation.
Previous Positions: Controller of Federated Investors, Inc.; Senior Vice President and Assistant Treasurer, Federated Investors Management Company; Treasurer, Federated Investors Trust Company; Assistant Treasurer, Federated Administrative Services, Federated Administrative Services, Inc., Federated Securities Corp., Edgewood Services, Inc., Federated Advisory Services Company, Federated Equity Management Company of Pennsylvania, Federated Global Investment Management Corp., Federated Investment Counseling, Federated Investment Management Company, Passport Research, Ltd., and Federated MDTA, LLC; Financial and Operations Principal for Federated Securities Corp., Edgewood Services, Inc. and Southpointe Distribution Services, Inc. |
Annual Shareholder Report
Name
Birth Date
Address
Positions Held with Trust
Date Service Began | Principal Occupation(s) for Past Five Years
and Previous Position(s) |
Peter J. Germain
Birth Date: September 3, 1959
CHIEF LEGAL OFFICER
Officer since: June 2006 | Principal Occupations: Mr. Germain is Chief Legal Officer of the Federated Fund Family. He is General Counsel and Vice President, Federated Investors, Inc.; President, Federated Administrative Services and Federated Administrative Services, Inc.; Vice President, Federated Securities Corp.; Secretary, Federated Private Asset Management, Inc.; and Secretary, Retirement Plan Service Company of America. Mr. Germain joined Federated in 1984 and is a member of the Pennsylvania Bar Association.
Previous Positions: Deputy General Counsel, Special Counsel, Managing Director of Mutual Fund Services, Federated Investors, Inc.; Senior Vice President, Federated Services Company; and Senior Corporate Counsel, Federated Investors, Inc. |
Brian P. Bouda
Birth Date: February 28, 1947
CHIEF COMPLIANCE OFFICER AND SENIOR VICE PRESIDENT
Officer since: June 2006 | Principal Occupations: Senior Vice President and Chief Compliance Officer of the Federated Fund Family; Vice President and Chief Compliance Officer of Federated Investors, Inc. and Chief Compliance Officer of certain of its subsidiaries. Mr. Bouda joined Federated in 1999 and is a member of the American Bar Association and the State Bar Association of Wisconsin.
Previous Positions: Served in Senior Management positions with a large regional banking organization. |
Stephen F. Auth
Birth Date: September 3, 1956
450 Lexington Avenue
Suite 3700
New York, NY 10017-3943
CHIEF INVESTMENT OFFICER
Officer since: June 2012 | Principal Occupations: Stephen F. Auth is Chief Investment Officer of various Funds in the Federated Fund Family; Executive Vice President, Federated Investment Counseling, Federated Global Investment Management Corp. and Federated Equity Management Company of Pennsylvania.
Previous Positions: Executive Vice President, Federated Investment Management Company and Passport Research, Ltd. (investment advisory subsidiary of Federated); Senior Vice President, Global Portfolio Management Services Division; Senior Vice President, Federated Investment Management Company and Passport Research, Ltd.; Senior Managing Director and Portfolio Manager, Prudential Investments. |
Daniel Mahr
Birth Date: April 9, 1981
125 High Street
Oliver Tower
21st Floor
Boston, MA 02110-2704
Vice President
Officer since: June 2012
Portfolio Manager since:
August 2008 | Principal Occupations: Daniel Mahr has been the Fund's Portfolio Manager since August 2008. Mr. Mahr joined the MDT Advisers Investment Team in 2002. As Managing Director, Research, he is responsible for leading the Investment Team as it relates to the ongoing design, development and implementation of the Optimum Q Process. He is Vice President of the Trust with respect to the Fund. Mr. Mahr received his A.B., Computer Science from Harvard College and his S.M., Computer Science from Harvard University. |
Annual Shareholder Report
Evaluation and Approval of Advisory Contract–May 2014
Federated MDT Small Cap Core Fund (the “Fund”)
Following a review and recommendation of approval by the Fund's independent trustees, the Fund's Board reviewed and approved at its May 2014 meetings the Fund's investment advisory contract for an additional one-year term. The Board's decision regarding the contract reflects the exercise of its business judgment on whether to continue the existing arrangements.
In this connection, the Federated Funds' Board had previously appointed a Senior Officer, whose duties include specified responsibilities relating to the process by which advisory fees are to be charged to a Federated fund. The Senior Officer has the authority to retain consultants, experts, or staff as may be reasonably necessary to assist in the performance of his duties, reports directly to the Board, and may be terminated only with the approval of a majority of the independent members of the Board. The Senior Officer prepared and furnished to the Board an independent, written evaluation that covered topics discussed below (the “Evaluation”). The Board considered that Evaluation, along with other information, in deciding to approve the advisory contract.
The Board is also familiar with and considered judicial decisions concerning allegedly excessive investment advisory fees, which have indicated that the following factors may be relevant to an Adviser's fiduciary duty with respect to its receipt of compensation from a fund: the nature and quality of the services provided by the Adviser to a fund and its shareholders, including the performance and expenses of the fund and of comparable funds; the Adviser's cost of providing the services, including the profitability to the Adviser of providing advisory services to a fund; the extent to which the Adviser may realize “economies of scale” as a fund grows larger and, if such economies exist, whether they have been shared with a fund and its shareholders or the family of funds; any “fall-out financial benefits” that accrue to the Adviser because of its relationship with a fund (including research services received from brokers that execute fund trades and any fees paid to affiliates of the Adviser for services rendered to a fund); comparative fee structures, including a comparison of fees paid to the Adviser with those paid by similar funds; and the extent of care, conscientiousness and independence with which the Board members perform their duties and their expertise, including whether they are fully informed about all facts the Board deems relevant to its consideration of the Adviser's services and fees. The Board noted that SEC disclosure requirements regarding the basis for the Board's approval of the Fund's advisory contract generally track the factors listed above. Consistent with these judicial decisions and SEC disclosure requirements, the Board also considered management fees charged to
Annual Shareholder Report
institutional and other clients of the Adviser for what might be viewed as like services. The Board was aware of these factors and was guided by them in its review of the Fund's advisory contract to the extent it considered them to be appropriate and relevant, as discussed further below.
The Board considered and weighed these circumstances in light of its substantial accumulated experience in governing the Fund and working with Federated on matters relating to the Federated funds, and was assisted in its deliberations by independent legal counsel. Throughout the year, and in connection with its May meetings, the Board requested and received substantial and detailed information about the Fund and the Federated organization that was in addition to the extensive materials that comprise and accompany the Senior Officer's Evaluation. Federated provided much of this information at each regular meeting of the Board, and furnished additional substantial information in connection with the May meeting at which the Board's formal review of the advisory contract occurred. At this May meeting, senior management of the Adviser also met with the independent trustees and their counsel to discuss the materials presented and any other matters thought relevant by the Adviser or the trustees. Between regularly scheduled meetings, the Board also received information on particular matters as the need arose. Thus, the Board's consideration of the advisory contract included review of the Senior Officer's Evaluation, accompanying data and additional information covering such matters as: the Adviser's investment philosophy, revenue, profitability, personnel and processes; investment and operating strategies; the Fund's short- and long-term performance (in absolute terms, both on a gross basis and net of expenses, as well as in relationship to its particular investment program and certain competitor or “peer group” funds and/or other benchmarks, as appropriate), and comments on the reasons for performance; the Fund's investment objectives; the Fund's expenses (including the advisory fee itself and the overall expense structure of the Fund, both in absolute terms and relative to similar and/or competing funds, with due regard for contractual or voluntary expense limitations); the use and allocation of brokerage commissions derived from trading the Fund's portfolio securities (if any); and the nature, quality and extent of the advisory and other services provided to the Fund by the Adviser and its affiliates. The Board also considered the preferences and expectations of Fund shareholders; the entrepreneurial risk assumed by the Adviser in sponsoring the funds; the continuing state of competition in the mutual fund industry and market practices; the range of comparable fees for similar funds in the mutual fund industry; the Fund's relationship to the Federated family of funds which include a comprehensive array of funds with different investment objectives, policies and strategies which are available for exchange without the incurrence of additional sales charges; compliance and audit reports concerning the Federated funds and the Federated companies that service them (including communications from regulatory agencies), as well as Federated's responses to any issues raised therein; and relevant developments in
Annual Shareholder Report
the mutual fund industry and how the Federated funds and/or Federated are responding to them. The Board's evaluation process is evolutionary. The criteria considered and the emphasis placed on relevant criteria change in recognition of changing circumstances in the mutual fund marketplace.
While mindful that courts have cautioned against giving such comparisons too much weight, the Board has found the use of comparisons of the Fund's fees and expenses to other mutual funds with comparable investment programs to be relevant. In this regard, the Board was presented with, and considered, information regarding the contractual advisory fee rates, net advisory fee rates and total expense ratios relative to a fund's peers. The Board focused on comparisons with other similar mutual funds more heavily than non-mutual fund products or services because it is believed that they are more relevant. For example, other mutual funds are the products most like the Fund, they are readily available to Fund shareholders as alternative investment vehicles, and they are the type of investment vehicle in fact chosen and maintained by the Fund's investors. The range of their fees and expenses therefore appears to be a relevant indicator of what consumers have found to be reasonable in the precise marketplace in which the Fund competes.
The Board reviewed the contractual advisory fee rate, net advisory fee rate where partially waived and other expenses of the Fund and noted the position of the Fund's fee rates relative to its peers. In this regard, the Board noted that the contractual advisory fee rate was above the median of the relevant peer group, but the Board noted the applicable waivers and reimbursements and that the overall expense structure of the Fund remained competitive. In this regard, the Board had been previously advised that, while comparisons to fund peer groups are relevant in judging the reasonableness of advisory fees, the Fund's quantitative focus makes fee and expense comparisons particularly difficult. Although the Fund's advisory fee was above the median of the peer range, the peer group of funds varied widely in their complexity, and the management of the Fund is among the more complex relative to its peers. The Board will continue to monitor advisory fees and other expenses borne by the Fund.
By contrast, the Senior Officer has reviewed Federated's fees for providing advisory services to products outside the Federated family of funds (e.g., institutional and separate accounts and sub-adviser services). He concluded that mutual funds and institutional accounts are inherently different products. Those differences include, but are not limited to, different types of targeted investors; being subject to different laws and regulations; different legal structures; different average account sizes and portfolio management techniques made necessary by different cash flows and different associated costs; and the time spent by portfolio managers and their teams, funds financial services, legal, compliance and risk management in reviewing securities pricing, addressing
Annual Shareholder Report
different administrative responsibilities, addressing different degrees of risk associated with management and a variety of different costs. The Senior Officer did not consider these fee schedules to be determinative in judging the appropriateness of mutual fund advisory fees.
The Fund's ability to deliver competitive performance when compared to its peer group was also deemed to be relevant by the Board as a useful indicator of how the Adviser is executing the Fund's investment program, which in turn was one of the Board's considerations in reaching a conclusion that the nature, extent, and quality of the Adviser's investment management services were such as to warrant continuation of the advisory contract.
The Senior Officer reviewed information compiled by Federated, using data supplied by independent fund ranking organizations, regarding the performance of, and fees charged by, other mutual funds, noting his view that comparisons to fund peer groups may be helpful, though not conclusive, in judging the reasonableness of proposed fees. The Board considered, in evaluating such comparisons, that in some cases individual funds may exhibit significant and unique differences in their objectives and management techniques when compared to other funds within an industry peer group, and that the Senior Officer had specifically noted that the Fund's quantitative investment program is of such a type.
For the periods covered by the Evaluation, the Fund's performance for both the one-year and three-year periods was above the median of the relevant peer group, and the Fund's performance fell below the median of the relevant peer group for the five-year period. In addition, the Board was informed by the Adviser that, for the same periods, the Fund outperformed its benchmark index for the one-year period, outperformed its benchmark index for the three-year period and underperformed its benchmark index for the five-year period. The Board discussed the Fund's performance with the Adviser and recognized the efforts being undertaken by the Adviser. The Board will continue to monitor these efforts and the performance of the Fund in the context of the other factors considered relevant by the Board.
The Board also received financial information about Federated, including information regarding the compensation and benefits Federated derived from its relationships with the Federated funds. This information covered not only the fees under the advisory contracts, but also fees received by Federated's subsidiaries for providing other services to the Federated funds under separate contracts (e.g., for serving as the Federated funds' administrator). The information also detailed any indirect benefit Federated may derive from its receipt of research services from brokers who execute Federated fund trades. In addition, the Board considered the fact that, in order for a fund to be competitive in the marketplace, Federated and its affiliates frequently waived fees and/or reimbursed expenses and have disclosed to fund investors and/or indicated to the Board their intention to do so in the future, where appropriate. Moreover, the Board receives regular reporting as to the institution, adjustment
Annual Shareholder Report
or elimination of these voluntary waivers. In addition, following discussions regarding the Senior Officer's May 2013 recommendations, Federated made meaningful reductions to gross advisory fees for several funds. At the Board meeting in May 2014, the Senior Officer proposed, and the Board approved, reductions in the contractual advisory fees of certain other funds.
Federated furnished information, requested by the Senior Officer, that reported revenues on a fund-by-fund basis and made estimates of the allocation of expenses on a fund-by-fund basis, using allocation methodologies specified by the Senior Officer. The Senior Officer noted that, while these cost allocation reports apply consistent allocation processes, the inherent difficulties in allocating costs continues to cause the Senior Officer to question the precision of the process and to conclude that such reports may be unreliable, since a single change in an allocation estimate may dramatically alter the resulting estimate of cost and/or profitability of a fund and may produce unintended consequences. The allocation information, including the Senior Officer's view that fund-by-fund estimations may be unreliable, was considered in the analysis by the Board.
The Board and the Senior Officer also reviewed information compiled by Federated comparing profitability information for Federated to other publicly held fund management companies. In this regard, the Senior Officer concluded that Federated's profit margins did not appear to be excessive.
The Senior Officer's Evaluation also discussed the notion of possible realization of “economies of scale” as a fund grows larger. The Board considered in this regard that the Adviser has made significant and long-term investments in areas that support all of the Federated family of funds, such as personnel and processes for the portfolio management, shareholder services, compliance, internal audit, and risk management functions; and systems technology; and that the benefits of these efforts (as well as any economies, should they exist) were likely to be enjoyed by the fund family as a whole. Finally, the Board also noted the absence of any applicable regulatory or industry guidelines on this subject, which (as discussed in the Senior Officer's Evaluation) is compounded by the lack of any common industry practice or general pattern with respect to structuring fund advisory fees with “breakpoints” that serve to reduce the fee as the fund attains a certain size.
The Senior Officer noted that, subject to the comments and recommendations made within his Evaluation, his observations and the information accompanying the Evaluation supported a finding by the Board that the management fees for each of the funds were reasonable. Under these circumstances, no changes were recommended to, and no objection was raised to, the continuation of the Fund's advisory contract.
In its decision to continue an existing investment advisory contract, the Board was mindful of the potential disruptions of the Fund's operations and various risks, uncertainties and other effects that could occur as a result of a decision to terminate or not renew an advisory contract. In particular, the Board recognized that many shareholders have invested in the Fund on the strength of the
Annual Shareholder Report
Adviser's industry standing and reputation and with the expectation that the Adviser will have a continuing role in providing advisory services to the Fund. Thus, the Board's approval of the advisory contract reflected the fact that it is the shareholders who have effectively selected the Adviser by virtue of having invested in the Fund. The Board concluded that, in light of the factors discussed above, including the nature, quality and scope of the services provided to the Fund by the Adviser and its affiliates, continuation of the advisory contract was appropriate.
The Board based its decision to approve the advisory contract on the totality of the circumstances and relevant factors and with a view to past and future long-term considerations. Not all of the factors and considerations identified above were necessarily relevant to the Fund, nor did the Board consider any one of them to be determinative. With respect to the factors that were relevant, the Board's decision to approve the contract reflects its determination that Federated's performance and actions provided a satisfactory basis to support the decision to continue the existing arrangements.
Annual Shareholder Report
Voting Proxies on Fund Portfolio Securities
A description of the policies and procedures that the Fund uses to determine how to vote proxies, if any, relating to securities held in the Fund's portfolio is available, without charge and upon request, by calling 1-800-341-7400. A report on “Form N-PX” of how the Fund voted any such proxies during the most recent 12-month period ended June 30 is available via the Proxy Voting Record (Form N-PX) link associated with the Fund and share class name at www.FederatedInvestors.com/FundInformation. Form N-PX filings are also available at the SEC's website at www.sec.gov.
Quarterly Portfolio Schedule
The Fund files with the SEC a complete schedule of its portfolio holdings, as of the close of the first and third quarters of its fiscal year, on “Form N-Q.” These filings are available on the SEC's website at www.sec.gov and may be reviewed and copied at the SEC's Public Reference Room in Washington, DC. (Call 1-800-SEC-0330 for information on the operation of the Public Reference Room.) You may also access this information via the link to the Fund and share class name at www.FederatedInvestors.com/FundInformation.
Annual Shareholder Report
[PAGE INTENTIONALLY LEFT BLANK]
Mutual funds are not bank deposits or obligations, are not guaranteed by any bank and are not insured or guaranteed by the U.S. government, the Federal Deposit Insurance Corporation, the Federal Reserve Board or any other government agency. Investment in mutual funds involves investment risk, including the possible loss of principal.
This Report is authorized for distribution to prospective investors only when preceded or accompanied by the Fund's Prospectus, which contains facts concerning its objective and policies, management fees, expenses and other information.
Federated MDT Small Cap Core Fund
Federated Investors Funds
4000 Ericsson Drive
Warrendale, PA 15086-7561
Contact us at FederatedInvestors.com
or call 1-800-341-7400.
Federated Securities Corp., Distributor
CUSIP 31421R817
CUSIP 31421R791
CUSIP 31421R783
37328 (9/14)
Federated is a registered trademark of Federated Investors, Inc.
2014 ©Federated Investors, Inc.
Annual Shareholder Report
July 31, 2014
| Share Class | Ticker |
| A | QASGX |
| B | QBSGX |
| C | QCSGX |
| Institutional | QISGX |
Federated MDT Small Cap Growth Fund
Fund Established 2005
A Portfolio of Federated MDT Series
Dear Valued Shareholder,
I am pleased to present the Annual Shareholder Report for your fund covering the period from August 1, 2013 through July 31, 2014. This report includes Management's Discussion of Fund Performance, a complete listing of your fund's holdings, performance information and financial statements along with other important fund information.
In addition, our website, FederatedInvestors.com, offers easy access to Federated resources that include timely fund updates, economic and market insights from our investment strategists, and financial planning tools. We invite you to register to take full advantage of its capabilities.
Thank you for investing with Federated. I hope you find this information useful and look forward to keeping you informed.
Sincerely,
J. Christopher Donahue, President
Not FDIC Insured • May Lose Value • No Bank Guarantee
CONTENTS
| 1 |
| 6 |
| 8 |
| 18 |
| 22 |
| 24 |
| 25 |
| 26 |
| 35 |
| 36 |
| 38 |
| 43 |
| 49 |
| 49 |
Management's Discussion of Fund Performance (unaudited)
The total return of Federated MDT Small Cap Growth Fund (the “Fund”), based on net asset value, for the 12-month reporting period ended July 31, 2014 was 7.88% for Class A Shares, 7.12% for Class B Shares, 7.11% for Class C Shares and 8.21% for Institutional Shares. The total return for the Russell 2000® Growth Index (R2000G),1 the Fund's broad-based securities market index, was 8.93% for the same period. The total return of the Morningstar Small Growth Funds Average (MSGFA),2 a peer group average for the Fund, was 8.13% during the same period. The Fund's and MSGFA's total returns for the most recently completed fiscal year reflected actual cash flows, transaction costs and other expenses, which were not reflected in the total return of the R2000G.
During the reporting period, the Fund's investment strategy focused on stock selection. This was the most significant factor affecting the Fund's performance relative to the R2000G during the period.
The following discussion will focus on the performance of the Fund's Institutional Shares.
MARKET OVERVIEW
During the 12-month reporting period, domestic equity market performance was very strong as evidenced by the 16.37% return on the Russell 3000® Index.3 Large-cap stocks led the way with the Russell Top 200® Index4 returning 17.38%, closely followed by mid-cap stocks with a 16.36% return on the Russell Midcap® Index.5 Small-cap stocks6 posted a moderate gain with the Russell 2000® Index7 returning 8.56%. Growth stocks outperformed value stocks during the reporting period with the Russell 3000® Growth Index,8 returning 17.89% as compared to 14.87% for the Russell 3000® Value Index.9
The best performing sectors in the R2000G during the reporting period were Energy (30.38%), Materials (12.44%), Health Care (11.74%) and Telecommunication Services (11.43%). Underperforming sectors during the same period included Consumer Discretionary (-1.41%), Utilities (0.14%) and Financials (6.57%).
STOCK SELECTION
The most significant positive factor in the Fund's performance during the 12-month reporting period was favorable stock selection for stocks with high repeatable earnings, which was partially offset by poor stock selection among stocks that had high analyst conviction but required external financing. Breaking down the results by the Global Industry Classification Standard sector definitions, the Consumer Discretionary sector was overweighted, and the Financials and Health Care sectors were slightly underweighted in the Fund.
Annual Shareholder Report
Strong stock selection in the Consumer Discretionary and Industrials sectors contributed positively to Fund performance. There was negative contribution from the Energy and Materials sectors, where the Fund's stock selection was poor.
Individual stocks enhancing the Fund's performance included Synaptics Incorporated, Alaska Airgroup and Stone Energy Corporation.
Individual stocks detracting from the Fund's performance included Puma Biotechnology Incorporated and Sunedison Incorporated, which the Fund did not hold, and Dexcom Incorporated, which the Fund did hold.
| 1 | Please see the footnotes to the line graphs below for definitions of, and further information about, the R2000G. |
| 2 | Please see the footnotes to the line graphs below for definitions of, and further information about, the MSGFA. |
| 3 | The Russell 3000® Index measures the performance of the largest 3,000 U.S. companies representing approximately 98% of the investable U.S. equity market. The Russell 3000® Index is constructed to provide a comprehensive, unbiased, and stable barometer of the broad market and is completely reconstituted annually to ensure new and growing equities are reflected. The index is unmanaged, and it is not possible to invest directly in an index. |
| 4 | The Russell Top 200® Index measures the performance of the largest cap segment of the U.S. equity universe. The Russell Top 200® Index is a subset of the Russell 3000® Index. It includes approximately 200 of the largest securities based on a combination of their market cap and current index membership and represents approximately 68% of the U.S. market. The Russell Top 200® Index is constructed to provide a comprehensive and unbiased barometer for this very large cap segment and is completely reconstituted annually to ensure new and growing equities are reflected. The index is unmanaged, and it is not possible to invest directly in an index. |
| 5 | The Russell Midcap® Index measures the performance of the mid-cap segment of the U.S. equity universe. The Russell Midcap® Index is a subset of the Russell 1000® Index. It includes approximately 800 of the smallest securities based on a combination of their market cap and current index membership. The Russell Midcap® Index represents approximately 31% of the total market capitalization of the Russell 1000® companies. The Russell Midcap® Index is constructed to provide a comprehensive and unbiased barometer for the mid-cap segment. The Russell Midcap® Index is completely reconstituted annually to ensure larger stocks do not distort the performance and characteristics of the true mid-cap opportunity set. The index is unmanaged, and it is not possible to invest directly in an index. |
| 6 | Small-cap stocks may be less liquid and subject to greater price volatility than large-cap stocks. |
| 7 | The Russell 2000® Index measures the performance of the small-cap segment of the U.S. equity universe. The Russell 2000® Index is a subset of the Russell 3000® Index representing approximately 10% of the total market capitalization of that index. It includes approximately 2000 of the smallest securities based on a combination of their market cap and current index membership. The Russell 2000® Index is constructed to provide a comprehensive and unbiased small-cap barometer and is completely reconstituted annually to ensure larger stocks do not distort the performance and characteristics of the true small-cap opportunity set. The index is unmanaged, and it is not possible to invest directly in an index. |
Annual Shareholder Report
| 8 | The Russell 3000® Growth Index measures the performance of the broad growth segment of the U.S. equity universe. It includes those Russell 3000® Index companies with higher price-to-book ratios and higher forecasted growth values. The Russell 3000® Growth Index is constructed to provide a comprehensive, unbiased and stable barometer of the broad growth market. The Russell 3000® Growth Index is completely reconstituted annually to ensure new and growing equities are included and that the represented companies continue to reflect growth characteristics. The index is unmanaged, and it is not possible to invest directly in an index. |
| 9 | The Russell 3000® Value Index measures the performance of the broad value segment of the U.S. equity value universe. It includes those Russell 3000® Index companies with lower price-to-book ratios and lower forecasted growth values. The Russell 3000® Value Index is constructed to provide a comprehensive, unbiased and stable barometer of the broad value market. The Russell 3000® Value Index is completely reconstituted annually to ensure new and growing equities are included and that the represented companies continue to reflect value characteristics. The index is unmanaged, and it is not possible to invest directly in an index. |
Annual Shareholder Report
FUND PERFORMANCE AND GROWTH OF A $10,000 INVESTMENT
The graph below illustrates the hypothetical investment of $10,0001 in the Federated MDT Small Cap Growth Fund2 from September 15, 2005 (start of performance) to July 31, 2014, compared to the Russell 2000 Growth® Index (R2000G)3 and the Morningstar Small Growth Funds Average (MSGFA).4 The Average Annual Total Return table below shows returns for each class averaged over the stated periods.
Growth of a $10,000 Investment
Growth of $10,000 as of July 31, 2014
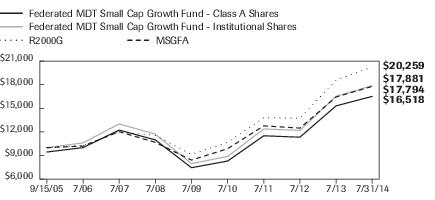
| Federated MDT Small Cap Growth Fund - | Class A Shares | Institutional Shares | R2000G | MSGFA |
| F | F | I | I |
| 9/15/2005 | 9,450 | 10,000 | 10,000 | 10,000 |
| 7/31/2006 | 10,008 | 10,610 | 10,280 | 10,207 |
| 7/31/2007 | 12,238 | 13,020 | 12,011 | 12,030 |
| 7/31/2008 | 10,990 | 11,720 | 11,559 | 10,678 |
| 7/31/2009 | 7,456 | 7,970 | 9,148 | 8,424 |
| 7/31/2010 | 8,302 | 8,895 | 10,677 | 9,869 |
| 7/31/2011 | 11,512 | 12,373 | 13,807 | 12,773 |
| 7/31/2012 | 11,332 | 12,202 | 13,737 | 12,486 |
| 7/31/2013 | 15,312 | 16,524 | 18,598 | 16,442 |
| 7/31/2014 | 16,518 | 17,881 | 20,259 | 17,794 |
41 graphic description end -->
| ■ | Total returns shown for Class A Shares include the maximum sales charge of the 5.50% ($10,000 investment minus $550 sales charge = $9,450). |
The Fund offers multiple share classes whose performance may be greater than or less than its other share class(es) due to differences in sales charges and expenses. See the Average Annual Total Return table below for the returns of additional classes not shown in the line graph above.
Average Annual Total Returns for the Period Ended 7/31/2014
(returns reflect all applicable sales charges and contingent deferred sales charges as specified below in footnote #1)
| | 1 Year | 5 Years | Start of
Performance* |
| Class A Shares | 1.93% | 15.92% | 5.82% |
| Class B Shares | 1.62% | 16.18% | 5.78% |
| Class C Shares | 6.11% | 16.38% | 5.70% |
| Institutional Shares | 8.21% | 17.54% | 6.77% |
| R2000G | 8.93% | 17.24% | 8.28% |
| MSGFA | 8.13% | 16.80% | 6.74% |
| * | The Fund's start of performance date was September 15, 2005. |
Annual Shareholder Report
Performance data quoted represents past performance which is no guarantee of future results. Investment return and principal value will fluctuate so that an investor's shares, when redeemed, may be worth more or less than their original cost. Mutual fund performance changes over time and current performance may be lower or higher than what is stated. For current to the most recent month-end performance and after-tax returns, visit FederatedInvestors.com or call 1-800-341-7400. Returns shown do not reflect the deduction of taxes that a shareholder would pay on Fund distributions or the redemption of Fund shares. Mutual funds are not obligations of or guaranteed by any bank and are not federally insured.
| 1 | Represents a hypothetical investment of $10,000 in the Fund after deducting applicable sales charges: for Class A Shares, the maximum sales charge of 5.50% ($10,000 investment minus $550 sales charges = $9,450); for Class B Shares, the maximum contingent deferred sales charge is 5.50% on any redemption less than one year from the purchase date; for Class C Shares, a 1.00% contingent deferred sales charge would be applied to any redemption less than one year from the purchase date. The Fund's performance assumes the reinvestment of all dividends and distributions. The R2000G and MSGFA have been adjusted to reflect reinvestment of dividends on securities. |
| 2 | The Fund is the successor to the MDT Small Cap Growth Fund pursuant to a reorganization that took place on December 8, 2006. Prior to that date, the Fund had no investment operations. Accordingly, the performance information shown for periods prior to that date is that of the MDT Small Cap Growth Fund. |
| 3 | The R2000G measures the performance of the small-cap growth segment of the U.S. equity universe. It includes those Russell 2000® Index companies with higher price-to-value ratios and higher forecasted growth values. The R2000G is constructed to provide a comprehensive and unbiased barometer for the small-cap growth segment. The R2000G is completely reconstituted annually to ensure larger stocks do not distort the performance and characteristics of the true small-cap opportunity set and that the represented companies continue to reflect growth characteristics. The R2000G is unmanaged and, unlike the Fund, is not affected by cash flows. It is not possible to invest directly in an index. The R2000G is not adjusted to reflect sales charges, expenses or other fees that the Securities and Exchange Commission requires to be reflected in the Fund's performance. |
| 4 | Morningstar figures represent the average of the total returns reported by all the mutual funds designated by Morningstar as falling into the respective category indicated. They do not reflect sales charges. |
Annual Shareholder Report
Portfolio of Investments Summary Table (unaudited)
At July 31, 2014, the Fund's industry composition1 was as follows:
| Industry Composition | Percentage of
Total Net Assets |
| Software Packaged/Custom | 7.3% |
| Specialty Retailing | 5.3% |
| Biotechnology | 3.7% |
| Apparel | 3.4% |
| Services to Medical Professionals | 3.3% |
| Financial Services | 2.9% |
| Medical Supplies | 2.9% |
| Telecommunication Equipment & Services | 2.7% |
| Computer Services | 2.5% |
| Restaurants | 2.5% |
| Medical Technology | 2.0% |
| Shoes | 2.0% |
| Industrial Machinery | 1.9% |
| Undesignated Consumer Cyclicals | 1.9% |
| Crude Oil & Gas Production | 1.8% |
| Semiconductor Manufacturing | 1.8% |
| Internet Services | 1.7% |
| Poultry Products | 1.7% |
| Specialty Chemicals | 1.7% |
| Auto Original Equipment Manufacturers | 1.5% |
| Education & Training Services | 1.5% |
| Generic Drugs | 1.5% |
| Personnel Agency | 1.4% |
| Home Products | 1.3% |
| Oil Refiner | 1.3% |
| Electrical Equipment | 1.1% |
| Office Furniture | 1.1% |
| Pharmaceuticals | 1.1% |
| Undesignated Consumer Staples | 1.1% |
| Airline—Regional | 1.0% |
| Communications Equipment | 1.0% |
| Personal Loans | 1.0% |
| Recreational Vehicles | 1.0% |
| Semiconductor & Semiconductor Equipment | 1.0% |
| Specialty Machinery | 1.0% |
| Other2 | 26.1% |
Annual Shareholder Report
| Industry Composition | Percentage of
Total Net Assets |
| Cash Equivalents3 | 1.9% |
| Other Assets and Liabilities—Net4 | 0.1% |
| TOTAL | 100.0% |
| 1 | Except for Cash Equivalents and Other Assets and Liabilities, industry classifications are based upon, and individual portfolio securities are assigned to, the classifications of the Global Industry Classification Standard (GICS) except that the Adviser assigns a classification to securities not classified by the GICS and to securities for which the Adviser does not have access to the classification made by the GICS. |
| 2 | For purposes of this table, industry classifications which constitute less than 1.0% of the Fund's total net assets have been aggregated under the designation “Other.” |
| 3 | Cash Equivalents include any investments in money market mutual funds and/or overnight repurchase agreements. |
| 4 | Assets, other than investments in securities, less liabilities. See Statement of Assets and Liabilities. |
Annual Shareholder Report
Portfolio of Investments
July 31, 2014
| Shares | | | Value |
| | | COMMON STOCKS—98.0% | |
| | | Airline - Regional—1.0% | |
| 16,368 | | Alaska Air Group, Inc. | $719,701 |
| | | Apparel—3.4% | |
| 15,864 | 1 | Ann, Inc. | 583,002 |
| 5,005 | | Columbia Sportswear Co. | 374,174 |
| 8,700 | 1 | G-III Apparel Group Ltd. | 675,729 |
| 11,000 | 1 | Iconix Brand Group, Inc. | 464,530 |
| 1,436 | | Oxford Industries, Inc. | 85,542 |
| 10,033 | 1 | Zumiez, Inc. | 279,419 |
| | | TOTAL | 2,462,396 |
| | | Auto Original Equipment Manufacturers—1.5% | |
| 6,741 | | Dana Holding Corp. | 150,864 |
| 20,065 | 1 | Meritor, Inc. | 252,217 |
| 11,473 | 1 | Tenneco Automotive, Inc. | 730,830 |
| | | TOTAL | 1,133,911 |
| | | Beer—0.1% | |
| 500 | 1 | The Boston Beer Co., Inc., Class A | 110,200 |
| | | Biotechnology—3.7% | |
| 18,600 | 1 | Acorda Therapeutics, Inc. | 544,422 |
| 12,700 | 1 | Anika Therapeutics, Inc. | 534,162 |
| 11,100 | 1 | InterMune, Inc. | 486,957 |
| 10,700 | 1 | Isis Pharmaceuticals, Inc. | 331,593 |
| 2,000 | 1 | Oncomed Pharmaceuticals, Inc. | 43,180 |
| 32,900 | 1 | Repligen Corp. | 689,913 |
| 3,000 | 1 | Seattle Genetics, Inc. | 105,600 |
| | | TOTAL | 2,735,827 |
| | | Clothing Stores—0.2% | |
| 8,187 | 1 | Aeropostale, Inc. | 27,181 |
| 3,308 | | Cato Corp., Class A | 102,085 |
| | | TOTAL | 129,266 |
| | | Commodity Chemicals—0.2% | |
| 3,208 | | Stepan Co. | 154,369 |
| | | Communications Equipment—1.0% | |
| 43,000 | 1 | Aruba Networks, Inc. | 767,980 |
| | | Computer Networking—0.6% | |
| 9,800 | 1 | NetScout Systems, Inc. | 416,794 |
Annual Shareholder Report
| Shares | | | Value |
| | | COMMON STOCKS—continued | |
| | | Computer Peripherals—0.7% | |
| 10,234 | 1 | Silicon Graphics, Inc. | $97,325 |
| 5,317 | 1 | Synaptics, Inc. | 384,047 |
| | | TOTAL | 481,372 |
| | | Computer Services—2.5% | |
| 2,855 | | Fair Isaac & Co., Inc. | 163,163 |
| 11,200 | 1 | IGATE Capital Corp. | 399,616 |
| 22,000 | 1 | Manhattan Associates, Inc. | 645,920 |
| 3,623 | 1 | Syntel, Inc. | 312,919 |
| 14,941 | 1 | Unisys Corp. | 318,094 |
| | | TOTAL | 1,839,712 |
| | | Computer Stores—0.2% | |
| 6,322 | 1 | Insight Enterprises, Inc. | 166,079 |
| | | Containers & Packaging—0.7% | |
| 21,300 | 1 | Berry Plastics Group, Inc. | 517,377 |
| | | Contracting—0.2% | |
| 3,000 | 1 | Team, Inc. | 118,830 |
| | | Cosmetics & Toiletries—0.6% | |
| 2,481 | 1 | Elizabeth Arden, Inc. | 51,183 |
| 14,034 | 1 | Sally Beauty Holdings, Inc. | 364,182 |
| | | TOTAL | 415,365 |
| | | Crude Oil & Gas Production—1.8% | |
| 7,200 | 1 | Carrizo Oil & Gas, Inc. | 442,152 |
| 16,144 | 1 | Stone Energy Corp. | 614,279 |
| 19,484 | | W&T Offshore, Inc. | 261,281 |
| | | TOTAL | 1,317,712 |
| | | Defense Aerospace—0.9% | |
| 5,600 | | Kaman Corp., Class A | 224,056 |
| 996 | 1 | Orbital Sciences Corp. | 25,567 |
| 4,300 | 1 | Teledyne Technologies, Inc. | 392,160 |
| | | TOTAL | 641,783 |
| | | Education & Training Services—1.5% | |
| 3,960 | 1 | American Public Education, Inc. | 141,372 |
| 5,528 | | Capella Education Co. | 353,571 |
| 6,707 | 1 | Grand Canyon Education, Inc. | 288,401 |
| 5,812 | 1 | Strayer Education, Inc. | 301,178 |
| | | TOTAL | 1,084,522 |
| | | Electric & Electronic Original Equipment Manufacturers—0.4% | |
| 10,200 | | Altra Holdings, Inc. | 319,770 |
Annual Shareholder Report
| Shares | | | Value |
| | | COMMON STOCKS—continued | |
| | | Electrical Equipment—1.1% | |
| 10,706 | | EnerSys, Inc. | $679,081 |
| 6,330 | 1 | Rofin-Sinar Technologies, Inc. | 138,184 |
| | | TOTAL | 817,265 |
| | | Electronic Instruments—0.1% | |
| 3,289 | 1 | iRobot Corp. | 106,465 |
| | | Electronic Test/Measuring Equipment—0.3% | |
| 3,334 | | MTS Systems Corp. | 220,044 |
| | | Ethical Drugs—0.8% | |
| 11,300 | 1 | Ligand Pharmaceuticals, Inc., Class B | 555,621 |
| | | Financial Services—2.9% | |
| 14,068 | | Deluxe Corp. | 773,881 |
| 10,005 | | Heartland Payment Systems, Inc. | 475,237 |
| 7,879 | 1 | Outerwall, Inc. | 433,503 |
| 7,200 | 1 | Portfolio Recovery Associates, Inc. | 424,512 |
| | | TOTAL | 2,107,133 |
| | | Furniture—0.6% | |
| 7,783 | | Ethan Allen Interiors, Inc. | 178,386 |
| 12,014 | 1 | Select Comfort Corp. | 242,683 |
| | | TOTAL | 421,069 |
| | | Generic Drugs—1.5% | |
| 27,800 | 1 | Impax Laboratories, Inc. | 650,242 |
| 13,300 | 1 | Lannett Co., Inc. | 447,013 |
| | | TOTAL | 1,097,255 |
| | | Grocery Chain—0.1% | |
| 1,350 | | Casey's General Stores, Inc. | 89,329 |
| | | Health Care Equipment & Supplies—0.6% | |
| 17,300 | 1 | Masimo Corp. | 416,584 |
| | | Home Health Care—0.8% | |
| 9,470 | 1 | Wellcare Health Plans, Inc. | 590,739 |
| | | Home Products—1.3% | |
| 4,900 | | Spectrum Brands Holdings, Inc. | 408,660 |
| 7,349 | | Tupperware Brands Corp. | 534,860 |
| | | TOTAL | 943,520 |
| | | Household Appliances—0.3% | |
| 3,100 | 1 | Middleby Corp. | 225,866 |
| | | Industrial Machinery—1.9% | |
| 5,100 | | Hyster-Yale Materials Handling, Inc. | 408,510 |
| 18,400 | 1 | Rexnord Corp. | 495,144 |
Annual Shareholder Report
| Shares | | | Value |
| | | COMMON STOCKS—continued | |
| | | Industrial Machinery—continued | |
| 2,945 | | Tennant Co. | $214,838 |
| 4,513 | | Watts Industries, Inc., Class A | 263,830 |
| | | TOTAL | 1,382,322 |
| | | Insurance Brokerage—0.8% | |
| 13,600 | | AmTrust Financial Services, Inc. | 579,904 |
| 100 | 1 | Texas Capital Bancshares, Inc. | 5,205 |
| | | TOTAL | 585,109 |
| | | Internet Services—1.7% | |
| 11,600 | | j2 Global, Inc. | 567,472 |
| 4,661 | 1 | Travelzoo, Inc. | 80,356 |
| 23,000 | 1 | Web.com Group, Inc. | 610,650 |
| | | TOTAL | 1,258,478 |
| | | Internet Software & Services—0.5% | |
| 16,803 | 1 | Conversant, Inc. | 392,686 |
| | | IT Services—0.5% | |
| 10,300 | 1 | EPAM Systems, Inc. | 398,198 |
| | | Machined Parts Original Equipment Manufacturers—0.7% | |
| 10,278 | | Applied Industrial Technologies, Inc. | 498,072 |
| | | Mail Order—0.4% | |
| 5,570 | | HSN, Inc. | 311,307 |
| | | Maritime—0.6% | |
| 10,724 | | TAL International Group, Inc. | 474,001 |
| | | Medical Supplies—2.9% | |
| 8,400 | 1 | Align Technology, Inc. | 455,364 |
| 16,300 | | Owens & Minor, Inc. | 539,367 |
| 15,177 | | Steris Corp. | 772,206 |
| 8,300 | | West Pharmaceutical Services, Inc. | 338,225 |
| | | TOTAL | 2,105,162 |
| | | Medical Technology—2.0% | |
| 15,200 | | Cantel Medical Corp. | 509,656 |
| 1,500 | 1 | Cyberonics, Inc. | 89,205 |
| 16,151 | 1 | MedAssets, Inc. | 343,047 |
| 18,500 | 1 | Natus Medical, Inc. | 532,245 |
| | | TOTAL | 1,474,153 |
| | | Metal Fabrication—0.8% | |
| 15,038 | | Worthington Industries, Inc. | 575,203 |
| | | Miscellaneous Components—0.7% | |
| 6,300 | 1 | Proto Labs, Inc. | 510,300 |
Annual Shareholder Report
| Shares | | | Value |
| | | COMMON STOCKS—continued | |
| | | Miscellaneous Metals—0.7% | |
| 8,098 | | Materion Corp. | $261,646 |
| 6,365 | | Matthews International Corp., Class A | 276,814 |
| | | TOTAL | 538,460 |
| | | Multi-Industry Basic—0.6% | |
| 16,614 | | Olin Corp. | 441,434 |
| | | Multi-Industry Capital Goods—0.0% | |
| 280 | | Acuity Brands, Inc. | 30,036 |
| | | Multi-Industry Transportation—0.7% | |
| 10,389 | | Brinks Co. (The) | 278,841 |
| 5,080 | 1 | Hub Group, Inc. | 234,594 |
| | | TOTAL | 513,435 |
| | | Office Furniture—1.1% | |
| 10,040 | | HNI Corp. | 354,814 |
| 14,535 | | Knoll, Inc. | 244,333 |
| 7,135 | | Miller Herman, Inc. | 208,627 |
| | | TOTAL | 807,774 |
| | | Office Supplies—0.7% | |
| 793 | 1 | MSA Safety, Inc. | 41,062 |
| 11,631 | | United Stationers, Inc. | 448,724 |
| | | TOTAL | 489,786 |
| | | Oil Gas & Consumable Fuels—0.2% | |
| 3,325 | | CVR Energy, Inc. | 156,541 |
| | | Oil Refiner—1.3% | |
| 26,400 | | Alon USA Energy, Inc. | 339,240 |
| 17,800 | | Delek US Holdings, Inc. | 520,116 |
| 2,450 | | Western Refining, Inc. | 100,352 |
| | | TOTAL | 959,708 |
| | | Oil Service, Explore & Drill—0.9% | |
| 29,200 | 1 | Basic Energy Services, Inc. | 700,508 |
| | | Other Communications Equipment—0.3% | |
| 8,124 | 1 | Netgear, Inc. | 254,362 |
| | | Packaged Foods—0.4% | |
| 4,579 | 1 | United Natural Foods, Inc. | 268,421 |
| | | Paint & Related Materials—0.6% | |
| 9,700 | | Fuller (H.B.) Co. | 433,105 |
| | | Paper Products—0.4% | |
| 4,000 | 1 | Clearwater Paper Corp. | 270,400 |
Annual Shareholder Report
| Shares | | | Value |
| | | COMMON STOCKS—continued | |
| | | Personal & Household—0.5% | |
| 6,000 | | Nu Skin Enterprises, Inc., Class A | $352,140 |
| | | Personal Loans—1.0% | |
| 8,577 | | Cash America International, Inc. | 380,733 |
| 3,300 | 1 | Credit Acceptance Corp. | 375,293 |
| | | TOTAL | 756,026 |
| | | Personnel Agency—1.4% | |
| 22,700 | 1 | AMN Healthcare Services, Inc. | 297,370 |
| 10,900 | | Maximus, Inc. | 450,824 |
| 9,492 | 1 | TrueBlue, Inc. | 256,189 |
| | | TOTAL | 1,004,383 |
| | | Pharmaceuticals—1.1% | |
| 8,600 | 1 | Pacira Pharmaceuticals, Inc. | 791,200 |
| | | Photo-Optical Component-Equipment—0.2% | |
| 2,997 | 1 | Coherent, Inc. | 176,553 |
| | | Plastic—0.8% | |
| 15,900 | | Polyone Corp. | 603,405 |
| | | Poultry Products—1.7% | |
| 18,000 | 1 | Pilgrim's Pride Corp. | 503,280 |
| 8,400 | | Sanderson Farms, Inc. | 765,156 |
| | | TOTAL | 1,268,436 |
| | | Recreational Goods—0.5% | |
| 7,700 | | Sturm Ruger & Co., Inc. | 384,692 |
| | | Recreational Vehicles—1.0% | |
| 4,600 | | Arctic Cat, Inc. | 163,760 |
| 13,982 | | Brunswick Corp. | 563,894 |
| | | TOTAL | 727,654 |
| | | Regional Banks—0.8% | |
| 7,600 | | Bank of the Ozarks, Inc. | 233,852 |
| 14,600 | 1 | Western Alliance Bancorp | 334,340 |
| | | TOTAL | 568,192 |
| | | Restaurants—2.5% | |
| 3,700 | 1 | Buffalo Wild Wings, Inc. | 537,684 |
| 4,276 | | Cracker Barrel Old Country Store, Inc. | 414,601 |
| 5,500 | | Domino's Pizza, Inc. | 396,000 |
| 3,626 | | Jack in the Box, Inc. | 207,371 |
| 4,316 | 1 | Red Robin Gourmet Burgers | 277,778 |
| | | TOTAL | 1,833,434 |
Annual Shareholder Report
| Shares | | | Value |
| | | COMMON STOCKS—continued | |
| | | Roofing & Wallboard—0.1% | |
| 2,197 | 1 | Beacon Roofing Supply, Inc. | $60,725 |
| | | Semiconductor Distribution—0.6% | |
| 4,700 | 1 | Tyler Technologies, Inc. | 426,431 |
| | | Semiconductor Manufacturing—1.8% | |
| 412 | 1 | Cabot Microelectronics Corp. | 16,558 |
| 22,465 | 1 | Cirrus Logic, Inc. | 503,890 |
| 33,600 | 1 | Integrated Device Technology, Inc. | 482,496 |
| 7,894 | 1 | Plexus Corp. | 310,471 |
| | | TOTAL | 1,313,415 |
| | | Semiconductor Manufacturing Equipment—0.9% | |
| 18,799 | | Brooks Automation, Inc. | 191,374 |
| 25,704 | | Mentor Graphics Corp. | 507,654 |
| | | TOTAL | 699,028 |
| | | Semiconductors & Semiconductor Equipment—1.0% | |
| 2,700 | 1 | Ambarella, Inc. | 77,247 |
| 14,400 | 1 | Cavium Networks, Inc. | 671,760 |
| | | TOTAL | 749,007 |
| | | Services to Medical Professionals—3.3% | |
| 14,809 | 1 | Bio-Reference Laboratories, Inc. | 464,854 |
| 8,317 | 1 | Centene Corp. | 599,573 |
| 13,423 | 1 | Team Health Holdings, Inc. | 759,071 |
| 12,600 | 1 | WebMD Health Corp., Class A | 627,858 |
| | | TOTAL | 2,451,356 |
| | | Shoes—2.0% | |
| 8,021 | 1 | CROCs, Inc. | 127,293 |
| 9,220 | 1 | Genesco, Inc. | 703,210 |
| 11,800 | 1 | Skechers USA, Inc., Class A | 615,606 |
| | | TOTAL | 1,446,109 |
| | | Software Packaged/Custom—7.3% | |
| 17,700 | 1 | Aspen Technology, Inc. | 768,888 |
| 16,472 | | CSG Systems International, Inc. | 428,931 |
| 3,200 | 1 | Commvault Systems, Inc. | 153,664 |
| 13,500 | 1 | Electronics for Imaging, Inc. | 594,945 |
| 1,679 | 1 | MicroStrategy, Inc., Class A | 240,315 |
| 21,407 | 1 | PTC, Inc. | 769,796 |
| 15,930 | 1 | Progress Software Corp. | 369,257 |
| 10,100 | 1 | SS&C Technologies Holdings, Inc. | 437,431 |
| 30,500 | 1 | Take-Two Interactive Software, Inc. | 682,590 |
Annual Shareholder Report
| Shares | | | Value |
| | | COMMON STOCKS—continued | |
| | | Software Packaged/Custom—continued | |
| 5,600 | 1 | Ultimate Software Group, Inc. | $755,496 |
| 2,697 | 1 | Verint Systems, Inc. | 126,597 |
| | | TOTAL | 5,327,910 |
| | | Specialty Chemicals—1.7% | |
| 15,500 | | American Vanguard Corp. | 196,695 |
| 7,933 | | Chemed Corp. | 807,976 |
| 6,434 | 1 | Chemtura Corp. | 149,655 |
| 1,638 | | Quaker Chemical Corp. | 115,659 |
| | | TOTAL | 1,269,985 |
| | | Specialty Machinery—1.0% | |
| 14,400 | | Woodward Governor Co. | 719,424 |
| | | Specialty Retailing—5.3% | |
| 2,114 | | Aaron's, Inc. | 55,767 |
| 10,500 | 1 | Asbury Automotive Group, Inc. | 709,065 |
| 2,751 | 1 | Cabela's, Inc., Class A | 160,548 |
| 7,598 | | Children's Place, Inc./The | 381,420 |
| 8,700 | 1 | Dorman Products, Inc. | 377,406 |
| 10,402 | | Finish Line, Inc., Class A | 273,469 |
| 7,960 | | GNC Acquisition Holdings, Inc. | 261,168 |
| 3,445 | 1 | Kirkland's, Inc. | 64,800 |
| 8,200 | | Lithia Motors, Inc., Class A | 728,570 |
| 13,619 | | Penske Automotive Group, Inc. | 632,603 |
| 8,239 | | Pier 1 Imports, Inc. | 124,079 |
| 600 | 1 | Restoration Hardware, Inc. | 49,074 |
| 5,100 | 1 | Vera Bradley, Inc. | 101,133 |
| | | TOTAL | 3,919,102 |
| | | Telecommunication Equipment & Services—2.7% | |
| 7,003 | | Adtran, Inc. | 155,747 |
| 7,531 | 1 | Anixter International, Inc. | 647,440 |
| 21,963 | 1 | CIENA Corp. | 428,937 |
| 18,800 | 1 | Ubiquiti Networks, Inc. | 718,724 |
| | | TOTAL | 1,950,848 |
| | | Thrifts & Mortgage Finance—0.8% | |
| 7,700 | 1 | BofI Holding, Inc. | 574,343 |
| | | Trucking—0.9% | |
| 9,900 | 1 | Old Dominion Freight Lines, Inc. | 628,452 |
| | | Undesignated Consumer Cyclicals—1.9% | |
| 11,900 | 1 | Euronet Worldwide, Inc. | 595,476 |
Annual Shareholder Report
| Shares | | | Value |
| | | COMMON STOCKS—continued | |
| | | Undesignated Consumer Cyclicals—continued | |
| 15,500 | 1 | Parexel International Corp. | $830,180 |
| | | TOTAL | 1,425,656 |
| | | Undesignated Consumer Staples—1.1% | |
| 16,400 | 1 | Medifast, Inc. | 470,844 |
| 4,800 | 1 | USANA, Inc. | 306,480 |
| | | TOTAL | 777,324 |
| | | Undesignated Health—0.4% | |
| 7,600 | | HealthSouth Corp. | 291,308 |
| | | Wireless Communications—0.7% | |
| 11,600 | | InterDigital, Inc. | 511,444 |
| | | TOTAL COMMON STOCKS
(IDENTIFIED COST $64,328,334) | 71,960,799 |
| | | INVESTMENT COMPANY—1.9% | |
| 1,393,702 | 2,3 | Federated Prime Value Obligations Fund, Institutional Shares, 0.07%
(AT NET ASSET VALUE) | 1,393,702 |
| | | TOTAL INVESTMENTS—99.9%
(IDENTIFIED COST $65,722,036)4 | 73,354,501 |
| | | OTHER ASSETS AND LIABILITIES - NET—0.1%5 | 38,118 |
| | | TOTAL NET ASSETS—100% | $73,392,619 |
| 1 | Non-income-producing security. |
| 2 | Affiliated holding. |
| 3 | 7-day net yield. |
| 4 | The cost of investments for federal tax purposes amounts to $65,765,145. |
| 5 | Assets, other than investments in securities, less liabilities. See Statement of Assets and Liabilities. |
Note: The categories of investments are shown as a percentage of total net assets at July 31, 2014.
Annual Shareholder Report
Various inputs are used in determining the value of the Fund's investments. These inputs are summarized in the three broad levels listed below:
Level 1—quoted prices in active markets for identical securities, including investment companies with daily net asset values, if applicable.
Level 2—other significant observable inputs (including quoted prices for similar securities, interest rates, prepayment speeds, credit risk, etc.). Also includes securities valued at amortized cost.
Level 3—significant unobservable inputs (including the Fund's own assumptions in determining the fair value of investments).
The inputs or methodology used for valuing securities are not an indication of the risk associated with investing in those securities.
As of July 31, 2014, all investments of the Fund utilized Level 1 inputs in valuing the Fund's assets carried at fair value.
See Notes which are an integral part of the Financial Statements
Annual Shareholder Report
Financial Highlights–Class A Shares
(For a Share Outstanding Throughout Each Period)
| Year Ended July 31 | 2014 | 2013 | 2012 | 2011 | 2010 |
| Net Asset Value, Beginning of Period | $16.12 | $11.93 | $12.12 | $8.74 | $7.85 |
| Income From Investment Operations: | | | | | |
| Net investment income (loss) | (0.18)1 | (0.07)1 | (0.09)1 | (0.13)1 | (0.10)1 |
| Net realized and unrealized gain (loss) on investments and foreign currency transactions | 1.45 | 4.26 | (0.10) | 3.51 | 0.99 |
| TOTAL FROM INVESTMENT OPERATIONS | 1.27 | 4.19 | (0.19) | 3.38 | 0.89 |
| Net Asset Value, End of Period | $17.39 | $16.12 | $11.93 | $12.12 | $8.74 |
| Total Return2 | 7.88% | 35.12% | (1.57)% | 38.67% | 11.34% |
| Ratios to Average Net Assets: | | | | | |
| Net expenses | 1.75% | 1.75% | 1.75% | 1.75% | 1.75% |
| Net investment income (loss) | (1.05)% | (0.49)% | (0.79)% | (1.18)% | (1.17)% |
| Expense waiver/reimbursement3 | 0.43% | 0.59% | 1.04% | 1.14% | 1.22% |
| Supplemental Data: | | | | | |
| Net assets, end of period (000 omitted) | $29,690 | $30,187 | $22,718 | $25,634 | $19,822 |
| Portfolio turnover | 61% | 88% | 69% | 154% | 142% |
| 1 | Per share numbers have been calculated using the average shares method. |
| 2 | Based on net asset value, which does not reflect the sales charge, redemption fee or contingent deferred sales charge, if applicable. |
| 3 | This expense decrease is reflected in both the net expense and the net investment income (loss) ratios shown above. |
See Notes which are an integral part of the Financial Statements
Annual Shareholder Report
Financial Highlights–Class B Shares
(For a Share Outstanding Throughout Each Period)
| Year Ended July 31 | 2014 | 2013 | 2012 | 2011 | 2010 |
| Net Asset Value, Beginning of Period | $15.58 | $11.62 | $11.90 | $8.65 | $7.81 |
| Income From Investment Operations: | | | | | |
| Net investment income (loss) | (0.30)1 | (0.17)1 | (0.17)1 | (0.21)1 | (0.16)1 |
| Net realized and unrealized gain (loss) on investments and foreign currency transactions | 1.41 | 4.13 | (0.11) | 3.46 | 1.00 |
| TOTAL FROM INVESTMENT OPERATIONS | 1.11 | 3.96 | (0.28) | 3.25 | 0.84 |
| Net Asset Value, End of Period | $16.69 | $15.58 | $11.62 | $11.90 | $8.65 |
| Total Return2 | 7.12% | 34.08% | (2.35)% | 37.57% | 10.76% |
| Ratios to Average Net Assets: | | | | | |
| Net expenses | 2.50% | 2.50% | 2.50% | 2.50% | 2.50% |
| Net investment income (loss) | (1.79)% | (1.25)% | (1.55)% | (1.93)% | (1.92)% |
| Expense waiver/reimbursement3 | 0.43% | 0.59% | 1.06% | 1.15% | 1.22% |
| Supplemental Data: | | | | | |
| Net assets, end of period (000 omitted) | $1,842 | $2,016 | $1,640 | $2,541 | $2,350 |
| Portfolio turnover | 61% | 88% | 69% | 154% | 142% |
| 1 | Per share numbers have been calculated using the average shares method. |
| 2 | Based on net asset value, which does not reflect the sales charge, redemption fee or contingent deferred sales charge, if applicable. |
| 3 | This expense decrease is reflected in both the net expense and the net investment income (loss) ratios shown above. |
See Notes which are an integral part of the Financial Statements
Annual Shareholder Report
Financial Highlights–Class C Shares
(For a Share Outstanding Throughout Each Period)
| Year Ended July 31 | 2014 | 2013 | 2012 | 2011 | 2010 |
| Net Asset Value, Beginning of Period | $15.19 | $11.33 | $11.60 | $8.43 | $7.62 |
| Income From Investment Operations: | | | | | |
| Net investment income (loss) | (0.30)1 | (0.16)1 | (0.17)1 | (0.21)1 | (0.16)1 |
| Net realized and unrealized gain (loss) on investments and foreign currency transactions | 1.38 | 4.02 | (0.10) | 3.38 | 0.97 |
| TOTAL FROM INVESTMENT OPERATIONS | 1.08 | 3.86 | (0.27) | 3.17 | 0.81 |
| Net Asset Value, End of Period | $16.27 | $15.19 | $11.33 | $11.60 | $8.43 |
| Total Return2 | 7.11% | 34.07% | (2.33)% | 37.60% | 10.63% |
| Ratios to Average Net Assets: | | | | | |
| Net expenses | 2.50% | 2.50% | 2.50% | 2.50% | 2.49% |
| Net investment income (loss) | (1.79)% | (1.24)% | (1.54)% | (1.94)% | (1.91)% |
| Expense waiver/reimbursement3 | 0.43% | 0.59% | 1.04% | 1.13% | 1.22% |
| Supplemental Data: | | | | | |
| Net assets, end of period (000 omitted) | $4,608 | $4,912 | $4,223 | $4,663 | $2,795 |
| Portfolio turnover | 61% | 88% | 69% | 154% | 142% |
| 1 | Per share numbers have been calculated using the average shares method. |
| 2 | Based on net asset value, which does not reflect the sales charge, redemption fee or contingent deferred sales charge, if applicable. |
| 3 | This expense decrease is reflected in both the net expense and the net investment income (loss) ratios shown above. |
See Notes which are an integral part of the Financial Statements
Annual Shareholder Report
Financial Highlights–Institutional Shares
(For a Share Outstanding Throughout Each Period)
| Year Ended July 31 | 2014 | 2013 | 2012 | 2011 | 2010 |
| Net Asset Value, Beginning of Period | $16.44 | $12.14 | $12.31 | $8.85 | $7.93 |
| Income From Investment Operations: | | | | | |
| Net investment income (loss) | (0.14)1 | (0.03)1 | (0.06)1 | (0.10)1 | (0.08)1 |
| Net realized and unrealized gain (loss) on investments and foreign currency transactions | 1.49 | 4.33 | (0.11) | 3.56 | 1.00 |
| TOTAL FROM INVESTMENT OPERATIONS | 1.35 | 4.30 | (0.17) | 3.46 | 0.92 |
| Net Asset Value, End of Period | $17.79 | $16.44 | $12.14 | $12.31 | $8.85 |
| Total Return2 | 8.21% | 35.42% | (1.38)% | 39.10% | 11.60% |
| Ratios to Average Net Assets: | | | | | |
| Net expenses | 1.50% | 1.50% | 1.50% | 1.50% | 1.50% |
| Net investment income (loss) | (0.80)% | (0.24)% | (0.54)% | (0.92)% | (0.92)% |
| Expense waiver/reimbursement3 | 0.43% | 0.59% | 1.05% | 1.15% | 1.22% |
| Supplemental Data: | | | | | |
| Net assets, end of period (000 omitted) | $37,253 | $31,179 | $26,233 | $29,395 | $27,039 |
| Portfolio turnover | 61% | 88% | 69% | 154% | 142% |
| 1 | Per share numbers have been calculated using the average shares method. |
| 2 | Based on net asset value. |
| 3 | This expense decrease is reflected in both the net expense and the net investment income (loss) ratios shown above. |
See Notes which are an integral part of the Financial Statements
Annual Shareholder Report
Statement of Assets and Liabilities
July 31, 2014
| Assets: | | |
| Total investment in securities, at value including $1,393,702 of investment in an affiliated holding (Note 5) (identified cost $65,722,036) | | $73,354,501 |
| Income receivable | | 17,985 |
| Receivable for investments sold | | 499,921 |
| Receivable for shares sold | | 147,764 |
| TOTAL ASSETS | | 74,020,171 |
| Liabilities: | | |
| Payable for investments purchased | $395,034 | |
| Payable for shares redeemed | 88,696 | |
| Payable for transfer agent fee | 41,975 | |
| Payable for auditing fees | 23,800 | |
| Payable for distribution services fee (Note 5) | 4,423 | |
| Payable for other service fees (Notes 2 and 5) | 18,640 | |
| Payable for share registration costs | 33,900 | |
| Accrued expenses (Note 5) | 21,084 | |
| TOTAL LIABILITIES | | 627,552 |
| Net assets for 4,194,600 shares outstanding | | $73,392,619 |
| Net Assets Consist of: | | |
| Paid-in capital | | $68,876,329 |
| Net unrealized appreciation of investments | | 7,632,465 |
| Accumulated net realized loss on investments and foreign currency transactions | | (2,636,923) |
| Accumulated net investment income (loss) | | (479,252) |
| TOTAL NET ASSETS | | $73,392,619 |
Annual Shareholder Report
Statement of Assets and Liabilities–continued
| Net Asset Value, Offering Price and Redemption Proceeds Per Share | | |
| Class A Shares: | | |
| Net asset value per share ($29,690,115 ÷ 1,706,918 shares outstanding), no par value, unlimited shares authorized | | $17.39 |
| Offering price per share (100/94.50 of $17.39) | | $18.40 |
| Redemption proceeds per share | | $17.39 |
| Class B Shares: | | |
| Net asset value per share ($1,841,904 ÷ 110,381 shares outstanding), no par value, unlimited shares authorized | | $16.69 |
| Offering price per share | | $16.69 |
| Redemption proceeds per share (94.50/100 of $16.69) | | $15.77 |
| Class C Shares: | | |
| Net asset value per share ($4,607,702 ÷ 283,185 shares outstanding), no par value, unlimited shares authorized | | $16.27 |
| Offering price per share | | $16.27 |
| Redemption proceeds per share (99.00/100 of $16.27) | | $16.11 |
| Institutional Shares: | | |
| Net asset value per share ($37,252,898 ÷ 2,094,116 shares outstanding), no par value, unlimited shares authorized | | $17.79 |
| Offering price per share | | $17.79 |
| Redemption proceeds per share | | $17.79 |
See Notes which are an integral part of the Financial Statements
Annual Shareholder Report
Statement of Operations
Year Ended July 31, 2014
| Investment Income: | | | |
| Dividends (including $885 received from an affiliated holding (Note 5)) | | | $514,522 |
| Interest | | | 72 |
| TOTAL INCOME | | | 514,594 |
| Expenses: | | | |
| Investment adviser fee (Note 5) | | $838,235 | |
| Administrative fee (Note 5) | | 56,940 | |
| Custodian fees | | 10,247 | |
| Transfer agent fee | | 269,270 | |
| Directors'/Trustees' fees (Note 5) | | 1,378 | |
| Auditing fees | | 23,800 | |
| Legal fees | | 14,057 | |
| Portfolio accounting fees | | 78,997 | |
| Distribution services fee (Note 5) | | 54,894 | |
| Other service fees (Notes 2 and 5) | | 96,073 | |
| Share registration costs | | 53,649 | |
| Printing and postage | | 50,786 | |
| Miscellaneous (Note 5) | | 11,273 | |
| TOTAL EXPENSES | | 1,559,599 | |
| Waiver/reimbursement of investment adviser fee (Note 5) | | (311,711) | |
| Net expenses | | | 1,247,888 |
| Net investment income (loss) | | | (733,294) |
| Realized and Unrealized Gain (Loss) on Investments: | | | |
| Net realized gain on investments | | | 9,490,958 |
| Net change in unrealized appreciation of investments | | | (3,333,015) |
| Net realized and unrealized gain on investments | | | 6,157,943 |
| Change in net assets resulting from operations | | | $5,424,649 |
See Notes which are an integral part of the Financial Statements
Annual Shareholder Report
Statement of Changes in Net Assets
| Year Ended July 31 | 2014 | 2013 |
| Increase (Decrease) in Net Assets | | |
| Operations: | | |
| Net investment income (loss) | $(733,294) | $(273,634) |
| Net realized gain on investments | 9,490,958 | 11,801,972 |
| Net change in unrealized appreciation/depreciation of investments | (3,333,015) | 7,112,884 |
| CHANGE IN NET ASSETS RESULTING FROM OPERATIONS | 5,424,649 | 18,641,222 |
| Share Transactions: | | |
| Proceeds from sale of shares | 16,325,070 | 12,327,005 |
| Cost of shares redeemed | (16,650,066) | (17,490,091) |
| CHANGE IN NET ASSETS RESULTING FROM SHARE TRANSACTIONS | (324,996) | (5,163,086) |
| Change in net assets | 5,099,653 | 13,478,136 |
| Net Assets: | | |
| Beginning of period | 68,292,966 | 54,814,830 |
| End of period (including accumulated net investment income (loss) of $(479,252) and $(275,991), respectively) | $73,392,619 | $68,292,966 |
See Notes which are an integral part of the Financial Statements
Annual Shareholder Report
Notes to Financial Statements
July 31, 2014
1. ORGANIZATION
Federated MDT Series (the “Trust”) is registered under the Investment Company Act of 1940, as amended (the “Act”), as an open-end management investment company. The Trust consists of five portfolios. The financial statements included herein are only those of Federated MDT Small Cap Growth Fund (the “Fund”), a diversified portfolio. The financial statements of the other portfolios are presented separately. The assets of each portfolio are segregated and a shareholder's interest is limited to the portfolio in which shares are held. Each portfolio pays its own expenses. The Fund offers four classes of shares: Class A Shares, Class B Shares, Class C Shares and Institutional Shares. All shares of the Fund have equal rights with respect to voting, except on class-specific matters. The investment objective of the Fund is long-term capital appreciation.
2. SIGNIFICANT ACCOUNTING POLICIES
The following is a summary of significant accounting policies consistently followed by the Fund in the preparation of its financial statements. These policies are in conformity with U.S. generally accepted accounting principles (GAAP).
Investment Valuation
In calculating its net asset value (NAV), the Fund generally values investments as follows:
| ■ | Equity securities listed on an exchange or traded through a regulated market system are valued at their last reported sale price or official closing price in their principal exchange or market. |
| ■ | Shares of other mutual funds or non-exchange-traded investment companies are valued based upon their reported NAVs. |
| ■ | Fixed-income securities acquired with remaining maturities greater than 60 days are fair valued using price evaluations provided by a pricing service approved by the Fund's Board of Trustees (the “Trustees”). |
| ■ | Fixed-income securities and repurchase agreements acquired with remaining maturities of 60 days or less are valued at their amortized cost (adjusted for the accretion of any discount or amortization of any premium), unless the issuer's creditworthiness is impaired or other factors indicate that amortized cost is not an accurate estimate of the investment's fair value, in which case it would be valued in the same manner as a longer-term security. |
| ■ | Derivative contracts listed on exchanges are valued at their reported settlement or closing price. |
| ■ | Over-the-counter (OTC) derivative contracts are fair valued using price evaluations provided by a pricing service approved by the Trustees. |
| ■ | For securities that are fair valued in accordance with procedures established by and under the general supervision of the Trustees, certain factors may be considered such as: the purchase price of the security, information obtained by contacting the issuer, analysis of the issuer's financial statements or other available documents, fundamental analytical data, the nature and duration of restrictions on disposition, the movement of the market in which the security is normally traded and public trading in similar securities of the issuer or comparable issuers. |
Annual Shareholder Report
If the Fund cannot obtain a price or price evaluation from a pricing service for an investment, the Fund may attempt to value the investment based upon the mean of bid and asked quotations or fair value the investment based on price evaluations from one or more dealers. If any price, quotation, price evaluation or other pricing source is not readily available when the NAV is calculated, or if the Fund cannot obtain price evaluations from a pricing service or from more than one dealer for an investment within a reasonable period of time as set forth in the Fund's valuation policies and procedures, the Fund uses the fair value of the investment determined in accordance with the procedures described below. There can be no assurance that the Fund could purchase or sell an investment at the price used to calculate the Fund's NAV.
Fair Valuation Procedures
The Trustees have appointed a Valuation Committee comprised of officers of the Fund, Federated MDTA LLC (“Adviser”) and certain of the Adviser's affiliated companies to determine fair value of securities and in overseeing the calculation of the NAV. The Trustees have also authorized the use of pricing services recommended by the Valuation Committee to provide fair value evaluations of the current value of certain investments for purposes of calculating the NAV. The Valuation Committee employs various methods for reviewing third-party pricing-service evaluations including periodic reviews of third-party pricing services' policies, procedures and valuation methods (including key inputs and assumptions), transactional back-testing, comparisons of evaluations of different pricing services, and review of price challenges by the Adviser based on recent market activity. In the event that market quotations and price evaluations are not available for an investment, the Valuation Committee determines the fair value of the investment in accordance with procedures adopted by the Trustees. The Trustees periodically review and approve the fair valuations made by the Valuation Committee and any changes made to the procedures.
Factors considered by pricing services in evaluating an investment include the yields or prices of investments of comparable quality, coupon, maturity, call rights and other potential prepayments, terms and type, reported transactions, indications as to values from dealers and general market conditions. Some pricing services provide a single price evaluation reflecting the bid-side of the market for an investment (a “bid” evaluation). Other pricing services offer both bid evaluations and price evaluations indicative of a price between the prices bid and asked for the investment (a “mid” evaluation). The Fund normally uses bid evaluations for U.S. Treasury and Agency securities, mortgage-backed securities and municipal securities. The Fund normally uses mid evaluations for other types of fixed-income securities and OTC derivative contracts. In the event that market quotations and price evaluations are not available for an investment, the fair value of the investment is determined in accordance with procedures adopted by the Trustees.
Repurchase Agreements
The Fund may invest in repurchase agreements for short-term liquidity purposes. It is the policy of the Fund to require the other party to a repurchase agreement to transfer to the Fund's custodian or sub-custodian eligible securities or cash with a market value (after transaction costs) at least equal to the repurchase price to be paid under the repurchase agreement. The eligible securities are transferred to accounts with the custodian or sub-custodian in which the Fund holds a “securities entitlement” and exercises “control” as those terms are defined in the Uniform Commercial Code. The Fund has established procedures for monitoring the market value of the transferred securities and requiring the transfer of
Annual Shareholder Report
additional eligible securities if necessary to equal at least the repurchase price. These procedures also allow the other party to require securities to be transferred from the account to the extent that their market value exceeds the repurchase price or in exchange for other eligible securities of equivalent market value.
The insolvency of the other party or other failure to repurchase the securities may delay the disposition of the underlying securities or cause the Fund to receive less than the full repurchase price. Under the terms of the repurchase agreement, any amounts received by the Fund in excess of the repurchase price and related transaction costs must be remitted to the other party.
The Fund may enter into repurchase agreements in which eligible securities are transferred into joint trading accounts maintained by the custodian or sub-custodian for investment companies and other clients advised by the Fund's Adviser and its affiliates. The Fund will participate on a pro rata basis with the other investment companies and clients in its share of the securities transferred under such repurchase agreements and in its share of proceeds from any repurchase or other disposition of such securities.
Investment Income, Gains and Losses, Expenses and Distributions
Investment transactions are accounted for on a trade-date basis. Realized gains and losses from investment transactions are recorded on an identified-cost basis. Interest income and expenses are accrued daily. Dividend income and distributions to shareholders are recorded on the ex-dividend date. Distributions of net investment income, if any, are declared and paid annually. Non-cash dividends included in dividend income, if any, are recorded at fair value. Investment income, realized and unrealized gains and losses, and certain fund-level expenses are allocated to each class based on relative average daily net assets, except that Class A Shares, Class B Shares, Class C Shares and Institutional Shares may bear distribution services fees and other service fees unique to those classes.
Other Service Fees
The Fund may pay other service fees up to 0.25% of the average daily net assets of the Fund's Class A Shares, Class B Shares and Class C Shares to unaffiliated financial intermediaries or to Federated Shareholder Services Company (FSSC) for providing services to shareholders and maintaining shareholder accounts. Subject to the terms described in the Expense Limitation note, FSSC may voluntarily reimburse the Fund for other service fees. For the year ended July 31, 2014, other service fees for the Fund were as follows:
| | Other
Service Fees
Incurred |
| Class A Shares | $77,825 |
| Class B Shares | 5,264 |
| Class C Shares | 12,984 |
| TOTAL | $96,073 |
Dividends are declared separately for each class. No class has preferential dividend rights; differences in per share dividend rates are generally due to differences in separate class expenses.
Annual Shareholder Report
Premium and Discount Amortization
All premiums and discounts on fixed-income securities are amortized/accreted using the effective-interest-rate method.
Federal Taxes
It is the Fund's policy to comply with the Subchapter M provision of the Internal Revenue Code (the “Code”) and to distribute to shareholders each year substantially all of its income. Accordingly, no provision for federal income tax is necessary. As of and during the year ended July 31, 2014, the Fund did not have a liability for any uncertain tax positions. The Fund recognizes interest and penalties, if any, related to tax liabilities as income tax expense in the Statement of Operations. As of July 31, 2014, tax years 2011 through 2014 remain subject to examination by the Fund's major tax jurisdictions, which include the United States of America and the Commonwealth of Massachusetts.
When-Issued and Delayed-Delivery Transactions
The Fund may engage in when-issued or delayed-delivery transactions. The Fund records when-issued securities on the trade date and maintains security positions such that sufficient liquid assets will be available to make payment for the securities purchased. Securities purchased on a when-issued or delayed-delivery basis are marked to market daily and begin earning interest on the settlement date. Losses may occur on these transactions due to changes in market conditions or the failure of counterparties to perform under the contract.
Other
The preparation of financial statements in conformity with GAAP requires management to make estimates and assumptions that affect the amounts of assets, liabilities, expenses and revenues reported in the financial statements. Actual results could differ from those estimated.
3. SHARES OF BENEFICIAL INTEREST
The following tables summarize share activity:
| Year Ended July 31 | 2014 | 2013 |
| Class A Shares: | Shares | Amount | Shares | Amount |
| Shares sold | 141,156 | $2,490,198 | 331,847 | $4,237,900 |
| Shares redeemed | (307,176) | (5,375,153) | (363,126) | (4,908,290) |
| NET CHANGE RESULTING FROM CLASS A SHARE TRANSACTIONS | (166,020) | $(2,884,955) | (31,279) | $(670,390) |
| Year Ended July 31 | 2014 | 2013 |
| Class B Shares: | Shares | Amount | Shares | Amount |
| Shares sold | 18,297 | $308,687 | 32,692 | $439,424 |
| Shares redeemed | (37,296) | (634,098) | (44,499) | (581,084) |
| NET CHANGE RESULTING FROM CLASS B SHARE TRANSACTIONS | (18,999) | $(325,411) | (11,807) | $(141,660) |
Annual Shareholder Report
| Year Ended July 31 | 2014 | 2013 |
| Class C Shares: | Shares | Amount | Shares | Amount |
| Shares sold | 23,500 | $374,325 | 20,807 | $274,225 |
| Shares redeemed | (63,678) | (1,059,481) | (70,218) | (912,217) |
| NET CHANGE RESULTING FROM CLASS C SHARE TRANSACTIONS | (40,178) | $(685,156) | (49,411) | $(637,992) |
| Year Ended July 31 | 2014 | 2013 |
| Institutional Shares: | Shares | Amount | Shares | Amount |
| Shares sold | 729,007 | $13,151,860 | 523,422 | $7,375,456 |
| Shares redeemed | (531,135) | (9,581,334) | (787,972) | (11,088,500) |
| NET CHANGE RESULTING FROM INSTITUTIONAL SHARE TRANSACTIONS | 197,872 | $3,570,526 | (264,550) | $(3,713,044) |
| NET CHANGE RESULTING FROM TOTAL FUND SHARE TRANSACTIONS | (27,325) | $(324,996) | (357,047) | $(5,163,086) |
4. FEDERAL TAX INFORMATION
The timing and character of income and capital gain distributions are determined in accordance with income tax regulations, which may differ from GAAP. These differences are due to differing treatments for regulatory settlement proceeds and net operating losses.
For the year ended July 31, 2014, permanent differences identified and reclassified among the components of net assets were as follows:
| Increase (Decrease) |
| Paid-In Capital | Undistributed
Net Investment
Income (Loss) | Accumulated
Net Realized
Gain (Loss) |
| $(530,261) | $530,033 | $228 |
Net investment income (loss), net realized gains (losses), and net assets were not affected by this reclassification.
As of July 31, 2014, the components of distributable earnings on a tax basis were as follows:
| Net unrealized appreciation | $7,589,356 |
| Capital loss carryforwards and deferrals | $(3,073,066) |
The difference between book-basis and tax-basis net unrealized appreciation/depreciation is attributable to differing treatments for the deferral of losses on wash sales.
At July 31, 2014, the cost of investments for federal tax purposes was $65,765,145. The net unrealized appreciation of investments for federal tax purposes was $7,589,356. This consists of net unrealized appreciation from investments for those securities having an excess of value over cost of $11,303,321 and net unrealized depreciation from investments for those securities having an excess of cost over value of $3,713,965.
Annual Shareholder Report
At July 31, 2014, the Fund had a capital loss carryforward of $2,593,814 which will reduce the Fund's taxable income arising from future net realized gains on investments, if any, to the extent permitted by the Code, thereby reducing the amount of distributions to shareholders which would otherwise be necessary to relieve the Fund of any liability for federal income tax. Pursuant to the Code, a net capital loss incurred in taxable years beginning on or before December 22, 2010, is characterized as short-term and may be carried forward for a maximum of eight tax years (“Carryforward Limit”), whereas a net capital loss incurred in taxable years beginning after December 22, 2010, retains its character as either short-term or long-term, does not expire and is required to be utilized prior to the losses which have a Carryforward Limit.
The following schedule summarizes the Fund's capital loss carryforward and expiration year:
| Expiration Year | Short-Term | Long-Term | Total |
| 2018 | $2,593,814 | NA | $2,593,814 |
The Fund used capital loss carryforwards of $9,514,541 to offset capital gains realized during the year ended July 31, 2014.
Under current tax rules, a late-year ordinary loss may be deferred, in whole or in part, and treated as occurring on the first day of the following fiscal year. As of July 31, 2014, for federal income tax purposes, a late year ordinary loss of $479,252 was deferred to August 1, 2014.
5. INVESTMENT ADVISER FEE AND OTHER TRANSACTIONS WITH AFFILIATES
Investment Adviser Fee
The advisory agreement between the Fund and the Adviser provides for an annual fee equal to 1.15% of the Fund's average daily net assets. Subject to the terms described in the Expense Limitation note, the Adviser may voluntarily choose to waive any portion of its fee. For the year ended July 31, 2014, the Adviser voluntarily waived $310,147 of its fee.
Administrative Fee
Federated Administrative Services (FAS), under the Administrative Services Agreement, provides the Fund with administrative personnel and services. For purposes of determining the appropriate rate breakpoint, “Investment Complex” is defined as all of the Federated Funds subject to a fee under the Administrative Services Agreement. The fee paid to FAS is based on the average daily net assets of the Investment Complex as specified below, plus certain out-of-pocket expenses:
| Administrative Fee | Average Daily Net Assets
of the Investment Complex |
| 0.150% | on the first $5 billion |
| 0.125% | on the next $5 billion |
| 0.100% | on the next $10 billion |
| 0.075% | on assets in excess of $20 billion |
Subject to the terms described in the Expense Limitation note, FAS may voluntarily choose to waive any portion of its fee. For the year ended July 31, 2014, the annualized fee paid to FAS was 0.078% of average daily net assets of the Fund.
Annual Shareholder Report
Distribution Services Fee
The Fund has adopted a Distribution Plan (the “Plan”) pursuant to Rule 12b-1 under the Act. Under the terms of the Plan, the Fund will compensate Federated Securities Corp. (FSC), the principal distributor, from the daily net assets of the Fund's Class A Shares, Class B Shares and Class C Shares to finance activities intended to result in the sale of these shares. The Plan provides that the Fund may incur distribution expenses at the following percentages of average daily net assets annually, to compensate FSC:
| Share Class Name | Percentage of Average Daily
Net Assets of Class |
| Class A Shares | 0.05% |
| Class B Shares | 0.75% |
| Class C Shares | 0.75% |
Subject to the terms described in the Expense Limitation note, FSC may voluntarily choose to waive any portion of its fee. For the year ended July 31, 2014, distribution services fees for the Fund were as follows:
| | Distribution
Services
Fees Incurred |
| Class B Shares | $15,822 |
| Class C Shares | $39,072 |
| TOTAL | $54,894 |
For the year ended July 31, 2014, FSC retained $10,886 of fees paid by the Fund.
When FSC receives fees, it may pay some or all of them to financial intermediaries whose customers purchase shares. For the year ended July 31, 2014, the Fund's Class A Shares did not incur a distribution services fee; however, it may begin to incur this fee upon approval of the Trustees.
Sales Charges
Front-end sales charges and contingent deferred sales charges (CDSC) do not represent expenses of the Fund. They are deducted from the proceeds of sales of Fund shares prior to investment or from redemption proceeds prior to remittance, as applicable. For the year ended July 31, 2014, FSC retained $1,430 in sales charges from the sale of Class A Shares. FSC also retained $1,601 of CDSC relating to redemptions of Class B Shares and $205 relating to redemptions of Class C Shares.
Other Service Fees
FSSC received $7,349 of the other service fees disclosed in Note 2.
Annual Shareholder Report
Expense Limitation
The Adviser and certain of its affiliates (which may include FSC, FAS and FSSC) on their own initiative have agreed to waive their respective fees and/or reimburse expenses so that the total annual fund operating expenses (as shown in the financial highlights, excluding expenses allocated from affiliated partnerships, extraordinary expenses and proxy-related expenses paid by the Fund, if any) paid by the Fund's Class A Shares, Class B Shares, Class C Shares and Institutional Shares (after the voluntary waivers and/or reimbursements) will not exceed 1.75%, 2.50%, 2.50% and 1.50% (the “Fee Limit”), respectively, up to but not including the later of (the “Termination Date”): (a) October 1, 2015; or (b) the date of the Fund's next effective Prospectus. While the Adviser and its applicable affiliates currently do not anticipate terminating or increasing these arrangements prior to the Termination Date, these arrangements may only be terminated or the Fee Limit increased prior to the Termination Date with the agreement of the Trustees.
General
Certain Officers and Trustees of the Funds are Officers and Directors or Trustees of certain of the above companies. To efficiently facilitate payment, Directors'/Trustees' fees and certain expenses related to conducting meetings of the Directors/Trustees and other miscellaneous expenses are paid by an affiliate of the Adviser which in due course are reimbursed by the Fund. Such expenses may be included in Accrued and Miscellaneous Expenses on the Statement of Assets and Liabilities and Statement of Operations, respectively.
Transactions Involving Affiliated Company Holdings
Affiliated holdings are investment companies which are managed by the Adviser or an affiliate of the Adviser. The Adviser has agreed to reimburse the Fund for certain investment adviser fees as a result of transactions in other affiliated investment companies. For the year ended July 31, 2014, the Adviser reimbursed $1,564. Transactions involving the affiliated holding during the year ended July 31, 2014, were as follows:
| | Federated
Prime Value
Obligations Fund,
Institutional Shares |
| Balance of Shares Held 7/31/2013 | 1,007,928 |
| Purchases/Additions | 16,023,768 |
| Sales/Reductions | (15,637,994) |
| Balance of Shares Held 7/31/2014 | 1,393,702 |
| Value | $1,393,702 |
| Dividend Income | $885 |
6. Investment TRANSACTIONS
Purchases and sales of investments, excluding long-term U.S. government securities and short-term obligations for the year ended July 31, 2014, were as follows:
| Purchases | $43,305,769 |
| Sales | $44,748,751 |
Annual Shareholder Report
7. LINE OF CREDIT
The Fund participates in a $100,000,000 unsecured, uncommitted revolving line of credit (LOC) agreement with PNC Bank. The LOC was made available for extraordinary or emergency purposes, primarily for financing redemption payments. Borrowings are charged interest at a rate offered to the Fund by PNC Bank at the time of the borrowing. As of July 31, 2014, there were no outstanding loans. During the year ended July 31, 2014, the Fund did not utilize the LOC.
8. INTERFUND LENDING
Pursuant to an Exemptive Order issued by the Securities and Exchange Commission, the Funds, along with other funds advised by subsidiaries of Federated Investors, Inc., may participate in an interfund lending program. This program provides an alternative credit facility allowing the Fund to borrow from other participating affiliated funds. As of July 31, 2014, there were no outstanding loans. During the year ended July 31, 2014, the program was not utilized.
Annual Shareholder Report
Report of Independent Registered Public Accounting Firm
TO THE BOARD OF trustees OF Federated MDt series AND SHAREHOLDERS OF federated mdt Small cap growth fund:
We have audited the accompanying statement of assets and liabilities of Federated MDT Small Cap Growth Fund (the “Fund”) (one of the portfolios constituting Federated MDT Series), including the portfolio of investments, as of July 31, 2014, and the related statement of operations for the year then ended, the statement of changes in net assets for each of the two years in the period then ended and the financial highlights for each of the five years in the period then ended. These financial statements and financial highlights are the responsibility of the Fund's management. Our responsibility is to express an opinion on these financial statements and financial highlights based on our audits.
We conducted our audits in accordance with standards of the Public Company Accounting Oversight Board (United States). Those standards require that we plan and perform the audit to obtain reasonable assurance about whether the financial statements and financial highlights are free of material misstatement. We were not engaged to perform an audit of the Fund's internal control over financial reporting. Our audits included consideration of internal control over financial reporting as a basis for designing audit procedures that are appropriate in the circumstances, but not for the purpose of expressing an opinion on the effectiveness of the Fund's internal control over financial reporting. Accordingly, we express no such opinion. An audit also includes examining, on a test basis, evidence supporting the amounts and disclosures in the financial statements and financial highlights, assessing the accounting principles used and significant estimates made by management, and evaluating the overall financial statement presentation. Our procedures included confirmation of securities owned as of July 31, 2014, by correspondence with the custodian and others, or by other appropriate auditing procedures where replies from others were not received. We believe that our audits provide a reasonable basis for our opinion.
In our opinion, the financial statements and financial highlights referred to above present fairly, in all material respects, the financial position of Federated MDT Small Cap Growth Fund, a portfolio of Federated MDT Series, at July 31, 2014, the results of its operations for the year then ended, the changes in its net assets for each of the two years in the period then ended and the financial highlights for each of the five years in the period then ended, in conformity with U.S. generally accepted accounting principles.
Boston, Massachusetts
September 23, 2014
Annual Shareholder Report
Shareholder Expense Example (unaudited)
As a shareholder of the Fund, you incur two types of costs: (1) transaction costs, including sales charges (loads) on purchase or redemption payments; and (2) ongoing costs, including management fees and to the extent applicable, distribution (12b-1) fees and/or other service fees and other Fund expenses. This Example is intended to help you to understand your ongoing costs (in dollars) of investing in the Fund and to compare these costs with the ongoing costs of investing in other mutual funds. It is based on an investment of $1,000 invested at the beginning of the period and held for the entire period from February 1, 2014 to July 31, 2014.
ACTUAL EXPENSES
The first section of the table below provides information about actual account values and actual expenses. You may use the information in this section, together with the amount you invested, to estimate the expenses that you incurred over the period. Simply divide your account value by $1,000 (for example, an $8,600 account value divided by $1,000 = 8.6), then multiply the result by the number in the first section under the heading entitled “Expenses Paid During Period” to estimate the expenses attributable to your investment during this period.
HYPOTHETICAL EXAMPLE FOR COMPARISON PURPOSES
The second section of the table below provides information about hypothetical account values and hypothetical expenses based on the Fund's actual expense ratio and an assumed rate of return of 5% per year before expenses, which is not the Fund's actual return. Thus, you should not use the hypothetical account values and expenses to estimate the actual ending account balance or your expenses for the period. Rather, these figures are required to be provided to enable you to compare the ongoing costs of investing in the Fund with other funds. To do so, compare this 5% hypothetical example with the 5% hypothetical examples that appear in the shareholder reports of the other funds.
Annual Shareholder Report
Please note that the expenses shown in the table are meant to highlight your ongoing costs only and do not reflect any transaction costs, such as sales charges (loads) on purchase or redemption payments. Therefore, the second section of the table is useful in comparing ongoing costs only, and will not help you determine the relative total costs of owning different funds. In addition, if these transaction costs were included, your costs would have been higher.
| | Beginning
Account Value
2/1/2014 | Ending
Account Value
7/31/2014 | Expenses Paid
During Period1 |
| Actual: | | | |
| Class A Shares | $1,000 | $990.90 | $8.64 |
| Class B Shares | $1,000 | $987.60 | $12.32 |
| Class C Shares | $1,000 | $987.30 | $12.32 |
| Institutional Shares | $1,000 | $992.20 | $7.41 |
Hypothetical (assuming a 5% return
before expenses): | | | |
| Class A Shares | $1,000 | $1,016.12 | $8.75 |
| Class B Shares | $1,000 | $1,012.40 | $12.47 |
| Class C Shares | $1,000 | $1,012.40 | $12.47 |
| Institutional Shares | $1,000 | $1,017.36 | $7.50 |
| 1 | Expenses are equal to the Fund's annualized net expense ratios, multiplied by the average account value over the period, multiplied by 181/365 (to reflect the one-half-year period). The annualized net expense ratios are as follows: |
| | |
| Class A Shares | 1.75% |
| Class B Shares | 2.50% |
| Class C Shares | 2.50% |
| Institutional Shares | 1.50% |
Annual Shareholder Report
Board of Trustees and Trust Officers
The Board of Trustees is responsible for managing the Trust's business affairs and for exercising all the Trust's powers except those reserved for the shareholders. The following tables give information about each Trustee and the senior officers of the Fund. Where required, the tables separately list Trustees who are “interested persons” of the Fund (i.e., “Interested” Trustees) and those who are not (i.e., “Independent” Trustees). Unless otherwise noted, the address of each person listed is Federated Investors Tower, 1001 Liberty Avenue, Pittsburgh, PA 15222. The address of all Independent Trustees listed is 4000 Ericsson Drive, Warrendale, PA 15086-7561; Attention: Mutual Fund Board. As of December 31, 2013, the Trust comprised five portfolio(s), and the Federated Fund Family consisted of 42 investment companies (comprising 135 portfolios). Unless otherwise noted, each Officer is elected annually. Unless otherwise noted, each Trustee oversees all portfolios in the Federated Fund Family and serves for an indefinite term. The Fund's Statement of Additional Information includes additional information about Trust Trustees and is available, without charge and upon request, by calling 1-800-341-7400.
Interested TRUSTEES Background
Name
Birth Date
Positions Held with Trust
Date Service Began | Principal Occupation(s) for Past Five Years,
Other Directorships Held and Previous Position(s) |
John F. Donahue*
Birth Date: July 28, 1924
Trustee
Began serving: June 2006 | Principal Occupations: Director or Trustee of the Federated Fund Family; Chairman and Director, Federated Investors, Inc.; Chairman of the Federated Fund Family's Executive Committee.
Previous Positions: Chairman of the Federated Fund Family; Trustee, Federated Investment Management Company; Chairman and Director, Federated Investment Counseling. |
J. Christopher Donahue*
Birth Date: April 11, 1949
President and Trustee
Began serving: June 2006 | Principal Occupations: Principal Executive Officer and President of certain of the Funds in the Federated Fund Family; Director or Trustee of the Funds in the Federated Fund Family; President, Chief Executive Officer and Director, Federated Investors, Inc.; Chairman and Trustee, Federated Investment Management Company; Trustee, Federated Investment Counseling; Chairman and Director, Federated Global Investment Management Corp.; Chairman, Federated Equity Management Company of Pennsylvania and Passport Research, Ltd. (investment advisory subsidiary of Federated); Trustee, Federated Shareholder Services Company; Director, Federated Services Company.
Previous Positions: President, Federated Investment Counseling; President and Chief Executive Officer, Federated Investment Management Company, Federated Global Investment Management Corp. and Passport Research, Ltd. |
| * | Family relationships and reasons for “interested” status: John F. Donahue is the father of J. Christopher Donahue; both are “interested” due to their beneficial ownership of shares of Federated Investors, Inc. and the positions they hold with Federated and its subsidiaries. |
Annual Shareholder Report
INDEPENDENT TRUSTEES Background
Name
Birth Date
Positions Held with Trust
Date Service Began | Principal Occupation(s) for Past Five Years,
Other Directorships Held, Previous Position(s) and Qualifications |
John T. Collins
Birth Date: January 24, 1947
Trustee
Began serving: October 2013 | Principal Occupations: Director or Trustee of the Federated Fund Family; Chairman and CEO, The Collins Group, Inc. (a private equity firm).
Other Directorships Held: Chairman Emeriti, Bentley University; Director, Sterling Suffolk Downs, Inc.; Former Director, National Association of Printers and Lithographers.
Previous Positions: Director and Audit Committee Member, Bank of America Corp.
Qualifications: Business management and director experience. |
Maureen Lally-Green
Birth Date: July 5, 1949
Trustee
Began serving: August 2009 | Principal Occupations: Director or Trustee of the Federated Fund Family; Associate General Secretary and Director, Office for Church Relations, Diocese of Pittsburgh; Adjunct Professor of Law, Duquesne University School of Law; Superior Court of Pennsylvania (service began 1998 and ended July 2009).
Other Directorships Held: Director, Consol Energy (service started June 2013); Director, Auberle (service ended December 2013); Member, Pennsylvania State Board of Education; Director, Saint Vincent College; Director, Ireland Institute of Pittsburgh (service ended December 2013); Director and Chair, UPMC Mercy Hospital; Regent, St. Vincent Seminary; Director, Epilepsy Foundation of Western and Central Pennsylvania; Director, Saint Thomas More Society (service ended December 2013); Director, Our Campaign for the Church Alive!, Inc.; Director, Pennsylvania Bar Institute (2013-present); Director, Cardinal Wuerl North Catholic High School (2013-present).
Previous Position: Professor of Law, Duquesne University School of Law, Pittsburgh (1983-1998).
Qualifications: Legal and director experience. |
Peter E. Madden
Birth Date: March 16, 1942
Trustee
Began serving: June 2006 | Principal Occupation: Director or Trustee, and Chairman of the Board of Directors or Trustees, of the Federated Fund Family.
Previous Positions: Representative, Commonwealth of Massachusetts General Court; President, Chief Operating Officer and Director, State Street Bank and Trust Company and State Street Corporation (retired); Director, VISA USA and VISA International; Chairman and Director, Massachusetts Bankers Association; Director, Depository Trust Corporation; Director, The Boston Stock Exchange.
Qualifications: Business management, mutual fund services and director experience. |
Annual Shareholder Report
Name
Birth Date
Positions Held with Trust
Date Service Began | Principal Occupation(s) for Past Five Years,
Other Directorships Held, Previous Position(s) and Qualifications |
Charles F. Mansfield, Jr.
Birth Date: April 10, 1945
Trustee
Began serving: June 2006 | Principal Occupations: Director or Trustee of the Federated Fund Family; Management Consultant.
Previous Positions: Chief Executive Officer, PBTC International Bank; Partner, Arthur Young & Company (now Ernst & Young LLP); Chief Financial Officer of Retail Banking Sector, Chase Manhattan Bank; Senior Vice President, HSBC Bank USA (formerly Marine Midland Bank); Vice President, Citibank; Assistant Professor of Banking and Finance, Frank G. Zarb School of Business, Hofstra University; Executive Vice President, DVC Group, Inc. (marketing, communications and technology).
Qualifications: Banking, business management, education and director experience. |
Thomas M. O'Neill
Birth Date: June 14, 1951
Trustee
Began serving: October 2006 | Principal Occupations: Director or Trustee, Vice Chairman of the Audit Committee of the Federated Fund Family; Sole Proprietor, Navigator Management Company (investment and strategic consulting).
Other Directorships Held: Board of Overseers, Children's Hospital of Boston; Visiting Committee on Athletics, Harvard College; Board of Directors, Medicines for Humanity; Board of Directors, The Golisano Children's Museum of Naples, Florida.
Previous Positions: Chief Executive Officer and President, Managing Director and Chief Investment Officer, Fleet Investment Advisors; President and Chief Executive Officer, Aeltus Investment Management, Inc.; General Partner, Hellman, Jordan Management Co., Boston, MA; Chief Investment Officer, The Putnam Companies, Boston, MA; Credit Analyst and Lending Officer, Fleet Bank; Director and Consultant, EZE Castle Software (investment order management software); Director, Midway Pacific (lumber).
Qualifications: Business management, mutual fund, director and investment experience. |
P. Jerome Richey
Birth Date: February 23, 1949
Trustee
Began serving: October 2013 | Principal Occupations: Director or Trustee of the Federated Fund Family; General Counsel, University of Pittsburgh.
Other Directorships Held: Board Chairman, Epilepsy Foundation of Western Pennsylvania; Board Member, World Affairs Council of Pittsburgh.
Previous Positions: Chief Legal Officer and Executive Vice President, CONSOL Energy Inc.; Shareholder, Buchanan Ingersoll & Rooney PC (a law firm).
Qualifications: Business management, legal and director experience. |
Annual Shareholder Report
Name
Birth Date
Positions Held with Trust
Date Service Began | Principal Occupation(s) for Past Five Years,
Other Directorships Held, Previous Position(s) and Qualifications |
John S. Walsh
Birth Date: November 28, 1957
Trustee
Began serving: June 2006 | Principal Occupations: Director or Trustee, Chairman of the Audit Committee of the Federated Fund Family; President and Director, Heat Wagon, Inc. (manufacturer of construction temporary heaters); President and Director, Manufacturers Products, Inc. (distributor of portable construction heaters); President, Portable Heater Parts, a division of Manufacturers Products, Inc.
Previous Position: Vice President, Walsh & Kelly, Inc.
Qualifications: Business management and director experience. |
OFFICERS
Name
Birth Date
Address
Positions Held with Trust
Date Service Began | Principal Occupation(s) for Past Five Years
and Previous Position(s) |
John W. McGonigle
Birth Date: October 26, 1938
Secretary
Officer since: May 2006 | Principal Occupations: Executive Vice President and Secretary of the Federated Fund Family; Vice Chairman, Executive Vice President, Secretary and Director, Federated Investors, Inc.
Previous Positions: Trustee, Federated Investment Management Company and Federated Investment Counseling; Director, Federated Global Investment Management Corp., Federated Services Company and Federated Securities Corp. |
Lori A. Hensler
Birth Date: January 6, 1967
TREASURER
Officer since: April 2013 | Principal Occupations: Principal Financial Officer and Treasurer of the Federated Fund Family; Senior Vice President, Federated Administrative Services; Financial and Operations Principal for Federated Securities Corp. and Edgewood Services, Inc.; and Assistant Treasurer, Federated Investors Trust Company. Ms. Hensler has received the Certified Public Accountant designation.
Previous Positions: Controller of Federated Investors, Inc.; Senior Vice President and Assistant Treasurer, Federated Investors Management Company; Treasurer, Federated Investors Trust Company; Assistant Treasurer, Federated Administrative Services, Federated Administrative Services, Inc., Federated Securities Corp., Edgewood Services, Inc., Federated Advisory Services Company, Federated Equity Management Company of Pennsylvania, Federated Global Investment Management Corp., Federated Investment Counseling, Federated Investment Management Company, Passport Research, Ltd., and Federated MDTA, LLC; Financial and Operations Principal for Federated Securities Corp., Edgewood Services, Inc. and Southpointe Distribution Services, Inc. |
Annual Shareholder Report
Name
Birth Date
Address
Positions Held with Trust
Date Service Began | Principal Occupation(s) for Past Five Years
and Previous Position(s) |
Peter J. Germain
Birth Date: September 3, 1959
CHIEF LEGAL OFFICER
Officer since: June 2006 | Principal Occupations: Mr. Germain is Chief Legal Officer of the Federated Fund Family. He is General Counsel and Vice President, Federated Investors, Inc.; President, Federated Administrative Services and Federated Administrative Services, Inc.; Vice President, Federated Securities Corp.; Secretary, Federated Private Asset Management, Inc.; and Secretary, Retirement Plan Service Company of America. Mr. Germain joined Federated in 1984 and is a member of the Pennsylvania Bar Association.
Previous Positions: Deputy General Counsel, Special Counsel, Managing Director of Mutual Fund Services, Federated Investors, Inc.; Senior Vice President, Federated Services Company; and Senior Corporate Counsel, Federated Investors, Inc. |
Brian P. Bouda
Birth Date: February 28, 1947
CHIEF COMPLIANCE OFFICER AND SENIOR VICE PRESIDENT
Officer since: June 2006 | Principal Occupations: Senior Vice President and Chief Compliance Officer of the Federated Fund Family; Vice President and Chief Compliance Officer of Federated Investors, Inc. and Chief Compliance Officer of certain of its subsidiaries. Mr. Bouda joined Federated in 1999 and is a member of the American Bar Association and the State Bar Association of Wisconsin.
Previous Positions: Served in Senior Management positions with a large regional banking organization. |
Stephen F. Auth
Birth Date: September 3, 1956
450 Lexington Avenue
Suite 3700
New York, NY 10017-3943
CHIEF INVESTMENT OFFICER
Officer since: June 2012 | Principal Occupations: Stephen F. Auth is Chief Investment Officer of various Funds in the Federated Fund Family; Executive Vice President, Federated Investment Counseling, Federated Global Investment Management Corp. and Federated Equity Management Company of Pennsylvania.
Previous Positions: Executive Vice President, Federated Investment Management Company and Passport Research, Ltd. (investment advisory subsidiary of Federated); Senior Vice President, Global Portfolio Management Services Division; Senior Vice President, Federated Investment Management Company and Passport Research, Ltd.; Senior Managing Director and Portfolio Manager, Prudential Investments. |
Daniel Mahr
Birth Date: April 9, 1981
125 High Street
Oliver Tower
21st Floor
Boston, MA 02110-2704
Vice President
Officer since: June 2012
Portfolio Manager since:
August 2008 | Principal Occupations: Daniel Mahr has been the Fund's Portfolio Manager since August 2008. Mr. Mahr joined the MDT Advisers Investment Team in 2002. As Managing Director, Research, he is responsible for leading the Investment Team as it relates to the ongoing design, development and implementation of the Optimum Q Process. He is Vice President of the Trust with respect to the Fund. Mr. Mahr received his A.B., Computer Science from Harvard College and his S.M., Computer Science from Harvard University. |
Annual Shareholder Report
Evaluation and Approval of Advisory Contract–May 2014
Federated MDT Small Cap Growth Fund (the “Fund”)
Following a review and recommendation of approval by the Fund's independent trustees, the Fund's Board reviewed and approved at its May 2014 meetings the Fund's investment advisory contract for an additional one-year term. The Board's decision regarding the contract reflects the exercise of its business judgment on whether to continue the existing arrangements.
In this connection, the Federated Funds' Board had previously appointed a Senior Officer, whose duties include specified responsibilities relating to the process by which advisory fees are to be charged to a Federated fund. The Senior Officer has the authority to retain consultants, experts, or staff as may be reasonably necessary to assist in the performance of his duties, reports directly to the Board, and may be terminated only with the approval of a majority of the independent members of the Board. The Senior Officer prepared and furnished to the Board an independent, written evaluation that covered topics discussed below (the “Evaluation”). The Board considered that Evaluation, along with other information, in deciding to approve the advisory contract.
The Board is also familiar with and considered judicial decisions concerning allegedly excessive investment advisory fees, which have indicated that the following factors may be relevant to an Adviser's fiduciary duty with respect to its receipt of compensation from a fund: the nature and quality of the services provided by the Adviser to a fund and its shareholders, including the performance and expenses of the fund and of comparable funds; the Adviser's cost of providing the services, including the profitability to the Adviser of providing advisory services to a fund; the extent to which the Adviser may realize “economies of scale” as a fund grows larger and, if such economies exist, whether they have been shared with a fund and its shareholders or the family of funds; any “fall-out financial benefits” that accrue to the Adviser because of its relationship with a fund (including research services received from brokers that execute fund trades and any fees paid to affiliates of the Adviser for services rendered to a fund); comparative fee structures, including a comparison of fees paid to the Adviser with those paid by similar funds; and the extent of care, conscientiousness and independence with which the Board members perform their duties and their expertise, including whether they are fully informed about all facts the Board deems relevant to its consideration of the Adviser's services and fees. The Board noted that SEC disclosure requirements regarding the basis for the Board's approval of the Fund's advisory contract generally track the factors listed above. Consistent with these judicial decisions and SEC disclosure requirements, the Board also considered management fees charged to
Annual Shareholder Report
institutional and other clients of the Adviser for what might be viewed as like services. The Board was aware of these factors and was guided by them in its review of the Fund's advisory contract to the extent it considered them to be appropriate and relevant, as discussed further below.
The Board considered and weighed these circumstances in light of its substantial accumulated experience in governing the Fund and working with Federated on matters relating to the Federated funds, and was assisted in its deliberations by independent legal counsel. Throughout the year, and in connection with its May meetings, the Board requested and received substantial and detailed information about the Fund and the Federated organization that was in addition to the extensive materials that comprise and accompany the Senior Officer's Evaluation. Federated provided much of this information at each regular meeting of the Board, and furnished additional substantial information in connection with the May meeting at which the Board's formal review of the advisory contract occurred. At this May meeting, senior management of the Adviser also met with the independent trustees and their counsel to discuss the materials presented and any other matters thought relevant by the Adviser or the trustees. Between regularly scheduled meetings, the Board also received information on particular matters as the need arose. Thus, the Board's consideration of the advisory contract included review of the Senior Officer's Evaluation, accompanying data and additional information covering such matters as: the Adviser's investment philosophy, revenue, profitability, personnel and processes; investment and operating strategies; the Fund's short- and long-term performance (in absolute terms, both on a gross basis and net of expenses, as well as in relationship to its particular investment program and certain competitor or “peer group” funds and/or other benchmarks, as appropriate), and comments on the reasons for performance; the Fund's investment objectives; the Fund's expenses (including the advisory fee itself and the overall expense structure of the Fund, both in absolute terms and relative to similar and/or competing funds, with due regard for contractual or voluntary expense limitations); the use and allocation of brokerage commissions derived from trading the Fund's portfolio securities (if any); and the nature, quality and extent of the advisory and other services provided to the Fund by the Adviser and its affiliates. The Board also considered the preferences and expectations of Fund shareholders; the entrepreneurial risk assumed by the Adviser in sponsoring the funds; the continuing state of competition in the mutual fund industry and market practices; the range of comparable fees for similar funds in the mutual fund industry; the Fund's relationship to the Federated family of funds which include a comprehensive array of funds with different investment objectives, policies and strategies which are available for exchange without the incurrence of additional sales charges; compliance and audit reports concerning the Federated funds and the Federated companies that service them (including communications from regulatory agencies), as well as Federated's responses to any issues raised therein; and relevant developments in
Annual Shareholder Report
the mutual fund industry and how the Federated funds and/or Federated are responding to them. The Board's evaluation process is evolutionary. The criteria considered and the emphasis placed on relevant criteria change in recognition of changing circumstances in the mutual fund marketplace.
While mindful that courts have cautioned against giving such comparisons too much weight, the Board has found the use of comparisons of the Fund's fees and expenses to other mutual funds with comparable investment programs to be relevant. In this regard, the Board was presented with, and considered, information regarding the contractual advisory fee rates, net advisory fee rates and total expense ratios relative to a fund's peers. The Board focused on comparisons with other similar mutual funds more heavily than non-mutual fund products or services because it is believed that they are more relevant. For example, other mutual funds are the products most like the Fund, they are readily available to Fund shareholders as alternative investment vehicles, and they are the type of investment vehicle in fact chosen and maintained by the Fund's investors. The range of their fees and expenses therefore appears to be a relevant indicator of what consumers have found to be reasonable in the precise marketplace in which the Fund competes.
The Board reviewed the contractual advisory fee rate, net advisory fee rate where partially waived and other expenses of the Fund and noted the position of the Fund's fee rates relative to its peers. In this regard, the Board noted that the contractual advisory fee rate was above the median of the relevant peer group, but the Board noted the applicable waivers and reimbursements and that the overall expense structure of the Fund remained competitive. In this regard, the Board had been previously advised that, while comparisons to fund peer groups are relevant in judging the reasonableness of advisory fees, the Fund's quantitative focus makes fee and expense comparisons particularly difficult. Although the Fund's advisory fee was above the median of the peer range, the peer group of funds varied widely in their complexity, and the management of the Fund is among the more complex relative to its peers. The Board will continue to monitor advisory fees and other expenses borne by the Fund.
By contrast, the Senior Officer has reviewed Federated's fees for providing advisory services to products outside the Federated family of funds (e.g., institutional and separate accounts and sub-adviser services). He concluded that mutual funds and institutional accounts are inherently different products. Those differences include, but are not limited to, different types of targeted investors; being subject to different laws and regulations; different legal structures; different average account sizes and portfolio management techniques made necessary by different cash flows and different associated costs; and the time spent by portfolio managers and their teams, funds financial services, legal, compliance and risk management in reviewing securities pricing, addressing different administrative responsibilities, addressing different degrees of risk associated with management and a variety of different costs. The Senior Officer
Annual Shareholder Report
did not consider these fee schedules to be determinative in judging the appropriateness of mutual fund advisory fees. The Senior Officer noted that the services, administrative responsibilities and risks associated with such relationships is quite different than serving as a primary adviser to a fund.
The Fund's ability to deliver competitive performance when compared to its peer group was also deemed to be relevant by the Board as a useful indicator of how the Adviser is executing the Fund's investment program, which in turn was one of the Board's considerations in reaching a conclusion that the nature, extent, and quality of the Adviser's investment management services were such as to warrant continuation of the advisory contract.
The Senior Officer reviewed information compiled by Federated, using data supplied by independent fund ranking organizations, regarding the performance of, and fees charged by, other mutual funds, noting his view that comparisons to fund peer groups may be helpful, though not conclusive, in judging the reasonableness of proposed fees. The Board considered, in evaluating such comparisons, that in some cases individual funds may exhibit significant and unique differences in their objectives and management techniques when compared to other funds within an industry peer group, and that the Senior Officer had specifically noted that the Fund's quantitative investment program is of such a type.
For the periods covered by the Evaluation, the Fund's performance for the one-year period was at the median of the relevant peer group, the Fund's performance for the three-year period was above the median of the relevant peer group and the Fund's performance fell below the median of the relevant peer group for the five-year period. In addition, the Board was informed by the Adviser that, for the same periods, the Fund underperformed its benchmark index for the one-year period, outperformed its benchmark index for the three-year period and underperformed its benchmark index for the five-year period. The Board discussed the Fund's performance with the Adviser and recognized the efforts being undertaken by the Adviser. The Board will continue to monitor these efforts and the performance of the Fund in the context of the other factors considered relevant by the Board.
The Board also received financial information about Federated, including information regarding the compensation and benefits Federated derived from its relationships with the Federated funds. This information covered not only the fees under the advisory contracts, but also fees received by Federated's subsidiaries for providing other services to the Federated funds under separate contracts (e.g., for serving as the Federated funds' administrator). The information also detailed any indirect benefit Federated may derive from its receipt of research services from brokers who execute Federated fund trades. In addition, the Board considered the fact that, in order for a fund to be competitive in the marketplace, Federated and its affiliates frequently waived fees and/or reimbursed expenses and have disclosed to fund investors and/or indicated to the Board their intention to do so in the future, where appropriate.
Annual Shareholder Report
Moreover, the Board receives regular reporting as to the institution, adjustment or elimination of these voluntary waivers. In addition, following discussions regarding the Senior Officer's May 2013 recommendations, Federated made meaningful reductions to gross advisory fees for several funds. At the Board meeting in May 2014, the Senior Officer proposed, and the Board approved, reductions in the contractual advisory fees of certain other funds.
Federated furnished information, requested by the Senior Officer, that reported revenues on a fund-by-fund basis and made estimates of the allocation of expenses on a fund-by-fund basis, using allocation methodologies specified by the Senior Officer. The Senior Officer noted that, while these cost allocation reports apply consistent allocation processes, the inherent difficulties in allocating costs continues to cause the Senior Officer to question the precision of the process and to conclude that such reports may be unreliable, since a single change in an allocation estimate may dramatically alter the resulting estimate of cost and/or profitability of a fund and may produce unintended consequences. The allocation information, including the Senior Officer's view that fund-by-fund estimations may be unreliable, was considered in the analysis by the Board.
The Board and the Senior Officer also reviewed information compiled by Federated comparing profitability information for Federated to other publicly held fund management companies. In this regard, the Senior Officer concluded that Federated's profit margins did not appear to be excessive.
The Senior Officer's Evaluation also discussed the notion of possible realization of “economies of scale” as a fund grows larger. The Board considered in this regard that the Adviser has made significant and long-term investments in areas that support all of the Federated family of funds, such as personnel and processes for the portfolio management, shareholder services, compliance, internal audit, and risk management functions; and systems technology; and that the benefits of these efforts (as well as any economies, should they exist) were likely to be enjoyed by the fund family as a whole. Finally, the Board also noted the absence of any applicable regulatory or industry guidelines on this subject, which (as discussed in the Senior Officer's Evaluation) is compounded by the lack of any common industry practice or general pattern with respect to structuring fund advisory fees with “breakpoints” that serve to reduce the fee as the fund attains a certain size.
The Senior Officer noted that, subject to the comments and recommendations made within his Evaluation, his observations and the information accompanying the Evaluation supported a finding by the Board that the management fees for each of the funds were reasonable. Under these circumstances, no changes were recommended to, and no objection was raised to, the continuation of the Fund's advisory contract.
In its decision to continue an existing investment advisory contract, the Board was mindful of the potential disruptions of the Fund's operations and various risks, uncertainties and other effects that could occur as a result of a decision to terminate or not renew an advisory contract. In particular, the Board recognized
Annual Shareholder Report
that many shareholders have invested in the Fund on the strength of the Adviser's industry standing and reputation and with the expectation that the Adviser will have a continuing role in providing advisory services to the Fund. Thus, the Board's approval of the advisory contract reflected the fact that it is the shareholders who have effectively selected the Adviser by virtue of having invested in the Fund. The Board concluded that, in light of the factors discussed above, including the nature, quality and scope of the services provided to the Fund by the Adviser and its affiliates, continuation of the advisory contract was appropriate.
The Board based its decision to approve the advisory contract on the totality of the circumstances and relevant factors and with a view to past and future long-term considerations. Not all of the factors and considerations identified above were necessarily relevant to the Fund, nor did the Board consider any one of them to be determinative. With respect to the factors that were relevant, the Board's decision to approve the contract reflects its determination that Federated's performance and actions provided a satisfactory basis to support the decision to continue the existing arrangements.
Annual Shareholder Report
Voting Proxies on Fund Portfolio Securities
A description of the policies and procedures that the Fund uses to determine how to vote proxies, if any, relating to securities held in the Fund's portfolio is available, without charge and upon request, by calling 1-800-341-7400. A report on “Form N-PX” of how the Fund voted any such proxies during the most recent 12-month period ended June 30 is available via the Proxy Voting Record (Form N-PX) link associated with the Fund and share class name at www.FederatedInvestors.com/FundInformation. Form N-PX filings are also available at the SEC's website at www.sec.gov.
Quarterly Portfolio Schedule
The Fund files with the SEC a complete schedule of its portfolio holdings, as of the close of the first and third quarters of its fiscal year, on “Form N-Q.” These filings are available on the SEC's website at www.sec.gov and may be reviewed and copied at the SEC's Public Reference Room in Washington, DC. (Call 1-800-SEC-0330 for information on the operation of the Public Reference Room.) You may also access this information via the link to the Fund and share class name at www.FederatedInvestors.com/FundInformation.
Annual Shareholder Report
Mutual funds are not bank deposits or obligations, are not guaranteed by any bank and are not insured or guaranteed by the U.S. government, the Federal Deposit Insurance Corporation, the Federal Reserve Board or any other government agency. Investment in mutual funds involves investment risk, including the possible loss of principal.
This Report is authorized for distribution to prospective investors only when preceded or accompanied by the Fund's Prospectus, which contains facts concerning its objective and policies, management fees, expenses and other information.
Federated MDT Small Cap Growth Fund
Federated Investors Funds
4000 Ericsson Drive
Warrendale, PA 15086-7561
Contact us at FederatedInvestors.com
or call 1-800-341-7400.
Federated Securities Corp., Distributor
CUSIP 31421R775
CUSIP 31421R676
CUSIP 31421R767
CUSIP 31421R759
37313 (9/14)
Federated is a registered trademark of Federated Investors, Inc.
2014 ©Federated Investors, Inc.
Item 2. Code of Ethics
(a) As of the end of the period covered by this report, the registrant has adopted a code of ethics (the "Section 406 Standards for Investment Companies - Ethical Standards for Principal Executive and Financial Officers") that applies to the registrant's Principal Executive Officer and Principal Financial Officer; the registrant's Principal Financial Officer also serves as the Principal Accounting Officer.
(c) Not Applicable
(d) Not Applicable
(e) Not Applicable
(f)(3) The registrant hereby undertakes to provide any person, without charge, upon request, a copy of the code of ethics. To request a copy of the code of ethics, contact the registrant at 1-800-341-7400, and ask for a copy of the Section 406 Standards for Investment Companies - Ethical Standards for Principal Executive and Financial Officers.
Item 3. Audit Committee Financial Expert
The registrant's Board has determined that each of the following members of the Board's Audit Committee is an “audit committee financial expert,” and is "independent," for purposes of this Item: Charles F. Mansfield, Jr., Thomas M. O'Neill and John S. Walsh.
Item 4. Principal Accountant Fees and Services
(a) Audit Fees billed to the registrant for the two most recent fiscal years:
Fiscal year ended 2014 - $124,600
Fiscal year ended 2013 – $121,600
(b) Audit-Related Fees billed to the registrant for the two most recent fiscal years:
Fiscal year ended 2014 - $76
Fiscal year ended 2013 – $182
Fiscal year ended 2014- Travel to Audit Committee Meeting.
Fiscal year ended 2013- Travel to Audit Committee Meeting.
Amount requiring approval of the registrant’s audit committee pursuant to paragraph (c)(7)(ii) of Rule 2-01 of Regulation S-X, $0 and $0, respectively.
(c) Tax Fees billed to the registrant for the two most recent fiscal years:
Fiscal year ended 2014 - $0
Fiscal year ended 2013 - $0
Amount requiring approval of the registrant’s audit committee pursuant to paragraph (c)(7)(ii) of Rule 2-01 of Regulation S-X, $0 and $0, respectively.
(d) All Other Fees billed to the registrant for the two most recent fiscal years:
Fiscal year ended 2014 - $0
Fiscal year ended 2013 - $0
Amount requiring approval of the registrant’s audit committee pursuant to paragraph (c)(7)(ii) of Rule 2-01 of Regulation S-X, $21,857 and $12,280, respectively. Fiscal year ended 2014- Service fee for analysis of potential Passive Foreign Investment Company holdings. Fiscal year ended 2013- Service fee for analysis of potential Passive Foreign Investment Company holdings.
(e)(1) Audit Committee Policies regarding Pre-approval of Services.
The Audit Committee is required to pre-approve audit and non-audit services performed by the independent auditor in order to assure that the provision of such services do not impair the auditor’s independence. Unless a type of service to be provided by the independent auditor has received general pre-approval, it will require specific pre-approval by the Audit Committee. Any proposed services exceeding pre-approved cost levels will require specific pre-approval by the Audit Committee.
Certain services have the general pre-approval of the Audit Committee. The term of the general pre-approval is 12 months from the date of pre-approval, unless the Audit Committee specifically provides for a different period. The Audit Committee will annually review the services that may be provided by the independent auditor without obtaining specific pre-approval from the Audit Committee and may grant general pre-approval for such services. The Audit Committee will revise the list of general pre-approved services from time to time, based on subsequent determinations. The Audit Committee will not delegate its responsibilities to pre-approve services performed by the independent auditor to management.
The Audit Committee has delegated pre-approval authority to its Chairman. The Chairman will report any pre-approval decisions to the Audit Committee at its next scheduled meeting. The Committee will designate another member with such pre-approval authority when the Chairman is unavailable.
AUDIT SERVICES
The annual Audit services engagement terms and fees will be subject to the specific pre-approval of the Audit Committee. The Audit Committee must approve any changes in terms, conditions and fees resulting from changes in audit scope, registered investment company (RIC) structure or other matters.
In addition to the annual Audit services engagement specifically approved by the Audit Committee, the Audit Committee may grant general pre-approval for other Audit Services, which are those services that only the independent auditor reasonably can provide. The Audit Committee has pre-approved certain Audit services, all other Audit services must be specifically pre-approved by the Audit Committee.
AUDIT-RELATED SERVICES
Audit-related services are assurance and related services that are reasonably related to the performance of the audit or review of the Company’s financial statements or that are traditionally performed by the independent auditor. The Audit Committee believes that the provision of Audit-related services does not impair the independence of the auditor, and has pre-approved certain Audit-related services, all other Audit-related services must be specifically pre-approved by the Audit Committee.
TAX SERVICES
The Audit Committee believes that the independent auditor can provide Tax services to the Company such as tax compliance, tax planning and tax advice without impairing the auditor’s independence. However, the Audit Committee will not permit the retention of the independent auditor in connection with a transaction initially recommended by the independent auditor, the purpose of which may be tax avoidance and the tax treatment of which may not be supported in the Internal Revenue Code and related regulations. The Audit Committee has pre-approved certain Tax services, all Tax services involving large and complex transactions must be specifically pre-approved by the Audit Committee.
ALL OTHER SERVICES
With respect to the provision of services other than audit, review or attest services the pre-approval requirement is waived if:
| (1) | The aggregate amount of all such services provided constitutes no more than five percent of the total amount of revenues paid by the registrant, the registrant’s adviser (not including any sub-adviser whose role is primarily portfolio management and is subcontracted with or overseen by another investment adviser), and any entity controlling, controlled by, or under common control with the investment adviser that provides ongoing services to the registrant to its accountant during the fiscal year in which the services are provided; |
| (2) | Such services were not recognized by the registrant, the registrant’s adviser (not including any sub-adviser whose role is primarily portfolio management and is subcontracted with or overseen by another investment adviser), and any entity controlling, controlled by, or under common control with the investment adviser that provides ongoing services to the registrant at the time of the engagement to be non-audit services; and |
| (3) | Such services are promptly brought to the attention of the Audit Committee of the issuer and approved prior to the completion of the audit by the Audit Committee or by one or more members of the Audit Committee who are members of the board of directors to whom authority to grant such approvals has been delegated by the Audit Committee. |
The Audit Committee may grant general pre-approval to those permissible non-audit services classified as All Other services that it believes are routine and recurring services, and would not impair the independence of the auditor.
The SEC’s rules and relevant guidance should be consulted to determine the precise definitions of prohibited non-audit services and the applicability of exceptions to certain of the prohibitions.
PRE-APPROVAL FEE LEVELS
Pre-approval fee levels for all services to be provided by the independent auditor will be established annually by the Audit Committee. Any proposed services exceeding these levels will require specific pre-approval by the Audit Committee.
PROCEDURES
Requests or applications to provide services that require specific approval by the Audit Committee will be submitted to the Audit Committee by both the independent auditor and the Principal Accounting Officer and/or Internal Auditor, and must include a joint statement as to whether, in their view, the request or application is consistent with the SEC’s rules on auditor independence.
(e)(2) Percentage of services identified in items 4(b) through 4(d) that were approved by the registrants audit committee pursuant to paragraph (c)(7)(i)(C) of Rule 2-01 of Regulation S-X:
4(b)
Fiscal year ended 2014 – 0%
Fiscal year ended 2013 – 0%
Percentage of services provided to the registrants investment adviser and any entity controlling, controlled by, or under common control with the investment adviser that provides ongoing services to the registrant that were approved by the registrants audit committee pursuant to paragraph (c)(7)(i)(C) of Rule 2-01 of Regulation S-X, 0% and 0% respectively.
4(c)
Fiscal year ended 2014 – 0%
Fiscal year ended 2013 – 0%
Percentage of services provided to the registrants investment adviser and any entity controlling, controlled by, or under common control with the investment adviser that provides ongoing services to the registrant that were approved by the registrants audit committee pursuant to paragraph (c)(7)(i)(C) of Rule 2-01 of Regulation S-X, 0% and 0% respectively.
4(d)
Fiscal year ended 2014 – 0%
Fiscal year ended 2013 – 0%
Percentage of services provided to the registrants investment adviser and any entity controlling, controlled by, or under common control with the investment adviser that provides ongoing services to the registrant that were approved by the registrants audit committee pursuant to paragraph (c)(7)(i)(C) of Rule 2-01 of Regulation S-X, 0% and 0% respectively.
| (g) | Non-Audit Fees billed to the registrant, the registrant’s investment adviser, and certain entities controlling, controlled by or under common control with the investment adviser: |
Fiscal year ended 2014 - $91,770
Fiscal year ended 2013 - $126,877
(h) The registrant’s Audit Committee has considered that the provision of non-audit services that were rendered to the registrant’s adviser (not including any sub-adviser whose role is primarily portfolio management and is subcontracted with or overseen by another investment adviser), and any entity controlling, controlled by, or under common control with the investment adviser that provides ongoing services to the registrant that were not pre-approved pursuant to paragraph (c)(7)(ii) of Rule 2-01 of Regulation S-X is compatible with maintaining the principal accountant’s independence.
Item 5. Audit Committee of Listed Registrants
Not Applicable
Item 6. Schedule of Investments
(a) The registrant’s Schedule of Investments is included as part of the Report to Stockholders filed under Item 1 of this form.
(b) Not Applicable; Fund had no divestments during the reporting period covered since the previous Form N-CSR filing.
Item 7. Disclosure of Proxy Voting Policies and Procedures for Closed-End Management Investment Companies
Item 8. Portfolio Managers of Closed-End Management Investment Companies
Item 9. Purchases of Equity Securities by Closed-End Management Investment Company and Affiliated Purchasers
Item 10. Submission of Matters to a Vote of Security Holders
No Changes to Report
Item 11. Controls and Procedures
(a) The registrant’s President and Treasurer have concluded that the
registrant’s disclosure controls and procedures (as defined in rule 30a-3(c) under the Act) are effective in design and operation and are sufficient to form the basis of the certifications required by Rule 30a-(2) under the Act, based on their evaluation of these disclosure controls and procedures within 90 days of the filing date of this report on Form N-CSR.
(b) There were no changes in the registrant’s internal control over financial reporting (as defined in rule 30a-3(d) under the Act) during the second fiscal quarter of the period covered by this report that have materially affected, or are reasonably likely to materially affect, the registrant’s internal control over financial reporting.
Item 12. Exhibits
(a)(1) Code of Ethics- Not Applicable to this Report.
(a)(2) Certifications of Principal Executive Officer and Principal Financial Officer.
(a)(3) Not Applicable.
(b) Certifications pursuant to 18 U.S.C. Section 1350.
SIGNATURES
Pursuant to the requirements of the Securities Exchange Act of 1934 and the Investment Company Act of 1940, the registrant has duly caused this report to be signed on its behalf by the undersigned, thereunto duly authorized.
Registrant Federated MDT Series
By /S/ Lori A. Hensler
Lori A. Hensler, Principal Financial Officer
Date September 22, 2014
Pursuant to the requirements of the Securities Exchange Act of 1934 and the Investment Company Act of 1940, this report has been signed below by the following persons on behalf of the registrant and in the capacities and on the dates indicated.
By /S/ J. Christopher Donahue
J. Christopher Donahue, Principal Executive Officer
Date September 22, 2014
By /S/ Lori A. Hensler
Lori A. Hensler, Principal Financial Officer
Date September 22, 2014