United States
Securities and Exchange Commission
Washington, D.C. 20549
Form N-CSR
Certified Shareholder Report of Registered Management Investment Companies
811-21904
(Investment Company Act File Number)
Federated MDT Series
_______________________________________________________________
(Exact Name of Registrant as Specified in Charter)
Federated Investors Funds
4000 Ericsson Drive
Warrendale, Pennsylvania 15086-7561
(Address of Principal Executive Offices)
(412) 288-1900
(Registrant's Telephone Number)
John W. McGonigle, Esquire
Federated Investors Tower
1001 Liberty Avenue
Pittsburgh, Pennsylvania 15222-3779
(Name and Address of Agent for Service)
(Notices should be sent to the Agent for Service)
Date of Fiscal Year End: 07/31/16
Date of Reporting Period: 07/31/16
Item 1. Reports to Stockholders

Annual Shareholder Report
July 31, 2016
| Share Class | Ticker |
| A | QAACX |
| C | QCACX |
| Institutional | QIACX |
| R6* | QKACX |
*formerly, Class R Shares
Federated MDT All Cap Core Fund
Fund Established 2002
A Portfolio of Federated MDT Series
Dear Valued Shareholder,
I am pleased to present the Annual Shareholder Report for your fund covering the period from August 1, 2015 through July 31, 2016. This report includes Management's Discussion of Fund Performance, a complete listing of your fund's holdings, performance information and financial statements along with other important fund information.
In addition, our website, FederatedInvestors.com, offers easy access to Federated resources that include timely fund updates, economic and market insights from our investment strategists, and financial planning tools. We invite you to register to take full advantage of its capabilities.
Thank you for investing with Federated. I hope you find this information useful and look forward to keeping you informed.
Sincerely,
J. Christopher Donahue, President
Not FDIC Insured • May Lose Value • No Bank Guarantee
CONTENTS
| 1 |
| 6 |
| 8 |
| 17 |
| 21 |
| 23 |
| 24 |
| 25 |
| 34 |
| 35 |
| 37 |
| 43 |
| 50 |
| 50 |
Management's Discussion of Fund Performance (unaudited)
The total return of Federated MDT All Cap Core Fund (the “Fund”), based on net asset value for the 12-month reporting period ended July 31, 2016, was -0.61% for Class A Shares, -1.43% for Class C Shares, -1.05% for Class R Shares and -0.34% for Institutional Shares. The total return for the Russell 3000® Index (R3000),1 the Fund's broad-based securities market index, was 4.44% for the same period. The total return of the Morningstar Large Blend Funds Average (MLBFA),2 a peer group average for the Fund, was 1.94% during the same period. The Fund's and MLBFA's total returns for the most recently completed fiscal year reflected actual cash flows, transaction costs and other expenses, which were not reflected in the total return of the R3000.
During the reporting period, the Fund's investment strategy focused on stock selection. This was the most significant factor affecting the Fund's performance relative to the R3000 during the period.
The following discussion will focus on the performance of the Fund's Institutional Shares.
Market Overview
During the reporting period, domestic equity market performance was moderate as evidenced by the 4.44% return on the R3000. Large-cap stocks led the way with the Russell Top 200® Index3 returning 5.04%, closely followed by mid-cap stocks with a 4.37% return on the Russell Midcap® Index.4 Small-cap stocks5 were neutral with the Russell 2000® Index6 returning 0.00%. The lowest returning stocks were microcaps, with the Russell Microcap® Index7 returning -4.40%. Value stocks outperformed growth stocks during the reporting period with the Russell 3000® Value Index8 returning 5.39%, compared to 3.57% for the Russell 3000® Growth Index.9 The widest spread was in the Russell Microcap® Index, where the Microcap® Value Index10 returned 1.78% while the Microcap® Growth Index11 returned -12.38%. During the reporting period, less volatile stocks generally outperformed more volatile stocks and high dividend stocks outperformed stocks with lower dividends.
The best performing sectors in the R3000 during the reporting period were Telecommunication Services (24.98%), Utilities (23.65%) and Consumer Staples (11.32%). Underperforming sectors during the same period included Health Care (-2.71%), Energy (-1.47%) and Financials (-1.32%).
Annual Shareholder Report
STOCK SELECTION
When looking at the strategy from the point of view of fundamental characteristics, the Fund's underperformance during the reporting period was driven by overweighting stocks with high earnings-to-price ratios and improving earnings estimates. These stocks have favorable value and growth characteristics and typically outperform the benchmark significantly, but they underperformed during most of the Fund's fiscal year. A partial offset to underperformance came from stocks with high structural earnings, but negative conviction from sell-side analysts. The Fund's sector exposures continued to remain close to R3000 weights, but with a small overweight in Consumer Discretionary. Weak stock selection in the Consumer Discretionary and Energy sectors contributed the most to the Fund's underperformance. Favorable stock selection in the Information Technology sector provided a partial offset.
Individual stocks enhancing the Fund's performance during the reporting period included Computer Sciences Company, Joy Global Incorporated and Baxter International Incorporated.
Individual stocks detracting from the Fund's performance during the reporting period included Marathon Petroleum Corporation, Microsoft Corporation and Gilead Sciences Incorporated. Microsoft outperformed the R3000 but was underweighted relative to the R3000.
| 1 | Please see the footnotes to the line graphs below for definitions of, and further information about, the Russell 3000® Index. |
| 2 | Morningstar has assigned the Fund to the Morningstar Large Cap Value Funds Average peer group, however, the MLBFA is being used for comparison purposes. The Fund invests in both value and growth stocks and therefore the Fund's Adviser believes that the MLBFA is more reflective of the Fund's investment style. Please see the footnotes to the line graphs below for definitions of, and further information about, the MLBFA. |
| 3 | The Russell Top 200® Index measures the performance of the largest cap segment of the U.S. equity universe. The Russell Top 200® Index is a subset of the Russell 3000® Index. It includes approximately 200 of the largest securities based on a combination of their market cap and current index membership and represents approximately 68% of the U.S. market. The Russell Top 200® Index is constructed to provide a comprehensive and unbiased barometer for this very large cap segment and is completely reconstituted annually to ensure new and growing equities are reflected. The Russell Top 200 Index is unmanaged, and it is not possible to invest directly in an index. |
| 4 | The Russell Midcap® Index measures the performance of the mid-cap segment of the U.S. equity universe. The Russell Midcap® Index is a subset of the Russell 1000® Index. It includes approximately 800 of the smallest securities based on a combination of their market cap and current index membership. The Russell Midcap® Index represents approximately 31% of the total market capitalization of the Russell 1000® companies. The Russell Midcap® Index is constructed to provide a comprehensive and unbiased barometer for the mid-cap segment. The Russell Midcap Index is completely reconstituted annually to ensure larger stocks do not distort the performance and characteristics of the true mid-cap opportunity set. The Russell Midcap Index is unmanaged, and it is not possible to invest directly in an index. |
Annual Shareholder Report
| 5 | Small-cap stocks may be less liquid and subject to greater price volatility than large-cap stocks. |
| 6 | The Russell 2000® Index measures the performance of the small-cap segment of the U.S. equity universe. The Russell 2000® Index is a subset of the Russell 3000® Index representing approximately 10% of the total market capitalization of that index. It includes approximately 2000 of the smallest securities based on a combination of their market cap and current index membership. The Russell 2000® Index is constructed to provide a comprehensive and unbiased small-cap barometer and is completely reconstituted annually to ensure larger stocks do not distort the performance and characteristics of the true small-cap opportunity set. The Russell 2000 Index is unmanaged, and it is not possible to invest directly in an index. |
| 7 | The Russell Microcap® Index measures the performance of the microcap segment of the U.S. equity market. Microcap stocks make up less than 3% of the U.S. equity market (by market cap) and consist of the smallest 1,000 securities in the small-cap Russell 2000® Index, plus the next 1,000 smallest eligible securities by market cap. The Russell Microcap® Index is constructed to provide a comprehensive and unbiased barometer for the microcap segment trading on national exchanges and is completely reconstituted annually to ensure new and growing equities are reflected and companies continue to reflect appropriate capitalization and value characteristics. The Russell Microcap® Index is unmanaged, and it is not possible to invest directly in an index. |
| 8 | The Russell 3000® Value Index measures the performance of the broad value segment of the U.S. equity value universe. It includes those Russell 3000® Index companies with lower price-to-book ratios and lower forecasted growth values. The Russell 3000® Value Index is constructed to provide a comprehensive, unbiased and stable barometer of the broad value market. The Russell 3000® Value Index is completely reconstituted annually to ensure new and growing equities are included and that the represented companies continue to reflect value characteristics. The index is unmanaged, and it is not possible to invest directly in an index. |
| 9 | The Russell 3000® Growth Index measures the performance of the broad growth segment of the U.S. equity universe. It includes those Russell 3000® Index companies with higher price-to-book ratios and higher forecasted growth values. The Russell 3000® Growth Index is constructed to provide a comprehensive, unbiased and stable barometer of the broad growth market. The Russell 3000® Growth Index is completely reconstituted annually to ensure new and growing equities are included and that the represented companies continue to reflect growth characteristics. The index is unmanaged, and it is not possible to invest directly in an index. |
| 10 | The Russell Microcap® Value Index measures the performance of the micro-cap value segment of the U.S. equity universe. It includes those Russell Microcap® Index companies with higher price-to-book ratios and lower forecasted growth values. The Russell Microcap® Value Index is constructed to provide a comprehensive, unbiased and stable barometer of the micro-cap value market. The Russell Microcap Value Index is completely reconstituted annually to ensure new and growing equities are included and that the represented companies continue to reflect value characteristics. The index is unmanaged, and it is not possible to invest directly in an index. |
| 11 | The Russell Microcap® Growth Index measures the performance of the microcap growth segment of the U.S. equity market. It includes Russell Microcap companies that are considered more growth oriented relative to the overall market as defined by Russell's leading style methodology. The Russell Microcap® Growth Index is constructed to provide a comprehensive and unbiased barometer for the microcap growth segment of the market. The Russell Microcap® Growth Index is completely reconstituted annually to ensure larger stocks do not distort performance and characteristics of the microcap opportunity set. The Russell Microcap® Growth Index is unmanaged, and it is not possible to invest directly in an index. |
Annual Shareholder Report
FUND PERFORMANCE AND GROWTH OF A $10,000 INVESTMENT
The graph below illustrates the hypothetical investment of $10,0001 in the Federated MDT All Cap Core Fund2 (the “Fund”) from July 31, 2006 to July 31, 2016, compared to the Russell 3000® Index (R3000)3 and the Morningstar Large Blend Funds Average (MLBFA).4 The Average Annual Total Return table below shows returns for each class averaged over the stated periods.
Growth of a $10,000 Investment
Growth of $10,000 as of July 31, 2016
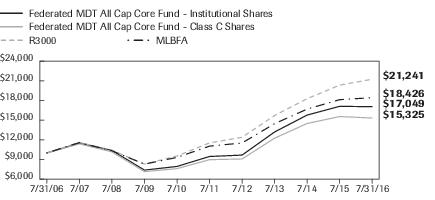
| Federated MDT All Cap Core Fund - | Institutional Shares | Class C Shares | R3000 | MLBFA |
| F | F | I | I |
| 7/31/2006 | 10,000 | 10,000 | 10,000 | 10,000 |
| 7/31/2007 | 11,492 | 11,381 | 11,608 | 11,579 |
| 7/31/2008 | 10,376 | 10,164 | 10,410 | 10,329 |
| 7/31/2009 | 7,383 | 7,151 | 8,306 | 8,288 |
| 7/31/2010 | 7,940 | 7,603 | 9,537 | 9,321 |
| 7/31/2011 | 9,459 | 8,973 | 11,533 | 11,035 |
| 7/31/2012 | 9,670 | 9,077 | 12,378 | 11,517 |
| 7/31/2013 | 13,196 | 12,253 | 15,704 | 14,461 |
| 7/31/2014 | 15,775 | 14,489 | 18,275 | 16,683 |
| 7/31/2015 | 17,107 | 15,547 | 20,337 | 18,122 |
| 7/31/2016 | 17,049 | 15,325 | 21,241 | 18,426 |
41 graphic description end -->
| ■ | Total returns shown for the Class C Shares include the maximum contingent deferred sales charge of 1.00% as applicable. |
The Fund offers multiple share classes whose performance may be greater than or less than its other share class(es) due to differences in sales charges and expenses. See the Average Annual Total Return table below for the returns of additional classes not shown in the line graph above.
Average Annual Total Returns for the Period Ended 7/31/2016
(returns reflect all applicable sales charges and contingent deferred sales charges as specified below in footnote #1)
| | 1 Year | 5 Years | 10 Years |
| Class A Shares | -6.09% | 10.93% | 4.60% |
| Class C Shares | -2.41% | 11.30% | 4.36% |
| Class R Shares5 | -1.05% | 11.67% | 4.74% |
| Institutional Shares | -0.34% | 12.50% | 5.48% |
| R3000 | 4.44% | 12.99% | 7.82% |
| MLBFA | 1.94% | 11.44% | 6.80% |
Annual Shareholder Report
Performance data quoted represents past performance which is no guarantee of future results. Investment return and principal value will fluctuate so that an investor's shares, when redeemed, may be worth more or less than their original cost. Mutual fund performance changes over time and current performance may be lower or higher than what is stated. For current to the most recent month-end performance and after-tax returns, visit FederatedInvestors.com or call 1-800-341-7400. Returns shown do not reflect the deduction of taxes that a shareholder would pay on Fund distributions or the redemption of Fund shares. Mutual funds are not obligations of or guaranteed by any bank and are not federally insured.
| 1 | Represents a hypothetical investment of $10,000 in the Fund after deducting applicable sales charges: for Class A Shares, the maximum sales charge of 5.50% ($10,000 investment minus $550 sales charge = $9,450); for Class C Shares a 1.00% contingent deferred sales charge would be applied on any redemption less than one year from the purchase date. The Fund's performance assumes the reinvestment of all dividends and distributions. The R3000 has been adjusted to reflect reinvestment of dividends of securities. |
| 2 | The Fund is the successor to the MDT All Cap Core Fund pursuant to a reorganization that took place on December 8, 2006. Prior to that date, the Fund had no investment operations. Accordingly, the performance information shown for periods prior to that date is that of the MDT All Cap Core Fund. |
| 3 | The R3000 measures the performance of the largest 3,000 U.S. companies representing approximately 98% of the investable U.S. equity market. The R3000 is constructed to provide a comprehensive, unbiased, and stable barometer of the broad market and is completely reconstituted annually to ensure new and growing equities are reflected. The index is unmanaged and, unlike the Fund, is not affected by cash flows. It is not possible to invest directly in an index. The R3000 is not adjusted to reflect sales charges, expenses or other fees that the Securities and Exchange Commission requires to be reflected in the Fund's performance. |
| 4 | Morningstar figures represent the average of the total returns reported by all the mutual funds designated by Morningstar as falling into the respective category indicated. They do not reflect sales charges. |
| 5 | Class R Shares commenced operations on December 12, 2006. Performance results shown before that date are for the Fund's Institutional Shares and have been adjusted for the total annual operating expenses applicable to Class R Shares. |
Annual Shareholder Report
Portfolio of Investments Summary Table (unaudited)
At July 31, 2016, the Fund's industry composition1 was as follows:
| Industry Composition | Percentage of
Total Net Assets |
| Life Insurance | 4.9% |
| Internet Services | 4.3% |
| Regional Banks | 4.1% |
| Department Stores | 4.0% |
| Biotechnology | 3.7% |
| Oil Refiner | 3.5% |
| Property Liability Insurance | 3.3% |
| Money Center Bank | 3.0% |
| Services to Medical Professionals | 3.0% |
| Software Packaged/Custom | 2.9% |
| Medical Supplies | 2.8% |
| Computers—High End | 2.7% |
| Computers—Midrange | 2.5% |
| Ethical Drugs | 2.5% |
| Auto Original Equipment Manufacturers | 2.2% |
| Medical Technology | 2.0% |
| Packaged Foods | 2.0% |
| Computers—Low End | 1.9% |
| Financial Services | 1.8% |
| Commodity Chemicals | 1.7% |
| Electric Utility | 1.7% |
| Grocery Chain | 1.7% |
| AT&T Divestiture | 1.6% |
| Construction Machinery | 1.5% |
| Specialty Retailing | 1.5% |
| Airline—Regional | 1.4% |
| Poultry Products | 1.4% |
| Telephone Utility | 1.4% |
| Semiconductor Manufacturing | 1.3% |
| Cable TV | 1.2% |
| Cosmetics & Toiletries | 1.1% |
| Hospitals | 1.1% |
| Computer Stores | 1.0% |
Annual Shareholder Report
| Industry Composition | Percentage of
Total Net Assets |
| Shipbuilding | 1.0% |
| Other2 | 20.4% |
| Cash Equivalents3 | 1.5% |
| Other Assets and Liabilities—Net4 | 0.4% |
| TOTAL | 100.0% |
| 1 | Except for Cash Equivalents and Other Assets and Liabilities, industry classifications are based upon, and individual portfolio securities are assigned to, the classifications of the Global Industry Classification Standard (GICS) except that the Adviser assigns a classification to securities not classified by the GICS and to securities for which the Adviser does not have access to the classification made by the GICS. |
| 2 | For purposes of this table, industry classifications which constitute less than 1.0% of the Fund's total net assets have been aggregated under the designation “Other”. |
| 3 | Cash Equivalents include any investments in money market mutual funds and/or overnight repurchase agreements. |
| 4 | Assets, other than investments in securities, less liabilities. See Statement of Assets and Liabilities. |
Annual Shareholder Report
Portfolio of Investments
July 31, 2016
| Shares | | | Value |
| | | COMMON STOCKS—98.1% | |
| | | Agricultural Machinery—0.3% | |
| 9,100 | | AGCO Corp. | $438,256 |
| | | Airline - National—0.9% | |
| 4,639 | 1 | Atlas Air Worldwide Holdings, Inc. | 200,544 |
| 21,800 | 1 | Jet Blue Airways Corp. | 399,594 |
| 14,659 | 1 | United Continental Holdings, Inc. | 687,360 |
| | | TOTAL | 1,287,498 |
| | | Airline - Regional—1.4% | |
| 10,759 | | Alaska Air Group, Inc. | 723,220 |
| 35,766 | | Southwest Airlines Co. | 1,323,700 |
| | | TOTAL | 2,046,920 |
| | | Airlines—0.6% | |
| 21,847 | | Delta Air Lines, Inc. | 846,571 |
| | | Apparel—0.6% | |
| 4,466 | 1 | Iconix Brand Group, Inc. | 32,155 |
| 7,800 | | PVH Corp. | 788,268 |
| | | TOTAL | 820,423 |
| | | AT&T Divestiture—1.6% | |
| 40,304 | | Verizon Communications, Inc. | 2,233,245 |
| | | Auto Manufacturing—0.5% | |
| 10,855 | | Allison Transmission Holdings, Inc. | 312,841 |
| 35,900 | | Ford Motor Co. | 454,494 |
| | | TOTAL | 767,335 |
| | | Auto Original Equipment Manufacturers—2.2% | |
| 18,948 | | Lear Corp. | 2,149,651 |
| 3,562 | 1 | O'Reilly Automotive, Inc. | 1,035,224 |
| | | TOTAL | 3,184,875 |
| | | Biotechnology—3.7% | |
| 22,998 | | Amgen, Inc. | 3,956,346 |
| 15,342 | | Gilead Sciences, Inc. | 1,219,229 |
| 3,045 | 1 | Repligen Corp. | 87,087 |
| | | TOTAL | 5,262,662 |
| | | Broadcasting—0.3% | |
| 7,909 | | CBS Corp., Class B | 413,008 |
| | | Building Supply Stores—0.4% | |
| 1,054 | | Home Depot, Inc. | 145,705 |
Annual Shareholder Report
| Shares | | | Value |
| | | COMMON STOCKS—continued | |
| | | Building Supply Stores—continued | |
| 5,203 | | Lowe's Cos., Inc. | $428,103 |
| | | TOTAL | 573,808 |
| | | Cable TV—1.2% | |
| 36,984 | | Viacom, Inc., Class B | 1,681,662 |
| | | Capital Markets—0.5% | |
| 18,565 | | Bank of New York Mellon Corp. | 731,461 |
| | | Clothing Stores—0.8% | |
| 9,671 | 1 | Fossil, Inc. | 305,603 |
| 33,449 | | Gap (The), Inc. | 862,650 |
| | | TOTAL | 1,168,253 |
| | | Commodity Chemicals—1.7% | |
| 2,018 | | Celanese Corp. | 127,982 |
| 2,011 | | Eastman Chemical Co. | 131,177 |
| 28,095 | | LyondellBasell Investment LLC, Class A | 2,114,430 |
| | | TOTAL | 2,373,589 |
| | | Computer Networking—0.5% | |
| 31,818 | | Juniper Networks, Inc. | 721,950 |
| | | Computer Peripherals—0.4% | |
| 19,800 | | NetApp, Inc. | 521,730 |
| | | Computer Services—0.2% | |
| 3,888 | 1 | Salesforce.com, Inc. | 318,038 |
| | | Computer Stores—1.0% | |
| 10,800 | | GameStop Corp. | 334,260 |
| 13,862 | 1 | Tech Data Corp. | 1,080,266 |
| | | TOTAL | 1,414,526 |
| | | Computers - High End—2.7% | |
| 23,940 | | IBM Corp. | 3,845,243 |
| | | Computers - Low End—1.9% | |
| 25,774 | | Apple, Inc. | 2,685,909 |
| | | Computers - Midrange—2.5% | |
| 256,781 | 1 | Hewlett-Packard Co. | 3,597,502 |
| | | Construction Machinery—1.5% | |
| 49,196 | | Joy Global, Inc. | 1,359,285 |
| 35,600 | | Trinity Industries, Inc. | 826,276 |
| | | TOTAL | 2,185,561 |
| | | Consumer Finance—0.3% | |
| 25,900 | | Navient Corp. | 367,780 |
Annual Shareholder Report
| Shares | | | Value |
| | | COMMON STOCKS—continued | |
| | | Contracting—0.3% | |
| 8,300 | 1 | Jacobs Engineering Group, Inc. | $444,216 |
| | | Cosmetics & Toiletries—1.1% | |
| 21,400 | | Avon Products, Inc. | 87,098 |
| 1,506 | | Estee Lauder Cos., Inc., Class A | 139,907 |
| 3,481 | 1 | Helen of Troy Ltd. | 346,743 |
| 3,697 | 1 | Ulta Salon Cosmetics & Fragrance, Inc. | 965,693 |
| | | TOTAL | 1,539,441 |
| | | Crude Oil & Gas Production—0.2% | |
| 22,200 | 1 | Chesapeake Energy Corp. | 120,324 |
| 1,181 | | Cimarex Energy Co. | 141,744 |
| | | TOTAL | 262,068 |
| | | Dairy Products—0.3% | |
| 5,515 | | Cal-Maine Foods, Inc. | 231,078 |
| 8,425 | | Dean Foods Co. | 155,526 |
| | | TOTAL | 386,604 |
| | | Defense Aerospace—0.7% | |
| 2,959 | | General Dynamics Corp. | 434,647 |
| 11,239 | 1 | Spirit Aerosystems Holdings, Inc., Class A | 487,548 |
| | | TOTAL | 922,195 |
| | | Department Stores—4.0% | |
| 5,980 | | Dillards, Inc., Class A | 404,727 |
| 20,551 | | Kohl's Corp. | 854,716 |
| 41,805 | | Macy's, Inc. | 1,497,873 |
| 38,852 | | Target Corp. | 2,926,721 |
| | | TOTAL | 5,684,037 |
| | | Discount Department Stores—0.2% | |
| 5,400 | | Foot Locker, Inc. | 321,948 |
| | | Distillers—0.6% | |
| 4,757 | | Constellation Brands, Inc., Class A | 783,145 |
| | | Diversified Oil—0.6% | |
| 10,472 | | Occidental Petroleum Corp. | 782,573 |
| | | Electric Utility—1.7% | |
| 24,600 | | AES Corp. | 303,810 |
| 83,976 | | NiSource, Inc. | 2,154,824 |
| | | TOTAL | 2,458,634 |
| | | Electrical Equipment—0.4% | |
| 4,200 | 1 | Sanmina Corp. | 106,428 |
| 3,060 | 1 | WESCO International, Inc. | 170,564 |
Annual Shareholder Report
| Shares | | | Value |
| | | COMMON STOCKS—continued | |
| | | Electrical Equipment—continued | |
| 29,400 | | Xerox Corp. | $302,820 |
| | | TOTAL | 579,812 |
| | | Electronics Stores—0.4% | |
| 16,800 | | Best Buy Co., Inc. | 564,480 |
| | | Energy Equipment & Services—0.1% | |
| 11,813 | | Noble Corp. PLC | 87,180 |
| | | Entertainment—0.5% | |
| 43,653 | 1 | MSG Networks, Inc., Class A | 700,631 |
| | | Ethical Drugs—2.5% | |
| 74,491 | | Pfizer, Inc. | 2,747,973 |
| 6,195 | 1 | United Therapeutics Corp. | 749,657 |
| | | TOTAL | 3,497,630 |
| | | Financial Services—1.8% | |
| 28,700 | | Ally Financial, Inc. | 517,748 |
| 6,354 | | Ameriprise Financial, Inc. | 608,967 |
| 5,086 | | Deluxe Corp. | 343,763 |
| 10,116 | | Discover Financial Services | 574,993 |
| 4,846 | | Synchrony Financial | 135,107 |
| 18,900 | | Western Union Co. | 378,000 |
| | | TOTAL | 2,558,578 |
| | | Food & Staples Retailing—0.3% | |
| 4,603 | | Walgreens Boots Alliance, Inc. | 364,788 |
| | | Grocery Chain—1.7% | |
| 69,326 | | Kroger Co. | 2,370,256 |
| | | Health Care Equipment & Supplies—0.1% | |
| 1,779 | 1 | Inogen, Inc. | 95,603 |
| | | Home Building—0.1% | |
| 5,206 | | D. R. Horton, Inc. | 171,173 |
| | | Home Products—0.4% | |
| 3,770 | | Libbey, Inc. | 70,461 |
| 7,554 | | Tupperware Brands Corp. | 473,485 |
| | | TOTAL | 543,946 |
| | | Hospitals—1.1% | |
| 27,966 | 1 | Community Health Systems, Inc. | 357,126 |
| 15,835 | 1 | HCA, Inc. | 1,221,353 |
| | | TOTAL | 1,578,479 |
| | | Hotels—0.7% | |
| 13,361 | | Wyndham Worldwide Corp. | 948,898 |
Annual Shareholder Report
| Shares | | | Value |
| | | COMMON STOCKS—continued | |
| | | Household Appliances—0.3% | |
| 2,463 | | Whirlpool Corp. | $473,783 |
| | | Integrated International Oil—0.3% | |
| 4,821 | | Exxon Mobil Corp. | 428,828 |
| | | Internet Services—4.3% | |
| 115,239 | 1 | eBay, Inc. | 3,590,847 |
| 20,698 | 1 | Facebook, Inc., Class A | 2,565,310 |
| | | TOTAL | 6,156,157 |
| | | Life Insurance—4.9% | |
| 44,569 | | Aflac, Inc. | 3,221,447 |
| 21,412 | | Assured Guaranty Ltd. | 573,627 |
| 42,688 | | Prudential Financial, Inc. | 3,213,980 |
| | | TOTAL | 7,009,054 |
| | | Machinery—0.1% | |
| 6,829 | | Kennametal, Inc. | 169,769 |
| | | Medical Supplies—2.8% | |
| 74,279 | | Baxter International, Inc. | 3,566,878 |
| 7,878 | 1 | Hologic, Inc. | 303,224 |
| 1,633 | 1 | Orthofix International NV | 77,404 |
| | | TOTAL | 3,947,506 |
| | | Medical Technology—2.0% | |
| 2,873 | 1 | Abiomed, Inc. | 338,928 |
| 21,833 | 1 | Edwards Lifesciences Corp. | 2,500,315 |
| | | TOTAL | 2,839,243 |
| | | Metal Fabrication—0.1% | |
| 2,471 | | Reliance Steel & Aluminum Co. | 193,825 |
| | | Miscellaneous Components—0.3% | |
| 27,428 | | Vishay Intertechnology, Inc. | 365,615 |
| | | Miscellaneous Food Products—0.8% | |
| 7,300 | | Fresh Del Monte Produce, Inc. | 415,005 |
| 5,900 | | Ingredion, Inc. | 786,116 |
| | | TOTAL | 1,201,121 |
| | | Miscellaneous Machinery—0.8% | |
| 32,533 | 1 | Colfax Corp. | 955,169 |
| 14,360 | 1 | SPX Corp. | 217,410 |
| | | TOTAL | 1,172,579 |
| | | Money Center Bank—3.0% | |
| 19,891 | | Bank of America Corp. | 288,221 |
| 8,281 | | Citigroup, Inc. | 362,791 |
Annual Shareholder Report
| Shares | | | Value |
| | | COMMON STOCKS—continued | |
| | | Money Center Bank—continued | |
| 55,952 | | JPMorgan Chase & Co. | $3,579,249 |
| | | TOTAL | 4,230,261 |
| | | Multi-Industry Capital Goods—0.2% | |
| 1,259 | | Acuity Brands, Inc. | 330,399 |
| | | Multi-Industry Transportation—0.1% | |
| 863 | | FedEx Corp. | 139,720 |
| | | Office Equipment—0.2% | |
| 14,800 | | Pitney Bowes, Inc. | 285,788 |
| | | Office Supplies—0.0% | |
| 2,386 | | Ennis Business Forms, Inc. | 41,326 |
| | | Offshore Driller—0.1% | |
| 15,800 | | Nabors Industries Ltd. | 142,200 |
| | | Oil Refiner—3.5% | |
| 15,598 | | HollyFrontier Corp. | 396,501 |
| 15,618 | | Tesoro Petroleum Corp. | 1,189,311 |
| 63,739 | | Valero Energy Corp. | 3,332,275 |
| | | TOTAL | 4,918,087 |
| | | Oil Well Supply—0.6% | |
| 21,445 | | National Oilwell Varco, Inc. | 693,746 |
| 8,200 | | Superior Energy Services, Inc. | 130,954 |
| | | TOTAL | 824,700 |
| | | Packaged Foods—2.0% | |
| 17,980 | | Smucker (J.M.) Co. | 2,771,797 |
| | | Paper Products—0.2% | |
| 5,600 | | Domtar, Corp. | 220,472 |
| | | Poultry Products—1.4% | |
| 16,900 | | Pilgrim's Pride Corp. | 392,925 |
| 4,000 | | Sanderson Farms, Inc. | 350,360 |
| 17,688 | | Tyson Foods, Inc., Class A | 1,301,837 |
| | | TOTAL | 2,045,122 |
| | | Printing—0.1% | |
| 9,700 | | Donnelley (R.R.) & Sons Co. | 173,824 |
| | | Property Liability Insurance—3.3% | |
| 5,558 | | Everest Re Group Ltd. | 1,050,518 |
| 30,641 | | The Travelers Cos., Inc. | 3,561,097 |
| | | TOTAL | 4,611,615 |
| | | Recreational Goods—0.1% | |
| 4,970 | 1 | Smith & Wesson Holding Corp. | 146,367 |
Annual Shareholder Report
| Shares | | | Value |
| | | COMMON STOCKS—continued | |
| | | Regional Banks—4.1% | |
| 29,600 | | Fifth Third Bancorp | $561,808 |
| 17,200 | | Huntington Bancshares, Inc. | 163,400 |
| 30,200 | | KeyCorp | 353,340 |
| 24,479 | | PNC Financial Services Group | 2,023,189 |
| 9,100 | | Popular, Inc. | 306,579 |
| 33,335 | | SunTrust Banks, Inc. | 1,409,737 |
| 21,302 | | Wells Fargo & Co. | 1,021,857 |
| | | TOTAL | 5,839,910 |
| | | Restaurants—0.4% | |
| 3,686 | | Cracker Barrel Old Country Store, Inc. | 580,213 |
| | | Rubber—0.4% | |
| 19,439 | | Goodyear Tire & Rubber Co. | 557,316 |
| | | Semiconductor Distribution—0.5% | |
| 2,931 | 1 | Arrow Electronics, Inc. | 194,882 |
| 10,973 | | Avnet, Inc. | 450,991 |
| | | TOTAL | 645,873 |
| | | Semiconductor Manufacturing—1.3% | |
| 51,399 | | Intel Corp. | 1,791,769 |
| | | Services to Medical Professionals—3.0% | |
| 4,841 | | Aetna, Inc. | 557,732 |
| 12,514 | | Anthem, Inc. | 1,643,589 |
| 24,463 | 1 | Express Scripts Holding Co. | 1,860,900 |
| 3,753 | 1 | Molina Healthcare, Inc. | 213,208 |
| | | TOTAL | 4,275,429 |
| | | Shipbuilding—1.0% | |
| 8,559 | | Huntington Ingalls Industries, Inc. | 1,477,112 |
| | | Shoes—0.1% | |
| 8,631 | 1 | Skechers USA, Inc., Class A | 207,317 |
| | | Soft Drinks—0.8% | |
| 6,012 | | Dr. Pepper Snapple Group, Inc. | 592,242 |
| 5,062 | | PepsiCo, Inc. | 551,353 |
| | | TOTAL | 1,143,595 |
| | | Software Packaged/Custom—2.9% | |
| 19,200 | | CA, Inc. | 665,280 |
| 8,086 | | CDW Corp. | 347,132 |
| 35,403 | 1 | Citrix Systems, Inc. | 3,155,469 |
| | | TOTAL | 4,167,881 |
Annual Shareholder Report
| Shares | | | Value |
| | | COMMON STOCKS—continued | |
| | | Specialty Retailing—1.5% | |
| 8,000 | | Abercrombie & Fitch Co., Class A | $165,680 |
| 16,403 | | Bed Bath & Beyond, Inc. | 737,315 |
| 2,900 | | Big Lots, Inc. | 154,222 |
| 1,700 | | Children's Place, Inc./The | 142,086 |
| 8,480 | | GNC Holdings, Inc. | 173,077 |
| 5,296 | | Nordstrom, Inc. | 234,242 |
| 6,464 | | Outerwall, Inc. | 340,394 |
| 16,300 | | Staples, Inc. | 151,427 |
| 4,151 | | Tailored Brands, Inc. | 60,812 |
| | | TOTAL | 2,159,255 |
| | | Telecommunication Equipment & Services—0.7% | |
| 16,930 | | Cisco Systems, Inc. | 516,873 |
| 4,365 | 1 | Dycom Industries, Inc. | 410,528 |
| | | TOTAL | 927,401 |
| | | Telephone Utility—1.4% | |
| 62,812 | | CenturyLink, Inc. | 1,974,809 |
| | | Truck Manufacturing—0.3% | |
| 6,600 | | OshKosh Truck Corp. | 363,594 |
| | | Undesignated Consumer Cyclicals—0.7% | |
| 7,800 | 1 | Avis Budget Group, Inc. | 286,494 |
| 2,100 | | DeVry Education Group, Inc. | 46,767 |
| 5,969 | 1 | Herbalife Ltd. | 405,952 |
| 5,800 | | Nu Skin Enterprises, Inc., Class A | 309,720 |
| | | TOTAL | 1,048,933 |
| | | TOTAL COMMON STOCKS
(IDENTIFIED COST $135,810,510) | 139,133,685 |
| | | INVESTMENT COMPANY—1.5% | |
| 2,073,572 | 2 | Federated Institutional Prime Value Obligations Fund, Institutional Shares, 0.36%3
(AT NET ASSET VALUE) | 2,073,572 |
| | | TOTAL INVESTMENTS—99.6%
(IDENTIFIED COST $137,884,082)4 | 141,207,257 |
| | | OTHER ASSETS AND LIABILITIES - NET—0.4%5 | 544,021 |
| | | TOTAL NET ASSETS—100% | $141,751,278 |
| 1 | Non-income-producing security. |
| 2 | Affiliated holding. |
| 3 | 7-day net yield. |
| 4 | The cost of investments for federal tax purposes amounts to $137,931,874. |
| 5 | Assets, other than investments in securities, less liabilities. See Statement of Assets and Liabilities. |
Annual Shareholder Report
Note: The categories of investments are shown as a percentage of total net assets at July 31, 2016.
Various inputs are used in determining the value of the Fund's investments. These inputs are summarized in the three broad levels listed below:
Level 1—quoted prices in active markets for identical securities.
Level 2—other significant observable inputs (including quoted prices for similar securities, interest rates, prepayment speeds, credit risk, etc.). Also includes securities valued at amortized cost.
Level 3—significant unobservable inputs (including the Fund's own assumptions in determining the fair value of investments).
The inputs or methodology used for valuing securities are not an indication of the risk associated with investing in those securities.
As of July 31, 2016, all investments of the Fund utilized Level 1 inputs in valuing the Fund's assets carried at fair value.
See Notes which are an integral part of the Financial Statements
Annual Shareholder Report
Financial Highlights–Class A Shares
(For a Share Outstanding Throughout Each Period)
| Year Ended July 31 | 2016 | 2015 | 2014 | 2013 | 2012 |
| Net Asset Value, Beginning of Period | $22.10 | $20.47 | $17.26 | $12.73 | $12.48 |
| Income From Investment Operations: | | | | | |
| Net investment income | 0.191 | 0.111 | 0.081 | 0.091 | 0.061 |
| Net realized and unrealized gain (loss) on investments | (0.33) | 1.55 | 3.23 | 4.49 | 0.19 |
| TOTAL FROM INVESTMENT OPERATIONS | (0.14) | 1.66 | 3.31 | 4.58 | 0.25 |
| Less Distributions: | | | | | |
| Distributions from net investment income | (0.19) | (0.03) | (0.10) | (0.05) | — |
| Net Asset Value, End of Period | $21.77 | $22.10 | $20.47 | $17.26 | $12.73 |
| Total Return2 | (0.61)% | 8.10% | 19.21% | 36.10% | 2.00% |
| Ratios to Average Net Assets: | | | | | |
| Net expenses | 1.35% | 1.35% | 1.35% | 1.35% | 1.35% |
| Net investment income | 0.94% | 0.51% | 0.41% | 0.59% | 0.48% |
| Expense waiver/reimbursement3 | 0.03% | 0.00%4 | 0.08% | 0.16% | 0.40% |
| Supplemental Data: | | | | | |
| Net assets, end of period (000 omitted) | $33,753 | $40,433 | $44,678 | $34,092 | $29,365 |
| Portfolio turnover | 62% | 76% | 31% | 99% | 164% |
| 1 | Per share numbers have been calculated using the average shares method. |
| 2 | Based on net asset value, which does not reflect the sales charge, redemption fee or contingent deferred sales charge, if applicable. |
| 3 | This expense decrease is reflected in both the net expense and the net investment income ratios shown above. |
| 4 | Represents less than 0.01%. |
See Notes which are an integral part of the Financial Statements
Annual Shareholder Report
Financial Highlights–Class C Shares
(For a Share Outstanding Throughout Each Period)
| Year Ended July 31 | 2016 | 2015 | 2014 | 2013 | 2012 |
| Net Asset Value, Beginning of Period | $21.00 | $19.57 | $16.55 | $12.26 | $12.12 |
| Income From Investment Operations: | | | | | |
| Net investment income (loss) | 0.031 | (0.05)1 | (0.07)1 | (0.03)1 | (0.04)1 |
| Net realized and unrealized gain (loss) on investments | (0.33) | 1.48 | 3.09 | 4.32 | 0.18 |
| TOTAL FROM INVESTMENT OPERATIONS | (0.30) | 1.43 | 3.02 | 4.29 | 0.14 |
| Less Distributions: | | | | | |
| Distributions from net investment income | (0.04) | — | — | — | — |
| Net Asset Value, End of Period | $20.66 | $21.00 | $19.57 | $16.55 | $12.26 |
| Total Return2 | (1.43)% | 7.31% | 18.25% | 34.99% | 1.16% |
| Ratios to Average Net Assets: | | | | | |
| Net expenses | 2.14% | 2.11% | 2.15% | 2.15% | 2.15% |
| Net investment income (loss) | 0.15% | (0.26)% | (0.38)% | (0.21)% | (0.32)% |
| Expense waiver/reimbursement3 | 0.00%4 | 0.00%4 | 0.06% | 0.11% | 0.36% |
| Supplemental Data: | | | | | |
| Net assets, end of period (000 omitted) | $36,846 | $41,509 | $35,052 | $27,674 | $24,440 |
| Portfolio turnover | 62% | 76% | 31% | 99% | 164% |
| 1 | Per share numbers have been calculated using the average shares method. |
| 2 | Based on net asset value, which does not reflect the sales charge, redemption fee or contingent deferred sales charge, if applicable. |
| 3 | This expense decrease is reflected in both the net expense and the net investment income (loss) ratios shown above. |
| 4 | Represents less than 0.01%. |
See Notes which are an integral part of the Financial Statements
Annual Shareholder Report
Financial Highlights–Class R Shares
(For a Share Outstanding Throughout Each Period)
| Year Ended July 31 | 2016 | 2015 | 2014 | 2013 | 2012 |
| Net Asset Value, Beginning of Period | $21.80 | $20.25 | $17.09 | $12.62 | $12.44 |
| Income From Investment Operations: | | | | | |
| Net investment income (loss) | 0.101 | 0.021 | (0.01)1 | 0.021 | (0.00)1,2 |
| Net realized and unrealized gain (loss) on investments | (0.33) | 1.53 | 3.20 | 4.45 | 0.18 |
| TOTAL FROM INVESTMENT OPERATIONS | (0.23) | 1.55 | 3.19 | 4.47 | 0.18 |
| Less Distributions: | | | | | |
| Distributions from net investment income | (0.11) | — | (0.03) | — | — |
| Net Asset Value, End of Period | $21.46 | $21.80 | $20.25 | $17.09 | $12.62 |
| Total Return3 | (1.05)% | 7.65% | 18.68% | 35.42% | 1.45% |
| Ratios to Average Net Assets: | | | | | |
| Net expenses | 1.80% | 1.76% | 1.81% | 1.83% | 1.85% |
| Net investment income (loss) | 0.49% | 0.09% | (0.05)% | 0.11% | (0.02)% |
| Expense waiver/reimbursement4 | 0.00%5 | 0.00%5 | 0.00%5 | 0.02% | 0.25% |
| Supplemental Data: | | | | | |
| Net assets, end of period (000 omitted) | $5,717 | $6,300 | $5,467 | $4,089 | $2,718 |
| Portfolio turnover | 62% | 76% | 31% | 99% | 164% |
| 1 | Per share numbers have been calculated using the average shares method. |
| 2 | Represents less than $0.01. |
| 3 | Based on net asset value. |
| 4 | This expense decrease is reflected in both the net expense and the net investment income (loss) ratios shown above. |
| 5 | Represents less than 0.01%. |
See Notes which are an integral part of the Financial Statements
Annual Shareholder Report
Financial Highlights–Institutional Shares
(For a Share Outstanding Throughout Each Period)
| Year Ended July 31 | 2016 | 2015 | 2014 | 2013 | 2012 |
| Net Asset Value, Beginning of Period | $22.37 | $20.71 | $17.45 | $12.87 | $12.61 |
| Income From Investment Operations: | | | | | |
| Net investment income | 0.251 | 0.181 | 0.131 | 0.121 | 0.091 |
| Net realized and unrealized gain (loss) on investments | (0.34) | 1.57 | 3.27 | 4.55 | 0.19 |
| TOTAL FROM INVESTMENT OPERATIONS | (0.09) | 1.75 | 3.40 | 4.67 | 0.28 |
| Less Distributions: | | | | | |
| Distributions from net investment income | (0.26) | (0.09) | (0.14) | (0.09) | (0.02) |
| Net Asset Value, End of Period | $22.02 | $22.37 | $20.71 | $17.45 | $12.87 |
| Total Return2 | (0.34)% | 8.45% | 19.54% | 36.46% | 2.23% |
| Ratios to Average Net Assets: | | | | | |
| Net expenses | 1.07% | 1.05% | 1.10% | 1.10% | 1.10% |
| Net investment income | 1.22% | 0.80% | 0.65% | 0.84% | 0.73% |
| Expense waiver/reimbursement3 | 0.00%4 | 0.00%4 | 0.00%4 | 0.05% | 0.27% |
| Supplemental Data: | | | | | |
| Net assets, end of period (000 omitted) | $65,435 | $76,242 | $62,770 | $39,932 | $39,101 |
| Portfolio turnover | 62% | 76% | 31% | 99% | 164% |
| 1 | Per share numbers have been calculated using the average shares method. |
| 2 | Based on net asset value. |
| 3 | This expense decrease is reflected in both the net expense and the net investment income ratios shown above. |
| 4 | Represents less than 0.01%. |
See Notes which are an integral part of the Financial Statements
Annual Shareholder Report
Statement of Assets and Liabilities
July 31, 2016
| Assets: | | |
| Total investment in securities, at value including $2,073,572 of investment in an affiliated holding (Note 5) (identified cost $137,884,082) | | $141,207,257 |
| Income receivable | | 109,358 |
| Receivable for investments sold | | 3,676,006 |
| Receivable for shares sold | | 212,374 |
| TOTAL ASSETS | | 145,204,995 |
| Liabilities: | | |
| Payable for investments purchased | $1,646,475 | |
| Payable for shares redeemed | 1,639,577 | |
| Payable to adviser (Note 5) | 8,701 | |
| Payable for administrative fee (Note 5) | 909 | |
| Payable for distribution services fee (Note 5) | 25,407 | |
| Payable for other service fees (Notes 2 and 5) | 18,185 | |
| Accrued expenses (Note 5) | 114,463 | |
| TOTAL LIABILITIES | | 3,453,717 |
| Net assets for 6,571,642 shares outstanding | | $141,751,278 |
| Net Assets Consist of: | | |
| Paid-in capital | | $205,715,164 |
| Net unrealized appreciation of investments | | 3,323,175 |
| Accumulated net realized loss on investments | | (67,949,670) |
| Undistributed net investment income | | 662,609 |
| TOTAL NET ASSETS | | $141,751,278 |
Annual Shareholder Report
Statement of Assets and Liabilities–continued
| Net Asset Value, Offering Price and Redemption Proceeds Per Share | | |
| Class A Shares: | | |
Net asset value per share ($33,752,971 ÷ 1,550,504 shares outstanding),
no par value, unlimited shares authorized | | $21.77 |
| Offering price per share (100/94.50 of $21.77) | | $23.04 |
| Redemption proceeds per share | | $21.77 |
| Class C Shares: | | |
Net asset value per share ($36,845,857 ÷ 1,783,053 shares outstanding),
no par value, unlimited shares authorized | | $20.66 |
| Offering price per share | | $20.66 |
| Redemption proceeds per share (99.00/100 of $20.66) | | $20.45 |
| Class R Shares: | | |
Net asset value per share ($5,717,354 ÷ 266,391 shares outstanding),
no par value, unlimited shares authorized | | $21.46 |
| Offering price per share | | $21.46 |
| Redemption proceeds per share | | $21.46 |
| Institutional Shares: | | |
Net asset value per share ($65,435,096 ÷ 2,971,694 shares outstanding),
no par value, unlimited shares authorized | | $22.02 |
| Offering price per share | | $22.02 |
| Redemption proceeds per share | | $22.02 |
See Notes which are an integral part of the Financial Statements
Annual Shareholder Report
Statement of Operations
Year Ended July 31, 2016
| Investment Income: | | | |
| Dividends (including $7,728 received from an affiliated holding (Note 5) and net of foreign taxes withheld of $546) | | | $3,353,275 |
| Expenses: | | | |
| Investment adviser fee (Note 5) | | $1,094,488 | |
| Administrative fee (Note 5) | | 114,158 | |
| Custodian fees | | 15,932 | |
| Transfer agent fee (Note 2) | | 188,547 | |
| Directors'/Trustees' fees (Note 5) | | 3,048 | |
| Auditing fees | | 24,799 | |
| Legal fees | | 8,235 | |
| Portfolio accounting fees | | 80,037 | |
| Distribution services fee (Note 5) | | 307,115 | |
| Other service fees (Notes 2 and 5) | | 182,917 | |
| Share registration costs | | 54,880 | |
| Printing and postage | | 31,750 | |
| Miscellaneous (Note 5) | | 13,132 | |
| TOTAL EXPENSES | | 2,119,038 | |
| Reimbursements: | | | |
| Reimbursement of investment adviser fee (Note 5) | $(2,984) | | |
| Reimbursement of other operating expenses (Notes 2 and 5) | (8,492) | | |
| TOTAL REIMBURSEMENTS | | (11,476) | |
| Net expenses | | | 2,107,562 |
| Net investment income | | | 1,245,713 |
| Realized and Unrealized Gain (Loss) on Investments: | | | |
| Net realized gain on investments | | | 10,543,935 |
| Net change in unrealized appreciation of investments | | | (14,227,683) |
| Net realized and unrealized loss on investments | | | (3,683,748) |
| Change in net assets resulting from operations | | | $(2,438,035) |
See Notes which are an integral part of the Financial Statements
Annual Shareholder Report
Statement of Changes in Net Assets
| Year Ended July 31 | 2016 | 2015 |
| Increase (Decrease) in Net Assets | | |
| Operations: | | |
| Net investment income | $1,245,713 | $688,318 |
| Net realized gain on investments | 10,543,935 | 23,954,092 |
| Net change in unrealized appreciation/depreciation of investments | (14,227,683) | (12,475,569) |
| CHANGE IN NET ASSETS RESULTING FROM OPERATIONS | (2,438,035) | 12,166,841 |
| Distributions to Shareholders: | | |
| Distributions from net investment income | | |
| Class A Shares | (331,676) | (54,414) |
| Class C Shares | (74,346) | — |
| Class R Shares | (30,147) | — |
| Institutional Shares | (834,843) | (280,741) |
| CHANGE IN NET ASSETS RESULTING FROM DISTRIBUTIONS TO SHAREHOLDERS | (1,271,012) | (335,155) |
| Share Transactions: | | |
| Proceeds from sale of shares | 16,202,436 | 46,770,875 |
| Net asset value of shares issued to shareholders in payment of distributions declared | 1,208,182 | 324,870 |
| Cost of shares redeemed | (36,433,688) | (42,409,715) |
| CHANGE IN NET ASSETS RESULTING FROM SHARE TRANSACTIONS | (19,023,070) | 4,686,030 |
| Change in net assets | (22,732,117) | 16,517,716 |
| Net Assets: | | |
| Beginning of period | 164,483,395 | 147,965,679 |
| End of period (including undistributed net investment income of $662,609 and $687,908, respectively) | $141,751,278 | $164,483,395 |
See Notes which are an integral part of the Financial Statements
Annual Shareholder Report
Notes to Financial Statements
July 31, 2016
1. ORGANIZATION
Federated MDT Series (the “Trust”) is registered under the Investment Company Act of 1940, as amended (the “Act”), as an open-end management investment company. The Trust consists of five portfolios. The financial statements included herein are only those of Federated MDT All Cap Core Fund (the “Fund”), a diversified portfolio. The financial statements of the other portfolios are presented separately. The assets of each portfolio are segregated and a shareholder's interest is limited to the portfolio in which shares are held. Each portfolio pays its own expenses. The Fund offers four classes of shares: Class A Shares, Class C Shares, Class R Shares and Institutional Shares. All shares of the Fund have equal rights with respect to voting, except on class-specific matters. On June 20, 2016, Class R Shares were closed to new accounts/investors. The investment objective of the Fund is long-term capital appreciation.
2. SIGNIFICANT ACCOUNTING POLICIES
The following is a summary of significant accounting policies consistently followed by the Fund in the preparation of its financial statements. These policies are in conformity with U.S. generally accepted accounting principles (GAAP).
Investment Valuation
In calculating its net asset value (NAV), the Fund generally values investments as follows:
| ■ | Equity securities listed on an exchange or traded through a regulated market system are valued at their last reported sale price or official closing price in their principal exchange or market. |
| ■ | Shares of other mutual funds or non-exchange-traded investment companies are valued based upon their reported NAVs. |
| ■ | Fixed-income securities acquired with remaining maturities greater than 60 days are fair valued using price evaluations provided by a pricing service approved by the Board of Trustees (the “Trustees”). |
| ■ | Fixed-income securities and repurchase agreements acquired with remaining maturities of 60 days or less are valued at their cost (adjusted for the accretion of any discount or amortization of any premium), unless the issuer's creditworthiness is impaired or other factors indicate that amortized cost is not an accurate estimate of the investment's fair value, in which case it would be valued in the same manner as a longer-term security. |
| ■ | Derivative contracts listed on exchanges are valued at their reported settlement or closing price, except that options are valued at the mean of closing bid and asked quotations. |
| ■ | Over-the-counter (OTC) derivative contracts are fair valued using price evaluations provided by a pricing service approved by the Trustees. |
| ■ | For securities that are fair valued in accordance with procedures established by and under the general supervision of the Trustees, certain factors may be considered such as: the last traded or purchase price of the security, information obtained by contacting the issuer or dealers, analysis of the issuer's financial statements or other available documents, fundamental analytical data, the nature and duration of restrictions on disposition, the movement of the market in which the security is normally traded, public trading in similar securities or derivative contracts of the issuer or comparable issuers, movement of a relevant index, or other factors including but not limited to industry changes and relevant government actions. |
Annual Shareholder Report
If any price, quotation, price evaluation or other pricing source is not readily available when the NAV is calculated, or if the Fund cannot obtain price evaluations from a pricing service or from more than one dealer for an investment within a reasonable period of time as set forth in the Fund's valuation policies and procedures, the Fund uses the fair value of the investment determined in accordance with the procedures described below. There can be no assurance that the Fund could obtain the fair value assigned to an investment if it sold the investment at approximately the time at which the Fund determines its NAV per share.
Fair Valuation Procedures
The Trustees have ultimate responsibility for determining the fair value of investments for which market quotations are not readily available. The Trustees have appointed a valuation committee (“Valuation Committee”) comprised of officers of the Fund, Federated MDTA LLC (“Adviser”) and certain of the Adviser's affiliated companies to assist in determining fair value and in overseeing the calculation of the NAV. The Trustees have also authorized the use of pricing services recommended by the Valuation Committee to provide fair value evaluations of the current value of certain investments for purposes of calculating the NAV. The Valuation Committee employs various methods for reviewing third-party pricing-service evaluations including periodic reviews of third-party pricing services' policies, procedures and valuation methods (including key inputs, methods, models and assumptions), transactional back-testing, comparisons of evaluations of different pricing services, and review of price challenges by the Adviser based on recent market activity. In the event that market quotations and price evaluations are not available for an investment, the Valuation Committee determines the fair value of the investment in accordance with procedures adopted by the Trustees. The Trustees periodically review and approve the fair valuations made by the Valuation Committee and any changes made to the procedures.
Factors considered by pricing services in evaluating an investment include the yields or prices of investments of comparable quality, coupon, maturity, call rights and other potential prepayments, terms and type, reported transactions, indications as to values from dealers and general market conditions. Some pricing services provide a single price evaluation reflecting the bid-side of the market for an investment (a “bid” evaluation). Other pricing services offer both bid evaluations and price evaluations indicative of a price between the prices bid and asked for the investment (a “mid” evaluation). The Fund normally uses bid evaluations for any U.S. Treasury and Agency securities, mortgage-backed securities and municipal securities. The Fund normally uses mid evaluations for any other types of fixed-income securities and any OTC derivative contracts. In the event that market quotations and price evaluations are not available for an investment, the fair value of the investment is determined in accordance with procedures adopted by the Trustees.
Repurchase Agreements
The Fund may invest in repurchase agreements for short-term liquidity purposes. It is the policy of the Fund to require the other party to a repurchase agreement to transfer to the Fund's custodian or sub-custodian eligible securities or cash with a market value (after transaction costs) at least equal to the repurchase price to be paid under the repurchase agreement. The eligible securities are transferred to accounts with the custodian or sub-custodian in which the Fund holds a “securities entitlement” and exercises “control” as those terms are defined in the Uniform Commercial Code. The Fund has established procedures for monitoring the market value of the transferred securities and requiring the transfer of
Annual Shareholder Report
additional eligible securities if necessary to equal at least the repurchase price. These procedures also allow the other party to require securities to be transferred from the account to the extent that their market value exceeds the repurchase price or in exchange for other eligible securities of equivalent market value.
The insolvency of the other party or other failure to repurchase the securities may delay the disposition of the underlying securities or cause the Fund to receive less than the full repurchase price. Under the terms of the repurchase agreement, any amounts received by the Fund in excess of the repurchase price and related transaction costs must be remitted to the other party.
The Fund may enter into repurchase agreements in which eligible securities are transferred into joint trading accounts maintained by the custodian or sub-custodian for investment companies and other clients advised by the Adviser and its affiliates. The Fund will participate on a pro rata basis with the other investment companies and clients in its share of the securities transferred under such repurchase agreements and in its share of proceeds from any repurchase or other disposition of such securities.
Investment Income, Gains and Losses, Expenses and Distributions
Investment transactions are accounted for on a trade-date basis. Realized gains and losses from investment transactions are recorded on an identified-cost basis. Interest income and expenses are accrued daily. Dividend income and distributions to shareholders are recorded on the ex-dividend date. Foreign dividends are recorded on the ex-dividend date or when the Fund is informed of the ex-dividend date. Distributions of net investment income, if any, are declared and paid annually. Non-cash dividends included in dividend income, if any, are recorded at fair value. Investment income, realized and unrealized gains and losses, and certain fund-level expenses are allocated to each class based on relative average daily net assets, except that Class A Shares, Class C Shares, Class R Shares and Institutional Shares may bear distribution services fees, other service fees and transfer agent fees unique to those classes. The detail of the total fund expense reimbursements of $11,476 is disclosed in this Note 2 and Note 5. For the year ended July 31, 2016, transfer agent fees for the Fund were as follows:
| | Transfer
Agent Fees
Incurred | Transfer
Agent Fees
Reimbursed |
| Class A Shares | $51,922 | $(8,492) |
| Class C Shares | 59,088 | — |
| Class R Shares | 17,831 | — |
| Institutional Shares | 59,706 | — |
| TOTAL | $188,547 | $(8,492) |
Dividends are declared separately for each class. No class has preferential dividend rights; differences in per share dividend rates are generally due to differences in separate class expenses.
Annual Shareholder Report
Other Service Fees
The Fund may pay other service fees up to 0.25% of the average daily net assets of the Fund's Class A Shares and Class C Shares to unaffiliated financial intermediaries or to Federated Shareholder Services Company (FSSC) for providing services to shareholders and maintaining shareholder accounts. For the year ended July 31, 2016, other service fees for the Fund were as follows:
| | Other Service
Fees Incurred |
| Class A Shares | $90,053 |
| Class C Shares | 92,864 |
| TOTAL | $182,917 |
Premium and Discount Amortization
All premiums and discounts on fixed-income securities are amortized/accreted using the effective-interest-rate method.
Federal Taxes
It is the Fund's policy to comply with the Subchapter M provision of the Internal Revenue Code (the “Code”) and to distribute to shareholders each year substantially all of its income. Accordingly, no provision for federal income tax is necessary. As of and during the year ended July 31, 2016, the Fund did not have a liability for any uncertain tax positions. The Fund recognizes interest and penalties, if any, related to tax liabilities as income tax expense in the Statement of Operations. As of July 31, 2016, tax years 2013 through 2016 remain subject to examination by the Fund's major tax jurisdictions, which include the United States of America and the Commonwealth of Massachusetts.
The Fund may be subject to taxes imposed by governments of countries in which it invests. Such taxes are generally based on either income or gains earned or repatriated. The Fund accrues and applies such taxes to net investment income, net realized gains and net unrealized gains as income and/or gains are earned.
When-Issued and Delayed-Delivery Transactions
The Fund may engage in when-issued or delayed-delivery transactions. The Fund records when-issued securities on the trade date and maintains security positions such that sufficient liquid assets will be available to make payment for the securities purchased. Securities purchased on a when-issued or delayed-delivery basis are marked to market daily and begin earning interest on the settlement date. Losses may occur on these transactions due to changes in market conditions or the failure of counterparties to perform under the contract.
Other
The preparation of financial statements in conformity with GAAP requires management to make estimates and assumptions that affect the amounts of assets, liabilities, expenses and revenues reported in the financial statements. Actual results could differ from those estimated. The Fund applies Investment Company accounting and reporting guidance.
Annual Shareholder Report
3. SHARES OF BENEFICIAL INTEREST
The following tables summarize share activity:
| Year Ended July 31 | 2016 | 2015 |
| Class A Shares: | Shares | Amount | Shares | Amount |
| Shares sold | 219,344 | $4,566,247 | 495,711 | $10,691,452 |
| Shares issued to shareholders in payment of distributions declared | 15,315 | 317,790 | 2,376 | 52,057 |
| Shares redeemed | (513,803) | (10,627,905) | (851,485) | (18,382,289) |
NET CHANGE RESULTING FROM
CLASS A SHARE TRANSACTIONS | (279,144) | $(5,743,868) | (353,398) | $(7,638,780) |
| Year Ended July 31 | 2016 | 2015 |
| Class C Shares: | Shares | Amount | Shares | Amount |
| Shares sold | 219,633 | $4,264,493 | 612,017 | $12,394,286 |
| Shares issued to shareholders in payment of distributions declared | 3,342 | 66,135 | — | — |
| Shares redeemed | (416,914) | (8,026,807) | (426,212) | (8,772,133) |
| NET CHANGE RESULTING FROM CLASS C SHARE TRANSACTIONS | (193,939) | $(3,696,179) | 185,805 | $3,622,153 |
| Year Ended July 31 | 2016 | 2015 |
| Class R Shares: | Shares | Amount | Shares | Amount |
| Shares sold | 87,503 | $1,760,683 | 127,210 | $2,715,467 |
| Shares issued to shareholders in payment of distributions declared | 1,465 | 30,064 | — | — |
| Shares redeemed | (111,552) | (2,251,362) | (108,214) | (2,323,679) |
NET CHANGE RESULTING FROM
CLASS R SHARE TRANSACTIONS | (22,584) | $(460,615) | 18,996 | $391,788 |
| Year Ended July 31 | 2016 | 2015 |
| Institutional Shares: | Shares | Amount | Shares | Amount |
| Shares sold | 269,327 | $5,611,013 | 963,004 | $20,969,670 |
| Shares issued to shareholders in payment of distributions declared | 37,891 | 794,193 | 12,322 | 272,813 |
| Shares redeemed | (744,427) | (15,527,614) | (597,814) | (12,931,614) |
NET CHANGE RESULTING
FROM INSTITUTIONAL SHARE TRANSACTIONS | (437,209) | $(9,122,408) | 377,512 | $8,310,869 |
| NET CHANGE RESULTING FROM TOTAL FUND SHARE TRANSACTIONS | (932,876) | $(19,023,070) | 288,915 | $4,686,030 |
Annual Shareholder Report
4. FEDERAL TAX INFORMATION
The tax character of distributions as reported on the Statement of Changes in Net Assets for the years ended July 31, 2016 and 2015, was as follows:
| | 2016 | 2015 |
| Ordinary income | $1,271,012 | $335,155 |
As of July 31, 2016, the components of distributable earnings on a tax-basis were as follows:
| Undistributed ordinary income | $662,609 |
| Net unrealized appreciation | $3,275,383 |
| Capital loss carryforwards | $(67,901,878) |
The difference between book-basis and tax-basis net unrealized appreciation/depreciation is attributable to differing treatments for the deferral of losses on wash sales.
At July 31, 2016, the cost of investments for federal tax purposes was $137,931,874. The net unrealized appreciation of investments for federal tax purposes was $3,275,383. This consists of net unrealized appreciation from investments for those securities having an excess of value over cost of $13,969,275 and net unrealized depreciation from investments for those securities having an excess of cost over value of $10,693,892.
At July 31, 2016, the Fund had a capital loss carryforward of $67,901,878 which will reduce the Fund's taxable income arising from future net realized gains on investments, if any, to the extent permitted by the Code, thereby reducing the amount of distributions to shareholders which would otherwise be necessary to relieve the Fund of any liability for federal income tax. Pursuant to the Code, a net capital loss incurred in taxable years beginning on or before December 22, 2010, is characterized as short-term and may be carried forward for a maximum of eight tax years (“Carryforward Limit”), whereas a net capital loss incurred in taxable years beginning after December 22, 2010, retains its character as either short-term or long-term, does not expire and is required to be utilized prior to the losses which have a Carryforward Limit.
The following schedule summarizes the Fund's capital loss carryforwards and expiration years:
| Expiration Year | Short-Term | Long-Term | Total |
| 2017 | $423,018 | NA | $423,018 |
| 2018 | $67,478,860 | NA | $67,478,860 |
As a result of the March 2010 tax-free transfer of assets from Federated MDT Tax Aware/All Cap Core Fund, the use of certain capital loss carryforwards listed above may be limited.
The Fund used capital loss carryforwards of $10,481,658 to offset capital gains realized during the year ended July 31, 2016.
Annual Shareholder Report
5. INVESTMENT ADVISER FEE AND OTHER TRANSACTIONS WITH AFFILIATES
Investment Adviser Fee
The advisory agreement between the Fund and the Adviser provides for an annual fee equal to 0.75% of the Fund's average daily net assets. The Adviser may voluntarily choose to waive any portion of its fee and/or reimburse certain operating expenses of the Fund. For the year ended July 31, 2016, the Adviser voluntarily reimbursed $8,492 of transfer agent fees.
Administrative Fee
Federated Administrative Services (FAS), under the Administrative Services Agreement, provides the Fund with administrative personnel and services. For purposes of determining the appropriate rate breakpoint, “Investment Complex” is defined as all of the Federated Funds subject to a fee under the Administrative Services Agreement. The fee paid to FAS is based on the average daily net assets of the Investment Complex as specified below, plus certain out-of-pocket expenses:
| Administrative Fee | Average Daily Net Assets
of the Investment Complex |
| 0.150% | on the first $5 billion |
| 0.125% | on the next $5 billion |
| 0.100% | on the next $10 billion |
| 0.075% | on assets in excess of $20 billion |
FAS may voluntarily choose to waive any portion of its fee. For the year ended July 31, 2016, the annualized fee paid to FAS was 0.078% of average daily net assets of the Fund.
Distribution Services Fee
The Fund has adopted a Distribution Plan (the “Plan”) pursuant to Rule 12b-1 under the Act. Under the terms of the Plan, the Fund will compensate Federated Securities Corp. (FSC), the principal distributor, from the daily net assets of the Fund's Class A Shares, Class C Shares and Class R Shares to finance activities intended to result in the sale of these shares. The Plan provides that the Fund may incur distribution expenses at the following percentages of average daily net assets annually, to compensate FSC:
| Share Class Name | Percentage of Average Daily
Net Assets of Class |
| Class A Shares | 0.05% |
| Class C Shares | 0.75% |
| Class R Shares | 0.50% |
FSC may voluntarily choose to waive any portion of its fee. For the year ended July 31, 2016, distribution services fees for the Fund were as follows:
| | Distribution Services
Fees Incurred |
| Class C Shares | $278,593 |
| Class R Shares | 28,522 |
| TOTAL | $307,115 |
Annual Shareholder Report
When FSC receives fees, it may pay some or all of them to financial intermediaries whose customers purchase shares. For the year ended July 31, 2016, FSC retained $25,203 of fees paid by the Fund. For the year ended July 31, 2016, the Fund's Class A Shares did not incur a distribution services fee; however, it may begin to incur this fee upon approval of the Trustees.
Other Service Fees
For the year ended July 31, 2016, FSSC received $3,672 of the other service fees disclosed in Note 2.
Sales Charges
Front-end sales charges and contingent deferred sales charges (CDSC) do not represent expenses of the Fund. They are deducted from the proceeds of sales of Fund shares prior to investment or from redemption proceeds prior to remittance, as applicable. For the year ended July 31, 2016, FSC retained $4,083 in sales charges from the sale of Class A Shares. FSC also retained $217 of CDSC relating to redemptions of Class A Shares and $2,279 relating to redemptions of Class C Shares.
General
Certain Officers and Trustees of the Fund are Officers and Directors or Trustees of certain of the above companies. To efficiently facilitate payment, Directors'/Trustees' fees and certain expenses related to conducting meetings of the Directors/Trustees and other miscellaneous expenses are paid by an affiliate of the Adviser which in due course are reimbursed by the Fund. Such expenses may be included in Accrued and Miscellaneous Expenses on the Statement of Assets and Liabilities and Statement of Operations, respectively.
Transactions Involving Affiliated Holdings
Affiliated holdings are investment companies which are managed by the Adviser or an affiliate of the Adviser. The Adviser has agreed to reimburse the Fund for certain investment adviser fees as a result of transactions in other affiliated investment companies. For the year ended July 31, 2016, the Adviser reimbursed the Fund $2,984. Transactions involving the affiliated holding during the year ended July 31, 2016, were as follows:
| | Federated
Institutional
Prime Value
Obligations Fund,
Institutional Shares |
| Balance of Shares Held 7/31/2015 | 3,340,032 |
| Purchases/Additions | 25,608,639 |
| Sales/Reductions | (26,875,099) |
| Balance of Shares Held 7/31/2016 | 2,073,572 |
| Value | $2,073,572 |
| Dividend Income | $7,728 |
Annual Shareholder Report
6. Investment TRANSACTIONS
Purchases and sales of investments, excluding long-term U.S. government securities and short-term obligations, for the year ended July 31, 2016, were as follows:
| Purchases | $88,445,672 |
| Sales | $106,815,983 |
7. LINE OF CREDIT
The Fund participates with certain other Federated Funds, on a several basis, in an up to $500,000,000 unsecured, 364-day, committed, revolving line of credit (LOC) agreement. The LOC was made available to finance temporarily the repurchase or redemption of shares of the Fund, failed trades, payment of dividends, settlement of trades and for other short-term, temporary or emergency general business purposes. The Fund cannot borrow under the LOC if an inter-fund loan is outstanding. The Fund's ability to borrow under the LOC also is subject to the limitations of the Act and various conditions precedent that must be satisfied before the Fund can borrow. Loans under the LOC are charged interest at a fluctuating rate per annum equal to the highest, on any day, of (a) (i) the federal funds effective rate, (ii) the one month London Interbank Offer Rate (LIBOR), and (iii) 0.0%, plus (b) a margin. The LOC also requires the Fund to pay, quarterly in arrears and at maturity, its pro rata share of a commitment fee based on the amount of the lenders' commitment that has not been utilized. As of July 31, 2016, the Fund had no outstanding loans. During the year ended July 31, 2016, the Fund did not utilize the LOC.
8. INTERFUND LENDING
Pursuant to an Exemptive Order issued by the Securities and Exchange Commission, the Fund, along with other funds advised by subsidiaries of Federated Investors, Inc., may participate in an interfund lending program. This program provides an alternative credit facility allowing the Fund to borrow from other participating affiliated funds. As of July 31, 2016, there were no outstanding loans. During the year ended July 31, 2016, the program was not utilized.
9. FEDERAL TAX INFORMATION (UNAUDITED)
For the fiscal year ended July 31, 2016, 100% of total income distributions made by the Fund are qualifying dividends which may be subject to a maximum tax rate of 15%, as provided for by the Jobs and Growth Tax Relief Act of 2003. Complete information is reported in conjunction with the reporting of your distributions on Form 1099-DIV.
Of the ordinary income distributions made by the Fund during the year ended July 31, 2016, 100% qualify for the dividend received deduction available to corporate shareholders.
10. Subsequent Event
On August 31, 2016, Class R Shares were closed to new purchases by existing shareholders. Effective September 1, 2016, the Class R Shares were redesignated as Class R6 Shares and are available to new accounts as well as new purchases by existing shareholders.
Annual Shareholder Report
Report of Independent Registered Public Accounting Firm
TO THE BOARD OF trustees OF Federated MDt series AND SHAREHOLDERS OF federated mdt all cap core fund:
We have audited the accompanying statement of assets and liabilities of Federated MDT All Cap Core Fund (the “Fund”) (one of the portfolios constituting Federated MDT Series), including the portfolio of investments, as of July 31, 2016, and the related statement of operations for the year then ended, the statement of changes in net assets for each of the two years in the period then ended, and the financial highlights for each of the five years in the period then ended. These financial statements and financial highlights are the responsibility of the Fund's management. Our responsibility is to express an opinion on these financial statements and financial highlights based on our audits.
We conducted our audits in accordance with standards of the Public Company Accounting Oversight Board (United States). Those standards require that we plan and perform the audit to obtain reasonable assurance about whether the financial statements and financial highlights are free of material misstatement. We were not engaged to perform an audit of the Fund's internal control over financial reporting. Our audits included consideration of internal control over financial reporting as a basis for designing audit procedures that are appropriate in the circumstances, but not for the purpose of expressing an opinion on the effectiveness of the Fund's internal control over financial reporting. Accordingly, we express no such opinion. An audit also includes examining, on a test basis, evidence supporting the amounts and disclosures in the financial statements and financial highlights, assessing the accounting principles used and significant estimates made by management, and evaluating the overall financial statement presentation. Our procedures included confirmation of securities owned as of July 31, 2016 by correspondence with the custodian and others or by other appropriate auditing procedures where replies from others were not received. We believe that our audits provide a reasonable basis for our opinion.
In our opinion, the financial statements and financial highlights referred to above present fairly, in all material respects, the financial position of Federated MDT All Cap Core Fund, a portfolio of Federated MDT Series, at July 31, 2016, the results of its operations for the year then ended, the changes in its net assets for each of the two years in the period then ended, and the financial highlights for each of the five years in the period then ended, in conformity with U.S. generally accepted accounting principles.
Boston, Massachusetts
September 22, 2016
Annual Shareholder Report
Shareholder Expense Example (unaudited)
As a shareholder of the Fund, you incur two types of costs: (1) transaction costs, including sales charges (loads) on purchase or redemption payments; and (2) ongoing costs, including management fees and to the extent applicable, distribution (12b-1) fees and/or other service fees and other Fund expenses. This Example is intended to help you to understand your ongoing costs (in dollars) of investing in the Fund and to compare these costs with the ongoing costs of investing in other mutual funds. It is based on an investment of $1,000 invested at the beginning of the period and held for the entire period from February 1, 2016 to July 31, 2016.
ACTUAL EXPENSES
The first section of the table below provides information about actual account values and actual expenses. You may use the information in this section, together with the amount you invested, to estimate the expenses that you incurred over the period. Simply divide your account value by $1,000 (for example, an $8,600 account value divided by $1,000 = 8.6), then multiply the result by the number in the first section under the heading entitled “Expenses Paid During Period” to estimate the expenses attributable to your investment during this period.
HYPOTHETICAL EXAMPLE FOR COMPARISON PURPOSES
The second section of the table below provides information about hypothetical account values and hypothetical expenses based on the Fund's actual expense ratio and an assumed rate of return of 5% per year before expenses, which is not the Fund's actual return. Thus, you should not use the hypothetical account values and expenses to estimate the actual ending account balance or your expenses for the period. Rather, these figures are required to be provided to enable you to compare the ongoing costs of investing in the Fund with other funds. To do so, compare this 5% hypothetical example with the 5% hypothetical examples that appear in the shareholder reports of the other funds.
Annual Shareholder Report
Please note that the expenses shown in the table are meant to highlight your ongoing costs only and do not reflect any transaction costs, such as sales charges (loads) on purchase or redemption payments. Therefore, the second section of the table is useful in comparing ongoing costs only, and will not help you determine the relative total costs of owning different funds. In addition, if these transaction costs were included, your costs would have been higher.
| | Beginning
Account Value
2/1/2016 | Ending
Account Value
7/31/2016 | Expenses Paid
During Period1 |
| Actual: | | | |
| Class A Shares | $1,000 | $1,138.60 | $7.18 |
| Class C Shares | $1,000 | $1,133.90 | $11.41 |
| Class R Shares | $1,000 | $1,136.10 | $9.56 |
| Institutional Shares | $1,000 | $1,140.30 | $5.75 |
Hypothetical (assuming a 5% return
before expenses): | | | |
| Class A Shares | $1,000 | $1,018.15 | $6.77 |
| Class C Shares | $1,000 | $1,014.17 | $10.77 |
| Class R Shares | $1,000 | $1,015.91 | $9.02 |
| Institutional Shares | $1,000 | $1,019.49 | $5.42 |
| 1 | Expenses are equal to the Fund's annualized net expense ratios, multiplied by the average account value over the period, multiplied by 182/366 (to reflect the one-half-year period). The annualized net expense ratios are as follows: |
| | |
| Class A Shares | 1.35% |
| Class C Shares | 2.15% |
| Class R Shares | 1.80% |
| Institutional Shares | 1.08% |
Annual Shareholder Report
Board of Trustees and Trust Officers
The Board of Trustees is responsible for managing the Trust's business affairs and for exercising all the Trust's powers except those reserved for the shareholders. The following tables give information about each Trustee and the senior officers of the Fund. Where required, the tables separately list Trustees who are “interested persons” of the Fund (i.e., “Interested” Trustees) and those who are not (i.e., “Independent” Trustees). Unless otherwise noted, the address of each person listed is Federated Investors Tower, 1001 Liberty Avenue, Pittsburgh, PA 15222. The address of all Independent Trustees listed is 4000 Ericsson Drive, Warrendale, PA 15086-7561; Attention: Mutual Fund Board. As of December 31, 2015, the Trust comprised five portfolio(s), and the Federated Fund Family consisted of 38 investment companies (comprising 122 portfolios). Unless otherwise noted, each Officer is elected annually. Unless otherwise noted, each Trustee oversees all portfolios in the Federated Fund Family and serves for an indefinite term. The Fund's Statement of Additional Information includes additional information about Trust Trustees and is available, without charge and upon request, by calling 1-800-341-7400.
Interested TRUSTEES Background
Name
Birth Date
Positions Held with Trust
Date Service Began | Principal Occupation(s) for Past Five Years,
Other Directorships Held and Previous Position(s) |
J. Christopher Donahue*
Birth Date: April 11, 1949
President and Trustee
Indefinite Term
Began serving: May 2006 | Principal Occupations: Principal Executive Officer and President of certain of the Funds in the Federated Fund Family; Director or Trustee of the Funds in the Federated Fund Family; President, Chief Executive Officer and Director, Federated Investors, Inc.; Chairman and Trustee, Federated Investment Management Company; Trustee, Federated Investment Counseling; Chairman and Director, Federated Global Investment Management Corp.; Chairman, Federated Equity Management Company of Pennsylvania and Passport Research, Ltd. (investment advisory subsidiary of Federated); Trustee, Federated Shareholder Services Company; Director, Federated Services Company.
Previous Positions: President, Federated Investment Counseling; President and Chief Executive Officer, Federated Investment Management Company, Federated Global Investment Management Corp. and Passport Research, Ltd. |
Annual Shareholder Report
Name
Birth Date
Positions Held with Trust
Date Service Began | Principal Occupation(s) for Past Five Years,
Other Directorships Held and Previous Position(s) |
John B. Fisher*
Birth Date: May 16, 1956
Trustee
Indefinite Term
Began serving: May 2016 | Principal Occupations: Principal Executive Officer and President of certain of the Funds in the Federated Fund Family; Director or Trustee of certain of the Funds in the Federated Fund Family; Vice President, Federated Investors, Inc.; President, Director/Trustee and CEO, Federated Advisory Services Company, Federated Equity Management Company of Pennsylvania, Federated Global Investment Management Corp., Federated Investment Counseling, Federated Investment Management Company; President and CEO of Passport Research, Ltd.; President of some of the Funds in the Federated Fund Complex and Director, Federated Investors Trust Company.
Previous Positions: President and Director of the Institutional Sales Division of Federated Securities Corp.; President and Director of Federated Investment Counseling; Director, Edgewood Securities Corp.; Director, Federated Services Company; Director, Federated Investors, Inc.; Chairman and Director, Southpointe Distribution Services, Inc. and President, Technology, Federated Services Company. |
| * | Reasons for “interested” status: J. Christopher Donahue and John B. Fisher are interested due to their beneficial ownership of shares of Federated Investors, Inc. and due to positions they hold with Federated and its subsidiaries. J. Christopher Donahue is the son of John F. Donahue, Chairman Emeritus of the Federated Funds. |
INDEPENDENT TRUSTEES Background
Name
Birth Date
Positions Held with Trust
Date Service Began | Principal Occupation(s) for Past Five Years,
Other Directorships Held, Previous Position(s) and Qualifications |
John T. Collins
Birth Date: January 24, 1947
Trustee
Indefinite Term
Began serving: October 2013 | Principal Occupations: Director or Trustee of the Federated Fund Family; Retired.
Other Directorships Held: Director, Chair of the Compensation Committee, Audit Committee member, KLX Corp.
Qualifications: Mr. Collins has served in several business and financial management roles and directorship positions throughout his career. Mr. Collins previously served as Chairman and CEO, The Collins Group, Inc. (a private equity firm). Mr. Collins serves as Chairman Emeriti, Bentley University. Mr. Collins previously served as Director, FleetBoston Financial Corp.; Director and Audit Committee Member, Bank of America Corp. and Director, Beth Israel Deaconess Medical Center (Harvard University Affiliate Hospital). |
Annual Shareholder Report
Name
Birth Date
Positions Held with Trust
Date Service Began | Principal Occupation(s) for Past Five Years,
Other Directorships Held, Previous Position(s) and Qualifications |
G. Thomas Hough
Birth Date: February 28, 1955
Trustee
Indefinite Term
Began serving: August 2015 | Principal Occupations: Director or Trustee of the Federated Fund Family; Retired.
Other Directorships Held: Director, Chair of the Audit Committee, Governance Committee, Publix Super Markets, Inc.
Qualifications: Mr. Hough has served in accounting, business management and directorship positions throughout his career. Mr. Hough most recently held the position of Americas Vice Chair of Assurance with Ernst & Young LLP. Mr. Hough is an Executive Committee member of the United States Golf Association, he serves on the President's Cabinet and Business School Board of Visitors for the University of Alabama and is on the Business School Board of Visitors for Wake Forest University. |
Maureen Lally-Green
Birth Date: July 5, 1949
Trustee
Indefinite Term
Began serving: August 2009 | Principal Occupations: Director or Trustee of the Federated Fund Family; Interim Dean of the Duquesne University School of Law; Adjunct Professor of Law, Duquesne University School of Law.
Other Directorships Held: Director, CONSOL Energy Inc.
Qualifications: Judge Lally-Green has served in various legal and business roles and directorship positions throughout her career. Judge Lally-Green previously served as: Associate General Secretary, Diocese of Pittsburgh; a member of the Superior Court of Pennsylvania; and as a Professor of Law, Duquesne University School of Law. Judge Lally-Green also holds the positions on either a public or not for profit Board of Directors as follows: Member, Pennsylvania State Board of Education (public); Director and Chair, UPMC Mercy Hospital; Regent, St. Vincent Seminary; Director and Vice Chair, Our Campaign for the Church Alive!, Inc.; Director, Saint Vincent College; and Director and Chair, Cardinal Wuerl North Catholic High School, Inc. Judge Lally-Green has held the positions of: Director, Auberle; Director, Ireland Institute of Pittsburgh; Director, Saint Thomas More Society; and Director, Catholic High Schools of the Diocese of Pittsburgh, Inc. |
Peter E. Madden
Birth Date: March 16, 1942
Trustee
Indefinite Term
Began serving: June 2006 | Principal Occupation: Director or Trustee, and Chair of the Board of Directors or Trustees, of the Federated Fund Family; Retired.
Other Directorships Held: None.
Qualifications: Mr. Madden has served in several business management, mutual fund services and directorship positions throughout his career. Mr. Madden previously served as President, Chief Operating Officer and Director, State Street Bank and Trust Company (custodian bank) and State Street Corporation (financial services). He was Director, VISA USA and VISA International and Chairman and Director, Massachusetts Bankers Association. Mr. Madden served as Director, Depository Trust Corporation and Director, The Boston Stock Exchange. Mr. Madden also served as a Representative to the Commonwealth of Massachusetts General Court. |
Annual Shareholder Report
Name
Birth Date
Positions Held with Trust
Date Service Began | Principal Occupation(s) for Past Five Years,
Other Directorships Held, Previous Position(s) and Qualifications |
Charles F. Mansfield, Jr.
Birth Date: April 10, 1945
Trustee
Indefinite Term
Began serving: June 2006 | Principal Occupations: Director or Trustee of the Federated Fund Family; Management Consultant.
Other Directorships Held: None.
Qualifications: Mr. Mansfield has served in several banking, business management and educational roles and directorship positions throughout his career. Mr. Mansfield previously served as Chief Executive Officer, PBTC International Bank; Partner, Arthur Young & Company (now Ernst & Young LLP); Chief Financial Officer of Retail Banking Sector, Chase Manhattan Bank; Senior Vice President, HSBC Bank USA (formerly, Marine Midland Bank); Vice President, Citibank; Assistant Professor of Banking and Finance, Frank G. Zarb School of Business, Hofstra University; Executive Vice President DVC Group, Inc. (marketing, communications and technology). |
Thomas M. O'Neill
Birth Date: June 14, 1951
Trustee
Indefinite Term
Began serving: October 2006 | Principal Occupations: Director or Trustee, Chair of the Audit Committee of the Federated Fund Family; Sole Proprietor, Navigator Management Company (investment and strategic consulting).
Other Directorships Held: None.
Qualifications: Mr. O'Neill has served in several business, mutual fund and financial management roles and directorship positions throughout his career. Mr. O'Neill serves as Director, Medicines for Humanity and Director, The Golisano Children's Museum of Naples, Florida. Mr. O'Neill previously served as Chief Executive Officer and President, Managing Director and Chief Investment Officer, Fleet Investment Advisors; President and Chief Executive Officer, Aeltus Investment Management, Inc.; General Partner, Hellman, Jordan Management Co., Boston, MA; Chief Investment Officer, The Putnam Companies, Boston, MA; Credit Analyst and Lending Officer, Fleet Bank; Director and Consultant, EZE Castle Software (investment order management software); and Director, Midway Pacific (lumber). |
P. Jerome Richey
Birth Date: February 23, 1949
Trustee
Indefinite Term
Began serving: October 2013 | Principal Occupations: Director or Trustee of the Federated Fund Family; Management Consultant.
Other Directorships Held: None.
Qualifications: Mr. Richey has served in several business and legal management roles and directorship positions throughout his career. Mr. Richey most recently held the positions of Senior Vice Chancellor and Chief Legal Officer, University of Pittsburgh. Mr. Richey serves as Board Member, Epilepsy Foundation of Western Pennsylvania and Board member, World Affairs Council of Pittsburgh. Mr. Richey previously served as Chief Legal Officer and Executive Vice President, CONSOL Energy Inc. and Shareholder, Buchanan Ingersoll & Rooney PC (a law firm). |
Annual Shareholder Report
Name
Birth Date
Positions Held with Trust
Date Service Began | Principal Occupation(s) for Past Five Years,
Other Directorships Held, Previous Position(s) and Qualifications |
John S. Walsh
Birth Date: November 28, 1957
Trustee
Indefinite Term
Began serving: June 2006 | Principal Occupations: Director or Trustee of the Federated Fund Family; President and Director, Heat Wagon, Inc. (manufacturer of construction temporary heaters); President and Director, Manufacturers Products, Inc. (distributor of portable construction heaters); President, Portable Heater Parts, a division of Manufacturers Products, Inc.
Other Directorships Held: None.
Qualifications: Mr. Walsh has served in several business management roles and directorship positions throughout his career. Mr. Walsh previously served as Vice President, Walsh & Kelly, Inc. (paving contractors). |
OFFICERS
Name
Birth Date
Address
Positions Held with Trust
Date Service Began | Principal Occupation(s) for Past Five Years
and Previous Position(s) |
John W. McGonigle
Birth Date: October 26, 1938
Secretary
Officer since: May 2006 | Principal Occupations: Executive Vice President and Secretary of the Federated Fund Family; Vice Chairman, Executive Vice President, Secretary and Director, Federated Investors, Inc.
Previous Positions: Trustee, Federated Investment Management Company and Federated Investment Counseling; Director, Federated Global Investment Management Corp., Federated Services Company and Federated Securities Corp. |
Lori A. Hensler
Birth Date: January 6, 1967
TREASURER
Officer since: April 2013 | Principal Occupations: Principal Financial Officer and Treasurer of the Federated Fund Family; Senior Vice President, Federated Administrative Services; Financial and Operations Principal for Federated Securities Corp. and Edgewood Services, Inc.; and Assistant Treasurer, Federated Investors Trust Company. Ms. Hensler has received the Certified Public Accountant designation.
Previous Positions: Controller of Federated Investors, Inc.; Senior Vice President and Assistant Treasurer, Federated Investors Management Company; Treasurer, Federated Investors Trust Company; Assistant Treasurer, Federated Administrative Services, Federated Administrative Services, Inc., Federated Securities Corp., Edgewood Services, Inc., Federated Advisory Services Company, Federated Equity Management Company of Pennsylvania, Federated Global Investment Management Corp., Federated Investment Counseling, Federated Investment Management Company, Passport Research, Ltd., and Federated MDTA, LLC; Financial and Operations Principal for Federated Securities Corp., Edgewood Services, Inc. and Southpointe Distribution Services, Inc. |
Annual Shareholder Report
Name
Birth Date
Address
Positions Held with Trust
Date Service Began | Principal Occupation(s) for Past Five Years
and Previous Position(s) |
Peter J. Germain
Birth Date: September 3, 1959
CHIEF LEGAL OFFICER
Officer since: June 2006 | Principal Occupations: Mr. Germain is Chief Legal Officer of the Federated Fund Family. He is General Counsel and Vice President, Federated Investors, Inc.; President, Federated Administrative Services and Federated Administrative Services, Inc.; Vice President, Federated Securities Corp.; Secretary, Federated Private Asset Management, Inc.; and Secretary, Retirement Plan Service Company of America. Mr. Germain joined Federated in 1984 and is a member of the Pennsylvania Bar Association.
Previous Positions: Deputy General Counsel, Special Counsel, Managing Director of Mutual Fund Services, Federated Investors, Inc.; Senior Vice President, Federated Services Company; and Senior Corporate Counsel, Federated Investors, Inc. |
Stephen F. Auth
Birth Date: September 13, 1956
101 Park Avenue
41st Floor
New York, NY 10178
CHIEF INVESTMENT OFFICER
Officer since: June 2012 | Principal Occupations: Stephen F. Auth is Chief Investment Officer of various Funds in the Federated Fund Family; Executive Vice President, Federated Investment Counseling, Federated Global Investment Management Corp. and Federated Equity Management Company of Pennsylvania.
Previous Positions: Executive Vice President, Federated Investment Management Company and Passport Research, Ltd. (investment advisory subsidiary of Federated); Senior Vice President, Global Portfolio Management Services Division; Senior Vice President, Federated Investment Management Company and Passport Research, Ltd.; Senior Managing Director and Portfolio Manager, Prudential Investments. |
Stephen Van Meter
Birth Date: June 5, 1975
CHIEF COMPLIANCE OFFICER AND SENIOR VICE PRESIDENT
Officer since: July 2015 | Principal Occupations: Senior Vice President and Chief Compliance Officer of the Federated Fund Family; Vice President and Chief Compliance Officer of Federated Investors, Inc. and Chief Compliance Officer of certain of its subsidiaries. Mr. Van Meter joined Federated in October 2011. He holds FINRA licenses under Series 3, 7, 24 and 66.
Previous Positions: Mr. Van Meter previously held the position of Compliance Operating Officer, Federated Investors, Inc. Prior to joining Federated, Mr. Van Meter served at the United States Securities and Exchange Commission in the positions of Senior Counsel, Office of Chief Counsel, Division of Investment Management and Senior Counsel, Division of Enforcement. |
Annual Shareholder Report
Evaluation and Approval of Advisory Contract–May 2016
Federated MDT All Cap Core Fund (the “Fund”)
Following a review and recommendation of approval by the Fund's independent trustees, the Fund's Board of Trustees (the “Board”) reviewed and unanimously approved at its May 2016 meetings the continuation of the Fund's investment advisory contract for an additional one-year term. The Board's decision regarding the contract reflects the exercise of its business judgment after consideration of all of the information received on whether to continue the existing arrangements.
The Board had previously appointed a Senior Officer, whose duties include specified responsibilities relating to the process by which advisory fees are to be charged to a Federated fund. The Senior Officer has the authority to retain consultants, experts, or staff as may be reasonably necessary to assist in the performance of his duties, reports directly to the Board, and may be terminated only with the approval of a majority of the independent members of the Board. The Senior Officer prepared and furnished to the Board an independent, written evaluation that covered topics discussed below (the “Senior Officer's Evaluation”). The Board considered the Senior Officer's Evaluation, along with other information, in deciding to approve the investment advisory contract.
The Board is also familiar with and considered judicial decisions concerning allegedly excessive investment advisory fees, which have indicated that the following factors may be relevant to an adviser's fiduciary duty with respect to its receipt of compensation from a fund: the nature and quality of the services provided by an adviser to a fund and its shareholders, including the performance and fees and expenses of the fund and of comparable funds; an adviser's cost of providing the services, including the profitability to an adviser of providing advisory services to a fund; the extent to which an adviser may realize “economies of scale” as a fund grows larger and, if such economies of scale exist, whether they have been shared with a fund and its shareholders or the family of funds; any “fall-out financial benefits” that accrue to an adviser because of its relationship with a fund (including research services received from brokers that execute fund trades and any fees paid to affiliates of an adviser for services rendered to a fund); comparative fee and expense structures, including a comparison of fees paid to an adviser with those paid by similar funds; and the extent of care, conscientiousness and independence with which board members perform their duties and their expertise, including whether they are fully informed about all facts the board deems relevant to its consideration of an adviser's services and fees. The Board noted that the Securities and Exchange Commission (“SEC”) disclosure requirements regarding the basis for the Board's approval of the Fund's investment advisory contract generally track the factors listed above. Consistent with these judicial decisions and SEC disclosure requirements, the Board also considered management fees charged to
Annual Shareholder Report
institutional and other clients of Federated MDTA LLC (the “Adviser”) for what might be viewed as like services. The Board was aware of these factors and was guided by them in its review of the Fund's investment advisory contract to the extent it considered them to be appropriate and relevant, as discussed further below.
The Board considered and weighed these circumstances in light of its substantial accumulated experience in governing the Fund and working with Federated Investors, Inc. and its affiliates (“Federated”) on matters relating to the Federated funds, and was assisted in its deliberations by independent legal counsel. Throughout the year, and in connection with its May meetings, the Board requested and received substantial and detailed information about the Fund and the Federated organization that was in addition to the extensive materials that comprise and accompany the Senior Officer's Evaluation. Federated provided much of this information at each regular meeting of the Board, and furnished additional substantial information in connection with the May meetings at which the Board's formal review of the investment advisory contract occurred. At the May meetings, in addition to meeting in separate sessions of the independent trustees without management present, senior management of the Adviser also met with the independent trustees and their counsel to discuss the materials presented and any other matters thought relevant by the Adviser or the trustees. Between regularly scheduled meetings, the Board also received information on particular matters as the need arose. Thus, the Board's consideration of the investment advisory contract included review of the Senior Officer's Evaluation, accompanying data and additional information covering such matters as: the Adviser's investment philosophy, revenue, profitability, personnel and processes; investment and operating strategies; the Fund's short- and long-term performance (in absolute terms, both on a gross basis and net of expenses, as well as in relationship to its particular investment program and certain competitor or “peer group” funds and/or other benchmarks, as appropriate), and comments on the reasons for performance; the Fund's investment objectives; the Fund's expenses (including the advisory fee itself and the overall expense structure of the Fund, both in absolute terms and relative to similar and/or competing funds, with due regard for contractual or voluntary expense limitations); the use and allocation of brokerage commissions derived from trading the Fund's portfolio securities (if any); and the nature, quality and extent of the advisory and other services provided to the Fund by the Adviser and its affiliates. The Board also considered the preferences and expectations of Fund shareholders; the entrepreneurial risk assumed by the Adviser in sponsoring the Fund; the continuing state of competition in the mutual fund industry and market practices; the range of comparable fees for similar funds in the mutual fund industry; the Fund's relationship to the Federated funds which include a comprehensive array of funds with different investment objectives, policies and strategies which are generally available for exchange without the incurrence of additional sales charges; compliance and
Annual Shareholder Report
audit reports concerning the Federated funds and the Federated companies that service them (including communications from regulatory agencies), as well as Federated's responses to any issues raised therein; and relevant developments in the mutual fund industry and how the Federated funds and/or Federated are responding to them. The Board's evaluation process is evolutionary. The criteria considered and the emphasis placed on relevant criteria change in recognition of changing circumstances in the mutual fund marketplace.
While mindful that courts have cautioned against giving such comparisons too much weight, the Board has found the use of comparisons of the Fund's fees and expenses to other mutual funds with comparable investment programs to be relevant to its deliberations. In this regard, the Board was presented with, and considered, information regarding the contractual advisory fee rates, net advisory fee rates, total expense ratios and each element of the Fund's total expense ratio (i.e., gross and net advisory fees, custody fees, portfolio accounting fees and transfer agency fees) relative to the Fund's peers. The Board focused on comparisons with other similar mutual funds more heavily than non-mutual fund products or services because it is believed that they are more relevant. For example, other mutual funds are the products most like the Fund, they are readily available to Fund shareholders as alternative investment vehicles, and they are the type of investment vehicle in fact chosen and maintained by the Fund's investors. The range of their fees and expenses therefore appears to be a relevant indicator of what consumers have found to be reasonable in the precise marketplace in which the Fund competes.
The Board reviewed the contractual advisory fee rate and other expenses of the Fund and noted the position of the Fund's fee rates relative to its peers. In this regard, the Board noted that the contractual advisory fee rate was above the median of the relevant peer group, but the Board noted the applicable waivers and reimbursements and that the overall expense structure of the Fund remained competitive in the context of other factors considered by the Board. In this regard, the Board had been previously advised that, while comparisons to fund peer groups are relevant in judging the reasonableness of advisory fees, the Fund's quantitative focus makes fee and expense comparisons particularly difficult. Although the Fund's advisory fee was above the median of the peer range, the peer group of funds varied widely in their complexity, and the Board had been informed that the management of the Fund is among the more complex relative to its peers.
By contrast, the Senior Officer has reviewed Federated's fees for providing advisory services to products outside the Federated funds (e.g., institutional and separate accounts and sub-adviser services). He concluded that mutual funds and institutional accounts are inherently different products. Those differences include, but are not limited to, different types of targeted investors; being subject to different laws and regulations; different legal structures; different average account sizes and portfolio management techniques made necessary by different cash flows and different associated costs; and the time spent by portfolio
Annual Shareholder Report
managers and their teams, funds financial services, legal, compliance and risk management in reviewing securities pricing, addressing different administrative responsibilities, addressing different degrees of risk associated with management and a variety of different costs. The Senior Officer did not consider the fees for providing advisory services to these outside products to be determinative in judging the appropriateness of mutual fund advisory fees.
The Senior Officer noted that the services, administrative responsibilities and risks associated with such relationships are quite different than serving as a primary adviser to a fund.
Following such evaluation, the Board concluded, within the context of its full deliberations, that the expenses of the Fund are reasonable and supported renewal of the investment advisory contract with respect to the Fund.
The Board considered the nature, extent and quality of the services provided to the Fund by the Adviser and the resources of the Adviser and its affiliates dedicated to the Fund. In this regard, the Board evaluated, among other things, the Adviser's personnel, experience, track record, overall reputation and willingness to invest in personnel and infrastructure that benefit the Fund. In addition, the Board reviewed the qualifications, backgrounds and responsibilities of the portfolio management team primarily responsible for the day-to-day management of the Fund. The Board noted the compliance programs of and the compliance-related resources provided to the Fund by the Adviser. The Fund's ability to deliver competitive performance when compared to its peer group was also deemed to be relevant by the Board as a useful indicator of how the Adviser is executing the Fund's investment program, which in turn was one of the Board's considerations in reaching a conclusion that the nature, extent, and quality of the Adviser's investment management services were such as to warrant continuation of the investment advisory contract.
In evaluating the Fund's investment performance, the Board considered performance results in light of the Fund's investment objective, strategies and risks, as disclosed in the Fund's prospectus. The Board particularly considered detailed investment reports on the Fund's performance provided to the Board throughout the year and in connection with the May meetings. The Senior Officer also reviewed information compiled by Federated, using data supplied by independent fund ranking organizations, regarding the performance of, and fees charged by, other mutual funds, noting his view that comparisons to fund peer groups may be helpful, though not conclusive, in judging the reasonableness of the proposed fees. The Board considered, in evaluating such comparisons, that in some cases individual funds may exhibit significant and unique differences in their objectives and management techniques when compared to other funds within an industry peer group, and that the Senior Officer had specifically noted that the Fund's quantitative focus makes fee and expense comparisons particularly difficult as the peer group of funds varied widely in their complexity, and the management of the Fund is among the more complex relative to its peers.
Annual Shareholder Report
For the periods covered by the Senior Officer's Evaluation, the Fund's performance for the three-year and five-year periods was above the median of the relevant peer group and the Fund's performance fell below the median of the relevant peer group for the one-year period. In addition, the Board was informed by the Adviser that, for the same periods, the Fund outperformed its benchmark index for the three-year period and underperformed its benchmark index for the one-year and five-year periods. The Board discussed the Fund's performance with the Adviser and recognized the efforts being taken by the Adviser in the context of the other factors considered relevant by the Board.
Following such evaluation, the Board concluded, within the context of its full deliberations, that the performance of the Fund supported renewal of the advisory contract with respect to the Fund.
The Board also received financial information about Federated, including information regarding the compensation and ancillary (or “fall-out”) benefits Federated derived from its relationships with the Federated funds. This information covered not only the fees under the investment advisory contracts, but also fees received by Federated's subsidiaries for providing other services to the Federated funds under separate contracts (e.g., for serving as the Federated funds' administrator). The information also detailed any indirect benefit Federated may derive from its receipt of research services from brokers who execute Federated fund trades. In addition, the Board considered the fact that, in order for a fund to be competitive in the marketplace, Federated and its affiliates frequently waived fees and/or reimbursed expenses and have disclosed to fund investors and/or indicated to the Board their intention to do so in the future, where appropriate. Moreover, the Board receives regular reporting as to the institution, adjustment or elimination of these voluntary waivers. The Board considered Federated's previous reductions in contractual management fees to certain funds in response to the Senior Officer's recommendations.
Federated furnished information, requested by the Senior Officer, that reported revenues on a fund-by-fund basis and made estimates of the allocation of expenses on a fund-by-fund basis, using allocation methodologies specified by the Senior Officer. The Senior Officer noted that, while these cost allocation reports apply consistent allocation processes, the inherent difficulties in allocating costs continues to cause the Senior Officer to question the precision of the process and to conclude that such reports may be unreliable, since a single change in an allocation estimate may dramatically alter the resulting estimate of cost and/or profitability of a fund and may produce unintended consequences. The allocation information, including the Senior Officer's view that fund-by-fund estimations may be unreliable, was considered in the analysis by the Board.
Annual Shareholder Report
The Board and the Senior Officer also reviewed information compiled by Federated comparing profitability information for Federated to other publicly held fund management companies. In this regard, the Senior Officer concluded that Federated's profit margins did not appear to be excessive. The Senior Officer also noted that Federated appeared financially sound, with the resources to fulfill its obligations under its contracts with the Fund.
The Senior Officer's Evaluation also discussed the notion of possible realization of “economies of scale” as a fund grows larger. The Board considered in this regard that the Adviser has made significant and long-term investments in areas that support all of the Federated funds, such as personnel and processes for the portfolio management, shareholder services, compliance, internal audit, and risk management functions, as well as systems technology (including technology relating to cybersecurity), and that the benefits of these efforts (as well as any economies of scale, should they exist) were likely to be enjoyed by the fund family as a whole. The Board noted that the Adviser's investments in these areas are extensive. In addition, the Board considered that Federated and its affiliates have frequently waived fees and/or reimbursed expenses and that this has allowed fund shareholders to share potential economies of scale from a fund's inception. Federated, as it does throughout the year, and again in connection with the Board's review, furnished information relative to revenue sharing or adviser paid fees. Federated and the Senior Officer noted that this information should be viewed to determine if there was an incentive to either not apply breakpoints or to apply breakpoints at higher levels and should not be viewed to determine the appropriateness of advisory fees, because it would represent marketing and distribution expenses. Finally, the Board also noted the absence of any applicable regulatory or industry guidelines on this subject, which (as discussed in the Senior Officer's Evaluation) is compounded by the lack of any common industry practice or general pattern with respect to structuring fund advisory fees with “breakpoints” that serve to reduce the fee as a fund attains a certain size.
The Senior Officer noted that, subject to the comments and recommendations made within the Senior Officer's Evaluation, his observations and the information accompanying the Senior Officer's Evaluation supported a finding by the Board that the management fee for the Fund was reasonable. Under these circumstances, no changes were recommended to, and no objection was raised to, the continuation of the Fund's investment advisory contract.
In its decision to continue an existing investment advisory contract, the Board was mindful of the potential disruptions of the Fund's operations and various risks, uncertainties and other effects that could occur as a result of a decision to terminate or not renew an investment advisory contract. In particular, the Board recognized that many shareholders have invested in the Fund on the strength of the Adviser's industry standing and reputation and with the expectation that the Adviser will have a continuing role in providing advisory services to the Fund. Thus, the Board's approval of the investment advisory contract reflected the fact
Annual Shareholder Report
that it is the shareholders who have effectively selected the Adviser by virtue of having invested in the Fund. The Board concluded that, in light of the factors discussed above, including the nature, quality and scope of the services provided to the Fund by the Adviser and its affiliates, continuation of the investment advisory contract was appropriate.
The Board based its decision to approve the investment advisory contract on the totality of the circumstances and relevant factors and with a view to past and future long-term considerations. Not all of the factors and considerations identified above were necessarily relevant to the Fund, nor did the Board consider any one of them to be determinative. With respect to the factors that were relevant, the Board's decision to approve the continuation of the contract reflects its determination that Federated's performance and actions provided a satisfactory basis to support the decision to continue the existing arrangement.
Annual Shareholder Report
Voting Proxies on Fund Portfolio Securities
A description of the policies and procedures that the Fund uses to determine how to vote proxies, if any, relating to securities held in the Fund's portfolio is available, without charge and upon request, by calling 1-800-341-7400. A report on “Form N-PX” of how the Fund voted any such proxies during the most recent 12-month period ended June 30 is available via the Proxy Voting Record (Form N-PX) link associated with the Fund and share class name at www.FederatedInvestors.com/FundInformation. Form N-PX filings are also available at the SEC's website at www.sec.gov.
Quarterly Portfolio Schedule
The Fund files with the SEC a complete schedule of its portfolio holdings, as of the close of the first and third quarters of its fiscal year, on “Form N-Q.” These filings are available on the SEC's website at www.sec.gov and may be reviewed and copied at the SEC's Public Reference Room in Washington, DC. (Call 1-800-SEC-0330 for information on the operation of the Public Reference Room.) You may also access this information via the link to the Fund and share class name at www.FederatedInvestors.com/FundInformation.
Annual Shareholder Report
Mutual funds are not bank deposits or obligations, are not guaranteed by any bank and are not insured or guaranteed by the U.S. government, the Federal Deposit Insurance Corporation, the Federal Reserve Board or any other government agency. Investment in mutual funds involves investment risk, including the possible loss of principal.
This Report is authorized for distribution to prospective investors only when preceded or accompanied by the Fund's Prospectus, which contains facts concerning its objective and policies, management fees, expenses and other information.
Federated MDT All Cap Core Fund
Federated Investors Funds
4000 Ericsson Drive
Warrendale, PA 15086-7561
Contact us at FederatedInvestors.com
or call 1-800-341-7400.
Federated Securities Corp., Distributor
CUSIP 31421R106
CUSIP 31421R205
CUSIP 31421R304
CUSIP 31421R718
37309 (9/16)
Federated is a registered trademark of Federated Investors, Inc.
2016 ©Federated Investors, Inc.
Annual Shareholder Report
July 31, 2016
| Share Class | Ticker |
| A | QABGX |
| C | QCBGX |
| Institutional | QIBGX |
| R6* | QKBGX |
*formerly, Class R Shares
Federated MDT Balanced Fund
Fund Established 2002
A Portfolio of Federated MDT Series
Dear Valued Shareholder,
I am pleased to present the Annual Shareholder Report for your fund covering the period from August 1, 2015 through July 31, 2016. This report includes Management's Discussion of Fund Performance, a complete listing of your fund's holdings, performance information and financial statements along with other important fund information.
In addition, our website, FederatedInvestors.com, offers easy access to Federated resources that include timely fund updates, economic and market insights from our investment strategists, and financial planning tools. We invite you to register to take full advantage of its capabilities.
Thank you for investing with Federated. I hope you find this information useful and look forward to keeping you informed.
Sincerely,
J. Christopher Donahue, President
Not FDIC Insured • May Lose Value • No Bank Guarantee
CONTENTS
| 1 |
| 8 |
| 10 |
| 33 |
| 37 |
| 39 |
| 41 |
| 42 |
| 55 |
| 56 |
| 58 |
| 64 |
| 71 |
| 71 |
Management's Discussion of Fund Performance (unaudited)
The total return of Federated MDT Balanced Fund (the “Fund”), based on net asset value for the 12-month reporting period ended July 31, 2016, was -0.37% for Class A Shares, -1.10% for Class C Shares, -0.07% for Institutional Shares and -0.59% for Class R Shares. Over the same period, the Fund's custom blended benchmark (“Blended Index”),1 which consists of a 60%/40% blend of the Standard & Poor's 500 Index (S&P 500)2 and the Barclays U.S. Aggregate Bond Index (BAB),3 returned 6.00%. The total return of the Morningstar Allocation-50% to 70% Equity Funds Average (MA50-70),4 a peer group average for the Fund, was 1.86% during the period. The Fund's and the MA50-70's total return for the most recently completed fiscal year reflected actual cash flows, transaction costs and other expenses, which were not reflected in the total return of the Blended Index.
During the reporting period, the Fund's investment strategy focused on asset allocation, security selection within the equity segment of the portfolio, and yield curve positioning and security selection within the fixed income segment of the portfolio. These were the most significant factors affecting the Fund's performance relative to the Blended Index during the reporting period.
The following discussion will focus on the performance of the Fund's Institutional Shares.
MArket Overview
During the reporting period, domestic equity market performance was volatile but finished in moderately positive territory as evidenced by the 4.44% return on the Russell 3000® Index (R3000).5 From a capitalization perspective, large-cap stocks were the best performers with the Russell Top 200® Index6 returning 5.04% for the period. Mid-cap stocks did well, with the Russell Midcap® Index7 returning 4.37%, while small-cap stocks had the weakest result as evidenced by the 0.00% return on the Russell 2000® Index.8 Value stocks beat growth stocks during the period with the Russell 3000® Value Index9 returning 5.39% as compared to the 3.57% return on the Russell 3000® Growth Index.10
The best performing sectors in the R3000 during the reporting period were Telecommunication Services (24.98%) and Utilities (23.65%), while the most significantly underperforming sectors were Health Care (-2.71%) and Energy (-1.47%).
International equities11 in developed markets underperformed the domestic equity market during the reporting period with the Morgan Stanley Capital International (MSCI) Europe, Australasia and Far East (EAFE) Index12 returning -7.53%. Emerging market13 equities performed better but still well behind the result for domestic markets, with the MSCI Emerging Markets Index14 returning -0.75% during the reporting period.
Annual Shareholder Report
Real Estate Investment Trust (REIT) fundamentals benefited from the slow growth, low interest rate environment which drove steady demand for institutional quality real estate. Over the reporting period, the MSCI US REIT Index15 returned 22.41% (gross).
Interest rates at intermediate- and longer-term maturities declined during the reporting period while those at the shorter end of the treasury curve increased modestly causing the overall curve to flatten. For the reporting period, the BAB returned 5.94%.
ASSET ALLOCATION
During the reporting period, the stock/bond allocation on average was close to neutral with equity investments accounting for approximately 61% of the portfolio while fixed income16 and cash investments accounted for an average of 39%. A larger than normal allocation to cash and modest underweight to equities did hurt Fund performance during the second half of the reporting period as equities rallied through the spring and into midsummer. Within the equity allocation, REIT investments17 were reduced modestly late in the reporting period while the mix between domestic and international was consistently weighted more heavily towards domestic throughout.
EQUITIES
Domestic equity investments, which were managed using Federated MDT's proprietary Optimum Q process, underperformed the R3000 during the reporting period. Investments in the Telecommunications Services and Industrials sectors were the most significant positive factors in the Fund's domestic equity performance relative to the R3000, while investments in the Consumer Discretionary, Energy and Health Care sectors were the most significant negative contributors to relative results.
FIXED INCOME
During the reporting period, the fixed-income portion of the portfolio outperformed the BAB with yield curve positioning and security selection the most significant contributors to relative results. A strategy designed to take advantage of a flatter yield curve was effective during the reporting period as longer-term rates fell fairly significantly even as short-term rates rose. The positive contribution of security selection to relative performance resulted from an underweight allocation to higher beta credits in commodity-related sectors which suffered from the substantial decline in energy prices.
| 1 | The Fund's Blended Index, which reflects 60% of the S&P 500 and 40% of the BAB, is being used for comparison purposes because, although it is not the Fund's broad-based securities market index, the Fund's Adviser believes it is more reflective of the Fund's balanced investment style. |
| 2 | Please see the footnotes to the line graphs below for definitions of, and further information about, the S&P 500 Index, one of the Fund's broad-based securities market indices. The S&P 500's return for the 12-month reporting period was 5.61%. |
Annual Shareholder Report
| 3 | Please see the footnotes to the line graphs below for definitions of, and further information about, the BAB, one of the Fund's broad-based securities market indices. The BAB's return for the 12-month reporting period was 5.94%. |
| 4 | Please see the footnotes to the line graphs below for definitions of, and further information about, the MA50-70. |
| 5 | The Russell 3000® Index measures the performance of the largest 3,000 U.S. companies representing approximately 98% of the investable U.S. equity market. The Russell 3000® Index is constructed to provide a comprehensive, unbiased and stable barometer of the broad market and is completely reconstituted annually to ensure new and growing equities are reflected. The index is unmanaged, and it is not possible to invest directly in an index. |
| 6 | The Russell Top 200® Index measures the performance of the largest cap segment of the U.S. equity universe. The Russell Top 200® Index is a subset of the Russell 3000® Index. It includes approximately 200 of the largest securities based on a combination of their market cap and current index membership and represents approximately 68% of the U.S. market. The Russell Top 200® Index is constructed to provide a comprehensive and unbiased barometer for this very large cap segment and is completely reconstituted annually to ensure new and growing equities are reflected. The index is unmanaged, and it is not possible to invest directly in an index. |
| 7 | The Russell Midcap® Index measures the performance of the mid-cap segment of the U.S. equity universe. The Russell Midcap® Index is a subset of the Russell 1000® Index. It includes approximately 800 of the smallest securities based on a combination of their market cap and current index membership. The Russell Midcap® Index represents approximately 31% of the total market capitalization of the Russell 1000® companies. The Russell Midcap® Index is constructed to provide a comprehensive and unbiased barometer for the mid-cap segment. The Russell Midcap Index is completely reconstituted annually to ensure larger stocks do not distort the performance and characteristics of the true mid-cap opportunity set. The index is unmanaged, and it is not possible to invest directly in an index. |
| 8 | The Russell 2000® Index measures the performance of the small-cap segment of the U.S. equity universe. The Russell 2000® Index is a subset of the Russell 3000® Index representing approximately 10% of the total market capitalization of that index. It includes approximately 2000 of the smallest securities based on a combination of their market cap and current index membership. The Russell 2000® Index is constructed to provide a comprehensive and unbiased small-cap barometer and is completely reconstituted annually to ensure larger stocks do not distort the performance and characteristics of the true small-cap opportunity set. The index is unmanaged, and it is not possible to invest directly in an index. |
| 9 | The Russell 3000® Value Index measures the performance of the broad value segment of U.S. equity value universe. It includes those Russell 3000® Index companies with lower price-to-book ratios and lower forecasted growth values. The Russell 3000® Value Index is constructed to provide a comprehensive, unbiased and stable barometer of the broad value market. The Russell 3000® Value Index is completely reconstituted annually to ensure new and growing equities are included and that the represented companies continue to reflect value characteristics. The index is unmanaged, and it is not possible to invest directly in an index. |
| 10 | The Russell 3000® Growth Index measures the performance of the broad growth segment of the U.S. equity universe. It includes those Russell 3000® Index companies with higher price-to-book ratios and higher forecasted growth values. The Russell 3000® Growth Index is constructed to provide a comprehensive, unbiased and stable barometer of the broad growth market. The Russell 3000® Growth Index is completely reconstituted annually to ensure new and growing equities are included and that the represented companies continue to reflect growth characteristics. The index is unmanaged, and it is not possible to invest directly in an index. |
| 11 | International investing involves special risks including currency risk, increased volatility of foreign securities, political risks and differences in auditing and other financial standards. |
| 12 | The MSCI EAFE Index is an equity index which captures large- and mid-cap representation across developed markets countries around the world, excluding the US and Canada. The index is unmanaged, and it is not possible to invest directly in an index. |
| 13 | Prices of emerging markets securities can be significantly more volatile than the prices of securities in developed countries, and currency risks and political risks are accentuated in emerging markets. |
Annual Shareholder Report
| 14 | The MSCI Emerging Markets Index is an unmanaged index consisting of 23 emerging market countries. The index is unmanaged, and it is not possible to invest directly in an index. |
| 15 | The MSCI US REIT Index is a free float-adjusted market capitalization index that is comprised of equity REITs. It represents about 99% of the US REIT universe and securities are classified in the REIT sector according to the Global Industry Classification Standard (GICS®). It however excludes Mortgage REIT and selected Specialized REITs. The index is unmanaged, and it is not possible to invest directly in an index. |
| 16 | Bond prices are sensitive to changes in interest rates, and a rise in interest rates can cause a decline in their prices. |
| 17 | Investments in REITs involve special risks associated with an investment in real estate, such as limited liquidity and interest rate risks. |
Annual Shareholder Report
FUND PERFORMANCE AND GROWTH OF A $10,000 INVESTMENT
The graph below illustrates the hypothetical investment of $10,0001 in the Federated MDT Balanced Fund2 from July 31, 2006 to July 31, 2016, compared to the Standard and Poor's 500 Index (S&P 500),3 the Barclays U.S. Aggregate Bond Index (BAB),4 60% S&P 500/40% BAB (Blended Index) and the Morningstar Allocation-50% to 70% Equity Funds Average (MA50-70).5 The Average Annual Total Return table below shows returns for each class averaged over the stated periods.
Growth of a $10,000 Investment
Growth of $10,000 as of July 31, 2016
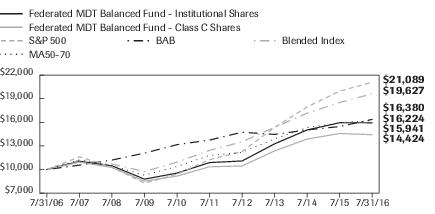
| Federated MDT Balanced Fund - | Institutional Shares | Class C Shares | S&P 500 | BAB | Blended Index | MA50-70 |
| F | F | I | I | I | I |
| 7/31/2006 | 10,000 | 10,000 | 10,000 | 10,000 | 10,000 | 10,000 |
| 7/31/2007 | 11,061 | 10,950 | 11,613 | 10,558 | 11,190 | 11,214 |
| 7/31/2008 | 10,472 | 10,262 | 10,325 | 11,207 | 10,709 | 10,514 |
| 7/31/2009 | 8,782 | 8,523 | 8,264 | 12,086 | 9,750 | 9,288 |
| 7/31/2010 | 9,550 | 9,173 | 9,408 | 13,163 | 10,942 | 10,392 |
| 7/31/2011 | 10,886 | 10,352 | 11,256 | 13,747 | 12,431 | 11,791 |
| 7/31/2012 | 11,090 | 10,448 | 12,284 | 14,745 | 13,527 | 12,169 |
| 7/31/2013 | 13,267 | 12,371 | 15,355 | 14,464 | 15,365 | 13,899 |
| 7/31/2014 | 15,031 | 13,874 | 17,956 | 15,038 | 17,161 | 15,330 |
| 7/31/2015 | 15,952 | 14,585 | 19,968 | 15,462 | 18,516 | 15,941 |
| 7/31/2016 | 15,941 | 14,424 | 21,089 | 16,380 | 19,627 | 16,224 |
41 graphic description end -->
| ■ | Total returns shown for Class C Shares include the maximum contingent deferred sales charge of 1.00% as applicable. |
The Fund offers multiple share classes whose performance may be greater than or less than its other share class(es) due to differences in sales charges and expenses. See the Average Annual Total Return table below for the returns of additional classes not shown in the line graph above.
Annual Shareholder Report
Average Annual Total Returns for the Periods Ended 7/31/2016
(returns reflect all applicable sales charges and contingent deferred sales charges as specified below in footnote #1)
| | 1 Year | 5 Years | 10 Years |
| Class A Shares | -5.85% | 6.44% | 3.92% |
| Class C Shares | -2.08% | 6.86% | 3.73% |
| Class R Shares6 | -0.59% | 7.31% | 4.13% |
| Institutional Shares | -0.07% | 7.93% | 4.77% |
| S&P 500 | 5.61% | 13.38% | 7.75% |
| BAB | 5.94% | 3.57% | 5.06% |
| Blended Index | 6.00% | 9.56% | 6.98% |
| MA50-70 | 1.86% | 6.94% | 5.49% |
Performance data quoted represents past performance which is no guarantee of future results. Investment return and principal value will fluctuate so that an investor's shares, when redeemed, may be worth more or less than their original cost. Mutual fund performance changes over time and current performance may be lower or higher than what is stated. For current to the most recent month-end performance and after-tax returns, visit FederatedInvestors.com or call 1-800-341-7400. Returns shown do not reflect the deduction of taxes that a shareholder would pay on Fund distributions or the redemption of Fund shares. Mutual funds are not obligations of or guaranteed by any bank and are not federally insured.
| 1 | Represents a hypothetical investment of $10,000 in the Fund after deducting applicable sales charges: for Class A Shares, the maximum sales charge of 5.50% ($10,000 investment minus $550 sales charge = $9,450); for Class C Shares, a 1.00% contingent deferred sales charge would be applied on any redemption less than one year from the purchase date. The Fund's performance assumes the reinvestment of all dividends and distributions. The S&P 500 and BAB and MA50-70 have been adjusted to reflect reinvestment of dividends on securities in the indexes. |
| 2 | The Fund is the successor to the MDT Balanced Fund pursuant to a reorganization that took place on December 8, 2006. Prior to that date, the Fund had no investment operations. Accordingly, the performance information shown for periods prior to that date is that of the MDT Balanced Fund. |
| 3 | The S&P 500 Index, a broad-based securities market index of the Fund, is an unmanaged capitalization-weighted index of 500 stocks designed to measure performance of the broad domestic economy through changes in the aggregate market value of 500 stocks representing all major industries. The S&P 500 is unmanaged and, unlike the Fund, is not affected by cash flows. It is not possible to invest directly in an index. The S& P 500 is not adjusted to reflect sales charges, expenses or other fees that the Securities and Exchange Commission requires to be reflected in the Fund's performance. |
| 4 | The BAB Index, a broad-based securities market index of the Fund, is an unmanaged index composed of securities from the Barclay's Government/Corporate Bond Index, Mortgage-Backed Securities Index and the Asset-Backed Securities Index. Total return comprises price appreciation/depreciation and income as a percentage of the original investment. Indices are rebalanced monthly by market capitalization. The BAB is unmanaged and, unlike the Fund, is not affected by cash flows. It is not possible to invest directly in an index. The BAB is not adjusted to reflect sales charges, expenses or other fees that the Securities and Exchange Commission requires to be reflected in the Fund's performance. |
Annual Shareholder Report
| 5 | Morningstar figures represent the average of the total returns reported by all the mutual funds designated by Morningstar as falling into the respective category indicated. Morningstar figures do not reflect sales charges. It is not possible to invest directly in an average. |
| 6 | The Fund's Class R Shares commenced operations on December 12, 2006. Performance results shown for the period prior to commencement of operations of the Class R Shares are for the Fund's Institutional Shares and have been adjusted for the total annual operating expenses applicable to Class R Shares. |
Annual Shareholder Report
Portfolio of Investments Summary Table (unaudited)
At July 31, 2016, the Fund's portfolio composition1 was as follows:
| Security Type | Percentage of
Total Net Assets |
| Domestic Equity Securities | 48.8% |
| Corporate Debt Securities | 21.4% |
| Mortgage-Backed Securities2 | 8.0% |
| International Equity Securities (including International Exchange-Traded Funds) | 6.7% |
| Collateralized Mortgage Obligations | 3.4% |
| Asset-Backed Securities | 1.9% |
| Trade Finance Agreements | 1.9% |
| Floating Rate Loan | 1.5% |
| U.S. Treasury Securities3 | 1.2% |
| Commercial Mortgage-Backed Securities | 1.0% |
| Foreign Debt Securities | 0.4% |
| Municipal Bond | 0.1% |
| Derivative Contracts4,5 | (0.0)% |
| Other Security Types5,6 | 0.1% |
| Cash Equivalents7 | 6.1% |
| Other Assets and Liabilities—Net8 | (2.5)% |
| TOTAL | 100.0% |
| 1 | See the Fund's Prospectus for a description of the principal types of securities in which the Fund invests. As of the date specified above, the Fund owned shares of one or more affiliated investment companies. For purposes of this table, the affiliated investment company (other than an affiliated money market mutual fund) is not treated as a single portfolio security, but rather the Fund is treated as owning a pro rata portion of each security and each other asset and liability owned by the affiliated investment company. Accordingly, the percentages of total net assets shown in the table will differ from those presented on the Portfolio of Investments. |
| 2 | For purposes of this table, Mortgage-Backed Securities include mortgage-backed securities guaranteed by Government Sponsored Entities and adjustable rate mortgage-backed securities. |
| 3 | Also includes $179,205 held in U.S. Treasuries pledged as collateral to ensure the Fund is able to satisfy the obligations of its outstanding futures contracts. |
| 4 | Based upon net unrealized appreciation (depreciation) or value of the derivative contracts as applicable. Derivative contracts may consist of futures, forwards, options and swaps. The impact of a derivative contract on the Fund's performance may be larger than its unrealized appreciation (depreciation) or value may indicate. In many cases, the notional value or amount of a derivative contract may provide a better indication of the contract's significance to the portfolio. More complete information regarding the Fund's direct investments in derivative contracts, including unrealized appreciation (depreciation), value and notional values or amounts of such contracts, can be found in the table at the end of the Portfolio of Investments included in this Report. |
| 5 | Represents less than 0.1%. |
| 6 | Other Security Types consist of a domestic exchange-traded fund. |
| 7 | Cash Equivalents include any investments in money market mutual funds and/or overnight repurchase agreements. |
| 8 | Assets, other than investments in securities and derivative contracts, less liabilities. See Statement of Assets and Liabilities. |
Annual Shareholder Report
At July 31, 2016, the Fund's industry composition9 for its equity securities (excluding exchange-traded funds) was as follows:
| Industry Composition | Percentage of
Total Net Assets |
| Insurance | 7.9% |
| Technology Hardware Storage & Peripherals | 6.1% |
| Real Estate Investment Trusts | 6.0% |
| Banks | 5.7% |
| Specialty Retail | 5.0% |
| Health Care Providers & Services | 4.6% |
| Food Products | 4.3% |
| Oil Gas & Consumable Fuels | 4.3% |
| Biotechnology | 4.1% |
| Health Care Equipment & Supplies | 4.0% |
| Multiline Retail | 4.0% |
| Internet Software & Services | 3.7% |
| Machinery | 3.0% |
| Diversified Telecommunication Services | 2.9% |
| Software | 2.9% |
| Airlines | 2.3% |
| Electronic Equipment Instruments & Components | 2.3% |
| Food & Staples Retailing | 2.3% |
| Media | 2.1% |
| Auto Components | 2.0% |
| Pharmaceuticals | 1.9% |
| Chemicals | 1.7% |
| Communications Equipment | 1.7% |
| Aerospace & Defense | 1.4% |
| Consumer Finance | 1.3% |
| Multi-Utilities | 1.3% |
| Household Durables | 1.2% |
| Beverages | 1.1% |
| Capital Markets | 1.1% |
| Hotels Restaurants & Leisure | 1.1% |
| Semiconductors & Semiconductor Equipment | 1.0% |
| Other10 | 5.7% |
| TOTAL | 100.0% |
| 9 | Industry classifications are based upon, and individual portfolio securities are assigned to, the classifications of the Global Industry Classification Standard (GICS) except that the Adviser assigns a classification to securities not classified by the GICS and to securities for which the Adviser does not have access to the classification made by the GICS. |
| 10 | For purposes of this table, industry classifications which constitute less than 1.0% of the Fund's equity securities have been aggregated under the designation “Other.” |
Annual Shareholder Report
Portfolio of Investments
July 31, 2016
Principal
Amount
or Shares | | | Value |
| | | COMMON STOCKS—50.5% | |
| | | Aerospace & Defense—0.7% | |
| 2,557 | | General Dynamics Corp. | $375,598 |
| 1,670 | | Huntington Ingalls Industries, Inc. | 288,209 |
| 6,598 | 1 | Spirit Aerosystems Holdings, Inc., Class A | 286,221 |
| | | TOTAL | 950,028 |
| | | Air Freight & Logistics—0.2% | |
| 2,035 | 1 | Atlas Air Worldwide Holdings, Inc. | 87,973 |
| 976 | | FedEx Corp. | 158,014 |
| | | TOTAL | 245,987 |
| | | Airlines—1.1% | |
| 4,853 | | Alaska Air Group, Inc. | 326,219 |
| 12,530 | | Delta Air Lines, Inc. | 485,538 |
| 3,004 | 1 | Jet Blue Airways Corp. | 55,063 |
| 14,845 | | Southwest Airlines Co. | 549,413 |
| 3,691 | 1 | United Continental Holdings, Inc. | 173,071 |
| | | TOTAL | 1,589,304 |
| | | Auto Components—1.0% | |
| 645 | 1 | Cooper-Standard Holding, Inc. | 56,792 |
| 13,840 | | Goodyear Tire & Rubber Co. | 396,793 |
| 1,454 | | Johnson Controls, Inc. | 66,767 |
| 7,475 | | Lear Corp. | 848,039 |
| | | TOTAL | 1,368,391 |
| | | Automobiles—0.2% | |
| 24,635 | | Ford Motor Co. | 311,879 |
| | | Banks—2.9% | |
| 11,267 | | Bank of America Corp. | 163,259 |
| 20,900 | | Fifth Third Bancorp | 396,682 |
| 13,300 | | Huntington Bancshares, Inc. | 126,350 |
| 25,470 | | JPMorgan Chase & Co. | 1,629,316 |
| 16,358 | | KeyCorp | 191,389 |
| 9,653 | | PNC Financial Services Group | 797,820 |
| 6,300 | | Popular, Inc. | 212,247 |
| 10,542 | | SunTrust Banks, Inc. | 445,821 |
| | | TOTAL | 3,962,884 |
Annual Shareholder Report
Principal
Amount
or Shares | | | Value |
| | | COMMON STOCKS—continued | |
| | | Beverages—0.5% | |
| 987 | | Constellation Brands, Inc., Class A | $162,490 |
| 1,095 | | Dr. Pepper Snapple Group, Inc. | 107,869 |
| 4,296 | | PepsiCo, Inc. | 467,920 |
| | | TOTAL | 738,279 |
| | | Biotechnology—2.1% | |
| 10,082 | | Amgen, Inc. | 1,734,406 |
| 8,894 | | Gilead Sciences, Inc. | 706,806 |
| 3,678 | 1 | United Therapeutics Corp. | 445,075 |
| | | TOTAL | 2,886,287 |
| | | Capital Markets—0.5% | |
| 3,256 | | Ameriprise Financial, Inc. | 312,055 |
| 11,075 | | The Bank of New York Mellon Corp. | 436,355 |
| | | TOTAL | 748,410 |
| | | Chemicals—0.8% | |
| 3,606 | | Celanese Corp. | 228,692 |
| 1,792 | | Eastman Chemical Co. | 116,892 |
| 10,822 | | LyondellBasell Industries NV, Class A | 814,464 |
| | | TOTAL | 1,160,048 |
| | | Commercial Services—0.4% | |
| 1,162 | | Deluxe Corp. | 78,540 |
| 7,600 | | Donnelley (R.R.) & Sons Co. | 136,192 |
| 1,032 | | Ennis Business Forms, Inc. | 17,874 |
| 10,000 | | Pitney Bowes, Inc. | 193,100 |
| 989 | | Waste Management, Inc. | 65,393 |
| | | TOTAL | 491,099 |
| | | Communications Equipment—0.8% | |
| 12,728 | | Cisco Systems, Inc. | 388,586 |
| 23,286 | | Juniper Networks, Inc. | 528,359 |
| 3,480 | | Motorola Solutions, Inc. | 241,443 |
| | | TOTAL | 1,158,388 |
| | | Construction & Engineering—0.2% | |
| 1,991 | 1 | Dycom Industries, Inc. | 187,253 |
| 2,778 | 1 | Jacobs Engineering Group, Inc. | 148,679 |
| | | TOTAL | 335,932 |
| | | Consumer Finance—0.6% | |
| 8,000 | | Ally Financial, Inc. | 144,320 |
| 5,387 | | Discover Financial Services | 306,197 |
Annual Shareholder Report
Principal
Amount
or Shares | | | Value |
| | | COMMON STOCKS—continued | |
| | | Consumer Finance—continued | |
| 17,976 | | Navient Corp. | $255,259 |
| 6,104 | | Synchrony Financial | 170,180 |
| | | TOTAL | 875,956 |
| | | Diversified Consumer Services—0.0% | |
| 1,500 | | DeVry Education Group, Inc. | 33,405 |
| | | Diversified Financial Services—0.1% | |
| 437 | | MarketAxess Holdings, Inc. | 70,645 |
| | | Diversified Telecommunication Services—1.5% | |
| 40,241 | | CenturyLink, Inc. | 1,265,177 |
| 13,380 | | Verizon Communications | 741,386 |
| | | TOTAL | 2,006,563 |
| | | Electric Utility—0.1% | |
| 859 | | NextEra Energy, Inc. | 110,201 |
| | | Electrical Equipment—0.2% | |
| 947 | | Acuity Brands, Inc., Holding Company | 248,521 |
| | | Electronic Equipment Instruments & Components—1.2% | |
| 2,726 | | Avnet, Inc. | 112,039 |
| 2,387 | | CDW Corp. | 102,474 |
| 1,900 | 1 | Insight Enterprises, Inc. | 50,540 |
| 7,000 | 1 | Sanmina Corp. | 177,380 |
| 11,300 | 1 | Tech Data Corp. | 880,609 |
| 22,000 | | Vishay Intertechnology, Inc. | 293,260 |
| | | TOTAL | 1,616,302 |
| | | Energy Equipment & Services—0.3% | |
| 2,493 | | Archrock, Inc. | 22,213 |
| 9,781 | | Ensco PLC | 89,692 |
| 3,838 | | National Oilwell Varco, Inc. | 124,159 |
| 10,600 | | Noble Corp. PLC | 78,228 |
| 3,698 | | Rowan Companies PLC | 56,357 |
| | | TOTAL | 370,649 |
| | | Food & Staples Retailing—1.2% | |
| 36,694 | | Kroger Co. | 1,254,568 |
| 4,852 | | Walgreens Boots Alliance, Inc. | 384,521 |
| | | TOTAL | 1,639,089 |
| | | Food Products—2.2% | |
| 2,708 | | Cal-Maine Foods, Inc. | 113,465 |
| 984 | | Campbell Soup Co. | 61,274 |
Annual Shareholder Report
Principal
Amount
or Shares | | | Value |
| | | COMMON STOCKS—continued | |
| | | Food Products—continued | |
| 3,483 | | Dean Foods Co. | $64,296 |
| 4,289 | | Fresh Del Monte Produce, Inc. | 243,830 |
| 2,006 | | Ingredion, Inc. | 267,279 |
| 8,300 | | Pilgrims Pride Corp. | 192,975 |
| 2,100 | | Sanderson Farms, Inc. | 183,939 |
| 8,826 | | Smucker (J.M.) Co. | 1,360,616 |
| 6,731 | | Tyson Foods, Inc., Class A | 495,402 |
| | | TOTAL | 2,983,076 |
| | | Health Care Equipment & Supplies—2.0% | |
| 1,081 | 1 | Abiomed, Inc. | 127,526 |
| 31,500 | | Baxter International, Inc. | 1,512,630 |
| 8,568 | 1 | Edwards Lifesciences Corp. | 981,207 |
| 5,137 | 1 | Hologic, Inc. | 197,723 |
| | | TOTAL | 2,819,086 |
| | | Health Care Providers & Services—2.3% | |
| 3,287 | | Aetna, Inc. | 378,695 |
| 7,453 | | Anthem, Inc. | 978,877 |
| 15,524 | 1 | Community Health Systems, Inc. | 198,242 |
| 11,231 | 1 | Express Scripts Holding Co. | 854,342 |
| 9,307 | 1 | HCA Holdings, Inc. | 717,849 |
| 465 | | UnitedHealth Group, Inc. | 66,588 |
| | | TOTAL | 3,194,593 |
| | | Hotels Restaurants & Leisure—0.6% | |
| 517 | | Cracker Barrel Old Country Store, Inc. | 81,381 |
| 2,333 | | McDonald's Corp. | 274,478 |
| 6,115 | | Wyndham Worldwide Corp. | 434,287 |
| | | TOTAL | 790,146 |
| | | Household Durables—0.6% | |
| 2,483 | | D.R. Horton, Inc. | 81,641 |
| 745 | 1 | Helen of Troy Ltd. | 74,209 |
| 835 | | Libbey, Inc. | 15,606 |
| 333 | 1 | Mohawk Industries, Inc. | 69,577 |
| 5,423 | | Tupperware Brands Corp. | 339,914 |
| 1,171 | | Whirlpool Corp. | 225,254 |
| | | TOTAL | 806,201 |
| | | Independent Power and Renewable Electricity Producers—0.1% | |
| 15,600 | | AES Corp. | 192,660 |
Annual Shareholder Report
Principal
Amount
or Shares | | | Value |
| | | COMMON STOCKS—continued | |
| | | Industrial Conglomerates—0.0% | |
| 621 | | Carlisle Cos., Inc. | $64,143 |
| | | Insurance—4.0% | |
| 22,851 | | Aflac, Inc. | 1,651,670 |
| 13,907 | | Assured Guaranty Ltd. | 372,569 |
| 1,244 | | Everest Re Group Ltd. | 235,128 |
| 213 | 1 | Markel Corp. | 202,084 |
| 18,472 | | Prudential Financial | 1,390,757 |
| 14,182 | | The Travelers Cos., Inc. | 1,648,232 |
| | | TOTAL | 5,500,440 |
| | | Internet Software & Services—1.9% | |
| 54,478 | 1 | eBay, Inc. | 1,697,535 |
| 7,397 | 1 | Facebook, Inc. | 916,784 |
| | | TOTAL | 2,614,319 |
| | | IT Services—0.3% | |
| 833 | | Accenture PLC | 93,971 |
| 10,000 | | Western Union Co. | 200,000 |
| 14,300 | | Xerox Corp. | 147,290 |
| | | TOTAL | 441,261 |
| | | Machinery—1.5% | |
| 2,951 | | AGCO Corp. | 142,120 |
| 9,017 | | Allison Transmission Holdings, Inc. | 259,870 |
| 15,401 | 1 | Colfax Corp. | 452,174 |
| 26,951 | | Joy Global, Inc. | 744,656 |
| 10,666 | 1 | SPX Corp. | 161,483 |
| 15,300 | | Trinity Industries, Inc. | 355,113 |
| | | TOTAL | 2,115,416 |
| | | Media—1.0% | |
| 5,186 | | CBS Corp., Class B | 270,813 |
| 28,128 | 1 | MSG Networks, Inc. | 451,454 |
| 852 | | Time Warner, Inc. | 65,306 |
| 14,600 | | Viacom, Inc., Class B - New | 663,862 |
| | | TOTAL | 1,451,435 |
| | | Multi-Utilities—0.7% | |
| 35,274 | | NiSource, Inc. | 905,131 |
| | | Multiline Retail—2.0% | |
| 2,400 | | Big Lots, Inc. | 127,632 |
| 2,169 | | Dillards, Inc., Class A | 146,798 |
Annual Shareholder Report
Principal
Amount
or Shares | | | Value |
| | | COMMON STOCKS—continued | |
| | | Multiline Retail—continued | |
| 13,170 | | Kohl's Corp. | $547,740 |
| 18,284 | | Macy's, Inc. | 655,116 |
| 17,300 | | Target Corp. | 1,303,209 |
| | | TOTAL | 2,780,495 |
| | | Oil Gas & Consumable Fuels—2.2% | |
| 523 | | Cimarex Energy Co. | 62,770 |
| 3,188 | | Exxon Mobil Corp. | 283,573 |
| 8,120 | | HollyFrontier Corp. | 206,410 |
| 3,253 | | Kinder Morgan, Inc. | 66,133 |
| 5,229 | | Occidental Petroleum Corp. | 390,763 |
| 7,397 | | Tesoro Petroleum Corp. | 563,282 |
| 27,767 | | Valero Energy Corp. | 1,451,659 |
| | | TOTAL | 3,024,590 |
| | | Paper & Forest Products—0.1% | |
| 3,600 | | Domtar Corp. | 141,732 |
| | | Personal Products—0.3% | |
| 9,700 | | Avon Products, Inc. | 39,479 |
| 3,095 | 1 | Herbalife Ltd. | 210,491 |
| 3,147 | | Nu Skin Enterprises, Inc. | 168,050 |
| | | TOTAL | 418,020 |
| | | Pharmaceuticals—1.0% | |
| 36,776 | | Pfizer, Inc. | 1,356,667 |
| | | Real Estate Investment Trusts—3.0% | |
| 5,500 | | American Campus Communities, Inc. | 297,385 |
| 2,500 | | American Tower Corp. | 289,425 |
| 900 | | Avalonbay Communities, Inc. | 167,085 |
| 13,000 | | Blackstone Mortgage Trust, Inc., Class A | 377,130 |
| 1,500 | | Coresite Realty Corp., REIT | 123,795 |
| 4,000 | | CubeSmart, REIT | 118,840 |
| 2,600 | | DCT Industrial Trust, Inc. | 130,572 |
| 1,600 | | Digital Realty Trust, Inc. | 167,136 |
| 4,500 | | Douglas Emmett, Inc. | 171,180 |
| 2,900 | | EastGroup Properties, Inc. | 213,498 |
| 450 | | Equinix, Inc. | 167,791 |
| 3,100 | | Equity Lifestyle Properties, Inc. | 254,944 |
| 1,300 | | Extra Space Storage, Inc. | 111,826 |
| 2,400 | | Mid-American Apartment Communities, Inc. | 254,448 |
Annual Shareholder Report
Principal
Amount
or Shares | | | Value |
| | | COMMON STOCKS—continued | |
| | | Real Estate Investment Trusts—continued | |
| 28,000 | | New Residential Investment Corp. | $382,760 |
| 6,000 | | Retail Opportunity Investments Corp. | 136,980 |
| 1,300 | | Simon Property Group, Inc. | 295,152 |
| 2,000 | | Vornado Realty Trust | 214,800 |
| 10,250 | | Weyerhaeuser Co. | 335,380 |
| | | TOTAL | 4,210,127 |
| | | Real Estate Management & Development—0.0% | |
| 763 | 1 | Altisource Portfolio Solutions S.A. | 17,747 |
| | | Semiconductors & Semiconductor Equipment—0.5% | |
| 1,333 | 1 | Advanced Energy Industries, Inc. | 54,280 |
| 18,461 | | Intel Corp. | 643,550 |
| | | TOTAL | 697,830 |
| | | Software—1.5% | |
| 12,270 | | CA, Inc. | 425,156 |
| 17,201 | 1 | Citrix Systems, Inc. | 1,533,125 |
| 4,307 | 1 | Nuance Communications, Inc. | 69,213 |
| | | TOTAL | 2,027,494 |
| | | Specialty Retail—2.5% | |
| 5,200 | | Abercrombie & Fitch Co., Class A | 107,692 |
| 7,113 | | Bed Bath & Beyond, Inc. | 319,730 |
| 5,221 | | Best Buy Co., Inc. | 175,426 |
| 1,200 | | Children's Place, Inc./The | 100,296 |
| 939 | | Foot Locker, Inc. | 55,983 |
| 4,854 | | GNC Holdings, Inc. | 99,070 |
| 7,400 | | GameStop Corp. | 229,030 |
| 15,027 | | Gap (The), Inc. | 387,546 |
| 3,800 | | Guess ?, Inc. | 55,936 |
| 2,608 | | Home Depot, Inc. | 360,530 |
| 826 | | Lowe's Cos., Inc. | 67,963 |
| 989 | 1 | Murphy USA, Inc. | 75,797 |
| 2,175 | 1 | O'Reilly Automotive, Inc. | 632,120 |
| 826 | | Outerwall, Inc. | 43,497 |
| 2,300 | | Rent-A-Center, Inc. | 24,840 |
| 3,900 | 1 | Sally Beauty Holdings, Inc. | 114,387 |
| 13,300 | | Staples, Inc. | 123,557 |
| 1,917 | 1 | Ulta Salon Cosmetics & Fragrance, Inc. | 500,740 |
Annual Shareholder Report
Principal
Amount
or Shares | | | Value |
| | | COMMON STOCKS—continued | |
| | | Specialty Retail—continued | |
| 1,135 | 1 | Zumiez, Inc. | $19,272 |
| | | TOTAL | 3,493,412 |
| | | Technology Hardware Storage & Peripherals—3.1% | |
| 6,503 | | Apple, Inc. | 677,678 |
| 118,713 | 1 | HP, Inc. | 1,663,169 |
| 10,416 | | International Business Machines Corp. | 1,673,018 |
| 10,850 | | NetApp, Inc. | 285,897 |
| | | TOTAL | 4,299,762 |
| | | Textiles Apparel & Luxury Goods—0.4% | |
| 3,861 | 1 | Fossil Group, Inc. | 122,007 |
| 3,200 | | PVH Corp. | 323,392 |
| 7,184 | 1 | Skechers USA, Inc., Class A | 172,560 |
| | | TOTAL | 617,959 |
| | | Trading Companies & Distributors—0.1% | |
| 1,176 | 1 | United Rentals, Inc. | 93,692 |
| 321 | | W.W. Grainger, Inc. | 70,251 |
| | | TOTAL | 163,943 |
| | | TOTAL COMMON STOCKS
(IDENTIFIED COST $68,878,392) | 70,045,932 |
| | | ASSET-BACKED SECURITIES—1.0% | |
| | | Auto Receivables—0.3% | |
| $300,000 | | BMW Vehicle Trust 2014-1, Class A4, 0.990%, 08/21/2017 | 300,057 |
| 22,571 | | CS First Boston Mortgage Securities Corp. 2002-HE4, Class AF, 5.510%, 08/25/2032 | 26,405 |
| 25,000 | | Santander Drive Auto Receivables Trust 2013-1, Class D, 2.270%, 01/15/2019 | 25,112 |
| 100,000 | | Santander Drive Auto Receivables Trust 2016-2, Class C, 2.660%, 11/15/2021 | 101,644 |
| | | TOTAL | 453,218 |
| | | Credit Card—0.6% | |
| 350,000 | | Capital One Multi-Asset Execution Trust 2004-B3, Class B3, 1.211%, 01/18/2022 | 350,082 |
| 250,000 | | Citibank Credit Card Issuance Trust 2014-A2, Class A2, 1.020%, 02/22/2019 | 250,117 |
| 300,000 | 2,3 | Penarth Master Issuer 2015-1A, Class A1, 0.882%, 03/18/2019 | 299,314 |
| | | TOTAL | 899,513 |
Annual Shareholder Report
Principal
Amount
or Shares | | | Value |
| | | ASSET-BACKED SECURITIES—continued | |
| | | Other—0.1% | |
| $100,000 | | Navient Student Loan Trust 2014-1, Class A2, 0.797%, 03/27/2023 | $99,543 |
| | | TOTAL ASSET-BACKED SECURITIES
(IDENTIFIED COST $1,448,837) | 1,452,274 |
| | | COLLATERALIZED MORTGAGE OBLIGATIONS—2.6% | |
| | | Commercial Mortgage—2.6% | |
| 170,000 | | Banc of America Commercial Mortgage Trust 2016-UBS10, Class A4, 3.170%, 6/15/2049 | 181,416 |
| 744 | 4 | Bear Stearns Mortgage Securities, Inc. 1997-6, Class 1A, 6.297%, 3/25/2031 | 763 |
| 200,000 | | Citigroup Commercial Mortgage Trust 2013-GC11, Class B, 3.732%, 4/10/2046 | 212,406 |
| 350,000 | | Citigroup Commercial Mortgage Trust 2015-GC33, Class AS, 4.114%, 9/10/2058 | 392,671 |
| 70,000 | | Commercial Mortgage Pass-Through Certificates 2012-CR1, Class AM, 3.912%, 5/15/2045 | 76,839 |
| 125,000 | | Commercial Mortgage Pass-Through Certificates 2012-CR1, Class B, 4.612%, 5/15/2045 | 140,360 |
| 200,000 | 2,3 | Commercial Mortgage Trust 2013-CR8, Class B, 3.964%, 6/10/2046 | 217,648 |
| 200,000 | | Commercial Mortgage Trust 2014-LC17, Class B, 4.490%, 10/10/2047 | 224,445 |
| 300,000 | | Commercial Mortgage Trust 2015-DC1, Class AM, 3.724%, 2/10/2048 | 322,929 |
| 200,000 | 2,3 | FREMF Mortgage Trust 2013-K25, Class B, 3.743%, 11/25/2045 | 209,210 |
| 2,229 | | Federal Home Loan Mortgage Corp. REMIC 1311 K, 7.000%, 7/15/2022 | 2,418 |
| 4,418 | | Federal Home Loan Mortgage Corp. REMIC 1384 D, 7.000%, 9/15/2022 | 4,855 |
| 7,747 | | Federal Home Loan Mortgage Corp. REMIC 2497 JH, 6.000%, 9/15/2032 | 8,861 |
| 79,777 | | Federal Home Loan Mortgage Corp., 2.263%, 4/24/2025 | 82,235 |
| 300,000 | | Federal Home Loan Mortgage Corp., 2.566%, 9/25/2020 | 311,686 |
| 9,671 | | Federal National Mortgage Association REMIC 1993-113 SB, 9.749%, 7/25/2023 | 10,706 |
| 1,885 | | Federal National Mortgage Association REMIC 2003-35 UC, 3.750%, 5/25/2033 | 1,986 |
| 100,000 | | GS Mortgage Securities Corp. II 2012-GCJ7 AS, 4.085%, 5/10/2045 | 109,741 |
| 135,000 | | GS Mortgage Securities Corp. II 2012-GCJ7 B, 4.740%, 5/10/2045 | 151,192 |
| 7,953 | | Government National Mortgage Association REMIC 2002-17 B, 6.000%, 3/20/2032 | 9,015 |
| 100,000 | | Merrill Lynch Mortgage Trust 2008-C1, Class AM, 6.263%, 2/12/2051 | 105,116 |
| 50,000 | | Morgan Stanley Capital I 2007-IQ16, Class AM, 6.052%, 12/12/2049 | 52,142 |
| 100,000 | | Morgan Stanley Capital I 2012-C4, Class AS, 3.773%, 3/15/2045 | 107,522 |
Annual Shareholder Report
Principal
Amount
or Shares | | | Value |
| | | COLLATERALIZED MORTGAGE OBLIGATIONS—continued | |
| | | Commercial Mortgage—continued | |
| $150,000 | 2,3 | UBS-Barclays Commercial Mortgage Trust 2013-C6, Class B, 3.875%, 4/10/2046 | $160,469 |
| 25,000 | | WF-RBS Commercial Mortgage Trust 2012-C6, Class B, 4.697%, 4/15/2045 | 28,059 |
| 300,000 | | WF-RBS Commercial Mortgage Trust 2014-C25, Class AS, 3.984%, 11/15/2047 | 334,203 |
| 150,000 | | WF-RBS Commercial Mortgage Trust 2014-C25, Class B, 4.236%, 11/15/2047 | 164,281 |
| | | TOTAL COLLATERALIZED MORTGAGE OBLIGATIONS
(IDENTIFIED COST $3,438,595) | 3,623,174 |
| | | CORPORATE BONDS—16.9% | |
| | | Basic Industry - Chemicals—0.1% | |
| 35,000 | 2,3 | Incitec Pivot Finance LLC, Company Guarantee, Series 144A, 6.000%, 12/10/2019 | 37,932 |
| 70,000 | | RPM International, Inc., 6.500%, 02/15/2018 | 74,902 |
| 20,000 | | RPM International, Inc., Sr. Unsecd. Note, 6.125%, 10/15/2019 | 22,252 |
| 22,000 | | Rohm & Haas Co., 6.000%, 09/15/2017 | 23,079 |
| | | TOTAL | 158,165 |
| | | Basic Industry - Metals & Mining—0.5% | |
| 100,000 | | Alcoa, Inc., 5.870%, 02/23/2022 | 108,250 |
| 15,000 | | Anglogold Ashanti Holdings PLC, Sr. Note, 6.500%, 04/15/2040 | 15,300 |
| 100,000 | | Anglogold Ashanti Holdings PLC, Sr. Unsecd. Note, 5.125%, 08/01/2022 | 103,372 |
| 62,000 | | Carpenter Technology Corp., Sr. Unsecd. Note, 4.450%, 03/01/2023 | 61,229 |
| 40,000 | | Carpenter Technology Corp., Sr. Unsecd. Note, 5.200%, 07/15/2021 | 40,997 |
| 20,000 | 2,3 | Newcrest Finance Property Ltd., Sr. Unsecd. Note, Series 144A, 4.200%, 10/01/2022 | 20,623 |
| 100,000 | | Reliance Steel & Aluminum Co., Sr. Unsecd. Note, 4.500%, 04/15/2023 | 103,944 |
| 20,000 | | Southern Copper Corp., Note, 6.750%, 04/16/2040 | 21,749 |
| 160,000 | | Worthington Industries, Inc., Sr. Unsecd. Note, 6.500%, 04/15/2020 | 175,958 |
| | | TOTAL | 651,422 |
| | | Basic Industry - Paper—0.0% | |
| 10,000 | | Plum Creek Timberlands LP, Sr. Unsecd. Note, 3.250%, 03/15/2023 | 10,074 |
| 20,000 | | Plum Creek Timberlands LP, Sr. Unsecd. Note, 4.700%, 03/15/2021 | 21,743 |
| | | TOTAL | 31,817 |
| | | Capital Goods - Aerospace & Defense—0.3% | |
| 211,000 | 2,3 | Embraer Overseas Ltd., Sr. Unsecd. Note, Series 144A, 5.696%, 09/16/2023 | 224,188 |
| 20,000 | | Raytheon Co., Sr. Note, 4.400%, 02/15/2020 | 22,167 |
Annual Shareholder Report
Principal
Amount
or Shares | | | Value |
| | | CORPORATE BONDS—continued | |
| | | Capital Goods - Aerospace & Defense—continued | |
| $10,000 | | Rockwell Collins, Inc., Sr. Unsecd. Note, 3.100%, 11/15/2021 | $10,568 |
| 40,000 | 2,3 | Textron Financial Corp., Jr. Sub. Note, Series 144A, 6.000%, 2/15/2067 | 25,400 |
| 50,000 | | Textron, Inc., Sr. Unsecd. Note, 4.000%, 03/15/2026 | 53,504 |
| 50,000 | | Textron, Inc., Sr. Unsecd. Note, 4.300%, 03/01/2024 | 54,143 |
| | | TOTAL | 389,970 |
| | | Capital Goods - Building Materials—0.1% | |
| 80,000 | | Masco Corp., Sr. Unsecd. Note, 4.375%, 04/01/2026 | 85,600 |
| | | Capital Goods - Construction Machinery—0.0% | |
| 40,000 | | AGCO Corp., Sr. Unsecd. Note, 5.875%, 12/01/2021 | 43,952 |
| | | Capital Goods - Diversified Manufacturing—0.3% | |
| 15,000 | | Avery Dennison Corp., Sr. Unsecd. Note, 5.375%, 04/15/2020 | 16,431 |
| 30,000 | | General Electric Capital, Sr. Unsecd. Note, Series GMTN, 3.100%, 01/09/2023 | 32,121 |
| 200,000 | | General Electric Co., Sr. Unsecd. Note, 4.125%, 10/09/2042 | 225,949 |
| 80,000 | | Hubbell, Inc., 5.950%, 06/01/2018 | 86,433 |
| 50,000 | | Pentair, Ltd., Company Guarantee, 5.000%, 05/15/2021 | 53,922 |
| 15,000 | | Thomas & Betts Corp., Sr. Unsecd. Note, 5.625%, 11/15/2021 | 17,473 |
| 14,000 | | Valmont Industries, Inc., Sr. Unsecd. Note, 6.625%, 04/20/2020 | 15,969 |
| | | TOTAL | 448,298 |
| | | Capital Goods - Environmental—0.1% | |
| 85,000 | | Republic Services, Inc., Company Guarantee, 5.500%, 9/15/2019 | 95,191 |
| | | Capital Goods - Packaging—0.0% | |
| 45,000 | | Packaging Corp. of America, Sr. Unsecd. Note, 3.900%, 06/15/2022 | 48,036 |
| 10,000 | | Rock-Tenn Co., Sr. Unsecd. Note, 4.000%, 03/01/2023 | 10,583 |
| 10,000 | | Rock-Tenn Co., Sr. Unsecd. Note, 4.450%, 03/01/2019 | 10,579 |
| | | TOTAL | 69,198 |
| | | Communications - Cable & Satellite—0.3% | |
| 200,000 | 2,3 | CCO Safari II LLC, Term Loan—1st Lien, Series 144A, 4.908%, 07/23/2025 | 221,301 |
| 90,000 | | NBC Universal, Inc., Sr. Unsecd. Note, 5.150%, 04/30/2020 | 102,585 |
| 30,000 | | Time Warner Cable, Inc., Company Guarantee, 8.250%, 04/01/2019 | 34,855 |
| | | TOTAL | 358,741 |
| | | Communications - Media & Entertainment—0.7% | |
| 75,000 | | 21st Century Fox America, Inc., 8.000%, 10/17/2016 | 76,054 |
| 75,000 | | 21st Century Fox America, Inc., Sr. Unsecd. Note, 5.400%, 10/01/2043 | 91,548 |
| 80,000 | | Discovery Communications, Sr. Unsecd. Note, 4.900%, 03/11/2026 | 86,640 |
| 30,000 | | Grupo Televisa S.A., Sr. Unsecd. Note, 6.125%, 01/31/2046 | 35,039 |
Annual Shareholder Report
Principal
Amount
or Shares | | | Value |
| | | CORPORATE BONDS—continued | |
| | | Communications - Media & Entertainment—continued | |
| $30,000 | | Interpublic Group of Cos., Inc., Sr. Unsecd. Note, 2.250%, 11/15/2017 | $30,249 |
| 25,000 | | Moody's Corp., Sr. Unsecd. Note, 5.500%, 09/01/2020 | 28,357 |
| 250,000 | | Omnicom Group, Inc., Sr. Unsecd. Note, 3.600%, 04/15/2026 | 266,515 |
| 20,000 | | Omnicom Group, Inc., Sr. Unsecd. Note, 3.625%, 05/01/2022 | 21,504 |
| 30,000 | | Viacom, Inc., 2.500%, 09/01/2018 | 30,445 |
| 25,000 | | Viacom, Inc., Sr. Unsecd. Note, 2.500%, 12/15/2016 | 25,108 |
| 100,000 | | Viacom, Inc., Sr. Unsecd. Note, 3.875%, 04/01/2024 | 102,896 |
| 150,000 | | WPP Finance 2010, Sr. Unsecd. Note, 5.625%, 11/15/2043 | 181,315 |
| | | TOTAL | 975,670 |
| | | Communications - Telecom Wireless—0.3% | |
| 100,000 | | American Tower Corp., Sr. Unsecd. Note, 3.400%, 02/15/2019 | 104,792 |
| 50,000 | | American Tower Corp., Sr. Unsecd. Note, 4.500%, 01/15/2018 | 52,274 |
| 150,000 | | Crown Castle International Corp., Sr. Unsecd. Note, 3.700%, 06/15/2026 | 158,372 |
| 90,000 | | Telefonaktiebolaget LM Ericsson, Sr. Unsecd. Note, 4.125%, 05/15/2022 | 97,675 |
| | | TOTAL | 413,113 |
| | | Communications - Telecom Wirelines—0.2% | |
| 10,000 | | CenturyLink, Inc., Sr. Unsecd. Note, 7.650%, 3/15/2042 | 9,000 |
| 90,000 | | Verizon Communications, Inc., Sr. Unsecd. Note, 4.150%, 03/15/2024 | 100,444 |
| 175,000 | | Verizon Communications, Inc., Sr. Unsecd. Note, 5.150%, 09/15/2023 | 205,524 |
| | | TOTAL | 314,968 |
| | | Consumer Cyclical - Automotive—0.9% | |
| 175,000 | | American Honda Finance Co., Series MTN, 0.843%, 7/14/2017 | 175,063 |
| 175,000 | | American Honda Finance Co., Unsecd. Deb., Series MTN, 2.250%, 8/15/2019 | 180,527 |
| 10,000 | | DaimlerChrysler North America Holding Corp., Company Guarantee, 8.500%, 01/18/2031 | 16,689 |
| 100,000 | | Ford Motor Co., Sr. Unsecd. Note, 4.750%, 01/15/2043 | 110,600 |
| 200,000 | | Ford Motor Credit Co., Sr. Unsecd. Note, 3.336%, 03/18/2021 | 208,930 |
| 150,000 | | General Motors Financial Co., Inc., Sr. Unsecd. Note, 3.100%, 01/15/2019 | 153,438 |
| 160,000 | | General Motors Financial Co., Sr. Unsecd. Note, 3.200%, 07/06/2021 | 162,648 |
| 10,000 | 2,3 | Harley-Davidson Financial Services, Inc., Sr. Unsecd. Note, Series 144A, 2.700%, 03/15/2017 | 10,084 |
| 100,000 | 2,3 | Hyundai Capital America, Sr. Unsecd. Note, Series 144A, 2.875%, 08/09/2018 | 102,458 |
| 65,000 | 2,3 | RCI Banque SA, Sr. Unsecd. Note, Series 144A, 3.500%, 4/03/2018 | 67,238 |
| | | TOTAL | 1,187,675 |
Annual Shareholder Report
Principal
Amount
or Shares | | | Value |
| | | CORPORATE BONDS—continued | |
| | | Consumer Cyclical - Leisure—0.2% | |
| $200,000 | 2 | Football Trust V, Pass Thru Cert., Series 144A, 5.350%, 10/05/2020 | $221,635 |
| | | Consumer Cyclical - Lodging—0.1% | |
| 30,000 | | Hyatt Hotels Corp., Sr. Unsecd. Note, 3.375%, 07/15/2023 | 31,333 |
| 110,000 | | Hyatt Hotels Corp., Sr. Unsecd. Note, 4.850%, 03/15/2026 | 122,770 |
| 50,000 | | Marriott International, Inc., Sr. Unsecd. Note, 3.000%, 03/01/2019 | 51,742 |
| | | TOTAL | 205,845 |
| | | Consumer Cyclical - Retailers—0.9% | |
| 50,000 | | Advance Auto Parts, Inc., 4.500%, 12/01/2023 | 54,398 |
| 40,000 | | AutoZone, Inc., Sr. Unsecd. Note, 3.125%, 04/21/2026 | 41,807 |
| 250,000 | | AutoZone, Inc., Sr. Unsecd. Note, 3.250%, 04/15/2025 | 262,481 |
| 175,000 | | CVS Health Corp., Sr. Unsecd. Note, 2.875%, 06/01/2026 | 180,584 |
| 160,000 | | Dollar General Corp., Sr. Unsecd. Note, 4.150%, 11/01/2025 | 177,691 |
| 10,000 | | O'Reilly Automotive, Inc., Company Guarantee, 4.875%, 01/14/2021 | 11,141 |
| 80,000 | | Under Armour, Inc., Sr. Unsecd. Note, 3.250%, 06/15/2026 | 81,642 |
| 35,000 | | Wal-Mart Stores, Inc., Sr. Unsecd. Note, 3.300%, 04/22/2024 | 38,741 |
| 300,000 | | Wal-Mart Stores, Inc., Sr. Unsecd. Note, 4.300%, 04/22/2044 | 360,476 |
| | | TOTAL | 1,208,961 |
| | | Consumer Cyclical - Services—0.1% | |
| 65,000 | | Expedia, Inc., Company Guarantee, 5.950%, 08/15/2020 | 73,157 |
| 10,000 | | University of Southern California, Sr. Unsecd. Note, 5.250%, 10/01/2111 | 13,650 |
| 70,000 | | Visa, Inc., Sr. Unsecd. Note, 3.150%, 12/14/2025 | 75,299 |
| | | TOTAL | 162,106 |
| | | Consumer Non-Cyclical - Food/Beverage—0.5% | |
| 200,000 | 2,3 | Kerry Group Financial Services, Sr. Unsecd. Note, Series 144A, 3.200%, 04/09/2023 | 201,034 |
| 280,000 | 2,3 | Kraft Heinz Foods Co., Sr. Unsecd. Note, Series 144A, 4.375%, 06/01/2046 | 306,157 |
| 50,000 | | Mead Johnson Nutrition Co., Sr. Unsecd. Note, 4.125%, 11/15/2025 | 55,105 |
| 150,000 | | PepsiCo, Inc., 2.750%, 4/30/2025 | 157,899 |
| 30,000 | | The Coca-Cola Co., Sr. Unsecd. Note, 1.800%, 9/01/2016 | 30,032 |
| | | TOTAL | 750,227 |
| | | Consumer Non-Cyclical - Health Care—0.1% | |
| 15,000 | | Agilent Technologies, Inc., Sr. Unsecd. Note, 3.200%, 10/01/2022 | 15,573 |
| 10,000 | | Laboratory Corp. of America Holdings, Sr. Unsecd. Note, 3.750%, 08/23/2022 | 10,670 |
| 30,000 | | Stryker Corp., Sr. Unsecd. Note, 3.500%, 03/15/2026 | 32,257 |
Annual Shareholder Report
Principal
Amount
or Shares | | | Value |
| | | CORPORATE BONDS—continued | |
| | | Consumer Non-Cyclical - Health Care—continued | |
| $10,000 | | Zimmer Holdings, Inc., Sr. Note, 5.750%, 11/30/2039 | $12,326 |
| | | TOTAL | 70,826 |
| | | Consumer Non-Cyclical - Pharmaceuticals—0.3% | |
| 10,000 | | Dentsply International, Inc., Sr. Unsecd. Note, 2.750%, 08/15/2016 | 10,006 |
| 300,000 | | Eli Lilly & Co., 3.700%, 03/01/2045 | 325,570 |
| 30,000 | | Pfizer, Inc., Sr. Unsecd. Note, 6.200%, 03/15/2019 | 33,855 |
| | | TOTAL | 369,431 |
| | | Consumer Non-Cyclical - Products—0.2% | |
| 200,000 | | Newell Rubbermaid, Inc., Sr. Unsecd. Note, 4.200%, 04/01/2026 | 218,902 |
| | | Consumer Non-Cyclical - Tobacco—0.0% | |
| 24,000 | | Altria Group, Inc., 9.250%, 08/06/2019 | 29,526 |
| 30,000 | | Philip Morris International, Inc., 5.650%, 05/16/2018 | 32,451 |
| | | TOTAL | 61,977 |
| | | Energy - Independent—0.4% | |
| 250,000 | | Canadian Natural Resources Ltd., 3.900%, 02/01/2025 | 250,756 |
| 30,000 | | EOG Resources, Inc., Note, 5.625%, 06/01/2019 | 33,039 |
| 100,000 | | Marathon Oil Corp., Sr. Unsecd. Note, 3.850%, 6/01/2025 | 90,943 |
| 75,000 | | XTO Energy, Inc., 6.375%, 06/15/2038 | 108,295 |
| 60,000 | | XTO Energy, Inc., 6.750%, 08/01/2037 | 90,099 |
| | | TOTAL | 573,132 |
| | | Energy - Integrated—0.5% | |
| 30,000 | | BP Capital Markets America, Inc., Company Guarantee, 4.200%, 06/15/2018 | 31,487 |
| 135,000 | | BP Capital Markets PLC, 3.119%, 5/04/2026 | 137,981 |
| 75,000 | | Husky Energy, Inc., 4.000%, 04/15/2024 | 77,751 |
| 100,000 | | Husky Oil Ltd., Deb., 7.550%, 11/15/2016 | 100,814 |
| 90,000 | | Petrobras Global Finance BV, Sr. Unsecd. Note, 4.375%, 05/20/2023 | 77,400 |
| 50,000 | | Petrobras International Finance Co., Sr. Unsecd. Note, 5.375%, 1/27/2021 | 47,563 |
| 25,000 | | Petroleos Mexicanos, Sr. Unsecd. Note, 4.875%, 1/18/2024 | 25,500 |
| 145,000 | | Shell International Finance BV, Sr. Unsecd. Note, 4.000%, 05/10/2046 | 149,670 |
| | | TOTAL | 648,166 |
| | | Energy - Midstream—0.6% | |
| 75,000 | | Energy Transfer Partners LP, Sr. Unsecd. Note, 4.900%, 02/01/2024 | 77,540 |
| 100,000 | | Energy Transfer Partners, Sr. Unsecd. Note, 4.050%, 3/15/2025 | 98,212 |
| 170,000 | | Enterprise Products Opera, Sr. Unsecd. Note, 3.950%, 02/15/2027 | 179,564 |
| 10,000 | 2,3 | Florida Gas Transmission Co. LLC, Sr. Unsecd. Note, Series 144A, 5.450%, 07/15/2020 | 10,825 |
Annual Shareholder Report
Principal
Amount
or Shares | | | Value |
| | | CORPORATE BONDS—continued | |
| | | Energy - Midstream—continued | |
| $150,000 | | Kinder Morgan Energy Partners LP, Sr. Unsecd. Note, 5.000%, 03/01/2043 | $143,145 |
| 100,000 | | Kinder Morgan, Inc., 5.050%, 2/15/2046 | 94,756 |
| 20,000 | 2,3 | Texas Eastern Transmission LP, Sr. Unsecd. Note, Series 144A, 2.800%, 10/15/2022 | 20,059 |
| 200,000 | | Williams Partners LP, 5.100%, 09/15/2045 | 180,515 |
| 40,000 | | Williams Partners LP, 5.250%, 03/15/2020 | 42,190 |
| 30,000 | | Williams Partners LP, Sr. Unsecd. Note, 4.125%, 11/15/2020 | 30,389 |
| | | TOTAL | 877,195 |
| | | Energy - Oil Field Services—0.1% | |
| 15,000 | | Nabors Industries, Inc., Company Guarantee, 5.000%, 09/15/2020 | 14,133 |
| 20,000 | | Nabors Industries, Inc., Sr. Unsecd. Note, 4.625%, 09/15/2021 | 17,771 |
| 50,000 | | Nabors Industries, Inc., Sr. Unsecd. Note, 5.100%, 09/15/2023 | 45,038 |
| 15,000 | | Noble Holding International Ltd., Company Guarantee, 4.900%, 08/01/2020 | 12,966 |
| | | TOTAL | 89,908 |
| | | Energy - Refining—0.2% | |
| 10,000 | | Marathon Petroleum Corp., Sr. Unsecd. Note, 6.500%, 03/01/2041 | 10,796 |
| 50,000 | | Phillips 66, Sr. Unsecd. Note, 4.300%, 04/01/2022 | 54,881 |
| 30,000 | | Valero Energy Corp., 7.500%, 04/15/2032 | 37,034 |
| 10,000 | | Valero Energy Corp., 9.375%, 03/15/2019 | 11,891 |
| 95,000 | | Valero Energy Corp., Sr. Unsecd. Note, 6.625%, 06/15/2037 | 105,703 |
| | | TOTAL | 220,305 |
| | | Financial Institution - Banking—4.0% | |
| 74,000 | | American Express Co., 2.650%, 12/02/2022 | 75,843 |
| 250,000 | | American Express Credit Corp., Sr. Unsecd. Note, Series MTN, 2.250%, 05/05/2021 | 255,602 |
| 50,000 | | American Express Credit Corp., Sr. Unsecd. Note, Series MTN, 2.800%, 09/19/2016 | 50,137 |
| 50,000 | | BB&T Corp., Sr. Unsecd. Note, Series MTN, 2.250%, 02/01/2019 | 51,197 |
| 300,000 | | Bank of America Corp., Sr. Unsecd. Note, Series GMTN, 3.500%, 04/19/2026 | 313,913 |
| 100,000 | | Bank of America Corp., Sr. Unsecd. Note, Series MTN, 5.000%, 5/13/2021 | 112,631 |
| 200,000 | | Bank of America Corp., Sub. Note, Series L, 3.950%, 4/21/2025 | 207,036 |
| 50,000 | | Bank of Montreal, Sr. Unsecd. Note, Series MTN, 1.450%, 04/09/2018 | 50,213 |
| 350,000 | | Bank of New York Mellon Corp., Sr. Unsecd. Note, Series MTN, 2.800%, 05/04/2026 | 365,143 |
| 250,000 | | Branch Banking & Trust Co., Sub. Note, 3.800%, 10/30/2026 | 275,579 |
Annual Shareholder Report
Principal
Amount
or Shares | | | Value |
| | | CORPORATE BONDS—continued | |
| | | Financial Institution - Banking—continued | |
| $120,000 | | Capital One Financial Corp., Sr. Sub., 4.200%, 10/29/2025 | $125,398 |
| 200,000 | | Citigroup, Inc., Sr. Unsecd. Note, 2.700%, 03/30/2021 | 204,231 |
| 250,000 | | Citigroup, Inc., Sr. Unsecd. Note, 3.300%, 04/27/2025 | 259,340 |
| 170,000 | | Citigroup, Inc., Sr. Unsecd. Note, 3.400%, 05/01/2026 | 175,617 |
| 100,000 | | Citigroup, Inc., Sub. Note, 4.450%, 09/29/2027 | 105,134 |
| 25,000 | | City National Corp., Sr. Unsecd. Note, 5.250%, 09/15/2020 | 28,437 |
| 30,000 | | Comerica, Inc., 3.800%, 7/22/2026 | 31,532 |
| 200,000 | | Fifth Third Bancorp, Sr. Unsecd. Note, 1.350%, 06/01/2017 | 200,514 |
| 80,000 | | Fifth Third Bancorp, Sr. Unsecd. Note, 2.875%, 7/27/2020 | 83,440 |
| 275,000 | | Goldman Sachs Group, Inc., Sr. Unsecd. Note, 3.625%, 01/22/2023 | 292,092 |
| 25,000 | | Goldman Sachs Group, Inc., Sr. Unsecd. Note, 6.125%, 02/15/2033 | 31,887 |
| 30,000 | | Goldman Sachs Group, Inc., Sr. Unsecd. Note, 6.150%, 04/01/2018 | 32,264 |
| 150,000 | | Goldman Sachs Group, Inc., Sr. Unsecd. Note, 6.250%, 02/01/2041 | 198,470 |
| 50,000 | | HSBC Holdings PLC, Sr. Unsecd. Note, 5.100%, 04/05/2021 | 55,716 |
| 250,000 | | Huntington National Bank, Sr. Unsecd. Note, 2.200%, 04/01/2019 | 253,713 |
| 400,000 | | J.P. Morgan Chase & Co., Sub. Note, 3.375%, 05/01/2023 | 409,465 |
| 250,000 | | Manufacturers & Traders Trust Co., Sr. Unsecd. Note, Series BKNT, 1.015%, 7/25/2017 | 249,798 |
| 65,000 | | Morgan Stanley, Sr. Unsecd. Note, 4.750%, 03/22/2017 | 66,491 |
| 120,000 | | Morgan Stanley, Sr. Unsecd. Note, Series GMTN, 2.500%, 04/21/2021 | 121,554 |
| 175,000 | | Morgan Stanley, Sub. Note, Series MTN, 4.100%, 05/22/2023 | 185,123 |
| 20,000 | | Murray Street Investment Trust I, Sr. Unsecd. Note, 4.647%, 03/09/2017 | 20,395 |
| 210,000 | | Regions Financial Corp., Sr. Unsecd. Note, 3.200%, 02/08/2021 | 217,284 |
| 130,000 | | SunTrust Banks, Inc., Sr. Unsecd. Note, 2.900%, 03/03/2021 | 135,875 |
| 30,000 | | Wachovia Corp., Sr. Unsecd. Note, Series MTN, 5.750%, 2/01/2018 | 32,021 |
| 85,000 | | Wells Fargo & Co., Sub. Note, Series GMTN, 4.900%, 11/17/2045 | 96,641 |
| 70,000 | | Westpac Banking Corp., Sr. Unsecd. Note, 4.875%, 11/19/2019 | 77,483 |
| 100,000 | | Wilmington Trust Corp., Sub. Note, 8.500%, 04/02/2018 | 111,227 |
| | | TOTAL | 5,558,436 |
| | | Financial Institution - Broker/Asset Mgr/Exchange—0.2% | |
| 80,000 | | Invesco Finance PLC, Sr. Unsecd. Note, 3.750%, 1/15/2026 | 86,405 |
| 40,000 | | Jefferies Group LLC, Sr. Unsecd. Note, 6.500%, 01/20/2043 | 41,600 |
| 125,000 | | Jefferies Group LLC, Sr. Unsecd. Note, 6.875%, 04/15/2021 | 143,781 |
| 13,000 | | Raymond James Financial, Inc., Sr. Unsecd. Note, 5.625%, 04/01/2024 | 15,097 |
| | | TOTAL | 286,883 |
Annual Shareholder Report
Principal
Amount
or Shares | | | Value |
| | | CORPORATE BONDS—continued | |
| | | Financial Institution - Finance Companies—0.1% | |
| $170,000 | | AerCap Ireland Capital Ltd./AerCap Global Aviation Trust, Sr. Unsecd. Note, 3.950%, 02/01/2022 | $178,222 |
| | | Financial Institution - Insurance - Health—0.2% | |
| 170,000 | | Aetna, Inc., Sr. Unsecd. Note, 3.200%, 06/15/2026 | 174,709 |
| 45,000 | | UnitedHealth Group, Inc., Sr. Unsecd. Note, 4.750%, 07/15/2045 | 56,301 |
| 50,000 | | Wellpoint, Inc., 5.850%, 01/15/2036 | 62,297 |
| | | TOTAL | 293,307 |
| | | Financial Institution - Insurance - Life—0.8% | |
| 200,000 | | Aflac, Inc., Sr. Unsecd. Note, 3.625%, 06/15/2023 | 216,477 |
| 10,000 | | Aflac, Inc., Sr. Unsecd. Note, 6.900%, 12/17/2039 | 14,434 |
| 25,000 | | American International Group, Inc., 4.500%, 07/16/2044 | 25,416 |
| 35,000 | | American International Group, Inc., Sr. Unsecd. Note, 4.125%, 02/15/2024 | 37,723 |
| 10,000 | | Lincoln National Corp., Sr. Unsecd. Note, 4.200%, 03/15/2022 | 10,832 |
| 275,000 | 2,3 | Mass Mutual Global Funding II, Series 144A, 2.000%, 04/15/2021 | 278,955 |
| 10,000 | | MetLife, Inc., Jr. Sub. Note, 10.750%, 8/01/2039 | 16,025 |
| 250,000 | | MetLife, Inc., Sr. Unsecd. Note, 3.600%, 04/10/2024 | 265,784 |
| 15,000 | 2,3 | Penn Mutual Life Insurance Co., Sr. Note, Series 144A, 7.625%, 06/15/2040 | 20,989 |
| 10,000 | | Principal Financial Group, Inc., Sr. Unsecd. Note, 3.125%, 05/15/2023 | 10,238 |
| 10,000 | | Principal Financial Group, Inc., Sr. Unsecd. Note, 3.300%, 09/15/2022 | 10,392 |
| 150,000 | | Prudential Financial, Inc., Sr. Unsecd. Note, Series MTN, 5.625%, 05/12/2041 | 179,840 |
| 50,000 | | Prudential Financial, Inc., Sr. Unsecd. Note, Series MTN, 6.200%, 11/15/2040 | 62,875 |
| | | TOTAL | 1,149,980 |
| | | Financial Institution - Insurance - P&C—0.3% | |
| 1,000 | | ACE INA Holdings, Inc., Sr. Note, 5.700%, 02/15/2017 | 1,025 |
| 80,000 | | Berkshire Hathaway, Inc., Sr. Unsecd. Note, 3.125%, 03/15/2026 | 85,284 |
| 30,000 | | CNA Financial Corp., Sr. Unsecd. Note, 7.350%, 11/15/2019 | 34,551 |
| 20,000 | | Chubb Corp., Sr. Note, 5.750%, 05/15/2018 | 21,583 |
| 100,000 | 2,3 | Liberty Mutual Group, Inc., Series 144A, 4.850%, 8/01/2044 | 106,002 |
| 65,000 | 2,3 | Nationwide Mutual Insurance Co., Sub. Note, Series 144A, 9.375%, 08/15/2039 | 104,418 |
| | | TOTAL | 352,863 |
| | | Financial Institution - REIT - Apartment—0.0% | |
| 20,000 | | Post Apartment Homes LP, Sr. Unsecd. Note, 3.375%, 12/01/2022 | 20,436 |
Annual Shareholder Report
Principal
Amount
or Shares | | | Value |
| | | CORPORATE BONDS—continued | |
| | | Financial Institution - REIT - Apartment—continued | |
| $10,000 | | UDR, Inc., Company Guarantee, 4.625%, 01/10/2022 | $11,089 |
| | | TOTAL | 31,525 |
| | | Financial Institution - REIT - Healthcare—0.1% | |
| 40,000 | | Health Care REIT, Inc., Sr. Unsecd. Note, 6.125%, 04/15/2020 | 45,655 |
| 50,000 | | Healthcare Trust of America, 3.700%, 04/15/2023 | 51,926 |
| | | TOTAL | 97,581 |
| | | Financial Institution - REIT - Office—0.1% | |
| 50,000 | | Alexandria Real Estate Equities, Inc., Sr. Unsecd. Note, 3.900%, 06/15/2023 | 52,232 |
| 50,000 | | Alexandria Real Estate Equities, Inc., Sr. Unsecd. Note, 4.600%, 04/01/2022 | 54,329 |
| 55,000 | | Boston Properties LP, Sr. Unsecd. Note, 5.875%, 10/15/2019 | 62,196 |
| | | TOTAL | 168,757 |
| | | Financial Institution - REIT - Other—0.2% | |
| 75,000 | | Liberty Property LP, 6.625%, 10/01/2017 | 79,200 |
| 50,000 | | ProLogis LP, Sr. Unsecd. Note, 3.350%, 02/01/2021 | 53,111 |
| 75,000 | | WP Carey, Inc., Sr. Unsecd. Note, 4.600%, 04/01/2024 | 78,151 |
| | | TOTAL | 210,462 |
| | | Financial Institution - REIT - Retail—0.1% | |
| 50,000 | | Kimco Realty Corp., Sr. Unsecd. Note, 3.400%, 11/01/2022 | 52,728 |
| 20,000 | | Regency Centers LP, Company Guarantee, 4.800%, 04/15/2021 | 22,083 |
| 30,000 | | Tanger Properties LP, Sr. Unsecd. Note, 6.125%, 06/01/2020 | 34,228 |
| | | TOTAL | 109,039 |
| | | Sovereign—0.0% | |
| 30,000 | | Corp Andina De Fomento, Sr. Unsecd. Note, 4.375%, 06/15/2022 | 33,521 |
| | | Technology—1.0% | |
| 45,000 | | Apple, Inc., Sr. Unsecd. Note, 1.000%, 05/03/2018 | 45,097 |
| 30,000 | | Apple, Inc., Sr. Unsecd. Note, 2.400%, 05/03/2023 | 30,841 |
| 100,000 | | Apple, Inc., Sr. Unsecd. Note, Series 30 Year, 3.850%, 08/04/2046 | 101,408 |
| 115,000 | | Autodesk, Inc., Sr. Unsecd. Note, 4.375%, 6/15/2025 | 122,175 |
| 140,000 | | Automatic Data Processing, Inc., 3.375%, 9/15/2025 | 153,703 |
| 20,000 | | Corning, Inc., Unsecd. Note, 4.750%, 03/15/2042 | 21,320 |
| 240,000 | 2,3 | Diamond 1 Finance Corp./Diamond 2 Finance Corp., Term Loan—1st Lien, Series 144A, 6.020%, 06/15/2026 | 257,959 |
| 125,000 | | Equifax, Inc., Sr. Unsecd. Note, 2.300%, 06/01/2021 | 126,700 |
| 100,000 | | Fidelity National Information Services, Inc., Sr. Unsecd. Note, 3.500%, 04/15/2023 | 104,782 |
Annual Shareholder Report
Principal
Amount
or Shares | | | Value |
| | | CORPORATE BONDS—continued | |
| | | Technology—continued | |
| $180,000 | | Fidelity National Information Services, Inc., Sr. Unsecd. Note, 5.000%, 10/15/2025 | $208,761 |
| 70,000 | 2,3 | Hewlett Packard Enterprise Co., Sr. Unsecd. Note, Series 144A, 3.600%, 10/15/2020 | 73,929 |
| 20,000 | | Ingram Micro, Inc., Sr. Unsecd. Note, 5.000%, 08/10/2022 | 20,587 |
| 50,000 | | Total System Services, Inc., Sr. Unsecd. Note, 4.800%, 04/01/2026 | 55,714 |
| 10,000 | | Verisk Analytics, Inc., Sr. Unsecd. Note, 4.125%, 09/12/2022 | 10,745 |
| 25,000 | | Verisk Analytics, Inc., Sr. Unsecd. Note, 4.875%, 01/15/2019 | 26,684 |
| 50,000 | | Verisk Analytics, Inc., Sr. Unsecd. Note, 5.500%, 06/15/2045 | 54,178 |
| 20,000 | | Xerox Corp., Sr. Unsecd. Note, 2.950%, 03/15/2017 | 20,109 |
| | | TOTAL | 1,434,692 |
| | | Transportation - Airlines—0.1% | |
| 130,000 | | Southwest Airlines Co., Sr. Unsecd. Note, 5.125%, 03/01/2017 | 132,971 |
| | | Transportation - Railroads—0.2% | |
| 50,000 | | Burlington Northern Santa Fe Corp., Deb., 5.750%, 05/01/2040 | 67,900 |
| 30,000 | | Kansas City Southern Industries, Inc., Sr. Unsecd. Note, 3.000%, 05/15/2023 | 30,934 |
| 225,000 | | Kansas City Southern Industries, Inc., Sr. Unsecd. Note, 3.125%, 06/01/2026 | 231,133 |
| | | TOTAL | 329,967 |
| | | Transportation - Services—0.1% | |
| 90,000 | 2,3 | Enterprise Rent-A-Car USA Finance Co., Series 144A, 6.375%, 10/15/2017 | 95,173 |
| 50,000 | | Ryder System, Inc., Sr. Unsecd. Note, Series MTN, 2.450%, 11/15/2018 | 50,740 |
| 30,000 | | United Parcel Service, Inc., Sr. Unsecd. Note, 3.125%, 01/15/2021 | 32,233 |
| | | TOTAL | 178,146 |
| | | Utility - Electric—1.2% | |
| 5,000 | | Consolidated Edison Co., Sr. Unsecd. Note, 6.650%, 04/01/2019 | 5,693 |
| 70,000 | 2,3 | Electricite de France SA, Note, Series 144A, 5.600%, 01/27/2040 | 84,079 |
| 140,000 | 2,3 | Emera US Finance LP, Sr. Unsecd. Note, Series 144A, 4.750%, 06/15/2046 | 154,940 |
| 170,000 | | EverSource Energy, Sr. Unsecd. Note, 3.350%, 03/15/2026 | 181,551 |
| 200,000 | | Exelon Corp., Sr. Unsecd. Note, 3.400%, 04/15/2026 | 210,906 |
| 100,000 | | Exelon Generation Co. LLC, Sr. Unsecd. Note, 4.250%, 06/15/2022 | 107,369 |
| 10,000 | | Great Plains Energy, Inc., Note, 4.850%, 06/01/2021 | 11,010 |
| 4,756 | 2,3 | Great River Energy, 1st Mtg. Note, Series 144A, 5.829%, 7/01/2017 | 4,913 |
| 70,000 | | Indiana Michigan Power Co., Sr. Unsecd. Note, Series K, 4.550%, 03/15/2046 | 81,264 |
| 110,000 | | National Rural Utilities, Sr. Sub., 5.250%, 04/20/2046 | 116,369 |
Annual Shareholder Report
Principal
Amount
or Shares | | | Value |
| | | CORPORATE BONDS—continued | |
| | | Utility - Electric—continued | |
| $25,000 | | National Rural Utilities, Sr. Unsecd. Note, Series MTNC, 8.000%, 3/01/2032 | $38,143 |
| 50,000 | | NextEra Energy Capital Holdings, Inc., Sr. Unsecd. Note, 2.700%, 09/15/2019 | 51,579 |
| 80,000 | | Northern States Power Co., MN, 1st Mtg. Bond, 5.250%, 03/01/2018 | 85,268 |
| 250,000 | | PPL Capital Funding, Inc., Sr. Unsecd. Note, 3.100%, 05/15/2026 | 255,726 |
| 50,000 | | Progress Energy, Inc., 7.050%, 03/15/2019 | 56,832 |
| 175,000 | | Southern Co., Sr. Unsecd. Note, 3.250%, 07/01/2026 | 183,926 |
| 10,000 | | TECO Finance, Inc., Company Guarantee, 5.150%, 03/15/2020 | 11,097 |
| 40,000 | | UIL Holdings Corp., Sr. Unsecd. Note, 4.625%, 10/01/2020 | 43,301 |
| | | TOTAL | 1,683,966 |
| | | Utility - Natural Gas—0.2% | |
| 20,000 | | Atmos Energy Corp., 8.500%, 03/15/2019 | 23,444 |
| 100,000 | | Atmos Energy Corp., Sr. Unsecd. Note, 4.125%, 10/15/2044 | 111,371 |
| 50,000 | | Enbridge Energy Partners LP, Sr. Unsecd. Note, 4.200%, 09/15/2021 | 51,597 |
| 40,000 | | Enbridge, Inc., Sr. Note, 5.600%, 04/01/2017 | 40,993 |
| 65,000 | | National Fuel Gas Co., Sr. Unsecd. Note, 3.750%, 03/01/2023 | 64,797 |
| | | TOTAL | 292,202 |
| | | TOTAL CORPORATE BONDS
(IDENTIFIED COST $22,002,894) | 23,424,916 |
| | | MORTGAGE-BACKED SECURITY—0.0% | |
| | | Federal National Mortgage Association—0.0% | |
| 256 | | Federal National Mortgage Association Pool 609554, 7.500%, 10/1/2016
(IDENTIFIED COST $266) | 257 |
| | | MUNICIPAL BOND—0.1% | |
| | | Municipal Services—0.1% | |
| 70,000 | | Chicago, IL Metropolitan Water Reclamation District, Direct Payment Taxable Limited GO Build America Bonds, 5.720%, 12/01/2038
(IDENTIFIED COST $70,000) | 90,703 |
| | | U.S. TREASURY—1.2% | |
| 435,000 | | United States Treasury Bond, 2.500%, 2/15/2046 | 463,944 |
| 325,000 | | United States Treasury Bond, 2.500%, 5/15/2046 | 347,293 |
| 200,000 | | United States Treasury Note, 0.875%, 6/15/2019 | 200,653 |
| 50,000 | | United States Treasury Note, 1.625%, 5/15/2026 | 50,774 |
| 10,000 | | United States Treasury Note, 2.250%, 11/15/2024 | 10,681 |
| 253,227 | | U.S. Treasury Inflation-Protected Note, 0.375%, 7/15/2025 | 261,649 |
| 159,192 | | U.S. Treasury Inflation-Protected Note, Series A-2022, 0.125%, 1/15/2022 | 161,773 |
Annual Shareholder Report
Principal
Amount
or Shares | | | Value |
| | | U.S. TREASURY—continued | |
| $177,034 | 5 | U.S. Treasury Inflation-Protected Note, Series D-2024, 0.125%, 7/15/2024 | $179,205 |
| | | TOTAL U.S. TREASURY
(IDENTIFIED COST $1,605,955) | 1,675,972 |
| | | EXCHANGE-TRADED FUNDS—5.0% | |
| 30,000 | | iShares Core MSCI Emerging Markets ETF | 1,319,100 |
| 96,000 | | iShares MSCI EAFE ETF | 5,569,920 |
| | | TOTAL EXCHANGE-TRADED FUNDS
(IDENTIFIED COST $7,715,046) | 6,889,020 |
| | | INVESTMENT COMPANIES—22.6%6 | |
| 166,883 | | Emerging Markets Core Fund | 1,707,215 |
| 220,091 | | Federated Bank Loan Core Fund | 2,203,112 |
| 4,202,435 | | Federated Institutional Prime Value Obligations Fund, Institutional Shares, 0.36%7 | 4,202,435 |
| 1,511,148 | | Federated Mortgage Core Portfolio | 15,217,257 |
| 307,620 | | Federated Project and Trade Finance Core Fund | 2,867,023 |
| 826,313 | | High Yield Bond Portfolio | 5,147,928 |
| | | TOTAL INVESTMENT COMPANIES
(IDENTIFIED COST $31,713,415) | 31,344,970 |
| | | TOTAL INVESTMENTS—99.9%
(IDENTIFIED COST $136,873,400)8 | 138,547,218 |
| | | OTHER ASSETS AND LIABILITIES - NET—0.1%9 | 184,521 |
| | | TOTAL NET ASSETS—100% | $138,731,739 |
At July 31, 2016, the Fund had the following outstanding futures contracts:
| Description | Number of
Contracts | Notional
Value | Expiration
Date | Unrealized
Appreciation
(Depreciation) |
| 1United States Treasury Note 2-Year Long Futures | 50 | $10,950,000 | September 2016 | $(2,458) |
| 1United States Treasury Ultra Bond Long Futures | 13 | $2,476,906 | September 2016 | $149,090 |
| 1United States Treasury Note 5-Year Short Futures | 43 | $5,246,672 | September 2016 | $(89,124) |
| 1United States Treasury Note 10-Year Short Futures | 20 | $2,660,937 | September 2016 | $(5,424) |
| NET UNREALIZED APPRECIATION ON FUTURES CONTRACTS | $52,084 |
Net Unrealized Appreciation on Futures Contracts is included in “Other Assets and Liabilities—Net.”
Annual Shareholder Report
| 1 | Non-income-producing security. |
| 2 | Denotes a restricted security that either: (a) cannot be offered for public sale without first being registered, or being able to take advantage of an exemption from registration, under the Securities Act of 1933; or (b) is subject to a contractual restriction on public sales. At July 31, 2016, these restricted securities amounted to $3,536,932, which represented 2.5% of total net assets. |
| 3 | Denotes a restricted security that may be resold without restriction to “qualified institutional buyers” as defined in Rule 144A under the Securities Act of 1933 and that the Fund has determined to be liquid under criteria established by the Fund's Board of Trustees (the “Trustees”). At July 31, 2016, these liquid restricted securities amounted to $3,315,297, which represented 2.4% of total net assets. |
| 4 | JPMorgan Chase & Co. has fully and unconditionally guaranteed Bear Stearns' outstanding registered debt securities. |
| 5 | All or a portion of this security is pledged as collateral to ensure the Fund is able to satisfy the obligations of its outstanding futures contracts. |
| 6 | Affiliated holdings. |
| 7 | 7-day net yield. |
| 8 | The cost of investments for federal tax purposes amounts to $136,841,125. |
| 9 | Assets, other than investments in securities, less liabilities. See Statement of Assets and Liabilities. |
Note: The categories of investments are shown as a percentage of total net assets at July 31, 2016.
Various inputs are used in determining the value of the Fund's investments. These inputs are summarized in the three broad levels listed below:
Level 1—quoted prices in active markets for identical securities.
Level 2—other significant observable inputs (including quoted prices for similar securities, interest rates, prepayment speeds, credit risk, etc.). Also includes securities valued at amortized cost.
Level 3—significant unobservable inputs (including the Fund's own assumptions in determining the fair value of investments).
The inputs or methodology used for valuing securities are not an indication of the risk associated with investing in those securities.
Annual Shareholder Report
The following is a summary of the inputs used, as of July 31, 2016, in valuing the Fund's assets carried at fair value:
| Valuation Inputs | | | | |
| | Level 1—
Quoted
Prices | Level 2—
Other
Significant
Observable
Inputs | Level 3—
Significant
Unobservable
Inputs | Total |
| Equity Securities: | | | | |
| Common Stocks | | | | |
| Domestic | $67,621,208 | $— | $— | $67,621,208 |
| International | 2,424,724 | — | — | 2,424,724 |
| Debt Securities: | | | | |
| Asset-Backed Securities | — | 1,452,274 | — | 1,452,274 |
| Collateralized Mortgage Obligations | — | 3,623,174 | — | 3,623,174 |
| Corporate Bonds | — | 23,424,916 | — | 23,424,916 |
| Mortgage-Backed Security | — | 257 | — | 257 |
| Municipal Bond | — | 90,703 | — | 90,703 |
| U.S. Treasury | — | 1,675,972 | — | 1,675,972 |
| Exchange-Traded Funds | 6,889,020 | — | — | 6,889,020 |
| Investment Companies1 | 4,202,435 | — | — | 31,344,970 |
| TOTAL SECURITIES | $81,137,387 | $30,267,296 | $— | $138,547,218 |
| Other Financial Instruments:2 | | | | |
| Assets | $149,090 | $— | $— | $149,090 |
| Liabilities | (97,006) | — | — | (97,006) |
| TOTAL OTHER FINANCIAL INSTRUMENTS | $52,084 | $— | $— | $52,084 |
| 1 | As permitted by U.S. generally accepted accounting principles (GAAP), Investment Companies valued at $27,142,535 are measured at fair value using the net asset value (NAV) per share practical expedient and have not been categorized in the chart above but are included in the Total column. The amount included herein is intended to permit reconciliation of the fair value classifications to the amounts presented on the Statement of Assets and Liabilities. The price of shares redeemed in Emerging Markets Core Fund, Federated Bank Loan Core Fund, Federated Mortgage Core Portfolio and High Yield Bond Portfolio is the next determined NAV after receipt of a shareholder redemption request. The price of shares redeemed of Federated Project and Trade Finance Core Fund may be determined as of the closing NAV of the fund up to twenty-four days after receipt of a shareholder redemption request. |
| 2 | Other financial instruments include futures contracts. |
The following acronyms are used throughout this portfolio:
| ETF | —Exchange-Traded Fund |
| FREMF | —Freddie Mac Multifamily K-Deals |
| GO | —General Obligation |
| MTN | —Medium Term Note |
| REIT(s) | —Real Estate Investment Trust(s) |
| REMIC | —Real Estate Mortgage Investment Conduit |
See Notes which are an integral part of the Financial Statements
Annual Shareholder Report
Financial Highlights–Class A Shares
(For a Share Outstanding Throughout Each Period)
| Year Ended July 31 | 2016 | 2015 | 2014 | 2013 | 2012 |
| Net Asset Value, Beginning of Period | $16.83 | $16.07 | $14.35 | $12.20 | $12.17 |
| Income From Investment Operations: | | | | | |
| Net investment income | 0.241 | 0.201 | 0.171 | 0.141 | 0.171 |
| Net realized and unrealized gain (loss) on investments, futures contracts, swap contracts and foreign currency transactions | (0.31) | 0.74 | 1.70 | 2.19 | 0.02 |
| TOTAL FROM INVESTMENT OPERATIONS | (0.07) | 0.94 | 1.87 | 2.33 | 0.19 |
| Less Distributions: | | | | | |
| Distributions from net investment income | (0.24) | (0.18) | (0.15) | (0.18) | (0.16) |
| Net Asset Value, End of Period | $16.52 | $16.83 | $16.07 | $14.35 | $12.20 |
| Total Return2 | (0.37)% | 5.89% | 13.06% | 19.28% | 1.65% |
| Ratios to Average Net Assets: | | | | | |
| Net expenses | 1.30% | 1.30% | 1.30% | 1.30% | 1.30% |
| Net investment income | 1.51% | 1.21% | 1.10% | 1.10% | 1.43% |
| Expense waiver/reimbursement3 | 0.10% | 0.09% | 0.10% | 0.11% | 0.28% |
| Supplemental Data: | | | | | |
| Net assets, end of period (000 omitted) | $61,245 | $62,555 | $55,634 | $50,340 | $48,774 |
| Portfolio turnover | 98% | 89% | 34% | 105% | 149% |
| 1 | Per share numbers have been calculated using the average shares method. |
| 2 | Based on net asset value, which does not reflect the sales charge, redemption fee or contingent deferred sales charge, if applicable. |
| 3 | This expense decrease is reflected in both the net expense and the net investment income ratios shown above. |
See Notes which are an integral part of the Financial Statements
Annual Shareholder Report
Financial Highlights–Class C Shares
(For a Share Outstanding Throughout Each Period)
| Year Ended July 31 | 2016 | 2015 | 2014 | 2013 | 2012 |
| Net Asset Value, Beginning of Period | $16.59 | $15.84 | $14.16 | $12.03 | $11.99 |
| Income From Investment Operations: | | | | | |
| Net investment income | 0.121 | 0.071 | 0.051 | 0.041 | 0.081 |
| Net realized and unrealized gain (loss) on investments, futures contracts, swap contracts and foreign currency transactions | (0.31) | 0.74 | 1.67 | 2.16 | 0.03 |
| TOTAL FROM INVESTMENT OPERATIONS | (0.19) | 0.81 | 1.72 | 2.20 | 0.11 |
| Less Distributions: | | | | | |
| Distributions from net investment income | (0.10) | (0.06) | (0.04) | (0.07) | (0.07) |
| Net Asset Value, End of Period | $16.30 | $16.59 | $15.84 | $14.16 | $12.03 |
| Total Return2 | (1.10)% | 5.12% | 12.14% | 18.41% | 0.93% |
| Ratios to Average Net Assets: | | | | | |
| Net expenses | 2.05% | 2.05% | 2.05% | 2.05% | 2.05% |
| Net investment income | 0.76% | 0.45% | 0.34% | 0.36% | 0.68% |
| Expense waiver/reimbursement3 | 0.08% | 0.06% | 0.07% | 0.08% | 0.24% |
| Supplemental Data: | | | | | |
| Net assets, end of period (000 omitted) | $29,152 | $31,571 | $34,522 | $35,450 | $34,193 |
| Portfolio turnover | 98% | 89% | 34% | 105% | 149% |
| 1 | Per share numbers have been calculated using the average shares method. |
| 2 | Based on net asset value, which does not reflect the sales charge, redemption fee or contingent deferred sales charge, if applicable. |
| 3 | This expense decrease is reflected in both the net expense and the net investment income ratios shown above. |
See Notes which are an integral part of the Financial Statements
Annual Shareholder Report
Financial Highlights–Class R Shares
(For a Share Outstanding Throughout Each Period)
| Year Ended July 31 | 2016 | 2015 | 2014 | 2013 | 2012 |
| Net Asset Value, Beginning of Period | $16.80 | $16.05 | $14.33 | $12.17 | $12.12 |
| Income From Investment Operations: | | | | | |
| Net investment income | 0.201 | 0.161 | 0.131 | 0.091 | 0.111 |
| Net realized and unrealized gain (loss) on investments, futures contracts, swap contracts and foreign currency transactions | (0.31) | 0.74 | 1.69 | 2.19 | 0.03 |
| TOTAL FROM INVESTMENT OPERATIONS | (0.11) | 0.90 | 1.82 | 2.28 | 0.14 |
| Less Distributions: | | | | | |
| Distributions from net investment income | (0.20) | (0.15) | (0.10) | (0.12) | (0.09) |
| Net Asset Value, End of Period | $16.49 | $16.80 | $16.05 | $14.33 | $12.17 |
| Total Return2 | (0.59)% | 5.61% | 12.72% | 18.84% | 1.19% |
| Ratios to Average Net Assets: | | | | | |
| Net expenses | 1.56% | 1.56% | 1.57% | 1.69% | 1.80% |
| Net investment income | 1.27% | 0.96% | 0.84% | 0.70% | 0.93% |
| Expense waiver/reimbursement3 | 0.04% | 0.03% | 0.05% | 0.06% | 0.22% |
| Supplemental Data: | | | | | |
| Net assets, end of period (000 omitted) | $577 | $532 | $464 | $417 | $526 |
| Portfolio turnover | 98% | 89% | 34% | 105% | 149% |
| 1 | Per share numbers have been calculated using the average shares method. |
| 2 | Based on net asset value. |
| 3 | This expense decrease is reflected in both the net expense and the net investment income ratios shown above. |
See Notes which are an integral part of the Financial Statements
Annual Shareholder Report
Financial Highlights–Institutional Shares
(For a Share Outstanding Throughout Each Period)
| Year Ended July 31 | 2016 | 2015 | 2014 | 2013 | 2012 |
| Net Asset Value, Beginning of Period | $16.87 | $16.11 | $14.39 | $12.23 | $12.21 |
| Income From Investment Operations: | | | | | |
| Net investment income | 0.281 | 0.241 | 0.211 | 0.181 | 0.201 |
| Net realized and unrealized gain (loss) on investments, futures contracts, swap contracts and foreign currency transactions | (0.30) | 0.74 | 1.69 | 2.19 | 0.02 |
| TOTAL FROM INVESTMENT OPERATIONS | (0.02) | 0.98 | 1.90 | 2.37 | 0.22 |
| Less Distributions: | | | | | |
| Distributions from net investment income | (0.28) | (0.22) | (0.18) | (0.21) | (0.20) |
| Net Asset Value, End of Period | $16.57 | $16.87 | $16.11 | $14.39 | $12.23 |
| Total Return2 | (0.07)% | 6.13% | 13.30% | 19.63% | 1.87% |
| Ratios to Average Net Assets: | | | | | |
| Net expenses | 1.05% | 1.05% | 1.05% | 1.05% | 1.05% |
| Net investment income | 1.76% | 1.46% | 1.35% | 1.35% | 1.69% |
| Expense waiver/reimbursement3 | 0.05% | 0.04% | 0.06% | 0.07% | 0.23% |
| Supplemental Data: | | | | | |
| Net assets, end of period (000 omitted) | $47,757 | $53,291 | $49,667 | $46,365 | $43,341 |
| Portfolio turnover | 98% | 89% | 34% | 105% | 149% |
| 1 | Per share numbers have been calculated using the average shares method. |
| 2 | Based on net asset value. |
| 3 | This expense decrease is reflected in both the net expense and the net investment income ratios shown above. |
See Notes which are an integral part of the Financial Statements
Annual Shareholder Report
Statement of Assets and Liabilities
July 31, 2016
| Assets: | | |
| Total investment in securities, at value including $31,344,970 of investment in affiliated holdings (Note 5) (identified cost $136,873,400) | | $138,547,218 |
| Income receivable | | 328,660 |
| Receivable for investments sold | | 1,184,377 |
| Receivable for shares sold | | 66,789 |
| Receivable for daily variation margin on futures contracts | | 7,252 |
| TOTAL ASSETS | | 140,134,296 |
| Liabilities: | | |
| Payable for investments purchased | $1,170,890 | |
| Payable for shares redeemed | 29,276 | |
| Payable to adviser (Note 5) | 8,376 | |
| Payable for administrative fee (Note 5) | 888 | |
| Payable for auditing fees | 30,600 | |
| Payable for distribution services fee (Note 5) | 18,635 | |
| Payable for other service fees (Notes 2 and 5) | 45,625 | |
| Payable for share registration costs | 37,459 | |
| Accrued expenses (Note 5) | 60,808 | |
| TOTAL LIABILITIES | | 1,402,557 |
| Net assets for 8,412,395 shares outstanding | | $138,731,739 |
| Net Assets Consist of: | | |
| Paid-in capital | | $146,900,592 |
| Net unrealized appreciation of investments and futures contracts | | 1,725,902 |
| Accumulated net realized loss on investments and futures contracts | | (11,068,943) |
| Undistributed net investment income | | 1,174,188 |
| TOTAL NET ASSETS | | $138,731,739 |
Annual Shareholder Report
Statement of Assets and Liabilities–continued
| Net Asset Value, Offering Price and Redemption Proceeds Per Share | | |
| Class A Shares: | | |
| Net asset value per share ($61,245,423 ÷ 3,706,859 shares outstanding), no par value, unlimited shares authorized | | $16.52 |
| Offering price per share (100/94.50 of $16.52) | | $17.48 |
| Redemption proceeds per share | | $16.52 |
| Class C Shares: | | |
| Net asset value per share ($29,151,900 ÷ 1,788,393 shares outstanding), no par value, unlimited shares authorized | | $16.30 |
| Offering price per share | | $16.30 |
| Redemption proceeds per share (99.00/100 of $16.30) | | $16.14 |
| Class R Shares: | | |
| Net asset value per share ($577,167 ÷ 34,993 shares outstanding), no par value, unlimited shares authorized | | $16.49 |
| Offering price per share | | $16.49 |
| Redemption proceeds per share | | $16.49 |
| Institutional Shares: | | |
| Net asset value per share ($47,757,249 ÷ 2,882,150 shares outstanding), no par value, unlimited shares authorized | | $16.57 |
| Offering price per share | | $16.57 |
| Redemption proceeds per share | | $16.57 |
See Notes which are an integral part of the Financial Statements
Annual Shareholder Report
Statement of Operations
Year Ended July 31, 2016
| Investment Income: | | | |
| Dividends (including $904,925 received from affiliated holdings (Note 5) and net of foreign taxes withheld of $378) | | | $2,827,276 |
| Interest | | | 975,076 |
| Investment income allocated from an affiliated partnership (Note 5) | | | 75,273 |
| TOTAL INCOME | | | 3,877,625 |
| Expenses: | | | |
| Investment adviser fee (Note 5) | | $1,037,057 | |
| Administrative fee (Note 5) | | 108,166 | |
| Custodian fees | | 31,486 | |
| Transfer agent fee (Note 2) | | 141,271 | |
| Directors'/Trustees' fees (Note 5) | | 2,762 | |
| Auditing fees | | 30,600 | |
| Legal fees | | 8,236 | |
| Portfolio accounting fees | | 107,065 | |
| Distribution services fee (Note 5) | | 224,162 | |
| Other service fees (Notes 2 and 5) | | 217,537 | |
| Share registration costs | | 59,535 | |
| Printing and postage | | 31,094 | |
| Miscellaneous (Note 5) | | 15,195 | |
| EXPENSES BEFORE ALLOCATION | | 2,014,166 | |
| Expenses allocated from affiliated partnership (Note 2) | | 898 | |
| TOTAL EXPENSES | | 2,015,064 | |
| Waiver and Reimbursements: | | | |
| Waiver/reimbursement of investment adviser fee (Note 5) | $(48,596) | | |
| Reimbursement of other operating expenses (Notes 2 and 5) | (59,945) | | |
| TOTAL WAIVER AND REIMBURSEMENTS | | (108,541) | |
| Net expenses | | | 1,906,523 |
| Net investment income | | | 1,971,102 |
Annual Shareholder Report
Statement of Operations–continued
| Realized and Unrealized Gain (Loss) on Investments and Futures Contracts: | | | |
| Net realized gain on investments (including realized gain of $269,626 on sales of investments in affiliated holdings (Note 5)) | | | $3,350,020 |
| Net realized loss on futures contracts | | | (222,092) |
| Net realized loss on investments and foreign currency transactions allocated from an affiliated partnership (Note 5) | | | (70,479) |
| Realized gain distribution from registered investment company shares (Note 5) | | | 52,801 |
| Net change in unrealized appreciation of investments | | | (6,222,212) |
| Net change in unrealized depreciation of futures contracts | | | 105,179 |
| Net realized and unrealized loss on investments and futures contracts | | | (3,006,783) |
| Change in net assets resulting from operations | | | $(1,035,681) |
See Notes which are an integral part of the Financial Statements
Annual Shareholder Report
Statement of Changes in Net Assets
| Year Ended July 31 | 2016 | 2015 |
| Increase (Decrease) in Net Assets | | |
| Operations: | | |
| Net investment income | $1,971,102 | $1,631,758 |
| Net realized gain on investments including allocations from an affiliated partnership and futures contracts | 3,110,250 | 18,811,985 |
| Net change in unrealized appreciation/depreciation of investments and futures contracts | (6,117,033) | (12,482,552) |
| CHANGE IN NET ASSETS RESULTING FROM OPERATIONS | (1,035,681) | 7,961,191 |
| Distributions to Shareholders: | | |
| Distributions from net investment income | | |
| Class A Shares | (912,021) | (627,231) |
| Class C Shares | (200,679) | (120,251) |
| Class R Shares | (7,400) | (4,641) |
| Institutional Shares | (830,257) | (724,945) |
| CHANGE IN NET ASSETS RESULTING FROM DISTRIBUTIONS TO SHAREHOLDERS | (1,950,357) | (1,477,068) |
| Share Transactions: | | |
| Proceeds from sale of shares | 17,267,895 | 27,367,111 |
| Net asset value of shares issued to shareholders in payment of distributions declared | 1,804,807 | 1,374,214 |
| Cost of shares redeemed | (25,304,874) | (27,563,013) |
| CHANGE IN NET ASSETS RESULTING FROM SHARE TRANSACTIONS | (6,232,172) | 1,178,312 |
| Change in net assets | (9,218,210) | 7,662,435 |
| Net Assets: | | |
| Beginning of period | 147,949,949 | 140,287,514 |
| End of period (including undistributed net investment income of $1,174,188 and $1,103,078, respectively) | $138,731,739 | $147,949,949 |
See Notes which are an integral part of the Financial Statements
Annual Shareholder Report
Notes to Financial Statements
July 31, 2016
1. ORGANIZATION
Federated MDT Series (the “Trust”) is registered under the Investment Company Act of 1940, as amended (the “Act”), as an open-end management investment company. The Trust consists of five portfolios. The financial statements included herein are only those of Federated MDT Balanced Fund (the “Fund”), a diversified portfolio. The financial statements of the other portfolios are presented separately. The assets of each portfolio are segregated and a shareholder's interest is limited to the portfolio in which shares are held. Each portfolio pays its own expenses. The Fund offers four classes of shares: Class A Shares, Class C Shares, Class R Shares and Institutional Shares. All shares of the Fund have equal rights with respect to voting, except on class-specific matters. On June 20, 2016, Class R Shares were closed to new accounts/investors. The investment objective of the Fund is the possibility of long-term growth of capital and income.
2. SIGNIFICANT ACCOUNTING POLICIES
The following is a summary of significant accounting policies consistently followed by the Fund in the preparation of its financial statements. These policies are in conformity with U.S. generally accepted accounting principles (GAAP).
Investment Valuation
In calculating its net asset value (NAV), the Fund generally values investments as follows:
| ■ | Equity securities listed on an exchange or traded through a regulated market system are valued at their last reported sale price or official closing price in their principal exchange or market. |
| ■ | Fixed-income securities acquired with remaining maturities greater than 60 days are fair valued using price evaluations provided by a pricing service approved by the Trustees. |
| ■ | Fixed-income securities and repurchase agreements acquired with remaining maturities of 60 days or less are valued at their cost (adjusted for the accretion of any discount or amortization of any premium), unless the issuer's creditworthiness is impaired or other factors indicate that amortized cost is not an accurate estimate of the investment's fair value, in which case it would be valued in the same manner as a longer-term security. |
| ■ | Shares of other mutual funds or non-exchange-traded investment companies are valued based upon their reported NAVs. |
| ■ | Derivative contracts listed on exchanges are valued at their reported settlement or closing price, except that options are valued at the mean of closing bid and asked quotations. |
| ■ | Over-the-counter (OTC) derivative contracts are fair valued using price evaluations provided by a pricing service approved by the Trustees. |
| ■ | For securities that are fair valued in accordance with procedures established by and under the general supervision of the Trustees, certain factors may be considered such as: the last traded or purchase price of the security, information obtained by contacting the issuer or dealers, analysis of the issuer's financial statements or other available documents, fundamental analytical data, the nature and duration of restrictions on disposition, the movement of the market in which the security is normally traded, public trading in similar securities or derivative contracts of the issuer or comparable issuers, movement of a relevant index, or other factors including but not limited to industry changes and relevant government actions. |
Annual Shareholder Report
If any price, quotation, price evaluation or other pricing source is not readily available when the NAV is calculated, or if the Fund cannot obtain price evaluations from a pricing service or from more than one dealer for an investment within a reasonable period of time as set forth in the Fund's valuation policies and procedures, the Fund uses the fair value of the investment determined in accordance with the procedures described below. There can be no assurance that the Fund could obtain the fair value assigned to an investment if it sold the investment at approximately the time at which the Fund determines its NAV per share.
Fair Valuation and Significant Events Procedures
The Trustees have ultimate responsibility for determining the fair value of investments for which market quotations are not readily available. The Trustees have appointed a valuation committee (“Valuation Committee”) comprised of officers of the Fund, Federated MDTA LLC (“Adviser”) and certain of the Adviser's affiliated companies to assist in determining fair value and in overseeing the calculation of the NAV. The Trustees have also authorized the use of pricing services recommended by the Valuation Committee to provide fair value evaluations of the current value of certain investments for purposes of calculating the NAV. The Valuation Committee employs various methods for reviewing third-party pricing-service evaluations including periodic reviews of third-party pricing services' policies, procedures and valuation methods (including key inputs, methods, models and assumptions), transactional back-testing, comparisons of evaluations of different pricing services, and review of price challenges by the Adviser based on recent market activity. In the event that market quotations and price evaluations are not available for an investment, the Valuation Committee determines the fair value of the investment in accordance with procedures adopted by the Trustees. The Trustees periodically review and approve the fair valuations made by the Valuation Committee and any changes made to the procedures.
Factors considered by pricing services in evaluating an investment include the yields or prices of investments of comparable quality, coupon, maturity, call rights and other potential prepayments, terms and type, reported transactions, indications as to values from dealers and general market conditions. Some pricing services provide a single price evaluation reflecting the bid-side of the market for an investment (a “bid” evaluation). Other pricing services offer both bid evaluations and price evaluations indicative of a price between the prices bid and asked for the investment (a “mid” evaluation). The Fund normally uses bid evaluations for any U.S. Treasury and Agency securities, mortgage-backed securities and municipal securities. The Fund normally uses mid evaluations for any other types of fixed-income securities and any OTC derivative contracts. In the event that market quotations and price evaluations are not available for an investment, the fair value of the investment is determined in accordance with procedures adopted by the Trustees.
The Trustees also have adopted procedures requiring an investment to be priced at its fair value whenever the Adviser determines that a significant event affecting the value of the investment has occurred between the time as of which the price of the investment would otherwise be determined and the time as of which the NAV is computed. An event is considered significant if there is both an affirmative expectation that the investment's value will change in response to the event and a reasonable basis for quantifying the resulting change in value. Examples of significant events that may occur after the close of the principal market on which a security is traded, or after the time of a price evaluation provided by a pricing service or a dealer, include:
| ■ | With respect to securities traded principally in foreign markets, significant trends in U.S. equity markets or in the trading of foreign securities index futures contracts; |
Annual Shareholder Report
| ■ | Political or other developments affecting the economy or markets in which an issuer conducts its operations or its securities are traded; |
| ■ | Announcements concerning matters such as acquisitions, recapitalizations, litigation developments, or a natural disaster affecting the issuer's operations or regulatory changes or market developments affecting the issuer's industry. |
The Trustees have adopted procedures whereby the Valuation Committee uses a pricing service to determine the fair value of equity securities traded principally in foreign markets when the Adviser determines that there has been a significant trend in the U.S. equity markets or in index futures trading. For other significant events, the Fund may seek to obtain more current quotations or price evaluations from alternative pricing sources. If a reliable alternative pricing source is not available, the Fund will determine the fair value of the investment in accordance with the fair valuation procedures approved by the Trustees. The Trustees have ultimate responsibility for any fair valuations made in response to a significant event.
Repurchase Agreements
The Fund may invest in repurchase agreements for short-term liquidity purposes. It is the policy of the Fund to require the other party to a repurchase agreement to transfer to the Fund's custodian or sub-custodian eligible securities or cash with a market value (after transaction costs) at least equal to the repurchase price to be paid under the repurchase agreement. The eligible securities are transferred to accounts with the custodian or sub-custodian in which the Fund holds a “securities entitlement” and exercises “control” as those terms are defined in the Uniform Commercial Code. The Fund has established procedures for monitoring the market value of the transferred securities and requiring the transfer of additional eligible securities if necessary to equal at least the repurchase price. These procedures also allow the other party to require securities to be transferred from the account to the extent that their market value exceeds the repurchase price or in exchange for other eligible securities of equivalent market value.
The insolvency of the other party or other failure to repurchase the securities may delay the disposition of the underlying securities or cause the Fund to receive less than the full repurchase price. Under the terms of the repurchase agreement, any amounts received by the Fund in excess of the repurchase price and related transaction costs must be remitted to the other party.
The Fund may enter into repurchase agreements in which eligible securities are transferred into joint trading accounts maintained by the custodian or sub-custodian for investment companies and other clients advised by the Fund's Adviser and its affiliates. The Fund will participate on a pro rata basis with the other investment companies and clients in its share of the securities transferred under such repurchase agreements and in its share of proceeds from any repurchase or other disposition of such securities.
Investment Income, Gains and Losses, Expenses and Distributions
Investment transactions are accounted for on a trade-date basis. Realized gains and losses from investment transactions are recorded on an identified-cost basis. Interest income and expenses are accrued daily. Dividend income and distributions to shareholders are recorded on the ex-dividend date. Foreign dividends are recorded on the ex-dividend date or when the Fund is informed of the ex-dividend date. Positive or negative inflation adjustments on Treasury Inflation-Protected Securities (TIPS) are included in interest income. Distributions of net investment income are declared and paid annually. Non-cash dividends included in dividend income, if any, are recorded at fair value. The Fund invested in Emerging Markets Fixed
Annual Shareholder Report
Income Core Fund (EMCORE), a portfolio of Federated Core Trust II, L.P. which was a limited partnership established under the laws of the state of Delaware. The Fund recorded daily its proportionate share of income, expenses, realized and unrealized gains and losses from EMCORE.
Investment income, realized and unrealized gains and losses, and certain fund-level expenses are allocated to each class based on relative average daily net assets, except that Class A Shares, Class C Shares, Class R Shares and Institutional Shares may bear distribution services fees, other service fees and certain transfer agent fees unique to those classes. The detail of the total fund expense waiver and reimbursements of $108,541 is disclosed in various locations in this Note 2 and Note 5. For the year ended July 31, 2016, transfer agent fees for the Fund were as follows:
| | Transfer
Agent Fees
Incurred | Transfer
Agent Fees
Reimbursed |
| Class A Shares | $76,976 | $(39,636) |
| Class C Shares | 29,153 | (12,205) |
| Class R Shares | 304 | — |
| Institutional Shares | 34,838 | (8,104) |
| TOTAL | $141,271 | $(59,945) |
Dividends are declared separately for each class. No class has preferential dividend rights; differences in per share dividend rates are generally due to differences in separate class expenses.
Other Service Fees
The Fund may pay other service fees up to 0.25% of the average daily net assets of the Fund's Class A Shares and Class C Shares to unaffiliated financial intermediaries or to Federated Shareholder Services Company (FSSC) for providing services to shareholders and maintaining shareholder accounts. Subject to the terms described in the Expense Limitation note, FSSC may voluntarily reimburse the Fund for other service fees. For the year ended July 31, 2016, other service fees for the Fund were as follows:
| | Other
Service Fees
Incurred |
| Class A Shares | $144,451 |
| Class C Shares | 73,086 |
| TOTAL | $217,537 |
Premium and Discount Amortization/Paydown Gains and Losses
All premiums and discounts on fixed-income securities, other than mortgage-backed securities, are amortized/accreted using the effective-interest-rate method. Gains and losses realized on principal payment of mortgage-backed securities (paydown gains and losses) are classified as part of investment income.
Annual Shareholder Report
Federal Taxes
It is the Fund's policy to comply with the Subchapter M provision of the Internal Revenue Code (the “Code”) and to distribute to shareholders each year substantially all of its income. Accordingly, no provision for federal income tax is necessary. As of and during the year ended July 31, 2016, the Fund did not have a liability for any uncertain tax positions. The Fund recognizes interest and penalties, if any, related to tax liabilities as income tax expense in the Statement of Operations. As of July 31, 2016, tax years 2013 through 2016 remain subject to examination by the Fund's major tax jurisdictions, which include the United States of America and the Commonwealth of Massachusetts.
When-Issued and Delayed-Delivery Transactions
The Fund may engage in when-issued or delayed-delivery transactions. The Fund records when-issued securities on the trade date and maintains security positions such that sufficient liquid assets will be available to make payment for the securities purchased. Securities purchased on a when-issued or delayed-delivery basis are marked to market daily and begin earning interest on the settlement date. Losses may occur on these transactions due to changes in market conditions or the failure of counterparties to perform under the contract.
Futures Contracts
The Fund purchases and sells financial futures contracts to manage duration and yield curve risks. Upon entering into a financial futures contract with a broker, the Fund is required to deposit in a segregated account a specified amount of cash or U.S. government securities. Futures contracts are valued daily and unrealized gains or losses are recorded in a “variation margin” account. Daily, the Fund receives from or pays to the broker a specified amount of cash based upon changes in the variation margin account. When a contract is closed, the Fund recognizes a realized gain or loss. Futures contracts have market risks, including the risk that the change in the value of the contract may not correlate with the changes in the value of the underlying securities. There is minimal counterparty risk to the Fund since futures are exchange traded and the exchange's clearinghouse, as counterparty to all exchange traded futures, guarantees the futures against default.
Futures contracts outstanding at period end are listed after the Fund's Portfolio of Investments.
The average notional value of long and short futures contracts held by the Fund throughout the period was $18,365,488 and $9,616,111, respectively. This is based on amounts held as of each month-end throughout the fiscal period.
Restricted Securities
The Fund may purchase securities which are considered restricted. Restricted securities are securities that either: (a) cannot be offered for public sale without first being registered, or being able to take advantage of an exemption from registration, under the Securities Act of 1933; or (b) are subject to contractual restrictions on public sales. In some cases, when a security cannot be offered for public sale without first being registered, the issuer of the restricted security has agreed to register such securities for resale, at the issuer's expense, either upon demand by the Fund or in connection with another registered offering of the securities. Many such restricted securities may be resold in the secondary market in transactions exempt from registration. Restricted securities may be determined to be liquid under criteria established by the Trustees. The Fund will not incur any registration costs upon such resales. The Fund's restricted securities, like other securities, are priced in accordance with procedures established by and under the general supervision of the Trustees.
Annual Shareholder Report
Additional information on restricted securities, excluding securities purchased under Rule 144A that have been deemed liquid by the Trustees, if applicable, held at July 31, 2016, is as follows:
| Security | Acquisition
Date | Cost | Market
Value |
| Football Trust V, Pass Thru Cert., Series 144A, 5.350%, 10/05/2020 | 3/24/2010 | $200,000 | $221,635 |
Additional Disclosure Related to Derivative Instruments
| Fair Value of Derivative Instruments |
| | Asset |
| | Statement of
Assets and
Liabilities
Location | Fair
Value |
| Derivatives not accounted for as hedging instruments under ASC Topic 815 | | |
| Interest rate contracts | Receivable for
daily variation
margin on
futures contracts | $52,084* |
| * | Includes cumulative appreciation of futures contracts as reported in the footnotes to the Portfolio of Investments. Only the current day's variation margin is reported within the Statement of Assets and Liabilities. |
| | |
The Effect of Derivative Instruments on the Statement of Operations for the Year Ended July 31, 2016
| Amount of Realized Gain or (Loss) on Derivatives Recognized in Income |
| | Futures |
| Interest rate contracts | $(222,092) |
| Change in Unrealized Appreciation or (Depreciation) on Derivatives Recognized in Income |
| | Futures |
| Interest rate contracts | $105,179 |
Other
The preparation of financial statements in conformity with GAAP requires management to make estimates and assumptions that affect the amounts of assets, liabilities, expenses and revenues reported in the financial statements. Actual results could differ from those estimated. The Fund applies Investment Company accounting and reporting guidance.
Annual Shareholder Report
3. SHARES OF BENEFICIAL INTEREST
The following tables summarize share activity:
| Year Ended July 31 | 2016 | 2015 |
| Class A Shares: | Shares | Amount | Shares | Amount |
| Shares sold | 587,548 | $9,377,136 | 877,364 | $14,585,649 |
Shares issued to shareholders in
payment of distribution declared | 51,346 | 816,912 | 33,893 | 561,953 |
| Shares redeemed | (649,638) | (10,261,256) | (656,048) | (10,848,975) |
NET CHANGE RESULTING FROM
CLASS A SHARE TRANSACTIONS | (10,744) | $(67,208) | 255,209 | $4,298,627 |
| Year Ended July 31 | 2016 | 2015 |
| Class C Shares: | Shares | Amount | Shares | Amount |
| Shares sold | 302,928 | $4,781,444 | 291,257 | $4,780,270 |
Shares issued to shareholders in
payment of distribution declared | 11,611 | 182,981 | 6,665 | 109,378 |
| Shares redeemed | (429,374) | (6,745,049) | (573,519) | (9,319,128) |
NET CHANGE RESULTING FROM
CLASS C SHARE TRANSACTIONS | (114,835) | $(1,780,624) | (275,597) | $(4,429,480) |
| Year Ended July 31 | 2016 | 2015 |
| Class R Shares: | Shares | Amount | Shares | Amount |
| Shares sold | 8,198 | $131,010 | 5,140 | $84,844 |
Shares issued to shareholders in
payment of distribution declared | 402 | 6,380 | 276 | 4,573 |
| Shares redeemed | (5,256) | (82,857) | (2,687) | (44,528) |
NET CHANGE RESULTING FROM
CLASS R SHARE TRANSACTIONS | 3,344 | $54,533 | 2,729 | $44,889 |
| Year Ended July 31 | 2016 | 2015 |
| Institutional Shares: | Shares | Amount | Shares | Amount |
| Shares sold | 187,245 | $2,978,562 | 476,302 | $7,916,348 |
Shares issued to shareholders in
payment of distribution declared | 50,127 | 798,534 | 42,067 | 698,310 |
| Shares redeemed | (513,254) | (8,215,712) | (442,803) | (7,350,382) |
NET CHANGE RESULTING FROM
INSTITUTIONAL SHARE TRANSACTIONS | (275,882) | $(4,438,616) | 75,566 | $1,264,276 |
NET CHANGE RESULTING FROM
TOTAL FUND SHARE TRANSACTIONS | (398,117) | $(6,231,915) | 57,907 | $1,178,312 |
Annual Shareholder Report
4. FEDERAL TAX INFORMATION
The timing and character of income and capital gain distributions are determined in accordance with income tax regulations, which may differ from GAAP. These differences are due to differing treatments for partnership income, fair fund settlements and short-term capital gain distributions from regulated investment companies.
For the year ended July 31, 2016, permanent differences identified and reclassified among the components of net assets were as follows:
| Increase (Decrease) |
| Paid-In Capital | Undistributed
Net Investment
Income (Loss) | Accumulated
Net Realized
Gain (Loss) |
| $(12) | $50,365 | $(50,353) |
Net investment income (loss), net realized gains (losses), and net assets were not affected by this reclassification.
The tax character of distributions as reported on the Statement of Changes in Net Assets for the years ended July 31, 2016 and 2015 was as follows:
| | 2016 | 2015 |
| Ordinary income | $1,950,357 | $1,477,068 |
As of July 31, 2016, the components of distributable earnings on a tax basis were as follows:
| Undistributed ordinary income | $1,174,188 |
| Net unrealized appreciation | $1,706,093 |
| Capital loss carryforwards and deferrals | $(11,049,134) |
The difference between book-basis and tax-basis net unrealized appreciation is attributable to differing treatments for the deferral of losses on wash sales, deferral of paydown losses, and partnership investment.
At July 31, 2016, the cost of investments for federal tax purposes was $136,841,125. The net unrealized appreciation of investments for federal tax purposes excluding any unrealized appreciation resulting from futures contracts was $1,706,093. This consists of net unrealized appreciation from investments for those securities having an excess of value over cost of $7,721,960 and net unrealized depreciation from investments for those securities having an excess of cost over value of $6,015,867.
Annual Shareholder Report
At July 31, 2016, the Fund had a capital loss carryforward of $10,992,401 which will reduce the Fund's taxable income arising from future net realized gains on investments, if any, to the extent permitted by the Code, thereby reducing the amount of distributions to shareholders which would otherwise be necessary to relieve the Fund of any liability for federal income tax. Pursuant to the Code, a net capital loss incurred in taxable years beginning on or before December 22, 2010, is characterized as short-term and may be carried forward for a maximum of eight tax years (“Carryforward Limit”), whereas a net capital loss incurred in taxable years beginning after December 22, 2010, retains its character as either short-term or long-term, does not expire and is required to be utilized prior to the losses which have a Carryforward Limit.
The following schedule summarizes the Fund's capital loss carryforwards and expiration years:
| Expiration Year | Short-Term | Long-Term | Total |
| 2018 | $10,992,401 | NA | $10,992,401 |
The Fund used capital loss carryforwards of $3,356,548 to offset capital gains realized during the year ended July 31, 2016.
Under current tax rules, capital losses on securities transactions realized after October 31 may be deferred, in whole or in part, and treated as occurring on the first day of the following fiscal year. As of July 31, 2016, for federal income tax purposes, post-October losses of $40,536 were deferred to August 1, 2016.
As of the year ended July 31, 2016, for federal income tax purposes, the Fund has $16,197 in straddle loss deferrals.
5. INVESTMENT ADVISER FEE AND OTHER TRANSACTIONS WITH AFFILIATES
Investment Adviser Fee
The advisory agreement between the Fund and the Adviser provides for an annual fee equal to 0.75% of the Fund's average daily net assets. Subject to the terms described in the Expense Limitation note, the Adviser may voluntarily choose to waive any portion of its fee and/or reimburse certain operating expenses of the Fund. For the year ended July 31, 2016, the Adviser voluntarily waived $40,929 of its fee and voluntarily reimbursed $59,945 of transfer agent fees.
Certain of the Fund's assets are managed by Federated Investment Management Company (the “Sub-Adviser”). Under the terms of a sub-advisory agreement between the Adviser and the Sub-Adviser, the Sub-Adviser receives an allocable portion of the Fund's adviser fee. The fee is paid by the Adviser out of its resources and is not an incremental Fund expense. For the year ended July 31, 2016, the Sub-Adviser earned a fee of $136,941.
Annual Shareholder Report
Administrative Fee
Federated Administrative Services (FAS), under the Administrative Services Agreement, provides the Fund with administrative personnel and services. For purposes of determining the appropriate rate breakpoint, “Investment Complex” is defined as all of the Federated Funds subject to a fee under the Administrative Services Agreement. The fee paid to FAS is based on the average daily net assets of the Investment Complex as specified below, plus certain out-of-pocket expenses:
| Administrative Fee | Average Daily Net Assets
of the Investment Complex |
| 0.150% | on the first $5 billion |
| 0.125% | on the next $5 billion |
| 0.100% | on the next $10 billion |
| 0.075% | on assets in excess of $20 billion |
Subject to the terms described in the Expense Limitation note, FAS may voluntarily choose to waive any portion of its fee. For the year ended July 31, 2016, the annualized fee paid to FAS was 0.078% of average daily net assets of the Fund.
Distribution Services Fee
The Fund has adopted a Distribution Plan (the “Plan”) pursuant to Rule 12b-1 under the Act. Under the terms of the Plan, the Fund will compensate Federated Securities Corp. (FSC), the principal distributor, from the daily net assets of the Fund's Class A Shares, Class C Shares and Class R Shares to finance activities intended to result in the sale of these shares. The Plan provides that the Fund may incur distribution expenses at the following percentages of average daily net assets annually, to compensate FSC:
| Share Class Name | Percentage of Average Daily
Net Assets of Class |
| Class A Shares | 0.05% |
| Class C Shares | 0.75% |
| Class R Shares | 0.50% |
Subject to the terms described in the Expense Limitation note, FSC may voluntarily choose to waive any portion of its fee. For the year ended July 31, 2016, distribution services fees for the Fund were as follows:
| | Distribution
Services Fees
Incurred |
| Class C Shares | $221,391 |
| Class R Shares | 2,771 |
| TOTAL | $224,162 |
When FSC receives fees, it may pay some or all of them to financial intermediaries whose customers purchase shares. For the year ended July 31, 2016, FSC retained $42,278 of fees paid by the Fund. For the year ended July 31, 2016, the Fund's Class A Shares did not incur a distribution services fee; however, it may begin to incur this fee upon approval of the Trustees.
Annual Shareholder Report
Sales Charges
Front-end sales charges and contingent deferred sales charges (CDSC) do not represent expenses of the Fund. They are deducted from the proceeds of sales of Fund shares prior to investment or from redemption proceeds prior to remittance, as applicable. For the year ended July 31, 2016, FSC retained $14,248 in sales charges from the sale of Class A Shares. FSC also retained $2,983 of CDSC relating to redemptions of Class C Shares.
Other Service Fees
For the year ended July 31, 2016, FSSC received $11,892 of the other service fees disclosed in Note 2.
Expense Limitation
The Adviser and certain of its affiliates (which may include FSC, FAS and FSSC) on their own initiative have agreed to waive certain amounts of their respective fees and/or reimburse expenses. Effective September 1, 2016, total annual fund operating expenses (as shown in the financial highlights, excluding expenses allocated from affiliated partnerships, extraordinary expenses and proxy-related expenses paid by the Fund, if any) paid by the Fund's Class A Shares, Class C Shares, Class R6 Shares and Institutional Shares (after the voluntary waivers and/or reimbursements) will not exceed 1.30%, 2.05, 1.04% and 1.05% (the “Fee Limit”), respectively, up to but not including the later of (the “Termination Date”): (a) October 1, 2016; or (b) the date of the Fund's next effective Prospectus. While the Adviser and its applicable affiliates currently do not anticipate terminating or increasing these arrangements prior to the Termination Date, these arrangements may only be terminated or the Fee Limit increased prior to the Termination Date with the agreement of the Trustees.
General
Certain Officers and Trustees of the Fund are Officers and Directors or Trustees of certain of the above companies. To efficiently facilitate payment, Directors'/Trustees' fees and certain expenses related to conducting meetings of the Directors/Trustees and other miscellaneous expenses are paid by an affiliate of the Adviser which in due course are reimbursed by the Fund. Such expenses may be included in Accrued and Miscellaneous Expenses on the Statement of Assets and Liabilities and Statement of Operations, respectively.
Annual Shareholder Report
Transactions Involving Affiliated Holdings
Affiliated holdings are investment companies which are managed by the Adviser or an affiliate of the Adviser. The Adviser has agreed to reimburse the Fund for certain investment adviser fees as a result of transactions in other affiliated investment companies. For the year ended July 31, 2016, the Adviser reimbursed $7,667. Transactions involving the affiliated holdings during the year ended July 31, 2016, were as follows:
| | Emerging
Markets
Fixed
Income
Core
Fund | Emerging
Markets
Core
Fund | Federated
Bank
Loan
Core
Fund | Federated
Institutional
Prime
Value
Obligations
Fund,
Institutional
Shares | Federated
Mortgage
Core
Portfolio | Federated
Project
and
Trade
Finance
Core
Fund | High
Yield
Bond
Portfolio | Total of
Affiliated
Trans-
actions |
Balance
of
Shares
Held
7/31/2015 | 33,683 | — | 117,879 | 5,521,116 | 1,325,624 | 241,956 | 811,201 | 8,051,459 |
Pur-
chases/
Additions | 36,531 | 234,499 | 159,270 | 53,677,933 | 728,696 | 65,664 | 487,907 | 55,390,500 |
Sales/
Reductions | (70,214) | (67,616) | (57,058) | (54,996,614) | (543,172) | — | (472,795) | (56,207,469) |
Balance
of
Shares
Held
7/31/2016 | — | 166,883 | 220,091 | 4,202,435 | 1,511,148 | 307,620 | 826,313 | 7,234,490 |
| Value | $— | $1,707,215 | $2,203,112 | $4,202,435 | $15,217,257 | $2,867,023 | $5,147,928 | $31,344,970 |
Dividend
Income/
Allocated
Investment
Income | $75,273 | $10,610 | $75,055 | $20,539 | $374,152 | $103,572 | $320,997 | $980,198 |
Allocated
Net
Realized
Gain
(Loss) | $(70,479) | $— | $— | $— | $— | $— | $— | $(70,479) |
Annual Shareholder Report
6. Investment TRANSACTIONS
Purchases and sales of investments, excluding long-term U.S. government securities and short-term obligations, for the year ended July 31, 2016, were as follows:
| Purchases | $116,201,935 |
| Sales | $120,361,289 |
7. LINE OF CREDIT
The Fund participates with certain other Federated Funds, on a several basis, in an up to $500,000,000 unsecured, 364-day, committed, revolving line of credit (LOC) agreement. The LOC was made available to finance temporarily the repurchase or redemption of shares of the Fund, failed trades, payment of dividends, settlement of trades and for other short-term, temporary or emergency general business purposes. The Fund cannot borrow under the LOC if an inter-fund loan is outstanding. The Fund's ability to borrow under the LOC also is subject to the limitations of the Act and various conditions precedent that must be satisfied before the Fund can borrow. Loans under the LOC are charged interest at a fluctuating rate per annum equal to the highest, on any day, of (a) (i) the federal funds effective rate, (ii) the one month London Interbank Offer Rate (LIBOR), and (iii) 0.0%, plus (b) a margin. The LOC also requires the Fund to pay, quarterly in arrears and at maturity, its pro rata share of a commitment fee based on the amount of the lenders' commitment that has not been utilized. As of July 31, 2016, the Fund had no outstanding loans. During the year ended July 31, 2016, the Fund did not utilize the LOC.
8. INTERFUND LENDING
Pursuant to an Exemptive Order issued by the Securities and Exchange Commission, the Fund, along with other funds advised by subsidiaries of Federated Investors, Inc., may participate in an interfund lending program. This program provides an alternative credit facility allowing the Fund to borrow from other participating affiliated funds. As of July 31, 2016, there were no outstanding loans. During the year ended July 31, 2016, the program was not utilized.
9. Subsequent events
On August 31, 2016, Class R Shares were closed to new purchases by existing shareholders. Effective September 1, 2016, Class R Shares were re-designated as Class R6 Shares and are available to new accounts as well as new purchases by existing shareholders.
10. FEDERAL TAX INFORMATION (UNAUDITED)
For the fiscal year ended July 31, 2016, 93.16% of total distributions made by the Fund are qualifying dividends which may be subject to a maximum tax rate of 15%, as provided for by the Jobs and Growth Tax Relief Act of 2003. Complete information is reported in conjunction with the reporting of your distributions on Form 1099-DIV.
Of the ordinary income distributions made by the Fund during the year ended July 31, 2016, 79.03% qualify for the dividend received deduction available to corporate shareholders.
Annual Shareholder Report
Report of Independent Registered Public Accounting Firm
TO THE BOARD OF trustees OF Federated MDt series AND SHAREHOLDERS OF federated mdt Balanced fund:
We have audited the accompanying statement of assets and liabilities of Federated MDT Balanced Fund (the “Fund”) (one of the portfolios constituting Federated MDT Series), including the portfolio of investments, as of July 31, 2016, and the related statement of operations for the year then ended, the statement of changes in net assets for each of the two years in the period then ended, and the financial highlights for each of the five years in the period then ended. These financial statements and financial highlights are the responsibility of the Fund's management. Our responsibility is to express an opinion on these financial statements and financial highlights based on our audits.
We conducted our audits in accordance with standards of the Public Company Accounting Oversight Board (United States). Those standards require that we plan and perform the audit to obtain reasonable assurance about whether the financial statements and financial highlights are free of material misstatement. We were not engaged to perform an audit of the Fund's internal control over financial reporting. Our audits included consideration of internal control over financial reporting as a basis for designing audit procedures that are appropriate in the circumstances, but not for the purpose of expressing an opinion on the effectiveness of the Fund's internal control over financial reporting. Accordingly, we express no such opinion. An audit also includes examining, on a test basis, evidence supporting the amounts and disclosures in the financial statements and financial highlights, assessing the accounting principles used and significant estimates made by management, and evaluating the overall financial statement presentation. Our procedures included confirmation of securities owned as of July 31, 2016, by correspondence with the custodian and others or by other appropriate auditing procedures where replies from others were not received. We believe that our audits provide a reasonable basis for our opinion.
In our opinion, the financial statements and financial highlights referred to above present fairly, in all material respects, the financial position of Federated MDT Balanced Fund, a portfolio of Federated MDT Series, at July 31, 2016, the results of its operations for the year then ended, the changes in its net assets for each of the two years in the period then ended, and the financial highlights for each of the five years in the period then ended, in conformity with U.S. generally accepted accounting principles.
Boston, Massachusetts
September 22, 2016
Annual Shareholder Report
Shareholder Expense Example (unaudited)
As a shareholder of the Fund, you incur two types of costs: (1) transaction costs, including sales charges (loads) on purchase or redemption payments; and (2) ongoing costs, including management fees and to the extent applicable, distribution (12b-1) fees and/or other service fees and other Fund expenses. This Example is intended to help you to understand your ongoing costs (in dollars) of investing in the Fund and to compare these costs with the ongoing costs of investing in other mutual funds. It is based on an investment of $1,000 invested at the beginning of the period and held for the entire period from February 1, 2016 to July 31, 2016.
ACTUAL EXPENSES
The first section of the table below provides information about actual account values and actual expenses. You may use the information in this section, together with the amount you invested, to estimate the expenses that you incurred over the period. Simply divide your account value by $1,000 (for example, an $8,600 account value divided by $1,000 = 8.6), then multiply the result by the number in the first section under the heading entitled “Expenses Paid During Period” to estimate the expenses attributable to your investment during this period.
HYPOTHETICAL EXAMPLE FOR COMPARISON PURPOSES
The second section of the table below provides information about hypothetical account values and hypothetical expenses based on the Fund's actual expense ratio and an assumed rate of return of 5% per year before expenses, which is not the Fund's actual return. Thus, you should not use the hypothetical account values and expenses to estimate the actual ending account balance or your expenses for the period. Rather, these figures are required to be provided to enable you to compare the ongoing costs of investing in the Fund with other funds. To do so, compare this 5% hypothetical example with the 5% hypothetical examples that appear in the shareholder reports of the other funds.
Annual Shareholder Report
Please note that the expenses shown in the table are meant to highlight your ongoing costs only and do not reflect any transaction costs, such as sales charges (loads) on purchase or redemption payments. Therefore, the second section of the table is useful in comparing ongoing costs only, and will not help you determine the relative total costs of owning different funds. In addition, if these transaction costs were included, your costs would have been higher.
| | Beginning
Account Value
2/1/2016 | Ending
Account Value
7/31/2016 | Expenses Paid
During Period1 |
| Actual: | | | |
| Class A Shares | $1,000 | $1,091.10 | $6.76 |
| Class C Shares | $1,000 | $1,087.40 | $10.64 |
| Class R Shares | $1,000 | $1,089.90 | $8.11 |
| Institutional Shares | $1,000 | $1,093.00 | $5.46 |
Hypothetical (assuming a 5% return
before expenses): | | | |
| Class A Shares | $1,000 | $1,018.40 | $6.52 |
| Class C Shares | $1,000 | $1,014.67 | $10.27 |
| Class R Shares | $1,000 | $1,017.11 | $7.82 |
| Institutional Shares | $1,000 | $1,019.64 | $5.27 |
| 1 | Expenses are equal to the Fund's annualized net expense ratios, multiplied by the average account value over the period, multiplied by 182/366 (to reflect the one-half-year period). The annualized net expense ratios are as follows: |
| | |
| Class A Shares | 1.30% |
| Class C Shares | 2.05% |
| Class R Shares | 1.56% |
| Institutional Shares | 1.05% |
Annual Shareholder Report
Board of Trustees and Trust Officers
The Board of Trustees is responsible for managing the Trust's business affairs and for exercising all the Trust's powers except those reserved for the shareholders. The following tables give information about each Trustee and the senior officers of the Fund. Where required, the tables separately list Trustees who are “interested persons” of the Fund (i.e., “Interested” Trustees) and those who are not (i.e., “Independent” Trustees). Unless otherwise noted, the address of each person listed is Federated Investors Tower, 1001 Liberty Avenue, Pittsburgh, PA 15222. The address of all Independent Trustees listed is 4000 Ericsson Drive, Warrendale, PA 15086-7561; Attention: Mutual Fund Board. As of December 31, 2015, the Trust comprised five portfolio(s), and the Federated Fund Family consisted of 38 investment companies (comprising 122 portfolios). Unless otherwise noted, each Officer is elected annually. Unless otherwise noted, each Trustee oversees all portfolios in the Federated Fund Family and serves for an indefinite term. The Fund's Statement of Additional Information includes additional information about Trust Trustees and is available, without charge and upon request, by calling 1-800-341-7400.
Interested TRUSTEES Background
Name
Birth Date
Positions Held with Trust
Date Service Began | Principal Occupation(s) for Past Five Years,
Other Directorships Held and Previous Position(s) |
J. Christopher Donahue*
Birth Date: April 11, 1949
President and Trustee
Indefinite Term
Began serving: May 2006 | Principal Occupations: Principal Executive Officer and President of certain of the Funds in the Federated Fund Family; Director or Trustee of the Funds in the Federated Fund Family; President, Chief Executive Officer and Director, Federated Investors, Inc.; Chairman and Trustee, Federated Investment Management Company; Trustee, Federated Investment Counseling; Chairman and Director, Federated Global Investment Management Corp.; Chairman, Federated Equity Management Company of Pennsylvania and Passport Research, Ltd. (investment advisory subsidiary of Federated); Trustee, Federated Shareholder Services Company; Director, Federated Services Company.
Previous Positions: President, Federated Investment Counseling; President and Chief Executive Officer, Federated Investment Management Company, Federated Global Investment Management Corp. and Passport Research, Ltd. |
Annual Shareholder Report
Name
Birth Date
Positions Held with Trust
Date Service Began | Principal Occupation(s) for Past Five Years,
Other Directorships Held and Previous Position(s) |
John B. Fisher*
Birth Date: May 16, 1956
Trustee
Indefinite Term
Began serving: May 2016 | Principal Occupations: Principal Executive Officer and President of certain of the Funds in the Federated Fund Family; Director or Trustee of certain of the Funds in the Federated Fund Family; Vice President, Federated Investors, Inc.; President, Director/Trustee and CEO, Federated Advisory Services Company, Federated Equity Management Company of Pennsylvania, Federated Global Investment Management Corp., Federated Investment Counseling, Federated Investment Management Company; President and CEO of Passport Research, Ltd.; President of some of the Funds in the Federated Fund Complex and Director, Federated Investors Trust Company.
Previous Positions: President and Director of the Institutional Sales Division of Federated Securities Corp.; President and Director of Federated Investment Counseling; Director, Edgewood Securities Corp.; Director, Federated Services Company; Director, Federated Investors, Inc.; Chairman and Director, Southpointe Distribution Services, Inc. and President, Technology, Federated Services Company. |
| * | Reasons for “interested” status: J. Christopher Donahue and John B. Fisher are interested due to their beneficial ownership of shares of Federated Investors, Inc. and due to positions they hold with Federated and its subsidiaries. J. Christopher Donahue is the son of John F. Donahue, Chairman Emeritus of the Federated Funds. |
INDEPENDENT TRUSTEES Background
Name
Birth Date
Positions Held with Trust
Date Service Began | Principal Occupation(s) for Past Five Years,
Other Directorships Held, Previous Position(s) and Qualifications |
John T. Collins
Birth Date: January 24, 1947
Trustee
Indefinite Term
Began serving: October 2013 | Principal Occupations: Director or Trustee of the Federated Fund Family; Retired.
Other Directorships Held: Director, Chair of the Compensation Committee, Audit Committee member, KLX Corp.
Qualifications: Mr. Collins has served in several business and financial management roles and directorship positions throughout his career. Mr. Collins previously served as Chairman and CEO, The Collins Group, Inc. (a private equity firm). Mr. Collins serves as Chairman Emeriti, Bentley University. Mr. Collins previously served as Director, FleetBoston Financial Corp.; Director and Audit Committee Member, Bank of America Corp. and Director, Beth Israel Deaconess Medical Center (Harvard University Affiliate Hospital). |
Annual Shareholder Report
Name
Birth Date
Positions Held with Trust
Date Service Began | Principal Occupation(s) for Past Five Years,
Other Directorships Held, Previous Position(s) and Qualifications |
G. Thomas Hough
Birth Date: February 28, 1955
Trustee
Indefinite Term
Began serving: August 2015 | Principal Occupations: Director or Trustee of the Federated Fund Family; Retired.
Other Directorships Held: Director, Chair of the Audit Committee, Governance Committee, Publix Super Markets, Inc.
Qualifications: Mr. Hough has served in accounting, business management and directorship positions throughout his career. Mr. Hough most recently held the position of Americas Vice Chair of Assurance with Ernst & Young LLP. Mr. Hough is an Executive Committee member of the United States Golf Association, he serves on the President's Cabinet and Business School Board of Visitors for the University of Alabama and is on the Business School Board of Visitors for Wake Forest University. |
Maureen Lally-Green
Birth Date: July 5, 1949
Trustee
Indefinite Term
Began serving: August 2009 | Principal Occupations: Director or Trustee of the Federated Fund Family; Interim Dean of the Duquesne University School of Law; Adjunct Professor of Law, Duquesne University School of Law.
Other Directorships Held: Director, CONSOL Energy Inc.
Qualifications: Judge Lally-Green has served in various legal and business roles and directorship positions throughout her career. Judge Lally-Green previously served as: Associate General Secretary, Diocese of Pittsburgh; a member of the Superior Court of Pennsylvania; and as a Professor of Law, Duquesne University School of Law. Judge Lally-Green also holds the positions on either a public or not for profit Board of Directors as follows: Member, Pennsylvania State Board of Education (public); Director and Chair, UPMC Mercy Hospital; Regent, St. Vincent Seminary; Director and Vice Chair, Our Campaign for the Church Alive!, Inc.; Director, Saint Vincent College; and Director and Chair, Cardinal Wuerl North Catholic High School, Inc. Judge Lally-Green has held the positions of: Director, Auberle; Director, Ireland Institute of Pittsburgh; Director, Saint Thomas More Society; and Director, Catholic High Schools of the Diocese of Pittsburgh, Inc. |
Peter E. Madden
Birth Date: March 16, 1942
Trustee
Indefinite Term
Began serving: June 2006 | Principal Occupation: Director or Trustee, and Chair of the Board of Directors or Trustees, of the Federated Fund Family; Retired.
Other Directorships Held: None.
Qualifications: Mr. Madden has served in several business management, mutual fund services and directorship positions throughout his career. Mr. Madden previously served as President, Chief Operating Officer and Director, State Street Bank and Trust Company (custodian bank) and State Street Corporation (financial services). He was Director, VISA USA and VISA International and Chairman and Director, Massachusetts Bankers Association. Mr. Madden served as Director, Depository Trust Corporation and Director, The Boston Stock Exchange. Mr. Madden also served as a Representative to the Commonwealth of Massachusetts General Court. |
Annual Shareholder Report
Name
Birth Date
Positions Held with Trust
Date Service Began | Principal Occupation(s) for Past Five Years,
Other Directorships Held, Previous Position(s) and Qualifications |
Charles F. Mansfield, Jr.
Birth Date: April 10, 1945
Trustee
Indefinite Term
Began serving: June 2006 | Principal Occupations: Director or Trustee of the Federated Fund Family; Management Consultant.
Other Directorships Held: None.
Qualifications: Mr. Mansfield has served in several banking, business management and educational roles and directorship positions throughout his career. Mr. Mansfield previously served as Chief Executive Officer, PBTC International Bank; Partner, Arthur Young & Company (now Ernst & Young LLP); Chief Financial Officer of Retail Banking Sector, Chase Manhattan Bank; Senior Vice President, HSBC Bank USA (formerly, Marine Midland Bank); Vice President, Citibank; Assistant Professor of Banking and Finance, Frank G. Zarb School of Business, Hofstra University; Executive Vice President DVC Group, Inc. (marketing, communications and technology). |
Thomas M. O'Neill
Birth Date: June 14, 1951
Trustee
Indefinite Term
Began serving: October 2006 | Principal Occupations: Director or Trustee, Chair of the Audit Committee of the Federated Fund Family; Sole Proprietor, Navigator Management Company (investment and strategic consulting).
Other Directorships Held: None.
Qualifications: Mr. O'Neill has served in several business, mutual fund and financial management roles and directorship positions throughout his career. Mr. O'Neill serves as Director, Medicines for Humanity and Director, The Golisano Children's Museum of Naples, Florida. Mr. O'Neill previously served as Chief Executive Officer and President, Managing Director and Chief Investment Officer, Fleet Investment Advisors; President and Chief Executive Officer, Aeltus Investment Management, Inc.; General Partner, Hellman, Jordan Management Co., Boston, MA; Chief Investment Officer, The Putnam Companies, Boston, MA; Credit Analyst and Lending Officer, Fleet Bank; Director and Consultant, EZE Castle Software (investment order management software); and Director, Midway Pacific (lumber). |
P. Jerome Richey
Birth Date: February 23, 1949
Trustee
Indefinite Term
Began serving: October 2013 | Principal Occupations: Director or Trustee of the Federated Fund Family; Management Consultant.
Other Directorships Held: None.
Qualifications: Mr. Richey has served in several business and legal management roles and directorship positions throughout his career. Mr. Richey most recently held the positions of Senior Vice Chancellor and Chief Legal Officer, University of Pittsburgh. Mr. Richey serves as Board Member, Epilepsy Foundation of Western Pennsylvania and Board member, World Affairs Council of Pittsburgh. Mr. Richey previously served as Chief Legal Officer and Executive Vice President, CONSOL Energy Inc. and Shareholder, Buchanan Ingersoll & Rooney PC (a law firm). |
Annual Shareholder Report
Name
Birth Date
Positions Held with Trust
Date Service Began | Principal Occupation(s) for Past Five Years,
Other Directorships Held, Previous Position(s) and Qualifications |
John S. Walsh
Birth Date: November 28, 1957
Trustee
Indefinite Term
Began serving: June 2006 | Principal Occupations: Director or Trustee of the Federated Fund Family; President and Director, Heat Wagon, Inc. (manufacturer of construction temporary heaters); President and Director, Manufacturers Products, Inc. (distributor of portable construction heaters); President, Portable Heater Parts, a division of Manufacturers Products, Inc.
Other Directorships Held: None.
Qualifications: Mr. Walsh has served in several business management roles and directorship positions throughout his career. Mr. Walsh previously served as Vice President, Walsh & Kelly, Inc. (paving contractors). |
OFFICERS
Name
Birth Date
Address
Positions Held with Trust
Date Service Began | Principal Occupation(s) for Past Five Years
and Previous Position(s) |
John W. McGonigle
Birth Date: October 26, 1938
Secretary
Officer since: May 2006 | Principal Occupations: Executive Vice President and Secretary of the Federated Fund Family; Vice Chairman, Executive Vice President, Secretary and Director, Federated Investors, Inc.
Previous Positions: Trustee, Federated Investment Management Company and Federated Investment Counseling; Director, Federated Global Investment Management Corp., Federated Services Company and Federated Securities Corp. |
Lori A. Hensler
Birth Date: January 6, 1967
TREASURER
Officer since: April 2013 | Principal Occupations: Principal Financial Officer and Treasurer of the Federated Fund Family; Senior Vice President, Federated Administrative Services; Financial and Operations Principal for Federated Securities Corp. and Edgewood Services, Inc.; and Assistant Treasurer, Federated Investors Trust Company. Ms. Hensler has received the Certified Public Accountant designation.
Previous Positions: Controller of Federated Investors, Inc.; Senior Vice President and Assistant Treasurer, Federated Investors Management Company; Treasurer, Federated Investors Trust Company; Assistant Treasurer, Federated Administrative Services, Federated Administrative Services, Inc., Federated Securities Corp., Edgewood Services, Inc., Federated Advisory Services Company, Federated Equity Management Company of Pennsylvania, Federated Global Investment Management Corp., Federated Investment Counseling, Federated Investment Management Company, Passport Research, Ltd., and Federated MDTA, LLC; Financial and Operations Principal for Federated Securities Corp., Edgewood Services, Inc. and Southpointe Distribution Services, Inc. |
Annual Shareholder Report
Name
Birth Date
Address
Positions Held with Trust
Date Service Began | Principal Occupation(s) for Past Five Years
and Previous Position(s) |
Peter J. Germain
Birth Date: September 3, 1959
CHIEF LEGAL OFFICER
Officer since: June 2006 | Principal Occupations: Mr. Germain is Chief Legal Officer of the Federated Fund Family. He is General Counsel and Vice President, Federated Investors, Inc.; President, Federated Administrative Services and Federated Administrative Services, Inc.; Vice President, Federated Securities Corp.; Secretary, Federated Private Asset Management, Inc.; and Secretary, Retirement Plan Service Company of America. Mr. Germain joined Federated in 1984 and is a member of the Pennsylvania Bar Association.
Previous Positions: Deputy General Counsel, Special Counsel, Managing Director of Mutual Fund Services, Federated Investors, Inc.; Senior Vice President, Federated Services Company; and Senior Corporate Counsel, Federated Investors, Inc. |
Stephen Van Meter
Birth Date: June 5, 1975
CHIEF COMPLIANCE OFFICER AND SENIOR VICE PRESIDENT
Officer since: July 2015 | Principal Occupations: Senior Vice President and Chief Compliance Officer of the Federated Fund Family; Vice President and Chief Compliance Officer of Federated Investors, Inc. and Chief Compliance Officer of certain of its subsidiaries. Mr. Van Meter joined Federated in October 2011. He holds FINRA licenses under Series 3, 7, 24 and 66.
Previous Positions: Mr. Van Meter previously held the position of Compliance Operating Officer, Federated Investors, Inc. Prior to joining Federated, Mr. Van Meter served at the United States Securities and Exchange Commission in the positions of Senior Counsel, Office of Chief Counsel, Division of Investment Management and Senior Counsel, Division of Enforcement. |
Stephen F. Auth
Birth Date: September 13, 1956
101 Park Avenue
41st Floor
New York, NY 10178
CHIEF INVESTMENT OFFICER
Officer since: June 2012 | Principal Occupations: Stephen F. Auth is Chief Investment Officer of various Funds in the Federated Fund Family; Executive Vice President, Federated Investment Counseling, Federated Global Investment Management Corp. and Federated Equity Management Company of Pennsylvania.
Previous Positions: Executive Vice President, Federated Investment Management Company and Passport Research, Ltd. (investment advisory subsidiary of Federated); Senior Vice President, Global Portfolio Management Services Division; Senior Vice President, Federated Investment Management Company and Passport Research, Ltd.; Senior Managing Director and Portfolio Manager, Prudential Investments. |
Annual Shareholder Report
Evaluation and Approval of Advisory Contract–May 2016
Federated MDT Balanced Fund (the “Fund”)
Following a review and recommendation of approval by the Fund's independent trustees, the Fund's Board of Trustees (the “Board”) reviewed and unanimously approved at its May 2016 meetings the continuation of the Fund's investment advisory and subadvisory contracts for an additional one-year term. The Board's decision regarding these contracts reflects the exercise of its business judgment after consideration of all of the information received on whether to continue the existing arrangements.
The Board had previously appointed a Senior Officer, whose duties include specified responsibilities relating to the process by which advisory fees are to be charged to a Federated fund. The Senior Officer has the authority to retain consultants, experts, or staff as may be reasonably necessary to assist in the performance of his duties, reports directly to the Board, and may be terminated only with the approval of a majority of the independent members of the Board. The Senior Officer prepared and furnished to the Board an independent, written evaluation that covered topics discussed below (the “Senior Officer Evaluation”). The Board considered the Senior Officer Evaluation, along with other information, in deciding to approve the investment advisory and subadvisory contracts.
The Board is also familiar with and considered judicial decisions concerning allegedly excessive investment advisory fees, which have indicated that the following factors may be relevant to an adviser's fiduciary duty with respect to its receipt of compensation from a fund: the nature and quality of the services provided by an adviser to a fund and its shareholders, including the performance and fees and expenses of the fund and of comparable funds; an adviser's cost of providing the services, including the profitability to an adviser of providing advisory services to a fund; the extent to which an adviser may realize “economies of scale” as a fund grows larger and, if such economies of scale exist, whether they have been shared with a fund and its shareholders or the family of funds; any “fall-out financial benefits” that accrue to an adviser because of its relationship with a fund (including research services received from brokers that execute fund trades and any fees paid to affiliates of an adviser for services rendered to a fund); comparative fee and expense structures, including a comparison of fees paid to an adviser with those paid by similar funds; and the extent of care, conscientiousness and independence with which board members perform their duties and their expertise, including whether they are fully informed about all facts the board deems relevant to its consideration of an adviser's services and fees. The Board noted that Securities and Exchange Commission (“SEC”) disclosure requirements regarding the basis for the Board's approval of the Fund's investment advisory contract generally track the factors listed above. Consistent with these judicial decisions and SEC disclosure
Annual Shareholder Report
requirements, the Board also considered management fees charged to institutional and other clients of Federated MDTA LLC (the “Adviser”) and subadviser for what might be viewed as like services. The Board was aware of these factors and was guided by them in its review of the Fund's investment advisory and subadvisory contracts to the extent it considered them to be appropriate and relevant, as discussed further below.
The Board considered and weighed these circumstances in light of its substantial accumulated experience in governing the Fund and working with Federated Investors, Inc. and its affiliates (“Federated”) on matters relating to the Federated funds, and was assisted in its deliberations by independent legal counsel. Throughout the year, and in connection with its May meetings, the Board requested and received substantial and detailed information about the Fund and the Federated organization that was in addition to the extensive materials that comprise and accompany the Senior Officer's Evaluation. Federated provided much of this information at each regular meeting of the Board, and furnished additional substantial information in connection with the May meetings at which the Board's formal review of the investment advisory and subadvisory contracts occurred. At the May meetings, in addition to meeting in separates sessions of the independent trustees without management present, senior management of the Adviser also met with the independent trustees and their counsel to discuss the materials presented and any other matters thought relevant by the Adviser or the trustees. Between regularly scheduled meetings, the Board also received information on particular matters as the need arose. Thus, the Board's consideration of the investment advisory and subadvisory contracts included review of the Senior Officer's Evaluation, accompanying data and additional information covering such matters as: the Adviser's and subadviser's investment philosophy, revenue, profitability, personnel and processes; investment and operating strategies; the Fund's short- and long-term performance (in absolute terms, both on a gross basis and net of expenses, as well as in relationship to its particular investment program and certain competitor or “peer group” funds and/or other benchmarks, as appropriate), and comments on the reasons for performance; the Fund's investment objectives; the Fund's expenses (including the advisory fee itself and the overall expense structure of the Fund, both in absolute terms and relative to similar and/or competing funds, with due regard for contractual or voluntary expense limitations); the use and allocation of brokerage commissions derived from trading the Fund's portfolio securities (if any); and the nature, quality and extent of the advisory and other services provided to the Fund by the Adviser and its affiliates. The Board also considered the preferences and expectations of Fund shareholders; the entrepreneurial risk assumed by the Adviser in sponsoring the Fund; the continuing state of competition in the mutual fund industry and market practices; the range of comparable fees for similar funds in the mutual fund industry; the Fund's relationship to the Federated funds which include a comprehensive array of funds with different investment objectives, policies and
Annual Shareholder Report
strategies which are generally available for exchange without the incurrence of additional sales charges; compliance and audit reports concerning the Federated funds and the Federated companies that service them (including communications from regulatory agencies), as well as Federated's responses to any issues raised therein; and relevant developments in the mutual fund industry and how the Federated funds and/or Federated are responding to them. The Board's evaluation process is evolutionary. The criteria considered and the emphasis placed on relevant criteria change in recognition of changing circumstances in the mutual fund marketplace.
While mindful that courts have cautioned against giving such comparisons too much weight, the Board has found the use of comparisons of the Fund's fees and expenses to other mutual funds with comparable investment programs to be relevant to its deliberations. In this regard, the Board was presented with, and considered, information regarding the contractual advisory fee rates, net advisory fee rates, total expense ratios and each element of the Fund's total expense ratio (i.e., gross and net advisory fees, custody fees, portfolio accounting fees and transfer agency fees) relative to the Fund's peers. The Board focused on comparisons with other similar mutual funds more heavily than non-mutual fund products or services because it is believed that they are more relevant. For example, other mutual funds are the products most like the Fund, they are readily available to Fund shareholders as alternative investment vehicles, and they are the type of investment vehicle in fact chosen and maintained by the Fund's investors. The range of their fees and expenses therefore appears to be a relevant indicator of what consumers have found to be reasonable in the precise marketplace in which the Fund competes.
The Board reviewed the contractual advisory fee rate, net advisory fee rate where partially waived and other expenses of the Fund and noted the position of the Fund's fee rates relative to its peers. In this regard, the Board noted that the contractual advisory fee rate was above the median of the relevant peer group, but the Board noted the applicable waivers and reimbursements and that the overall expense structure of the Fund remained competitive in the context of other factors considered by the Board. In this regard, the Board had been previously advised that, while comparisons to fund peer groups are relevant in judging the reasonableness of advisory fees, the Fund's quantitative focus makes fee and expense comparisons particularly difficult. Although the Fund's advisory fee was above the median of the peer range, the peer group of funds varied widely in their complexity, and the Board had been informed that the management of the Fund is among the more complex relative to its peers.
By contrast, the Senior Officer has reviewed Federated's fees for providing advisory services to products outside the Federated funds (e.g., institutional and separate accounts and sub-adviser services). . He concluded that mutual funds and institutional accounts are inherently different products. Those differences include, but are not limited to, different types of targeted investors; being subject to different laws and regulations; different legal structures; different average
Annual Shareholder Report
account sizes and portfolio management techniques made necessary by different cash flows and different associated costs; and the time spent by portfolio managers and their teams, funds financial services, legal, compliance and risk management in reviewing securities pricing, addressing different administrative responsibilities, addressing different degrees of risk associated with management and a variety of different costs. The Senior Officer did not consider the fees for providing advisory services to these outside products to be determinative in judging the appropriateness of mutual fund advisory fees.
Following such evaluation, the Board concluded, within the context of its full deliberations, that the expenses of the Fund are reasonable and supported renewal of the investment advisory and subadvisory contracts with respect to the Fund.
The Board considered the nature, extent and quality of the services provided to the Fund by the Adviser and the resources of the Adviser and its affiliates dedicated to the Fund. In this regard, the Board evaluated, among other things, the Adviser's personnel, experience, track record, overall reputation and willingness to invest in personnel and infrastructure that benefit the Fund. In addition, the Board reviewed the qualifications, backgrounds and responsibilities of the portfolio management team primarily responsible for the day-to-day management of the Fund. The Board noted the compliance programs of and the compliance-related resources provided to the Fund by the Adviser. The Fund's ability to deliver competitive performance when compared to its peer group was also deemed to be relevant by the Board as a useful indicator of how the Adviser is executing the Fund's investment program, which in turn was one of the Board's considerations in reaching a conclusion that the nature, extent, and quality of the Adviser's investment management services were such as to warrant continuation of the investment advisory and subadvisory contracts.
In evaluating the Fund's investment performance, the Board considered performance results in light of the Fund's investment objective, strategies and risks, as disclosed in the Fund's prospectus. The Board particularly considered detailed investment reports on the Fund's performance provided to the Board throughout the year and in connection with the May meetings. The Senior Officer also reviewed information compiled by Federated, using data supplied by independent fund ranking organizations, regarding the performance of, and fees charged by, other mutual funds, noting his view that comparisons to fund peer groups may be helpful, though not conclusive, in judging the reasonableness of the proposed fees. The Board considered, in evaluating such comparisons, that in some cases individual funds may exhibit significant and unique differences in their objectives and management techniques when compared to other funds within an industry peer group, and that the Senior Officer had specifically noted that the Fund's quantitative focus makes fee and expense comparisons particularly difficult as the peer group of funds varied widely in their complexity, and the management of the Fund is among the more complex relative to its peers.
Annual Shareholder Report
For the periods covered by the Senior Officer's Evaluation, the Fund's performance for both the three-year and five-year periods was above the median of the relevant peer group, and the Fund's performance fell below the median of the relevant peer group for the one-year period. The Board discussed the Fund's performance with the Adviser and recognized the efforts being taken by the Adviser in the context of the other factors considered relevant by the Board.
Following such evaluation, the Board concluded, within the context of its full deliberations, that the performance of the Fund supported renewal of the investment advisory and subadvisory contracts with respect to the Fund.
The Board also received financial information about Federated, including information regarding the compensation and ancillary (or “fall out”) benefits Federated derived from its relationships with the Federated funds. This information covered not only the fees under the investment advisory contracts, but also fees received by Federated's subsidiaries for providing other services to the Federated funds under separate contracts (e.g., for serving as the Federated funds' administrator). The information also detailed any indirect benefit Federated may derive from its receipt of research services from brokers who execute Federated fund trades. In addition, the Board considered the fact that, in order for a fund to be competitive in the marketplace, Federated and its affiliates frequently waived fees and/or reimbursed expenses and have disclosed to fund investors and/or indicated to the Board their intention to do so in the future, where appropriate. Moreover, the Board receives regular reporting as to the institution, adjustment or elimination of these voluntary waivers. The Board considered Federated's previous reduction in contractual management fees to certain funds in response to the Senior Officer's recommendations.
Federated furnished information, requested by the Senior Officer, that reported revenues on a fund-by-fund basis and made estimates of the allocation of expenses on a fund-by-fund basis, using allocation methodologies specified by the Senior Officer. The Senior Officer noted that, while these cost allocation reports apply consistent allocation processes, the inherent difficulties in allocating costs continues to cause the Senior Officer to question the precision of the process and to conclude that such reports may be unreliable, since a single change in an allocation estimate may dramatically alter the resulting estimate of cost and/or profitability of a fund and may produce unintended consequences. The allocation information, including the Senior Officer's view that fund-by-fund estimations may be unreliable, was considered in the analysis by the Board.
The Board and the Senior Officer also reviewed information compiled by Federated comparing profitability information for Federated to other publicly held fund management companies. In this regard, the Senior Officer concluded that Federated's profit margins did not appear to be excessive. The Senior Officer also noted that Federated appeared financially sound, with the resources to fulfill its obligations under its contracts with the Fund.
Annual Shareholder Report
The Senior Officer's Evaluation also discussed the notion of possible realization of “economies of scale” as a fund grows larger. The Board considered in this regard that the Adviser has made significant and long-term investments in areas that support all of the Federated funds, such as personnel and processes for the portfolio management, shareholder services, compliance, internal audit, and risk management functions, as well as, systems technology (including technology relating to cybersecurity), and that the benefits of these efforts (as well as any economies of scale, should they exist) were likely to be enjoyed by the fund family as a whole. The Board noted that the Adviser's investments in these areas are extensive. In addition, the Board considered that Federated and its affiliates have frequently waived fees and/or reimbursed expenses and that this has allowed fund shareholders to share potential economies of scale from a fund's inception. Federated, as it does throughout the year, and again in connection with the Board's review, furnished information relative to revenue sharing or adviser paid fees. Federated and the Senior Officer noted that this information should be viewed to determine if there was an incentive to either not apply breakpoints or to apply breakpoints at higher levels and should not be viewed to determining the appropriateness of advisory fees, because it would represent marketing and distribution expenses. Finally, the Board also noted the absence of any applicable regulatory or industry guidelines on this subject, which (as discussed in the Senior Officer's Evaluation) is compounded by the lack of any common industry practice or general pattern with respect to structuring fund advisory fees with “breakpoints” that serve to reduce the fee as a fund attains a certain size.
The Senior Officer noted that, subject to the comments and recommendations made within the Senior Officer's Evaluation, his observations and the information accompanying the Senior Officer's Evaluation supported a finding by the Board that the management fee for the Funds was reasonable. Under these circumstances, no changes were recommended to, and no objection was raised to, the continuation of the Fund's investment advisory and subadvisory contracts.
In its decision to continue an existing investment advisory contract, the Board was mindful of the potential disruptions of the Fund's operations and various risks, uncertainties and other effects that could occur as a result of a decision to terminate or not renew an investment advisory contract. In particular, the Board recognized that many shareholders have invested in the Fund on the strength of the Adviser's industry standing and reputation and with the expectation that the Adviser will have a continuing role in providing advisory services to the Fund. Thus, the Board's approval of the investment advisory contract reflected the fact that it is the shareholders who have effectively selected the Adviser by virtue of having invested in the Fund. The Board concluded that, in light of the factors discussed above, including the nature, quality and scope of the services provided to the Fund by the Adviser and its affiliates, continuation of the investment advisory contract was appropriate.
Annual Shareholder Report
The Board based its decision to approve the investment advisory and subadvisory contracts on the totality of the circumstances and relevant factors and with a view to past and future long-term considerations. Not all of the factors and considerations identified above were necessarily relevant to the Fund, nor did the Board consider any one of them to be determinative. With respect to the factors that were relevant, the Board's decision to approve the continuation of the contracts reflects its determination that Federated's performance and actions provided a satisfactory basis to support the decision to continue the existing arrangements.
Annual Shareholder Report
Voting Proxies on Fund Portfolio Securities
A description of the policies and procedures that the Fund uses to determine how to vote proxies, if any, relating to securities held in the Fund's portfolio is available, without charge and upon request, by calling 1-800-341-7400. A report on “Form N-PX” of how the Fund voted any such proxies during the most recent 12-month period ended June 30 is available via the Proxy Voting Record (Form N-PX) link associated with the Fund and share class name at www.FederatedInvestors.com/FundInformation. Form N-PX filings are also available at the SEC's website at www.sec.gov.
Quarterly Portfolio Schedule
The Fund files with the SEC a complete schedule of its portfolio holdings, as of the close of the first and third quarters of its fiscal year, on “Form N-Q.” These filings are available on the SEC's website at www.sec.gov and may be reviewed and copied at the SEC's Public Reference Room in Washington, DC. (Call 1-800-SEC-0330 for information on the operation of the Public Reference Room.) You may also access this information via the link to the Fund and share class name at www.FederatedInvestors.com/FundInformation.
Annual Shareholder Report
Mutual funds are not bank deposits or obligations, are not guaranteed by any bank and are not insured or guaranteed by the U.S. government, the Federal Deposit Insurance Corporation, the Federal Reserve Board or any other government agency. Investment in mutual funds involves investment risk, including the possible loss of principal.
This Report is authorized for distribution to prospective investors only when preceded or accompanied by the Fund's Prospectus, which contains facts concerning its objective and policies, management fees, expenses and other information.
Federated MDT Balanced Fund
Federated Investors Funds
4000 Ericsson Drive
Warrendale, PA 15086-7561
Contact us at FederatedInvestors.com
or call 1-800-341-7400.
Federated Securities Corp., Distributor
CUSIP 31421R841
CUSIP 31421R833
CUSIP 31421R825
CUSIP 31421R692
37326 (9/16)
Federated is a registered trademark of Federated Investors, Inc.
2016 ©Federated Investors, Inc.
Annual Shareholder Report
July 31, 2016
| Share Class | Ticker |
| A | QALGX |
| B | QBLGX |
| C | QCLGX |
| Institutional | QILGX |
Federated MDT Large Cap Growth Fund
Fund Established 2005
A Portfolio of Federated MDT Series
Dear Valued Shareholder,
I am pleased to present the Annual Shareholder Report for your fund covering the period from August 1, 2015 through July 31, 2016. This report includes Management's Discussion of Fund Performance, a complete listing of your fund's holdings, performance information and financial statements along with other important fund information.
In addition, our website, FederatedInvestors.com, offers easy access to Federated resources that include timely fund updates, economic and market insights from our investment strategists, and financial planning tools. We invite you to register to take full advantage of its capabilities.
Thank you for investing with Federated. I hope you find this information useful and look forward to keeping you informed.
Sincerely,
J. Christopher Donahue, President
Not FDIC Insured • May Lose Value • No Bank Guarantee
CONTENTS
| 1 |
| 6 |
| 8 |
| 14 |
| 18 |
| 20 |
| 21 |
| 22 |
| 32 |
| 33 |
| 35 |
| 41 |
| 48 |
| 48 |
Management's Discussion of Fund Performance (unaudited)
The total return of Federated MDT Large Cap Growth Fund (the “Fund”), based on net asset value for the 12-month reporting period ended July 31, 2016, was -3.62% for Class A Shares, -4.41% for Class B Shares, -4.39% for Class C Shares and -3.40% for the Institutional Shares. The total return for the Russell 1000® Growth Index (R1000G),1 the Fund's broad-based securities market index, was 4.35% for the same period. The total return of the Morningstar Large Growth Funds Average (MLGFA),2 a peer group average for the Fund, was -0.40% during the same period. The Fund's and MLGFA's total returns for the most recently completed fiscal year reflected actual cash flows, transaction costs and other expenses, which were not reflected in the total return of the R1000G.
During the reporting period, the Fund's investment strategy focused on stock selection. This was the most significant factor affecting the Fund's performance relative to the R1000G during the period.
The following discussion will focus on the performance of the Fund's Institutional Shares.
MARKET OVERVIEW
During the reporting period, domestic equity market performance was moderate as evidenced by the 4.44% return on the Russell 3000® Index.3 Large-cap stocks led the way with the Russell Top 200® Index4 returning 5.04%, closely followed by mid-cap stocks with a 4.37% return on the Russell Midcap® Index.5 Small-cap stocks6 were neutral with the Russell 2000 Index7 returning 0.00%. The lowest returning stocks were microcaps, with the Russell Microcap Index8 returning -4.40%. Value stocks outperformed growth stocks during the reporting period with the Russell 3000 Value Index9 returning 5.39%, compared to 3.57% for the Russell 3000 Growth Index.10 The widest spread was in the Russell Microcap Index, where the Microcap Value Index11 returned 1.78% while the Microcap Growth Index12 returned -12.38%. During the reporting period, less volatile stocks generally outperformed more volatile stocks and high dividend stocks outperformed stocks with lower dividends.
The best performing sectors in the R1000G during the reporting period were Telecommunication Services (24.12%), Utilities (16.06%) and Consumer Staples (12.00%). Underperforming sectors during the same period included Energy (-28.03%), Health Care (-5.73%) and Materials (3.40%).
Annual Shareholder Report
STOCK SELECTION
When looking at the Fund from the point of view of fundamental characteristics, the most significant driver of Fund underperformance during the reporting period was the overweighting of large cap growth stocks with relatively high earnings-to-price ratios. Weak stock selection among stocks with high earnings-to-price ratios but low conviction from sell-side analysts also contributed negatively to performance. The outperformance of the stocks in the Fund with strong conviction from sell-side analysts provided a partial offset to the underperformance. The Fund's sector exposures are close to R1000G weights except for an overweight in Consumer Discretionary and a small underweight in Information Technology. Weak stock selection in the Consumer Discretionary sector contributed the most to Fund underperformance. Additional underperformance came from the Information Technology and Financials sectors.
Individual stocks enhancing the Fund's performance during the reporting period included Huntington Ingalls Industries, Baxter International Incorporated and Keurig Green Mountain Incorporated.
Individual stocks detracting from the Fund's performance during the reporting period included Microsoft Corporation, Macy's Incorporated and Marathon Petroleum Corporation. Microsoft outperformed the R1000G but was underweighted relative to the R1000G.
| 1 | Please see the footnotes to the line graphs below for definitions of, and further information about, the R1000G. |
| 2 | Please see the footnotes to the line graphs below for definitions of, and further information about, the MLGFA. |
| 3 | The Russell 3000® Index measures the performance of the largest 3,000 U.S. companies representing approximately 98% of the investable U.S. equity market. The Russell 3000® Index is constructed to provide a comprehensive, unbiased and stable barometer of the broad market, and is completely reconstituted annually to ensure new and growing equities are reflected. The index is unmanaged, and it is not possible to invest directly in an index. |
| 4 | The Russell Top 200® Index measures the performance of the largest cap segment of the U.S. equity universe. The Russell Top 200® Index is a subset of the Russell 3000® Index. It includes approximately 200 of the largest securities based on a combination of their market cap and current index membership and represents approximately 68% of the U.S. market. The Russell Top 200® Index is constructed to provide a comprehensive and unbiased barometer for this very large cap segment and is completely reconstituted annually to ensure new and growing equities are reflected. The index is unmanaged, and it is not possible to invest directly in an index. |
| 5 | The Russell Midcap® Index measures the performance of the mid-cap segment of the U.S. equity universe. The Russell Midcap® Index is a subset of the Russell 1000® Index. It includes approximately 800 of the smallest securities based on a combination of their market cap and current index membership. The Russell Midcap® Index represents approximately 31% of the total market capitalization of the Russell 1000® companies. The Russell Midcap® Index is constructed to provide a comprehensive and unbiased barometer for the mid-cap segment. The Russell Midcap Index is completely reconstituted annually to ensure larger stocks do not distort the performance and characteristics of the true mid-cap opportunity set. The index is unmanaged, and it is not possible to invest directly in an index. |
| 6 | Small-cap stocks may be less liquid and subject to greater price volatility than large-cap stocks. |
Annual Shareholder Report
| 7 | The Russell 2000® Index measures the performance of the small-cap segment of the U.S. equity universe. The Russell 2000® Index is a subset of the Russell 3000® Index representing approximately 10% of the total market capitalization of that index. It includes approximately 2000 of the smallest securities based on a combination of their market cap and current index membership. The Russell 2000® Index is constructed to provide a comprehensive and unbiased small-cap barometer and is completely reconstituted annually to ensure larger stocks do not distort the performance and characteristics of the true small-cap opportunity set. The index is unmanaged, and it is not possible to invest directly in an index. |
| 8 | The Russell Microcap® Index measures the performance of the microcap segment of the U.S. equity market. Microcap stocks make up less than 3% of the U.S. equity market (by market cap) and consist of the smallest 1,000 securities in the small-cap Russell 2000® Index, plus the next 1,000 smallest eligible securities by market cap. The Russell Microcap® Index is constructed to provide a comprehensive and unbiased barometer for the microcap segment trading on national exchanges and is completely reconstituted annually to ensure new and growing equities are reflected and companies continue to reflect appropriate capitalization and value characteristics. The Russell Microcap® Index is unmanaged, and it is not possible to invest directly in an index. |
| 9 | The Russell 3000® Value Index measures the performance of the broad value segment of U.S. equity value universe. It includes those Russell 3000® Index companies with lower price-to-book ratios and lower forecasted growth values. The Russell 3000® Value Index is constructed to provide a comprehensive, unbiased and stable barometer of the broad value market. The Russell 3000 Value Index is completely reconstituted annually to ensure new and growing equities are included and that the represented companies continue to reflect value characteristics. The index is unmanaged, and it is not possible to invest directly in an index. |
| 10 | The Russell 3000® Growth Index measures the performance of the broad growth segment of the U.S. equity universe. It includes those Russell 3000® Index companies with higher price-to-book ratios and higher forecasted growth values. The Russell 3000® Growth Index is constructed to provide a comprehensive, unbiased and stable barometer of the broad growth market. The Russell 3000 Growth Index is completely reconstituted annually to ensure new and growing equities are included and that the represented companies continue to reflect growth characteristics. The index is unmanaged, and it is not possible to invest directly in an index. |
| 11 | The Russell Microcap® Value Index measures the performance of the micro-cap value segment of the U.S. equity universe. It includes those Russell Microcap® Index companies with higher price-to-book ratios and lower forecasted growth values. The Russell Microcap® Value Index is constructed to provide a comprehensive, unbiased and stable barometer of the micro-cap value market. The Russell Microcap Value Index is completely reconstituted annually to ensure new and growing equities are included and that the represented companies continue to reflect value characteristics. The index is unmanaged, and it is not possible to invest directly in an index. |
| 12 | The Russell Microcap® Growth Index measures the performance of the microcap growth segment of the U.S. equity market. It includes Russell Microcap companies that are considered more growth oriented relative to the overall market as defined by Russell's leading style methodology. The Russell Microcap® Growth Index is constructed to provide a comprehensive and unbiased barometer for the microcap growth segment of the market. The Russell Microcap® Growth Index is completely reconstituted annually to ensure larger stocks do not distort performance and characteristics of the microcap opportunity set. The Russell Microcap® Growth Index is unmanaged, and it is not possible to invest directly in an index. |
Annual Shareholder Report
FUND PERFORMANCE AND GROWTH OF A $10,000 INVESTMENT
The graph below illustrates the hypothetical investment of $10,0001 in the Federated MDT Large Cap Growth Fund2 (the “Fund”) from July 31, 2006 to July 31, 2016, compared to the Russell 1000® Growth Index (R1000G)3 and the Morningstar Large Growth Funds Average (MLGFA).4 The Average Annual Total Return table below shows returns for each class averaged over the stated periods.
Growth of a $10,000 Investment
Growth of $10,000 as of July 31, 2016

| Federated MDT Large Cap Growth Fund - | Institutional Shares | Class C Shares | NA | R1000G | MLGFA |
| F | F | NA | I | I |
| 7/31/2006 | 10,000 | 10,000 | | 10,000 | 10,000 |
| 7/31/2007 | 12,069 | 11,930 | | 11,947 | 11,797 |
| 7/31/2008 | 11,400 | 11,168 | | 11,196 | 10,986 |
| 7/31/2009 | 8,497 | 8,239 | | 9,228 | 8,794 |
| 7/31/2010 | 9,457 | 9,078 | | 10,488 | 9,826 |
| 7/31/2011 | 11,786 | 11,202 | | 13,084 | 12,076 |
| 7/31/2012 | 11,918 | 11,213 | | 14,165 | 12,381 |
| 7/31/2013 | 15,317 | 14,265 | | 17,231 | 15,262 |
| 7/31/2014 | 18,264 | 16,848 | | 20,451 | 17,947 |
| 7/31/2015 | 20,007 | 18,267 | | 23,740 | 20,508 |
| 7/31/2016 | 19,328 | 17,465 | | 24,772 | 20,424 |
41 graphic description end -->
| ■ | Total returns shown for Class C Shares include the maximum contingent deferred sales charge of 1.00% as applicable. |
The Fund offers multiple share classes whose performance may be greater than or less than its other share class(es) due to differences in sales charges and expenses. See the Average Annual Return table below for the returns of additional classes not shown in the line graph above.
Average Annual Total Returns for the Period Ended 7/31/2016
(returns reflect all applicable sales charges and contingent deferred sales charge as specified below in footnote #1)
| | 1 Year | 5 Years | 10 Years |
| Class A Shares | -8.94% | 8.88% | 5.94% |
| Class B Shares5 | -9.07% | 9.02% | 5.93% |
| Class C Shares | -5.24% | 9.29% | 5.73% |
| Institutional Shares | -3.40% | 10.40% | 6.81% |
| R1000G | 4.35% | 13.62% | 9.50% |
| MLGFA | -0.40% | 11.37% | 7.98% |
Annual Shareholder Report
Performance data quoted represents past performance which is no guarantee of future results. Investment return and principal value will fluctuate so that an investor's shares, when redeemed, may be worth more or less than their original cost. Mutual fund performance changes over time and current performance may be lower or higher than what is stated. For current to the most recent month-end performance and after-tax returns, visit FederatedInvestors.com or call 1-800-341-7400. Returns shown do not reflect the deduction of taxes that a shareholder would pay on Fund distributions or the redemption of Fund shares. Mutual funds are not obligations of or guaranteed by any bank and are not federally insured.
| 1 | Represents a hypothetical investment of $10,000 in the Fund after deducting applicable sales charges: for Class A Shares, the maximum sales charge of 5.50% ($10,000 investment minus $550 sales charges = $9,450); for Class B Shares, the maximum contingent deferred sales charge is 5.50% on any redemption less than one year from the purchase date; for Class C Shares, a 1.00% contingent deferred sales charge would be applied to any redemption less than one year from the purchase date. The Fund's performance assumes the reinvestment of all dividends and distributions. The R1000G has been adjusted to reflect reinvestment of dividends on securities. |
| 2 | The Fund is the successor to the MDT Large Cap Growth Fund pursuant to a reorganization that took place on December 8, 2006. Prior to that date, the Fund had no investment operations. Accordingly, the performance information shown for the periods prior to that date is that of the MDT Large Cap Growth Fund. |
| 3 | The R1000G measures the performance of the large-cap growth segment of the U.S. equity universe. It includes those Russell 1000® Index companies with higher price-to-book ratios and higher forecasted growth values. The R1000G is constructed to provide a comprehensive and unbiased barometer for the large-cap growth segment. The R1000G is completely reconstituted annually to ensure new and growing equities are included and that the represented companies continue to reflect growth characteristics. The R1000G is unmanaged and, unlike the Fund, is not affected by cash flows. It is not possible to invest directly in an index. The R1000G is not adjusted to reflect sales charges, expenses or other fees that the Securities and Exchange Commission requires to be reflected in the Fund's performance. |
| 4 | Morningstar figures represent the average of the total returns reported by all the mutual funds designated by Morningstar as falling into the respective category indicated. They do not reflect sales charges. |
| 5 | The start of performance date for the Fund was September 15, 2005. Class B Shares of the Fund were offered beginning March 29, 2007. Performance results shown before that date are for the Fund's Institutional Shares and have been adjusted for the maximum contingent deferred sales charge and total annual operating expenses applicable to the Fund's Class B Shares. The Fund's Institutional Shares commenced operations on September 15, 2005. Subject to the expense adjustments described above, the Fund's Class B Shares annual returns would have been substantially similar to those of the Fund's Institutional Shares because Shares of each class are invested in the same portfolio of securities. |
Annual Shareholder Report
Portfolio of Investments Summary Table (unaudited)
At July 31, 2016, the Fund's industry composition1 was as follows:
| Industry Composition | Percentage of
Total Net Assets |
| Internet Services | 8.1% |
| Software Packaged/Custom | 7.7% |
| Computers—Low End | 4.9% |
| Auto Original Equipment Manufacturers | 4.5% |
| Biotechnology | 4.4% |
| Financial Services | 4.1% |
| Cable TV | 3.9% |
| Services to Medical Professionals | 3.3% |
| Medical Supplies | 3.2% |
| Ethical Drugs | 3.0% |
| Soft Drinks | 2.8% |
| Computers—High End | 2.5% |
| Medical Technology | 2.5% |
| Shipbuilding | 2.5% |
| Hotels and Motels | 2.4% |
| Specialty Retailing | 2.3% |
| Chemicals | 2.2% |
| Grocery Chain | 2.2% |
| Multiline Retail | 2.1% |
| Clothing Stores | 1.9% |
| Cosmetics & Toiletries | 1.7% |
| Airline—Regional | 1.4% |
| Computer Services | 1.3% |
| AT&T Divestiture | 1.2% |
| Distillers | 1.2% |
| Hospitals | 1.2% |
| Life Insurance | 1.2% |
| Broadcasting | 1.1% |
| Property Liability Insurance | 1.0% |
| Other2 | 16.6% |
| Cash Equivalents3 | 1.7% |
| Other Assets and Liabilities—Net4 | (0.1)% |
| TOTAL | 100.0% |
Annual Shareholder Report
| 1 | Except for Cash Equivalents and Other Assets and Liabilities, industry classifications are based upon, and individual portfolio securities are assigned to, the classifications of the Global Industry Classification Standard (GICS) except that the Adviser assigns a classification to securities not classified by the GICS and to securities for which the Adviser does not have access to the classification made by the GICS. |
| 2 | For purposes of this table, industry classifications which constitute less than 1.0% of the Fund's total net assets have been aggregated under the designation “Other.” |
| 3 | Cash Equivalents include any investments in money market mutual funds and/or overnight repurchase agreements. |
| 4 | Assets, other than investments in securities, less liabilities. See Statement of Assets and Liabilities. |
Annual Shareholder Report
Portfolio of Investments
July 31, 2016
| Shares | | | Value |
| | | COMMON STOCKS—98.4% | |
| | | Airline - National—0.8% | |
| 13,961 | 1 | Jet Blue Airways Corp. | $255,905 |
| 8,151 | 1 | United Continental Holdings, Inc. | 382,201 |
| | | TOTAL | 638,106 |
| | | Airline - Regional—1.4% | |
| 8,106 | | Alaska Air Group, Inc. | 544,885 |
| 15,047 | | Southwest Airlines Co. | 556,890 |
| | | TOTAL | 1,101,775 |
| | | Airlines—0.8% | |
| 15,518 | | Delta Air Lines, Inc. | 601,322 |
| | | Apparel—0.6% | |
| 4,531 | | PVH Corp. | 457,903 |
| | | AT&T Divestiture—1.2% | |
| 16,978 | | Verizon Communications, Inc. | 940,751 |
| | | Auto Manufacturing—0.5% | |
| 3,145 | | Allison Transmission Holdings, Inc. | 90,639 |
| 25,317 | | Ford Motor Co. | 320,513 |
| | | TOTAL | 411,152 |
| | | Auto Original Equipment Manufacturers—4.5% | |
| 12,670 | | Lear Corp. | 1,437,412 |
| 6,895 | 1 | O'Reilly Automotive, Inc. | 2,003,894 |
| 1,058 | 1 | Visteon Corp. | 74,155 |
| | | TOTAL | 3,515,461 |
| | | Auto Rentals—0.3% | |
| 3,172 | 1 | United Rentals, Inc. | 252,713 |
| | | Baking���0.3% | |
| 12,348 | | Flowers Foods, Inc. | 227,080 |
| | | Biotechnology—4.4% | |
| 11,675 | | Amgen, Inc. | 2,008,450 |
| 1,030 | 1 | Charles River Laboratories International, Inc. | 90,568 |
| 15,508 | | Gilead Sciences, Inc. | 1,232,421 |
| 3,637 | 1 | Myriad Genetics, Inc. | 112,674 |
| | | TOTAL | 3,444,113 |
| | | Broadcasting—1.1% | |
| 1,248 | 1 | AMC Networks, Inc. | 69,089 |
| 10,129 | | CBS Corp., Class B | 528,937 |
Annual Shareholder Report
| Shares | | | Value |
| | | COMMON STOCKS—continued | |
| | | Broadcasting—continued | |
| 9,100 | 1 | Discovery Communications, Inc., Class A | $228,319 |
| | | TOTAL | 826,345 |
| | | Building Supply Stores—0.9% | |
| 8,563 | | Lowe's Cos., Inc. | 704,564 |
| | | Cable TV—3.9% | |
| 73,976 | 1 | MSG Networks, Inc., Class A | 1,187,315 |
| 40,416 | | Viacom, Inc., Class B | 1,837,715 |
| | | TOTAL | 3,025,030 |
| | | Chemicals—2.2% | |
| 22,442 | | LyondellBasell Industries NV, Class A | 1,688,985 |
| | | Clothing Stores—1.9% | |
| 7,887 | 1 | Fossil, Inc. | 249,229 |
| 38,363 | | Gap (The), Inc. | 989,382 |
| 4,310 | 1 | Michael Kors Holdings Ltd. | 222,913 |
| | | TOTAL | 1,461,524 |
| | | Computer Peripherals—0.6% | |
| 16,792 | | NetApp, Inc. | 442,469 |
| | | Computer Services—1.3% | |
| 12,507 | 1 | Salesforce.com, Inc. | 1,023,073 |
| | | Computers - High End—2.5% | |
| 12,325 | | IBM Corp. | 1,979,641 |
| | | Computers - Low End—4.9% | |
| 37,006 | | Apple, Inc. | 3,856,395 |
| | | Contracting—0.1% | |
| 2,771 | | Chicago Bridge & Iron Co., N.V. | 93,688 |
| | | Cosmetics & Toiletries—1.7% | |
| 15,906 | | Avon Products, Inc. | 64,737 |
| 879 | | Estee Lauder Cos., Inc., Class A | 81,659 |
| 5,600 | 1 | Sally Beauty Holdings, Inc. | 164,248 |
| 3,846 | 1 | Ulta Salon Cosmetics & Fragrance, Inc. | 1,004,614 |
| | | TOTAL | 1,315,258 |
| | | Defense Aerospace—0.8% | |
| 15,012 | 1 | Spirit Aerosystems Holdings, Inc., Class A | 651,221 |
| | | Defense Electronics—0.7% | |
| 2,552 | | Grainger (W.W.), Inc. | 558,505 |
| | | Department Stores—0.9% | |
| 2,873 | | Dillards, Inc., Class A | 194,444 |
Annual Shareholder Report
| Shares | | | Value |
| | | COMMON STOCKS—continued | |
| | | Department Stores—continued | |
| 6,348 | | Target Corp. | $478,195 |
| | | TOTAL | 672,639 |
| | | Discount Department Stores—0.3% | |
| 4,592 | | Foot Locker, Inc. | 273,775 |
| | | Distillers—1.2% | |
| 5,593 | | Constellation Brands, Inc., Class A | 920,776 |
| | | Diversified Consumer Services—0.2% | |
| 3,283 | | Block (H&R), Inc. | 78,103 |
| 2,697 | 1 | ServiceMaster Global Holdings, Inc. | 102,027 |
| | | TOTAL | 180,130 |
| | | Ethical Drugs—3.0% | |
| 16,576 | | Bristol-Myers Squibb Co. | 1,240,050 |
| 9,258 | 1 | United Therapeutics Corp. | 1,120,311 |
| | | TOTAL | 2,360,361 |
| | | Financial Services—4.1% | |
| 14,400 | | Ally Financial, Inc. | 259,776 |
| 19,726 | | Ameriprise Financial, Inc. | 1,890,540 |
| 3,696 | | Total System Services, Inc. | 188,200 |
| 44,090 | | Western Union Co. | 881,800 |
| | | TOTAL | 3,220,316 |
| | | Grocery Chain—2.2% | |
| 49,399 | | Kroger Co. | 1,688,952 |
| | | Home Building—0.4% | |
| 8,721 | | D. R. Horton, Inc. | 286,746 |
| | | Home Products—0.8% | |
| 9,449 | | Tupperware Brands Corp. | 592,263 |
| | | Hospitals—1.2% | |
| 11,708 | 1 | HCA, Inc. | 903,038 |
| | | Hotels and Motels—2.4% | |
| 26,887 | | Wyndham Worldwide Corp. | 1,909,515 |
| | | Internet Services—8.1% | |
| 2,252 | 1 | Amazon.com, Inc. | 1,708,840 |
| 65,057 | 1 | eBay, Inc. | 2,027,176 |
| 16,798 | 1 | Facebook, Inc. | 2,081,944 |
| 8,891 | | IAC Interactive Corp. | 515,323 |
| | | TOTAL | 6,333,283 |
| | | Internet Software & Services—0.5% | |
| 464 | 1 | Alphabet, Inc., Class A | 367,182 |
Annual Shareholder Report
| Shares | | | Value |
| | | COMMON STOCKS—continued | |
| | | IT Services—0.2% | |
| 1,392 | | Accenture PLC, Class A | $157,032 |
| | | Life Insurance—1.2% | |
| 12,000 | | Prudential Financial, Inc. | 903,480 |
| | | Medical Supplies—3.2% | |
| 42,124 | | Baxter International, Inc. | 2,022,795 |
| 12,262 | 1 | Hologic, Inc. | 471,964 |
| | | TOTAL | 2,494,759 |
| | | Medical Technology—2.5% | |
| 17,309 | 1 | Edwards Lifesciences Corp. | 1,982,227 |
| | | Multi-Industry Capital Goods—0.4% | |
| 8,247 | 1 | HD Supply, Inc. | 298,459 |
| | | Multiline Retail—2.1% | |
| 46,431 | | Macy's, Inc. | 1,663,623 |
| | | Mutual Fund Adviser—0.1% | |
| 2,300 | | Waddell & Reed Financial, Inc., Class A | 41,998 |
| | | Office Equipment—0.7% | |
| 28,428 | | Pitney Bowes, Inc. | 548,945 |
| | | Packaged Foods—0.5% | |
| 6,630 | | Campbell Soup Co. | 412,850 |
| | | Personal & Household—0.4% | |
| 5,300 | | Nu Skin Enterprises, Inc., Class A | 283,020 |
| | | Personal Loans—0.5% | |
| 2,260 | 1 | Credit Acceptance Corp. | 408,314 |
| | | Pharmaceuticals—0.3% | |
| 2,969 | 1 | Mallinckrodt PLC | 199,932 |
| | | Plastic Containers—0.1% | |
| 2,262 | | Sealed Air Corp. | 106,721 |
| | | Printing—0.3% | |
| 11,646 | | Donnelley (R.R.) & Sons Co. | 208,696 |
| | | Property Liability Insurance—1.0% | |
| 6,906 | | The Travelers Cos., Inc. | 802,615 |
| | | Rubber—0.5% | |
| 14,600 | | Goodyear Tire & Rubber Co. | 418,582 |
| | | Semiconductor Manufacturing—0.8% | |
| 18,872 | | Intel Corp. | 657,878 |
| | | Semiconductors & Semiconductor Equipment—0.4% | |
| 5,131 | | NVIDIA Corp. | 292,980 |
Annual Shareholder Report
| Shares | | | Value |
| | | COMMON STOCKS—continued | |
| | | Services to Medical Professionals—3.3% | |
| 23,816 | 1 | Express Scripts Holding Co. | $1,811,683 |
| 5,462 | | UnitedHealth Group, Inc. | 782,159 |
| | | TOTAL | 2,593,842 |
| | | Shipbuilding—2.5% | |
| 11,118 | | Huntington Ingalls Industries, Inc. | 1,918,744 |
| | | Shoes—0.3% | |
| 9,198 | 1 | Skechers USA, Inc., Class A | 220,936 |
| | | Soft Drinks—2.8% | |
| 3,628 | | Dr. Pepper Snapple Group, Inc. | 357,394 |
| 17,007 | | PepsiCo, Inc. | 1,852,403 |
| | | TOTAL | 2,209,797 |
| | | Software Packaged/Custom—7.7% | |
| 35,613 | | CA, Inc. | 1,233,990 |
| 6,634 | | CDW Corp. | 284,798 |
| 23,102 | 1 | Citrix Systems, Inc. | 2,059,081 |
| 7,756 | 1 | Electronic Arts, Inc. | 591,938 |
| 1,980 | | Intuit, Inc. | 219,760 |
| 3,125 | | Marketaxess Holdings, Inc. | 505,188 |
| 20,197 | | Symantec Corp. | 412,625 |
| 1,814 | 1 | Ultimate Software Group, Inc. | 379,307 |
| 5,077 | 1 | VMware, Inc., Class A | 370,520 |
| | | TOTAL | 6,057,207 |
| | | Specialty Retailing—2.3% | |
| 27,388 | | Bed Bath & Beyond, Inc. | 1,231,091 |
| 5,900 | | Big Lots, Inc. | 313,762 |
| 4,516 | | GNC Holdings, Inc. | 92,171 |
| 1,560 | | Nordstrom, Inc. | 68,999 |
| 698 | | Signet Jewelers Ltd. | 61,361 |
| | | TOTAL | 1,767,384 |
| | | Technology Hardware Storage & Peripherals—0.2% | |
| 4,349 | 1 | Teradata Corp. | 123,425 |
| | | Telecommunication Equipment & Services—0.9% | |
| 9,988 | | Motorola, Inc. | 692,967 |
| | | Toys & Games—0.2% | |
| 1,937 | | Hasbro, Inc. | 157,342 |
| | | Undesignated Consumer Cyclicals—0.3% | |
| 3,443 | 1 | Herbalife Ltd. | 234,158 |
Annual Shareholder Report
| Shares | | | Value |
| | | COMMON STOCKS—continued | |
| | | Undesignated Consumer Cyclicals—continued | |
| 3,300 | | Weight Watchers International, Inc. | $39,369 |
| | | TOTAL | 273,527 |
| | | TOTAL COMMON STOCKS
(IDENTIFIED COST $73,172,320) | 76,823,332 |
| | | INVESTMENT COMPANY—1.7% | |
| 1,355,892 | 2 | Federated Institutional Prime Value Obligations Fund, Institutional Shares, 0.36%3
(AT NET ASSET VALUE) | 1,355,892 |
| | | TOTAL INVESTMENTS—100.1%
(IDENTIFIED COST $74,528,212)4 | 78,179,224 |
| | | OTHER ASSETS AND LIABILITIES - NET—(0.1)%5 | (73,035) |
| | | TOTAL NET ASSETS—100% | $78,106,189 |
| 1 | Non-income-producing security. |
| 2 | Affiliated holding. |
| 3 | 7-day net yield. |
| 4 | The cost of investments for federal tax purposes amounts to $74,767,181. |
| 5 | Assets, other than investments in securities, less liabilities. See Statement of Assets and Liabilities. |
Note: The categories of investments are shown as a percentage of total net assets at July 31, 2016.
Various inputs are used in determining the value of the Fund's investments. These inputs are summarized in the three broad levels listed below:
Level 1—quoted prices in active markets for identical securities.
Level 2—other significant observable inputs (including quoted prices for similar securities, interest rates, prepayment speeds, credit risk, etc.). Also includes securities valued at amortized cost.
Level 3—significant unobservable inputs (including the Fund's own assumptions in determining the fair value of investments).
The inputs or methodology used for valuing securities are not an indication of the risk associated with investing in those securities.
As of July 31, 2016, all investments of the Fund utilized Level 1 inputs in valuing the Fund's assets carried at fair value.
See Notes which are an integral part of the Financial Statements
Annual Shareholder Report
Financial Highlights–Class A Shares
(For a Share Outstanding Throughout Each Period)
| Year Ended July 31 | 2016 | 2015 | 2014 | 2013 | 2012 |
| Net Asset Value, Beginning of Period | $17.64 | $16.15 | $13.58 | $10.59 | $10.50 |
| Income From Investment Operations: | | | | | |
| Net investment income (loss)1 | 0.04 | 0.02 | 0.03 | 0.04 | (0.02) |
| Net realized and unrealized gain (loss) on investments | (0.70) | 1.47 | 2.54 | 2.95 | 0.11 |
| TOTAL FROM INVESTMENT OPERATIONS | (0.66) | 1.49 | 2.57 | 2.99 | 0.09 |
| Less Distributions: | | | | | |
| Distributions from net realized gain on investments | (1.80) | — | — | — | — |
| TOTAL DISTRIBUTIONS | (1.80) | — | — | — | — |
| Net Asset Value, End of Period | $15.18 | $17.64 | $16.15 | $13.58 | $10.59 |
| Total Return2 | (3.62)% | 9.23% | 18.92% | 28.23% | 0.86% |
| Ratios to Average Net Assets: | | | | | |
| Net expenses | 1.50% | 1.50% | 1.50% | 1.50% | 1.50% |
| Net investment income (loss) | 0.28% | 0.13% | 0.17% | 0.34% | (0.23)% |
| Expense waiver/reimbursement3 | 0.07% | 0.03% | 0.11% | 0.27% | 0.78% |
| Supplemental Data: | | | | | |
| Net assets, end of period (000 omitted) | $45,661 | $55,033 | $54,573 | $49,018 | $40,676 |
| Portfolio turnover | 69% | 91% | 51% | 135% | 258% |
| 1 | Per share numbers have been calculated using the average shares method. |
| 2 | Based on net asset value, which does not reflect the sales charge, redemption fee or contingent deferred sales charge, if applicable. |
| 3 | This expense decrease is reflected in both the net expense and the net investment income (loss) ratios shown above. |
See Notes which are an integral part of the Financial Statements
Annual Shareholder Report
Financial Highlights–Class B Shares
(For a Share Outstanding Throughout Each Period)
| Year Ended July 31 | 2016 | 2015 | 2014 | 2013 | 2012 |
| Net Asset Value, Beginning of Period | $16.71 | $15.41 | $13.05 | $10.25 | $10.24 |
| Income From Investment Operations: | | | | | |
| Net investment income (loss)1 | (0.07) | (0.11) | (0.09) | (0.05) | (0.10) |
| Net realized and unrealized gain (loss) on investments | (0.68) | 1.41 | 2.45 | 2.85 | 0.11 |
| TOTAL FROM INVESTMENT OPERATIONS | (0.75) | 1.30 | 2.36 | 2.80 | 0.01 |
| Less Distributions: | | | | | |
| Distributions from net realized gain on investments | (1.80) | — | — | — | — |
| TOTAL DISTRIBUTIONS | (1.80) | — | — | — | — |
| Net Asset Value, End of Period | $14.16 | $16.71 | $15.41 | $13.05 | $10.25 |
| Total Return2 | (4.41)% | 8.44% | 18.08% | 27.32% | 0.10% |
| Ratios to Average Net Assets: | | | | | |
| Net expenses | 2.25% | 2.25% | 2.25% | 2.25% | 2.25% |
| Net investment income (loss) | (0.49)% | (0.65)% | (0.59)% | (0.44)% | (0.98)% |
| Expense waiver/reimbursement3 | 0.08% | 0.03% | 0.11% | 0.26% | 0.78% |
| Supplemental Data: | | | | | |
| Net assets, end of period (000 omitted) | $14,925 | $16,175 | $10,519 | $7,428 | $4,932 |
| Portfolio turnover | 69% | 91% | 51% | 135% | 258% |
| 1 | Per share numbers have been calculated using the average shares method. |
| 2 | Based on net asset value, which does not reflect the sales charge, redemption fee or contingent deferred sales charge, if applicable. |
| 3 | This expense decrease is reflected in both the net expense and the net investment income (loss) ratios shown above. |
See Notes which are an integral part of the Financial Statements
Annual Shareholder Report
Financial Highlights–Class C Shares
(For a Share Outstanding Throughout Each Period)
| Year Ended July 31 | 2016 | 2015 | 2014 | 2013 | 2012 |
| Net Asset Value, Beginning of Period | $16.34 | $15.07 | $12.76 | $10.03 | $10.02 |
| Income From Investment Operations: | | | | | |
| Net investment income (loss)1 | (0.06) | (0.10) | (0.08) | (0.05) | (0.09) |
| Net realized and unrealized gain (loss) on investments | (0.67) | 1.37 | 2.39 | 2.78 | 0.10 |
| TOTAL FROM INVESTMENT OPERATIONS | (0.73) | 1.27 | 2.31 | 2.73 | 0.01 |
| Less Distributions: | | | | | |
| Distributions from net realized gain on investments | (1.80) | — | — | — | — |
| TOTAL DISTRIBUTIONS | (1.80) | — | — | — | — |
| Net Asset Value, End of Period | $13.81 | $16.34 | $15.07 | $12.76 | $10.03 |
| Total Return2 | (4.39)% | 8.43% | 18.10% | 27.22% | 0.10% |
| Ratios to Average Net Assets: | | | | | |
| Net expenses | 2.25% | 2.25% | 2.25% | 2.25% | 2.25% |
| Net investment income (loss) | (0.46)% | (0.63)% | (0.59)% | (0.43)% | (0.98)% |
| Expense waiver/reimbursement3 | 0.07% | 0.03% | 0.11% | 0.27% | 0.78% |
| Supplemental Data: | | | | | |
| Net assets, end of period (000 omitted) | $10,052 | $12,904 | $11,991 | $9,830 | $7,001 |
| Portfolio turnover | 69% | 91% | 51% | 135% | 258% |
| 1 | Per share numbers have been calculated using the average shares method. |
| 2 | Based on net asset value, which does not reflect the sales charge, redemption fee or contingent deferred sales charge, if applicable. |
| 3 | This expense decrease is reflected in both the net expense and the net investment income (loss) ratios shown above. |
See Notes which are an integral part of the Financial Statements
Annual Shareholder Report
Financial Highlights–Institutional Shares
(For a Share Outstanding Throughout Each Period)
| Year Ended July 31 | 2016 | 2015 | 2014 | 2013 | 2012 |
| Net Asset Value, Beginning of Period | $18.13 | $16.55 | $13.88 | $10.80 | $10.68 |
| Income From Investment Operations: | | | | | |
| Net investment income1 | 0.08 | 0.07 | 0.06 | 0.07 | 0.002 |
| Net realized and unrealized gain (loss) on investments | (0.72) | 1.51 | 2.61 | 3.01 | 0.12 |
| TOTAL FROM INVESTMENT OPERATIONS | (0.64) | 1.58 | 2.67 | 3.08 | 0.12 |
| Less Distributions: | | | | | |
| Distributions from net realized gain on investments | (1.80) | — | — | — | — |
| TOTAL DISTRIBUTIONS | (1.80) | — | — | — | — |
| Net Asset Value, End of Period | $15.69 | $18.13 | $16.55 | $13.88 | $10.80 |
| Total Return3 | (3.40)% | 9.55% | 19.24% | 28.52% | 1.12% |
| Ratios to Average Net Assets: | | | | | |
| Net expenses | 1.25% | 1.25% | 1.25% | 1.25% | 1.25% |
| Net investment income | 0.52% | 0.37% | 0.40% | 0.58% | 0.02% |
| Expense waiver/reimbursement4 | 0.07% | 0.03% | 0.10% | 0.27% | 0.78% |
| Supplemental Data: | | | | | |
| Net assets, end of period (000 omitted) | $7,469 | $7,888 | $7,502 | $5,002 | $3,774 |
| Portfolio turnover | 69% | 91% | 51% | 135% | 258% |
| 1 | Per share numbers have been calculated using the average shares method. |
| 2 | Represents less than $0.01. |
| 3 | Based on net asset value. |
| 4 | This expense decrease is reflected in both the net expense and the net investment income ratios shown above. |
See Notes which are an integral part of the Financial Statements
Annual Shareholder Report
Statement of Assets and Liabilities
July 31, 2016
| Assets: | | |
| Total investment in securities, at value including $1,355,892 of investment in an affiliated holding (Note 5) (identified cost $74,528,212) | | $78,179,224 |
| Income receivable | | 31,142 |
| Receivable for investments sold | | 1,650,471 |
| Receivable for shares sold | | 2,345 |
| TOTAL ASSETS | | 79,863,182 |
| Liabilities: | | |
| Payable for investments purchased | $1,562,618 | |
| Payable for shares redeemed | 33,174 | |
| Payable to adviser (Note 5) | 4,380 | |
| Payable for administrative fee (Note 5) | 501 | |
| Payable for distribution services fee (Note 5) | 15,535 | |
| Payable for other service fees (Notes 2 and 5) | 26,277 | |
| Payable for share registration costs | 36,080 | |
| Accrued expenses (Note 5) | 78,428 | |
| TOTAL LIABILITIES | | 1,756,993 |
| Net assets for 5,266,856 shares outstanding | | $78,106,189 |
| Net Assets Consist of: | | |
| Paid-in capital | | $74,255,671 |
| Net unrealized appreciation of investments | | 3,651,012 |
| Accumulated net realized gain on investments | | 199,506 |
| TOTAL NET ASSETS | | $78,106,189 |
Annual Shareholder Report
Statement of Assets and Liabilities–continued
| Net Asset Value, Offering Price and Redemption Proceeds Per Share | | |
| Class A Shares: | | |
| Net asset value per share ($45,660,633 ÷ 3,008,706 shares outstanding), no par value, unlimited shares authorized | | $15.18 |
| Offering price per share (100/94.50 of $15.18) | | $16.06 |
| Redemption proceeds per share | | $15.18 |
| Class B Shares: | | |
| Net asset value per share ($14,925,266 ÷ 1,054,210 shares outstanding), no par value, unlimited shares authorized | | $14.16 |
| Offering price per share | | $14.16 |
| Redemption proceeds per share (94.50/100 of $14.16) | | $13.38 |
| Class C Shares: | | |
| Net asset value per share ($10,051,520 ÷ 727,775 shares outstanding), no par value, unlimited shares authorized | | $13.81 |
| Offering price per share | | $13.81 |
| Redemption proceeds per share (99.00/100 of $13.81) | | $13.67 |
| Institutional Shares: | | |
| Net asset value per share ($7,468,770 ÷ 476,165 shares outstanding), no par value, unlimited shares authorized | | $15.69 |
| Offering price per share | | $15.69 |
| Redemption proceeds per share | | $15.69 |
See Notes which are an integral part of the Financial Statements
Annual Shareholder Report
Statement of Operations
Year Ended July 31, 2016
| Investment Income: | | | |
| Dividends (including $4,342 received from an affiliated holding (Note 5) and net of foreign taxes withheld of $170) | | | $1,437,957 |
| Expenses: | | | |
| Investment adviser fee (Note 5) | | $604,695 | |
| Administrative fee (Note 5) | | 63,071 | |
| Custodian fees | | 15,039 | |
| Transfer agent fee | | 179,857 | |
| Directors'/Trustees' fees (Note 5) | | 2,315 | |
| Auditing fees | | 24,800 | |
| Legal fees | | 8,236 | |
| Portfolio accounting fees | | 74,980 | |
| Distribution services fee (Note 5) | | 189,777 | |
| Other service fees (Notes 2 and 5) | | 183,337 | |
| Share registration costs | | 56,534 | |
| Printing and postage | | 31,172 | |
| Miscellaneous (Note 5) | | 11,467 | |
| TOTAL EXPENSES | | 1,445,280 | |
| Waiver and Reimbursements: | | | |
| Waiver/reimbursement of investment adviser fee (Note 5) | $(60,391) | | |
| Reimbursement of other operating expenses (Notes 2 and 5) | (30) | | |
| TOTAL WAIVER AND REIMBURSEMENTS | | (60,421) | |
| Net expenses | | | 1,384,859 |
| Net investment income | | | 53,098 |
| Realized and Unrealized Gain (Loss) on Investments: | | | |
| Net realized gain on investments | | | 199,433 |
| Net change in unrealized appreciation of investments | | | (4,502,195) |
| Net realized and unrealized loss on investments | | | (4,302,762) |
| Change in net assets resulting from operations | | | $(4,249,664) |
See Notes which are an integral part of the Financial Statements
Annual Shareholder Report
Statement of Changes in Net Assets
| Year Ended July 31 | 2016 | 2015 |
| Increase (Decrease) in Net Assets | | |
| Operations: | | |
| Net investment income (loss) | $53,098 | $(66,686) |
| Net realized gain on investments | 199,433 | 13,523,659 |
| Net change in unrealized appreciation/depreciation of investments | (4,502,195) | (5,876,894) |
| CHANGE IN NET ASSETS RESULTING FROM OPERATIONS | (4,249,664) | 7,580,079 |
| Distributions to Shareholders: | | |
| Distributions from net realized gain on investments | | |
| Class A Shares | (5,502,857) | — |
| Class B Shares | (1,867,474) | — |
| Class C Shares | (1,323,955) | — |
| Institutional Shares | (798,673) | — |
| CHANGE IN NET ASSETS RESULTING FROM DISTRIBUTIONS TO SHAREHOLDERS | (9,492,959) | — |
| Share Transactions: | | |
| Proceeds from sale of shares | 14,463,299 | 19,436,379 |
| Net asset value of shares issued to shareholders in payment of distributions declared | 8,568,103 | — |
| Cost of shares redeemed | (23,183,153) | (19,601,538) |
| CHANGE IN NET ASSETS RESULTING FROM SHARE TRANSACTIONS | (151,751) | (165,159) |
| Change in net assets | (13,894,374) | 7,414,920 |
| Net Assets: | | |
| Beginning of period | 92,000,563 | 84,585,643 |
| End of period (including accumulated net investment income (loss) of $0 and $(61,714), respectively) | $78,106,189 | $92,000,563 |
See Notes which are an integral part of the Financial Statements
Annual Shareholder Report
Notes to Financial Statements
July 31, 2016
1. ORGANIZATION
Federated MDT Series (the “Trust”) is registered under the Investment Company Act of 1940, as amended (the “Act”), as an open-end management investment company. The Trust consists of five portfolios. The financial statements included herein are only those of Federated MDT Large Cap Growth Fund (the “Fund”), a diversified portfolio. The financial statements of the other portfolios are presented separately. The assets of each portfolio are segregated and a shareholder's interest is limited to the portfolio in which shares are held. Each portfolio pays its own expenses. The Fund offers four classes of shares: Class A Shares, Class B Shares, Class C Shares and Institutional Shares. All shares of the Fund have equal rights with respect to voting, except on class-specific matters. The investment objective of the Fund is long-term capital appreciation.
2. SIGNIFICANT ACCOUNTING POLICIES
The following is a summary of significant accounting policies consistently followed by the Fund in the preparation of its financial statements. These policies are in conformity with U.S. generally accepted accounting principles (GAAP).
Investment Valuation
In calculating its net asset value (NAV), the Fund generally values investments as follows:
| ■ | Equity securities listed on an exchange or traded through a regulated market system are valued at their last reported sale price or official closing price in their principal exchange or market. |
| ■ | Shares of other mutual funds or non-exchange-traded investment companies are valued based upon their reported NAVs. |
| ■ | Derivative contracts listed on exchanges are valued at their reported settlement or closing price, except that options are valued at the mean of closing bid and asked quotations. |
| ■ | Over-the-counter (OTC) derivative contracts are fair valued using price evaluations provided by a pricing service approved by the Board of Trustees (the “Trustees”). |
| ■ | Fixed-income securities acquired with remaining maturities greater than 60 days are fair valued using price evaluations provided by a pricing service approved by the Trustees. |
| ■ | Fixed-income securities and repurchase agreements acquired with remaining maturities of 60 days or less are valued at their cost (adjusted for the accretion of any discount or amortization of any premium), unless the issuer's creditworthiness is impaired or other factors indicate that amortized cost is not an accurate estimate of the investment's fair value, in which case it would be valued in the same manner as a longer-term security. |
| ■ | For securities that are fair valued in accordance with procedures established by and under the general supervision of the Trustees, certain factors may be considered such as: the last traded or purchase price of the security, information obtained by contacting the issuer or dealers, analysis of the issuer's financial statements or other available documents, fundamental analytical data, the nature and duration of restrictions on disposition, the movement of the market in which the security is normally traded, public trading in similar securities or derivative contracts of the issuer or comparable issuers, movement of a relevant index, or other factors including but not limited to industry changes and relevant government actions. |
Annual Shareholder Report
If any price, quotation, price evaluation or other pricing source is not readily available when the NAV is calculated, or if the Fund cannot obtain price evaluations from a pricing service or from more than one dealer for an investment within a reasonable period of time as set forth in the Fund's valuation policies and procedures, the Fund uses the fair value of the investment determined in accordance with the procedures described below. There can be no assurance that the Fund could obtain the fair value assigned to an investment if it sold the investment at approximately the time at which the Fund determines its NAV per share.
Fair Valuation Procedures
The Trustees have ultimate responsibility for determining the fair value of investments for which market quotations are not readily available. The Trustees have appointed a valuation committee (“Valuation Committee”) comprised of officers of the Fund, Federated MDTA LLC (“Adviser”) and certain of the Adviser's affiliated companies to assist in determining fair value and in overseeing the calculation of the NAV. The Trustees have also authorized the use of pricing services recommended by the Valuation Committee to provide fair value evaluations of the current value of certain investments for purposes of calculating the NAV. The Valuation Committee employs various methods for reviewing third-party pricing-service evaluations including periodic reviews of third-party pricing services' policies, procedures and valuation methods (including key inputs, methods, models and assumptions), transactional back-testing, comparisons of evaluations of different pricing services, and review of price challenges by the Adviser based on recent market activity. In the event that market quotations and price evaluations are not available for an investment, the Valuation Committee determines the fair value of the investment in accordance with procedures adopted by the Trustees. The Trustees periodically review and approve the fair valuations made by the Valuation Committee and any changes made to the procedures.
Factors considered by pricing services in evaluating an investment include the yields or prices of investments of comparable quality, coupon, maturity, call rights and other potential prepayments, terms and type, reported transactions, indications as to values from dealers and general market conditions. Some pricing services provide a single price evaluation reflecting the bid-side of the market for an investment (a “bid” evaluation). Other pricing services offer both bid evaluations and price evaluations indicative of a price between the prices bid and asked for the investment (a “mid” evaluation). The Fund normally uses bid evaluations for any U.S. Treasury and Agency securities, mortgage-backed securities and municipal securities. The Fund normally uses mid evaluations for any other types of fixed-income securities and any OTC derivative contracts. In the event that market quotations and price evaluations are not available for an investment, the fair value of the investment is determined in accordance with procedures adopted by the Trustees.
Repurchase Agreements
The Fund may invest in repurchase agreements for short-term liquidity purposes. It is the policy of the Fund to require the other party to a repurchase agreement to transfer to the Fund's custodian or sub-custodian eligible securities or cash with a market value (after transaction costs) at least equal to the repurchase price to be paid under the repurchase agreement. The eligible securities are transferred to accounts with the custodian or sub-custodian in which the Fund holds a “securities entitlement” and exercises “control” as those terms are defined in the Uniform Commercial Code. The Fund has established procedures for monitoring the market value of the transferred securities and requiring the transfer of
Annual Shareholder Report
additional eligible securities if necessary to equal at least the repurchase price. These procedures also allow the other party to require securities to be transferred from the account to the extent that their market value exceeds the repurchase price or in exchange for other eligible securities of equivalent market value.
The insolvency of the other party or other failure to repurchase the securities may delay the disposition of the underlying securities or cause the Fund to receive less than the full repurchase price. Under the terms of the repurchase agreement, any amounts received by the Fund in excess of the repurchase price and related transaction costs must be remitted to the other party.
The Fund may enter into repurchase agreements in which eligible securities are transferred into joint trading accounts maintained by the custodian or sub-custodian for investment companies and other clients advised by the Fund's Adviser and its affiliates. The Fund will participate on a pro rata basis with the other investment companies and clients in its share of the securities transferred under such repurchase agreements and in its share of proceeds from any repurchase or other disposition of such securities.
Investment Income, Gains and Losses, Expenses and Distributions
Investment transactions are accounted for on a trade-date basis. Realized gains and losses from investment transactions are recorded on an identified-cost basis. Interest income and expenses are accrued daily. Dividend income and distributions to shareholders are recorded on the ex-dividend date. Foreign dividends are recorded on the ex-dividend date or when the Fund is informed of the ex-dividend date. Distributions of net investment income, if any, are declared and paid annually. Non-cash dividends included in dividend income, if any, are recorded at fair value. Investment income, realized and unrealized gains and losses, and certain fund-level expenses are allocated to each class based on relative average daily net assets, except that Class A Shares, Class B Shares and Class C Shares may bear distribution services fees and other service fees unique to those classes. The detail of the total fund expense waivers and reimbursement of $60,421 is disclosed in this Note 2 and Note 5.
Dividends are declared separately for each class. No class has preferential dividend rights; differences in per share dividend rates are generally due to differences in separate class expenses.
Other Service Fees
The Fund may pay other service fees up to 0.25% of the average daily net assets of the Fund's Class A Shares, Class B Shares and Class C Shares to unaffiliated financial intermediaries or to Federated Shareholder Services Company (FSSC) for providing services to shareholders and maintaining shareholder accounts. Subject to the terms described in the Expense Limitation
Annual Shareholder Report
note, FSSC may voluntarily reimburse the Fund for other service fees. In addition, unaffiliated third-party financial intermediaries may waive other service fees. This waiver can be modified or terminated at any time. For the year ended July 31, 2016, other service fees for the Fund were as follows:
| | Other Service
Fees Incurred | Other Service
Fees Reimbursed |
| Class A Shares | $120,078 | $— |
| Class B Shares | 36,323 | 30 |
| Class C Shares | 26,936 | — |
| TOTAL | $183,337 | $30 |
Premium and Discount Amortization
All premiums and discounts on fixed-income securities are amortized/accreted using the effective-interest-rate method.
Federal Taxes
It is the Fund's policy to comply with the Subchapter M provision of the Internal Revenue Code (the “Code”) and to distribute to shareholders each year substantially all of its income. Accordingly, no provision for federal income tax is necessary. As of and during the year ended July 31, 2016, the Fund did not have a liability for any uncertain tax positions. The Fund recognizes interest and penalties, if any, related to tax liabilities as income tax expense in the Statement of Operations. As of July 31, 2016, tax years 2013 through 2016 remain subject to examination by the Fund's major tax jurisdictions, which include the United States of America and the Commonwealth of Massachusetts.
The Fund may be subject to taxes imposed by governments of countries in which it invests. Such taxes are generally based on either income or gains earned or repatriated. The Fund accrues and applies such taxes to net investment income, net realized gains and net unrealized gains as income and/or gains are earned.
When-Issued and Delayed-Delivery Transactions
The Fund may engage in when-issued or delayed-delivery transactions. The Fund records when-issued securities on the trade date and maintains security positions such that sufficient liquid assets will be available to make payment for the securities purchased. Securities purchased on a when-issued or delayed-delivery basis are marked to market daily and begin earning interest on the settlement date. Losses may occur on these transactions due to changes in market conditions or the failure of counterparties to perform under the contract.
Other
The preparation of financial statements in conformity with GAAP requires management to make estimates and assumptions that affect the amounts of assets, liabilities, expenses and revenues reported in the financial statements. Actual results could differ from those estimated. The Fund applies Investment Company accounting and reporting guidance.
Annual Shareholder Report
3. SHARES OF BENEFICIAL INTEREST
The following tables summarize share activity:
| Year Ended July 31 | 2016 | 2015 |
| Class A Shares: | Shares | Amount | Shares | Amount |
| Shares sold | 310,533 | $4,754,875 | 437,475 | $7,550,573 |
| Shares issued to shareholders in payment of distributions declared | 332,140 | 4,972,137 | — | — |
| Shares redeemed | (753,019) | (11,160,736) | (697,690) | (11,932,507) |
NET CHANGE RESULTING FROM
CLASS A SHARE TRANSACTIONS | (110,346) | $(1,433,724) | (260,215) | $(4,381,934) |
| Year Ended July 31 | 2016 | 2015 |
| Class B Shares: | Shares | Amount | Shares | Amount |
| Shares sold | 332,457 | $4,849,130 | 435,608 | $7,148,957 |
| Shares issued to shareholders in payment of distributions declared | 130,599 | 1,832,304 | — | — |
| Shares redeemed | (377,102) | (5,173,438) | (150,183) | (2,470,360) |
NET CHANGE RESULTING FROM
CLASS B SHARE TRANSACTIONS | 85,954 | $1,507,996 | 285,425 | $4,678,597 |
| Year Ended July 31 | 2016 | 2015 |
| Class C Shares: | Shares | Amount | Shares | Amount |
| Shares sold | 166,717 | $2,348,511 | 195,222 | $3,120,016 |
| Shares issued to shareholders in payment of distributions declared | 85,418 | 1,169,370 | — | — |
| Shares redeemed | (314,062) | (4,374,197) | (201,285) | (3,220,353) |
NET CHANGE RESULTING FROM
CLASS C SHARE TRANSACTIONS | (61,927) | $(856,316) | (6,063) | $(100,337) |
| Year Ended July 31 | 2016 | 2015 |
| Institutional Shares: | Shares | Amount | Shares | Amount |
| Shares sold | 167,477 | $2,510,783 | 93,199 | $1,616,833 |
| Shares issued to shareholders in payment of distributions declared | 38,466 | 594,292 | — | — |
| Shares redeemed | (164,945) | (2,474,782) | (111,365) | (1,978,318) |
NET CHANGE RESULTING FROM
INSTITUTIONAL SHARE TRANSACTIONS | 40,998 | $630,293 | (18,166) | $(361,485) |
NET CHANGE RESULTING FROM
TOTAL FUND SHARE TRANSACTIONS | (45,321) | $(151,751) | 981 | $(165,159) |
4. FEDERAL TAX INFORMATION
The timing and character of income and capital gain distributions are determined in accordance with income tax regulations, which may differ from GAAP. These differences are due to differing treatments for partnership investments, net operating losses and fair funds reclass.
Annual Shareholder Report
For the year ended July 31, 2016, permanent differences identified and reclassified among the components of net assets were as follows:
| Increase (Decrease) |
| Paid-In Capital | Undistributed
Net Investment
Income (Loss) | Accumulated
Net Realized
Gain (Loss) |
| $(658) | $8,616 | $(7,958) |
Net investment income (loss), net realized gains (losses), and net assets were not affected by this reclassification.
The tax character of distributions as reported on the Statement of Changes in Net Assets for the years ended July 31, 2016 and 2015, was as follows:
| | 2016 | 2015 |
| Long-term capital gains | $9,492,959 | $— |
As of July 31, 2016, the components of distributable earnings on a tax-basis were as follows:
| Undistributed long-term capital gains | $438,475 |
| Net unrealized appreciation | $3,412,043 |
The difference between book-basis and tax-basis net unrealized appreciation/depreciation is attributable to differing treatments for wash sales.
At July 31, 2016, the cost of investments for federal tax purposes was $74,767,181. The net unrealized appreciation of investments for federal tax purposes was $3,412,043. This consists of net unrealized appreciation from investments for those securities having an excess of value over cost of $8,455,392 and net unrealized depreciation from investments for those securities having an excess of cost over value of $5,043,349.
5. INVESTMENT ADVISER FEE AND OTHER TRANSACTIONS WITH AFFILIATES
Investment Adviser Fee
The advisory agreement between the Fund and the Adviser provides for an annual fee equal to 0.75% of the Fund's average daily net assets. Subject to the terms described in the Expense Limitation note, the Adviser may voluntarily choose to waive any portion of its fee. For the year ended July 31, 2016, the Adviser voluntarily waived $58,681 of its fee.
Annual Shareholder Report
Administrative Fee
Federated Administrative Services (FAS), under the Administrative Services Agreement, provides the Fund with administrative personnel and services. For purposes of determining the appropriate rate breakpoint, “Investment Complex” is defined as all of the Federated Funds subject to a fee under the Administrative Services Agreement. The fee paid to FAS is based on the average daily net assets of the Investment Complex as specified below, plus certain out-of-pocket expenses:
| Administrative Fee | Average Daily Net Assets
of the Investment Complex |
| 0.150% | on the first $5 billion |
| 0.125% | on the next $5 billion |
| 0.100% | on the next $10 billion |
| 0.075% | on assets in excess of $20 billion |
Subject to the terms described in the Expense Limitation note, FAS may voluntarily choose to waive any portion of its fee. For the year ended July 31, 2016, the annualized fee paid to FAS was 0.078% of average daily net assets of the Fund.
Distribution Services Fee
The Fund has adopted a Distribution Plan (the “Plan”) pursuant to Rule 12b-1 under the Act. Under the terms of the Plan, the Fund will compensate Federated Securities Corp. (FSC), the principal distributor, from the daily net assets of the Fund's Class A Shares, Class B Shares and Class C Shares to finance activities intended to result in the sale of these shares. The Plan provides that the Fund may incur distribution expenses at the following percentages of average daily net assets annually, to compensate FSC:
| Share Class Name | Percentage of Average Daily
Net Assets of Class |
| Class A Shares | 0.05% |
| Class B Shares | 0.75% |
| Class C Shares | 0.75% |
Subject to the terms described in the Expense Limitation note, FSC may voluntarily choose to waive any portion of its fee. For the year ended July 31, 2016, distribution services fees for the Fund were as follows:
| | Distribution
Services Fees
Incurred |
| Class B Shares | $108,969 |
| Class C Shares | $80,808 |
| TOTAL | $189,777 |
When FSC receives fees, it may pay some or all of them to financial intermediaries whose customers purchase shares. For the year ended July 31, 2016, FSC retained $81,900 of fees paid by the Fund. For the year ended July 31, 2016, the Fund's Class A Shares did not incur a distribution services fee; however, it may begin to incur this fee upon approval of the Trustees.
Annual Shareholder Report
Sales Charges
Front-end sales charges and contingent deferred sales charges (CDSC) do not represent expenses of the Fund. They are deducted from the proceeds of sales of Fund shares prior to investment or from redemption proceeds prior to remittance, as applicable. For the year ended July 31, 2016, FSC retained $2,220 in sales charges from the sale of Class A Shares. FSC also retained $45,806 of CDSC relating to redemptions of Class B Shares and $616 relating to redemptions of Class C Shares.
Other Service Fees
For the year ended July 31, 2016, FSSC received $33,508 and reimbursed $30 of the other service fees disclosed in Note 2.
Expense Limitation
The Adviser and certain of its affiliates (which may include FSC, FAS and FSSC) on their own initiative have agreed to waive certain amounts of their respective fees and/or reimburse expenses. Total annual fund operating (as shown in the financial highlights, excluding expenses allocated from partnerships, extraordinary expenses and proxy-related expenses paid by the Fund, if any) paid by the Fund's Class A Shares, Class B Shares, Class C Shares and Institutional Shares (after the voluntary waivers and/or reimbursements) will not exceed 1.50%, 2.25%, 2.25% and 1.25% (the “Fee Limit”), respectively, up to but not including the later of (the “Termination Date”): (a) October 1, 2016; or (b) the date of the Fund's next effective Prospectus. While the Adviser and its applicable affiliates currently do not anticipate terminating or increasing these arrangements prior to the Termination Date, these arrangements may only be terminated or the Fee Limit increased prior to the Termination Date with the agreement of the Trustees.
General
Certain Officers and Trustees of the Fund are Officers and Directors or Trustees of certain of the above companies. To efficiently facilitate payment, Directors'/Trustees' fees and certain expenses related to conducting meetings of the Directors/Trustees and other miscellaneous expenses are paid by an affiliate of the Adviser which in due course are reimbursed by the Fund. Such expenses may be included in Accrued and Miscellaneous Expenses on the Statement of Assets and Liabilities and Statement of Operations, respectively.
Annual Shareholder Report
Transactions Involving Affiliated Holdings
Affiliated holdings are investment companies which are managed by the Adviser or an affiliate of the Adviser. The Adviser has agreed to reimburse the Fund for certain investment adviser fees as a result of transactions in other affiliated investment companies. For the year ended July 31, 2016, the Adviser reimbursed $1,710. Transactions involving the affiliated holding during the year ended July 31, 2016, were as follows:
| | Federated
Institutional
Prime Value
Obligations Fund,
Institutional Shares |
| Balance of Shares Held 7/31/2015 | 1,864,649 |
| Purchases/Additions | 16,175,206 |
| Sales/Reductions | (16,683,963) |
| Balance of Shares Held 7/31/2016 | 1,355,892 |
| Value | $1,355,892 |
| Dividend Income | $4,342 |
6. Investment TRANSACTIONS
Purchases and sales of investments, excluding long-term U.S. government securities and short-term obligations, for the year ended July 31, 2016, were as follows:
| Purchases | $54,546,791 |
| Sales | $63,726,318 |
7. LINE OF CREDIT
The Fund participates with certain other Federated Funds, on a several basis, in an up to $500,000,000 unsecured, 364-day, committed, revolving line of credit (LOC) agreement. The LOC was made available to finance temporarily the repurchase or redemption of shares of the Fund, failed trades, payment of dividends, settlement of trades and for other short-term, temporary or emergency general business purposes. The Fund cannot borrow under the LOC if an inter-fund loan is outstanding. The Fund's ability to borrow under the LOC also is subject to the limitations of the Act and various conditions precedent that must be satisfied before the Fund can borrow. Loans under the LOC are charged interest at a fluctuating rate per annum equal to the highest, on any day, of (a) (i) the federal funds effective rate, (ii) the one month London Interbank Offer Rate (LIBOR), and (iii) 0.0%, plus (b) a margin. The LOC also requires the Fund to pay, quarterly in arrears and at maturity, its pro rata share of a commitment fee based on the amount of the lenders' commitment that has not been utilized. As of July 31, 2016, the Fund had no outstanding loans. During the year ended July 31, 2016, the Fund did not utilize the LOC.
Annual Shareholder Report
8. INTERFUND LENDING
Pursuant to an Exemptive Order issued by the Securities and Exchange Commission, the Fund, along with other funds advised by subsidiaries of Federated Investors, Inc., may participate in an interfund lending program. This program provides an alternative credit facility allowing the Fund to borrow from other participating affiliated funds.
As of July 31, 2016, there were no outstanding loans. During the year ended July 31, 2016, the program was not utilized.
9. federal tax information (unaudited)
For the year ended July 31, 2016, the amount of long-term capital gains designated by the Fund was $9,492,959.
Annual Shareholder Report
Report of Independent Registered Public Accounting Firm
TO THE BOARD OF trustees OF Federated MDt series AND SHAREHOLDERS OF federated mdt large cap growth fund:
We have audited the accompanying statement of assets and liabilities of Federated MDT Large Cap Growth Fund (the “Fund”) (one of the portfolios constituting Federated MDT Series), including the portfolio of investments, as of July 31, 2016, and the related statement of operations for the year then ended, the statement of changes in net assets for each of the two years in the period then ended, and the financial highlights for each of the five years in the period then ended. These financial statements and financial highlights are the responsibility of the Fund's management. Our responsibility is to express an opinion on these financial statements and financial highlights based on our audits.
We conducted our audits in accordance with standards of the Public Company Accounting Oversight Board (United States). Those standards require that we plan and perform the audit to obtain reasonable assurance about whether the financial statements and financial highlights are free of material misstatement. We were not engaged to perform an audit of the Fund's internal control over financial reporting. Our audits included consideration of internal control over financial reporting as a basis for designing audit procedures that are appropriate in the circumstances, but not for the purpose of expressing an opinion on the effectiveness of the Fund's internal control over financial reporting. Accordingly, we express no such opinion. An audit also includes examining, on a test basis, evidence supporting the amounts and disclosures in the financial statements and financial highlights, assessing the accounting principles used and significant estimates made by management, and evaluating the overall financial statement presentation. Our procedures included confirmation of securities owned as of July 31, 2016, by correspondence with the custodian and others or by other appropriate auditing procedures where replies from others were not received. We believe that our audits provide a reasonable basis for our opinion.
In our opinion, the financial statements and financial highlights referred to above present fairly, in all material respects, the financial position of Federated MDT Large Cap Growth Fund, a portfolio of Federated MDT Series, at July 31, 2016, the results of its operations for the year then ended, the changes in its net assets for each of the two years in the period then ended, and the financial highlights for each of the five years in the period then ended, in conformity with U.S. generally accepted accounting principles
Boston, Massachusetts
September 22, 2016
Annual Shareholder Report
Shareholder Expense Example (unaudited)
As a shareholder of the Fund, you incur two types of costs: (1) transaction costs, including sales charges (loads) on purchase or redemption payments; and (2) ongoing costs, including management fees and to the extent applicable, distribution (12b-1) fees and/or other service fees and other Fund expenses. This Example is intended to help you to understand your ongoing costs (in dollars) of investing in the Fund and to compare these costs with the ongoing costs of investing in other mutual funds. It is based on an investment of $1,000 invested at the beginning of the period and held for the entire period from February 1, 2016 to July 31, 2016.
ACTUAL EXPENSES
The first section of the table below provides information about actual account values and actual expenses. You may use the information in this section, together with the amount you invested, to estimate the expenses that you incurred over the period. Simply divide your account value by $1,000 (for example, an $8,600 account value divided by $1,000 = 8.6), then multiply the result by the number in the first section under the heading entitled “Expenses Paid During Period” to estimate the expenses attributable to your investment during this period.
HYPOTHETICAL EXAMPLE FOR COMPARISON PURPOSES
The second section of the table below provides information about hypothetical account values and hypothetical expenses based on the Fund's actual expense ratio and an assumed rate of return of 5% per year before expenses, which is not the Fund's actual return. Thus, you should not use the hypothetical account values and expenses to estimate the actual ending account balance or your expenses for the period. Rather, these figures are required to be provided to enable you to compare the ongoing costs of investing in the Fund with other funds. To do so, compare this 5% hypothetical example with the 5% hypothetical examples that appear in the shareholder reports of the other funds.
Annual Shareholder Report
Please note that the expenses shown in the table are meant to highlight your ongoing costs only and do not reflect any transaction costs, such as sales charges (loads) on purchase or redemption payments. Therefore, the second section of the table is useful in comparing ongoing costs only, and will not help you determine the relative total costs of owning different funds. In addition, if these transaction costs were included, your costs would have been higher.
| | Beginning
Account Value
2/1/2016 | Ending
Account Value
7/31/2016 | Expenses Paid
During Period1 |
| Actual: | | | |
| Class A Shares | $1,000 | $1,108.80 | $7.86 |
| Class B Shares | $1,000 | $1,104.50 | $11.77 |
| Class C Shares | $1,000 | $1,104.80 | $11.77 |
| Institutional Shares | $1,000 | $1,110.40 | $6.56 |
Hypothetical (assuming a 5% return
before expenses): | | | |
| Class A Shares | $1,000 | $1,017.40 | $7.52 |
| Class B Shares | $1,000 | $1,013.67 | $11.26 |
| Class C Shares | $1,000 | $1,013.67 | $11.26 |
| Institutional Shares | $1,000 | $1,018.65 | $6.27 |
| 1 | Expenses are equal to the Fund's annualized net expense ratios, multiplied by the average account value over the period, multiplied by 182/366 (to reflect the one-half-year period). The annualized net expense ratios are as follows: |
| | |
| Class A Shares | 1.50% |
| Class B Shares | 2.25% |
| Class C Shares | 2.25% |
| Institutional Shares | 1.25% |
Annual Shareholder Report
Board of Trustees and Trust Officers
The Board of Trustees is responsible for managing the Trust's business affairs and for exercising all the Trust's powers except those reserved for the shareholders. The following tables give information about each Trustee and the senior officers of the Fund. Where required, the tables separately list Trustees who are “interested persons” of the Fund (i.e., “Interested” Trustees) and those who are not (i.e., “Independent” Trustees). Unless otherwise noted, the address of each person listed is Federated Investors Tower, 1001 Liberty Avenue, Pittsburgh, PA 15222. The address of all Independent Trustees listed is 4000 Ericsson Drive, Warrendale, PA 15086-7561; Attention: Mutual Fund Board. As of December 31, 2015, the Trust comprised five portfolio(s), and the Federated Fund Family consisted of 38 investment companies (comprising 122 portfolios). Unless otherwise noted, each Officer is elected annually. Unless otherwise noted, each Trustee oversees all portfolios in the Federated Fund Family and serves for an indefinite term. The Fund's Statement of Additional Information includes additional information about Trust Trustees and is available, without charge and upon request, by calling 1-800-341-7400.
Interested TRUSTEES Background
Name
Birth Date
Positions Held with Trust
Date Service Began | Principal Occupation(s) for Past Five Years,
Other Directorships Held and Previous Position(s) |
J. Christopher Donahue*
Birth Date: April 11, 1949
President and Trustee
Indefinite Term
Began serving: May 2006 | Principal Occupations: Principal Executive Officer and President of certain of the Funds in the Federated Fund Family; Director or Trustee of the Funds in the Federated Fund Family; President, Chief Executive Officer and Director, Federated Investors, Inc.; Chairman and Trustee, Federated Investment Management Company; Trustee, Federated Investment Counseling; Chairman and Director, Federated Global Investment Management Corp.; Chairman, Federated Equity Management Company of Pennsylvania and Passport Research, Ltd. (investment advisory subsidiary of Federated); Trustee, Federated Shareholder Services Company; Director, Federated Services Company.
Previous Positions: President, Federated Investment Counseling; President and Chief Executive Officer, Federated Investment Management Company, Federated Global Investment Management Corp. and Passport Research, Ltd. |
Annual Shareholder Report
Name
Birth Date
Positions Held with Trust
Date Service Began | Principal Occupation(s) for Past Five Years,
Other Directorships Held and Previous Position(s) |
John B. Fisher*
Birth Date: May 16, 1956
Trustee
Indefinite Term
Began serving: May 2016 | Principal Occupations: Principal Executive Officer and President of certain of the Funds in the Federated Fund Family; Director or Trustee of certain of the Funds in the Federated Fund Family; Vice President, Federated Investors, Inc.; President, Director/Trustee and CEO, Federated Advisory Services Company, Federated Equity Management Company of Pennsylvania, Federated Global Investment Management Corp., Federated Investment Counseling, Federated Investment Management Company; President and CEO of Passport Research, Ltd.; President of some of the Funds in the Federated Fund Complex and Director, Federated Investors Trust Company.
Previous Positions: President and Director of the Institutional Sales Division of Federated Securities Corp.; President and Director of Federated Investment Counseling; Director, Edgewood Securities Corp.; Director, Federated Services Company; Director, Federated Investors, Inc.; Chairman and Director, Southpointe Distribution Services, Inc. and President, Technology, Federated Services Company. |
| * | Reasons for “interested” status: J. Christopher Donahue and John B. Fisher are interested due to their beneficial ownership of shares of Federated Investors, Inc. and due to positions they hold with Federated and its subsidiaries. J. Christopher Donahue is the son of John F. Donahue, Chairman Emeritus of the Federated Funds. |
INDEPENDENT TRUSTEES Background
Name
Birth Date
Positions Held with Trust
Date Service Began | Principal Occupation(s) for Past Five Years,
Other Directorships Held, Previous Position(s) and Qualifications |
John T. Collins
Birth Date: January 24, 1947
Trustee
Indefinite Term
Began serving: October 2013 | Principal Occupations: Director or Trustee of the Federated Fund Family; Retired.
Other Directorships Held: Director, Chair of the Compensation Committee, Audit Committee member, KLX Corp.
Qualifications: Mr. Collins has served in several business and financial management roles and directorship positions throughout his career. Mr. Collins previously served as Chairman and CEO, The Collins Group, Inc. (a private equity firm). Mr. Collins serves as Chairman Emeriti, Bentley University. Mr. Collins previously served as Director, FleetBoston Financial Corp.; Director and Audit Committee Member, Bank of America Corp. and Director, Beth Israel Deaconess Medical Center (Harvard University Affiliate Hospital). |
Annual Shareholder Report
Name
Birth Date
Positions Held with Trust
Date Service Began | Principal Occupation(s) for Past Five Years,
Other Directorships Held, Previous Position(s) and Qualifications |
G. Thomas Hough
Birth Date: February 28, 1955
Trustee
Indefinite Term
Began serving: August 2015 | Principal Occupations: Director or Trustee of the Federated Fund Family; Retired.
Other Directorships Held: Director, Chair of the Audit Committee, Governance Committee, Publix Super Markets, Inc.
Qualifications: Mr. Hough has served in accounting, business management and directorship positions throughout his career. Mr. Hough most recently held the position of Americas Vice Chair of Assurance with Ernst & Young LLP. Mr. Hough is an Executive Committee member of the United States Golf Association, he serves on the President's Cabinet and Business School Board of Visitors for the University of Alabama and is on the Business School Board of Visitors for Wake Forest University. |
Maureen Lally-Green
Birth Date: July 5, 1949
Trustee
Indefinite Term
Began serving: August 2009 | Principal Occupations: Director or Trustee of the Federated Fund Family; Interim Dean of the Duquesne University School of Law; Adjunct Professor of Law, Duquesne University School of Law.
Other Directorships Held: Director, CONSOL Energy Inc.
Qualifications: Judge Lally-Green has served in various legal and business roles and directorship positions throughout her career. Judge Lally-Green previously served as: Associate General Secretary, Diocese of Pittsburgh; a member of the Superior Court of Pennsylvania; and as a Professor of Law, Duquesne University School of Law. Judge Lally-Green also holds the positions on either a public or not for profit Board of Directors as follows: Member, Pennsylvania State Board of Education (public); Director and Chair, UPMC Mercy Hospital; Regent, St. Vincent Seminary; Director and Vice Chair, Our Campaign for the Church Alive!, Inc.; Director, Saint Vincent College; and Director and Chair, Cardinal Wuerl North Catholic High School, Inc. Judge Lally-Green has held the positions of: Director, Auberle; Director, Ireland Institute of Pittsburgh; Director, Saint Thomas More Society; and Director, Catholic High Schools of the Diocese of Pittsburgh, Inc. |
Peter E. Madden
Birth Date: March 16, 1942
Trustee
Indefinite Term
Began serving: June 2006 | Principal Occupation: Director or Trustee, and Chair of the Board of Directors or Trustees, of the Federated Fund Family; Retired.
Other Directorships Held: None.
Qualifications: Mr. Madden has served in several business management, mutual fund services and directorship positions throughout his career. Mr. Madden previously served as President, Chief Operating Officer and Director, State Street Bank and Trust Company (custodian bank) and State Street Corporation (financial services). He was Director, VISA USA and VISA International and Chairman and Director, Massachusetts Bankers Association. Mr. Madden served as Director, Depository Trust Corporation and Director, The Boston Stock Exchange. Mr. Madden also served as a Representative to the Commonwealth of Massachusetts General Court. |
Annual Shareholder Report
Name
Birth Date
Positions Held with Trust
Date Service Began | Principal Occupation(s) for Past Five Years,
Other Directorships Held, Previous Position(s) and Qualifications |
Charles F. Mansfield, Jr.
Birth Date: April 10, 1945
Trustee
Indefinite Term
Began serving: June 2006 | Principal Occupations: Director or Trustee of the Federated Fund Family; Management Consultant.
Other Directorships Held: None.
Qualifications: Mr. Mansfield has served in several banking, business management and educational roles and directorship positions throughout his career. Mr. Mansfield previously served as Chief Executive Officer, PBTC International Bank; Partner, Arthur Young & Company (now Ernst & Young LLP); Chief Financial Officer of Retail Banking Sector, Chase Manhattan Bank; Senior Vice President, HSBC Bank USA (formerly, Marine Midland Bank); Vice President, Citibank; Assistant Professor of Banking and Finance, Frank G. Zarb School of Business, Hofstra University; Executive Vice President DVC Group, Inc. (marketing, communications and technology). |
Thomas M. O'Neill
Birth Date: June 14, 1951
Trustee
Indefinite Term
Began serving: October 2006 | Principal Occupations: Director or Trustee, Chair of the Audit Committee of the Federated Fund Family; Sole Proprietor, Navigator Management Company (investment and strategic consulting).
Other Directorships Held: None.
Qualifications: Mr. O'Neill has served in several business, mutual fund and financial management roles and directorship positions throughout his career. Mr. O'Neill serves as Director, Medicines for Humanity and Director, The Golisano Children's Museum of Naples, Florida. Mr. O'Neill previously served as Chief Executive Officer and President, Managing Director and Chief Investment Officer, Fleet Investment Advisors; President and Chief Executive Officer, Aeltus Investment Management, Inc.; General Partner, Hellman, Jordan Management Co., Boston, MA; Chief Investment Officer, The Putnam Companies, Boston, MA; Credit Analyst and Lending Officer, Fleet Bank; Director and Consultant, EZE Castle Software (investment order management software); and Director, Midway Pacific (lumber). |
P. Jerome Richey
Birth Date: February 23, 1949
Trustee
Indefinite Term
Began serving: October 2013 | Principal Occupations: Director or Trustee of the Federated Fund Family; Management Consultant.
Other Directorships Held: None.
Qualifications: Mr. Richey has served in several business and legal management roles and directorship positions throughout his career. Mr. Richey most recently held the positions of Senior Vice Chancellor and Chief Legal Officer, University of Pittsburgh. Mr. Richey serves as Board Member, Epilepsy Foundation of Western Pennsylvania and Board member, World Affairs Council of Pittsburgh. Mr. Richey previously served as Chief Legal Officer and Executive Vice President, CONSOL Energy Inc. and Shareholder, Buchanan Ingersoll & Rooney PC (a law firm). |
Annual Shareholder Report
Name
Birth Date
Positions Held with Trust
Date Service Began | Principal Occupation(s) for Past Five Years,
Other Directorships Held, Previous Position(s) and Qualifications |
John S. Walsh
Birth Date: November 28, 1957
Trustee
Indefinite Term
Began serving: June 2006 | Principal Occupations: Director or Trustee of the Federated Fund Family; President and Director, Heat Wagon, Inc. (manufacturer of construction temporary heaters); President and Director, Manufacturers Products, Inc. (distributor of portable construction heaters); President, Portable Heater Parts, a division of Manufacturers Products, Inc.
Other Directorships Held: None.
Qualifications: Mr. Walsh has served in several business management roles and directorship positions throughout his career. Mr. Walsh previously served as Vice President, Walsh & Kelly, Inc. (paving contractors). |
OFFICERS
Name
Birth Date
Address
Positions Held with Trust
Date Service Began | Principal Occupation(s) for Past Five Years
and Previous Position(s) |
John W. McGonigle
Birth Date: October 26, 1938
Secretary
Officer since: May 2006 | Principal Occupations: Executive Vice President and Secretary of the Federated Fund Family; Vice Chairman, Executive Vice President, Secretary and Director, Federated Investors, Inc.
Previous Positions: Trustee, Federated Investment Management Company and Federated Investment Counseling; Director, Federated Global Investment Management Corp., Federated Services Company and Federated Securities Corp. |
Lori A. Hensler
Birth Date: January 6, 1967
TREASURER
Officer since: April 2013 | Principal Occupations: Principal Financial Officer and Treasurer of the Federated Fund Family; Senior Vice President, Federated Administrative Services; Financial and Operations Principal for Federated Securities Corp. and Edgewood Services, Inc.; and Assistant Treasurer, Federated Investors Trust Company. Ms. Hensler has received the Certified Public Accountant designation.
Previous Positions: Controller of Federated Investors, Inc.; Senior Vice President and Assistant Treasurer, Federated Investors Management Company; Treasurer, Federated Investors Trust Company; Assistant Treasurer, Federated Administrative Services, Federated Administrative Services, Inc., Federated Securities Corp., Edgewood Services, Inc., Federated Advisory Services Company, Federated Equity Management Company of Pennsylvania, Federated Global Investment Management Corp., Federated Investment Counseling, Federated Investment Management Company, Passport Research, Ltd., and Federated MDTA, LLC; Financial and Operations Principal for Federated Securities Corp., Edgewood Services, Inc. and Southpointe Distribution Services, Inc. |
Annual Shareholder Report
Name
Birth Date
Address
Positions Held with Trust
Date Service Began | Principal Occupation(s) for Past Five Years
and Previous Position(s) |
Peter J. Germain
Birth Date: September 3, 1959
CHIEF LEGAL OFFICER
Officer since: June 2006 | Principal Occupations: Mr. Germain is Chief Legal Officer of the Federated Fund Family. He is General Counsel and Vice President, Federated Investors, Inc.; President, Federated Administrative Services and Federated Administrative Services, Inc.; Vice President, Federated Securities Corp.; Secretary, Federated Private Asset Management, Inc.; and Secretary, Retirement Plan Service Company of America. Mr. Germain joined Federated in 1984 and is a member of the Pennsylvania Bar Association.
Previous Positions: Deputy General Counsel, Special Counsel, Managing Director of Mutual Fund Services, Federated Investors, Inc.; Senior Vice President, Federated Services Company; and Senior Corporate Counsel, Federated Investors, Inc. |
Stephen F. Auth
Birth Date: September 13, 1956
101 Park Avenue
41st Floor
New York, NY 10178
CHIEF INVESTMENT OFFICER
Officer since: June 2012 | Principal Occupations: Stephen F. Auth is Chief Investment Officer of various Funds in the Federated Fund Family; Executive Vice President, Federated Investment Counseling, Federated Global Investment Management Corp. and Federated Equity Management Company of Pennsylvania.
Previous Positions: Executive Vice President, Federated Investment Management Company and Passport Research, Ltd. (investment advisory subsidiary of Federated); Senior Vice President, Global Portfolio Management Services Division; Senior Vice President, Federated Investment Management Company and Passport Research, Ltd.; Senior Managing Director and Portfolio Manager, Prudential Investments. |
Stephen Van Meter
Birth Date: June 5, 1975
CHIEF COMPLIANCE OFFICER AND SENIOR VICE PRESIDENT
Officer since: July 2015 | Principal Occupations: Senior Vice President and Chief Compliance Officer of the Federated Fund Family; Vice President and Chief Compliance Officer of Federated Investors, Inc. and Chief Compliance Officer of certain of its subsidiaries. Mr. Van Meter joined Federated in October 2011. He holds FINRA licenses under Series 3, 7, 24 and 66.
Previous Positions: Mr. Van Meter previously held the position of Compliance Operating Officer, Federated Investors, Inc. Prior to joining Federated, Mr. Van Meter served at the United States Securities and Exchange Commission in the positions of Senior Counsel, Office of Chief Counsel, Division of Investment Management and Senior Counsel, Division of Enforcement. |
Annual Shareholder Report
Evaluation and Approval of Advisory Contract–May 2016
Federated MDT Large Cap Growth Fund (the “Fund”)
Following a review and recommendation of approval by the Fund's independent trustees, the Fund's Board of Trustees (the “Board”) reviewed and unanimously approved at its May 2016 meetings the continuation of the Fund's investment advisory contract for an additional one-year term. The Board's decision regarding the contract reflects the exercise of its business judgment after consideration of all of the information received on whether to continue the existing arrangements.
The Board had previously appointed a Senior Officer, whose duties include specified responsibilities relating to the process by which advisory fees are to be charged to a Federated fund. The Senior Officer has the authority to retain consultants, experts, or staff as may be reasonably necessary to assist in the performance of his duties, reports directly to the Board, and may be terminated only with the approval of a majority of the independent members of the Board. The Senior Officer prepared and furnished to the Board an independent, written evaluation that covered topics discussed below (the “Senior Officer's Evaluation”). The Board considered the Senior Officer's Evaluation, along with other information, in deciding to approve the investment advisory contract.
The Board is also familiar with and considered judicial decisions concerning allegedly excessive investment advisory fees, which have indicated that the following factors may be relevant to an adviser's fiduciary duty with respect to its receipt of compensation from a fund: the nature and quality of the services provided by an adviser to a fund and its shareholders, including the performance and fees and expenses of the fund and of comparable funds; an adviser's cost of providing the services, including the profitability to an adviser of providing advisory services to a fund; the extent to which an adviser may realize “economies of scale” as a fund grows larger and, if such economies of scale exist, whether they have been shared with a fund and its shareholders or the family of funds; any “fall-out financial benefits” that accrue to an adviser because of its relationship with a fund (including research services received from brokers that execute fund trades and any fees paid to affiliates of an adviser for services rendered to a fund); comparative fee and expense structures, including a comparison of fees paid to an adviser with those paid by similar funds; and the extent of care, conscientiousness and independence with which board members perform their duties and their expertise, including whether they are fully informed about all facts the board deems relevant to its consideration of an adviser's services and fees. The Board noted that the Securities and Exchange Commission (“SEC”) disclosure requirements regarding the basis for the Board's approval of the Fund's investment advisory contract generally track the factors listed above. Consistent with these judicial decisions and SEC disclosure requirements, the Board also considered management fees charged to
Annual Shareholder Report
institutional and other clients of Federated MDTA LLC (the “Adviser”) for what might be viewed as like services. The Board was aware of these factors and was guided by them in its review of the Fund's investment advisory contract to the extent it considered them to be appropriate and relevant, as discussed further below.
The Board considered and weighed these circumstances in light of its substantial accumulated experience in governing the Fund and working with Federated Investors, Inc. and its affiliates (“Federated”) on matters relating to the Federated funds, and was assisted in its deliberations by independent legal counsel. Throughout the year, and in connection with its May meetings, the Board requested and received substantial and detailed information about the Fund and the Federated organization that was in addition to the extensive materials that comprise and accompany the Senior Officer's Evaluation. Federated provided much of this information at each regular meeting of the Board, and furnished additional substantial information in connection with the May meetings at which the Board's formal review of the investment advisory contract occurred. At the May meetings, in addition to meeting in separate sessions of the independent trustees without management present, senior management of the Adviser also met with the independent trustees and their counsel to discuss the materials presented and any other matters thought relevant by the Adviser or the trustees. Between regularly scheduled meetings, the Board also received information on particular matters as the need arose. Thus, the Board's consideration of the investment advisory contract included review of the Senior Officer's Evaluation, accompanying data and additional information covering such matters as: the Adviser's investment philosophy, revenue, profitability, personnel and processes; investment and operating strategies; the Fund's short- and long-term performance (in absolute terms, both on a gross basis and net of expenses, as well as in relationship to its particular investment program and certain competitor or “peer group” funds and/or other benchmarks, as appropriate), and comments on the reasons for performance; the Fund's investment objectives; the Fund's expenses (including the advisory fee itself and the overall expense structure of the Fund, both in absolute terms and relative to similar and/or competing funds, with due regard for contractual or voluntary expense limitations); the use and allocation of brokerage commissions derived from trading the Fund's portfolio securities (if any); and the nature, quality and extent of the advisory and other services provided to the Fund by the Adviser and its affiliates. The Board also considered the preferences and expectations of Fund shareholders; the entrepreneurial risk assumed by the Adviser in sponsoring the Fund; the continuing state of competition in the mutual fund industry and market practices; the range of comparable fees for similar funds in the mutual fund industry; the Fund's relationship to the Federated funds which include a comprehensive array of funds with different investment objectives, policies and strategies which are generally available for exchange without the incurrence of additional sales charges; compliance and
Annual Shareholder Report
audit reports concerning the Federated funds and the Federated companies that service them (including communications from regulatory agencies), as well as Federated's responses to any issues raised therein; and relevant developments in the mutual fund industry and how the Federated funds and/or Federated are responding to them. The Board's evaluation process is evolutionary. The criteria considered and the emphasis placed on relevant criteria change in recognition of changing circumstances in the mutual fund marketplace.
While mindful that courts have cautioned against giving such comparisons too much weight, the Board has found the use of comparisons of the Fund's fees and expenses to other mutual funds with comparable investment programs to be relevant to its deliberations. In this regard, the Board was presented with, and considered, information regarding the contractual advisory fee rates, net advisory fee rates, total expense ratios and each element of the Fund's total expense ratio (i.e., gross and net advisory fees, custody fees, portfolio accounting fees and transfer agency fees) relative to the Fund's peers. The Board focused on comparisons with other similar mutual funds more heavily than non-mutual fund products or services because it is believed that they are more relevant. For example, other mutual funds are the products most like the Fund, they are readily available to Fund shareholders as alternative investment vehicles, and they are the type of investment vehicle in fact chosen and maintained by the Fund's investors. The range of their fees and expenses therefore appears to be a relevant indicator of what consumers have found to be reasonable in the precise marketplace in which the Fund competes.
The Board reviewed the contractual advisory fee rate, net advisory fee rate where partially waived and other expenses of the Fund and noted the position of the Fund's fee rates relative to its peers. In this regard, the Board noted that the contractual advisory fee rate was above the median of the relevant peer group, but the Board noted the applicable waivers and reimbursements and that the overall expense structure of the Fund remained competitive in the context of other factors considered by the Board. In this regard, the Board had been previously advised that, while comparisons to fund peer groups are relevant in judging the reasonableness of advisory fees, the Fund's quantitative focus makes fee and expense comparisons particularly difficult. Although the Fund's advisory fee was above the median of the peer range, the peer group of funds varied widely in their complexity, and the Board had been informed that the management of the Fund is among the more complex relative to its peers.
By contrast, the Senior Officer has reviewed Federated's fees for providing advisory services to products outside the Federated funds (e.g., institutional and separate accounts and sub-adviser services). He concluded that mutual funds and institutional accounts are inherently different products. Those differences include, but are not limited to, different types of targeted investors; being subject to different laws and regulations; different legal structures; different average account sizes and portfolio management techniques made necessary by different cash flows and different associated costs; and the time spent by portfolio
Annual Shareholder Report
managers and their teams, funds financial services, legal, compliance and risk management in reviewing securities pricing, addressing different administrative responsibilities, addressing different degrees of risk associated with management and a variety of different costs. The Senior Officer did not consider the fees for providing advisory services to these outside products to be determinative in judging the appropriateness of mutual fund advisory fees.
The Senior Officer noted that the services, administrative responsibilities and risks associated with such relationships are quite different than serving as a primary adviser to a fund.
Following such evaluation, the Board concluded, within the context of its full deliberations, that the expenses of the Fund are reasonable and supported renewal of the investment advisory contract with respect to the Fund.
The Board considered the nature, extent and quality of the services provided to the Fund by the Adviser and the resources of the Adviser and its affiliates dedicated to the Fund. In this regard, the Board evaluated, among other things, the Adviser's personnel, experience, track record, overall reputation and willingness to invest in personnel and infrastructure that benefit the Fund. In addition, the Board reviewed the qualifications, backgrounds and responsibilities of the portfolio management team primarily responsible for the day-to-day management of the Fund. The Board noted the compliance programs of and the compliance-related resources provided to the Fund by the Adviser. The Fund's ability to deliver competitive performance when compared to its peer group was also deemed to be relevant by the Board as a useful indicator of how the Adviser is executing the Fund's investment program, which in turn was one of the Board's considerations in reaching a conclusion that the nature, extent, and quality of the Adviser's investment management services were such as to warrant continuation of the investment advisory contract.
In evaluating the Fund's investment performance, the Board considered performance results in light of the Fund's investment objective, strategies and risks, as disclosed in the Fund's prospectus. The Board particularly considered detailed investment reports on the Fund's performance provided to the Board throughout the year and in connection with the May meetings. The Senior Officer also reviewed information compiled by Federated, using data supplied by independent fund ranking organizations, regarding the performance of, and fees charged by, other mutual funds, noting his view that comparisons to fund peer groups may be helpful, though not conclusive, in judging the reasonableness of the proposed fees. The Board considered, in evaluating such comparisons, that in some cases individual funds may exhibit significant and unique differences in their objectives and management techniques when compared to other funds within an industry peer group, and that the Senior Officer had specifically noted that the Fund's quantitative focus makes fee and expense comparisons particularly difficult as the peer group of funds varied widely in their complexity, and the management of the Fund is among the more complex relative to its peers.
Annual Shareholder Report
The Fund's performance fell below the median of the relevant peer group for the one-year, three-year and five-year periods covered by the Senior Officer's Evaluation. In addition, the Board was informed by the Adviser that, for the same periods, the Fund underperformed its benchmark index for the one-year, three-year and five-year periods. The Board discussed the Fund's performance with the Adviser and recognized the efforts being taken by the Adviser in the context of the other factors considered relevant by the Board.
Following such evaluation, the Board concluded, within the context of its full deliberations, that the performance of the Fund supported renewal of the advisory contract with respect to the Fund.
The Board also received financial information about Federated, including information regarding the compensation and ancillary (or “fall-out”) benefits Federated derived from its relationships with the Federated funds. This information covered not only the fees under the investment advisory contracts, but also fees received by Federated's subsidiaries for providing other services to the Federated funds under separate contracts (e.g., for serving as the Federated funds' administrator). The information also detailed any indirect benefit Federated may derive from its receipt of research services from brokers who execute Federated fund trades. In addition, the Board considered the fact that, in order for a fund to be competitive in the marketplace, Federated and its affiliates frequently waived fees and/or reimbursed expenses and have disclosed to fund investors and/or indicated to the Board their intention to do so in the future, where appropriate. Moreover, the Board receives regular reporting as to the institution, adjustment or elimination of these voluntary waivers. The Board considered Federated's previous reductions in contractual management fees to certain funds in response to the Senior Officer's recommendations.
Federated furnished information, requested by the Senior Officer, that reported revenues on a fund-by-fund basis and made estimates of the allocation of expenses on a fund-by-fund basis, using allocation methodologies specified by the Senior Officer. The Senior Officer noted that, while these cost allocation reports apply consistent allocation processes, the inherent difficulties in allocating costs continues to cause the Senior Officer to question the precision of the process and to conclude that such reports may be unreliable, since a single change in an allocation estimate may dramatically alter the resulting estimate of cost and/or profitability of a fund and may produce unintended consequences. The allocation information, including the Senior Officer's view that fund-by-fund estimations may be unreliable, was considered in the analysis by the Board.
The Board and the Senior Officer also reviewed information compiled by Federated comparing profitability information for Federated to other publicly held fund management companies. In this regard, the Senior Officer concluded that Federated's profit margins did not appear to be excessive. The Senior Officer also noted that Federated appeared financially sound, with the resources to fulfill its obligations under its contracts with the Fund.
Annual Shareholder Report
The Senior Officer's Evaluation also discussed the notion of possible realization of “economies of scale” as a fund grows larger. The Board considered in this regard that the Adviser has made significant and long-term investments in areas that support all of the Federated funds, such as personnel and processes for the portfolio management, shareholder services, compliance, internal audit, and risk management functions, as well as systems technology (including technology relating to cybersecurity), and that the benefits of these efforts (as well as any economies of scale, should they exist) were likely to be enjoyed by the fund family as a whole. The Board noted that the Adviser's investments in these areas are extensive. In addition, the Board considered that Federated and its affiliates have frequently waived fees and/or reimbursed expenses and that this has allowed fund shareholders to share potential economies of scale from a fund's inception. Federated, as it does throughout the year, and again in connection with the Board's review, furnished information relative to revenue sharing or adviser paid fees. Federated and the Senior Officer noted that this information should be viewed to determine if there was an incentive to either not apply breakpoints or to apply breakpoints at higher levels and should not be viewed to determine the appropriateness of advisory fees, because it would represent marketing and distribution expenses. Finally, the Board also noted the absence of any applicable regulatory or industry guidelines on this subject, which (as discussed in the Senior Officer's Evaluation) is compounded by the lack of any common industry practice or general pattern with respect to structuring fund advisory fees with “breakpoints” that serve to reduce the fee as a fund attains a certain size.
The Senior Officer noted that, subject to the comments and recommendations made within the Senior Officer's Evaluation, his observations and the information accompanying the Senior Officer's Evaluation supported a finding by the Board that the management fee for the Fund was reasonable. Under these circumstances, no changes were recommended to, and no objection was raised to, the continuation of the Fund's investment advisory contract.
In its decision to continue an existing investment advisory contract, the Board was mindful of the potential disruptions of the Fund's operations and various risks, uncertainties and other effects that could occur as a result of a decision to terminate or not renew an investment advisory contract. In particular, the Board recognized that many shareholders have invested in the Fund on the strength of the Adviser's industry standing and reputation and with the expectation that the Adviser will have a continuing role in providing advisory services to the Fund. Thus, the Board's approval of the investment advisory contract reflected the fact that it is the shareholders who have effectively selected the Adviser by virtue of having invested in the Fund. The Board concluded that, in light of the factors discussed above, including the nature, quality and scope of the services provided to the Fund by the Adviser and its affiliates, continuation of the investment advisory contract was appropriate.
Annual Shareholder Report
The Board based its decision to approve the investment advisory contract on the totality of the circumstances and relevant factors and with a view to past and future long-term considerations. Not all of the factors and considerations identified above were necessarily relevant to the Fund, nor did the Board consider any one of them to be determinative. With respect to the factors that were relevant, the Board's decision to approve the continuation of the contract reflects its determination that Federated's performance and actions provided a satisfactory basis to support the decision to continue the existing arrangement.
Annual Shareholder Report
Voting Proxies on Fund Portfolio Securities
A description of the policies and procedures that the Fund uses to determine how to vote proxies, if any, relating to securities held in the Fund's portfolio is available, without charge and upon request, by calling 1-800-341-7400. A report on “Form N-PX” of how the Fund voted any such proxies during the most recent 12-month period ended June 30 is available via the Proxy Voting Record (Form N-PX) link associated with the Fund and share class name at www.FederatedInvestors.com/FundInformation. Form N-PX filings are also available at the SEC's website at www.sec.gov.
Quarterly Portfolio Schedule
The Fund files with the SEC a complete schedule of its portfolio holdings, as of the close of the first and third quarters of its fiscal year, on “Form N-Q.” These filings are available on the SEC's website at www.sec.gov and may be reviewed and copied at the SEC's Public Reference Room in Washington, DC. (Call 1-800-SEC-0330 for information on the operation of the Public Reference Room.) You may also access this information via the link to the Fund and share class name at www.FederatedInvestors.com/FundInformation.
Annual Shareholder Report
Mutual funds are not bank deposits or obligations, are not guaranteed by any bank and are not insured or guaranteed by the U.S. government, the Federal Deposit Insurance Corporation, the Federal Reserve Board or any other government agency. Investment in mutual funds involves investment risk, including the possible loss of principal.
This Report is authorized for distribution to prospective investors only when preceded or accompanied by the Fund's Prospectus, which contains facts concerning its objective and policies, management fees, expenses and other information.
Federated MDT Large Cap Growth Fund
Federated Investors Funds
4000 Ericsson Drive
Warrendale, PA 15086-7561
Contact us at FederatedInvestors.com
or call 1-800-341-7400.
Federated Securities Corp., Distributor
CUSIP 31421R700
CUSIP 31421R684
CUSIP 31421R809
CUSIP 31421R882
37329 (9/16)
Federated is a registered trademark of Federated Investors, Inc.
2016 ©Federated Investors, Inc.
Annual Shareholder Report
July 31, 2016
| Share Class | Ticker |
| A | QASCX |
| C | QCSCX |
| Institutional | QISCX |
| R6 | QLSCX |
Federated MDT Small Cap Core Fund
Fund Established 2005
A Portfolio of Federated MDT Series
Dear Valued Shareholder,
I am pleased to present the Annual Shareholder Report for your fund covering the period from August 1, 2015 through July 31, 2016. This report includes Management's Discussion of Fund Performance, a complete listing of your fund's holdings, performance information and financial statements along with other important fund information.
In addition, our website, FederatedInvestors.com, offers easy access to Federated resources that include timely fund updates, economic and market insights from our investment strategists, and financial planning tools. We invite you to register to take full advantage of its capabilities.
Thank you for investing with Federated. I hope you find this information useful and look forward to keeping you informed.
Sincerely,
J. Christopher Donahue, President
Not FDIC Insured • May Lose Value • No Bank Guarantee
CONTENTS
| 1 |
| 6 |
| 8 |
| 17 |
| 21 |
| 23 |
| 24 |
| 25 |
| 35 |
| 36 |
| 38 |
| 44 |
| 51 |
| 51 |
Management's Discussion of Fund Performance (unaudited)
The total return of Federated MDT Small Cap Core Fund (the “Fund”), based on net asset value for the 12-month reporting period ended July 31, 2016, was 7.90% for Class A Shares, 7.12% for Class C Shares, 8.24% for Institutional Shares and 7.89% for Class R6 Shares.1 The total return for the Russell 2000® Index (R2000),2 the Fund's broad-based securities market index, was 0.00% for the same period. The total return of the Morningstar Small Blend Funds Average (MSBFA),3 a peer group average for the Fund, was 0.43% during the same period. The Fund's and MSBFA's total returns for the most recently completed fiscal year reflected actual cash flows, transaction costs and other expenses, which were not reflected in the total return of the R2000.
During the reporting period, the Fund's investment strategy focused on stock selection. This was the most significant factor affecting the Fund's performance relative to the R2000 during the period.
The following discussion will focus on the performance of the Fund's Institutional Shares.
MARKET OVERVIEW
During the reporting period, domestic equity market performance was moderate as evidenced by the 4.44% return on the Russell 3000® Index.4 Large-cap stocks led the way with the Russell Top 200® Index5 returning 5.04%, closely followed by mid-cap stocks with a 4.37% return on the Russell Midcap® Index.6 Small-cap stocks7 were neutral with the R2000 returning 0.00%. The lowest returning stocks were microcaps, with the Russell Microcap® Index8 returning -4.40%. Value stocks outperformed growth stocks during the reporting period with the Russell 3000® Value Index9 returning 5.39%, compared to 3.57% for the Russell 3000® Growth Index.10 The widest spread was in the Russell Microcap Index, where the Russell Microcap® Value Index11 returned 1.78% while the Russell Microcap® Growth Index12 returned -12.38%. During the reporting period, less volatile stocks generally outperformed more volatile stocks and high dividend stocks outperformed stocks with lower dividends.
The best performing sectors in the R2000 during the reporting period were Utilities (27.02%), Telecommunication Services (22.17%) and Consumer Staples (14.61%). Underperforming sectors during the same period included Energy (-27.59%), Health Care (-16.74%) and Consumer Discretionary (-8.40%).
Annual Shareholder Report
STOCK SELECTION
When looking at the Fund from the point of view of fundamental characteristics, the outperformance during the reporting period came primarily from stocks with a combination of high earnings-to-price ratios and high structural earnings. Additional favorable performance came from a small number of stocks with solid but not strong fundamental characteristics that the Fund bought after they had suffered severe price drops. Some of those stocks, including Weight Watchers International among them, recovered strongly while the Fund held them for an overall gain. Stocks selected for their strong growth characteristics detracted the most from performance.
The Fund's sector exposures remained close to R2000 weights, but with an overweight in the Consumer Discretionary sector and small underweights in the Utilities, Financials and Health Care sectors. Strong stock selection in the Consumer Discretionary sector, followed by the Industrials and Information Technology sectors, contributed the most to the Fund's outperformance. Poor stock selection in the Telecom Services sector detracted the most from performance.
Individual stocks enhancing the Fund's performance during the reporting period included Weight Watchers International, EZCORP Incorporated and Rovi Corporation.
Individual stocks detracting from the Fund's performance during the reporting period included Intelsat SA, Iconix Brand Group Incorporated and Century Aluminum Company.
| 1 | The Fund's R6 Class commenced operations on June 29, 2016. For the period prior to the commencement of operations of the R6 class, the R6 class performance information shown is for the Institutional Share class, adjusted to reflect the expenses of the Fund's R6 class for each period for which the Fund's R6 class gross expenses would have exceeded the actual expense paid by the Fund's Institutional Share class. |
| 2 | Please see the footnotes to the line graphs below for definitions of, and further information about, the R2000. |
| 3 | Please see the footnotes to the line graphs below for definitions of, and further information about, the MSBFA. |
| 4 | The Russell 3000® Index measures the performance of the largest 3,000 U.S. companies representing approximately 98% of the investable U.S. equity market. The Russell 3000® Index is constructed to provide a comprehensive, unbiased and stable barometer of the broad market and is completely reconstituted annually to ensure new and growing equities are reflected. The index is unmanaged, and it is not possible to invest directly in an index. |
| 5 | The Russell Top 200® Index measures the performance of the largest cap segment of the U.S. equity universe. The Russell Top 200® Index is a subset of the Russell 3000® Index. It includes approximately 200 of the largest securities based on a combination of their market cap and current index membership and represents approximately 68% of the U.S. market. The Russell Top 200® Index is constructed to provide a comprehensive and unbiased barometer for this very large cap segment and is completely reconstituted annually to ensure new and growing equities are reflected. The index is unmanaged, and it is not possible to invest directly in an index. |
| 6 | The Russell Midcap® Index measures the performance of the mid-cap segment of the U.S. equity universe. The Russell Midcap® Index is a subset of the Russell 1000® Index. It includes approximately 800 of the smallest securities based on a combination of their market cap and current index membership. The Russell Midcap® Index represents approximately 31% of the total market capitalization |
Annual Shareholder Report
| | of the Russell 1000® companies. The Russell Midcap® Index is constructed to provide a comprehensive and unbiased barometer for the mid-cap segment. The Russell Midcap® Index is completely reconstituted annually to ensure larger stocks do not distort the performance and characteristics of the true mid-cap opportunity set. The index is unmanaged, and it is not possible to invest directly in an index. |
| 7 | Small-cap stocks may be less liquid and subject to greater price volatility than large-cap stocks. |
| 8 | The Russell Microcap® Index measures the performance of the microcap segment of the U.S. equity market. Microcap stocks make up less than 3% of the U.S. equity market (by market cap) and consist of the smallest 1,000 securities in the small-cap Russell 2000® Index, plus the next 1,000 smallest eligible securities by market cap. The Russell Microcap® Index is constructed to provide a comprehensive and unbiased barometer for the microcap segment trading on national exchanges and is completely reconstituted annually to ensure new and growing equities are reflected and companies continue to reflect appropriate capitalization and value characteristics. The Russell Microcap® Index is unmanaged, and it is not possible to invest directly in an index. |
| 9 | The Russell 3000® Value Index measures the performance of the broad value segment of the U.S. equity value universe. It includes those Russell 3000® Index companies with lower price-to-book ratios and lower forecasted growth values. The Russell 3000® Value Index is constructed to provide a comprehensive, unbiased and stable barometer of the broad value market. The Russell 3000® Value Index is completely reconstituted annually to ensure new and growing equities are included and that the represented companies continue to reflect value characteristics. The index is unmanaged, and it is not possible to invest directly in an index. |
| 10 | The Russell 3000® Growth Index measures the performance of the broad growth segment of the U.S. equity universe. It includes those Russell 3000® Index companies with higher price-to-book ratios and higher forecasted growth values. The Russell 3000® Growth Index is constructed to provide a comprehensive, unbiased and stable barometer of the broad growth market. The Russell 3000® Growth Index is completely reconstituted annually to ensure new and growing equities are included and that the represented companies continue to reflect growth characteristics. The index is unmanaged, and it is not possible to invest directly in an index. |
| 11 | The Russell Microcap® Value Index measures the performance of the micro-cap value segment of the U.S. equity universe. It includes those Russell Microcap® Index companies with higher price-to-book ratios and lower forecasted growth values. The Russell Microcap® Value Index is constructed to provide a comprehensive, unbiased and stable barometer of the micro-cap value market. The Russell Microcap Value Index is completely reconstituted annually to ensure new and growing equities are included and that the represented companies continue to reflect value characteristics. The index is unmanaged, and it is not possible to invest directly in an index. |
| 12 | The Russell Microcap® Growth Index measures the performance of the microcap growth segment of the U.S. equity market. It includes Russell Microcap companies that are considered more growth oriented relative to the overall market as defined by Russell's leading style methodology. The Russell Microcap® Growth Index is constructed to provide a comprehensive and unbiased barometer for the microcap growth segment of the market. The Russell Microcap® Growth Index is completely reconstituted annually to ensure larger stocks do not distort performance and characteristics of the microcap opportunity set. The Russell Microcap® Growth Index is unmanaged, and it is not possible to invest directly in an index. |
Annual Shareholder Report
FUND PERFORMANCE AND GROWTH OF A $10,000 INVESTMENT
The graph below illustrates the hypothetical investment of $10,0001 in the Federated MDT Small Cap Core Fund2 from July 31, 2006 to July 31, 2016, compared to the Russell 2000® Index (R2000)3 and the Morningstar Small Blend Funds Average (MSBFA).4 The Average Annual Total Return table below shows returns for each class averaged over the stated periods.
Growth of a $10,000 INVESTMENT
Growth of $10,000 as of July 31, 2016

| Federated MDT Small Cap Core Fund - | Class C Shares | Institutional Shares | R2000 | MSBFA |
| F | F | I | I |
| 7/31/2006 | 10,000 | 10,000 | 10,000 | 10,000 |
| 7/31/2007 | 11,801 | 11,921 | 11,212 | 11,373 |
| 7/31/2008 | 9,598 | 9,785 | 10,459 | 10,121 |
| 7/31/2009 | 6,140 | 6,311 | 8,292 | 8,055 |
| 7/31/2010 | 6,995 | 7,262 | 9,820 | 9,554 |
| 7/31/2011 | 9,080 | 9,518 | 12,169 | 11,841 |
| 7/31/2012 | 8,686 | 9,204 | 12,192 | 11,688 |
| 7/31/2013 | 12,404 | 13,268 | 16,430 | 15,618 |
| 7/31/2014 | 13,547 | 14,639 | 17,837 | 17,161 |
| 7/31/2015 | 14,822 | 16,173 | 19,982 | 18,485 |
| 7/31/2016 | 15,877 | 17,505 | 19,982 | 18,593 |
41 graphic description end -->
| ■ | Total returns shown for Class C Shares include the maximum contingent deferred sales charge of 1.00% as applicable. |
The Fund offers multiple shares classes whose performance may be greater than or less than its other share class(es) due to differences in sales charges and expenses. See the Average Annual Total Returns table below for the returns of additional classes not shown in the line graph above.
Average Annual Total Returns for the Periods Ended 7/31/2016
(returns reflect all applicable sales charges and contingent deferred sales charges as specified below in footnote #1)
| | 1 Year | 5 Years | 10 Years |
| Class A Shares | 1.98% | 11.37% | 4.92% |
| Class C Shares | 6.17% | 11.83% | 4.73% |
| Institutional Shares | 8.24% | 12.96% | 5.76% |
| Class R6 Shares5 | 7.89% | 11.97% | 2.88% |
| R2000 | 0.00% | 10.43% | 7.17% |
| MSBFA | 0.43% | 9.43% | 6.77% |
Annual Shareholder Report
Performance data quoted represents past performance which is no guarantee of future results. Investment return and principal value will fluctuate so that an investor's shares, when redeemed, may be worth more or less than their original cost. Mutual fund performance changes over time and current performance may be lower or higher than what is stated. For current to the most recent month-end performance and after-tax returns, visit FederatedInvestors.com or call 1-800-341-7400. Returns shown do not reflect the deduction of taxes that a shareholder would pay on Fund distributions or the redemption of Fund shares. Mutual funds are not obligations of or guaranteed by any bank and are not federally insured.
| 1 | Represents a hypothetical investment of $10,000 in the Fund after deducting applicable sales charges: for Class A Shares, the maximum sales charge of 5.50% ($10,000 investment minus $550 sales charge = $9,450); for Class C Shares, a 1.00% contingent deferred sales charge would be applied on any redemption less than one year from the purchase date. The Fund's performance assumes the reinvestment of all dividends and distributions. The R2000 and MSBFA have been adjusted to reflect reinvestment of dividends on securities. |
| 2 | The Fund is the successor to MDT Small Cap Core Fund pursuant to a reorganization that took place on December 8, 2006. Prior to that date, the Fund had no investment operations. Accordingly, the performance information shown for periods prior to that date is that of the MDT Small Cap Core Fund. |
| 3 | The R2000 measures the performance of the small-cap segment of the U.S. equity universe. The R2000 is a subset of the Russell 3000® Index representing approximately 10% of the total market capitalization of that index. It includes approximately 2000 of the smallest securities based on a combination of their market cap and current index membership. The R2000 is constructed to provide a comprehensive and unbiased small-cap barometer and is completely reconstituted annually to ensure larger stocks do not distort the performance and characteristics of the true small-cap opportunity set. The R2000 is unmanaged and, unlike the Fund, is not affected by cash flows. It is not possible to invest directly in an index. The R2000 is not adjusted to reflect sales charges, expenses or other fees that the Securities and Exchange Commission requires to be reflected in the Fund's performance. |
| 4 | Morningstar figures represent the average of the total returns reported by all the mutual funds designated by Morningstar as falling into the respective category indicated. They do not reflect sales charges. |
| 5 | The Fund's R6 Class commenced operations on June 29, 2016. It is anticipated that this class will have the lowest net expenses of all outstanding share classes. For the period prior to the commencement of operations of the R6 class, the R6 class performance information shown is for the Institutional Share class, adjusted to reflect the expenses of the Fund's R6 class for each period for which the Fund's R6 class gross expenses would have exceeded the actual expense paid by the Fund's Institutional Share class. |
Annual Shareholder Report
Portfolio of Investments Summary Table (unaudited)
At July 31, 2016, the Fund's industry composition1 was as follows:
| Industry Composition | Percentage of
Total Net Assets |
| Regional Banks | 12.5% |
| Biotechnology | 4.8% |
| Financial Services | 4.1% |
| Semiconductor Manufacturing Equipment | 3.2% |
| Specialty Retailing | 3.1% |
| Miscellaneous Communications | 2.5% |
| Health Care Equipment & Supplies | 2.4% |
| Software Packaged/Custom | 2.4% |
| Entertainment | 2.3% |
| Electronic Equipment Instruments & Components | 2.2% |
| Auto Original Equipment Manufacturers | 2.1% |
| Miscellaneous Machinery | 2.0% |
| Airline—Regional | 1.8% |
| Dairy Products | 1.6% |
| Commodity Chemicals | 1.5% |
| Defense Aerospace | 1.5% |
| Home Products | 1.4% |
| Machinery | 1.4% |
| Mutual Fund Adviser | 1.4% |
| Personal Loans | 1.4% |
| Contracting | 1.3% |
| Internet & Catalog Retail | 1.3% |
| Internet Software & Services | 1.3% |
| Broadcasting | 1.2% |
| Computer Stores | 1.2% |
| Telecommunication Equipment & Services | 1.2% |
| Clothing Stores | 1.1% |
| Medical Supplies | 1.1% |
| Apparel | 1.0% |
| Furniture | 1.0% |
| Property Liability Insurance | 1.0% |
| Recreational Goods | 1.0% |
| Thrifts & Mortgage Finance | 1.0% |
| Truck Manufacturing | 1.0% |
Annual Shareholder Report
| Industry Composition | Percentage of
Total Net Assets |
| Undesignated Consumer Cyclicals | 1.0% |
| Other2 | 26.2% |
| Cash Equivalents3 | 2.0% |
| Other Assets and Liabilities—Net4 | (0.5) % |
| TOTAL | 100.0% |
| 1 | Except for Cash Equivalents and Other Assets and Liabilities, industry classifications are based upon, and individual portfolio securities are assigned to, the classifications of the Global Industry Classification Standard (GICS) except that the Adviser assigns a classification to securities not classified by the GICS and to securities for which the Adviser does not have access to the classification made by the GICS. |
| 2 | For purposes of this table, industry classifications which constitute less than 1.0% of the Fund's total net assets have been aggregated under the designation “Other.” |
| 3 | Cash Equivalents include any investments in money market mutual funds and/or overnight repurchase agreements. |
| 4 | Assets, other than investments in securities, less liabilities. See Statement of Assets and Liabilities. |
Annual Shareholder Report
Portfolio of Investments
July 31, 2016
| Shares | | | Value |
| | | COMMON STOCKS—98.5% | |
| | | Airline - Regional—1.8% | |
| 10,170 | 1 | Hawaiian Holdings, Inc. | $463,040 |
| 8,916 | | SkyWest, Inc. | 256,513 |
| | | TOTAL | 719,553 |
| | | Apparel—1.0% | |
| 15,155 | 1 | Express, Inc. | 226,719 |
| 10,773 | 1 | Iconix Brand Group, Inc. | 77,565 |
| 5,854 | 1 | Perry Ellis International, Inc. | 125,393 |
| | | TOTAL | 429,677 |
| | | Auto Original Equipment Manufacturers—2.1% | |
| 3,267 | 1 | American Axle & Manufacturing Holdings, Inc. | 56,878 |
| 7,192 | 1 | Cooper-Standard Holding, Inc. | 633,256 |
| 3,027 | 1 | Tenneco, Inc. | 171,086 |
| | | TOTAL | 861,220 |
| | | Biotechnology—4.8% | |
| 12,771 | 1 | Aegerion Pharmaceuticals, Inc. | 18,390 |
| 3,217 | 1 | Anika Therapeutics, Inc. | 160,593 |
| 13,386 | 1 | BioCryst Pharmaceuticals, Inc. | 48,457 |
| 45,674 | 1 | Celldex Therapeutics, Inc. | 211,014 |
| 3,297 | 1 | Esperion Therapeutics, Inc. | 35,805 |
| 6,094 | 1 | Five Prime Therapeutics, Inc. | 308,905 |
| 25,782 | 1 | INSYS Therapeutics, Inc. | 403,488 |
| 19,520 | 1 | NewLink Genetics Corp. | 206,522 |
| 5,646 | 1 | Osiris Therapeutics, Inc. | 28,230 |
| 148,018 | | PDL BioPharma, Inc. | 521,023 |
| 10,195 | 1 | Zafgen, Inc. | 30,993 |
| | | TOTAL | 1,973,420 |
| | | Broadcasting—1.2% | |
| 17,230 | | Sinclair Broadcast Group, Inc. | 479,339 |
| | | Clothing Stores—1.1% | |
| 22,811 | | American Eagle Outfitters, Inc. | 408,773 |
| 4,218 | 1 | Francesca's Holdings Corp. | 53,611 |
| | | TOTAL | 462,384 |
| | | Cogeneration—0.5% | |
| 9,622 | 1 | Headwaters, Inc. | 191,382 |
Annual Shareholder Report
| Shares | | | Value |
| | | COMMON STOCKS—continued | |
| | | Commodity Chemicals—1.5% | |
| 12,053 | | Trinseo SA | $600,119 |
| | | Computer Networking—0.8% | |
| 15,230 | | Black Box Corp. | 207,889 |
| 33,310 | 1 | Extreme Networks, Inc. | 129,576 |
| | | TOTAL | 337,465 |
| | | Computer Peripherals—0.4% | |
| 1,630 | 1 | Synaptics, Inc. | 84,678 |
| 9,572 | 1 | Zagg, Inc. | 60,591 |
| | | TOTAL | 145,269 |
| | | Computer Stores—1.2% | |
| 3,140 | 1 | Insight Enterprises, Inc. | 83,524 |
| 5,160 | 1 | PC Connections, Inc. | 133,180 |
| 3,711 | 1 | Tech Data Corp. | 289,198 |
| | | TOTAL | 505,902 |
| | | Construction Machinery—0.2% | |
| 4,641 | 1 | NCI Building System, Inc. | 75,277 |
| | | Consumer Durables & Apparel—0.5% | |
| 17,234 | 1 | GoPro, Inc. | 217,838 |
| | | Consumer Finance—0.6% | |
| 27,497 | 1 | Enova International, Inc. | 249,948 |
| | | Contracting—1.3% | |
| 7,092 | | Comfort Systems USA, Inc. | 215,455 |
| 32,440 | | Harsco Corp. | 317,588 |
| | | TOTAL | 533,043 |
| | | Crude Oil & Gas Production—0.8% | |
| 23,002 | | CVR Energy, Inc. | 340,430 |
| | | Dairy Products—1.6% | |
| 34,646 | | Dean Foods Co. | 639,565 |
| | | Defense Aerospace—1.5% | |
| 4,521 | 1 | Ducommun, Inc. | 87,436 |
| 4,849 | 1 | Esterline Technologies Corp. | 294,965 |
| 4,460 | 1 | MOOG, Inc., Class A | 245,612 |
| | | TOTAL | 628,013 |
| | | Diversified Leisure—0.5% | |
| 10,726 | 1 | Isle of Capri Casinos, Inc. | 200,898 |
| | | Electric & Electronic Original Equipment Manufacturers—0.2% | |
| 5,487 | | General Cable Corp. | 80,823 |
Annual Shareholder Report
| Shares | | | Value |
| | | COMMON STOCKS—continued | |
| | | Electronic Equipment Instruments & Components—2.2% | |
| 4,726 | | Belden, Inc. | $345,991 |
| 8,678 | 1 | Fabrinet | 327,681 |
| 9,013 | 1 | Sanmina Corp. | 228,389 |
| | | TOTAL | 902,061 |
| | | Electronic Instruments—0.4% | |
| 14,442 | 1 | Ixia | 166,083 |
| | | Electronic Test/Measuring Equipment—0.2% | |
| 7,185 | | Cohu, Inc. | 75,874 |
| | | Energy Equipment & Services—0.3% | |
| 10,433 | 1 | RigNet, Inc. | 124,674 |
| | | Entertainment—2.3% | |
| 59,724 | 1 | MSG Networks, Inc., Class A | 958,570 |
| | | Financial Services—4.1% | |
| 16,354 | 1 | Ambac Financial Group, Inc. | 297,316 |
| 8,441 | | Deluxe Corp. | 570,527 |
| 1,200 | | First Financial Corp. | 45,960 |
| 10,744 | | MainSource Financial Group, Inc. | 239,269 |
| 7,603 | | Nelnet, Inc., Class A | 307,237 |
| 7,974 | | Union Bankshares Corp. | 214,022 |
| | | TOTAL | 1,674,331 |
| | | Food & Staples Retailing—0.5% | |
| 6,392 | | SpartanNash Co. | 201,348 |
| | | Food Wholesaling—0.4% | |
| 5,023 | 1 | Omega Protein Corp. | 113,118 |
| 13,753 | 1 | SUPERVALU, Inc. | 67,115 |
| | | TOTAL | 180,233 |
| | | Furniture—1.0% | |
| 11,438 | | Ethan Allen Interiors, Inc. | 397,242 |
| | | Grocery Chain—0.3% | |
| 3,648 | | Ingles Markets, Inc., Class A | 141,652 |
| | | Health Care Equipment & Supplies—2.4% | |
| 13,357 | | LeMaitre Vascular, Inc. | 229,740 |
| 13,873 | 1 | Masimo Corp. | 734,853 |
| | | TOTAL | 964,593 |
| | | Health Care Providers & Services—0.4% | |
| 6,057 | 1 | PharMerica Corp. | 160,874 |
| | | Home Building—0.2% | |
| 6,424 | | KB HOME | 100,857 |
Annual Shareholder Report
| Shares | | | Value |
| | | COMMON STOCKS—continued | |
| | | Home Health Care—0.5% | |
| 13,498 | 1 | Cross Country Healthcare, Inc. | $197,341 |
| | | Home Products—1.4% | |
| 31,303 | | Libbey, Inc. | 585,053 |
| | | Hospitals—0.4% | |
| 13,039 | 1 | Community Health Systems, Inc. | 166,508 |
| | | Hotels Restaurants & Leisure—0.7% | |
| 4,000 | | Marriott Vacations Worldwide Corp. | 305,200 |
| | | Insurance—0.8% | |
| 11,321 | | Employers Holdings, Inc. | 322,875 |
| | | Insurance Brokerage—0.1% | |
| 3,034 | 1 | eHealth, Inc. | 28,975 |
| | | International Bank—0.2% | |
| 2,800 | | Preferred Bank Los Angeles, CA | 91,476 |
| | | Internet & Catalog Retail—1.3% | |
| 9,780 | 1 | FTD Companies, Inc. | 247,532 |
| 8,874 | 1 | RetailMeNot, Inc. | 74,098 |
| 14,470 | | Travelport Worldwide Ltd. | 195,200 |
| | | TOTAL | 516,830 |
| | | Internet Services—0.4% | |
| 21,830 | | EarthLink Network, Inc. | 148,007 |
| | | Internet Software & Services—1.3% | |
| 3,585 | 1 | Care.com, Inc. | 39,399 |
| 27,219 | 1 | Five9, Inc. | 343,232 |
| 3,147 | 1 | Gigamon, Inc. | 147,028 |
| | | TOTAL | 529,659 |
| | | Machinery—1.4% | |
| 10,042 | | Global Brass & Copper Holdings, Inc. | 284,389 |
| 55,219 | | Manitowoc, Inc. | 307,570 |
| | | TOTAL | 591,959 |
| | | Maritime—0.3% | |
| 28,386 | | DHT Maritime, Inc. | 132,279 |
| | | Media—Non-Cable - 0.9% | |
| 10,616 | | MDC Partners, Inc., Class A | 135,460 |
| 4,233 | | Nexstar Broadcasting Group, Inc., Class A | 213,978 |
| | | TOTAL | 349,438 |
| | | Medical Supplies—1.1% | |
| 9,786 | 1 | Orthofix International NV | 463,856 |
Annual Shareholder Report
| Shares | | | Value |
| | | COMMON STOCKS—continued | |
| | | Metals & Mining—0.7% | |
| 66,105 | 1 | Cloud Peak Energy, Inc. | $225,418 |
| 5,232 | 1 | Ryerson Holding Corp. | 75,550 |
| | | TOTAL | 300,968 |
| | | Mini-Mill Producer—0.8% | |
| 19,702 | | Commercial Metals Corp. | 325,871 |
| | | Miscellaneous Communications—2.5% | |
| 26,470 | 1 | FairPoint Communications, Inc. | 428,549 |
| 26,415 | | West Corp. | 584,036 |
| | | TOTAL | 1,012,585 |
| | | Miscellaneous Components—0.9% | |
| 18,067 | 1 | Nanometrics, Inc. | 362,063 |
| | | Miscellaneous Machinery—2.0% | |
| 13,731 | | Briggs & Stratton Corp. | 312,106 |
| 34,517 | 1 | SPX Corp. | 522,587 |
| | | TOTAL | 834,693 |
| | | Mortgage Banks—0.3% | |
| 4,723 | 1 | Altisource Portfolio Solutions S.A. | 109,857 |
| | | Multi-Industry Capital Goods—0.7% | |
| 6,273 | 1 | DXP Enterprises, Inc. | 104,383 |
| 4,289 | 1 | Lydall, Inc. | 191,632 |
| | | TOTAL | 296,015 |
| | | Mutual Fund Adviser—1.4% | |
| 30,758 | | Waddell & Reed Financial, Inc., Class A | 561,641 |
| | | Office Furniture—0.9% | |
| 15,045 | | Knoll, Inc. | 379,886 |
| | | Office Supplies—0.7% | |
| 23,915 | 1 | Acco Brands Corp. | 268,805 |
| | | Oil Gas & Consumable Fuels—0.2% | |
| 12,707 | | Teekay Corp. | 78,783 |
| | | Oil Refiner—0.1% | |
| 6,743 | | Alon USA Energy, Inc. | 47,673 |
| | | Oil Service, Explore & Drill—0.8% | |
| 39,203 | | Archrock, Inc. | 349,299 |
| | | Other Communications Equipment—0.9% | |
| 7,392 | 1 | Netgear, Inc. | 380,171 |
| | | Personal Loans—1.4% | |
| 56,346 | 1 | Ezcorp, Inc., Class A | 510,495 |
Annual Shareholder Report
| Shares | | | Value |
| | | COMMON STOCKS—continued | |
| | | Personal Loans—continued | |
| 1,734 | 1 | World Acceptance Corp. | $75,359 |
| | | TOTAL | 585,854 |
| | | Personnel Agency—0.5% | |
| 5,282 | 1 | AMN Healthcare Services, Inc. | 223,429 |
| | | Pharmaceuticals—0.5% | |
| 2,373 | 1 | ANI Pharmaceuticals, Inc. | 143,804 |
| 13,725 | 1 | Tetraphase Pharmaceuticals, Inc. | 55,174 |
| | | TOTAL | 198,978 |
| | | Photo-Optical Component-Equipment—0.9% | |
| 3,335 | 1 | Coherent, Inc. | 353,677 |
| | | Printing—0.5% | |
| 8,665 | | Quad Graphics, Inc. | 219,744 |
| | | Property Liability Insurance—1.0% | |
| 3,791 | | HCI Group, Inc. | 114,336 |
| 7,640 | | Heritage Insurance Holdings, Inc. | 94,660 |
| 9,419 | | Universal Insurance Holdings, Inc. | 204,769 |
| | | TOTAL | 413,765 |
| | | Recreational Goods—1.0% | |
| 6,042 | 1 | Scientific Games Holdings Corp. | 64,377 |
| 11,764 | 1 | Smith & Wesson Holding Corp. | 346,450 |
| | | TOTAL | 410,827 |
| | | Regional Banks—12.5% | |
| 1,364 | | 1st Source Corp. | 45,844 |
| 9,352 | | Bryn Mawr Bank Corp. | 274,294 |
| 1,719 | | CNB Financial Corp. | 31,716 |
| 5,759 | | Cathay Bancorp, Inc. | 172,655 |
| 26,614 | | CenterState Banks of Florida | 443,389 |
| 4,560 | | Central Pacific Financial Corp. | 111,857 |
| 4,013 | | Chemical Financial Corp. | 166,058 |
| 2,629 | | City Holding Co. | 122,774 |
| 9,017 | | Community Trust Bancorp, Inc. | 313,611 |
| 17,149 | | Enterprise Financial Services Corp. | 493,205 |
| 1,070 | | Financial Institutions, Inc. | 28,783 |
| 19,248 | 1 | First BanCorp | 88,348 |
| 5,502 | | First Business Financial Services, Inc. | 130,452 |
| 10,548 | | Flushing Financial Corp. | 235,326 |
| 4,674 | | Great Southern Bancorp, Inc. | 183,221 |
| 9,195 | | Great Western Bancorp, Inc. | 304,998 |
Annual Shareholder Report
| Shares | | | Value |
| | | COMMON STOCKS—continued | |
| | | Regional Banks—continued | |
| 7,681 | | Heartland Financial USA, Inc. | $282,046 |
| 1,334 | | Iberiabank Corp. | 83,335 |
| 9,190 | | Lakeland Bancorp, Inc. | 109,453 |
| 8,881 | | Mercantile Bancorporation, Inc. | 223,624 |
| 4,200 | | MidSouth Bancorp, Inc. | 44,142 |
| 18,604 | | OFG Bancorp. | 197,389 |
| 11,878 | | Old National Bancorp | 156,315 |
| 3,460 | | Peoples Bancorp, Inc. | 77,677 |
| 8,193 | | QCR Holdings, Inc. | 242,841 |
| 1,936 | | Sandy Spring Bancorp, Inc. | 57,770 |
| 5,238 | | TriCo Bancshares | 136,293 |
| 3,362 | | UMB Financial Corp. | 186,288 |
| 3,394 | | Wintrust Financial Corp. | 179,203 |
| | | TOTAL | 5,122,907 |
| | | Rubber—0.9% | |
| 11,657 | | Cooper Tire & Rubber Co. | 384,564 |
| | | Savings & Loan—0.6% | |
| 5,437 | | First Defiance Financial Corp. | 226,669 |
| | | Securities Brokerage—0.3% | |
| 3,250 | 1 | Piper Jaffray Cos., Inc. | 134,355 |
| | | Semiconductor Manufacturing Equipment—3.2% | |
| 8,219 | 1 | Advanced Energy Industries, Inc. | 334,677 |
| 12,699 | 1 | Alpha & Omega Semiconductor Ltd. | 181,469 |
| 20,444 | | Mentor Graphics Corp. | 436,684 |
| 12,924 | 1 | Photronics, Inc. | 124,846 |
| 6,795 | | Tessera Technologies, Inc. | 218,391 |
| | | TOTAL | 1,296,067 |
| | | Semiconductors & Semiconductor Equipment—0.5% | |
| 15,524 | 1 | Advanced Micro Devices, Inc. | 106,495 |
| 6,558 | 1 | NeoPhotonics Corp. | 82,303 |
| | | TOTAL | 188,798 |
| | | Services to Medical Professionals—0.7% | |
| 5,037 | 1 | WebMD Health Corp., Class A | 307,307 |
| | | Software & Services—0.2% | |
| 5,464 | 1 | 8x8, Inc. | 75,130 |
| | | Software Packaged/Custom—2.4% | |
| 4,757 | | Ebix, Inc. | 253,643 |
| 3,841 | 1 | Ellie Mae, Inc. | 353,795 |
Annual Shareholder Report
| Shares | | | Value |
| | | COMMON STOCKS—continued | |
| | | Software Packaged/Custom—continued | |
| 1,024 | 1 | Proofpoint, Inc. | $77,691 |
| 8,649 | 1 | Verint Systems, Inc. | 305,050 |
| | | TOTAL | 990,179 |
| | | Specialty Chemicals—0.4% | |
| 5,779 | | KMG Chemicals, Inc. | 158,865 |
| | | Specialty Retailing—3.1% | |
| 7,920 | 1 | Build-A-Bear Workshop, Inc. | 107,950 |
| 5,064 | | GNC Holdings, Inc. | 103,356 |
| 11,957 | 1 | Office Depot, Inc. | 41,371 |
| 2,738 | | Outerwall, Inc. | 144,183 |
| 33,181 | | Pier 1 Imports, Inc. | 169,887 |
| 12,016 | 1 | Restoration Hardware, Inc. | 370,213 |
| 22,908 | | Tailored Brands, Inc. | 335,602 |
| | | TOTAL | 1,272,562 |
| | | Technology Hardware Storage & Peripherals—0.1% | |
| 8,616 | | CPI Card Group, Inc. | 40,667 |
| | | Telecommunication Equipment & Services—1.2% | |
| 2,548 | 1 | Dycom Industries, Inc. | 239,640 |
| 5,403 | 1 | Ubiquiti Networks, Inc. | 241,622 |
| | | TOTAL | 481,262 |
| | | Telecommunication Services—0.5% | |
| 91,191 | 1 | Intelsat SA | 209,739 |
| | | Thrifts & Mortgage Finance—1.0% | |
| 16,301 | | Dime Community Bancorp, Inc. | 282,007 |
| 2,204 | | Meta Financial Group, Inc. | 120,537 |
| | | TOTAL | 402,544 |
| | | Toys & Games—0.2% | |
| 7,468 | 1 | JAKKS Pacific, Inc. | 68,855 |
| | | Truck Manufacturing—1.0% | |
| 27,272 | 1 | Wabash National Corp. | 394,899 |
| | | Undesignated Consumer Cyclicals—1.0% | |
| 7,983 | | DeVry Education Group, Inc. | 177,782 |
| 20,623 | | Rent-A-Center, Inc. | 222,728 |
| | | TOTAL | 400,510 |
| | | Undesignated Consumer Staples—0.9% | |
| 10,536 | | Medifast, Inc. | 371,078 |
| | | TOTAL COMMON STOCKS
(IDENTIFIED COST $37,443,473) | 40,390,954 |
Annual Shareholder Report
| Shares | | | Value |
| | | INVESTMENT COMPANY—2.0% | |
| 803,721 | 2 | Federated Institutional Prime Value Obligations Fund, Institutional Shares, 0.36%3
(IDENTIFIED COST $803,721) | $803,721 |
| | | TOTAL INVESTMENTS—100.5%
(IDENTIFIED COST $38,247,194)4 | 41,194,675 |
| | | OTHER ASSETS AND LIABILITIES - NET—(0.5)%5 | (207,802) |
| | | TOTAL NET ASSETS—100% | $40,986,873 |
| 1 | Non-income-producing security. |
| 2 | Affiliated holding. |
| 3 | 7-day net yield. |
| 4 | The cost of investments for federal tax purposes amounts to $38,404,613. |
| 5 | Assets, other than investments in securities, less liabilities. See Statement of Assets and Liabilities. |
Note: The categories of investments are shown as a percentage of total net assets at July 31, 2016.
Various inputs are used in determining the value of the Fund's investments. These inputs are summarized in the three broad levels listed below:
Level 1—quoted prices in active markets for identical securities.
Level 2—other significant observable inputs (including quoted prices for similar securities, interest rates, prepayment speeds, credit risk, etc.). Also includes securities valued at amortized cost.
Level 3—significant unobservable inputs (including the Fund's own assumptions in determining the fair value of investments).
The inputs or methodology used for valuing securities are not an indication of the risk associated with investing in those securities.
As of July 31, 2016, all investments of the Fund utilized Level 1 inputs in valuing the Fund's assets carried at fair value.
See Notes which are an integral part of the Financial Statements
Annual Shareholder Report
Financial Highlights–Class A Shares
(For a Share Outstanding Throughout Each Period)
| Year Ended July 31 | 2016 | 2015 | 2014 | 2013 | 2012 |
| Net Asset Value, Beginning of Period | $15.66 | $15.07 | $13.70 | $9.52 | $9.88 |
| Income From Investment Operations: | | | | | |
| Net investment income (loss) | 0.031 | (0.05)1 | (0.12)1 | (0.01)1 | (0.06)1 |
| Net realized and unrealized gain (loss) on investments | 1.02 | 1.57 | 1.49 | 4.19 | (0.30) |
| TOTAL FROM INVESTMENT OPERATIONS | 1.05 | 1.52 | 1.37 | 4.18 | (0.36) |
| Less Distributions: | | | | | |
| Distributions from net realized gain on investments | (1.63) | (0.93) | — | — | — |
| Net Asset Value, End of Period | $15.08 | $15.66 | $15.07 | $13.70 | $9.52 |
| Total Return2 | 7.90% | 10.22% | 10.00% | 43.91% | (3.64)% |
| Ratios to Average Net Assets: | | | | | |
| Net expenses | 1.13% | 1.48% | 1.70% | 1.70% | 1.71% |
| Net investment income (loss) | 0.19% | (0.35)% | (0.77)% | (0.05)% | (0.65)% |
| Expense waiver/reimbursement3 | 1.10% | 0.76% | 0.52% | 1.09% | 4.24% |
| Supplemental Data: | | | | | |
| Net assets, end of period (000 omitted) | $13,035 | $7,160 | $5,346 | $3,694 | $2,550 |
| Portfolio turnover | 189% | 166% | 174% | 184% | 200% |
| 1 | Per share numbers have been calculated using the average shares method. |
| 2 | Based on net asset value, which does not reflect the sales charge, redemption fee or contingent deferred sales charge, if applicable. |
| 3 | This expense decrease is reflected in both the net expense and the net investment income (loss) ratios shown above. |
See Notes which are an integral part of the Financial Statements
Annual Shareholder Report
Financial Highlights–Class C Shares
(For a Share Outstanding Throughout Each Period)
| Year Ended July 31 | 2016 | 2015 | 2014 | 2013 | 2012 |
| Net Asset Value, Beginning of Period | $14.48 | $14.10 | $12.91 | $9.04 | $9.45 |
| Income From Investment Operations: | | | | | |
| Net investment income (loss) | (0.07)1 | (0.16)1 | (0.21)1 | (0.09)1 | (0.12)1 |
| Net realized and unrealized gain (loss) on investments | 0.92 | 1.47 | 1.40 | 3.96 | (0.29) |
| TOTAL FROM INVESTMENT OPERATIONS | 0.85 | 1.31 | 1.19 | 3.87 | (0.41) |
| Less Distributions: | | | | | |
| Distributions from net realized gain on investments | (1.63) | (0.93) | — | — | — |
| Net Asset Value, End of Period | $13.70 | $14.48 | $14.10 | $12.91 | $9.04 |
| Total Return2 | 7.12% | 9.41% | 9.22% | 42.81% | (4.34)% |
| Ratios to Average Net Assets: | | | | | |
| Net expenses | 1.88% | 2.28% | 2.45% | 2.45% | 2.46% |
| Net investment income (loss) | (0.56)% | (1.11)% | (1.50)% | (0.81)% | (1.41)% |
| Expense waiver/reimbursement3 | 1.11% | 0.72% | 0.54% | 1.11% | 4.24% |
| Supplemental Data: | | | | | |
| Net assets, end of period (000 omitted) | $3,422 | $3,031 | $3,338 | $2,636 | $2,358 |
| Portfolio turnover | 189% | 166% | 174% | 184% | 200% |
| 1 | Per share numbers have been calculated using the average shares method. |
| 2 | Based on net asset value, which does not reflect the sales charge, redemption fee or contingent deferred sales charge, if applicable. |
| 3 | This expense decrease is reflected in both the net expense and the net investment income (loss) ratios shown above. |
See Notes which are an integral part of the Financial Statements
Annual Shareholder Report
Financial Highlights–Institutional Shares
(For a Share Outstanding Throughout Each Period)
| Year Ended July 31 | 2016 | 2015 | 2014 | 2013 | 2012 |
| Net Asset Value, Beginning of Period | $16.04 | $15.38 | $13.94 | $9.67 | $10.00 |
| Income From Investment Operations: | | | | | |
| Net investment income (loss) | 0.061 | (0.02)1 | (0.08)1 | 0.031 | (0.04)1 |
| Net realized and unrealized gain (loss) on investments | 1.07 | 1.61 | 1.52 | 4.24 | (0.29) |
| TOTAL FROM INVESTMENT OPERATIONS | 1.13 | 1.59 | 1.44 | 4.27 | (0.33) |
| Less Distributions: | | | | | |
| Distributions from net realized gain on investments | (1.63) | (0.93) | — | — | — |
| Net Asset Value, End of Period | $15.54 | $16.04 | $15.38 | $13.94 | $9.67 |
| Total Return2 | 8.24% | 10.48% | 10.33% | 44.16% | (3.30)% |
| Ratios to Average Net Assets: | | | | | |
| Net expenses | 0.88% | 1.26% | 1.45% | 1.45% | 1.46% |
| Net investment income (loss) | 0.43% | (0.11)% | (0.51)% | 0.23% | (0.44)% |
| Expense waiver/reimbursement3 | 1.11% | 0.74% | 0.52% | 1.10% | 3.77% |
| Supplemental Data: | | | | | |
| Net assets, end of period (000 omitted) | $24,529 | $20,504 | $21,486 | $14,084 | $11,650 |
| Portfolio turnover | 189% | 166% | 174% | 184% | 200% |
| 1 | Per share numbers have been calculated using the average shares method. |
| 2 | Based on net asset value. |
| 3 | This expense decrease is reflected in both the net expense and the net investment income (loss) ratios shown above. |
See Notes which are an integral part of the Financial Statements
Annual Shareholder Report
Financial Highlights–Class R6 Shares
(For a Share Outstanding Throughout the Period)
| | Period
Ended
7/31/20161 |
| Net Asset Value, Beginning of Period | $13.88 |
| Income From Investment Operations: | |
| Net investment income (loss) | (0.01)2 |
| Net realized and unrealized gain on investments | 1.67 |
| TOTAL FROM INVESTMENT OPERATIONS | 1.66 |
| Net Asset Value, End of Period | $15.54 |
| Total Return3 | 11.96% |
| Ratios to Average Net Assets: | |
| Net expenses | 0.87%4 |
| Net investment income (loss) | (0.04)%4 |
| Expense waiver/reimbursement5 | 0.97%4 |
| Supplemental Data: | |
| Net assets, end of period (000 omitted) | $06 |
| Portfolio turnover | 189%7 |
| 1 | Reflects operations for the period from June 29, 2016 (date of initial investment) to July 31, 2016. |
| 2 | Per share number has been calculated using the average shares method. |
| 3 | Based on net asset value. Total returns for periods of less than one year are not annualized. |
| 4 | Computed on an annualized basis. |
| 5 | This expense decrease is reflected in both the net expense and the net investment income (loss) ratios shown above. |
| 6 | Represents less than $1,000. |
| 7 | Portfolio turnover is calculated at the Fund level. Percentage indicated was calculated for the year ended July 31, 2016. |
See Notes which are an integral part of the Financial Statements
Annual Shareholder Report
Statement of Assets and Liabilities
July 31, 2016
| Assets: | | |
| Total investment in securities, at value including $803,721 of investment in an affiliated holding (Note 5) (identified cost $38,247,194) | | $41,194,675 |
| Income receivable | | 19,640 |
| Receivable for investments sold | | 632,603 |
| Receivable for shares sold | | 65,662 |
| TOTAL ASSETS | | 41,912,580 |
| Liabilities: | | |
| Payable for investments purchased | $610,165 | |
| Payable for shares redeemed | 225,979 | |
| Payable to adviser (Note 5) | 499 | |
| Payable for administrative fee (Note 5) | 264 | |
| Payable for auditing fees | 24,800 | |
| Payable for distribution services fee (Note 5) | 2,093 | |
| Payable for other service fees (Notes 2 and 5) | 7,666 | |
| Payable for share registration costs | 29,440 | |
| Accrued expenses (Note 5) | 24,801 | |
| TOTAL LIABILITIES | | 925,707 |
| Net assets for 2,692,928.205 shares outstanding | | $40,986,873 |
| Net Assets Consist of: | | |
| Paid-in capital | | $38,982,273 |
| Net unrealized appreciation of investments | | 2,947,481 |
| Accumulated net realized loss on investments | | (942,881) |
| TOTAL NET ASSETS | | $40,986,873 |
Annual Shareholder Report
Statement of Assets and Liabilities–continued
| Net Asset Value, Offering Price and Redemption Proceeds Per Share | | |
| Class A Shares: | | |
| Net asset value per share ($13,035,341 ÷ 864,264 shares outstanding), no par value, unlimited shares authorized | | $15.08 |
| Offering price per share (100/94.50 of $15.08) | | $15.96 |
| Redemption proceeds per share | | $15.08 |
| Class C Shares: | | |
| Net asset value per share ($3,422,304 ÷ 249,811 shares outstanding), no par value, unlimited shares authorized | | $13.70 |
| Offering price per share | | $13.70 |
| Redemption proceeds per share (99.00/100 of $13.70) | | $13.56 |
| Institutional Shares: | | |
| Net asset value per share ($24,529,116 ÷ 1,578,846 shares outstanding), no par value, unlimited shares authorized | | $15.54 |
| Offering price per share | | $15.54 |
| Redemption proceeds per share | | $15.54 |
| Class R6 Shares: | | |
| Net asset value per share ($112 ÷ 7.205 shares outstanding), no par value, unlimited shares authorized | | $15.54 |
| Offering price per share | | $15.54 |
| Redemption proceeds per share | | $15.54 |
See Notes which are an integral part of the Financial Statements
Annual Shareholder Report
Statement of Operations
Year Ended July 31, 2016
| Investment Income: | | | |
| Dividends (including $2,330 received from an affiliated holding (Note 5) and net of foreign taxes withheld of $1,454) | | | $420,351 |
| Expenses: | | | |
| Investment adviser fee (Note 5) | | $357,108 | |
| Administrative fee (Note 5) | | 24,921 | |
| Custodian fees | | 23,095 | |
| Transfer agent fee (Note 2) | | 41,847 | |
| Directors'/Trustees' fees (Note 5) | | 1,797 | |
| Auditing fees | | 26,550 | |
| Legal fees | | 8,734 | |
| Portfolio accounting fees | | 65,535 | |
| Distribution services fee (Note 5) | | 22,216 | |
| Other service fees (Notes 2 and 5) | | 29,586 | |
| Share registration costs | | 55,464 | |
| Printing and postage | | 18,620 | |
| Miscellaneous (Note 5) | | 10,434 | |
| TOTAL EXPENSES | | 685,907 | |
| Waiver and Reimbursements: | | | |
| Waiver/reimbursement of investment adviser fee (Note 5) | $(350,146) | | |
| Reimbursements of other operating expenses (Notes 2 and 5) | (2,057) | | |
| TOTAL WAIVER AND REIMBURSEMENTS | | (352,203) | |
| Net expenses | | | 333,704 |
| Net investment income | | | 86,647 |
| Realized and Unrealized Gain on Investments: | | | |
| Net realized gain on investments | | | 238,839 |
| Net change in unrealized appreciation of investments | | | 2,534,704 |
| Net realized and unrealized gain on investments | | | 2,773,543 |
| Change in net assets resulting from operations | | | $2,860,190 |
See Notes which are an integral part of the Financial Statements
Annual Shareholder Report
Statement of Changes in Net Assets
| Year Ended July 31 | 2016 | 2015 |
| Increase (Decrease) in Net Assets | | |
| Operations: | | |
| Net investment income (loss) | $86,647 | $(79,268) |
| Net realized gain on investments | 238,839 | 3,442,659 |
| Net change in unrealized appreciation/depreciation of investments | 2,534,704 | (418,792) |
| CHANGE IN NET ASSETS RESULTING FROM OPERATIONS | 2,860,190 | 2,944,599 |
| Distributions to Shareholders: | | |
| Distributions from net investment income | | |
| Class A Shares | (24,130) | — |
| Class C Shares | (8,056) | — |
| Institutional Shares | (54,461) | — |
| Distributions from net realized gain on investments | | |
| Class A Shares | (899,981) | (330,893) |
| Class C Shares | (346,517) | (208,105) |
| Institutional Shares | (2,022,825) | (1,153,048) |
| CHANGE IN NET ASSETS RESULTING FROM DISTRIBUTIONS TO SHAREHOLDERS | (3,355,970) | (1,692,046) |
| Share Transactions: | | |
| Proceeds from sale of shares | 18,430,305 | 6,991,073 |
| Net asset value of shares issued to shareholders in payment of distributions declared | 3,230,590 | 1,610,014 |
| Cost of shares redeemed | (10,873,114) | (9,329,278) |
| CHANGE IN NET ASSETS RESULTING FROM SHARE TRANSACTIONS | 10,787,781 | (728,191) |
| Change in net assets | 10,292,001 | 524,362 |
| Net Assets: | | |
| Beginning of period | 30,694,872 | 30,170,510 |
| End of period (including undistributed net investment income of $0 and $0, respectively) | $40,986,873 | $30,694,872 |
See Notes which are an integral part of the Financial Statements
Annual Shareholder Report
Notes to Financial Statements
July 31, 2016
1. ORGANIZATION
Federated MDT Series (the “Trust”) is registered under the Investment Company Act of 1940, as amended (the “Act”), as an open-end management investment company. The Trust consists of five portfolios. The financial statements included herein are only those of Federated MDT Small Cap Core Fund (the “Fund”), a diversified portfolio. The financial statements of the other portfolios are presented separately. The assets of each portfolio are segregated and a shareholder's interest is limited to the portfolio in which shares are held. Each portfolio pays its own expenses. The Fund offers four classes of shares: Class A Shares, Class C Shares, Institutional Shares and Class R6 Shares. All shares of the Fund have equal rights with respect to voting, except on class-specific matters. The investment objective of the Fund is long-term capital appreciation.
The Fund commenced offering Class R6 Shares on June 29, 2016.
2. SIGNIFICANT ACCOUNTING POLICIES
The following is a summary of significant accounting policies consistently followed by the Fund in the preparation of its financial statements. These policies are in conformity with U.S. generally accepted accounting principles (GAAP).
Investment Valuation
In calculating its net asset value (NAV), the Fund generally values investments as follows:
| ■ | Equity securities listed on an exchange or traded through a regulated market system are valued at their last reported sale price or official closing price in their principal exchange or market. |
| ■ | Shares of other mutual funds or non-exchange-traded investment companies are valued based upon their reported NAVs. |
| ■ | Fixed-income securities acquired with remaining maturities greater than 60 days are fair valued using price evaluations provided by a pricing service approved by the Fund's Board of Trustees (the “Trustees”). |
| ■ | Fixed-income securities and repurchase agreements acquired with remaining maturities of 60 days or less are valued at their cost (adjusted for the accretion of any discount or amortization of any premium), unless the issuer's creditworthiness is impaired or other factors indicate that amortized cost is not an accurate estimate of the investment's fair value, in which case it would be valued in the same manner as a longer-term security. |
| ■ | Derivative contracts listed on exchanges are valued at their reported settlement or closing price, except that options are valued at the mean of closing bid and asked quotations. |
| ■ | Over-the-counter (OTC) derivative contracts are fair valued using price evaluations provided by a pricing service approved by the Trustees. |
| ■ | For securities that are fair valued in accordance with procedures established by and under the general supervision of the Trustees, certain factors may be considered such as: the last traded or purchase price of the security, information obtained by contacting the issuer or dealers, analysis of the issuer's financial statements or other available documents, fundamental analytical data, the nature and duration of restrictions on disposition, the movement of the market in which the security is normally traded, public trading in similar securities or derivative contracts of the issuer or comparable issuers, movement of a relevant index, or other factors including but not limited to industry changes and relevant government actions. |
Annual Shareholder Report
If any price, quotation, price evaluation or other pricing source is not readily available when the NAV is calculated, or if the Fund cannot obtain price evaluations from a pricing service or from more than one dealer for an investment within a reasonable period of time as set forth in the Fund's valuation policies and procedures, the Fund uses the fair value of the investment determined in accordance with the procedures described below. There can be no assurance that the Fund could obtain the fair value assigned to an investment if it sold the investment at approximately the time at which the Fund determines its NAV per share.
Fair Valuation Procedures
The Trustees have ultimate responsibility for determining the fair value of investments for which market quotations are not readily available. The Trustees have appointed a valuation committee (“Valuation Committee”) comprised of officers of the Fund, Federated MDTA LLC (“Adviser”) and certain of the Adviser's affiliated companies to assist in determining fair value and in overseeing the calculation of the NAV. The Trustees have also authorized the use of pricing services recommended by the Valuation Committee to provide fair value evaluations of the current value of certain investments for purposes of calculating the NAV. The Valuation Committee employs various methods for reviewing third-party pricing-service evaluations including periodic reviews of third-party pricing services' policies, procedures and valuation methods (including key inputs, methods, models and assumptions), transactional back-testing, comparisons of evaluations of different pricing services and review of price challenges by the Adviser based on recent market activity. In the event that market quotations and price evaluations are not available for an investment, the Valuation Committee determines the fair value of the investment in accordance with procedures adopted by the Trustees. The Trustees periodically review and approve the fair valuations made by the Valuation Committee and any changes made to the procedures.
Factors considered by pricing services in evaluating an investment include the yields or prices of investments of comparable quality, coupon, maturity, call rights and other potential prepayments, terms and type, reported transactions, indications as to values from dealers and general market conditions. Some pricing services provide a single price evaluation reflecting the bid-side of the market for an investment (a “bid” evaluation). Other pricing services offer both bid evaluations and price evaluations indicative of a price between the prices bid and asked for the investment (a “mid” evaluation). The Fund normally uses bid evaluations for any U.S. Treasury and Agency securities, mortgage-backed securities and municipal securities. The Fund normally uses mid evaluations for any other types of fixed-income securities and any OTC derivative contracts. In the event that market quotations and price evaluations are not available for an investment, the fair value of the investment is determined in accordance with procedures adopted by the Trustees.
Repurchase Agreements
The Fund may invest in repurchase agreements for short-term liquidity purposes. It is the policy of the Fund to require the other party to a repurchase agreement to transfer to the Fund's custodian or sub-custodian eligible securities or cash with a market value (after transaction costs) at least equal to the repurchase price to be paid under the repurchase agreement. The eligible securities are transferred to accounts with the custodian or sub-custodian in which the Fund holds a “securities entitlement” and exercises “control” as those terms are defined in the Uniform Commercial Code. The Fund has established procedures for monitoring the market value of the transferred securities and requiring the transfer of
Annual Shareholder Report
additional eligible securities if necessary to equal at least the repurchase price. These procedures also allow the other party to require securities to be transferred from the account to the extent that their market value exceeds the repurchase price or in exchange for other eligible securities of equivalent market value.
The insolvency of the other party or other failure to repurchase the securities may delay the disposition of the underlying securities or cause the Fund to receive less than the full repurchase price. Under the terms of the repurchase agreement, any amounts received by the Fund in excess of the repurchase price and related transaction costs must be remitted to the other party.
The Fund may enter into repurchase agreements in which eligible securities are transferred into joint trading accounts maintained by the custodian or sub-custodian for investment companies and other clients advised by the Fund's Adviser and its affiliates. The Fund will participate on a pro rata basis with the other investment companies and clients in its share of the securities transferred under such repurchase agreements and in its share of proceeds from any repurchase or other disposition of such securities.
Investment Income, Gains and Losses, Expenses and Distributions
Investment transactions are accounted for on a trade-date basis. Realized gains and losses from investment transactions are recorded on an identified-cost basis. Interest income and expenses are accrued daily. Dividend income and distributions to shareholders are recorded on the ex-dividend date. Foreign dividends are recorded on the ex-dividend date or when the Fund is informed of the ex-dividend date. Distributions of net investment income, if any, are declared and paid annually. Non-cash dividends included in dividend income, if any, are recorded at fair value. Investment income, realized and unrealized gains and losses and certain fund-level expenses are allocated to each class based on relative average daily net assets, except that Class A Shares, Class C Shares, Institutional Shares and Class R6 Shares may bear distribution services fees, other service fees and transfer agent fees unique to those classes. The detail of the total fund expense waiver and reimbursements of $352,203 is disclosed in various locations in this Note 2 and Note 5. For the year ended July 31, 2016, transfer agent fees for the Fund were as follows:
| | Transfer
Agent Fees
Incurred | Transfer
Agent Fees
Reimbursed |
| Class A Shares | $11,743 | $(831) |
| Class C Shares | 4,081 | (335) |
| Institutional Shares | 26,023 | (876) |
| TOTAL | $41,847 | $(2,042) |
Dividends are declared separately for each class. No class has preferential dividend rights; differences in per share dividend rates are generally due to differences in separate class expenses.
Annual Shareholder Report
Other Service Fees
The Fund may pay other service fees up to 0.25% of the average daily net assets of the Fund's Class A Shares and Class C Shares to unaffiliated financial intermediaries or to Federated Shareholder Services Company (FSSC) for providing services to shareholders and maintaining shareholder accounts. Subject to the terms described in the Expense Limitation note, FSSC may voluntarily reimburse the Fund for other service fees. For the year ended July 31, 2016, other service fees for the Fund were as follows:
| | Other
Service Fees
Incurred | Other
Service Fees
Reimbursed |
| Class A Shares | $22,181 | $(15) |
| Class C Shares | $7,405 | $— |
| TOTAL | $29,586 | $(15) |
Premium and Discount Amortization
All premiums and discounts on fixed-income securities are amortized/accreted using the effective-interest-rate method.
Federal Taxes
It is the Fund's policy to comply with the Subchapter M provision of the Internal Revenue Code (the “Code”) and to distribute to shareholders each year substantially all of its income. Accordingly, no provision for federal income tax is necessary. As of and during the year ended July 31, 2016, the Fund did not have a liability for any uncertain tax positions. The Fund recognizes interest and penalties, if any, related to tax liabilities as income tax expense in the Statement of Operations. As of July 31, 2016, tax years 2013 through 2016 remain subject to examination by the Fund's major tax jurisdictions, which include the United States of America and the Commonwealth of Massachusetts.
The Fund may be subject to taxes imposed by governments of countries in which it invests. Such taxes are generally based on either income or gains earned or repatriated. The Fund accrues and applies such taxes to net investment income, net realized gains and net unrealized gains as income and/or gains are earned.
When-Issued and Delayed-Delivery Transactions
The Fund may engage in when-issued or delayed-delivery transactions. The Fund records when-issued securities on the trade date and maintains security positions such that sufficient liquid assets will be available to make payment for the securities purchased. Securities purchased on a when-issued or delayed-delivery basis are marked to market daily and begin earning interest on the settlement date. Losses may occur on these transactions due to changes in market conditions or the failure of counterparties to perform under the contract.
Other
The preparation of financial statements in conformity with GAAP requires management to make estimates and assumptions that affect the amounts of assets, liabilities, expenses and revenues reported in the financial statements. Actual results could differ from those estimated. The Fund applies Investment Company accounting and reporting guidance.
Annual Shareholder Report
3. SHARES OF BENEFICIAL INTEREST
The following tables summarize share activity:
| Year Ended July 31 | 2016 | 2015 |
| Class A Shares: | Shares | Amount | Shares | Amount |
| Shares sold | 499,161 | $7,058,133 | 195,981 | $3,035,389 |
| Shares issued to shareholders in payment of distributions declared | 67,053 | 904,542 | 20,829 | 317,649 |
| Shares redeemed | (159,177) | (2,155,066) | (114,348) | (1,754,885) |
NET CHANGE RESULTING FROM
CLASS A SHARE TRANSACTIONS | 407,037 | $5,807,609 | 102,462 | $1,598,153 |
| Year Ended July 31 | 2016 | 2015 |
| Class C Shares: | Shares | Amount | Shares | Amount |
| Shares sold | 87,018 | $1,153,452 | 42,094 | $604,168 |
| Shares issued to shareholders in payment of distributions declared | 22,980 | 282,655 | 11,327 | 160,392 |
| Shares redeemed | (69,504) | (901,369) | (80,851) | (1,175,191) |
NET CHANGE RESULTING FROM
CLASS C SHARE TRANSACTIONS | 40,494 | $534,738 | (27,430) | $(410,631) |
| Year Ended July 31 | 2016 | 2015 |
| Institutional Shares: | Shares | Amount | Shares | Amount |
| Shares sold | 705,662 | $10,218,620 | 212,197 | $3,351,516 |
| Shares issued to shareholders in payment of distributions declared | 147,325 | 2,043,393 | 72,562 | 1,131,973 |
| Shares redeemed | (552,221) | (7,816,679) | (403,797) | (6,399,202) |
| NET CHANGE RESULTING FROM INSTITUTIONAL SHARE TRANSACTIONS | 300,766 | $4,445,334 | (119,038) | $(1,915,713) |
| | Period Ended
7/31/20161 | Year Ended
7/31/2015 |
| Class R6 Shares: | Shares | Amount | Shares | Amount |
| Shares sold | 7.205 | $100 | — | $— |
| Shares issued to shareholders in payment of distributions declared | — | — | — | — |
| Shares redeemed | (—) | (—) | — | — |
NET CHANGE RESULTING FROM
CLASS R6 SHARE TRANSACTIONS | 7.205 | $100 | — | $— |
NET CHANGE RESULTING FROM
TOTAL FUND SHARE TRANSACTIONS | 748,304.205 | $10,787,781 | (44,006) | $(728,191) |
| 1 | Reflects operations for the period from June 29, 2016 (date of initial investment) to July 31, 2016. |
Annual Shareholder Report
4. FEDERAL TAX INFORMATION
The timing and character of income and capital gain distributions are determined in accordance with income tax regulations, which may differ from GAAP. These differences are due to differing treatments for excise tax distributions.
For the year ended July 31, 2016, permanent differences identified and reclassified among the components of net assets were as follows:
| Increase (Decrease) |
| Paid-In Capital | Accumulated
Net Realized
Gain (Loss) |
| $(2,490,796) | $2,490,796 |
Net investment income (loss), net realized gains (losses) and net assets were not affected by this reclassification.
The tax character of distributions as reported on the Statement of Changes in Net Assets for the years ended July 31, 2016 and 2015 was as follows:
| | 2016 | 2015 |
| Ordinary income1 | $1,744,423 | $3,125 |
| Long-term capital gains | $1,611,547 | $1,688,921 |
| 1 | For tax purposes, short-term capital gain distributions are considered ordinary income distributions. |
| | |
As of July 31, 2016, the components of distributable earnings on a tax basis were as follows:
| Net unrealized appreciation | $2,790,062 |
| Capital loss carryforwards and deferrals | $(785,462) |
The difference between book-basis and tax-basis net unrealized appreciation/depreciation is attributable to differing treatments for the deferral of losses on wash sales.
At July 31, 2016, the cost of investments for federal tax purposes was $38,404,613. The net unrealized appreciation of investments for federal tax purposes was $2,790,062. This consists of net unrealized appreciation from investments for those securities having an excess of value over cost of $4,739,484 and net unrealized depreciation from investments for those securities having an excess of cost over value of $1,949,422.
At July 31, 2016, the Fund had a capital loss carryforward of $537,274 which will reduce the Fund's taxable income arising from future net realized gains on investments, if any, to the extent permitted by the Code, thereby reducing the amount of distributions to shareholders which would otherwise be necessary to relieve the Fund of any liability for federal income tax. Pursuant to the Code, a net capital loss incurred in taxable years beginning on or before December 22, 2010, is characterized as short-term and may be carried forward for a maximum of eight tax years (“Carryforward Limit”), whereas a net capital loss incurred in taxable years beginning after December 22, 2010, retains its character as either short-term or long-term, does not expire and is required to be utilized prior to the losses which have a Carryforward Limit.
Annual Shareholder Report
The following schedule summarizes the Fund's capital loss carryforwards and expiration years:
| Expiration Year | Short-Term | Long-Term | Total |
| 2018 | $537,274 | NA | $537,274 |
The Fund used capital loss carryforwards of $268,637 to offset capital gains realized during the year ended July 31, 2016.
Under current tax rules, capital losses on securities transactions realized after October 31 may be deferred, in whole or in part, and treated as occurring on the first day of the following fiscal year. As of July 31, 2016, for federal income tax purposes, post October losses of $248,188 were deferred to August 1, 2016.
5. INVESTMENT ADVISER FEE AND OTHER TRANSACTIONS WITH AFFILIATES
Investment Adviser Fee
The advisory agreement between the Fund and the Adviser provides for an annual fee equal to 0.99% of the Fund's average daily net assets. Prior to June 8, 2016, the annual advisory fee was 1.15% of the Fund's average daily net assets. Subject to the terms described in the Expense Limitation note, the Adviser may voluntarily choose to waive any portion of its fee. For the year ended July 31, 2016, the Adviser voluntarily waived $349,312 of its fee and reimbursed $2,042 of transfer agent fees.
Administrative Fee
Federated Administrative Services (FAS), under the Administrative Services Agreement, provides the Fund with administrative personnel and services. For purposes of determining the appropriate rate breakpoint, “Investment Complex” is defined as all of the Federated Funds subject to a fee under the Administrative Services Agreement. The fee paid to FAS is based on the average daily net assets of the Investment Complex as specified below, plus certain out-of-pocket expenses:
| Administrative Fee | Average Daily Net Assets
of the Investment Complex |
| 0.150% | on the first $5 billion |
| 0.125% | on the next $5 billion |
| 0.100% | on the next $10 billion |
| 0.075% | on assets in excess of $20 billion |
Subject to the terms described in the Expense Limitation note, FAS may voluntarily choose to waive any portion of its fee. For the year ended July 31, 2016, the annualized fee paid to FAS was 0.078% of average daily net assets of the Fund.
Annual Shareholder Report
Distribution Services Fee
The Fund has adopted a Distribution Plan (the “Plan”) pursuant to Rule 12b-1 under the Act. Under the terms of the Plan, the Fund will compensate Federated Securities Corp. (FSC), the principal distributor, from the daily net assets of the Fund's Class A Shares and Class C Shares to finance activities intended to result in the sale of these shares. The Plan provides that the Fund may incur distribution expenses at the following percentages of average daily net assets annually, to compensate FSC:
| Share Class Name | Percentage of Average Daily
Net Assets of Class |
| Class A Shares | 0.05% |
| Class C Shares | 0.75% |
Subject to the terms described in the Expense Limitation note, FSC may voluntarily choose to waive any portion of its fee. For the year ended July 31, 2016, distribution services fees for the Fund were as follows:
| | Distribution
Services Fees
Incurred |
| Class C Shares | $22,216 |
When FSC receives fees, it may pay some or all of them to financial intermediaries whose customers purchase shares. For the year ended July 31, 2016, FSC retained $2,827 of fees paid by the Fund. For the year ended July 31, 2016, the Fund's Class A Shares did not incur a distribution services fee; however, it may begin to incur this upon approval of the Trustees.
Other Service Fees
For the year ended July 31, 2016, FSSC received $202 and reimbursed $15 of the other service fees disclosed in Note 2.
Sales Charges
Front-end sales charges and contingent deferred sales charges (CDSC) do not represent expenses of the Fund. They are deducted from the proceeds of sales of Fund shares prior to investment or from redemption proceeds prior to remittance, as applicable. For the year ended July 31, 2016, FSC retained $1,710 in sales charges from the sale of Class A Shares. FSC also retained $427 of CDSC relating to redemptions of Class C Shares.
Expense Limitation
The Adviser and certain of its affiliates (which may include FSC, FAS and FSSC) on their own initiative have agreed to waive certain amounts of their respective fees and/or reimburse expenses. Total annual fund operating expenses (as shown in the financial highlights, excluding expenses allocated from affiliated partnerships, extraordinary expenses, line of credit expenses and proxy-related expenses paid by the Fund, if any) paid by the Fund's Class A Shares, Class C Shares, Institutional Shares and Class R6 Shares (after the voluntary waivers and/or reimbursements) will not exceed 1.13%, 1.88%, 0.88% and 0.87% (the “Fee Limit”), respectively, up to but not including the later of (the “Termination Date”):
Annual Shareholder Report
(a) July 1, 2017 or (b) the date of the Fund's next effective Prospectus. While the Adviser and its applicable affiliates currently do not anticipate terminating or increasing these arrangements prior to the Termination Date, these arrangements may only be terminated or the Fee Limit increased prior to the Termination Date with the agreement of the Trustees.
General
Certain Officers and Trustees of the Trust are Officers and Directors or Trustees of certain of the above companies. To efficiently facilitate payment, Directors'/Trustees' fees and certain expenses related to conducting meetings of the Directors/Trustees and other miscellaneous expenses are paid by an affiliate of the Adviser which in due course are reimbursed by the Fund. Such expenses may be included in Accrued and Miscellaneous Expenses on the Statement of Assets and Liabilities and Statement of Operations, respectively.
Transactions Involving Affiliated Holdings
Affiliated holdings are investment companies which are managed by the Adviser or an affiliate of the Adviser. The Adviser has agreed to reimburse the Fund for certain investment adviser fees as a result of transactions in other affiliated investment companies. For the year ended July 31, 2016, the Adviser reimbursed $834. Transactions involving the affiliated holding during the year ended July 31, 2016, were as follows:
| | Federated
Institutional
Prime Value
Obligations Fund,
Institutional Shares |
| Balance of Shares Held 7/31/2015 | 630,062 |
| Purchases/Additions | 16,125,297 |
| Sales/Reductions | (15,951,638) |
| Balance of Shares Held 7/31/2016 | 803,721 |
| Value | $803,271 |
| Dividend Income | $2,330 |
6. Investment TRANSACTIONS
Purchases and sales of investments, excluding long-term U.S. government securities and short-term obligations, for the year ended July 31, 2016, were as follows:
| Purchases | $67,167,841 |
| Sales | $59,642,142 |
7. LINE OF CREDIT
The Fund participates with certain other Federated Funds, on a several basis, in an up to $500,000,000 unsecured, 364-day, committed, revolving line of credit (LOC) agreement. The LOC was made available to finance temporarily the repurchase or redemption of shares of the Fund, failed trades, payment of dividends, settlement of trades and for other short-term, temporary or emergency general business purposes. The Fund cannot borrow under the LOC if an inter-fund loan is outstanding. The Fund's ability to borrow under the LOC also is subject to the limitations of the Act and various conditions precedent that must be satisfied before the Fund can borrow. Loans under the LOC are charged interest at a fluctuating rate per annum
Annual Shareholder Report
equal to the highest, on any day, of (a) (i) the federal funds effective rate, (ii) the one month London Interbank Offer Rate (LIBOR), and (iii) 0.0%, plus (b) a margin. The LOC also requires the Fund to pay, quarterly in arrears and at maturity, its pro rata share of a commitment fee based on the amount of the lenders' commitment that has not been utilized. As of July 31, 2016, the Fund had no outstanding loans. During the year ended July 31, 2016, the Fund did not utilize the LOC.
8. INTERFUND LENDING
Pursuant to an Exemptive Order issued by the Securities and Exchange Commission, the Fund, along with other funds advised by subsidiaries of Federated Investors, Inc., may participate in an interfund lending program. This program provides an alternative credit facility allowing the Fund to borrow from other participating affiliated funds. As of July 31, 2016, there were no outstanding loans. During the year ended July 31, 2016, the program was not utilized.
9. FEDERAL TAX INFORMATION (UNAUDITED)
For the year ended July 31, 2016, the amount of long-term capital gains designated by the Fund was $1,611,547.
For the fiscal year ended July 31, 2016, 36.54% of total income (including short-term capital gain) distributions made by the Fund are qualifying dividends which may be subject to a maximum tax rate of 15%, as provided for by the Jobs and Growth Tax Relief Act of 2003. Complete information is reported in conjunction with the reporting of your distributions on Form 1099-DIV.
Of the ordinary income (including short-term capital gain) distributions made by the Fund during the year ended July 31, 2016, 35.72% qualify for the dividend received deduction available to corporate shareholders.
Annual Shareholder Report
Report of Independent Registered Public Accounting Firm
TO THE BOARD OF trustees OF Federated MDt series AND SHAREHOLDERS OF federated mdt Small cap core fund:
We have audited the accompanying statement of assets and liabilities of Federated MDT Small Cap Core Fund (the “Fund”) (one of the portfolios constituting Federated MDT Series), including the portfolio of investments, as of July 31, 2016, and the related statement of operations for the year then ended, the statement of changes in net assets for each of the two years in the period then ended, and the financial highlights for each of periods indicated therein. These financial statements and financial highlights are the responsibility of the Fund's management. Our responsibility is to express an opinion on these financial statements and financial highlights based on our audits.
We conducted our audits in accordance with standards of the Public Company Accounting Oversight Board (United States). Those standards require that we plan and perform the audit to obtain reasonable assurance about whether the financial statements and financial highlights are free of material misstatement. We were not engaged to perform an audit of the Fund's internal control over financial reporting. Our audits included consideration of internal control over financial reporting as a basis for designing audit procedures that are appropriate in the circumstances, but not for the purpose of expressing an opinion on the effectiveness of the Fund's internal control over financial reporting. Accordingly, we express no such opinion. An audit also includes examining, on a test basis, evidence supporting the amounts and disclosures in the financial statements and financial highlights, assessing the accounting principles used and significant estimates made by management, and evaluating the overall financial statement presentation. Our procedures included confirmation of securities owned as of July 31, 2016, by correspondence with the custodian and others or by other appropriate auditing procedures where replies from others were not received. We believe that our audits provide a reasonable basis for our opinion.
In our opinion, the financial statements and financial highlights referred to above present fairly, in all material respects, the financial position of Federated MDT Small Cap Core Fund, a portfolio of Federated MDT Series, at July 31, 2016, the results of its operations for the year then ended, the changes in its net assets for each of the two years in the period then ended, and the financial highlights for each of the periods indicated therein, in conformity with U.S. generally accepted accounting principles.
Boston, Massachusetts
September 22, 2016
Annual Shareholder Report
Shareholder Expense Example (unaudited)
As a shareholder of the Fund, you incur two types of costs: (1) transaction costs, including sales charges (loads) on purchase or redemption payments; and (2) ongoing costs, including management fees and to the extent applicable, distribution (12b-1) fees and/or other service fees and other Fund expenses. This Example is intended to help you to understand your ongoing costs (in dollars) of investing in the Fund and to compare these costs with the ongoing costs of investing in other mutual funds. It is based on an investment of $1,000 invested at the beginning of the period and held for the entire period from February 1, 2016 to July 31, 2016.
ACTUAL EXPENSES
The first section of the table below provides information about actual account values and actual expenses. You may use the information in this section, together with the amount you invested, to estimate the expenses that you incurred over the period. Simply divide your account value by $1,000 (for example, an $8,600 account value divided by $1,000 = 8.6), then multiply the result by the number in the first section under the heading entitled “Expenses Paid During Period” to estimate the expenses attributable to your investment during this period.
HYPOTHETICAL EXAMPLE FOR COMPARISON PURPOSES
The second section of the table below provides information about hypothetical account values and hypothetical expenses based on the Fund's actual expense ratio and an assumed rate of return of 5% per year before expenses, which is not the Fund's actual return. Thus, you should not use the hypothetical account values and expenses to estimate the actual ending account balance or your expenses for the period. Rather, these figures are required to be provided to enable you to compare the ongoing costs of investing in the Fund with other funds. To do so, compare this 5% hypothetical example with the 5% hypothetical examples that appear in the shareholder reports of the other funds.
Annual Shareholder Report
Please note that the expenses shown in the table are meant to highlight your ongoing costs only and do not reflect any transaction costs, such as sales charges (loads) on purchase or redemption payments. Therefore, the second section of the table is useful in comparing ongoing costs only, and will not help you determine the relative total costs of owning different funds. In addition, if these transaction costs were included, your costs would have been higher.
| | Beginning
Account Value
2/1/2016 | Ending
Account Value
7/31/2016 | Expenses Paid
During Period1 |
| Actual: | | | |
| Class A Shares | $1,000 | $1,253.50 | $6.33 |
| Class C Shares | $1,000 | $1,250.00 | $10.52 |
| Institutional Shares | $1,000 | $1,256.30 | $4.94 |
| Class R6 Shares | $1,000 | $1,119.60 | $0.832 |
Hypothetical (assuming a 5% return
before expenses): | | | |
| Class A Shares | $1,000 | $1,019.24 | $5.67 |
| Class C Shares | $1,000 | $1,015.51 | $9.42 |
| Institutional Shares | $1,000 | $1,020.49 | $4.42 |
| Class R6 Shares | $1,000 | $1,020.79 | $4.122 |
| 1 | Expenses are equal to the Fund's annualized net expense ratios, multiplied by the average account value over the period, multiplied by 182/366 (to reflect the one-half-year period). The annualized net expense ratios are as follows: |
| | |
| Class A Shares | 1.13% |
| Class C Shares | 1.88% |
| Institutional Shares | 0.88% |
| Class R6 Shares | 0.87% |
| 2 | “Actual” expense information for the Fund's Class R6 Shares is for the period from June 29, 2016 (date of initial investment) to July 31, 2016. Actual expenses are equal to the Fund's annualized net expense ratio of 0.87%, multiplied by 33/366 (to reflect the period from initial investment to July 31, 2016). “Hypothetical” expense information for R6 is presented on the basis of the full one-half year period to enable comparison to other funds. It is based on assuming the same net expense ratio and average account value over the period, but it is multiplied by 182/366 (to reflect the full half-year period). |
Annual Shareholder Report
Board of Trustees and Trust Officers
The Board of Trustees is responsible for managing the Trust's business affairs and for exercising all the Trust's powers except those reserved for the shareholders. The following tables give information about each Trustee and the senior officers of the Fund. Where required, the tables separately list Trustees who are “interested persons” of the Fund (i.e., “Interested” Trustees) and those who are not (i.e., “Independent” Trustees). Unless otherwise noted, the address of each person listed is Federated Investors Tower, 1001 Liberty Avenue, Pittsburgh, PA 15222. The address of all Independent Trustees listed is 4000 Ericsson Drive, Warrendale, PA 15086-7561; Attention: Mutual Fund Board. As of December 31, 2015, the Trust comprised five portfolio(s), and the Federated Fund Family consisted of 38 investment companies (comprising 122 portfolios). Unless otherwise noted, each Officer is elected annually. Unless otherwise noted, each Trustee oversees all portfolios in the Federated Fund Family and serves for an indefinite term. The Fund's Statement of Additional Information includes additional information about Trust Trustees and is available, without charge and upon request, by calling 1-800-341-7400.
Interested TRUSTEES Background
Name
Birth Date
Positions Held with Trust
Date Service Began | Principal Occupation(s) for Past Five Years,
Other Directorships Held and Previous Position(s) |
J. Christopher Donahue*
Birth Date: April 11, 1949
President and Trustee
Indefinite Term
Began serving: May 2006 | Principal Occupations: Principal Executive Officer and President of certain of the Funds in the Federated Fund Family; Director or Trustee of the Funds in the Federated Fund Family; President, Chief Executive Officer and Director, Federated Investors, Inc.; Chairman and Trustee, Federated Investment Management Company; Trustee, Federated Investment Counseling; Chairman and Director, Federated Global Investment Management Corp.; Chairman, Federated Equity Management Company of Pennsylvania and Passport Research, Ltd. (investment advisory subsidiary of Federated); Trustee, Federated Shareholder Services Company; Director, Federated Services Company.
Previous Positions: President, Federated Investment Counseling; President and Chief Executive Officer, Federated Investment Management Company, Federated Global Investment Management Corp. and Passport Research, Ltd. |
Annual Shareholder Report
Name
Birth Date
Positions Held with Trust
Date Service Began | Principal Occupation(s) for Past Five Years,
Other Directorships Held and Previous Position(s) |
John B. Fisher*
Birth Date: May 16, 1956
Trustee
Indefinite Term
Began serving: May 2016 | Principal Occupations: Principal Executive Officer and President of certain of the Funds in the Federated Fund Family; Director or Trustee of certain of the Funds in the Federated Fund Family; Vice President, Federated Investors, Inc.; President, Director/Trustee and CEO, Federated Advisory Services Company, Federated Equity Management Company of Pennsylvania, Federated Global Investment Management Corp., Federated Investment Counseling, Federated Investment Management Company; President and CEO of Passport Research, Ltd.; President of some of the Funds in the Federated Fund Complex and Director, Federated Investors Trust Company.
Previous Positions: President and Director of the Institutional Sales Division of Federated Securities Corp.; President and Director of Federated Investment Counseling; Director, Edgewood Securities Corp.; Director, Federated Services Company; Director, Federated Investors, Inc.; Chairman and Director, Southpointe Distribution Services, Inc. and President, Technology, Federated Services Company. |
| * | Reasons for “interested” status: J. Christopher Donahue and John B. Fisher are interested due to their beneficial ownership of shares of Federated Investors, Inc. and due to positions they hold with Federated and its subsidiaries. J. Christopher Donahue is the son of John F. Donahue, Chairman Emeritus of the Federated Funds. |
INDEPENDENT TRUSTEES Background
Name
Birth Date
Positions Held with Trust
Date Service Began | Principal Occupation(s) for Past Five Years,
Other Directorships Held, Previous Position(s) and Qualifications |
John T. Collins
Birth Date: January 24, 1947
Trustee
Indefinite Term
Began serving: October 2013 | Principal Occupations: Director or Trustee of the Federated Fund Family; Retired.
Other Directorships Held: Director, Chair of the Compensation Committee, Audit Committee member, KLX Corp.
Qualifications: Mr. Collins has served in several business and financial management roles and directorship positions throughout his career. Mr. Collins previously served as Chairman and CEO, The Collins Group, Inc. (a private equity firm). Mr. Collins serves as Chairman Emeriti, Bentley University. Mr. Collins previously served as Director, FleetBoston Financial Corp.; Director and Audit Committee Member, Bank of America Corp. and Director, Beth Israel Deaconess Medical Center (Harvard University Affiliate Hospital). |
Annual Shareholder Report
Name
Birth Date
Positions Held with Trust
Date Service Began | Principal Occupation(s) for Past Five Years,
Other Directorships Held, Previous Position(s) and Qualifications |
G. Thomas Hough
Birth Date: February 28, 1955
Trustee
Indefinite Term
Began serving: August 2015 | Principal Occupations: Director or Trustee of the Federated Fund Family; Retired.
Other Directorships Held: Director, Chair of the Audit Committee, Governance Committee, Publix Super Markets, Inc.
Qualifications: Mr. Hough has served in accounting, business management and directorship positions throughout his career. Mr. Hough most recently held the position of Americas Vice Chair of Assurance with Ernst & Young LLP. Mr. Hough is an Executive Committee member of the United States Golf Association, he serves on the President's Cabinet and Business School Board of Visitors for the University of Alabama and is on the Business School Board of Visitors for Wake Forest University. |
Maureen Lally-Green
Birth Date: July 5, 1949
Trustee
Indefinite Term
Began serving: August 2009 | Principal Occupations: Director or Trustee of the Federated Fund Family; Interim Dean of the Duquesne University School of Law; Adjunct Professor of Law, Duquesne University School of Law.
Other Directorships Held: Director, CONSOL Energy Inc.
Qualifications: Judge Lally-Green has served in various legal and business roles and directorship positions throughout her career. Judge Lally-Green previously served as: Associate General Secretary, Diocese of Pittsburgh; a member of the Superior Court of Pennsylvania; and as a Professor of Law, Duquesne University School of Law. Judge Lally-Green also holds the positions on either a public or not for profit Board of Directors as follows: Member, Pennsylvania State Board of Education (public); Director and Chair, UPMC Mercy Hospital; Regent, St. Vincent Seminary; Director and Vice Chair, Our Campaign for the Church Alive!, Inc.; Director, Saint Vincent College; and Director and Chair, Cardinal Wuerl North Catholic High School, Inc. Judge Lally-Green has held the positions of: Director, Auberle; Director, Ireland Institute of Pittsburgh; Director, Saint Thomas More Society; and Director, Catholic High Schools of the Diocese of Pittsburgh, Inc. |
Peter E. Madden
Birth Date: March 16, 1942
Trustee
Indefinite Term
Began serving: June 2006 | Principal Occupation: Director or Trustee, and Chair of the Board of Directors or Trustees, of the Federated Fund Family; Retired.
Other Directorships Held: None.
Qualifications: Mr. Madden has served in several business management, mutual fund services and directorship positions throughout his career. Mr. Madden previously served as President, Chief Operating Officer and Director, State Street Bank and Trust Company (custodian bank) and State Street Corporation (financial services). He was Director, VISA USA and VISA International and Chairman and Director, Massachusetts Bankers Association. Mr. Madden served as Director, Depository Trust Corporation and Director, The Boston Stock Exchange. Mr. Madden also served as a Representative to the Commonwealth of Massachusetts General Court. |
Annual Shareholder Report
Name
Birth Date
Positions Held with Trust
Date Service Began | Principal Occupation(s) for Past Five Years,
Other Directorships Held, Previous Position(s) and Qualifications |
Charles F. Mansfield, Jr.
Birth Date: April 10, 1945
Trustee
Indefinite Term
Began serving: June 2006 | Principal Occupations: Director or Trustee of the Federated Fund Family; Management Consultant.
Other Directorships Held: None.
Qualifications: Mr. Mansfield has served in several banking, business management and educational roles and directorship positions throughout his career. Mr. Mansfield previously served as Chief Executive Officer, PBTC International Bank; Partner, Arthur Young & Company (now Ernst & Young LLP); Chief Financial Officer of Retail Banking Sector, Chase Manhattan Bank; Senior Vice President, HSBC Bank USA (formerly, Marine Midland Bank); Vice President, Citibank; Assistant Professor of Banking and Finance, Frank G. Zarb School of Business, Hofstra University; Executive Vice President DVC Group, Inc. (marketing, communications and technology). |
Thomas M. O'Neill
Birth Date: June 14, 1951
Trustee
Indefinite Term
Began serving: October 2006 | Principal Occupations: Director or Trustee, Chair of the Audit Committee of the Federated Fund Family; Sole Proprietor, Navigator Management Company (investment and strategic consulting).
Other Directorships Held: None.
Qualifications: Mr. O'Neill has served in several business, mutual fund and financial management roles and directorship positions throughout his career. Mr. O'Neill serves as Director, Medicines for Humanity and Director, The Golisano Children's Museum of Naples, Florida. Mr. O'Neill previously served as Chief Executive Officer and President, Managing Director and Chief Investment Officer, Fleet Investment Advisors; President and Chief Executive Officer, Aeltus Investment Management, Inc.; General Partner, Hellman, Jordan Management Co., Boston, MA; Chief Investment Officer, The Putnam Companies, Boston, MA; Credit Analyst and Lending Officer, Fleet Bank; Director and Consultant, EZE Castle Software (investment order management software); and Director, Midway Pacific (lumber). |
P. Jerome Richey
Birth Date: February 23, 1949
Trustee
Indefinite Term
Began serving: October 2013 | Principal Occupations: Director or Trustee of the Federated Fund Family; Management Consultant.
Other Directorships Held: None.
Qualifications: Mr. Richey has served in several business and legal management roles and directorship positions throughout his career. Mr. Richey most recently held the positions of Senior Vice Chancellor and Chief Legal Officer, University of Pittsburgh. Mr. Richey serves as Board Member, Epilepsy Foundation of Western Pennsylvania and Board member, World Affairs Council of Pittsburgh. Mr. Richey previously served as Chief Legal Officer and Executive Vice President, CONSOL Energy Inc. and Shareholder, Buchanan Ingersoll & Rooney PC (a law firm). |
Annual Shareholder Report
Name
Birth Date
Positions Held with Trust
Date Service Began | Principal Occupation(s) for Past Five Years,
Other Directorships Held, Previous Position(s) and Qualifications |
John S. Walsh
Birth Date: November 28, 1957
Trustee
Indefinite Term
Began serving: June 2006 | Principal Occupations: Director or Trustee of the Federated Fund Family; President and Director, Heat Wagon, Inc. (manufacturer of construction temporary heaters); President and Director, Manufacturers Products, Inc. (distributor of portable construction heaters); President, Portable Heater Parts, a division of Manufacturers Products, Inc.
Other Directorships Held: None.
Qualifications: Mr. Walsh has served in several business management roles and directorship positions throughout his career. Mr. Walsh previously served as Vice President, Walsh & Kelly, Inc. (paving contractors). |
OFFICERS
Name
Birth Date
Address
Positions Held with Trust
Date Service Began | Principal Occupation(s) for Past Five Years
and Previous Position(s) |
John W. McGonigle
Birth Date: October 26, 1938
Secretary
Officer since: May 2006 | Principal Occupations: Executive Vice President and Secretary of the Federated Fund Family; Vice Chairman, Executive Vice President, Secretary and Director, Federated Investors, Inc.
Previous Positions: Trustee, Federated Investment Management Company and Federated Investment Counseling; Director, Federated Global Investment Management Corp., Federated Services Company and Federated Securities Corp. |
Lori A. Hensler
Birth Date: January 6, 1967
TREASURER
Officer since: April 2013 | Principal Occupations: Principal Financial Officer and Treasurer of the Federated Fund Family; Senior Vice President, Federated Administrative Services; Financial and Operations Principal for Federated Securities Corp. and Edgewood Services, Inc.; and Assistant Treasurer, Federated Investors Trust Company. Ms. Hensler has received the Certified Public Accountant designation.
Previous Positions: Controller of Federated Investors, Inc.; Senior Vice President and Assistant Treasurer, Federated Investors Management Company; Treasurer, Federated Investors Trust Company; Assistant Treasurer, Federated Administrative Services, Federated Administrative Services, Inc., Federated Securities Corp., Edgewood Services, Inc., Federated Advisory Services Company, Federated Equity Management Company of Pennsylvania, Federated Global Investment Management Corp., Federated Investment Counseling, Federated Investment Management Company, Passport Research, Ltd., and Federated MDTA, LLC; Financial and Operations Principal for Federated Securities Corp., Edgewood Services, Inc. and Southpointe Distribution Services, Inc. |
Annual Shareholder Report
Name
Birth Date
Address
Positions Held with Trust
Date Service Began | Principal Occupation(s) for Past Five Years
and Previous Position(s) |
Peter J. Germain
Birth Date: September 3, 1959
CHIEF LEGAL OFFICER
Officer since: June 2006 | Principal Occupations: Mr. Germain is Chief Legal Officer of the Federated Fund Family. He is General Counsel and Vice President, Federated Investors, Inc.; President, Federated Administrative Services and Federated Administrative Services, Inc.; Vice President, Federated Securities Corp.; Secretary, Federated Private Asset Management, Inc.; and Secretary, Retirement Plan Service Company of America. Mr. Germain joined Federated in 1984 and is a member of the Pennsylvania Bar Association.
Previous Positions: Deputy General Counsel, Special Counsel, Managing Director of Mutual Fund Services, Federated Investors, Inc.; Senior Vice President, Federated Services Company; and Senior Corporate Counsel, Federated Investors, Inc. |
Stephen Van Meter
Birth Date: June 5, 1975
CHIEF COMPLIANCE OFFICER AND SENIOR VICE PRESIDENT
Officer since: July 2015 | Principal Occupations: Senior Vice President and Chief Compliance Officer of the Federated Fund Family; Vice President and Chief Compliance Officer of Federated Investors, Inc. and Chief Compliance Officer of certain of its subsidiaries. Mr. Van Meter joined Federated in October 2011. He holds FINRA licenses under Series 3, 7, 24 and 66.
Previous Positions: Mr. Van Meter previously held the position of Compliance Operating Officer, Federated Investors, Inc. Prior to joining Federated, Mr. Van Meter served at the United States Securities and Exchange Commission in the positions of Senior Counsel, Office of Chief Counsel, Division of Investment Management and Senior Counsel, Division of Enforcement. |
Stephen F. Auth
Birth Date: September 13, 1956
101 Park Avenue
41st Floor
New York, NY 10178
CHIEF INVESTMENT OFFICER
Officer since: June 2012 | Principal Occupations: Stephen F. Auth is Chief Investment Officer of various Funds in the Federated Fund Family; Executive Vice President, Federated Investment Counseling, Federated Global Investment Management Corp. and Federated Equity Management Company of Pennsylvania.
Previous Positions: Executive Vice President, Federated Investment Management Company and Passport Research, Ltd. (investment advisory subsidiary of Federated); Senior Vice President, Global Portfolio Management Services Division; Senior Vice President, Federated Investment Management Company and Passport Research, Ltd.; Senior Managing Director and Portfolio Manager, Prudential Investments. |
Annual Shareholder Report
Evaluation and Approval of Advisory Contract–May 2016
Federated MDT Small Cap Core Fund (the “Fund”)
Following a review and recommendation of approval by the Fund's independent trustees, the Fund's Board of Trustees (the “Board”) reviewed and unanimously approved at its May 2016 meetings the continuation of the Fund's investment advisory contract for an additional one-year term. The Board's decision regarding the contract reflects the exercise of its business judgment after consideration of all of the information received on whether to continue the existing arrangements.
The Board had previously appointed a Senior Officer, whose duties include specified responsibilities relating to the process by which advisory fees are to be charged to a Federated fund. The Senior Officer has the authority to retain consultants, experts, or staff as may be reasonably necessary to assist in the performance of his duties, reports directly to the Board, and may be terminated only with the approval of a majority of the independent members of the Board. The Senior Officer prepared and furnished to the Board an independent, written evaluation that covered topics discussed below (the “Senior Officer's Evaluation”). The Board considered the Senior Officer's Evaluation, along with other information, in deciding to approve the investment advisory contract.
The Board is also familiar with and considered judicial decisions concerning allegedly excessive investment advisory fees, which have indicated that the following factors may be relevant to an adviser's fiduciary duty with respect to its receipt of compensation from a fund: the nature and quality of the services provided by an adviser to a fund and its shareholders, including the performance and fees and expenses of the fund and of comparable funds; an adviser's cost of providing the services, including the profitability to an adviser of providing advisory services to a fund; the extent to which an adviser may realize “economies of scale” as a fund grows larger and, if such economies of scale exist, whether they have been shared with a fund and its shareholders or the family of funds; any “fall-out financial benefits” that accrue to an adviser because of its relationship with a fund (including research services received from brokers that execute fund trades and any fees paid to affiliates of an adviser for services rendered to a fund); comparative fee and expense structures, including a comparison of fees paid to an adviser with those paid by similar funds; and the extent of care, conscientiousness and independence with which board members perform their duties and their expertise, including whether they are fully informed about all facts the board deems relevant to its consideration of an adviser's services and fees. The Board noted that the Securities and Exchange Commission (“SEC”) disclosure requirements regarding the basis for the Board's approval of the Fund's investment advisory contract generally track the factors listed above. Consistent with these judicial decisions and SEC disclosure requirements, the Board also considered management fees charged to
Annual Shareholder Report
institutional and other clients of Federated MDTA LLC (the “Adviser”) for what might be viewed as like services. The Board was aware of these factors and was guided by them in its review of the Fund's investment advisory contract to the extent it considered them to be appropriate and relevant, as discussed further below.
The Board considered and weighed these circumstances in light of its substantial accumulated experience in governing the Fund and working with Federated Investors, Inc. and its affiliates (“Federated”) on matters relating to the Federated funds, and was assisted in its deliberations by independent legal counsel. Throughout the year, and in connection with its May meetings, the Board requested and received substantial and detailed information about the Fund and the Federated organization that was in addition to the extensive materials that comprise and accompany the Senior Officer's Evaluation. Federated provided much of this information at each regular meeting of the Board, and furnished additional substantial information in connection with the May meetings at which the Board's formal review of the investment advisory contract occurred. At the May meetings, in addition to meeting in separate sessions of the independent trustees without management present, senior management of the Adviser also met with the independent trustees and their counsel to discuss the materials presented and any other matters thought relevant by the Adviser or the trustees. Between regularly scheduled meetings, the Board also received information on particular matters as the need arose. Thus, the Board's consideration of the investment advisory contract included review of the Senior Officer's Evaluation, accompanying data and additional information covering such matters as: the Adviser's investment philosophy, revenue, profitability, personnel and processes; investment and operating strategies; the Fund's short- and long-term performance (in absolute terms, both on a gross basis and net of expenses, as well as in relationship to its particular investment program and certain competitor or “peer group” funds and/or other benchmarks, as appropriate), and comments on the reasons for performance; the Fund's investment objectives; the Fund's expenses (including the advisory fee itself and the overall expense structure of the Fund, both in absolute terms and relative to similar and/or competing funds, with due regard for contractual or voluntary expense limitations); the use and allocation of brokerage commissions derived from trading the Fund's portfolio securities (if any); and the nature, quality and extent of the advisory and other services provided to the Fund by the Adviser and its affiliates. The Board also considered the preferences and expectations of Fund shareholders; the entrepreneurial risk assumed by the Adviser in sponsoring the Fund; the continuing state of competition in the mutual fund industry and market practices; the range of comparable fees for similar funds in the mutual fund industry; the Fund's relationship to the Federated funds which include a comprehensive array of funds with different investment objectives, policies and strategies which are generally available for exchange without the incurrence of additional sales charges; compliance and
Annual Shareholder Report
audit reports concerning the Federated funds and the Federated companies that service them (including communications from regulatory agencies), as well as Federated's responses to any issues raised therein; and relevant developments in the mutual fund industry and how the Federated funds and/or Federated are responding to them. The Board's evaluation process is evolutionary. The criteria considered and the emphasis placed on relevant criteria change in recognition of changing circumstances in the mutual fund marketplace.
While mindful that courts have cautioned against giving such comparisons too much weight, the Board has found the use of comparisons of the Fund's fees and expenses to other mutual funds with comparable investment programs to be relevant to its deliberations. In this regard, the Board was presented with, and considered, information regarding the contractual advisory fee rates, net advisory fee rates, total expense ratios and each element of the Fund's total expense ratio (i.e., gross and net advisory fees, custody fees, portfolio accounting fees and transfer agency fees) relative to the Fund's peers. The Board focused on comparisons with other similar mutual funds more heavily than non-mutual fund products or services because it is believed that they are more relevant. For example, other mutual funds are the products most like the Fund, they are readily available to Fund shareholders as alternative investment vehicles, and they are the type of investment vehicle in fact chosen and maintained by the Fund's investors. The range of their fees and expenses therefore appears to be a relevant indicator of what consumers have found to be reasonable in the precise marketplace in which the Fund competes.
The Board reviewed the contractual advisory fee rate, net advisory fee rate where partially waived and other expenses of the Fund and noted the position of the Fund's fee rates relative to its peers. In this regard, the Board noted that the contractual advisory fee rate was above the median of the relevant peer group, but the Board noted the applicable waivers and reimbursements and that the overall expense structure of the Fund remained competitive in the context of other factors considered by the Board. In this regard, the Board had been previously advised that, while comparisons to fund peer groups are relevant in judging the reasonableness of advisory fees, the Fund's quantitative focus makes fee and expense comparisons particularly difficult. Although the Fund's advisory fee was above the median of the peer range, the peer group of funds varied widely in their complexity, and the Board had been informed that the management of the Fund is among the more complex relative to its peers.
By contrast, the Senior Officer has reviewed Federated's fees for providing advisory services to products outside the Federated funds (e.g., institutional and separate accounts and sub-adviser services). He concluded that mutual funds and institutional accounts are inherently different products. Those differences include, but are not limited to, different types of targeted investors; being subject to different laws and regulations; different legal structures; different average account sizes and portfolio management techniques made necessary by different cash flows and different associated costs; and the time spent by portfolio
Annual Shareholder Report
managers and their teams, funds financial services, legal, compliance and risk management in reviewing securities pricing, addressing different administrative responsibilities, addressing different degrees of risk associated with management and a variety of different costs. The Senior Officer did not consider the fees for providing advisory services to these outside products to be determinative in judging the appropriateness of mutual fund advisory fees.
The Senior Officer noted that the services, administrative responsibilities and risks associated with such relationships are quite different than serving as a primary adviser to a fund.
Following such evaluation, the Board concluded, within the context of its full deliberations, that the expenses of the Fund are reasonable and supported renewal of the investment advisory contract with respect to the Fund.
The Board considered the nature, extent and quality of the services provided to the Fund by the Adviser and the resources of the Adviser and its affiliates dedicated to the Fund. In this regard, the Board evaluated, among other things, the Adviser's personnel, experience, track record, overall reputation and willingness to invest in personnel and infrastructure that benefit the Fund. In addition, the Board reviewed the qualifications, backgrounds and responsibilities of the portfolio management team primarily responsible for the day-to-day management of the Fund. The Board noted the compliance programs of and the compliance-related resources provided to the Fund by the Adviser. The Fund's ability to deliver competitive performance when compared to its peer group was also deemed to be relevant by the Board as a useful indicator of how the Adviser is executing the Fund's investment program, which in turn was one of the Board's considerations in reaching a conclusion that the nature, extent, and quality of the Adviser's investment management services were such as to warrant continuation of the investment advisory contract.
In evaluating the Fund's investment performance, the Board considered performance results in light of the Fund's investment objective, strategies and risks, as disclosed in the Fund's prospectus. The Board particularly considered detailed investment reports on the Fund's performance provided to the Board throughout the year and in connection with the May meetings. The Senior Officer also reviewed information compiled by Federated, using data supplied by independent fund ranking organizations, regarding the performance of, and fees charged by, other mutual funds, noting his view that comparisons to fund peer groups may be helpful, though not conclusive, in judging the reasonableness of the proposed fees. The Board considered, in evaluating such comparisons, that in some cases individual funds may exhibit significant and unique differences in their objectives and management techniques when compared to other funds within an industry peer group, and that the Senior Officer had specifically noted that the Fund's quantitative focus makes fee and expense comparisons particularly difficult as the peer group of funds varied widely in their complexity, and the management of the Fund is among the more complex relative to its peers.
Annual Shareholder Report
For the one-year, three-year and five-year periods covered by the Senior Officer's Evaluation, the Fund's performance was above the median of the relevant peer group. In addition, the Board was informed by the Adviser that, for the same periods, the Fund outperformed its benchmark index for the one-year, three-year and five-year periods.
Following such evaluation, the Board concluded, within the context of its full deliberations, that the performance of the Fund supported renewal of the advisory contract with respect to the Fund.
The Board also received financial information about Federated, including information regarding the compensation and ancillary (or “fall-out”) benefits Federated derived from its relationships with the Federated funds. This information covered not only the fees under the investment advisory contracts, but also fees received by Federated's subsidiaries for providing other services to the Federated funds under separate contracts (e.g., for serving as the Federated funds' administrator). The information also detailed any indirect benefit Federated may derive from its receipt of research services from brokers who execute Federated fund trades. In addition, the Board considered the fact that, in order for a fund to be competitive in the marketplace, Federated and its affiliates frequently waived fees and/or reimbursed expenses and have disclosed to fund investors and/or indicated to the Board their intention to do so in the future, where appropriate. Moreover, the Board receives regular reporting as to the institution, adjustment or elimination of these voluntary waivers. The Board considered Federated's previous reductions in contractual management fees to certain funds in response to the Senior Officer's recommendations.
In this regard, the Board approved, a reduction of 16 basis points in the contractual advisory fee. This change more closely aligned the contractual fee with the net fee actually charged after the imposition of applicable voluntary waivers and was believed by both the Senior Officer and the Board to improve the market competitiveness of the Fund.
Federated furnished information, requested by the Senior Officer, that reported revenues on a fund-by-fund basis and made estimates of the allocation of expenses on a fund-by-fund basis, using allocation methodologies specified by the Senior Officer. The Senior Officer noted that, while these cost allocation reports apply consistent allocation processes, the inherent difficulties in allocating costs continues to cause the Senior Officer to question the precision of the process and to conclude that such reports may be unreliable, since a single change in an allocation estimate may dramatically alter the resulting estimate of cost and/or profitability of a fund and may produce unintended consequences. The allocation information, including the Senior Officer's view that fund-by-fund estimations may be unreliable, was considered in the analysis by the Board.
Annual Shareholder Report
The Board and the Senior Officer also reviewed information compiled by Federated comparing profitability information for Federated to other publicly held fund management companies. In this regard, the Senior Officer concluded that Federated's profit margins did not appear to be excessive. The Senior Officer also noted that Federated appeared financially sound, with the resources to fulfill its obligations under its contracts with the Fund.
The Senior Officer's Evaluation also discussed the notion of possible realization of “economies of scale” as a fund grows larger. The Board considered in this regard that the Adviser has made significant and long-term investments in areas that support all of the Federated funds, such as personnel and processes for the portfolio management, shareholder services, compliance, internal audit, and risk management functions, as well as systems technology (including technology relating to cybersecurity), and that the benefits of these efforts (as well as any economies of scale, should they exist) were likely to be enjoyed by the fund family as a whole. The Board noted that the Adviser's investments in these areas are extensive. In addition, the Board considered that Federated and its affiliates have frequently waived fees and/or reimbursed expenses and that this has allowed fund shareholders to share potential economies of scale from a fund's inception. Federated, as it does throughout the year, and again in connection with the Board's review, furnished information relative to revenue sharing or adviser paid fees. Federated and the Senior Officer noted that this information should be viewed to determine if there was an incentive to either not apply breakpoints or to apply breakpoints at higher levels and should not be viewed to determine the appropriateness of advisory fees, because it would represent marketing and distribution expenses. Finally, the Board also noted the absence of any applicable regulatory or industry guidelines on this subject, which (as discussed in the Senior Officer's Evaluation) is compounded by the lack of any common industry practice or general pattern with respect to structuring fund advisory fees with “breakpoints” that serve to reduce the fee as a fund attains a certain size.
The Senior Officer noted that, subject to the comments and recommendations made within the Senior Officer's Evaluation, his observations and the information accompanying the Senior Officer's Evaluation supported a finding by the Board that the management fee for the Fund was reasonable. Under these circumstances, other than the reduction in the contractual (or gross) advisory fee noted above, no changes were recommended to, and no objection was raised to, the continuation of the Fund's investment advisory contract.
In its decision to continue an existing investment advisory contract, the Board was mindful of the potential disruptions of the Fund's operations and various risks, uncertainties and other effects that could occur as a result of a decision to terminate or not renew an investment advisory contract. In particular, the Board recognized that many shareholders have invested in the Fund on the strength of the Adviser's industry standing and reputation and with the expectation that the
Annual Shareholder Report
Adviser will have a continuing role in providing advisory services to the Fund. Thus, the Board's approval of the investment advisory contract reflected the fact that it is the shareholders who have effectively selected the Adviser by virtue of having invested in the Fund. The Board concluded that, in light of the factors discussed above, including the nature, quality and scope of the services provided to the Fund by the Adviser and its affiliates, continuation of the investment advisory contract was appropriate.
The Board based its decision to approve the investment advisory contract on the totality of the circumstances and relevant factors and with a view to past and future long-term considerations. Not all of the factors and considerations identified above were necessarily relevant to the Fund, nor did the Board consider any one of them to be determinative. With respect to the factors that were relevant, the Board's decision to approve the continuation of the contract reflects its determination that Federated's performance and actions provided a satisfactory basis to support the decision to continue the existing arrangement.
Annual Shareholder Report
Voting Proxies on Fund Portfolio Securities
A description of the policies and procedures that the Fund uses to determine how to vote proxies, if any, relating to securities held in the Fund's portfolio is available, without charge and upon request, by calling 1-800-341-7400. A report on “Form N-PX” of how the Fund voted any such proxies during the most recent 12-month period ended June 30 is available via the Proxy Voting Record (Form N-PX) link associated with the Fund and share class name at www.FederatedInvestors.com/FundInformation. Form N-PX filings are also available at the SEC's website at www.sec.gov.
Quarterly Portfolio Schedule
The Fund files with the SEC a complete schedule of its portfolio holdings, as of the close of the first and third quarters of its fiscal year, on “Form N-Q.” These filings are available on the SEC's website at www.sec.gov and may be reviewed and copied at the SEC's Public Reference Room in Washington, DC. (Call 1-800-SEC-0330 for information on the operation of the Public Reference Room.) You may also access this information via the link to the Fund and share class name at www.FederatedInvestors.com/FundInformation.
Annual Shareholder Report
Mutual funds are not bank deposits or obligations, are not guaranteed by any bank and are not insured or guaranteed by the U.S. government, the Federal Deposit Insurance Corporation, the Federal Reserve Board or any other government agency. Investment in mutual funds involves investment risk, including the possible loss of principal.
This Report is authorized for distribution to prospective investors only when preceded or accompanied by the Fund's Prospectus, which contains facts concerning its objective and policies, management fees, expenses and other information.
Federated MDT Small Cap Core Fund
Federated Investors Funds
4000 Ericsson Drive
Warrendale, PA 15086-7561
Contact us at FederatedInvestors.com
or call 1-800-341-7400.
Federated Securities Corp., Distributor
CUSIP 31421R817
CUSIP 31421R791
CUSIP 31421R783
CUSIP 31421R627
37328 (9/16)
Federated is a registered trademark of Federated Investors, Inc.
2016 ©Federated Investors, Inc.
Annual Shareholder Report
July 31, 2016
| Share Class | Ticker |
| A | QASGX |
| B | QBSGX |
| C | QCSGX |
| Institutional | QISGX |
| R6 | QLSGX |
Federated MDT Small Cap Growth Fund
Fund Established 2005
A Portfolio of Federated MDT Series
Dear Valued Shareholder,
I am pleased to present the Annual Shareholder Report for your fund covering the period from August 1, 2015 through July 31, 2016. This report includes Management's Discussion of Fund Performance, a complete listing of your fund's holdings, performance information and financial statements along with other important fund information.
In addition, our website, FederatedInvestors.com, offers easy access to Federated resources that include timely fund updates, economic and market insights from our investment strategists, and financial planning tools. We invite you to register to take full advantage of its capabilities.
Thank you for investing with Federated. I hope you find this information useful and look forward to keeping you informed.
Sincerely,
J. Christopher Donahue, President
Not FDIC Insured • May Lose Value • No Bank Guarantee
CONTENTS
| 1 |
| 6 |
| 8 |
| 17 |
| 22 |
| 24 |
| 25 |
| 26 |
| 36 |
| 37 |
| 39 |
| 45 |
| 52 |
| 52 |
Management's Discussion of Fund Performance (unaudited)
The total return of Federated MDT Small Cap Growth Fund (the “Fund”), based on net asset value for the 12-month reporting period ended July 31, 2016 was 2.30% for Class A Shares, 1.58% for Class B Shares, 1.51% for Class C Shares, 2.56% for Institutional Shares and 2.39%1 for Class R6 Shares. The total return for the Russell 2000® Growth Index (R2000G),2 the Fund's broad-based securities market index, was -5.30% for the same period. The total return of the Morningstar Small Growth Funds Average (MSGFA),3 a peer group average for the Fund, was -5.12% during the same period. The Fund's and MSGFA's total returns for the most recently completed fiscal year reflected actual cash flows, transaction costs and other expenses, which were not reflected in the total return of the R2000G.
During the reporting period, the Fund's investment strategy focused on stock selection. This was the most significant factor affecting the Fund's performance relative to the R2000G during the period.
The following discussion will focus on the performance of the Fund's Institutional Shares.
MARKET OVERVIEW
During the reporting period, domestic equity market performance was moderate as evidenced by the 4.44% return on the Russell 3000® Index.4 Large-cap stocks led the way with the Russell Top 200® Index5 returning 5.04%, closely followed by mid-cap stocks with a 4.37% return on the Russell Midcap® Index.6 Small-cap stocks7 trailed with the Russell 2000® Index8 returning 0.00%. The lowest returning stocks were microcaps, with the Russell Microcap® Index9 returning -4.40%. Value stocks outperformed growth stocks during the reporting period with the Russell 3000® Value Index10 returning 5.39%, compared to 3.57% for the Russell 3000® Growth Index.11 The widest spread was in the Russell Microcap® Index, where the Russell Microcap® Value Index12 returned 1.78% while the Russell Microcap® Growth Index13 returned -12.38%. During the reporting period, less volatile stocks generally outperformed more volatile stocks and high dividend stocks outperformed stocks with lower dividends.
The best performing sectors in the R2000G during the reporting period were Telecommunication Services (33.21%), Consumer Staples (12.80%) and Materials (7.28%). Underperforming sectors during the same period included Energy (-33.37%), Health Care (-18.24%) and Consumer Discretionary (-8.51%).
STOCK SELECTION
The Fund buys stocks with many different combinations of fundamental and technical characteristics that have signaled market outperformance historically. When looking at the Fund from the point of view of these combinations of
Annual Shareholder Report
characteristics, the outperformance during the reporting period came primarily from stocks with high earnings-to-price ratios and high structural earnings. Stocks with strong conviction from sell-side analysts and high structural earnings also contributed favorably. The most negative offset to Fund performance came from poor stock selection among stocks with lower earnings-to-price ratios and structural earnings.
The Fund's sector exposures continued to remain close to R2000G weights, but with overweights in Consumer Discretionary and Industrials and underweights in Financials and Health Care. Strong stock selection in the Consumer Discretionary and Health Care sectors contributed the most positively to Fund performance. Additional contribution came from favorable stock selection in the Industrials and Materials sectors. Poor stock selection in the Financials sector detracted the most from Fund performance.
Individual stocks enhancing the Fund's performance included Weight Watchers International, Belden Incorporated and Nortek Incorporated.
Individual stocks detracting from the Fund's performance included Ultra Petroleum Corporation, Aegerion Pharmaceuticals Incorporated and Newlink Genetics Corporation.
| 1 | The Fund's Class R6 Shares commenced operations on June 29, 2016. For the period prior to the commencement of operations of Class R6 Shares, the performance information shown is for the Fund's Institutional Shares adjusted to reflect expenses of the Class R6 Shares for each year for which the gross expenses of Class R6 Shares would have exceeded the actual expenses paid by Institutional Shares. |
| 2 | Please see the footnotes to the line graphs below for definitions of, and further information about, the R2000G. |
| 3 | Please see the footnotes to the line graphs below for definitions of, and further information about, the MSGFA. |
| 4 | The Russell 3000® Index measures the performance of the largest 3,000 U.S. companies representing approximately 98% of the investable U.S. equity market. The Russell 3000® Index is constructed to provide a comprehensive, unbiased, and stable barometer of the broad market and is completely reconstituted annually to ensure new and growing equities are reflected. The index is unmanaged, and it is not possible to invest directly in an index. |
| 5 | The Russell Top 200® Index measures the performance of the largest cap segment of the U.S. equity universe. The Russell Top 200® Index is a subset of the Russell 3000® Index. It includes approximately 200 of the largest securities based on a combination of their market cap and current index membership and represents approximately 68% of the U.S. market. The Russell Top 200® Index is constructed to provide a comprehensive and unbiased barometer for this very large cap segment and is completely reconstituted annually to ensure new and growing equities are reflected. The index is unmanaged, and it is not possible to invest directly in an index. |
| 6 | The Russell Midcap® Index measures the performance of the mid-cap segment of the U.S. equity universe. The Russell Midcap® Index is a subset of the Russell 1000® Index. It includes approximately 800 of the smallest securities based on a combination of their market cap and current index membership. The Russell Midcap® Index represents approximately 31% of the total market capitalization of the Russell 1000® companies. The Russell Midcap® Index is constructed to provide a comprehensive and unbiased barometer for the mid-cap segment. The Russell Midcap® Index is completely reconstituted annually to ensure larger stocks do not distort the performance and characteristics of the true mid-cap opportunity set. The index is unmanaged, and it is not possible to invest directly in an index. |
| 7 | Small-cap stocks may be less liquid and subject to greater price volatility than large-cap stocks. |
Annual Shareholder Report
| 8 | The Russell 2000® Index measures the performance of the small-cap segment of the U.S. equity universe. The Russell 2000® Index is a subset of the Russell 3000® Index representing approximately 10% of the total market capitalization of that index. It includes approximately 2000 of the smallest securities based on a combination of their market cap and current index membership. The Russell 2000® Index is constructed to provide a comprehensive and unbiased small-cap barometer and is completely reconstituted annually to ensure larger stocks do not distort the performance and characteristics of the true small-cap opportunity set. The index is unmanaged, and it is not possible to invest directly in an index. |
| 9 | The Russell Microcap® Index measures the performance of the microcap segment of the U.S. equity market. Microcap stocks make up less than 3% of the U.S. equity market (by market cap) and consist of the smallest 1,000 securities in the small-cap Russell 2000® Index, plus the next 1,000 smallest eligible securities by market cap. The Russell Microcap® Index is constructed to provide a comprehensive and unbiased barometer for the microcap segment trading on national exchanges and is completely reconstituted annually to ensure new and growing equities are reflected and companies continue to reflect appropriate capitalization and value characteristics. The Russell Microcap® Index is unmanaged, and it is not possible to invest directly in an index. |
| 10 | The Russell 3000® Value Index measures the performance of the broad value segment of the U.S. equity value universe. It includes those Russell 3000® Index companies with lower price-to-book ratios and lower forecasted growth values. The Russell 3000® Value Index is constructed to provide a comprehensive, unbiased and stable barometer of the broad value market. The Russell 3000® Value Index is completely reconstituted annually to ensure new and growing equities are included and that the represented companies continue to reflect value characteristics. The index is unmanaged, and it is not possible to invest directly in an index. |
| 11 | The Russell 3000® Growth Index measures the performance of the broad growth segment of the U.S. equity universe. It includes those Russell 3000® Index companies with higher price-to-book ratios and higher forecasted growth values. The Russell 3000® Growth Index is constructed to provide a comprehensive, unbiased and stable barometer of the broad growth market. The Russell 3000® Growth Index is completely reconstituted annually to ensure new and growing equities are included and that the represented companies continue to reflect growth characteristics. The index is unmanaged, and it is not possible to invest directly in an index. |
| 12 | The Russell Microcap® Value Index measures the performance of the micro-cap value segment of the U.S. equity universe. It includes those Russell Microcap® Index companies with higher price-to-book ratios and lower forecasted growth values. The Russell Microcap® Value Index is constructed to provide a comprehensive, unbiased and stable barometer of the micro-cap value market. The Russell Microcap Value Index is completely reconstituted annually to ensure new and growing equities are included and that the represented companies continue to reflect value characteristics. The index is unmanaged, and it is not possible to invest directly in an index. |
| 13 | The Russell Microcap® Growth Index measures the performance of the microcap growth segment of the U.S. equity market. It includes Russell Microcap companies that are considered more growth oriented relative to the overall market as defined by Russell's leading style methodology. The Russell Microcap® Growth Index is constructed to provide a comprehensive and unbiased barometer for the microcap growth segment of the market. The Russell Microcap® Growth Index is completely reconstituted annually to ensure larger stocks do not distort performance and characteristics of the microcap opportunity set. The Russell Microcap® Growth Index is unmanaged, and it is not possible to invest directly in an index. |
Annual Shareholder Report
FUND PERFORMANCE AND GROWTH OF A $10,000 INVESTMENT
The graph below illustrates the hypothetical investment of $10,0001 in the Federated MDT Small Cap Growth Fund2 from July 31, 2006 to July 31, 2016, compared to the Russell 2000 Growth® Index (R2000G)3 and the Morningstar Small Growth Funds Average (MSGFA).4 The Average Annual Total Return table below shows returns for each class averaged over the stated periods.
Growth of a $10,000 Investment
Growth of $10,000 as of July 31, 2016

| Federated MDT Small Cap Growth Fund - | NA | Class C Shares | Institutional Shares | R2000G | MSGFA |
| NA | F | F | I | I |
| 7/31/2006 | | 10,000 | 10,000 | 10,000 | 10,000 |
| 7/31/2007 | | 12,139 | 12,271 | 11,683 | 11,786 |
| 7/31/2008 | | 10,817 | 11,046 | 11,244 | 10,462 |
| 7/31/2009 | | 7,281 | 7,512 | 8,898 | 8,254 |
| 7/31/2010 | | 8,055 | 8,384 | 10,386 | 9,669 |
| 7/31/2011 | | 11,084 | 11,661 | 13,430 | 12,514 |
| 7/31/2012 | | 10,826 | 11,500 | 13,362 | 12,232 |
| 7/31/2013 | | 14,515 | 15,574 | 18,090 | 16,109 |
| 7/31/2014 | | 15,547 | 16,853 | 19,706 | 17,433 |
| 7/31/2015 | | 18,184 | 19,903 | 23,662 | 20,301 |
| 7/31/2016 | | 18,458 | 20,412 | 22,407 | 19,235 |
41 graphic description end -->
| ■ | Total returns shown for Class C Shares include the maximum contingent deferred sales charge of 1.00% as applicable. |
The Fund offers multiple share classes whose performance may be greater than or less than its other share class(es) due to differences in sales charges and expenses. See the Average Annual Total Return table below for the returns of additional classes not shown in the line graph above.
Average Annual Total Returns for the Period Ended 7/31/2016
(returns reflect all applicable sales charges and contingent deferred sales charges as specified below in footnote #1)
| | 1 Year | 5 Years | 10 Years |
| Class A Shares | -3.32% | 10.32% | 6.51% |
| Class B Shares | -3.08% | 10.47% | 6.49% |
| Class C Shares | 0.66% | 10.74% | 6.32% |
| Institutional Shares | 2.56% | 11.85% | 7.40% |
| Class R6 Shares5 | 2.39% | 11.68% | 6.58% |
| R2000G | -5.30% | 10.78% | 8.40% |
| MSGFA | -5.12% | 9.32% | 7.66% |
Annual Shareholder Report
Performance data quoted represents past performance which is no guarantee of future results. Investment return and principal value will fluctuate so that an investor's shares, when redeemed, may be worth more or less than their original cost. Mutual fund performance changes over time and current performance may be lower or higher than what is stated. For current to the most recent month-end performance and after-tax returns, visit FederatedInvestors.com or call 1-800-341-7400. Returns shown do not reflect the deduction of taxes that a shareholder would pay on Fund distributions or the redemption of Fund shares. Mutual funds are not obligations of or guaranteed by any bank and are not federally insured.
| 1 | Represents a hypothetical investment of $10,000 in the Fund after deducting applicable sales charges: for Class A Shares, the maximum sales charge of 5.50% ($10,000 investment minus $550 sales charges = $9,450); for Class B Shares, the maximum contingent deferred sales charge is 5.50% on any redemption less than one year from the purchase date; for Class C Shares, a 1.00% contingent deferred sales charge would be applied to any redemption less than one year from the purchase date. The Fund's performance assumes the reinvestment of all dividends and distributions. The R2000G and MSGFA have been adjusted to reflect reinvestment of dividends on securities. |
| 2 | The Fund is the successor to the MDT Small Cap Growth Fund pursuant to a reorganization that took place on December 8, 2006. Prior to that date, the Fund had no investment operations. Accordingly, the performance information shown for periods prior to that date is that of the MDT Small Cap Growth Fund. |
| 3 | The R2000G measures the performance of the small-cap growth segment of the U.S. equity universe. It includes those Russell 2000® Index companies with higher price-to-value ratios and higher forecasted growth values. The R2000G is constructed to provide a comprehensive and unbiased barometer for the small-cap growth segment. The R2000G is completely reconstituted annually to ensure larger stocks do not distort the performance and characteristics of the true small-cap opportunity set and that the represented companies continue to reflect growth characteristics. The R2000G is unmanaged and, unlike the Fund, is not affected by cash flows. It is not possible to invest directly in an index. The R2000G is not adjusted to reflect sales charges, expenses or other fees that the Securities and Exchange Commission requires to be reflected in the Fund's performance. |
| 4 | Morningstar figures represent the average of the total returns reported by all the mutual funds designated by Morningstar as falling into the respective category indicated. They do not reflect sales charges. |
| 5 | The Fund's Class R6 Shares commenced operations on June 29, 2016. It is anticipated that this class will have the lowest net expenses of all outstanding share classes. For the period prior to the commencement of operations of Class R6 Shares, the performance information shown is for the Fund's Institutional Shares adjusted to reflect expenses of the Class R6 Shares for each year for which the gross expenses of Class R6 Shares would have exceeded the actual expenses paid by Institutional Shares. |
Annual Shareholder Report
Portfolio of Investments Summary Table (unaudited)
At July 31, 2016, the Fund's industry composition1 was as follows:
| Industry Composition | Percentage of
Total Net Assets |
| Software Packaged/Custom | 7.2% |
| Biotechnology | 6.7% |
| Specialty Retailing | 5.5% |
| Health Care Equipment & Supplies | 3.8% |
| Specialty Chemicals | 3.3% |
| Internet Services | 2.9% |
| Auto Original Equipment Manufacturers | 2.7% |
| Telecommunication Equipment & Services | 2.7% |
| Services to Medical Professionals | 2.5% |
| Miscellaneous Communications | 2.4% |
| Airline—Regional | 2.3% |
| Office Furniture | 2.3% |
| Financial Services | 2.2% |
| Broadcasting | 2.1% |
| Property Liability Insurance | 2.0% |
| Semiconductor Manufacturing Equipment | 1.9% |
| Professional Services | 1.7% |
| Medical Supplies | 1.6% |
| Contracting | 1.5% |
| Dairy Products | 1.5% |
| Software | 1.5% |
| Home Products | 1.4% |
| Electric & Electronic Original Equipment Manufacturers | 1.3% |
| Electrical Equipment | 1.3% |
| Home Health Care | 1.3% |
| Pharmaceuticals | 1.3% |
| Recreational Goods | 1.3% |
| Truck Manufacturing | 1.3% |
| Clothing Stores | 1.2% |
| Cogeneration | 1.2% |
| Internet Software & Services | 1.2% |
| Personnel Agency | 1.2% |
| Undesignated Consumer Staples | 1.2% |
| Apparel | 1.1% |
| Furniture | 1.1% |
| Health Care Providers & Services | 1.1% |
| IT Services | 1.1% |
Annual Shareholder Report
| Industry Composition | Percentage of
Total Net Assets |
| Photo-Optical Component-Equipment | 1.1% |
| Semiconductor Manufacturing | 1.1% |
| Machinery | 1.0% |
| Other2 | 15.0% |
| Cash Equivalents3 | 2.1% |
| Other Assets and Liabilities—Net4 | (0.2)% |
| TOTAL | 100.0% |
| 1 | Except for Cash Equivalents and Other Assets and Liabilities, industry classifications are based upon, and individual portfolio securities are assigned to, the classifications of the Global Industry Classification Standard (GICS) except that the Adviser assigns a classification to securities not classified by the GICS and to securities for which the Adviser does not have access to the classification made by the GICS. |
| 2 | For purposes of this table, industry classifications which constitute less than 1.0% of the Fund's total net assets have been aggregated under the designation “Other.” |
| 3 | Cash Equivalents include any investments in money market mutual funds and/or overnight repurchase agreements. |
| 4 | Assets, other than investments in securities, less liabilities. See Statement of Assets and Liabilities. |
Annual Shareholder Report
Portfolio of Investments
July 31, 2016
| Shares | | | Value |
| | | COMMON STOCKS—98.1% | |
| | | Airline - Regional—2.3% | |
| 5,972 | | Allegiant Travel Co. | $774,986 |
| 23,600 | 1 | Hawaiian Holdings, Inc. | 1,074,508 |
| | | TOTAL | 1,849,494 |
| | | Apparel—1.1% | |
| 28,972 | 1 | Express, Inc. | 433,421 |
| 8,162 | | Oxford Industries, Inc. | 466,703 |
| | | TOTAL | 900,124 |
| | | Auto Original Equipment Manufacturers—2.7% | |
| 33,393 | 1 | American Axle & Manufacturing Holdings, Inc. | 581,372 |
| 77,507 | 1 | Commercial Vehicle Group, Inc. | 320,879 |
| 9,791 | 1 | Stoneridge, Inc. | 163,314 |
| 18,238 | 1 | Tenneco, Inc. | 1,030,812 |
| | | TOTAL | 2,096,377 |
| | | Auto Part Replacement—0.2% | |
| 10,232 | | Supreme Industries, Inc. | 171,898 |
| | | Biotechnology—6.7% | |
| 117,234 | 1 | Aegerion Pharmaceuticals, Inc. | 168,818 |
| 9,395 | 1 | Anika Therapeutics, Inc. | 468,998 |
| 4,257 | 1 | Applied Genetic Technologies Corp. | 63,983 |
| 15,852 | 1 | Ariad Pharmaceuticals, Inc. | 150,753 |
| 3,175 | 1 | Cambrex Corp. | 166,402 |
| 104,454 | 1 | Celldex Therapeutics, Inc. | 482,578 |
| 11,828 | 1 | Clovis Oncology, Inc. | 168,904 |
| 11,786 | 1 | Esperion Therapeutics, Inc. | 127,996 |
| 11,939 | 1 | Five Prime Therapeutics, Inc. | 605,188 |
| 52,904 | 1 | INSYS Therapeutics, Inc. | 827,948 |
| 22,740 | 1 | Nektar Therapeutics | 393,175 |
| 62,942 | 1 | NewLink Genetics Corp. | 665,926 |
| 3,541 | 1 | Ophthotech Corp. | 227,474 |
| 18,038 | 1 | Osiris Therapeutics, Inc. | 90,190 |
| 84,022 | | PDL BioPharma, Inc. | 295,757 |
| 12,828 | 1 | Xencor, Inc. | 242,962 |
| 35,482 | 1 | Zafgen, Inc. | 107,865 |
| | | TOTAL | 5,254,917 |
Annual Shareholder Report
| Shares | | | Value |
| | | COMMON STOCKS—continued | |
| | | Broadcasting—2.1% | |
| 9,285 | | Nexstar Broadcasting Group, Inc., Class A | $469,357 |
| 42,527 | | Sinclair Broadcast Group, Inc. | 1,183,101 |
| | | TOTAL | 1,652,458 |
| | | Building Products—0.7% | |
| 34,885 | 1 | Ply Gem Holdings, Inc. | 535,834 |
| | | Clothing Stores—1.2% | |
| 46,704 | | American Eagle Outfitters, Inc. | 836,936 |
| 7,653 | 1 | Francesca's Holdings Corp. | 97,269 |
| | | TOTAL | 934,205 |
| | | Cogeneration—1.2% | |
| 36,869 | 1 | Headwaters, Inc. | 733,324 |
| 86,100 | 1 | Rentech, Inc. | 220,416 |
| | | TOTAL | 953,740 |
| | | Computer Networking—0.2% | |
| 6,264 | 1 | Cray, Inc. | 197,692 |
| | | Computer Peripherals—0.6% | |
| 6,615 | 1 | Synaptics, Inc. | 343,649 |
| 15,673 | 1 | Zagg, Inc. | 99,210 |
| | | TOTAL | 442,859 |
| | | Computer Stores—0.2% | |
| 6,322 | 1 | Insight Enterprises, Inc. | 168,165 |
| | | Consumer Finance—0.9% | |
| 80,396 | 1 | Enova International, Inc. | 730,800 |
| | | Contracting—1.5% | |
| 21,700 | | Comfort Systems USA, Inc. | 659,246 |
| 53,320 | | Harsco Corp. | 522,003 |
| | | TOTAL | 1,181,249 |
| | | Dairy Products—1.5% | |
| 64,365 | | Dean Foods Co. | 1,188,178 |
| | | Defense Aerospace—0.2% | |
| 7,587 | 1 | Ducommun, Inc. | 146,733 |
| | | Diversified Leisure—0.7% | |
| 28,509 | 1 | Isle of Capri Casinos, Inc. | 533,974 |
| | | Diversified Telecommunication Services—0.5% | |
| 27,526 | 1 | 8x8, Inc. | 378,482 |
| | | Education & Training Services—0.1% | |
| 3,960 | 1 | American Public Education, Inc. | 113,414 |
Annual Shareholder Report
| Shares | | | Value |
| | | COMMON STOCKS—continued | |
| | | Electric & Electronic Original Equipment Manufacturers—1.3% | |
| 17,252 | 1 | Generac Holdings, Inc. | $651,953 |
| 24,540 | | General Cable Corp. | 361,474 |
| | | TOTAL | 1,013,427 |
| | | Electrical Equipment—1.3% | |
| 14,244 | | Belden, Inc. | 1,042,803 |
| | | Electronic Components—0.2% | |
| 29,628 | 1 | Oclaro, Inc. | 169,768 |
| | | Electronic Instruments—0.8% | |
| 55,331 | 1 | Ixia | 636,306 |
| | | Energy Equipment & Services—0.3% | |
| 18,230 | 1 | RigNet, Inc. | 217,849 |
| | | Ethical Drugs—0.5% | |
| 2,731 | 1 | Ligand Pharmaceuticals, Inc., Class B | 368,357 |
| | | Financial Services—2.2% | |
| 20,021 | | Deluxe Corp. | 1,353,220 |
| 26,420 | | Liberty Tax, Inc. | 366,181 |
| | | TOTAL | 1,719,401 |
| | | Food Products—0.5% | |
| 27,959 | 1 | Amplify Snack Brands, Inc. | 398,695 |
| | | Furniture—1.1% | |
| 7,576 | | Bassett Furniture Industries, Inc. | 195,688 |
| 18,446 | | Ethan Allen Interiors, Inc. | 640,630 |
| | | TOTAL | 836,318 |
| | | Health Care Equipment & Supplies—3.8% | |
| 9,978 | 1 | Cardiovascular Systems, Inc. | 195,669 |
| 13,461 | 1 | iRadimed Corp. | 260,605 |
| 129,167 | 1 | Lantheus Holdings, Inc. | 548,960 |
| 31,107 | | LeMaitre Vascular, Inc. | 535,040 |
| 25,030 | 1 | Masimo Corp. | 1,325,839 |
| 36,232 | 1 | RTI Surgical, Inc. | 117,754 |
| | | TOTAL | 2,983,867 |
| | | Health Care Providers & Services—1.1% | |
| 18,869 | 1 | PRA Health Sciences, Inc. | 875,144 |
| | | Home Health Care—1.3% | |
| 7,043 | 1 | Amedisys, Inc. | 377,153 |
| 42,759 | 1 | Cross Country Healthcare, Inc. | 625,136 |
| | | TOTAL | 1,002,289 |
Annual Shareholder Report
| Shares | | | Value |
| | | COMMON STOCKS—continued | |
| | | Home Products—1.4% | |
| 61,452 | | Libbey, Inc. | $1,148,538 |
| | | Hotels and Motels—0.5% | |
| 19,909 | 1 | Boyd Gaming Corp. | 390,415 |
| | | Insurance Brokerage—0.1% | |
| 12,716 | 1 | eHealth, Inc. | 121,438 |
| | | Internet Services—2.9% | |
| 71,612 | | EarthLink Network, Inc. | 485,529 |
| 23,546 | 1 | Etsy, Inc. | 236,873 |
| 18,430 | | j2 Global, Inc. | 1,231,861 |
| 16,866 | 1 | Web.com Group, Inc. | 318,093 |
| | | TOTAL | 2,272,356 |
| | | Internet Software & Services—1.2% | |
| 11,878 | 1 | Apigee Corp. | 147,762 |
| 8,029 | 1 | Brightcove, Inc. | 84,064 |
| 26,772 | 1 | Care.com, Inc. | 294,224 |
| 9,499 | 1 | Cornerstone OnDemand, Inc. | 410,262 |
| | | TOTAL | 936,312 |
| | | IT Services—1.1% | |
| 24,988 | | Hackett Group, Inc. | 334,589 |
| 39,685 | | Travelport Worldwide Ltd. | 535,351 |
| | | TOTAL | 869,940 |
| | | Life Sciences Tools & Services—0.9% | |
| 15,504 | 1 | INC Research Holdings, Inc. | 690,083 |
| | | Machinery—1.0% | |
| 28,693 | | Global Brass & Copper Holdings, Inc. | 812,586 |
| | | Medical Supplies—1.6% | |
| 5,158 | 1 | Cutera, Inc. | 55,655 |
| 19,239 | 1 | NuVasive, Inc. | 1,196,666 |
| | | TOTAL | 1,252,321 |
| | | Medical Technology—0.5% | |
| 9,159 | 1 | Vascular Solutions, Inc. | 420,123 |
| | | Miscellaneous Communications—2.4% | |
| 38,060 | 1 | FairPoint Communications, Inc. | 616,191 |
| 107,732 | 1 | Internap Network Services Corp. | 239,165 |
| 13,357 | | Shenandoah Telecommunications Co. | 548,706 |
| 22,828 | | West Corp. | 504,727 |
| | | TOTAL | 1,908,789 |
Annual Shareholder Report
| Shares | | | Value |
| | | COMMON STOCKS—continued | |
| | | Miscellaneous Components—0.8% | |
| 33,517 | 1 | Nanometrics, Inc. | $671,681 |
| | | Multi-Industry Capital Goods—0.7% | |
| 7,258 | 1 | DXP Enterprises, Inc. | 120,773 |
| 9,756 | | EnPro Industries, Inc. | 446,337 |
| | | TOTAL | 567,110 |
| | | Office Furniture—2.3% | |
| 38,063 | | Knoll, Inc. | 961,091 |
| 25,487 | | Miller Herman, Inc. | 835,209 |
| | | TOTAL | 1,796,300 |
| | | Oil Service, Explore & Drill—0.2% | |
| 10,374 | 1 | PetroQuest Energy, Inc. | 33,508 |
| 33,657 | 1 | Pioneer Energy Services Corp. | 106,020 |
| | | TOTAL | 139,528 |
| | | Other Communications Equipment—0.7% | |
| 11,203 | 1 | Netgear, Inc. | 576,170 |
| | | Paper Products—0.6% | |
| 65,895 | 1 | Xerium Technologies, Inc. | 490,918 |
| | | Personal Loans—0.4% | |
| 8,019 | 1 | World Acceptance Corp. | 348,506 |
| | | Personnel Agency—1.2% | |
| 14,522 | 1 | AMN Healthcare Services, Inc. | 614,281 |
| 17,042 | | KForce Com, Inc. | 304,370 |
| | | TOTAL | 918,651 |
| | | Pharmaceuticals—1.3% | |
| 5,573 | 1 | ANI Pharmaceuticals, Inc. | 337,724 |
| 39,781 | 1 | Innoviva, Inc. | 511,981 |
| 36,352 | 1 | Tetraphase Pharmaceuticals, Inc. | 146,135 |
| | | TOTAL | 995,840 |
| | | Photo-Optical Component-Equipment—1.1% | |
| 7,938 | 1 | Coherent, Inc. | 841,825 |
| | | Printing—0.2% | |
| 6,027 | | Quad Graphics, Inc. | 152,845 |
| | | Professional Services—1.7% | |
| 6,749 | | CEB, Inc. | 405,210 |
| 9,407 | | Insperity, Inc. | 738,355 |
| 3,274 | 1 | WageWorks, Inc. | 202,366 |
| | | TOTAL | 1,345,931 |
Annual Shareholder Report
| Shares | | | Value |
| | | COMMON STOCKS—continued | |
| | | Property Liability Insurance—2.0% | |
| 23,370 | | Employers Holdings, Inc. | $666,512 |
| 7,143 | | HCI Group, Inc. | 215,433 |
| 14,649 | | Heritage Insurance Holdings, Inc. | 181,501 |
| 22,320 | | Universal Insurance Holdings, Inc. | 485,237 |
| | | TOTAL | 1,548,683 |
| | | Real Estate Management & Development—0.4% | |
| 14,475 | 1 | Altisource Portfolio Solutions S.A. | 336,689 |
| | | Recreational Goods—1.3% | |
| 24,599 | 1 | Scientific Games Holdings Corp. | 262,103 |
| 27,274 | 1 | Smith & Wesson Holding Corp. | 803,219 |
| | | TOTAL | 1,065,322 |
| | | Road & Rail—0.2% | |
| 17,851 | 1 | Roadrunner Transportation Systems, Inc. | 135,132 |
| | | Semiconductor Manufacturing—1.1% | |
| 41,565 | 1 | Advanced Micro Devices, Inc. | 285,136 |
| 12,330 | 1 | Cirrus Logic, Inc. | 599,115 |
| | | TOTAL | 884,251 |
| | | Semiconductor Manufacturing Equipment—1.9% | |
| 22,057 | 1 | Advanced Energy Industries, Inc. | 898,161 |
| 19,339 | | Tessera Technologies, Inc. | 621,555 |
| | | TOTAL | 1,519,716 |
| | | Semiconductors & Semiconductor Equipment—0.3% | |
| 9,402 | 1 | MaxLinear, Inc. | 205,058 |
| | | Services to Medical Professionals—2.5% | |
| 19,730 | 1 | Advisory Board Co. | 823,925 |
| 18,766 | 1 | WebMD Health Corp., Class A | 1,144,913 |
| | | TOTAL | 1,968,838 |
| | | Software—1.5% | |
| 20,891 | 1 | Mitek Systems, Inc. | 157,727 |
| 6,990 | 1 | Proofpoint, Inc. | 530,331 |
| 2,852 | 1 | Varonis Systems, Inc. | 73,268 |
| 17,988 | 1 | Xactly Corp. | 223,411 |
| 7,254 | 1 | Zendesk, Inc. | 219,361 |
| | | TOTAL | 1,204,098 |
| | | Software Packaged/Custom—7.2% | |
| 5,857 | 1 | Barracuda Networks, Inc. | 129,323 |
| 5,863 | 1 | BroadSoft, Inc. | 262,838 |
| 3,635 | | CSG Systems International, Inc. | 146,345 |
Annual Shareholder Report
| Shares | | | Value |
| | | COMMON STOCKS—continued | |
| | | Software Packaged/Custom—continued | |
| 4,817 | 1 | Commvault Systems, Inc. | $249,232 |
| 14,298 | | Ebix, Inc. | 762,369 |
| 8,367 | 1 | Ellie Mae, Inc. | 770,684 |
| 50,306 | 1 | Five9, Inc. | 634,359 |
| 3,162 | 1 | Fleetmatics Group PLC | 135,839 |
| 4,006 | 1 | Guidewire Software, Inc. | 246,249 |
| 8,602 | 1 | Paycom Software, Inc. | 406,100 |
| 3,467 | 1 | Paylocity Corp. | 154,767 |
| 9,221 | | Pegasystems, Inc. | 257,266 |
| 11,958 | 1 | Perficient, Inc. | 265,707 |
| 2,475 | 1 | Qualys, Inc. | 77,690 |
| 11,252 | 1 | RealPage, Inc. | 282,988 |
| 7,305 | | Sapiens International Corp. NV | 93,358 |
| 3,783 | 1 | Take-Two Interactive Software, Inc. | 152,001 |
| 17,799 | 1 | Verint Systems, Inc. | 627,771 |
| | | TOTAL | 5,654,886 |
| | | Specialty Chemicals—3.3% | |
| 21,195 | | KMG Chemicals, Inc. | 582,651 |
| 13,295 | 1 | Koppers Holdings, Inc. | 420,388 |
| 31,898 | | Trinseo SA | 1,588,201 |
| | | TOTAL | 2,591,240 |
| | | Specialty Retailing—5.5% | |
| 15,265 | | Big Lots, Inc. | 811,793 |
| 7,589 | 1 | Build-A-Bear Workshop, Inc. | 103,438 |
| 26,320 | | GNC Holdings, Inc. | 537,191 |
| 6,600 | 1 | Kirkland's, Inc. | 100,584 |
| 7,453 | | Outerwall, Inc. | 392,475 |
| 111,263 | | Pier 1 Imports, Inc. | 569,667 |
| 35,274 | 1 | Restoration Hardware, Inc. | 1,086,792 |
| 48,116 | | Tailored Brands, Inc. | 704,899 |
| | | TOTAL | 4,306,839 |
| | | Technology Hardware Storage & Peripherals—0.3% | |
| 44,131 | | CPI Card Group, Inc. | 208,298 |
| | | Telecommunication Equipment & Services—2.7% | |
| 7,969 | 1 | Dycom Industries, Inc. | 749,484 |
| 9,697 | 1 | Gigamon, Inc. | 453,044 |
| 10,970 | 1 | NeuStar, Inc., Class A | 276,334 |
| 13,827 | 1 | Sonus Networks, Inc. | 119,189 |
Annual Shareholder Report
| Shares | | | Value |
| | | COMMON STOCKS—continued | |
| | | Telecommunication Equipment & Services—continued | |
| 12,275 | 1 | Ubiquiti Networks, Inc. | $548,938 |
| | | TOTAL | 2,146,989 |
| | | Thrifts & Mortgage Finance—0.5% | |
| 17,809 | 1 | Walker & Dunlop, Inc. | 421,539 |
| | | Truck Manufacturing—1.3% | |
| 18,837 | 1 | Accuride Corp. | 25,241 |
| 67,983 | 1 | Wabash National Corp. | 984,394 |
| | | TOTAL | 1,009,635 |
| | | Undesignated Consumer Cyclicals—0.8% | |
| 11,522 | 1 | Strayer Education, Inc. | 526,786 |
| 12,510 | | Weight Watchers International, Inc. | 149,244 |
| | | TOTAL | 676,030 |
| | | Undesignated Consumer Staples—1.2% | |
| 26,224 | | Medifast, Inc. | 923,609 |
| | | Undesignated Technology—0.3% | |
| 53,874 | 1 | American Reprographics Co. | 212,264 |
| | | TOTAL COMMON STOCKS
(IDENTIFIED COST $72,312,811) | 77,382,139 |
| | | INVESTMENT COMPANY—2.1% | |
| 1,660,718 | 2 | Federated Institutional Prime Value Obligations Fund, Institutional Shares, 0.36%3
(AT NET ASSET VALUE) | 1,660,718 |
| | | TOTAL INVESTMENTS—100.2%
(IDENTIFIED COST $73,973,529)4 | 79,042,857 |
| | | OTHER ASSETS AND LIABILITIES - NET—(0.2)%5 | (158,434) |
| | | TOTAL NET ASSETS—100% | $78,884,423 |
| 1 | Non-income-producing security. |
| 2 | Affiliated holding. |
| 3 | 7-day net yield. |
| 4 | The cost of investments for federal tax purposes amounts to $74,358,469. |
| 5 | Assets, other than investments in securities, less liabilities. See Statement of Assets and Liabilities. |
Note: The categories of investments are shown as a percentage of total net assets at July 31, 2016.
Annual Shareholder Report
Various inputs are used in determining the value of the Fund's investments. These inputs are summarized in the three broad levels listed below:
Level 1—quoted prices in active markets for identical securities.
Level 2—other significant observable inputs (including quoted prices for similar securities, interest rates, prepayment speeds, credit risk, etc.). Also includes securities valued at amortized cost.
Level 3—significant unobservable inputs (including the Fund's own assumptions in determining the fair value of investments).
The inputs or methodology used for valuing securities are not an indication of the risk associated with investing in those securities.
As of July 31, 2016, all investments of the Fund utilized Level 1 inputs in valuing the Fund's assets carried at fair value.
See Notes which are an integral part of the Financial Statements
Annual Shareholder Report
Financial Highlights–Class A Shares
(For a Share Outstanding Throughout Each Period)
| Year Ended July 31 | 2016 | 2015 | 2014 | 2013 | 2012 |
| Net Asset Value, Beginning of Period | $20.49 | $17.39 | $16.12 | $11.93 | $12.12 |
| Income From Investment Operations: | | | | | |
| Net investment income (loss) | (0.06)1 | (0.12)1 | (0.18)1 | (0.07)1 | (0.09)1 |
| Net realized and unrealized gain (loss) on investments | 0.32 | 3.22 | 1.45 | 4.26 | (0.10) |
| TOTAL FROM INVESTMENT OPERATIONS | 0.26 | 3.10 | 1.27 | 4.19 | (0.19) |
| Less Distributions: | | | | | |
| Distributions from net realized gain on investments | (3.09) | — | — | — | — |
| TOTAL DISTRIBUTIONS | (3.09) | — | — | — | — |
| Net Asset Value, End of Period | $17.66 | $20.49 | $17.39 | $16.12 | $11.93 |
| Total Return2 | 2.30% | 17.83% | 7.88% | 35.12% | (1.57)% |
| Ratios to Average Net Assets: | | | | | |
| Net expenses | 1.13% | 1.54% | 1.75% | 1.75% | 1.75% |
| Net investment income (loss) | (0.34)% | (0.66)% | (1.05)% | (0.49)% | (0.79)% |
| Expense waiver/reimbursement3 | 1.00% | 0.61% | 0.43% | 0.59% | 1.04% |
| Supplemental Data: | | | | | |
| Net assets, end of period (000 omitted) | $29,707 | $32,136 | $29,690 | $30,187 | $22,718 |
| Portfolio turnover | 198% | 121% | 61% | 88% | 69% |
| 1 | Per share numbers have been calculated using the average shares method. |
| 2 | Based on net asset value, which does not reflect the sales charge, redemption fee or contingent deferred sales charge, if applicable. |
| 3 | This expense decrease is reflected in both the net expense and the net investment income (loss) ratios shown above. |
See Notes which are an integral part of the Financial Statements
Annual Shareholder Report
Financial Highlights–Class B Shares
(For a Share Outstanding Throughout Each Period)
| Year Ended July 31 | 2016 | 2015 | 2014 | 2013 | 2012 |
| Net Asset Value, Beginning of Period | $19.51 | $16.69 | $15.58 | $11.62 | $11.90 |
| Income From Investment Operations: | | | | | |
| Net investment income (loss) | (0.18)1 | (0.25)1 | (0.30)1 | (0.17)1 | (0.17)1 |
| Net realized and unrealized gain (loss) on investments | 0.29 | 3.07 | 1.41 | 4.13 | (0.11) |
| TOTAL FROM INVESTMENT OPERATIONS | 0.11 | 2.82 | 1.11 | 3.96 | (0.28) |
| Less Distributions: | | | | | |
| Distributions from net realized gain on investments | (3.09) | — | — | — | — |
| TOTAL DISTRIBUTIONS | (3.09) | — | — | — | — |
| Net Asset Value, End of Period | $16.53 | $19.51 | $16.69 | $15.58 | $11.62 |
| Total Return2 | 1.58% | 16.90% | 7.12% | 34.08% | (2.35)% |
| Ratios to Average Net Assets: | | | | | |
| Net expenses | 1.88% | 2.27% | 2.50% | 2.50% | 2.50% |
| Net investment income (loss) | (1.09)% | (1.38)% | (1.79)% | (1.25)% | (1.55)% |
| Expense waiver/reimbursement3 | 0.99% | 0.63% | 0.43% | 0.59% | 1.06% |
| Supplemental Data: | | | | | |
| Net assets, end of period (000 omitted) | $1,899 | $2,327 | $1,842 | $2,016 | $1,640 |
| Portfolio turnover | 198% | 121% | 61% | 88% | 69% |
| 1 | Per share numbers have been calculated using the average shares method. |
| 2 | Based on net asset value, which does not reflect the sales charge, redemption fee or contingent deferred sales charge, if applicable. |
| 3 | This expense decrease is reflected in both the net expense and the net investment income (loss) ratios shown above. |
See Notes which are an integral part of the Financial Statements
Annual Shareholder Report
Financial Highlights–Class C Shares
(For a Share Outstanding Throughout Each Period)
| Year Ended July 31 | 2016 | 2015 | 2014 | 2013 | 2012 |
| Net Asset Value, Beginning of Period | $19.03 | $16.27 | $15.19 | $11.33 | $11.60 |
| Income From Investment Operations: | | | | | |
| Net investment income (loss) | (0.17)1 | (0.25)1 | (0.30)1 | (0.16)1 | (0.17)1 |
| Net realized and unrealized gain (loss) on investments | 0.26 | 3.01 | 1.38 | 4.02 | (0.10) |
| TOTAL FROM INVESTMENT OPERATIONS | 0.09 | 2.76 | 1.08 | 3.86 | (0.27) |
| Less Distributions: | | | | | |
| Distributions from net realized gain on investments | (3.09) | — | — | — | — |
| TOTAL DISTRIBUTIONS | (3.09) | — | — | — | — |
| Net Asset Value, End of Period | $16.03 | $19.03 | $16.27 | $15.19 | $11.33 |
| Total Return2 | 1.51% | 16.96% | 7.11% | 34.07% | (2.33)% |
| Ratios to Average Net Assets: | | | | | |
| Net expenses | 1.88% | 2.31% | 2.50% | 2.50% | 2.50% |
| Net investment income (loss) | (1.09)% | (1.44)% | (1.79)% | (1.24)% | (1.54)% |
| Expense waiver/reimbursement3 | 1.00% | 0.59% | 0.43% | 0.59% | 1.04% |
| Supplemental Data: | | | | | |
| Net assets, end of period (000 omitted) | $3,941 | $3,571 | $4,608 | $4,912 | $4,223 |
| Portfolio turnover | 198% | 121% | 61% | 88% | 69% |
| 1 | Per share numbers have been calculated using the average shares method. |
| 2 | Based on net asset value, which does not reflect the sales charge, redemption fee or contingent deferred sales charge, if applicable. |
| 3 | This expense decrease is reflected in both the net expense and the net investment income (loss) ratios shown above. |
See Notes which are an integral part of the Financial Statements
Annual Shareholder Report
Financial Highlights–Institutional Shares
(For a Share Outstanding Throughout Each Period)
| Year Ended July 31 | 2016 | 2015 | 2014 | 2013 | 2012 |
| Net Asset Value, Beginning of Period | $21.01 | $17.79 | $16.44 | $12.14 | $12.31 |
| Income From Investment Operations: | | | | | |
| Net investment income (loss) | (0.02)1 | (0.08)1 | (0.14)1 | (0.03)1 | (0.06)1 |
| Net realized and unrealized gain (loss) on investments | 0.34 | 3.30 | 1.49 | 4.33 | (0.11) |
| TOTAL FROM INVESTMENT OPERATIONS | 0.32 | 3.22 | 1.35 | 4.30 | (0.17) |
| Less Distributions: | | | | | |
| Distributions from net realized gain on investments | (3.09) | — | — | — | — |
| TOTAL DISTRIBUTIONS | (3.09) | — | — | — | — |
| Net Asset Value, End of Period | $18.24 | $21.01 | $17.79 | $16.44 | $12.14 |
| Total Return2 | 2.56% | 18.10% | 8.21% | 35.42% | (1.38)% |
| Ratios to Average Net Assets: | | | | | |
| Net expenses | 0.88% | 1.30% | 1.50% | 1.50% | 1.50% |
| Net investment income (loss) | (0.09)% | (0.43)% | (0.80)% | (0.24)% | (0.54)% |
| Expense waiver/reimbursement3 | 0.99% | 0.60% | 0.43% | 0.59% | 1.05% |
| Supplemental Data: | | | | | |
| Net assets, end of period (000 omitted) | $43,337 | $36,706 | $37,253 | $31,179 | $26,233 |
| Portfolio turnover | 198% | 121% | 61% | 88% | 69% |
| 1 | Per share numbers have been calculated using the average shares method. |
| 2 | Based on net asset value. |
| 3 | This expense decrease is reflected in both the net expense and the net investment income (loss) ratios shown above. |
See Notes which are an integral part of the Financial Statements
Annual Shareholder Report
Financial Highlights–Class R6 Shares
(For a Share Outstanding Throughout the Period)
| Period Ended July 31 | 20161 |
| Net Asset Value, Beginning of Period | $16.25 |
| Income From Investment Operations: | |
| Net investment income (loss) | (0.07)2 |
| Net realized and unrealized gain on investments | 2.06 |
| TOTAL FROM INVESTMENT OPERATIONS | 1.99 |
| Net Asset Value, End of Period | $18.24 |
| Total Return3 | 12.25% |
| Ratios to Average Net Assets: | |
| Net expenses | 0.87%4 |
| Net investment income (loss) | (0.41)%4 |
| Expense waiver/reimbursement5 | 0.66%4 |
| Supplemental Data: | |
| Net assets, end of period (000 omitted) | $06 |
| Portfolio turnover | 198%7 |
| 1 | Reflects operations for the period from June 29, 2016 (date of initial investment) to July 31, 2016. |
| 2 | Per share numbers have been calculated using the average shares method. |
| 3 | Based on net asset value. Total returns for the period of less than one year is not annualized. |
| 4 | Computed on an annualized basis. |
| 5 | This expense decrease is reflected in both the net expense and the net investment income (loss) ratios shown above. |
| 6 | Represents less than $1,000. |
| 7 | Portfolio turnover is calculated at the Fund level. Percentage indicated was calculated for the year ended July 31, 2016. |
See Notes which are an integral part of the Financial Statements
Annual Shareholder Report
Statement of Assets and Liabilities
July 31, 2016
| Assets: | | |
| Total investment in securities, at value including $1,660,718 of investment in an affiliated holding (Note 5) (identified cost $73,973,529) | | $79,042,857 |
| Income receivable | | 14,834 |
| Receivable for investments sold | | 1,464,968 |
| Receivable for shares sold | | 196,811 |
| TOTAL ASSETS | | 80,719,470 |
| Liabilities: | | |
| Payable for investments purchased | $1,545,601 | |
| Payable for shares redeemed | 150,390 | |
| Payable to adviser (Note 5) | 871 | |
| Payable for administrative fee (Note 5) | 504 | |
| Payable for distribution services fee (Note 5) | 3,624 | |
| Payable for other service fees (Notes 2 and 5) | 17,432 | |
| Payable for share registration costs | 35,352 | |
| Accrued expenses (Note 5) | 81,273 | |
| TOTAL LIABILITIES | | 1,835,047 |
| Net assets for 4,418,483 shares outstanding | | $78,884,423 |
| Net Assets Consist of: | | |
| Paid-in capital | | $72,584,806 |
| Net unrealized appreciation of investments | | 5,069,328 |
| Accumulated net realized gain on investments | | 1,230,289 |
| TOTAL NET ASSETS | | $78,884,423 |
Annual Shareholder Report
Statement of Assets and Liabilities–continued
| Net Asset Value, Offering Price and Redemption Proceeds Per Share | | |
| Class A Shares: | | |
| Net asset value per share ($29,706,779 ÷ 1,681,893 shares outstanding), no par value, unlimited shares authorized | | $17.66 |
| Offering price per share (100/94.50 of $17.66) | | $18.69 |
| Redemption proceeds per share | | $17.66 |
| Class B Shares: | | |
| Net asset value per share ($1,898,937 ÷ 114,908 shares outstanding), no par value, unlimited shares authorized | | $16.53 |
| Offering price per share | | $16.53 |
| Redemption proceeds per share (94.50/100 of $16.53) | | $15.62 |
| Class C Shares: | | |
| Net asset value per share ($3,941,234 ÷ 245,844 shares outstanding), no par value, unlimited shares authorized | | $16.03 |
| Offering price per share | | $16.03 |
| Redemption proceeds per share (99.00/100 of $16.03) | | $15.87 |
| Institutional Shares: | | |
| Net asset value per share ($43,337,361 ÷ 2,375,832 shares outstanding), no par value, unlimited shares authorized | | $18.24 |
| Offering price per share | | $18.24 |
| Redemption proceeds per share | | $18.24 |
| Class R6 Shares: | | |
| Net asset value per share ($112.26 ÷ 6.154 shares outstanding), no par value, unlimited shares authorized | | $18.24 |
| Offering price per share | | $18.24 |
| Redemption proceeds per share | | $18.24 |
See Notes which are an integral part of the Financial Statements
Annual Shareholder Report
Statement of Operations
Year Ended July 31, 2016
| Investment Income: | | | |
| Dividends (including $4,190 received from an affiliated holding (Note 5) and net of foreign taxes withheld of $365) | | | $581,177 |
| Interest | | | 611 |
| TOTAL INCOME | | | 581,788 |
| Expenses: | | | |
| Investment adviser fee (Note 5) | | $827,152 | |
| Administrative fee (Note 5) | | 57,470 | |
| Custodian fees | | 26,872 | |
| Transfer agent fee | | 237,402 | |
| Directors'/Trustees' fees (Note 5) | | 2,178 | |
| Auditing fees | | 26,550 | |
| Legal fees | | 8,736 | |
| Portfolio accounting fees | | 76,017 | |
| Distribution services fee (Note 5) | | 41,485 | |
| Other service fees (Notes 2 and 5) | | 88,461 | |
| Share registration costs | | 73,945 | |
| Printing and postage | | 34,818 | |
| Miscellaneous (Note 5) | | 11,091 | |
| TOTAL EXPENSES | | 1,512,177 | |
| Waivers/Reimbursements: | | | |
| Waiver/reimbursement of investment adviser fee (Note 5) | $(720,674) | | |
| Reimbursement of other operating expenses (Notes 2 and 5) | (11,441) | | |
| TOTAL WAIVER AND REIMBURSEMENTS | | (732,115) | |
| Net expenses | | | 780,062 |
| Net investment income (loss) | | | (198,274) |
| Realized and Unrealized Gain on Investments: | | | |
| Net realized gain on investments | | | 1,564,302 |
| Net change in unrealized appreciation of investments | | | 706,476 |
| Net realized and unrealized gain on investments | | | 2,270,778 |
| Change in net assets resulting from operations | | | $2,072,504 |
See Notes which are an integral part of the Financial Statements
Annual Shareholder Report
Statement of Changes in Net Assets
| Year Ended July 31 | 2016 | 2015 |
| Increase (Decrease) in Net Assets | | |
| Operations: | | |
| Net investment income (loss) | $(198,274) | $(436,245) |
| Net realized gain on investments | 1,564,302 | 15,656,300 |
| Net change in unrealized appreciation/depreciation of investments | 706,476 | (3,269,613) |
| CHANGE IN NET ASSETS RESULTING FROM OPERATIONS | 2,072,504 | 11,950,442 |
| Distributions to Shareholders: | | |
| Distributions from net realized gain on investments | | |
| Class A Shares | (5,047,941) | — |
| Class B Shares | (351,767) | — |
| Class C Shares | (643,484) | — |
| Institutional Shares | (6,264,901) | — |
| CHANGE IN NET ASSETS RESULTING FROM DISTRIBUTIONS TO SHAREHOLDERS | (12,308,093) | — |
| Share Transactions: | | |
| Proceeds from sale of shares | 33,756,690 | 16,906,335 |
| Net asset value of shares issued to shareholders in payment of distributions declared | 11,779,980 | — |
| Cost of shares redeemed | (31,157,360) | (27,508,694) |
| CHANGE IN NET ASSETS RESULTING FROM SHARE TRANSACTIONS | 14,379,310 | (10,602,359) |
| Change in net assets | 4,143,721 | 1,348,083 |
| Net Assets: | | |
| Beginning of period | 74,740,702 | 73,392,619 |
| End of period (including accumulated net investment income (loss) of $0 and $(135,739), respectively) | $78,884,423 | $74,740,702 |
See Notes which are an integral part of the Financial Statements
Annual Shareholder Report
Notes to Financial Statements
July 31, 2016
1. ORGANIZATION
Federated MDT Series (the “Trust”) is registered under the Investment Company Act of 1940, as amended (the “Act”), as an open-end management investment company. The Trust consists of five portfolios. The financial statements included herein are only those of Federated MDT Small Cap Growth Fund (the “Fund”), a diversified portfolio. The financial statements of the other portfolios are presented separately. The assets of each portfolio are segregated and a shareholder's interest is limited to the portfolio in which shares are held. Each portfolio pays its own expenses. The Fund offers five classes of shares: Class A Shares, Class B Shares, Class C Shares, Institutional Shares and R6 Shares. All shares of the Fund have equal rights with respect to voting, except on class-specific matters. On June 1, 2015, Class B Shares were closed to new accounts/investors. The investment objective of the Fund is long-term capital appreciation.
The Fund commenced offering Class R6 Shares on June 29, 2016.
2. SIGNIFICANT ACCOUNTING POLICIES
The following is a summary of significant accounting policies consistently followed by the Fund in the preparation of its financial statements. These policies are in conformity with U.S. generally accepted accounting principles (GAAP).
Investment Valuation
In calculating its net asset value (NAV), the Fund generally values investments as follows:
| ■ | Equity securities listed on an exchange or traded through a regulated market system are valued at their last reported sale price or official closing price in their principal exchange or market. |
| ■ | Shares of other mutual funds or non-exchange-traded investment companies are valued based upon their reported NAVs. |
| ■ | Fixed-income securities acquired with remaining maturities greater than 60 days are fair valued using price evaluations provided by a pricing service approved by the Fund's Board of Trustees (the “Trustees”). |
| ■ | Fixed-income securities and repurchase agreements acquired with remaining maturities of 60 days or less are valued at their cost (adjusted for the accretion of any discount or amortization of any premium), unless the issuer's creditworthiness is impaired or other factors indicate that amortized cost is not an accurate estimate of the investment's fair value, in which case it would be valued in the same manner as a longer-term security. |
| ■ | Derivative contracts listed on exchanges are valued at their reported settlement or closing price, except that options are valued at the mean of closing bid and asked quotations. |
| ■ | Over-the-counter (OTC) derivative contracts are fair valued using price evaluations provided by a pricing service approved by the Trustees. |
| ■ | For securities that are fair valued in accordance with procedures established by and under the general supervision of the Trustees, certain factors may be considered such as: the last traded or purchase price of the security, information obtained by contacting the issuer or dealers, analysis of the issuer's financial statements or other available documents, fundamental analytical data, the nature and duration of restrictions on disposition, the movement of the market in which the security is normally traded, public trading in similar |
Annual Shareholder Report
| | securities or derivative contracts of the issuer or comparable issuers, movement of a relevant index, or other factors including but not limited to industry changes and relevant government actions. |
If any price, quotation, price evaluation or other pricing source is not readily available when the NAV is calculated, or if the Fund cannot obtain price evaluations from a pricing service or from more than one dealer for an investment within a reasonable period of time as set forth in the Fund's valuation policies and procedures, the Fund uses the fair value of the investment determined in accordance with the procedures described below. There can be no assurance that the Fund could obtain the fair value assigned to an investment if it sold the investment at approximately the time at which the Fund determines its NAV per share.
Fair Valuation Procedures
The Trustees have ultimate responsibility for determining the fair value of investments for which market quotations are not readily available. The Trustees have appointed a valuation committee (“Valuation Committee”) comprised of officers of the Fund, Federated MDTA LLC (“Adviser”) and certain of the Adviser's affiliated companies to assist in determining fair value and in overseeing the calculation of the NAV. The Trustees have also authorized the use of pricing services recommended by the Valuation Committee to provide fair value evaluations of the current value of certain investments for purposes of calculating the NAV. The Valuation Committee employs various methods for reviewing third-party pricing-service evaluations including periodic reviews of third-party pricing services' policies, procedures and valuation methods (including key inputs, methods, models and assumptions), transactional back-testing, comparisons of evaluations of different pricing services, and review of price challenges by the Adviser based on recent market activity. In the event that market quotations and price evaluations are not available for an investment, the Valuation Committee determines the fair value of the investment in accordance with procedures adopted by the Trustees. The Trustees periodically review and approve the fair valuations made by the Valuation Committee and any changes made to the procedures.
Factors considered by pricing services in evaluating an investment include the yields or prices of investments of comparable quality, coupon, maturity, call rights and other potential prepayments, terms and type, reported transactions, indications as to values from dealers and general market conditions. Some pricing services provide a single price evaluation reflecting the bid-side of the market for an investment (a “bid” evaluation). Other pricing services offer both bid evaluations and price evaluations indicative of a price between the prices bid and asked for the investment (a “mid” evaluation). The Fund normally uses bid evaluations for any U.S. Treasury and Agency securities, mortgage-backed securities and municipal securities. The Fund normally uses mid evaluations for any other types of fixed-income securities and any OTC derivative contracts. In the event that market quotations and price evaluations are not available for an investment, the fair value of the investment is determined in accordance with procedures adopted by the Trustees.
Repurchase Agreements
The Fund may invest in repurchase agreements for short-term liquidity purposes. It is the policy of the Fund to require the other party to a repurchase agreement to transfer to the Fund's custodian or sub-custodian eligible securities or cash with a market value (after transaction costs) at least equal to the repurchase price to be paid under the repurchase agreement. The eligible securities are transferred to accounts with the custodian or sub-custodian in which the Fund holds a “securities entitlement” and exercises “control” as those terms are defined in the Uniform Commercial Code. The Fund has established procedures for
Annual Shareholder Report
monitoring the market value of the transferred securities and requiring the transfer of additional eligible securities if necessary to equal at least the repurchase price. These procedures also allow the other party to require securities to be transferred from the account to the extent that their market value exceeds the repurchase price or in exchange for other eligible securities of equivalent market value.
The insolvency of the other party or other failure to repurchase the securities may delay the disposition of the underlying securities or cause the Fund to receive less than the full repurchase price. Under the terms of the repurchase agreement, any amounts received by the Fund in excess of the repurchase price and related transaction costs must be remitted to the other party.
The Fund may enter into repurchase agreements in which eligible securities are transferred into joint trading accounts maintained by the custodian or sub-custodian for investment companies and other clients advised by the Adviser and its affiliates. The Fund will participate on a pro rata basis with the other investment companies and clients in its share of the securities transferred under such repurchase agreements and in its share of proceeds from any repurchase or other disposition of such securities.
Investment Income, Gains and Losses, Expenses and Distributions
Investment transactions are accounted for on a trade-date basis. Realized gains and losses from investment transactions are recorded on an identified-cost basis. Interest income and expenses are accrued daily. Dividend income and distributions to shareholders are recorded on the ex-dividend date. Distributions of net investment income are declared and paid annually. Non-cash dividends included in dividend income, if any, are recorded at fair value. Investment income, realized and unrealized gains and losses, and certain fund-level expenses are allocated to each class based on relative average daily net assets, except that Class A Shares, Class B Shares, Class C Shares, Institutional Shares and R6 Shares may bear distribution services fees, other service fees and transfer agent fees unique to those classes. The detail of the total fund expense waivers and reimbursements of $732,115 is disclosed in various locations in this Note 2 and Note 5.
| | Transfer
Agent Fees
Incurred | Transfer
Agent Fees
Reimbursed |
| Class A Shares | $97,741 | $(5,293) |
| Class B Shares | 6,275 | (156) |
| Class C Shares | 11,692 | (764) |
| Institutional Shares | 121,694 | (5,228) |
| TOTAL | $237,402 | $(11,441) |
Dividends are declared separately for each class. No class has preferential dividend rights; differences in per share dividend rates are generally due to differences in separate class expenses.
Annual Shareholder Report
Other Service Fees
The Fund may pay other service fees up to 0.25% of the average daily net assets of the Fund's Class A shares, Class B Shares and Class C Shares to unaffiliated financial intermediaries or to Federated Shareholder Services Company (FSSC) for providing services to shareholders and maintaining shareholder accounts. Subject to the terms described in the Expense Limitation note, FSSC may voluntarily reimburse the Fund for other service fees. For the year ended July 31, 2016, other service fees for the Fund were as follows:
| | Other
Service Fees
Incurred |
| Class A Shares | $74,643 |
| Class B Shares | 4,930 |
| Class C Shares | 8,888 |
| TOTAL | $88,461 |
Premium and Discount Amortization
All premiums and discounts on fixed-income securities are amortized/accreted using the effective-interest-rate method.
Federal Taxes
It is the Fund's policy to comply with the Subchapter M provision of the Internal Revenue Code (the “Code”) and to distribute to shareholders each year substantially all of its income. Accordingly, no provision for federal income tax is necessary. As of and during the year ended July 31, 2016, the Fund did not have a liability for any uncertain tax positions. The Fund recognizes interest and penalties, if any, related to tax liabilities as income tax expense in the Statement of Operations. As of July 31, 2016, tax years 2013 through 2016 remain subject to examination by the Fund's major tax jurisdictions, which include the United States of America and the Commonwealth of Massachusetts.
When-Issued and Delayed-Delivery Transactions
The Fund may engage in when-issued or delayed-delivery transactions. The Fund records when-issued securities on the trade date and maintains security positions such that sufficient liquid assets will be available to make payment for the securities purchased. Securities purchased on a when-issued or delayed-delivery basis are marked to market daily and begin earning interest on the settlement date. Losses may occur on these transactions due to changes in market conditions or the failure of counterparties to perform under the contract.
Other
The preparation of financial statements in conformity with GAAP requires management to make estimates and assumptions that affect the amounts of assets, liabilities, expenses and revenues reported in the financial statements. Actual results could differ from those estimated. The Fund applies Investment Company accounting and reporting guidance.
Annual Shareholder Report
3. SHARES OF BENEFICIAL INTEREST
The following tables summarize share activity:
| Year Ended July 31 | 2016 | 2015 |
| Class A Shares: | Shares | Amount | Shares | Amount |
| Shares sold | 465,083 | $7,909,230 | 205,032 | $4,007,524 |
| Shares issued to shareholders in payment of distributions declared | 280,541 | 4,637,343 | | |
| Shares redeemed | (631,816) | (10,489,720) | (343,865) | (6,518,418) |
NET CHANGE RESULTING FROM
CLASS A SHARE TRANSACTIONS | 113,808 | $2,056,853 | (138,833) | $(2,510,894) |
| Year Ended July 31 | 2016 | 2015 |
| Class B Shares: | Shares | Amount | Shares | Amount |
| Shares sold | 628 | $9,758 | 36,818 | $665,769 |
| Shares issued to shareholders in payment of distributions declared | 21,942 | 340,760 | — | — |
| Shares redeemed | (26,934) | (420,323) | (27,927) | (501,164) |
NET CHANGE RESULTING FROM
CLASS B SHARE TRANSACTIONS | (4,364) | $(69,805) | 8,891 | $164,605 |
| Year Ended July 31 | 2016 | 2015 |
| Class C Shares: | Shares | Amount | Shares | Amount |
| Shares sold | 79,204 | $1,262,101 | 28,731 | $508,470 |
| Shares issued to shareholders in payment of distributions declared | 37,876 | 570,799 | — | — |
| Shares redeemed | (58,895) | (871,702) | (124,257) | (2,140,893) |
| NET CHANGE RESULTING FROM CLASS C SHARE TRANSACTIONS | 58,185 | $961,198 | (95,526) | $(1,632,423) |
| Year Ended July 31 | 2016 | 2015 |
| Institutional Shares: | Shares | Amount | Shares | Amount |
| Shares sold | 1,403,762 | $24,575,501 | 616,792 | $11,724,572 |
| Shares issued to shareholders in payment of distributions declared | 365,674 | 6,231,078 | — | — |
| Shares redeemed | (1,140,530) | (19,375,615) | (963,982) | (18,348,219) |
| NET CHANGE RESULTING FROM INSTITUTIONAL SHARE TRANSACTIONS | 628,906 | $11,430,964 | (347,190) | $(6,623,647) |
Annual Shareholder Report
| | Period Ended
7/31/20161 | 2015 |
| Class R6 Shares: | Shares | Amount | Shares | Amount |
| Shares sold | 6 | $100 | — | $— |
| Shares issued to shareholders in payment of distributions declared | — | — | — | — |
| Shares redeemed | (—) | (—) | (—) | (—) |
| NET CHANGE RESULTING FROM CLASS R6 SHARE TRANSACTIONS | 6 | $100 | — | $— |
| NET CHANGE RESULTING FROM TOTAL FUND SHARE TRANSACTIONS | 796,541 | $14,379,310 | (572,658) | $(10,602,359) |
| 1 | Reflects operations for the period from June 29, 2016 (date of initial investment) to July 31, 2016. |
4. FEDERAL TAX INFORMATION
The timing and character of income and capital gain distributions are determined in accordance with income tax regulations, which may differ from GAAP. These differences are primarily due to net operating losses.
For the year ended July 31, 2016, permanent differences identified and reclassified among the components of net assets were as follows:
| Increase (Decrease) |
Undistributed
Net Investment
Income (Loss) | Accumulated
Net Realized
Gain (Loss) |
| $334,013 | $(334,013) |
Net investment income (loss), net realized gains (losses), and net assets were not affected by this reclassification.
The tax character of distributions as reported on the Statement of Changes in Net Assets for the years ended July 31, 2016 and 2015, was as follows:
| | 2016 | 2015 |
| Long-term capital gains | $12,308,093 | $0 |
As of July 31, 2016, the components of distributable earnings on a tax-basis were as follows:
| Ordinary income1 | $568,066 |
| Undistributed long-term capital gains | $1,047,163 |
| Net unrealized appreciation | $4,684,388 |
| 1 | For tax purposes, short-term capital gain distributions are considered ordinary income distributions. |
| | |
At July 31, 2016, the cost of investments for federal tax purposes was $74,358,469. The net unrealized appreciation of investments for federal tax purposes was $4,684,388. This consists of net unrealized appreciation from investments for those securities having an excess of value over cost of $9,586,891 and net unrealized depreciation from investments for those securities having an excess of cost over value of $4,902,503.
Annual Shareholder Report
5. INVESTMENT ADVISER FEE AND OTHER TRANSACTIONS WITH AFFILIATES
Investment Adviser Fee
The advisory agreement between the Fund and the Adviser provides for an annual fee equal to 0.99% of the Fund's average daily net assets. Prior to June 8, 2016, the annual advisory fee was 1.15% of the Fund's average daily net assets. Subject to the terms described in the Expense Limitation note, the Adviser may voluntarily choose to waive any portion of its fee. For the year ended July 31, 2016, the Adviser voluntarily waived $719,026 of its fee and voluntarily reimbursed $11,441 of transfer agent fees.
Administrative Fee
Federated Administrative Services (FAS), under the Administrative Services Agreement, provides the Fund with administrative personnel and services. For purposes of determining the appropriate rate breakpoint, “Investment Complex” is defined as all of the Federated Funds subject to a fee under the Administrative Services Agreement. The fee paid to FAS is based on the average daily net assets of the Investment Complex as specified below, plus certain out-of-pocket expenses:
| Administrative Fee | Average Daily Net Assets
of the Investment Complex |
| 0.150% | on the first $5 billion |
| 0.125% | on the next $5 billion |
| 0.100% | on the next $10 billion |
| 0.075% | on assets in excess of $20 billion |
Subject to the terms described in the Expense Limitation note, FAS may voluntarily choose to waive any portion of its fee. For the year ended July 31, 2016, the annualized fee paid to FAS was 0.078% of average daily net assets of the Fund.
Distribution Services Fee
The Fund has adopted a Distribution Plan (the “Plan”) pursuant to Rule 12b-1 under the Act. Under the terms of the Plan, the Fund will compensate Federated Securities Corp. (FSC), the principal distributor, from the daily net assets of the Fund's Class A Shares, Class B Shares and Class C Shares to finance activities intended to result in the sale of these shares. The Plan provides that the Fund may incur distribution expenses at the following percentages of average daily net assets annually, to compensate FSC:
| Share Class Name | Percentage of Average Daily
Net Assets of Class |
| Class A Shares | 0.05% |
| Class B Shares | 0.75% |
| Class C Shares | 0.75% |
Annual Shareholder Report
Subject to the terms described in the Expense Limitation note, FSC may voluntarily choose to waive any portion of its fee. For the year ended July 31, 2016, distribution services fees for the Fund were as follows:
| | Distribution
Services Fees
Incurred |
| Class B Shares | $14,790 |
| Class C Shares | 26,695 |
| TOTAL | $41,485 |
For the year ended July 31, 2016, FSC retained $13,698 of fees paid by the Fund.
When FSC receives fees, it may pay some or all of them to financial intermediaries whose customers purchase shares. For the year ended July 31, 2016, the Fund's Class A Shares did not incur a distribution services fee; however, it may begin to incur this fee upon approval of the Trustees.
Sales Charges
Front-end sales charges and contingent deferred sales charges (CDSC) do not represent expenses of the Fund. They are deducted from the proceeds of sales of Fund shares prior to investment or from redemption proceeds prior to remittance, as applicable. For the year ended July 31, 2016, FSC retained $3,850 in sales charges from the sale of Class A Shares. FSC also retained $4,437 of CDSC relating to redemptions of Class B Shares.
Other Service Fees
For the year ended July 31, 2016, FSSC received $8,862 of the other service fees disclosed in Note 2.
Expense Limitation
The Adviser and certain of its affiliates (which may include FSC, FAS and FSSC) on their own initiative have agreed to waive certain amounts of their respective fees and/or reimburse expenses. Total annual fund operating expenses (as shown in the financial highlights, excluding expenses allocated from affiliated partnerships, extraordinary expenses, line of credit expenses and proxy-related expenses paid by the Fund, if any) paid by the Fund's Class A Shares, Class B Shares, Class C Shares, Institutional Shares and Class R6 Shares (after the voluntary waivers and/or reimbursements) will not exceed 1.13%, 1.88%, 1.88%, 0.88% and 0.87% (the “Fee Limit”), respectively, up to but not including the later of (the “Termination Date”): (a) July 1, 2017; or (b) the date of the Fund's next effective Prospectus. While the Adviser and its applicable affiliates currently do not anticipate terminating or increasing these arrangements prior to the Termination Date, these arrangements may only be terminated or the Fee Limit increased prior to the Termination Date with the agreement of the Trustees.
General
Certain Officers and Trustees of the Fund are Officers and Directors or Trustees of certain of the above companies. To efficiently facilitate payment, Directors'/Trustees' fees and certain expenses related to conducting meetings of the Directors/Trustees and other miscellaneous expenses are paid by an affiliate of the Adviser which in due course are reimbursed by the Fund. Such expenses may be included in Accrued and Miscellaneous Expenses on the Statement of Assets and Liabilities and Statement of Operations, respectively.
Annual Shareholder Report
Transactions Involving Affiliated Company Holdings
Affiliated holdings are investment companies which are managed by the Adviser or an affiliate of the Adviser. The Adviser has agreed to reimburse the Fund for certain investment adviser fees as a result of transactions in other affiliated investment companies. For the year ended July 31, 2016, the Adviser reimbursed the Fund $1,648. Transactions involving the affiliated holding during the year ended July 31, 2016, were as follows:
| | Federated
Institutional
Prime Value
Obligations Fund,
Institutional Shares |
| Balance of Shares Held 7/31/2015 | 1,422,241 |
| Purchases/Additions | 27,435,188 |
| Sales/Reductions | (27,196,711) |
| Balance of Shares Held 7/31/2016 | 1,660,718 |
| Value | $1,660,718 |
| Dividend Income | $4,190 |
6. Investment TRANSACTIONS
Purchases and sales of investments, excluding long-term U.S. government securities and short-term obligations, for the year ended July 31, 2016, were as follows:
| Purchases | $146,439,099 |
| Sales | $143,810,618 |
7. LINE OF CREDIT
The Fund participates with certain other Federated Funds, on a several basis, in an up to $500,000,000 unsecured, 364-day, committed, revolving line of credit (LOC) agreement. The LOC was made available to finance temporarily the repurchase or redemption of shares of the Fund, failed trades, payment of dividends, settlement of trades and for other short-term, temporary or emergency general business purposes. The Fund cannot borrow under the LOC if an inter-fund loan is outstanding. The Fund's ability to borrow under the LOC also is subject to the limitations of the Act and various conditions precedent that must be satisfied before the Fund can borrow. Loans under the LOC are charged interest at a fluctuating rate per annum equal to the highest, on any day, of (a) (i) the federal funds effective rate, (ii) the one month London Interbank Offer Rate (LIBOR), and (iii) 0.0%, plus (b) a margin. The LOC also requires the Fund to pay, quarterly in arrears and at maturity, its pro rata share of a commitment fee based on the amount of the lenders' commitment that has not been utilized. As of July 31, 2016, the Fund had no outstanding loans. During the year ended July 31, 2016, the Fund did not utilize the LOC.
8. INTERFUND LENDING
Pursuant to an Exemptive Order issued by the Securities and Exchange Commission, the Fund, along with other funds advised by subsidiaries of Federated Investors, Inc., may participate in an interfund lending program. This program provides an alternative credit facility allowing the Fund to borrow from other participating affiliated funds.
Annual Shareholder Report
As of July 31, 2016, there were no outstanding loans. During the year ended July 31, 2016, the program was not utilized.
9. federal tax information (unaudited)
For the year ended July 31, 2016, the amount of long-term capital gains designated by the Fund was $12,308,093.
Annual Shareholder Report
Report of Independent Registered Public Accounting Firm
TO THE BOARD OF trustees OF Federated MDt series AND SHAREHOLDERS OF federated mdt Small cap growth fund:
We have audited the accompanying statement of assets and liabilities of Federated MDT Small Cap Growth Fund (the “Fund”) (one of the portfolios constituting Federated MDT Series), including the portfolio of investments, as of July 31, 2016, and the related statement of operations for the year then ended, the statement of changes in net assets for each of the two years in the period then ended, and the financial highlights for each of the periods indicated therein. These financial statements and financial highlights are the responsibility of the Fund's management. Our responsibility is to express an opinion on these financial statements and financial highlights based on our audits.
We conducted our audits in accordance with standards of the Public Company Accounting Oversight Board (United States). Those standards require that we plan and perform the audit to obtain reasonable assurance about whether the financial statements and financial highlights are free of material misstatement. We were not engaged to perform an audit of the Fund's internal control over financial reporting. Our audits included consideration of internal control over financial reporting as a basis for designing audit procedures that are appropriate in the circumstances, but not for the purpose of expressing an opinion on the effectiveness of the Fund's internal control over financial reporting. Accordingly, we express no such opinion. An audit also includes examining, on a test basis, evidence supporting the amounts and disclosures in the financial statements and financial highlights, assessing the accounting principles used and significant estimates made by management, and evaluating the overall financial statement presentation. Our procedures included confirmation of securities owned as of July 31, 2016, by correspondence with the custodian and others or by other appropriate auditing procedures where replies from others were not received. We believe that our audits provide a reasonable basis for our opinion.
In our opinion, the financial statements and financial highlights referred to above present fairly, in all material respects, the financial position of Federated MDT Small Cap Growth Fund, a portfolio of Federated MDT Series, at July 31, 2016, the results of its operations for the year then ended, the changes in its net assets for each of the two years in the period then ended, and the financial highlights for each of the periods indicated therein, in conformity with U.S. generally accepted accounting principles.
Boston, Massachusetts
September 22, 2016
Annual Shareholder Report
Shareholder Expense Example (unaudited)
As a shareholder of the Fund, you incur two types of costs: (1) transaction costs, including sales charges (loads) on purchase or redemption payments; and (2) ongoing costs, including management fees and to the extent applicable, distribution (12b-1) fees and/or other service fees and other Fund expenses. This Example is intended to help you to understand your ongoing costs (in dollars) of investing in the Fund and to compare these costs with the ongoing costs of investing in other mutual funds. It is based on an investment of $1,000 invested at the beginning of the period and held for the entire period from February 1, 2016 to July 31, 2016.
ACTUAL EXPENSES
The first section of the table below provides information about actual account values and actual expenses. You may use the information in this section, together with the amount you invested, to estimate the expenses that you incurred over the period. Simply divide your account value by $1,000 (for example, an $8,600 account value divided by $1,000 = 8.6), then multiply the result by the number in the first section under the heading entitled “Expenses Paid During Period” to estimate the expenses attributable to your investment during this period.
HYPOTHETICAL EXAMPLE FOR COMPARISON PURPOSES
The second section of the table below provides information about hypothetical account values and hypothetical expenses based on the Fund's actual expense ratio and an assumed rate of return of 5% per year before expenses, which is not the Fund's actual return. Thus, you should not use the hypothetical account values and expenses to estimate the actual ending account balance or your expenses for the period. Rather, these figures are required to be provided to enable you to compare the ongoing costs of investing in the Fund with other funds. To do so, compare this 5% hypothetical example with the 5% hypothetical examples that appear in the shareholder reports of the other funds.
Annual Shareholder Report
Please note that the expenses shown in the table are meant to highlight your ongoing costs only and do not reflect any transaction costs, such as sales charges (loads) on purchase or redemption payments. Therefore, the second section of the table is useful in comparing ongoing costs only, and will not help you determine the relative total costs of owning different funds. In addition, if these transaction costs were included, your costs would have been higher.
| | Beginning
Account Value
2/1/2016 | Ending
Account Value
7/31/2016 | Expenses Paid
During Period1 |
| Actual: | | | |
| Class A Shares | $1,000 | $1,216.30 | $6.23 |
| Class B Shares | $1,000 | $1,212.80 | $10.34 |
| Class C Shares | $1,000 | $1,211.60 | $10.34 |
| Institutional Shares | $1,000 | $1,217.60 | $4.85 |
| R6 Shares | $1,000 | $1,122.50 | $0.832 |
Hypothetical (assuming a 5% return
before expenses): | | | |
| Class A Shares | $1,000 | $1,019.24 | $5.67 |
| Class B Shares | $1,000 | $1,015.51 | $9.42 |
| Class C Shares | $1,000 | $1,015.51 | $9.42 |
| Institutional Shares | $1,000 | $1,020.49 | $4.42 |
| R6 Shares | $1,000 | $1,020.54 | $4.372 |
| 1 | Expenses are equal to the Fund's annualized net expense ratios, multiplied by the average account value over the period, multiplied by 182/366 (to reflect the one-half-year period). The annualized net expense ratios are as follows: |
| | |
| Class A Shares | 1.13% |
| Class B Shares | 1.88% |
| Class C Shares | 1.88% |
| Institutional Shares | 0.88% |
| R6 Shares | 0.87% |
| 2 | “Actual” expense information for the Fund's R6 Shares is for the period from June 29, 2016 (date of initial investment) to July 31, 2016. Actual expenses are equal to the Fund's annualized net expense ratio of 0.87%, multiplied by 33/366 (to reflect the period from initial investment to July 31, 2016). “Hypothetical” expense information for R6 is presented on the basis of the full one-half year period to enable comparison to other funds. It is based on assuming the same net expense ratio and average account value over the period, but it is multiplied by 182/366 (to reflect the full half-year period). |
Annual Shareholder Report
Board of Trustees and Trust Officers
The Board of Trustees is responsible for managing the Trust's business affairs and for exercising all the Trust's powers except those reserved for the shareholders. The following tables give information about each Trustee and the senior officers of the Fund. Where required, the tables separately list Trustees who are “interested persons” of the Fund (i.e., “Interested” Trustees) and those who are not (i.e., “Independent” Trustees). Unless otherwise noted, the address of each person listed is Federated Investors Tower, 1001 Liberty Avenue, Pittsburgh, PA 15222. The address of all Independent Trustees listed is 4000 Ericsson Drive, Warrendale, PA 15086-7561; Attention: Mutual Fund Board. As of December 31, 2015, the Trust comprised five portfolio(s), and the Federated Fund Family consisted of 38 investment companies (comprising 122 portfolios). Unless otherwise noted, each Officer is elected annually. Unless otherwise noted, each Trustee oversees all portfolios in the Federated Fund Family and serves for an indefinite term. The Fund's Statement of Additional Information includes additional information about Trust Trustees and is available, without charge and upon request, by calling 1-800-341-7400.
Interested TRUSTEES Background
Name
Birth Date
Positions Held with Trust
Date Service Began | Principal Occupation(s) for Past Five Years,
Other Directorships Held and Previous Position(s) |
J. Christopher Donahue*
Birth Date: April 11, 1949
President and Trustee
Indefinite Term
Began serving: June 2006 | Principal Occupations: Principal Executive Officer and President of certain of the Funds in the Federated Fund Family; Director or Trustee of the Funds in the Federated Fund Family; President, Chief Executive Officer and Director, Federated Investors, Inc.; Chairman and Trustee, Federated Investment Management Company; Trustee, Federated Investment Counseling; Chairman and Director, Federated Global Investment Management Corp.; Chairman, Federated Equity Management Company of Pennsylvania and Passport Research, Ltd. (investment advisory subsidiary of Federated); Trustee, Federated Shareholder Services Company; Director, Federated Services Company.
Previous Positions: President, Federated Investment Counseling; President and Chief Executive Officer, Federated Investment Management Company, Federated Global Investment Management Corp. and Passport Research, Ltd. |
Annual Shareholder Report
Name
Birth Date
Positions Held with Trust
Date Service Began | Principal Occupation(s) for Past Five Years,
Other Directorships Held and Previous Position(s) |
John B. Fisher*
Birth Date: May 16, 1956
Trustee
Indefinite Term
Began serving: May 2016 | Principal Occupations: Principal Executive Officer and President of certain of the Funds in the Federated Fund Family; Director or Trustee of certain of the Funds in the Federated Fund Family; Vice President, Federated Investors, Inc.; President, Director/Trustee and CEO, Federated Advisory Services Company, Federated Equity Management Company of Pennsylvania, Federated Global Investment Management Corp., Federated Investment Counseling, Federated Investment Management Company; President and CEO of Passport Research, Ltd.; President of some of the Funds in the Federated Fund Complex and Director, Federated Investors Trust Company.
Previous Positions: President and Director of the Institutional Sales Division of Federated Securities Corp.; President and Director of Federated Investment Counseling; Director, Edgewood Securities Corp.; Director, Federated Services Company; Director, Federated Investors, Inc.; Chairman and Director, Southpointe Distribution Services, Inc. and President, Technology, Federated Services Company. |
| * | Reasons for “interested” status: J. Christopher Donahue and John B. Fisher are interested due to their beneficial ownership of shares of Federated Investors, Inc. and due to positions they hold with Federated and its subsidiaries. J. Christopher Donahue is the son of John F. Donahue, Chairman Emeritus of the Federated Funds. |
INDEPENDENT TRUSTEES Background
Name
Birth Date
Positions Held with Trust
Date Service Began | Principal Occupation(s) for Past Five Years,
Other Directorships Held, Previous Position(s) and Qualifications |
John T. Collins
Birth Date: January 24, 1947
Trustee
Indefinite Term
Began serving: October 2013 | Principal Occupations: Director or Trustee of the Federated Fund Family; Retired.
Other Directorships Held: Director, Chair of the Compensation Committee, Audit Committee member, KLX Corp.
Qualifications: Mr. Collins has served in several business and financial management roles and directorship positions throughout his career. Mr. Collins previously served as Chairman and CEO, The Collins Group, Inc. (a private equity firm). Mr. Collins serves as Chairman Emeriti, Bentley University. Mr. Collins previously served as Director, FleetBoston Financial Corp.; Director and Audit Committee Member, Bank of America Corp. and Director, Beth Israel Deaconess Medical Center (Harvard University Affiliate Hospital). |
Annual Shareholder Report
Name
Birth Date
Positions Held with Trust
Date Service Began | Principal Occupation(s) for Past Five Years,
Other Directorships Held, Previous Position(s) and Qualifications |
G. Thomas Hough
Birth Date: February 28, 1955
Trustee
Indefinite Term
Began serving: August 2015 | Principal Occupations: Director or Trustee of the Federated Fund Family; Retired.
Other Directorships Held: Director, Chair of the Audit Committee, Governance Committee, Publix Super Markets, Inc.
Qualifications: Mr. Hough has served in accounting, business management and directorship positions throughout his career. Mr. Hough most recently held the position of Americas Vice Chair of Assurance with Ernst & Young LLP. Mr. Hough is an Executive Committee member of the United States Golf Association, he serves on the President's Cabinet and Business School Board of Visitors for the University of Alabama and is on the Business School Board of Visitors for Wake Forest University. |
Maureen Lally-Green
Birth Date: July 5, 1949
Trustee
Indefinite Term
Began serving: August 2009 | Principal Occupations: Director or Trustee of the Federated Fund Family; Interim Dean of the Duquesne University School of Law; Adjunct Professor of Law, Duquesne University School of Law.
Other Directorships Held: Director, CONSOL Energy Inc.
Qualifications: Judge Lally-Green has served in various legal and business roles and directorship positions throughout her career. Judge Lally-Green previously served as: Associate General Secretary, Diocese of Pittsburgh; a member of the Superior Court of Pennsylvania; and as a Professor of Law, Duquesne University School of Law. Judge Lally-Green also holds the positions on either a public or not for profit Board of Directors as follows: Member, Pennsylvania State Board of Education (public); Director and Chair, UPMC Mercy Hospital; Regent, St. Vincent Seminary; Director and Vice Chair, Our Campaign for the Church Alive!, Inc.; Director, Saint Vincent College; and Director and Chair, Cardinal Wuerl North Catholic High School, Inc. Judge Lally-Green has held the positions of: Director, Auberle; Director, Ireland Institute of Pittsburgh; Director, Saint Thomas More Society; and Director, Catholic High Schools of the Diocese of Pittsburgh, Inc. |
Peter E. Madden
Birth Date: March 16, 1942
Trustee
Indefinite Term
Began serving: June 2006 | Principal Occupation: Director or Trustee, and Chair of the Board of Directors or Trustees, of the Federated Fund Family; Retired.
Other Directorships Held: None.
Qualifications: Mr. Madden has served in several business management, mutual fund services and directorship positions throughout his career. Mr. Madden previously served as President, Chief Operating Officer and Director, State Street Bank and Trust Company (custodian bank) and State Street Corporation (financial services). He was Director, VISA USA and VISA International and Chairman and Director, Massachusetts Bankers Association. Mr. Madden served as Director, Depository Trust Corporation and Director, The Boston Stock Exchange. Mr. Madden also served as a Representative to the Commonwealth of Massachusetts General Court. |
Annual Shareholder Report
Name
Birth Date
Positions Held with Trust
Date Service Began | Principal Occupation(s) for Past Five Years,
Other Directorships Held, Previous Position(s) and Qualifications |
Charles F. Mansfield, Jr.
Birth Date: April 10, 1945
Trustee
Indefinite Term
Began serving: June 2006 | Principal Occupations: Director or Trustee of the Federated Fund Family; Management Consultant.
Other Directorships Held: None.
Qualifications: Mr. Mansfield has served in several banking, business management and educational roles and directorship positions throughout his career. Mr. Mansfield previously served as Chief Executive Officer, PBTC International Bank; Partner, Arthur Young & Company (now Ernst & Young LLP); Chief Financial Officer of Retail Banking Sector, Chase Manhattan Bank; Senior Vice President, HSBC Bank USA (formerly, Marine Midland Bank); Vice President, Citibank; Assistant Professor of Banking and Finance, Frank G. Zarb School of Business, Hofstra University; Executive Vice President DVC Group, Inc. (marketing, communications and technology). |
Thomas M. O'Neill
Birth Date: June 14, 1951
Trustee
Indefinite Term
Began serving: October 2006 | Principal Occupations: Director or Trustee, Chair of the Audit Committee of the Federated Fund Family; Sole Proprietor, Navigator Management Company (investment and strategic consulting).
Other Directorships Held: None.
Qualifications: Mr. O'Neill has served in several business, mutual fund and financial management roles and directorship positions throughout his career. Mr. O'Neill serves as Director, Medicines for Humanity and Director, The Golisano Children's Museum of Naples, Florida. Mr. O'Neill previously served as Chief Executive Officer and President, Managing Director and Chief Investment Officer, Fleet Investment Advisors; President and Chief Executive Officer, Aeltus Investment Management, Inc.; General Partner, Hellman, Jordan Management Co., Boston, MA; Chief Investment Officer, The Putnam Companies, Boston, MA; Credit Analyst and Lending Officer, Fleet Bank; Director and Consultant, EZE Castle Software (investment order management software); and Director, Midway Pacific (lumber). |
P. Jerome Richey
Birth Date: February 23, 1949
Trustee
Indefinite Term
Began serving: October 2013 | Principal Occupations: Director or Trustee of the Federated Fund Family; Management Consultant.
Other Directorships Held: None.
Qualifications: Mr. Richey has served in several business and legal management roles and directorship positions throughout his career. Mr. Richey most recently held the positions of Senior Vice Chancellor and Chief Legal Officer, University of Pittsburgh. Mr. Richey serves as Board Member, Epilepsy Foundation of Western Pennsylvania and Board member, World Affairs Council of Pittsburgh. Mr. Richey previously served as Chief Legal Officer and Executive Vice President, CONSOL Energy Inc. and Shareholder, Buchanan Ingersoll & Rooney PC (a law firm). |
Annual Shareholder Report
Name
Birth Date
Positions Held with Trust
Date Service Began | Principal Occupation(s) for Past Five Years,
Other Directorships Held, Previous Position(s) and Qualifications |
John S. Walsh
Birth Date: November 28, 1957
Trustee
Indefinite Term
Began serving: June 2006 | Principal Occupations: Director or Trustee of the Federated Fund Family; President and Director, Heat Wagon, Inc. (manufacturer of construction temporary heaters); President and Director, Manufacturers Products, Inc. (distributor of portable construction heaters); President, Portable Heater Parts, a division of Manufacturers Products, Inc.
Other Directorships Held: None.
Qualifications: Mr. Walsh has served in several business management roles and directorship positions throughout his career. Mr. Walsh previously served as Vice President, Walsh & Kelly, Inc. (paving contractors). |
OFFICERS
Name
Birth Date
Address
Positions Held with Trust
Date Service Began | Principal Occupation(s) for Past Five Years
and Previous Position(s) |
John W. McGonigle
Birth Date: October 26, 1938
Secretary
Officer since: May 2006 | Principal Occupations: Executive Vice President and Secretary of the Federated Fund Family; Vice Chairman, Executive Vice President, Secretary and Director, Federated Investors, Inc.
Previous Positions: Trustee, Federated Investment Management Company and Federated Investment Counseling; Director, Federated Global Investment Management Corp., Federated Services Company and Federated Securities Corp. |
Lori A. Hensler
Birth Date: January 6, 1967
TREASURER
Officer since: April 2013 | Principal Occupations: Principal Financial Officer and Treasurer of the Federated Fund Family; Senior Vice President, Federated Administrative Services; Financial and Operations Principal for Federated Securities Corp. and Edgewood Services, Inc.; and Assistant Treasurer, Federated Investors Trust Company. Ms. Hensler has received the Certified Public Accountant designation.
Previous Positions: Controller of Federated Investors, Inc.; Senior Vice President and Assistant Treasurer, Federated Investors Management Company; Treasurer, Federated Investors Trust Company; Assistant Treasurer, Federated Administrative Services, Federated Administrative Services, Inc., Federated Securities Corp., Edgewood Services, Inc., Federated Advisory Services Company, Federated Equity Management Company of Pennsylvania, Federated Global Investment Management Corp., Federated Investment Counseling, Federated Investment Management Company, Passport Research, Ltd., and Federated MDTA, LLC; Financial and Operations Principal for Federated Securities Corp., Edgewood Services, Inc. and Southpointe Distribution Services, Inc. |
Annual Shareholder Report
Name
Birth Date
Address
Positions Held with Trust
Date Service Began | Principal Occupation(s) for Past Five Years
and Previous Position(s) |
Peter J. Germain
Birth Date: September 3, 1959
CHIEF LEGAL OFFICER
Officer since: June 2006 | Principal Occupations: Mr. Germain is Chief Legal Officer of the Federated Fund Family. He is General Counsel and Vice President, Federated Investors, Inc.; President, Federated Administrative Services and Federated Administrative Services, Inc.; Vice President, Federated Securities Corp.; Secretary, Federated Private Asset Management, Inc.; and Secretary, Retirement Plan Service Company of America. Mr. Germain joined Federated in 1984 and is a member of the Pennsylvania Bar Association.
Previous Positions: Deputy General Counsel, Special Counsel, Managing Director of Mutual Fund Services, Federated Investors, Inc.; Senior Vice President, Federated Services Company; and Senior Corporate Counsel, Federated Investors, Inc. |
Stephen F. Auth
Birth Date: September 13, 1956
101 Park Avenue
41st Floor
New York, NY 10178
CHIEF INVESTMENT OFFICER
Officer since: June 2012 | Principal Occupations: Stephen F. Auth is Chief Investment Officer of various Funds in the Federated Fund Family; Executive Vice President, Federated Investment Counseling, Federated Global Investment Management Corp. and Federated Equity Management Company of Pennsylvania.
Previous Positions: Executive Vice President, Federated Investment Management Company and Passport Research, Ltd. (investment advisory subsidiary of Federated); Senior Vice President, Global Portfolio Management Services Division; Senior Vice President, Federated Investment Management Company and Passport Research, Ltd.; Senior Managing Director and Portfolio Manager, Prudential Investments. |
Stephen Van Meter
Birth Date: June 5, 1975
CHIEF COMPLIANCE OFFICER AND SENIOR VICE PRESIDENT
Officer since: July 2015 | Principal Occupations: Senior Vice President and Chief Compliance Officer of the Federated Fund Family; Vice President and Chief Compliance Officer of Federated Investors, Inc. and Chief Compliance Officer of certain of its subsidiaries. Mr. Van Meter joined Federated in October 2011. He holds FINRA licenses under Series 3, 7, 24 and 66.
Previous Positions: Mr. Van Meter previously held the position of Compliance Operating Officer, Federated Investors, Inc. Prior to joining Federated, Mr. Van Meter served at the United States Securities and Exchange Commission in the positions of Senior Counsel, Office of Chief Counsel, Division of Investment Management and Senior Counsel, Division of Enforcement. |
Annual Shareholder Report
Evaluation and Approval of Advisory Contract–May 2016
Federated MDT Small Cap Growth Fund (the “Fund”)
Following a review and recommendation of approval by the Fund's independent trustees, the Fund's Board of Trustees (the “Board”) reviewed and unanimously approved at its May 2016 meetings the continuation of the Fund's investment advisory contract for an additional one-year term. The Board's decision regarding the contract reflects the exercise of its business judgment after consideration of all of the information received on whether to continue the existing arrangements.
The Board had previously appointed a Senior Officer, whose duties include specified responsibilities relating to the process by which advisory fees are to be charged to a Federated fund. The Senior Officer has the authority to retain consultants, experts, or staff as may be reasonably necessary to assist in the performance of his duties, reports directly to the Board, and may be terminated only with the approval of a majority of the independent members of the Board. The Senior Officer prepared and furnished to the Board an independent, written evaluation that covered topics discussed below (the “Senior Officer's Evaluation”). The Board considered the Senior Officer's Evaluation, along with other information, in deciding to approve the investment advisory contract.
The Board is also familiar with and considered judicial decisions concerning allegedly excessive investment advisory fees, which have indicated that the following factors may be relevant to an adviser's fiduciary duty with respect to its receipt of compensation from a fund: the nature and quality of the services provided by an adviser to a fund and its shareholders, including the performance and fees and expenses of the fund and of comparable funds; an adviser's cost of providing the services, including the profitability to an adviser of providing advisory services to a fund; the extent to which an adviser may realize “economies of scale” as a fund grows larger and, if such economies of scale exist, whether they have been shared with a fund and its shareholders or the family of funds; any “fall-out financial benefits” that accrue to an adviser because of its relationship with a fund (including research services received from brokers that execute fund trades and any fees paid to affiliates of an adviser for services rendered to a fund); comparative fee and expense structures, including a comparison of fees paid to an adviser with those paid by similar funds; and the extent of care, conscientiousness and independence with which board members perform their duties and their expertise, including whether they are fully informed about all facts the board deems relevant to its consideration of an adviser's services and fees. The Board noted that the Securities and Exchange Commission (“SEC”) disclosure requirements regarding the basis for the Board's approval of the Fund's investment advisory contract generally track the factors listed above. Consistent with these judicial decisions and SEC disclosure requirements, the Board also considered management fees charged to
Annual Shareholder Report
institutional and other clients of Federated MDTA LLC (the “Adviser”) for what might be viewed as like services. The Board was aware of these factors and was guided by them in its review of the Fund's investment advisory contract to the extent it considered them to be appropriate and relevant, as discussed further below.
The Board considered and weighed these circumstances in light of its substantial accumulated experience in governing the Fund and working with Federated Investors, Inc. and its affiliates (“Federated”) on matters relating to the Federated funds, and was assisted in its deliberations by independent legal counsel. Throughout the year, and in connection with its May meetings, the Board requested and received substantial and detailed information about the Fund and the Federated organization that was in addition to the extensive materials that comprise and accompany the Senior Officer's Evaluation. Federated provided much of this information at each regular meeting of the Board, and furnished additional substantial information in connection with the May meetings at which the Board's formal review of the investment advisory contract occurred. At the May meetings, in addition to meeting in separate sessions of the independent trustees without management present, senior management of the Adviser also met with the independent trustees and their counsel to discuss the materials presented and any other matters thought relevant by the Adviser or the trustees. Between regularly scheduled meetings, the Board also received information on particular matters as the need arose. Thus, the Board's consideration of the investment advisory contract included review of the Senior Officer's Evaluation, accompanying data and additional information covering such matters as: the Adviser's investment philosophy, revenue, profitability, personnel and processes; investment and operating strategies; the Fund's short- and long-term performance (in absolute terms, both on a gross basis and net of expenses, as well as in relationship to its particular investment program and certain competitor or “peer group” funds and/or other benchmarks, as appropriate), and comments on the reasons for performance; the Fund's investment objectives; the Fund's expenses (including the advisory fee itself and the overall expense structure of the Fund, both in absolute terms and relative to similar and/or competing funds, with due regard for contractual or voluntary expense limitations); the use and allocation of brokerage commissions derived from trading the Fund's portfolio securities (if any); and the nature, quality and extent of the advisory and other services provided to the Fund by the Adviser and its affiliates. The Board also considered the preferences and expectations of Fund shareholders; the entrepreneurial risk assumed by the Adviser in sponsoring the Fund; the continuing state of competition in the mutual fund industry and market practices; the range of comparable fees for similar funds in the mutual fund industry; the Fund's relationship to the Federated funds which include a comprehensive array of funds with different investment objectives, policies and strategies which are generally available for exchange without the incurrence of additional sales charges; compliance and
Annual Shareholder Report
audit reports concerning the Federated funds and the Federated companies that service them (including communications from regulatory agencies), as well as Federated's responses to any issues raised therein; and relevant developments in the mutual fund industry and how the Federated funds and/or Federated are responding to them. The Board's evaluation process is evolutionary. The criteria considered and the emphasis placed on relevant criteria change in recognition of changing circumstances in the mutual fund marketplace.
While mindful that courts have cautioned against giving such comparisons too much weight, the Board has found the use of comparisons of the Fund's fees and expenses to other mutual funds with comparable investment programs to be relevant to its deliberations. In this regard, the Board was presented with, and considered, information regarding the contractual advisory fee rates, net advisory fee rates, total expense ratios and each element of the Fund's total expense ratio (i.e., gross and net advisory fees, custody fees, portfolio accounting fees and transfer agency fees) relative to the Fund's peers. The Board focused on comparisons with other similar mutual funds more heavily than non-mutual fund products or services because it is believed that they are more relevant. For example, other mutual funds are the products most like the Fund, they are readily available to Fund shareholders as alternative investment vehicles, and they are the type of investment vehicle in fact chosen and maintained by the Fund's investors. The range of their fees and expenses therefore appears to be a relevant indicator of what consumers have found to be reasonable in the precise marketplace in which the Fund competes.
The Board reviewed the contractual advisory fee rate, net advisory fee rate where partially waived and other expenses of the Fund and noted the position of the Fund's fee rates relative to its peers. In this regard, the Board noted that the contractual advisory fee rate was above the median of the relevant peer group, but the Board noted the applicable waivers and reimbursements and that the overall expense structure of the Fund remained competitive in the context of other factors considered by the Board. In this regard, the Board had been previously advised that, while comparisons to fund peer groups are relevant in judging the reasonableness of advisory fees, the Fund's quantitative focus makes fee and expense comparisons particularly difficult. Although the Fund's advisory fee was above the median of the peer range, the peer group of funds varied widely in their complexity, and the Board had been informed that the management of the Fund is among the more complex relative to its peers.
By contrast, the Senior Officer has reviewed Federated's fees for providing advisory services to products outside the Federated funds (e.g., institutional and separate accounts and sub-adviser services). He concluded that mutual funds and institutional accounts are inherently different products. Those differences include, but are not limited to, different types of targeted investors; being subject to different laws and regulations; different legal structures; different average account sizes and portfolio management techniques made necessary by different cash flows and different associated costs; and the time spent by portfolio
Annual Shareholder Report
managers and their teams, funds financial services, legal, compliance and risk management in reviewing securities pricing, addressing different administrative responsibilities, addressing different degrees of risk associated with management and a variety of different costs. The Senior Officer did not consider the fees for providing advisory services to these outside products to be determinative in judging the appropriateness of mutual fund advisory fees.
The Senior Officer noted that the services, administrative responsibilities and risks associated with such relationships are quite different than serving as a primary adviser to a fund.
Following such evaluation, the Board concluded, within the context of its full deliberations, that the expenses of the Fund are reasonable and supported renewal of the investment advisory contract with respect to the Fund.
The Board considered the nature, extent and quality of the services provided to the Fund by the Adviser and the resources of the Adviser and its affiliates dedicated to the Fund. In this regard, the Board evaluated, among other things, the Adviser's personnel, experience, track record, overall reputation and willingness to invest in personnel and infrastructure that benefit the Fund. In addition, the Board reviewed the qualifications, backgrounds and responsibilities of the portfolio management team primarily responsible for the day-to-day management of the Fund. The Board noted the compliance programs of and the compliance-related resources provided to the Fund by the Adviser. The Fund's ability to deliver competitive performance when compared to its peer group was also deemed to be relevant by the Board as a useful indicator of how the Adviser is executing the Fund's investment program, which in turn was one of the Board's considerations in reaching a conclusion that the nature, extent, and quality of the Adviser's investment management services were such as to warrant continuation of the investment advisory contract.
In evaluating the Fund's investment performance, the Board considered performance results in light of the Fund's investment objective, strategies and risks, as disclosed in the Fund's prospectus. The Board particularly considered detailed investment reports on the Fund's performance provided to the Board throughout the year and in connection with the May meetings. The Senior Officer also reviewed information compiled by Federated, using data supplied by independent fund ranking organizations, regarding the performance of, and fees charged by, other mutual funds, noting his view that comparisons to fund peer groups may be helpful, though not conclusive, in judging the reasonableness of the proposed fees. The Board considered, in evaluating such comparisons, that in some cases individual funds may exhibit significant and unique differences in their objectives and management techniques when compared to other funds within an industry peer group, and that the Senior Officer had specifically noted that the Fund's quantitative focus makes fee and expense comparisons particularly difficult as the peer group of funds varied widely in their complexity, and the management of the Fund is among the more complex relative to its peers.
Annual Shareholder Report
For the one-year, three-year and five-year periods covered by the Senior Officer's Evaluation, the Fund's performance was above the median of the relevant peer group. In addition, the Board was informed by the Adviser that, for the same periods, the Fund outperformed its benchmark index for the one-year, three-year and five-year periods.
Following such evaluation, the Board concluded, within the context of its full deliberations, that the performance of the Fund supported renewal of the advisory contract with respect to the Fund.
The Board also received financial information about Federated, including information regarding the compensation and ancillary (or “fall-out”) benefits Federated derived from its relationships with the Federated funds. This information covered not only the fees under the investment advisory contracts, but also fees received by Federated's subsidiaries for providing other services to the Federated funds under separate contracts (e.g., for serving as the Federated funds' administrator). The information also detailed any indirect benefit Federated may derive from its receipt of research services from brokers who execute Federated fund trades. In addition, the Board considered the fact that, in order for a fund to be competitive in the marketplace, Federated and its affiliates frequently waived fees and/or reimbursed expenses and have disclosed to fund investors and/or indicated to the Board their intention to do so in the future, where appropriate. Moreover, the Board receives regular reporting as to the institution, adjustment or elimination of these voluntary waivers. The Board considered Federated's previous reductions in contractual management fees to certain funds in response to the Senior Officer's recommendations.
In this regard, the Board approved, a reduction of 16 basis points in the contractual advisory fee. This change more closely aligned the contractual fee with the net fee actually charged after the imposition of applicable voluntary waivers and was believed by both the Senior Officer and the Board to improve the market competitiveness of the Fund.
Federated furnished information, requested by the Senior Officer, that reported revenues on a fund-by-fund basis and made estimates of the allocation of expenses on a fund-by-fund basis, using allocation methodologies specified by the Senior Officer. The Senior Officer noted that, while these cost allocation reports apply consistent allocation processes, the inherent difficulties in allocating costs continues to cause the Senior Officer to question the precision of the process and to conclude that such reports may be unreliable, since a single change in an allocation estimate may dramatically alter the resulting estimate of cost and/or profitability of a fund and may produce unintended consequences. The allocation information, including the Senior Officer's view that fund-by-fund estimations may be unreliable, was considered in the analysis by the Board.
Annual Shareholder Report
The Board and the Senior Officer also reviewed information compiled by Federated comparing profitability information for Federated to other publicly held fund management companies. In this regard, the Senior Officer concluded that Federated's profit margins did not appear to be excessive. The Senior Officer also noted that Federated appeared financially sound, with the resources to fulfill its obligations under its contracts with the Fund.
The Senior Officer's Evaluation also discussed the notion of possible realization of “economies of scale” as a fund grows larger. The Board considered in this regard that the Adviser has made significant and long-term investments in areas that support all of the Federated funds, such as personnel and processes for the portfolio management, shareholder services, compliance, internal audit, and risk management functions, as well as systems technology (including technology relating to cybersecurity), and that the benefits of these efforts (as well as any economies of scale, should they exist) were likely to be enjoyed by the fund family as a whole. The Board noted that the Adviser's investments in these areas are extensive. In addition, the Board considered that Federated and its affiliates have frequently waived fees and/or reimbursed expenses and that this has allowed fund shareholders to share potential economies of scale from a fund's inception. Federated, as it does throughout the year, and again in connection with the Board's review, furnished information relative to revenue sharing or adviser paid fees. Federated and the Senior Officer noted that this information should be viewed to determine if there was an incentive to either not apply breakpoints or to apply breakpoints at higher levels and should not be viewed to determine the appropriateness of advisory fees, because it would represent marketing and distribution expenses. Finally, the Board also noted the absence of any applicable regulatory or industry guidelines on this subject, which (as discussed in the Senior Officer's Evaluation) is compounded by the lack of any common industry practice or general pattern with respect to structuring fund advisory fees with “breakpoints” that serve to reduce the fee as a fund attains a certain size.
The Senior Officer noted that, subject to the comments and recommendations made within the Senior Officer's Evaluation, his observations and the information accompanying the Senior Officer's Evaluation supported a finding by the Board that the management fee for the Fund was reasonable. Under these circumstances, other than the reduction in the contractual (or gross) advisory fee noted above, no changes were recommended to, and no objection was raised to, the continuation of the Fund's investment advisory contract.
In its decision to continue an existing investment advisory contract, the Board was mindful of the potential disruptions of the Fund's operations and various risks, uncertainties and other effects that could occur as a result of a decision to terminate or not renew an investment advisory contract. In particular, the Board recognized that many shareholders have invested in the Fund on the strength of the Adviser's industry standing and reputation and with the expectation that the
Annual Shareholder Report
Adviser will have a continuing role in providing advisory services to the Fund. Thus, the Board's approval of the investment advisory contract reflected the fact that it is the shareholders who have effectively selected the Adviser by virtue of having invested in the Fund. The Board concluded that, in light of the factors discussed above, including the nature, quality and scope of the services provided to the Fund by the Adviser and its affiliates, continuation of the investment advisory contract was appropriate.
The Board based its decision to approve the investment advisory contract on the totality of the circumstances and relevant factors and with a view to past and future long-term considerations. Not all of the factors and considerations identified above were necessarily relevant to the Fund, nor did the Board consider any one of them to be determinative. With respect to the factors that were relevant, the Board's decision to approve the continuation of the contract reflects its determination that Federated's performance and actions provided a satisfactory basis to support the decision to continue the existing arrangement.
Annual Shareholder Report
Voting Proxies on Fund Portfolio Securities
A description of the policies and procedures that the Fund uses to determine how to vote proxies, if any, relating to securities held in the Fund's portfolio is available, without charge and upon request, by calling 1-800-341-7400. A report on “Form N-PX” of how the Fund voted any such proxies during the most recent 12-month period ended June 30 is available via the Proxy Voting Record (Form N-PX) link associated with the Fund and share class name at www.FederatedInvestors.com/FundInformation. Form N-PX filings are also available at the SEC's website at www.sec.gov.
Quarterly Portfolio Schedule
The Fund files with the SEC a complete schedule of its portfolio holdings, as of the close of the first and third quarters of its fiscal year, on “Form N-Q.” These filings are available on the SEC's website at www.sec.gov and may be reviewed and copied at the SEC's Public Reference Room in Washington, DC. (Call 1-800-SEC-0330 for information on the operation of the Public Reference Room.) You may also access this information via the link to the Fund and share class name at www.FederatedInvestors.com/FundInformation.
Annual Shareholder Report
Mutual funds are not bank deposits or obligations, are not guaranteed by any bank and are not insured or guaranteed by the U.S. government, the Federal Deposit Insurance Corporation, the Federal Reserve Board or any other government agency. Investment in mutual funds involves investment risk, including the possible loss of principal.
This Report is authorized for distribution to prospective investors only when preceded or accompanied by the Fund's Prospectus, which contains facts concerning its objective and policies, management fees, expenses and other information.
Federated MDT Small Cap Growth Fund
Federated Investors Funds
4000 Ericsson Drive
Warrendale, PA 15086-7561
Contact us at FederatedInvestors.com
or call 1-800-341-7400.
Federated Securities Corp., Distributor
CUSIP 31421R775
CUSIP 31421R676
CUSIP 31421R767
CUSIP 31421R759
CUSIP 31421R619
37313 (9/16)
Federated is a registered trademark of Federated Investors, Inc.
2016 ©Federated Investors, Inc.
Item 2. Code of Ethics
(a) As of the end of the period covered by this report, the registrant has adopted a code of ethics (the "Section 406 Standards for Investment Companies - Ethical Standards for Principal Executive and Financial Officers") that applies to the registrant's Principal Executive Officer and Principal Financial Officer; the registrant's Principal Financial Officer also serves as the Principal Accounting Officer.
(c) There was no amendment to the registrant’s code of ethics described in Item 2(a) above during the period covered by the report.
(d) There was no waiver granted, either actual or implicit, from a provision to the registrant’s code of ethics described in Item 2(a) above during the period covered by the report.
(e) Not Applicable
(f)(3) The registrant hereby undertakes to provide any person, without charge, upon request, a copy of the code of ethics. To request a copy of the code of ethics, contact the registrant at 1-800-341-7400, and ask for a copy of the Section 406 Standards for Investment Companies - Ethical Standards for Principal Executive and Financial Officers.
Item 3. Audit Committee Financial Expert
The registrant's Board has determined that each of the following members of the Board's Audit Committee is an “audit committee financial expert,” and is "independent," for purposes of this Item: John T. Collins, G. Thomas Hough and Thomas M. O'Neill.
Item 4. Principal Accountant Fees and Services
(a) Audit Fees billed to the registrant for the two most recent fiscal years:
Fiscal year ended 2016 - $133,300
Fiscal year ended 2015 – $124,600
(b) Audit-Related Fees billed to the registrant for the two most recent fiscal years:
Fiscal year ended 2016 - $0
Fiscal year ended 2015 – $217
Fiscal year ended 2015- Travel to Audit Committee Meeting.
Amount requiring approval of the registrant’s audit committee pursuant to paragraph (c)(7)(ii) of Rule 2-01 of Regulation S-X, $0 and $87, respectively. Fiscal year ended 2015- Travel expenses for attendance at Audit Committee meeting.
(c) Tax Fees billed to the registrant for the two most recent fiscal years:
Fiscal year ended 2016 - $0
Fiscal year ended 2015 - $0
Amount requiring approval of the registrant’s audit committee pursuant to paragraph (c)(7)(ii) of Rule 2-01 of Regulation S-X, $0 and $0, respectively.
(d) All Other Fees billed to the registrant for the two most recent fiscal years:
Fiscal year ended 2016 - $0
Fiscal year ended 2015 - $0
Amount requiring approval of the registrant’s audit committee pursuant to paragraph (c)(7)(ii) of Rule 2-01 of Regulation S-X, $31,784 and $31,263, respectively. Fiscal year ended 2016- Service fee for analysis of potential Passive Foreign Investment Company holdings. Fiscal year ended 2015- Service fee for analysis of potential Passive Foreign Investment Company holdings.
(e)(1) Audit Committee Policies regarding Pre-approval of Services.
The Audit Committee is required to pre-approve audit and non-audit services performed by the independent auditor in order to assure that the provision of such services do not impair the auditor’s independence. Unless a type of service to be provided by the independent auditor has received general pre-approval, it will require specific pre-approval by the Audit Committee. Any proposed services exceeding pre-approved cost levels will require specific pre-approval by the Audit Committee.
Certain services have the general pre-approval of the Audit Committee. The term of the general pre-approval is 12 months from the date of pre-approval, unless the Audit Committee specifically provides for a different period. The Audit Committee will annually review the services that may be provided by the independent auditor without obtaining specific pre-approval from the Audit Committee and may grant general pre-approval for such services. The Audit Committee will revise the list of general pre-approved services from time to time, based on subsequent determinations. The Audit Committee will not delegate its responsibilities to pre-approve services performed by the independent auditor to management.
The Audit Committee has delegated pre-approval authority to its Chairman. The Chairman will report any pre-approval decisions to the Audit Committee at its next scheduled meeting. The Committee will designate another member with such pre-approval authority when the Chairman is unavailable.
AUDIT SERVICES
The annual Audit services engagement terms and fees will be subject to the specific pre-approval of the Audit Committee. The Audit Committee must approve any changes in terms, conditions and fees resulting from changes in audit scope, registered investment company (RIC) structure or other matters.
In addition to the annual Audit services engagement specifically approved by the Audit Committee, the Audit Committee may grant general pre-approval for other Audit Services, which are those services that only the independent auditor reasonably can provide. The Audit Committee has pre-approved certain Audit services, all other Audit services must be specifically pre-approved by the Audit Committee.
AUDIT-RELATED SERVICES
Audit-related services are assurance and related services that are reasonably related to the performance of the audit or review of the Company’s financial statements or that are traditionally performed by the independent auditor. The Audit Committee believes that the provision of Audit-related services does not impair the independence of the auditor, and has pre-approved certain Audit-related services, all other Audit-related services must be specifically pre-approved by the Audit Committee.
TAX SERVICES
The Audit Committee believes that the independent auditor can provide Tax services to the Company such as tax compliance, tax planning and tax advice without impairing the auditor’s independence. However, the Audit Committee will not permit the retention of the independent auditor in connection with a transaction initially recommended by the independent auditor, the purpose of which may be tax avoidance and the tax treatment of which may not be supported in the Internal Revenue Code and related regulations. The Audit Committee has pre-approved certain Tax services, all Tax services involving large and complex transactions must be specifically pre-approved by the Audit Committee.
ALL OTHER SERVICES
With respect to the provision of services other than audit, review or attest services the pre-approval requirement is waived if:
| (1) | The aggregate amount of all such services provided constitutes no more than five percent of the total amount of revenues paid by the registrant, the registrant’s adviser (not including any sub-adviser whose role is primarily portfolio management and is subcontracted with or overseen by another investment adviser), and any entity controlling, controlled by, or under common control with the investment adviser that provides ongoing services to the registrant to its accountant during the fiscal year in which the services are provided; |
| (2) | Such services were not recognized by the registrant, the registrant’s adviser (not including any sub-adviser whose role is primarily portfolio management and is subcontracted with or overseen by another investment adviser), and any entity controlling, controlled by, or under common control with the investment adviser that provides ongoing services to the registrant at the time of the engagement to be non-audit services; and |
| (3) | Such services are promptly brought to the attention of the Audit Committee of the issuer and approved prior to the completion of the audit by the Audit Committee or by one or more members of the Audit Committee who are members of the board of directors to whom authority to grant such approvals has been delegated by the Audit Committee. |
The Audit Committee may grant general pre-approval to those permissible non-audit services classified as All Other services that it believes are routine and recurring services, and would not impair the independence of the auditor.
The SEC’s rules and relevant guidance should be consulted to determine the precise definitions of prohibited non-audit services and the applicability of exceptions to certain of the prohibitions.
PRE-APPROVAL FEE LEVELS
Pre-approval fee levels for all services to be provided by the independent auditor will be established annually by the Audit Committee. Any proposed services exceeding these levels will require specific pre-approval by the Audit Committee.
PROCEDURES
Requests or applications to provide services that require specific approval by the Audit Committee will be submitted to the Audit Committee by both the independent auditor and the Principal Accounting Officer and/or Internal Auditor, and must include a joint statement as to whether, in their view, the request or application is consistent with the SEC’s rules on auditor independence.
(e)(2) Percentage of services identified in items 4(b) through 4(d) that were approved by the registrants audit committee pursuant to paragraph (c)(7)(i)(C) of Rule 2-01 of Regulation S-X:
4(b)
Fiscal year ended 2016 – 0%
Fiscal year ended 2015 – 0%
Percentage of services provided to the registrants investment adviser and any entity controlling, controlled by, or under common control with the investment adviser that provides ongoing services to the registrant that were approved by the registrants audit committee pursuant to paragraph (c)(7)(i)(C) of Rule 2-01 of Regulation S-X, 0% and 0% respectively.
4(c)
Fiscal year ended 2016 – 0%
Fiscal year ended 2015 – 0%
Percentage of services provided to the registrants investment adviser and any entity controlling, controlled by, or under common control with the investment adviser that provides ongoing services to the registrant that were approved by the registrants audit committee pursuant to paragraph (c)(7)(i)(C) of Rule 2-01 of Regulation S-X, 0% and 0% respectively.
4(d)
Fiscal year ended 2016 – 0%
Fiscal year ended 2015 – 0%
Percentage of services provided to the registrants investment adviser and any entity controlling, controlled by, or under common control with the investment adviser that provides ongoing services to the registrant that were approved by the registrants audit committee pursuant to paragraph (c)(7)(i)(C) of Rule 2-01 of Regulation S-X, 0% and 0% respectively.
| (g) | Non-Audit Fees billed to the registrant, the registrant’s investment adviser, and certain entities controlling, controlled by or under common control with the investment adviser: |
Fiscal year ended 2016 - $79,236
Fiscal year ended 2015 - $69,395
| (h) | The registrant’s Audit Committee has considered that the provision of non-audit services that were rendered to the registrant’s adviser (not including any sub-adviser whose role is primarily portfolio management and is subcontracted with or overseen by another investment adviser), and any entity controlling, controlled by, or under common control with the investment adviser that provides ongoing services to the registrant that were not pre-approved pursuant to paragraph (c)(7)(ii) of Rule 2-01 of Regulation S-X is compatible with maintaining the principal accountant’s independence. |
In its required communications to the Audit Committee of the registrant’s Board, Ernst & Young LLP (“EY”), the registrant’s independent public accountant, informed the Audit Committee that EY and/ or covered person professionals within EY maintain lending relationships with certain owners of greater than 10% of the shares of certain investment companies within the “investment company complex” as defined under Rule 2-01(f)(14) of Regulation S-X, which are affiliates of the registrant. EY has advised the Audit Committee that these lending relationships implicate Rule 2-01(c)(1)(ii)(A) of Regulation S-X (referred to as the “Loan Rule”). The Loan Rule prohibits an independent public accountant, or covered person professionals at such firm, from having a financial relationship (such as a loan) with a lender that is a record or beneficial owner of more than 10% of an audit client’s equity securities. For purposes of the Loan Rule, audit clients include the registrant, as well as all registered investment companies advised by advisory subsidiaries of Federated Investors, Inc., including the registrant’s investment adviser (“Adviser”), for which EY serves as independent public accountant, the Adviser, and their respective affiliates (collectively, the “Federated Fund Complex”).
EY informed the Audit Committee that EY believes that these lending relationships described above do not and will not impair EY’s ability to exercise objective and impartial judgment in connection with the audits of the financial statements for the registrant and a reasonable investor with knowledge of all relevant facts and circumstances would conclude that EY has been and is capable of objective and impartial judgment on all issues encompassed within EY’s audits.
On June 20, 2016, the Division of Investment Management of the Securities and Exchange Commission (“SEC”) issued a no-action letter to another mutual fund complex (see Fidelity Management & Research Company et al., No-Action Letter) related to similar Loan Rule matters as those described above. In that letter, the SEC Staff confirmed that it would not recommend enforcement action against an investment company that relied on the audit services performed by an independent public accountant where the Loan Rule was implicated in certain specified circumstances. In that letter, the SEC staff indicated that it would not recommend enforcement action against the investment company complex if the Loan Rule is implicated provided that: (1) the auditor has complied with PCAOB Rule 3526(b)(1) and 3526(b)(2); (2) the Loan Rule is implicated because of lending relationships; and (3) notwithstanding such lending relationships that implicate the Loan Rule, the auditor has concluded that it is objective and impartial with respect to the issues encompassed within its engagement as auditor of the funds. The circumstances described in the no-action letter are substantially similar to the circumstances that implicated the Loan Rule with respect to EY and the registrant. The relief provided in the SEC no-action letter is effective for 18 months from its June 20, 2016 issuance date.
If it were to be determined that the relief available under the no-action letter was improperly relied upon, or that the independence requirements under the federal securities laws were not otherwise complied with regarding the registrant, for certain periods, any of the registrant’s filings with the SEC which contain financial statements of the registrant for such periods may not comply with applicable federal securities laws, the registrant’s ability to offer shares under its current registration statement may be impacted, and certain financial reporting and/or other covenants with, and representations and warranties to, the registrant’s lender under its committed line of credit may be impacted. Such events could have a material adverse effect on the registrant and the Federated Fund Complex.
Item 5. Audit Committee of Listed Registrants
Not Applicable
Item 6. Schedule of Investments
(a) The registrant’s Schedule of Investments is included as part of the Report to Stockholders filed under Item 1 of this form.
(b) Not Applicable; Fund had no divestments during the reporting period covered since the previous Form N-CSR filing.
Item 7. Disclosure of Proxy Voting Policies and Procedures for Closed-End Management Investment Companies
Not Applicable
Item 8. Portfolio Managers of Closed-End Management Investment Companies
Not Applicable
Item 9. Purchases of Equity Securities by Closed-End Management Investment Company and Affiliated Purchasers
Not Applicable
Item 10. Submission of Matters to a Vote of Security Holders
No Changes to Report
Item 11. Controls and Procedures
(a) The registrant’s President and Treasurer have concluded that the
registrant’s disclosure controls and procedures (as defined in rule 30a-3(c) under the Act) are effective in design and operation and are sufficient to form the basis of the certifications required by Rule 30a-(2) under the Act, based on their evaluation of these disclosure controls and procedures within 90 days of the filing date of this report on Form N-CSR.
(b) There were no changes in the registrant’s internal control over financial reporting (as defined in rule 30a-3(d) under the Act) during the second fiscal quarter of the period covered by this report that have materially affected, or are reasonably likely to materially affect, the registrant’s internal control over financial reporting.
Item 12. Exhibits
(a)(1) Code of Ethics- Not Applicable to this Report.
(a)(2) Certifications of Principal Executive Officer and Principal Financial Officer.
(a)(3) Not Applicable.
(b) Certifications pursuant to 18 U.S.C. Section 1350.
SIGNATURES
Pursuant to the requirements of the Securities Exchange Act of 1934 and the Investment Company Act of 1940, the registrant has duly caused this report to be signed on its behalf by the undersigned, thereunto duly authorized.
Registrant Federated MDT Series
By /S/ Lori A. Hensler
Lori A. Hensler, Principal Financial Officer
Date September 22, 2016
Pursuant to the requirements of the Securities Exchange Act of 1934 and the Investment Company Act of 1940, this report has been signed below by the following persons on behalf of the registrant and in the capacities and on the dates indicated.
By /S/ J. Christopher Donahue
J. Christopher Donahue, Principal Executive Officer
Date September 22, 2016
By /S/ Lori A. Hensler
Lori A. Hensler, Principal Financial Officer
Date September 22, 2016