United States
Securities and Exchange Commission
Washington, D.C. 20549
Form N-CSR
Certified Shareholder Report of Registered Management Investment Companies
811-21904
(Investment Company Act File Number)
Federated MDT Series
_______________________________________________________________
(Exact Name of Registrant as Specified in Charter)
Federated Investors Funds
4000 Ericsson Drive
Warrendale, Pennsylvania 15086-7561
(Address of Principal Executive Offices)
(412) 288-1900
(Registrant's Telephone Number)
Peter J. Germain, Esquire
Federated Investors Tower
1001 Liberty Avenue
Pittsburgh, Pennsylvania 15222-3779
(Name and Address of Agent for Service)
(Notices should be sent to the Agent for Service)
Date of Fiscal Year End:07/31/19
Date of Reporting Period:07/31/19
| Item 1. | Reports to Stockholders |

Annual Shareholder Report
July 31, 2019
| Share Class | Ticker | A | QAACX | C | QCACX | Institutional | QIACX | R6 | QKACX |
Federated MDT All Cap Core Fund
Fund Established 2002
A Portfolio of Federated MDT Series
IMPORTANT NOTICE REGARDING REPORT DELIVERY
Beginning on January 1, 2021, as permitted by regulations adopted by the Securities and Exchange Commission, paper copies of the Fund's shareholder reports like this one will no longer be sent by mail, unless you specifically request paper copies of the reports from the Fund or from your financial intermediary, such as a broker-dealer or bank. Instead, the reports will be made available on a website, and you will be notified by mail each time a report is posted and provided with a website link to access the report.
If you already elected to receive shareholder reports electronically, you will not be affected by this change and you need not take any action. You may elect to receive shareholder reports and other communications from the Fund or your financial intermediary electronically by contacting your financial intermediary (such as a broker-dealer or bank); other shareholders may call the Fund at 1-800-341-7400, Option 4.
You may elect to receive all future reports in paper free of charge. You can inform the Fund or your financial intermediary that you wish to continue receiving paper copies of your shareholder reports by contacting your financial intermediary (such as a broker-dealer or bank); other shareholders may call the Fund at 1-800-341-7400, Option 4. Your election to receive reports in paper will apply to all funds held with the Fund complex or your financial intermediary.
Not FDIC Insured ■ May Lose Value ■ No Bank Guarantee
J. Christopher
Donahue
President
Federated MDT All Cap Core Fund
Letter from the President
Dear Valued Shareholder,
I am pleased to present the Annual Shareholder Report for your fund covering the period from August 1, 2018 through July 31, 2019. This report includes Management's Discussion of Fund Performance, a complete listing of your fund's holdings, performance information and financial statements along with other important fund information.
In addition, our website, FederatedInvestors.com, offers easy access to Federated resources that include timely fund updates, economic and market insights from our investment strategists, and financial planning tools.
Thank you for investing with Federated. I hope you find this information useful and look forward to keeping you informed.
Sincerely,
J. Christopher Donahue, President
CONTENTS
| 1 |
| 6 |
| 7 |
| 14 |
| 18 |
| 20 |
| 21 |
| 22 |
| 32 |
| 34 |
| 36 |
| 42 |
| 50 |
| 50 |
Management's Discussion of Fund Performance (unaudited)
The total return of Federated MDT All Cap Core Fund (the “Fund”), based on net asset value, for the 12-month reporting period ended July 31, 2019, was 7.80% for Class A Shares, 6.96% for Class C Shares, 8.08% for Institutional Shares and 8.08% for Class R6 Shares. The total return for the Russell 3000® Index (R3000),1 the Fund's broad-based securities market index, was 7.05% for the same period. The total return of the Morningstar Large Blend Funds Average (MLBFA),2 a peer group average for the Fund, was 6.02% during the same period. The Fund's and MLBFA's total returns for the most recently completed fiscal year reflected actual cash flows, transaction costs and other expenses, which were not reflected in the total return of the R3000.
During the reporting period, the Fund's investment strategy focused on stock selection. This was the most significant factor affecting the Fund's performance relative to the R3000 during the period.
The following discussion will focus on the performance of the Fund's Class R6 Shares.
Market Overview
During the reporting period, overall domestic equity market performance was moderately strong as evidenced by the 7.05% return of the whole-market R3000. Larger cap stocks had a much better year than small cap stocks.3 The Russell Top 200® Index4 returned 8.51% and the Russell Midcap® Index5 returned 6.71%, but both the small-cap Russell 2000® Index6 and the very small-cap Russell Microcap® Index7 fell (returns of -4.42% and -11.55%, respectively). For style, this was the third fiscal year in a row that growth stocks led value stocks by a substantial margin. During the reporting period, the Russell 3000® Growth Index8 returned 9.88% and the Russell 3000® Value Index9 returned 4.23%. The widest difference between the growth and value styles was in the midcap range, where the Russell Midcap® Growth Index10 returned 14.15%, and the Russell Midcap Value Index11 returned 1.78%.
The best performing sectors in the R3000 during the reporting period were Information Technology (17.06%), Utilities (16.65%) and Real Estate (13.24%). Underperforming sectors during the same period included Energy (-19.42%), Materials (-3.94%) and Financials (2.77%).
Annual Shareholder Report
STOCK SELECTION
When looking at the Fund's outperformance in terms of fundamental and technical characteristics during this growth-oriented period, most of the Fund's outperformance relative to the R3000 was driven by growth-oriented stocks with neutral to high analyst conviction and weaker value characteristics. Stocks with strong value characteristics, particularly high structural earnings (a measure of earnings repeatability), detracted from performance. The Fund's sector exposures remained close to R3000 weights at the end of the period except for an underweight in the Real Estate sector (the Fund did not invest in the Real Estate sector during the period). Strong stock selection in the Information Technology, Energy and Consumer Discretionary sectors contributed the most to the Fund's outperformance. There was a small offset created by the Fund's underweight in the Real Estate sector.
Individual stocks enhancing the Fund's performance during the reporting period included Global Payments Inc., Veeva Systems Inc., Stryker Corporation and Live Nation Entertainment, Inc.
Individual stocks detracting from the Fund's performance during the reporting period included Microsoft Corporation and Align Technology, Inc. Microsoft outperformed the R3000 but was underweighted by the Fund, and Align Technology underperformed the R3000 and was overweighted by the Fund. Align Technology had been the top contributor to performance during the year ended July 31, 2018.
| 1 | Please see the footnotes to the line graphs below for definitions of, and further information about, the Russell 3000® Index. |
| 2 | Morningstar has assigned the Fund to the Morningstar Large Cap Value Funds Average peer group, however, the MLBFA is being used for comparison purposes. The Fund invests in both value and growth stocks and therefore the Fund's Adviser believes that the MLBFA is more reflective of the Fund's investment style. Please see the footnotes to the line graphs below for definitions of, and further information about, the MLBFA. |
| 3 | Small-cap stocks may be less liquid and subject to greater price volatility than large-cap stocks. |
| 4 | The Russell Top 200® Index measures the performance of the largest cap segment of the U.S. equity universe. The Russell Top 200® Index is a subset of the Russell 3000® Index. It includes approximately 200 of the largest securities based on a combination of their market cap and current index membership and represents approximately 68% of the U.S. market. The Russell Top 200® Index is constructed to provide a comprehensive and unbiased barometer for this very large cap segment and is completely reconstituted annually to ensure new and growing equities are reflected.* |
| 5 | The Russell Midcap® Index measures the performance of the mid-cap segment of the U.S. equity universe. The Russell Midcap® Index is a subset of the Russell 1000® Index. It includes approximately 800 of the smallest securities based on a combination of their market cap and current index membership. The Russell Midcap® Index represents approximately 31% of the total market capitalization of the Russell 1000® companies. The Russell Midcap® Index is constructed to provide a comprehensive and unbiased barometer for the mid-cap segment. The Russell Midcap Index is completely reconstituted annually to ensure larger stocks do not distort the performance and characteristics of the true mid-cap opportunity set.* |
| 6 | The Russell 2000® Index measures the performance of the small-cap segment of the U.S. equity universe. The Russell 2000® Index is a subset of the Russell 3000® Index representing approximately 10% of the total market capitalization of that index. It includes approximately 2000 of the smallest securities based on a combination of their market cap and current index membership. The Russell 2000® |
Annual Shareholder Report
| | Index is constructed to provide a comprehensive and unbiased small-cap barometer and is completely reconstituted annually to ensure larger stocks do not distort the performance and characteristics of the true small-cap opportunity set.* |
| 7 | The Russell Microcap® Index measures the performance of the microcap segment of the U.S. equity market. Microcap stocks make up less than 3% of the U.S. equity market (by market cap) and consist of the smallest 1,000 securities in the small-cap Russell 2000® Index, plus the next 1,000 smallest eligible securities by market cap. The Russell Microcap® Index is constructed to provide a comprehensive and unbiased barometer for the microcap segment trading on national exchanges and is completely reconstituted annually to ensure new and growing equities are reflected and companies continue to reflect appropriate capitalization and value characteristics.* |
| 8 | The Russell 3000® Growth Index measures the performance of the broad growth segment of the U.S. equity universe. It includes those Russell 3000® Index companies with higher price-to-book ratios and higher forecasted growth values. The Russell 3000® Growth Index is constructed to provide a comprehensive, unbiased and stable barometer of the broad growth market. The Russell 3000® Growth Index is completely reconstituted annually to ensure new and growing equities are included and that the represented companies continue to reflect growth characteristics.* |
| 9 | The Russell 3000® Value Index measures the performance of the broad value segment of U.S. equity value universe. It includes those Russell 3000® Index companies with lower price-to-book ratios and lower forecasted growth values. The Russell 3000® Value Index is constructed to provide a comprehensive, unbiased and stable barometer of the broad value market. The Russell 3000® Value Index is completely reconstituted annually to ensure new and growing equities are included and that the represented companies continue to reflect value characteristics.* |
| 10 | The Russell Midcap® Growth Index measures the performance of the mid-cap growth segment of the U.S. equity universe. It includes those Russell Midcap® Index companies with higher price-to-book ratios and higher forecasted growth values. The Russell Midcap® Growth Index is constructed to provide a comprehensive and unbiased barometer of the mid-cap growth market and is completely reconstituted annually to ensure larger stocks do not distort the performance and characteristics of the true mid-cap growth market.* |
| 11 | The Russell Midcap® Value Index measures the performance of the mid-cap value segment of the U.S. equity universe. It includes those Russell Midcap Index companies with lower price-to-book ratios and lower forecasted growth values. The Russell Midcap® Value Index is constructed to provide a comprehensive and unbiased barometer of the mid-cap value market and is completely reconstituted annually to ensure larger stocks do not distort the performance and characteristics of the true mid-cap value market.* |
| * | The index is unmanaged, and it is not possible to invest directly in an index. |
Annual Shareholder Report
FUND PERFORMANCE AND GROWTH OF A $10,000 INVESTMENT
The graph below illustrates the hypothetical investment of $10,0001 in the Federated MDT All Cap Core Fund (the “Fund”) from July 31, 2009 to July 31, 2019, compared to the Russell 3000®Index (R3000)2and the Morningstar Large Blend Funds Average (MLBFA).3 The Average Annual Total Return table below shows returns for each class averaged over the stated periods.
Growth of a $10,000 Investment
Growth of $10,000 as of July 31, 2019
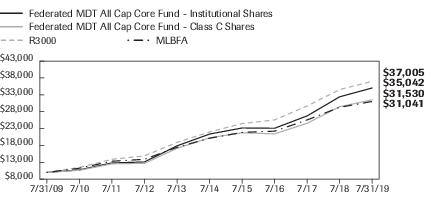
| Federated MDT All Cap Core Fund - | Institutional Shares | Class C Shares | R3000 | MLBFA |
| F | F | I | I |
| 7/31/2009 | 10,000 | 10,000 | 10,000 | 10,000 |
| 7/31/2010 | 10,754 | 10,633 | 11,482 | 11,246 |
| 7/31/2011 | 12,811 | 12,548 | 13,886 | 13,314 |
| 7/31/2012 | 13,098 | 12,693 | 14,903 | 13,895 |
| 7/31/2013 | 17,873 | 17,135 | 18,907 | 17,447 |
| 7/31/2014 | 21,366 | 20,261 | 22,002 | 20,128 |
| 7/31/2015 | 23,170 | 21,742 | 24,485 | 21,865 |
| 7/31/2016 | 23,091 | 21,431 | 25,573 | 22,231 |
| 7/31/2017 | 26,761 | 24,585 | 29,700 | 25,560 |
| 7/31/2018 | 32,421 | 29,479 | 34,568 | 29,304 |
| 7/31/2019 | 35,042 | 31,530 | 37,005 | 31,041 |
41 graphic description end -->
| ■ | Total returns shown for the Class C Shares include the maximum contingent deferred sales charge of 1.00% as applicable. |
The Fund offers multiple share classes whose performance may be greater than or less than its other share class(es) due to differences in sales charges and expenses. See the Average Annual Total Return table below for the returns of additional classes not shown in the line graph above.
Average Annual Total Returnsfor the Period Ended 7/31/2019
(returns reflect all applicable sales charges and contingent deferred sales charges as specified below in footnote #1)
| | 1 Year | 5 Years | 10 Years |
| Class A Shares | 1.86% | 8.85% | 12.41% |
| Class C Shares | 5.97% | 9.25% | 12.17% |
| Institutional Shares | 8.08% | 10.40% | 13.36% |
| Class R6 Shares4 | 8.08% | 10.07% | 12.77% |
| R3000 | 7.05% | 10.96% | 13.98% |
| MLBFA | 6.02% | 9.42% | 12.52% |
Annual Shareholder Report
Performance data quoted represents past performance which is no guarantee of future results. Investment return and principal value will fluctuate so that an investor's shares, when redeemed, may be worth more or less than their original cost. Mutual fund performance changes over time and current performance may be lower or higher than what is stated. For current to the most recent month-end performance and after-tax returns, visit FederatedInvestors.com or call 1-800-341-7400. Returns shown do not reflect the deduction of taxes that a shareholder would pay on Fund distributions or the redemption of Fund shares. Mutual funds are not obligations of or guaranteed by any bank and are not federally insured.
| 1 | Represents a hypothetical investment of $10,000 in the Fund after deducting applicable sales charges: for Class A Shares, the maximum sales charge of 5.50% ($10,000 investment minus $550 sales charge = $9,450); for Class C Shares a 1.00% contingent deferred sales charge would be applied on any redemption less than one year from the purchase date. The Fund's performance assumes the reinvestment of all dividends and distributions. The R3000 and MLBFA have been adjusted to reflect reinvestment of dividends of securities. |
| 2 | The R3000 measures the performance of the largest 3,000 U.S. companies representing approximately 98% of the investable U.S. equity market. The R3000 is constructed to provide a comprehensive, unbiased, and stable barometer of the broad market and is completely reconstituted annually to ensure new and growing equities are reflected. The index is unmanaged and, unlike the Fund, is not affected by cash flows. It is not possible to invest directly in an index. The R3000 is not adjusted to reflect sales charges, expenses or other fees that the Securities and Exchange Commission requires to be reflected in the Fund's performance. |
| 3 | Morningstar figures represent the average of the total returns reported by all the funds designated by Morningstar as falling into the respective category indicated. They do not reflect sales charges. The Morningstar figures in the Growth of $10,000 line graph are based on historical return information published by Morningstar and reflect the return of the funds comprising the category in the year of publication. Because the funds designated by Morningstar as falling into the category can change over time, the Morningstar figures in the line graph may not match the Morningstar figures in the Average Annual Total Returns table, which reflect the return of the funds that currently comprise the category. |
| 4 | Prior to September 1, 2016, Class R6 Shares were known as Class R Shares and included 12b-1 fees and certain other expenses. As of September 1, 2016, Class R6 does not include such 12b-1 fees and certain other expenses, and the performance shown above for Class R6 prior to September 1, 2016, reflects the higher Class R expenses. |
Annual Shareholder Report
Portfolio of Investments Summary Table (unaudited)
At July 31, 2019, the Fund's index composition1 was as follows:
| Sector Composition | Percentage of
Total Net Assets |
| Information Technology | 21.4% |
| Financials | 14.4% |
| Health Care | 13.1% |
| Consumer Discretionary | 11.4% |
| Industrials | 10.6% |
| Communication Services | 8.2% |
| Consumer Staples | 7.3% |
| Energy | 5.5% |
| Materials | 3.2% |
| Utilities | 2.7% |
| Securities Lending Collateral2 | 0.1% |
| Cash Equivalents3 | 2.4% |
| Other Assets and Liabilities—Net4 | (0.3)% |
| TOTAL | 100.0% |
| 1 | Except for Cash Equivalents and Other Assets and Liabilities, sector classifications are based upon, and individual portfolio securities are assigned to, the classifications of the Global Industry Classification Standard (GICS) except that the Adviser assigns a classification to securities not classified by the GICS and to securities for which the Adviser does not have access to the classification made by the GICS. |
| 2 | Represents cash collateral received for portfolio securities on loan that may be invested in affiliated money market funds, other money market instruments and/or repurchase agreements. |
| 3 | Cash Equivalents include any investments in money market mutual funds and/or overnight repurchase agreements other than those representing cash collateral for securities lending. |
| 4 | Assets, other than investments in securities, less liabilities. See Statement of Assets and Liabilities. |
Annual Shareholder Report
Portfolio of Investments
July 31, 2019
| Shares | | | Value |
| | | COMMON STOCKS—97.8% | |
| | | Communication Services—8.2% | |
| 4,370 | 1 | AMC Networks, Inc. | $233,271 |
| 24,694 | | AT&T, Inc. | 840,831 |
| 1,284 | 1 | Alphabet, Inc., Class A | 1,564,169 |
| 110 | | Cable One, Inc. | 133,848 |
| 21,466 | 1 | Charter Communications, Inc. | 8,272,567 |
| 20,698 | 1 | Facebook, Inc. | 4,020,172 |
| 2,119 | 1 | IAC Interactive Corp. | 506,547 |
| 107,822 | 1 | Live Nation Entertainment, Inc. | 7,769,653 |
| 43,653 | 1 | MSG Networks, Inc. | 828,970 |
| 35,402 | | Verizon Communications, Inc. | 1,956,669 |
| 16,508 | | Viacom, Inc., Class B | 501,018 |
| | | TOTAL | 26,627,715 |
| | | Consumer Discretionary—11.4% | |
| 8,000 | | Abercrombie & Fitch Co., Class A | 151,440 |
| 490 | 1 | Amazon.com, Inc. | 914,722 |
| 8,712 | 1 | American Outdoor Brands Corp. | 83,984 |
| 2,347 | 1 | AutoZone, Inc. | 2,635,775 |
| 16,403 | 2 | Bed Bath & Beyond, Inc. | 159,273 |
| 12,101 | 1 | Burlington Stores, Inc. | 2,187,256 |
| 1,875 | 1 | Chipotle Mexican Grill, Inc. | 1,491,619 |
| 3,520 | 2 | Dillards, Inc., Class A | 256,186 |
| 17,549 | | Dunkin' Brands Group, Inc. | 1,406,728 |
| 79,965 | | eBay, Inc. | 3,293,758 |
| 35,142 | | Expedia Group, Inc. | 4,664,749 |
| 35,900 | | Ford Motor Co. | 342,127 |
| 9,671 | 1 | Fossil, Inc. | 106,768 |
| 15,062 | | Goodyear Tire & Rubber Co. | 206,801 |
| 15,827 | | Harley-Davidson, Inc. | 566,290 |
| 13,204 | | Hilton Worldwide Holdings, Inc. | 1,274,846 |
| 18,331 | | Home Depot, Inc. | 3,917,151 |
| 4,881 | | Kohl's Corp. | 262,891 |
| 3,400 | 1 | Libbey, Inc. | 5,746 |
| 32,501 | | Lowe's Cos., Inc. | 3,295,601 |
| 8,145 | 1 | Lululemon Athletica, Inc. | 1,556,428 |
| 6,306 | 1 | Planet Fitness, Inc. | 496,030 |
Annual Shareholder Report
| Shares | | | Value |
| | | COMMON STOCKS—continued | |
| | | Consumer Discretionary—continued | |
| 13,397 | | Ralph Lauren Corp. | $1,396,369 |
| 6,512 | 1 | Skechers USA, Inc., Class A | 247,065 |
| 13,563 | 2 | Tailored Brands, Inc. | 66,052 |
| 7,692 | | Target Corp. | 664,589 |
| 7,454 | 1 | Tempur Sealy International, Inc. | 597,960 |
| 8,419 | | Toll Brothers, Inc. | 302,831 |
| 7,554 | | Tupperware Brands Corp. | 115,652 |
| 31,450 | | Wyndham Destinations, Inc. | 1,480,037 |
| 26,311 | | Yum! Brands, Inc. | 2,960,514 |
| | | TOTAL | 37,107,238 |
| | | Consumer Staples—7.3% | |
| 4,837 | | Colgate-Palmolive Co. | 347,006 |
| 4,773 | | Costco Wholesale Corp. | 1,315,582 |
| 20,347 | 1 | Dean Foods Co. | 29,503 |
| 33,620 | | Estee Lauder Cos., Inc., Class A | 6,192,468 |
| 7,300 | | Fresh Del Monte Produce, Inc. | 221,409 |
| 28,034 | 1 | Herbalife Ltd. | 1,149,955 |
| 2,069 | | Ingredion, Inc. | 159,913 |
| 40,237 | | Kimberly-Clark Corp. | 5,458,149 |
| 16,514 | | Lamb Weston Holdings, Inc. | 1,108,420 |
| 46,008 | | PepsiCo, Inc. | 5,880,282 |
| 9,509 | 1 | Post Holdings, Inc. | 1,019,555 |
| 1,236 | | Procter & Gamble Co. | 145,897 |
| 12,745 | | Sysco Corp. | 873,925 |
| | | TOTAL | 23,902,064 |
| | | Energy—5.5% | |
| 60,069 | | Chevron Corp. | 7,395,095 |
| 14,890 | | Continental Resources, Inc. | 553,461 |
| 70,560 | | EOG Resources, Inc. | 6,057,576 |
| 39,101 | | Exxon Mobil Corp. | 2,907,550 |
| 16,659 | | HollyFrontier Corp. | 829,118 |
| 42,289 | 1 | Noble Corp. PLC | 94,305 |
| | | TOTAL | 17,837,105 |
| | | Financials—14.4% | |
| 76,245 | | Allstate Corp. | 8,188,713 |
| 32,960 | | American International Group, Inc. | 1,845,430 |
| 13,800 | | Ameriprise Financial, Inc. | 2,008,038 |
| 12,621 | 1 | Athene Holding Ltd. | 515,694 |
Annual Shareholder Report
| Shares | | | Value |
| | | COMMON STOCKS—continued | |
| | | Financials—continued | |
| 19,891 | | Bank of America Corp. | $610,256 |
| 65,596 | | Citigroup, Inc. | 4,667,811 |
| 30,146 | | Citizens Financial Group, Inc. | 1,123,240 |
| 15,016 | | Everest Re Group Ltd. | 3,703,546 |
| 29,600 | | Fifth Third Bancorp | 878,824 |
| 8,201 | 1 | Green Dot Corp. | 415,709 |
| 17,200 | | Huntington Bancshares, Inc. | 245,100 |
| 35,447 | | JPMorgan Chase & Co. | 4,111,852 |
| 30,200 | | KeyCorp | 554,774 |
| 11,250 | | LPL Investment Holdings, Inc. | 943,538 |
| 29,651 | | M & T Bank Corp. | 4,870,177 |
| 7,153 | | MSCI, Inc., Class A | 1,625,448 |
| 357 | | Marketaxess Holdings, Inc. | 120,323 |
| 25,900 | | Navient Corp. | 366,485 |
| 3,442 | | PNC Financial Services Group | 491,862 |
| 30,652 | | Popular, Inc. | 1,764,329 |
| 34,021 | | Progressive Corp., OH | 2,755,021 |
| 28,531 | | Prudential Financial, Inc. | 2,890,476 |
| 12,989 | | RenaissanceRe Holdings Ltd. | 2,352,957 |
| 2,673 | | Synchrony Financial | 95,907 |
| | | TOTAL | 47,145,510 |
| | | Health Care—13.1% | |
| 13,462 | 1 | Alexion Pharmaceuticals, Inc. | 1,525,110 |
| 1,153 | 1 | Amedisys, Inc. | 158,987 |
| 1,152 | | AmerisourceBergen Corp. | 100,397 |
| 7,102 | | Anthem, Inc. | 2,092,320 |
| 21,989 | 1 | Biogen, Inc. | 5,229,424 |
| 10,836 | | Bristol-Myers Squibb Co. | 481,227 |
| 464 | | Chemed Corp. | 188,101 |
| 20,834 | 1,2 | Community Health Systems, Inc. | 42,710 |
| 14,675 | | Eli Lilly & Co. | 1,598,841 |
| 61,040 | | HCA Healthcare, Inc. | 8,149,450 |
| 3,749 | 1 | IDEXX Laboratories, Inc. | 1,057,405 |
| 15,052 | 1 | Incyte Genomics, Inc. | 1,278,216 |
| 7,440 | 1 | Ionis Pharmaceuticals, Inc. | 489,998 |
| 14,274 | 1 | Jazz Pharmaceuticals PLC. | 1,989,510 |
| 1,434 | | McKesson Corp. | 199,254 |
| 1,231 | 1 | Mettler-Toledo International, Inc. | 931,559 |
Annual Shareholder Report
| Shares | | | Value |
| | | COMMON STOCKS—continued | |
| | | Health Care—continued | |
| 3,360 | 1 | Mirati Therapeutics, Inc. | $355,488 |
| 4,765 | 1 | Molina Healthcare, Inc. | 632,697 |
| 1,633 | 1 | Orthofix Medical, Inc. | 87,284 |
| 34,827 | | Stryker Corp. | 7,306,008 |
| 552 | | UnitedHealth Group, Inc. | 137,454 |
| 34,899 | 1 | Veeva Systems, Inc. | 5,789,744 |
| 17,446 | 1 | Vertex Pharmaceuticals, Inc. | 2,906,853 |
| | | TOTAL | 42,728,037 |
| | | Industrials—10.6% | |
| 9,100 | | AGCO Corp. | 700,700 |
| 6,465 | | Allison Transmission Holdings, Inc. | 297,067 |
| 12,535 | | Boeing Co. | 4,276,691 |
| 20,059 | | CSX Corp. | 1,412,154 |
| 2,140 | | Caterpillar, Inc. | 281,774 |
| 3,243 | 1 | CoStar Group, Inc. | 1,995,742 |
| 11,779 | | Delta Air Lines, Inc. | 718,990 |
| 5,086 | | Deluxe Corp. | 226,937 |
| 4,916 | | Fortune Brands Home & Security, Inc. | 270,085 |
| 1,696 | | GATX Corp. | 130,355 |
| 359 | | Grainger (W.W.), Inc. | 104,480 |
| 25,860 | | Heico Corp. | 3,536,355 |
| 6,610 | | Insperity, Inc. | 702,973 |
| 21,800 | 1 | Jet Blue Airways Corp. | 419,214 |
| 6,829 | | Kennametal, Inc. | 236,147 |
| 3,362 | | L3Harris Technologies, Inc. | 697,951 |
| 15,298 | | Lennox International, Inc. | 3,923,631 |
| 25,327 | | Lockheed Martin Corp. | 9,172,680 |
| 52,571 | | PACCAR, Inc. | 3,687,330 |
| 14,360 | 1 | SPX Corp. | 501,164 |
| 3,016 | | SkyWest, Inc. | 183,101 |
| 11,499 | 1 | United Airlines Holdings, Inc. | 1,056,873 |
| 3,060 | 1 | WESCO International, Inc. | 155,264 |
| | | TOTAL | 34,687,658 |
| | | Information Technology—21.4% | |
| 10,542 | 1 | Adobe, Inc. | 3,150,582 |
| 7,796 | 1 | Ansys, Inc. | 1,583,524 |
| 12,790 | | Apple, Inc. | 2,724,782 |
| 8,424 | 1 | Atlassian Corp. PLC | 1,180,371 |
Annual Shareholder Report
| Shares | | | Value |
| | | COMMON STOCKS—continued | |
| | | Information Technology—continued | |
| 31,765 | 1 | Autodesk, Inc. | $4,960,740 |
| 51,107 | | Automatic Data Processing, Inc. | 8,510,338 |
| 12,897 | | Booz Allen Hamilton Holding Corp. | 886,669 |
| 2,396 | | CDW Corp. | 283,111 |
| 68,779 | 1 | Cadence Design Systems, Inc. | 5,083,456 |
| 9,670 | | DXC Technology Co. | 539,296 |
| 1,827 | 1 | Fair Isaac & Co., Inc. | 634,736 |
| 3,770 | 1 | FleetCor Technologies, Inc. | 1,071,321 |
| 30,100 | 1 | Fortinet Inc. | 2,417,331 |
| 45,446 | | Global Payments, Inc. | 7,631,292 |
| 44,378 | | Hewlett-Packard Co. | 933,713 |
| 7,884 | 1 | HubSpot, Inc. | 1,409,029 |
| 17,267 | | Intel Corp. | 872,847 |
| 11,765 | | Intuit, Inc. | 3,262,552 |
| 3,745 | 1 | Keysight Technologies, Inc. | 335,252 |
| 27,375 | | Mastercard, Inc. | 7,453,391 |
| 24,457 | | Microsoft Corp. | 3,332,755 |
| 16,514 | | NetApp, Inc. | 965,904 |
| 7,224 | 1 | Paycom Software, Inc. | 1,739,178 |
| 7,818 | 1 | PayPal, Inc. | 863,107 |
| 9,338 | 1 | Salesforce.com, Inc. | 1,442,721 |
| 4,200 | 1 | Sanmina Corp. | 133,350 |
| 5,468 | 1 | ServiceNow, Inc. | 1,516,769 |
| 2,404 | | Universal Display Corp. | 507,436 |
| 27,428 | | Vishay Intertechnology, Inc. | 466,276 |
| 11,900 | 1 | WEX, Inc. | 2,595,033 |
| 18,900 | | Western Union Co. | 396,900 |
| 2,493 | | Xilinx, Inc. | 284,726 |
| 7,946 | 1 | Zscaler, Inc. | 669,609 |
| | | TOTAL | 69,838,097 |
| | | Materials—3.2% | |
| 40,800 | | Domtar, Corp. | 1,731,960 |
| 104,611 | | DuPont de Nemours, Inc. | 7,548,730 |
| 37,454 | | Mosaic Co./The | 943,466 |
| 2,471 | | Reliance Steel & Aluminum Co. | 246,977 |
| | | TOTAL | 10,471,133 |
| | | Utilities—2.7% | |
| 24,600 | | AES Corp. | 413,034 |
Annual Shareholder Report
| Shares | | | Value |
| | | COMMON STOCKS—continued | |
| | | Utilities—continued | |
| 44,605 | | Consolidated Edison Co. | $3,789,641 |
| 33,353 | | Edison International | 2,486,132 |
| 28,304 | | Exelon Corp. | 1,275,378 |
| 18,501 | | NiSource, Inc. | 549,295 |
| 2,481 | | Pinnacle West Capital Corp. | 226,317 |
| | | TOTAL | 8,739,797 |
| | | TOTAL COMMON STOCKS
(IDENTIFIED COST $291,497,344) | 319,084,354 |
| | | INVESTMENT COMPANIES—2.5% | |
| 491,528 | | Federated Government Obligations Fund, Premier Shares, 2.25%3 | 491,528 |
| 7,701,438 | | Federated Institutional Prime Value Obligations Fund, Institutional Shares, 2.39%3 | 7,703,749 |
| | | TOTAL INVESTMENT COMPANIES
(IDENTIFIED COST $8,195,277) | 8,195,277 |
| | | TOTAL INVESTMENT IN SECURITIES—100.3%
(IDENTIFIED COST $299,692,621)4 | 327,279,631 |
| | | OTHER ASSETS AND LIABILITIES - NET—(0.3)%5 | (898,266) |
| | | TOTAL NET ASSETS—100% | $326,381,365 |
Affiliated fund holdings are investment companies which are managed by the Adviser or an affiliate of the Adviser. Transactions with affiliated fund holdings during the period ended July 31, 2019, were as follows:
| | Federated
Government
Obligations Fund,
Premier Shares* | Federated
Institutional
Prime Value
Obligations Fund,
Institutional Shares | Total of
Affiliated
Transactions |
| Balance of Shares Held 7/31/2018 | 740,143 | 4,824,255 | 5,564,398 |
| Purchases/Additions | 22,320,512 | 85,456,752 | 107,777,264 |
| Sales/Reductions | (22,569,127) | (82,579,569) | (105,148,696) |
| Balance of Shares Held 7/31/2019 | 491,528 | 7,701,438 | 8,192,966 |
| Value | $491,528 | $7,703,749 | $8,195,277 |
| Change in Unrealized Appreciation/Depreciation | N/A | $(81) | $(81) |
| Net Realized Gain/(Loss) | N/A | $186 | $186 |
| Dividend Income | $23,165 | $172,914 | $ 196,079 |
| * | All or a portion of the balance/activity for the fund relates to cash collateral received on securities lending transactions. |
| 1 | Non-income-producing security. |
| 2 | All or a portion of these securities are temporarily on loan to unaffiliated broker/dealers. |
| 3 | 7-day net yield. |
| 4 | The cost of investments for federal tax purposes amounts to $299,797,409. |
| 5 | Assets, other than investments in securities, less liabilities. See Statement of Assets and Liabilities. |
Annual Shareholder Report
Note: The categories of investments are shown as a percentage of total net assets at July 31, 2019.
Various inputs are used in determining the value of the Fund's investments. These inputs are summarized in the three broad levels listed below:
Level 1—quoted prices in active markets for identical securities.
Level 2—other significant observable inputs (including quoted prices for similar securities, interest rates, prepayment speeds, credit risk, etc.). Also includes securities valued at amortized cost.
Level 3—significant unobservable inputs (including the Fund's own assumptions in determining the fair value of investments).
The inputs or methodology used for valuing securities are not an indication of the risk associated with investing in those securities.
As of July 31, 2019, all investments of the Fund utilized Level 1 inputs in valuing the Fund's assets carried at fair value.
See Notes which are an integral part of the Financial Statements
Annual Shareholder Report
Financial Highlights–Class A Shares
(For a Share Outstanding Throughout Each Period)
| Year Ended July 31 | 2019 | 2018 | 2017 | 2016 | 2015 |
| Net Asset Value, Beginning of Period | $30.01 | $24.95 | $21.77 | $22.10 | $20.47 |
| Income From Investment Operations: | | | | | |
| Net investment income | 0.161 | 0.091 | 0.26 | 0.191 | 0.111 |
| Net realized and unrealized gain (loss) | 1.81 | 5.08 | 3.11 | (0.33) | 1.55 |
| TOTAL FROM INVESTMENT OPERATIONS | 1.97 | 5.17 | 3.37 | (0.14) | 1.66 |
| Less Distributions: | | | | | |
| Distributions from net investment income | (0.07) | (0.11) | (0.19) | (0.19) | (0.03) |
| Distributions from net realized gain | (2.01) | — | — | — | — |
| TOTAL DISTRIBUTIONS | (2.08) | (0.11) | (0.19) | (0.19) | (0.03) |
| Net Asset Value, End of Period | $29.90 | $30.01 | $24.95 | $21.77 | $22.10 |
| Total Return2 | 7.80% | 20.78% | 15.56% | (0.61)% | 8.10% |
| Ratios to Average Net Assets: | | | | | |
| Net expenses | 1.08% | 1.36% | 1.38% | 1.35% | 1.35% |
| Net investment income | 0.57% | 0.31% | 0.69% | 0.94% | 0.51% |
| Expense waiver/reimbursement3 | 0.24% | 0.00%4 | 0.00%4 | 0.03% | 0.00%4 |
| Supplemental Data: | | | | | |
| Net assets, end of period (000 omitted) | $69,221 | $40,539 | $33,799 | $33,753 | $40,433 |
| Portfolio turnover | 87% | 82% | 77% | 62% | 76% |
| 1 | Per share numbers have been calculated using the average shares method. |
| 2 | Based on net asset value, which does not reflect the sales charge, redemption fee or contingent deferred sales charge, if applicable. |
| 3 | This expense decrease is reflected in both the net expense and the net investment income ratios shown above. |
| 4 | Represents less than 0.01%. |
See Notes which are an integral part of the Financial Statements
Annual Shareholder Report
Financial Highlights–Class C Shares
(For a Share Outstanding Throughout Each Period)
| Year Ended July 31 | 2019 | 2018 | 2017 | 2016 | 2015 |
| Net Asset Value, Beginning of Period | $28.37 | $23.66 | $20.66 | $21.00 | $19.57 |
| Income From Investment Operations: | | | | | |
| Net investment income (loss) | (0.05)1 | (0.11)1 | (0.19) | 0.031 | (0.05)1 |
| Net realized and unrealized gain (loss) | 1.68 | 4.82 | 3.23 | (0.33) | 1.48 |
| TOTAL FROM INVESTMENT OPERATIONS | 1.63 | 4.71 | 3.04 | (0.30) | 1.43 |
| Less Distributions: | | | | | |
| Distributions from net investment income | — | — | (0.04) | (0.04) | — |
| Distributions from net realized gain | (2.01) | — | — | — | — |
| TOTAL DISTRIBUTIONS | (2.01) | — | (0.04) | (0.04) | — |
| Net Asset Value, End of Period | $27.99 | $28.37 | $23.66 | $20.66 | $21.00 |
| Total Return2 | 6.96% | 19.91% | 14.72% | (1.43)% | 7.31% |
| Ratios to Average Net Assets: | | | | | |
| Net expenses | 1.85% | 2.09% | 2.13% | 2.14% | 2.11% |
| Net investment income (loss) | (0.20)% | (0.41)% | (0.06)% | 0.15% | (0.26)% |
| Expense waiver/reimbursement3 | 0.24% | 0.00%4 | 0.00%4 | 0.00%4 | 0.00%4 |
| Supplemental Data: | | | | | |
| Net assets, end of period (000 omitted) | $32,178 | $39,625 | $36,440 | $36,846 | $41,509 |
| Portfolio turnover | 87% | 82% | 77% | 62% | 76% |
| 1 | Per share numbers have been calculated using the average shares method. |
| 2 | Based on net asset value, which does not reflect the sales charge, redemption fee or contingent deferred sales charge, if applicable. |
| 3 | This expense decrease is reflected in both the net expense and the net investment income (loss) ratios shown above. |
| 4 | Represents less than 0.01%. |
See Notes which are an integral part of the Financial Statements
Annual Shareholder Report
Financial Highlights–Institutional Shares
(For a Share Outstanding Throughout Each Period)
| Year Ended July 31 | 2019 | 2018 | 2017 | 2016 | 2015 |
| Net Asset Value, Beginning of Period | $30.37 | $25.24 | $22.02 | $22.37 | $20.71 |
| Income From Investment Operations: | | | | | |
| Net investment income | 0.251 | 0.161 | 0.39 | 0.251 | 0.181 |
| Net realized and unrealized gain (loss) | 1.81 | 5.16 | 3.09 | (0.34) | 1.57 |
| TOTAL FROM INVESTMENT OPERATIONS | 2.06 | 5.32 | 3.48 | (0.09) | 1.75 |
| Less Distributions: | | | | | |
| Distributions from net investment income | (0.13) | (0.19) | (0.26) | (0.26) | (0.09) |
| Distributions from net realized gain | (2.01) | — | — | — | — |
| TOTAL DISTRIBUTIONS | (2.14) | (0.19) | (0.26) | (0.26) | (0.09) |
| Net Asset Value, End of Period | $30.29 | $30.37 | $25.24 | $22.02 | $22.37 |
| Total Return2 | 8.08% | 21.15% | 15.90% | (0.34)% | 8.45% |
| Ratios to Average Net Assets: | | | | | |
| Net expenses | 0.78% | 1.07% | 1.08% | 1.07% | 1.05% |
| Net investment income | 0.87% | 0.57% | 1.01% | 1.22% | 0.80% |
| Expense waiver/reimbursement3 | 0.29% | 0.00%4 | 0.00%4 | 0.00%4 | 0.00%4 |
| Supplemental Data: | | | | | |
| Net assets, end of period (000 omitted) | $215,799 | $95,290 | $52,169 | $65,435 | $76,242 |
| Portfolio turnover | 87% | 82% | 77% | 62% | 76% |
| 1 | Per share numbers have been calculated using the average shares method. |
| 2 | Based on net asset value. |
| 3 | This expense decrease is reflected in both the net expense and the net investment income ratios shown above. |
| 4 | Represents less than 0.01%. |
See Notes which are an integral part of the Financial Statements
Annual Shareholder Report
Financial Highlights–Class R6 Shares1
(For a Share Outstanding Throughout Each Period)
| Year Ended July 31 | 2019 | 2018 | 2017 | 2016 | 2015 |
| Net Asset Value, Beginning of Period | $29.89 | $24.85 | $21.46 | $21.80 | $20.25 |
| Income From Investment Operations: | | | | | |
| Net investment income | 0.232 | 0.182 | 0.21 | 0.102 | 0.022 |
| Net realized and unrealized gain (loss) | 1.79 | 5.06 | 3.18 | (0.33) | 1.53 |
| TOTAL FROM INVESTMENT OPERATIONS | 2.02 | 5.24 | 3.39 | (0.23) | 1.55 |
| Less Distributions: | | | | | |
| Distributions from net investment income | (0.15) | (0.20) | — | (0.11) | — |
| Distributions from net realized gain | (2.01) | — | — | — | — |
| TOTAL DISTRIBUTIONS | (2.16) | (0.20) | — | (0.11) | — |
| Net Asset Value, End of Period | $29.75 | $29.89 | $24.85 | $21.46 | $21.80 |
| Total Return3 | 8.08% | 21.17% | 15.80% | (1.05)% | 7.65% |
| Ratios to Average Net Assets: | | | | | |
| Net expenses | 0.81% | 1.02% | 1.07% | 1.80% | 1.76% |
| Net investment income | 0.78% | 0.65% | 0.95% | 0.49% | 0.09% |
| Expense waiver/reimbursement4 | 0.18% | 0.00%5 | 0.00%5 | 0.00%5 | 0.00%5 |
| Supplemental Data: | | | | | |
| Net assets, end of period (000 omitted) | $9,183 | $20,425 | $17,363 | $5,717 | $6,300 |
| Portfolio turnover | 87% | 82% | 77% | 62% | 76% |
| 1 | Prior to September 1, 2016, the Fund's Class R6 Shares were designated as Class R Shares. |
| 2 | Per share numbers have been calculated using the average shares method. |
| 3 | Based on net asset value. |
| 4 | This expense decrease is reflected in both the net expense and the net investment income ratios shown above. |
| 5 | Represents less than 0.01%. |
See Notes which are an integral part of the Financial Statements
Annual Shareholder Report
Statement of Assets and Liabilities
July 31, 2019
| Assets: | | |
| Investment in securities, at value including $479,249 of securities loaned and $8,195,277 of investment in affiliated holdings (identified cost $299,692,621) | | $327,279,631 |
| Income receivable | | 129,480 |
| Income receivable from affiliated holdings | | 36,990 |
| Receivable for investments sold | | 1,585,100 |
| Receivable for shares sold | | 1,996,017 |
| TOTAL ASSETS | | 331,027,218 |
| Liabilities: | | |
| Payable for investments purchased | $2,367,233 | |
| Payable for shares redeemed | 1,609,220 | |
| Bank overdraft | 4,404 | |
| Payable for collateral due to broker for securities lending | 491,528 | |
| Payable for investment adviser fee (Note 5) | 4,407 | |
| Payable for administrative fees (Note 5) | 716 | |
| Payable for distribution services fee (Note 5) | 20,704 | |
| Payable for other service fees (Notes 2 and 5) | 24,754 | |
| Accrued expenses (Note 5) | 122,887 | |
| TOTAL LIABILITIES | | 4,645,853 |
| Net assets for 10,896,863 shares outstanding | | $326,381,365 |
| Net Assets Consist of: | | |
| Paid-in capital | | $297,868,865 |
| Total distributable earnings | | 28,512,500 |
| TOTAL NET ASSETS | | $326,381,365 |
Annual Shareholder Report
Statement of Assets and Liabilities–continued
| Net Asset Value, Offering Price and Redemption Proceeds Per Share | | |
| Class A Shares: | | |
Net asset value per share ($69,221,049 ÷ 2,315,413 shares outstanding),
no par value, unlimited shares authorized | | $29.90 |
| Offering price per share (100/94.50 of $29.90) | | $31.64 |
| Redemption proceeds per share | | $29.90 |
| Class C Shares: | | |
Net asset value per share ($32,178,093 ÷ 1,149,445 shares outstanding),
no par value, unlimited shares authorized | | $27.99 |
| Offering price per share | | $27.99 |
| Redemption proceeds per share (99.00/100 of $27.99) | | $27.71 |
| Institutional Shares: | | |
Net asset value per share ($215,799,181 ÷ 7,123,317 shares outstanding),
no par value, unlimited shares authorized | | $30.29 |
| Offering price per share | | $30.29 |
| Redemption proceeds per share | | $30.29 |
| Class R6 Shares: | | |
Net asset value per share ($9,183,042 ÷ 308,688 shares outstanding),
no par value, unlimited shares authorized | | $29.75 |
| Offering price per share | | $29.75 |
| Redemption proceeds per share | | $29.75 |
See Notes which are an integral part of the Financial Statements
Annual Shareholder Report
Statement of Operations
Year Ended July 31, 2019
| Investment Income: | | | |
| Dividends (including $172,914 received from an affiliated holding* and net of foreign taxes withheld of $2,294) | | | $4,290,562 |
| Net income on securities loaned (includes $23,165 earned from an affiliated holding related to cash collateral balances*)(Note 2) | | | 27,984 |
| TOTAL INCOME | | | 4,318,546 |
| Expenses: | | | |
| Investment adviser fee (Note 5) | | $1,953,546 | |
| Administrative fee (Note 5) | | 210,065 | |
| Custodian fees | | 35,916 | |
| Transfer agent fee (Note 2) | | 237,299 | |
| Directors'/Trustees' fees (Note 5) | | 3,176 | |
| Auditing fees | | 27,199 | |
| Legal fees | | 11,915 | |
| Portfolio accounting fees | | 109,734 | |
| Distribution services fee (Note 5) | | 213,192 | |
| Other service fees (Notes 2 and 5) | | 214,159 | |
| Share registration costs | | 141,938 | |
| Printing and postage | | 35,785 | |
| Miscellaneous (Note 5) | | 32,267 | |
| TOTAL EXPENSES | | 3,226,191 | |
| Waiver and Reimbursements: | | | |
| Waiver/reimbursement of investment adviser fee (Note 5) | $(600,220) | | |
| Reimbursement of other operating expenses (Notes 2 and 5) | (106,934) | | |
| TOTAL WAIVER AND REIMBURSEMENTS | | (707,154) | |
| Net expenses | | | 2,519,037 |
| Net investment income | | | 1,799,509 |
| Realized and Unrealized Gain (Loss) on Investments: | | | |
| Net realized gain on investments (including net realized gain of $186 on sales of investments in an affiliated holding*) | | | 12,196,355 |
| Net change in unrealized appreciation of investments (including net change in unrealized depreciation of $(81) on investments in an affiliated an holding*) | | | 7,975,426 |
| Net realized and unrealized gain on investments | | | 20,171,781 |
| Change in net assets resulting from operations | | | $21,971,290 |
| * | See information listed after the Fund's Portfolio of Investments. |
See Notes which are an integral part of the Financial Statements
Annual Shareholder Report
Statement of Changes in Net Assets
| Year Ended July 31 | 2019 | 2018 |
| Increase (Decrease) in Net Assets | | |
| Operations: | | |
| Net investment income | $1,799,509 | $420,985 |
| Net realized gain | 12,196,355 | 17,219,025 |
| Net change in unrealized appreciation/depreciation | 7,975,426 | 10,538,220 |
| CHANGE IN NET ASSETS RESULTING FROM OPERATIONS | 21,971,290 | 28,178,230 |
| Distributions to Shareholders: | | |
| Class A Shares | (3,882,027) | (150,867) |
| Class C Shares | (1,891,738) | — |
| Institutional Shares | (12,178,410) | (353,878) |
| Class R6 Shares | (604,361) | (139,150) |
| CHANGE IN NET ASSETS RESULTING FROM DISTRIBUTIONS TO SHAREHOLDERS | (18,556,536) | (643,895) |
| Share Transactions: | | |
| Proceeds from sale of shares | 256,926,172 | 67,281,847 |
| Net asset value of shares issued to shareholders in payment of distributions declared | 17,409,881 | 596,689 |
| Cost of shares redeemed | (147,248,399) | (39,304,708) |
| CHANGE IN NET ASSETS RESULTING FROM SHARE TRANSACTIONS | 127,087,654 | 28,573,828 |
| Change in net assets | 130,502,408 | 56,108,163 |
| Net Assets: | | |
| Beginning of period | 195,878,957 | 139,770,794 |
| End of period | $326,381,365 | $195,878,957 |
See Notes which are an integral part of the Financial Statements
Annual Shareholder Report
Notes to Financial Statements
July 31, 2019
1. ORGANIZATION
Federated MDT Series (the “Trust”) is registered under the Investment Company Act of 1940, as amended (the “Act”), as an open-end management investment company. The Trust consists of five portfolios. The financial statements included herein are only those of Federated MDT All Cap Core Fund (the “Fund”), a diversified portfolio. The financial statements of the other portfolios are presented separately. The assets of each portfolio are segregated and a shareholder's interest is limited to the portfolio in which shares are held. Each portfolio pays its own expenses. The Fund offers four classes of shares: Class A Shares, Class C Shares, Institutional Shares and Class R6 Shares. All shares of the Fund have equal rights with respect to voting, except on class-specific matters. The investment objective of the Fund is long-term capital appreciation.
On March 30, 2017, the Fund's T Share Class became effective with the Securities and Exchange Commission (SEC), but is not yet offered for sale.
Effective August 1, 2018, an automatic conversion feature for Class C Shares was implemented. Pursuant to this automatic conversion feature, after Class C Shares have been held for ten years from the date of purchase, they will automatically convert to Class A Shares on the next monthly conversion processing date.
2. SIGNIFICANT ACCOUNTING POLICIES
The following is a summary of significant accounting policies consistently followed by the Fund in the preparation of its financial statements. These policies are in conformity with U.S. generally accepted accounting principles (GAAP).
Investment Valuation
In calculating its net asset value (NAV), the Fund generally values investments as follows:
| ■ | Equity securities listed on an exchange or traded through a regulated market system are valued at their last reported sale price or official closing price in their principal exchange or market. |
| ■ | Shares of other mutual funds or non-exchange-traded investment companies are valued based upon their reported NAVs. |
| ■ | Fixed-income securities are fair valued using price evaluations provided by a pricing service approved by the Fund's Board of Trustees (the “Trustees”). |
| ■ | Derivative contracts listed on exchanges are valued at their reported settlement or closing price, except that options are valued at the mean of closing bid and asked quotations. |
| ■ | Over-the-counter (OTC) derivative contracts are fair valued using price evaluations provided by a pricing service approved by the Trustees. |
| ■ | For securities that are fair valued in accordance with procedures established by and under the general supervision of the Trustees, certain factors may be considered, such as: the last traded or purchase price of the security, information obtained by contacting the issuer or dealers, analysis of the issuer's financial statements or other available documents, fundamental analytical data, the nature and duration of restrictions on disposition, the movement of the market in which the security is normally traded, public trading in similar securities or derivative contracts of the issuer or comparable issuers, movement of a relevant index, or other factors including but not limited to industry changes and relevant government actions. |
Annual Shareholder Report
If any price, quotation, price evaluation or other pricing source is not readily available when the NAV is calculated, if the Fund cannot obtain price evaluations from a pricing service or from more than one dealer for an investment within a reasonable period of time as set forth in the Fund's valuation policies and procedures, or if information furnished by a pricing service, in the opinion of the valuation committee (“Valuation Committee”), is deemed not representative of the fair value of such security, the Fund uses the fair value of the investment determined in accordance with the procedures described below. There can be no assurance that the Fund could obtain the fair value assigned to an investment if it sold the investment at approximately the time at which the Fund determines its NAV per share.
Fair Valuation Procedures
The Trustees have ultimate responsibility for determining the fair value of investments for which market quotations are not readily available. The Trustees have appointed a Valuation Committee comprised of officers of the Fund, Federated MDTA LLC (the “Adviser”) and certain of the Adviser's affiliated companies to assist in determining fair value and in overseeing the calculation of the NAV. The Trustees have also authorized the use of pricing services recommended by the Valuation Committee to provide fair value evaluations of the current value of certain investments for purposes of calculating the NAV. The Valuation Committee employs various methods for reviewing third-party pricing-service evaluations including periodic reviews of third-party pricing services' policies, procedures and valuation methods (including key inputs, methods, models and assumptions), transactional back-testing, comparisons of evaluations of different pricing services, and review of price challenges by the Adviser based on recent market activity. In the event that market quotations and price evaluations are not available for an investment, the Valuation Committee determines the fair value of the investment in accordance with procedures adopted by the Trustees. The Trustees periodically review and approve the fair valuations made by the Valuation Committee and any changes made to the procedures.
Factors considered by pricing services in evaluating an investment include the yields or prices of investments of comparable quality, coupon, maturity, call rights and other potential prepayments, terms and type, reported transactions, indications as to values from dealers and general market conditions. Some pricing services provide a single price evaluation reflecting the bid-side of the market for an investment (a “bid” evaluation). Other pricing services offer both bid evaluations and price evaluations indicative of a price between the prices bid and asked for the investment (a “mid” evaluation). The Fund normally uses bid evaluations for any U.S. Treasury and Agency securities, mortgage-backed securities and municipal securities. The Fund normally uses mid evaluations for any other types of fixed-income securities and any OTC derivative contracts. In the event that market quotations and price evaluations are not available for an investment, the fair value of the investment is determined in accordance with procedures adopted by the Trustees.
Repurchase Agreements
The Fund may invest in repurchase agreements for short-term liquidity purposes. It is the policy of the Fund to require the other party to a repurchase agreement to transfer to the Fund's custodian or sub-custodian eligible securities or cash with a market value (after transaction costs) at least equal to the repurchase price to be paid under the repurchase agreement. The eligible securities are transferred to accounts with the custodian or sub-custodian in which the Fund holds a “securities entitlement” and exercises “control” as those terms are defined in the Uniform Commercial Code. The Fund has established procedures for monitoring the market value of the transferred securities and requiring the transfer of
Annual Shareholder Report
additional eligible securities if necessary to equal at least the repurchase price. These procedures also allow the other party to require securities to be transferred from the account to the extent that their market value exceeds the repurchase price or in exchange for other eligible securities of equivalent market value.
The insolvency of the other party or other failure to repurchase the securities may delay the disposition of the underlying securities or cause the Fund to receive less than the full repurchase price. Under the terms of the repurchase agreement, any amounts received by the Fund in excess of the repurchase price and related transaction costs must be remitted to the other party.
The Fund may enter into repurchase agreements in which eligible securities are transferred into joint trading accounts maintained by the custodian or sub-custodian for investment companies and other clients advised by the Fund's Adviser and its affiliates. The Fund will participate on a pro rata basis with the other investment companies and clients in its share of the securities transferred under such repurchase agreements and in its share of proceeds from any repurchase or other disposition of such securities.
Investment Income, Gains and Losses and Distributions
Investment transactions are accounted for on a trade-date basis. Realized gains and losses from investment transactions are recorded on an identified-cost basis. Interest income and expenses are accrued daily. Dividend income and distributions to shareholders are recorded on the ex-dividend date. Foreign dividends are recorded on the ex-dividend date or when the Fund is informed of the ex-dividend date. Distributions of net investment income, if any, are declared and paid annually. Non-cash dividends included in dividend income, if any, are recorded at fair value. Amortization/accretion of premium and discount is included in investment income. Investment income, realized gains and unrealized gains losses, and certain fund-level expenses are allocated to each class based on relative average daily net assets, except that select classes will bear certain expenses unique to those classes. The detail of the total fund expense waiver and reimbursements of $707,154 is disclosed in Note 2 and Note 5. For the year ended July 31, 2019, transfer agent fees for the Fund were as follows:
| | Transfer Agent
Fees Incurred | Transfer Agent
Fees Reimbursed |
| Class A Shares | $57,393 | $(10,779) |
| Class C Shares | 31,757 | (5,643) |
| Institutional Shares | 145,557 | (90,512) |
| Class R6 Shares | 2,592 | — |
| TOTAL | $237,299 | $(106,934) |
Dividends are declared separately for each class. No class has preferential dividend rights; differences in per share dividend rates are generally due to differences in separate class expenses. All distributions as indicated on the Statement of Changes in Net Assets for the year ended July 31, 2018, were from net investment income. Undistributed net investment income at July 31, 2018, was $161,935.
Annual Shareholder Report
Other Service Fees
The Fund may pay other service fees up to 0.25% of the average daily net assets of the Fund's Class A Shares and Class C Shares to unaffiliated financial intermediaries or to Federated Shareholder Services Company (FSSC) for providing services to shareholders and maintaining shareholder accounts. Subject to the terms described in the Expense Limitation note, FSSC may voluntarily reimburse the Fund for other service fees. For the year ended July 31, 2019, other service fees for the Fund were as follows:
| | Other Service
Fees Incurred |
| Class A Shares | $143,095 |
| Class C Shares | 71,064 |
| TOTAL | $214,159 |
Federal Taxes
It is the Fund's policy to comply with the Subchapter M provision of the Internal Revenue Code and to distribute to shareholders each year substantially all of its income. Accordingly, no provision for federal income tax is necessary. As of and during the year ended July 31, 2019, the Fund did not have a liability for any uncertain tax positions. The Fund recognizes interest and penalties, if any, related to tax liabilities as income tax expense in the Statement of Operations. As of July 31, 2019, tax years 2016 through 2019 remain subject to examination by the Fund's major tax jurisdictions, which include the United States of America and the Commonwealth of Massachusetts.
The Fund may be subject to taxes imposed by governments of countries in which it invests. Such taxes are generally based on either income or gains earned or repatriated. The Fund accrues and applies such taxes to net investment income, net realized gains and net unrealized gains as income and/or gains are earned.
When-Issued and Delayed-Delivery Transactions
The Fund may engage in when-issued or delayed-delivery transactions. The Fund records when-issued securities on the trade date and maintains security positions such that sufficient liquid assets will be available to make payment for the securities purchased. Securities purchased on a when-issued or delayed-delivery basis are marked to market daily and begin earning interest on the settlement date. Losses may occur on these transactions due to changes in market conditions or the failure of counterparties to perform under the contract.
Securities Lending
The Fund participates in a securities lending program providing for the lending of equity securities to qualified brokers. The term of the loans within the program is one year or less. The Fund normally receives cash collateral for securities loaned that is invested in affiliated money market funds, other money market instruments and/or repurchase agreements. Investments in money market funds may include funds with a “floating” NAV that can impose redemption fees and liquidity gates, impose certain operational impediments to investing cash collateral, and, if the investee fund's NAV decreases, result in the Fund recognizing losses and being required to cover the decrease in the value of the cash collateral. Collateral is maintained at a minimum level of 100% of the market value of investments loaned, plus interest, if applicable. In accordance with the Fund's securities lending agreement, the market value of securities on loan is determined each day at the close of business and any additional collateral required to cover the value of securities on loan is delivered to the Fund on the next
Annual Shareholder Report
business day. Earnings on collateral are allocated between the borrower of the security, the securities lending agent, as a fee for its services under the program and the Fund, according to agreed-upon rates. The Fund will not have the right to vote on securities while they are on loan. However, the Fund will attempt to terminate a loan in an effort to reacquire the securities in time to vote on matters that are deemed to be material by the Adviser. There can be no assurance that the Fund will have sufficient notice of such matters to be able to terminate the loan in time to vote thereon.
Securities lending transactions are subject to Master Netting Agreements which are agreements between the Fund and its counterparties that provide for the net settlement of all transactions and collateral with the Fund, through a single payment, in the event of default or termination. Amounts presented on the Portfolio of Investments and Statement of Assets and Liabilities are not net settlement amounts but gross. As indicated below, the cash collateral received by the Fund exceeds the market value of the securities loaned reducing the net settlement amount to zero. The chart below identifies the amount of collateral received as well as the market value of securities on loan. Additionally, the securities lending agreement executed by the Fund includes an indemnification clause. This clause stipulates that the borrower will reimburse the Fund for any losses as a result of any failure of the borrower to return equivalent securities to the Fund.
As of July 31, 2019, securities subject to this type of arrangement and related collateral were as follows:
Market Value of
Securities Loaned | Collateral
Received |
| $479,249 | $491,528 |
Other
The preparation of financial statements in conformity with GAAP requires management to make estimates and assumptions that affect the amounts of assets, liabilities, expenses and revenues reported in the financial statements. Actual results could differ from those estimated. The Fund applies investment company accounting and reporting guidance.
3. SHARES OF BENEFICIAL INTEREST
The following tables summarize share activity:
| Year Ended July 31 | 2019 | 2018 |
| Class A Shares: | Shares | Amount | Shares | Amount |
| Shares sold | 1,197,944 | $35,149,177 | 239,832 | $6,766,765 |
| Shares issued to shareholders in payment of distributions declared | 143,909 | 3,662,745 | 5,033 | 139,021 |
| Shares redeemed | (377,081) | (10,640,181) | (248,870) | (6,806,136) |
NET CHANGE RESULTING FROM
CLASS A SHARE TRANSACTIONS | 964,772 | $28,171,741 | (4,005) | $99,650 |
Annual Shareholder Report
| Year Ended July 31 | 2019 | 2018 |
| Class C Shares: | Shares | Amount | Shares | Amount |
| Shares sold | 486,557 | $12,740,476 | 261,516 | $7,009,390 |
| Shares issued to shareholders in payment of distributions declared | 73,190 | 1,749,965 | — | — |
| Shares redeemed | (806,777) | (22,501,025) | (405,082) | (10,646,392) |
NET CHANGE RESULTING FROM
CLASS C SHARE TRANSACTIONS | (247,030) | $(8,010,584) | (143,566) | $(3,637,002) |
| Year Ended July 31 | 2019 | 2018 |
| Institutional Shares: | Shares | Amount | Shares | Amount |
| Shares sold | 6,734,928 | $195,716,816 | 1,752,574 | $51,491,570 |
| Shares issued to shareholders in payment of distributions declared | 442,206 | 11,395,972 | 11,422 | 318,781 |
| Shares redeemed | (3,191,121) | (90,332,398) | (693,414) | (19,281,770) |
| NET CHANGE RESULTING FROM INSTITUTIONAL SHARE TRANSACTIONS | 3,986,013 | $116,780,390 | 1,070,582 | $32,528,581 |
| Year Ended July 31 | 2019 | 2018 |
| Class R6 Shares: | Shares | Amount | Shares | Amount |
| Shares sold | 448,233 | $13,319,703 | 72,607 | $2,014,122 |
| Shares issued to shareholders in payment of distributions declared | 23,752 | 601,199 | 5,058 | 138,887 |
| Shares redeemed | (846,550) | (23,774,795) | (93,249) | (2,570,410) |
NET CHANGE RESULTING FROM
CLASS R6 SHARE TRANSACTIONS | (374,565) | $(9,853,893) | (15,584) | $(417,401) |
NET CHANGE RESULTING FROM
TOTAL FUND SHARE TRANSACTIONS | 4,329,190 | $127,087,654 | 907,427 | $28,573,828 |
4. FEDERAL TAX INFORMATION
The timing and character of income and capital gain distributions are determined in accordance with income tax regulations, which may differ from GAAP. These differences are due to differing treatments for regulatory settlement proceeds and distributions required for excise tax purposes.
For the year ended July 31, 2019, permanent differences identified and reclassified among the components of net assets were as follows:
| Increase (Decrease) |
| Paid-In Capital | Total Distributable
Earnings (Loss) |
| $(5,365,536) | $5,365,536 |
Net investment income (loss), net realized gains (losses), and net assets were not affected by this reclassification.
Annual Shareholder Report
The tax character of distributions as reported on the Statement of Changes in Net Assets for the years ended July 31, 2019 and 2018, was as follows:
| | 2019 | 2018 |
| Ordinary income1 | $6,315,404 | $643,895 |
| Long-term capital gains | $12,241,132 | — |
| 1 | For tax purposes, short-term capital gain distributions are considered ordinary income distributions. |
As of July 31, 2019, the components of distributable earnings on a tax-basis were as follows:
| Undistributed ordinary income | $1,030,278 |
| Net unrealized appreciation | $27,482,222 |
The difference between book-basis and tax-basis net unrealized appreciation/depreciation is attributable to differing treatments for deferral of losses on wash sales.
At July 31, 2019, the cost of investments for federal tax purposes was $299,797,409. The net unrealized appreciation of investments for federal tax purposes was $27,482,222. This consists of net unrealized appreciation from investments for those securities having an excess of value over cost of $36,797,597 and net unrealized depreciation from investments for those securities having an excess of cost over value of $9,315,375.
5. INVESTMENT ADVISER FEE AND OTHER TRANSACTIONS WITH AFFILIATES
Investment Adviser Fee
The advisory agreement between the Fund and the Adviser provides for an annual fee equal to 0.70% of the Fund's average daily net assets. Prior to July 1, 2019, the annual advisory fee was 0.75% of the Fund's average daily net assets. Subject to the terms described in the Expense Limitation note, the Adviser may voluntarily choose to waive any portion of its fee and/or reimburse certain operating expenses of the Fund. For the year ended July 31, 2019, the Adviser voluntarily waived $595,246 of its fee and voluntarily reimbursed $106,934 of transfer agent fees. The Adviser has agreed to reimburse the Fund for certain investment adviser fees as a result of transactions in other affiliated investment companies. For the year ended July 31, 2019, the Adviser reimbursed $4,974.
Administrative Fee
Federated Administrative Services (FAS), under the Administrative Services Agreement, provides the Fund with administrative personnel and services. For purposes of determining the appropriate rate breakpoint, “Investment Complex” is defined as all of the Federated Funds subject to a fee under the Administrative Services Agreement. The fee paid to FAS is based on the average daily net assets of the Investment Complex as specified below:
| Administrative Fee | Average Daily Net Assets
of the Investment Complex |
| 0.100% | on assets up to $50 billion |
| 0.075% | on assets over $50 billion |
Subject to the terms described in the Expense Limitation note, FAS may voluntarily choose to waive any portion of its fee. For the year ended July 31, 2019, the annualized fee paid to FAS was 0.080% of average daily net assets of the Fund.
Annual Shareholder Report
In addition, FAS may charge certain out-of-pocket expenses to the Fund.
Distribution Services Fee
The Fund has adopted a Distribution Plan (the “Plan”) pursuant to Rule 12b-1 under the Act. Under the terms of the Plan, the Fund will compensate Federated Securities Corp. (FSC), the principal distributor, from the daily net assets of the Fund's Class A Shares, and Class C Shares to finance activities intended to result in the sale of these shares. The Plan provides that the Fund may incur distribution expenses at the following percentages of average daily net assets annually, to compensate FSC:
| | Percentage of Average Daily
Net Assets of Class |
| Class A Shares | 0.05% |
| Class C Shares | 0.75% |
FSC may voluntarily choose to waive any portion of its fee. For the year ended July 31, 2019, distribution services fees for the Fund were as follows:
| | Distribution Services
Fees Incurred |
| Class C Shares | $213,192 |
When FSC receives fees, it may pay some or all of them to financial intermediaries whose customers purchase shares. For the year ended July 31, 2019, FSC retained $34,119 fees paid by the Fund. For the year ended July 31, 2019, the Fund's Class A Shares did not incur a distribution services fee; however, it may begin to incur this fee upon approval of the Trustees.
Other Service Fees
For the year ended July 31, 2019, FSSC received $4,156 of the other service fees disclosed in Note 2.
Sales Charges
Front-end sales charges and contingent deferred sales charges (CDSC) do not represent expenses of the Fund. They are deducted from the proceeds of sales of Fund shares prior to investment or from redemption proceeds prior to remittance, as applicable. For the year ended July 31, 2019, FSC retained $22,872 in sales charges from the sale of Class A Shares. FSC also retained $3,387 of CDSC relating to redemptions of Class C Shares.
Expense Limitation
The Adviser and certain of its affiliates on their own initiative have agreed to waive certain amounts of their respective fees and/or reimburse expenses. Total annual fund operating expenses (excluding interest expense, extraordinary expenses and proxy-related expenses paid by the Fund, if any) paid by the Fund's Class A Shares, Class C Shares, Institutional Shares and Class R6 Shares (after the voluntary waivers and/or reimbursements) will not exceed 1.04%, 1.79%, 0.74%, and 0.73% (the “Fee Limit”), respectively, up to but not including the later of (the “Termination Date”): (a) October 1, 2020; or (b) the date of the Fund's next effective Prospectus. While the Adviser and its affiliates currently do not anticipate terminating or increasing these arrangements prior to the Termination Date, these arrangements may only be terminated or the Fee Limit increased prior to the Termination Date with the agreement of the Fund's Board of Trustees.
Annual Shareholder Report
Directors'/Trustees' and Miscellaneous Fees
Certain Officers and Trustees of the Fund are Officers and Directors or Trustees of certain of the above companies. To efficiently facilitate payment, Directors'/Trustees' fees and certain expenses related to conducting meetings of the Directors/Trustees and other miscellaneous expenses are paid by an affiliate of the Adviser which in due course are reimbursed by the Fund. These expenses related to conducting meetings of the Directors/Trustees and other miscellaneous expenses may be included in Accrued and Miscellaneous Expenses on the Statement of Assets and Liabilities and Statement of Operations, respectively.
6. INVESTMENT TRANSACTIONS
Purchases and sales of investments, excluding long-term U.S. government securities and short-term obligations, for the year ended July 31, 2019, were as follows:
| Purchases | $331,644,630 |
| Sales | $223,311,881 |
7. LINE OF CREDIT
The Fund participates with certain other Federated Funds, on a several basis, in an up to $500,000,000 unsecured, 364-day, committed, revolving line of credit (LOC) agreement. The LOC was made available to finance temporarily the repurchase or redemption of shares of the Fund, failed trades, payment of dividends, settlement of trades and for other short-term, temporary or emergency general business purposes. The Fund cannot borrow under the LOC if an inter-fund loan is outstanding. The Fund's ability to borrow under the LOC also is subject to the limitations of the Act and various conditions precedent that must be satisfied before the Fund can borrow. Loans under the LOC are charged interest at a fluctuating rate per annum equal to the highest, on any day, of (a) (i) the federal funds effective rate, (ii) the one month London Interbank Offered Rate (LIBOR), and (iii) 0.0%, plus (b) a margin. The LOC also requires the Fund to pay, quarterly in arrears and at maturity, its pro rata share of a commitment fee based on the amount of the lenders' commitment that has not been utilized. As of July 31, 2019, the Fund had no outstanding loans. During the year ended July 31, 2019, the Fund did not utilize the LOC.
8. INTERFUND LENDING
Pursuant to an Exemptive Order issued by the SEC, the Fund, along with other funds advised by subsidiaries of Federated Investors, Inc., may participate in an interfund lending program. This program provides an alternative credit facility allowing the Fund to borrow from other participating affiliated funds. As of July 31, 2019, there were no outstanding loans. During the year ended July 31, 2019, the program was not utilized.
9. SUBSEQUENT EVENT
On May 16, 2019, the Trustees approved the reorganization of PNC Multi-Factor All Cap Fund, a portfolio of the PNC Funds, into the Fund. The reorganization is expected to occur in the fourth quarter of 2019, pending approval by the shareholders of the PNC fund.
Additionally, if the reorganization is approved, the “Termination Date” for the Fund's Class A Shares, Class C Shares and Institutional Shares stated under Expense Limitation in the “Investment Adviser Fee and Other Transactions with Affiliates” note shall be extended up to but not including, the later of: (a) December 1, 2020 or (b) the first day of the month following the one year anniversary of the closing date of the reorganization.
Annual Shareholder Report
10. FEDERAL TAX INFORMATION (UNAUDITED)
For the year ended July 31, 2019, the amount of long-term capital gains designated by the Fund was $12,241,132.
For the fiscal year ended July 31, 2019, 50.51% of total ordinary income distributions made by the Fund are qualifying dividends which may be subject to a maximum tax rate of 15%, as provided for by the Jobs and Growth Tax Relief Act of 2003. Complete information is reported in conjunction with the reporting of your distributions on Form 1099-DIV.
Of the ordinary income distributions made by the Fund during the year ended July 31, 2019, 49.53% qualify for the dividend received deduction available to corporate shareholders.
Annual Shareholder Report
Report of Independent Registered Public Accounting Firm
TO THE BOARD OF TRUSTEES OF FEDERATED MDT SERIES AND SHAREHOLDERS OF FEDERATED MDT ALL CAP CORE FUND:
Opinion on the Financial Statements
We have audited the accompanying statement of assets and liabilities of Federated MDT All Cap Core Fund (the “Fund”) (one of the portfolios constituting Federated MDT Series (the “Trust”)), including the portfolio of investments, as of July 31, 2019, and the related statement of operations for the year then ended, the statement of changes in net assets for each of the two years in the period then ended, the financial highlights for each of the five years in the period then ended and the related notes (collectively referred to as the “financial statements”). In our opinion, the financial statements present fairly, in all material respects, the financial position of the Fund (one of the funds constituting Federated MDT Series) at July 31, 2019, the results of its operations for the year then ended, the changes in its net assets for each of the two years in the period then ended and its financial highlights for each of the five years in the period then ended, in conformity with U.S. generally accepted accounting principles.
Basis for Opinion
These financial statements are the responsibility of the Trust's management. Our responsibility is to express an opinion on the Fund's financial statements based on our audits. We are a public accounting firm registered with the Public Company Accounting Oversight Board (United States) (“PCAOB”) and are required to be independent with respect to the Trust in accordance with the U.S. federal securities laws and the applicable rules and regulations of the Securities and Exchange Commission and the PCAOB.
We conducted our audits in accordance with standards of the PCAOB. Those standards require that we plan and perform the audit to obtain reasonable assurance about whether the financial statements and financial highlights are free of material misstatement, whether due to error or fraud. The Trust is not required to have, nor were we engaged to perform, an audit of the Trust's internal control over financial reporting. As part of our audits, we are required to obtain an understanding of internal control over financial reporting, but not for the purpose of expressing an opinion on the effectiveness of the Trust's internal control over financial reporting. Accordingly, we express no such opinion.
Annual Shareholder Report
Our audits included performing procedures to assess the risks of material misstatement of the financial statements, whether due to error or fraud, and performing procedures that respond to those risks. Such procedures included examining, on a test basis, evidence regarding the amounts and disclosures in the financial statements. Our procedures included confirmation of securities owned as of July 31, 2019, by correspondence with the custodian and others, by other appropriate auditing procedures where replies from others were not received. Our audits also included evaluating the accounting principles used and significant estimates made by management, as well as evaluating the overall presentation of the financial statements. We believe that our audits provide a reasonable basis for our opinion.
We have served as the auditor of one or more Federated investment companies since 1979.
Boston, Massachusetts
September 23, 2019
Annual Shareholder Report
Shareholder Expense Example (unaudited)
As a shareholder of the Fund, you incur two types of costs: (1) transaction costs, including sales charges (loads) on purchase or redemption payments; and (2) ongoing costs, including management fees and to the extent applicable, distribution (12b-1) fees and/or other service fees and other Fund expenses. This Example is intended to help you to understand your ongoing costs (in dollars) of investing in the Fund and to compare these costs with the ongoing costs of investing in other mutual funds. It is based on an investment of $1,000 invested at the beginning of the period and held for the entire period from February 1, 2019 to July 31, 2019.
ACTUAL EXPENSES
The first section of the table below provides information about actual account values and actual expenses. You may use the information in this section, together with the amount you invested, toestimate the expenses that you incurred over the period. Simply divide your account value by $1,000 (for example, an $8,600 account value divided by $1,000 = 8.6), then multiply the result by the number in the first section under the heading entitled “Expenses Paid During Period” to estimate the expenses attributable to your investment during this period.
HYPOTHETICAL EXAMPLE FOR COMPARISON PURPOSES
The second section of the table below provides information about hypothetical account values and hypothetical expenses based on the Fund's actual expense ratio and anassumed rate of return of 5% per year before expenses, which is not the Fund's actual return. Thus, you shouldnot use the hypothetical account values and expenses to estimate the actual ending account balance or your expenses for the period. Rather, these figures are required to be provided to enable you to compare the ongoing costs of investing in the Fund with other funds. To do so, compare this 5% hypothetical example with the 5% hypothetical examples that appear in the shareholder reports of the other funds.
Annual Shareholder Report
Please note that the expenses shown in the table are meant to highlight your ongoing costs only and do not reflect any transaction costs, such as sales charges (loads) on purchase or redemption payments. Therefore, the second section of the table is useful in comparing ongoing costs only, and will not help you determine the relativetotal costs of owning different funds. In addition, if these transaction costs were included, your costs would have been higher.
| | Beginning
Account Value
2/1/2019 | Ending
Account Value
7/31/2019 | Expenses Paid
During Period1 |
| Actual: | | | |
| Class A Shares | $1,000 | $1,108.60 | $5.44 |
| Class C Shares | $1,000 | $1,104.10 | $9.34 |
| Institutional Shares | $1,000 | $1,109.90 | $3.87 |
| Class R6 Shares | $1,000 | $1,110.10 | $3.82 |
Hypothetical (assuming a 5% return
before expenses): | | | |
| Class A Shares | $1,000 | $1,019.60 | $5.21 |
| Class C Shares | $1,000 | $1,015.90 | $8.95 |
| Institutional Shares | $1,000 | $1,021.10 | $3.71 |
| Class R6 Shares | $1,000 | $1,021.20 | $3.66 |
| 1 | Expenses are equal to the Fund's annualized net expense ratios, multiplied by the average account value over the period, multiplied by 181/365 (to reflect the one-half-year period). The annualized net expense ratios are as follows: |
| | |
| Class A Shares | 1.04% |
| Class C Shares | 1.79% |
| Institutional Shares | 0.74% |
| Class R6 Shares | 0.73% |
Annual Shareholder Report
Board of Trustees and Trust Officers
The Board of Trustees is responsible for managing the Trust's business affairs and for exercising all the Trust's powers except those reserved for the shareholders. The following tables give information about each Trustee and the senior officers of the Fund. Where required, the tables separately list Trustees who are “interested persons” of the Fund (i.e., “Interested” Trustees) and those who are not (i.e., “Independent” Trustees). Unless otherwise noted, the address of each person listed is Federated Investors Tower, 1001 Liberty Avenue, Pittsburgh, PA 15222. The address of all Independent Trustees listed is 4000 Ericsson Drive, Warrendale, PA 15086-7561; Attention: Mutual Fund Board. As of December 31, 2018, the Trust comprised five portfolio(s), and the Federated Fund Family consisted of 40 investment companies (comprising 102 portfolios). Unless otherwise noted, each Officer is elected annually. Unless otherwise noted, each Trustee oversees all portfolios in the Federated Fund Family and serves for an indefinite term. The Fund's Statement of Additional Information includes additional information about Trust Trustees and is available, without charge and upon request, by calling 1-800-341-7400.
Interested TRUSTEES Background
Name
Birth Date
Positions Held with Trust
Date Service Began | Principal Occupation(s) for Past Five Years,
Other Directorships Held and Previous Position(s) |
J. Christopher Donahue*
Birth Date: April 11, 1949
President and Trustee
Indefinite Term
Began serving: May 2006 | Principal Occupations: Principal Executive Officer and President of certain of the Funds in the Federated Fund Family; Director or Trustee of the Funds in the Federated Fund Family; President, Chief Executive Officer and Director, Federated Investors, Inc.; Chairman and Trustee, Federated Investment Management Company; Trustee, Federated Investment Counseling; Chairman and Director, Federated Global Investment Management Corp.; Chairman and Trustee, Federated Equity Management Company of Pennsylvania; Trustee, Federated Shareholder Services Company; Director, Federated Services Company.
Previous Positions: President, Federated Investment Counseling; President and Chief Executive Officer, Federated Investment Management Company, Federated Global Investment Management Corp. and Passport Research, Ltd; Chairman, Passport Research, Ltd. |
Annual Shareholder Report
Name
Birth Date
Positions Held with Trust
Date Service Began | Principal Occupation(s) for Past Five Years,
Other Directorships Held and Previous Position(s) |
John B. Fisher*
Birth Date: May 16, 1956
Trustee
Indefinite Term
Began serving: May 2016 | Principal Occupations:Principal Executive Officer and President of certain of the Funds in the Federated Fund Family; Director or Trustee of certain of the Funds in the Federated Fund Family; Vice President, Federated Investors, Inc.; President, Director/Trustee and CEO, Federated Advisory Services Company, Federated Equity Management Company of Pennsylvania, Federated Global Investment Management Corp., Federated Investment Counseling, Federated Investment Management Company; President of some of the Funds in the Federated Fund Complex and Director, Federated Investors Trust Company.
Previous Positions: President and Director of the Institutional Sales Division of Federated Securities Corp.; President and Director of Federated Investment Counseling; President and CEO of Passport Research, Ltd.; Director, Edgewood Securities Corp.; Director, Federated Services Company; Director, Federated Investors, Inc.; Chairman and Director, Southpointe Distribution Services, Inc. and President, Technology, Federated Services Company. |
| * | Reasons for “interested” status: J. Christopher Donahue and John B. Fisher are interested due to their beneficial ownership of shares of Federated Investors, Inc. and due to positions they hold with Federated and its subsidiaries. |
INDEPENDENT TRUSTEES Background
Name
Birth Date
Positions Held with Trust
Date Service Began | Principal Occupation(s) for Past Five Years,
Other Directorships Held, Previous Position(s) and Qualifications |
John T. Collins
Birth Date: January 24, 1947
Trustee
Indefinite Term
Began serving: October 2013 | Principal Occupations: Director or Trustee of the Federated Fund Family; formerly, Chairman and CEO, The Collins Group, Inc. (a private equity firm) (Retired).
Other Directorships Held: Director, Chairman of the Compensation Committee, KLX Energy Services Holdings, Inc. (oilfield services); former Director of KLX Corp. (aerospace).
Qualifications: Mr. Collins has served in several business and financial management roles and directorship positions throughout his career. Mr. Collins previously served as Chairman and CEO of The Collins Group, Inc. (a private equity firm) and as a Director of KLX Corp. Mr. Collins serves as Chairman Emeriti, Bentley University. Mr. Collins previously served as Director and Audit Committee Member, Bank of America Corp.; Director, FleetBoston Financial Corp.; and Director, Beth Israel Deaconess Medical Center (Harvard University Affiliate Hospital). |
Annual Shareholder Report
Name
Birth Date
Positions Held with Trust
Date Service Began | Principal Occupation(s) for Past Five Years,
Other Directorships Held, Previous Position(s) and Qualifications |
G. Thomas Hough
Birth Date: February 28, 1955
Trustee
Indefinite Term
Began serving: August 2015 | Principal Occupations: Director or Trustee of the Federated Fund Family; formerly, Vice Chair, Ernst & Young LLP (public accounting firm) (Retired).
Other Directorships Held: Director, Member of Governance and Compensation Committees, Publix Super Markets, Inc.; Director, Chair of the Audit Committee, Equifax, Inc.; Director, Member of the Audit Committee, Haverty Furniture Companies, Inc.
Qualifications: Mr. Hough has served in accounting, business management and directorship positions throughout his career. Mr. Hough most recently held the position of Americas Vice Chair of Assurance with Ernst & Young LLP (public accounting firm). Mr. Hough serves on the President's Cabinet and Business School Board of Visitors for the University of Alabama and is on the Business School Board of Visitors for Wake Forest University. Mr. Hough previously served as an Executive Committee member of the United States Golf Association. |
Maureen Lally-Green
Birth Date: July 5, 1949
Trustee
Indefinite Term
Began serving: August 2009 | Principal Occupations: Director or Trustee of the Federated Fund Family; Adjunct Professor of Law, Duquesne University School of Law; formerly, Dean of the Duquesne University School of Law and Professor of Law and Interim Dean of the Duquesne University School of Law; formerly, Associate General Secretary and Director, Office of Church Relations, Diocese of Pittsburgh.
Other Directorships Held: Director, CNX Resources Corporation (formerly known as CONSOL Energy Inc.).
Qualifications: Judge Lally-Green has served in various legal and business roles and directorship positions throughout her career. Judge Lally-Green previously held the position of Dean of the School of Law of Duquesne University (as well as Interim Dean). Judge Lally-Green previously served as a member of the Superior Court of Pennsylvania and as a Professor of Law, Duquesne University School of Law. Judge Lally-Green also currently holds the positions on not for profit or for profit boards of directors as follows: Director and Chair, UPMC Mercy Hospital; Director and Vice Chair, Our Campaign for the Church Alive!, Inc.; Regent, Saint Vincent Seminary; Member, Pennsylvania State Board of Education (public); and Director CNX Resources Corporation (formerly known as CONSOL Energy Inc.). Judge Lally-Green has held the positions of: Director, Auberle; Director, Epilepsy Foundation of Western and Central Pennsylvania; Director, Ireland Institute of Pittsburgh; Director, Saint Thomas More Society; Director and Chair, Catholic High Schools of the Diocese of Pittsburgh, Inc.; Director, Pennsylvania Bar Institute; Director, St. Vincent College; and Director and Chair, North Catholic High School, Inc. |
Charles F. Mansfield, Jr.
Birth Date: April 10, 1945
Trustee
Indefinite Term
Began serving: June 2006 | Principal Occupations: Director or Trustee of the Federated Fund Family; Management Consultant and Author.
Other Directorships Held: None.
Qualifications: Mr. Mansfield has served as a Marine Corps officer and in several banking, business management, educational roles and directorship positions throughout his long career. He remains active as a Management Consultant and Author. |
Annual Shareholder Report
Name
Birth Date
Positions Held with Trust
Date Service Began | Principal Occupation(s) for Past Five Years,
Other Directorships Held, Previous Position(s) and Qualifications |
Thomas M. O'Neill
Birth Date: June 14, 1951
Trustee
Indefinite Term
Began serving: August 2006 | Principal Occupations: Director or Trustee, Chair of the Audit Committee of the Federated Fund Family; Sole Proprietor, Navigator Management Company (investment and strategic consulting).
Other Directorships Held: None.
Qualifications: Mr. O'Neill has served in several business, mutual fund and financial management roles and directorship positions throughout his career. Mr. O'Neill serves as Director, Medicines for Humanity and Director, The Golisano Children's Museum of Naples, Florida. Mr. O'Neill previously served as Chief Executive Officer and President, Managing Director and Chief Investment Officer, Fleet Investment Advisors; President and Chief Executive Officer, Aeltus Investment Management, Inc.; General Partner, Hellman, Jordan Management Co., Boston, MA; Chief Investment Officer, The Putnam Companies, Boston, MA; Credit Analyst and Lending Officer, Fleet Bank; Director and Consultant, EZE Castle Software (investment order management software); and Director, Midway Pacific (lumber). |
P. Jerome Richey
Birth Date: February 23, 1949
Trustee
Indefinite Term
Began serving: October 2013 | Principal Occupations: Director or Trustee of the Federated Fund Family; Management Consultant; Retired; formerly, Senior Vice Chancellor and Chief Legal Officer, University of Pittsburgh and Executive Vice President and Chief Legal Officer, CNX Resources Corporation (formerly known as CONSOL Energy Inc.).
Other Directorships Held: None.
Qualifications: Mr. Richey has served in several business and legal management roles and directorship positions throughout his career. Mr. Richey most recently held the positions of Senior Vice Chancellor and Chief Legal Officer, University of Pittsburgh. Mr. Richey previously served as Chairman of the Board, Epilepsy Foundation of Western Pennsylvania and Chairman of the Board, World Affairs Council of Pittsburgh. Mr. Richey previously served as Chief Legal Officer and Executive Vice President, CNX Resources Corporation (formerly known as CONSOL Energy Inc.); and Board Member, Ethics Counsel and Shareholder, Buchanan Ingersoll & Rooney PC (a law firm). |
John S. Walsh
Birth Date: November 28, 1957
Trustee
Indefinite Term
Began serving: June 2006 | Principal Occupations: Director or Trustee, and Chair of the Board of Directors or Trustees, of the Federated Fund Family; President and Director, Heat Wagon, Inc. (manufacturer of construction temporary heaters); President and Director, Manufacturers Products, Inc. (distributor of portable construction heaters); President, Portable Heater Parts, a division of Manufacturers Products, Inc.
Other Directorships Held: None.
Qualifications: Mr. Walsh has served in several business management roles and directorship positions throughout his career. Mr. Walsh previously served as Vice President, Walsh & Kelly, Inc. (paving contractors). |
Annual Shareholder Report
OFFICERS
Name
Birth Date
Address
Positions Held with Trust
Date Service Began | Principal Occupation(s) for Past Five Years
and Previous Position(s) |
Lori A. Hensler
Birth Date: January 6, 1967
TREASURER
Officer since: April 2013 | Principal Occupations: Principal Financial Officer and Treasurer of the Federated Fund Family; Senior Vice President, Federated Administrative Services; Financial and Operations Principal for Federated Securities Corp. and Edgewood Services, Inc.; and Assistant Treasurer, Federated Investors Trust Company. Ms. Hensler has received the Certified Public Accountant designation.
Previous Positions: Controller of Federated Investors, Inc.; Senior Vice President and Assistant Treasurer, Federated Investors Management Company; Treasurer, Federated Investors Trust Company; Assistant Treasurer, Federated Administrative Services, Federated Administrative Services, Inc., Federated Securities Corp., Edgewood Services, Inc., Federated Advisory Services Company, Federated Equity Management Company of Pennsylvania, Federated Global Investment Management Corp., Federated Investment Counseling, Federated Investment Management Company, Passport Research, Ltd., and Federated MDTA, LLC; Financial and Operations Principal for Federated Securities Corp., Edgewood Services, Inc. and Southpointe Distribution Services, Inc. |
Peter J. Germain
Birth Date: September 3, 1959
CHIEF LEGAL OFFICER, SECRETARY and EXECUTIVE VICE PRESIDENT
Officer since: June 2006 | Principal Occupations: Mr. Germain is Chief Legal Officer, Secretary and Executive Vice President of the Federated Fund Family. He is General Counsel, Chief Legal Officer, Secretary and Executive Vice President, Federated Investors, Inc.; Trustee and Senior Vice President, Federated Investors Management Company; Trustee and President, Federated Administrative Services; Director and President, Federated Administrative Services, Inc.; Director and Vice President, Federated Securities Corp.; Director and Secretary, Federated Private Asset Management, Inc.; Secretary, Federated Shareholder Services Company; and Secretary, Retirement Plan Service Company of America. Mr. Germain joined Federated in 1984 and is a member of the Pennsylvania Bar Association.
Previous Positions: Deputy General Counsel, Special Counsel, Managing Director of Mutual Fund Services, Federated Investors, Inc.; Senior Vice President, Federated Services Company; and Senior Corporate Counsel, Federated Investors, Inc. |
Stephen F. Auth
Birth Date: September 13, 1956
101 Park Avenue
41st Floor
New York, NY 10178
CHIEF INVESTMENT OFFICER
Officer since: June 2012 | Principal Occupations: Stephen F. Auth is Chief Investment Officer of various Funds in the Federated Fund Family; Executive Vice President, Federated Investment Counseling, Federated Global Investment Management Corp. and Federated Equity Management Company of Pennsylvania.
Previous Positions: Executive Vice President, Federated Investment Management Company and Passport Research, Ltd. (investment advisory subsidiary of Federated); Senior Vice President, Global Portfolio Management Services Division; Senior Vice President, Federated Investment Management Company and Passport Research, Ltd.; Senior Managing Director and Portfolio Manager, Prudential Investments. |
Annual Shareholder Report
Name
Birth Date
Address
Positions Held with Trust
Date Service Began | Principal Occupation(s) for Past Five Years
and Previous Position(s) |
Stephen Van Meter
Birth Date: June 5, 1975
CHIEF COMPLIANCE OFFICER AND SENIOR VICE PRESIDENT
Officer since: July 2015 | Principal Occupations: Senior Vice President and Chief Compliance Officer of the Federated Fund Family; Vice President and Chief Compliance Officer of Federated Investors, Inc. and Chief Compliance Officer of certain of its subsidiaries. Mr. Van Meter joined Federated in October 2011. He holds FINRA licenses under Series 3, 7, 24 and 66.
Previous Positions: Mr. Van Meter previously held the position of Compliance Operating Officer, Federated Investors, Inc. Prior to joining Federated, Mr. Van Meter served at the United States Securities and Exchange Commission in the positions of Senior Counsel, Office of Chief Counsel, Division of Investment Management and Senior Counsel, Division of Enforcement. |
Annual Shareholder Report
Evaluation and Approval of Advisory Contract–May 2019
Federated MDT All Cap Core Fund (the “Fund”)
At its meetings in May 2019, the Fund's Board of Trustees (the “Board”), including a majority of those Trustees who are not “interested persons” of the Fund, as defined in the Investment Company Act of 1940 (the “Independent Trustees”) reviewed and unanimously approved the continuation of the Fund's investment advisory contract for an additional one-year term. The Board's decision regarding the contract reflects the exercise of its business judgment after considering all of the information received on whether to continue the existing arrangements.
At the request of the Independent Trustees, the Fund's Chief Compliance Officer (the CCO) furnished to the Board in advance of its May 2019 meetings an independent written evaluation presenting on the topics discussed below. The Board considered the CCO's independent written evaluation (the “CCO Fee Evaluation Report”), along with other information, in evaluating the reasonableness of the Fund's management fee and in deciding to approve the continuation of the investment advisory contract. The CCO, in preparing the CCO Fee Evaluation Report, has the authority to retain consultants, experts or staff as reasonably necessary to assist in the performance of his duties, reports directly to the Board, and can be terminated only with the approval of a majority of the Independent Trustees. At the request of the Independent Trustees, the CCO Fee Evaluation Report followed the same general approach and covered the same topics as that of the report that had previously been delivered by the CCO in his capacity as “Senior Officer,” prior to the elimination of the Senior Officer position in December 2017.
The Board also considered judicial decisions concerning allegedly excessive investment advisory fees in making its decision. Using these judicial decisions as a guide, the Board observed that the following factors may be relevant to an adviser's fiduciary duty with respect to its receipt of compensation from a fund: (1) the nature and quality of the services provided by an adviser to a fund and its shareholders (including the performance of the fund, its benchmark, and comparable funds); (2) an adviser's cost of providing the services (including the profitability to an adviser of providing advisory services to a fund); (3) the extent to which an adviser may realize “economies of scale” as a fund grows larger and, if such economies of scale exist, whether they have been shared with a fund and its shareholders or the family of funds; (4) any “fall-out” financial benefits that accrue to an adviser because of its relationship with a fund (including research services received from brokers that execute fund trades and any fees paid to affiliates of an adviser for services rendered to a fund); (5) comparative fee and expense structures (including a comparison of fees paid to an adviser with those paid by similar funds both internally and externally as well as management fees charged to institutional and other advisory clients of the
Annual Shareholder Report
adviser for what might be viewed as like services); and (6) the extent of care, conscientiousness and independence with which the fund's board members perform their duties and their expertise (including whether they are fully informed about all facts the board deems relevant to its consideration of an adviser's services and fees). The Board noted that the Securities and Exchange Commission (SEC) disclosure requirements regarding the basis for the Board's approval of the Fund's investment advisory contract generally align with the factors listed above. The Board was aware of these factors and was guided by them in its review of the Fund's investment advisory contract to the extent it considered them to be appropriate and relevant, as discussed further below.
The Board considered and weighed these factors in light of its substantial accumulated experience in governing the Fund and working with Federated MDTA LLC (the “Adviser”) and its affiliates (collectively “Federated”) on matters relating to the funds advised by Federated (each, a “Federated Fund”). The Independent Trustees were assisted in their deliberations by independent legal counsel.
In addition to the extensive materials that comprise and accompany the CCO Fee Evaluation Report, the Board received detailed information about the Fund and the Federated organization throughout the year, and in connection with its May meetings at which the Board's formal approval of the advisory and subadvisory contracts occurred. In this regard, Federated provided much of this information at each regular meeting of the Board, and furnished additional information specifically in connection with the May meetings. In the months preceding the May meetings, the Board requested and reviewed written materials prepared by Federated in response to requests on behalf of the Independent Trustees encompassing a wide variety of topics. At the May meetings, in addition to meeting in separate sessions of the Independent Trustees without management present, senior management of the Adviser also met with the Independent Trustees and their counsel to discuss the materials presented and such additional matters as the Independent Trustees deemed reasonably necessary to evaluate the advisory and subadvisory contracts. Between regularly scheduled meetings, the Board also received information on particular matters as the need arose.
The Board's consideration of the investment advisory contract included review of the CCO Fee Evaluation Report, accompanying data and additional information covering the following matters, among others: the Adviser's investment philosophy, revenue, profitability, personnel and processes; investment and operating strategies; the Fund's short-term and long-term performance (in absolute terms, both on a gross basis and net of expenses, as well as in terms relative to its particular investment program and certain competitor or “peer group” funds and/or other benchmarks, as appropriate) and comments on the reasons for performance; the Fund's investment objectives; the Fund's expenses, including the advisory fee and the overall expense structure of the Fund (both in absolute terms and relative to similar and/or competing funds), with due
Annual Shareholder Report
regard for contractual or voluntary expense limitations; the use and allocation of brokerage commissions derived from trading the Fund's portfolio securities (if any); and the nature, quality and extent of the advisory and other services provided to the Fund by the Adviser and its affiliates. The Board also considered the preferences and expectations of Fund shareholders; the entrepreneurial and other risks assumed by the Adviser in sponsoring the Fund; the continuing state of competition in the mutual fund industry and market practices; the range of comparable fees for similar funds in the mutual fund industry; the Fund's relationship to the Federated Funds which include a comprehensive array of funds with different investment objectives, policies and strategies which are generally available for exchange without the incurrence of additional sales charges; compliance and audit reports concerning the Federated Funds and the Federated companies that service them (including communications from regulatory agencies), as well as Federated's responses to any issues raised therein; and relevant developments in the mutual fund industry and how the Federated Funds and/or Federated are responding to them. The Board's evaluation process is evolutionary. The criteria considered and the emphasis placed on relevant criteria change in recognition of changing circumstances in the mutual fund marketplace.
While mindful that courts have cautioned against giving too much weight to comparative information concerning fees charged by other advisers for managing funds with comparable investment programs, the Board has found the use of such comparisons to be relevant to its deliberations. In this regard, the Board was presented with, and considered, information regarding the contractual advisory fee rates, net advisory fee rates, total expense ratios and each element of the Fund's total expense ratio (i.e., gross and net advisory fees, custody fees, portfolio accounting fees and transfer agency fees) relative to an appropriate group of peer funds compiled by Federated using data supplied by independent fund ranking organizations (the “Peer Group”). The Board received a description of the composition and methodology used to select the Peer Group. The Board focused on comparisons with other similar mutual funds more heavily than non-mutual fund products or services because it is believed that they are more relevant. For example, other mutual funds are the products most like the Fund, in that they are readily available to Fund shareholders as alternative investment vehicles. Also, they are the type of investment vehicle, in fact, chosen and maintained by the Fund's investors. The range of their fees and expenses, therefore, appears to be a relevant indicator of what consumers have found to be reasonable in the marketplace in which the Fund competes.
The Board reviewed the contractual advisory fee rate and other expenses of the Fund and noted the position of the Fund's fee rates relative to its Peer Group. In this regard, the Board noted that the contractual advisory fee rate was above the median of the relevant Peer Group, but the Board noted the applicable waivers and reimbursements, and that the overall expense structure of the Fund remained competitive in the context of other factors considered by
Annual Shareholder Report
the Board. In this regard, the Board had been previously advised that, while comparisons to fund Peer Groups are relevant in judging the reasonableness of advisory fees, the Fund's quantitative focus makes fee and expense comparisons particularly difficult. Although the Fund's advisory fee was above the median of the peer range, the Peer Group of funds varied widely in their complexity, and the Board has been informed that the management of the Fund is among the more complex relative to its Peer Group. The Board considered the fact that the Adviser committed to permanently reduce fees of the Fund in an agreed upon amount, such reduction to be effective July 1, 2019.
For comparison, the CCO reviewed the fees charged by Federated for providing advisory services to products other than the Federated Funds (e.g., institutional separate accounts and third-party unaffiliated mutual funds for which Federated serves as sub-adviser) (referenced to as “Comparable Funds/Accounts”). With respect to Comparable Funds/Accounts other than third-party mutual funds, the CCO concluded that they are inherently different products. Those differences include, but are not limited to, different types of targeted investors; different applicable laws and regulations; different legal structures; different average account sizes and portfolio management techniques made necessary by different cash flows and different associated costs; and the time spent by portfolio managers and their teams, as well as personnel in the Funds Financial Services, Legal, Compliance and Risk Management departments, in reviewing securities pricing, addressing different administrative responsibilities, addressing different degrees of risk associated with management and a variety of different costs. The CCO also reviewed the differences in the nature of the services required for Federated to manage its proprietary mutual fund business versus managing a discrete pool of assets as a sub-adviser to another institution's mutual fund, and that Federated generally performs significant additional services and assumes substantially greater risks in managing the Fund and other Federated Funds than in its role as sub-adviser to an unaffiliated third-party mutual fund. The CCO did not consider the fees for providing advisory services to Comparable Funds/Accounts to be determinative in judging the appropriateness of the Federated Funds' advisory fees.
The CCO noted that the services, administrative responsibilities and risks associated with such relationships are quite different than serving as a primary adviser to a fund.
Following such evaluation, and full deliberations, the Board concluded that the fees and expenses of the Fund are reasonable and supported renewal of the Fund's investment advisory contract.
The Board considered the nature, extent and quality of the services provided to the Fund by the Adviser and the resources of the Adviser and its affiliates dedicated to the Fund. In this regard, the Board evaluated, among other things, the Adviser's personnel, experience, track record, financial resources, overall reputation and willingness to invest in personnel and infrastructure that benefit the Fund. In addition, the Board reviewed the qualifications, backgrounds and
Annual Shareholder Report
responsibilities of the portfolio management team primarily responsible for the day-to-day management of the Fund and the Adviser's ability and experience in attracting and retaining qualified personnel to service the Fund. The Board noted the investment research and company engagement capabilities of the Adviser and its affiliates. The Board also noted the compliance program of the Adviser and the compliance-related resources provided to the Fund by the Adviser, including the Adviser's commitment to respond to rulemaking initiatives of the SEC. The Fund's ability to deliver competitive performance when compared to its Peer Group was also deemed to be relevant by the Board as a useful indicator of how the Adviser is executing the Fund's investment program. The Adviser's ability to execute this program was one of the Board's considerations in reaching a conclusion that the nature, extent and quality of the Adviser's investment management services warrant the continuation of the investment advisory contract.
In evaluating the Fund's investment performance, the Board considered performance results in light of the Fund's investment objective, strategies and risks, as disclosed in the Fund's prospectus. The Board considered detailed investment reports on the Fund's performance that were provided to the Board throughout the year and in connection with the May meetings. The CCO also reviewed information regarding the performance of other mutual funds in the Peer Group, noting the CCO's view that comparisons to fund peer groups may be helpful, though not conclusive, in evaluating the performance of the Adviser in managing the Fund. The Board considered, in evaluating such comparisons, that in some cases there may be differences in the funds' investment objectives or investment management techniques, or the costs to implement funds, even within the same Peer Group, and that the CCO had specifically noted that the Fund's quantitative focus makes fee and expense comparisons particularly difficult as the funds in the Peer Group varied widely in their complexity, and the management of the Fund is among the more complex relative to its Peer Group.
For the one-year, three-year and five-year periods covered by the CCO Fee Evaluation Report, the Fund's performance was above the median of the relevant Peer Group. In addition, the Board was informed by the Adviser that the Fund outperformed its benchmark index for the one-year and three-year periods.
Following such evaluation, and full deliberations, the Board concluded that the performance of the Fund supported renewal of the Fund's advisory contract.
The Board also received financial information about Federated, including information regarding the compensation and ancillary (or “fall-out”) benefits Federated derived from its relationships with the Federated Funds. This information covered not only the fees under the investment advisory contracts, but also fees received by Federated's subsidiaries for providing other services to the Federated Funds under separate contracts (e.g., for serving as the Federated
Annual Shareholder Report
Funds' administrator and distributor). In this regard, the Board considered that certain Federated subsidiaries provide distribution and shareholder services to the Federated Funds, for which they may be compensated through distribution and servicing fees paid pursuant to Rule 12b-1 plans or otherwise. The information also detailed any indirect benefit Federated may derive from its receipt of research services from brokers who execute Federated Fund trades. In addition, the Board considered the fact that, in order for a Federated Fund to be competitive in the marketplace, the Adviser and its affiliates frequently waived fees and/or reimbursed expenses and have disclosed to Federated Fund investors and/or indicated to the Board their intention to do so in the future. Moreover, the Board receives regular reporting as to the institution, adjustment or elimination of these voluntary waivers. The Board considered Federated's previous reductions in contractual management fees to certain Federated Funds in response to the CCO's recommendations in the prior year's CCO Fee Evaluation Report.
In 2019, the Board approved a reduction of 5 basis points in the contractual advisory fee.
Federated furnished information, requested by the CCO, that reported revenues on a fund-by-fund basis and made estimates of the allocation of expenses on a fund-by-fund basis, using allocation methodologies specified by the CCO. The CCO noted that, while these cost allocation reports apply consistent allocation processes, the inherent difficulties in allocating costs continues to cause the CCO to question the precision of the process and to conclude that such reports may be unreliable, since a single change in an allocation estimate may dramatically alter the resulting estimate of cost and/or profitability of a Federated Fund and may produce unintended consequences. The allocation information, including the CCO's view that fund-by-fund estimations may be unreliable, was considered in the evaluation by the Board.
The Board and the CCO also reviewed information compiled by Federated comparing its profitability information to other publicly held fund management companies, including information regarding profitability trends over time. In this regard, the CCO concluded that Federated's profit margins did not appear to be excessive. The CCO also noted that Federated appeared financially sound, with the resources necessary to fulfill its obligations under its contracts with the Fund.
The CCO Fee Evaluation Report also discussed the notion of possible realization of “economies of scale” as a fund grows larger, the difficulties of calculating economies of scale at an individual fund level, and the extent to which potential scale benefits are shared with shareholders. In this regard, the Board considered that Federated has made significant and long-term investments in areas that support all of the Federated Funds, such as personnel and processes for the portfolio management, shareholder services, compliance, internal audit and risk management functions, as well as systems technology (including technology relating to cybersecurity) and that the benefits of these investments
Annual Shareholder Report
(as well as any economies of scale, should they exist) were likely to be shared with the Federated Fund family as a whole. The Board noted that Federated's investments in these areas are extensive. In addition, the Board considered that the Adviser and its affiliates have frequently waived fees and/or reimbursed expenses and that this has allowed potential economies of scale to be shared with shareholders. The Board also considered that such waivers and reimbursements can provide protection from an increase in expenses if a Federated Fund's assets decline. Federated, as it does throughout the year, and specifically in connection with the Board's review of the advisory and subadvisory contracts, furnished information relative to revenue sharing or adviser-paid fees. Federated and the CCO noted that this information should be viewed to determine if there was an incentive to either not apply breakpoints, or to apply breakpoints at higher levels, and should not be viewed to determine the appropriateness of advisory fees. The Board also noted the absence of any applicable regulatory or industry guidelines on this subject, which (as discussed in the CCO Fee Evaluation Report) is compounded by the lack of any common industry practice or general pattern with respect to structuring fund advisory fees with “breakpoints” that serve to reduce the fee as a fund attains a certain size.
The CCO stated that his observations and the information accompanying the CCO Fee Evaluation Report supported a finding by the Board that the management fee for the Fund was reasonable. Under these circumstances, no changes were recommended to, and no objection was raised to the continuation of, the Fund's investment advisory contract. The CCO also recognized that the Board's evaluation of the Federated Funds' advisory and subadvisory arrangements is a continuing and on-going process that is informed by the information that the Board requests and receives from management throughout the course of the year and, in this regard, the CCO noted certain items for future reporting to the Board or further consideration by management as the Board continues its on-going oversight of the Federated Funds.
In its decision to continue an existing investment advisory contract, the Board was mindful of the potential disruptions of the Fund's operations and various risks, uncertainties and other effects that could occur as a result of a decision to terminate or not renew an investment advisory contract. In particular, the Board recognized that many shareholders have invested in the Fund on the strength of the Adviser's industry standing and reputation and with the expectation that the Adviser will have a continuing role in providing advisory services to the Fund. Thus, the Board's approval of the investment advisory contract reflected the fact that it is the shareholders who have effectively selected the Adviser by virtue of having invested in the Fund. The Board concluded that, in light of the factors summarized above, including the nature, quality and scope of the services provided to the Fund by the Adviser and its affiliates, continuation of the investment advisory contract was appropriate.
Annual Shareholder Report
The Board based its decision to approve the investment advisory contract on the totality of the circumstances and relevant factors and with a view to past and future long-term considerations. Not all of the factors and considerations identified above were necessarily relevant to the Fund, nor did the Board consider any one of them to be determinative. With respect to the factors that were relevant, the Board's decision to approve the continuation of the contract reflects its view that Federated's performance and actions provided a satisfactory basis to support the decision to continue the existing arrangement.
Annual Shareholder Report
Voting Proxies on Fund Portfolio Securities
A description of the policies and procedures that the Fund uses to determine how to vote proxies, if any, relating to securities held in the Fund's portfolio is available, without charge and upon request, by calling 1-800-341-7400. A report on “Form N-PX” of how the Fund voted any such proxies during the most recent 12-month period ended June 30 is available via the Proxy Voting Record (Form N-PX) link associated with the Fund and share class name at www.FederatedInvestors.com/FundInformation. Form N-PX filings are also available at the SEC's website at www.sec.gov.
Quarterly Portfolio Schedule
Each fiscal quarter, the Fund will file with the SEC a complete schedule of its monthly portfolio holdings on “Form N-PORT.” The Fund's holdings as of the end of the third month of every fiscal quarter, as reported on Form N-PORT, will be publicly available on the SEC's website at www.sec.gov within 60 days of the end of the fiscal quarter upon filing. You may also access this information via the link to the Fund and share class name at www.FederatedInvestors.com.
Annual Shareholder Report
Mutual funds are not bank deposits or obligations, are not guaranteed by any bank and are not insured or guaranteed by the U.S. government, the Federal Deposit Insurance Corporation, the Federal Reserve Board or any other government agency. Investment in mutual funds involves investment risk, including the possible loss of principal.
This Report is authorized for distribution to prospective investors only when preceded or accompanied by the Fund's Prospectus, which contains facts concerning its objective and policies, management fees, expenses and other information.
Federated MDT All Cap Core Fund
Federated Investors Funds
4000 Ericsson Drive
Warrendale, PA 15086-7561
Contact us at FederatedInvestors.com
or call 1-800-341-7400.
Federated Securities Corp., Distributor
CUSIP 31421R106
CUSIP 31421R205
CUSIP 31421R304
CUSIP 31421R718
37309 (9/19)
Federated is a registered trademark of Federated Investors, Inc.
2019 ©Federated Investors, Inc.
Annual Shareholder Report
July 31, 2019
| Share Class | Ticker | A | QABGX | C | QCBGX | Institutional | QIBGX | R6 | QKBGX |
Federated MDT Balanced Fund
Fund Established 2002
A Portfolio of Federated MDT Series
IMPORTANT NOTICE REGARDING REPORT DELIVERY
Beginning on January 1, 2021, as permitted by regulations adopted by the Securities and Exchange Commission, paper copies of the Fund's shareholder reports like this one will no longer be sent by mail, unless you specifically request paper copies of the reports from the Fund or from your financial intermediary, such as a broker-dealer or bank. Instead, the reports will be made available on a website, and you will be notified by mail each time a report is posted and provided with a website link to access the report.
If you already elected to receive shareholder reports electronically, you will not be affected by this change and you need not take any action. You may elect to receive shareholder reports and other communications from the Fund or your financial intermediary electronically by contacting your financial intermediary (such as a broker-dealer or bank); other shareholders may call the Fund at 1-800-341-7400, Option 4.
You may elect to receive all future reports in paper free of charge. You can inform the Fund or your financial intermediary that you wish to continue receiving paper copies of your shareholder reports by contacting your financial intermediary (such as a broker-dealer or bank); other shareholders may call the Fund at 1-800-341-7400, Option 4. Your election to receive reports in paper will apply to all funds held with the Fund complex or your financial intermediary.
Not FDIC Insured ■ May Lose Value ■ No Bank Guarantee
J. Christopher
Donahue
President
Federated MDT Balanced Fund
Letter from the President
Dear Valued Shareholder,
I am pleased to present the Annual Shareholder Report for your fund covering the period from August 1, 2018 through July 31, 2019. This report includes Management's Discussion of Fund Performance, a complete listing of your fund's holdings, performance information and financial statements along with other important fund information.
In addition, our website, FederatedInvestors.com, offers easy access to Federated resources that include timely fund updates, economic and market insights from our investment strategists, and financial planning tools.
Thank you for investing with Federated. I hope you find this information useful and look forward to keeping you informed.
Sincerely,
J. Christopher Donahue, President
CONTENTS
| 1 |
| 7 |
| 9 |
| 30 |
| 34 |
| 36 |
| 38 |
| 39 |
| 51 |
| 53 |
| 55 |
| 61 |
| 68 |
| 68 |
Management's Discussion of Fund Performance (unaudited)
Federated MDT Balanced Fund's (the “Fund”) total return, based on net asset value for the 12-month reporting period ended July 31, 2019, was 5.28% for Class A Shares, 4.54% for Class C Shares, 5.61% for Institutional Shares and 5.56% for Class R6 Shares. Over the same period, the Fund's custom blended benchmark (“Blended Index”),1 which consists of a 60%/40% blend of the Standard & Poor's 500 Index(S&P 500)2 and the Bloomberg Barclays U.S. Aggregate Bond Index (BAB),3 returned 8.48%. The total return of the Morningstar US Allocation 50% - 70% Equity Category Average (MA50-70),4 a peer group average for the Fund, was 4.31% during the period. The Fund's and the MA50-70's total return for the most recently completed fiscal year reflected actual cash flows, transaction costs and other expenses, which were not reflected in the total return of the Blended Index.
During the reporting period, the Fund's investment strategy focused on security selection within the domestic equity and Real Estate Investment Trust (REIT) segments of the portfolio, asset allocation and sector allocation within the fixed income segment of the portfolio. These were the most significant factors affecting the Fund's performance relative to the Blended Index during the period.
The following discussion will focus on the performance of the Fund's Institutional Shares.
MArket Overview
During the reporting period, overall domestic equity market performance was moderately strong as evidenced by the 7.05% return of the whole-market Russell 3000® Index (R3000).5 Larger cap stocks had a much better year than small-cap stocks. The Russell Top 200® Index6 returned 8.51%, the Russell Midcap® Index7 returned 6.71%, but both the small-cap Russell 2000® Index8 and the very small-cap Russell Microcap® Index9 fell (returns of -4.42% and -11.55%, respectively). For style, this was the third fiscal year in a row that growth stocks led value stocks by a substantial margin. During this reporting period, the Russell 3000® Growth Index10 returned 9.88% while the Russell 3000® Value Index11 returned 4.23%.
The best performing sectors in the R3000 during the reporting period were Information Technology (17.06%), Utilities (16.65%) and Real Estate (13.24%). Underperforming sectors during the same period included Energy (-19.42%), Materials (-3.94%) and Financials (2.77%).
International equities12 in developed markets underperformed the domestic equity market during the reporting period, with the MSCI EAFE Index13 returning -2.60%. Emerging-market14 equities were similarly weak, with the MSCI Emerging Markets Index15 returning -2.18%.
Annual Shareholder Report
Interest rates decreased across the maturity spectrum during the period, while credit spreads finished modestly wider, leading to a positive result for the BAB, which returned 8.08%.16
EQUITIES
Domestic equity investments finished ahead of their benchmark, the R3000, during the reporting period. Investments in the Information Technology, Energy and Health Care sectors were the most significant positive factors in the Fund's domestic equity performance relative to the R3000, while investments in the Utilities sector were the most significant negative contributors to relative performance.
REITS17
REIT investments finished ahead of their benchmark, the MSCI US REIT Index,18 during the reporting period. Investments in the Mortgage and Industrial sectors were the most significant positive factors in the Fund's relative results.
ASSET ALLOCATION
Although the performance differential between equities and fixed income was marginal over the entire reporting period, a larger overweight to equities during the volatile period late in 2018, and smaller relative overweight to equities during the rapid recovery in early 2019, negatively affected Fund performance.
FIXED INCOME
During the reporting period, the fixed-income portion of the portfolio slightly underperformed the BAB. Sector allocation was largely a positive contributor to relative performance, with yield curve positioning also providing a smaller positive contribution. Interest rate exposure ranged from 90 to 100% of that of the benchmark, and had minimal impact on relative performance compared to the index. The portfolio's exposure to Treasury Inflation Protected notes underperformed and detracted from relative performance.
| 1 | The Fund's Blended Index, which reflects 60% of the S&P 500 and 40% of the BAB, is being used for comparison purposes because, although it is not the Fund's broad-based securities market index, the Fund's Adviser believes it is more reflective of the Fund's balanced investment style. |
| 2 | Please see the footnotes to the line graphs below for definitions of, and further information about, the S&P 500 Index, one of the Fund's broad-based securities market indices. The S&P 500's return for the 12-month reporting period was 24.98%. |
| 3 | Please see the footnotes to the line graphs below for definitions of, and further information about, the BAB, one of the Fund's broad-based securities market indices. The BAB's return for the 12-month reporting period was -1.90%. |
| 4 | Please see the footnotes to the line graphs below for definitions of, and further information about, the MA50-70. |
| 5 | The Russell 3000® Index measures the performance of the largest 3,000 U.S. companies representing approximately 98% of the investable U.S. equity market. The Russell 3000® Index is constructed to provide a comprehensive, unbiased, and stable barometer of the broad market and is completely reconstituted annually to ensure new and growing equities are reflected.* |
Annual Shareholder Report
| 6 | The Russell Top 200® Index measures the performance of the largest cap segment of the U.S. equity universe. The Russell Top 200® Index is a subset of the Russell 3000® Index. It includes approximately 200 of the largest securities based on a combination of their market cap and current index membership and represents approximately 68% of the U.S. market. The Russell Top 200® Index is constructed to provide a comprehensive and unbiased barometer for this very large cap segment and is completely reconstituted annually to ensure new and growing equities are reflected.* |
| 7 | The Russell Midcap® Index measures the performance of the mid-cap segment of the U.S. equity universe. The Russell Midcap® Index is a subset of the Russell 1000® Index. It includes approximately 800 of the smallest securities based on a combination of their market cap and current index membership. The Russell Midcap® Index represents approximately 31% of the total market capitalization of the Russell 1000® companies. The Russell Midcap® Index is constructed to provide a comprehensive and unbiased barometer for the mid-cap segment. The Russell Midcap Index is completely reconstituted annually to ensure larger stocks do not distort the performance and characteristics of the true mid-cap opportunity set.* |
| 8 | The Russell 2000® Index measures the performance of the small-cap segment of the U.S. equity universe. The Russell 2000® Index is a subset of the Russell 3000® Index representing approximately 10% of the total market capitalization of that index. It includes approximately 2000 of the smallest securities based on a combination of their market cap and current index membership. The Russell 2000® Index is constructed to provide a comprehensive and unbiased small-cap barometer and is completely reconstituted annually to ensure larger stocks do not distort the performance and characteristics of the true small-cap opportunity set.* |
| 9 | The Russell Microcap® Index measures the performance of the microcap segment of the U.S. equity market. Microcap stocks make up less than 3% of the U.S. equity market (by market cap) and consist of the smallest 1,000 securities in the small-cap Russell 2000® Index, plus the next 1,000 smallest eligible securities by market cap. The Russell Microcap® Index is constructed to provide a comprehensive and unbiased barometer for the microcap segment trading on national exchanges and is completely reconstituted annually to ensure new and growing equities are reflected and companies continue to reflect appropriate capitalization and value characteristics.* |
| 10 | The Russell 3000® Growth Index measures the performance of the broad growth segment of the U.S. equity universe. It includes those Russell 3000® Index companies with higher price-to-book ratios and higher forecasted growth values. The Russell 3000® Growth Index is constructed to provide a comprehensive, unbiased and stable barometer of the broad growth market. The Russell 3000® Growth Index is completely reconstituted annually to ensure new and growing equities are included and that the represented companies continue to reflect growth characteristics.* |
| 11 | The Russell 3000® Value Index measures the performance of the broad value segment of U.S. equity value universe. It includes those Russell 3000® Index companies with lower price-to-book ratios and lower forecasted growth values. The Russell 3000® Value Index is constructed to provide a comprehensive, unbiased and stable barometer of the broad value market. The Russell 3000® Value Index is completely reconstituted annually to ensure new and growing equities are included and that the represented companies continue to reflect value characteristics.* |
| 12 | International investing involves special risks including currency risk, increased volatility of foreign securities, political risks and differences in auditing and other financial standards. |
| 13 | The MSCI EAFE Index measures international equity performance. It comprises 22 MSCI country indices, representing the developed markets outside of North America.* |
| 14 | Prices of emerging markets securities can be significantly more volatile than the prices of securities in developed countries, and currency risks and political risks are accentuated in emerging markets. |
| 15 | The MSCI Emerging Markets Index is an unmanaged index consisting of 21 emerging market countries.* |
| 16 | Bond prices are sensitive to changes in interest rates and a rise in interest rates can cause a decline in their prices. |
| 17 | Investments in real estate investment trusts (REITs) involve special risks associated with an investment in real estate, such as limited liquidity and interest rate risks. |
| 18 | The MSCI REIT Index is a free float-adjusted market capitalization weighted index that is comprised of equity Real Estate Investment Trusts (REITs). The index is based on the MSCI USA Investable Market Index (IMI), its parent index, which captures the large, mid and small cap segments of the USA market.* |
| * | The index is unmanaged, and it is not possible to invest directly in an index. |
Annual Shareholder Report
FUND PERFORMANCE AND GROWTH OF A $10,000 INVESTMENT
The graph below illustrates the hypothetical investment of $10,0001in the Federated MDT Balanced Fund from July 31, 2009 to July 31, 2019, compared to the Standard and Poor's 500 Index (S& P 500),2the Bloomberg Barclays U.S. Aggregate Bond Index (BAB),360% S&P 500/40% BAB (Blended Index) and the Morningstar Allocation-50% to 70% Equity Funds Average (MA50-70).4 The Average Annual Total Return table below shows returns for each class averaged over the stated periods.
Growth of a $10,000 Investment
Growth of $10,000 as of July 31, 2019
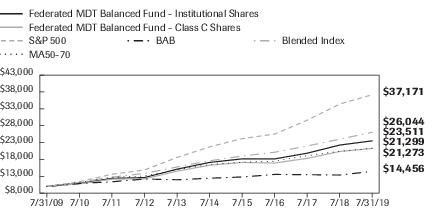
| Federated MDT Balanced Fund - | Institutional Shares | Class C Shares | S&P 500 | BAB | Blended Index | MA50-70 |
| F | F | I | I | I | I |
| 7/31/2009 | 10,000 | 10,000 | 10,000 | 10,000 | 10,000 | 10,000 |
| 7/31/2010 | 10,874 | 10,763 | 11,384 | 10,891 | 11,223 | 11,188 |
| 7/31/2011 | 12,395 | 12,146 | 13,621 | 11,374 | 12,749 | 12,695 |
| 7/31/2012 | 12,627 | 12,259 | 14,864 | 12,199 | 13,873 | 13,102 |
| 7/31/2013 | 15,106 | 14,515 | 18,580 | 11,967 | 15,758 | 14,964 |
| 7/31/2014 | 17,114 | 16,278 | 21,728 | 12,442 | 17,600 | 16,505 |
| 7/31/2015 | 18,163 | 17,112 | 24,163 | 12,793 | 18,990 | 17,162 |
| 7/31/2016 | 18,151 | 16,924 | 25,519 | 13,552 | 20,130 | 17,467 |
| 7/31/2017 | 19,850 | 18,317 | 29,613 | 13,483 | 21,979 | 19,115 |
| 7/31/2018 | 22,262 | 20,348 | 34,422 | 13,375 | 24,009 | 20,429 |
| 7/31/2019 | 23,511 | 21,273 | 37,171 | 14,456 | 26,044 | 21,299 |
41 graphic description end -->
| ■ | Total returns shown for Class C Shares include the maximum contingent deferred sales charge of 1.00% as applicable. |
The Fund offers multiple share classes whose performance may be greater than or less than its other share class(es) due to differences in sales charges and expenses. See the Average Annual Total Return table below for the returns of additional classes not shown in the line graph above.
Annual Shareholder Report
Average Annual Total Returnsfor the Periods Ended 7/31/2019
(returns reflect all applicable sales charges and contingent deferred sales charges as specified below in footnote #1)
| | 1 Year | 5 Years | 10 Years |
| Class A Shares | -0.51% | 5.08% | 8.04% |
| Class C Shares | 3.59% | 5.50% | 7.84% |
| Institutional Shares | 5.61% | 6.56% | 8.93% |
| Class R6 Shares5 | 5.56% | 6.33% | 8.45% |
| S&P 500 | 7.99% | 11.34% | 14.03% |
| BAB | 8.08% | 3.05% | 3.75% |
| Blended Index | 8.48% | 8.15% | 10.05% |
| MA50-70 | 4.31% | 5.55% | 8.42% |
Performance data quoted represents past performance which is no guarantee of future results. Investment return and principal value will fluctuate so that an investor's shares, when redeemed, may be worth more or less than their original cost. Mutual fund performance changes over time and current performance may be lower or higher than what is stated. For current to the most recent month-end performance and after-tax returns, visit FederatedInvestors.com or call 1-800-341-7400. Returns shown do not reflect the deduction of taxes that a shareholder would pay on Fund distributions or the redemption of Fund shares. Mutual funds are not obligations of or guaranteed by any bank and are not federally insured.
| 1 | Represents a hypothetical investment of $10,000 in the Fund after deducting applicable sales charges: for Class A Shares, the maximum sales charge of 5.50% ($10,000 investment minus $550 sales charge = $9,450); for Class C Shares, a 1.00% contingent deferred sales charge would be applied on any redemption less than one year from the purchase date. The Fund's performance assumes the reinvestment of all dividends and distributions. The S&P 500, BAB and MA50-70 have been adjusted to reflect reinvestment of dividends on securities in the indexes. |
| 2 | The S&P 500 Index, a broad-based securities market index of the Fund, is an unmanaged capitalization-weighted index of 500 stocks designed to measure performance of the broad domestic economy through changes in the aggregate market value of 500 stocks representing all major industries. The S&P 500 is unmanaged and, unlike the Fund, is not affected by cash flows. It is not possible to invest directly in an index. The S& P 500 is not adjusted to reflect sales charges, expenses or other fees that the Securities and Exchange Commission (SEC) requires to be reflected in the Fund's performance. |
| 3 | The BAB Index, a broad-based securities market index of the Fund, is a broad-based benchmark that measures the investment-grade, U.S. dollar-denominated, fixed-rate taxable bond market. The BAB is unmanaged and, unlike the Fund, is not affected by cash flows. It is not possible to invest directly in an index. The BAB is not adjusted to reflect sales charges, expenses or other fees that the SEC requires to be reflected in the Fund's performance. |
Annual Shareholder Report
| 4 | Morningstar figures represent the average of the total returns reported by all the funds designated by Morningstar as falling into the respective category indicated. They do not reflect sales charges. The Morningstar figures in the Growth of $10,000 line graph are based on historical return information published by Morningstar and reflect the return of the funds comprising the category in the year of publication. Because the funds designated by Morningstar as falling into the category can change over time, the Morningstar figures in the line graph may not match the Morningstar figures in the Average Annual Total Returns table, which reflect the return of the funds that currently comprise the category. |
| 5 | Prior to September 1, 2016, Class R6 Shares were known as Class R Shares and included 12b-1 fees and certain other expenses. As of September 1, 2016, Class R6 does not include such 12b-1 fees and certain other expenses, and the performance shown above for Class R6 prior to September 1, 2016, reflects the higher Class R expenses. |
Annual Shareholder Report
Portfolio of Investments Summary Tables (unaudited)
At July 31, 2019, the Fund's portfolio composition1 was as follows:
| Security Type | Percentage of
Total Net Assets |
| Domestic Equity Securities | 50.2% |
| Corporate Debt Securities | 13.1% |
| International Equity Securities (including International Exchange-Traded Funds) | 9.9% |
| Federated Mortgage Core Portfolio | 8.3% |
| U.S. Treasury Securities2 | 5.1% |
| High Yield Bond Portfolio | 2.8% |
| Federated Project and Trade Finance Core Fund | 2.1% |
| Commercial Mortgage-Backed Securities | 2.0% |
| Emerging Markets Core Fund | 1.8% |
| Federated Bank Loan Core Fund | 0.9% |
| Asset-Backed Securities | 0.1% |
| Collateralized Mortgage Obligations | 0.0%3 |
| Securities Lending Collateral4 | 0.1% |
| Derivative Contracts5 | 0.0%3 |
| Cash Equivalents6 | 3.7% |
| Other Assets and Liabilities—Net7 | (0.1)% |
| TOTAL | 100.0% |
| 1 | See the Fund's Prospectus and Statement of Additional Information for a description of the types of securities in which the Fund invests. As of the date specified above, the Fund owned shares of one or more affiliated investment companies. For purposes of this table, affiliated investment companies (other than an affiliated money market mutual fund) in which the Fund invested less than 10% of its net assets, are listed individually in the table. |
| 2 | Includes U.S. Treasuries pledged as collateral to ensure the Fund is able to satisfy the obligations of its outstanding futures contracts. |
| 3 | Represents less than 0.1%. |
| 4 | Represents cash collateral received for portfolio securities on loan that may be invested in affiliated money market funds, other money market instruments and/or repurchase agreements. |
| 5 | Based upon net unrealized appreciation (depreciation) or value of the derivative contracts as applicable. Derivative contracts may consist of futures, forwards, options and swaps. The impact of a derivative contract on the Fund's performance may be larger than its unrealized appreciation (depreciation) or value may indicate. In many cases, the notional value or amount of a derivative contract may provide a better indication of the contract's significance to the portfolio. More complete information regarding the Fund's direct investments in derivative contracts, including unrealized appreciation (depreciation), value and notional values or amounts of such contracts, can be found in the table at the end of the Portfolio of Investments included in this Report. |
| 6 | Cash Equivalents include any investments in money market mutual funds and/or overnight repurchase agreements other than those representing cash collateral for securities lending. |
| 7 | Assets, other than investments in securities and derivative contracts, less liabilities. See Statement of Assets and Liabilities. |
Annual Shareholder Report
At July 31, 2019, the Fund's sector composition8 for its equity securities (excluding exchange-traded funds) was as follows:
| Sector Composition | Percentage of
Equity Securities |
| Information Technology | 20.4% |
| Financials | 14.5% |
| Health Care | 12.5% |
| Consumer Discretionary | 11.0% |
| Industrials | 10.3% |
| Communication Services | 8.2% |
| Consumer Staples | 7.1% |
| Energy | 5.2% |
| Real Estate | 4.9% |
| Materials | 3.1% |
| Utilities | 2.8% |
| TOTAL | 100.0% |
| 8 | Sector classifications are based upon, and individual portfolio securities are assigned to, the classifications of the Global Industry Classification Standard (GICS) except that the Adviser assigns a classification to securities not classified by the GICS and to securities for which the Adviser does not have access to the classification made by the GICS. |
Annual Shareholder Report
Portfolio of Investments
July 31, 2019
Shares or
Principal
Amount | | | Value |
| | | COMMON STOCKS—52.1% | |
| | | Communication Services—4.2% | |
| 7,240 | | AT&T, Inc. | $246,522 |
| 5,627 | 1 | Charter Communications, Inc. | 2,168,533 |
| 5,733 | 1 | Facebook, Inc. | 1,113,521 |
| 555 | 1 | IAC Interactive Corp. | 132,673 |
| 25,493 | 1 | Live Nation Entertainment, Inc. | 1,837,025 |
| 28,128 | 1 | MSG Networks, Inc. | 534,151 |
| 9,716 | | Verizon Communications, Inc. | 537,003 |
| 1,403 | | Viacom, Inc., Class B | 42,581 |
| | | TOTAL | 6,612,009 |
| | | Consumer Discretionary—5.7% | |
| 5,200 | | Abercrombie & Fitch Co., Class A | 98,436 |
| 201 | 1 | Amazon.com, Inc. | 375,223 |
| 418 | 1 | AutoZone, Inc. | 469,431 |
| 7,113 | 2 | Bed Bath & Beyond, Inc. | 69,067 |
| 3,664 | 1 | Burlington Stores, Inc. | 662,268 |
| 400 | 1 | Chipotle Mexican Grill, Inc. | 318,212 |
| 645 | 1 | Cooper-Standard Holding, Inc. | 31,915 |
| 594 | 2 | Dillards, Inc., Class A | 43,231 |
| 4,427 | | Dunkin' Brands Group, Inc. | 354,868 |
| 18,014 | | eBay, Inc. | 741,997 |
| 9,353 | | Expedia Group, Inc. | 1,241,517 |
| 24,635 | | Ford Motor Co. | 234,772 |
| 3,861 | 1 | Fossil, Inc. | 42,625 |
| 5,192 | 1 | GameStop Corp. | 20,872 |
| 4,741 | | Goodyear Tire & Rubber Co. | 65,094 |
| 3,983 | | Harley-Davidson, Inc. | 142,512 |
| 3,130 | | Hilton Worldwide Holdings, Inc. | 302,202 |
| 5,309 | | Home Depot, Inc. | 1,134,480 |
| 2,435 | 1 | Libbey, Inc. | 4,115 |
| 6,556 | | Lowe's Cos., Inc. | 664,778 |
| 1,234 | 1 | Lululemon Athletica, Inc. | 235,805 |
| 1,390 | 1 | Planet Fitness, Inc. | 109,337 |
| 3,477 | | Ralph Lauren Corp. | 362,408 |
| 3,900 | 1 | Sally Beauty Holdings, Inc. | 53,586 |
Annual Shareholder Report
Shares or
Principal
Amount | | | Value |
| | | COMMON STOCKS—continued | |
| | | Consumer Discretionary—continued | |
| 600 | 1 | Tempur Sealy International, Inc. | $48,132 |
| 899 | | Toll Brothers, Inc. | 32,337 |
| 218 | | Tractor Supply Co. | 23,721 |
| 5,423 | | Tupperware Brands Corp. | 83,026 |
| 9,457 | | Wyndham Destinations, Inc. | 445,046 |
| 4,445 | | Yum! Brands, Inc. | 500,151 |
| 1,135 | 1 | Zumiez, Inc. | 28,114 |
| | | TOTAL | 8,939,278 |
| | | Consumer Staples—3.7% | |
| 946 | | Cal-Maine Foods, Inc. | 37,622 |
| 1,410 | | Church and Dwight, Inc. | 106,370 |
| 1,769 | | Colgate-Palmolive Co. | 126,908 |
| 8,975 | | Estee Lauder Cos., Inc., Class A | 1,653,105 |
| 4,289 | | Fresh Del Monte Produce, Inc. | 130,085 |
| 5,780 | 1 | Herbalife Ltd. | 237,096 |
| 7,472 | | Kimberly-Clark Corp. | 1,013,577 |
| 4,058 | | Lamb Weston Holdings, Inc. | 272,373 |
| 12,524 | | PepsiCo, Inc. | 1,600,693 |
| 3,602 | 1 | Post Holdings, Inc. | 386,206 |
| 3,066 | | Sysco Corp. | 210,236 |
| | | TOTAL | 5,774,271 |
| | | Energy—2.7% | |
| 12,992 | | Chevron Corp. | 1,599,445 |
| 3,476 | | Continental Resources, Inc. | 129,203 |
| 14,134 | | EOG Resources, Inc. | 1,213,404 |
| 13,438 | | Exxon Mobil Corp. | 999,250 |
| 5,879 | | HollyFrontier Corp. | 292,598 |
| 10,600 | 1 | Noble Corp. PLC | 23,638 |
| | | TOTAL | 4,257,538 |
| | | Financials—7.6% | |
| 18,118 | | Allstate Corp. | 1,945,873 |
| 6,338 | | American International Group, Inc. | 354,865 |
| 1,452 | | Ameriprise Financial, Inc. | 211,280 |
| 6,209 | 1 | Athene Holding Ltd. | 253,700 |
| 11,267 | | Bank of America Corp. | 345,672 |
| 5,500 | | Blackstone Mortgage Trust, Inc. | 195,360 |
| 12,644 | | Citigroup, Inc. | 899,747 |
Annual Shareholder Report
Shares or
Principal
Amount | | | Value |
| | | COMMON STOCKS—continued | |
| | | Financials—continued | |
| 2,010 | | Citizens Financial Group, Inc. | $74,893 |
| 4,315 | | Everest Re Group Ltd. | 1,064,252 |
| 17,862 | | Fifth Third Bancorp | 530,323 |
| 1,384 | 1 | Green Dot Corp. | 70,155 |
| 11,680 | | Huntington Bancshares, Inc. | 166,440 |
| 11,621 | | JPMorgan Chase & Co. | 1,348,036 |
| 12,370 | | KeyCorp | 227,237 |
| 2,649 | | LPL Investment Holdings, Inc. | 222,172 |
| 5,760 | | M & T Bank Corp. | 946,080 |
| 1,875 | | MSCI, Inc., Class A | 426,075 |
| 136 | | Marketaxess Holdings, Inc. | 45,837 |
| 17,976 | | Navient Corp. | 254,360 |
| 14,700 | | New Residential Investment Corp. | 230,643 |
| 8,406 | | Popular, Inc. | 483,849 |
| 7,303 | | Progressive Corp., OH | 591,397 |
| 4,065 | | Prudential Financial, Inc. | 411,825 |
| 2,595 | | RenaissanceRe Holdings Ltd. | 470,084 |
| | | TOTAL | 11,770,155 |
| | | Health Care—6.5% | |
| 3,187 | 1 | Alexion Pharmaceuticals, Inc. | 361,055 |
| 2,307 | | Anthem, Inc. | 679,665 |
| 5,364 | 1 | Biogen, Inc. | 1,275,666 |
| 1,474 | | Bristol-Myers Squibb Co. | 65,460 |
| 15,524 | 1,2 | Community Health Systems, Inc. | 31,824 |
| 2,864 | | Eli Lilly & Co. | 312,033 |
| 14,865 | | HCA Healthcare, Inc. | 1,984,626 |
| 811 | 1 | IDEXX Laboratories, Inc. | 228,743 |
| 4,764 | 1 | Incyte Genomics, Inc. | 404,559 |
| 1,186 | 1 | Ionis Pharmaceuticals, Inc. | 78,110 |
| 3,151 | 1 | Jazz Pharmaceuticals PLC. | 439,186 |
| 274 | 1 | Mettler-Toledo International, Inc. | 207,350 |
| 231 | 1 | Mirati Therapeutics, Inc. | 24,440 |
| 1,347 | 1 | Molina Healthcare, Inc. | 178,855 |
| 7,246 | | Stryker Corp. | 1,520,066 |
| 10,382 | 1 | Veeva Systems, Inc. | 1,722,374 |
| 3,686 | 1 | Vertex Pharmaceuticals, Inc. | 614,161 |
| | | TOTAL | 10,128,173 |
Annual Shareholder Report
Shares or
Principal
Amount | | | Value |
| | | COMMON STOCKS—continued | |
| | | Industrials—5.4% | |
| 2,951 | | AGCO Corp. | $227,227 |
| 11,532 | | Allison Transmission Holdings, Inc. | 529,895 |
| 2,415 | | Boeing Co. | 823,950 |
| 2,044 | | CSX Corp. | 143,898 |
| 737 | 1 | CoStar Group, Inc. | 453,550 |
| 1,681 | | Delta Air Lines, Inc. | 102,608 |
| 1,162 | | Deluxe Corp. | 51,848 |
| 1,032 | | Ennis, Inc. | 20,981 |
| 582 | | Grainger (W.W.), Inc. | 169,379 |
| 5,635 | | Heico Corp. | 770,586 |
| 828 | | Insperity, Inc. | 88,058 |
| 3,004 | 1 | Jet Blue Airways Corp. | 57,767 |
| 1,235 | | L3Harris Technologies, Inc. | 256,386 |
| 3,465 | | Lennox International, Inc. | 888,703 |
| 6,257 | | Lockheed Martin Corp. | 2,266,098 |
| 14,009 | | PACCAR, Inc. | 982,591 |
| 10,000 | | Pitney Bowes, Inc. | 40,500 |
| 1,321 | | R.R. Donnelley & Sons Co. | 2,668 |
| 9,094 | 1 | SPX Corp. | 317,381 |
| 2,272 | | Trinity Industries, Inc. | 44,531 |
| 1,648 | 1 | United Airlines Holdings, Inc. | 151,468 |
| | | TOTAL | 8,390,073 |
| | | Information Technology—10.6% | |
| 3,497 | 1 | Adobe, Inc. | 1,045,113 |
| 1,588 | 1 | Ansys, Inc. | 322,555 |
| 3,251 | | Apple, Inc. | 692,593 |
| 1,767 | 1 | Atlassian Corp. PLC | 247,592 |
| 6,627 | 1 | Autodesk, Inc. | 1,034,939 |
| 12,104 | | Automatic Data Processing, Inc. | 2,015,558 |
| 18,972 | 1 | Cadence Design Systems, Inc. | 1,402,221 |
| 388 | 1 | Coupa Software, Inc. | 52,655 |
| 1,190 | | DXC Technology Co. | 66,366 |
| 747 | 1 | Fair Isaac & Co., Inc. | 259,523 |
| 222 | 1 | FleetCor Technologies, Inc. | 63,086 |
| 6,202 | 1 | Fortinet, Inc. | 498,083 |
| 10,749 | | Global Payments, Inc. | 1,804,972 |
| 8,704 | | Hewlett-Packard Co. | 183,132 |
Annual Shareholder Report
Shares or
Principal
Amount | | | Value |
| | | COMMON STOCKS—continued | |
| | | Information Technology—continued | |
| 922 | 1 | HubSpot, Inc. | $164,780 |
| 1,900 | 1 | Insight Enterprises, Inc. | 104,538 |
| 2,227 | | Intuit, Inc. | 617,569 |
| 8,891 | | Mastercard, Inc. | 2,420,753 |
| 5,856 | | Microsoft Corp. | 797,997 |
| 3,138 | | NetApp, Inc. | 183,542 |
| 1,846 | 1 | Paycom Software, Inc. | 444,424 |
| 557 | 1 | PayPal, Inc. | 61,493 |
| 1,747 | 1 | Salesforce.com, Inc. | 269,912 |
| 7,000 | 1 | Sanmina Corp. | 222,250 |
| 1,492 | 1 | ServiceNow, Inc. | 413,866 |
| 190 | | Universal Display Corp. | 40,105 |
| 22,000 | | Vishay Intertechnology, Inc. | 374,000 |
| 1,760 | 1 | WEX, Inc. | 383,803 |
| 10,000 | | Western Union Co. | 210,000 |
| 506 | 1 | Zendesk, Inc. | 42,281 |
| 1,587 | 1 | Zscaler, Inc. | 133,736 |
| | | TOTAL | 16,573,437 |
| | | Materials—1.6% | |
| 9,367 | | Domtar, Corp. | 397,629 |
| 25,646 | | DuPont de Nemours, Inc. | 1,850,615 |
| 10,914 | | Mosaic Co./The | 274,924 |
| 725 | | Newmont Goldcorp Corp. | 26,477 |
| | | TOTAL | 2,549,645 |
| | | Real Estate—2.6% | |
| 1,900 | | Alexandria Real Estate Equities, Inc. | 278,084 |
| 763 | 1 | Altisource Portfolio Solutions S.A. | 16,023 |
| 5,100 | | American Homes 4 Rent | 123,471 |
| 1,100 | | American Tower Corp. | 232,782 |
| 7,700 | | Americold Realty Trust | 258,181 |
| 5,200 | | Douglas Emmett, Inc. | 212,264 |
| 505 | | Equinix, Inc. | 253,561 |
| 2,450 | | Equity Lifestyle Properties, Inc. | 304,412 |
| 2,500 | | Equity Residential Properties Trust | 197,225 |
| 6,200 | | Hudson Pacific Properties, Inc. | 218,860 |
| 9,400 | | Invitation Homes, Inc. | 258,218 |
| 4,300 | | Liberty Property Trust | 224,890 |
Annual Shareholder Report
Shares or
Principal
Amount | | | Value |
| | | COMMON STOCKS—continued | |
| | | Real Estate—continued | |
| 1,500 | | ProLogis, Inc. | $120,915 |
| 4,300 | | Rexford Industrial Realty, Inc. | 178,020 |
| 1,900 | | Ryman Hospitality Properties | 142,500 |
| 9,300 | | STORE Capital Corp. | 318,153 |
| 880 | | Simon Property Group, Inc. | 142,736 |
| 2,300 | | Sun Communities, Inc. | 305,463 |
| 3,600 | | Terreno Realty Corp. | 175,896 |
| | | TOTAL | 3,961,654 |
| | | Utilities—1.5% | |
| 14,160 | | AES Corp. | 237,747 |
| 11,927 | | Consolidated Edison Co. | 1,013,318 |
| 8,594 | | Edison International | 640,597 |
| 8,072 | | Exelon Corp. | 363,724 |
| | | TOTAL | 2,255,386 |
| | | TOTAL COMMON STOCKS
(IDENTIFIED COST $74,886,826) | 81,211,619 |
| | | ASSET-BACKED SECURITIES—0.1% | |
| | | Auto Receivables—0.0% | |
| $53,469 | | Santander Drive Auto Receivables Trust 2016-2, Class C, 2.660%, 11/15/2021 | 53,505 |
| | | Other—0.1% | |
| 128,000 | | PFS Financing Corp. 2016-BA, Class A, 1.870%, 10/15/2021 | 127,819 |
| | | TOTAL ASSET-BACKED SECURITIES
(IDENTIFIED COST $181,455) | 181,324 |
| | | COLLATERALIZED MORTGAGE OBLIGATIONS—0.0% | |
| 333 | 3 | Bear Stearns Mortgage Securities, Inc. 1997-6, Class 1A, 6.284%, 3/25/2031 | 331 |
| 929 | | Federal Home Loan Mortgage Corp. REMIC, Series 1311, Class K, 7.000%, 7/15/2022 | 980 |
| 1,151 | | Federal Home Loan Mortgage Corp. REMIC, Series 1384, Class D, 7.000%, 9/15/2022 | 1,199 |
| 4,166 | | Federal Home Loan Mortgage Corp. REMIC, Series 2497, Class JH, 6.000%, 9/15/2032 | 4,610 |
| 3,368 | 4 | Federal National Mortgage Association REMIC, Series 1993-113, Class SB, 9.749% (10-year Constant Maturity Treasury +48.285%), Maximum Rate 9.749%, 7/25/2023 | 3,601 |
| 910 | | Federal National Mortgage Association REMIC, Series 2003-35, Class UC, 3.750%, 5/25/2033 | 931 |
| | | TOTAL COLLATERALIZED MORTGAGE OBLIGATIONS
(IDENTIFIED COST $11,262) | 11,652 |
Annual Shareholder Report
Shares or
Principal
Amount | | | Value |
| | | COMMERCIAL MORTGAGE-BACKED SECURITIES—2.0% | |
| | | Commercial Mortgage—2.0% | |
| $170,000 | | Banc of America Commercial Mortgage Trust 2016-UBS10, Class A4, 3.170%, 7/15/2049 | $175,826 |
| 190,000 | | Bank 2017-BNK8, Class A4, 3.488%, 11/15/2050 | 201,286 |
| 220,000 | | Bank 2018-BN15, Class A4, 4.407%, 11/15/2061 | 249,502 |
| 190,000 | | CD Commercial Mortgage Trust 2016-CD1, Class A4, 2.724%, 8/10/2049 | 191,790 |
| 200,000 | | Citigroup Commercial Mortgage Trust 2013-GC11, Class B, 3.732%, 4/10/2046 | 205,518 |
| 70,000 | | Commercial Mortgage Pass-Through Certificates 2012-CR1, Class AM, 3.912%, 5/15/2045 | 72,186 |
| 125,000 | | Commercial Mortgage Pass-Through Certificates 2012-CR1, Class B, 4.612%, 5/15/2045 | 129,628 |
| 200,000 | | Commercial Mortgage Trust 2013-CR8, Class B, 3.960%, 6/10/2046 | 207,914 |
| 200,000 | | Commercial Mortgage Trust 2014-LC17, Class B, 4.490%, 10/10/2047 | 213,514 |
| 300,000 | | Commercial Mortgage Trust 2015-DC1, Class AM, 3.724%, 2/10/2048 | 311,619 |
| 200,000 | | FREMF Mortgage Trust 2013-K25 REMIC, Class B, 3.618%, 11/25/2045 | 206,401 |
| 69,270 | | Federal Home Loan Mortgage Corp. REMIC, Series K055, Class A1, 2.263%, 4/25/2025 | 69,316 |
| 252,705 | | Federal Home Loan Mortgage Corp. REMIC, Series K504, Class A2, 2.566%, 9/25/2020 | 252,509 |
| 100,000 | | GS Mortgage Securities Corp. II 2012-GCJ7, Class AS, 4.085%, 5/10/2045 | 103,698 |
| 200,000 | | JPMDB Commercial Mortgage Securities Trust 2016-C4, Class A3, 3.141%, 12/15/2049 | 206,946 |
| 50,000 | | JPMDB Commercial Mortgage Securities Trust 2017-C5, Class A5, 3.693%, 3/15/2050 | 53,612 |
| 100,000 | | Morgan Stanley Capital I 2012-C4, Class AS, 3.773%, 3/15/2045 | 103,013 |
| 150,000 | | UBS-Barclays Commercial Mortgage Trust 2013-C6, Class B, 3.875%, 4/10/2046 | 155,463 |
| 25,000 | | WF-RBS Commercial Mortgage Trust 2012-C6, Class B, 4.697%, 4/15/2045 | 26,170 |
| | | TOTAL COMMERCIAL MORTGAGE-BACKED SECURITIES
(IDENTIFIED COST $3,098,472) | 3,135,911 |
| | | CORPORATE BONDS—13.1% | |
| | | Basic Industry - Chemicals—0.0% | |
| 35,000 | | Incitec Pivot Finance LLC, Company Guarantee, 144A, 6.000%, 12/10/2019 | 35,371 |
| 20,000 | | RPM International, Inc., Sr. Unsecd. Note, 6.125%, 10/15/2019 | 20,134 |
| | | TOTAL | 55,505 |
Annual Shareholder Report
Shares or
Principal
Amount | | | Value |
| | | CORPORATE BONDS—continued | |
| | | Basic Industry - Metals & Mining—0.3% | |
| $15,000 | | Anglogold Ashanti Holdings PLC, Sr. Note, 6.500%, 4/15/2040 | $16,320 |
| 62,000 | | Carpenter Technology Corp., Sr. Unsecd. Note, 4.450%, 3/1/2023 | 63,481 |
| 40,000 | | Carpenter Technology Corp., Sr. Unsecd. Note, 5.200%, 7/15/2021 | 40,937 |
| 20,000 | | Newcrest Finance Property Ltd., Sr. Unsecd. Note, 144A, 4.200%, 10/1/2022 | 20,804 |
| 100,000 | | Reliance Steel & Aluminum Co., Sr. Unsecd. Note, 4.500%, 4/15/2023 | 105,434 |
| 20,000 | | Southern Copper Corp., Sr. Unsecd. Note, 6.750%, 4/16/2040 | 25,675 |
| 160,000 | | Worthington Industries, Inc., Sr. Unsecd. Note, 6.500%, 4/15/2020 | 163,755 |
| | | TOTAL | 436,406 |
| | | Basic Industry - Paper—0.0% | |
| 10,000 | | Weyerhaeuser Co., Sr. Unsecd. Note, 3.250%, 3/15/2023 | 10,155 |
| 20,000 | | Weyerhaeuser Co., Sr. Unsecd. Note, 4.700%, 3/15/2021 | 20,562 |
| | | TOTAL | 30,717 |
| | | Capital Goods - Aerospace & Defense—0.2% | |
| 100,000 | | Arconic, Inc., 5.870%, 2/23/2022 | 107,009 |
| 11,000 | | Embraer Overseas Ltd., Sr. Unsecd. Note, 144A, 5.696%, 9/16/2023 | 12,100 |
| 20,000 | | Raytheon Co., Sr. Note, 4.400%, 2/15/2020 | 20,215 |
| 10,000 | | Rockwell Collins, Inc., Sr. Unsecd. Note, 3.100%, 11/15/2021 | 10,123 |
| 40,000 | 4 | Textron Financial Corp., Jr. Sub. Note, 144A, 4.253% (3-month USLIBOR +1.735%), 2/15/2042 | 31,015 |
| 50,000 | | Textron, Inc., Sr. Unsecd. Note, 4.000%, 3/15/2026 | 52,543 |
| 50,000 | | Textron, Inc., Sr. Unsecd. Note, 4.300%, 3/1/2024 | 52,864 |
| | | TOTAL | 285,869 |
| | | Capital Goods - Building Materials—0.2% | |
| 200,000 | | Allegion US Holdings Co., Inc., Sr. Unsecd. Note, 3.200%, 10/1/2024 | 202,816 |
| 80,000 | | Masco Corp., Sr. Unsecd. Note, 4.375%, 4/1/2026 | 84,899 |
| | | TOTAL | 287,715 |
| | | Capital Goods - Diversified Manufacturing—0.2% | |
| 15,000 | | Avery Dennison Corp., Sr. Unsecd. Note, 5.375%, 4/15/2020 | 15,237 |
| 30,000 | | General Electric Capital Corp., Sr. Unsecd. Note, Series GMTN, 3.100%, 1/9/2023 | 30,284 |
| 15,000 | | Thomas & Betts Corp., Sr. Unsecd. Note, 5.625%, 11/15/2021 | 16,024 |
| 200,000 | | Valmont Industries, Inc., 5.250%, 10/1/2054 | 202,358 |
| | | TOTAL | 263,903 |
| | | Capital Goods - Environmental—0.1% | |
| 85,000 | | Republic Services, Inc., Company Guarantee, 5.500%, 9/15/2019 | 85,300 |
| | | Capital Goods - Packaging—0.0% | |
| 45,000 | | Packaging Corp. of America, Sr. Unsecd. Note, 3.900%, 6/15/2022 | 46,470 |
Annual Shareholder Report
Shares or
Principal
Amount | | | Value |
| | | CORPORATE BONDS—continued | |
| | | Communications - Cable & Satellite—0.2% | |
| $200,000 | | CCO Safari II LLC, 4.908%, 7/23/2025 | $215,883 |
| 90,000 | | NBCUniversal, Inc., Sr. Unsecd. Note, 5.150%, 4/30/2020 | 91,885 |
| �� | | TOTAL | 307,768 |
| | | Communications - Media & Entertainment—0.2% | |
| 30,000 | | Grupo Televisa S.A., Sr. Unsecd. Note, 6.125%, 1/31/2046 | 35,201 |
| 25,000 | | Moody's Corp., Sr. Unsecd. Note, 5.500%, 9/1/2020 | 25,807 |
| 250,000 | | Omnicom Group, Inc., Sr. Unsecd. Note, 3.600%, 4/15/2026 | 258,540 |
| 20,000 | | Omnicom Group, Inc., Sr. Unsecd. Note, 3.625%, 5/1/2022 | 20,592 |
| | | TOTAL | 340,140 |
| | | Communications - Telecom Wireless—0.2% | |
| 150,000 | | Crown Castle International Corp., Sr. Unsecd. Note, 3.700%, 6/15/2026 | 156,889 |
| 200,000 | | Vodafone Group PLC, Sr. Unsecd. Note, 4.875%, 6/19/2049 | 215,404 |
| | | TOTAL | 372,293 |
| | | Communications - Telecom Wirelines—0.2% | |
| 150,000 | | Telefonica Emisiones SAU, Sr. Unsecd. Note, 5.520%, 3/1/2049 | 177,682 |
| 90,000 | | Verizon Communications, Inc., Sr. Unsecd. Note, 4.150%, 3/15/2024 | 96,596 |
| | | TOTAL | 274,278 |
| | | Consumer Cyclical - Automotive—0.4% | |
| 175,000 | | American Honda Finance Corp., Unsecd. Deb., Series MTN, 2.250%, 8/15/2019 | 174,982 |
| 10,000 | | DaimlerChrysler North America Holding Corp., Company Guarantee, 8.500%, 1/18/2031 | 14,841 |
| 100,000 | | Ford Motor Co., Sr. Unsecd. Note, 4.750%, 1/15/2043 | 86,595 |
| 200,000 | | Ford Motor Credit Co. LLC, Sr. Unsecd. Note, 3.336%, 3/18/2021 | 201,116 |
| 160,000 | | General Motors Financial Co., Inc., Sr. Unsecd. Note, 3.200%, 7/6/2021 | 161,366 |
| | | TOTAL | 638,900 |
| | | Consumer Cyclical - Leisure—0.1% | |
| 131,736 | | Football Trust V, Pass Thru Cert., 5.350%, 10/5/2020 | 136,100 |
| | | Consumer Cyclical - Lodging—0.0% | |
| 30,000 | | Hyatt Hotels Corp., Sr. Unsecd. Note, 3.375%, 7/15/2023 | 30,656 |
| | | Consumer Cyclical - Retailers—0.4% | |
| 50,000 | | Advance Auto Parts, Inc., 4.500%, 12/1/2023 | 53,347 |
| 40,000 | | AutoZone, Inc., Sr. Unsecd. Note, 3.125%, 4/21/2026 | 40,564 |
| 250,000 | | AutoZone, Inc., Sr. Unsecd. Note, 3.250%, 4/15/2025 | 256,156 |
| 175,000 | | CVS Health Corp., Sr. Unsecd. Note, 2.875%, 6/1/2026 | 173,604 |
| 10,000 | | O'Reilly Automotive, Inc., Company Guarantee, 4.875%, 1/14/2021 | 10,298 |
Annual Shareholder Report
Shares or
Principal
Amount | | | Value |
| | | CORPORATE BONDS—continued | |
| | | Consumer Cyclical - Retailers—continued | |
| $80,000 | | Under Armour, Inc., Sr. Unsecd. Note, 3.250%, 6/15/2026 | $77,441 |
| | | TOTAL | 611,410 |
| | | Consumer Cyclical - Services—0.3% | |
| 200,000 | | Alibaba Group Holding Ltd., Sr. Unsecd. Note, 2.800%, 6/6/2023 | 201,419 |
| 125,000 | | Amazon.com, Inc., Sr. Unsecd. Note, 3.800%, 12/5/2024 | 134,263 |
| 65,000 | | Expedia, Inc., Company Guarantee, 5.950%, 8/15/2020 | 67,295 |
| 10,000 | | University of Southern California, Sr. Unsecd. Note, 5.250%, 10/1/2111 | 13,779 |
| 70,000 | | Visa, Inc., Sr. Unsecd. Note, 3.150%, 12/14/2025 | 73,157 |
| | | TOTAL | 489,913 |
| | | Consumer Non-Cyclical - Food/Beverage—1.0% | |
| 300,000 | | Anheuser-Busch InBev Worldwide, Inc., Sr. Unsecd. Note, 5.550%, 1/23/2049 | 371,798 |
| 300,000 | | Danone SA, Sr. Unsecd. Note, 144A, 2.947%, 11/2/2026 | 302,404 |
| 140,000 | | Flowers Foods, Inc., Sr. Unsecd. Note, 3.500%, 10/1/2026 | 140,994 |
| 80,000 | | General Mills, Inc., Sr. Unsecd. Note, 4.700%, 4/17/2048 | 89,495 |
| 270,000 | | Heineken NV, Sr. Unsecd. Note, 144A, 3.500%, 1/29/2028 | 281,693 |
| 200,000 | | Kerry Group Financial Services, Sr. Unsecd. Note, 144A, 3.200%, 4/9/2023 | 202,239 |
| 60,000 | | McCormick & Co., Inc., Sr. Unsecd. Note, 3.400%, 8/15/2027 | 61,788 |
| 50,000 | | Mead Johnson Nutrition Co., Sr. Unsecd. Note, 4.125%, 11/15/2025 | 54,507 |
| | | TOTAL | 1,504,918 |
| | | Consumer Non-Cyclical - Health Care—0.0% | |
| 15,000 | | Agilent Technologies, Inc., Sr. Unsecd. Note, 3.200%, 10/1/2022 | 15,244 |
| 10,000 | | Laboratory Corp. of America Holdings, Sr. Unsecd. Note, 3.750%, 8/23/2022 | 10,326 |
| | | TOTAL | 25,570 |
| | | Consumer Non-Cyclical - Pharmaceuticals—0.1% | |
| 105,000 | | Eli Lilly & Co., Sr. Unsecd. Note, 3.950%, 3/15/2049 | 114,470 |
| | | Consumer Non-Cyclical - Products—0.1% | |
| 200,000 | | Newell Rubbermaid, Inc., Sr. Unsecd. Note, 4.200%, 4/1/2026 | 200,374 |
| | | Consumer Non-Cyclical - Supermarkets—0.2% | |
| 290,000 | | Kroger Co., Sr. Unsecd. Note, 5.400%, 1/15/2049 | 324,248 |
| | | Consumer Non-Cyclical - Tobacco—0.0% | |
| 24,000 | | Altria Group, Inc., 9.250%, 8/6/2019 | 24,018 |
| | | Energy - Independent—0.3% | |
| 250,000 | | Canadian Natural Resources Ltd., 3.900%, 2/1/2025 | 261,467 |
Annual Shareholder Report
Shares or
Principal
Amount | | | Value |
| | | CORPORATE BONDS—continued | |
| | | Energy - Independent—continued | |
| $125,000 | | Cimarex Energy Co., Sr. Unsecd. Note, 3.900%, 5/15/2027 | $127,106 |
| | | TOTAL | 388,573 |
| | | Energy - Integrated—0.5% | |
| 135,000 | | BP Capital Markets America, Inc., Sr. Unsecd. Note, 3.119%, 5/4/2026 | 138,961 |
| 300,000 | | BP Capital Markets America, Inc., Sr. Unsecd. Note, 3.937%, 9/21/2028 | 326,190 |
| 75,000 | | Husky Energy, Inc., 4.000%, 4/15/2024 | 78,917 |
| 240,000 | | Husky Energy, Inc., Sr. Unsecd. Note, 4.400%, 4/15/2029 | 252,502 |
| | | TOTAL | 796,570 |
| | | Energy - Midstream—0.9% | |
| 100,000 | | Energy Transfer Partners LP, Sr. Unsecd. Note, 4.050%, 3/15/2025 | 104,228 |
| 75,000 | | Energy Transfer Partners LP, Sr. Unsecd. Note, 4.900%, 2/1/2024 | 80,726 |
| 170,000 | | Enterprise Products Operating LLC, Sr. Unsecd. Note, 3.950%, 2/15/2027 | 181,753 |
| 270,000 | | Enterprise Products Operating LLC, Sr. Unsecd. Note, 4.200%, 1/31/2050 | 275,658 |
| 10,000 | | Florida Gas Transmission Co. LLC, Sr. Unsecd. Note, 144A, 5.450%, 7/15/2020 | 10,269 |
| 150,000 | | Kinder Morgan Energy Partners LP, Sr. Unsecd. Note, 5.000%, 3/1/2043 | 160,430 |
| 100,000 | | Kinder Morgan, Inc., 5.050%, 2/15/2046 | 109,350 |
| 40,000 | | MPLX LP, Sr. Unsecd. Note, 4.125%, 3/1/2027 | 41,713 |
| 225,000 | | MPLX LP, Sr. Unsecd. Note, 5.500%, 2/15/2049 | 251,353 |
| 195,000 | | ONEOK, Inc., Sr. Unsecd. Note, 4.950%, 7/13/2047 | 208,319 |
| 20,000 | | Texas Eastern Transmission LP, Sr. Unsecd. Note, 144A, 2.800%, 10/15/2022 | 19,955 |
| 30,000 | | Williams Partners LP, Sr. Unsecd. Note, 4.125%, 11/15/2020 | 30,488 |
| | | TOTAL | 1,474,242 |
| | | Energy - Oil Field Services—0.1% | |
| 15,000 | | Nabors Industries, Inc., Company Guarantee, 5.000%, 9/15/2020 | 15,188 |
| 20,000 | | Nabors Industries, Inc., Sr. Unsecd. Note, 4.625%, 9/15/2021 | 19,700 |
| 50,000 | | Nabors Industries, Inc., Sr. Unsecd. Note, 5.100%, 9/15/2023 | 45,250 |
| | | TOTAL | 80,138 |
| | | Energy - Refining—0.0% | |
| 10,000 | | Marathon Petroleum Corp., Sr. Unsecd. Note, 6.500%, 3/1/2041 | 12,540 |
| | | Financial Institution - Banking—2.4% | |
| 74,000 | | American Express Co., 2.650%, 12/2/2022 | 74,678 |
| 250,000 | | American Express Credit Corp., Sr. Unsecd. Note, Series MTN, 2.250%, 5/5/2021 | 250,035 |
Annual Shareholder Report
Shares or
Principal
Amount | | | Value |
| | | CORPORATE BONDS—continued | |
| | | Financial Institution - Banking—continued | |
| $300,000 | | Bank of America Corp., Sr. Unsecd. Note, Series GMTN, 3.500%, 4/19/2026 | $313,712 |
| 250,000 | 4 | Bank of America Corp., Sr. Unsecd. Note, Series MTN, 2.968% (3-month USLIBOR +0.650%), 10/1/2021 | 250,982 |
| 100,000 | | Bank of America Corp., Sr. Unsecd. Note, Series MTN, 5.000%, 5/13/2021 | 104,507 |
| 200,000 | | Bank of America Corp., Sub. Note, Series L, 3.950%, 4/21/2025 | 209,762 |
| 200,000 | | Citigroup, Inc., Sr. Unsecd. Note, 2.700%, 3/30/2021 | 201,082 |
| 250,000 | | Citigroup, Inc., Sr. Unsecd. Note, 3.300%, 4/27/2025 | 258,781 |
| 170,000 | | Citigroup, Inc., Sr. Unsecd. Note, 3.400%, 5/1/2026 | 176,175 |
| 25,000 | | City National Corp., Sr. Unsecd. Note, 5.250%, 9/15/2020 | 25,815 |
| 30,000 | | Comerica, Inc., 3.800%, 7/22/2026 | 31,492 |
| 75,000 | | Fifth Third Bancorp, Sr. Unsecd. Note, 3.650%, 1/25/2024 | 78,561 |
| 275,000 | | Goldman Sachs Group, Inc., Sr. Unsecd. Note, 3.625%, 1/22/2023 | 284,339 |
| 150,000 | | Goldman Sachs Group, Inc., Sr. Unsecd. Note, 6.250%, 2/1/2041 | 202,077 |
| 50,000 | | HSBC Holdings PLC, Sr. Unsecd. Note, 5.100%, 4/5/2021 | 52,206 |
| 400,000 | | JPMorgan Chase & Co., Sub. Note, 3.375%, 5/1/2023 | 410,624 |
| 300,000 | | Morgan Stanley, 4.300%, 1/27/2045 | 333,202 |
| 120,000 | | Morgan Stanley, Sr. Unsecd. Note, Series GMTN, 2.500%, 4/21/2021 | 120,287 |
| 210,000 | | Regions Financial Corp., Sr. Unsecd. Note, 3.200%, 2/8/2021 | 212,216 |
| 130,000 | | SunTrust Banks, Inc., Sr. Unsecd. Note, 2.900%, 3/3/2021 | 130,900 |
| | | TOTAL | 3,721,433 |
| | | Financial Institution - Broker/Asset Mgr/Exchange—0.2% | |
| 80,000 | | Invesco Finance PLC, Sr. Unsecd. Note, 3.750%, 1/15/2026 | 84,312 |
| 125,000 | | Jefferies Group LLC, Sr. Unsecd. Note, 6.875%, 4/15/2021 | 133,448 |
| 70,000 | | Nuveen LLC, Sr. Unsecd. Note, 144A, 4.000%, 11/1/2028 | 77,022 |
| 13,000 | | Raymond James Financial, Inc., Sr. Unsecd. Note, 5.625%, 4/1/2024 | 14,649 |
| | | TOTAL | 309,431 |
| | | Financial Institution - Finance Companies—0.6% | |
| 170,000 | | AerCap Ireland Capital Ltd./AerCap Global Aviation Trust, Sr. Unsecd. Note, 3.950%, 2/1/2022 | 174,425 |
| 150,000 | | AerCap Ireland Capital Ltd./AerCap Global Aviation Trust, Sr. Unsecd. Note, 4.875%, 1/16/2024 | 161,238 |
| 250,000 | | Discover Bank, Sr. Unsecd. Note, Series BKNT, 4.650%, 9/13/2028 | 275,724 |
| 250,000 | | GE Capital International Funding, Inc., Sr. Unsecd. Note, 4.418%, 11/15/2035 | 252,778 |
| | | TOTAL | 864,165 |
Annual Shareholder Report
Shares or
Principal
Amount | | | Value |
| | | CORPORATE BONDS—continued | |
| | | Financial Institution - Insurance - Life—0.7% | |
| $200,000 | | Aflac, Inc., Sr. Unsecd. Note, 3.625%, 6/15/2023 | $209,741 |
| 25,000 | | American International Group, Inc., 4.500%, 7/16/2044 | 26,804 |
| 35,000 | | American International Group, Inc., Sr. Unsecd. Note, 4.125%, 2/15/2024 | 37,244 |
| 125,000 | | American International Group, Inc., Sr. Unsecd. Note, 4.200%, 4/1/2028 | 134,266 |
| 10,000 | | Lincoln National Corp., Sr. Unsecd. Note, 4.200%, 3/15/2022 | 10,416 |
| 275,000 | | Mass Mutual Global Funding II, 144A, 2.000%, 4/15/2021 | 273,677 |
| 10,000 | | MetLife, Inc., Jr. Sub. Note, 10.750%, 8/1/2039 | 16,069 |
| 250,000 | | MetLife, Inc., Sr. Unsecd. Note, 3.600%, 4/10/2024 | 263,748 |
| 15,000 | | Penn Mutual Life Insurance Co., Sr. Note, 144A, 7.625%, 6/15/2040 | 21,373 |
| 10,000 | | Principal Financial Group, Inc., Sr. Unsecd. Note, 3.125%, 5/15/2023 | 10,211 |
| 10,000 | | Principal Financial Group, Inc., Sr. Unsecd. Note, 3.300%, 9/15/2022 | 10,172 |
| 50,000 | | Prudential Financial, Inc., Sr. Unsecd. Note, Series MTN, 6.200%, 11/15/2040 | 65,564 |
| | | TOTAL | 1,079,285 |
| | | Financial Institution - Insurance - P&C—0.1% | |
| 100,000 | | Liberty Mutual Group, Inc., 144A, 4.850%, 8/1/2044 | 112,255 |
| 65,000 | | Nationwide Mutual Insurance Co., Sub. Note, 144A, 9.375%, 8/15/2039 | 106,683 |
| | | TOTAL | 218,938 |
| | | Financial Institution - REIT - Apartment—0.1% | |
| 20,000 | | Post Apartment Homes LP, Sr. Unsecd. Note, 3.375%, 12/1/2022 | 20,455 |
| 10,000 | | UDR, Inc., Company Guarantee, Series 0001, 4.625%, 1/10/2022 | 10,435 |
| 70,000 | | UDR, Inc., Sr. Unsecd. Note, Series MTN, 2.950%, 9/1/2026 | 69,886 |
| | | TOTAL | 100,776 |
| | | Financial Institution - REIT - Healthcare—0.0% | |
| 50,000 | | Healthcare Trust of America, 3.700%, 4/15/2023 | 51,227 |
| | | Financial Institution - REIT - Office—0.1% | |
| 50,000 | | Alexandria Real Estate Equities, Inc., Sr. Unsecd. Note, 3.900%, 6/15/2023 | 52,548 |
| 70,000 | | Alexandria Real Estate Equities, Inc., Sr. Unsecd. Note, 3.950%, 1/15/2028 | 74,457 |
| | | TOTAL | 127,005 |
| | | Financial Institution - REIT - Other—0.1% | |
| 105,000 | | WP Carey, Inc., Sr. Unsecd. Note, 3.850%, 7/15/2029 | 106,988 |
| 75,000 | | WP Carey, Inc., Sr. Unsecd. Note, 4.600%, 4/1/2024 | 79,969 |
| | | TOTAL | 186,957 |
Annual Shareholder Report
Shares or
Principal
Amount | | | Value |
| | | CORPORATE BONDS—continued | |
| | | Financial Institution - REIT - Retail—0.0% | |
| $50,000 | | Kimco Realty Corp., Sr. Unsecd. Note, 3.400%, 11/1/2022 | $51,193 |
| | | Sovereign—0.0% | |
| 30,000 | | Corp Andina De Fomento, Sr. Unsecd. Note, 4.375%, 6/15/2022 | 31,585 |
| | | Technology—0.5% | |
| 30,000 | | Apple, Inc., Sr. Unsecd. Note, 2.400%, 5/3/2023 | 30,260 |
| 20,000 | | Corning, Inc., Unsecd. Note, 4.750%, 3/15/2042 | 22,496 |
| 240,000 | | Diamond 1 Finance Corp./Diamond 2 Finance Corp., Sr. Secd. Note, 144A, 6.020%, 6/15/2026 | 265,414 |
| 125,000 | | Equifax, Inc., Sr. Unsecd. Note, 2.300%, 6/1/2021 | 124,431 |
| 53,000 | | Fidelity National Information Services, Inc., Sr. Unsecd. Note, 3.500%, 4/15/2023 | 54,836 |
| 110,000 | | Fiserv, Inc., Sr. Unsecd. Note, 3.500%, 7/1/2029 | 113,049 |
| 70,000 | | Hewlett Packard Enterprise Co., Sr. Unsecd. Note, 3.600%, 10/15/2020 | 70,840 |
| 20,000 | | Ingram Micro, Inc., Sr. Unsecd. Note, 5.000%, 8/10/2022 | 20,406 |
| 50,000 | | Total System Services, Inc., Sr. Unsecd. Note, 4.800%, 4/1/2026 | 55,213 |
| 10,000 | | Verisk Analytics, Inc., Sr. Unsecd. Note, 4.125%, 9/12/2022 | 10,463 |
| 50,000 | | Verisk Analytics, Inc., Sr. Unsecd. Note, 5.500%, 6/15/2045 | 59,002 |
| | | TOTAL | 826,410 |
| | | Transportation - Railroads—0.2% | |
| 50,000 | | Burlington Northern Santa Fe Corp., Deb., 5.750%, 5/1/2040 | 66,088 |
| 30,000 | | Kansas City Southern Industries, Inc., Sr. Unsecd. Note, 3.000%, 5/15/2023 | 30,476 |
| 225,000 | | Kansas City Southern Industries, Inc., Sr. Unsecd. Note, 3.125%, 6/1/2026 | 225,737 |
| | | TOTAL | 322,301 |
| | | Transportation - Services—0.2% | |
| 70,000 | | Ryder System, Inc., Sr. Unsecd. Note, Series MTN, 2.800%, 3/1/2022 | 70,482 |
| 200,000 | | Ryder System, Inc., Sr. Unsecd. Note, Series MTN, 3.750%, 6/9/2023 | 208,629 |
| 30,000 | | United Parcel Service, Inc., Sr. Unsecd. Note, 3.125%, 1/15/2021 | 30,434 |
| | | TOTAL | 309,545 |
| | | Utility - Electric—1.6% | |
| 110,000 | | Duke Energy Corp., Sr. Unsecd. Note, 2.650%, 9/1/2026 | 109,119 |
| 70,000 | | Electricite de France SA, Note, 144A, 5.600%, 1/27/2040 | 85,677 |
| 300,000 | | Electricite de France SA, Sr. Unsecd. Note, 144A, 4.500%, 9/21/2028 | 331,072 |
| 140,000 | | Emera US Finance LP, Sr. Unsecd. Note, 4.750%, 6/15/2046 | 156,754 |
| 280,000 | | Enel Finance International NV, Sr. Unsecd. Note, 144A, 4.625%, 9/14/2025 | 301,444 |
| 170,000 | | EverSource Energy, Sr. Unsecd. Note, 3.350%, 3/15/2026 | 173,220 |
Annual Shareholder Report
Shares or
Principal
Amount | | | Value |
| | | CORPORATE BONDS—continued | |
| | | Utility - Electric—continued | |
| $200,000 | | Exelon Corp., Sr. Unsecd. Note, 3.400%, 4/15/2026 | $207,179 |
| 100,000 | | Exelon Generation Co. LLC, Sr. Unsecd. Note, 4.250%, 6/15/2022 | 104,399 |
| 10,000 | | Great Plains Energy, Inc., Note, 4.850%, 6/1/2021 | 10,329 |
| 300,000 | | Metropolitan Edison Co., Sr. Unsecd. Note, 144A, 4.300%, 1/15/2029 | 331,002 |
| 110,000 | | National Rural Utilities Cooperative Finance Corp., Sr. Sub. Note, 5.250%, 4/20/2046 | 115,464 |
| 25,000 | | National Rural Utilities Cooperative Finance Corp., Sr. Unsecd. Note, Series MTNC, 8.000%, 3/1/2032 | 36,849 |
| 50,000 | | NextEra Energy Capital Holdings, Inc., Sr. Unsecd. Note, 2.700%, 9/15/2019 | 50,004 |
| 250,000 | | PPL Capital Funding, Inc., Sr. Unsecd. Note, 3.100%, 5/15/2026 | 250,586 |
| 175,000 | | Southern Co., Sr. Unsecd. Note, 3.250%, 7/1/2026 | 178,764 |
| 10,000 | | TECO Finance, Inc., Company Guarantee, 5.150%, 3/15/2020 | 10,167 |
| 40,000 | | UIL Holdings Corp., Sr. Unsecd. Note, 4.625%, 10/1/2020 | 40,896 |
| | | TOTAL | 2,492,925 |
| | | Utility - Natural Gas—0.1% | |
| 50,000 | | Enbridge Energy Partners LP, Sr. Unsecd. Note, 4.200%, 9/15/2021 | 51,437 |
| 65,000 | | National Fuel Gas Co., Sr. Unsecd. Note, 3.750%, 3/1/2023 | 66,079 |
| | | TOTAL | 117,516 |
| | | TOTAL CORPORATE BONDS
(IDENTIFIED COST $19,341,446) | 20,449,696 |
| | | U.S. TREASURY—5.1% | |
| 108,045 | 5 | U.S. Treasury Inflation-Protected Notes, 0.125%, 4/15/2021 | 106,776 |
| 169,710 | | U.S. Treasury Inflation-Protected Notes, 0.125%, 1/15/2022 | 168,223 |
| 288,984 | | U.S. Treasury Inflation-Protected Notes, 0.750%, 2/15/2042 | 293,566 |
| 816,391 | | U.S. Treasury Inflation-Protected Notes, 0.875%, 1/15/2029 | 860,186 |
| 269,674 | | U.S. Treasury Inflation-Protected Notes, 1.000%, 2/15/2049 | 289,409 |
| 137,344 | | U.S. Treasury Inflation-Protected Notes, 1.375%, 2/15/2044 | 157,730 |
| 325,000 | | United States Treasury Bond, 2.875%, 5/15/2049 | 348,639 |
| 100,000 | | United States Treasury Bond, 3.000%, 2/15/2049 | 109,775 |
| 1,050,000 | | United States Treasury Note, 1.625%, 6/30/2021 | 1,044,964 |
| 625,000 | | United States Treasury Note, 1.750%, 6/30/2024 | 622,134 |
| 500,000 | | United States Treasury Note, 1.875%, 6/30/2026 | 498,750 |
| 350,000 | | United States Treasury Note, 2.125%, 5/31/2021 | 351,380 |
| 120,000 | | United States Treasury Note, 2.250%, 3/31/2021 | 120,626 |
| 200,000 | | United States Treasury Note, 2.250%, 4/30/2021 | 201,132 |
| 50,000 | | United States Treasury Note, 2.250%, 4/30/2024 | 50,905 |
| 425,000 | | United States Treasury Note, 2.375%, 4/30/2026 | 437,129 |
Annual Shareholder Report
Shares or
Principal
Amount | | | Value |
| | | U.S. TREASURY—continued | |
| $1,300,000 | | United States Treasury Note, 2.375%, 5/15/2029 | $1,340,828 |
| 110,000 | | United States Treasury Note, 2.500%, 1/31/2021 | 110,885 |
| 375,000 | | United States Treasury Note, 2.500%, 2/28/2021 | 378,286 |
| 400,000 | | United States Treasury Note, 2.625%, 2/15/2029 | 421,003 |
| | | TOTAL U.S. TREASURY
(IDENTIFIED COST $7,775,186) | 7,912,326 |
| | | EXCHANGE-TRADED FUNDS—8.0% | |
| 63,075 | | iShares Core MSCI Emerging Markets ETF | 3,165,104 |
| 144,400 | | iShares MSCI EAFE ETF | 9,306,580 |
| | | TOTAL EXCHANGE-TRADED FUNDS
(IDENTIFIED COST $13,153,451) | 12,471,684 |
| | | INVESTMENT COMPANIES—19.7% | |
| 278,303 | | Emerging Markets Core Fund | 2,783,030 |
| 135,857 | | Federated Bank Loan Core Fund | 1,340,910 |
| 145,972 | | Federated Government Obligations Fund, Premier Shares, 2.25%6 | 145,972 |
| 5,815,511 | | Federated Institutional Prime Value Obligations Fund, Institutional Shares, 2.39%6 | 5,817,256 |
| 1,314,242 | | Federated Mortgage Core Portfolio | 12,945,282 |
| 362,119 | | Federated Project and Trade Finance Core Fund | 3,266,314 |
| 691,626 | | High Yield Bond Portfolio | 4,350,324 |
| | | TOTAL INVESTMENT COMPANIES
(IDENTIFIED COST $31,118,910) | 30,649,088 |
| | | TOTAL INVESTMENT IN SECURITIES—100.1%
(IDENTIFIED COST $149,567,008)7 | 156,023,300 |
| | | OTHER ASSETS AND LIABILITIES - NET—(0.1)%8 | (88,123) |
| | | TOTAL NET ASSETS—100% | $155,935,177 |
Annual Shareholder Report
At July 31, 2019, the Fund had the following outstanding futures contracts:
| Description | Number of
Contracts | Notional
Value | Expiration
Date | Value and
Unrealized
Appreciation
(Depreciation) |
| 1United States Treasury Note 2-Year Long Futures | 80 | $17,152,500 | September 2019 | $44,155 |
| 1United States Treasury Note 5-Year Long Futures | 34 | $3,996,859 | September 2019 | $42,452 |
| 1United States Treasury Bond Long Futures | 3 | $466,781 | September 2019 | $13,774 |
| 1United States Treasury Bond Ultra Long Futures | 6 | $1,065,375 | September 2019 | $52,322 |
| 1United States Treasury Note 10-Year Short Futures | 6 | $764,531 | September 2019 | $(16,180) |
| 1United States Treasury Note 10-Year Ultra Short Futures | 32 | $4,411,000 | September 2019 | $(106,751) |
| NET UNREALIZED APPRECIATION ON FUTURES CONTRACTS | $29,772 |
Net Unrealized Appreciation on Futures Contracts is included in “Other Assets and Liabilities—Net.”
Annual Shareholder Report
[PAGE INTENTIONALLY LEFT BLANK]
Annual Shareholder Report
Affiliated fund holdings are investment companies which are managed by the Adviser or an affiliate of the Adviser. Transactions involving the affiliated fund holdings during the period ended July 31, 2019, were as follows:
| Affiliates | Balance of
Shares
Held
7/31/2018 | Purchases/
Additions | Sales/
Reductions |
| Emerging Markets Core Fund | 235,533 | 158,484 | (115,714) |
| Federated Bank Loan Core Fund | 218,141 | 118,335 | (200,619) |
| Federated Government Obligations Fund, Premier Shares* | 593,845 | 54,927,579 | (55,375,452) |
| Federated Institutional Prime Value Obligations Fund, Institutional Shares | 4,928,376 | 51,305,259 | (50,418,124) |
| Federated Mortgage Core Portfolio | 1,196,190 | 477,444 | (359,392) |
| Federated Project and Trade Finance Core Fund | 335,486 | 26,633 | — |
| High Yield Bond Portfolio | 482,388 | 425,238 | (216,000) |
| TOTAL OF AFFILIATED TRANSACTIONS | 7,989,959 | 107,438,972 | (106,685,301) |
Annual Shareholder Report
Balance of
Shares
Held
7/31/2019 | Value | Change in
Unrealized
Appreciation/
Depreciation | Net
Realized
Gain/(Loss) | Dividend
Income |
| 278,303 | $2,783,030 | $95,037 | $22,980 | $129,408 |
| 135,857 | $1,340,910 | $2,204 | $(70,775) | $89,787 |
| 145,972 | $145,972 | N/A | N/A | $23,028 |
| 5,815,511 | $5,817,256 | $(453) | $2,038 | $146,508 |
| 1,314,242 | $12,945,282 | $382,510 | $34,308 | $430,916 |
| 362,119 | $3,266,314 | $(27,896) | $— | $150,483 |
| 691,626 | $4,350,324 | $20,466 | $26,326 | $214,752 |
| 8,743,630 | $30,649,088 | $471,868 | $14,877 | $1,184,882 |
| * | All or a portion of the balance/activity for the fund relates to cash collateral received on securities lending transactions. |
| 1 | Non-income-producing security. |
| 2 | All or a portion of these securities are temporarily on loan to unaffiliated broker/dealers. |
| 3 | JPMorgan Chase & Co. has fully and unconditionally guaranteed Bear Stearns' outstanding registered debt securities. |
| 4 | Floating/variable note with current rate and current maturity or next reset date shown. |
| 5 | All or a portion of this security is pledged as collateral to ensure the Fund is able to satisfy the obligations of its outstanding futures contracts. |
| 6 | 7-day net yield. |
| 7 | The cost of investments for federal tax purposes amounts to $149,508,737. |
| 8 | Assets, other than investments in securities, less liabilities. See Statement of Assets and Liabilities. |
Note: The categories of investments are shown as a percentage of total net assets at July 31, 2019.
Various inputs are used in determining the value of the Fund's investments. These inputs are summarized in the three broad levels listed below:
Level 1—quoted prices in active markets for identical securities.
Level 2—other significant observable inputs (including quoted prices for similar securities, interest rates, prepayment speeds, credit risk, etc.). Also includes securities valued at amortized cost.
Level 3—significant unobservable inputs (including the Fund's own assumptions in determining the fair value of investments).
The inputs or methodology used for valuing securities are not an indication of the risk associated with investing in those securities.
Annual Shareholder Report
The following is a summary of the inputs used, as of July 31, 2019, in valuing the Fund's assets carried at fair value:
| Valuation Inputs | | | | |
| | Level 1—
Quoted
Prices | Level 2—
Other
Significant
Observable
Inputs | Level 3—
Significant
Unobservable
Inputs | Total |
| Equity Securities: | | | | |
| Common Stocks | | | | |
| Domestic | $78,329,963 | $— | $— | $78,329,963 |
| International | 2,881,656 | — | — | 2,881,656 |
| Debt Securities: | | | | |
| Asset-Backed Securities | — | 181,324 | — | 181,324 |
| Collateralized Mortgage Obligations | — | 11,652 | — | 11,652 |
| Commercial Mortgage-Backed Securities | — | 3,135,911 | — | 3,135,911 |
| Corporate Bonds | — | 20,449,696 | — | 20,449,696 |
| U.S. Treasury | — | 7,912,326 | — | 7,912,326 |
| Exchange-Traded Funds | 12,471,684 | — | — | 12,471,684 |
| Investment Companies1 | 27,382,774 | — | — | 30,649,088 |
| TOTAL SECURITIES | $121,066,077 | $31,690,909 | $— | $156,023,300 |
| Other Financial Instruments2 | | | | |
| Assets | $152,703 | $— | $— | $152,703 |
| Liabilities | (122,931) | — | — | (122,931) |
| TOTAL OTHER FINANCIAL INSTRUMENTS | $29,772 | $— | $— | $29,772 |
| 1 | As permitted by U.S. generally accepted accounting principles (GAAP), the Investment Company valued at $3,266,314 is measured at fair value using the net asset value (NAV) per share practical expedient and has not been categorized in the chart above but is included in the Total column. The amount included herein is intended to permit reconciliation of the fair value classifications to the amounts presented on the Statement of Assets and Liabilities. The price of shares redeemed of Federated Project and Trade Finance Core Fund may be determined as of the closing NAV of the fund up to twenty-four days after receipt of a shareholder redemption request. |
| 2 | Other financial instruments are futures contracts. |
The following acronyms are used throughout this portfolio:
| BKNT | —Bank Notes |
| ETF | —Exchange-Traded Fund |
| FREMF | —Freddie Mac Multifamily K-Deals |
| GMTN | —Global Medium Term Note |
| LIBOR | —London Interbank Offered Rate |
| MTN | —Medium Term Note |
| REIT | —Real Estate Investment Trust |
| REMIC | —Real Estate Mortgage Investment Conduit |
See Notes which are an integral part of the Financial Statements
Annual Shareholder Report
Financial Highlights–Class A Shares
(For a Share Outstanding Throughout Each Period)
| Year Ended July 31 | 2019 | 2018 | 2017 | 2016 | 2015 |
| Net Asset Value, Beginning of Period | $19.59 | $17.74 | $16.52 | $16.83 | $16.07 |
| Income From Investment Operations: | | | | | |
| Net investment income1 | 0.25 | 0.21 | 0.26 | 0.24 | 0.20 |
| Net realized and unrealized gain (loss) | 0.57 | 1.89 | 1.23 | (0.31) | 0.74 |
| TOTAL FROM INVESTMENT OPERATIONS | 0.82 | 2.10 | 1.49 | (0.07) | 0.94 |
| Less Distributions: | | | | | |
| Distributions from net investment income | (0.19) | (0.25) | (0.27) | (0.24) | (0.18) |
| Distributions from net realized gain | (1.51) | — | — | — | — |
| TOTAL DISTRIBUTIONS | (1.70) | (0.25) | (0.27) | (0.24) | (0.18) |
| Net Asset Value, End of Period | $18.71 | $19.59 | $17.74 | $16.52 | $16.83 |
| Total Return2 | 5.28% | 11.91% | 9.11% | (0.37)% | 5.89% |
| Ratios to Average Net Assets: | | | | | |
| Net expenses | 1.31% | 1.32% | 1.26% | 1.30% | 1.30% |
| Net investment income | 1.35% | 1.11% | 1.51% | 1.51% | 1.21% |
| Expense waiver/reimbursement3 | 0.08% | 0.06% | 0.15% | 0.10% | 0.09% |
| Supplemental Data: | | | | | |
| Net assets, end of period (000 omitted) | $84,243 | $61,553 | $61,405 | $61,245 | $62,555 |
| Portfolio turnover | 92% | 89% | 82% | 98% | 89% |
| 1 | Per share numbers have been calculated using the average shares method. |
| 2 | Based on net asset value, which does not reflect the sales charge, redemption fee or contingent deferred sales charge, if applicable. |
| 3 | This expense decrease is reflected in both the net expense and the net investment income ratios shown above. |
See Notes which are an integral part of the Financial Statements
Annual Shareholder Report
Financial Highlights–Class C Shares
(For a Share Outstanding Throughout Each Period)
| Year Ended July 31 | 2019 | 2018 | 2017 | 2016 | 2015 |
| Net Asset Value, Beginning of Period | $19.31 | $17.49 | $16.30 | $16.59 | $15.84 |
| Income From Investment Operations: | | | | | |
| Net investment income1 | 0.11 | 0.06 | 0.13 | 0.12 | 0.07 |
| Net realized and unrealized gain (loss) | 0.59 | 1.87 | 1.20 | (0.31) | 0.74 |
| TOTAL FROM INVESTMENT OPERATIONS | 0.70 | 1.93 | 1.33 | (0.19) | 0.81 |
| Less Distributions: | | | | | |
| Distributions from net investment income | (0.00)2 | (0.11) | (0.14) | (0.10) | (0.06) |
| Distributions from net realized gain | (1.51) | — | — | — | — |
| TOTAL DISTRIBUTIONS | (1.51) | (0.11) | (0.14) | (0.10) | (0.06) |
| Net Asset Value, End of Period | $18.50 | $19.31 | $17.49 | $16.30 | $16.59 |
| Total Return3 | 4.54% | 11.09% | 8.23% | (1.10)% | 5.12% |
| Ratios to Average Net Assets: | | | | | |
| Net expenses | 2.06% | 2.07% | 2.01% | 2.05% | 2.05% |
| Net investment income | 0.60% | 0.35% | 0.75% | 0.76% | 0.45% |
| Expense waiver/reimbursement4 | 0.10% | 0.04% | 0.13% | 0.08% | 0.06% |
| Supplemental Data: | | | | | |
| Net assets, end of period (000 omitted) | $15,492 | $27,577 | $29,007 | $29,152 | $31,571 |
| Portfolio turnover | 92% | 89% | 82% | 98% | 89% |
| 1 | Per share numbers have been calculated using the average shares method. |
| 2 | Represents less than $0.01. |
| 3 | Based on net asset value, which does not reflect the sales charge, redemption fee or contingent deferred sales charge, if applicable. |
| 4 | This expense decrease is reflected in both the net expense and the net investment income ratios shown above. |
See Notes which are an integral part of the Financial Statements
Annual Shareholder Report
Financial Highlights–Institutional Shares
(For a Share Outstanding Throughout Each Period)
| Year Ended July 31 | 2019 | 2018 | 2017 | 2016 | 2015 |
| Net Asset Value, Beginning of Period | $19.64 | $17.79 | $16.57 | $16.87 | $16.11 |
| Income From Investment Operations: | | | | | |
| Net investment income1 | 0.30 | 0.26 | 0.30 | 0.28 | 0.24 |
| Net realized and unrealized gain (loss) | 0.58 | 1.89 | 1.23 | (0.30) | 0.74 |
| TOTAL FROM INVESTMENT OPERATIONS | 0.88 | 2.15 | 1.53 | (0.02) | 0.98 |
| Less Distributions: | | | | | |
| Distributions from net investment income | (0.23) | (0.30) | (0.31) | (0.28) | (0.22) |
| Distributions from net realized gain | (1.51) | — | — | — | — |
| TOTAL DISTRIBUTIONS | (1.74) | (0.30) | (0.31) | (0.28) | (0.22) |
| Net Asset Value, End of Period | $18.78 | $19.64 | $17.79 | $16.57 | $16.87 |
| Total Return2 | 5.61% | 12.15% | 9.36% | (0.07)% | 6.13% |
| Ratios to Average Net Assets: | | | | | |
| Net expenses | 1.06% | 1.07% | 1.00% | 1.05% | 1.05% |
| Net investment income | 1.62% | 1.35% | 1.77% | 1.76% | 1.46% |
| Expense waiver/reimbursement3 | 0.08% | 0.02% | 0.12% | 0.05% | 0.04% |
| Supplemental Data: | | | | | |
| Net assets, end of period (000 omitted) | $53,035 | $54,358 | $39,136 | $47,757 | $53,291 |
| Portfolio turnover | 92% | 89% | 82% | 98% | 89% |
| 1 | Per share numbers have been calculated using the average shares method. |
| 2 | Based on net asset value. |
| 3 | This expense decrease is reflected in both the net expense and the net investment income ratios shown above. |
See Notes which are an integral part of the Financial Statements
Annual Shareholder Report
Financial Highlights–Class R6 Shares
(For a Share Outstanding Throughout Each Period)
| Year Ended July 31 | 2019 | 2018 | 20171 | 2016 | 2015 |
| Net Asset Value, Beginning of Period | $19.62 | $17.76 | $16.49 | $16.80 | $16.05 |
| Income From Investment Operations: | | | | | |
| Net investment income2 | 0.27 | 0.26 | 0.28 | 0.20 | 0.16 |
| Net realized and unrealized gain (loss) | 0.60 | 1.90 | 1.24 | (0.31) | 0.74 |
| TOTAL FROM INVESTMENT OPERATIONS | 0.87 | 2.16 | 1.52 | (0.11) | 0.90 |
| Less Distributions: | | | | | |
| Distributions from net investment income | (0.24) | (0.30) | (0.25) | (0.20) | (0.15) |
| Distributions from net realized gain | (1.51) | — | — | — | — |
| TOTAL DISTRIBUTIONS | (1.75) | (0.30) | (0.25) | (0.20) | (0.15) |
| Net Asset Value, End of Period | $18.74 | $19.62 | $17.76 | $16.49 | $16.80 |
| Total Return3 | 5.56% | 12.24% | 9.32% | (0.59)% | 5.61% |
| Ratios to Average Net Assets: | | | | | |
| Net expenses | 1.05% | 1.06% | 1.05% | 1.56% | 1.56% |
| Net investment income | 1.40% | 1.36% | 1.64% | 1.27% | 0.96% |
| Expense waiver/reimbursement4 | 0.06% | 0.02% | 0.06% | 0.04% | 0.03% |
| Supplemental Data: | | | | | |
| Net assets, end of period (000 omitted) | $3,165 | $12,178 | $10,439 | $577 | $532 |
| Portfolio turnover | 92% | 89% | 82% | 98% | 89% |
| 1 | Effective September 1, 2016, the Fund's Class R Shares were redesignated as Class R6 Shares. |
| 2 | Per share numbers have been calculated using the average shares method. |
| 3 | Based on net asset value. |
| 4 | This expense decrease is reflected in both the net expense and the net investment income ratios shown above. |
See Notes which are an integral part of the Financial Statements
Annual Shareholder Report
Statement of Assets and Liabilities
July 31, 2019
| Assets: | | |
| Investment in securities, at value including $142,196 of securities loaned and $30,649,088 of investment in affiliated holdings (identified cost $149,567,008) | | $156,023,300 |
| Income receivable | | 276,593 |
| Income receivable from affiliated holdings | | 115,225 |
| Receivable for investments sold | | 386,511 |
| Receivable for shares sold | | 189,668 |
| TOTAL ASSETS | | 156,991,297 |
| Liabilities: | | |
| Payable for investments purchased | $548,281 | |
| Payable for shares redeemed | 147,756 | |
| Payable to bank | 3,212 | |
| Payable for daily variation margin on futures contracts | 16,647 | |
| Payable for collateral due to broker for securities lending | 145,972 | |
| Payable for investment adviser fee (Note 5) | 3,207 | |
| Payable for administrative fees (Note 5) | 340 | |
| Payable for auditing fees | 33,600 | |
| Payable for portfolio accounting fees | 24,769 | |
| Payable for distribution services fee (Note 5) | 9,870 | |
| Payable for other service fees (Notes 2 and 5) | 43,920 | |
| Payable for share registration costs | 45,397 | |
| Accrued expenses (Note 5) | 33,149 | |
| TOTAL LIABILITIES | | 1,056,120 |
| Net assets for 8,332,557 shares outstanding | | $155,935,177 |
| Net Assets Consist of: | | |
| Paid-in capital | | $146,256,341 |
| Total distributable earnings (loss) | | 9,678,836 |
| TOTAL NET ASSETS | | $155,935,177 |
Annual Shareholder Report
Statement of Assets and Liabilities–continued
| Net Asset Value, Offering Price and Redemption Proceeds Per Share | | |
| Class A Shares: | | |
| Net asset value per share ($84,243,158 ÷ 4,501,881 shares outstanding), no par value, unlimited shares authorized | | $18.71 |
| Offering price per share (100/94.50 of $18.71) | | $19.80 |
| Redemption proceeds per share | | $18.71 |
| Class C Shares: | | |
| Net asset value per share ($15,492,108 ÷ 837,483 shares outstanding), no par value, unlimited shares authorized | | $18.50 |
| Offering price per share | | $18.50 |
| Redemption proceeds per share (99.00/100 of $18.50) | | $18.32 |
| Institutional Shares: | | |
| Net asset value per share ($53,034,745 ÷ 2,824,249 shares outstanding), no par value, unlimited shares authorized | | $18.78 |
| Offering price per share | | $18.78 |
| Redemption proceeds per share | | $18.78 |
| Class R6 Shares: | | |
| Net asset value per share ($3,165,166 ÷ 168,944 shares outstanding), no par value, unlimited shares authorized | | $18.74 |
| Offering price per share | | $18.74 |
| Redemption proceeds per share | | $18.74 |
See Notes which are an integral part of the Financial Statements
Annual Shareholder Report
Statement of Operations
Year Ended July 31, 2019
| Investment Income: | | | |
| Dividends (including $1,161,854 received from affiliated holdings* and net of foreign taxes withheld of $819) | | | $3,081,354 |
| Interest | | | 1,028,528 |
| Net income on securities loaned (includes $23,028 earned from affiliated holdings related to cash collateral balances*) (Note 2) | | | 4,812 |
| TOTAL INCOME | | | 4,114,694 |
| Expenses: | | | |
| Investment adviser fee (Note 5) | | $1,158,772 | |
| Administrative fee (Note 5) | | 123,229 | |
| Custodian fees | | 69,610 | |
| Transfer agent fee (Note 2) | | 144,532 | |
| Directors'/Trustees' fees (Note 5) | | 2,696 | |
| Auditing fees | | 33,600 | |
| Legal fees | | 11,915 | |
| Portfolio accounting fees | | 98,620 | |
| Distribution services fee (Note 5) | | 109,260 | |
| Other service fees (Notes 2 and 5) | | 218,432 | |
| Share registration costs | | 73,542 | |
| Printing and postage | | 29,874 | |
| Miscellaneous (Note 5) | | 37,035 | |
| TOTAL EXPENSES | | 2,111,117 | |
| Waiver and Reimbursements: | | | |
| Waiver/reimbursement of investment adviser fee (Note 5) | $(83,964) | | |
| Reimbursement of other operating expenses (Notes 2 and 5) | (45,535) | | |
| TOTAL WAIVER AND REIMBURSEMENTS | | (129,499) | |
| Net expenses | | | 1,981,618 |
| Net investment income | | | $2,133,076 |
Annual Shareholder Report
Statement of Operations–continued
| Realized and Unrealized Gain (Loss) on Investments, Futures Contracts and Foreign Currency Transactions: | | | |
| Net realized gain on investments (including net realized gain of $14,877 on sales of investments in affiliated holdings*) | | | $7,465,825 |
| Net realized gain on foreign currency transactions | | | 77,056 |
| Net realized loss on futures contracts | | | (17,027) |
| Net change in unrealized appreciation of investments (including net change in unrealized depreciation of $471,868 on investments in affiliated holdings*) | | | (1,868,378) |
| Net change in unrealized appreciation of futures contracts | | | 8,853 |
| Net realized and unrealized gain (loss) on investments, futures contracts and foreign currency transactions | | | 5,666,329 |
| Change in net assets resulting from operations | | | $7,799,405 |
| * | See information listed after the Fund's Portfolio of Investments. |
See Notes which are an integral part of the Financial Statements
Annual Shareholder Report
Statement of Changes in Net Assets
| Year Ended July 31 | 2019 | 2018 |
| Increase (Decrease) in Net Assets | | |
| Operations: | | |
| Net investment income | $2,133,076 | $1,482,124 |
| Net realized gain | 7,525,854 | 10,643,426 |
| Net change in unrealized appreciation/depreciation | (1,859,525) | 3,826,927 |
| CHANGE IN NET ASSETS RESULTING FROM OPERATIONS | 7,799,405 | 15,952,477 |
| Distributions to Shareholders (Note 2): | | |
| Class A Shares | (6,723,192) | (820,337) |
| Class C Shares | (1,044,348) | (182,113) |
| Institutional Shares | (5,847,283) | (590,928) |
| Class R6 Shares | (242,234) | (175,714) |
| CHANGE IN NET ASSETS RESULTING FROM DISTRIBUTIONS TO SHAREHOLDERS | (13,857,057) | (1,769,092) |
| Share Transactions: | | |
| Proceeds from sale of shares | 63,670,084 | 34,844,213 |
| Net asset value of shares issued to shareholders in payment of distributions declared | 12,933,369 | 1,616,876 |
| Cost of shares redeemed | (70,276,399) | (34,966,647) |
| CHANGE IN NET ASSETS RESULTING FROM SHARE TRANSACTIONS | 6,327,054 | 1,494,442 |
| Change in net assets | 269,402 | 15,677,827 |
| Net Assets: | | |
| Beginning of period | 155,665,775 | 139,987,948 |
| End of period | $155,935,177 | $155,665,775 |
See Notes which are an integral part of the Financial Statements
Annual Shareholder Report
Notes to Financial Statements
July 31, 2019
1. ORGANIZATION
Federated MDT Series (the “Trust”) is registered under the Investment Company Act of 1940, as amended (the “Act”), as an open-end management investment company. The Trust consists of five portfolios. The financial statements included herein are only those of Federated MDT Balanced Fund (the “Fund”), a diversified portfolio. The financial statements of the other portfolios are presented separately. The assets of each portfolio are segregated and a shareholder's interest is limited to the portfolio in which shares are held. Each portfolio pays its own expenses. The Fund offers four classes of shares: Class A Shares, Class C Shares, Institutional Shares and Class R6 Shares. All shares of the Fund have equal rights with respect to voting, except on class-specific matters. The investment objective of the Fund is the possibility of long-term growth of capital and income.
On March 30, 2017, the Fund's T Share Class became effective with the Securities and Exchange Commission (SEC), but is not yet offered for sale.
Effective August 1, 2018, an automatic conversion feature for Class C Shares was implemented. Pursuant to this automatic conversion feature, after Class C Shares have been held for ten years from the date of purchase, they will automatically convert to Class A Shares on the next monthly conversion processing date.
2. SIGNIFICANT ACCOUNTING POLICIES
The following is a summary of significant accounting policies consistently followed by the Fund in the preparation of its financial statements. These policies are in conformity with GAAP.
Investment Valuation
In calculating its NAV, the Fund generally values investments as follows:
| ■ | Equity securities listed on an exchange or traded through a regulated market system are valued at their last reported sale price or official closing price in their principal exchange or market. |
| ■ | Fixed-income securities are fair valued using price evaluations provided by a pricing service approved by the Fund's Board of Trustees (the “Trustees”). |
| ■ | Shares of other mutual funds or non-exchange-traded investment companies are valued based upon their reported NAVs. |
| ■ | Derivative contracts listed on exchanges are valued at their reported settlement or closing price, except that options are valued at the mean of closing bid and asked quotations. |
| ■ | Over-the-counter (OTC) derivative contracts are fair valued using price evaluations provided by a pricing service approved by the Trustees. |
| ■ | For securities that are fair valued in accordance with procedures established by and under the general supervision of the Trustees, certain factors may be considered, such as: the last traded or purchase price of the security, information obtained by contacting the issuer or dealers, analysis of the issuer's financial statements or other available documents, fundamental analytical data, the nature and duration of restrictions on disposition, the movement of the market in which the security is normally traded, public trading in similar securities or derivative contracts of the issuer or comparable issuers, movement of a relevant index, or other factors including but not limited to industry changes and relevant government actions. |
Annual Shareholder Report
If any price, quotation, price evaluation or other pricing source is not readily available when the NAV is calculated, if the Fund cannot obtain price evaluations from a pricing service or from more than one dealer for an investment within a reasonable period of time as set forth in the Fund's valuation policies and procedures, or if information furnished by a pricing service, in the opinion of the valuation committee (“Valuation Committee”), is deemed not representative of the fair value of such security, the Fund uses the fair value of the investment determined in accordance with the procedures described below. There can be no assurance that the Fund could obtain the fair value assigned to an investment if it sold the investment at approximately the time at which the Fund determines its NAV per share.
Fair Valuation and Significant Events Procedures
The Trustees have ultimate responsibility for determining the fair value of investments for which market quotations are not readily available. The Trustees have appointed a Valuation Committee comprised of officers of the Fund, Federated MDTA LLC (the “Adviser”) and certain of the Adviser's affiliated companies to assist in determining fair value and in overseeing the calculation of the NAV. The Trustees have also authorized the use of pricing services recommended by the Valuation Committee to provide fair value evaluations of the current value of certain investments for purposes of calculating the NAV. The Valuation Committee employs various methods for reviewing third-party pricing-service evaluations including periodic reviews of third-party pricing services' policies, procedures and valuation methods (including key inputs, methods, models and assumptions), transactional back-testing, comparisons of evaluations of different pricing services, and review of price challenges by the Adviser based on recent market activity. In the event that market quotations and price evaluations are not available for an investment, the Valuation Committee determines the fair value of the investment in accordance with procedures adopted by the Trustees. The Trustees periodically review and approve the fair valuations made by the Valuation Committee and any changes made to the procedures.
Factors considered by pricing services in evaluating an investment include the yields or prices of investments of comparable quality, coupon, maturity, call rights and other potential prepayments, terms and type, reported transactions, indications as to values from dealers and general market conditions. Some pricing services provide a single price evaluation reflecting the bid-side of the market for an investment (a “bid” evaluation). Other pricing services offer both bid evaluations and price evaluations indicative of a price between the prices bid and asked for the investment (a “mid” evaluation). The Fund normally uses bid evaluations for any U.S. Treasury and Agency securities, mortgage-backed securities and municipal securities. The Fund normally uses mid evaluations for any other types of fixed-income securities and any OTC derivative contracts. In the event that market quotations and price evaluations are not available for an investment, the fair value of the investment is determined in accordance with procedures adopted by the Trustees.
The Trustees also have adopted procedures requiring an investment to be priced at its fair value whenever the Adviser determines that a significant event affecting the value of the investment has occurred between the time as of which the price of the investment would otherwise be determined and the time as of which the NAV is computed. An event is considered significant if there is both an affirmative expectation that the investment's value will change in response to the event and a reasonable basis for quantifying the resulting change in value. Examples of significant events that may occur after the close of the principal market on which a security is traded, or after the time of a price evaluation provided by a pricing service or a dealer, include:
| ■ | With respect to securities traded principally in foreign markets, significant trends in U.S. equity markets or in the trading of foreign securities index futures contracts; |
Annual Shareholder Report
| ■ | Political or other developments affecting the economy or markets in which an issuer conducts its operations or its securities are traded; |
| ■ | Announcements concerning matters such as acquisitions, recapitalizations, litigation developments, or a natural disaster affecting the issuer's operations or regulatory changes or market developments affecting the issuer's industry. |
The Trustees have adopted procedures whereby the Valuation Committee uses a pricing service to provide factors to update the fair value of equity securities traded principally in foreign markets from the time of the close of their respective foreign stock exchanges to the pricing time of the Fund. For other significant events, the Fund may seek to obtain more current quotations or price evaluations from alternative pricing sources. If a reliable alternative pricing source is not available, the Fund will determine the fair value of the investment in accordance with the fair valuation procedures approved by the Trustees. The Trustees have ultimate responsibility for any fair valuations made in response to a significant event.
Repurchase Agreements
The Fund may invest in repurchase agreements for short-term liquidity purposes. It is the policy of the Fund to require the other party to a repurchase agreement to transfer to the Fund's custodian or sub-custodian eligible securities or cash with a market value (after transaction costs) at least equal to the repurchase price to be paid under the repurchase agreement. The eligible securities are transferred to accounts with the custodian or sub-custodian in which the Fund holds a “securities entitlement” and exercises “control” as those terms are defined in the Uniform Commercial Code. The Fund has established procedures for monitoring the market value of the transferred securities and requiring the transfer of additional eligible securities if necessary to equal at least the repurchase price. These procedures also allow the other party to require securities to be transferred from the account to the extent that their market value exceeds the repurchase price or in exchange for other eligible securities of equivalent market value.
The insolvency of the other party or other failure to repurchase the securities may delay the disposition of the underlying securities or cause the Fund to receive less than the full repurchase price. Under the terms of the repurchase agreement, any amounts received by the Fund in excess of the repurchase price and related transaction costs must be remitted to the other party.
The Fund may enter into repurchase agreements in which eligible securities are transferred into joint trading accounts maintained by the custodian or sub-custodian for investment companies and other clients advised by the Fund's Adviser and its affiliates. The Fund will participate on a pro rata basis with the other investment companies and clients in its share of the securities transferred under such repurchase agreements and in its share of proceeds from any repurchase or other disposition of such securities.
Investment Income, Gains and Losses, Expenses and Distributions
Investment transactions are accounted for on a trade-date basis. Realized gains and losses from investment transactions are recorded on an identified-cost basis. Interest income and expenses are accrued daily. Dividend income and distributions to shareholders are recorded on the ex-dividend date. Foreign dividends are recorded on the ex-dividend date or when the Fund is informed of the ex-dividend date. Amortization/accretion of premium and discount is included in investment income. Gains and losses realized on principal payment of mortgage-backed securities (paydown gains and losses) are classified as part of investment income. Positive or negative inflation adjustments on Treasury Inflation-Protected Securities are included in interest income. Distributions of net investment income, if any, are declared and paid annually. Non-cash dividends included in dividend income, if any, are recorded at fair value.
Annual Shareholder Report
Investment income, realized and unrealized gains and losses, and certain fund-level expenses are allocated to each class based on relative average daily net assets, except that select classes will bear certain expenses unique to those classes. The detail of the total fund expense waiver and reimbursements of $129,499 is disclosed in various locations in this Note 2 and Note 5. For the year ended July 31, 2019, transfer agent fees for the Fund were as follows:
| | Transfer Agent
Fees Incurred | Transfer Agent
Fees Reimbursed |
| Class A Shares | $78,927 | $(23,571) |
| Class C Shares | 14,958 | (6,091) |
| Institutional Shares | 48,269 | (15,873) |
| Class R6 Shares | 2,378 | — |
| TOTAL | $144,532 | $(45,535) |
Dividends are declared separately for each class. No class has preferential dividend rights; differences in per share dividend rates are generally due to differences in separate class expenses. All distributions as indicated on the Statement of Changes in Net Assets for the year ended July 31, 2018, were from net investment income. Undistributed net investment income at July 31, 2018, was $771,690.
Other Service Fees
The Fund may pay other service fees up to 0.25% of the average daily net assets of the Fund's Class A Shares and Class C Shares to unaffiliated financial intermediaries or to Federated Shareholder Services Company (FSSC) for providing services to shareholders and maintaining shareholder accounts. Subject to the terms described in the Expense Limitation note, FSSC may voluntarily reimburse the Fund for other service fees. For the year ended July 31, 2019, other service fees for the Fund were as follows:
| | Other Service
Fees Incurred |
| Class A Shares | $182,618 |
| Class C Shares | 35,814 |
| TOTAL | $218,432 |
Federal Taxes
It is the Fund's policy to comply with the Subchapter M provision of the Internal Revenue Code (the “Code”) and to distribute to shareholders each year substantially all of its income. Accordingly, no provision for federal income tax is necessary. As of and during the year ended July 31, 2019, the Fund did not have a liability for any uncertain tax positions. The Fund recognizes interest and penalties, if any, related to tax liabilities as income tax expense in the Statement of Operations. As of July 31, 2019, tax years 2016 through 2019 remain subject to examination by the Fund's major tax jurisdictions, which include the United States of America and the Commonwealth of Massachusetts.
The Fund may be subject to taxes imposed by governments of countries in which it invests. Such taxes are generally based on either income or gains earned or repatriated. The Fund accrues and applies such taxes to net investment income, net realized gains and net unrealized gains as income and/or gains are earned.
Annual Shareholder Report
When-Issued and Delayed-Delivery Transactions
The Fund may engage in when-issued or delayed-delivery transactions. The Fund records when-issued securities on the trade date and maintains security positions such that sufficient liquid assets will be available to make payment for the securities purchased. Securities purchased on a when-issued or delayed-delivery basis are marked to market daily and begin earning interest on the settlement date. Losses may occur on these transactions due to changes in market conditions or the failure of counterparties to perform under the contract.
Futures Contracts
The Fund purchases and sells financial futures contracts to manage duration and yield curve risks. Upon entering into a financial futures contract with a broker, the Fund is required to deposit in a segregated account, either U.S. government securities or a specified amount of Restricted cash, which is shown in the Statement of Assets and Liabilities. Futures contracts are valued daily and unrealized gains or losses are recorded in a “variation margin” account. Daily, the Fund receives from or pays to the broker a specified amount of cash based upon changes in the variation margin account. When a contract is closed, the Fund recognizes a realized gain or loss. Futures contracts have market risks, including the risk that the change in the value of the contract may not correlate with the changes in the value of the underlying securities. There is minimal counterparty risk to the Fund since futures contracts are exchange traded and the exchange's clearinghouse, as counterparty to all exchange traded futures contracts, guarantees the futures contracts against default.
Futures contracts outstanding at period end are listed after the Fund's Portfolio of Investments.
The average notional value of long and short futures contracts held by the Fund throughout the period was $11,269,021 and $4,017,858, respectively. This is based on amounts held as of each month-end throughout the fiscal period.
Restricted Securities
The Fund may purchase securities which are considered restricted. Restricted securities are securities that either: (a) cannot be offered for public sale without first being registered, or being able to take advantage of an exemption from registration, under the Securities Act of 1933; or (b) are subject to contractual restrictions on public sales. In some cases, when a security cannot be offered for public sale without first being registered, the issuer of the restricted security has agreed to register such securities for resale, at the issuer's expense, either upon demand by the Fund or in connection with another registered offering of the securities. Many such restricted securities may be resold in the secondary market in transactions exempt from registration. Restricted securities may be determined to be liquid under criteria established by the Trustees. The Fund will not incur any registration costs upon such resales. The Fund's restricted securities, like other securities, are priced in accordance with procedures established by and under the general supervision of the Trustees.
Securities Lending
The Fund participates in a securities lending program providing for the lending of equity securities to qualified brokers. The term of the loans within the program is one year or less. The Fund normally receives cash collateral for securities loaned that may be invested in affiliated money market funds, other money market instruments and/or repurchase agreements. Investments in money market funds may include funds with a “floating” NAV that can impose redemption fees and liquidity gates, impose certain operational impediments to investing cash collateral, and, if the investee fund's NAV decreases, result in the Fund recognizing losses and being required to cover the decrease in the value of the cash collateral. Collateral is maintained at a minimum level of 100% of the market value of investments loaned,
Annual Shareholder Report
plus interest, if applicable. In accordance with the Fund's securities lending agreement, the market value of securities on loan is determined each day at the close of business and any additional collateral required to cover the value of securities on loan is delivered to the Fund on the next business day. Earnings on collateral are allocated between the borrower of the security, the securities lending agent, as a fee for its services under the program and the Fund, according to agreed-upon rates. The Fund will not have the right to vote on securities while they are on loan. However, the Fund will attempt to terminate a loan in an effort to reacquire the securities in time to vote on matters that are deemed to be material by the Adviser. There can be no assurance that the Fund will have sufficient notice of such matters to be able to terminate the loan in time to vote thereon.
Securities lending transactions are subject to Master Netting Agreements which are agreements between the Fund and its counterparties that provide for the net settlement of all transactions and collateral with the Fund, through a single payment, in the event of default or termination. Amounts presented on the Portfolio of Investments and Statement of Assets and Liabilities are not net settlement amounts but gross. As indicated below, the cash collateral received by the Fund exceeds the market value of the securities loaned reducing the net settlement amount to zero. The chart below identifies the amount of collateral received as well as the market value of securities on loan. Additionally, the securities lending agreement executed by the Fund includes an indemnification clause. This clause stipulates that the borrower will reimburse the Fund for any losses as a result of any failure of the borrower to return equivalent securities to the Fund.
As of July 31, 2019, securities subject to this type of arrangement and related collateral were as follows:
Market Value of
Securities Loaned | Collateral
Received |
| $142,196 | $145,972 |
Additional Disclosure Related to Derivative Instruments
| Fair Value of Derivative Instruments |
| | Liabilities |
| | Statement of
Assets and
Liabilities
Location | Fair
Value |
| Derivatives not accounted for as hedging instruments under ASC Topic 815 | | |
| Interest rate contracts | Payable for daily
variation margin on
futures contracts | $(29,772)* |
| * | Includes cumulative net appreciation of futures contracts as reported in the footnotes to the Portfolio of Investments. Only the current day's variation margin is reported within the Statement of Assets and Liabilities. |
Annual Shareholder Report
The Effect of Derivative Instruments on the Statement of Operations for the Year Ended July 31, 2019
| Amount of Realized Gain or (Loss) on Derivatives Recognized in Income |
| | Futures
Contracts |
| Interest rate contracts | $(17,027) |
| Change in Unrealized Appreciation or (Depreciation) on Derivatives Recognized in Income |
| | Futures
Contracts |
| Interest rate contracts | $8,853 |
Other
The preparation of financial statements in conformity with GAAP requires management to make estimates and assumptions that affect the amounts of assets, liabilities, expenses and revenues reported in the financial statements. Actual results could differ from those estimated. The Fund applies investment company accounting and reporting guidance.
3. SHARES OF BENEFICIAL INTEREST
The following tables summarize share activity:
| Year Ended July 31 | 2019 | 2018 |
| Class A Shares: | Shares | Amount | Shares | Amount |
| Shares sold | 1,017,180 | $18,426,997 | 616,086 | $11,426,201 |
| Conversion of Class C Shares to Class A Shares | 577,227 | 11,313,650 | — | — |
| Shares issued to shareholders in payment of distributions declared | 356,509 | 5,992,523 | 37,690 | 704,802 |
| Shares redeemed | (591,801) | (10,713,481) | (973,306) | (17,952,970) |
| NET CHANGE RESULTING FROM CLASS A SHARE TRANSACTIONS | 1,359,115 | $25,019,689 | (319,530) | $(5,821,967) |
| Year Ended July 31 | 2019 | 2018 |
| Class C Shares: | Shares | Amount | Shares | Amount |
| Shares sold | 295,829 | $5,229,357 | 94,955 | $1,762,067 |
| Shares issued to shareholders in payment of distributions declared | 54,548 | 903,860 | 9,123 | 168,962 |
| Conversion of Class C Shares to Class A Shares | (585,290) | (11,313,650) | — | — |
| Shares redeemed | (355,430) | (6,666,352) | (334,347) | (6,217,117) |
| NET CHANGE RESULTING FROM CLASS C SHARE TRANSACTIONS | (590,343) | $(11,846,785) | (230,269) | $(4,286,088) |
Annual Shareholder Report
| Year Ended July 31 | 2019 | 2018 |
| Institutional Shares: | Shares | Amount | Shares | Amount |
| Shares sold | 1,337,055 | $24,174,708 | 1,033,047 | $19,682,314 |
| Shares issued to shareholders in payment of distributions declared | 344,529 | 5,809,112 | 30,373 | 568,576 |
| Shares redeemed | (1,624,656) | (28,538,979) | (496,465) | (9,266,521) |
| NET CHANGE RESULTING FROM INSTITUTIONAL SHARE TRANSACTIONS | 56,928 | $1,444,841 | 566,955 | $10,984,369 |
| Year Ended July 31 | 2019 | 2018 |
| Class R6 Shares: | Shares | Amount | Shares | Amount |
| Shares sold | 235,953 | $4,525,372 | 104,828 | $1,973,631 |
| Shares issued to shareholders in payment of distributions declared | 13,548 | 227,874 | 9,333 | 174,536 |
| Shares redeemed | (701,361) | (13,043,937) | (81,103) | (1,530,039) |
| NET CHANGE RESULTING FROM CLASS R6 SHARE TRANSACTIONS | (451,860) | $(8,290,691) | 33,058 | $618,128 |
| NET CHANGE RESULTING FROM TOTAL FUND SHARE TRANSACTIONS | 373,840 | $6,327,054 | 50,214 | $1,494,442 |
4. FEDERAL TAX INFORMATION
The timing and character of income and capital gain distributions are determined in accordance with income tax regulations, which may differ from GAAP. These differences are due to differing treatments for foreign currency transactions and regulatory settlement proceeds.
For the year ended July 31, 2019, permanent differences identified and reclassified among the components of net assets were as follows:
| Increase (Decrease) |
| Paid-In Capital | Total Distributable
Earnings (Loss) |
| $(4,552) | $4,552 |
Net assets were not affected by this reclassification.
The tax character of distributions as reported on the Statement of Changes in Net Assets for the years ended July 31, 2019 and 2018, was as follows:
| | 2019 | 2018 |
| Ordinary income1 | $7,714,224 | $1,769,092 |
| Long-term capital gains | $6,142,833 | $— |
| 1 | For tax purposes, short-term capital gain distributions are considered ordinary income distributions. |
Annual Shareholder Report
As of July 31, 2019, the components of distributable earnings on a tax-basis were as follows:
| Undistributed ordinary income2 | $434,349 |
| Net unrealized appreciation | $6,514,563 |
| Undistributed long-term capital gains | $2,759,933 |
| Capital loss deferrals | $(30,009) |
| 2 | For tax purposes, short-term capital gains are considered ordinary income in determining distributable earnings. |
The difference between book-basis and tax-basis net unrealized appreciation/depreciation is attributable to differing treatments for deferral of losses on wash sales, mark to market of futures contracts, deferral of paydown losses, straddle loss deferrals and partnership adjustments.
At July 31, 2019, the cost of investments for federal tax purposes was $149,508,737. The net unrealized appreciation of investments for federal tax purposes was $6,484,554. This consists of net unrealized appreciation from investments for those securities having an excess of value over cost of $11,010,977 and net unrealized depreciation from investments for those securities having an excess of cost over value of $4,526,423. The amounts presented are inclusive of derivative contracts.
At July 31, 2019, for federal income tax purposes, the Fund had $30,009 in straddle loss deferral.
5. INVESTMENT ADVISER FEE AND OTHER TRANSACTIONS WITH AFFILIATES
Investment Adviser Fee
The advisory agreement between the Fund and the Adviser provides for an annual fee equal to 0.75% of the Fund's average daily net assets. Subject to the terms described in the Expense Limitation note, the Adviser may voluntarily choose to waive any portion of its fee and/or reimburse certain operating expenses of the Fund. For the year ended July 31, 2019, the Adviser voluntarily waived $79,716 of its fee and voluntarily reimbursed $45,535 of transfer agent fees.
The Adviser has agreed to reimburse the Fund for certain investment adviser fees as a result of transactions in other affiliated investment companies. For the year ended July 31, 2019, the Adviser reimbursed $4,248.
Certain of the Fund's assets are managed by Federated Investment Management Company (the “Sub-Adviser”). Under the terms of a sub-advisory agreement between the Adviser and the Sub-Adviser, the Sub-Adviser receives an allocable portion of the Fund's adviser fee. The fee is paid by the Adviser out of its resources and is not an incremental Fund expense. For the year ended July 31, 2019, the Sub-Adviser earned a fee of $133,778.
Annual Shareholder Report
Administrative Fee
Federated Administrative Services (FAS), under the Administrative Services Agreement, provides the Fund with administrative personnel and services. For purposes of determining the appropriate rate breakpoint, “Investment Complex” is defined as all of the Federated Funds subject to a fee under the Administrative Services Agreement. The fee paid to FAS is based on the average daily net assets of the Investment Complex as specified below:
| Administrative Fee | Average Daily Net Assets
of the Investment Complex |
| 0.100% | on assets up to $50 billion |
| 0.075% | on assets over $50 billion |
Subject to the terms described in the Expense Limitation note, FAS may voluntarily choose to waive any portion of its fee. For the year ended July 31, 2019, the annualized fee paid to FAS was 0.080% of average daily net assets of the Fund.
In addition, FAS may charge certain out-of-pocket expenses to the Fund.
Distribution Services Fee
The Fund has adopted a Distribution Plan (the “Plan”) pursuant to Rule 12b-1 under the Act. Under the terms of the Plan, the Fund will compensate Federated Securities Corp. (FSC), the principal distributor, from the daily net assets of the Fund's Class A Shares and Class C Shares to finance activities intended to result in the sale of these shares. The Plan provides that the Fund may incur distribution expenses at the following percentages of average daily net assets annually, to compensate FSC:
| | Percentage of Average Daily
Net Assets of Class |
| Class A Shares | 0.05% |
| Class C Shares | 0.75% |
Subject to the terms described in the Expense Limitation note, FSC may voluntarily choose to waive any portion of its fee. For the year ended July 31, 2019, distribution services fees for the Fund were as follows:
| | Distribution Services
Fees Incurred |
| Class C Shares | $109,260 |
When FSC receives fees, it may pay some or all of them to financial intermediaries whose customers purchase shares. For the year ended July 31, 2019, FSC retained $12,071 fees paid by the Fund. For the year ended July 31, 2019, the Fund's Class A Shares did not incur a distribution services fee; however, it may begin to incur this fee upon approval of the Trustees.
Sales Charges
Front-end sales charges and contingent deferred sales charges (CDSC) do not represent expenses of the Fund. They are deducted from the proceeds of sales of Fund shares prior to investment or from redemption proceeds prior to remittance, as applicable. For the year ended July 31, 2019, FSC retained $13,121 in sales charges from the sale of Class A Shares. FSC also retained $1,074 of CDSC relating to redemptions of Class C Shares.
Annual Shareholder Report
Other Service Fees
For the year ended July 31, 2019, FSSC received $12,630 of the other service fees disclosed in Note 2.
Expense Limitation
The Adviser and certain of its affiliates (which may include FSC, FAS and FSSC) on their own initiative have agreed to waive certain amounts of their respective fees and/or reimburse expenses. Total annual fund operating expenses (as shown in the financial highlights, excluding interest expense, extraordinary expenses and proxy-related expenses paid by the Fund, if any) paid by the Fund's Class A Shares, Class C Shares, Institutional Shares and Class R6 Shares (after the voluntary waivers and/or reimbursements) will not exceed 1.31%, 2.06%, 1.06% and 1.05% (the “Fee Limit”), respectively, up to but not including the later of (the “Termination Date”): (a) October 1, 2020; or (b) the date of the Fund's next effective Prospectus. While the Adviser and its applicable affiliates currently do not anticipate terminating or increasing these arrangements prior to the Termination Date, these arrangements may only be terminated or the Fee Limit increased prior to the Termination Date with the agreement of the Trustees.
Directors'/Trustees' and Miscellaneous Fees
Certain Officers and Trustees of the Fund are Officers and Directors or Trustees of certain of the above companies. To efficiently facilitate payment, Directors'/Trustees' fees and certain expenses related to conducting meetings of the Directors/Trustees and other miscellaneous expenses are paid by an affiliate of the Adviser which in due course are reimbursed by the Fund. These expenses related to conducting meetings of the Directors/Trustees and other miscellaneous expenses may be included in Accrued and Miscellaneous Expenses on the Statement of Assets and Liabilities and Statement of Operations, respectively.
6. INVESTMENT TRANSACTIONS
Purchases and sales of investments, excluding long-term U.S. government securities and short-term obligations, for the year ended July 31, 2019, were as follows:
| Purchases | $117,751,286 |
| Sales | $127,180,982 |
7. LINE OF CREDIT
The Fund participates with certain other Federated Funds, on a several basis, in an up to $500,000,000 unsecured, 364-day, committed, revolving line of credit (LOC) agreement. The LOC was made available to finance temporarily the repurchase or redemption of shares of the Fund, failed trades, payment of dividends, settlement of trades and for other short-term, temporary or emergency general business purposes. The Fund cannot borrow under the LOC if an inter-fund loan is outstanding. The Fund's ability to borrow under the LOC also is subject to the limitations of the Act and various conditions precedent that must be satisfied before the Fund can borrow. Loans under the LOC are charged interest at a fluctuating rate per annum equal to the highest, on any day, of (a) (i) the federal funds effective rate, (ii) the one month London Interbank Offered Rate (LIBOR), and (iii) 0.0%, plus (b) a margin. The LOC also requires the Fund to pay, quarterly in arrears and at maturity, its pro rata share of a commitment fee based on the amount of the lenders' commitment that has not been utilized. As of July 31, 2019, the Fund had no outstanding loans. During the year ended July 31, 2019, the Fund did not utilize the LOC.
Annual Shareholder Report
8. INTERFUND LENDING
Pursuant to an Exemptive Order issued by the SEC, the Fund, along with other funds advised by subsidiaries of Federated Investors, Inc., may participate in an interfund lending program. This program provides an alternative credit facility allowing the Fund to borrow from other participating affiliated funds. As of July 31, 2019, there were no outstanding loans. During the year ended July 31, 2019, the program was not utilized.
9. SUBSEQUENT EVENT
On May 16, 2019, the Trustees approved the reorganization of PNC Balanced Allocation Fund, a portfolio of the PNC Funds, into the Fund. The reorganization is expected to occur in the fourth quarter of 2019, pending approval by the shareholders of the PNC fund.
Additionally, if the reorganization is approved, the “Termination Date” for the Fund's Class A Shares, Class C Shares and Institutional Shares stated under Expense Limitation in the “Investment Adviser Fee and Other Transactions with Affiliates” note shall be extended up to but not including, the later of: (a) December 1, 2020; or (b) the first day of the month following the one year anniversary of the closing date of the reorganization.
10. FEDERAL TAX INFORMATION (UNAUDITED)
For the fiscal year ended July 31, 2019, the amount of long-term capital gains designated by the Fund was $6,142,833.
For the fiscal year ended July 31, 2019, 28.69% of total ordinary income distributions made by the Fund are qualifying dividends which may be subject to a maximum tax rate of 15%, as provided for by the Jobs and Growth Tax Relief Act of 2003. Complete information is reported in conjunction with the reporting of your distributions on Form 1099-DIV.
Of the ordinary income distributions made by the Fund during the year ended July 31, 2019, 22.13% qualify for the dividends received deduction available to corporate shareholders.
Annual Shareholder Report
Report of Independent Registered Public Accounting Firm
TO THE BOARD OF trustees OF Federated MDt series AND SHAREHOLDERS OF federated mdt Balanced fund:
Opinion on the Financial Statements
We have audited the accompanying statement of assets and liabilities of Federated MDT Balanced Fund (the “Fund”) (one of the portfolios constituting Federated MDT Series (the “Trust”)), including the portfolio of investments, as of July 31, 2019, and the related statement of operations for the year then ended, the statement of changes in net assets for each of the two years in the period then ended, the financial highlights for each of the five years in the period then ended and the related notes (collectively referred to as the “financial statements”). In our opinion, the financial statements present fairly, in all material respects, the financial position of the Fund (one of the funds constituting Federated MDT Series) at July 31, 2019, the results of its operations for the year then ended, the changes in its net assets for each of the two years in the period then ended and its financial highlights for each of the five years in the period then ended, in conformity with U.S. generally accepted accounting principles.
Basis for Opinion
These financial statements are the responsibility of the Trust's management. Our responsibility is to express an opinion on the Fund's financial statements based on our audits. We are a public accounting firm registered with the Public Company Accounting Oversight Board (United States) (“PCAOB”) and are required to be independent with respect to the Trust in accordance with the U.S. federal securities laws and the applicable rules and regulations of the Securities and Exchange Commission and the PCAOB.
We conducted our audits in accordance with standards of the PCAOB. Those standards require that we plan and perform the audit to obtain reasonable assurance about whether the financial statements and financial highlights are free of material misstatement, whether due to error or fraud. The Trust is not required to have, nor were we engaged to perform, an audit of the Trust's internal control over financial reporting. As part of our audits, we are required to obtain an understanding of internal control over financial reporting, but not for the purpose of expressing an opinion on the effectiveness of the Trust's internal control over financial reporting. Accordingly, we express no such opinion.
Annual Shareholder Report
Our audits included performing procedures to assess the risks of material misstatement of the financial statements, whether due to error or fraud, and performing procedures that respond to those risks. Such procedures included examining, on a test basis, evidence regarding the amounts and disclosures in the financial statements. Our procedures included confirmation of securities owned as of July 31, 2019, by correspondence with the custodian and others, or by other appropriate auditing procedures where replies from others were not received. Our audits also included evaluating the accounting principles used and significant estimates made by management, as well as evaluating the overall presentation of the financial statements. We believe that our audits provide a reasonable basis for our opinion.
We have served as the auditor of one or more Federated investment companies since 1979.
Boston, Massachusetts
September 23, 2019
Annual Shareholder Report
Shareholder Expense Example (unaudited)
As a shareholder of the Fund, you incur two types of costs: (1) transaction costs, including sales charges (loads) on purchase or redemption payments; and (2) ongoing costs, including management fees and to the extent applicable, distribution (12b-1) fees and/or other service fees and other Fund expenses. This Example is intended to help you to understand your ongoing costs (in dollars) of investing in the Fund and to compare these costs with the ongoing costs of investing in other mutual funds. It is based on an investment of $1,000 invested at the beginning of the period and held for the entire period from February 1, 2019 to July 31, 2019.
ACTUAL EXPENSES
The first section of the table below provides information about actual account values and actual expenses. You may use the information in this section, together with the amount you invested, toestimate the expenses that you incurred over the period. Simply divide your account value by $1,000 (for example, an $8,600 account value divided by $1,000 = 8.6), then multiply the result by the number in the first section under the heading entitled “Expenses Paid During Period” to estimate the expenses attributable to your investment during this period.
HYPOTHETICAL EXAMPLE FOR COMPARISON PURPOSES
The second section of the table below provides information about hypothetical account values and hypothetical expenses based on the Fund's actual expense ratio and anassumed rate of return of 5% per year before expenses, which is not the Fund's actual return. Thus, you shouldnot use the hypothetical account values and expenses to estimate the actual ending account balance or your expenses for the period. Rather, these figures are required to be provided to enable you to compare the ongoing costs of investing in the Fund with other funds. To do so, compare this 5% hypothetical example with the 5% hypothetical examples that appear in the shareholder reports of the other funds.
Annual Shareholder Report
Please note that the expenses shown in the table are meant to highlight your ongoing costs only and do not reflect any transaction costs, such as sales charges (loads) on purchase or redemption payments. Therefore, the second section of the table is useful in comparing ongoing costs only, and will not help you determine the relativetotal costs of owning different funds. In addition, if these transaction costs were included, your costs would have been higher.
| | Beginning
Account Value
2/1/2019 | Ending
Account Value
7/31/2019 | Expenses Paid
During Period1 |
| Actual: | | | |
| Class A Shares | $1,000 | $1,075.30 | $6.74 |
| Class C Shares | $1,000 | $1,071.80 | $10.58 |
| Institutional Shares | $1,000 | $1,076.80 | $5.46 |
| Class R6 Shares | $1,000 | $1,077.00 | $5.41 |
Hypothetical (assuming a 5% return
before expenses): | | | |
| Class A Shares | $1,000 | $1,018.30 | $6.56 |
| Class C Shares | $1,000 | $1,014.60 | $10.29 |
| Institutional Shares | $1,000 | $1,019.50 | $5.31 |
| Class R6 Shares | $1,000 | $1,019.60 | $5.26 |
| 1 | Expenses are equal to the Fund's annualized net expense ratios, multiplied by the average account value over the period, multiplied by 181/365 (to reflect the one-half-year period). The annualized net expense ratios are as follows: |
| | |
| Class A Shares | 1.31% |
| Class C Shares | 2.06% |
| Institutional Shares | 1.06% |
| Class R6 Shares | 1.05% |
Annual Shareholder Report
Board of Trustees and Trust Officers
The Board of Trustees is responsible for managing the Trust's business affairs and for exercising all the Trust's powers except those reserved for the shareholders. The following tables give information about each Trustee and the senior officers of the Fund. Where required, the tables separately list Trustees who are “interested persons” of the Fund (i.e., “Interested” Trustees) and those who are not (i.e., “Independent” Trustees). Unless otherwise noted, the address of each person listed is Federated Investors Tower, 1001 Liberty Avenue, Pittsburgh, PA 15222. The address of all Independent Trustees listed is 4000 Ericsson Drive, Warrendale, PA 15086-7561; Attention: Mutual Fund Board. As of December 31, 2018, the Trust comprised five portfolio(s), and the Federated Fund Family consisted of 40 investment companies (comprising 102 portfolios). Unless otherwise noted, each Officer is elected annually. Unless otherwise noted, each Trustee oversees all portfolios in the Federated Fund Family and serves for an indefinite term. The Fund's Statement of Additional Information includes additional information about Trust Trustees and is available, without charge and upon request, by calling 1-800-341-7400.
Interested TRUSTEES Background
Name
Birth Date
Positions Held with Trust
Date Service Began | Principal Occupation(s) for Past Five Years,
Other Directorships Held and Previous Position(s) |
J. Christopher Donahue*
Birth Date: April 11, 1949
President and Trustee
Indefinite Term
Began serving: May 2006 | Principal Occupations: Principal Executive Officer and President of certain of the Funds in the Federated Fund Family; Director or Trustee of the Funds in the Federated Fund Family; President, Chief Executive Officer and Director, Federated Investors, Inc.; Chairman and Trustee, Federated Investment Management Company; Trustee, Federated Investment Counseling; Chairman and Director, Federated Global Investment Management Corp.; Chairman and Trustee, Federated Equity Management Company of Pennsylvania; Trustee, Federated Shareholder Services Company; Director, Federated Services Company.
Previous Positions: President, Federated Investment Counseling; President and Chief Executive Officer, Federated Investment Management Company, Federated Global Investment Management Corp. and Passport Research, Ltd; Chairman, Passport Research, Ltd. |
Annual Shareholder Report
Name
Birth Date
Positions Held with Trust
Date Service Began | Principal Occupation(s) for Past Five Years,
Other Directorships Held and Previous Position(s) |
John B. Fisher*
Birth Date: May 16, 1956
Trustee
Indefinite Term
Began serving: May 2016 | Principal Occupations:Principal Executive Officer and President of certain of the Funds in the Federated Fund Family; Director or Trustee of certain of the Funds in the Federated Fund Family; Vice President, Federated Investors, Inc.; President, Director/Trustee and CEO, Federated Advisory Services Company, Federated Equity Management Company of Pennsylvania, Federated Global Investment Management Corp., Federated Investment Counseling, Federated Investment Management Company; President of some of the Funds in the Federated Fund Complex and Director, Federated Investors Trust Company.
Previous Positions: President and Director of the Institutional Sales Division of Federated Securities Corp.; President and Director of Federated Investment Counseling; President and CEO of Passport Research, Ltd.; Director, Edgewood Securities Corp.; Director, Federated Services Company; Director, Federated Investors, Inc.; Chairman and Director, Southpointe Distribution Services, Inc. and President, Technology, Federated Services Company. |
| * | Reasons for “interested” status: J. Christopher Donahue and John B. Fisher are interested due to their beneficial ownership of shares of Federated Investors, Inc. and due to positions they hold with Federated and its subsidiaries. |
INDEPENDENT TRUSTEES Background
Name
Birth Date
Positions Held with Trust
Date Service Began | Principal Occupation(s) for Past Five Years,
Other Directorships Held, Previous Position(s) and Qualifications |
John T. Collins
Birth Date: January 24, 1947
Trustee
Indefinite Term
Began serving: October 2013 | Principal Occupations: Director or Trustee of the Federated Fund Family; formerly, Chairman and CEO, The Collins Group, Inc. (a private equity firm) (Retired).
Other Directorships Held: Director, Chairman of the Compensation Committee, KLX Energy Services Holdings, Inc. (oilfield services); former Director of KLX Corp. (aerospace).
Qualifications: Mr. Collins has served in several business and financial management roles and directorship positions throughout his career. Mr. Collins previously served as Chairman and CEO of The Collins Group, Inc. (a private equity firm) and as a Director of KLX Corp. Mr. Collins serves as Chairman Emeriti, Bentley University. Mr. Collins previously served as Director and Audit Committee Member, Bank of America Corp.; Director, FleetBoston Financial Corp.; and Director, Beth Israel Deaconess Medical Center (Harvard University Affiliate Hospital). |
Annual Shareholder Report
Name
Birth Date
Positions Held with Trust
Date Service Began | Principal Occupation(s) for Past Five Years,
Other Directorships Held, Previous Position(s) and Qualifications |
G. Thomas Hough
Birth Date: February 28, 1955
Trustee
Indefinite Term
Began serving: August 2015 | Principal Occupations: Director or Trustee of the Federated Fund Family; formerly, Vice Chair, Ernst & Young LLP (public accounting firm) (Retired).
Other Directorships Held: Director, Member of Governance and Compensation Committees, Publix Super Markets, Inc.; Director, Chair of the Audit Committee, Equifax, Inc.; Director, Member of the Audit Committee, Haverty Furniture Companies, Inc.
Qualifications: Mr. Hough has served in accounting, business management and directorship positions throughout his career. Mr. Hough most recently held the position of Americas Vice Chair of Assurance with Ernst & Young LLP (public accounting firm). Mr. Hough serves on the President's Cabinet and Business School Board of Visitors for the University of Alabama and is on the Business School Board of Visitors for Wake Forest University. Mr. Hough previously served as an Executive Committee member of the United States Golf Association. |
Maureen Lally-Green
Birth Date: July 5, 1949
Trustee
Indefinite Term
Began serving: August 2009 | Principal Occupations: Director or Trustee of the Federated Fund Family; Adjunct Professor of Law, Duquesne University School of Law; formerly, Dean of the Duquesne University School of Law and Professor of Law and Interim Dean of the Duquesne University School of Law; formerly, Associate General Secretary and Director, Office of Church Relations, Diocese of Pittsburgh.
Other Directorships Held: Director, CNX Resources Corporation (formerly known as CONSOL Energy Inc.).
Qualifications: Judge Lally-Green has served in various legal and business roles and directorship positions throughout her career. Judge Lally-Green previously held the position of Dean of the School of Law of Duquesne University (as well as Interim Dean). Judge Lally-Green previously served as a member of the Superior Court of Pennsylvania and as a Professor of Law, Duquesne University School of Law. Judge Lally-Green also currently holds the positions on not for profit or for profit boards of directors as follows: Director and Chair, UPMC Mercy Hospital; Director and Vice Chair, Our Campaign for the Church Alive!, Inc.; Regent, Saint Vincent Seminary; Member, Pennsylvania State Board of Education (public); and Director CNX Resources Corporation (formerly known as CONSOL Energy Inc.). Judge Lally-Green has held the positions of: Director, Auberle; Director, Epilepsy Foundation of Western and Central Pennsylvania; Director, Ireland Institute of Pittsburgh; Director, Saint Thomas More Society; Director and Chair, Catholic High Schools of the Diocese of Pittsburgh, Inc.; Director, Pennsylvania Bar Institute; Director, St. Vincent College; and Director and Chair, North Catholic High School, Inc. |
Charles F. Mansfield, Jr.
Birth Date: April 10, 1945
Trustee
Indefinite Term
Began serving: June 2006 | Principal Occupations: Director or Trustee of the Federated Fund Family; Management Consultant and Author.
Other Directorships Held: None.
Qualifications: Mr. Mansfield has served as a Marine Corps officer and in several banking, business management, educational roles and directorship positions throughout his long career. He remains active as a Management Consultant and Author. |
Annual Shareholder Report
Name
Birth Date
Positions Held with Trust
Date Service Began | Principal Occupation(s) for Past Five Years,
Other Directorships Held, Previous Position(s) and Qualifications |
Thomas M. O'Neill
Birth Date: June 14, 1951
Trustee
Indefinite Term
Began serving: August 2006 | Principal Occupations: Director or Trustee, Chair of the Audit Committee of the Federated Fund Family; Sole Proprietor, Navigator Management Company (investment and strategic consulting).
Other Directorships Held: None.
Qualifications: Mr. O'Neill has served in several business, mutual fund and financial management roles and directorship positions throughout his career. Mr. O'Neill serves as Director, Medicines for Humanity and Director, The Golisano Children's Museum of Naples, Florida. Mr. O'Neill previously served as Chief Executive Officer and President, Managing Director and Chief Investment Officer, Fleet Investment Advisors; President and Chief Executive Officer, Aeltus Investment Management, Inc.; General Partner, Hellman, Jordan Management Co., Boston, MA; Chief Investment Officer, The Putnam Companies, Boston, MA; Credit Analyst and Lending Officer, Fleet Bank; Director and Consultant, EZE Castle Software (investment order management software); and Director, Midway Pacific (lumber). |
P. Jerome Richey
Birth Date: February 23, 1949
Trustee
Indefinite Term
Began serving: October 2013 | Principal Occupations: Director or Trustee of the Federated Fund Family; Management Consultant; Retired; formerly, Senior Vice Chancellor and Chief Legal Officer, University of Pittsburgh and Executive Vice President and Chief Legal Officer, CNX Resources Corporation (formerly known as CONSOL Energy Inc.).
Other Directorships Held: None.
Qualifications: Mr. Richey has served in several business and legal management roles and directorship positions throughout his career. Mr. Richey most recently held the positions of Senior Vice Chancellor and Chief Legal Officer, University of Pittsburgh. Mr. Richey previously served as Chairman of the Board, Epilepsy Foundation of Western Pennsylvania and Chairman of the Board, World Affairs Council of Pittsburgh. Mr. Richey previously served as Chief Legal Officer and Executive Vice President, CNX Resources Corporation (formerly known as CONSOL Energy Inc.); and Board Member, Ethics Counsel and Shareholder, Buchanan Ingersoll & Rooney PC (a law firm). |
John S. Walsh
Birth Date: November 28, 1957
Trustee
Indefinite Term
Began serving: June 2006 | Principal Occupations: Director or Trustee, and Chair of the Board of Directors or Trustees, of the Federated Fund Family; President and Director, Heat Wagon, Inc. (manufacturer of construction temporary heaters); President and Director, Manufacturers Products, Inc. (distributor of portable construction heaters); President, Portable Heater Parts, a division of Manufacturers Products, Inc.
Other Directorships Held: None.
Qualifications: Mr. Walsh has served in several business management roles and directorship positions throughout his career. Mr. Walsh previously served as Vice President, Walsh & Kelly, Inc. (paving contractors). |
Annual Shareholder Report
OFFICERS
Name
Birth Date
Address
Positions Held with Trust
Date Service Began | Principal Occupation(s) for Past Five Years
and Previous Position(s) |
Lori A. Hensler
Birth Date: January 6, 1967
TREASURER
Officer since: April 2013 | Principal Occupations: Principal Financial Officer and Treasurer of the Federated Fund Family; Senior Vice President, Federated Administrative Services; Financial and Operations Principal for Federated Securities Corp. and Edgewood Services, Inc.; and Assistant Treasurer, Federated Investors Trust Company. Ms. Hensler has received the Certified Public Accountant designation.
Previous Positions: Controller of Federated Investors, Inc.; Senior Vice President and Assistant Treasurer, Federated Investors Management Company; Treasurer, Federated Investors Trust Company; Assistant Treasurer, Federated Administrative Services, Federated Administrative Services, Inc., Federated Securities Corp., Edgewood Services, Inc., Federated Advisory Services Company, Federated Equity Management Company of Pennsylvania, Federated Global Investment Management Corp., Federated Investment Counseling, Federated Investment Management Company, Passport Research, Ltd., and Federated MDTA, LLC; Financial and Operations Principal for Federated Securities Corp., Edgewood Services, Inc. and Southpointe Distribution Services, Inc. |
Peter J. Germain
Birth Date: September 3, 1959
CHIEF LEGAL OFFICER, SECRETARY and EXECUTIVE VICE PRESIDENT
Officer since: June 2006 | Principal Occupations: Mr. Germain is Chief Legal Officer, Secretary and Executive Vice President of the Federated Fund Family. He is General Counsel, Chief Legal Officer, Secretary and Executive Vice President, Federated Investors, Inc.; Trustee and Senior Vice President, Federated Investors Management Company; Trustee and President, Federated Administrative Services; Director and President, Federated Administrative Services, Inc.; Director and Vice President, Federated Securities Corp.; Director and Secretary, Federated Private Asset Management, Inc.; Secretary, Federated Shareholder Services Company; and Secretary, Retirement Plan Service Company of America. Mr. Germain joined Federated in 1984 and is a member of the Pennsylvania Bar Association.
Previous Positions: Deputy General Counsel, Special Counsel, Managing Director of Mutual Fund Services, Federated Investors, Inc.; Senior Vice President, Federated Services Company; and Senior Corporate Counsel, Federated Investors, Inc. |
Stephen Van Meter
Birth Date: June 5, 1975
CHIEF COMPLIANCE OFFICER AND SENIOR VICE PRESIDENT
Officer since: July 2015 | Principal Occupations: Senior Vice President and Chief Compliance Officer of the Federated Fund Family; Vice President and Chief Compliance Officer of Federated Investors, Inc. and Chief Compliance Officer of certain of its subsidiaries. Mr. Van Meter joined Federated in October 2011. He holds FINRA licenses under Series 3, 7, 24 and 66.
Previous Positions: Mr. Van Meter previously held the position of Compliance Operating Officer, Federated Investors, Inc. Prior to joining Federated, Mr. Van Meter served at the United States Securities and Exchange Commission in the positions of Senior Counsel, Office of Chief Counsel, Division of Investment Management and Senior Counsel, Division of Enforcement. |
Annual Shareholder Report
Name
Birth Date
Address
Positions Held with Trust
Date Service Began | Principal Occupation(s) for Past Five Years
and Previous Position(s) |
Stephen F. Auth
Birth Date: September 13, 1956
101 Park Avenue
41st Floor
New York, NY 10178
CHIEF INVESTMENT OFFICER
Officer since: June 2012 | Principal Occupations: Stephen F. Auth is Chief Investment Officer of various Funds in the Federated Fund Family; Executive Vice President, Federated Investment Counseling, Federated Global Investment Management Corp. and Federated Equity Management Company of Pennsylvania.
Previous Positions: Executive Vice President, Federated Investment Management Company and Passport Research, Ltd. (investment advisory subsidiary of Federated); Senior Vice President, Global Portfolio Management Services Division; Senior Vice President, Federated Investment Management Company and Passport Research, Ltd.; Senior Managing Director and Portfolio Manager, Prudential Investments. |
Annual Shareholder Report
Evaluation and Approval of Advisory Contract–May 2019
Federated MDT Balanced Fund (the “Fund”)
At its meetings in May 2019, the Fund's Board of Trustees (the “Board”), including a majority of those Trustees who are not “interested persons” of the Fund, as defined in the Investment Company Act of 1940 (the “Independent Trustees”) reviewed and unanimously approved the continuation of the Fund's investment advisory and subadvisory contracts for an additional one-year term. The Board's decision regarding these contracts reflects the exercise of its business judgment after considering all of the information received on whether to continue the existing arrangements.
At the request of the Independent Trustees, the Fund's Chief Compliance Officer (the CCO) furnished to the Board in advance of its May 2019 meetings an independent written evaluation presenting on the topics discussed below. The Board considered the CCO's independent written evaluation (the “CCO Fee Evaluation Report”), along with other information, in evaluating the reasonableness of the Fund's management fee and in deciding to approve the continuation of the investment advisory and subadvisory contracts. The CCO, in preparing the CCO Fee Evaluation Report, has the authority to retain consultants, experts or staff as reasonably necessary to assist in the performance of his duties, reports directly to the Board, and can be terminated only with the approval of a majority of the Independent Trustees. At the request of the Independent Trustees, the CCO Fee Evaluation Report followed the same general approach and covered the same topics as that of the report that had previously been delivered by the CCO in his capacity as “Senior Officer,” prior to the eliminiation of the Senior Officer position in December 2017.
The Board also considered judicial decisions concerning allegedly excessive investment advisory fees in making its decision. Using these judicial decisions as a guide, the Board observed that the following factors may be relevant to an adviser's fiduciary duty with respect to its receipt of compensation from a fund: (1) the nature and quality of the services provided by an adviser to a fund and its shareholders (including the performance of the fund, its benchmark, and comparable funds); (2) an adviser's cost of providing the services (including the profitability to an adviser of providing advisory services to a fund); (3) the extent to which an adviser may realize “economies of scale” as a fund grows larger and, if such economies of scale exist, whether they have been shared with a fund and its shareholders or the family of funds; (4) any “fall-out” financial benefits that accrue to an adviser because of its relationship with a fund (including research services received from brokers that execute fund trades and any fees paid to affiliates of an adviser for services rendered to a fund); (5) comparative fee and expense structures (including a comparison of fees paid to an adviser with those paid by similar funds both internally and externally as well as management fees charged to institutional and other advisory clients of the
Annual Shareholder Report
adviser or its affiliates for what might be viewed as like services); and (6) the extent of care, conscientiousness and independence with which the fund's board members perform their duties and their expertise (including whether they are fully informed about all facts the board deems relevant to its consideration of an adviser's services and fees). The Board noted that the Securities and Exchange Commission (SEC) disclosure requirements regarding the basis for the Board's approval of the Fund's investment advisory contract generally align with the factors listed above. The Board was aware of these factors and was guided by them in its review of the Fund's investment advisory and subadvisory contracts to the extent it considered them to be appropriate and relevant, as discussed further below.
The Board considered and weighed these factors in light of its substantial accumulated experience in governing the Fund and working with Federated MDTA LLC (the “Adviser”) and its affiliates (collectively, “Federated”) on matters relating to the funds advised by Federated (each, a “Federated Fund”). The Independent Trustees were assisted in their deliberations by independent legal counsel.
In addition to the extensive materials that comprise and accompany the CCO Fee Evaluation, the Board received detailed information about the Fund and the Federated organization throughout the year, and in connection with its May meetings at which the Board's formal approval of the advisory and subadvisory contracts occurred. In this regard, Federated provided much of this information at each regular meeting of the Board, and furnished additional information specifically in connection with the May meetings. In the months preceding the May meetings, the Board requested and reviewed written materials prepared by Federated in response to requests on behalf of the Independent Trustees encompassing a wide variety of topics. At the May meetings, in addition to meeting in separates sessions of the Independent Trustees without management present, senior management of the Adviser also met with the Independent Trustees and their counsel to discuss the materials presented and such additional matters as the Independent Trustees deemed reasonably necessary to evaluate the advisory and subadvisory contracts. Between regularly scheduled meetings, the Board also received information on particular matters as the need arose.
The Board's consideration of the investment advisory and subadvisory contracts included review of the CCO Fee Evaluation Report, accompanying data and additional information covering the following matters, among others: the Adviser's and sub-adviser's investment philosophy, revenue, profitability, personnel and processes; investment and operating strategies; the Fund's short-term and long-term performance (in absolute terms, both on a gross basis and net of expenses, as well as in terms relative to its particular investment program and certain competitor or “peer group” funds and/or other benchmarks, as appropriate) and comments on the reasons for performance; the Fund's investment objectives; the Fund's expenses, including the advisory fee and the
Annual Shareholder Report
overall expense structure of the Fund (both in absolute terms and relative to similar and/or competing funds), with due regard for contractual or voluntary expense limitations; the use and allocation of brokerage commissions derived from trading the Fund's portfolio securities (if any); and the nature, quality and extent of the advisory and other services provided to the Fund by the Adviser and its affiliates. The Board also considered the preferences and expectations of Fund shareholders; the entrepreneurial and other risks assumed by the Adviser in sponsoring the Fund; the continuing state of competition in the mutual fund industry and market practices; the range of comparable fees for similar funds in the mutual fund industry; the Fund's relationship to the Federated Funds which include a comprehensive array of funds with different investment objectives, policies and strategies which are generally available for exchange without the incurrence of additional sales charges; compliance and audit reports concerning the Federated Funds and the Federated companies that service them (including communications from regulatory agencies), as well as Federated's responses to any issues raised therein; and relevant developments in the mutual fund industry and how the Federated Funds and/or Federated are responding to them. The Board's evaluation process is evolutionary. The criteria considered and the emphasis placed on relevant criteria change in recognition of changing circumstances in the mutual fund marketplace.
While mindful that courts have cautioned against giving too much weight to comparative information concerning fees charged by other advisers for managing funds with comparable investment programs, the Board has found the use of such comparisons to be relevant to its deliberations. In this regard, the Board was presented with, and considered, information regarding the contractual advisory fee rates, net advisory fee rates, total expense ratios and each element of the Fund's total expense ratio (i.e., gross and net advisory fees, custody fees, portfolio accounting fees and transfer agency fees) relative to an appropriate group of peer funds compiled by Federated using data supplied by independent fund ranking organizations (the “Peer Group”). The Board received a description of the composition and methodology used to select the Peer Group. The Board focused on comparisons with other similar mutual funds more heavily than non-mutual fund products or services because it is believed that they are more relevant. For example, other mutual funds are the products most like the Fund, in that they are readily available to Fund shareholders as alternative investment vehicles. Also, they are the type of investment vehicle, in fact, chosen and maintained by the Fund's investors. The range of their fees and expenses, therefore, appears to be a relevant indicator of what consumers have found to be reasonable in the marketplace in which the Fund competes.
The Board reviewed the contractual advisory fee rate, net advisory fee rate and other expenses of the Fund and noted the position of the Fund's fee rates relative to its Peer Group. In this regard, the Board noted that the contractual advisory fee rate was above the median of the relevant Peer Group, but the Board noted the applicable waivers and reimbursements, and that the overall
Annual Shareholder Report
expense structure of the Fund remained competitive in the context of other factors considered by the Board. In this regard, the Board had been previously advised that, while comparisons to fund Peer Groups are relevant in judging the reasonableness of advisory fees, the Fund's quantitative focus makes fee and expense comparisons particularly difficult. Although the Fund's advisory fee was above the median of the peer range, the Peer Group of funds varied widely in their complexity, and the Board has been informed that the management of the Fund is among the more complex relative to its Peer Group.
For comparison, the CCO reviewed the fees charged by Federated for providing advisory services to products other than the Federated Funds (e.g., institutional separate accounts and third-party unaffiliated mutual funds for which Federated serves as sub-adviser) (referenced to as “Comparable Funds/Accounts”). With respect to Comparable Funds/Accounts other than third-party mutual funds, the CCO concluded that they are inherently different products. Those differences include, but are not limited to, different types of targeted investors; different applicable laws and regulations; different legal structures; different average account sizes and portfolio management techniques made necessary by different cash flows and different associated costs; and the time spent by portfolio managers and their teams, as well as personnel in the Funds Financial Services, Legal, Compliance and Risk Management departments, in reviewing securities pricing, addressing different administrative responsibilities, addressing different degrees of risk associated with management and a variety of different costs. The CCO also reviewed the differences in the nature of the services required for Federated to manage its proprietary mutual fund business versus managing a discrete pool of assets as a sub-adviser to another institution's mutual fund, and that Federated generally performs significant additional services and assumes substantially greater risks in managing the Fund and other Federated Funds than in its role as sub-adviser to an unaffiliated third-party mutual fund. The CCO did not consider the fees for providing advisory services to Comparable Funds/Accounts to be determinative in judging the appropriateness of the Federated Funds' advisory fees.
Following such evaluation, and full deliberations, the Board concluded that the fees and expenses of the Fund are reasonable and supported renewal of the Fund's investment advisory and subadvisory contracts.
The Board considered the nature, extent and quality of the services provided to the Fund by the Adviser and the resources of the Adviser and its affiliates dedicated to the Fund. In this regard, the Board evaluated, among other things, the Adviser's personnel, experience, track record, financial resources, overall reputation and willingness to invest in personnel and infrastructure that benefit the Fund. In addition, the Board reviewed the qualifications, backgrounds and responsibilities of the portfolio management team primarily responsible for the day-to-day management of the Fund and the Adviser's ability and experience in attracting and retaining qualified personnel to service the Fund. The Board noted the investment research and company engagement capabilities of the
Annual Shareholder Report
Adviser and its affiliates. The Board also noted the compliance program of the Adviser and the compliance-related resources provided to the Fund by the Adviser, including the Adviser's commitment to respond to rulemaking initiatives of the SEC. The Fund's ability to deliver competitive performance when compared to its Peer Group was also deemed to be relevant by the Board as a useful indicator of how the Adviser is executing the Fund's investment program. The Adviser's ability to execute this program was one of the Board's considerations in reaching a conclusion that the nature, extent and quality of the Adviser's investment management services warrant the continuation of the investment advisory and subadvisory contracts.
In evaluating the Fund's investment performance, the Board considered performance results in light of the Fund's investment objective, strategies and risks, as disclosed in the Fund's prospectus. The Board considered detailed investment reports on the Fund's performance that were provided to the Board throughout the year and in connection with the May meetings. The CCO also reviewed information regarding the performance of other mutual funds in the Peer Group, noting the CCO's view that comparisons to fund peer groups may be helpful, though not conclusive, in evaluating the performance of the Adviser in managing the Fund. The Board considered, in evaluating such comparisons, that in some cases there may be differences in the funds' investment objectives or investment management techniques, or the costs to implement funds, even within the same Peer Group, and that the CCO had specifically noted that the Fund's quantitative focus makes fee and expense comparisons particularly difficult as the funds in the Peer Group varied widely in their complexity, and the management of the Fund is among the more complex relative to its Peer Group.
For the one-year, three-year and five-year periods covered by the CCO Fee Evaluation Report, the Fund's performance was above the median of the relevant Peer Group.
Following such evaluation, and full deliberations, the Board considered that the performance of the Fund supported renewal of the Fund's investment advisory and subadvisory contracts.
The Board also received financial information about Federated, including information regarding the compensation and ancillary (or “fall out”) benefits Federated derived from its relationships with the Federated Funds. This information covered not only the fees under the investment advisory contracts, but also fees received by Federated's subsidiaries for providing other services to the Federated Funds under separate contracts (e.g., for serving as the Federated Funds' administrator and distributor). In this regard, the Board considered that certain Federated subsidiaries provide distribution and shareholder services to the Federated Funds, for which they may be compensated through distribution and servicing fees paid pursuant to Rule 12b-1 plans or otherwise. The information also detailed any indirect benefit Federated may derive from its receipt of research services from brokers who execute Federated Fund trades. In
Annual Shareholder Report
addition, the Board considered the fact that, in order for a Federated Fund to be competitive in the marketplace, the Adviser and its affiliates frequently waived fees and/or reimbursed expenses and have disclosed to Federated Fund investors and/or indicated to the Board their intention to do so in the future. Moreover, the Board receives regular reporting as to the institution, adjustment or elimination of these voluntary waivers. The Board considered Federated's previous reduction in contractual management fees to certain Federated Funds in response to the CCO's recommendations in the prior year's CCO Fee Evaluation Report.
Federated furnished information, requested by the CCO, that reported revenues on a fund-by-fund basis and made estimates of the allocation of expenses on a fund-by-fund basis, using allocation methodologies specified by the CCO. The CCO noted that, while these cost allocation reports apply consistent allocation processes, the inherent difficulties in allocating costs continues to cause the Senior Officer to question the precision of the process and to conclude that such reports may be unreliable, since a single change in an allocation estimate may dramatically alter the resulting estimate of cost and/or profitability of a Federated Fund and may produce unintended consequences. The allocation information, including the CCO's view that fund-by-fund estimations may be unreliable, was considered in the evaluation by the Board.
The Board and the CCO also reviewed information compiled by Federated comparing its profitability information to other publicly held fund management companies, including information regarding profitability trends over time. In this regard, the CCO concluded that Federated's profit margins did not appear to be excessive. The CCO also noted that Federated appeared financially sound, with the resources necessary to fulfill its obligations under its contracts with the Fund.
The CCO Fee Evaluation Report also discussed the notion of possible realization of “economies of scale” as a fund grows larger, the difficulties of calculating economies of scale at an individual fund level, and the extent to which potential scale benefits are shared with shareholders. In this regard, the Board considered that Federated has made significant and long-term investments in areas that support all of the Federated Funds, such as personnel and processes for the portfolio management, shareholder services, compliance, internal audit and risk management functions, as well as systems technology (including technology relating to cybersecurity) and that the benefits of these investments (as well as any economies of scale, should they exist) were likely to be shared with the Federated Fund family as a whole. The Board noted that Federated's investments in these areas are extensive. In addition, the Board considered that the Adviser and its affiliates have frequently waived fees and/or reimbursed expenses and that this has allowed potential economies of scale to be shared with shareholders. The Board also considered that such waivers and reimbursements can provide protection from an increase in expenses if a Federated Fund's assets decline. Federated, as it does throughout the year, and
Annual Shareholder Report
specifically in connection with the Board's review of the advisory and subadvisory contracts, furnished information relative to revenue sharing or adviser-paid fees. Federated and the CCO noted that this information should be viewed to determine if there was an incentive to either not apply breakpoints, or to apply breakpoints at higher levels, and should not be viewed to determine the appropriateness of advisory fees. The Board also noted the absence of any applicable regulatory or industry guidelines on this subject, which (as discussed in the CCO Fee Evaluation Report) is compounded by the lack of any common industry practice or general pattern with respect to structuring fund advisory fees with “breakpoints” that serve to reduce the fee as a fund attains a certain size.
The CCO stated that his observations and the information accompanying the CCO Fee Evaluation Report supported a finding by the Board that the management fee for the Fund was reasonable. Under these circumstances, no changes were recommended to, and no objection was raised to, the continuation of the Fund's investment advisory and subadvisory contracts. The CCO also recognized that the Board's evaluation of the Federated Funds' advisory and subadvisory arrangements is a continuing and on-going process that is informed by the information that the Board requests and receives from management throughout the course of the year and, in this regard, the CCO noted certain items for future reporting to the Board or further consideration by management as the Board continues its on-going oversight of the Federated Funds.
In its decision to continue an existing investment advisory contract, the Board was mindful of the potential disruptions of the Fund's operations and various risks, uncertainties and other effects that could occur as a result of a decision to terminate or not renew an investment advisory contract. In particular, the Board recognized that many shareholders have invested in the Fund on the strength of the Adviser's industry standing and reputation and with the expectation that the Adviser will have a continuing role in providing advisory services to the Fund. Thus, the Board's approval of the investment advisory contract reflected the fact that it is the shareholders who have effectively selected the Adviser by virtue of having invested in the Fund. The Board concluded that, in light of the factors summarized above, including the nature, quality and scope of the services provided to the Fund by the Adviser and its affiliates, continuation of the investment advisory and subadvisory contract were appropriate.
The Board based its decision to approve the investment advisory and subadvisory contracts on the totality of the circumstances and relevant factors and with a view to past and future long-term considerations. Not all of the factors and considerations identified above were necessarily relevant to the Fund, nor did the Board consider any one of them to be determinative. With respect to the factors that were relevant, the Board's decision to approve the continuation of the contracts reflects its view that Federated's performance and actions provided a satisfactory basis to support the decision to continue the existing arrangements.
Annual Shareholder Report
Voting Proxies on Fund Portfolio Securities
A description of the policies and procedures that the Fund uses to determine how to vote proxies, if any, relating to securities held in the Fund's portfolio is available, without charge and upon request, by calling 1-800-341-7400. A report on “Form N-PX” of how the Fund voted any such proxies during the most recent 12-month period ended June 30 is available via the Proxy Voting Record (Form N-PX) link associated with the Fund and share class name at www.FederatedInvestors.com/FundInformation. Form N-PX filings are also available at the SEC's website at www.sec.gov.
Quarterly Portfolio Schedule
Each fiscal quarter, the Fund will file with the SEC a complete schedule of its monthly portfolio holdings on “Form N-PORT.” The Fund's holdings as of the end of the third month of every fiscal quarter, as reported on Form N-PORT, will be publicly available on the SEC's website at www.sec.gov within 60 days of the end of the fiscal quarter upon filing. You may also access this information via the link to the Fund and share class name at www.FederatedInvestors.com.
Annual Shareholder Report
Mutual funds are not bank deposits or obligations, are not guaranteed by any bank and are not insured or guaranteed by the U.S. government, the Federal Deposit Insurance Corporation, the Federal Reserve Board or any other government agency. Investment in mutual funds involves investment risk, including the possible loss of principal.
This Report is authorized for distribution to prospective investors only when preceded or accompanied by the Fund's Prospectus, which contains facts concerning its objective and policies, management fees, expenses and other information.
Federated MDT Balanced Fund
Federated Investors Funds
4000 Ericsson Drive
Warrendale, PA 15086-7561
Contact us at FederatedInvestors.com
or call 1-800-341-7400.
Federated Securities Corp., Distributor
CUSIP 31421R841
CUSIP 31421R833
CUSIP 31421R825
CUSIP 31421R692
37326 (9/19)
Federated is a registered trademark of Federated Investors, Inc.
2019 ©Federated Investors, Inc.
Annual Shareholder Report
July 31, 2019
| Share Class | Ticker | A | QALGX | B | QBLGX | C | QCLGX | Institutional | QILGX |
Federated MDT Large Cap Growth Fund
Fund Established 2005
A Portfolio of Federated MDT Series
IMPORTANT NOTICE REGARDING REPORT DELIVERY
Beginning on January 1, 2021, as permitted by regulations adopted by the Securities and Exchange Commission, paper copies of the Fund's shareholder reports like this one will no longer be sent by mail, unless you specifically request paper copies of the reports from the Fund or from your financial intermediary, such as a broker-dealer or bank. Instead, the reports will be made available on a website, and you will be notified by mail each time a report is posted and provided with a website link to access the report.
If you already elected to receive shareholder reports electronically, you will not be affected by this change and you need not take any action. You may elect to receive shareholder reports and other communications from the Fund or your financial intermediary electronically by contacting your financial intermediary (such as a broker-dealer or bank); other shareholders may call the Fund at 1-800-341-7400, Option 4.
You may elect to receive all future reports in paper free of charge. You can inform the Fund or your financial intermediary that you wish to continue receiving paper copies of your shareholder reports by contacting your financial intermediary (such as a broker-dealer or bank); other shareholders may call the Fund at 1-800-341-7400, Option 4. Your election to receive reports in paper will apply to all funds held with the Fund complex or your financial intermediary.
Not FDIC Insured ■ May Lose Value ■ No Bank Guarantee
J. Christopher
Donahue
President
Federated MDT Large Cap Growth Fund
Letter from the President
Dear Valued Shareholder,
I am pleased to present the Annual Shareholder Report for your fund covering the period from August 1, 2018 through July 31, 2019. This report includes Management's Discussion of Fund Performance, a complete listing of your fund's holdings, performance information and financial statements along with other important fund information.
In addition, our website, FederatedInvestors.com, offers easy access to Federated resources that include timely fund updates, economic and market insights from our investment strategists, and financial planning tools.
Thank you for investing with Federated. I hope you find this information useful and look forward to keeping you informed.
Sincerely,
J. Christopher Donahue, President
CONTENTS
| 1 |
| 6 |
| 7 |
| 12 |
| 16 |
| 18 |
| 19 |
| 20 |
| 30 |
| 32 |
| 34 |
| 40 |
| 48 |
| 48 |
Management's Discussion of Fund Performance (unaudited)
The total return of Federated MDT Large Cap Growth Fund (the “Fund”), based on net asset value for the 12-month reporting period ended July 31, 2019, was 11.28% for Class A Shares, 10.51% for Class B Shares, 10.46% for Class C Shares and 11.59% for the Institutional Shares. The total return for the Russell 1000® Growth Index (R1000G),1 the Fund's broad-based securities market index, was 10.82% for the same period. The total return of the Morningstar Large Growth Funds Average (MLGFA), a peer group average for the Fund, was 9.06% during the same period. The Fund's and MLGFA's total returns for the most recently completed fiscal year reflected actual cash flows, transaction costs and other expenses, which were not reflected in the total return of the R1000G.
During the reporting period, the Fund's investment strategy focused on stock selection. This was the most significant factor affecting the Fund's performance relative to the R1000G during the period.
The following discussion will focus on the performance of the Fund's Institutional Shares.
MARKET OVERVIEW
During the reporting period, overall domestic equity market performance was moderately strong as evidenced by the 7.05% return of the whole-market Russell 3000® Index.2 Larger cap stocks had a much better year than small-cap stocks.3 The Russell Top 200® Index4 returned 8.51%, and the Russell Midcap®5 Index returned 6.71%, but both the small-cap Russell 2000® Index6 and the very small-cap Russell Microcap7 Index fell (returns of -4.42% and -11.55%, respectively). For style, this was the third fiscal year in a row that growth stocks led value stocks by a substantial margin. During the reporting period, the Russell 3000® Growth Index8 returned 9.88% while the Russell 3000® Value Index9 returned 4.23%. The widest difference between the growth and value styles was in the mid-cap range, where the Russell Midcap® Growth Index10 returned 14.15%, and the Russell Midcap® Value Index11 returned 1.78%.
The best performing sectors in the R1000G during the reporting period were Real Estate (22.85%), Information Technology (16.63%) and Financials (13.41%). Underperforming sectors during the same period included Energy (-27.53%), Health Care (0.45%) and Industrials (4.55%).
Annual Shareholder Report
STOCK SELECTION
When looking at the Fund's outperformance in terms of fundamental and technical characteristics, the most significant drivers of outperformance during the reporting period were stocks with high analyst conviction and prices near 52-week highs. Stocks with those characteristics outperformed the benchmark and the Fund overweighted them. Stocks with negative analyst conviction and either worsening earnings to price or significant requirements for financing underperformed and were underweighted, but stock selection among them was not favorable, so these stocks were detractors. The Fund's sector exposures at the end of the period were close to R1000G weights, except for a small underweight in the Real Estate sector (the Fund did not invest in the Real Estate sector during the period). Favorable stock selection in the Information Technology, Health Care and Consumer Staples sectors contributed the most to the Fund's outperformance during the reporting period. Unfavorable stock selection in the Consumer Discretionary sector was a detractor during the period.
Individual stocks enhancing the Fund's performance during the reporting period included Veeva Systems Inc., Global Payments Inc., Xilinx, Inc. and Stryker Corporation.
Individual stocks detracting from the Fund's performance during the reporting period included Microsoft Corporation, Align Technology, Inc., and Visa Inc. Microsoft and Visa outperformed the benchmark but were underweighted relative to the R1000G by the Fund, and Align Technology underperformed and was overweighted by the Fund. Align Technology had been the top contributor to performance during the year ended July 31, 2018.
| 1 | Please see the footnotes to the line graphs below for definitions of, and further information about, the R1000G. |
| 2 | The Russell 3000® Index measures the performance of the largest 3,000 U.S. companies representing approximately 98% of the investable U.S. equity market. The Russell 3000® Index is constructed to provide a comprehensive, unbiased and stable barometer of the broad market, and is completely reconstituted annually to ensure new and growing equities are reflected.* |
| 3 | Small-cap stocks may be less liquid and subject to greater price volatility than large-cap stocks. |
| 4 | The Russell Top 200® Index measures the performance of the largest cap segment of the U.S. equity universe. The Russell Top 200® Index is a subset of the Russell 3000® Index. It includes approximately 200 of the largest securities based on a combination of their market cap and current index membership and represents approximately 68% of the U.S. market. The Russell Top 200® Index is constructed to provide a comprehensive and unbiased barometer for this very large cap segment and is completely reconstituted annually to ensure new and growing equities are reflected.* |
| 5 | The Russell Midcap® Index measures the performance of the mid-cap segment of the U.S. equity universe. The Russell Midcap® Index is a subset of the Russell 1000® Index. It includes approximately 800 of the smallest securities based on a combination of their market cap and current index membership. The Russell Midcap® Index represents approximately 31% of the total market capitalization of the Russell 1000® companies. The Russell Midcap® Index is constructed to provide a comprehensive and unbiased barometer for the mid-cap segment. The Russell Midcap Index is completely reconstituted annually to ensure larger stocks do not distort the performance and characteristics of the true mid-cap opportunity set.* |
Annual Shareholder Report
| 6 | The Russell 2000® Index measures the performance of the small-cap segment of the U.S. equity universe. The Russell 2000® Index is a subset of the Russell 3000® Index representing approximately 10% of the total market capitalization of that index. It includes approximately 2000 of the smallest securities based on a combination of their market cap and current index membership. The Russell 2000® Index is constructed to provide a comprehensive and unbiased small-cap barometer and is completely reconstituted annually to ensure larger stocks do not distort the performance and characteristics of the true small-cap opportunity set.* |
| 7 | The Russell Microcap® Index measures the performance of the microcap segment of the U.S. equity market. Microcap stocks make up less than 3% of the U.S. equity market (by market cap) and consist of the smallest 1,000 securities in the small-cap Russell 2000® Index, plus the next 1,000 smallest eligible securities by market cap. The Russell Microcap® Index is constructed to provide a comprehensive and unbiased barometer for the microcap segment trading on national exchanges and is completely reconstituted annually to ensure new and growing equities are reflected and companies continue to reflect appropriate capitalization and value characteristics.* |
| 8 | The Russell 3000® Growth Index measures the performance of the broad growth segment of the U.S. equity universe. It includes those Russell 3000® Index companies with higher price-to-book ratios and higher forecasted growth values. The Russell 3000® Growth Index is constructed to provide a comprehensive, unbiased and stable barometer of the broad growth market. The Russell 3000® Growth Index is completely reconstituted annually to ensure new and growing equities are included and that the represented companies continue to reflect growth characteristics.* |
| 9 | The Russell 3000® Value Index measures the performance of the broad value segment of U.S. equity value universe. It includes those Russell 3000® Index companies with lower price-to-book ratios and lower forecasted growth values. The Russell 3000® Value Index is constructed to provide a comprehensive, unbiased and stable barometer of the broad value market. The Russell 3000® Value Index is completely reconstituted annually to ensure new and growing equities are included and that the represented companies continue to reflect value characteristics.* |
| 10 | The Russell Midcap® Growth Index measures the performance of the mid-cap growth segment of the U.S. equity universe. It includes those Russell Midcap® Index companies with higher price-to-book ratios and higher forecasted growth values. The Russell Midcap® Growth Index is constructed to provide a comprehensive and unbiased barometer of the mid-cap growth market and is completely reconstituted annually to ensure larger stocks do not distort the performance and characteristics of the true mid-cap growth market.* |
| 11 | The Russell Midcap® Value Index measures the performance of the mid-cap value segment of the U.S. equity universe. It includes those Russell Midcap Index companies with lower price-to-book ratios and lower forecasted growth values. The Russell Midcap® Value Index is constructed to provide a comprehensive and unbiased barometer of the mid-cap value market and is completely reconstituted annually to ensure larger stocks do not distort the performance and characteristics of the true mid-cap value market.* |
| * | The index is unmanaged, and it is not possible to invest directly in an index. |
Annual Shareholder Report
FUND PERFORMANCE AND GROWTH OF A $10,000 INVESTMENT
The graph below illustrates the hypothetical investment of $10,0001 in the Federated MDT Large Cap Growth Fund (the “Fund”) from July 31, 2009 to July 31, 2019, compared to the Russell 1000® Growth Index (R1000G)2and the Morningstar Large Growth Funds Average (MLGFA).3The Average Annual Total Return table below shows returns for each class averaged over the stated periods.
Growth of a $10,000 Investment
Growth of $10,000 as of July 31, 2019
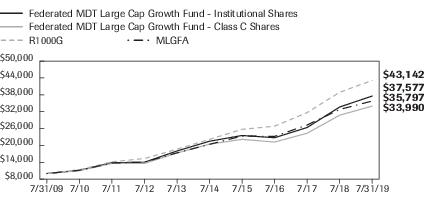
| Federated MDT Large Cap Growth Fund - | Institutional Shares | Class C Shares | NA | R1000G | MLGFA |
| F | F | NA | I | I |
| 7/31/2009 | 10,000 | 10,000 | | 10,000 | 10,000 |
| 7/31/2010 | 11,130 | 11,018 | | 11,365 | 11,174 |
| 7/31/2011 | 13,870 | 13,596 | | 14,179 | 13,732 |
| 7/31/2012 | 14,026 | 13,609 | | 15,350 | 14,078 |
| 7/31/2013 | 18,026 | 17,313 | | 18,672 | 17,355 |
| 7/31/2014 | 21,494 | 20,448 | | 22,161 | 20,408 |
| 7/31/2015 | 23,545 | 22,171 | | 25,725 | 23,319 |
| 7/31/2016 | 22,746 | 21,197 | | 26,844 | 23,224 |
| 7/31/2017 | 26,382 | 24,339 | | 31,690 | 27,274 |
| 7/31/2018 | 33,675 | 30,770 | | 38,928 | 32,801 |
| 7/31/2019 | 37,577 | 33,990 | | 43,142 | 35,797 |
41 graphic description end -->
| ■ | Total returns shown for Class C Shares include the maximum contingent deferred sales charge of 1.00% as applicable. |
The Fund offers multiple share classes whose performance may be greater than or less than its other share class(es) due to differences in sales charges and expenses. See the Average Annual Return table below for the returns of additional classes not shown in the line graph above.
Average Annual Total Returnsfor the Period Ended 7/31/2019
(returns reflect all applicable sales charges and contingent deferred sales charge as specified below in footnote #1)
| | 1 Year | 5 Years | 10 Years |
| Class A Shares | 5.17% | 10.28% | 13.24% |
| Class B Shares | 5.06% | 10.43% | 13.19% |
| Class C Shares | 9.48% | 10.70% | 13.01% |
| Institutional Shares | 11.59% | 11.82% | 14.15% |
| R1000G | 10.82% | 14.25% | 15.74% |
| MLGFA | 9.06% | 11.98% | 14.05% |
Annual Shareholder Report
Performance data quoted represents past performance which is no guarantee of future results. Investment return and principal value will fluctuate so that an investor's shares, when redeemed, may be worth more or less than their original cost. Mutual fund performance changes over time and current performance may be lower or higher than what is stated. For current to the most recent month-end performance and after-tax returns, visit FederatedInvestors.com or call 1-800-341-7400. Returns shown do not reflect the deduction of taxes that a shareholder would pay on Fund distributions or the redemption of Fund shares. Mutual funds are not obligations of or guaranteed by any bank and are not federally insured.
| 1 | Represents a hypothetical investment of $10,000 in the Fund after deducting applicable sales charges: for Class A Shares, the maximum sales charge of 5.50% ($10,000 investment minus $550 sales charges = $9,450); for Class B Shares, the maximum contingent deferred sales charge is 5.50% on any redemption less than one year from the purchase date; for Class C Shares, a 1.00% contingent deferred sales charge would be applied to any redemption less than one year from the purchase date. The Fund's performance assumes the reinvestment of all dividends and distributions. The R1000G and MLGFA have been adjusted to reflect reinvestment of dividends on securities. |
| 2 | The R1000G measures the performance of the large-cap growth segment of the U.S. equity universe. It includes those Russell 1000® Index companies with higher price-to-book ratios and higher forecasted growth values. The R1000G is constructed to provide a comprehensive and unbiased barometer for the large-cap growth segment. The R1000G is completely reconstituted annually to ensure new and growing equities are included and that the represented companies continue to reflect growth characteristics. The R1000G is unmanaged and, unlike the Fund, is not affected by cash flows. It is not possible to invest directly in an index. The R1000G is not adjusted to reflect sales charges, expenses or other fees that the Securities and Exchange Commission requires to be reflected in the Fund's performance. |
| 3 | Morningstar figures represent the average of the total returns reported by all the funds designated by Morningstar as falling into the respective category indicated. They do not reflect sales charges. The Morningstar figures in the Growth of $10,000 line graph are based on historical return information published by Morningstar and reflect the return of the funds comprising the category in the year of publication. Because the funds designated by Morningstar as falling into the category can change over time, the Morningstar figures in the line graph may not match the Morningstar figures in the Average Annual Total Returns table, which reflect the return of the funds that currently comprise the category. |
Annual Shareholder Report
Portfolio of Investments Summary Table (unaudited)
At July 31, 2019, the Fund's sector composition1 was as follows:
| Sector Composition | Percentage of
Total Net Assets |
| Information Technology | 36.1% |
| Consumer Discretionary | 15.3% |
| Health Care | 14.2% |
| Communication Services | 12.4% |
| Industrials | 10.1% |
| Consumer Staples | 4.9% |
| Financials | 4.2% |
| Energy | 0.5% |
| Materials | 0.3% |
| Securities Lending Collateral2 | 0.1% |
| Cash Equivalents3 | 2.0% |
| Other Assets and Liabilities—Net4 | (0.1)% |
| TOTAL | 100.0% |
| 1 | Except for Cash Equivalents and Other Assets and Liabilities, sector classifications are based upon, and individual portfolio securities are assigned to, the classifications of the Global Industry Classification Standard (GICS) except that the Adviser assigns a classification to securities not classified by the GICS and to securities for which the Adviser does not have access to the classification made by the GICS. |
| 2 | Represents cash collateral received for portfolio securities on loan that may be invested in affiliated money market funds, other money market instruments and/or repurchase agreements. |
| 3 | Cash Equivalents include any investments in money market mutual funds and/or overnight repurchase agreements other than those representing cash collateral for securities lending. |
| 4 | Assets, other than investments in securities, less liabilities. See Statement of Assets and Liabilities. |
Annual Shareholder Report
Portfolio of Investments
July 31, 2019
| Shares | | | Value |
| | | COMMON STOCKS—98.0% | |
| | | Communication Services—12.4% | |
| 540 | 1 | AMC Networks, Inc. | $28,825 |
| 3,642 | 1 | Alphabet, Inc., Class A | 4,436,684 |
| 6,362 | 1 | Charter Communications, Inc. | 2,451,788 |
| 9,100 | 1 | Discovery, Inc. | 275,821 |
| 16,398 | 1 | Facebook, Inc. | 3,184,984 |
| 2,776 | 1 | IAC Interactive Corp. | 663,603 |
| 37,183 | 1 | Live Nation Entertainment, Inc. | 2,679,407 |
| 60,498 | 1 | MSG Networks, Inc. | 1,148,857 |
| 20,898 | | Verizon Communications, Inc. | 1,155,032 |
| | | TOTAL | 16,025,001 |
| | | Consumer Discretionary—15.3% | |
| 3,023 | 1 | Amazon.com, Inc. | 5,643,276 |
| 60 | 1 | AutoZone, Inc. | 67,383 |
| 10,246 | 2 | Bed Bath & Beyond, Inc. | 99,489 |
| 6,069 | 1 | Burlington Stores, Inc. | 1,096,972 |
| 904 | 1 | Chipotle Mexican Grill, Inc. | 719,159 |
| 15,732 | | Dunkin' Brands Group, Inc. | 1,261,077 |
| 13,659 | | eBay, Inc. | 562,614 |
| 23,476 | | Expedia Group, Inc. | 3,116,204 |
| 25,317 | | Ford Motor Co. | 241,271 |
| 5,804 | 1 | Fossil, Inc. | 64,076 |
| 4,516 | 1,2 | GNC Holdings, Inc. | 9,393 |
| 8,984 | | Hilton Worldwide Holdings, Inc. | 867,405 |
| 9,826 | | Home Depot, Inc. | 2,099,718 |
| 13,787 | | Lowe's Cos., Inc. | 1,398,002 |
| 1,382 | 1 | Lululemon Athletica, Inc. | 264,087 |
| 5,600 | 1 | Sally Beauty Holdings, Inc. | 76,944 |
| 1,595 | 1 | Tempur Sealy International, Inc. | 127,951 |
| 2,169 | | Toll Brothers, Inc. | 78,019 |
| 1,477 | | Tractor Supply Co. | 160,712 |
| 9,449 | | Tupperware Brands Corp. | 144,664 |
| 2,647 | 1 | Visteon Corp. | 174,384 |
| 1,921 | 1 | Weight Watchers International, Inc. | 41,590 |
| 29,559 | | Wyndham Destinations, Inc. | 1,391,047 |
Annual Shareholder Report
| Shares | | | Value |
| | | COMMON STOCKS—continued | |
| | | Consumer Discretionary—continued | |
| 1,360 | | Yum! Brands, Inc. | $153,027 |
| | | TOTAL | 19,858,464 |
| | | Consumer Staples—4.9% | |
| 996 | | Church and Dwight, Inc. | 75,138 |
| 5,640 | | Costco Wholesale Corp. | 1,554,553 |
| 11,820 | | Estee Lauder Cos., Inc., Class A | 2,177,126 |
| 12,348 | | Flowers Foods, Inc. | 292,648 |
| 291 | | Hershey Foods Corp. | 44,156 |
| 379 | | Kimberly-Clark Corp. | 51,411 |
| 15,080 | | PepsiCo, Inc. | 1,927,375 |
| 609 | 1 | Post Holdings, Inc. | 65,297 |
| 3,448 | | Sysco Corp. | 236,430 |
| | | TOTAL | 6,424,134 |
| | | Energy—0.5% | |
| 18,194 | | Continental Resources, Inc. | 676,271 |
| | | Financials—4.2% | |
| 27,126 | | Citizens Financial Group, Inc. | 1,010,715 |
| 6,125 | | Everest Re Group Ltd. | 1,510,670 |
| 4,543 | | MSCI, Inc., Class A | 1,032,351 |
| 8,748 | | Progressive Corp., OH | 708,413 |
| 2,756 | | Prudential Financial, Inc. | 279,210 |
| 4,952 | | RenaissanceRe Holdings Ltd. | 897,055 |
| 2,300 | | Waddell & Reed Financial, Inc., Class A | 40,250 |
| | | TOTAL | 5,478,664 |
| | | Health Care—14.2% | |
| 8,753 | 1 | Alexion Pharmaceuticals, Inc. | 991,627 |
| 10,892 | 1 | Biogen, Inc. | 2,590,335 |
| 427 | | Bristol-Myers Squibb Co. | 18,963 |
| 1,496 | 1 | Exelixis, Inc. | 31,820 |
| 24,866 | | HCA Healthcare, Inc. | 3,319,860 |
| 4,122 | 1 | IDEXX Laboratories, Inc. | 1,162,610 |
| 7,237 | 1 | Incyte Genomics, Inc. | 614,566 |
| 4,018 | 1 | Jazz Pharmaceuticals PLC. | 560,029 |
| 1,622 | 1 | Mettler-Toledo International, Inc. | 1,227,449 |
| 2,416 | 1 | Molina Healthcare, Inc. | 320,797 |
| 3,637 | 1 | Myriad Genetics, Inc. | 105,982 |
| 14,671 | | Stryker Corp. | 3,077,682 |
| 19,454 | 1 | Veeva Systems, Inc. | 3,227,419 |
Annual Shareholder Report
| Shares | | | Value |
| | | COMMON STOCKS—continued | |
| | | Health Care—continued | |
| 7,170 | 1 | Vertex Pharmaceuticals, Inc. | $1,194,665 |
| | | TOTAL | 18,443,804 |
| | | Industrials—10.1% | |
| 7,524 | | Boeing Co. | 2,567,038 |
| 12,595 | | CSX Corp. | 886,688 |
| 7,071 | | Caterpillar, Inc. | 931,039 |
| 2,602 | 1 | CoStar Group, Inc. | 1,601,271 |
| 406 | | Grainger (W.W.), Inc. | 118,158 |
| 12,012 | | Heico Corp. | 1,642,641 |
| 13,961 | 1 | Jet Blue Airways Corp. | 268,470 |
| 2,794 | | Lennox International, Inc. | 716,605 |
| 11,600 | | Lockheed Martin Corp. | 4,201,172 |
| 28,428 | | Pitney Bowes, Inc. | 115,133 |
| 3,882 | | R.R. Donnelley & Sons Co. | 7,842 |
| | | TOTAL | 13,056,057 |
| | | Information Technology—36.1% | |
| 236 | | Accenture PLC | 45,449 |
| 7,841 | 1 | Adobe, Inc. | 2,343,361 |
| 6,003 | 1 | Ansys, Inc. | 1,219,329 |
| 30,767 | | Apple, Inc. | 6,554,602 |
| 11,657 | 1 | Autodesk, Inc. | 1,820,474 |
| 22,254 | | Automatic Data Processing, Inc. | 3,705,736 |
| 663 | | Booz Allen Hamilton Holding Corp. | 45,581 |
| 2,080 | | CDW Corp. | 245,773 |
| 31,057 | 1 | Cadence Design Systems, Inc. | 2,295,423 |
| 2,057 | 1 | Coupa Software, Inc. | 279,156 |
| 527 | 1 | Fair Isaac & Co., Inc. | 183,090 |
| 3,143 | 1 | FleetCor Technologies, Inc. | 893,146 |
| 10,233 | 1 | Fortinet, Inc. | 821,812 |
| 18,733 | | Global Payments, Inc. | 3,145,645 |
| 1,452 | 1,2 | HubSpot, Inc. | 259,502 |
| 6,653 | | Intuit, Inc. | 1,844,943 |
| 16,126 | | Mastercard, Inc. | 4,390,626 |
| 46,675 | | Microsoft Corp. | 6,360,402 |
| 11,575 | | NetApp, Inc. | 677,022 |
| 2,797 | 1 | Paycom Software, Inc. | 673,378 |
| 16,081 | 1 | PayPal, Inc. | 1,775,342 |
| 7,455 | 1 | Salesforce.com, Inc. | 1,151,798 |
Annual Shareholder Report
| Shares | | | Value |
| | | COMMON STOCKS—continued | |
| | | Information Technology—continued | |
| 7,746 | 1 | ServiceNow, Inc. | $2,148,663 |
| 4,150 | | Universal Display Corp. | 875,982 |
| 6,577 | 1 | WEX, Inc. | 1,434,246 |
| 44,090 | | Western Union Co. | 925,890 |
| 917 | 1 | Zebra Technologies Corp., Class A | 193,386 |
| 5,333 | 1 | Zendesk, Inc. | 445,626 |
| | | TOTAL | 46,755,383 |
| | | Materials—0.3% | |
| 1,426 | | Grace (W.R.) & Co. | 96,697 |
| 387 | | Scotts Miracle-Gro Co. | 43,414 |
| 384 | | Sherwin-Williams Co. | 197,007 |
| | | TOTAL | 337,118 |
| | | TOTAL COMMON STOCKS
(IDENTIFIED COST $104,509,552) | 127,054,896 |
| | | INVESTMENT COMPANIES—2.1% | |
| 145,725 | | Federated Government Obligations Fund, Premier Shares, 2.25%3 | 145,725 |
| 2,521,943 | | Federated Institutional Prime Value Obligations Fund, Institutional Shares, 2.39%3 | 2,522,699 |
| | | TOTAL INVESTMENT COMPANIES
(IDENTIFIED COST $2,667,836) | 2,668,424 |
| | | TOTAL INVESTMENT IN SECURITIES—100.1%
(IDENTIFIED COST $107,177,388)4 | 129,723,320 |
| | | OTHER ASSETS AND LIABILITIES - NET—(0.1)%5 | (78,035) |
| | | TOTAL NET ASSETS—100% | $129,645,285 |
Annual Shareholder Report
Affiliated fund holdings are investment companies which are managed by the Adviser or an affiliate of the Adviser. Transactions with affiliated fund holdings during the period ended July 31, 2019, were as follows:
| | Federated
Government
Obligations Fund,
Premier Shares* | Federated
Institutional
Prime Value
Obligations Fund,
Institutional Shares | Total
Affiliated
Transactions |
| Balance of Shares Held 7/31/2018 | 280,960 | 1,197,370 | 1,478,330 |
| Purchases/Additions | 7,123,342 | 21,650,720 | 28,774,062 |
| Sales/Reductions | (7,258,577) | (20,326,147) | (27,584,724) |
| Balance of Shares Held 7/31/2019 | 145,725 | 2,521,943 | 2,667,668 |
| Value | $145,725 | $2,522,699 | $2,668,424 |
| Change in Unrealized Appreciation/Depreciation | N/A | $226 | $226 |
| Net Realized Gain/(Loss) | N/A | $(289) | $(289) |
| Dividend Income | $9,655 | $61,140 | $70,795 |
| * | All or a portion of the balance/activity for the fund relates to cash collateral received on securities lending transactions. |
| 1 | Non-income-producing security. |
| 2 | All or a portion of these securities are temporarily on loan to unaffiliated broker/dealers. |
| 3 | 7-day net yield. |
| 4 | The cost of investments for federal tax purposes amounts to $107,244,983. |
| 5 | Assets, other than investments in securities, less liabilities. See Statement of Assets and Liabilities. |
Note: The categories of investments are shown as a percentage of total net assets at July 31, 2019.
Various inputs are used in determining the value of the Fund's investments. These inputs are summarized in the three broad levels listed below:
Level 1—quoted prices in active markets for identical securities.
Level 2—other significant observable inputs (including quoted prices for similar securities, interest rates, prepayment speeds, credit risk, etc.). Also includes securities valued at amortized cost.
Level 3—significant unobservable inputs (including the Fund's own assumptions in determining the fair value of investments).
The inputs or methodology used for valuing securities are not an indication of the risk associated with investing in those securities.
As of July 31, 2019, all investments of the Fund utilized Level 1 inputs in valuing the Fund's assets carried at fair value.
See Notes which are an integral part of the Financial Statements
Annual Shareholder Report
Financial Highlights–Class A Shares
(For a Share Outstanding Throughout Each Period)
| Year Ended July 31 | 2019 | 2018 | 2017 | 2016 | 2015 |
| Net Asset Value, Beginning of Period | $20.66 | $17.46 | $15.18 | $17.64 | $16.15 |
| Income From Investment Operations: | | | | | |
| Net investment income (loss)1 | (0.05) | (0.07) | 0.01 | 0.04 | 0.02 |
| Net realized and unrealized gain (loss) | 2.01 | 4.67 | 2.36 | (0.70) | 1.47 |
| TOTAL FROM INVESTMENT OPERATIONS | 1.96 | 4.60 | 2.37 | (0.66) | 1.49 |
| Less Distributions: | | | | | |
| Distributions from net realized gain | (1.81) | (1.40) | (0.09) | (1.80) | — |
| Net Asset Value, End of Period | $20.81 | $20.66 | $17.46 | $15.18 | $17.64 |
| Total Return2 | 11.28% | 27.38% | 15.66% | (3.62)% | 9.23% |
| Ratios to Average Net Assets: | | | | | |
| Net expenses | 1.48% | 1.52% | 1.52% | 1.50% | 1.50% |
| Net investment income (loss) | (0.27)% | (0.38)% | 0.02% | 0.28% | 0.13% |
| Expense waiver/reimbursement3 | 0.00%4 | 0.02% | 0.08% | 0.07% | 0.03% |
| Supplemental Data: | | | | | |
| Net assets, end of period (000 omitted) | $67,513 | $59,355 | $49,794 | $45,661 | $55,033 |
| Portfolio turnover | 97% | 104% | 104% | 69% | 91% |
| 1 | Per share numbers have been calculated using the average shares method. |
| 2 | Based on net asset value, which does not reflect the sales charge, redemption fee or contingent deferred sales charge, if applicable. |
| 3 | This expense decrease is reflected in both the net expense and the net investment income (loss) ratios shown above. |
| 4 | Represents less than 0.01%. |
See Notes which are an integral part of the Financial Statements
Annual Shareholder Report
Financial Highlights–Class B Shares
(For a Share Outstanding Throughout Each Period)
| Year Ended July 31 | 2019 | 2018 | 2017 | 2016 | 2015 |
| Net Asset Value, Beginning of Period | $18.85 | $16.16 | $14.16 | $16.71 | $15.41 |
| Income From Investment Operations: | | | | | |
| Net investment income (loss)1 | (0.18) | (0.20) | (0.11) | (0.07) | (0.11) |
| Net realized and unrealized gain (loss) | 1.80 | 4.29 | 2.20 | (0.68) | 1.41 |
| TOTAL FROM INVESTMENT OPERATIONS | 1.62 | 4.09 | 2.09 | (0.75) | 1.30 |
| Less Distributions: | | | | | |
| Distributions from net realized gain | (1.81) | (1.40) | (0.09) | (1.80) | — |
| Net Asset Value, End of Period | $18.66 | $18.85 | $16.16 | $14.16 | $16.71 |
| Total Return2 | 10.51% | 26.38% | 14.81% | (4.41)% | 8.44% |
| Ratios to Average Net Assets: | | | | | |
| Net expenses | 2.23% | 2.27% | 2.27% | 2.25% | 2.25% |
| Net investment income (loss) | (1.02)% | (1.13)% | (0.71)% | (0.49)% | (0.65)% |
| Expense waiver/reimbursement3 | 0.00%4 | 0.02% | 0.08% | 0.08% | 0.03% |
| Supplemental Data: | | | | | |
| Net assets, end of period (000 omitted) | $12,612 | $14,432 | $13,654 | $14,925 | $16,175 |
| Portfolio turnover | 97% | 104% | 104% | 69% | 91% |
| 1 | Per share numbers have been calculated using the average shares method. |
| 2 | Based on net asset value, which does not reflect the sales charge, redemption fee or contingent deferred sales charge, if applicable. |
| 3 | This expense decrease is reflected in both the net expense and the net investment income (loss) ratios shown above. |
| 4 | Represents less than 0.01%. |
See Notes which are an integral part of the Financial Statements
Annual Shareholder Report
Financial Highlights–Class C Shares
(For a Share Outstanding Throughout Each Period)
| Year Ended July 31 | 2019 | 2018 | 2017 | 2016 | 2015 |
| Net Asset Value, Beginning of Period | $18.35 | $15.76 | $13.81 | $16.34 | $15.07 |
| Income From Investment Operations: | | | | | |
| Net investment income (loss)1 | (0.18) | (0.19) | (0.11) | (0.06) | (0.10) |
| Net realized and unrealized gain (loss) | 1.74 | 4.18 | 2.15 | (0.67) | 1.37 |
| TOTAL FROM INVESTMENT OPERATIONS | 1.56 | 3.99 | 2.04 | (0.73) | 1.27 |
| Less Distributions: | | | | | |
| Distributions from net realized gain | (1.81) | (1.40) | (0.09) | (1.80) | — |
| Net Asset Value, End of Period | $18.10 | $18.35 | $15.76 | $13.81 | $16.34 |
| Total Return2 | 10.46% | 26.42% | 14.82% | (4.39)% | 8.43% |
| Ratios to Average Net Assets: | | | | | |
| Net expenses | 2.23% | 2.27% | 2.27% | 2.25% | 2.25% |
| Net investment income (loss) | (1.03)% | (1.13)% | (0.72)% | (0.46)% | (0.63)% |
| Expense waiver/reimbursement3 | 0.00%4 | 0.02% | 0.08% | 0.07% | 0.03% |
| Supplemental Data: | | | | | |
| Net assets, end of period (000 omitted) | $12,445 | $10,685 | $9,672 | $10,052 | $12,904 |
| Portfolio turnover | 97% | 104% | 104% | 69% | 91% |
| 1 | Per share numbers have been calculated using the average shares method. |
| 2 | Based on net asset value, which does not reflect the sales charge, redemption fee or contingent deferred sales charge, if applicable. |
| 3 | This expense decrease is reflected in both the net expense and the net investment income (loss) ratios shown above. |
| 4 | Represents less than 0.01%. |
See Notes which are an integral part of the Financial Statements
Annual Shareholder Report
Financial Highlights–Institutional Shares
(For a Share Outstanding Throughout Each Period)
| Year Ended July 31 | 2019 | 2018 | 2017 | 2016 | 2015 |
| Net Asset Value, Beginning of Period | $21.52 | $18.10 | $15.69 | $18.13 | $16.55 |
| Income From Investment Operations: | | | | | |
| Net investment income (loss)1 | (0.01) | (0.03) | 0.05 | 0.08 | 0.07 |
| Net realized and unrealized gain (loss) | 2.13 | 4.85 | 2.45 | (0.72) | 1.51 |
| TOTAL FROM INVESTMENT OPERATIONS | 2.12 | 4.82 | 2.50 | (0.64) | 1.58 |
| Less Distributions: | | | | | |
| Distributions from net realized gain | (1.81) | (1.40) | (0.09) | (1.80) | — |
| Net Asset Value, End of Period | $21.83 | $21.52 | $18.10 | $15.69 | $18.13 |
| Total Return2 | 11.59% | 27.65% | 15.98% | (3.40)% | 9.55% |
| Ratios to Average Net Assets: | | | | | |
| Net expenses | 1.22% | 1.27% | 1.27% | 1.25% | 1.25% |
| Net investment income (loss) | (0.04)% | (0.14)% | 0.27% | 0.52% | 0.37% |
| Expense waiver/reimbursement3 | 0.00%4 | 0.02% | 0.08% | 0.07% | 0.03% |
| Supplemental Data: | | | | | |
| Net assets, end of period (000 omitted) | $37,076 | $11,966 | $7,649 | $7,469 | $7,888 |
| Portfolio turnover | 97% | 104% | 104% | 69% | 91% |
| 1 | Per share numbers have been calculated using the average shares method. |
| 2 | Based on net asset value. |
| 3 | This expense decrease is reflected in both the net expense and the net investment income (loss) ratios shown above. |
| 4 | Represents less than 0.01%. |
See Notes which are an integral part of the Financial Statements
Annual Shareholder Report
Statement of Assets and Liabilities
July 31, 2019
| Assets: | | |
| Investment in securities, at value including $142,343 of securities loaned and including $2,668,424 of investment in affiliated holdings (identified cost $107,177,388) | | $129,723,320 |
| Income receivable | | 49,123 |
| Income receivable from affiliated holdings | | 9,706 |
| Receivable for investments sold | | 832,082 |
| Receivable for shares sold | | 147,215 |
| TOTAL ASSETS | | 130,761,446 |
| Liabilities: | | |
| Payable for investments purchased | $783,160 | |
| Payable for shares redeemed | 17,795 | |
| Bank overdraft | 2,703 | |
| Payable for collateral due to broker for securities lending | 145,725 | |
| Payable for investment adviser fee (Note 5) | 2,684 | |
| Payable for administrative fees (Note 5) | 284 | |
| Payable for auditing fees | 27,200 | |
| Payable for distribution services fee (Note 5) | 16,280 | |
| Payable for other service fees (Notes 2 and 5) | 33,682 | |
| Payable for share registration costs | 40,357 | |
| Accrued expenses (Note 5) | 46,291 | |
| TOTAL LIABILITIES | | 1,116,161 |
| Net assets for 6,306,508 shares outstanding | | $129,645,285 |
| Net Assets Consist of: | | |
| Paid-in capital | | $97,743,512 |
| Total distributable earnings | | 31,901,773 |
| TOTAL NET ASSETS | | $129,645,285 |
Annual Shareholder Report
Statement of Assets and Liabilities–continued
| Net Asset Value, Offering Price and Redemption Proceeds Per Share | | |
| Class A Shares: | | |
| Net asset value per share ($67,512,636 ÷ 3,244,313 shares outstanding), no par value, unlimited shares authorized | | $20.81 |
| Offering price per share (100/94.50 of $20.81) | | $22.02 |
| Redemption proceeds per share | | $20.81 |
| Class B Shares: | | |
| Net asset value per share ($12,611,914 ÷ 676,051 shares outstanding), no par value, unlimited shares authorized | | $18.66 |
| Offering price per share | | $18.66 |
| Redemption proceeds per share (94.50/100 of $18.66) | | $17.63 |
| Class C Shares: | | |
| Net asset value per share ($12,444,846 ÷ 687,496 shares outstanding), no par value, unlimited shares authorized | | $18.10 |
| Offering price per share | | $18.10 |
| Redemption proceeds per share (99.00/100 of $18.10) | | $17.92 |
| Institutional Shares: | | |
| Net asset value per share ($37,075,889 ÷ 1,698,648 shares outstanding), no par value, unlimited shares authorized | | $21.83 |
| Offering price per share | | $21.83 |
| Redemption proceeds per share | | $21.83 |
See Notes which are an integral part of the Financial Statements
Annual Shareholder Report
Statement of Operations
Year Ended July 31, 2019
| Investment Income: | | |
| Dividends (including $61,140 received from affiliated holdings*) | | $1,356,958 |
| Net income on securities loaned (includes $9,655 earned from affiliated holdings related to cash collateral balances*)(Note 2) | | 2,557 |
| TOTAL INCOME | | 1,359,515 |
| Expenses: | | |
| Investment adviser fee (Note 5) | $850,783 | |
| Administrative fee (Note 5) | 90,883 | |
| Custodian fees | 22,442 | |
| Transfer agent fee | 166,491 | |
| Directors'/Trustees' fees (Note 5) | 2,302 | |
| Auditing fees | 27,200 | |
| Legal fees | 11,915 | |
| Portfolio accounting fees | 83,979 | |
| Distribution services fee (Note 5) | 178,721 | |
| Other service fees (Notes 2 and 5) | 216,933 | |
| Share registration costs | 78,020 | |
| Printing and postage | 28,168 | |
| Miscellaneous (Note 5) | 29,911 | |
| TOTAL EXPENSES | 1,787,748 | |
| Reimbursement of investment adviser fee (Note 5) | (1,874) | |
| Net expenses | | 1,785,874 |
| Net investment income (loss) | | (426,359) |
| Realized and Unrealized Gain (Loss) on Investments: | | |
| Net realized gain on investments (including net realized loss of $(289) on sales of investments in affiliated holdings*) | | 9,852,764 |
| Net change in unrealized appreciation of investments (including net change in unrealized appreciation of $226 on investments in affiliated holdings*) | | 3,316,789 |
| Net realized and unrealized gain on investments | | 13,169,553 |
| Change in net assets resulting from operations | | $12,743,194 |
| * | See information listed after the Fund's Portfolio of Investments. |
See Notes which are an integral part of the Financial Statements
Annual Shareholder Report
Statement of Changes in Net Assets
| Year Ended July 31 | 2019 | 2018 |
| Increase (Decrease) in Net Assets | | |
| Operations: | | |
| Net investment income (loss) | $(426,359) | $(499,782) |
| Net realized gain | 9,852,764 | 10,083,407 |
| Net change in unrealized appreciation/depreciation | 3,316,789 | 11,109,591 |
| CHANGE IN NET ASSETS RESULTING FROM OPERATIONS | 12,743,194 | 20,693,216 |
| Distributions to Shareholders: | | |
| Class A Shares | (5,477,815) | (4,029,431) |
| Class B Shares | (1,293,241) | (1,111,920) |
| Class C Shares | (969,378) | (797,120) |
| Institutional Shares | (1,895,731) | (476,552) |
| CHANGE IN NET ASSETS RESULTING FROM DISTRIBUTIONS TO SHAREHOLDERS | (9,636,165) | (6,415,023) |
| Share Transactions: | | |
| Proceeds from sale of shares | 50,787,953 | 18,205,541 |
| Net asset value of shares issued to shareholders in payment of distributions declared | 9,069,033 | 5,896,339 |
| Cost of shares redeemed | (29,755,658) | (22,712,943) |
| CHANGE IN NET ASSETS RESULTING FROM SHARE TRANSACTIONS | 30,101,328 | 1,388,937 |
| Change in net assets | 33,208,357 | 15,667,130 |
| Net Assets: | | |
| Beginning of period | 96,436,928 | 80,769,798 |
| End of period | $129,645,285 | $96,436,928 |
See Notes which are an integral part of the Financial Statements
Annual Shareholder Report
Notes to Financial Statements
July 31, 2019
1. ORGANIZATION
Federated MDT Series (the “Trust”) is registered under the Investment Company Act of 1940, as amended (the “Act”), as an open-end management investment company. The Trust consists of five portfolios. The financial statements included herein are only those of Federated MDT Large Cap Growth Fund (the “Fund”), a diversified portfolio. The financial statements of the other portfolios are presented separately. The assets of each portfolio are segregated and a shareholder's interest is limited to the portfolio in which shares are held. Each portfolio pays its own expenses. The Fund offers four classes of shares: Class A Shares, Class B Shares, Class C Shares and Institutional Shares. All shares of the Fund have equal rights with respect to voting, except on class-specific matters. The investment objective of the Fund is long-term capital appreciation.
Effective August 1, 2018, an automatic conversion feature for Class C Shares was implemented. Pursuant to this automatic conversion feature, after Class C Shares have been held for ten years from the date of purchase, they will automatically convert to Class A Shares on the next monthly conversion processing date.
2. SIGNIFICANT ACCOUNTING POLICIES
The following is a summary of significant accounting policies consistently followed by the Fund in the preparation of its financial statements. These policies are in conformity with U.S. generally accepted accounting principles (GAAP).
Investment Valuation
In calculating its net asset value (NAV), the Fund generally values investments as follows:
| ■ | Equity securities listed on an exchange or traded through a regulated market system are valued at their last reported sale price or official closing price in their principal exchange or market. |
| ■ | Shares of other mutual funds or non-exchange-traded investment companies are valued based upon their reported NAVs. |
| ■ | Fixed-income securities are fair valued using price evaluations provided by a pricing service approved by the Fund's Board of Trustees (the “Trustees”). |
| ■ | Derivative contracts listed on exchanges are valued at their reported settlement or closing price, except that options are valued at the mean of closing bid and asked quotations. |
| ■ | Over-the-counter (OTC) derivative contracts are fair valued using price evaluations provided by a pricing service approved by the Trustees. |
| ■ | For securities that are fair valued in accordance with procedures established by and under the general supervision of the Trustees, certain factors may be considered, such as: the last traded or purchase price of the security, information obtained by contacting the issuer or dealers, analysis of the issuer's financial statements or other available documents, fundamental analytical data, the nature and duration of restrictions on disposition, the movement of the market in which the security is normally traded, public trading in similar securities or derivative contracts of the issuer or comparable issuers, movement of a relevant index, or other factors including but not limited to industry changes and relevant government actions. |
Annual Shareholder Report
If any price, quotation, price evaluation or other pricing source is not readily available when the NAV is calculated, if the Fund cannot obtain price evaluations from a pricing service or from more than one dealer for an investment within a reasonable period of time as set forth in the Fund's valuation policies and procedures, or if information furnished by a pricing service, in the opinion of the valuation committee (“Valuation Committee”), is deemed not representative of the fair value of such security, the Fund uses the fair value of the investment determined in accordance with the procedures described below. There can be no assurance that the Fund could obtain the fair value assigned to an investment if it sold the investment at approximately the time at which the Fund determines its NAV per share.
Fair Valuation Procedures
The Trustees have ultimate responsibility for determining the fair value of investments for which market quotations are not readily available. The Trustees have appointed a Valuation Committee comprised of officers of the Fund, Federated MDTA LLC (the “Adviser”) and certain of the Adviser's affiliated companies to assist in determining fair value and in overseeing the calculation of the NAV. The Trustees have also authorized the use of pricing services recommended by the Valuation Committee to provide fair value evaluations of the current value of certain investments for purposes of calculating the NAV. The Valuation Committee employs various methods for reviewing third-party pricing-service evaluations including periodic reviews of third-party pricing services' policies, procedures and valuation methods (including key inputs, methods, models and assumptions), transactional back-testing, comparisons of evaluations of different pricing services, and review of price challenges by the Adviser based on recent market activity. In the event that market quotations and price evaluations are not available for an investment, the Valuation Committee determines the fair value of the investment in accordance with procedures adopted by the Trustees. The Trustees periodically review and approve the fair valuations made by the Valuation Committee and any changes made to the procedures.
Factors considered by pricing services in evaluating an investment include the yields or prices of investments of comparable quality, coupon, maturity, call rights and other potential prepayments, terms and type, reported transactions, indications as to values from dealers and general market conditions. Some pricing services provide a single price evaluation reflecting the bid-side of the market for an investment (a “bid” evaluation). Other pricing services offer both bid evaluations and price evaluations indicative of a price between the prices bid and asked for the investment (a “mid” evaluation). The Fund normally uses bid evaluations for any U.S. Treasury and Agency securities, mortgage-backed securities and municipal securities. The Fund normally uses mid evaluations for any other types of fixed-income securities and any OTC derivative contracts. In the event that market quotations and price evaluations are not available for an investment, the fair value of the investment is determined in accordance with procedures adopted by the Trustees.
Annual Shareholder Report
Repurchase Agreements
The Fund may invest in repurchase agreements for short-term liquidity purposes. It is the policy of the Fund to require the other party to a repurchase agreement to transfer to the Fund's custodian or sub-custodian eligible securities or cash with a market value (after transaction costs) at least equal to the repurchase price to be paid under the repurchase agreement. The eligible securities are transferred to accounts with the custodian or sub-custodian in which the Fund holds a “securities entitlement” and exercises “control” as those terms are defined in the Uniform Commercial Code. The Fund has established procedures for monitoring the market value of the transferred securities and requiring the transfer of additional eligible securities if necessary to equal at least the repurchase price. These procedures also allow the other party to require securities to be transferred from the account to the extent that their market value exceeds the repurchase price or in exchange for other eligible securities of equivalent market value.
The insolvency of the other party or other failure to repurchase the securities may delay the disposition of the underlying securities or cause the Fund to receive less than the full repurchase price. Under the terms of the repurchase agreement, any amounts received by the Fund in excess of the repurchase price and related transaction costs must be remitted to the other party.
The Fund may enter into repurchase agreements in which eligible securities are transferred into joint trading accounts maintained by the custodian or sub-custodian for investment companies and other clients advised by the Fund's Adviser and its affiliates. The Fund will participate on a pro rata basis with the other investment companies and clients in its share of the securities transferred under such repurchase agreements and in its share of proceeds from any repurchase or other disposition of such securities.
Investment Income, Gains and Losses, Expenses and Distributions
Investment transactions are accounted for on a trade-date basis. Realized gains and losses from investment transactions are recorded on an identified-cost basis. Interest income and expenses are accrued daily. Dividend income and distributions to shareholders are recorded on the ex-dividend date. Foreign dividends are recorded on the ex-dividend date or when the Fund is informed of the ex-dividend date. Distributions of net investment income, if any, are declared and paid annually. Non-cash dividends included in dividend income, if any, are recorded at fair value. Amortization/accretion of premium and discount is included in investment income. Investment income, realized and unrealized gains and losses, and certain fund-level expenses are allocated to each class based on relative average daily net assets, except that select classes will bear certain expenses unique to those classes. The detail of the total fund expense reimbursement of $1,874 is disclosed in Note 5.
Dividends are declared separately for each class. No class has preferential dividend rights; differences in per share dividend rates are generally due to differences in separate class expenses. All distributions as indicated on the Statement of Changes in Net Assets for the year ended July 31, 2018, were from net realized gains. Accumulated net investment (loss) at July 31, 2018, was $(1,325).
Annual Shareholder Report
Other Service Fees
The Fund may pay other service fees up to 0.25% of the average daily net assets of the Fund's Class A Shares, Class B Shares and Class C Shares to unaffiliated financial intermediaries or to Federated Shareholder Services Company (FSSC) for providing services to shareholders and maintaining shareholder accounts. Subject to the terms described in the Expense Limitation note, FSSC may voluntarily reimburse the Fund for other service fees. For the year ended July 31, 2019, other service fees for the Fund were as follows:
| | Other Service
Fees Incurred |
| Class A Shares | $157,360 |
| Class B Shares | 32,888 |
| Class C Shares | 26,685 |
| TOTAL | $216,933 |
Federal Taxes
It is the Fund's policy to comply with the Subchapter M provision of the Internal Revenue Code and to distribute to shareholders each year substantially all of its income. Accordingly, no provision for federal income tax is necessary. As of and during the year ended July 31, 2019, the Fund did not have a liability for any uncertain tax positions. The Fund recognizes interest and penalties, if any, related to tax liabilities as income tax expense in the Statement of Operations. As of July 31, 2019, tax years 2016 through 2019 remain subject to examination by the Fund's major tax jurisdictions, which include the United States of America and the Commonwealth of Massachusetts.
The Fund may be subject to taxes imposed by governments of countries in which it invests. Such taxes are generally based on either income or gains earned or repatriated. The Fund accrues and applies such taxes to net investment income, net realized gains and net unrealized gains as income and/or gains are earned.
When-Issued and Delayed-Delivery Transactions
The Fund may engage in when-issued or delayed-delivery transactions. The Fund records when-issued securities on the trade date and maintains security positions such that sufficient liquid assets will be available to make payment for the securities purchased. Securities purchased on a when-issued or delayed-delivery basis are marked to market daily and begin earning interest on the settlement date. Losses may occur on these transactions due to changes in market conditions or the failure of counterparties to perform under the contract.
Annual Shareholder Report
Securities Lending
The Fund participates in a securities lending program providing for the lending of equity securities to qualified brokers. The term of the loans within the program is one year or less. The Fund normally receives cash collateral for securities loaned that may be invested in affiliated money market funds, other money market instruments and/or repurchase agreements. Investments in money market funds may include funds with a “floating” NAV that can impose redemption fees and liquidity gates, impose certain operational impediments to investing cash collateral, and, if the investee fund's NAV decreases, result in the Fund recognizing losses and being required to cover the decrease in the value of the cash collateral. Collateral is maintained at a minimum level of 100% of the market value of investments loaned, plus interest, if applicable. In accordance with the Fund's securities lending agreement, the market value of securities on loan is determined each day at the close of business and any additional collateral required to cover the value of securities on loan is delivered to the Fund on the next business day. Earnings on collateral are allocated between the borrower of the security, the securities lending agent, as a fee for its services under the program and the Fund, according to agreed-upon rates. The Fund will not have the right to vote on securities while they are on loan. However, the Fund will attempt to terminate a loan in an effort to reacquire the securities in time to vote on matters that are deemed to be material by the Adviser. There can be no assurance that the Fund will have sufficient notice of such matters to be able to terminate the loan in time to vote thereon.
Securities lending transactions are subject to Master Netting Agreements which are agreements between the Fund and its counterparties that provide for the net settlement of all transactions and collateral with the Fund, through a single payment, in the event of default or termination. Amounts presented on the Portfolio of Investments and Statement of Assets and Liabilities are not net settlement amounts but gross. As indicated below, the cash collateral received by the Fund exceeds the market value of the securities loaned reducing the net settlement amount to zero. The chart below identifies the amount of collateral received as well as the market value of securities on loan. Additionally, the securities lending agreement executed by the Fund includes an indemnification clause. This clause stipulates that the borrower will reimburse the Fund for any losses as a result of any failure of the borrower to return equivalent securities to the Fund.
As of July 31, 2019, securities subject to this type of arrangement and related collateral were as follows:
Market Value of
Securities Loaned | Collateral
Received |
| $142,343 | $145,725 |
Annual Shareholder Report
Other
The preparation of financial statements in conformity with GAAP requires management to make estimates and assumptions that affect the amounts of assets, liabilities, expenses and revenues reported in the financial statements. Actual results could differ from those estimated. The Fund applies investment company accounting and reporting guidance.
3. SHARES OF BENEFICIAL INTEREST
The following tables summarize share activity:
| Year Ended July 31, | 2019 | 2018 |
| Class A Shares: | Shares | Amount | Shares | Amount |
| Shares sold | 656,472 | $13,105,404 | 467,958 | $8,917,991 |
| Shares issued to shareholders in payment of distributions declared | 287,970 | 4,964,605 | 197,851 | 3,618,696 |
| Shares redeemed | (573,201) | (11,287,981) | (644,382) | (12,286,884) |
| NET CHANGE RESULTING FROM CLASS A SHARE TRANSACTIONS | 371,241 | $6,782,028 | 21,427 | $249,803 |
| Year Ended July 31, | 2019 | 2018 |
| Class B Shares: | Shares | Amount | Shares | Amount |
| Shares sold | 15,474 | $275,427 | 66,852 | $1,147,577 |
| Shares issued to shareholders in payment of distributions declared | 81,777 | 1,269,989 | 64,836 | 1,087,294 |
| Shares redeemed | (186,625) | (3,266,416) | (211,128) | (3,561,428) |
| NET CHANGE RESULTING FROM CLASS B SHARE TRANSACTIONS | (89,374) | $(1,721,000) | (79,440) | $(1,326,557) |
| Year Ended July 31, | 2019 | 2018 |
| Class C Shares: | Shares | Amount | Shares | Amount |
| Shares sold | 287,106 | $4,940,359 | 141,746 | $2,436,968 |
| Shares issued to shareholders in payment of distributions declared | 64,160 | 966,884 | 47,820 | 780,418 |
| Shares redeemed | (245,939) | (4,453,354) | (220,940) | (3,759,274) |
| NET CHANGE RESULTING FROM CLASS C SHARE TRANSACTIONS | 105,327 | $1,453,889 | (31,374) | $(541,888) |
Annual Shareholder Report
| Year Ended July 31, | 2019 | 2018 |
| Institutional Shares: | Shares | Amount | Shares | Amount |
| Shares sold | 1,564,212 | $32,466,763 | 267,065 | $5,703,005 |
| Shares issued to shareholders in payment of distributions declared | 103,408 | 1,867,555 | 21,553 | 409,931 |
| Shares redeemed | (524,974) | (10,747,907) | (155,328) | (3,105,357) |
| NET CHANGE RESULTING FROM INSTITUTIONAL SHARE TRANSACTIONS | 1,142,646 | $23,586,411 | 133,290 | $3,007,579 |
| NET CHANGE RESULTING FROM TOTAL FUND SHARE TRANSACTIONS | 1,529,840 | $30,101,328 | 43,903 | $1,388,937 |
4. FEDERAL TAX INFORMATION
The tax character of distributions as reported on the Statement of Changes in Net Assets for the years ended July 31, 2019 and 2018, was as follows:
| | 2019 | 2018 |
| Ordinary income1 | $5,514,491 | $3,734,212 |
| Long-term capital gains | $4,121,674 | $2,680,811 |
| 1 | For tax purposes, short term capital gains distributions are considered ordinary income distributions. |
As of July 31, 2019, the components of distributable earnings on a tax-basis were as follows:
| Undistributed ordinary income2 | $3,443,868 |
| Net unrealized appreciation | $22,478,337 |
| Undistributed long-term capital gains | $5,979,568 |
| 2 | For tax purposes, short term capital gains are considered ordinary income in determining distributable earnings. |
The difference between book-basis and tax-basis net unrealized appreciation/depreciation is attributable to differing treatments for deferral of losses on wash sales.
At July 31, 2019, the cost of investments for federal tax purposes was $107,244,983. The net unrealized appreciation of investments for federal tax purposes was $22,478,337. This consists of net unrealized appreciation from investments for those securities having an excess of value over cost of $25,378,166 and net unrealized depreciation from investments for those securities having an excess of cost over value of $2,899,829.
5. INVESTMENT ADVISER FEE AND OTHER TRANSACTIONS WITH AFFILIATES
Investment Adviser Fee
The advisory agreement between the Fund and the Adviser provides for an annual fee equal to 0.75% of the Fund's average daily net assets. Subject to the terms described in the Expense Limitation note, the Adviser may voluntarily choose to waive any portion of its fee. The Adviser has agreed to reimburse the Fund for certain investment adviser fees as a result of transactions in other affiliated investment companies. For the year ended July 31, 2019, the Adviser reimbursed $1,874.
Annual Shareholder Report
Administrative Fee
Federated Administrative Services (FAS), under the Administrative Services Agreement, provides the Fund with administrative personnel and services. For purposes of determining the appropriate rate breakpoint, “Investment Complex” is defined as all of the Federated Funds subject to a fee under the Administrative Services Agreement. The fee paid to FAS is based on the average daily net assets of the Investment Complex as specified below:
| Administrative Fee | Average Daily Net Assets
of the Investment Complex |
| 0.100% | on assets up to $50 billion |
| 0.075% | on assets over $50 billion |
Subject to the terms described in the Expense Limitation note, FAS may voluntarily choose to waive any portion of its fee. For the year ended July 31, 2019, the annualized fee paid to FAS was 0.080% of average daily net assets of the Fund. In addition, FAS may charge certain out-of-pocket expenses to the Fund.
Distribution Services Fee
The Fund has adopted a Distribution Plan (the “Plan”) pursuant to Rule 12b-1 under the Act. Under the terms of the Plan, the Fund will compensate Federated Securities Corp. (FSC), the principal distributor, from the daily net assets of the Fund's Class A Shares, Class B Shares and Class C Shares to finance activities intended to result in the sale of these shares. The Plan provides that the Fund may incur distribution expenses at the following percentages of average daily net assets annually, to compensate FSC:
| | Percentage of Average Daily
Net Assets of Class |
| Class A Shares | 0.05% |
| Class B Shares | 0.75% |
| Class C Shares | 0.75% |
Subject to the terms described in the Expense Limitation note, FSC may voluntarily choose to waive any portion of its fee. For the year ended July 31, 2019, distribution services fees for the Fund were as follows:
| | Distribution Services
Fees Incurred |
| Class B Shares | $98,665 |
| Class C Shares | 80,056 |
| TOTAL | $178,721 |
When FSC receives fees, it may pay some or all of them to financial intermediaries whose customers purchase shares. For the year ended July 31, 2019, FSC retained $110,768 fees paid by the Fund. For the year ended July 31, 2019, the Fund's Class A Shares did not incur a distribution services fee; however, it may begin to incur this fee upon approval of the Trustees.
Other Service Fees
For the year ended July 31, 2019, FSSC received $45,934 of the other service fees disclosed in Note 2.
Annual Shareholder Report
Sales Charges
Front-end sales charges and contingent deferred sales charges (CDSC) do not represent expenses of the Fund. They are deducted from the proceeds of sales of Fund shares prior to investment or from redemption proceeds prior to remittance, as applicable. For the year ended July 31, 2019, FSC retained $10,183 in sales charges from the sale of Class A Shares. FSC also retained $5,343, $26,380 and $935 of CDSC relating to redemptions of Class A Shares, Class B Shares and Class C Shares, respectively.
Expense Limitation
The Adviser and certain of its affiliates (which may include FSC, FAS and FSSC) on their own initiative have agreed to waive certain amounts of their respective fees and/or reimburse expenses. Total annual fund operating expenses (as shown in the financial highlights, excluding acquired fund fees and expenses, interest expenses, extraordinary expenses and proxy-related expenses paid by the Fund, if any) paid by the Fund's Class A Shares, Class B Shares, Class C Shares and Institutional Shares (after the voluntary waivers and/or reimbursements) will not exceed 1.51%, 2.26%, 2.26% and 1.26% (the “Fee Limit”), respectively, up to but not including the later of (the “Termination Date”): (a) October 1, 2020; or (b) the date of the Fund's next effective Prospectus. While the Adviser and its applicable affiliates currently do not anticipate terminating or increasing these arrangements prior to the Termination Date, these arrangements may only be terminated or the Fee Limit increased prior to the Termination Date with the agreement of the Trustees.
Directors'/Trustees' and Miscellaneous Fees
Certain Officers and Trustees of the Fund are Officers and Directors or Trustees of certain of the above companies. To efficiently facilitate payment, Directors'/Trustees' fees and certain expenses related to conducting meetings of the Directors/Trustees and other miscellaneous expenses are paid by an affiliate of the Adviser which in due course are reimbursed by the Fund. These expenses related to conducting meetings of the Directors/Trustees and other miscellaneous expenses may be included in Accrued and Miscellaneous Expenses on the Statement of Assets and Liabilities and Statement of Operations, respectively.
6. INVESTMENT TRANSACTIONS
Purchases and sales of investments, excluding long-term U.S. government securities and short-term obligations, for the year ended July 31, 2019, were as follows:
| Purchases | $126,344,723 |
| Sales | $108,079,985 |
7. CONCENTRATION OF RISK
The Fund may invest a portion of its assets in securities of companies that are deemed by the Fund's management to be classified in similar business sectors. Economic developments may have an effect on the liquidity and volatility of the portfolio securities.
Annual Shareholder Report
8. LINE OF CREDIT
The Fund participates with certain other Federated Funds, on a several basis, in an up to $500,000,000 unsecured, 364-day, committed, revolving line of credit (LOC) agreement. The LOC was made available to finance temporarily the repurchase or redemption of shares of the Fund, failed trades, payment of dividends, settlement of trades and for other short-term, temporary or emergency general business purposes. The Fund cannot borrow under the LOC if an inter-fund loan is outstanding. The Fund's ability to borrow under the LOC also is subject to the limitations of the Act and various conditions precedent that must be satisfied before the Fund can borrow. Loans under the LOC are charged interest at a fluctuating rate per annum equal to the highest, on any day, of (a) (i) the federal funds effective rate, (ii) the one month London Interbank Offered Rate (LIBOR), and (iii) 0.0%, plus (b) a margin. The LOC also requires the Fund to pay, quarterly in arrears and at maturity, its pro rata share of a commitment fee based on the amount of the lenders' commitment that has not been utilized. As of July 31, 2019, the Fund had no outstanding loans. During the year ended July 31, 2019, the Fund did not utilize the LOC.
9. INTERFUND LENDING
Pursuant to an Exemptive Order issued by the Securities and Exchange Commission, the Fund, along with other funds advised by subsidiaries of Federated Investors, Inc., may participate in an interfund lending program. This program provides an alternative credit facility allowing the Fund to borrow from other participating affiliated funds. As of July 31, 2019, there were no outstanding loans. During the year ended July 31, 2019, the program was not utilized.
10. SUBSEQUENT EVENT
On May 16, 2019, the Trustees approved the reorganization of PNC Multi-Factor Large Cap Growth Fund, a portfolio of the PNC Funds, into the Fund. The reorganization is expected to occur in the fourth quarter of 2019, pending approval by the shareholders of the PNC fund.
Additionally, if the reorganization is approved, the “Termination Date” for the Fund's Class A Shares, Class C Shares and Institutional Shares stated under Expense Limitation in the “Investment Adviser Fee and Other Transactions with Affiliates” note shall be extended up to but not including, the later of: (a) December 1, 2020 or (b) the first day of the month following the one year anniversary of the closing date of the reorganization.
11. FEDERAL TAX INFORMATION (UNAUDITED)
For the year ended July 31, 2019, the amount of long-term capital gains designated by the Fund was $4,121,674.
For the fiscal year ended July 31, 2019, 17.32% of total ordinary income (including short-term capital gains) distributions made by the Fund are qualifying dividends which may be subject to a maximum tax rate of 15%, as provided for by the Jobs and Growth Tax Relief Act of 2003. Complete information is reported in conjunction with the reporting of your distributions on Form 1099-DIV.
Of the ordinary income distributions made by the Fund during the year ended July 31, 2019, 17.17% qualify for the dividend received deduction available to corporate shareholders.
Annual Shareholder Report
Report of Independent Registered Public Accounting Firm
TO THE BOARD OF trustees OF Federated MDt series AND SHAREHOLDERS OF federated mdt large cap growth fund:
Opinion on the Financial Statements
We have audited the accompanying statement of assets and liabilities of Federated MDT Large Cap Growth Fund (the “Fund”) (one of the portfolios constituting Federated MDT Series (the “Trust”)), including the portfolio of investments, as of July 31, 2019, and the related statement of operations for the year then ended, the statement of changes in net assets for each of the two years in the period then ended, the financial highlights for each of the five years in the period then ended and the related notes (collectively referred to as the “financial statements”). In our opinion, the financial statements present fairly, in all material respects, the financial position of the Fund (one of the funds constituting Federated MDT Series) at July 31, 2019, the results of its operations for the year then ended, the changes in its net assets for each of the two years in the period then ended and its financial highlights for each of the five years in the period then ended, in conformity with U.S. generally accepted accounting principles.
Basis for Opinion
These financial statements are the responsibility of the Trust's management. Our responsibility is to express an opinion on the Fund's financial statements based on our audits. We are a public accounting firm registered with the Public Company Accounting Oversight Board (United States) (PCAOB) and are required to be independent with respect to the Trust in accordance with the U.S. federal securities laws and the applicable rules and regulations of the Securities and Exchange Commission and the PCAOB.
We conducted our audits in accordance with standards of the PCAOB. Those standards require that we plan and perform the audit to obtain reasonable assurance about whether the financial statements and financial highlights are free of material misstatement, whether due to error or fraud. The Trust is not required to have, nor were we engaged to perform, an audit of the Turst's internal control over financial reporting. As part of our audits, we are required to obtain an understanding of internal control over financial reporting, but not for the purpose of expressing an opinion on the effectiveness of the Trust's internal control over financial reporting. Accordingly, we express no such opinion.
Annual Shareholder Report
Our audits included performing procedures to assess the risks of material misstatement of the financial statements, whether due to error or fraud, and performing procedures that respond to those risks. Such procedures included examining, on a test basis, evidence regarding the amounts and disclosures in the financial statements. Our procedures included confirmation of securities owned as of July 31, 2019, by correspondence with the custodian and others, or by other appropriate auditing procedures where replies from others were not received. Our audits also included evaluating the accounting principles used and significant estimates made by management, as well as evaluating the overall presentation of the financial statements. We believe that our audits provide a reasonable basis for our opinion.
We have served as the auditor of one or more Federated investment companies since 1979.
Boston, Massachusetts
September 23, 2019
Annual Shareholder Report
Shareholder Expense Example (unaudited)
As a shareholder of the Fund, you incur two types of costs: (1) transaction costs, including sales charges (loads) on purchase or redemption payments; and (2) ongoing costs, including management fees and to the extent applicable, distribution (12b-1) fees and/or other service fees and other Fund expenses. This Example is intended to help you to understand your ongoing costs (in dollars) of investing in the Fund and to compare these costs with the ongoing costs of investing in other mutual funds. It is based on an investment of $1,000 invested at the beginning of the period and held for the entire period from February 1, 2019 to July 31, 2019.
ACTUAL EXPENSES
The first section of the table below provides information about actual account values and actual expenses. You may use the information in this section, together with the amount you invested, toestimate the expenses that you incurred over the period. Simply divide your account value by $1,000 (for example, an $8,600 account value divided by $1,000 = 8.6), then multiply the result by the number in the first section under the heading entitled “Expenses Paid During Period” to estimate the expenses attributable to your investment during this period.
HYPOTHETICAL EXAMPLE FOR COMPARISON PURPOSES
The second section of the table below provides information about hypothetical account values and hypothetical expenses based on the Fund's actual expense ratio and anassumed rate of return of 5% per year before expenses, which is not the Fund's actual return. Thus, you shouldnot use the hypothetical account values and expenses to estimate the actual ending account balance or your expenses for the period. Rather, these figures are required to be provided to enable you to compare the ongoing costs of investing in the Fund with other funds. To do so, compare this 5% hypothetical example with the 5% hypothetical examples that appear in the shareholder reports of the other funds.
Annual Shareholder Report
Please note that the expenses shown in the table are meant to highlight your ongoing costs only and do not reflect any transaction costs, such as sales charges (loads) on purchase or redemption payments. Therefore, the second section of the table is useful in comparing ongoing costs only, and will not help you determine the relativetotal costs of owning different funds. In addition, if these transaction costs were included, your costs would have been higher.
| | Beginning
Account Value
2/1/2019 | Ending
Account Value
7/31/2019 | Expenses Paid
During Period1 |
| Actual: | | | |
| Class A Shares | $1,000 | $1,134.10 | $7.73 |
| Class B Shares | $1,000 | $1,130.20 | $11.67 |
| Class C Shares | $1,000 | $1,129.80 | $11.67 |
| Institutional Shares | $1,000 | $1,135.20 | $6.41 |
Hypothetical (assuming a 5% return
before expenses): | | | |
| Class A Shares | $1,000 | $1,017.60 | $7.30 |
| Class B Shares | $1,000 | $1,013.80 | $11.03 |
| Class C Shares | $1,000 | $1,013.80 | $11.03 |
| Institutional Shares | $1,000 | $1,018.80 | $6.06 |
| 1 | Expenses are equal to the Fund's annualized net expense ratios, multiplied by the average account value over the period, multiplied by 181/365 (to reflect the one-half-year period). The annualized net expense ratios are as follows: |
| | |
| Class A Shares | 1.46% |
| Class B Shares | 2.21% |
| Class C Shares | 2.21% |
| Institutional Shares | 1.21% |
Annual Shareholder Report
Board of Trustees and Trust Officers
The Board of Trustees is responsible for managing the Trust's business affairs and for exercising all the Trust's powers except those reserved for the shareholders. The following tables give information about each Trustee and the senior officers of the Fund. Where required, the tables separately list Trustees who are “interested persons” of the Fund (i.e., “Interested” Trustees) and those who are not (i.e., “Independent” Trustees). Unless otherwise noted, the address of each person listed is Federated Investors Tower, 1001 Liberty Avenue, Pittsburgh, PA 15222. The address of all Independent Trustees listed is 4000 Ericsson Drive, Warrendale, PA 15086-7561; Attention: Mutual Fund Board. As of December 31, 2018, the Trust comprised five portfolio(s), and the Federated Fund Family consisted of 40 investment companies (comprising 102 portfolios). Unless otherwise noted, each Officer is elected annually. Unless otherwise noted, each Trustee oversees all portfolios in the Federated Fund Family and serves for an indefinite term. The Fund's Statement of Additional Information includes additional information about Trust Trustees and is available, without charge and upon request, by calling 1-800-341-7400.
Interested TRUSTEES Background
Name
Birth Date
Positions Held with Trust
Date Service Began | Principal Occupation(s) for Past Five Years,
Other Directorships Held and Previous Position(s) |
J. Christopher Donahue*
Birth Date: April 11, 1949
President and Trustee
Indefinite Term
Began serving: May 2006 | Principal Occupations: Principal Executive Officer and President of certain of the Funds in the Federated Fund Family; Director or Trustee of the Funds in the Federated Fund Family; President, Chief Executive Officer and Director, Federated Investors, Inc.; Chairman and Trustee, Federated Investment Management Company; Trustee, Federated Investment Counseling; Chairman and Director, Federated Global Investment Management Corp.; Chairman and Trustee, Federated Equity Management Company of Pennsylvania; Trustee, Federated Shareholder Services Company; Director, Federated Services Company.
Previous Positions: President, Federated Investment Counseling; President and Chief Executive Officer, Federated Investment Management Company, Federated Global Investment Management Corp. and Passport Research, Ltd; Chairman, Passport Research, Ltd. |
Annual Shareholder Report
Name
Birth Date
Positions Held with Trust
Date Service Began | Principal Occupation(s) for Past Five Years,
Other Directorships Held and Previous Position(s) |
John B. Fisher*
Birth Date: May 16, 1956
Trustee
Indefinite Term
Began serving: May 2016 | Principal Occupations:Principal Executive Officer and President of certain of the Funds in the Federated Fund Family; Director or Trustee of certain of the Funds in the Federated Fund Family; Vice President, Federated Investors, Inc.; President, Director/Trustee and CEO, Federated Advisory Services Company, Federated Equity Management Company of Pennsylvania, Federated Global Investment Management Corp., Federated Investment Counseling, Federated Investment Management Company; President of some of the Funds in the Federated Fund Complex and Director, Federated Investors Trust Company.
Previous Positions: President and Director of the Institutional Sales Division of Federated Securities Corp.; President and Director of Federated Investment Counseling; President and CEO of Passport Research, Ltd.; Director, Edgewood Securities Corp.; Director, Federated Services Company; Director, Federated Investors, Inc.; Chairman and Director, Southpointe Distribution Services, Inc. and President, Technology, Federated Services Company. |
| * | Reasons for “interested” status: J. Christopher Donahue and John B. Fisher are interested due to their beneficial ownership of shares of Federated Investors, Inc. and due to positions they hold with Federated and its subsidiaries. |
INDEPENDENT TRUSTEES Background
Name
Birth Date
Positions Held with Trust
Date Service Began | Principal Occupation(s) for Past Five Years,
Other Directorships Held, Previous Position(s) and Qualifications |
John T. Collins
Birth Date: January 24, 1947
Trustee
Indefinite Term
Began serving: October 2013 | Principal Occupations: Director or Trustee of the Federated Fund Family; formerly, Chairman and CEO, The Collins Group, Inc. (a private equity firm) (Retired).
Other Directorships Held: Director, Chairman of the Compensation Committee, KLX Energy Services Holdings, Inc. (oilfield services); former Director of KLX Corp. (aerospace).
Qualifications: Mr. Collins has served in several business and financial management roles and directorship positions throughout his career. Mr. Collins previously served as Chairman and CEO of The Collins Group, Inc. (a private equity firm) and as a Director of KLX Corp. Mr. Collins serves as Chairman Emeriti, Bentley University. Mr. Collins previously served as Director and Audit Committee Member, Bank of America Corp.; Director, FleetBoston Financial Corp.; and Director, Beth Israel Deaconess Medical Center (Harvard University Affiliate Hospital). |
Annual Shareholder Report
Name
Birth Date
Positions Held with Trust
Date Service Began | Principal Occupation(s) for Past Five Years,
Other Directorships Held, Previous Position(s) and Qualifications |
G. Thomas Hough
Birth Date: February 28, 1955
Trustee
Indefinite Term
Began serving: August 2015 | Principal Occupations: Director or Trustee of the Federated Fund Family; formerly, Vice Chair, Ernst & Young LLP (public accounting firm) (Retired).
Other Directorships Held: Director, Member of Governance and Compensation Committees, Publix Super Markets, Inc.; Director, Chair of the Audit Committee, Equifax, Inc.; Director, Member of the Audit Committee, Haverty Furniture Companies, Inc.
Qualifications: Mr. Hough has served in accounting, business management and directorship positions throughout his career. Mr. Hough most recently held the position of Americas Vice Chair of Assurance with Ernst & Young LLP (public accounting firm). Mr. Hough serves on the President's Cabinet and Business School Board of Visitors for the University of Alabama and is on the Business School Board of Visitors for Wake Forest University. Mr. Hough previously served as an Executive Committee member of the United States Golf Association. |
Maureen Lally-Green
Birth Date: July 5, 1949
Trustee
Indefinite Term
Began serving: August 2009 | Principal Occupations: Director or Trustee of the Federated Fund Family; Adjunct Professor of Law, Duquesne University School of Law; formerly, Dean of the Duquesne University School of Law and Professor of Law and Interim Dean of the Duquesne University School of Law; formerly, Associate General Secretary and Director, Office of Church Relations, Diocese of Pittsburgh.
Other Directorships Held: Director, CNX Resources Corporation (formerly known as CONSOL Energy Inc.).
Qualifications: Judge Lally-Green has served in various legal and business roles and directorship positions throughout her career. Judge Lally-Green previously held the position of Dean of the School of Law of Duquesne University (as well as Interim Dean). Judge Lally-Green previously served as a member of the Superior Court of Pennsylvania and as a Professor of Law, Duquesne University School of Law. Judge Lally-Green also currently holds the positions on not for profit or for profit boards of directors as follows: Director and Chair, UPMC Mercy Hospital; Director and Vice Chair, Our Campaign for the Church Alive!, Inc.; Regent, Saint Vincent Seminary; Member, Pennsylvania State Board of Education (public); and Director CNX Resources Corporation (formerly known as CONSOL Energy Inc.). Judge Lally-Green has held the positions of: Director, Auberle; Director, Epilepsy Foundation of Western and Central Pennsylvania; Director, Ireland Institute of Pittsburgh; Director, Saint Thomas More Society; Director and Chair, Catholic High Schools of the Diocese of Pittsburgh, Inc.; Director, Pennsylvania Bar Institute; Director, St. Vincent College; and Director and Chair, North Catholic High School, Inc. |
Charles F. Mansfield, Jr.
Birth Date: April 10, 1945
Trustee
Indefinite Term
Began serving: June 2006 | Principal Occupations: Director or Trustee of the Federated Fund Family; Management Consultant and Author.
Other Directorships Held: None.
Qualifications: Mr. Mansfield has served as a Marine Corps officer and in several banking, business management, educational roles and directorship positions throughout his long career. He remains active as a Management Consultant and Author. |
Annual Shareholder Report
Name
Birth Date
Positions Held with Trust
Date Service Began | Principal Occupation(s) for Past Five Years,
Other Directorships Held, Previous Position(s) and Qualifications |
Thomas M. O'Neill
Birth Date: June 14, 1951
Trustee
Indefinite Term
Began serving: August 2006 | Principal Occupations: Director or Trustee, Chair of the Audit Committee of the Federated Fund Family; Sole Proprietor, Navigator Management Company (investment and strategic consulting).
Other Directorships Held: None.
Qualifications: Mr. O'Neill has served in several business, mutual fund and financial management roles and directorship positions throughout his career. Mr. O'Neill serves as Director, Medicines for Humanity and Director, The Golisano Children's Museum of Naples, Florida. Mr. O'Neill previously served as Chief Executive Officer and President, Managing Director and Chief Investment Officer, Fleet Investment Advisors; President and Chief Executive Officer, Aeltus Investment Management, Inc.; General Partner, Hellman, Jordan Management Co., Boston, MA; Chief Investment Officer, The Putnam Companies, Boston, MA; Credit Analyst and Lending Officer, Fleet Bank; Director and Consultant, EZE Castle Software (investment order management software); and Director, Midway Pacific (lumber). |
P. Jerome Richey
Birth Date: February 23, 1949
Trustee
Indefinite Term
Began serving: October 2013 | Principal Occupations: Director or Trustee of the Federated Fund Family; Management Consultant; Retired; formerly, Senior Vice Chancellor and Chief Legal Officer, University of Pittsburgh and Executive Vice President and Chief Legal Officer, CNX Resources Corporation (formerly known as CONSOL Energy Inc.).
Other Directorships Held: None.
Qualifications: Mr. Richey has served in several business and legal management roles and directorship positions throughout his career. Mr. Richey most recently held the positions of Senior Vice Chancellor and Chief Legal Officer, University of Pittsburgh. Mr. Richey previously served as Chairman of the Board, Epilepsy Foundation of Western Pennsylvania and Chairman of the Board, World Affairs Council of Pittsburgh. Mr. Richey previously served as Chief Legal Officer and Executive Vice President, CNX Resources Corporation (formerly known as CONSOL Energy Inc.); and Board Member, Ethics Counsel and Shareholder, Buchanan Ingersoll & Rooney PC (a law firm). |
John S. Walsh
Birth Date: November 28, 1957
Trustee
Indefinite Term
Began serving: June 2006 | Principal Occupations: Director or Trustee, and Chair of the Board of Directors or Trustees, of the Federated Fund Family; President and Director, Heat Wagon, Inc. (manufacturer of construction temporary heaters); President and Director, Manufacturers Products, Inc. (distributor of portable construction heaters); President, Portable Heater Parts, a division of Manufacturers Products, Inc.
Other Directorships Held: None.
Qualifications: Mr. Walsh has served in several business management roles and directorship positions throughout his career. Mr. Walsh previously served as Vice President, Walsh & Kelly, Inc. (paving contractors). |
Annual Shareholder Report
OFFICERS
Name
Birth Date
Address
Positions Held with Trust
Date Service Began | Principal Occupation(s) for Past Five Years
and Previous Position(s) |
Lori A. Hensler
Birth Date: January 6, 1967
TREASURER
Officer since: April 2013 | Principal Occupations: Principal Financial Officer and Treasurer of the Federated Fund Family; Senior Vice President, Federated Administrative Services; Financial and Operations Principal for Federated Securities Corp. and Edgewood Services, Inc.; and Assistant Treasurer, Federated Investors Trust Company. Ms. Hensler has received the Certified Public Accountant designation.
Previous Positions: Controller of Federated Investors, Inc.; Senior Vice President and Assistant Treasurer, Federated Investors Management Company; Treasurer, Federated Investors Trust Company; Assistant Treasurer, Federated Administrative Services, Federated Administrative Services, Inc., Federated Securities Corp., Edgewood Services, Inc., Federated Advisory Services Company, Federated Equity Management Company of Pennsylvania, Federated Global Investment Management Corp., Federated Investment Counseling, Federated Investment Management Company, Passport Research, Ltd., and Federated MDTA, LLC; Financial and Operations Principal for Federated Securities Corp., Edgewood Services, Inc. and Southpointe Distribution Services, Inc. |
Peter J. Germain
Birth Date: September 3, 1959
CHIEF LEGAL OFFICER, SECRETARY and EXECUTIVE VICE PRESIDENT
Officer since: June 2006 | Principal Occupations: Mr. Germain is Chief Legal Officer, Secretary and Executive Vice President of the Federated Fund Family. He is General Counsel, Chief Legal Officer, Secretary and Executive Vice President, Federated Investors, Inc.; Trustee and Senior Vice President, Federated Investors Management Company; Trustee and President, Federated Administrative Services; Director and President, Federated Administrative Services, Inc.; Director and Vice President, Federated Securities Corp.; Director and Secretary, Federated Private Asset Management, Inc.; Secretary, Federated Shareholder Services Company; and Secretary, Retirement Plan Service Company of America. Mr. Germain joined Federated in 1984 and is a member of the Pennsylvania Bar Association.
Previous Positions: Deputy General Counsel, Special Counsel, Managing Director of Mutual Fund Services, Federated Investors, Inc.; Senior Vice President, Federated Services Company; and Senior Corporate Counsel, Federated Investors, Inc. |
Stephen F. Auth
Birth Date: September 13, 1956
101 Park Avenue
41st Floor
New York, NY 10178
CHIEF INVESTMENT OFFICER
Officer since: June 2012 | Principal Occupations: Stephen F. Auth is Chief Investment Officer of various Funds in the Federated Fund Family; Executive Vice President, Federated Investment Counseling, Federated Global Investment Management Corp. and Federated Equity Management Company of Pennsylvania.
Previous Positions: Executive Vice President, Federated Investment Management Company and Passport Research, Ltd. (investment advisory subsidiary of Federated); Senior Vice President, Global Portfolio Management Services Division; Senior Vice President, Federated Investment Management Company and Passport Research, Ltd.; Senior Managing Director and Portfolio Manager, Prudential Investments. |
Annual Shareholder Report
Name
Birth Date
Address
Positions Held with Trust
Date Service Began | Principal Occupation(s) for Past Five Years
and Previous Position(s) |
Stephen Van Meter
Birth Date: June 5, 1975
CHIEF COMPLIANCE OFFICER AND SENIOR VICE PRESIDENT
Officer since: July 2015 | Principal Occupations: Senior Vice President and Chief Compliance Officer of the Federated Fund Family; Vice President and Chief Compliance Officer of Federated Investors, Inc. and Chief Compliance Officer of certain of its subsidiaries. Mr. Van Meter joined Federated in October 2011. He holds FINRA licenses under Series 3, 7, 24 and 66.
Previous Positions: Mr. Van Meter previously held the position of Compliance Operating Officer, Federated Investors, Inc. Prior to joining Federated, Mr. Van Meter served at the United States Securities and Exchange Commission in the positions of Senior Counsel, Office of Chief Counsel, Division of Investment Management and Senior Counsel, Division of Enforcement. |
Annual Shareholder Report
Evaluation and Approval of Advisory Contract–May 2019
Federated MDT Large Cap Growth Fund (the “Fund”)
At its meetings in May 2019, the Fund's Board of Trustees (the “Board”), including a majority of those Trustees who are not “interested persons” of the Fund, as defined in the Investment Company Act of 1940 (the “Independent Trustees”) reviewed and unanimously approved the continuation of the Fund's investment advisory contract for an additional one-year term. The Board's decision regarding the contract reflects the exercise of its business judgment after considering all of the information received on whether to continue the existing arrangements.
At the request of the Independent Trustees, the Fund's Chief Compliance Officer (the CCO) furnished to the Board in advance of its May 2019 meetings an independent written evaluation presenting on the topics discussed below. The Board considered the CCO's independent written evaluation (the “CCO Fee Evaluation Report”), along with other information, in evaluating the reasonableness of the Fund's management fee and in deciding to approve the continuation of the investment advisory contract. The CCO, in preparing the CCO Fee Evaluation Report, has the authority to retain consultants, experts or staff as reasonably necessary to assist in the performance of his duties, reports directly to the Board, and can be terminated only with the approval of a majority of the Independent Trustees. At the request of the Independent Trustees, the CCO Fee Evaluation Report followed the same general approach and covered the same topics as that of the report that had previously been delivered by the CCO in his capacity as “Senior Officer,” prior to the elimination of the Senior Officer position in December 2017.
The Board also considered judicial decisions concerning allegedly excessive investment advisory fees in making its decision. Using these judicial decisions as a guide, the Board observed that the following factors may be relevant to an adviser's fiduciary duty with respect to its receipt of compensation from a fund: (1) the nature and quality of the services provided by an adviser to a fund and its shareholders (including the performance of the fund, its benchmark, and comparable funds); (2) an adviser's cost of providing the services (including the profitability to an adviser of providing advisory services to a fund); (3) the extent to which an adviser may realize “economies of scale” as a fund grows larger and, if such economies of scale exist, whether they have been shared with a fund and its shareholders or the family of funds; (4) any “fall-out” financial benefits that accrue to an adviser because of its relationship with a fund (including research services received from brokers that execute fund trades and any fees paid to affiliates of an adviser for services rendered to a fund); (5) comparative fee and expense structures (including a comparison of fees paid to an adviser with those paid by similar funds both internally and externally as well as management fees charged to institutional and other advisory clients of the
Annual Shareholder Report
adviser for what might be viewed as like services); and (6) the extent of care, conscientiousness and independence with which the fund's board members perform their duties and their expertise (including whether they are fully informed about all facts the board deems relevant to its consideration of an adviser's services and fees). The Board noted that the Securities and Exchange Commission (SEC) disclosure requirements regarding the basis for the Board's approval of the Fund's investment advisory contract generally align with the factors listed above. The Board was aware of these factors and was guided by them in its review of the Fund's investment advisory contract to the extent it considered them to be appropriate and relevant, as discussed further below.
The Board considered and weighed these factors in light of its substantial accumulated experience in governing the Fund and working with Federated MDTA LLC (the “Adviser”) and its affiliates (collectively “Federated”) on matters relating to the funds advised by Federated (each, a “Federated Fund”). The Independent Trustees were assisted in their deliberations by independent legal counsel.
In addition to the extensive materials that comprise and accompany the CCO Fee Evaluation Report, the Board received detailed information about the Fund and the Federated organization throughout the year, and in connection with its May meetings at which the Board's formal approval of the advisory and subadvisory contracts occurred. In this regard, Federated provided much of this information at each regular meeting of the Board, and furnished additional information specifically in connection with the May meetings. In the months preceding the May meetings, the Board requested and reviewed written materials prepared by Federated in response to requests on behalf of the Independent Trustees encompassing a wide variety of topics. At the May meetings, in addition to meeting in separate sessions of the Independent Trustees without management present, senior management of the Adviser also met with the Independent Trustees and their counsel to discuss the materials presented and such additional matters as the Independent Trustees deemed reasonably necessary to evaluate the advisory and subadvisory contracts. Between regularly scheduled meetings, the Board also received information on particular matters as the need arose.
The Board's consideration of the investment advisory contract included review of the CCO Fee Evaluation Report, accompanying data and additional information covering the following matters, among others: the Adviser's investment philosophy, revenue, profitability, personnel and processes; investment and operating strategies; the Fund's short-term and long-term performance (in absolute terms, both on a gross basis and net of expenses, as well as in terms relative to its particular investment program and certain competitor or “peer group” funds and/or other benchmarks, as appropriate) and comments on the reasons for performance; the Fund's investment objectives; the Fund's expenses, including the advisory fee and the overall expense structure of the Fund (both in absolute terms and relative to similar and/or competing funds), with due
Annual Shareholder Report
regard for contractual or voluntary expense limitations; the use and allocation of brokerage commissions derived from trading the Fund's portfolio securities (if any); and the nature, quality and extent of the advisory and other services provided to the Fund by the Adviser and its affiliates. The Board also considered the preferences and expectations of Fund shareholders; the entrepreneurial and other risks assumed by the Adviser in sponsoring the Fund; the continuing state of competition in the mutual fund industry and market practices; the range of comparable fees for similar funds in the mutual fund industry; the Fund's relationship to the Federated Funds which include a comprehensive array of funds with different investment objectives, policies and strategies which are generally available for exchange without the incurrence of additional sales charges; compliance and audit reports concerning the Federated Funds and the Federated companies that service them (including communications from regulatory agencies), as well as Federated's responses to any issues raised therein; and relevant developments in the mutual fund industry and how the Federated Funds and/or Federated are responding to them. The Board's evaluation process is evolutionary. The criteria considered and the emphasis placed on relevant criteria change in recognition of changing circumstances in the mutual fund marketplace.
While mindful that courts have cautioned against giving too much weight to comparative information concerning fees charged by other advisers for managing funds with comparable investment programs, the Board has found the use of such comparisons to be relevant to its deliberations. In this regard, the Board was presented with, and considered, information regarding the contractual advisory fee rates, net advisory fee rates, total expense ratios and each element of the Fund's total expense ratio (i.e., gross and net advisory fees, custody fees, portfolio accounting fees and transfer agency fees) relative to an appropriate group of peer funds compiled by Federated using data supplied by independent fund ranking organizations (the “Peer Group”). The Board received a description of the composition and methodology used to select the Peer Group. The Board focused on comparisons with other similar mutual funds more heavily than non-mutual fund products or services because it is believed that they are more relevant. For example, other mutual funds are the products most like the Fund, in that they are readily available to Fund shareholders as alternative investment vehicles. Also, they are the type of investment vehicle, in fact, chosen and maintained by the Fund's investors. The range of their fees and expenses, therefore, appears to be a relevant indicator of what consumers have found to be reasonable in the marketplace in which the Fund competes.
The Board reviewed the contractual advisory fee rate, net advisory fee rate and other expenses of the Fund and noted the position of the Fund's fee rates relative to its Peer Group. In this regard, the Board noted that the contractual advisory fee rate was above the median of the relevant Peer Group, but the Board noted the applicable waivers and reimbursements, and that the overall expense structure of the Fund remained competitive in the context of other
Annual Shareholder Report
factors considered by the Board. In this regard, the Board had been previously advised that, while comparisons to fund Peer Groups are relevant in judging the reasonableness of advisory fees, the Fund's quantitative focus makes fee and expense comparisons particularly difficult. Although the Fund's advisory fee was above the median of the peer range, the Peer Group of funds varied widely in their complexity, and the Board has been informed that the management of the Fund is among the more complex relative to its Peer Group.
For comparison, the CCO reviewed the fees charged by Federated for providing advisory services to products other than the Federated Funds (e.g., institutional separate accounts and third-party unaffiliated mutual funds for which Federated serves as sub-adviser) (referenced to as “Comparable Funds/Accounts”). With respect to Comparable Funds/Accounts other than third-party mutual funds, the CCO concluded that they are inherently different products. Those differences include, but are not limited to, different types of targeted investors; different applicable laws and regulations; different legal structures; different average account sizes and portfolio management techniques made necessary by different cash flows and different associated costs; and the time spent by portfolio managers and their teams, as well as personnel in the Funds Financial Services, Legal, Compliance and Risk Management departments, in reviewing securities pricing, addressing different administrative responsibilities, addressing different degrees of risk associated with management and a variety of different costs. The CCO also reviewed the differences in the nature of the services required for Federated to manage its proprietary mutual fund business versus managing a discrete pool of assets as a sub-adviser to another institution's mutual fund, and that Federated generally performs significant additional services and assumes substantially greater risks in managing the Fund and other Federated Funds than in its role as sub-adviser to an unaffiliated third-party mutual fund. The CCO did not consider the fees for providing advisory services to Comparable Funds/Accounts to be determinative in judging the appropriateness of the Federated Funds' advisory fees.
The CCO noted that the services, administrative responsibilities and risks associated with such relationships are quite different than serving as a primary adviser to a fund.
Following such evaluation, and full deliberations, the Board concluded that the fees and expenses of the Fund are reasonable and supported renewal of the Fund's investment advisory contract.
The Board considered the nature, extent and quality of the services provided to the Fund by the Adviser and the resources of the Adviser and its affiliates dedicated to the Fund. In this regard, the Board evaluated, among other things, the Adviser's personnel, experience, track record, financial resources, overall reputation and willingness to invest in personnel and infrastructure that benefit the Fund. In addition, the Board reviewed the qualifications, backgrounds and responsibilities of the portfolio management team primarily responsible for the day-to-day management of the Fund and the Adviser's ability and experience in
Annual Shareholder Report
attracting and retaining qualified personnel to service the Fund. The Board noted the investment research and company engagement capabilities of the Adviser and its affiliates. The Board also noted the compliance program of the Adviser and the compliance-related resources provided to the Fund by the Adviser, including the Adviser's commitment to respond to rulemaking initiatives of the SEC. The Fund's ability to deliver competitive performance when compared to its Peer Group was also deemed to be relevant by the Board as a useful indicator of how the Adviser is executing the Fund's investment program. The Adviser's ability to execute this program was one of the Board's considerations in reaching a conclusion that the nature, extent and quality of the Adviser's investment management services warrant the continuation of the investment advisory contract.
In evaluating the Fund's investment performance, the Board considered performance results in light of the Fund's investment objective, strategies and risks, as disclosed in the Fund's prospectus. The Board considered detailed investment reports on the Fund's performance that were provided to the Board throughout the year and in connection with the May meetings. The CCO also reviewed information regarding the performance of other mutual funds in the Peer Group, noting the CCO's view that comparisons to fund peer groups may be helpful, though not conclusive, in evaluating the performance of the Adviser in managing the Fund. The Board considered, in evaluating such comparisons, that in some cases there may be differences in the funds' investment objectives or investment management techniques, or the costs to implement funds, even within the same Peer Group, and that the CCO had specifically noted that the Fund's quantitative focus makes fee and expense comparisons particularly difficult as the funds in the Peer Group varied widely in their complexity, and the management of the Fund is among the more complex relative to its Peer Group.
For the one-year, three-year and five-year periods covered by the CCO Fee Evaluation Report, the Fund's performance was above the median of the relevant Peer Group. In addition, the Board was informed by the Adviser that the Fund outperformed its benchmark index for the one-year period.
Following such evaluation, and full deliberations, the Board concluded that the performance of the Fund supported renewal of the Fund's advisory contract.
The Board also received financial information about Federated, including information regarding the compensation and ancillary (or “fall-out”) benefits Federated derived from its relationships with the Federated Funds. This information covered not only the fees under the investment advisory contracts, but also fees received by Federated's subsidiaries for providing other services to the Federated Funds under separate contracts (e.g., for serving as the Federated Funds' administrator and distributor). In this regard, the Board considered that certain Federated subsidiaries provide distribution and shareholder services to the Federated Funds, for which they may be compensated through distribution
Annual Shareholder Report
and servicing fees paid pursuant to Rule 12b-1 plans or otherwise. The information also detailed any indirect benefit Federated may derive from its receipt of research services from brokers who execute Federated Fund trades. In addition, the Board considered the fact that, in order for a Federated Fund to be competitive in the marketplace, the Adviser and its affiliates frequently waived fees and/or reimbursed expenses and have disclosed to Federated Fund investors and/or indicated to the Board their intention to do so in the future. Moreover, the Board receives regular reporting as to the institution, adjustment or elimination of these voluntary waivers. The Board considered Federated's previous reductions in contractual management fees to certain Federated Funds in response to the CCO's recommendations in the prior year's CCO Fee Evaluation Report.
Federated furnished information, requested by the CCO, that reported revenues on a fund-by-fund basis and made estimates of the allocation of expenses on a fund-by-fund basis, using allocation methodologies specified by the CCO. The CCO noted that, while these cost allocation reports apply consistent allocation processes, the inherent difficulties in allocating costs continues to cause the CCO to question the precision of the process and to conclude that such reports may be unreliable, since a single change in an allocation estimate may dramatically alter the resulting estimate of cost and/or profitability of a Federated Fund and may produce unintended consequences. The allocation information, including the CCO's view that fund-by-fund estimations may be unreliable, was considered in the evaluation by the Board.
The Board and the CCO also reviewed information compiled by Federated comparing its profitability information to other publicly held fund management companies, including information regarding profitability trends over time. In this regard, the CCO concluded that Federated's profit margins did not appear to be excessive. The CCO also noted that Federated appeared financially sound, with the resources necessary to fulfill its obligations under its contracts with the Fund.
The CCO Fee Evaluation Report also discussed the notion of possible realization of “economies of scale” as a fund grows larger, the difficulties of calculating economies of scale at an individual fund level, and the extent to which potential scale benefits are shared with shareholders. In this regard, the Board considered that Federated has made significant and long-term investments in areas that support all of the Federated Funds, such as personnel and processes for the portfolio management, shareholder services, compliance, internal audit and risk management functions, as well as systems technology (including technology relating to cybersecurity) and that the benefits of these investments (as well as any economies of scale, should they exist) were likely to be shared with the Federated Fund family as a whole. The Board noted that Federated's investments in these areas are extensive. In addition, the Board considered that the Adviser and its affiliates have frequently waived fees and/or reimbursed expenses and that this has allowed potential economies of scale to be shared
Annual Shareholder Report
with shareholders. The Board also considered that such waivers and reimbursements can provide protection from an increase in expenses if a Federated Fund's assets decline. Federated, as it does throughout the year, and specifically in connection with the Board's review of the advisory and subadvisory contracts, furnished information relative to revenue sharing or adviser-paid fees. Federated and the CCO noted that this information should be viewed to determine if there was an incentive to either not apply breakpoints, or to apply breakpoints at higher levels, and should not be viewed to determine the appropriateness of advisory fees. The Board also noted the absence of any applicable regulatory or industry guidelines on this subject, which (as discussed in the CCO Fee Evaluation Report) is compounded by the lack of any common industry practice or general pattern with respect to structuring fund advisory fees with “breakpoints” that serve to reduce the fee as a fund attains a certain size.
The CCO stated that his observations and the information accompanying the CCO Fee Evaluation Report supported a finding by the Board that the management fee for the Fund was reasonable. Under these circumstances, no changes were recommended to, and no objection was raised to the continuation of, the Fund's investment advisory contract. The CCO also recognized that the Board's evaluation of the Federated Funds' advisory and subadvisory arrangements is a continuing and on-going process that is informed by the information that the Board requests and receives from management throughout the course of the year and, in this regard, the CCO noted certain items for future reporting to the Board or further consideration by management as the Board continues its on-going oversight of the Federated Funds.
In its decision to continue an existing investment advisory contract, the Board was mindful of the potential disruptions of the Fund's operations and various risks, uncertainties and other effects that could occur as a result of a decision to terminate or not renew an investment advisory contract. In particular, the Board recognized that many shareholders have invested in the Fund on the strength of the Adviser's industry standing and reputation and with the expectation that the Adviser will have a continuing role in providing advisory services to the Fund. Thus, the Board's approval of the investment advisory contract reflected the fact that it is the shareholders who have effectively selected the Adviser by virtue of having invested in the Fund. The Board concluded that, in light of the factors summarized above, including the nature, quality and scope of the services provided to the Fund by the Adviser and its affiliates, continuation of the investment advisory contract was appropriate.
Annual Shareholder Report
The Board based its decision to approve the investment advisory contract on the totality of the circumstances and relevant factors and with a view to past and future long-term considerations. Not all of the factors and considerations identified above were necessarily relevant to the Fund, nor did the Board consider any one of them to be determinative. With respect to the factors that were relevant, the Board's decision to approve the continuation of the contract reflects its view that Federated's performance and actions provided a satisfactory basis to support the decision to continue the existing arrangement.
Annual Shareholder Report
Voting Proxies on Fund Portfolio Securities
A description of the policies and procedures that the Fund uses to determine how to vote proxies, if any, relating to securities held in the Fund's portfolio is available, without charge and upon request, by calling 1-800-341-7400. A report on “Form N-PX” of how the Fund voted any such proxies during the most recent 12-month period ended June 30 is available via the Proxy Voting Record (Form N-PX) link associated with the Fund and share class name at www.FederatedInvestors.com/FundInformation. Form N-PX filings are also available at the SEC's website at www.sec.gov.
Quarterly Portfolio Schedule
Each fiscal quarter, the Fund will file with the SEC a complete schedule of its monthly portfolio holdings on “Form N-PORT.” The Fund's holdings as of the end of the third month of every fiscal quarter, as reported on Form N-PORT, will be publicly available on the SEC's website at www.sec.gov within 60 days of the end of the fiscal quarter upon filing. You may also access this information via the link to the Fund and share class name at www.FederatedInvestors.com.
Annual Shareholder Report
Mutual funds are not bank deposits or obligations, are not guaranteed by any bank and are not insured or guaranteed by the U.S. government, the Federal Deposit Insurance Corporation, the Federal Reserve Board or any other government agency. Investment in mutual funds involves investment risk, including the possible loss of principal.
This Report is authorized for distribution to prospective investors only when preceded or accompanied by the Fund's Prospectus, which contains facts concerning its objective and policies, management fees, expenses and other information.
Federated MDT Large Cap Growth Fund
Federated Investors Funds
4000 Ericsson Drive
Warrendale, PA 15086-7561
Contact us at FederatedInvestors.com
or call 1-800-341-7400.
Federated Securities Corp., Distributor
CUSIP 31421R700
CUSIP 31421R684
CUSIP 31421R809
CUSIP 31421R882
37329 (9/19)
Federated is a registered trademark of Federated Investors, Inc.
2019 ©Federated Investors, Inc.
Annual Shareholder Report
July 31, 2019
| Share Class | Ticker | A | QASCX | C | QCSCX | Institutional | QISCX | R6 | QLSCX |
Federated MDT Small Cap Core Fund
Fund Established 2005
A Portfolio of Federated MDT Series
IMPORTANT NOTICE REGARDING REPORT DELIVERY
Beginning on January 1, 2021, as permitted by regulations adopted by the Securities and Exchange Commission, paper copies of the Fund's shareholder reports like this one will no longer be sent by mail, unless you specifically request paper copies of the reports from the Fund or from your financial intermediary, such as a broker-dealer or bank. Instead, the reports will be made available on a website, and you will be notified by mail each time a report is posted and provided with a website link to access the report.
If you already elected to receive shareholder reports electronically, you will not be affected by this change and you need not take any action. You may elect to receive shareholder reports and other communications from the Fund or your financial intermediary electronically by contacting your financial intermediary (such as a broker-dealer or bank); other shareholders may call the Fund at 1-800-341-7400, Option 4.
You may elect to receive all future reports in paper free of charge. You can inform the Fund or your financial intermediary that you wish to continue receiving paper copies of your shareholder reports by contacting your financial intermediary (such as a broker-dealer or bank); other shareholders may call the Fund at 1-800-341-7400, Option 4. Your election to receive reports in paper will apply to all funds held with the Fund complex or your financial intermediary.
Not FDIC Insured ■ May Lose Value ■ No Bank Guarantee
J. Christopher
Donahue
President
Federated MDT Small Cap Core Fund
Letter from the President
Dear Valued Shareholder,
I am pleased to present the Annual Shareholder Report for your fund covering the period from August 1, 2018 through July 31, 2019. This report includes Management's Discussion of Fund Performance, a complete listing of your fund's holdings, performance information and financial statements along with other important fund information.
In addition, our website, FederatedInvestors.com, offers easy access to Federated resources that include timely fund updates, economic and market insights from our investment strategists, and financial planning tools.
Thank you for investing with Federated. I hope you find this information useful and look forward to keeping you informed.
Sincerely,
J. Christopher Donahue, President
CONTENTS
| 1 |
| 6 |
| 7 |
| 16 |
| 20 |
| 22 |
| 23 |
| 24 |
| 34 |
| 36 |
| 38 |
| 44 |
| 52 |
| 52 |
Management's Discussion of Fund Performance (unaudited)
The total return of Federated MDT Small Cap Core Fund (the “Fund”), based on net asset value for the 12-month reporting period ended July 31, 2019, was -7.69% for Class A Shares, -8.35% for Class C Shares, -7.45% for Institutional Shares and -7.45% for Class R6 Shares. The total return for the Russell 2000® Index (R2000),1 the Fund's broad-based securities market index, was -4.42% for the same period. The total return of the Morningstar Small Blend Funds Average (MSBFA),2 a peer group average for the Fund, was -4.80% during the same period. The Fund's and MSBFA's total returns for the most recently completed fiscal year reflected actual cash flows, transaction costs and other expenses, which were not reflected in the total return of the R2000.
During the reporting period, the Fund's investment strategy focused on stock selection. This was the most significant factor affecting the Fund's performance relative to the R2000 during the period.
The following discussion will focus on the performance of the Fund's Institutional Shares.
MARKET OVERVIEW
During the reporting period, overall domestic equity market performance was moderately strong as evidenced by the 7.05% return of the whole-market Russell 3000® Index.3 Larger cap stocks had a much better year than small-cap stocks.4 The Russell Top 200® Index5 returned 8.51%, and the Russell Midcap® Index6 returned 6.71%, but both the small-cap R2000 Index and the very small-cap Russell Microcap® Index7 fell (returns of -4.42% and -11.55%, respectively). For style, this was the third fiscal year in a row that growth stocks led value stocks by a substantial margin. During the reporting period, the Russell 3000® Growth Index8 returned 9.88%, and the Russell 3000® Value Index9 returned 4.23%. The widest difference between the growth and value styles was in the mid-cap range, where the Russell Midcap® Growth Index10 returned 14.15%, and the Russell Midcap Value Index11 returned 1.78%.
The best performing sectors in the R2000 during the reporting period were Utilities (17.38%), Information Technology (14.76%) and Communication Services (6.84%). Underperforming sectors during the same period included Energy (-42.79%), Materials (-18.24%) and Consumer Staples (-9.84%).
STOCK SELECTION
The Fund buys stocks with many different combinations of fundamental and technical characteristics that have signaled market outperformance historically. When looking at the Fund's combinations of these characteristics, the underperformance during the reporting period came primarily from stocks with flat or improving earnings to price and prices not near 52-week highs, and from deep value stocks with depressed prices but no significant external financing needs. Growth-oriented stocks with very high analyst conviction and strong
Annual Shareholder Report
technical factors provided a partial offset. At the end of the reporting period, the Fund's sector exposures remained close to R2000 weights, except for an underweight in the Real Estate sector (the Fund did not invest in the Real Estate sector during the period). Weak stock selection in the Financials and Industrials sectors contributed the most to the Fund's underperformance. Favorable stock selection in the Information Technology and Utilities sectors provided a partial offset.
Individual stocks enhancing the Fund's performance during the reporting period included Array BioPharma Inc., Workiva Inc. and K12 Inc.
Individual stocks detracting from the Fund's performance during the reporting period included Mallinckrodt plc, Green Dot Corporation and Weight Watchers International, Inc.
| 1 | Please see the footnotes to the line graphs below for definitions of, and further information about, the R2000. |
| 2 | Please see the footnotes to the line graphs below for definitions of, and further information about, the MSBFA. |
| 3 | The Russell 3000® Index measures the performance of the largest 3,000 U.S. companies representing approximately 98% of the investable U.S. equity market. The Russell 3000® Index is constructed to provide a comprehensive, unbiased and stable barometer of the broad market and is completely reconstituted annually to ensure new and growing equities are reflected.* |
| 4 | Small-cap stocks may be less liquid and subject to greater price volatility than large-cap stocks. |
| 5 | The Russell Top 200® Index measures the performance of the largest cap segment of the U.S. equity universe. The Russell Top 200® Index is a subset of the Russell 3000® Index. It includes approximately 200 of the largest securities based on a combination of their market cap and current index membership and represents approximately 68% of the U.S. market. The Russell Top 200® Index is constructed to provide a comprehensive and unbiased barometer for this very large cap segment and is completely reconstituted annually to ensure new and growing equities are reflected.* |
| 6 | The Russell Midcap® Index measures the performance of the mid-cap segment of the U.S. equity universe. The Russell Midcap® Index is a subset of the Russell 1000® Index. It includes approximately 800 of the smallest securities based on a combination of their market cap and current index membership. The Russell Midcap® Index represents approximately 31% of the total market capitalization of the Russell 1000® companies. The Russell Midcap® Index is constructed to provide a comprehensive and unbiased barometer for the mid-cap segment. The Russell Midcap Index is completely reconstituted annually to ensure larger stocks do not distort the performance and characteristics of the true mid-cap opportunity set.* |
| 7 | The Russell Microcap® Index measures the performance of the microcap segment of the U.S. equity market. Microcap stocks make up less than 3% of the U.S. equity market (by market cap) and consist of the smallest 1,000 securities in the small-cap Russell 2000® Index, plus the next 1,000 smallest eligible securities by market cap. The Russell Microcap® Index is constructed to provide a comprehensive and unbiased barometer for the microcap segment trading on national exchanges and is completely reconstituted annually to ensure new and growing equities are reflected and companies continue to reflect appropriate capitalization and value characteristics.* |
| 8 | The Russell 3000® Growth Index measures the performance of the broad growth segment of the U.S. equity universe. It includes those Russell 3000® Index companies with higher price-to-book ratios and higher forecasted growth values. The Russell 3000® Growth Index is constructed to provide a comprehensive, unbiased and stable barometer of the broad growth market. The Russell 3000® Growth Index is completely reconstituted annually to ensure new and growing equities are included and that the represented companies continue to reflect growth characteristics.* |
| 9 | The Russell 3000® Value Index measures the performance of the broad value segment of U.S. equity value universe. It includes those Russell 3000® Index companies with lower price-to-book ratios and lower forecasted growth values. The Russell 3000® Value Index is constructed to provide a |
Annual Shareholder Report
| | comprehensive, unbiased and stable barometer of the broad value market. The Russell 3000® Value Index is completely reconstituted annually to ensure new and growing equities are included and that the represented companies continue to reflect value characteristics.* |
| 10 | The Russell Midcap® Growth Index measures the performance of the mid-cap growth segment of the U.S. equity universe. It includes those Russell Midcap® Index companies with higher price-to-book ratios and higher forecasted growth values. The Russell Midcap® Growth Index is constructed to provide a comprehensive and unbiased barometer of the mid-cap growth market and is completely reconstituted annually to ensure larger stocks do not distort the performance and characteristics of the true mid-cap growth market.* |
| 11 | The Russell Midcap® Value Index measures the performance of the mid-cap value segment of the U.S. equity universe. It includes those Russell Midcap Index companies with lower price-to-book ratios and lower forecasted growth values. The Russell Midcap® Value Index is constructed to provide a comprehensive and unbiased barometer of the mid-cap value market and is completely reconstituted annually to ensure larger stocks do not distort the performance and characteristics of the true mid-cap value market.* |
| * | The index is unmanaged, and it is not possible to invest directly in an index. |
Annual Shareholder Report
FUND PERFORMANCE AND GROWTH OF A $10,000 INVESTMENT
The graph below illustrates the hypothetical investment of $10,0001 in the Federated MDT Small Cap Core Fund from July 31, 2009 to July 31, 2019, compared to the Russell 2000® Index (R2000)2 and the Morningstar Small Blend Funds Average (MSBFA).3 The Average Annual Total Return table below shows returns for each class averaged over the stated periods.
Growth of a $10,000 INVESTMENT
Growth of $10,000 as of July 31, 2019

| Federated MDT Small Cap Core Fund - | Institutional Shares | Class C Shares | R2000 | MSBFA |
| F | F | I | I |
| 7/31/2009 | 10,000 | 10,000 | 10,000 | 10,000 |
| 7/31/2010 | 11,508 | 11,393 | 11,843 | 11,860 |
| 7/31/2011 | 15,083 | 14,789 | 14,676 | 14,699 |
| 7/31/2012 | 14,585 | 14,147 | 14,704 | 14,510 |
| 7/31/2013 | 21,026 | 20,203 | 19,815 | 19,389 |
| 7/31/2014 | 23,198 | 22,066 | 21,511 | 21,304 |
| 7/31/2015 | 25,628 | 24,141 | 24,099 | 22,948 |
| 7/31/2016 | 27,740 | 25,860 | 24,099 | 23,082 |
| 7/31/2017 | 34,741 | 32,062 | 28,546 | 26,780 |
| 7/31/2018 | 41,266 | 37,705 | 33,894 | 30,985 |
| 7/31/2019 | 38,192 | 34,557 | 32,396 | 29,439 |
41 graphic description end -->
| ■ | Total returns shown for Class C Shares include the maximum contingent deferred sales charge of 1.00%, as applicable. |
The Fund offers multiple shares classes whose performance may be greater than or less than its other share class(es) due to differences in sales charges and expenses. See the Average Annual Total Returns table below for the returns of additional classes not shown in the line graph above.
Average Annual Total Returnsfor the Periods Ended 7/31/2019
(returns reflect all applicable sales charges and contingent deferred sales charges as specified below in footnote #1)
| | 1 Year | 5 Years | 10 Years |
| Class A Shares | -12.76% | 8.96% | 13.41% |
| Class C Shares | -9.23% | 9.39% | 13.20% |
| Institutional Shares | -7.45% | 10.49% | 14.34% |
| Class R6 Shares4 | -7.45% | 10.34% | 12.93% |
| R2000 | -4.42% | 8.53% | 12.47% |
| MSBFA | -4.80% | 6.99% | 11.80% |
Annual Shareholder Report
Performance data quoted represents past performance which is no guarantee of future results. Investment return and principal value will fluctuate so that an investor's shares, when redeemed, may be worth more or less than their original cost. Mutual fund performance changes over time and current performance may be lower or higher than what is stated. For current to the most recent month-end performance and after-tax returns, visit FederatedInvestors.com or call 1-800-341-7400. Returns shown do not reflect the deduction of taxes that a shareholder would pay on Fund distributions or the redemption of Fund shares. Mutual funds are not obligations of or guaranteed by any bank and are not federally insured.
| 1 | Represents a hypothetical investment of $10,000 in the Fund after deducting applicable sales charges: for Class A Shares, the maximum sales charge of 5.50% ($10,000 investment minus $550 sales charge = $9,450); for Class C Shares, a 1.00% contingent deferred sales charge would be applied on any redemption less than one year from the purchase date. The Fund's performance assumes the reinvestment of all dividends and distributions. The R2000 and MSBFA have been adjusted to reflect reinvestment of dividends on securities. |
| 2 | The R2000 measures the performance of the small-cap segment of the U.S. equity universe. The R2000 is a subset of the Russell 3000® Index representing approximately 10% of the total market capitalization of that index. It includes approximately 2000 of the smallest securities based on a combination of their market cap and current index membership. The R2000 is constructed to provide a comprehensive and unbiased small-cap barometer, and is completely reconstituted annually to ensure larger stocks do not distort the performance and characteristics of the true small-cap opportunity set. The R2000 is unmanaged and, unlike the Fund, is not affected by cash flows. It is not possible to invest directly in an index. The R2000 is not adjusted to reflect sales charges, expenses or other fees that the Securities and Exchange Commission requires to be reflected in the Fund's performance. |
| 3 | Morningstar figures represent the average of the total returns reported by all the funds designated by Morningstar as falling into the respective category indicated. They do not reflect sales charges. The Morningstar figures in the Growth of $10,000 line graph are based on historical return information published by Morningstar and reflect the return of the funds comprising the category in the year of publication. Because the funds designated by Morningstar as falling into the category can change over time, the Morningstar figures in the line graph may not match the Morningstar figures in the Average Annual Total Returns table, which reflect the return of the funds that currently comprise the category. |
| 4 | The Fund's R6 Class commenced operations on June 29, 2016. It is anticipated that this class will have the lowest net expenses of all outstanding share classes. For the period prior to the commencement of operations of the R6 class, the R6 class performance information shown is for the Institutional Share class, adjusted to reflect the expenses of the Fund's R6 class for each period for which the Fund's R6 class gross expenses would have exceeded the actual expense paid by the Fund's Institutional Share class. |
Annual Shareholder Report
Portfolio of Investments Summary Table (unaudited)
At July 31, 2019, the Fund's sector composition1 was as follows:
| Sector Composition | Percentage of
Total Net Assets |
| Financials | 18.7% |
| Health Care | 16.4% |
| Industrials | 16.3% |
| Information Technology | 14.5% |
| Consumer Discretionary | 12.0% |
| Utilities | 4.9% |
| Energy | 4.6% |
| Consumer Staples | 3.9% |
| Materials | 3.7% |
| Communication Services | 3.3% |
| Securities Lending Collateral2 | 3.8% |
| Cash Equivalents3 | 8.7% |
| Other Assets and Liabilities—Net4 | (10.8)% |
| TOTAL | 100.0% |
| 1 | Except for Securities Lending Collateral, Cash Equivalents and Other Assets and Liabilities, sector classifications are based upon, and individual portfolio securities are assigned to, the classifications of the Global Industry Classification Standard (GICS) except that the Adviser assigns a classification to securities not classified by the GICS and to securities for which the Adviser does not have access to the classification made by the GICS. |
| 2 | Represents cash collateral received for portfolio securities on loan that may be invested in affiliated money market funds, other money market instruments and/or repurchase agreements. |
| 3 | Cash Equivalents include any investments in money market mutual funds and/or overnight repurchase agreements other than those representing cash collateral for securities lending. |
| 4 | Assets, other than investments in securities, less liabilities. See Statement of Assets and Liabilities. |
Annual Shareholder Report
Portfolio of Investments
July 31, 2019
| Shares | | | Value |
| | | COMMON STOCKS—98.3% | |
| | | Communication Services—3.3% | |
| 43,531 | | Cogent Communications Holdings, Inc. | $2,742,888 |
| 198,610 | | Emerald Expositions Events, Inc. | 2,117,183 |
| 679,348 | 1,2 | Frontier Communications Corp. | 896,739 |
| 95,956 | 1 | Imax Corp. | 2,106,234 |
| 130,314 | 2 | Meredith Corp. | 7,149,026 |
| 15,859 | | Nexstar Media Group, Inc., Class A | 1,613,970 |
| 37,092 | | Shenandoah Telecommunications Co. | 1,459,941 |
| 53,084 | | Sinclair Broadcast Group, Inc. | 2,667,471 |
| 477,461 | | Tegna, Inc. | 7,252,633 |
| 105,735 | 1,2 | Yelp, Inc. | 3,706,012 |
| | | TOTAL | 31,712,097 |
| | | Consumer Discretionary—12.0% | |
| 27,145 | 1 | Asbury Automotive Group, Inc. | 2,499,512 |
| 24,889 | | BJ's Restaurants, Inc. | 988,093 |
| 120,824 | 1 | Beazer Homes USA, Inc. | 1,416,057 |
| 33,440 | 1 | Boot Barn Holdings, Inc. | 1,046,338 |
| 37,644 | 2 | Brinker International, Inc. | 1,500,113 |
| 27,070 | 2 | Buckle, Inc. | 550,875 |
| 162,162 | 1 | Cooper-Standard Holding, Inc. | 8,023,776 |
| 14,407 | 1 | Deckers Outdoor Corp. | 2,251,526 |
| 30,982 | 2 | Dine Brands Global, Inc. | 2,543,312 |
| 8,244 | 1 | Etsy, Inc. | 552,513 |
| 316,624 | 1 | Everi Holdings, Inc. | 3,802,654 |
| 300,725 | 1,2 | Fossil, Inc. | 3,320,004 |
| 11,425 | 1,2 | Francesca's Holdings Corp. | 35,760 |
| 23,839 | | Group 1 Automotive, Inc. | 2,001,523 |
| 438,043 | | KB HOME | 11,507,390 |
| 233,298 | 1 | K12, Inc. | 6,963,945 |
| 67,757 | | Lithia Motors, Inc., Class A | 8,935,793 |
| 59,111 | 1 | Meritage Corp. | 3,712,762 |
| 39,952 | 2 | Movado Group, Inc. | 1,051,936 |
| 215,005 | 2 | PetMed Express, Inc. | 3,734,637 |
| 81,592 | 1 | Planet Fitness, Inc. | 6,418,027 |
| 152,241 | | Rent-A-Center, Inc. | 4,115,074 |
| 267,908 | 1,2 | Sally Beauty Holdings, Inc. | 3,681,056 |
Annual Shareholder Report
| Shares | | | Value |
| | | COMMON STOCKS—continued | |
| | | Consumer Discretionary—continued | |
| 271,377 | 1,2 | SeaWorld Entertainment, Inc. | $8,295,995 |
| 265,465 | 2 | Signet Jewelers Ltd. | 4,815,535 |
| 108,543 | 1,2 | Stamps.com, Inc. | 5,182,928 |
| 332,760 | 1 | TRI Pointe Group, Inc. | 4,555,485 |
| 243,662 | 1 | Weight Watchers International, Inc. | 5,275,282 |
| 33,334 | | Wingstop, Inc. | 3,186,397 |
| 131,949 | 1,2 | YETI Holdings, Inc. | 4,586,547 |
| | | TOTAL | 116,550,845 |
| | | Consumer Staples—3.9% | |
| 91,414 | 1,2 | Chefs Warehouse, Inc. | 3,333,869 |
| 7,194 | | Coca-Cola Bottling Co. | 2,111,655 |
| 81,110 | 1,2 | elf Beauty, Inc. | 1,345,615 |
| 63,308 | 1 | Hostess Brands, Inc. | 893,909 |
| 31,960 | | Medifast, Inc. | 3,568,334 |
| 137,224 | 1,2 | National Beverage Corp. | 5,973,361 |
| 191,848 | 1 | Performance Food Group Co. | 8,412,535 |
| 19,994 | | Sanderson Farms, Inc. | 2,619,614 |
| 4,839 | 1 | The Boston Beer Co., Inc., Class A | 1,898,436 |
| 70,100 | 1,2 | USANA Health Sciences, Inc. | 4,770,305 |
| 50,347 | | Universal Corp. | 2,995,646 |
| | | TOTAL | 37,923,279 |
| | | Energy—4.6% | |
| 117,565 | 2 | Arch Coal, Inc. | 10,482,095 |
| 129,893 | 1 | CONSOL Energy, Inc. | 2,791,401 |
| 850,893 | 1,2 | Denbury Resources, Inc. | 961,509 |
| 118,854 | | Gulf Island Fabrication, Inc. | 850,995 |
| 275,917 | 1,2 | Key Energy Services, Inc. | 841,547 |
| 330,987 | 1 | Newpark Resources, Inc. | 2,525,431 |
| 309,828 | 1 | Noble Corp. PLC | 690,916 |
| 393,999 | 1 | Oil States International, Inc. | 5,878,465 |
| 357,076 | | Peabody Energy Corp. | 7,520,020 |
| 191,824 | 2 | RPC, Inc. | 1,185,472 |
| 287,634 | 1,2 | Renewable Energy Group, Inc. | 3,908,946 |
| 97,146 | | SM Energy Co. | 968,546 |
| 45,633 | | Scorpio Tankers, Inc. | 1,196,041 |
| 337,940 | 1,2 | Southwestern Energy Co. | 743,468 |
| 241,653 | 1,2 | Whiting Petroleum Corp. | 4,272,425 |
| | | TOTAL | 44,817,277 |
Annual Shareholder Report
| Shares | | | Value |
| | | COMMON STOCKS—continued | |
| | | Financials—18.7% | |
| 36,561 | | 1st Source Corp. | $1,716,539 |
| 148,421 | | American Equity Investment Life Holding Co. | 3,829,262 |
| 35,640 | | BancFirst Corp. | 2,079,238 |
| 249,851 | | BancorpSouth Bank | 7,468,046 |
| 55,969 | | Banner Corp. | 3,316,723 |
| 120,722 | | Employers Holdings, Inc. | 5,299,696 |
| 57,924 | 1 | Enova International, Inc. | 1,561,052 |
| 98,130 | 1 | Essent Group Ltd. | 4,529,681 |
| 236,210 | 1,2 | Ezcorp, Inc., Class A | 2,326,668 |
| 35,247 | | Financial Institutions, Inc. | 1,085,255 |
| 635,950 | | First BanCorp | 6,842,822 |
| 223,431 | | First Bancorp, Inc. | 8,253,541 |
| 170,742 | | First Defiance Financial Corp. | 4,903,710 |
| 48,448 | | First Guaranty Bancshares, Inc. | 1,058,589 |
| 80,924 | 2 | First Merchants Corp. | 3,189,215 |
| 510,292 | 2 | Fulton Financial Corp. | 8,674,964 |
| 151,059 | 1 | Green Dot Corp. | 7,657,181 |
| 122,259 | | Hancock Whitney Corp. | 5,076,194 |
| 106,129 | | Hometrust Bancshares, Inc. | 2,773,151 |
| 57,862 | | Iberiabank Corp. | 4,546,217 |
| 682,103 | | Investors Bancorp, Inc. | 7,748,690 |
| 52,944 | | Kemper Corp. | 4,660,131 |
| 106,611 | 2 | Kinsale Capital Group, Inc. | 9,580,064 |
| 10,084 | 1,2 | LendingTree, Inc. | 3,252,493 |
| 378,815 | | MGIC Investment Corp. | 4,867,773 |
| 156,105 | | Meridian Bancorp, Inc. | 2,862,966 |
| 145,513 | 1 | NMI Holdings, Inc. | 3,620,363 |
| 165,063 | | National Bank Holdings Corp. | 5,988,486 |
| 414,118 | 2 | National General Holdings Corp. | 10,241,138 |
| 619,631 | 2 | New York Mortgage Trust, Inc. | 3,785,945 |
| 19,683 | 1,2 | Nicolet Bankshares, Inc. | 1,293,370 |
| 169,690 | | OceanFirst Financial Corp. | 4,140,436 |
| 118,289 | | Peapack-Gladstone Financial Corp. | 3,362,956 |
| 112,685 | | QCR Holdings, Inc. | 4,311,328 |
| 187,714 | | Radian Group, Inc. | 4,279,879 |
| 21,857 | | Republic Bancorp, Inc. | 1,044,109 |
| 47,073 | | Simmons 1st National Corp., Class A | 1,212,130 |
| 47,502 | | Stifel Financial Corp. | 2,841,095 |
Annual Shareholder Report
| Shares | | | Value |
| | | COMMON STOCKS—continued | |
| | | Financials—continued | |
| 20,255 | | TowneBank | $569,976 |
| 70,286 | | TriCo Bancshares | 2,653,296 |
| 38,476 | | UMB Financial Corp. | 2,626,372 |
| 176,660 | 2 | Valley National Bancorp | 1,971,526 |
| 27,338 | | Washington Federal, Inc. | 1,000,024 |
| 227,145 | | Waterstone Financial Inc. | 3,838,750 |
| 108,805 | | Western New England Bancorp, Inc. | 1,016,239 |
| 47,820 | | Wintrust Financial Corp. | 3,421,043 |
| | | TOTAL | 182,378,322 |
| | | Health Care—16.4% | |
| 182,791 | 1,2 | AMAG Pharmaceutical, Inc. | 1,509,854 |
| 228,081 | 1 | Acorda Therapeutics, Inc. | 1,580,601 |
| 66,205 | 1,3 | Adeptus Health, Inc., Class A | 0 |
| 756,735 | 1,2 | Akorn, Inc. | 2,815,054 |
| 13,681 | 1 | Amedisys, Inc. | 1,886,473 |
| 289,904 | 1 | American Renal Associates Holdings, Inc. | 2,232,261 |
| 59,209 | 1 | Apellis Pharmaceuticals, Inc. | 1,653,707 |
| 62,956 | 1,2 | Arena Pharmaceuticals, Inc. | 3,946,082 |
| 35,905 | 1 | Arrowhead Pharmaceuticals, Inc. | 1,043,399 |
| 361,657 | 1,2 | Assertio Therapeutics, Inc. | 1,240,484 |
| 68,136 | 1 | Audentes Therapeutics, Inc. | 2,651,853 |
| 69,647 | 1 | Blueprint Medicines Corp. | 6,975,147 |
| 114,019 | | CONMED Corp. | 9,959,560 |
| 68,856 | 1,2 | Cara Therapeutics, Inc. | 1,648,413 |
| 162,316 | 1 | Cardiovascular Systems, Inc. | 7,438,942 |
| 222,570 | 1,2 | Coherus Biosciences, Inc. | 3,743,627 |
| 115,154 | 1 | Cytokinetics, Inc. | 1,403,727 |
| 21,134 | 1 | Eagle Pharmaceuticals, Inc. | 1,159,411 |
| 692,712 | 1 | Endo International PLC | 2,195,897 |
| 47,782 | | Ensign Group, Inc. | 2,879,343 |
| 73,086 | 1 | Fate Therapeutics, Inc. | 1,611,546 |
| 12,150 | 1,2 | Globus Medical, Inc. | 553,797 |
| 115,832 | 1 | HMS Holdings Corp. | 4,042,537 |
| 293,884 | 1 | Halozyme Therapeutics, Inc. | 4,993,089 |
| 47,355 | 1 | Horizon Therapeutics PLC | 1,178,666 |
| 125,533 | 1 | Inogen, Inc. | 7,720,279 |
| 115,995 | 1 | Iovance Biotherapeutics, Inc. | 2,852,317 |
| 575,101 | 1,2 | Mallinckrodt PLC | 3,916,438 |
Annual Shareholder Report
| Shares | | | Value |
| | | COMMON STOCKS—continued | |
| | | Health Care—continued | |
| 12,847 | 1 | Medicines Co. | $460,436 |
| 37,333 | 1 | Medpace Holdings, Inc. | 2,940,347 |
| 31,044 | 1 | MeiraGTx Holdings PLC | 845,949 |
| 42,214 | 1 | Mirati Therapeutics, Inc. | 4,466,241 |
| 36,192 | 1 | Molina Healthcare, Inc. | 4,805,574 |
| 140,003 | 1 | Natera, Inc. | 3,861,283 |
| 349,197 | 1 | NeoGenomics, Inc. | 8,509,931 |
| 13,157 | 1 | Novocure Ltd. | 1,094,926 |
| 17,899 | 1 | Omnicell, Inc. | 1,346,184 |
| 70,409 | 1 | Orthofix Medical, Inc. | 3,763,361 |
| 86,780 | 1 | Pacira BioSciences, Inc. | 3,808,774 |
| 105,496 | 1,2 | Ra Pharmaceuticals, Inc. | 3,591,084 |
| 15,287 | 1,2 | Reata Pharmaceuticals, Inc. | 1,385,767 |
| 155,147 | 1,2 | Repligen Corp. | 14,644,325 |
| 73,240 | 1 | Syneos Health, Inc. | 3,741,832 |
| 176,781 | 1,2 | Tenet Healthcare Corp. | 4,166,728 |
| 25,289 | 2 | U.S. Physical Therapy, Inc. | 3,264,304 |
| 212,899 | 1 | Vanda Pharmaceuticals, Inc. | 2,650,593 |
| 256,757 | 1 | Voyager Therapeutics, Inc. | 5,651,222 |
| | | TOTAL | 159,831,365 |
| | | Industrials—16.3% | |
| 155,374 | | Acco Brands Corp. | 1,519,558 |
| 25,221 | 1,2 | Aerovironment, Inc. | 1,383,372 |
| 150,967 | | Arcosa, Inc. | 5,661,263 |
| 146,796 | 1 | Atkore International Group, Inc. | 4,006,063 |
| 208,195 | 1 | CECO Environmental Corp. | 1,921,640 |
| 67,603 | 1,2 | Casella Waste Systems, Inc. | 2,947,491 |
| 83,694 | | Comfort Systems USA, Inc. | 3,515,148 |
| 245,061 | 1 | Continental Building Products, Inc. | 6,023,599 |
| 79,917 | | Deluxe Corp. | 3,565,897 |
| 174,366 | 1 | Echo Global Logistics, Inc. | 3,672,148 |
| 31,137 | | Emcor Group, Inc. | 2,627,652 |
| 71,812 | | EnPro Industries, Inc. | 5,101,525 |
| 55,829 | 1 | FTI Consulting, Inc. | 5,831,339 |
| 85,402 | 1 | Foundation Building Materials, Inc. | 1,469,769 |
| 61,290 | | GATX Corp. | 4,710,749 |
| 27,776 | 1 | Generac Holdings, Inc. | 2,008,205 |
| 129,444 | 1 | Harsco Corp. | 3,036,756 |
Annual Shareholder Report
| Shares | | | Value |
| | | COMMON STOCKS—continued | |
| | | Industrials—continued | |
| 122,541 | | Heidrick & Struggles International, Inc. | $3,639,468 |
| 50,704 | 1 | Hub Group, Inc. | 2,299,426 |
| 79,039 | | Hurco Co., Inc. | 2,702,344 |
| 52,801 | | Insperity, Inc. | 5,615,386 |
| 32,752 | | John Bean Technologies Corp. | 3,886,352 |
| 128,401 | | Korn Ferry | 5,043,591 |
| 120,081 | 1 | Masonite International Corp. | 6,400,317 |
| 27,943 | 1 | Mastec, Inc. | 1,434,035 |
| 438,520 | 2 | Maxar Technologies, Inc. | 3,227,507 |
| 42,789 | 1 | Mercury Systems, Inc. | 3,488,159 |
| 176,163 | 1 | Meritor, Inc. | 4,356,511 |
| 154,478 | | Miller Herman, Inc. | 7,004,033 |
| 34,697 | 1 | Navistar International Corp. | 1,083,934 |
| 50,742 | 2 | Quad Graphics, Inc. | 573,892 |
| 154,753 | 2 | REV Group, Inc. | 2,254,751 |
| 217,144 | 1 | Rexnord Corp. | 6,360,148 |
| 92,288 | | Rush Enterprises, Inc. | 3,475,566 |
| 40,484 | 1 | SPX Flow, Inc. | 1,642,031 |
| 52,430 | | SkyWest, Inc. | 3,183,025 |
| 196,213 | | Steelcase, Inc., Class A | 3,317,962 |
| 56,355 | 1,2 | Taser International, Inc. | 3,957,248 |
| 46,755 | | Tetra Tech, Inc. | 3,702,996 |
| 169,150 | 1 | Titan Machinery, Inc. | 3,508,171 |
| 53,479 | | Triton International Ltd. | 1,769,085 |
| 30,932 | | Unifirst Corp. | 6,089,583 |
| 118,160 | | Universal Truckload Services, Inc. | 2,326,570 |
| 39,898 | 1 | Veritiv Corp. | 695,023 |
| 114,341 | 2 | Werner Enterprises, Inc. | 3,790,404 |
| 27,460 | | Woodward, Inc. | 3,076,618 |
| | | TOTAL | 158,906,310 |
| | | Information Technology—14.5% | |
| 117,476 | | AVX Corp. | 1,789,160 |
| 23,233 | 1 | CACI International, Inc., Class A | 4,998,580 |
| 14,518 | 1 | Ciena Corp. | 656,504 |
| 59,357 | 1 | Commvault Systems, Inc. | 2,697,182 |
| 123,633 | 1 | Cornerstone OnDemand, Inc. | 7,319,074 |
| 63,852 | 1 | Coupa Software, Inc. | 8,665,355 |
| 220,394 | 1 | Diodes, Inc. | 9,388,784 |
Annual Shareholder Report
| Shares | | | Value |
| | | COMMON STOCKS—continued | |
| | | Information Technology—continued | |
| 343,177 | 1,2 | Enphase Energy, Inc. | $9,660,433 |
| 12,063 | 1 | Evo Payments, Inc. | 375,401 |
| 61,502 | 1,2 | HubSpot, Inc. | 10,991,637 |
| 29,260 | 1 | Insight Enterprises, Inc. | 1,609,885 |
| 67,568 | 2 | j2 Global, Inc. | 6,019,633 |
| 18,495 | | KBR, Inc. | 487,898 |
| 47,510 | 1 | Kimball Electronics, Inc. | 755,409 |
| 263,486 | 1 | Lattice Semiconductor Corp. | 5,095,819 |
| 256,757 | 1 | Netgear, Inc. | 8,691,224 |
| 59,132 | 1,2 | NetScout Systems, Inc. | 1,539,797 |
| 111,104 | 1,2 | PROS Holdings, Inc. | 8,039,485 |
| 114,811 | 1 | Paylocity Corp. | 11,721,055 |
| 60,257 | 1 | Rapid7, Inc. | 3,654,587 |
| 87,670 | 1 | SPS Commerce, Inc. | 9,804,136 |
| 232,492 | 1,2 | Stratasys, Inc. | 6,484,202 |
| 66,484 | 1,2 | Unisys Corp. | 823,737 |
| 74,183 | 1 | Verint Systems, Inc. | 4,292,970 |
| 146,637 | 1 | Workiva, Inc. | 8,430,161 |
| 92,422 | | XPERI Corp. | 1,973,210 |
| 54,539 | 1,2 | Zscaler, Inc. | 4,596,002 |
| | | TOTAL | 140,561,320 |
| | | Materials—3.7% | |
| 153,794 | 1,2 | Allegheny Technologies, Inc. | 3,348,095 |
| 124,954 | | Boise Cascade Co. | 3,373,758 |
| 131,806 | | Carpenter Technology Corp. | 5,932,588 |
| 59,054 | | Fuller (H.B.) Co. | 2,823,372 |
| 104,472 | | Gold Resource Corp. | 375,054 |
| 211,131 | 1 | Kraton Corp. | 6,475,388 |
| 402,148 | 1 | Livent Corp. | 2,589,833 |
| 87,515 | | Myers Industries, Inc. | 1,415,118 |
| 132,413 | | Schnitzer Steel Industries, Inc., Class A | 3,526,158 |
| 85,116 | | Trinseo SA | 3,303,352 |
| 28,208 | 1 | UFP Technologies, Inc. | 1,228,741 |
| 101,854 | 1 | Verso Corp. | 1,647,998 |
| | | TOTAL | 36,039,455 |
| | | Utilities—4.9% | |
| 81,004 | 2 | Avista Corp. | 3,728,614 |
| 654,905 | | Clearway Energy, Inc. | 11,244,719 |
Annual Shareholder Report
| Shares | | | Value |
| | | COMMON STOCKS—continued | |
| | | Utilities—continued | |
| 5,566 | | Idacorp, Inc. | $568,066 |
| 27,341 | | Northwest Natural Holding Co. | 1,952,694 |
| 202,937 | | PNM Resources, Inc. | 10,079,881 |
| 107,198 | | Portland General Electric Co. | 5,879,810 |
| 142,768 | 2 | Southwest Gas Holdings, Inc. | 12,693,503 |
| 107,559 | | TerraForm Power, Inc. | 1,657,484 |
| | | TOTAL | 47,804,771 |
| | | TOTAL COMMON STOCKS
(IDENTIFIED COST $949,794,125) | 956,525,041 |
| | | INVESTMENT COMPANIES—12.5% | |
| 37,415,748 | | Federated Government Obligations Fund, Premier Shares, 2.25%4 | 37,415,748 |
| 84,083,002 | | Federated Institutional Prime Value Obligations Fund, Institutional Shares, 2.39%4 | 84,108,227 |
| | | TOTAL INVESTMENT COMPANIES
(IDENTIFIED COST $121,521,725) | 121,523,975 |
| | | TOTAL INVESTMENT IN SECURITIES—110.8%
(IDENTIFIED COST $1,071,315,850)5 | 1,078,049,016 |
| | | OTHER ASSETS AND LIABILITIES - NET—(10.8)%6 | (105,117,458) |
| | | TOTAL NET ASSETS—100% | $972,931,558 |
Affiliated fund holdings are investment companies which are managed by the Adviser or an affiliate of the Adviser. Transactions with affiliated fund holdings during the period ended July 31, 2019, were as follows:
| | Federated
Government
Obligations Fund,
Premier Shares* | Federated
Institutional
Prime Value
Obligations Fund,
Institutional Shares* | Total of
Affiliated
Transactions |
| Balance of Shares Held 7/31/2018 | 43,276,939 | 89,106,925 | 132,383,864 |
| Purchases/Additions | 226,399,428 | 662,761,956 | 889,161,384 |
| Sales/Reductions | (232,260,619) | (667,785,879) | (900,046,498) |
| Balance of Shares Held 7/31/2019 | 37,415,748 | 84,083,002 | 121,498,750 |
| Value | $37,415,748 | $84,108,227 | $121,523,975 |
| Change in Unrealized Appreciation/Depreciation | N/A | $(4,359) | $(4,359) |
| Net Realized Gain/(Loss) | N/A | $14,594 | $14,594 |
| Dividend Income | $900,684 | $2,148,975 | $3,049,659 |
| * | All or a portion of the balance/activity for the fund relates to cash collateral received on securities lending transactions. |
| 1 | Non-income-producing security. |
| 2 | All or a portion of these securities are temporarily on loan to unaffiliated broker/dealers. |
Annual Shareholder Report
| 3 | Market quotations and price evaluations are not available. Fair value determined using significant unobservable inputs in accordance with procedures established by and under the general supervision of the Fund's Board of Trustees (the “Trustees”). |
| 4 | 7-day net yield. |
| 5 | The cost of investments for federal tax purposes amounts to $1,076,728,307. |
| 6 | Assets, other than investments in securities, less liabilities. See Statement of Assets and Liabilities. A significant portion of this balance represents loans to unaffiliated qualified brokers for securities lending. The Fund receives cash from the broker as collateral for the loaned securities and reinvests the collateral in certain short-term securities such as affiliated money market funds, other money market instruments and/or repurchase agreements. |
Note: The categories of investments are shown as a percentage of total net assets at July 31, 2019.
Various inputs are used in determining the value of the Fund's investments. These inputs are summarized in the three broad levels listed below:
Level 1—quoted prices in active markets for identical securities.
Level 2—other significant observable inputs (including quoted prices for similar securities, interest rates, prepayment speeds, credit risk, etc.). Also includes securities valued at amortized cost.
Level 3—significant unobservable inputs (including the Fund's own assumptions in determining the fair value of investments).
The inputs or methodology used for valuing securities are not an indication of the risk associated with investing in those securities.
The following is a summary of the inputs used, as of July 31, 2019, in valuing the Fund's assets carried at fair value:
| Valuation Inputs | | | | |
| | Level 1—
Quoted
Prices | Level 2—
Other
Significant
Observable
Inputs | Level 3—
Significant
Unobservable
Inputs | Total |
| Equity Securities: | | | | |
| Common Stocks | | | | |
| Domestic | $915,997,801 | $— | $0 | $915,997,801 |
| International | 40,527,240 | — | — | 40,527,240 |
| Investment Companies | 121,523,975 | — | — | 121,523,975 |
| TOTAL SECURITIES | $1,078,049,016 | $— | $0 | $1,078,049,016 |
See Notes which are an integral part of the Financial Statements
Annual Shareholder Report
Financial Highlights–Class A Shares
(For a Share Outstanding Throughout Each Period)
| Year Ended July 31 | 2019 | 2018 | 2017 | 2016 | 2015 |
| Net Asset Value, Beginning of Period | $21.19 | $18.69 | $15.08 | $15.66 | $15.07 |
| Income From Investment Operations: | | | | | |
| Net investment income (loss)1 | 0.01 | (0.01) | (0.02) | 0.03 | (0.05) |
| Net realized and unrealized gain (loss) | (1.70) | 3.38 | 3.78 | 1.02 | 1.57 |
| TOTAL FROM INVESTMENT OPERATIONS | (1.69) | 3.37 | 3.76 | 1.05 | 1.52 |
| Less Distributions: | | | | | |
| Distributions from net investment income | — | — | — | — | — |
| Distributions from net realized gain | (0.63) | (0.87) | (0.15) | (1.63) | (0.93) |
| TOTAL DISTRIBUTIONS | (0.63) | (0.87) | (0.15) | (1.63) | (0.93) |
| Net Asset Value, End of Period | $18.87 | $21.19 | $18.69 | $15.08 | $15.66 |
| Total Return2 | (7.69)% | 18.49% | 24.97% | 7.90% | 10.22% |
| Ratios to Average Net Assets: | | | | | |
| Net expenses | 1.13% | 1.14% | 1.14% | 1.13% | 1.48% |
| Net investment income (loss) | 0.07% | (0.06)% | (0.13)% | 0.19% | (0.35)% |
| Expense waiver/reimbursement3 | 0.22% | 0.37% | 0.55% | 1.10% | 0.76% |
| Supplemental Data: | | | | | |
| Net assets, end of period (000 omitted) | $68,546 | $74,396 | $37,031 | $13,035 | $7,160 |
| Portfolio turnover | 121% | 88% | 91% | 189% | 166% |
| 1 | Per share numbers have been calculated using the average shares method. |
| 2 | Based on net asset value, which does not reflect the sales charge, redemption fee or contingent deferred sales charge, if applicable. |
| 3 | This expense decrease is reflected in both the net expense and the net investment income (loss) ratios shown above. |
See Notes which are an integral part of the Financial Statements
Annual Shareholder Report
Financial Highlights–Class C Shares
(For a Share Outstanding Throughout Each Period)
| Year Ended July 31 | 2019 | 2018 | 2017 | 2016 | 2015 |
| Net Asset Value, Beginning of Period | $18.84 | $16.83 | $13.70 | $14.48 | $14.10 |
| Income From Investment Operations: | | | | | |
| Net investment income (loss)1 | (0.12) | (0.14) | (0.14) | (0.07) | (0.16) |
| Net realized and unrealized gain (loss) | (1.51) | 3.02 | 3.42 | 0.92 | 1.47 |
| TOTAL FROM INVESTMENT OPERATIONS | (1.63) | 2.88 | 3.28 | 0.85 | 1.31 |
| Less Distributions: | | | | | |
| Distributions from net investment income | — | — | — | — | — |
| Distributions from net realized gain | (0.63) | (0.87) | (0.15) | (1.63) | (0.93) |
| TOTAL DISTRIBUTIONS | (0.63) | (0.87) | (0.15) | (1.63) | (0.93) |
| Net Asset Value, End of Period | $16.58 | $18.84 | $16.83 | $13.70 | $14.48 |
| Total Return2 | (8.35)% | 17.60% | 23.98% | 7.12% | 9.41% |
| Ratios to Average Net Assets: | | | | | |
| Net expenses | 1.88% | 1.89% | 1.89% | 1.88% | 2.28% |
| Net investment income (loss) | (0.69)% | (0.81)% | (0.89)% | (0.56)% | (1.11)% |
| Expense waiver/reimbursement3 | 0.28% | 0.38% | 0.57% | 1.11% | 0.72% |
| Supplemental Data: | | | | | |
| Net assets, end of period (000 omitted) | $28,411 | $30,072 | $15,223 | $3,422 | $3,031 |
| Portfolio turnover | 121% | 88% | 91% | 189% | 166% |
| 1 | Per share numbers have been calculated using the average shares method. |
| 2 | Based on net asset value, which does not reflect the sales charge, redemption fee or contingent deferred sales charge, if applicable. |
| 3 | This expense decrease is reflected in both the net expense and the net investment income (loss) ratios shown above. |
See Notes which are an integral part of the Financial Statements
Annual Shareholder Report
Financial Highlights–Institutional Shares
(For a Share Outstanding Throughout Each Period)
| Year Ended July 31 | 2019 | 2018 | 2017 | 2016 | 2015 |
| Net Asset Value, Beginning of Period | $21.94 | $19.30 | $15.54 | $16.04 | $15.38 |
| Income From Investment Operations: | | | | | |
| Net investment income (loss)1 | 0.06 | 0.03 | 0.02 | 0.06 | (0.02) |
| Net realized and unrealized gain (loss) | (1.76) | 3.50 | 3.90 | 1.07 | 1.61 |
| TOTAL FROM INVESTMENT OPERATIONS | (1.70) | 3.53 | 3.92 | 1.13 | 1.59 |
| Less Distributions: | | | | | |
| Distributions from net investment income | (0.02) | (0.02) | — | — | — |
| Distributions from net realized gain | (0.63) | (0.87) | (0.16) | (1.63) | (0.93) |
| TOTAL DISTRIBUTIONS | (0.65) | (0.89) | (0.16) | (1.63) | (0.93) |
| Net Asset Value, End of Period | $19.59 | $21.94 | $19.30 | $15.54 | $16.04 |
| Total Return2 | (7.45)% | 18.78% | 25.24% | 8.24% | 10.48% |
| Ratios to Average Net Assets: | | | | | |
| Net expenses | 0.88% | 0.89% | 0.89% | 0.88% | 1.26% |
| Net investment income (loss) | 0.31% | 0.13% | 0.10% | 0.43% | (0.11)% |
| Expense waiver/reimbursement3 | 0.22% | 0.34% | 0.53% | 1.11% | 0.74% |
| Supplemental Data: | | | | | |
| Net assets, end of period (000 omitted) | $842,221 | $708,805 | $179,219 | $24,529 | $20,504 |
| Portfolio turnover | 121% | 88% | 91% | 189% | 166% |
| 1 | Per share numbers have been calculated using the average shares method. |
| 2 | Based on net asset value. |
| 3 | This expense decrease is reflected in both the net expense and the net investment income (loss) ratios shown above. |
See Notes which are an integral part of the Financial Statements
Annual Shareholder Report
Financial Highlights–Class R6 Shares
(For a Share Outstanding Throughout Each Period)
| | Year Ended July 31, | Period
Ended
7/31/20161 |
| 2019 | 2018 | 2017 |
| Net Asset Value, Beginning of Period | $21.94 | $19.30 | $15.54 | $13.88 |
| Income From Investment Operations: | | | | |
| Net investment income (loss)2 | 0.06 | 0.02 | 0.01 | (0.01) |
| Net realized and unrealized gain (loss) | (1.76) | 3.51 | 3.91 | 1.67 |
| TOTAL FROM INVESTMENT OPERATIONS | (1.70) | 3.53 | 3.92 | 1.66 |
| Less Distributions: | | | | |
| Distributions from net investment income | (0.02) | (0.02) | — | — |
| Distributions from net realized gain | (0.63) | (0.87) | (0.16) | — |
| TOTAL DISTRIBUTIONS | (0.65) | (0.89) | (0.16) | — |
| Net Asset Value, End of Period | $19.59 | $21.94 | $19.30 | $15.54 |
| Total Return3 | (7.45)% | 18.78% | 25.24% | 11.96% |
| Ratios to Average Net Assets: | | | | |
| Net expenses | 0.87% | 0.88% | 0.88% | 0.87%4 |
| Net investment income (loss) | 0.32% | 0.08% | 0.04% | (0.04)%4 |
| Expense waiver/reimbursement5 | 0.12% | 0.26% | 0.41% | 0.97%4 |
| Supplemental Data: | | | | |
| Net assets, end of period (000 omitted) | $33,753 | $13,374 | $1,017 | $06 |
| Portfolio turnover | 121% | 88% | 91% | 189%7 |
| 1 | Reflects operations for the period from June 29, 2016 (date of initial investment) to July 31, 2016. |
| 2 | Per share numbers have been calculated using the average shares method. |
| 3 | Based on net asset value. Total returns for periods of less than one year are not annualized. |
| 4 | Computed on an annualized basis. |
| 5 | This expense decrease is reflected in both the net expense and the net investment income (loss) ratios shown above. |
| 6 | Represents less than $1,000. |
| 7 | Portfolio turnover is calculated at the Fund level. Percentage indicated was calculated for the year ended July 31, 2016. |
See Notes which are an integral part of the Financial Statements
Annual Shareholder Report
Statement of Assets and Liabilities
July 31, 2019
| Assets: | | |
| Investment in securities, at value including $101,005,701 of securities loaned and including $121,523,975 of investment in affiliated holdings (identified cost $1,071,315,850) | | $1,078,049,016 |
| Income receivable | | 178,966 |
| Income receivable from affiliated holdings | | 61,334 |
| Receivable for investments sold | | 11,465,807 |
| Receivable for shares sold | | 733,739 |
| TOTAL ASSETS | | 1,090,488,862 |
| Liabilities: | | |
| Payable for investments purchased | $12,715,680 | |
| Payable for shares redeemed | 1,016,251 | |
| Bank overdraft | 18,821 | |
| Payable for collateral due to broker for securities lending | 103,435,748 | |
| Payable for investment adviser fee (Note 5) | 19,062 | |
| Payable for administrative fee (Note 5) | 2,120 | |
| Payable for distribution services fee (Note 5) | 18,352 | |
| Payable for other service fees (Notes 2 and 5) | 43,504 | |
| Accrued expenses (Note 5) | 287,766 | |
| TOTAL LIABILITIES | | 117,557,304 |
| Net assets for 50,061,915 shares outstanding | | $972,931,558 |
| Net Assets Consist of: | | |
| Paid-in capital | | $986,935,548 |
| Total distributable earnings (loss) | | (14,003,990) |
| TOTAL NET ASSETS | | $972,931,558 |
Annual Shareholder Report
Statement of Assets and Liabilities–continued
| Net Asset Value, Offering Price and Redemption Proceeds Per Share: | | |
| Class A Shares: | | |
Net asset value per share ($68,546,230 ÷ 3,632,560 shares outstanding),
no par value, unlimited shares authorized | | $18.87 |
| Offering price per share (100/94.50 of $18.87) | | $19.97 |
| Redemption proceeds per share | | $18.87 |
| Class C Shares: | | |
Net asset value per share ($28,411,271 ÷ 1,713,602 shares outstanding),
no par value, unlimited shares authorized | | $16.58 |
| Offering price per share | | $16.58 |
| Redemption proceeds per share (99.00/100 of $16.58) | | $16.41 |
| Institutional Shares: | | |
Net asset value per share ($842,220,905 ÷ 42,993,138 shares outstanding),
no par value, unlimited shares authorized | | $19.59 |
| Offering price per share | | $19.59 |
| Redemption proceeds per share | | $19.59 |
| Class R6 Shares: | | |
Net asset value per share ($33,753,152 ÷ 1,722,615 shares outstanding),
no par value, unlimited shares authorized | | $19.59 |
| Offering price per share | | $19.59 |
| Redemption proceeds per share | | $19.59 |
See Notes which are an integral part of the Financial Statements
Annual Shareholder Report
Statement of Operations
Year Ended July 31, 2019
| Investment Income: | | | |
| Dividends (including $492,198 received from an affiliated holding* and net of foreign taxes withheld of $3,853) | | | $10,587,480 |
| Net income on securities loaned (includes $2,557,461 earned from affiliated holdings related to cash collateral balances*)(Note 2) | | | 439,810 |
| TOTAL INCOME | | | 11,027,290 |
| Expenses: | | | |
| Investment adviser fee (Note 5) | | $7,798,328 | |
| Administrative fee (Note 5) | | 737,254 | |
| Custodian fees | | 74,384 | |
| Transfer agent fee (Note 2) | | 1,064,454 | |
| Directors'/Trustees' fees (Note 5) | | 7,746 | |
| Auditing fees | | 27,200 | |
| Legal fees | | 11,915 | |
| Portfolio accounting fees | | 161,924 | |
| Distribution services fee (Note 5) | | 229,291 | |
| Other service fees (Notes 2 and 5) | | 258,660 | |
| Share registration costs | | 196,177 | |
| Printing and postage | | 70,075 | |
| Miscellaneous (Note 5) | | 36,660 | |
| TOTAL EXPENSES | | 10,674,068 | |
| Waiver and Reimbursements: | | | |
| Waiver/reimbursement of investment adviser fee (Note 5) | $(1,149,888) | | |
| Reimbursement of other operating expenses (Notes 2 and 5) | (876,413) | | |
| TOTAL WAIVER AND REIMBURSEMENTS | | (2,026,301) | |
| Net expenses | | | 8,647,767 |
| Net investment income | | | 2,379,523 |
| Realized and Unrealized Gain (Loss) on Investments: | | | |
| Net realized loss on investments (including net realized gain of $14,594 on sales of investments in an affiliated holding*) | | | (6,860,147) |
| Net change in unrealized appreciation of investments (including net change in unrealized appreciation of $(4,359) on investments in an affiliated holding*) | | | (64,875,679) |
| Net realized and unrealized gain (loss) on investments | | | (71,735,826) |
| Change in net assets resulting from operations | | | $(69,356,303) |
| * | See information listed after the Fund's Portfolio of Investments. |
See Notes which are an integral part of the Financial Statements
Annual Shareholder Report
Statement of Changes in Net Assets
| Year Ended July 31 | 2019 | 2018 |
| Increase (Decrease) in Net Assets | | |
| Operations: | | |
| Net investment income | $2,379,523 | $291,818 |
| Net realized gain (loss) | (6,860,147) | 18,755,103 |
| Net change in unrealized appreciation/depreciation | (64,875,679) | 57,705,393 |
| CHANGE IN NET ASSETS RESULTING FROM OPERATIONS | (69,356,303) | 76,752,314 |
| Distributions to Shareholders (Note 2): | | |
| Class A Shares | (2,316,631) | (2,298,928) |
| Class C Shares | (1,156,337) | (898,230) |
| Institutional Shares | (24,309,562) | (12,144,064) |
| Class R6 Shares | (927,672) | (189,298) |
| CHANGE IN NET ASSETS RESULTING FROM DISTRIBUTIONS TO SHAREHOLDERS | (28,710,202) | (15,530,520) |
| Share Transactions: | | |
| Proceeds from sale of shares | 662,037,597 | 637,054,717 |
| Net asset value of shares issued to shareholders in payment of distributions declared | 26,997,492 | 15,027,304 |
| Cost of shares redeemed | (444,684,151) | (119,146,419) |
| CHANGE IN NET ASSETS RESULTING FROM SHARE TRANSACTIONS | 244,350,938 | 532,935,602 |
| Change in net assets | 146,284,433 | 594,157,396 |
| Net Assets: | | |
| Beginning of period | 826,647,125 | 232,489,729 |
| End of period | $972,931,558 | $826,647,125 |
See Notes which are an integral part of the Financial Statements
Annual Shareholder Report
Notes to Financial Statements
July 31, 2019
1. ORGANIZATION
Federated MDT Series (the “Trust”) is registered under the Investment Company Act of 1940, as amended (the “Act”), as an open-end management investment company. The Trust consists of five portfolios. The financial statements included herein are only those of Federated MDT Small Cap Core Fund (the “Fund”), a diversified portfolio. The financial statements of the other portfolios are presented separately. The assets of each portfolio are segregated and a shareholder's interest is limited to the portfolio in which shares are held. Each portfolio pays its own expenses. The Fund offers four classes of shares: Class A Shares, Class C Shares, Institutional Shares and Class R6 Shares. All shares of the Fund have equal rights with respect to voting, except on class-specific matters. The investment objective of the Fund is long-term capital appreciation.
On March 30, 2017, the Fund's T Share Class became effective with the Securities and Exchange Commission (SEC), but is not yet offered for sale.
Effective August 1, 2018, an automatic conversion feature for Class C Shares was implemented. Pursuant to this automatic conversion feature, after Class C Shares have been held for ten years from the date of purchase, they will automatically convert to Class A Shares on the next monthly conversion processing date.
2. SIGNIFICANT ACCOUNTING POLICIES
The following is a summary of significant accounting policies consistently followed by the Fund in the preparation of its financial statements. These policies are in conformity with U.S. generally accepted accounting principles (GAAP).
Investment Valuation
In calculating its net asset value (NAV), the Fund generally values investments as follows:
| ■ | Equity securities listed on an exchange or traded through a regulated market system are valued at their last reported sale price or official closing price in their principal exchange or market. |
| ■ | Shares of other mutual funds or non-exchange-traded investment companies are valued based upon their reported NAVs. |
| ■ | Fixed-income securities are fair valued using price evaluations provided by a pricing service approved by the Trustees. |
| ■ | Derivative contracts listed on exchanges are valued at their reported settlement or closing price, except that options are valued at the mean of closing bid and asked quotations. |
| ■ | Over-the-counter (OTC) derivative contracts are fair valued using price evaluations provided by a pricing service approved by the Trustees. |
| ■ | For securities that are fair valued in accordance with procedures established by and under the general supervision of the Trustees, certain factors may be considered, such as: the last traded or purchase price of the security, information obtained by contacting the issuer or dealers, analysis of the issuer's financial statements or other available documents, fundamental analytical data, the nature and duration of restrictions on disposition, the movement of the market in which the security is normally traded, public trading in similar securities or derivative contracts of the issuer or comparable issuers, movement of a relevant index, or other factors including but not limited to industry changes and relevant government actions. |
Annual Shareholder Report
If any price, quotation, price evaluation or other pricing source is not readily available when the NAV is calculated, if the Fund cannot obtain price evaluations from a pricing service or from more than one dealer for an investment within a reasonable period of time as set forth in the Fund's valuation policies and procedures, or if information furnished by a pricing service, in the opinion of the valuation committee (“Valuation Committee”), is deemed not representative of the fair value of such security, the Fund uses the fair value of the investment determined in accordance with the procedures described below. There can be no assurance that the Fund could obtain the fair value assigned to an investment if it sold the investment at approximately the time at which the Fund determines its NAV per share.
Fair Valuation Procedures
The Trustees have ultimate responsibility for determining the fair value of investments for which market quotations are not readily available. The Trustees have appointed a Valuation Committee comprised of officers of the Fund, Federated MDTA LLC (the “Adviser”), and certain of the Adviser's affiliated companies to assist in determining fair value and in overseeing the calculation of the NAV. The Trustees have also authorized the use of pricing services recommended by the Valuation Committee to provide fair value evaluations of the current value of certain investments for purposes of calculating the NAV. The Valuation Committee employs various methods for reviewing third-party pricing-service evaluations including periodic reviews of third-party pricing services' policies, procedures and valuation methods (including key inputs, methods, models and assumptions), transactional back-testing, comparisons of evaluations of different pricing services, and review of price challenges by the Adviser based on recent market activity. In the event that market quotations and price evaluations are not available for an investment, the Valuation Committee determines the fair value of the investment in accordance with procedures adopted by the Trustees. The Trustees periodically review and approve the fair valuations made by the Valuation Committee and any changes made to the procedures.
Factors considered by pricing services in evaluating an investment include the yields or prices of investments of comparable quality, coupon, maturity, call rights and other potential prepayments, terms and type, reported transactions, indications as to values from dealers and general market conditions. Some pricing services provide a single price evaluation reflecting the bid-side of the market for an investment (a “bid” evaluation). Other pricing services offer both bid evaluations and price evaluations indicative of a price between the prices bid and asked for the investment (a “mid” evaluation). The Fund normally uses bid evaluations for any U.S. Treasury and Agency securities, mortgage-backed securities and municipal securities. The Fund normally uses mid evaluations for any other types of fixed-income securities and any OTC derivative contracts. In the event that market quotations and price evaluations are not available for an investment, the fair value of the investment is determined in accordance with procedures adopted by the Trustees.
Repurchase Agreements
The Fund may invest in repurchase agreements for short-term liquidity purposes. It is the policy of the Fund to require the other party to a repurchase agreement to transfer to the Fund's custodian or sub-custodian eligible securities or cash with a market value (after transaction costs) at least equal to the repurchase price to be paid under the repurchase agreement. The eligible securities are transferred to accounts with the custodian or sub-custodian in which the Fund holds a “securities entitlement” and exercises “control” as those terms are defined in the Uniform Commercial Code. The Fund has established procedures for monitoring the market value of the transferred securities and requiring the transfer of
Annual Shareholder Report
additional eligible securities if necessary to equal at least the repurchase price. These procedures also allow the other party to require securities to be transferred from the account to the extent that their market value exceeds the repurchase price or in exchange for other eligible securities of equivalent market value.
The insolvency of the other party or other failure to repurchase the securities may delay the disposition of the underlying securities or cause the Fund to receive less than the full repurchase price. Under the terms of the repurchase agreement, any amounts received by the Fund in excess of the repurchase price and related transaction costs must be remitted to the other party.
The Fund may enter into repurchase agreements in which eligible securities are transferred into joint trading accounts maintained by the custodian or sub-custodian for investment companies and other clients advised by the Fund's Adviser and its affiliates. The Fund will participate on a pro rata basis with the other investment companies and clients in its share of the securities transferred under such repurchase agreements and in its share of proceeds from any repurchase or other disposition of such securities.
Investment Income, Gains and Losses, Expenses and Distributions
Investment transactions are accounted for on a trade-date basis. Realized gains and losses from investment transactions are recorded on an identified-cost basis. Interest income and expenses are accrued daily. Dividend income and distributions to shareholders are recorded on the ex-dividend date. Foreign dividends are recorded on the ex-dividend date or when the Fund is informed of the ex-dividend date. Distributions of net investment income, if any, are declared and paid annually. Non-cash dividends included in dividend income, if any, are recorded at fair value. Amortization/accretion of premium and discount is included in investment income. Investment income, realized and unrealized gains and losses, and certain fund-level expenses are allocated to each class based on relative average daily net assets, except that select classes will bear certain expenses unique to those classes. The detail of the total fund expense waiver and reimbursements of $2,026,301 is disclosed in various locations in this Note 2 and Note 5. For the year ended July 31, 2019, transfer agent fees for the Fund were as follows:
| | Transfer Agent
Fees Incurred | Transfer Agent
Fees Reimbursed |
| Class A Shares | $86,689 | $(71,410) |
| Class C Shares | 55,547 | (48,555) |
| Institutional Shares | 919,186 | (756,448) |
| Class R6 Shares | 3,032 | — |
| TOTAL | $1,064,454 | $(876,413) |
Dividends are declared separately for each class. No class has preferential dividend rights; differences in per share dividend rates are generally due to differences in separate class expenses. The distributions disclosed on the Statement of Changes in Net Assets for the year ended July 31, 2018, were from the following sources:
| Net investment income | |
| Institutional Shares | $287,325 |
| Class R6 Shares | 4,493 |
Annual Shareholder Report
| Net realized gain | |
| Class A Shares | $2,298,928 |
| Class C Shares | 898,230 |
| Institutional Shares | 11,856,739 |
| Class R6 Shares | 184,805 |
Other Service Fees
The Fund may pay other service fees up to 0.25% of the average daily net assets of the Fund's Class A Shares and Class C Shares to unaffiliated financial intermediaries or to Federated Shareholder Services Company (FSSC) for providing services to shareholders and maintaining shareholder accounts. Subject to the terms described in the Expense Limitation note, FSSC may voluntarily reimburse the Fund for other service fees. For the year ended July 31, 2019, other service fees for the Fund were as follows:
| | Other Service
Fees Incurred |
| Class A Shares | $182,933 |
| Class C Shares | 75,727 |
| TOTAL | $258,660 |
Federal Taxes
It is the Fund's policy to comply with the Subchapter M provision of the Internal Revenue Code and to distribute to shareholders each year substantially all of its income. Accordingly, no provision for federal income tax is necessary. As of and during the year ended July 31, 2019, the Fund did not have a liability for any uncertain tax positions. The Fund recognizes interest and penalties, if any, related to tax liabilities as income tax expense in the Statement of Operations. As of July 31, 2019, tax years 2016 through 2019 remain subject to examination by the Fund's major tax jurisdictions, which include the United States of America and the Commonwealth of Massachusetts.
The Fund may be subject to taxes imposed by governments of countries in which it invests. Such taxes are generally based on either income or gains earned or repatriated. The Fund accrues and applies such taxes to net investment income, net realized gains and net unrealized gains as income and/or gains are earned.
When-Issued and Delayed-Delivery Transactions
The Fund may engage in when-issued or delayed-delivery transactions. The Fund records when-issued securities on the trade date and maintains security positions such that sufficient liquid assets will be available to make payment for the securities purchased. Securities purchased on a when-issued or delayed-delivery basis are marked to market daily and begin earning interest on the settlement date. Losses may occur on these transactions due to changes in market conditions or the failure of counterparties to perform under the contract.
Securities Lending
The Fund participates in a securities lending program providing for the lending of equity securities to qualified brokers. The term of the loans within the program is one year or less. The Fund normally receives cash collateral for securities loaned that may be invested in affiliated money market funds, other money market instruments and/or repurchase agreements. Investments in money market funds may include funds with a “floating” NAV that
Annual Shareholder Report
can impose redemption fees and liquidity gates, impose certain operational impediments to investing cash collateral, and, if the investee fund's NAV decreases, result in the Fund recognizing losses and being required to cover the decrease in the value of the cash collateral. Collateral is maintained at a minimum level of 100% of the market value of investments loaned, plus interest, if applicable. In accordance with the Fund's securities lending agreement, the market value of securities on loan is determined each day at the close of business and any additional collateral required to cover the value of securities on loan is delivered to the Fund on the next business day. Earnings on collateral are allocated between the borrower of the security, the securities lending agent, as a fee for its services under the program and the Fund, according to agreed-upon rates. The Fund will not have the right to vote on securities while they are on loan. However, the Fund will attempt to terminate a loan in an effort to reacquire the securities in time to vote on matters that are deemed to be material by the Adviser. There can be no assurance that the Fund will have sufficient notice of such matters to be able to terminate the loan in time to vote thereon.
Securities lending transactions are subject to Master Netting Agreements which are agreements between the Fund and its counterparties that provide for the net settlement of all transactions and collateral with the Fund, through a single payment, in the event of default or termination. Amounts presented on the Portfolio of Investments and Statement of Assets and Liabilities are not net settlement amount but gross. As indicated below, the cash collateral received by the Fund exceeds the market value of the securities loaned reducing the net settlement amount to zero. The chart below identifies the amount of collateral received as well as the market value of securities on loan. Additionally, the securities lending agreement executed by the Fund includes an indemnification clause. This clause stipulates that the borrower will reimburse the Fund for any losses as a result of any failure of the borrower to return equivalent securities to the Fund.
As of July 31, 2019, securities subject to this type of arrangement and related collateral were as follows:
Market Value of
Securities Loaned | Collateral
Received |
| $101,005,701 | $103,435,748 |
Other
The preparation of financial statements in conformity with GAAP requires management to make estimates and assumptions that affect the amounts of assets, liabilities, expenses and revenues reported in the financial statements. Actual results could differ from those estimated. The Fund applies investment company accounting and reporting guidance.
Annual Shareholder Report
3. SHARES OF BENEFICIAL INTEREST
The following tables summarize share activity:
| Year Ended July 31 | 2019 | 2018 |
| Class A Shares: | Shares | Amount | Shares | Amount |
| Shares sold | 1,917,717 | $36,807,080 | 2,701,057 | $54,055,165 |
| Shares issued to shareholders in payment of distributions declared | 130,070 | 2,238,511 | 114,322 | 2,215,556 |
| Shares redeemed | (1,926,776) | (36,450,543) | (1,285,487) | (26,118,919) |
NET CHANGE RESULTING FROM
CLASS A SHARE TRANSACTIONS | 121,011 | $2,595,048 | 1,529,892 | $30,151,802 |
| Year Ended July 31 | 2019 | 2018 |
| Class C Shares: | Shares | Amount | Shares | Amount |
| Shares sold | 816,518 | $14,448,516 | 895,916 | $16,153,794 |
| Shares issued to shareholders in payment of distributions declared | 69,154 | 1,050,441 | 51,304 | 888,075 |
| Shares redeemed | (768,042) | (12,785,661) | (255,648) | (4,525,472) |
NET CHANGE RESULTING FROM
CLASS C SHARE TRANSACTIONS | 117,630 | $2,713,296 | 691,572 | $12,516,397 |
| Year Ended July 31 | 2019 | 2018 |
| Institutional Shares: | Shares | Amount | Shares | Amount |
| Shares sold | 29,605,182 | $578,572,031 | 26,620,440 | $553,678,973 |
| Shares issued to shareholders in payment of distributions declared | 1,278,403 | 22,792,305 | 584,818 | 11,734,158 |
| Shares redeemed | (20,198,281) | (386,462,699) | (4,184,409) | (86,776,222) |
NET CHANGE RESULTING FROM
INSTITUTIONAL SHARE TRANSACTIONS | 10,685,304 | $214,901,637 | 23,020,849 | $478,636,909 |
| Year Ended July 31 | 2019 | 2018 |
| Class R6 Shares: | Shares | Amount | Shares | Amount |
| Shares sold | 1,525,579 | $32,209,970 | 631,723 | $13,166,785 |
| Shares issued to shareholders in payment of distributions declared | 51,362 | 916,235 | 9,445 | 189,515 |
| Shares redeemed | (463,823) | (8,985,248) | (84,376) | (1,725,806) |
NET CHANGE RESULTING FROM
CLASS R6 SHARES TRANSACTIONS | 1,113,118 | $24,140,957 | 556,792 | $11,630,494 |
NET CHANGE RESULTING FROM
TOTAL FUND SHARE TRANSACTIONS | 12,037,063 | $244,350,938 | 25,799,105 | $532,935,602 |
Annual Shareholder Report
4. FEDERAL TAX INFORMATION
The tax character of distributions as reported on the Statement of Changes in Net Assets for the years ended July 31, 2019 and 2018, was as follows:
| | 2019 | 2018 |
| Ordinary income1 | $21,486,437 | $13,627,453 |
| Long-term capital gains | $7,223,765 | $1,903,067 |
| 1 | For tax purposes, short-term capital gain distributions are considered ordinary income distributions. |
| | |
As of July 31, 2019, the components of distributable earnings on a tax-basis were as follows:
| Undistributed ordinary income | $1,559,041 |
| Net unrealized appreciation | $1,320,709 |
| Capital loss deferrals | $(16,883,740) |
The difference between book-basis and tax-basis net unrealized appreciation is attributable to differing treatments for the deferral of losses on wash sales.
At July 31, 2019, the cost of investments for federal tax purposes was $1,076,728,307. The net unrealized appreciation of investments for federal tax purposes was $1,320,709. This consists of net unrealized appreciation from investments for those securities having an excess of value over cost of $90,427,622 and net unrealized depreciation from investments for those securities having an excess of cost over value of $89,106,913.
Under current tax rules, capital losses on securities transactions and foreign currency losses realized after October 31 may be deferred, in whole or in part, and treated as occurring on the first day of the following fiscal year. As of July 31, 2019, for federal income tax purposes, post October losses of $16,883,740 were deferred to August 1, 2019.
5. INVESTMENT ADVISER FEE AND OTHER TRANSACTIONS WITH AFFILIATES
Investment Adviser Fee
The advisory agreement between the Fund and the Adviser provides for an annual fee equal to 0.80% of the Fund's average daily net assets. Prior to July 1, 2019, the annual advisory fee was 0.85% of the Fund's average daily net assets. Subject to the terms described in the Expense Limitation note, the Adviser may voluntarily choose to waive any portion of its fee and/or reimburse certain operating expenses of the Fund. For the year ended July 31, 2019, the Adviser voluntarily waived $1,057,487 of its fee and voluntarily reimbursed $876,413 of transfer agent fees. The Adviser has agreed to reimburse the Fund for certain investment adviser fees as a result of transactions in other affiliated investment companies. For the year ended July 31, 2019, the Adviser reimbursed $92,401.
Annual Shareholder Report
Administrative Fee
Federated Administrative Services (FAS), under the Administrative Services Agreement, provides the Fund with administrative personnel and services. For purposes of determining the appropriate rate breakpoint, “Investment Complex” is defined as all of the Federated Funds subject to a fee under the Administrative Services Agreement. The fee paid to FAS is based on the average daily net assets of the Investment Complex as specified below:
| Administrative Fee | Average Daily Net Assets
of the Investment Complex |
| 0.100% | on assets up to $50 billion |
| 0.075% | on assets over $50 billion |
Subject to the terms described in the Expense Limitation note, FAS may voluntarily choose to waive any portion of its fee. For the year ended July 31, 2019, the annualized fee paid to FAS was 0.080% of average daily net assets of the Fund.
In addition, FAS may charge certain out-of-pocket expenses to the Fund.
Distribution Services Fee
The Fund has adopted a Distribution Plan (the “Plan”) pursuant to Rule 12b-1 under the Act. Under the terms of the Plan, the Fund will compensate Federated Securities Corp. (FSC), the principal distributor, from the daily net assets of the Fund's Class A Shares and Class C Shares to finance activities intended to result in the sale of these shares. The Plan provides that the Fund may incur distribution expenses at the following percentages of average daily net assets annually, to compensate FSC:
| | Percentage of Average Daily
Net Assets of Class |
| Class A Shares | 0.05% |
| Class C Shares | 0.75% |
Subject to the terms described in the Expense Limitation note, FSC may voluntarily choose to waive any portion of its fee. For the year ended July 31, 2019, distribution services fees for the Fund were as follows:
| | Distribution Services
Fees Incurred |
| Class C Shares | $229,291 |
When FSC receives fees, it may pay some or all of them to financial intermediaries whose customers purchase shares.
For the year ended July 31, 2019, FSC retained $89,373 of fees paid by the Fund. For the year ended July 31, 2019, the Fund's Class A Shares did not incur a distribution services fee; however, it may begin to incur this fee upon approval of the Trustees.
Other Service Fees
For the year ended July 31, 2019, FSSC received $907 of the other service fees disclosed in Note 2.
Annual Shareholder Report
Sales Charges
Front-end sales charges and contingent deferred sales charges (CDSC) do not represent expenses of the Fund. They are deducted from the proceeds of sales of Fund shares prior to investment or from redemption proceeds prior to remittance, as applicable. For the year ended July 31, 2019, FSC retained $16,294 in sales charges from the sale of Class A Shares. FSC also retained $1,073 and $5,356 of CDSC relating to redemptions of Class A Shares and C Shares, respectively.
Expense Limitation
The Adviser and certain of its affiliates (which may include FSC, FAS and FSSC) on their own initiative have agreed to waive certain amounts of their respective fees and/or reimburse expenses. Total annual fund operating expenses (as shown in the financial highlights excluding interest expense, extraordinary expenses and proxy-related expenses paid by the Fund, if any) paid by the Fund's Class A Shares, Class C Shares, Institutional Shares and Class R6 Shares (after the voluntary waivers and/or reimbursements) will not exceed 1.13%, 1.88%, 0.88% and 0.87% (the “Fee Limit”), respectively, up to but not including the later of (the “Termination Date”): (a) October 1, 2020; or (b) the date of the Fund's next effective Prospectus. While the Adviser and its applicable affiliates currently do not anticipate terminating or increasing these arrangements prior to the Termination Date, these arrangements may only be terminated or the Fee Limit increased prior to the Termination Date with the agreement of the Trustees.
Directors'/Trustees' and Miscellaneous Fees
Certain Officers and Trustees of the Fund are Officers and Directors or Trustees of certain of the above companies. To efficiently facilitate payment, Directors'/Trustees' fees and certain expenses related to conducting meetings of the Directors/Trustees and other miscellaneous expenses are paid by an affiliate of the Adviser which in due course are reimbursed by the Fund. These expenses related to conducting meetings of the Directors/Trustees and other miscellaneous expenses may be included in Accrued and Miscellaneous Expenses on the Statement of Assets and Liabilities and Statement of Operations, respectively.
6. INVESTMENT TRANSACTIONS
Purchases and sales of investments, excluding long-term U.S. government securities and short-term obligations, for the year ended July 31, 2019, were as follows:
| Purchases | $1,308,725,756 |
| Sales | $1,085,877,058 |
7. LINE OF CREDIT
The Fund participates with certain other Federated Funds, on a several basis, in an up to $500,000,000 unsecured, 364-day, committed, revolving line of credit (LOC) agreement. The LOC was made available to finance temporarily the repurchase or redemption of shares of the Fund, failed trades, payment of dividends, settlement of trades and for other short-term, temporary or emergency general business purposes. The Fund cannot borrow under the LOC if an inter-fund loan is outstanding. The Fund's ability to borrow under the LOC also is subject to the limitations of the Act and various conditions precedent that must be satisfied before the Fund can borrow. Loans under the LOC are charged interest at a fluctuating rate per annum equal to the highest, on any day, of (a) (i) the federal funds effective rate, (ii) the one month London Interbank Offered Rate (LIBOR), and (iii) 0.0%, plus (b) a margin. The LOC also
Annual Shareholder Report
requires the Fund to pay, quarterly in arrears and at maturity, its pro rata share of a commitment fee based on the amount of the lenders' commitment that has not been utilized. As of July 31, 2019, the Fund had no outstanding loans. During the year ended July 31, 2019, the Fund did not utilize the LOC.
8. INTERFUND LENDING
Pursuant to an Exemptive Order issued by the SEC, the Fund, along with other funds advised by subsidiaries of Federated Investors, Inc., may participate in an interfund lending program. This program provides an alternative credit facility allowing the Fund to borrow from other participating affiliated funds. As of July 31, 2019, there were no outstanding loans. During the year ended July 31, 2019, the program was not utilized.
9. SUBSEQUENT EVENT
On May 16, 2019, the Trustees approved the reorganization of PNC Multi-Factor Small Cap Core Fund, PNC Multi-Factor Small Cap Value Fund and PNC Small Cap Fund, each a portfolio of the PNC Funds, into the Fund. Each reorganization is expected to occur in the fourth quarter of 2019, pending approval by the shareholders of the PNC Funds.
Additionally, if the reorganization is approved, the “Termination Date” stated under Expense Limitation in the “Investment Adviser Fee and Other Transactions with Affiliates” note shall be extended up to but not including, the later of: (a) December 1, 2020 or (b) the first day of the month following the one year anniversary of the closing date of the reorganization.
10. FEDERAL TAX INFORMATION (UNAUDITED)
For the year ended July 31, 2019, the amount of long-term capital gains designated by the Fund was $7,223,765.
For the fiscal year ended July 31, 2019, 44.46% of total ordinary income (including short-term capital gains) distributions made by the Fund are qualifying dividends which may be subject to a maximum tax rate of 15%, as provided for by the Jobs and Growth Tax Relief Act of 2003. Complete information is reported in conjunction with the reporting of your distributions on Form 1099-DIV.
Of the ordinary income (including short-term capital gains) distributions made by the Fund during the year ended July 31, 2019, 42.88% qualify for the dividend received deduction available to corporate shareholders.
Annual Shareholder Report
Report of Independent Registered Public Accounting Firm
TO THE BOARD OF trustees OF Federated MDt series AND SHAREHOLDERS OF federated mdt Small cap core fund:
Opinion on the Financial Statements
We have audited the accompanying statement of assets and liabilities of Federated MDT Small Cap Core Fund (the “Fund”) (one of the portfolios constituting Federated MDT Series), including the portfolio of investments, as of July 31, 2019, and the related statement of operations for the year then ended, the statement of changes in net assets for each of the two years in the period then ended, the financial highlights for each of the five years in the period then ended and the related notes (collectively referred to as the “financial statements”). In our opinion, the financial statements present fairly, in all material respects, the financial position of the Fund at July 31, 2019, the results of its operations for the year then ended, the changes in its net assets for each of the two years in the period then ended and its financial highlights for each of the five years in the period then ended, in conformity with U.S. generally accepted accounting principles.
Basis for Opinion
These financial statements are the responsibility of the Fund's management. Our responsibility is to express an opinion on the Fund's financial statements based on our audits. We are a public accounting firm registered with the Public Company Accounting Oversight Board (United States) (“PCAOB”) and are required to be independent with respect to the Fund in accordance with the U.S. federal securities laws and the applicable rules and regulations of the Securities and Exchange Commission and the PCAOB.
We conducted our audits in accordance with standards of the PCAOB. Those standards require that we plan and perform the audit to obtain reasonable assurance about whether the financial statements and financial highlights are free of material misstatement, whether due to error or fraud. The Fund is not required to have, nor were we engaged to perform, an audit of the Fund's internal control over financial reporting. As part of our audits, we are required to obtain an understanding of internal control over financial reporting, but not for the purpose of expressing an opinion on the effectiveness of the Fund's internal control over financial reporting. Accordingly, we express no such opinion.
Annual Shareholder Report
Our audits included performing procedures to assess the risks of material misstatement of the financial statements, whether due to error or fraud, and performing procedures that respond to those risks. Such procedures included examining, on a test basis, evidence regarding the amounts and disclosures in the financial statements. Our procedures included confirmation of securities owned as of July 31, 2019, by correspondence with the custodian and others or by other appropriate auditing procedures where replies from others were not received. Our audits also included evaluating the accounting principles used and significant estimates made by management, as well as evaluating the overall presentation of the financial statements. We believe that our audits provide a reasonable basis for our opinion.
We have served as the auditor of one or more Federated investment companies since 1979.
Boston, Massachusetts
September 23, 2019
Annual Shareholder Report
Shareholder Expense Example (unaudited)
As a shareholder of the Fund, you incur two types of costs: (1) transaction costs, including sales charges (loads) on purchase or redemption payments; and (2) ongoing costs, including management fees and to the extent applicable, distribution (12b-1) fees and/or other service fees and other Fund expenses. This Example is intended to help you to understand your ongoing costs (in dollars) of investing in the Fund and to compare these costs with the ongoing costs of investing in other mutual funds. It is based on an investment of $1,000 invested at the beginning of the period and held for the entire period from February 1, 2019 to July 31, 2019.
ACTUAL EXPENSES
The first section of the table below provides information about actual account values and actual expenses. You may use the information in this section, together with the amount you invested, toestimate the expenses that you incurred over the period. Simply divide your account value by $1,000 (for example, an $8,600 account value divided by $1,000 = 8.6), then multiply the result by the number in the first section under the heading entitled “Expenses Paid During Period” to estimate the expenses attributable to your investment during this period.
HYPOTHETICAL EXAMPLE FOR COMPARISON PURPOSES
The second section of the table below provides information about hypothetical account values and hypothetical expenses based on the Fund's actual expense ratio and anassumed rate of return of 5% per year before expenses, which is not the Fund's actual return. Thus, you shouldnot use the hypothetical account values and expenses to estimate the actual ending account balance or your expenses for the period. Rather, these figures are required to be provided to enable you to compare the ongoing costs of investing in the Fund with other funds. To do so, compare this 5% hypothetical example with the 5% hypothetical examples that appear in the shareholder reports of the other funds.
Annual Shareholder Report
Please note that the expenses shown in the table are meant to highlight your ongoing costs only and do not reflect any transaction costs, such as sales charges (loads) on purchase or redemption payments. Therefore, the second section of the table is useful in comparing ongoing costs only, and will not help you determine the relativetotal costs of owning different funds. In addition, if these transaction costs were included, your costs would have been higher.
| | Beginning
Account Value
2/1/2019 | Ending
Account Value
7/31/2019 | Expenses Paid
During Period1 |
| Actual: | | | |
| Class A Shares | $1,000 | $1,036.20 | $5.70 |
| Class C Shares | $1,000 | $1,032.40 | $9.47 |
| Institutional Shares | $1,000 | $1,037.60 | $4.45 |
| Class R6 Shares | $1,000 | $1,037.60 | $4.40 |
Hypothetical (assuming a 5% return
before expenses): | | | |
| Class A Shares | $1,000 | $1,019.20 | $5.66 |
| Class C Shares | $1,000 | $1,015.50 | $9.39 |
| Institutional Shares | $1,000 | $1,020.40 | $4.41 |
| Class R6 Shares | $1,000 | $1,020.50 | $4.36 |
| 1 | Expenses are equal to the Fund's annualized net expense ratios, multiplied by the average account value over the period, multiplied by 181/365 (to reflect the one-half-year period). The annualized net expense ratios are as follows: |
| | |
| Class A Shares | 1.13% |
| Class C Shares | 1.88% |
| Institutional Shares | 0.88% |
| Class R6 Shares | 0.87% |
Annual Shareholder Report
Board of Trustees and Trust Officers
The Board of Trustees is responsible for managing the Trust's business affairs and for exercising all the Trust's powers except those reserved for the shareholders. The following tables give information about each Trustee and the senior officers of the Fund. Where required, the tables separately list Trustees who are “interested persons” of the Fund (i.e., “Interested” Trustees) and those who are not (i.e., “Independent” Trustees). Unless otherwise noted, the address of each person listed is Federated Investors Tower, 1001 Liberty Avenue, Pittsburgh, PA 15222. The address of all Independent Trustees listed is 4000 Ericsson Drive, Warrendale, PA 15086-7561; Attention: Mutual Fund Board. As of December 31, 2018, the Trust comprised five portfolio(s), and the Federated Fund Family consisted of 40 investment companies (comprising 102 portfolios). Unless otherwise noted, each Officer is elected annually. Unless otherwise noted, each Trustee oversees all portfolios in the Federated Fund Family and serves for an indefinite term. The Fund's Statement of Additional Information includes additional information about Trust Trustees and is available, without charge and upon request, by calling 1-800-341-7400.
Interested TRUSTEES Background
Name
Birth Date
Positions Held with Trust
Date Service Began | Principal Occupation(s) for Past Five Years,
Other Directorships Held and Previous Position(s) |
J. Christopher Donahue*
Birth Date: April 11, 1949
President and Trustee
Indefinite Term
Began serving: May 2006 | Principal Occupations: Principal Executive Officer and President of certain of the Funds in the Federated Fund Family; Director or Trustee of the Funds in the Federated Fund Family; President, Chief Executive Officer and Director, Federated Investors, Inc.; Chairman and Trustee, Federated Investment Management Company; Trustee, Federated Investment Counseling; Chairman and Director, Federated Global Investment Management Corp.; Chairman and Trustee, Federated Equity Management Company of Pennsylvania; Trustee, Federated Shareholder Services Company; Director, Federated Services Company.
Previous Positions: President, Federated Investment Counseling; President and Chief Executive Officer, Federated Investment Management Company, Federated Global Investment Management Corp. and Passport Research, Ltd; Chairman, Passport Research, Ltd. |
Annual Shareholder Report
Name
Birth Date
Positions Held with Trust
Date Service Began | Principal Occupation(s) for Past Five Years,
Other Directorships Held and Previous Position(s) |
John B. Fisher*
Birth Date: May 16, 1956
Trustee
Indefinite Term
Began serving: May 2016 | Principal Occupations:Principal Executive Officer and President of certain of the Funds in the Federated Fund Family; Director or Trustee of certain of the Funds in the Federated Fund Family; Vice President, Federated Investors, Inc.; President, Director/Trustee and CEO, Federated Advisory Services Company, Federated Equity Management Company of Pennsylvania, Federated Global Investment Management Corp., Federated Investment Counseling, Federated Investment Management Company; President of some of the Funds in the Federated Fund Complex and Director, Federated Investors Trust Company.
Previous Positions: President and Director of the Institutional Sales Division of Federated Securities Corp.; President and Director of Federated Investment Counseling; President and CEO of Passport Research, Ltd.; Director, Edgewood Securities Corp.; Director, Federated Services Company; Director, Federated Investors, Inc.; Chairman and Director, Southpointe Distribution Services, Inc. and President, Technology, Federated Services Company. |
| * | Reasons for “interested” status: J. Christopher Donahue and John B. Fisher are interested due to their beneficial ownership of shares of Federated Investors, Inc. and due to positions they hold with Federated and its subsidiaries. |
INDEPENDENT TRUSTEES Background
Name
Birth Date
Positions Held with Trust
Date Service Began | Principal Occupation(s) for Past Five Years,
Other Directorships Held, Previous Position(s) and Qualifications |
John T. Collins
Birth Date: January 24, 1947
Trustee
Indefinite Term
Began serving: October 2013 | Principal Occupations: Director or Trustee of the Federated Fund Family; formerly, Chairman and CEO, The Collins Group, Inc. (a private equity firm) (Retired).
Other Directorships Held: Director, Chairman of the Compensation Committee, KLX Energy Services Holdings, Inc. (oilfield services); former Director of KLX Corp. (aerospace).
Qualifications: Mr. Collins has served in several business and financial management roles and directorship positions throughout his career. Mr. Collins previously served as Chairman and CEO of The Collins Group, Inc. (a private equity firm) and as a Director of KLX Corp. Mr. Collins serves as Chairman Emeriti, Bentley University. Mr. Collins previously served as Director and Audit Committee Member, Bank of America Corp.; Director, FleetBoston Financial Corp.; and Director, Beth Israel Deaconess Medical Center (Harvard University Affiliate Hospital). |
Annual Shareholder Report
Name
Birth Date
Positions Held with Trust
Date Service Began | Principal Occupation(s) for Past Five Years,
Other Directorships Held, Previous Position(s) and Qualifications |
G. Thomas Hough
Birth Date: February 28, 1955
Trustee
Indefinite Term
Began serving: August 2015 | Principal Occupations: Director or Trustee of the Federated Fund Family; formerly, Vice Chair, Ernst & Young LLP (public accounting firm) (Retired).
Other Directorships Held: Director, Member of Governance and Compensation Committees, Publix Super Markets, Inc.; Director, Chair of the Audit Committee, Equifax, Inc.; Director, Member of the Audit Committee, Haverty Furniture Companies, Inc.
Qualifications: Mr. Hough has served in accounting, business management and directorship positions throughout his career. Mr. Hough most recently held the position of Americas Vice Chair of Assurance with Ernst & Young LLP (public accounting firm). Mr. Hough serves on the President's Cabinet and Business School Board of Visitors for the University of Alabama and is on the Business School Board of Visitors for Wake Forest University. Mr. Hough previously served as an Executive Committee member of the United States Golf Association. |
Maureen Lally-Green
Birth Date: July 5, 1949
Trustee
Indefinite Term
Began serving: August 2009 | Principal Occupations: Director or Trustee of the Federated Fund Family; Adjunct Professor of Law, Duquesne University School of Law; formerly, Dean of the Duquesne University School of Law and Professor of Law and Interim Dean of the Duquesne University School of Law; formerly, Associate General Secretary and Director, Office of Church Relations, Diocese of Pittsburgh.
Other Directorships Held: Director, CNX Resources Corporation (formerly known as CONSOL Energy Inc.).
Qualifications: Judge Lally-Green has served in various legal and business roles and directorship positions throughout her career. Judge Lally-Green previously held the position of Dean of the School of Law of Duquesne University (as well as Interim Dean). Judge Lally-Green previously served as a member of the Superior Court of Pennsylvania and as a Professor of Law, Duquesne University School of Law. Judge Lally-Green also currently holds the positions on not for profit or for profit boards of directors as follows: Director and Chair, UPMC Mercy Hospital; Director and Vice Chair, Our Campaign for the Church Alive!, Inc.; Regent, Saint Vincent Seminary; Member, Pennsylvania State Board of Education (public); and Director CNX Resources Corporation (formerly known as CONSOL Energy Inc.). Judge Lally-Green has held the positions of: Director, Auberle; Director, Epilepsy Foundation of Western and Central Pennsylvania; Director, Ireland Institute of Pittsburgh; Director, Saint Thomas More Society; Director and Chair, Catholic High Schools of the Diocese of Pittsburgh, Inc.; Director, Pennsylvania Bar Institute; Director, St. Vincent College; and Director and Chair, North Catholic High School, Inc. |
Charles F. Mansfield, Jr.
Birth Date: April 10, 1945
Trustee
Indefinite Term
Began serving: June 2006 | Principal Occupations: Director or Trustee of the Federated Fund Family; Management Consultant and Author.
Other Directorships Held: None.
Qualifications: Mr. Mansfield has served as a Marine Corps officer and in several banking, business management, educational roles and directorship positions throughout his long career. He remains active as a Management Consultant and Author. |
Annual Shareholder Report
Name
Birth Date
Positions Held with Trust
Date Service Began | Principal Occupation(s) for Past Five Years,
Other Directorships Held, Previous Position(s) and Qualifications |
Thomas M. O'Neill
Birth Date: June 14, 1951
Trustee
Indefinite Term
Began serving: August 2006 | Principal Occupations: Director or Trustee, Chair of the Audit Committee of the Federated Fund Family; Sole Proprietor, Navigator Management Company (investment and strategic consulting).
Other Directorships Held: None.
Qualifications: Mr. O'Neill has served in several business, mutual fund and financial management roles and directorship positions throughout his career. Mr. O'Neill serves as Director, Medicines for Humanity and Director, The Golisano Children's Museum of Naples, Florida. Mr. O'Neill previously served as Chief Executive Officer and President, Managing Director and Chief Investment Officer, Fleet Investment Advisors; President and Chief Executive Officer, Aeltus Investment Management, Inc.; General Partner, Hellman, Jordan Management Co., Boston, MA; Chief Investment Officer, The Putnam Companies, Boston, MA; Credit Analyst and Lending Officer, Fleet Bank; Director and Consultant, EZE Castle Software (investment order management software); and Director, Midway Pacific (lumber). |
P. Jerome Richey
Birth Date: February 23, 1949
Trustee
Indefinite Term
Began serving: October 2013 | Principal Occupations: Director or Trustee of the Federated Fund Family; Management Consultant; Retired; formerly, Senior Vice Chancellor and Chief Legal Officer, University of Pittsburgh and Executive Vice President and Chief Legal Officer, CNX Resources Corporation (formerly known as CONSOL Energy Inc.).
Other Directorships Held: None.
Qualifications: Mr. Richey has served in several business and legal management roles and directorship positions throughout his career. Mr. Richey most recently held the positions of Senior Vice Chancellor and Chief Legal Officer, University of Pittsburgh. Mr. Richey previously served as Chairman of the Board, Epilepsy Foundation of Western Pennsylvania and Chairman of the Board, World Affairs Council of Pittsburgh. Mr. Richey previously served as Chief Legal Officer and Executive Vice President, CNX Resources Corporation (formerly known as CONSOL Energy Inc.); and Board Member, Ethics Counsel and Shareholder, Buchanan Ingersoll & Rooney PC (a law firm). |
John S. Walsh
Birth Date: November 28, 1957
Trustee
Indefinite Term
Began serving: June 2006 | Principal Occupations: Director or Trustee, and Chair of the Board of Directors or Trustees, of the Federated Fund Family; President and Director, Heat Wagon, Inc. (manufacturer of construction temporary heaters); President and Director, Manufacturers Products, Inc. (distributor of portable construction heaters); President, Portable Heater Parts, a division of Manufacturers Products, Inc.
Other Directorships Held: None.
Qualifications: Mr. Walsh has served in several business management roles and directorship positions throughout his career. Mr. Walsh previously served as Vice President, Walsh & Kelly, Inc. (paving contractors). |
Annual Shareholder Report
OFFICERS
Name
Birth Date
Address
Positions Held with Trust
Date Service Began | Principal Occupation(s) for Past Five Years
and Previous Position(s) |
Lori A. Hensler
Birth Date: January 6, 1967
TREASURER
Officer since: April 2013 | Principal Occupations: Principal Financial Officer and Treasurer of the Federated Fund Family; Senior Vice President, Federated Administrative Services; Financial and Operations Principal for Federated Securities Corp. and Edgewood Services, Inc.; and Assistant Treasurer, Federated Investors Trust Company. Ms. Hensler has received the Certified Public Accountant designation.
Previous Positions: Controller of Federated Investors, Inc.; Senior Vice President and Assistant Treasurer, Federated Investors Management Company; Treasurer, Federated Investors Trust Company; Assistant Treasurer, Federated Administrative Services, Federated Administrative Services, Inc., Federated Securities Corp., Edgewood Services, Inc., Federated Advisory Services Company, Federated Equity Management Company of Pennsylvania, Federated Global Investment Management Corp., Federated Investment Counseling, Federated Investment Management Company, Passport Research, Ltd., and Federated MDTA, LLC; Financial and Operations Principal for Federated Securities Corp., Edgewood Services, Inc. and Southpointe Distribution Services, Inc. |
Peter J. Germain
Birth Date: September 3, 1959
CHIEF LEGAL OFFICER, SECRETARY and EXECUTIVE VICE PRESIDENT
Officer since: June 2006 | Principal Occupations: Mr. Germain is Chief Legal Officer, Secretary and Executive Vice President of the Federated Fund Family. He is General Counsel, Chief Legal Officer, Secretary and Executive Vice President, Federated Investors, Inc.; Trustee and Senior Vice President, Federated Investors Management Company; Trustee and President, Federated Administrative Services; Director and President, Federated Administrative Services, Inc.; Director and Vice President, Federated Securities Corp.; Director and Secretary, Federated Private Asset Management, Inc.; Secretary, Federated Shareholder Services Company; and Secretary, Retirement Plan Service Company of America. Mr. Germain joined Federated in 1984 and is a member of the Pennsylvania Bar Association.
Previous Positions: Deputy General Counsel, Special Counsel, Managing Director of Mutual Fund Services, Federated Investors, Inc.; Senior Vice President, Federated Services Company; and Senior Corporate Counsel, Federated Investors, Inc. |
Stephen Van Meter
Birth Date: June 5, 1975
CHIEF COMPLIANCE OFFICER AND SENIOR VICE PRESIDENT
Officer since: July 2015 | Principal Occupations: Senior Vice President and Chief Compliance Officer of the Federated Fund Family; Vice President and Chief Compliance Officer of Federated Investors, Inc. and Chief Compliance Officer of certain of its subsidiaries. Mr. Van Meter joined Federated in October 2011. He holds FINRA licenses under Series 3, 7, 24 and 66.
Previous Positions: Mr. Van Meter previously held the position of Compliance Operating Officer, Federated Investors, Inc. Prior to joining Federated, Mr. Van Meter served at the United States Securities and Exchange Commission in the positions of Senior Counsel, Office of Chief Counsel, Division of Investment Management and Senior Counsel, Division of Enforcement. |
Annual Shareholder Report
Name
Birth Date
Address
Positions Held with Trust
Date Service Began | Principal Occupation(s) for Past Five Years
and Previous Position(s) |
Stephen F. Auth
Birth Date: September 13, 1956
101 Park Avenue
41st Floor
New York, NY 10178
CHIEF INVESTMENT OFFICER
Officer since: June 2012 | Principal Occupations: Stephen F. Auth is Chief Investment Officer of various Funds in the Federated Fund Family; Executive Vice President, Federated Investment Counseling, Federated Global Investment Management Corp. and Federated Equity Management Company of Pennsylvania.
Previous Positions: Executive Vice President, Federated Investment Management Company and Passport Research, Ltd. (investment advisory subsidiary of Federated); Senior Vice President, Global Portfolio Management Services Division; Senior Vice President, Federated Investment Management Company and Passport Research, Ltd.; Senior Managing Director and Portfolio Manager, Prudential Investments. |
Annual Shareholder Report
Evaluation and Approval of Advisory Contract–May 2019
Federated MDT Small Cap Core Fund (the “Fund”)
At its meetings in May 2019, the Fund's Board of Trustees (the “Board”), including a majority of those Trustees who are not “interested persons” of the Fund, as defined in the Investment Company Act of 1940 (the “Independent Trustees”) reviewed and unanimously approved the continuation of the Fund's investment advisory contract for an additional one-year term. The Board's decision regarding the contract reflects the exercise of its business judgment after considering all of the information received on whether to continue the existing arrangements.
At the request of the Independent Trustees, the Fund's Chief Compliance Officer (the CCO) furnished to the Board in advance of its May 2019 meetings an independent written evaluation presenting on the topics discussed below. The Board considered the CCO's independent written evaluation (the “CCO Fee Evaluation Report”), along with other information, in evaluating the reasonableness of the Fund's management fee and in deciding to approve the continuation of the investment advisory contract. The CCO, in preparing the CCO Fee Evaluation Report, has the authority to retain consultants, experts or staff as reasonably necessary to assist in the performance of his duties, reports directly to the Board, and can be terminated only with the approval of a majority of the Independent Trustees. At the request of the Independent Trustees, the CCO Fee Evaluation Report followed the same general approach and covered the same topics as that of the report that had previously been delivered by the CCO in his capacity as “Senior Officer,” prior to the elimination of the Senior Officer position in December 2017.
The Board also considered judicial decisions concerning allegedly excessive investment advisory fees in making its decision. Using these judicial decisions as a guide, the Board observed that the following factors may be relevant to an adviser's fiduciary duty with respect to its receipt of compensation from a fund: (1) the nature and quality of the services provided by an adviser to a fund and its shareholders (including the performance of the fund, its benchmark, and comparable funds); (2) an adviser's cost of providing the services (including the profitability to an adviser of providing advisory services to a fund); (3) the extent to which an adviser may realize “economies of scale” as a fund grows larger and, if such economies of scale exist, whether they have been shared with a fund and its shareholders or the family of funds; (4) any “fall-out” financial benefits that accrue to an adviser because of its relationship with a fund (including research services received from brokers that execute fund trades and any fees paid to affiliates of an adviser for services rendered to a fund); (5) comparative fee and expense structures (including a comparison of fees paid to an adviser with those paid by similar funds both internally and externally as well as management fees charged to institutional and other advisory clients of the
Annual Shareholder Report
adviser for what might be viewed as like services); and (6) the extent of care, conscientiousness and independence with which the fund's board members perform their duties and their expertise (including whether they are fully informed about all facts the board deems relevant to its consideration of an adviser's services and fees). The Board noted that the Securities and Exchange Commission (SEC) disclosure requirements regarding the basis for the Board's approval of the Fund's investment advisory contract generally align with the factors listed above. The Board was aware of these factors and was guided by them in its review of the Fund's investment advisory contract to the extent it considered them to be appropriate and relevant, as discussed further below.
The Board considered and weighed these factors in light of its substantial accumulated experience in governing the Fund and working with Federated MDTA LLC (the “Adviser”) and its affiliates (collectively “Federated”) on matters relating to the funds advised by Federated (each, a “Federated Fund”). The Independent Trustees were assisted in their deliberations by independent legal counsel.
In addition to the extensive materials that comprise and accompany the CCO Fee Evaluation Report, the Board received detailed information about the Fund and the Federated organization throughout the year, and in connection with its May meetings at which the Board's formal approval of the advisory and subadvisory contracts occurred. In this regard, Federated provided much of this information at each regular meeting of the Board, and furnished additional information specifically in connection with the May meetings. In the months preceding the May meetings, the Board requested and reviewed written materials prepared by Federated in response to requests on behalf of the Independent Trustees encompassing a wide variety of topics. At the May meetings, in addition to meeting in separate sessions of the Independent Trustees without management present, senior management of the Adviser also met with the Independent Trustees and their counsel to discuss the materials presented and such additional matters as the Independent Trustees deemed reasonably necessary to evaluate the advisory and subadvisory contracts. Between regularly scheduled meetings, the Board also received information on particular matters as the need arose.
The Board's consideration of the investment advisory contract included review of the CCO Fee Evaluation Report, accompanying data and additional information covering the following matters, among others: the Adviser's investment philosophy, revenue, profitability, personnel and processes; investment and operating strategies; the Fund's short-term and long-term performance (in absolute terms, both on a gross basis and net of expenses, as well as in terms relative to its particular investment program and certain competitor or “peer group” funds and/or other benchmarks, as appropriate) and comments on the reasons for performance; the Fund's investment objectives; the Fund's expenses, including the advisory fee and the overall expense structure of the Fund (both in absolute terms and relative to similar and/or competing funds), with due
Annual Shareholder Report
regard for contractual or voluntary expense limitations; the use and allocation of brokerage commissions derived from trading the Fund's portfolio securities (if any); and the nature, quality and extent of the advisory and other services provided to the Fund by the Adviser and its affiliates. The Board also considered the preferences and expectations of Fund shareholders; the entrepreneurial and other risks assumed by the Adviser in sponsoring the Fund; the continuing state of competition in the mutual fund industry and market practices; the range of comparable fees for similar funds in the mutual fund industry; the Fund's relationship to the Federated Funds which include a comprehensive array of funds with different investment objectives, policies and strategies which are generally available for exchange without the incurrence of additional sales charges; compliance and audit reports concerning the Federated Funds and the Federated companies that service them (including communications from regulatory agencies), as well as Federated's responses to any issues raised therein; and relevant developments in the mutual fund industry and how the Federated Funds and/or Federated are responding to them. The Board's evaluation process is evolutionary. The criteria considered and the emphasis placed on relevant criteria change in recognition of changing circumstances in the mutual fund marketplace.
While mindful that courts have cautioned against giving too much weight to comparative information concerning fees charged by other advisers for managing funds with comparable investment programs, the Board has found the use of such comparisons to be relevant to its deliberations. In this regard, the Board was presented with, and considered, information regarding the contractual advisory fee rates, net advisory fee rates, total expense ratios and each element of the Fund's total expense ratio (i.e., gross and net advisory fees, custody fees, portfolio accounting fees and transfer agency fees) relative to an appropriate group of peer funds compiled by Federated using data supplied by independent fund ranking organizations (the “Peer Group”). The Board received a description of the composition and methodology used to select the Peer Group. The Board focused on comparisons with other similar mutual funds more heavily than non-mutual fund products or services because it is believed that they are more relevant. For example, other mutual funds are the products most like the Fund, in that they are readily available to Fund shareholders as alternative investment vehicles. Also, they are the type of investment vehicle, in fact, chosen and maintained by the Fund's investors. The range of their fees and expenses, therefore, appears to be a relevant indicator of what consumers have found to be reasonable in the marketplace in which the Fund competes.
The Board reviewed the contractual advisory fee rate, net advisory fee rate and other expenses of the Fund and noted the position of the Fund's fee rates relative to its Peer Group. In this regard, the Board noted that the contractual advisory fee rate was below the median of the relevant Peer Group and the
Annual Shareholder Report
Board was satisfied that the overall expense structure of the Fund remained competitive. The Board considered the fact that the Adviser committed to permanently reduce fees of the Fund in an agreed upon amount, such reduction to be effective July 1, 2019.
For comparison, the CCO reviewed the fees charged by Federated for providing advisory services to products other than the Federated Funds (e.g., institutional separate accounts and third-party unaffiliated mutual funds for which Federated serves as sub-adviser) (referenced to as “Comparable Funds/Accounts”). With respect to Comparable Funds/Accounts other than third-party mutual funds, the CCO concluded that they are inherently different products. Those differences include, but are not limited to, different types of targeted investors; different applicable laws and regulations; different legal structures; different average account sizes and portfolio management techniques made necessary by different cash flows and different associated costs; and the time spent by portfolio managers and their teams, as well as personnel in the Funds Financial Services, Legal, Compliance and Risk Management departments, in reviewing securities pricing, addressing different administrative responsibilities, addressing different degrees of risk associated with management and a variety of different costs. The CCO also reviewed the differences in the nature of the services required for Federated to manage its proprietary mutual fund business versus managing a discrete pool of assets as a sub-adviser to another institution's mutual fund, and that Federated generally performs significant additional services and assumes substantially greater risks in managing the Fund and other Federated Funds than in its role as sub-adviser to an unaffiliated third-party mutual fund. The CCO did not consider the fees for providing advisory services to Comparable Funds/Accounts to be determinative in judging the appropriateness of the Federated Funds' advisory fees.
The CCO noted that the services, administrative responsibilities and risks associated with such relationships are quite different than serving as a primary adviser to a fund.
Following such evaluation, and full deliberations, the Board concluded that the fees and expenses of the Fund are reasonable and supported renewal of the Fund's investment advisory contract.
The Board considered the nature, extent and quality of the services provided to the Fund by the Adviser and the resources of the Adviser and its affiliates dedicated to the Fund. In this regard, the Board evaluated, among other things, the Adviser's personnel, experience, track record, financial resources, overall reputation and willingness to invest in personnel and infrastructure that benefit the Fund. In addition, the Board reviewed the qualifications, backgrounds and responsibilities of the portfolio management team primarily responsible for the day-to-day management of the Fund and the Adviser's ability and experience in attracting and retaining qualified personnel to service the Fund. The Board noted the investment research and company engagement capabilities of the Adviser and its affiliates. The Board also noted the compliance program of the
Annual Shareholder Report
Adviser and the compliance-related resources provided to the Fund by the Adviser, including the Adviser's commitment to respond to rulemaking initiatives of the SEC. The Fund's ability to deliver competitive performance when compared to its Peer Group was also deemed to be relevant by the Board as a useful indicator of how the Adviser is executing the Fund's investment program. The Adviser's ability to execute this program was one of the Board's considerations in reaching a conclusion that the nature, extent and quality of the Adviser's investment management services warrant the continuation of the investment advisory contract.
In evaluating the Fund's investment performance, the Board considered performance results in light of the Fund's investment objective, strategies and risks, as disclosed in the Fund's prospectus. The Board considered detailed investment reports on the Fund's performance that were provided to the Board throughout the year and in connection with the May meetings. The CCO also reviewed information regarding the performance of other mutual funds in the Peer Group, noting the CCO's view that comparisons to fund peer groups may be helpful, though not conclusive, in evaluating the performance of the Adviser in managing the Fund. The Board considered, in evaluating such comparisons, that in some cases there may be differences in the funds' investment objectives or investment management techniques, or the costs to implement funds, even within the same Peer Group, and that the CCO had specifically noted that the Fund's quantitative focus makes fee and expense comparisons particularly difficult as the funds in the Peer Group varied widely in their complexity, and the management of the Fund is among the more complex relative to its Peer Group.
For the one-year, three-year and five-year periods covered by the CCO Fee Evaluation Report, the Fund's performance was above the median of the relevant Peer Group. In addition, the Board was informed by the Adviser that the Fund outperformed its benchmark index for the three-year and five-year periods.
Following such evaluation, and full deliberations, the Board concluded that the performance of the Fund supported renewal of the Fund's advisory contract.
The Board also received financial information about Federated, including information regarding the compensation and ancillary (or “fall-out”) benefits Federated derived from its relationships with the Federated Funds. This information covered not only the fees under the investment advisory contracts, but also fees received by Federated's subsidiaries for providing other services to the Federated Funds under separate contracts (e.g., for serving as the Federated Funds' administrator and distributor). In this regard, the Board considered that certain Federated subsidiaries provide distribution and shareholder services to the Federated Funds, for which they may be compensated through distribution and servicing fees paid pursuant to Rule 12b-1 plans or otherwise. The information also detailed any indirect benefit Federated may derive from its
Annual Shareholder Report
receipt of research services from brokers who execute Federated Fund trades. In addition, the Board considered the fact that, in order for a Federated Fund to be competitive in the marketplace, the Adviser and its affiliates frequently waived fees and/or reimbursed expenses and have disclosed to Federated Fund investors and/or indicated to the Board their intention to do so in the future. Moreover, the Board receives regular reporting as to the institution, adjustment or elimination of these voluntary waivers. The Board considered Federated's previous reductions in contractual management fees to certain Federated Funds in response to the CCO's recommendations in the prior year's CCO Fee Evaluation Report.
In 2016, the Board approved a reduction of 16 basis points in the contractual advisory fee. In 2018, the Board approved a reduction of 14 basis points in the contractual advisory fee. This change was intended to more closely align the contractual fee with the net fee actually charged after the imposition of applicable voluntary waivers. In 2019, the Board approved a further reduction of 5 basis points in the contractual advisory fee.
Federated furnished information, requested by the CCO, that reported revenues on a fund-by-fund basis and made estimates of the allocation of expenses on a fund-by-fund basis, using allocation methodologies specified by the CCO. The CCO noted that, while these cost allocation reports apply consistent allocation processes, the inherent difficulties in allocating costs continues to cause the CCO to question the precision of the process and to conclude that such reports may be unreliable, since a single change in an allocation estimate may dramatically alter the resulting estimate of cost and/or profitability of a Federated Fund and may produce unintended consequences. The allocation information, including the CCO's view that fund-by-fund estimations may be unreliable, was considered in the evaluation by the Board.
The Board and the CCO also reviewed information compiled by Federated comparing its profitability information to other publicly held fund management companies, including information regarding profitability trends over time. In this regard, the CCO concluded that Federated's profit margins did not appear to be excessive. The CCO also noted that Federated appeared financially sound, with the resources necessary to fulfill its obligations under its contracts with the Fund.
The CCO Fee Evaluation Report also discussed the notion of possible realization of “economies of scale” as a fund grows larger, the difficulties of calculating economies of scale at an individual fund level, and the extent to which potential scale benefits are shared with shareholders. In this regard, the Board considered that Federated has made significant and long-term investments in areas that support all of the Federated Funds, such as personnel and processes for the portfolio management, shareholder services, compliance, internal audit and risk management functions, as well as systems technology (including technology relating to cybersecurity) and that the benefits of these investments (as well as any economies of scale, should they exist) were likely to be shared
Annual Shareholder Report
with the Federated Fund family as a whole. The Board noted that Federated's investments in these areas are extensive. In addition, the Board considered that the Adviser and its affiliates have frequently waived fees and/or reimbursed expenses and that this has allowed potential economies of scale to be shared with shareholders. The Board also considered that such waivers and reimbursements can provide protection from an increase in expenses if a Federated Fund's assets decline. Federated, as it does throughout the year, and specifically in connection with the Board's review of the advisory and subadvisory contracts, furnished information relative to revenue sharing or adviser-paid fees. Federated and the CCO noted that this information should be viewed to determine if there was an incentive to either not apply breakpoints, or to apply breakpoints at higher levels, and should not be viewed to determine the appropriateness of advisory fees. The Board also noted the absence of any applicable regulatory or industry guidelines on this subject, which (as discussed in the CCO Fee Evaluation Report) is compounded by the lack of any common industry practice or general pattern with respect to structuring fund advisory fees with “breakpoints” that serve to reduce the fee as a fund attains a certain size.
The CCO stated that his observations and the information accompanying the CCO Fee Evaluation Report supported a finding by the Board that the management fee for the Fund was reasonable. Under these circumstances, no changes were recommended to, and no objection was raised to the continuation of, the Fund's investment advisory contract. The CCO also recognized that the Board's evaluation of the Federated Funds' advisory and subadvisory arrangements is a continuing and on-going process that is informed by the information that the Board requests and receives from management throughout the course of the year and, in this regard, the CCO noted certain items for future reporting to the Board or further consideration by management as the Board continues its on-going oversight of the Federated Funds.
In its decision to continue an existing investment advisory contract, the Board was mindful of the potential disruptions of the Fund's operations and various risks, uncertainties and other effects that could occur as a result of a decision to terminate or not renew an investment advisory contract. In particular, the Board recognized that many shareholders have invested in the Fund on the strength of the Adviser's industry standing and reputation and with the expectation that the Adviser will have a continuing role in providing advisory services to the Fund. Thus, the Board's approval of the investment advisory contract reflected the fact that it is the shareholders who have effectively selected the Adviser by virtue of having invested in the Fund. The Board concluded that, in light of the factors summarized above, including the nature, quality and scope of the services provided to the Fund by the Adviser and its affiliates, continuation of the investment advisory contract was appropriate.
Annual Shareholder Report
The Board based its decision to approve the investment advisory contract on the totality of the circumstances and relevant factors and with a view to past and future long-term considerations. Not all of the factors and considerations identified above were necessarily relevant to the Fund, nor did the Board consider any one of them to be determinative. With respect to the factors that were relevant, the Board's decision to approve the continuation of the contract reflects its view that Federated's performance and actions provided a satisfactory basis to support the decision to continue the existing arrangement.
Annual Shareholder Report
Voting Proxies on Fund Portfolio Securities
A description of the policies and procedures that the Fund uses to determine how to vote proxies, if any, relating to securities held in the Fund's portfolio is available, without charge and upon request, by calling 1-800-341-7400. A report on “Form N-PX” of how the Fund voted any such proxies during the most recent 12-month period ended June 30 is available via the Proxy Voting Record (Form N-PX) link associated with the Fund and share class name at www.FederatedInvestors.com/FundInformation. Form N-PX filings are also available at the SEC's website at www.sec.gov.
Quarterly Portfolio Schedule
Each fiscal quarter, the Fund will file with the SEC a complete schedule of its monthly portfolio holdings on “Form N-PORT.” The Fund's holdings as of the end of the third month of every fiscal quarter, as reported on Form N-PORT, will be publicly available on the SEC's website at www.sec.gov within 60 days of the end of the fiscal quarter upon filing. You may also access this information via the link to the Fund and share class name at www.FederatedInvestors.com.
Annual Shareholder Report
Mutual funds are not bank deposits or obligations, are not guaranteed by any bank and are not insured or guaranteed by the U.S. government, the Federal Deposit Insurance Corporation, the Federal Reserve Board or any other government agency. Investment in mutual funds involves investment risk, including the possible loss of principal.
This Report is authorized for distribution to prospective investors only when preceded or accompanied by the Fund's Prospectus, which contains facts concerning its objective and policies, management fees, expenses and other information.
Federated MDT Small Cap Core Fund
Federated Investors Funds
4000 Ericsson Drive
Warrendale, PA 15086-7561
Contact us at FederatedInvestors.com
or call 1-800-341-7400.
Federated Securities Corp., Distributor
CUSIP 31421R817
CUSIP 31421R791
CUSIP 31421R783
CUSIP 31421R627
37328 (9/19)
Federated is a registered trademark of Federated Investors, Inc.
2019 ©Federated Investors, Inc.
Annual Shareholder Report
July 31, 2019
| Share Class | Ticker | A | QASGX | C | QCSGX | |
| | Institutional | QISGX | R6 | QLSGX | |
Federated MDT Small Cap Growth Fund
Fund Established 2005
A Portfolio of Federated MDT Series
IMPORTANT NOTICE REGARDING REPORT DELIVERY
Beginning on January 1, 2021, as permitted by regulations adopted by the Securities and Exchange Commission, paper copies of the Fund's shareholder reports like this one will no longer be sent by mail, unless you specifically request paper copies of the reports from the Fund or from your financial intermediary, such as a broker-dealer or bank. Instead, the reports will be made available on a website, and you will be notified by mail each time a report is posted and provided with a website link to access the report.
If you already elected to receive shareholder reports electronically, you will not be affected by this change and you need not take any action. You may elect to receive shareholder reports and other communications from the Fund or your financial intermediary electronically by contacting your financial intermediary (such as a broker-dealer or bank); other shareholders may call the Fund at 1-800-341-7400, Option 4.
You may elect to receive all future reports in paper free of charge. You can inform the Fund or your financial intermediary that you wish to continue receiving paper copies of your shareholder reports by contacting your financial intermediary (such as a broker-dealer or bank); other shareholders may call the Fund at 1-800-341-7400, Option 4. Your election to receive reports in paper will apply to all funds held with the Fund complex or your financial intermediary.
Not FDIC Insured ■ May Lose Value ■ No Bank Guarantee
J. Christopher
Donahue
President
Federated MDT Small Cap Growth Fund
Letter from the President
Dear Valued Shareholder,
I am pleased to present the Annual Shareholder Report for your fund covering the period from August 1, 2018 through July 31, 2019. This report includes Management's Discussion of Fund Performance, a complete listing of your fund's holdings, performance information and financial statements along with other important fund information.
In addition, our website, FederatedInvestors.com, offers easy access to Federated resources that include timely fund updates, economic and market insights from our investment strategists, and financial planning tools.
Thank you for investing with Federated. I hope you find this information useful and look forward to keeping you informed.
Sincerely,
J. Christopher Donahue, President
CONTENTS
| 1 |
| 6 |
| 7 |
| 15 |
| 19 |
| 21 |
| 22 |
| 23 |
| 33 |
| 35 |
| 37 |
| 43 |
| 51 |
| 51 |
Management's Discussion of Fund Performance (unaudited)
The total return of Federated MDT Small Cap Growth Fund (the “Fund”), based on net asset value for the 12-month reporting period ended July 31, 2019, was -2.83% for Class A Shares, -3.58% for Class C Shares, -2.60% for Institutional Shares and -2.60% for Class R6 Shares. The total return for the Russell 2000® Growth Index (R2000G),1 the Fund's broad-based securities market index, was -1.22% for the same period. The total return of the Morningstar Small Growth Funds Average (MSGFA),2 a peer group average for the Fund, was 3.63% during the same period. The Fund's and MSGFA's total returns for the most recently completed fiscal year reflected actual cash flows, transaction costs and other expenses, which were not reflected in the total return of the R2000G.
During the reporting period, the Fund's investment strategy focused on stock selection. This was the most significant factor affecting the Fund's performance relative to the R2000G during the period.
The following discussion will focus on the performance of the Fund's R6 Shares.
MARKET OVERVIEW
During the reporting period, overall domestic equity market performance was moderately strong as evidenced by the 7.05% return of the whole-market Russell 3000® Index.3 Larger cap stocks had a much better year than small-cap stocks.4 The Russell Top 200® Index5 returned 8.51%, and the Russell Midcap® Index6 returned 6.71%, but both the small-cap Russell 2000® Index7 and the very small-cap Russell Microcap® Index8 fell (returns of -4.42% and -11.55%, respectively). For style, this was the third fiscal year in a row that growth stocks led value stocks by a substantial margin. During the reporting period, the Russell 3000® Growth Index9 returned 9.88%, and the Russell 3000® Value Index10 returned 4.23%. The widest difference between the growth and value styles was in the mid-cap range, where the Russell Midcap® Growth Index11 returned 14.15%, and the Russell Midcap Value Index12 returned 1.78%.
The best performing sectors in the R2000G during the reporting period were Utilities (22.06%), Information Technology (19.27%) and Communication Services (7.20%). Underperforming sectors during the same period included Energy (-46.65%), Materials (-16.24%) and Health Care (-5.67%).
STOCK SELECTION
The Fund buys stocks with many different combinations of fundamental and technical characteristics that have signaled market outperformance historically. While the Fund only buys stocks in the benchmark, in this growth-oriented environment it was the stocks with more value-oriented combinations of characteristics such as flat or improving earnings to price and prices not near
Annual Shareholder Report
52-week highs that were the primary cause of underperformance. The holdings with stronger growth characteristics such as very high analyst conviction and strong technical factors contributed most positively to performance. The Fund's sector exposures continued to remain close to R2000G weights; at the end of the fiscal year the only significant underweight was in the Real Estate sector (the Fund did not invest in the Real Estate sector during the period). Weak stock selection in the Industrials and Financials sectors contributed the most to Fund underperformance. Favorable stock selection in the Information Technology and Consumer Discretionary sectors provided a partial offset.
Individual stocks enhancing the Fund's performance included Planet Fitness, Inc., Loxo Oncology, Inc. and Scientific Games Corporation.
Individual stocks detracting from the Fund's performance included Weight Watchers International, Inc., Trinseo S.A. and Green Dot Corporation.
| 1 | Please see the footnotes to the line graphs below for definitions of, and further information about, the R2000G. |
| 2 | Please see the footnotes to the line graphs below for definitions of, and further information about, the MSGFA. |
| 3 | The Russell 3000® Index measures the performance of the largest 3,000 U.S. companies representing approximately 98% of the investable U.S. equity market. The Russell 3000® Index is constructed to provide a comprehensive, unbiased and stable barometer of the broad market, and is completely reconstituted annually to ensure new and growing equities are reflected.* |
| 4 | Small-cap stocks may be less liquid and subject to greater price volatility than large-cap stocks. |
| 5 | The Russell Top 200® Index measures the performance of the largest cap segment of the U.S. equity universe. The Russell Top 200® Index is a subset of the Russell 3000® Index. It includes approximately 200 of the largest securities based on a combination of their market cap and current index membership and represents approximately 68% of the U.S. market. The Russell Top 200® Index is constructed to provide a comprehensive and unbiased barometer for this very large cap segment and is completely reconstituted annually to ensure new and growing equities are reflected.* |
| 6 | The Russell Midcap® Index measures the performance of the mid-cap segment of the U.S. equity universe. The Russell Midcap® Index is a subset of the Russell 1000® Index. It includes approximately 800 of the smallest securities based on a combination of their market cap and current index membership. The Russell Midcap® Index represents approximately 31% of the total market capitalization of the Russell 1000® companies. The Russell Midcap® Index is constructed to provide a comprehensive and unbiased barometer for the mid-cap segment. The Russell Midcap Index is completely reconstituted annually to ensure larger stocks do not distort the performance and characteristics of the true mid-cap opportunity set.* |
| 7 | The Russell 2000® Index measures the performance of the small-cap segment of the U.S. equity universe. The Russell 2000® Index is a subset of the Russell 3000® Index representing approximately 10% of the total market capitalization of that index. It includes approximately 2000 of the smallest securities based on a combination of their market cap and current index membership. The Russell 2000® Index is constructed to provide a comprehensive and unbiased small-cap barometer and is completely reconstituted annually to ensure larger stocks do not distort the performance and characteristics of the true small-cap opportunity set.* |
| 8 | The Russell Microcap® Index measures the performance of the microcap segment of the U.S. equity market. Microcap stocks make up less than 3% of the U.S. equity market (by market cap) and consist of the smallest 1,000 securities in the small-cap Russell 2000® Index, plus the next 1,000 smallest eligible securities by market cap. The Russell Microcap® Index is constructed to provide a comprehensive and unbiased barometer for the microcap segment trading on national exchanges and is completely reconstituted annually to ensure new and growing equities are reflected and companies continue to reflect appropriate capitalization and value characteristics.* |
Annual Shareholder Report
| 9 | The Russell 3000® Growth Index measures the performance of the broad growth segment of the U.S. equity universe. It includes those Russell 3000® Index companies with higher price-to-book ratios and higher forecasted growth values. The Russell 3000® Growth Index is constructed to provide a comprehensive, unbiased and stable barometer of the broad growth market. The Russell 3000® Growth Index is completely reconstituted annually to ensure new and growing equities are included and that the represented companies continue to reflect growth characteristics.* |
| 10 | The Russell 3000® Value Index measures the performance of the broad value segment of U.S. equity value universe. It includes those Russell 3000® Index companies with lower price-to-book ratios and lower forecasted growth values. The Russell 3000® Value Index is constructed to provide a comprehensive, unbiased and stable barometer of the broad value market. The Russell 3000® Value Index is completely reconstituted annually to ensure new and growing equities are included and that the represented companies continue to reflect value characteristics.* |
| 11 | The Russell Midcap® Growth Index measures the performance of the mid-cap growth segment of the U.S. equity universe. It includes those Russell Midcap® Index companies with higher price-to-book ratios and higher forecasted growth values. The Russell Midcap® Growth Index is constructed to provide a comprehensive and unbiased barometer of the mid-cap growth market and is completely reconstituted annually to ensure larger stocks do not distort the performance and characteristics of the true mid-cap growth market.* |
| 12 | The Russell Midcap® Value Index measures the performance of the mid-cap value segment of the U.S. equity universe. It includes those Russell Midcap Index companies with lower price-to-book ratios and lower forecasted growth values. The Russell Midcap® Value Index is constructed to provide a comprehensive and unbiased barometer of the mid-cap value market and is completely reconstituted annually to ensure larger stocks do not distort the performance and characteristics of the true mid-cap value market.* |
| * | The index is unmanaged, and it is not possible to invest directly in an index. |
Annual Shareholder Report
FUND PERFORMANCE AND GROWTH OF A $10,000 INVESTMENT
The graph below illustrates the hypothetical investment of $10,0001 in the Federated MDT Small Cap Growth Fundfrom July 31, 2009 to July 31, 2019, compared to the Russell 2000 Growth® Index (R2000G)2 and the Morningstar Small Growth Funds Average (MSGFA).3The Average Annual Total Return table below shows returns for each class averaged over the stated periods.
Growth of a $10,000 Investment
Growth of $10,000 as of July 31, 2019
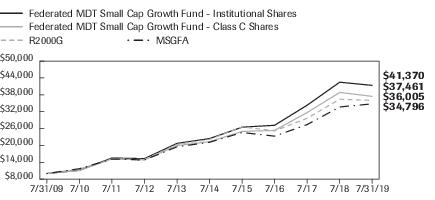
| Federated MDT Small Cap Growth Fund - | Institutional Shares | Class C Shares | NA | R2000G | MSGFA |
| F | F | NA | I | I |
| 7/31/2009 | 10,000 | 10,000 | | 10,000 | 10,000 |
| 7/31/2010 | 11,160 | 11,063 | | 11,671 | 11,715 |
| 7/31/2011 | 15,523 | 15,223 | | 15,093 | 15,162 |
| 7/31/2012 | 15,309 | 14,869 | | 15,017 | 14,821 |
| 7/31/2013 | 20,731 | 19,934 | | 20,330 | 19,517 |
| 7/31/2014 | 22,434 | 21,352 | | 22,146 | 21,122 |
| 7/31/2015 | 26,494 | 24,974 | | 26,592 | 24,597 |
| 7/31/2016 | 27,172 | 25,350 | | 25,182 | 23,305 |
| 7/31/2017 | 34,310 | 31,707 | | 29,654 | 27,420 |
| 7/31/2018 | 42,493 | 38,853 | | 36,448 | 33,690 |
| 7/31/2019 | 41,370 | 37,461 | | 36,005 | 34,796 |
41 graphic description end -->
| ■ | Total returns shown for Class C Shares include the maximum contingent deferred sales charge of 1.00% as applicable. |
The Fund offers multiple share classes whose performance may be greater than or less than its other share class(es) due to differences in sales charges and expenses. See the Average Annual Total Return table below for the returns of additional classes not shown in the line graph above.
Average Annual Total Returnsfor the Period Ended 7/31/2019
(returns reflect all applicable sales charges and contingent deferred sales charges as specified below in footnote #1)
| | 1 Year | 5 Years | 10 Years |
| Class A Shares | -8.17% | 11.49% | 14.32% |
| Class C Shares | -4.47% | 11.90% | 14.12% |
| Institutional Shares | -2.60% | 13.03% | 15.26% |
| Class R6 Shares4 | -2.60% | 12.95% | 15.05% |
| R2000G | -1.22% | 10.21% | 13.67% |
| MSGFA | 3.63% | 10.81% | 13.80% |
Annual Shareholder Report
Performance data quoted represents past performance which is no guarantee of future results. Investment return and principal value will fluctuate so that an investor's shares, when redeemed, may be worth more or less than their original cost. Mutual fund performance changes over time and current performance may be lower or higher than what is stated. For current to the most recent month-end performance and after-tax returns, visit FederatedInvestors.com or call 1-800-341-7400. Returns shown do not reflect the deduction of taxes that a shareholder would pay on Fund distributions or the redemption of Fund shares. Mutual funds are not obligations of or guaranteed by any bank and are not federally insured.
| 1 | Represents a hypothetical investment of $10,000 in the Fund after deducting applicable sales charges: for Class A Shares, the maximum sales charge of 5.50% ($10,000 investment minus $550 sales charges = $9,450); for Class C Shares, a 1.00% contingent deferred sales charge would be applied to any redemption less than one year from the purchase date. The Fund's performance assumes the reinvestment of all dividends and distributions. The R2000G and MSGFA have been adjusted to reflect reinvestment of dividends on securities. |
| 2 | The R2000G measures the performance of the small-cap growth segment of the U.S. equity universe. It includes those Russell 2000® Index companies with higher price-to-value ratios and higher forecasted growth values. The R2000G is constructed to provide a comprehensive and unbiased barometer for the small-cap growth segment. The R2000G is completely reconstituted annually to ensure larger stocks do not distort the performance and characteristics of the true small-cap opportunity set and that the represented companies continue to reflect growth characteristics. The R2000G is unmanaged and, unlike the Fund, is not affected by cash flows. It is not possible to invest directly in an index. The R2000G is not adjusted to reflect sales charges, expenses or other fees that the Securities and Exchange Commission requires to be reflected in the Fund's performance. |
| 3 | Morningstar figures represent the average of the total returns reported by all the funds designated by Morningstar as falling into the respective category indicated. They do not reflect sales charges. The Morningstar figures in the Growth of $10,000 line graph are based on historical return information published by Morningstar and reflect the return of the funds comprising the category in the year of publication. Because the funds designated by Morningstar as falling into the category can change over time, the Morningstar figures in the line graph may not match the Morningstar figures in the Average Annual Total Returns table, which reflect the return of the funds that currently comprise the category. |
| 4 | The Fund's Class R6 Shares commenced operations on June 29, 2016. It is anticipated that this class will have the lowest net expenses of all outstanding share classes. For the period prior to the commencement of operations of Class R6 Shares, the performance information shown is for the Fund's Institutional Shares adjusted to reflect expenses of the Class R6 Shares for each year for which the gross expenses of Class R6 Shares would have exceeded the actual expenses paid by Institutional Shares. |
Annual Shareholder Report
Portfolio of Investments Summary Table (unaudited)
At July 31, 2019, the Fund's sector composition1 was as follows:
| Sector Composition | Percentage of
Total Net Assets |
| Health Care | 27.4% |
| Information Technology | 19.0% |
| Industrials | 18.9% |
| Consumer Discretionary | 13.5% |
| Financials | 6.9% |
| Consumer Staples | 4.2% |
| Communication Services | 3.3% |
| Materials | 2.9% |
| Energy | 1.1% |
| Utilities | 0.8% |
| Securities Lending Collateral2 | 9.7% |
| Cash Equivalents3 | 1.7% |
| Other Assets and Liabilities—Net4 | (9.4)% |
| TOTAL | 100.0% |
| 1 | Except for Cash Equivalents and Other Assets and Liabilities, sector classifications are based upon, and individual portfolio securities are assigned to, the classifications of the Global Industry Classification Standard (GICS) except that the Adviser assigns a classification to securities not classified by the GICS and to securities for which the Adviser does not have access to the classification made by the GICS. |
| 2 | Represents cash collateral received for portfolio securities on loan that may be invested in affiliated money market funds, other money market instruments and/or repurchase agreements. |
| 3 | Cash Equivalents include any investments in money market mutual funds and/or overnight repurchase agreements other than those representing cash collateral for securities lending. |
| 4 | Assets, other than investments in securities, less liabilities. See Statement of Assets and Liabilities. |
Annual Shareholder Report
Portfolio of Investments
July 31, 2019
| Shares | | | Value |
| | | COMMON STOCKS—98.0% | |
| | | Communication Services—3.3% | |
| 81,063 | | Cogent Communications Holdings, Inc. | $5,107,780 |
| 155,299 | 1 | Imax Corp. | 3,408,813 |
| 104,645 | 2 | Meredith Corp. | 5,740,825 |
| 82,266 | | New York Times Co., Class A | 2,935,251 |
| 25,105 | 2 | Nexstar Media Group, Inc., Class A | 2,554,936 |
| 41,140 | | Shenandoah Telecommunications Co. | 1,619,270 |
| 59,478 | | Sinclair Broadcast Group, Inc. | 2,988,769 |
| 157,056 | 1,2 | Yelp, Inc. | 5,504,813 |
| | | TOTAL | 29,860,457 |
| | | Consumer Discretionary—13.5% | |
| 114,668 | | American Eagle Outfitters, Inc. | 2,028,477 |
| 63,130 | 1 | Asbury Automotive Group, Inc. | 5,813,010 |
| 48,389 | 2 | BJ's Restaurants, Inc. | 1,921,043 |
| 68,351 | | Bloomin Brands, Inc. | 1,164,017 |
| 101,461 | 2 | Bluegreen Vacations Corp. | 1,046,063 |
| 96,516 | 2 | Brinker International, Inc. | 3,846,163 |
| 3,780 | | Churchill Downs, Inc. | 452,277 |
| 117,043 | 1 | CROCs, Inc. | 2,674,432 |
| 116,377 | | Dana, Inc. | 1,944,660 |
| 43,662 | 1 | Deckers Outdoor Corp. | 6,823,497 |
| 54,565 | 2 | Dine Brands Global, Inc. | 4,479,241 |
| 27,397 | 1,2 | Eldorado Resorts, Inc. | 1,236,153 |
| 33,837 | 1,2 | Etsy, Inc. | 2,267,756 |
| 316,557 | 1 | Everi Holdings, Inc. | 3,801,850 |
| 33,926 | 1,2 | Fox Factory Holding Corp. | 2,716,794 |
| 43,906 | 1 | Installed Building Products, Inc. | 2,339,312 |
| 89,091 | | Lithia Motors, Inc., Class A | 11,749,321 |
| 118,049 | | M.D.C. Holdings, Inc. | 4,266,291 |
| 180,095 | 1,2 | MarineMax, Inc. | 2,780,667 |
| 126,182 | 1 | Planet Fitness, Inc. | 9,925,476 |
| 158,657 | | Rent-A-Center, Inc. | 4,288,499 |
| 282,962 | 1 | SeaWorld Entertainment, Inc. | 8,650,148 |
| 17,179 | 1 | Shutterstock, Inc. | 659,158 |
| 110,140 | 1,2 | Stamps.com, Inc. | 5,259,185 |
| 662,282 | 2 | Tailored Brands, Inc. | 3,225,313 |
Annual Shareholder Report
| Shares | | | Value |
| | | COMMON STOCKS—continued | |
| | | Consumer Discretionary—continued | |
| 76,089 | 1 | TopBuild Corp. | $6,173,101 |
| 341,076 | 1 | Weight Watchers International, Inc. | 7,384,295 |
| 54,313 | 2 | Wingstop, Inc. | 5,191,780 |
| 183,803 | 1,2 | YETI Holdings, Inc. | 6,388,992 |
| | | TOTAL | 120,496,971 |
| | | Consumer Staples—4.2% | |
| 68,532 | 1,2 | Chefs Warehouse, Inc. | 2,499,362 |
| 11,768 | | Coca-Cola Bottling Co. | 3,454,261 |
| 99,880 | 1,2 | elf Beauty, Inc. | 1,657,009 |
| 35,915 | | Medifast, Inc. | 4,009,910 |
| 149,131 | 1,2 | National Beverage Corp. | 6,491,672 |
| 210,925 | 1 | Performance Food Group Co. | 9,249,061 |
| 8,318 | 1,2 | The Boston Beer Co., Inc., Class A | 3,263,318 |
| 106,311 | 1 | USANA Health Sciences, Inc. | 7,234,464 |
| | | TOTAL | 37,859,057 |
| | | Energy—1.1% | |
| 212,213 | 1 | CONSOL Energy, Inc. | 4,560,457 |
| 40,241 | | DMC Global, Inc. | 2,102,190 |
| 738,449 | 1,2 | Denbury Resources, Inc. | 834,447 |
| 46,317 | 2 | Liberty Oilfield Services, Inc. | 655,386 |
| 75,531 | 1,2 | Par Pacific Holdings, Inc. | 1,741,745 |
| | | TOTAL | 9,894,225 |
| | | Financials—6.9% | |
| 8,955 | 1 | eHealth, Inc. | 929,081 |
| 78,184 | 1 | Enova International, Inc. | 2,107,059 |
| 87,110 | 1 | Essent Group Ltd. | 4,020,998 |
| 45,181 | 2 | FB Financial Corp. | 1,717,330 |
| 139,914 | 1 | Green Dot Corp. | 7,092,241 |
| 38,716 | | Guaranty Bancshares, Inc. | 1,193,227 |
| 73,507 | | Kemper Corp. | 6,470,086 |
| 104,460 | | Kinsale Capital Group, Inc. | 9,386,776 |
| 62,363 | 2 | Lakeland Financial Corp. | 2,868,074 |
| 10,912 | 1,2 | LendingTree, Inc. | 3,519,556 |
| 186,960 | 1 | NMI Holdings, Inc. | 4,651,565 |
| 102,498 | | National Bank Holdings Corp. | 3,718,627 |
| 478,461 | | National General Holdings Corp. | 11,832,340 |
| 60,025 | | The Bank of NT Butterfield & Son Ltd. | 1,886,586 |
| | | TOTAL | 61,393,546 |
Annual Shareholder Report
| Shares | | | Value |
| | | COMMON STOCKS—continued | |
| | | Health Care—27.4% | |
| 30,840 | 1,2 | Acadia Pharmaceuticals, Inc. | $758,047 |
| 51,904 | 1,3 | Adeptus Health, Inc. | 0 |
| 16,386 | 1 | Amedisys, Inc. | 2,259,466 |
| 354,227 | 1 | American Renal Associates Holdings, Inc. | 2,727,548 |
| 108,472 | 1 | Apellis Pharmaceuticals, Inc. | 3,029,623 |
| 115,437 | 1,2 | Arena Pharmaceuticals, Inc. | 7,235,591 |
| 122,455 | 1,2 | Arrowhead Pharmaceuticals, Inc. | 3,558,542 |
| 197,827 | 1 | Assertio Therapeutics, Inc. | 678,547 |
| 145,191 | 1 | Audentes Therapeutics, Inc. | 5,650,834 |
| 373,535 | 1 | BioCryst Pharmaceuticals, Inc. | 1,184,106 |
| 88,801 | 1 | Blueprint Medicines Corp. | 8,893,420 |
| 120,411 | | CONMED Corp. | 10,517,901 |
| 74,665 | 1,2 | Cara Therapeutics, Inc. | 1,787,480 |
| 209,853 | 1 | Cardiovascular Systems, Inc. | 9,617,563 |
| 147,849 | 1 | ChemoCentryx, Inc. | 1,179,835 |
| 201,225 | 1,2 | Coherus Biosciences, Inc. | 3,384,604 |
| 98,704 | 1 | Cytokinetics, Inc. | 1,203,202 |
| 75,553 | 1,2 | Denali Therapeutics, Inc. | 1,613,057 |
| 58,191 | 1,2 | Eagle Pharmaceuticals, Inc. | 3,192,358 |
| 20,648 | 1,2 | Eidos Therapeutics, Inc. | 672,712 |
| 8,082 | 1 | Enanta Pharmaceuticals, Inc. | 606,312 |
| 114,350 | 2 | Ensign Group, Inc. | 6,890,731 |
| 151,584 | 1 | Epizyme, Inc. | 2,010,004 |
| 169,073 | 1 | Fate Therapeutics, Inc. | 3,728,060 |
| 47,720 | 1 | Glaukos Corp. | 3,897,770 |
| 59,442 | 1,2 | Global Blood Therapeutics, Inc. | 3,257,422 |
| 50,779 | 1 | Globus Medical, Inc. | 2,314,507 |
| 135,556 | 1 | HMS Holdings Corp. | 4,730,904 |
| 500,747 | 1 | Halozyme Therapeutics, Inc. | 8,507,691 |
| 16,018 | 1 | HealthEquity Inc. | 1,313,156 |
| 104,016 | 1 | Horizon Therapeutics PLC | 2,588,958 |
| 145,041 | 1 | Inogen, Inc. | 8,920,021 |
| 16,004 | 1 | Integer Holdings Corp. | 1,400,830 |
| 258,854 | 1,2 | Iovance Biotherapeutics, Inc. | 6,365,220 |
| 14,190 | 1 | LHC Group, Inc. | 1,796,170 |
| 69,224 | 1 | Livanova PLC | 5,333,709 |
| 66,652 | 1 | Medpace Holdings, Inc. | 5,249,511 |
| 166,789 | 1 | MeiraGTx Holdings PLC | 4,545,000 |
Annual Shareholder Report
| Shares | | | Value |
| | | COMMON STOCKS—continued | |
| | | Health Care—continued | |
| 50,161 | 1 | Mirati Therapeutics, Inc. | $5,307,034 |
| 15,171 | 1 | Molina Healthcare, Inc. | 2,014,405 |
| 88,915 | 1,2 | Myriad Genetics, Inc. | 2,590,983 |
| 172,029 | 1 | Natera, Inc. | 4,744,560 |
| 491,020 | 1 | NeoGenomics, Inc. | 11,966,157 |
| 72,925 | 1 | Novocure Ltd. | 6,068,818 |
| 54,746 | 1 | NuVasive, Inc. | 3,646,084 |
| 57,087 | 1,2 | Omnicell, Inc. | 4,293,513 |
| 94,446 | 1 | Orthofix Medical, Inc. | 5,048,139 |
| 140,347 | 1 | Pacira BioSciences Inc. | 6,159,830 |
| 10,039 | 1 | Quidel Corp. | 592,602 |
| 108,864 | 1 | Ra Pharmaceuticals, Inc. | 3,705,731 |
| 25,537 | 1,2 | Reata Pharmaceuticals, Inc. | 2,314,929 |
| 208,696 | 1 | Repligen Corp. | 19,698,815 |
| 160,022 | 1,2 | Supernus Pharmaceuticals, Inc. | 5,339,934 |
| 22,821 | 1 | Tandem Diabetes Care, Inc. | 1,447,536 |
| 207,521 | 1 | Tenet Healthcare Corp. | 4,891,270 |
| 359,457 | 1 | Vanda Pharmaceuticals, Inc. | 4,475,240 |
| 261,954 | 1 | Voyager Therapeutics, Inc. | 5,765,608 |
| 332,483 | 1,2 | Ziopharm Oncology, Inc. | 2,307,432 |
| | | TOTAL | 244,979,032 |
| | | Industrials—18.9% | |
| 228,646 | | Advanced Drainage System, Inc. | 7,529,313 |
| 66,324 | 1 | Aerojet Rocketdyne Holdings, Inc. | 2,833,361 |
| 68,070 | 1,2 | Aerovironment, Inc. | 3,733,639 |
| 14,122 | | Albany International Corp., Class A | 1,214,351 |
| 64,342 | | Astec Industries, Inc. | 2,103,340 |
| 154,459 | 1 | Atkore International Group, Inc. | 4,215,186 |
| 47,805 | 2 | Brinks Co. (The) | 4,310,099 |
| 59,019 | 1 | Casella Waste Systems, Inc. | 2,573,228 |
| 86,435 | | Comfort Systems USA, Inc. | 3,630,270 |
| 83,146 | 1 | Commercial Vehicle Group, Inc. | 675,145 |
| 225,108 | 1 | Continental Building Products, Inc. | 5,533,155 |
| 173,220 | | Covanta Holding Corp. | 2,982,848 |
| 72,407 | | Deluxe Corp. | 3,230,800 |
| 145,460 | 1 | Echo Global Logistics, Inc. | 3,063,388 |
| 66,817 | | Emcor Group, Inc. | 5,638,687 |
| 44,301 | 1 | Generac Holdings, Inc. | 3,202,962 |
Annual Shareholder Report
| Shares | | | Value |
| | | COMMON STOCKS—continued | |
| | | Industrials—continued | |
| 148,104 | 1 | Harsco Corp. | $3,474,520 |
| 160,686 | | Heidrick & Struggles International, Inc. | 4,772,374 |
| 137,040 | | Hillenbrand, Inc. | 4,616,878 |
| 45,563 | 1 | Hub Group, Inc. | 2,066,282 |
| 61,702 | | Insperity, Inc. | 6,562,008 |
| 60,444 | | John Bean Technologies Corp. | 7,172,285 |
| 47,116 | | KForce Com, Inc. | 1,606,184 |
| 174,760 | | Korn Ferry | 6,864,573 |
| 20,627 | 2 | MSA Safety, Inc. | 2,173,054 |
| 106,459 | 1 | Masonite International Corp. | 5,674,265 |
| 122,192 | 1,2 | Mastec, Inc. | 6,270,893 |
| 75,874 | 1 | Mercury Systems, Inc. | 6,185,248 |
| 314,222 | 1 | Meritor, Inc. | 7,770,710 |
| 154,856 | | Miller Herman, Inc. | 7,021,171 |
| 107,919 | | Rush Enterprises, Inc. | 4,064,230 |
| 88,276 | 1,2 | Taser International, Inc. | 6,198,741 |
| 110,683 | | Tetra Tech, Inc. | 8,766,094 |
| 58,527 | 1,2 | TriNet Group, Inc. | 4,304,076 |
| 69,251 | | Universal Forest Products, Inc. | 2,799,818 |
| 121,174 | | Universal Logistics Holdings, Inc. | 2,385,916 |
| 89,381 | 2 | Werner Enterprises, Inc. | 2,962,980 |
| 77,594 | | Woodward, Inc. | 8,693,632 |
| | | TOTAL | 168,875,704 |
| | | Information Technology—19.0% | |
| 113,580 | 1 | ACI Worldwide, Inc. | 3,811,745 |
| 12,050 | 1 | Avalara, Inc. | 981,834 |
| 107,130 | | CSG Systems International, Inc. | 5,489,341 |
| 151,752 | 1,2 | Cardtronics, Inc. | 4,321,897 |
| 36,416 | 1 | Ciena Corp. | 1,646,732 |
| 133,475 | 1 | Commvault Systems, Inc. | 6,065,104 |
| 155,389 | 1 | Cornerstone OnDemand, Inc. | 9,199,029 |
| 71,184 | 1,2 | Coupa Software, Inc. | 9,660,381 |
| 239,795 | 1 | Endurance International Group Holdings, Inc. | 1,136,628 |
| 205,430 | 1 | Enphase Energy, Inc. | 5,782,855 |
| 16,355 | 1,2 | Everbridge, Inc. | 1,673,117 |
| 27,743 | 1 | Evo Payments, Inc. | 863,362 |
| 78,547 | 1 | HubSpot, Inc. | 14,037,920 |
| 12,763 | 1 | Inphi Corp. | 768,460 |
Annual Shareholder Report
| Shares | | | Value |
| | | COMMON STOCKS—continued | |
| | | Information Technology—continued | |
| 120,088 | 1,2 | j2 Global, Inc. | $10,698,640 |
| 434,447 | 1 | Lattice Semiconductor Corp. | 8,402,205 |
| 59,651 | | Maximus, Inc. | 4,384,945 |
| 86,595 | 1,2 | Nanometrics, Inc. | 2,717,351 |
| 45,011 | 1 | OSI Systems, Inc. | 5,066,438 |
| 133,431 | 1 | PROS Holdings, Inc. | 9,655,067 |
| 128,903 | 1 | Paylocity Corp. | 13,159,707 |
| 99,596 | 1 | Perficient, Inc. | 3,403,195 |
| 21,480 | 1 | Qualys, Inc. | 1,859,309 |
| 104,968 | 1 | Rapid7, Inc. | 6,366,309 |
| 94,427 | 1 | SPS Commerce, Inc. | 10,559,771 |
| 64,296 | 1,2 | SVMK, Inc. | 1,091,103 |
| 7,683 | | Science Applications International Corp. | 655,898 |
| 30,524 | 1 | Silicon Laboratories, Inc. | 3,425,098 |
| 68,878 | 1 | Stratasys, Inc. | 1,921,007 |
| 80,265 | 1 | Verint Systems, Inc. | 4,644,936 |
| 159,573 | 1 | Workiva, Inc. | 9,173,852 |
| 81,386 | 1,2 | Zscaler, Inc. | 6,858,398 |
| | | TOTAL | 169,481,634 |
| | | Materials—2.9% | |
| 91,627 | | Boise Cascade Co. | 2,473,929 |
| 117,803 | | Fuller (H.B.) Co. | 5,632,162 |
| 276,016 | 1,2 | Kraton Corp. | 8,465,411 |
| 141,398 | | Kronos Worldwide, Inc. | 1,896,147 |
| 194,248 | | Myers Industries, Inc. | 3,140,990 |
| 86,100 | 1,3 | Rentech, Inc. | 0 |
| 103,646 | | Trinseo SA | 4,022,501 |
| | | TOTAL | 25,631,140 |
| | | Utilities—0.8% | |
| 15,911 | | American States Water Co. | 1,232,625 |
| 19,626 | | Chesapeake Utilities Corp. | 1,834,246 |
| 255,914 | | TerraForm Power, Inc. | 3,943,635 |
| | | TOTAL | 7,010,506 |
| | | TOTAL COMMON STOCKS
(IDENTIFIED COST $824,513,889) | 875,482,272 |
| | | INVESTMENT COMPANIES—11.4% | |
| 34,589,446 | | Federated Government Obligations Fund, Premier Shares, 2.25%4 | 34,589,446 |
Annual Shareholder Report
| Shares | | | Value |
| | | INVESTMENT COMPANIES—continued | |
| 67,411,680 | | Federated Institutional Prime Value Obligations Fund, Institutional Shares, 2.39%4 | $67,431,904 |
| | | TOTAL INVESTMENT COMPANIES
(IDENTIFIED COST $102,016,518) | 102,021,350 |
| | | TOTAL INVESTMENT IN SECURITIES—109.4%
(IDENTIFIED COST $926,530,407)5 | 977,503,622 |
| | | OTHER ASSETS AND LIABILITIES - NET—(9.4)%6 | (84,038,357) |
| | | TOTAL NET ASSETS—100% | $893,465,265 |
Affiliated fund holdings are investment companies which are managed by the Adviser or an affiliate of the Adviser. Transactions with affiliated fund holdings during the period ended July 31, 2019, were as follows:
| | Federated
Government
Obligations Fund,
Premier Shares* | Federated
Institutional
Prime Value
Obligations Fund,
Institutional Shares* | Total of
Affiliated
Transactions |
| Balance of Shares Held 7/31/2018 | 11,851,038 | 20,756,726 | 32,607,764 |
| Purchases/Additions | 268,355,519 | 674,277,218 | 942,632,737 |
| Sales/Reductions | (245,617,111) | (627,622,264) | (873,239,375) |
| Balance of Shares Held 7/31/2019 | 34,589,446 | 67,411,680 | 102,001,126 |
| Value | $34,589,446 | $67,431,904 | $102,021,350 |
Change in Unrealized
Appreciation/Depreciation | N/A | $1,230 | $1,230 |
| Net Realized Gain/(Loss) | N/A | $5,562 | $5,562 |
| Dividend Income | $680,291 | $1,347,772 | $2,028,063 |
| * | All or a portion of the balance/activity for the fund relates to cash collateral received on securities lending transactions. |
| 1 | Non-income-producing security. |
| 2 | All or a portion of these securities are temporarily on loan to unaffiliated broker/dealers. |
| 3 | Market quotations and price evaluations are not available. Fair value determined using significant unobservable inputs in accordance with procedures established by and under the general supervision of the Fund's Board of Trustees (the “Trustees”). |
| 4 | 7-day net yield. |
| 5 | The cost of investments for federal tax purposes amounts to $931,185,423. |
| 6 | Assets, other than investments in securities, less liabilities. See Statement of Assets and Liabilities. |
Note: The categories of investments are shown as a percentage of total net assets at July 31, 2019.
Annual Shareholder Report
Various inputs are used in determining the value of the Fund's investments. These inputs are summarized in the three broad levels listed below:
Level 1—quoted prices in active markets for identical securities.
Level 2—other significant observable inputs (including quoted prices for similar securities, interest rates, prepayment speeds, credit risk, etc.). Also includes securities valued at amortized cost.
Level 3—significant unobservable inputs (including the Fund's own assumptions in determining the fair value of investments).
The inputs or methodology used for valuing securities are not an indication of the risk associated with investing in those securities.
The following is a summary of the inputs used, as of July 31, 2019, in valuing the Fund's assets carried at fair value:
| Valuation Inputs | | | | |
| | Level 1—
Quoted
Prices | Level 2—
Other
Significant
Observable
Inputs | Level 3—
Significant
Unobservable
Inputs | Total |
| Equity Securities: | | | | |
| Common Stocks | | | | |
| Domestic | $831,689,720 | $— | $0 | $831,689,720 |
| International | 43,792,552 | — | — | 43,792,552 |
| Investment Companies | 102,021,350 | — | — | 102,021,350 |
| TOTAL SECURITIES | $977,503,622 | $— | $0 | $977,503,622 |
See Notes which are an integral part of the Financial Statements
Annual Shareholder Report
Financial Highlights–Class A Shares
(For a Share Outstanding Throughout Each Period)
| Year Ended July 31 | 2019 | 2018 | 2017 | 2016 | 2015 |
| Net Asset Value, Beginning of Period | $25.67 | $21.89 | $17.66 | $20.49 | $17.39 |
| Income From Investment Operations: | | | | | |
| Net investment income (loss) | (0.08)1 | (0.11)1 | (0.08)1 | (0.06)1 | (0.12)1 |
| Net realized and unrealized gain (loss) | (0.84) | 5.09 | 4.63 | 0.32 | 3.22 |
| TOTAL FROM INVESTMENT OPERATIONS | (0.92) | 4.98 | 4.55 | 0.26 | 3.10 |
| Less Distributions: | | | | | |
| Distributions from net realized gain | (1.45) | (1.20) | (0.32) | (3.09) | — |
| Net Asset Value, End of Period | $23.30 | $25.67 | $21.89 | $17.66 | $20.49 |
| Total Return2 | (2.83)% | 23.50% | 26.00% | 2.30% | 17.83% |
| Ratios to Average Net Assets: | | | | | |
| Net expenses | 1.13% | 1.14% | 1.15% | 1.13% | 1.54% |
| Net investment income (loss) | (0.36)% | (0.48)% | (0.39)% | (0.34)% | (0.66)% |
| Expense waiver/reimbursement3 | 0.29% | 0.44% | 0.70% | 1.00% | 0.61% |
| Supplemental Data: | | | | | |
| Net assets, end of period (000 omitted) | $82,170 | $82,953 | $47,681 | $29,707 | $32,136 |
| Portfolio turnover | 142% | 129% | 118% | 198% | 121% |
| 1 | Per share numbers have been calculated using the average shares method. |
| 2 | Based on net asset value, which does not reflect the sales charge, redemption fee or contingent deferred sales charge, if applicable. |
| 3 | This expense decrease is reflected in both the net expense and the net investment income (loss) ratios shown above. |
See Notes which are an integral part of the Financial Statements
Annual Shareholder Report
Financial Highlights–Class C Shares
(For a Share Outstanding Throughout Each Period)
| Year Ended July 31 | 2019 | 2018 | 2017 | 2016 | 2015 |
| Net Asset Value, Beginning of Period | $22.77 | $19.69 | $16.03 | $19.03 | $16.27 |
| Income From Investment Operations: | | | | | |
| Net investment income (loss) | (0.23)1 | (0.26)1 | (0.21)1 | (0.17)1 | (0.25)1 |
| Net realized and unrealized gain (loss) | (0.77) | 4.54 | 4.19 | 0.26 | 3.01 |
| TOTAL FROM INVESTMENT OPERATIONS | (1.00) | 4.28 | 3.98 | 0.09 | 2.76 |
| Less Distributions: | | | | | |
| Distributions from net realized gain | (1.45) | (1.20) | (0.32) | (3.09) | — |
| Net Asset Value, End of Period | $20.32 | $22.77 | $19.69 | $16.03 | $19.03 |
| Total Return2 | (3.58)% | 22.54% | 25.08% | 1.51% | 16.96% |
| Ratios to Average Net Assets: | | | | | |
| Net expenses | 1.88% | 1.89% | 1.90% | 1.88% | 2.31% |
| Net investment income (loss) | (1.12)% | (1.23)% | (1.15)% | (1.09)% | (1.44)% |
| Expense waiver/reimbursement3 | 0.29% | 0.41% | 0.66% | 1.00% | 0.59% |
| Supplemental Data: | | | | | |
| Net assets, end of period (000 omitted) | $22,639 | $18,008 | $10,007 | $3,941 | $3,571 |
| Portfolio turnover | 142% | 129% | 118% | 198% | 121% |
| 1 | Per share numbers have been calculated using the average shares method. |
| 2 | Based on net asset value, which does not reflect the sales charge, redemption fee or contingent deferred sales charge, if applicable. |
| 3 | This expense decrease is reflected in both the net expense and the net investment income (loss) ratios shown above. |
See Notes which are an integral part of the Financial Statements
Annual Shareholder Report
Financial Highlights–Institutional Shares
(For a Share Outstanding Throughout Each Period)
| Year Ended July 31 | 2019 | 2018 | 2017 | 2016 | 2015 |
| Net Asset Value, Beginning of Period | $26.71 | $22.67 | $18.24 | $21.01 | $17.79 |
| Income From Investment Operations: | | | | | |
| Net investment income (loss) | (0.02)1 | (0.06)1 | (0.03)1 | (0.02)1 | (0.08)1 |
| Net realized and unrealized gain (loss) | (0.87) | 5.30 | 4.78 | 0.34 | 3.30 |
| TOTAL FROM INVESTMENT OPERATIONS | (0.89) | 5.24 | 4.75 | 0.32 | 3.22 |
| Less Distributions: | | | | | |
| Distributions from net realized gain | (1.45) | (1.20) | (0.32) | (3.09) | — |
| Net Asset Value, End of Period | $24.37 | $26.71 | $22.67 | $18.24 | $21.01 |
| Total Return2 | (2.60)% | 23.85% | 26.27% | 2.56% | 18.10% |
| Ratios to Average Net Assets: | | | | | |
| Net expenses | 0.88% | 0.89% | 0.90% | 0.88% | 1.30% |
| Net investment income (loss) | (0.10)% | (0.25)% | (0.15)% | (0.09)% | (0.43)% |
| Expense waiver/reimbursement3 | 0.25% | 0.41% | 0.63% | 0.99% | 0.60% |
| Supplemental Data: | | | | | |
| Net assets, end of period (000 omitted) | $455,597 | $364,248 | $112,742 | $43,337 | $36,706 |
| Portfolio turnover | 142% | 129% | 118% | 198% | 121% |
| 1 | Per share numbers have been calculated using the average shares method. |
| 2 | Based on net asset value. |
| 3 | This expense decrease is reflected in both the net expense and the net investment income (loss) ratios shown above. |
See Notes which are an integral part of the Financial Statements
Annual Shareholder Report
Financial Highlights–Class R6 Shares
(For a Share Outstanding Throughout Each Period)
| | Year Ended July 31, | Period
Ended
7/31/20161 |
| 2019 | 2018 | 2017 |
| Net Asset Value, Beginning of Period | $26.70 | $22.67 | $18.24 | $16.25 |
| Income From Investment Operations: | | | | |
| Net investment income (loss) | (0.02)2 | (0.06)2 | (0.01)2 | (0.07)2 |
| Net realized and unrealized gain (loss) | (0.87) | 5.29 | 4.76 | 2.06 |
| TOTAL FROM INVESTMENT OPERATIONS | (0.89) | 5.23 | 4.75 | 1.99 |
| Less Distributions: | | | | |
| Distributions from net realized gain | (1.45) | (1.20) | (0.32) | — |
| Net Asset Value, End of Period | $24.36 | $26.70 | $22.67 | $18.24 |
| Total Return3 | (2.60)% | 23.81% | 26.27% | 12.25% |
| Ratios to Average Net Assets: | | | | |
| Net expenses | 0.87% | 0.88% | 0.88% | 0.87%4 |
| Net investment income (loss) | (0.07)% | (0.24)% | (0.04)% | (0.41)%4 |
| Expense waiver/reimbursement5 | 0.15% | 0.30% | 0.42% | 0.66%4 |
| Supplemental Data: | | | | |
| Net assets, end of period (000 omitted) | $333,059 | $89,307 | $24,795 | $06 |
| Portfolio turnover | 142% | 129% | 118% | 198%7 |
| 1 | Reflects operations for the period from June 29, 2016 (date of initial investment) to July 31, 2016. |
| 2 | Per share numbers have been calculated using the average shares method. |
| 3 | Based on net asset value. Total returns for periods of less than one year are not annualized. |
| 4 | Computed on an annualized basis. |
| 5 | This expense decrease is reflected in both the net expense and the net investment income (loss) ratios shown above. |
| 6 | Represents less than $1,000. |
| 7 | Portfolio turnover is calculated at the Fund level. Percentage indicated was calculated for the year ended July 31, 2016. |
See Notes which are an integral part of the Financial Statements
Annual Shareholder Report
Statement of Assets and Liabilities
July 31, 2019
| Assets: | | |
| Investment in securities, at value including $82,365,160 of securities loaned and $102,021,350 of investment in affiliated holdings (identified cost $926,530,407) | | $977,503,622 |
| Income receivable | | 78,221 |
| Income receivable from an affiliated holding | | 65,853 |
| Receivable for investments sold | | 14,761,891 |
| Receivable for shares sold | | 2,119,893 |
| TOTAL ASSETS | | 994,529,480 |
| Liabilities: | | |
| Payable for investments purchased | $12,310,768 | |
| Payable for shares redeemed | 1,994,350 | |
| Payable to bank | 16,407 | |
| Payable for collateral due to broker for securities lending | 86,378,446 | |
| Payable for investment adviser fee (Note 5) | 16,553 | |
| Payable for administrative fees (Note 5) | 1,947 | |
| Payable for distribution services fee (Note 5) | 14,452 | |
| Payable for other service fees (Notes 2 and 5) | 50,540 | |
| Accrued expenses (Note 5) | 280,752 | |
| TOTAL LIABILITIES | | 101,064,215 |
| Net assets for 37,010,647 shares outstanding | | $893,465,265 |
| Net Assets Consist of: | | |
| Paid-in capital | | $849,240,518 |
| Total distributable earnings (loss) | | 44,224,747 |
| TOTAL NET ASSETS | | $893,465,265 |
Annual Shareholder Report
Statement of Assets and Liabilities–continued
| Net Asset Value, Offering Price and Redemption Proceeds Per Share | | |
| Class A Shares: | | |
Net asset value per share ($82,170,441 ÷ 3,527,289 shares outstanding), no
par value, unlimited shares authorized | | $23.30 |
| Offering price per share (100/94.50 of $23.30) | | $24.66 |
| Redemption proceeds per share | | $23.30 |
| Class C Shares: | | |
Net asset value per share ($22,638,600 ÷ 1,113,937 shares outstanding), no
par value, unlimited shares authorized | | $20.32 |
| Offering price per share | | $20.32 |
| Redemption proceeds per share (99.00/100 of $20.32) | | $20.12 |
| Institutional Shares: | | |
Net asset value per share ($455,597,494 ÷ 18,698,247 shares outstanding), no
par value, unlimited shares authorized | | $24.37 |
| Offering price per share | | $24.37 |
| Redemption proceeds per share | | $24.37 |
| Class R6 Shares: | | |
| Net asset value per share ($333,058,730 ÷ 13,671,174 shares outstanding), no par value, unlimited shares authorized | | $24.36 |
| Offering price per share | | $24.36 |
| Redemption proceeds per share | | $24.36 |
See Notes which are an integral part of the Financial Statements
Annual Shareholder Report
Statement of Operations
Year Ended July 31, 2019
| Investment Income: | | | |
| Dividends (including $453,657 received from an affiliated holding*) | | | $5,477,618 |
| Net income on securities loaned (includes $1,574,406 earned from affiliated holdings related to cash collateral balances*) (Note 2) | | | 258,805 |
| TOTAL INCOME | | | 5,736,423 |
| Expenses: | | | |
| Investment adviser fee (Note 5) | | $6,151,670 | |
| Administrative fee (Note 5) | | 582,289 | |
| Custodian fees | | 74,502 | |
| Transfer agent fee (Note 2) | | 784,426 | |
| Directors'/Trustees' fees (Note 5) | | 6,152 | |
| Auditing fees | | 27,200 | |
| Legal fees | | 11,960 | |
| Portfolio accounting fees | | 150,473 | |
| Distribution services fee (Note 5) | | 186,742 | |
| Other service fees (Notes 2 and 5) | | 260,542 | |
| Share registration costs | | 171,896 | |
| Printing and postage | | 74,204 | |
| Miscellaneous (Note 5) | | 37,090 | |
| TOTAL EXPENSES | | 8,519,146 | |
| Waiver and Reimbursements: | | | |
| Waiver/reimbursement of investment adviser fee (Note 5) | $(1,106,007) | | |
| Reimbursement of other operating expenses (Notes 2 and 5) | (542,998) | | |
| TOTAL WAIVER AND REIMBURSEMENTS | | (1,649,005) | |
| Net expenses | | | 6,870,141 |
| Net investment income (loss) | | | (1,133,718) |
| Realized and Unrealized Gain (Loss) on Investments and Foreign Currency Transactions: | | | |
| Net realized gain on investments (including net realized gain of $5,562 on sales of investments in an affiliated holding*) | | | 2,810,716 |
| Net realized gain on foreign currency transactions | | | 1,424 |
| Net change in unrealized appreciation of investments (including net change in unrealized appreciation of $1,230 on investments in an affiliated holding*) | | | (10,118,739) |
| Net realized and unrealized gain (loss) on investments and foreign currency transactions | | | (7,306,599) |
| Change in net assets resulting from operations | | | $(8,440,317) |
| * | See information listed after the Fund's Portfolio of Investments. |
See Notes which are an integral part of the Financial Statements
Annual Shareholder Report
Statement of Changes in Net Assets
| Year Ended July 31 | 2019 | 2018 |
| Increase (Decrease) in Net Assets | | |
| Operations: | | |
| Net investment income (loss) | $(1,133,718) | $(1,167,795) |
| Net realized gain | 2,812,140 | 32,205,200 |
| Net change in unrealized appreciation/depreciation | (10,118,739) | 41,745,166 |
| CHANGE IN NET ASSETS RESULTING FROM OPERATIONS | (8,440,317) | 72,782,571 |
| Distributions to Shareholders (Note 2): | | |
| Class A Shares | (4,694,682) | (3,459,083) |
| Class B Shares | — | (70,571) |
| Class C Shares | (1,802,870) | (676,386) |
| Institutional Shares | (21,193,835) | (8,159,743) |
| Class R6 Shares | (10,244,004) | (2,195,623) |
| CHANGE IN NET ASSETS RESULTING FROM DISTRIBUTIONS TO SHAREHOLDERS | (37,935,391) | (14,561,406) |
| Share Transactions: | | |
| Proceeds from sale of shares | 662,802,599 | 385,727,221 |
| Net asset value of shares issued to shareholders in payment of distributions declared | 32,928,721 | 14,092,088 |
| Cost of shares redeemed | (310,406,395) | (100,121,714) |
| CHANGE IN NET ASSETS RESULTING FROM SHARE TRANSACTIONS | 385,324,925 | 299,697,595 |
| Change in net assets | 338,949,217 | 357,918,760 |
| Net Assets: | | |
| Beginning of period | 554,516,048 | 196,597,288 |
| End of period | $893,465,265 | $554,516,048 |
See Notes which are an integral part of the Financial Statements
Annual Shareholder Report
Notes to Financial Statements
July 31, 2019
1. ORGANIZATION
Federated MDT Series (the “Trust”) is registered under the Investment Company Act of 1940, as amended (the “Act”), as an open-end management investment company. The Trust consists of five portfolios. The financial statements included herein are only those of Federated MDT Small Cap Growth Fund (the “Fund”), a diversified portfolio. The financial statements of the other portfolios are presented separately. The assets of each portfolio are segregated and a shareholder's interest is limited to the portfolio in which shares are held. Each portfolio pays its own expenses. The Fund offers four classes of shares: Class A Shares, Class C Shares, Institutional Shares and Class R6 Shares. All shares of the Fund have equal rights with respect to voting, except on class-specific matters. The investment objective of the Fund is long-term capital appreciation.
On March 30, 2017, the Fund's T Share Class became effective with the Securities and Exchange Commission (SEC), but is not yet offered for sale.
On February 2, 2018, Class B Shares were converted into the Fund's existing Class A Shares at the close of business pursuant to a Plan of Conversion approved by the Trustees. The conversion occurred on a tax-free basis. The cash value of a shareholder's investment was not changed as a result of the share class conversion. No action was required by shareholders to effect the conversion.
Effective August 1, 2018, an automatic conversion feature for Class C Shares was implemented. Pursuant to this automatic conversion feature, after Class C Shares have been held for ten years from the date of purchase, they will automatically convert to Class A Shares on the next monthly conversion processing date.
2. SIGNIFICANT ACCOUNTING POLICIES
The following is a summary of significant accounting policies consistently followed by the Fund in the preparation of its financial statements. These policies are in conformity with U.S. generally accepted accounting principles (GAAP).
Investment Valuation
In calculating its net asset value (NAV), the Fund generally values investments as follows:
| ■ | Equity securities listed on an exchange or traded through a regulated market system are valued at their last reported sale price or official closing price in their principal exchange or market. |
| ■ | Shares of other mutual funds or non-exchange-traded investment companies are valued based upon their reported NAVs. |
| ■ | Fixed-income securities are fair valued using price evaluations provided by a pricing service approved by the Trustees. |
| ■ | Derivative contracts listed on exchanges are valued at their reported settlement or closing price, except that options are valued at the mean of closing bid and asked quotations. |
| ■ | Over-the-counter (OTC) derivative contracts are fair valued using price evaluations provided by a pricing service approved by the Trustees. |
| ■ | For securities that are fair valued in accordance with procedures established by and under the general supervision of the Trustees, certain factors may be considered, such as: the last traded or purchase price of the security, information obtained by contacting the issuer or dealers, analysis of the issuer's financial statements or other available documents, |
Annual Shareholder Report
| | fundamental analytical data, the nature and duration of restrictions on disposition, the movement of the market in which the security is normally traded, public trading in similar securities or derivative contracts of the issuer or comparable issuers, movement of a relevant index, or other factors including but not limited to industry changes and relevant government actions. |
If any price, quotation, price evaluation or other pricing source is not readily available when the NAV is calculated, if the Fund cannot obtain price evaluations from a pricing service or from more than one dealer for an investment within a reasonable period of time as set forth in the Fund's valuation policies and procedures, or if information furnished by a pricing service, in the opinion of the valuation committee (“Valuation Committee”), is deemed not representative of the fair value of such security, the Fund uses the fair value of the investment determined in accordance with the procedures described below. There can be no assurance that the Fund could obtain the fair value assigned to an investment if it sold the investment at approximately the time at which the Fund determines its NAV per share.
Fair Valuation Procedures
The Trustees have ultimate responsibility for determining the fair value of investments for which market quotations are not readily available. The Trustees have appointed a Valuation Committee comprised of officers of the Fund, Federated MDTA LLC (the “Adviser”) and certain of the Adviser's affiliated companies to assist in determining fair value and in overseeing the calculation of the NAV. The Trustees have also authorized the use of pricing services recommended by the Valuation Committee to provide fair value evaluations of the current value of certain investments for purposes of calculating the NAV. The Valuation Committee employs various methods for reviewing third-party pricing-service evaluations including periodic reviews of third-party pricing services' policies, procedures and valuation methods (including key inputs, methods, models and assumptions), transactional back-testing, comparisons of evaluations of different pricing services, and review of price challenges by the Adviser based on recent market activity. In the event that market quotations and price evaluations are not available for an investment, the Valuation Committee determines the fair value of the investment in accordance with procedures adopted by the Trustees. The Trustees periodically review and approve the fair valuations made by the Valuation Committee and any changes made to the procedures.
Factors considered by pricing services in evaluating an investment include the yields or prices of investments of comparable quality, coupon, maturity, call rights and other potential prepayments, terms and type, reported transactions, indications as to values from dealers and general market conditions. Some pricing services provide a single price evaluation reflecting the bid-side of the market for an investment (a “bid” evaluation). Other pricing services offer both bid evaluations and price evaluations indicative of a price between the prices bid and asked for the investment (a “mid” evaluation). The Fund normally uses bid evaluations for any U.S. Treasury and Agency securities, mortgage-backed securities and municipal securities. The Fund normally uses mid evaluations for any other types of fixed-income securities and any OTC derivative contracts. In the event that market quotations and price evaluations are not available for an investment, the fair value of the investment is determined in accordance with procedures adopted by the Trustees.
Annual Shareholder Report
Repurchase Agreements
The Fund may invest in repurchase agreements for short-term liquidity purposes. It is the policy of the Fund to require the other party to a repurchase agreement to transfer to the Fund's custodian or sub-custodian eligible securities or cash with a market value (after transaction costs) at least equal to the repurchase price to be paid under the repurchase agreement. The eligible securities are transferred to accounts with the custodian or sub-custodian in which the Fund holds a “securities entitlement” and exercises “control” as those terms are defined in the Uniform Commercial Code. The Fund has established procedures for monitoring the market value of the transferred securities and requiring the transfer of additional eligible securities if necessary to equal at least the repurchase price. These procedures also allow the other party to require securities to be transferred from the account to the extent that their market value exceeds the repurchase price or in exchange for other eligible securities of equivalent market value.
The insolvency of the other party or other failure to repurchase the securities may delay the disposition of the underlying securities or cause the Fund to receive less than the full repurchase price. Under the terms of the repurchase agreement, any amounts received by the Fund in excess of the repurchase price and related transaction costs must be remitted to the other party.
The Fund may enter into repurchase agreements in which eligible securities are transferred into joint trading accounts maintained by the custodian or sub-custodian for investment companies and other clients advised by the Fund's Adviser and its affiliates. The Fund will participate on a pro rata basis with the other investment companies and clients in its share of the securities transferred under such repurchase agreements and in its share of proceeds from any repurchase or other disposition of such securities.
Investment Income, Gains and Losses, Expenses and Distributions
Investment transactions are accounted for on a trade-date basis. Realized gains and losses from investment transactions are recorded on an identified-cost basis. Interest income and expenses are accrued daily. Dividend income and distributions to shareholders are recorded on the ex-dividend date. Distributions of net investment income, if any, are declared and paid annually. Non-cash dividends included in dividend income, if any, are recorded at fair value. Amortization/accretion of premium and discount is included in investment income. Investment income, realized and unrealized gains and losses, and certain fund-level expenses are allocated to each class based on relative average daily net assets, except that select classes will bear certain expenses unique to those classes. The detail of the total fund expense waiver and reimbursements of $1,649,005 is disclosed in various locations in this Note 2 and Note 5. For the year ended July 31, 2019, transfer agent fees for the Fund were as follows:
| | Transfer Agent
Fees Incurred | Transfer Agent
Fees Reimbursed |
| Class A Shares | $143,414 | $(113,636) |
| Class C Shares | 44,083 | (35,128) |
| Institutional Shares | 539,436 | (394,234) |
| Class R6 Shares | 57,493 | — |
| TOTAL | $784,426 | $(542,998) |
Annual Shareholder Report
Dividends are declared separately for each class. No class has preferential dividend rights; differences in per share dividend rates are generally due to differences in separate class expenses. All distributions as indicated on the Statement of Changes in Net Assets for the year ended July 31, 2018, were from net realized gains. Accumulated net investment income (loss) at July 31, 2018, was $(4,620).
Other Service Fees
The Fund may pay other service fees up to 0.25% of the average daily net assets of the Fund's Class A Shares and Class C Shares to financial intermediaries or to Federated Shareholder Services Company (FSSC) for providing services to shareholders and maintaining shareholder accounts. Subject to the terms described in the Expense Limitation note, FSSC may voluntarily reimburse the Fund for other service fees. For the year ended July 31, 2019, other service fees for the Fund were as follows:
| | Other Service
Fees Incurred |
| Class A Shares | $198,326 |
| Class C Shares | 62,216 |
| TOTAL | $260,542 |
Federal Taxes
It is the Fund's policy to comply with the Subchapter M provision of the Internal Revenue Code and to distribute to shareholders each year substantially all of its income. Accordingly, no provision for federal income tax is necessary. As of and during the year ended July 31, 2019, the Fund did not have a liability for any uncertain tax positions. The Fund recognizes interest and penalties, if any, related to tax liabilities as income tax expense in the Statement of Operations. As of July 31, 2019, tax years 2016 through 2019 remain subject to examination by the Fund's major tax jurisdictions, which include the United States of America and the Commonwealth of Massachusetts.
When-Issued and Delayed-Delivery Transactions
The Fund may engage in when-issued or delayed-delivery transactions. The Fund records when-issued securities on the trade date and maintains security positions such that sufficient liquid assets will be available to make payment for the securities purchased. Securities purchased on a when-issued or delayed-delivery basis are marked to market daily and begin earning interest on the settlement date. Losses may occur on these transactions due to changes in market conditions or the failure of counterparties to perform under the contract.
Securities Lending
The Fund participates in a securities lending program providing for the lending of equity securities to qualified brokers. The term of the loans within the program is one year or less. The Fund normally receives cash collateral for securities loaned that may be invested in affiliated money market funds, other money market instruments and/or repurchase agreements. Investments in money market funds may include funds with a “floating” NAV that can impose redemption fees and liquidity gates, impose certain operational impediments to investing cash collateral, and, if the investee fund's NAV decreases, result in the Fund recognizing losses and being required to cover the decrease in the value of the cash collateral. Collateral is maintained at a minimum level of 100% of the market value of investments loaned, plus interest, if applicable. In accordance with the Fund's securities lending agreement, the
Annual Shareholder Report
market value of securities on loan is determined each day at the close of business and any additional collateral required to cover the value of securities on loan is delivered to the Fund on the next business day. Earnings on collateral are allocated between the borrower of the security, the securities lending agent, as a fee for its services under the program and the Fund, according to agreed-upon rates. The Fund will not have the right to vote on securities while they are on loan. However, the Fund will attempt to terminate a loan in an effort to reacquire the securities in time to vote on matters that are deemed to be material by the Adviser. There can be no assurance that the Fund will have sufficient notice of such matters to be able to terminate the loan in time to vote thereon.
Securities lending transactions are subject to Master Netting Agreements which are agreements between the Fund and its counterparties that provide for the net settlement of all transactions and collateral with the Fund, through a single payment, in the event of default or termination. Amounts presented on the Portfolio of Investments and Statement of Assets and Liabilities are not net settlement amounts but gross. As indicated below, the cash collateral received by the Fund exceeds the market value of the securities loaned reducing the net settlement amount to zero. The chart below identifies the amount of collateral received as well as the market value of securities on loan. Additionally, the securities lending agreement executed by the Fund includes an indemnification clause. This clause stipulates that the borrower will reimburse the Fund for any losses as a result of any failure of the borrower to return equivalent securities to the Fund.
As of July 31, 2019, securities subject to this type of arrangement and related collateral were as follows:
Market Value of
Securities Loaned | Collateral
Received |
| $82,365,160 | $86,378,446 |
Other
The preparation of financial statements in conformity with GAAP requires management to make estimates and assumptions that affect the amounts of assets, liabilities, expenses and revenues reported in the financial statements. Actual results could differ from those estimated. The Fund applies investment company accounting and reporting guidance.
3. SHARES OF BENEFICIAL INTEREST
The following tables summarize share activity:
| Year Ended July 31 | 2019 | 2018 |
| Class A Shares: | Shares | Amount | Shares | Amount |
| Shares sold | 1,528,971 | $35,808,747 | 2,037,550 | $47,226,003 |
| Shares issued to shareholders in payment of distributions declared | 206,833 | 4,264,901 | 141,059 | 3,180,877 |
| Shares redeemed | (1,439,941) | (34,081,411) | (1,125,462) | (26,908,372) |
NET CHANGE RESULTING FROM
CLASS A SHARE TRANSACTIONS | 295,863 | $5,992,237 | 1,053,147 | $23,498,508 |
Annual Shareholder Report
| Year Ended July 31 | 2019 | 2018 |
| Class B Shares: | Shares | Amount | Shares | Amount |
| Shares sold | — | $— | 127 | $2,647 |
| Shares issued to shareholders in payment of distributions declared | — | — | 3,272 | 67,924 |
| Shares redeemed | — | — | (71,006) | (1,527,679) |
NET CHANGE RESULTING FROM
CLASS B SHARE TRANSACTIONS | — | $— | (67,607) | $(1,457,108) |
| Year Ended July 31 | 2019 | 2018 |
| Class C Shares: | Shares | Amount | Shares | Amount |
| Shares sold | 861,349 | $19,805,308 | 337,143 | $7,291,692 |
| Shares issued to shareholders in payment of distributions declared | 84,088 | 1,519,470 | 33,322 | 669,436 |
| Shares redeemed | (622,248) | (12,775,267) | (88,072) | (1,851,406) |
NET CHANGE RESULTING FROM
CLASS C SHARE TRANSACTIONS | 323,189 | $8,549,511 | 282,393 | $6,109,722 |
| Year Ended July 31 | 2019 | 2018 |
| Institutional Shares: | Shares | Amount | Shares | Amount |
| Shares sold | 13,009,742 | $313,124,900 | 10,867,286 | $270,992,063 |
| Shares issued to shareholders in payment of distributions declared | 906,635 | 19,519,847 | 340,659 | 7,978,235 |
| Shares redeemed | (8,855,829) | (217,649,803) | (2,542,321) | (63,240,851) |
NET CHANGE RESULTING FROM
INSTITUTIONAL SHARE TRANSACTIONS | 5,060,548 | $114,994,944 | 8,665,624 | $215,729,447 |
| Year Ended July 31 | 2019 | 2018 |
| Class R6 Shares: | Shares | Amount | Shares | Amount |
| Shares sold | 11,880,605 | $294,063,644 | 2,418,806 | $60,214,816 |
| Shares issued to shareholders in payment of distributions declared | 354,134 | 7,624,503 | 93,789 | 2,195,616 |
| Shares redeemed | (1,908,361) | (45,899,914) | (261,695) | (6,593,406) |
NET CHANGE RESULTING FROM
CLASS R6 SHARE TRANSACTIONS | 10,326,378 | $255,788,233 | 2,250,900 | $55,817,026 |
NET CHANGE RESULTING FROM
TOTAL FUND SHARE TRANSACTIONS | 16,005,978 | $385,324,925 | 12,184,457 | $299,697,595 |
4. FEDERAL TAX INFORMATION
The timing and character of income and capital gain distributions are determined in accordance with income tax regulations, which may differ from GAAP. These differences are due to differing treatments for foreign currency transactions, return of capital adjustments and net operating losses.
Annual Shareholder Report
For the year ended July 31, 2019, permanent differences identified and reclassified among the components of net assets were as follows:
| Increase (Decrease) |
| Paid-In Capital | Total Distributable
Earnings (Loss) |
| $(473,341) | $473,341 |
Net assets were not affected by this reclassification.
The tax character of distributions as reported on the Statement of Changes in Net Assets for the years ended July 31, 2019 and 2018, was as follows:
| | 2019 | 2018 |
| Ordinary income1 | $19,115,501 | $11,703,942 |
| Long-term capital gains | $18,819,890 | $ 2,857,464 |
| 1 | For tax purposes, short-term capital gain distributions are considered ordinary income distributions. |
As of July 31, 2019, the components of distributable earnings on a tax-basis were as follows:
| Net unrealized appreciation | $46,318,199 |
| Capital loss deferrals | $(2,093,452) |
The difference between book-basis and tax-basis net unrealized appreciation/depreciation is attributable to differing treatments for deferral of losses on wash sales.
At July 31, 2019, the cost of investments for federal tax purposes was $931,185,423. The net unrealizedappreciationofinvestments for federal tax purposes was $46,318,199. This consists of net unrealized appreciation frominvestments for those securities having an excess of value over cost of $98,729,376 and net unrealized depreciation from investments for those securities having an excess of cost over value of $52,411,177.
Under current tax rules, capital losses on securities transactions and foreign currency losses realized after October 31 and a late-year ordinary loss may be deferred, in whole or in part, and treated as occurring on the first day of the following fiscal year. As of July 31, 2019, for federal income tax purposes, post October losses of $1,434,499 and a late year ordinary loss of $658,953 were deferred to August 1, 2019.
5. INVESTMENT ADVISER FEE AND OTHER TRANSACTIONS WITH AFFILIATES
Investment Adviser Fee
The advisory agreement between the Fund and the Adviser provides for an annual fee equal to 0.80% of the Fund's average daily net assets. Prior to July 1, 2019, the annual advisory fee was 0.85% of the Fund's average daily net assets. Prior to June 28, 2018, the annual advisory fee was 0.99% of the Fund's average daily net assets. Subject to the terms described in the Expense Limitation note, the Adviser may voluntarily choose to waive any portion of its fee and/or reimburse certain operating expenses of the Fund. For the year ended July 31, 2019, the Adviser voluntarily waived $1,069,697 of its fee and voluntarily reimbursed $542,998 of transfer agent fees. The Adviser has agreed to reimburse the Fund for certain investment adviser fees as a result of transactions in other affiliated investment companies. For the year ended July 31, 2019, the Adviser reimbursed $36,310.
Annual Shareholder Report
Administrative Fee
Federated Administrative Services (FAS), under the Administrative Services Agreement, provides the Fund with administrative personnel and services. For purposes of determining the appropriate rate breakpoint, “Investment Complex” is defined as all of the Federated Funds subject to a fee under the Administrative Services Agreement. The fee paid to FAS is based on the average daily net assets of the Investment Complex as specified below:
| Administrative Fee | Average Daily Net Assets
of the Investment Complex |
| 0.100% | on assets up to $50 billion |
| 0.075% | on assets over $50 billion |
Subject to the terms described in the Expense Limitation note, FAS may voluntarily choose to waive any portion of its fee. For the year ended July 31, 2019, the annualized fee paid to FAS was 0.080% of average daily net assets of the Fund.
In addition, FAS may charge certain out-of-pocket expenses to the Fund.
Distribution Services Fee
The Fund has adopted a Distribution Plan (the “Plan”) pursuant to Rule 12b-1 under the Act. Under the terms of the Plan, the Fund will compensate Federated Securities Corp. (FSC), the principal distributor, from the daily net assets of the Fund's Class A Shares and Class C Shares to finance activities intended to result in the sale of these shares. The Plan provides that the Fund may incur distribution expenses at the following percentages of average daily net assets annually, to compensate FSC:
| | Percentage of Average Daily
Net Assets of Class |
| Class A Shares | 0.05% |
| Class C Shares | 0.75% |
Subject to the terms described in the Expense Limitation note, FSC may voluntarily choose to waive any portion of its fee. For the year ended July 31, 2019, distribution services fees for the Fund were as follows:
| | Distribution Services
Fees Incurred |
| Class C Shares | $186,742 |
For the year ended July 31, 2019, FSC retained $41,118 fees paid by the Fund.
When FSC receives fees, it may pay some or all of them to financial intermediaries whose customers purchase shares. For the year ended July 31, 2019, the Fund's Class A Shares did not incur a distribution services fee; however, it may begin to incur this fee upon approval of the Trustees.
Sales Charges
Front-end sales charges and contingent deferred sales charges (CDSC) do not represent expenses of the Fund. They are deducted from the proceeds of sales of Fund shares prior to investment or from redemption proceeds prior to remittance, as applicable. For the year ended July 31, 2019, FSC retained $10,808 in sales charges from the sale of Class A Shares. FSC also retained $3,851 of CDSC relating to redemptions of Class C Shares.
Annual Shareholder Report
Other Service Fees
For the year ended July 31, 2019, FSSC received $8,562 of the other service fees disclosed in Note 2.
Expense Limitation
The Adviser and certain of its affiliates (which may include FSC, FAS and FSSC) on their own initiative have agreed to waive certain amounts of their respective fees and/or reimburse expenses. Total annual fund operating expenses (as shown in the financial highlights, excluding interest expense, extraordinary expenses and proxy-related expenses paid by the Fund, if any) paid by the Fund's Class A Shares, Class C Shares, Institutional Shares and Class R6 Shares (after the voluntary waivers and/or reimbursements) will not exceed 1.13%, 1.88%, 0.88% and 0.87% (the “Fee Limit”), respectively, up to but not including the later of (the “Termination Date”): (a) October 1, 2020; or (b) the date of the Fund's next effective Prospectus. While the Adviser and its applicable affiliates currently do not anticipate terminating or increasing these arrangements prior to the Termination Date, these arrangements may only be terminated or the Fee Limit increased prior to the Termination Date with the agreement of the Trustees.
Directors'/Trustees' and Miscellaneous Fees
Certain Officers and Trustees of the Fund are Officers and Directors or Trustees of certain of the above companies. To efficiently facilitate payment, Directors'/Trustees' fees and certain expenses related to conducting meetings of the Directors/Trustees and other miscellaneous expenses are paid by an affiliate of the Adviser which in due course are reimbursed by the Fund. These expenses related to conducting meetings of the Directors/Trustees and other miscellaneous expenses may be included in Accrued and Miscellaneous Expenses on the Statement of Assets and Liabilities and Statement of Operations, respectively.
6. INVESTMENT TRANSACTIONS
Purchases and sales of investments, excluding long-term U.S. government securities and short-term obligations, for the year ended July 31, 2019, were as follows:
| Purchases | $1,355,706,541 |
| Sales | $1,014,544,005 |
7. CONCENTRATION OF RISK
The Fund may invest a portion of its assets in securities of companies that are deemed by the Fund's management to be classified in similar business sectors. Economic developments may have an effect on the liquidity and volatility of the portfolio securities.
8. LINE OF CREDIT
The Fund participates with certain other Federated Funds, on a several basis, in an up to $500,000,000 unsecured, 364-day, committed, revolving line of credit (LOC) agreement. The LOC was made available to finance temporarily the repurchase or redemption of shares of the Fund, failed trades, payment of dividends, settlement of trades and for other short-term, temporary or emergency general business purposes. The Fund cannot borrow under the LOC if an inter-fund loan is outstanding. The Fund's ability to borrow under the LOC also is subject to the limitations of the Act and various conditions precedent that must be satisfied before the Fund can borrow. Loans under the LOC are charged interest at a fluctuating rate per annum equal to the highest, on any day, of (a) (i) the federal funds effective rate, (ii) the one month
Annual Shareholder Report
London Interbank Offered Rate (LIBOR), and (iii) 0.0%, plus (b) a margin. The LOC also requires the Fund to pay, quarterly in arrears and at maturity, its pro rata share of a commitment fee based on the amount of the lenders' commitment that has not been utilized. As of July 31, 2019, the Fund had no outstanding loans. During the year ended July 31, 2019, the Fund did not utilize the LOC.
9. INTERFUND LENDING
Pursuant to an Exemptive Order issued by the SEC, the Fund, along with other funds advised by subsidiaries of Federated Investors, Inc., may participate in an interfund lending program. This program provides an alternative credit facility allowing the Fund to borrow from other participating affiliated funds. As of July 31, 2019, there were no outstanding loans. During the year ended July 31, 2019, the program was not utilized.
10. SUBSEQUENT EVENT
On May 16, 2019, the Trustees approved the reorganization of PNC Multi-Factor Small Cap Growth Fund, a portfolio of the PNC Funds, into the Fund. The reorganization is expected to occur in the fourth quarter of 2019, pending approval by the shareholders of the PNC fund.
Additionally, if the reorganization is approved, the “Termination Date” stated under Expense Limitation in the “Investment Adviser Fee and Other Transactions with Affiliates” note shall be extended up to but not including, the later of: (a) December 1, 2020 or (b) the first day of the month following the one year anniversary of the closing date of the reorganization.
11. FEDERAL TAX INFORMATION (UNAUDITED)
For the year ended July 31, 2019, the amount of long-term capital gains designated by the Fund was $18,819,890.
For the fiscal year ended July 31, 2019, 9.45% of total ordinary income distributions made by the Fund are qualifying dividends which may be subject to a maximum tax rate of 15%, as provided for by the Jobs and Growth Tax Relief Act of 2003. Complete information is reported in conjunction with the reporting of your distributions on Form 1099-DIV.
Of the ordinary income distributions made by the Fund during the year ended July 31, 2019, 8.84% qualify for the dividends received deduction available to corporate shareholders.
Annual Shareholder Report
Report of Independent Registered Public Accounting Firm
TO THE board of trustees OF federated MDT Series and shareholders of Federated MDT Small Cap Growth Fund:
Opinion on the Financial Statements
We have audited the accompanying statement of assets and liabilities of Federated MDT Small Cap Growth Fund (the “Fund”) (one of the portfolios constituting Federated MDT Series (the “Trust”)), including the portfolio of investments, as of July 31, 2019, and the related statement of operations for the year then ended, the statement of changes in net assets for each of the two years in the period then ended, the financial highlights for each of the five years in the period then ended and the related notes (collectively referred to as the “financial statements”). In our opinion, the financial statements present fairly, in all material respects, the financial position of the Fund (one of the funds constituting Federated MDT Series) at July 31, 2019, the results of its operations for the year then ended, the changes in its net assets for each of the two years in the period then ended and its financial highlights for each of the five years in the period then ended, in conformity with U.S. generally accepted accounting principles.
Basis for Opinion
These financial statements are the responsibility of the Trust's management. Our responsibility is to express an opinion on the Fund's financial statements based on our audits. We are a public accounting firm registered with the Public Company Accounting Oversight Board (United States) (“PCAOB”) and are required to be independent with respect to the Trust in accordance with the U.S. federal securities laws and the applicable rules and regulations of the Securities and Exchange Commission and the PCAOB.
We conducted our audits in accordance with standards of the PCAOB. Those standards require that we plan and perform the audit to obtain reasonable assurance about whether the financial statements and financial highlights are free of material misstatement, whether due to error or fraud. The Trust is not required to have, nor were we engaged to perform, an audit of the Trust's internal control over financial reporting. As part of our audits, we are required to obtain an understanding of internal control over financial reporting, but not for the purpose of expressing an opinion on the effectiveness of the Trust's internal control over financial reporting. Accordingly, we express no such opinion.
Annual Shareholder Report
Our audits included performing procedures to assess the risks of material misstatement of the financial statements, whether due to error or fraud, and performing procedures that respond to those risks. Such procedures included examining, on a test basis, evidence regarding the amounts and disclosures in the financial statements. Our procedures included confirmation of securities owned as of July 31, 2019, by correspondence with the custodian and others or by other appropriate auditing procedures where replies from others were not received. Our audits also included evaluating the accounting principles used and significant estimates made by management, as well as evaluating the overall presentation of the financial statements. We believe that our audits provide a reasonable basis for our opinion.
We have served as the auditor of one or more Federated investment companies since 1979.
Boston, Massachusetts
September 23, 2019
Annual Shareholder Report
Shareholder Expense Example (unaudited)
As a shareholder of the Fund, you incur two types of costs: (1) transaction costs, including sales charges (loads) on purchase or redemption payments; and (2) ongoing costs, including management fees and to the extent applicable, distribution (12b-1) fees and/or other service fees and other Fund expenses. This Example is intended to help you to understand your ongoing costs (in dollars) of investing in the Fund and to compare these costs with the ongoing costs of investing in other mutual funds. It is based on an investment of $1,000 invested at the beginning of the period and held for the entire period from February 1, 2019 to July 31, 2019.
ACTUAL EXPENSES
The first section of the table below provides information about actual account values and actual expenses. You may use the information in this section, together with the amount you invested, toestimate the expenses that you incurred over the period. Simply divide your account value by $1,000 (for example, an $8,600 account value divided by $1,000 = 8.6), then multiply the result by the number in the first section under the heading entitled “Expenses Paid During Period” to estimate the expenses attributable to your investment during this period.
HYPOTHETICAL EXAMPLE FOR COMPARISON PURPOSES
The second section of the table below provides information about hypothetical account values and hypothetical expenses based on the Fund's actual expense ratio and anassumed rate of return of 5% per year before expenses, which is not the Fund's actual return. Thus, you shouldnot use the hypothetical account values and expenses to estimate the actual ending account balance or your expenses for the period. Rather, these figures are required to be provided to enable you to compare the ongoing costs of investing in the Fund with other funds. To do so, compare this 5% hypothetical example with the 5% hypothetical examples that appear in the shareholder reports of the other funds.
Annual Shareholder Report
Please note that the expenses shown in the table are meant to highlight your ongoing costs only and do not reflect any transaction costs, such as sales charges (loads) on purchase or redemption payments. Therefore, the second section of the table is useful in comparing ongoing costs only, and will not help you determine the relativetotal costs of owning different funds. In addition, if these transaction costs were included, your costs would have been higher.
| | Beginning
Account Value
2/1/2019 | Ending
Account Value
7/31/2019 | Expenses Paid
During Period1 |
| Actual: | | | |
| Class A Shares | $1,000 | $1,062.00 | $5.78 |
| Class C Shares | $1,000 | $1,057.80 | $9.59 |
| Institutional Shares | $1,000 | $1,063.30 | $4.50 |
| Class R6 Shares | $1,000 | $1,062.80 | $4.45 |
Hypothetical (assuming a 5% return
before expenses): | | | |
| Class A Shares | $1,000 | $1,019.20 | $5.66 |
| Class C Shares | $1,000 | $1,015.50 | $9.39 |
| Institutional Shares | $1,000 | $1,020.40 | $4.41 |
| Class R6 Shares | $1,000 | $1,020.50 | $4.36 |
| 1 | Expenses are equal to the Fund's annualized net expense ratios, multiplied by the average account value over the period, multiplied by 181/365 (to reflect the one-half-year period). The annualized net expense ratios are as follows: |
| | |
| Class A Shares | 1.13% |
| Class C Shares | 1.88% |
| Institutional Shares | 0.88% |
| Class R6 Shares | 0.87% |
Annual Shareholder Report
Board of Trustees and Trust Officers
The Board of Trustees is responsible for managing the Trust's business affairs and for exercising all the Trust's powers except those reserved for the shareholders. The following tables give information about each Trustee and the senior officers of the Fund. Where required, the tables separately list Trustees who are “interested persons” of the Fund (i.e., “Interested” Trustees) and those who are not (i.e., “Independent” Trustees). Unless otherwise noted, the address of each person listed is Federated Investors Tower, 1001 Liberty Avenue, Pittsburgh, PA 15222. The address of all Independent Trustees listed is 4000 Ericsson Drive, Warrendale, PA 15086-7561; Attention: Mutual Fund Board. As of December 31, 2018, the Trust comprised five portfolio(s), and the Federated Fund Family consisted of 40 investment companies (comprising 102 portfolios). Unless otherwise noted, each Officer is elected annually. Unless otherwise noted, each Trustee oversees all portfolios in the Federated Fund Family and serves for an indefinite term. The Fund's Statement of Additional Information includes additional information about Trust Trustees and is available, without charge and upon request, by calling 1-800-341-7400.
Interested TRUSTEES Background
Name
Birth Date
Positions Held with Trust
Date Service Began | Principal Occupation(s) for Past Five Years,
Other Directorships Held and Previous Position(s) |
J. Christopher Donahue*
Birth Date: April 11, 1949
President and Trustee
Indefinite Term
Began serving: June 2006 | Principal Occupations: Principal Executive Officer and President of certain of the Funds in the Federated Fund Family; Director or Trustee of the Funds in the Federated Fund Family; President, Chief Executive Officer and Director, Federated Investors, Inc.; Chairman and Trustee, Federated Investment Management Company; Trustee, Federated Investment Counseling; Chairman and Director, Federated Global Investment Management Corp.; Chairman and Trustee, Federated Equity Management Company of Pennsylvania; Trustee, Federated Shareholder Services Company; Director, Federated Services Company.
Previous Positions: President, Federated Investment Counseling; President and Chief Executive Officer, Federated Investment Management Company, Federated Global Investment Management Corp. and Passport Research, Ltd; Chairman, Passport Research, Ltd. |
Annual Shareholder Report
Name
Birth Date
Positions Held with Trust
Date Service Began | Principal Occupation(s) for Past Five Years,
Other Directorships Held and Previous Position(s) |
John B. Fisher*
Birth Date: May 16, 1956
Trustee
Indefinite Term
Began serving: May 2016 | Principal Occupations:Principal Executive Officer and President of certain of the Funds in the Federated Fund Family; Director or Trustee of certain of the Funds in the Federated Fund Family; Vice President, Federated Investors, Inc.; President, Director/Trustee and CEO, Federated Advisory Services Company, Federated Equity Management Company of Pennsylvania, Federated Global Investment Management Corp., Federated Investment Counseling, Federated Investment Management Company; President of some of the Funds in the Federated Fund Complex and Director, Federated Investors Trust Company.
Previous Positions: President and Director of the Institutional Sales Division of Federated Securities Corp.; President and Director of Federated Investment Counseling; President and CEO of Passport Research, Ltd.; Director, Edgewood Securities Corp.; Director, Federated Services Company; Director, Federated Investors, Inc.; Chairman and Director, Southpointe Distribution Services, Inc. and President, Technology, Federated Services Company. |
| * | Reasons for “interested” status: J. Christopher Donahue and John B. Fisher are interested due to their beneficial ownership of shares of Federated Investors, Inc. and due to positions they hold with Federated and its subsidiaries. |
INDEPENDENT TRUSTEES Background
Name
Birth Date
Positions Held with Trust
Date Service Began | Principal Occupation(s) for Past Five Years,
Other Directorships Held, Previous Position(s) and Qualifications |
John T. Collins
Birth Date: January 24, 1947
Trustee
Indefinite Term
Began serving: October 2013 | Principal Occupations: Director or Trustee of the Federated Fund Family; formerly, Chairman and CEO, The Collins Group, Inc. (a private equity firm) (Retired).
Other Directorships Held: Director, Chairman of the Compensation Committee, KLX Energy Services Holdings, Inc. (oilfield services); former Director of KLX Corp. (aerospace).
Qualifications: Mr. Collins has served in several business and financial management roles and directorship positions throughout his career. Mr. Collins previously served as Chairman and CEO of The Collins Group, Inc. (a private equity firm) and as a Director of KLX Corp. Mr. Collins serves as Chairman Emeriti, Bentley University. Mr. Collins previously served as Director and Audit Committee Member, Bank of America Corp.; Director, FleetBoston Financial Corp.; and Director, Beth Israel Deaconess Medical Center (Harvard University Affiliate Hospital). |
Annual Shareholder Report
Name
Birth Date
Positions Held with Trust
Date Service Began | Principal Occupation(s) for Past Five Years,
Other Directorships Held, Previous Position(s) and Qualifications |
G. Thomas Hough
Birth Date: February 28, 1955
Trustee
Indefinite Term
Began serving: August 2015 | Principal Occupations: Director or Trustee of the Federated Fund Family; formerly, Vice Chair, Ernst & Young LLP (public accounting firm) (Retired).
Other Directorships Held: Director, Member of Governance and Compensation Committees, Publix Super Markets, Inc.; Director, Chair of the Audit Committee, Equifax, Inc.; Director, Member of the Audit Committee, Haverty Furniture Companies, Inc.
Qualifications: Mr. Hough has served in accounting, business management and directorship positions throughout his career. Mr. Hough most recently held the position of Americas Vice Chair of Assurance with Ernst & Young LLP (public accounting firm). Mr. Hough serves on the President's Cabinet and Business School Board of Visitors for the University of Alabama and is on the Business School Board of Visitors for Wake Forest University. Mr. Hough previously served as an Executive Committee member of the United States Golf Association. |
Maureen Lally-Green
Birth Date: July 5, 1949
Trustee
Indefinite Term
Began serving: August 2009 | Principal Occupations: Director or Trustee of the Federated Fund Family; Adjunct Professor of Law, Duquesne University School of Law; formerly, Dean of the Duquesne University School of Law and Professor of Law and Interim Dean of the Duquesne University School of Law; formerly, Associate General Secretary and Director, Office of Church Relations, Diocese of Pittsburgh.
Other Directorships Held: Director, CNX Resources Corporation (formerly known as CONSOL Energy Inc.).
Qualifications: Judge Lally-Green has served in various legal and business roles and directorship positions throughout her career. Judge Lally-Green previously held the position of Dean of the School of Law of Duquesne University (as well as Interim Dean). Judge Lally-Green previously served as a member of the Superior Court of Pennsylvania and as a Professor of Law, Duquesne University School of Law. Judge Lally-Green also currently holds the positions on not for profit or for profit boards of directors as follows: Director and Chair, UPMC Mercy Hospital; Director and Vice Chair, Our Campaign for the Church Alive!, Inc.; Regent, Saint Vincent Seminary; Member, Pennsylvania State Board of Education (public); and Director CNX Resources Corporation (formerly known as CONSOL Energy Inc.). Judge Lally-Green has held the positions of: Director, Auberle; Director, Epilepsy Foundation of Western and Central Pennsylvania; Director, Ireland Institute of Pittsburgh; Director, Saint Thomas More Society; Director and Chair, Catholic High Schools of the Diocese of Pittsburgh, Inc.; Director, Pennsylvania Bar Institute; Director, St. Vincent College; and Director and Chair, North Catholic High School, Inc. |
Charles F. Mansfield, Jr.
Birth Date: April 10, 1945
Trustee
Indefinite Term
Began serving: June 2006 | Principal Occupations: Director or Trustee of the Federated Fund Family; Management Consultant and Author.
Other Directorships Held: None.
Qualifications: Mr. Mansfield has served as a Marine Corps officer and in several banking, business management, educational roles and directorship positions throughout his long career. He remains active as a Management Consultant and Author. |
Annual Shareholder Report
Name
Birth Date
Positions Held with Trust
Date Service Began | Principal Occupation(s) for Past Five Years,
Other Directorships Held, Previous Position(s) and Qualifications |
Thomas M. O'Neill
Birth Date: June 14, 1951
Trustee
Indefinite Term
Began serving: August 2006 | Principal Occupations: Director or Trustee, Chair of the Audit Committee of the Federated Fund Family; Sole Proprietor, Navigator Management Company (investment and strategic consulting).
Other Directorships Held: None.
Qualifications: Mr. O'Neill has served in several business, mutual fund and financial management roles and directorship positions throughout his career. Mr. O'Neill serves as Director, Medicines for Humanity and Director, The Golisano Children's Museum of Naples, Florida. Mr. O'Neill previously served as Chief Executive Officer and President, Managing Director and Chief Investment Officer, Fleet Investment Advisors; President and Chief Executive Officer, Aeltus Investment Management, Inc.; General Partner, Hellman, Jordan Management Co., Boston, MA; Chief Investment Officer, The Putnam Companies, Boston, MA; Credit Analyst and Lending Officer, Fleet Bank; Director and Consultant, EZE Castle Software (investment order management software); and Director, Midway Pacific (lumber). |
P. Jerome Richey
Birth Date: February 23, 1949
Trustee
Indefinite Term
Began serving: October 2013 | Principal Occupations: Director or Trustee of the Federated Fund Family; Management Consultant; Retired; formerly, Senior Vice Chancellor and Chief Legal Officer, University of Pittsburgh and Executive Vice President and Chief Legal Officer, CNX Resources Corporation (formerly known as CONSOL Energy Inc.).
Other Directorships Held: None.
Qualifications: Mr. Richey has served in several business and legal management roles and directorship positions throughout his career. Mr. Richey most recently held the positions of Senior Vice Chancellor and Chief Legal Officer, University of Pittsburgh. Mr. Richey previously served as Chairman of the Board, Epilepsy Foundation of Western Pennsylvania and Chairman of the Board, World Affairs Council of Pittsburgh. Mr. Richey previously served as Chief Legal Officer and Executive Vice President, CNX Resources Corporation (formerly known as CONSOL Energy Inc.); and Board Member, Ethics Counsel and Shareholder, Buchanan Ingersoll & Rooney PC (a law firm). |
John S. Walsh
Birth Date: November 28, 1957
Trustee
Indefinite Term
Began serving: June 2006 | Principal Occupations: Director or Trustee, and Chair of the Board of Directors or Trustees, of the Federated Fund Family; President and Director, Heat Wagon, Inc. (manufacturer of construction temporary heaters); President and Director, Manufacturers Products, Inc. (distributor of portable construction heaters); President, Portable Heater Parts, a division of Manufacturers Products, Inc.
Other Directorships Held: None.
Qualifications: Mr. Walsh has served in several business management roles and directorship positions throughout his career. Mr. Walsh previously served as Vice President, Walsh & Kelly, Inc. (paving contractors). |
Annual Shareholder Report
OFFICERS
Name
Birth Date
Address
Positions Held with Trust
Date Service Began | Principal Occupation(s) for Past Five Years
and Previous Position(s) |
Lori A. Hensler
Birth Date: January 6, 1967
TREASURER
Officer since: April 2013 | Principal Occupations: Principal Financial Officer and Treasurer of the Federated Fund Family; Senior Vice President, Federated Administrative Services; Financial and Operations Principal for Federated Securities Corp. and Edgewood Services, Inc.; and Assistant Treasurer, Federated Investors Trust Company. Ms. Hensler has received the Certified Public Accountant designation.
Previous Positions: Controller of Federated Investors, Inc.; Senior Vice President and Assistant Treasurer, Federated Investors Management Company; Treasurer, Federated Investors Trust Company; Assistant Treasurer, Federated Administrative Services, Federated Administrative Services, Inc., Federated Securities Corp., Edgewood Services, Inc., Federated Advisory Services Company, Federated Equity Management Company of Pennsylvania, Federated Global Investment Management Corp., Federated Investment Counseling, Federated Investment Management Company, Passport Research, Ltd., and Federated MDTA, LLC; Financial and Operations Principal for Federated Securities Corp., Edgewood Services, Inc. and Southpointe Distribution Services, Inc. |
Peter J. Germain
Birth Date: September 3, 1959
CHIEF LEGAL OFFICER, SECRETARY and EXECUTIVE VICE PRESIDENT
Officer since: June 2006 | Principal Occupations: Mr. Germain is Chief Legal Officer, Secretary and Executive Vice President of the Federated Fund Family. He is General Counsel, Chief Legal Officer, Secretary and Executive Vice President, Federated Investors, Inc.; Trustee and Senior Vice President, Federated Investors Management Company; Trustee and President, Federated Administrative Services; Director and President, Federated Administrative Services, Inc.; Director and Vice President, Federated Securities Corp.; Director and Secretary, Federated Private Asset Management, Inc.; Secretary, Federated Shareholder Services Company; and Secretary, Retirement Plan Service Company of America. Mr. Germain joined Federated in 1984 and is a member of the Pennsylvania Bar Association.
Previous Positions: Deputy General Counsel, Special Counsel, Managing Director of Mutual Fund Services, Federated Investors, Inc.; Senior Vice President, Federated Services Company; and Senior Corporate Counsel, Federated Investors, Inc. |
Stephen F. Auth
Birth Date: September 13, 1956
101 Park Avenue
41st Floor
New York, NY 10178
CHIEF INVESTMENT OFFICER
Officer since: June 2012 | Principal Occupations: Stephen F. Auth is Chief Investment Officer of various Funds in the Federated Fund Family; Executive Vice President, Federated Investment Counseling, Federated Global Investment Management Corp. and Federated Equity Management Company of Pennsylvania.
Previous Positions: Executive Vice President, Federated Investment Management Company and Passport Research, Ltd. (investment advisory subsidiary of Federated); Senior Vice President, Global Portfolio Management Services Division; Senior Vice President, Federated Investment Management Company and Passport Research, Ltd.; Senior Managing Director and Portfolio Manager, Prudential Investments. |
Annual Shareholder Report
Name
Birth Date
Address
Positions Held with Trust
Date Service Began | Principal Occupation(s) for Past Five Years
and Previous Position(s) |
Stephen Van Meter
Birth Date: June 5, 1975
CHIEF COMPLIANCE OFFICER AND SENIOR VICE PRESIDENT
Officer since: July 2015 | Principal Occupations: Senior Vice President and Chief Compliance Officer of the Federated Fund Family; Vice President and Chief Compliance Officer of Federated Investors, Inc. and Chief Compliance Officer of certain of its subsidiaries. Mr. Van Meter joined Federated in October 2011. He holds FINRA licenses under Series 3, 7, 24 and 66.
Previous Positions: Mr. Van Meter previously held the position of Compliance Operating Officer, Federated Investors, Inc. Prior to joining Federated, Mr. Van Meter served at the United States Securities and Exchange Commission in the positions of Senior Counsel, Office of Chief Counsel, Division of Investment Management and Senior Counsel, Division of Enforcement. |
Annual Shareholder Report
Evaluation and Approval of Advisory Contract–May 2019
Federated MDT Small Cap Growth Fund (the “Fund”)
At its meetings in May 2019, the Fund's Board of Trustees (the “Board”), including a majority of those Trustees who are not “interested persons” of the Fund, as defined in the Investment Company Act of 1940 (the “Independent Trustees”) reviewed and unanimously approved the continuation of the Fund's investment advisory contract for an additional one-year term. The Board's decision regarding the contract reflects the exercise of its business judgment after considering all of the information received on whether to continue the existing arrangements.
At the request of the Independent Trustees, the Fund's Chief Compliance Officer (the CCO) furnished to the Board in advance of its May 2019 meetings an independent written evaluation presenting on the topics discussed below. The Board considered the CCO's independent written evaluation (the “CCO Fee Evaluation Report”), along with other information, in evaluating the reasonableness of the Fund's management fee and in deciding to approve the continuation of the investment advisory contract. The CCO, in preparing the CCO Fee Evaluation Report, has the authority to retain consultants, experts or staff as reasonably necessary to assist in the performance of his duties, reports directly to the Board, and can be terminated only with the approval of a majority of the Independent Trustees. At the request of the Independent Trustees, the CCO Fee Evaluation Report followed the same general approach and covered the same topics as that of the report that had previously been delivered by the CCO in his capacity as “Senior Officer,” prior to the elimination of the Senior Officer position in December 2017.
The Board also considered judicial decisions concerning allegedly excessive investment advisory fees in making its decision. Using these judicial decisions as a guide, the Board observed that the following factors may be relevant to an adviser's fiduciary duty with respect to its receipt of compensation from a fund: (1) the nature and quality of the services provided by an adviser to a fund and its shareholders (including the performance of the fund, its benchmark, and comparable funds); (2) an adviser's cost of providing the services (including the profitability to an adviser of providing advisory services to a fund); (3) the extent to which an adviser may realize “economies of scale” as a fund grows larger and, if such economies of scale exist, whether they have been shared with a fund and its shareholders or the family of funds; (4) any “fall-out” financial benefits that accrue to an adviser because of its relationship with a fund (including research services received from brokers that execute fund trades and any fees paid to affiliates of an adviser for services rendered to a fund); (5) comparative fee and expense structures (including a comparison of fees paid to an adviser with those paid by similar funds both internally and externally as well as management fees charged to institutional and other advisory clients of the
Annual Shareholder Report
adviser for what might be viewed as like services); and (6) the extent of care, conscientiousness and independence with which the fund's board members perform their duties and their expertise (including whether they are fully informed about all facts the board deems relevant to its consideration of an adviser's services and fees). The Board noted that the Securities and Exchange Commission (SEC) disclosure requirements regarding the basis for the Board's approval of the Fund's investment advisory contract generally align with the factors listed above. The Board was aware of these factors and was guided by them in its review of the Fund's investment advisory contract to the extent it considered them to be appropriate and relevant, as discussed further below.
The Board considered and weighed these factors in light of its substantial accumulated experience in governing the Fund and working with Federated MDTA LLC (the “Adviser”) and its affiliates (collectively “Federated”) on matters relating to the funds advised by Federated (each, a “Federated Fund”). The Independent Trustees were assisted in their deliberations by independent legal counsel.
In addition to the extensive materials that comprise and accompany the CCO Fee Evaluation Report, the Board received detailed information about the Fund and the Federated organization throughout the year, and in connection with its May meetings at which the Board's formal approval of the advisory and subadvisory contracts occurred. In this regard, Federated provided much of this information at each regular meeting of the Board, and furnished additional information specifically in connection with the May meetings. In the months preceding the May meetings, the Board requested and reviewed written materials prepared by Federated in response to requests on behalf of the Independent Trustees encompassing a wide variety of topics. At the May meetings, in addition to meeting in separate sessions of the Independent Trustees without management present, senior management of the Adviser also met with the Independent Trustees and their counsel to discuss the materials presented and such additional matters as the Independent Trustees deemed reasonably necessary to evaluate the advisory and subadvisory contracts. Between regularly scheduled meetings, the Board also received information on particular matters as the need arose.
The Board's consideration of the investment advisory contract included review of the CCO Fee Evaluation Report, accompanying data and additional information covering the following matters, among others: the Adviser's investment philosophy, revenue, profitability, personnel and processes; investment and operating strategies; the Fund's short-term and long-term performance (in absolute terms, both on a gross basis and net of expenses, as well as in terms relative to its particular investment program and certain competitor or “peer group” funds and/or other benchmarks, as appropriate) and comments on the reasons for performance; the Fund's investment objectives; the Fund's expenses, including the advisory fee and the overall expense structure of the Fund (both in absolute terms and relative to similar and/or competing funds), with due
Annual Shareholder Report
regard for contractual or voluntary expense limitations; the use and allocation of brokerage commissions derived from trading the Fund's portfolio securities (if any); and the nature, quality and extent of the advisory and other services provided to the Fund by the Adviser and its affiliates. The Board also considered the preferences and expectations of Fund shareholders; the entrepreneurial and other risks assumed by the Adviser in sponsoring the Fund; the continuing state of competition in the mutual fund industry and market practices; the range of comparable fees for similar funds in the mutual fund industry; the Fund's relationship to the Federated Funds which include a comprehensive array of funds with different investment objectives, policies and strategies which are generally available for exchange without the incurrence of additional sales charges; compliance and audit reports concerning the Federated Funds and the Federated companies that service them (including communications from regulatory agencies), as well as Federated's responses to any issues raised therein; and relevant developments in the mutual fund industry and how the Federated Funds and/or Federated are responding to them. The Board's evaluation process is evolutionary. The criteria considered and the emphasis placed on relevant criteria change in recognition of changing circumstances in the mutual fund marketplace.
While mindful that courts have cautioned against giving too much weight to comparative information concerning fees charged by other advisers for managing funds with comparable investment programs, the Board has found the use of such comparisons to be relevant to its deliberations. In this regard, the Board was presented with, and considered, information regarding the contractual advisory fee rates, net advisory fee rates, total expense ratios and each element of the Fund's total expense ratio (i.e., gross and net advisory fees, custody fees, portfolio accounting fees and transfer agency fees) relative to an appropriate group of peer funds compiled by Federated using data supplied by independent fund ranking organizations (the “Peer Group”). The Board received a description of the composition and methodology used to select the Peer Group. The Board focused on comparisons with other similar mutual funds more heavily than non-mutual fund products or services because it is believed that they are more relevant. For example, other mutual funds are the products most like the Fund, in that they are readily available to Fund shareholders as alternative investment vehicles. Also, they are the type of investment vehicle, in fact, chosen and maintained by the Fund's investors. The range of their fees and expenses, therefore, appears to be a relevant indicator of what consumers have found to be reasonable in the marketplace in which the Fund competes.
The Board reviewed the contractual advisory fee rate, net advisory fee rate and other expenses of the Fund and noted the position of the Fund's fee rates relative to its Peer Group. In this regard, the Board noted that the contractual advisory fee rate was above the median of the relevant Peer Group, but the Board noted the applicable waivers and reimbursements, and that the overall expense structure of the Fund remained competitive in the context of other
Annual Shareholder Report
factors considered by the Board. In this regard, the Board had been previously advised that, while comparisons to fund Peer Groups are relevant in judging the reasonableness of advisory fees, the Fund's quantitative focus makes fee and expense comparisons particularly difficult. Although the Fund's advisory fee was above the median of the peer range, the Peer Group of funds varied widely in their complexity, and the Board has been informed that the management of the Fund is among the more complex relative to its Peer Group. The Board considered the fact that the Adviser committed to permanently reduce fees of the Fund in an agreed upon amount, such reduction to be effective July 1, 2019.
For comparison, the CCO reviewed the fees charged by Federated for providing advisory services to products other than the Federated Funds (e.g., institutional separate accounts and third-party unaffiliated mutual funds for which Federated serves as sub-adviser) (referenced to as “Comparable Funds/Accounts”). With respect to Comparable Funds/Accounts other than third-party mutual funds, the CCO concluded that they are inherently different products. Those differences include, but are not limited to, different types of targeted investors; different applicable laws and regulations; different legal structures; different average account sizes and portfolio management techniques made necessary by different cash flows and different associated costs; and the time spent by portfolio managers and their teams, as well as personnel in the Funds Financial Services, Legal, Compliance and Risk Management departments, in reviewing securities pricing, addressing different administrative responsibilities, addressing different degrees of risk associated with management and a variety of different costs. The CCO also reviewed the differences in the nature of the services required for Federated to manage its proprietary mutual fund business versus managing a discrete pool of assets as a sub-adviser to another institution's mutual fund, and that Federated generally performs significant additional services and assumes substantially greater risks in managing the Fund and other Federated Funds than in its role as sub-adviser to an unaffiliated third-party mutual fund. The CCO did not consider the fees for providing advisory services to Comparable Funds/Accounts to be determinative in judging the appropriateness of the Federated Funds' advisory fees.
The CCO noted that the services, administrative responsibilities and risks associated with such relationships are quite different than serving as a primary adviser to a fund.
Following such evaluation, and full deliberations, the Board concluded that the fees and expenses of the Fund are reasonable and supported renewal of the Fund's investment advisory contract.
The Board considered the nature, extent and quality of the services provided to the Fund by the Adviser and the resources of the Adviser and its affiliates dedicated to the Fund. In this regard, the Board evaluated, among other things, the Adviser's personnel, experience, track record, financial resources, overall reputation and willingness to invest in personnel and infrastructure that benefit the Fund. In addition, the Board reviewed the qualifications, backgrounds and
Annual Shareholder Report
responsibilities of the portfolio management team primarily responsible for the day-to-day management of the Fund and the Adviser's ability and experience in attracting and retaining qualified personnel to service the Fund. The Board noted the investment research and company engagement capabilities of the Adviser and its affiliates. The Board also noted the compliance program of the Adviser and the compliance-related resources provided to the Fund by the Adviser, including the Adviser's commitment to respond to rulemaking initiatives of the SEC. The Fund's ability to deliver competitive performance when compared to its Peer Group was also deemed to be relevant by the Board as a useful indicator of how the Adviser is executing the Fund's investment program. The Adviser's ability to execute this program was one of the Board's considerations in reaching a conclusion that the nature, extent and quality of the Adviser's investment management services warrant the continuation of the investment advisory contract.
In evaluating the Fund's investment performance, the Board considered performance results in light of the Fund's investment objective, strategies and risks, as disclosed in the Fund's prospectus. The Board considered detailed investment reports on the Fund's performance that were provided to the Board throughout the year and in connection with the May meetings. The CCO also reviewed information regarding the performance of other mutual funds in the Peer Group, noting the CCO's view that comparisons to fund peer groups may be helpful, though not conclusive, in evaluating the performance of the Adviser in managing the Fund. The Board considered, in evaluating such comparisons, that in some cases there may be differences in the funds' investment objectives or investment management techniques, or the costs to implement funds, even within the same Peer Group, and that the CCO had specifically noted that the Fund's quantitative focus makes fee and expense comparisons particularly difficult as the funds in the Peer Group varied widely in their complexity, and the management of the Fund is among the more complex relative to its Peer Group.
For the periods covered by the CCO Fee Evaluation Report, the Fund's performance for the three-year and five-year periods was above the median of the relevant Peer Group, and the Fund's performance fell below the median of the relevant Peer Group for the one-year period. In addition, the Board was informed by the Adviser that the Fund outperformed its benchmark index for the one-year, three-year and five-year periods. The Board discussed the Fund's performance with the Adviser and recognized the efforts being taken by the Adviser in the context of other factors considered relevant by the Board.
Following such evaluation, and full deliberations, the Board concluded that the performance of the Fund supported renewal of the Fund's advisory contract.
Annual Shareholder Report
The Board also received financial information about Federated, including information regarding the compensation and ancillary (or “fall-out”) benefits Federated derived from its relationships with the Federated Funds. This information covered not only the fees under the investment advisory contracts, but also fees received by Federated's subsidiaries for providing other services to the Federated Funds under separate contracts (e.g., for serving as the Federated Funds' administrator and distributor). In this regard, the Board considered that certain Federated subsidiaries provide distribution and shareholder services to the Federated Funds, for which they may be compensated through distribution and servicing fees paid pursuant to Rule 12b-1 plans or otherwise. The information also detailed any indirect benefit Federated may derive from its receipt of research services from brokers who execute Federated Fund trades. In addition, the Board considered the fact that, in order for a Federated Fund to be competitive in the marketplace, the Adviser and its affiliates frequently waived fees and/or reimbursed expenses and have disclosed to Federated Fund investors and/or indicated to the Board their intention to do so in the future. Moreover, the Board receives regular reporting as to the institution, adjustment or elimination of these voluntary waivers. The Board considered Federated's previous reductions in contractual management fees to certain Federated Funds in response to the CCO's recommendations in the prior year's CCO Fee Evaluation Report.
In 2016, the Board approved a reduction of 16 basis points in the contractual advisory fee. In 2018, the Board approved a reduction of 14 basis points in the contractual advisory fee. This change was intended to more closely align the contractual fee with the net fee actually charged after the imposition of applicable voluntary waivers. In 2019, the Board approved a further reduction of 5 basis points in the contractual advisory fee.
Federated furnished information, requested by the CCO, that reported revenues on a fund-by-fund basis and made estimates of the allocation of expenses on a fund-by-fund basis, using allocation methodologies specified by the CCO. The CCO noted that, while these cost allocation reports apply consistent allocation processes, the inherent difficulties in allocating costs continues to cause the CCO to question the precision of the process and to conclude that such reports may be unreliable, since a single change in an allocation estimate may dramatically alter the resulting estimate of cost and/or profitability of a Federated Fund and may produce unintended consequences. The allocation information, including the CCO's view that fund-by-fund estimations may be unreliable, was considered in the evaluation by the Board.
Annual Shareholder Report
The Board and the CCO also reviewed information compiled by Federated comparing its profitability information to other publicly held fund management companies, including information regarding profitability trends over time. In this regard, the CCO concluded that Federated's profit margins did not appear to be excessive. The CCO also noted that Federated appeared financially sound, with the resources necessary to fulfill its obligations under its contracts with the Fund.
The CCO Fee Evaluation Report also discussed the notion of possible realization of “economies of scale” as a fund grows larger, the difficulties of calculating economies of scale at an individual fund level, and the extent to which potential scale benefits are shared with shareholders. In this regard, the Board considered that Federated has made significant and long-term investments in areas that support all of the Federated Funds, such as personnel and processes for the portfolio management, shareholder services, compliance, internal audit and risk management functions, as well as systems technology (including technology relating to cybersecurity) and that the benefits of these investments (as well as any economies of scale, should they exist) were likely to be shared with the Federated Fund family as a whole. The Board noted that Federated's investments in these areas are extensive. In addition, the Board considered that the Adviser and its affiliates have frequently waived fees and/or reimbursed expenses and that this has allowed potential economies of scale to be shared with shareholders. The Board also considered that such waivers and reimbursements can provide protection from an increase in expenses if a Federated Fund's assets decline. Federated, as it does throughout the year, and specifically in connection with the Board's review of the advisory and subadvisory contracts, furnished information relative to revenue sharing or adviser-paid fees. Federated and the CCO noted that this information should be viewed to determine if there was an incentive to either not apply breakpoints, or to apply breakpoints at higher levels, and should not be viewed to determine the appropriateness of advisory fees. The Board also noted the absence of any applicable regulatory or industry guidelines on this subject, which (as discussed in the CCO Fee Evaluation Report) is compounded by the lack of any common industry practice or general pattern with respect to structuring fund advisory fees with “breakpoints” that serve to reduce the fee as a fund attains a certain size.
The CCO stated that his observations and the information accompanying the CCO Fee Evaluation Report supported a finding by the Board that the management fee for the Fund was reasonable. Under these circumstances, no changes were recommended to, and no objection was raised to the continuation of, the Fund's investment advisory contract. The CCO also recognized that the Board's evaluation of the Federated Funds' advisory and subadvisory arrangements is a continuing and on-going process that is informed by the
Annual Shareholder Report
information that the Board requests and receives from management throughout the course of the year and, in this regard, the CCO noted certain items for future reporting to the Board or further consideration by management as the Board continues its on-going oversight of the Federated Funds.
In its decision to continue an existing investment advisory contract, the Board was mindful of the potential disruptions of the Fund's operations and various risks, uncertainties and other effects that could occur as a result of a decision to terminate or not renew an investment advisory contract. In particular, the Board recognized that many shareholders have invested in the Fund on the strength of the Adviser's industry standing and reputation and with the expectation that the Adviser will have a continuing role in providing advisory services to the Fund. Thus, the Board's approval of the investment advisory contract reflected the fact that it is the shareholders who have effectively selected the Adviser by virtue of having invested in the Fund. The Board concluded that, in light of the factors summarized above, including the nature, quality and scope of the services provided to the Fund by the Adviser and its affiliates, continuation of the investment advisory contract was appropriate.
The Board based its decision to approve the investment advisory contract on the totality of the circumstances and relevant factors and with a view to past and future long-term considerations. Not all of the factors and considerations identified above were necessarily relevant to the Fund, nor did the Board consider any one of them to be determinative. With respect to the factors that were relevant, the Board's decision to approve the continuation of the contract reflects its view that Federated's performance and actions provided a satisfactory basis to support the decision to continue the existing arrangement.
Annual Shareholder Report
Voting Proxies on Fund Portfolio Securities
A description of the policies and procedures that the Fund uses to determine how to vote proxies, if any, relating to securities held in the Fund's portfolio is available, without charge and upon request, by calling 1-800-341-7400. A report on “Form N-PX” of how the Fund voted any such proxies during the most recent 12-month period ended June 30 is available via the Proxy Voting Record (Form N-PX) link associated with the Fund and share class name at www.FederatedInvestors.com/FundInformation. Form N-PX filings are also available at the SEC's website at www.sec.gov.
Quarterly Portfolio Schedule
Each fiscal quarter, the Fund will file with the SEC a complete schedule of its monthly portfolio holdings on “Form N-PORT.” The Fund's holdings as of the end of the third month of every fiscal quarter, as reported on Form N-PORT, will be publicly available on the SEC's website at www.sec.gov within 60 days of the end of the fiscal quarter upon filing. You may also access this information via the link to the Fund and share class name at www.FederatedInvestors.com.
Annual Shareholder Report
Mutual funds are not bank deposits or obligations, are not guaranteed by any bank and are not insured or guaranteed by the U.S. government, the Federal Deposit Insurance Corporation, the Federal Reserve Board or any other government agency. Investment in mutual funds involves investment risk, including the possible loss of principal.
This Report is authorized for distribution to prospective investors only when preceded or accompanied by the Fund's Prospectus, which contains facts concerning its objective and policies, management fees, expenses and other information.
Federated MDT Small Cap Growth Fund
Federated Investors Funds
4000 Ericsson Drive
Warrendale, PA 15086-7561
Contact us at FederatedInvestors.com
or call 1-800-341-7400.
Federated Securities Corp., Distributor
CUSIP 31421R775
CUSIP 31421R767
CUSIP 31421R759
CUSIP 31421R619
37313 (9/19)
Federated is a registered trademark of Federated Investors, Inc.
2019 ©Federated Investors, Inc.
(a) As of the end of the period covered by this report, the registrant has adopted a code of ethics (the "Section 406 Standards for Investment Companies - Ethical Standards for Principal Executive and Financial Officers") that applies to the registrant's Principal Executive Officer and Principal Financial Officer; the registrant's Principal Financial Officer also serves as the Principal Accounting Officer.
(c) There was no amendment to the registrant’s code of ethics described in Item 2(a) above during the period covered by the report.
(d) There was no waiver granted, either actual or implicit, from a provision to the registrant’s code of ethics described in Item 2(a) above during the period covered by the report.
(e) Not Applicable
(f)(3) The registrant hereby undertakes to provide any person, without charge, upon request, a copy of the code of ethics. To request a copy of the code of ethics, contact the registrant at 1-800-341-7400, and ask for a copy of the Section 406 Standards for Investment Companies - Ethical Standards for Principal Executive and Financial Officers.
Item 3. Audit Committee Financial Expert
The registrant's Board has determined that each of the following members of the Board's Audit Committee is an “audit committee financial expert,” and is "independent," for purposes of this Item: John T. Collins, G. Thomas Hough and Thomas M. O'Neill.
| Item 4. | Principal Accountant Fees and Services |
(a) Audit Fees billed to the registrant for the two most recent fiscal years:
Fiscal year ended 2019 - $142,400
Fiscal year ended 2018 – $139,710
(b) Audit-Related Fees billed to the registrant for the two most recent fiscal years:
Fiscal year ended 2019 - $0
Fiscal year ended 2018 – $0
Amount requiring approval of the registrant’s audit committee pursuant to paragraph (c)(7)(ii) of Rule 2-01 of Regulation S-X, $0 and $0, respectively.
(c) Tax Fees billed to the registrant for the two most recent fiscal years:
Fiscal year ended 2019 - $0
Fiscal year ended 2018 - $0
Amount requiring approval of the registrant’s audit committee pursuant to paragraph (c)(7)(ii) of Rule 2-01 of Regulation S-X, $0 and $0, respectively.
(d) All Other Fees billed to the registrant for the two most recent fiscal years:
Fiscal year ended 2019 - $0
Fiscal year ended 2018 - $0
Amount requiring approval of the registrant’s audit committee pursuant to paragraph (c)(7)(ii) of Rule 2-01 of Regulation S-X, $27,403 and $32,377, respectively. Fiscal year ended 2019- Service fee for analysis of potential Passive Foreign Investment Company holdings. Fiscal year ended 2018- Service fee for analysis of potential Passive Foreign Investment Company holdings.
(e)(1) Audit Committee Policies regarding Pre-approval of Services.
The Audit Committee is required to pre-approve audit and non-audit services performed by the independent auditor in order to assure that the provision of such services do not impair the auditor’s independence. Unless a type of service to be provided by the independent auditor has received general pre-approval, it will require specific pre-approval by the Audit Committee. Any proposed services exceeding pre-approved cost levels will require specific pre-approval by the Audit Committee.
Certain services have the general pre-approval of the Audit Committee. The term of the general pre-approval is 12 months from the date of pre-approval, unless the Audit Committee specifically provides for a different period. The Audit Committee will annually review the services that may be provided by the independent auditor without obtaining specific pre-approval from the Audit Committee and may grant general pre-approval for such services. The Audit Committee will revise the list of general pre-approved services from time to time, based on subsequent determinations. The Audit Committee will not delegate its responsibilities to pre-approve services performed by the independent auditor to management.
The Audit Committee has delegated pre-approval authority to its Chairman. The Chairman will report any pre-approval decisions to the Audit Committee at its next scheduled meeting. The Committee will designate another member with such pre-approval authority when the Chairman is unavailable.
AUDIT SERVICES
The annual Audit services engagement terms and fees will be subject to the specific pre-approval of the Audit Committee. The Audit Committee must approve any changes in terms, conditions and fees resulting from changes in audit scope, registered investment company (RIC) structure or other matters.
In addition to the annual Audit services engagement specifically approved by the Audit Committee, the Audit Committee may grant general pre-approval for other Audit Services, which are those services that only the independent auditor reasonably can provide. The Audit Committee has pre-approved certain Audit services, all other Audit services must be specifically pre-approved by the Audit Committee.
AUDIT-RELATED SERVICES
Audit-related services are assurance and related services that are reasonably related to the performance of the audit or review of the Company’s financial statements or that are traditionally performed by the independent auditor. The Audit Committee believes that the provision of Audit-related services does not impair the independence of the auditor, and has pre-approved certain Audit-related services, all other Audit-related services must be specifically pre-approved by the Audit Committee.
TAX SERVICES
The Audit Committee believes that the independent auditor can provide Tax services to the Company such as tax compliance, tax planning and tax advice without impairing the auditor’s independence. However, the Audit Committee will not permit the retention of the independent auditor in connection with a transaction initially recommended by the independent auditor, the purpose of which may be tax avoidance and the tax treatment of which may not be supported in the Internal Revenue Code and related regulations. The Audit Committee has pre-approved certain Tax services, all Tax services involving large and complex transactions must be specifically pre-approved by the Audit Committee.
ALL OTHER SERVICES
With respect to the provision of services other than audit, review or attest services the pre-approval requirement is waived if:
| (1) | The aggregate amount of all such services provided constitutes no more than five percent of the total amount of revenues paid by the registrant, the registrant’s adviser (not including any sub-adviser whose role is primarily portfolio management and is subcontracted with or overseen by another investment adviser), and any entity controlling, controlled by, or under common control with the investment adviser that provides ongoing services to the registrant to its accountant during the fiscal year in which the services are provided; |
| (2) | Such services were not recognized by the registrant, the registrant’s adviser (not including any sub-adviser whose role is primarily portfolio management and is subcontracted with or overseen by another investment adviser), and any entity controlling, controlled by, or under common control with the investment adviser that provides ongoing services to the registrant at the time of the engagement to be non-audit services; and |
| (3) | Such services are promptly brought to the attention of the Audit Committee of the issuer and approved prior to the completion of the audit by the Audit Committee or by one or more members of the Audit Committee who are members of the board of directors to whom authority to grant such approvals has been delegated by the Audit Committee. |
The Audit Committee may grant general pre-approval to those permissible non-audit services classified as All Other services that it believes are routine and recurring services, and would not impair the independence of the auditor.
The SEC’s rules and relevant guidance should be consulted to determine the precise definitions of prohibited non-audit services and the applicability of exceptions to certain of the prohibitions.
PRE-APPROVAL FEE LEVELS
Pre-approval fee levels for all services to be provided by the independent auditor will be established annually by the Audit Committee. Any proposed services exceeding these levels will require specific pre-approval by the Audit Committee.
PROCEDURES
Requests or applications to provide services that require specific approval by the Audit Committee will be submitted to the Audit Committee by both the independent auditor and the Principal Accounting Officer and/or Internal Auditor, and must include a joint statement as to whether, in their view, the request or application is consistent with the SEC’s rules on auditor independence.
(e)(2) Percentage of services identified in items 4(b) through 4(d) that were approved by the registrants audit committee pursuant to paragraph (c)(7)(i)(C) of Rule 2-01 of Regulation S-X:
4(b)
Fiscal year ended 2019 – 0%
Fiscal year ended 2018 – 0%
Percentage of services provided to the registrants investment adviser and any entity controlling, controlled by, or under common control with the investment adviser that provides ongoing services to the registrant that were approved by the registrants audit committee pursuant to paragraph (c)(7)(i)(C) of Rule 2-01 of Regulation S-X, 0% and 0% respectively.
4(c)
Fiscal year ended 2019 – 0%
Fiscal year ended 2018 – 0%
Percentage of services provided to the registrants investment adviser and any entity controlling, controlled by, or under common control with the investment adviser that provides ongoing services to the registrant that were approved by the registrants audit committee pursuant to paragraph (c)(7)(i)(C) of Rule 2-01 of Regulation S-X, 0% and 0% respectively.
4(d)
Fiscal year ended 2019 – 0%
Fiscal year ended 2018 – 0%
Percentage of services provided to the registrants investment adviser and any entity controlling, controlled by, or under common control with the investment adviser that provides ongoing services to the registrant that were approved by the registrants audit committee pursuant to paragraph (c)(7)(i)(C) of Rule 2-01 of Regulation S-X, 0% and 0% respectively.
| (g) | Non-Audit Fees billed to the registrant, the registrant’s investment adviser, and certain entities controlling, controlled by or under common control with the investment adviser: |
Fiscal year ended 2019 - $624,400
Fiscal year ended 2018 - $1,155,648
| (h) | The registrant’s Audit Committee has considered that the provision of non-audit services that were rendered to the registrant’s adviser (not including any sub-adviser whose role is primarily portfolio management and is subcontracted with or overseen by another investment adviser), and any entity controlling, controlled by, or under common control with the investment adviser that provides ongoing services to the registrant that were not pre-approved pursuant to paragraph (c)(7)(ii) of Rule 2-01 of Regulation S-X is compatible with maintaining the principal accountant’s independence. |
The registrant’s management and Audit Committee continue to believe that the registrant’s registered public accounting firm, Ernst & Young LLP (“EY”), has the ability to exercise objective and impartial judgment on all issues encompassed within their audit services. EY is required to make a determination that it satisfies certain independence requirements under the federal securities laws. Like other registrants, there is a risk that activities or relationships of EY, or its partners or employees, can prevent a determination from being made that it satisfies such independence requirements with respect to the registrant, which could render it ineligible to serve as the registrant’s independent public accountant.
In its required communications to the Audit Committee of the registrant’s Board, EY informed the Audit Committee that EY and/ or covered person professionals within EY maintain lending relationships with certain owners of greater than 10% of the shares of certain investment companies within the “investment company complex” as defined under Rule 2-01(f)(14) of Regulation S-X, which are affiliates of the registrant. EY has advised the Audit Committee that these lending relationships implicate Rule 2-01(c)(1)(ii)(A) of Regulation S-X (referred to as the “Loan Rule”). The Loan Rule prohibits an independent public accountant, or covered person professionals at such firm, from having a financial relationship (such as a loan) with a lender that is a record or beneficial owner of more than 10% of an audit client’s equity securities. For purposes of the Loan Rule, audit clients include the registrant, as well as all registered investment companies advised by advisory subsidiaries of Federated Investors, Inc., the Adviser (for which EY serves as independent public accountant), and their respective affiliates (collectively, the “Federated Fund Complex”).
EY informed the Audit Committee that EY believes that these lending relationships described above do not and will not impair EY’s ability to exercise objective and impartial judgment in connection with the audits of the financial statements for the registrant and a reasonable investor with knowledge of all relevant facts and circumstances would conclude that EY has been and is capable of objective and impartial judgment on all issues encompassed within EY’s audits.
On June 20, 2016, the Division of Investment Management of the Securities and Exchange Commission (“SEC”) issued a no-action letter to another mutual fund complex (see Fidelity Management & Research Company et al., No-Action Letter) related to similar Loan Rule matters as those described above (the “Letter”). In the Letter, the SEC Staff confirmed that it would not recommend enforcement action against an investment company that relied on the audit services performed by an independent public accountant where the Loan Rule was implicated in certain specified circumstances provided that: (1) the auditor has complied with PCAOB Rule 3526(b)(1) and 3526(b)(2); (2) the Loan Rule is implicated because of lending relationships; and (3) notwithstanding such lending relationships that implicate the Loan Rule, the auditor has concluded that it is objective and impartial with respect to the issues encompassed within its engagement as auditor of the funds. The circumstances described in the Letter are substantially similar to the circumstances that implicated the Loan Rule with respect to EY and the registrant. On September 22, 2017, the SEC extended the expiration of the Letter until the effectiveness of any amendments to the Loan Rule designed to address the concerns in the Letter. On June 18, 2019, the SEC adopted amendments to the Loan Rule, which, refocus the analysis that must be conducted to determine whether an auditor is independent when the auditor has a lending relationship with certain shareholders of an audit client at any time during an audit or professional engagement period.
Additionally, on July 18, 2018, EY informed the registrant that Rule 2-01(c)(1)(i)(A) of Regulation S-X (“Investment Rule”) also has been implicated since July 2, 2018. The Investment Rule prohibits public accounting firms, or covered person professionals and their immediate family members, from having certain direct financial investments in their audit clients and affiliated entities. EY informed the registrant that a pension trust of a non-US affiliated entity of EY had previously made, and as of July 18, 2018 maintained, an investment in a fund (“Hermes Fund”) managed by Hermes Alternative Investment Management Limited (“HAIML”), which is a wholly owned subsidiary of Hermes Fund Managers Limited (“HFML”). The pension trust’s investment in the Hermes Fund involved the Investment Rule because an indirect wholly owned subsidiary of Federated Investors, Inc. (an affiliate of the registrant’s adviser), acquired a 60% majority interest in HFML on July 2, 2018, effective July 1, 2018 (“Hermes Acquisition”). The pension trust first invested in the Hermes Fund in 2007, well prior to the Hermes Acquisition. The pension trust’s investment represented less than 3.3% of the Hermes Fund’s assets as of July 18, 2018. EY subsequently informed the registrant that EY’s affiliated entity’s pension trust had submitted an irrevocable redemption notice to redeem its investment in the Hermes Fund. Pursuant to the redemption terms of the Hermes Fund, the pension trust’s redemption would not be effected until December 26, 2018 at the earliest. The redemption notice could not be revoked by the pension trust. The redemption notice would only be revoked by HAIML, as the adviser for Hermes Fund, if, and to the extent, the pension trust successfully sold its interest in the Hermes Fund in a secondary market transaction. EY also informed the registrant that the pension trust simultaneously submitted a request to HAIML to conduct a secondary market auction for the pension trust’s interests in the Hermes Fund. In addition, the only voting rights shareholders of the Hermes Fund had under the Hermes Fund’s governing documents relate to key appointments, including the election of the non-executive members of the Hermes Fund’s committee, the appointment of the Hermes Fund’s trustee and the adoption of the Hermes Fund’s financial statements. The next meeting of the Hermes Fund at which shareholders could vote on the election of members to the Hermes Fund’s committee was not until June 2019, and the size of the pension trust’s investment in the Hermes Fund would not allow it to unilaterally elect a committee member or the trustee. EY does not audit the Hermes Fund and the Hermes Fund’s assets and operations are not consolidated in the registrant’s financial statements that are subject to audit by EY. Finally, no member of EY’s audit team that provides audit services to the registrant is a beneficiary of EY’s affiliated entity’s pension trust. Management reviewed this matter with the registrant’s Audit Committee, and, based on that review, as well as a letter from EY to the registrant dated July 26, 2018, in which EY indicated that it had determined that this matter does not impair EY’s ability to exercise objective and impartial judgment in connection with the audit of the financial statements for the registrant and the belief that a reasonable investor with knowledge of all relevant facts and circumstances would conclude that EY has been and is capable of exercising objective and impartial judgment on all issues encompassed within EY’s audit, the registrant’s management and Audit Committee made a determination that such matter does not impair EY’s ability to exercise objective and impartial judgment in connection with the audit of the financial statements for the registrant. On August 29, 2018, EY informed the registrant that EY’s affiliated entity’s pension trust sold its entire interest in the Hermes Fund, effective as of August 28, 2018.
If it were to be determined that, with respect to the Loan Rule, the relief available under the Letter was improperly relied upon, or that the independence requirements under the federal securities laws were not complied with regarding the registrant, for certain periods, and/or given the implication of the Investment Rule for certain periods, any of the registrant’s filings with the SEC which contain financial statements of the registrant for such periods may be determined not to be consistent with or comply with applicable federal securities laws, the registrant’s ability to offer shares under its current registration statement may be impacted, andcertain financial reporting and/or other covenants with, and representations and warranties to, the registrant’s lender under its committed line of credit may be impacted. Such eventscould have a material adverse effect on the registrant and the Federated Fund Complex.
| Item 5. | Audit Committee of Listed Registrants |
Not Applicable
| Item 6. | Schedule of Investments |
(a) The registrant’s Schedule of Investments is included as part of the Report to Stockholders filed under Item 1 of this form.
(b) Not Applicable; Fund had no divestments during the reporting period covered since the previous Form N-CSR filing.
| Item 7. | Disclosure of Proxy Voting Policies and Procedures for Closed-End Management Investment Companies |
Not Applicable
| Item 8. | Portfolio Managers of Closed-End Management Investment Companies |
Not Applicable
| Item 9. | Purchases of Equity Securities by Closed-End Management Investment Company and Affiliated Purchasers |
Not Applicable
| Item 10. | Submission of Matters to a Vote of Security Holders |
No Changes to Report
| Item 11. | Controls and Procedures |
(a) The registrant’s President and Treasurer have concluded that the
registrant’s disclosure controls and procedures (as defined in rule 30a-3(c) under the Act) are effective in design and operation and are sufficient to form the basis of the certifications required by Rule 30a-(2) under the Act, based on their evaluation of these disclosure controls and procedures within 90 days of the filing date of this report on Form N-CSR.
(b) There were no changes in the registrant’s internal control over financial reporting (as defined in rule 30a-3(d) under the Act) during the registrant’s most recent fiscal half-year (the registrant’s second fiscal half-year in the case of an annual report) that have materially affected, or are reasonably likely to materially affect, the registrant’s internal control over financial reporting.
| Item 12. | Disclosure of Securities Lending Activities for Closed-End Management Investment Companies |
Not Applicable
(a)(1) Code of Ethics- Not Applicable to this Report.
(a)(2) Certifications of Principal Executive Officer and Principal Financial Officer.
(a)(3) Not Applicable.
(b) Certifications pursuant to 18 U.S.C. Section 1350.
SIGNATURES
Pursuant to the requirements of the Securities Exchange Act of 1934 and the Investment Company Act of 1940, the registrant has duly caused this report to be signed on its behalf by the undersigned, thereunto duly authorized.
RegistrantFederated MDT Series
By/S/ Lori A. Hensler
Lori A. Hensler, Principal Financial Officer
DateSeptember 23, 2019
Pursuant to the requirements of the Securities Exchange Act of 1934 and the Investment Company Act of 1940, this report has been signed below by the following persons on behalf of the registrant and in the capacities and on the dates indicated.
By/S/ J. Christopher Donahue
J. Christopher Donahue, Principal Executive Officer
DateSeptember 23, 2019
By/S/ Lori A. Hensler
Lori A. Hensler, Principal Financial Officer
DateSeptember 23, 2019