United States
Securities and Exchange Commission
Washington, D.C. 20549
Form N-CSR
Certified Shareholder Report of Registered Management Investment Companies
811-21904
(Investment Company Act File Number)
Federated Hermes MDT Series
_______________________________________________________________
(Exact Name of Registrant as Specified in Charter)
Federated Hermes Funds
4000 Ericsson Drive
Warrendale, Pennsylvania 15086-7561
(Address of Principal Executive Offices)
(412) 288-1900
(Registrant's Telephone Number)
Peter J. Germain, Esquire
1001 Liberty Avenue
Pittsburgh, Pennsylvania 15222-3779
(Name and Address of Agent for Service)
(Notices should be sent to the Agent for Service)
Date of Fiscal Year End: 07/31/20
Date of Reporting Period: 07/31/20
| Item 1. | Reports to Stockholders |

Annual Shareholder Report
July 31, 2020
| Share Class | Ticker | A | QAACX | C | QCACX | Institutional | QIACX | R6 | QKACX |
Federated Hermes MDT All Cap Core Fund
(formerly, Federated MDT All Cap Core Fund)
Fund Established 2002
A Portfolio of Federated Hermes MDT Series
(formerly, Federated MDT Series)
IMPORTANT NOTICE REGARDING REPORT DELIVERY
Beginning on January 1, 2021, as permitted by regulations adopted by the Securities and Exchange Commission, paper copies of the Fund’s shareholder reports like this one will no longer be sent by mail, unless you specifically request paper copies of the reports from the Fund or from your financial intermediary, such as a broker-dealer or bank. Instead, the reports will be made available on a website, and you will be notified by mail each time a report is posted and provided with a website link to access the report.
If you already elected to receive shareholder reports electronically, you will not be affected by this change and you need not take any action. You may elect to receive shareholder reports and other communications from the Fund or your financial intermediary electronically by contacting your financial intermediary (such as a broker-dealer or bank); other shareholders may call the Fund at 1-800-341-7400, Option 4.
You may elect to receive all future reports in paper free of charge. You can inform the Fund or your financial intermediary that you wish to continue receiving paper copies of your shareholder reports by contacting your financial intermediary (such as a broker-dealer or bank); other shareholders may call the Fund at 1-800-341-7400, Option 4. Your election to receive reports in paper will apply to all funds held with the Fund complex or your financial intermediary.
Not FDIC Insured ■ May Lose Value ■ No Bank Guarantee
J. Christopher
Donahue
President
Federated Hermes MDT All Cap Core Fund
Letter from the President
Dear Valued Shareholder,
I am pleased to present the Annual Shareholder Report for your fund covering the period from August 1, 2019 through July 31, 2020.
As we all confront the unprecedented effects of the coronavirus and the challenges it presents to our families, communities, businesses and the financial markets, I want you to know that everyone at Federated Hermes is dedicated to helping you successfully navigate the markets ahead. You can count on us for the insights, investment management knowledge and client service that you have come to expect. Please refer to our website, FederatedInvestors.com, for timely updates on this and other economic and market matters.
Thank you for investing with us. I hope you find this information useful and look forward to keeping you informed.
Sincerely,
J. Christopher Donahue, President
CONTENTS
| 1 |
| 6 |
| 7 |
| 18 |
| 22 |
| 24 |
| 25 |
| 26 |
| 38 |
| 40 |
| 42 |
| 48 |
| 57 |
| 59 |
| 59 |
Management’s Discussion of Fund Performance (unaudited)
The total return of Federated Hermes MDT All Cap Core Fund (the “Fund”), based on net asset value, for the 12-month reporting period ended July 31, 2020, was 9.66% for Class A Shares, 8.86% for Class C Shares, 10.01% for Institutional Shares and 10.00% for Class R6 Shares. The total return for the Russell 3000® Index (R3000),1 the Fund’s broad-based securities market index, was 10.93% for the same period. The total return of the Morningstar Large Blend Funds Average (MLBFA),2 a peer group average for the Fund, was 7.60% during the same period. The Fund’s and MLBFA’s total returns for the most recently completed fiscal year reflected actual cash flows, transaction costs and other expenses, which were not reflected in the total return of the R3000.
During the reporting period, the Fund’s investment strategy focused on stock selection. Stock selection was the most significant factor affecting the Fund’s performance relative to the R3000 during the period.
The following discussion will focus on the performance of the Fund’s Institutional Shares relative to the R3000.
Market Overview
The twelve months of this reporting period, culminating with the COVID-19 pandemic, saw huge volatility in the domestic market. Despite the dramatic decline and recovery in the first half of 2020, the whole market R3000 was up 10.93% for the full period. However, looking more deeply at the sub-indexes revealed the wildness of the market. Large caps dominated small caps:3 the mega-cap Russell Top 200® Index4 returned 15.84%, while the Russell Midcap® Index5 returned 2.04% and the small-cap Russell 2000® Index6 returned -4.59%. In addition, once again, growth dominated value: the Russell 3000® Growth Index7 returned 28.24% while the Russell 3000® Value Index8 returned -6.67%. The largest spread between growth and value in one capitalization range this year was almost 38 percentage points: the mega-cap Russell Top 200® Growth Index9 returned 33.06% while the Russell Top 200® Value10 Index returned -4.80%.
The best performing sectors in the R3000 during the reporting period were Information Technology (37.07%), Consumer Discretionary (24.82%) and Health Care (20.14%). Underperforming sectors during the same period included Energy (-38.98%), Financials (-14.72%), Industrials (-5.82%) and Real Estate (-5.02%).
STOCK SELECTION
When looking at the Fund’s underperformance in terms of fundamental and technical characteristics during this growth-oriented period, most of the Fund’s underperformance relative to the R3000 was driven by growth-oriented stocks with neutral-to-high analyst conviction and weaker value characteristics. Good
Annual Shareholder Report
stock selection among stocks with high volatility, negative analyst conviction and depressed prices provided substantial favorable offsets. The Fund’s sector exposures continued to remain close to R3000 weights; there were no significant overweights or underweights at the end of the fiscal year. Weak stock selection in the Health Care and Consumer Discretionary sectors contributed the most to the Fund’s underperformance versus the benchmark. The largest favorable offsets were provided by strong stock selection in the Industrials and Energy sectors.
Individual stocks enhancing the Fund’s performance during the reporting period included DocuSign, Inc., Cadence Design Systems, Inc. and DXC Technology Co.
Individual stocks detracting from the Fund’s performance during the reporting period included Apple Inc., HCA Healthcare Inc. and Microsoft Corporation. Apple and Microsoft outperformed the R3000 but were underweighted by the Fund, and HCA Healthcare underperformed the R3000 and was overweighted by the Fund.
| 1 | Please see the footnotes to the line graphs below for definitions of, and further information about, the Russell 3000® Index. |
| 2 | Morningstar has assigned the Fund to the Morningstar Large Cap Value Funds Average peer group, however, the MLBFA is being used for comparison purposes. The Fund invests in both value and growth stocks and therefore the Fund’s Adviser believes that the MLBFA is more reflective of the Fund’s investment style. Please see the footnotes to the line graphs below for definitions of, and further information about, the MLBFA. |
| 3 | Small-cap stocks may be less liquid and subject to greater price volatility than large-cap stocks. |
| 4 | The Russell Top 200® Index measures the performance of the largest cap segment of the U.S. equity universe. The Russell Top 200® Index is a subset of the Russell 3000® Index. It includes approximately 200 of the largest securities based on a combination of their market cap and current index membership and represents approximately 68% of the U.S. market. The Russell Top 200® Index is constructed to provide a comprehensive and unbiased barometer for this very large cap segment and is completely reconstituted annually to ensure new and growing equities are reflected.* |
| 5 | The Russell Midcap® Index measures the performance of the mid-cap segment of the U.S. equity universe. The Russell Midcap® Index is a subset of the Russell 1000® Index. It includes approximately 800 of the smallest securities based on a combination of their market cap and current index membership. The Russell Midcap® Index represents approximately 31% of the total market capitalization of the Russell 1000® companies. The Russell Midcap® Index is constructed to provide a comprehensive and unbiased barometer for the mid-cap segment. The Russell Midcap Index is completely reconstituted annually to ensure larger stocks do not distort the performance and characteristics of the true mid-cap opportunity set.* |
| 6 | The Russell 2000® Index measures the performance of the small-cap segment of the U.S. equity universe. The Russell 2000® Index is a subset of the Russell 3000® Index representing approximately 10% of the total market capitalization of that index. It includes approximately 2000 of the smallest securities based on a combination of their market cap and current index membership. The Russell 2000® Index is constructed to provide a comprehensive and unbiased small-cap barometer and is completely reconstituted annually to ensure larger stocks do not distort the performance and characteristics of the true small-cap opportunity set.* |
Annual Shareholder Report
| 7 | The Russell 3000® Growth Index measures the performance of the broad growth segment of the U.S. equity universe. It includes those Russell 3000® Index companies with higher price-to-book ratios and higher forecasted growth values. The Russell 3000® Growth Index is constructed to provide a comprehensive, unbiased and stable barometer of the broad growth market. The Russell 3000® Growth Index is completely reconstituted annually to ensure new and growing equities are included and that the represented companies continue to reflect growth characteristics.* |
| 8 | The Russell 3000® Value Index measures the performance of the broad value segment of U.S. equity value universe. It includes those Russell 3000® Index companies with lower price-to-book ratios and lower forecasted growth values. The Russell 3000® Value Index is constructed to provide a comprehensive, unbiased and stable barometer of the broad value market. The Russell 3000® Value Index is completely reconstituted annually to ensure new and growing equities are included and that the represented companies continue to reflect value characteristics.* |
| 9 | The Russell Top 200® Growth Index measures the performance of the especially large cap segment of the U.S. equity universe represented by stocks in the largest 200 by market cap. It includes Russell Top 200® Index companies with higher growth earning potential as defined by Russell’s leading style methodology.* |
| 10 | The Russell Top 200® Value Index measures the performance of the especially large cap segment of the U.S. equity universe represented by stocks in the largest 200 by market cap. It includes Russell Top 200® Index companies with value characteristics as defined by Russell’s leading style methodology.* |
| * | The index is unmanaged, and it is not possible to invest directly in an index. |
Annual Shareholder Report
FUND PERFORMANCE AND GROWTH OF A $10,000 INVESTMENT
The graph below illustrates the hypothetical investment of $10,0001 in the Federated Hermes MDT All Cap Core Fund (the “Fund”) from July 31, 2010 to July 31, 2020, compared to the Russell 3000® Index (R3000)2 and the Morningstar Large Blend Funds Average (MLBFA).3 The Average Annual Total Return table below shows returns for each class averaged over the stated periods.
Growth of a $10,000 Investment
Growth of $10,000 as of July 31, 2020

| Federated Hermes MDT All Cap Core Fund - | Institutional Shares | Class C Shares | R3000 | MLBFA |
| F | F | I | I |
| 7/31/2010 | 10,000 | 10,000 | 10,000 | 10,000 |
| 7/31/2011 | 11,914 | 11,801 | 12,094 | 11,839 |
| 7/31/2012 | 12,180 | 11,938 | 12,980 | 12,356 |
| 7/31/2013 | 16,621 | 16,115 | 16,467 | 15,514 |
| 7/31/2014 | 19,868 | 19,056 | 19,163 | 17,899 |
| 7/31/2015 | 21,547 | 20,448 | 21,325 | 19,442 |
| 7/31/2016 | 21,473 | 20,156 | 22,273 | 19,769 |
| 7/31/2017 | 24,886 | 23,122 | 25,867 | 22,729 |
| 7/31/2018 | 30,149 | 27,725 | 30,107 | 26,057 |
| 7/31/2019 | 32,586 | 29,654 | 32,230 | 27,602 |
| 7/31/2020 | 35,847 | 32,280 | 35,752 | 29,651 |
41 graphic description end -->
| ■ | Total returns shown for the Class C Shares include the maximum contingent deferred sales charge of 1.00% as applicable. |
The Fund offers multiple share classes whose performance may be greater than or less than its other share class(es) due to differences in sales charges and expenses. See the Average Annual Total Return table below for the returns of additional classes not shown in the line graph above.
Average Annual Total Returns for the Period Ended 7/31/2020
(returns reflect all applicable sales charges and contingent deferred sales charges as specified below in footnote #1)
| | 1 Year | 5 Years | 10 Years |
| Class A Shares | 3.63% | 9.15% | 12.67% |
| Class C Shares | 7.86% | 9.56% | 12.43% |
| Institutional Shares | 10.01% | 10.72% | 13.62% |
| Class R6 Shares4 | 10.00% | 10.54% | 13.11% |
| R3000 | 10.93% | 10.89% | 13.59% |
| MLBFA | 7.60% | 9.09% | 12.04% |
Annual Shareholder Report
Performance data quoted represents past performance which is no guarantee of future results. Investment return and principal value will fluctuate so that an investor’s shares, when redeemed, may be worth more or less than their original cost. Mutual fund performance changes over time and current performance may be lower or higher than what is stated. For current to the most recent month-end performance and after-tax returns, visit FederatedInvestors.com or call 1-800-341-7400. Returns shown do not reflect the deduction of taxes that a shareholder would pay on Fund distributions or the redemption of Fund shares. Mutual funds are not obligations of or guaranteed by any bank and are not federally insured.
| 1 | Represents a hypothetical investment of $10,000 in the Fund after deducting applicable sales charges: for Class A Shares, the maximum sales charge of 5.50% ($10,000 investment minus $550 sales charge = $9,450); for Class C Shares a 1.00% contingent deferred sales charge would be applied on any redemption less than one year from the purchase date. The Fund’s performance assumes the reinvestment of all dividends and distributions. The R3000 and MLBFA have been adjusted to reflect reinvestment of dividends of securities. |
| 2 | The R3000 measures the performance of the largest 3,000 U.S. companies representing approximately 98% of the investable U.S. equity market. The R3000 is constructed to provide a comprehensive, unbiased, and stable barometer of the broad market and is completely reconstituted annually to ensure new and growing equities are reflected. The index is unmanaged and, unlike the Fund, is not affected by cash flows. It is not possible to invest directly in an index. The R3000 is not adjusted to reflect sales charges, expenses or other fees that the Securities and Exchange Commission requires to be reflected in the Fund’s performance. |
| 3 | Morningstar figures represent the average of the total returns reported by all the funds designated by Morningstar as falling into the respective category indicated. They do not reflect sales charges. The Morningstar figures in the Growth of $10,000 line graph are based on historical return information published by Morningstar and reflect the return of the funds comprising the category in the year of publication. Because the funds designated by Morningstar as falling into the category can change over time, the Morningstar figures in the line graph may not match the Morningstar figures in the Average Annual Total Returns table, which reflect the return of the funds that currently comprise the category. |
| 4 | Prior to September 1, 2016, Class R6 Shares were known as Class R Shares and included 12b-1 fees and certain other expenses. As of September 1, 2016, Class R6 does not include such 12b-1 fees and certain other expenses, and the performance shown above for Class R6 prior to September 1, 2016, reflects the higher Class R expenses. |
Annual Shareholder Report
Portfolio of Investments Summary Table (unaudited)
At July 31, 2020, the Fund’s index composition1 was as follows:
| Sector Composition | Percentage of
Total Net Assets |
| Information Technology | 27.2% |
| Health Care | 14.7% |
| Consumer Discretionary | 11.9% |
| Financials | 11.1% |
| Communication Services | 8.9% |
| Industrials | 8.1% |
| Consumer Staples | 7.3% |
| Real Estate | 3.1% |
| Materials | 2.2% |
| Energy | 2.0% |
| Utilities | 1.9% |
| Securities Lending Collateral2 | 2.0% |
| Cash Equivalents3 | 1.6% |
| Other Assets and Liabilities—Net4 | (2.0)% |
| TOTAL | 100.0% |
| 1 | Except for Cash Equivalents and Other Assets and Liabilities, sector classifications are based upon, and individual portfolio securities are assigned to, the classifications of the Global Industry Classification Standard (GICS) except that the Adviser assigns a classification to securities not classified by the GICS and to securities for which the Adviser does not have access to the classification made by the GICS. |
| 2 | Represents cash collateral received for portfolio securities on loan that may be invested in affiliated money market funds, other money market instruments and/or repurchase agreements. |
| 3 | Cash Equivalents include any investments in money market mutual funds and/or overnight repurchase agreements other than those representing cash collateral for securities lending. |
| 4 | Assets, other than investments in securities, less liabilities. See Statement of Assets and Liabilities. |
Annual Shareholder Report
Portfolio of Investments
July 31, 2020
| Shares | | | Value |
| | | COMMON STOCKS—98.4% | |
| | | Communication Services—8.9% | |
| 6,736 | | Activision Blizzard, Inc. | $556,596 |
| 9,446 | 1 | Alphabet, Inc., Class A | 14,055,176 |
| 1,681 | | Cable One, Inc. | 3,063,723 |
| 65,486 | 1 | Cars.com, Inc. | 531,746 |
| 1,575 | 1 | Charter Communications, Inc. | 913,500 |
| 45,632 | | Cogent Communications Holdings, Inc. | 4,111,900 |
| 4,832 | 1 | Facebook, Inc. | 1,225,733 |
| 43,653 | 1 | MSG Networks, Inc. | 416,013 |
| 8,771 | | Meredith Corp. | 125,952 |
| 7,046 | 1 | Netflix, Inc. | 3,444,648 |
| 88,452 | 1 | TripAdvisor, Inc. | 1,789,384 |
| 31,860 | | Verizon Communications, Inc. | 1,831,313 |
| | | TOTAL | 32,065,684 |
| | | Consumer Discretionary—11.9% | |
| 3,295 | 1 | Amazon.com, Inc. | 10,427,621 |
| 1,207 | 1 | AutoZone, Inc. | 1,457,356 |
| 23,311 | 1 | Cooper-Standard Holding, Inc. | 249,661 |
| 3,294 | | Dollar General Corp. | 627,178 |
| 18,524 | | Domino’s Pizza, Inc. | 7,161,564 |
| 49,006 | | eBay, Inc. | 2,709,052 |
| 8,335 | 1 | Etsy, Inc. | 986,697 |
| 35,900 | | Ford Motor Co. | 237,299 |
| 11,350 | | Garmin Ltd. | 1,118,996 |
| 53,197 | | Goodyear Tire & Rubber Co. | 479,305 |
| 11,512 | | Home Depot, Inc. | 3,056,321 |
| 2,328 | 1 | iRobot Corp. | 169,222 |
| 21,003 | | Lowe’s Cos., Inc. | 3,127,557 |
| 1,349 | 1 | Lululemon Athletica Inc. | 439,221 |
| 279,331 | 2 | Macy’s, Inc. | 1,692,746 |
| 2,166 | | McDonald’s Corp. | 420,810 |
| 11,173 | 1 | Mohawk Industries, Inc. | 892,164 |
| 839 | 1 | O’Reilly Automotive, Inc. | 400,522 |
| 13,302 | | PVH Corp. | 647,275 |
| 4,868 | 1 | Ulta Beauty, Inc. | 939,475 |
| 6,428 | 1,2 | Wayfair, Inc. | 1,710,426 |
Annual Shareholder Report
| Shares | | | Value |
| | | COMMON STOCKS—continued | |
| | | Consumer Discretionary—continued | |
| 23,237 | | Wingstop, Inc. | $3,630,781 |
| 7,652 | | Yum! Brands, Inc. | 696,715 |
| | | TOTAL | 43,277,964 |
| | | Consumer Staples—7.3% | |
| 39,144 | 1 | BJ’s Wholesale Club Holdings, Inc. | 1,567,717 |
| 10,550 | | Church and Dwight, Inc. | 1,016,282 |
| 18,027 | | Clorox Co. | 4,263,566 |
| 90,965 | | Colgate-Palmolive Co. | 7,022,498 |
| 8,897 | | Costco Wholesale Corp. | 2,896,240 |
| 4,201 | | Hershey Foods Corp. | 610,867 |
| 41,919 | | Kimberly-Clark Corp. | 6,373,365 |
| 12,071 | | Molson Coors Beverage Company, Class B | 452,904 |
| 8,885 | | PepsiCo, Inc. | 1,223,109 |
| 7,872 | | Philip Morris International, Inc. | 604,648 |
| 2,887 | | Procter & Gamble Co. | 378,544 |
| 7,963 | 1 | Sprouts Farmers Market, Inc. | 210,064 |
| | | TOTAL | 26,619,804 |
| | | Energy—2.0% | |
| 18,060 | | Arch Resources, Inc. | 560,221 |
| 13,529 | | CVR Energy, Inc. | 259,757 |
| 17,923 | | Cimarex Energy Co. | 438,396 |
| 29,353 | | Concho Resources, Inc. | 1,542,207 |
| 34,012 | 2 | Continental Resources, Inc. | 588,067 |
| 75,701 | | Devon Energy Corp. | 794,103 |
| 6,580 | | EOG Resources, Inc. | 308,273 |
| 22,259 | | Helmerich & Payne, Inc. | 396,878 |
| 63,055 | | Marathon Oil Corp. | 346,172 |
| 54,577 | | PBF Energy, Inc. | 473,728 |
| 77,330 | | Peabody Energy Corp. | 241,270 |
| 16,289 | | Phillips 66 | 1,010,244 |
| 4,307 | | Valero Energy Corp. | 242,183 |
| | | TOTAL | 7,201,499 |
| | | Financials—11.1% | |
| 26,190 | | Aflac, Inc. | 931,578 |
| 1,846 | | Alleghany Corp. | 964,203 |
| 51,160 | | Allstate Corp. | 4,828,993 |
| 3,358 | | Ameriprise Financial, Inc. | 515,890 |
| 3,925 | | Bank of New York Mellon Corp. | 140,711 |
Annual Shareholder Report
| Shares | | | Value |
| | | COMMON STOCKS—continued | |
| | | Financials—continued | |
| 2,734 | | BlackRock, Inc. | $1,572,077 |
| 5,374 | | Chubb Ltd. | 683,788 |
| 50,325 | | Cincinnati Financial Corp. | 3,921,827 |
| 10,919 | | Globe Life, Inc. | 869,152 |
| 18,837 | | Huntington Bancshares, Inc. | 174,619 |
| 39,755 | | Intercontinental Exchange, Inc. | 3,847,489 |
| 12,533 | | MSCI, Inc., Class A | 4,712,157 |
| 3,517 | | Marketaxess Holdings, Inc. | 1,817,234 |
| 35,165 | | MetLife, Inc. | 1,330,995 |
| 12,553 | | NASDAQ, Inc. | 1,648,335 |
| 17,833 | | Northern Trust Corp. | 1,397,216 |
| 36,514 | | Prudential Financial, Inc. | 2,313,892 |
| 5,557 | | State Street Corp. | 354,481 |
| 60,065 | | The Travelers Cos., Inc. | 6,872,637 |
| 41,094 | | Zions Bancorporation, N.A. | 1,334,322 |
| | | TOTAL | 40,231,596 |
| | | Health Care—14.7% | |
| 5,393 | | Abbott Laboratories | 542,751 |
| 15,510 | 1 | Alexion Pharmaceuticals, Inc. | 1,589,620 |
| 13,220 | 1 | Allogene Therapeutics, Inc. | 484,777 |
| 21,475 | | Amgen, Inc. | 5,254,288 |
| 42,294 | 1 | AnaptysBio, Inc. | 759,600 |
| 3,511 | | Anthem, Inc. | 961,312 |
| 10,896 | 1 | Arvinas, Inc. | 343,224 |
| 13,746 | 1 | Biogen, Inc. | 3,775,889 |
| 5,794 | 1 | Biohaven Pharmaceutical Holding Co. Ltd. | 371,048 |
| 4,875 | | CIGNA Corp. | 841,864 |
| 15,619 | | CVS Health Corp. | 983,060 |
| 12,175 | 1 | Constellation Pharmaceuticals, Inc. | 327,386 |
| 761 | | Cooper Cos., Inc. | 215,310 |
| 11,942 | 1 | Davita, Inc. | 1,043,611 |
| 12,300 | | Dentsply Sirona, Inc. | 548,580 |
| 24,860 | | Eli Lilly & Co. | 3,736,209 |
| 6,572 | | Gilead Sciences, Inc. | 456,951 |
| 27,024 | 1 | Hologic, Inc. | 1,885,735 |
| 6,863 | | Humana, Inc. | 2,693,384 |
| 5,623 | 1 | IDEXX Laboratories, Inc. | 2,236,548 |
| 10,787 | 1 | Jazz Pharmaceuticals PLC. | 1,167,693 |
Annual Shareholder Report
| Shares | | | Value |
| | | COMMON STOCKS—continued | |
| | | Health Care—continued | |
| 21,860 | | Johnson & Johnson | $3,186,314 |
| 5,111 | 1 | Kiniksa Pharmaceuticals Ltd. | 99,767 |
| 17,448 | 1,2 | Livongo Health, Inc. | 2,220,258 |
| 40,449 | | Merck & Co., Inc. | 3,245,628 |
| 1,140 | 1 | Molina Healthcare, Inc. | 210,558 |
| 37,635 | 1 | Myriad Genetics, Inc. | 454,254 |
| 10,820 | 1 | NextCure, Inc. | 96,514 |
| 16,307 | 1 | SAGE Therapeutics, Inc. | 743,110 |
| 6,497 | 1 | United Therapeutics Corp. | 724,221 |
| 528 | | UnitedHealth Group, Inc. | 159,868 |
| 15,141 | 1 | Vertex Pharmaceuticals, Inc. | 4,118,352 |
| 17,111 | 1 | Waters Corp. | 3,647,210 |
| 26,259 | | Zoetis, Inc. | 3,982,965 |
| | | TOTAL | 53,107,859 |
| | | Industrials—8.1% | |
| 12,481 | | AGCO Corp. | 819,128 |
| 18,699 | 1 | Astronics Corp. | 162,681 |
| 2,914 | | Brinks Co. (The) | 129,236 |
| 28,412 | 1 | CIRCOR International, Inc. | 744,963 |
| 8,310 | | Curtiss Wright Corp. | 740,587 |
| 14,768 | | Flowserve Corp. | 411,584 |
| 63,132 | | Fluor Corp. | 643,315 |
| 16,850 | | Hexcel Corp. | 628,505 |
| 6,124 | | Hubbell, Inc. | 826,556 |
| 9,617 | | Huntington Ingalls Industries, Inc. | 1,670,569 |
| 418,872 | | KAR Auction Services, Inc. | 6,337,533 |
| 7,589 | | Lockheed Martin Corp. | 2,876,003 |
| 6,024 | | Masco Corp. | 344,332 |
| 16,823 | | Republic Services, Inc. | 1,467,807 |
| 11,956 | | SPX Corp. | 502,152 |
| 179,048 | | Spirit AeroSystems Holdings, Inc., Class A | 3,503,969 |
| 4,755 | | Textron, Inc. | 166,140 |
| 3,166 | | TransUnion | 283,579 |
| 29,251 | | Verisk Analytics, Inc. | 5,519,956 |
| 1,937 | | W.W. Grainger, Inc. | 661,544 |
| 12,821 | | Xylem, Inc. | 935,677 |
| | | TOTAL | 29,375,816 |
Annual Shareholder Report
| Shares | | | Value |
| | | COMMON STOCKS—continued | |
| | | Information Technology—27.2% | |
| 11,820 | 1 | Adobe, Inc. | $5,251,862 |
| 12,822 | | Alliance Data Systems Corp. | 568,784 |
| 8,643 | | Analog Devices, Inc. | 992,649 |
| 23,374 | | Apple, Inc. | 9,934,885 |
| 29,417 | | Applied Materials, Inc. | 1,892,396 |
| 964 | 1 | Arista Networks, Inc. | 250,418 |
| 8,473 | 1 | Autodesk, Inc. | 2,003,271 |
| 5,427 | | Automatic Data Processing, Inc. | 721,303 |
| 26,936 | | Booz Allen Hamilton Holding Corp. | 2,202,287 |
| 8,092 | | Broadcom, Inc. | 2,563,141 |
| 76,462 | 1 | Cadence Design Systems, Inc. | 8,353,474 |
| 24,778 | 1 | Cirrus Logic, Inc. | 1,698,036 |
| 1,177 | | Citrix Systems, Inc. | 168,029 |
| 5,464 | | Cognizant Technology Solutions Corp. | 373,300 |
| 12,774 | 1 | Crowdstrike Holdings, Inc. | 1,446,017 |
| 404,865 | | DXC Technology Co. | 7,251,132 |
| 37,545 | 1 | DocuSign, Inc. | 8,140,882 |
| 35,888 | 1 | Dynatrace Holdings LLC | 1,501,195 |
| 3,537 | 1 | FleetCor Technologies Inc. | 914,562 |
| 6,311 | 1 | Fortinet Inc. | 872,811 |
| 2,558 | | Henry Jack & Associates, Inc. | 456,091 |
| 35,311 | 1 | Inphi Corp. | 4,613,735 |
| 46,303 | | Intel Corp. | 2,210,042 |
| 3,181 | | Intuit, Inc. | 974,563 |
| 17,400 | 1 | Keysight Technologies, Inc. | 1,738,086 |
| 4,878 | | Leidos Holdings, Inc. | 464,191 |
| 5,562 | | Mastercard, Inc. | 1,716,044 |
| 45,610 | | Microsoft Corp. | 9,350,506 |
| 7,153 | | NVIDIA Corp. | 3,037,092 |
| 1,460 | 1 | Okta, Inc. | 322,631 |
| 10,749 | | Oracle Corp. | 596,032 |
| 26,993 | | Paychex, Inc. | 1,941,337 |
| 18,981 | 1 | PayPal Holdings, Inc. | 3,721,605 |
| 49,135 | | Plantronics, Inc. | 982,209 |
| 47,231 | | Qualcomm, Inc. | 4,988,066 |
| 104,452 | | Sabre Corp. | 789,657 |
| 2,826 | 1 | Semtech Corp. | 157,493 |
| 9,888 | 1 | Synopsys, Inc. | 1,969,887 |
Annual Shareholder Report
| Shares | | | Value |
| | | COMMON STOCKS—continued | |
| | | Information Technology—continued | |
| 30,450 | | Xerox Holdings Corp. | $506,993 |
| 1,428 | | Xilinx, Inc. | 153,296 |
| 468 | 1 | Zoom Video Communications, Inc. | 118,830 |
| 4,484 | 1 | Zscaler, Inc. | 582,247 |
| | | TOTAL | 98,491,067 |
| | | Materials—2.2% | |
| 83,199 | 1 | Alcoa Corp. | 1,081,587 |
| 52,754 | 1 | Allegheny Technologies, Inc. | 458,432 |
| 5,404 | 1 | Berry Global Group, Inc. | 270,146 |
| 149,740 | | Chemours Co./The | 2,774,682 |
| 44,257 | | Domtar, Corp. | 928,954 |
| 2,213 | | Eastman Chemical Co. | 165,156 |
| 5,939 | 1 | Ingevity Corp. | 347,313 |
| 2,939 | | Linde PLC | 720,378 |
| 1,214 | | Martin Marietta Materials | 251,517 |
| 8,212 | | PPG Industries, Inc. | 884,022 |
| | | TOTAL | 7,882,187 |
| | | Real Estate—3.1% | |
| 6,129 | | American Tower Corp. | 1,602,060 |
| 8,174 | | Coresite Realty Corp. | 1,054,855 |
| 2,094 | | Crown Castle International Corp. | 349,070 |
| 1,975 | | Equity Residential Properties Trust | 105,919 |
| 170,221 | 2 | Macerich Co. (The) | 1,298,786 |
| 17,806 | | SBA Communications, Corp. | 5,547,281 |
| 27,290 | | SL Green Realty Corp. | 1,268,985 |
| | | TOTAL | 11,226,956 |
| | | Utilities—1.9% | |
| 13,357 | | Consolidated Edison Co. | 1,026,218 |
| 47,068 | | Exelon Corp. | 1,817,296 |
| 11,434 | | NiSource, Inc. | 279,561 |
| 44,479 | | OGE Energy Corp. | 1,463,359 |
| 2,553 | | Pinnacle West Capital Corp. | 212,103 |
| 21,917 | | Public Service Enterprises Group, Inc. | 1,226,037 |
| 53,804 | | Vistra Corp. | 1,003,983 |
| | | TOTAL | 7,028,557 |
| | | TOTAL COMMON STOCKS
(IDENTIFIED COST $304,208,026) | 356,508,989 |
Annual Shareholder Report
| Shares | | | Value |
| | | INVESTMENT COMPANIES—3.6% | |
| 7,296,777 | | Federated Hermes Government Obligations Fund, Premier Shares, 0.10%3 | $7,296,777 |
| 5,676,078 | | Federated Hermes Institutional Prime Value Obligations Fund, Institutional Shares, 0.21%3 | 5,679,483 |
| | | TOTAL INVESTMENT COMPANIES
(IDENTIFIED COST $12,976,781) | 12,976,260 |
| | | TOTAL INVESTMENT IN SECURITIES—102.0%
(IDENTIFIED COST $317,184,807)4 | 369,485,249 |
| | | OTHER ASSETS AND LIABILITIES - NET—(2.0)%5 | (7,092,899) |
| | | TOTAL NET ASSETS—100% | $362,392,350 |
Annual Shareholder Report
[PAGE INTENTIONALLY LEFT BLANK]
Annual Shareholder Report
An affiliated company is a company in which the Fund, alone or in combination with other funds, has ownership of at least 5% of the voting shares. Transactions with affiliated companies during the period ended July 31, 2020, were as follows:
| | Balance of
Shares
Held
7/31/2019 | Purchases/
Additions* | Sales/
Reductions* |
| Consumer Discretionary: | | | |
| Wingstop, Inc. | — | 23,237 | — |
| Health Care: | | | |
| AnaptysBio, Inc. | — | 42,294 | — |
| Affiliated Issuers no longer in the portfolio at period end | — | 2,706 | (2,706) |
| TOTAL OF AFFILIATED TRANSACTIONS | — | 68,237 | (2,706) |
Annual Shareholder Report
Balance of
Shares
Held
7/31/2020 | Value | Change in
Unrealized
Appreciation/
Depreciation | Net
Realized
Gain/(Loss)* | Dividend
Income* |
| | | | | |
| 23,237 | $3,630,781 | $786,286 | $— | $2,285 |
| | | | | |
| 42,294 | $759,600 | $(35,545) | $— | $— |
| — | $— | $— | $12,433 | $— |
| 65,531 | $4,390,381 | $750,741 | $12,433 | $2,285 |
| * | A portion of the amount shown was recorded when the Fund no longer had ownership of at least 5% of the voting shares. |
Affiliated fund holdings are investment companies which are managed by the Adviser or an affiliate of the Adviser. Transactions with affiliated fund holdings during the period ended July 31, 2020, were as follows:
| | Federated Hermes
Government
Obligations Fund,
Premier Shares* | Federated Hermes
Institutional
Prime Value
Obligations Fund,
Institutional Shares | Total of
Affiliated
Transactions |
| Balance of Shares Held 7/31/2019 | 491,528 | 7,701,438 | 8,192,966 |
| Purchases/Additions | 65,245,765 | 115,156,178 | 180,401,943 |
| Sales/Reductions | (58,440,516) | (117,181,538) | (175,622,054) |
| Balance of Shares Held 7/31/2020 | 7,296,777 | 5,676,078 | 12,972,855 |
| Value | $7,296,777 | $5,679,483 | $12,976,260 |
| Change in Unrealized Appreciation/Depreciation | N/A | $(521) | $(521) |
| Net Realized Gain/(Loss) | N/A | $2,184 | $2,184 |
| Dividend Income | $23,627 | $63,183 | $86,810 |
| * | All or a portion of the balance/activity for the fund relates to cash collateral received on securities lending transactions. |
| 1 | Non-income-producing security. |
| 2 | All or a portion of these securities are temporarily on loan to unaffiliated broker/dealers. |
| 3 | 7-day net yield. |
| 4 | The cost of investments for federal tax purposes amounts to $317,751,065. |
| 5 | Assets, other than investments in securities, less liabilities. See Statement of Assets and Liabilities. |
Note: The categories of investments are shown as a percentage of total net assets at July 31, 2020.
Annual Shareholder Report
Various inputs are used in determining the value of the Fund’s investments. These inputs are summarized in the three broad levels listed below:
Level 1—quoted prices in active markets for identical securities.
Level 2—other significant observable inputs (including quoted prices for similar securities, interest rates, prepayment speeds, credit risk, etc.). Also includes securities valued at amortized cost.
Level 3—significant unobservable inputs (including the Fund’s own assumptions in determining the fair value of investments).
The inputs or methodology used for valuing securities are not an indication of the risk associated with investing in those securities.
As of July 31, 2020, all investments of the Fund utilized Level 1 inputs in valuing the Fund’s assets carried at fair value.
See Notes which are an integral part of the Financial Statements
Annual Shareholder Report
Financial Highlights–Class A Shares
(For a Share Outstanding Throughout Each Period)
| Year Ended July 31 | 2020 | 2019 | 2018 | 2017 | 2016 |
| Net Asset Value, Beginning of Period | $29.90 | $30.01 | $24.95 | $21.77 | $22.10 |
| Income From Investment Operations: | | | | | |
| Net investment income | 0.131 | 0.161 | 0.091 | 0.26 | 0.191 |
| Net realized and unrealized gain (loss) | 2.69 | 1.81 | 5.08 | 3.11 | (0.33) |
| TOTAL FROM INVESTMENT OPERATIONS | 2.82 | 1.97 | 5.17 | 3.37 | (0.14) |
| Less Distributions: | | | | | |
| Distributions from net investment income | (0.11) | (0.07) | (0.11) | (0.19) | (0.19) |
| Distributions from net realized gain | (0.84) | (2.01) | — | — | — |
| TOTAL DISTRIBUTIONS | (0.95) | (2.08) | (0.11) | (0.19) | (0.19) |
| Net Asset Value, End of Period | $31.77 | $29.90 | $30.01 | $24.95 | $21.77 |
| Total Return2 | 9.66% | 7.80% | 20.78% | 15.56% | (0.61)% |
| Ratios to Average Net Assets: | | | | | |
| Net expenses3 | 1.04% | 1.08% | 1.36% | 1.38% | 1.35% |
| Net investment income | 0.44% | 0.57% | 0.31% | 0.69% | 0.94% |
| Expense waiver/reimbursement4 | 0.20% | 0.24% | 0.00%5 | 0.00%5 | 0.03% |
| Supplemental Data: | | | | | |
| Net assets, end of period (000 omitted) | $79,301 | $69,221 | $40,539 | $33,799 | $33,753 |
| Portfolio turnover | 160% | 87% | 82% | 77% | 62% |
| 1 | Per share numbers have been calculated using the average shares method. |
| 2 | Based on net asset value, which does not reflect the sales charge, redemption fee or contingent deferred sales charge, if applicable. |
| 3 | Amount does not reflect net expenses incurred by investment companies in which the Fund may invest. |
| 4 | This expense decrease is reflected in both the net expense and the net investment income ratios shown above. Amount does not reflect expense waiver/reimbursement recorded by investment companies in which the Fund may invest. |
| 5 | Represents less than 0.01%. |
See Notes which are an integral part of the Financial Statements
Annual Shareholder Report
Financial Highlights–Class C Shares
(For a Share Outstanding Throughout Each Period)
| Year Ended July 31 | 2020 | 2019 | 2018 | 2017 | 2016 |
| Net Asset Value, Beginning of Period | $27.99 | $28.37 | $23.66 | $20.66 | $21.00 |
| Income From Investment Operations: | | | | | |
| Net investment income (loss) | (0.08)1 | (0.05)1 | (0.11)1 | (0.19) | 0.031 |
| Net realized and unrealized gain (loss) | 2.50 | 1.68 | 4.82 | 3.23 | (0.33) |
| TOTAL FROM INVESTMENT OPERATIONS | 2.42 | 1.63 | 4.71 | 3.04 | (0.30) |
| Less Distributions: | | | | | |
| Distributions from net investment income | — | — | — | (0.04) | (0.04) |
| Distributions from net realized gain | (0.84) | (2.01) | — | — | — |
| TOTAL DISTRIBUTIONS | (0.84) | (2.01) | — | (0.04) | (0.04) |
| Net Asset Value, End of Period | $29.57 | $27.99 | $28.37 | $23.66 | $20.66 |
| Total Return2 | 8.86% | 6.96% | 19.91% | 14.72% | (1.43)% |
| Ratios to Average Net Assets: | | | | | |
| Net expenses3 | 1.79% | 1.85% | 2.09% | 2.13% | 2.14% |
| Net investment income (loss) | (0.31)% | (0.20)% | (0.41)% | (0.06)% | 0.15% |
| Expense waiver/reimbursement4 | 0.21% | 0.24% | 0.00%5 | 0.00%5 | 0.00%5 |
| Supplemental Data: | | | | | |
| Net assets, end of period (000 omitted) | $31,030 | $32,178 | $39,625 | $36,440 | $36,846 |
| Portfolio turnover | 160% | 87% | 82% | 77% | 62% |
| 1 | Per share numbers have been calculated using the average shares method. |
| 2 | Based on net asset value, which does not reflect the sales charge, redemption fee or contingent deferred sales charge, if applicable. |
| 3 | Amount does not reflect net expenses incurred by investment companies in which the Fund may invest. |
| 4 | This expense decrease is reflected in both the net expense and the net investment income (loss) ratios shown above. Amount does not reflect expense waiver/reimbursement recorded by investment companies in which the Fund may invest. |
| 5 | Represents less than 0.01%. |
See Notes which are an integral part of the Financial Statements
Annual Shareholder Report
Financial Highlights–Institutional Shares
(For a Share Outstanding Throughout Each Period)
| Year Ended July 31 | 2020 | 2019 | 2018 | 2017 | 2016 |
| Net Asset Value, Beginning of Period | $30.29 | $30.37 | $25.24 | $22.02 | $22.37 |
| Income From Investment Operations: | | | | | |
| Net investment income | 0.221 | 0.251 | 0.161 | 0.39 | 0.251 |
| Net realized and unrealized gain (loss) | 2.74 | 1.81 | 5.16 | 3.09 | (0.34) |
| TOTAL FROM INVESTMENT OPERATIONS | 2.96 | 2.06 | 5.32 | 3.48 | (0.09) |
| Less Distributions: | | | | | |
| Distributions from net investment income | (0.19) | (0.13) | (0.19) | (0.26) | (0.26) |
| Distributions from net realized gain | (0.84) | (2.01) | — | — | — |
| TOTAL DISTRIBUTIONS | (1.03) | (2.14) | (0.19) | (0.26) | (0.26) |
| Net Asset Value, End of Period | $32.22 | $30.29 | $30.37 | $25.24 | $22.02 |
| Total Return2 | 10.01% | 8.08% | 21.15% | 15.90% | (0.34)% |
| Ratios to Average Net Assets: | | | | | |
| Net expenses3 | 0.74% | 0.78% | 1.07% | 1.08% | 1.07% |
| Net investment income | 0.73% | 0.87% | 0.57% | 1.01% | 1.22% |
| Expense waiver/reimbursement4 | 0.25% | 0.29% | 0.00%5 | 0.00%5 | 0.00%5 |
| Supplemental Data: | | | | | |
| Net assets, end of period (000 omitted) | $243,490 | $215,799 | $95,290 | $52,169 | $65,435 |
| Portfolio turnover | 160% | 87% | 82% | 77% | 62% |
| 1 | Per share numbers have been calculated using the average shares method. |
| 2 | Based on net asset value. |
| 3 | Amount does not reflect net expenses incurred by investment companies in which the Fund may invest. |
| 4 | This expense decrease is reflected in both the net expense and the net investment income ratios shown above. Amount does not reflect expense waiver/reimbursement recorded by investment companies in which the Fund may invest. |
| 5 | Represents less than 0.01%. |
See Notes which are an integral part of the Financial Statements
Annual Shareholder Report
Financial Highlights–Class R6 Shares1
(For a Share Outstanding Throughout Each Period)
| Year Ended July 31 | 2020 | 2019 | 2018 | 2017 | 2016 |
| Net Asset Value, Beginning of Period | $29.75 | $29.89 | $24.85 | $21.46 | $21.80 |
| Income From Investment Operations: | | | | | |
| Net investment income | 0.212 | 0.232 | 0.182 | 0.21 | 0.102 |
| Net realized and unrealized gain (loss) | 2.69 | 1.79 | 5.06 | 3.18 | (0.33) |
| TOTAL FROM INVESTMENT OPERATIONS | 2.90 | 2.02 | 5.24 | 3.39 | (0.23) |
| Less Distributions: | | | | | |
| Distributions from net investment income | (0.19) | (0.15) | (0.20) | — | (0.11) |
| Distributions from net realized gain | (0.84) | (2.01) | — | — | — |
| TOTAL DISTRIBUTIONS | (1.03) | (2.16) | (0.20) | — | (0.11) |
| Net Asset Value, End of Period | $31.62 | $29.75 | $29.89 | $24.85 | $21.46 |
| Total Return3 | 10.00% | 8.08% | 21.17% | 15.80% | (1.05)% |
| Ratios to Average Net Assets: | | | | | |
| Net expenses4 | 0.73% | 0.81% | 1.02% | 1.07% | 1.80% |
| Net investment income | 0.75% | 0.78% | 0.65% | 0.95% | 0.49% |
| Expense waiver/reimbursement5 | 0.17% | 0.18% | 0.00%6 | 0.00%6 | 0.00%6 |
| Supplemental Data: | | | | | |
| Net assets, end of period (000 omitted) | $8,571 | $9,183 | $20,425 | $17,363 | $5,717 |
| Portfolio turnover | 160% | 87% | 82% | 77% | 62% |
| 1 | Prior to September 1, 2016, the Fund’s Class R6 Shares were designated as Class R Shares. |
| 2 | Per share numbers have been calculated using the average shares method. |
| 3 | Based on net asset value. |
| 4 | Amount does not reflect net expenses incurred by investment companies in which the Fund may invest. |
| 5 | This expense decrease is reflected in both the net expense and the net investment income ratios shown above. Amount does not reflect expense waiver/reimbursement recorded by investment companies in which the Fund may invest. |
| 6 | Represents less than 0.01%. |
See Notes which are an integral part of the Financial Statements
Annual Shareholder Report
Statement of Assets and Liabilities
July 31, 2020
| Assets: | | |
| Investment in securities, at value including $7,071,666 of securities loaned and $12,976,260 of investment in affiliated holdings* (identified cost $317,184,807) | | $369,485,249 |
| Income receivable | | 148,595 |
| Income receivable from affiliated holdings* | | 1,223 |
| Receivable for investments sold | | 745,012 |
| Receivable for shares sold | | 501,589 |
| TOTAL ASSETS | | 370,881,668 |
| Liabilities: | | |
| Payable for investments purchased | $426,963 | |
| Payable for shares redeemed | 544,952 | |
| Payable for collateral due to broker for securities lending | 7,296,777 | |
| Payable for investment adviser fee (Note 5) | 5,258 | |
| Payable for administrative fees (Note 5) | 768 | |
| Payable for distribution services fee (Note 5) | 19,634 | |
| Payable for other service fees (Notes 2 and 5) | 26,394 | |
| Accrued expenses (Note 5) | 168,572 | |
| TOTAL LIABILITIES | | 8,489,318 |
| Net assets for 11,373,676 shares outstanding | | $362,392,350 |
| Net Assets Consist of: | | |
| Paid-in capital | | $310,413,862 |
| Total distributable earnings (loss) | | 51,978,488 |
| TOTAL NET ASSETS | | $362,392,350 |
Annual Shareholder Report
Statement of Assets and Liabilities–continued
| Net Asset Value, Offering Price and Redemption Proceeds Per Share | | |
| Class A Shares: | | |
Net asset value per share ($79,300,807 ÷ 2,496,434 shares
outstanding), no par value, unlimited shares authorized | | $31.77 |
| Offering price per share (100/94.50 of $31.77) | | $33.62 |
| Redemption proceeds per share | | $31.77 |
| Class C Shares: | | |
Net asset value per share ($31,030,373 ÷ 1,049,329 shares
outstanding), no par value, unlimited shares authorized | | $29.57 |
| Offering price per share | | $29.57 |
| Redemption proceeds per share (99.00/100 of $29.57) | | $29.27 |
| Institutional Shares: | | |
Net asset value per share ($243,489,953 ÷ 7,556,849 shares
outstanding), no par value, unlimited shares authorized | | $32.22 |
| Offering price per share | | $32.22 |
| Redemption proceeds per share | | $32.22 |
| Class R6 Shares: | | |
Net asset value per share ($8,571,217 ÷ 271,064 shares
outstanding), no par value, unlimited shares authorized | | $31.62 |
| Offering price per share | | $31.62 |
| Redemption proceeds per share | | $31.62 |
| * | See information listed after the Fund’s Portfolio of Investments. |
See Notes which are an integral part of the Financial Statements
Annual Shareholder Report
Statement of Operations
Year Ended July 31, 2020
| Investment Income: | | | |
| Dividends (including $63,183 received from an affiliated holding* and net of foreign taxes withheld of $3,131) | | | $4,762,832 |
| Net income on securities loaned (includes $23,627 earned from an affiliated holding* related to cash collateral balances*) (Note 2) | | | 76,235 |
| TOTAL INCOME | | | 4,839,067 |
| Expenses: | | | |
| Investment adviser fee (Note 5) | | $2,288,899 | |
| Administrative fee (Note 5) | | 258,696 | |
| Custodian fees | | 45,060 | |
| Transfer agent fee (Note 2) | | 347,224 | |
| Directors’/Trustees’ fees (Note 5) | | 3,142 | |
| Auditing fees | | 27,701 | |
| Legal fees | | 7,722 | |
| Portfolio accounting fees | | 116,894 | |
| Distribution services fee (Note 5) | | 232,902 | |
| Other service fees (Notes 2 and 5) | | 261,052 | |
| Share registration costs | | 87,026 | |
| Printing and postage | | 38,832 | |
| Miscellaneous (Note 5) | | 30,546 | |
| TOTAL EXPENSES | | 3,745,696 | |
| Waiver and Reimbursements: | | | |
| Waiver/reimbursement of investment adviser fee (Note 5) | $(564,352) | | |
| Reimbursement of other operating expenses (Notes 2 and 5) | (200,652) | | |
| TOTAL REIMBURSEMENTS | | (765,004) | |
| Net expenses | | | 2,980,692 |
| Net investment income | | | 1,858,375 |
| Realized and Unrealized Gain (Loss) on Investments: | | | |
| Net realized gain on investments (including net realized gain of $2,184 on sales of investments in an affiliated holding*) | | | 3,253,617 |
| Net change in unrealized appreciation of investments (including net change in unrealized depreciation of $(521) on investments in an affiliated holding*) | | | 24,231,474 |
| Net realized and unrealized gain on investments | | | 27,485,091 |
| Change in net assets resulting from operations | | | $29,343,466 |
| * | See information listed after the Fund’s Portfolio of Investments. |
See Notes which are an integral part of the Financial Statements
Annual Shareholder Report
Statement of Changes in Net Assets
| Year Ended July 31 | 2020 | 2019 |
| Increase (Decrease) in Net Assets | | |
| Operations: | | |
| Net investment income | $1,858,375 | $1,799,509 |
| Net realized gain | 3,253,617 | 12,196,355 |
| Net change in unrealized appreciation/depreciation | 24,231,474 | 7,975,426 |
| CHANGE IN NET ASSETS RESULTING FROM OPERATIONS | 29,343,466 | 21,971,290 |
| Distributions to Shareholders: | | |
| Class A Shares | (2,420,345) | (3,882,027) |
| Class C Shares | (981,926) | (1,891,738) |
| Institutional Shares | (7,530,512) | (12,178,410) |
| Class R6 Shares | (293,094) | (604,361) |
| CHANGE IN NET ASSETS RESULTING FROM DISTRIBUTIONS TO SHAREHOLDERS | (11,225,877) | (18,556,536) |
| Share Transactions: | | |
| Proceeds from sale of shares | 138,101,946 | 256,926,172 |
| Proceeds from shares issued in connection with the tax-free transfer of assets from PNC Multi-Factor All Cap Fund | 4,799,602 | — |
| Net asset value of shares issued to shareholders in payment of distributions declared | 10,177,441 | 17,409,881 |
| Cost of shares redeemed | (135,185,593) | (147,248,399) |
| CHANGE IN NET ASSETS RESULTING FROM SHARE TRANSACTIONS | 17,893,396 | 127,087,654 |
| Change in net assets | 36,010,985 | 130,502,408 |
| Net Assets: | | |
| Beginning of period | 326,381,365 | 195,878,957 |
| End of period | $362,392,350 | $326,381,365 |
See Notes which are an integral part of the Financial Statements
Annual Shareholder Report
Notes to Financial Statements
July 31, 2020
1. ORGANIZATION
Federated Hermes MDT Series (the “Trust”) is registered under the Investment Company Act of 1940, as amended (the “Act”), as an open-end management investment company. The Trust consists of five portfolios. The financial statements included herein are only those of Federated Hermes MDT All Cap Core Fund (the “Fund”), a diversified portfolio. The financial statements of the other portfolios are presented separately. The assets of each portfolio are segregated and a shareholder’s interest is limited to the portfolio in which shares are held. Each portfolio pays its own expenses. The Fund offers four classes of shares: Class A Shares, Class C Shares, Institutional Shares and Class R6 Shares. All shares of the Fund have equal rights with respect to voting, except on class-specific matters. The investment objective of the Fund is long-term capital appreciation.
On March 30, 2017, the Fund’s T Share class became effective with the Securities and Exchange Commission (SEC), but is not yet offered for sale.
On November 15, 2019, the Fund acquired all of the net assets of PNC Multi-Factor All Cap Fund (the “Acquired Fund”), an open-end investment company, in a tax-free reorganization in exchange for shares of the Fund pursuant to a plan of reorganization approved by the Acquired Fund’s shareholders on November 5, 2019. The purpose of the transaction was to combine two portfolios with comparable investment objectives and strategies. For financial reporting purposes, the assets received and the shares issued by the Fund were recorded at fair value; however, the cost basis of the investments received from the Acquired Fund was carried forward to align ongoing reporting of the Fund’s realized gains and losses with amounts distributable to shareholders for tax purposes.
For every one share of the Acquired Fund’s Class A Shares exchanged, a shareholder received 0.707 shares of the Fund’s Class A Shares.
For every one share of the Acquired Fund’s Class C Shares exchanged, a shareholder received 0.692 shares of the Fund’s Class C Shares.
For every one share of the Acquired Fund’s Class I Shares exchanged, a shareholder received 0.714 shares of the Fund’s Institutional Shares.
The Fund received net assets from the Acquired Fund as the result of the tax-free reorganization as follows:
Shares of the
Fund Issued | Acquired Fund’s
Net Assets
Received | Unrealized
Depreciation1 | Net Assets
of the Fund
Immediately
Prior to
Combination | Net Assets
of the Fund
Immediately
After
Combination |
| 158,091 | $4,799,602 | $481,958 | $334,525,804 | $339,325,406 |
| 1 | Unrealized Depreciation is included in the Net Assets Received amount shown above. |
Annual Shareholder Report
Assuming the acquisition had been completed on August 1, 2019, the beginning of the annual reporting period of the Fund, the Fund’s pro forma results of operations for the year ended July 31, 2020, were as follows:
| Net investment income | $1,879,088 |
| Net realized and unrealized gain on investments | $27,688,497 |
| Net increase in net assets resulting from operations | $29,567,585 |
Because the combined investment portfolios have been managed as a single integrated portfolio since the acquisition was completed, it is not practicable to separate the amounts of revenue and earnings of the Acquired Fund that have been included in the Fund’s Statement of Operations and Statement of Changes in Net Assets as of July 31, 2020.
Prior to June 29, 2020, the name of the Trust and Fund were Federated MDT Series and Federated MDT All Cap Core Fund, respectively.
2. SIGNIFICANT ACCOUNTING POLICIES
The following is a summary of significant accounting policies consistently followed by the Fund in the preparation of its financial statements. These policies are in conformity with U.S. generally accepted accounting principles (GAAP).
Investment Valuation
In calculating its net asset value (NAV), the Fund generally values investments as follows:
| ■ | Equity securities listed on an exchange or traded through a regulated market system are valued at their last reported sale price or official closing price in their principal exchange or market. |
| ■ | Shares of other mutual funds or non-exchange-traded investment companies are valued based upon their reported NAVs. |
| ■ | Fixed-income securities are fair valued using price evaluations provided by a pricing service approved by the Fund’s Board of Trustees (the “Trustees”). |
| ■ | Derivative contracts listed on exchanges are valued at their reported settlement or closing price, except that options are valued at the mean of closing bid and asked quotations. |
| ■ | Over-the-counter (OTC) derivative contracts are fair valued using price evaluations provided by a pricing service approved by the Trustees. |
| ■ | For securities that are fair valued in accordance with procedures established by and under the general supervision of the Trustees, certain factors may be considered, such as: the last traded or purchase price of the security, information obtained by contacting the issuer or dealers, analysis of the issuer’s financial statements or other available documents, fundamental analytical data, the nature and duration of restrictions on disposition, the movement of the market in which the security is normally traded, public trading in similar securities or derivative contracts of the issuer or comparable issuers, movement of a relevant index, or other factors including but not limited to industry changes and relevant government actions. |
If any price, quotation, price evaluation or other pricing source is not readily available when the NAV is calculated, if the Fund cannot obtain price evaluations from a pricing service or from more than one dealer for an investment within a reasonable period of time as set forth in the Fund’s valuation policies and procedures, or if information furnished by a pricing service, in the opinion of the valuation committee (“Valuation Committee”), is deemed not representative of the fair value of such security, the Fund
Annual Shareholder Report
uses the fair value of the investment determined in accordance with the procedures described below. There can be no assurance that the Fund could obtain the fair value assigned to an investment if it sold the investment at approximately the time at which the Fund determines its NAV per share, and the actual value obtained could be materially different.
Fair Valuation Procedures
The Trustees have ultimate responsibility for determining the fair value of investments for which market quotations are not readily available. The Trustees have appointed a Valuation Committee comprised of officers of the Fund, Federated MDTA LLC (the “Adviser”), and certain of the Adviser’s affiliated companies to assist in determining fair value and in overseeing the calculation of the NAV. The Trustees have also authorized the use of pricing services recommended by the Valuation Committee to provide fair value evaluations of the current value of certain investments for purposes of calculating the NAV. The Valuation Committee employs various methods for reviewing third-party pricing-service evaluations including periodic reviews of third-party pricing services’ policies, procedures and valuation methods (including key inputs, methods, models and assumptions), transactional back-testing, comparisons of evaluations of different pricing services, and review of price challenges by the Adviser based on recent market activity. In the event that market quotations and price evaluations are not available for an investment, the Valuation Committee determines the fair value of the investment in accordance with procedures adopted by the Trustees. The Trustees periodically review and approve the fair valuations made by the Valuation Committee and any changes made to the procedures.
Factors considered by pricing services in evaluating an investment include the yields or prices of investments of comparable quality, coupon, maturity, call rights and other potential prepayments, terms and type, reported transactions, indications as to values from dealers and general market conditions. Some pricing services provide a single price evaluation reflecting the bid-side of the market for an investment (a “bid” evaluation). Other pricing services offer both bid evaluations and price evaluations indicative of a price between the prices bid and asked for the investment (a “mid” evaluation). The Fund normally uses bid evaluations for any U.S. Treasury and Agency securities, mortgage-backed securities and municipal securities. The Fund normally uses mid evaluations for any other types of fixed-income securities and any OTC derivative contracts. In the event that market quotations and price evaluations are not available for an investment, the fair value of the investment is determined in accordance with procedures adopted by the Trustees.
Repurchase Agreements
The Fund may invest in repurchase agreements for short-term liquidity purposes. It is the policy of the Fund to require the other party to a repurchase agreement to transfer to the Fund’s custodian or sub-custodian eligible securities or cash with a market value (after transaction costs) at least equal to the repurchase price to be paid under the repurchase agreement. The eligible securities are transferred to accounts with the custodian or sub-custodian in which the Fund holds a “securities entitlement” and exercises “control” as those terms are defined in the Uniform Commercial Code. The Fund has established procedures for monitoring the market value of the transferred
Annual Shareholder Report
securities and requiring the transfer of additional eligible securities if necessary to equal at least the repurchase price. These procedures also allow the other party to require securities to be transferred from the account to the extent that their market value exceeds the repurchase price or in exchange for other eligible securities of equivalent market value.
The insolvency of the other party or other failure to repurchase the securities may delay the disposition of the underlying securities or cause the Fund to receive less than the full repurchase price. Under the terms of the repurchase agreement, any amounts received by the Fund in excess of the repurchase price and related transaction costs must be remitted to the other party.
The Fund may enter into repurchase agreements in which eligible securities are transferred into joint trading accounts maintained by the custodian or sub-custodian for investment companies and other clients advised by the Fund’s Adviser and its affiliates. The Fund will participate on a pro rata basis with the other investment companies and clients in its share of the securities transferred under such repurchase agreements and in its share of proceeds from any repurchase or other disposition of such securities.
Investment Income, Gains and Losses and Distributions
Investment transactions are accounted for on a trade-date basis. Realized gains and losses from investment transactions are recorded on an identified-cost basis. Interest income and expenses are accrued daily. Dividend income and distributions to shareholders are recorded on the ex-dividend date. Foreign dividends are recorded on the ex-dividend date or when the Fund is informed of the ex-dividend date. Distributions of net investment income, if any, are declared and paid annually. Non-cash dividends included in dividend income, if any, are recorded at fair value. Amortization/accretion of premium and discount is included in investment income. Investment income, realized and unrealized gains and losses, and certain fund-level expenses are allocated to each class based on relative average daily net assets, except that select classes will bear certain expenses unique to those classes. The detail of the total fund expense waiver and reimbursements of $765,004 is disclosed in Note 2 and Note 5. For the year ended July 31, 2020, transfer agent fees for the Fund were as follows:
| | Transfer Agent
Fees Incurred | Transfer Agent
Fees Reimbursed |
| Class A Shares | $78,456 | $(20,385) |
| Class C Shares | 35,582 | (11,017) |
| Institutional Shares | 231,607 | (169,250) |
| Class R6 Shares | 1,579 | — |
| TOTAL | $347,224 | $(200,652) |
Dividends are declared separately for each class. No class has preferential dividend rights; differences in per share dividend rates are generally due to differences in separate class expenses.
Annual Shareholder Report
Other Service Fees
The Fund may pay other service fees up to 0.25% of the average daily net assets of the Fund’s Class A Shares and Class C Shares to financial intermediaries or to Federated Shareholder Services Company (FSSC) for providing services to shareholders and maintaining shareholder accounts. Subject to the terms described in the Expense Limitation note, FSSC may voluntarily reimburse the Fund for other service fees. For the year ended July 31, 2020, other service fees for the Fund were as follows:
| | Other Service
Fees Incurred |
| Class A Shares | $183,418 |
| Class C Shares | 77,634 |
| TOTAL | $261,052 |
Federal Taxes
It is the Fund’s policy to comply with the Subchapter M provision of the Internal Revenue Code and to distribute to shareholders each year substantially all of its income. Accordingly, no provision for federal income tax is necessary. As of and during the year ended July 31, 2020, the Fund did not have a liability for any uncertain tax positions. The Fund recognizes interest and penalties, if any, related to tax liabilities as income tax expense in the Statement of Operations. As of July 31, 2020, tax years 2017 through 2020 remain subject to examination by the Fund’s major tax jurisdictions, which include the United States of America and the Commonwealth of Massachusetts.
The Fund may be subject to taxes imposed by governments of countries in which it invests. Such taxes are generally based on either income or gains earned or repatriated. The Fund accrues and applies such taxes to net investment income, net realized gains and net unrealized gains as income and/or gains are earned.
When-Issued and Delayed-Delivery Transactions
The Fund may engage in when-issued or delayed-delivery transactions. The Fund records when-issued securities on the trade date and maintains security positions such that sufficient liquid assets will be available to make payment for the securities purchased. Securities purchased on a when-issued or delayed-delivery basis are marked to market daily and begin earning interest on the settlement date. Losses may occur on these transactions due to changes in market conditions or the failure of counterparties to perform under the contract.
Securities Lending
The Fund participates in a securities lending program providing for the lending of equity securities to qualified brokers. The term of the loans within the program is one year or less. The Fund normally receives cash collateral for securities loaned that is invested in affiliated money market funds, other money market instruments and/or repurchase agreements. Investments in money market funds may include funds with a “floating” NAV that can impose redemption fees and liquidity gates, impose certain operational impediments to investing cash collateral, and, if the investee fund’s NAV decreases, result in the Fund recognizing losses and being required to cover the decrease in the value of the cash collateral. Collateral is maintained at a minimum level of 100% of the market value of investments loaned, plus interest, if applicable. In accordance with the Fund’s securities lending agreement, the market value of securities on loan is
Annual Shareholder Report
determined each day at the close of business and any additional collateral required to cover the value of securities on loan is delivered to the Fund on the next business day. Earnings on collateral are allocated between the borrower of the security, the securities lending agent, as a fee for its services under the program and the Fund, according to agreed-upon rates. The Fund will not have the right to vote on securities while they are on loan. However, the Fund will attempt to terminate a loan in an effort to reacquire the securities in time to vote on matters that are deemed to be material by the Adviser. There can be no assurance that the Fund will have sufficient notice of such matters to be able to terminate the loan in time to vote thereon.
Securities lending transactions are subject to Master Netting Agreements which are agreements between the Fund and its counterparties that provide for the net settlement of all transactions and collateral with the Fund, through a single payment, in the event of default or termination. Amounts presented on the Portfolio of Investments and Statement of Assets and Liabilities are not net settlement amounts but gross. As indicated below, the cash collateral received by the Fund exceeds the market value of the securities loaned reducing the net settlement amount to zero. The chart below identifies the amount of collateral received as well as the market value of securities on loan. Additionally, the securities lending agreement executed by the Fund includes an indemnification clause. This clause stipulates that the borrower will reimburse the Fund for any losses as a result of any failure of the borrower to return equivalent securities to the Fund.
As of July 31, 2020, securities subject to this type of arrangement and related collateral were as follows:
Market Value of
Securities Loaned | Collateral
Received |
| $7,071,666 | $7,296,777 |
Other
The preparation of financial statements in conformity with GAAP requires management to make estimates and assumptions that affect the amounts of assets, liabilities, expenses and revenues reported in the financial statements. Actual results could differ materially from those estimated. The Fund applies investment company accounting and reporting guidance.
Annual Shareholder Report
3. SHARES OF BENEFICIAL INTEREST
The following tables summarize share activity:
| Year Ended July 31 | 2020 | 2019 |
| Class A Shares: | Shares | Amount | Shares | Amount |
| Shares sold | 690,025 | $19,860,088 | 1,197,944 | $35,149,177 |
| Proceeds from shares issued in connection with the tax-free transfer of assets from PNC Multi-Factor All Cap Fund | 69,799 | 2,108,622 | — | — |
| Shares issued to shareholders in payment of distributions declared | 75,909 | 2,245,758 | 143,909 | 3,662,745 |
| Shares redeemed | (654,712) | (18,099,902) | (377,081) | (10,640,181) |
NET CHANGE RESULTING FROM
CLASS A SHARE TRANSACTIONS | 181,021 | $6,114,566 | 964,772 | $28,171,741 |
| Year Ended July 31 | 2020 | 2019 |
| Class C Shares: | Shares | Amount | Shares | Amount |
| Shares sold | 229,788 | $6,229,160 | 486,557 | $12,740,476 |
| Proceeds from shares issued in connection with the tax-free transfer of assets from PNC Multi-Factor All Cap Fund | 5,925 | 167,267 | — | — |
| Shares issued to shareholders in payment of distributions declared | 32,298 | 888,524 | 73,190 | 1,749,965 |
| Shares redeemed | (368,127) | (9,700,529) | (806,777) | (22,501,025) |
NET CHANGE RESULTING FROM
CLASS C SHARE TRANSACTIONS | (100,116) | $(2,415,578) | (247,030) | $(8,010,584) |
| Year Ended July 31 | 2020 | 2019 |
| Institutional Shares: | Shares | Amount | Shares | Amount |
| Shares sold | 3,765,883 | $109,245,509 | 6,734,928 | $195,716,816 |
| Proceeds from shares issued in connection with the tax-free transfer of assets from PNC Multi-Factor All Cap Fund | 82,367 | 2,523,713 | — | — |
| Shares issued to shareholders in payment of distributions declared | 227,539 | 6,839,149 | 442,206 | 11,395,972 |
| Shares redeemed | (3,642,257) | (103,350,480) | (3,191,121) | (90,332,398) |
NET CHANGE RESULTING FROM
INSTITUTIONAL SHARE TRANSACTIONS | 433,532 | $15,257,891 | 3,986,013 | $116,780,390 |
Annual Shareholder Report
| Year Ended July 31 | 2020 | 2019 |
| Class R6 Shares: | Shares | Amount | Shares | Amount |
| Shares sold | 96,159 | $2,767,189 | 448,233 | $13,319,703 |
| Shares issued to shareholders in payment of distributions declared | 6,915 | 204,010 | 23,752 | 601,199 |
| Shares redeemed | (140,698) | (4,034,682) | (846,550) | (23,774,795) |
NET CHANGE RESULTING FROM
CLASS R6 SHARE TRANSACTIONS | (37,624) | $(1,063,483) | (374,565) | $(9,853,893) |
NET CHANGE RESULTING FROM
TOTAL FUND SHARE TRANSACTIONS | 476,813 | $17,893,396 | 4,329,190 | $127,087,654 |
4. FEDERAL TAX INFORMATION
The timing and character of income and capital gain distributions are determined in accordance with income tax regulations, which may differ from GAAP. These differences are due to differing treatments for regulatory settlement proceeds, distributions required for excise tax purposes and the capital loss carry forward and wash sale loss deferral tax attributes received from the Acquired Fund. For the year ended July 31, 2020, permanent differences identified and reclassified among the components of net assets were as follows:
| Increase (Decrease) |
| Paid-In Capital | Total Distributable
Earnings (Loss) |
| $(4,866,441) | $4,866,441 |
Net investment income (loss), net realized gains (losses), and net assets were not affected by this reclassification.
The tax character of distributions as reported on the Statement of Changes in Net Assets for the years ended July 31, 2020 and 2019, was as follows:
| | 2020 | 2019 |
| Ordinary income1 | $5,661,147 | $6,315,404 |
| Long-term capital gains | $5,564,730 | $12,241,132 |
| 1 | For tax purposes, short-term capital gain distributions are considered ordinary income distributions. |
As of July 31, 2020, the components of distributable earnings on a tax-basis were as follows:
| Undistributed ordinary income | $1,133,711 |
| Net unrealized appreciation | $51,734,184 |
| Capital loss deferrals | $(889,407) |
The difference between book-basis and tax-basis net unrealized appreciation/depreciation is attributable to differing treatments for deferral of losses on wash sales.
Annual Shareholder Report
At July 31, 2020, the cost of investments for federal tax purposes was $317,751,065. The net unrealized appreciation of investments for federal tax purposes was $51,734,184. This consists of net unrealized appreciation from investments for those securities having an excess of value over cost of $60,646,206 and net unrealized depreciation from investments for those securities having an excess of cost over value of $8,912,022.
Under current tax rules, capital losses on securities transactions and foreign currency losses realized after October 31 may be deferred, in whole or in part, and treated as occurring on the first day of the following fiscal year. As of July 31, 2020, for federal income tax purposes, post October losses of $889,407 were deferred to August 1, 2020.
The Fund used capital loss carryforwards of $199,858 to offset capital gains realized during the year ended July 31, 2020.
5. INVESTMENT ADVISER FEE AND OTHER TRANSACTIONS WITH AFFILIATES
Investment Adviser Fee
The advisory agreement between the Fund and the Adviser provides for an annual fee equal to 0.70% of the Fund’s average daily net assets. Prior to July 1, 2019, the annual advisory fee was 0.75% of the Fund’s average daily net assets. Subject to the terms described in the Expense Limitation note, the Adviser may voluntarily choose to waive any portion of its fee and/or reimburse certain operating expenses of the Fund. For the year ended July 31, 2020, the Adviser voluntarily waived $557,706 of its fee and voluntarily reimbursed $200,652 of transfer agent fees. The Adviser has agreed to reimburse the Fund for certain investment adviser fees as a result of transactions in other affiliated investment companies. For the year ended July 31, 2020, the Adviser reimbursed $6,646.
Administrative Fee
Federated Administrative Services (FAS), under the Administrative Services Agreement, provides the Fund with administrative personnel and services. For purposes of determining the appropriate rate breakpoint, “Investment Complex” is defined as all of the Federated Hermes Funds subject to a fee under the Administrative Services Agreement. The fee paid to FAS is based on the average daily net assets of the Investment Complex as specified below:
| Administrative Fee | Average Daily Net Assets
of the Investment Complex |
| 0.100% | on assets up to $50 billion |
| 0.075% | on assets over $50 billion |
Subject to the terms described in the Expense Limitation note, FAS may voluntarily choose to waive any portion of its fee. For the year ended July 31, 2020, the annualized fee paid to FAS was 0.079% of average daily net assets of the Fund.
In addition, FAS may charge certain out-of-pocket expenses to the Fund.
Annual Shareholder Report
Distribution Services Fee
The Fund has adopted a Distribution Plan (the “Plan”) pursuant to Rule 12b-1 under the Act. Under the terms of the Plan, the Fund will compensate Federated Securities Corp. (FSC), the principal distributor, from the daily net assets of the Fund’s Class A Shares, and Class C Shares to finance activities intended to result in the sale of these shares. The Plan provides that the Fund may incur distribution expenses at the following percentages of average daily net assets annually, to compensate FSC:
| | Percentage of Average Daily
Net Assets of Class |
| Class A Shares | 0.05% |
| Class C Shares | 0.75% |
FSC may voluntarily choose to waive any portion of its fee. For the year ended July 31, 2020, distribution services fees for the Fund were as follows:
| | Distribution Services
Fees Incurred |
| Class C Shares | $232,902 |
When FSC receives fees, it may pay some or all of them to financial intermediaries whose customers purchase shares. For the year ended July 31, 2020, FSC retained $51,320 of fees paid by the Fund. For the year ended July 31, 2020, the Fund’s Class A Shares did not incur a distribution services fee; however, it may begin to incur this fee upon approval of the Trustees.
Other Service Fees
For the year ended July 31, 2020, FSSC received $4,297 of the other service fees disclosed in Note 2.
Sales Charges
Front-end sales charges and contingent deferred sales charges (CDSC) do not represent expenses of the Fund. They are deducted from the proceeds of sales of Fund shares prior to investment or from redemption proceeds prior to remittance, as applicable. For the year ended July 31, 2020, FSC retained $18,598 in sales charges from the sale of Class A Shares. FSC also retained $5,780 and $5,306 of CDSC relating to redemptions of Class A Shares and Class C Shares, respectively.
Expense Limitation
The Adviser and certain of its affiliates on their own initiative have agreed to waive certain amounts of their respective fees and/or reimburse expenses. Total annual fund operating expenses, excluding interest expenses, extraordinary expenses, and proxy-related expenses paid by the Fund, if any) paid by the Fund’s Class A Shares, Class C Shares Institutional Shares and R6 Shares (after the voluntary waivers and/or reimbursements) will not exceed 1.04%, 1.79%, 0.74% and 0.73% (the “Fee Limit”), respectively, up to but not including the later of (the “Termination Date”): (a) October 1, 2021; or (b) the date of the Fund’s next effective Prospectus. While the
Annual Shareholder Report
Adviser and its affiliates currently do not anticipate terminating or increasing these arrangements prior to the Termination Date, these arrangements may only be terminated or the Fee Limit increased prior to the Termination Date with the agreement of the Trustees.
Directors’/Trustees’ and Miscellaneous Fees
Certain Officers and Trustees of the Fund are Officers and Directors or Trustees of certain of the above companies. To efficiently facilitate payment, Independent Directors’/Trustees’ fees and certain expenses related to conducting meetings of the Directors/Trustees and other miscellaneous expenses are paid by an affiliate of the Adviser which in due course are reimbursed by the Fund. These expenses related to conducting meetings of the Directors/Trustees and other miscellaneous expenses may be included in Accrued and Miscellaneous Expenses on the Statement of Assets and Liabilities and Statement of Operations, respectively.
6. INVESTMENT TRANSACTIONS
Purchases and sales of investments, excluding long-term U.S. government securities and short-term obligations, for the year ended July 31, 2020, were as follows:
| Purchases | $523,699,303 |
| Sales | $514,229,396 |
7. CONCENTRATION OF RISK
The Fund may invest a portion of its assets in securities of companies that are deemed by the Fund’s management to be classified in similar business sectors. Economic developments may have an effect on the liquidity and volatility of the portfolio securities.
8. LINE OF CREDIT
The Fund participates with certain other Federated Hermes Funds, on a several basis, in an up to $500,000,000 unsecured, 364-day, committed, revolving line of credit (LOC) agreement. The LOC was made available to temporarily finance the repurchase or redemption of shares of the Fund, failed trades, payment of dividends, settlement of trades and for other short-term, temporary or emergency general business purposes. The Fund cannot borrow under the LOC if an inter-fund loan is outstanding. The Fund’s ability to borrow under the LOC also is subject to the limitations of the Act and various conditions precedent that must be satisfied before the Fund can borrow. Loans under the LOC are charged interest at a fluctuating rate per annum equal to the highest, on any day, of (a) (i) the federal funds effective rate, (ii) the one month London Interbank Offered Rate (LIBOR), or a replacement rate as appropriate, and (iii) 0.0%, plus (b) a margin. Any fund eligible to borrow under the LOC pays its pro rata share of an upfront fee, and its pro rata share of a commitment fee based on the amount of the lenders’ commitment that has not been utilized, quarterly in arrears and at maturity. As of July 31, 2020, the Fund had no outstanding loans. During the year ended July 31, 2020, the Fund did not utilize the LOC.
Annual Shareholder Report
9. INTERFUND LENDING
Pursuant to an Exemptive Order issued by the SEC, the Fund, along with other funds advised by subsidiaries of Federated Hermes, Inc., may participate in an interfund lending program. This program provides an alternative credit facility allowing the Fund to borrow from other participating affiliated funds. As of July 31, 2020, there were no outstanding loans. During the year ended July 31, 2020, the program was not utilized.
10. OTHER MATTERS
An outbreak of respiratory disease caused by a novel coronavirus was first detected in China in December 2019 and subsequently spread globally. As of the date of the issuance of these financial statements, this coronavirus has resulted in closing borders, enhanced health screenings, healthcare service preparation and delivery, quarantines, cancellations, and disruptions to supply chains, workflow operations and consumer activity, as well as general concern and uncertainty. The impact of this coronavirus may be short-term or may last for an extended period of time and has resulted in a substantial economic downturn. Health crises caused by outbreaks, such as the coronavirus outbreak, may exacerbate other pre-existing political, social and economic risks. The impact of this outbreak, and other epidemics and pandemics that may arise in the future, could continue to negatively affect the worldwide economy, as well as the economies of individual countries, individual companies (including certain Fund service providers and issuers of the Fund’s investments) and the markets in general in significant and unforeseen ways. Any such impact could adversely affect the Fund’s performance.
11. FEDERAL TAX INFORMATION (UNAUDITED)
For the fiscal year ended July 31, 2020, the amount of long-term capital gains designated by the Fund was $5,564,730.
For the fiscal year ended July 31, 2020, 31.01% of total ordinary income distributions made by the Fund are qualifying dividends which may be subject to a maximum tax rate of 15%, as provided for by the Jobs and Growth Tax Relief Act of 2003. Complete information is reported in conjunction with the reporting of your distributions on Form 1099-DIV.
Of the ordinary income (including short-term capital gain) distributions made by the Fund during the year ended July 31, 2020, 31.01% qualify for the dividend received deduction available to corporate shareholders.
Annual Shareholder Report
Report of Independent Registered Public Accounting Firm
TO THE BOARD OF TRUSTEES OF FEDERATED HERMES MDT SERIES AND SHAREHOLDERS OF FEDERATED HERMES MDT ALL CAP CORE FUND:
Opinion on the Financial Statements
We have audited the accompanying statement of assets and liabilities of Federated Hermes MDT All Cap Core Fund (formerly, Federated MDT All Cap Core Fund) (the “Fund”) (one of the portfolios constituting Federated Hermes MDT Series (formerly, Federated MDT Series) (the “Trust”)), including the portfolio of investments, as of July 31, 2020, and the related statement of operations for the year then ended, the statement of changes in net assets for each of the two years in the period then ended, the financial highlights for each of the five years in the period then ended and the related notes (collectively referred to as the “financial statements”). In our opinion, the financial statements present fairly, in all material respects, the financial position of the Fund (one of the funds constituting Federated Hermes MDT Series) at July 31, 2020, the results of its operations for the year then ended, the changes in its net assets for each of the two years in the period then ended and its financial highlights for each of the five years in the period then ended, in conformity with U.S. generally accepted accounting principles.
Basis for Opinion
These financial statements are the responsibility of the Trust’s management. Our responsibility is to express an opinion on the Fund’s financial statements based on our audits. We are a public accounting firm registered with the Public Company Accounting Oversight Board (United States) (“PCAOB”) and are required to be independent with respect to the Trust in accordance with the U.S. federal securities laws and the applicable rules and regulations of the Securities and Exchange Commission and the PCAOB.
We conducted our audits in accordance with standards of the PCAOB. Those standards require that we plan and perform the audit to obtain reasonable assurance about whether the financial statements and financial highlights are free of material misstatement, whether due to error or fraud. The Trust is not required to have, nor were we engaged to perform, an audit of the Trust’s internal control over financial reporting. As part of our audits, we are required to obtain an understanding of internal control over financial reporting, but not for the purpose of expressing an opinion on the effectiveness of the Trust’s internal control over financial reporting. Accordingly, we express no such opinion.
Annual Shareholder Report
Our audits included performing procedures to assess the risks of material misstatement of the financial statements, whether due to error or fraud, and performing procedures that respond to those risks. Such procedures included examining, on a test basis, evidence regarding the amounts and disclosures in the financial statements. Our procedures included confirmation of securities owned as of July 31, 2020, by correspondence with the custodian and others or by other appropriate auditing procedures where replies from others were not received. Our audits also included evaluating the accounting principles used and significant estimates made by management, as well as evaluating the overall presentation of the financial statements. We believe that our audits provide a reasonable basis for our opinion.
We have served as the auditor of one or more Federated Hermes investment companies since 1979.
Boston, Massachusetts
September 22, 2020
Annual Shareholder Report
Shareholder Expense Example (unaudited)
As a shareholder of the Fund, you incur two types of costs: (1) transaction costs, including sales charges (loads) on purchase or redemption payments; and (2) ongoing costs, including management fees and to the extent applicable, distribution (12b-1) fees and/or other service fees and other Fund expenses. This Example is intended to help you to understand your ongoing costs (in dollars) of investing in the Fund and to compare these costs with the ongoing costs of investing in other mutual funds. It is based on an investment of $1,000 invested at the beginning of the period and held for the entire period from February 1, 2020 to July 31, 2020.
ACTUAL EXPENSES
The first section of the table below provides information about actual account values and actual expenses. You may use the information in this section, together with the amount you invested, to estimate the expenses that you incurred over the period. Simply divide your account value by $1,000 (for example, an $8,600 account value divided by $1,000 = 8.6), then multiply the result by the number in the first section under the heading entitled “Expenses Paid During Period” to estimate the expenses attributable to your investment during this period.
HYPOTHETICAL EXAMPLE FOR COMPARISON PURPOSES
The second section of the table below provides information about hypothetical account values and hypothetical expenses based on the Fund’s actual expense ratio and an assumed rate of return of 5% per year before expenses, which is not the Fund’s actual return. Thus, you should not use the hypothetical account values and expenses to estimate the actual ending account balance or your expenses for the period. Rather, these figures are required to be provided to enable you to compare the ongoing costs of investing in the Fund with other funds. To do so, compare this 5% hypothetical example with the 5% hypothetical examples that appear in the shareholder reports of the other funds.
Annual Shareholder Report
Please note that the expenses shown in the table are meant to highlight your ongoing costs only and do not reflect any transaction costs, such as sales charges (loads) on purchase or redemption payments. Therefore, the second section of the table is useful in comparing ongoing costs only, and will not help you determine the relative total costs of owning different funds. In addition, if these transaction costs were included, your costs would have been higher.
| | Beginning
Account Value
2/1/2020 | Ending
Account Value
7/31/2020 | Expenses Paid
During Period1 |
| Actual: | | | |
| Class A Shares | $1,000 | $1,052.00 | $5.31 |
| Class C Shares | $1,000 | $1,047.80 | $9.11 |
| Institutional Shares | $1,000 | $1,053.60 | $3.78 |
| Class R6 Shares | $1,000 | $1,053.60 | $3.73 |
Hypothetical (assuming a 5% return
before expenses): | | | |
| Class A Shares | $1,000 | $1,019.70 | $5.22 |
| Class C Shares | $1,000 | $1,016.00 | $8.97 |
| Institutional Shares | $1,000 | $1,021.20 | $3.72 |
| Class R6 Shares | $1,000 | $1,021.20 | $3.67 |
| 1 | Expenses are equal to the Fund’s annualized net expense ratios, multiplied by the average account value over the period, multiplied by 182/366 (to reflect the one-half-year period). The annualized net expense ratios are as follows: |
| | |
| Class A Shares | 1.04% |
| Class C Shares | 1.79% |
| Institutional Shares | 0.74% |
| Class R6 Shares | 0.73% |
Annual Shareholder Report
Board of Trustees and Trust Officers
The Board of Trustees is responsible for managing the Trust’s business affairs and for exercising all the Trust’s powers except those reserved for the shareholders. The following tables give information about each Trustee and the senior officers of the Fund. Where required, the tables separately list Trustees who are “interested persons” of the Fund (i.e., “Interested” Trustees) and those who are not (i.e., “Independent” Trustees). Unless otherwise noted, the address of each person listed is 1001 Liberty Avenue, Pittsburgh, PA 15222. The address of all Independent Trustees listed is 4000 Ericsson Drive, Warrendale, PA 15086-7561; Attention: Mutual Fund Board. As of December 31, 2019, the Trust comprised five portfolio(s), and the Federated Hermes Fund Family consisted of 41 investment companies (comprising 135 portfolios). Unless otherwise noted, each Officer is elected annually. Unless otherwise noted, each Trustee oversees all portfolios in the Federated Hermes Fund Family and serves for an indefinite term. The Fund’s Statement of Additional Information includes additional information about Trust Trustees and is available, without charge and upon request, by calling 1-800-341-7400.
Interested TRUSTEES Background
Name
Birth Date
Positions Held with Trust
Date Service Began | Principal Occupation(s) for Past Five Years,
Other Directorships Held and Previous Position(s) |
J. Christopher Donahue*
Birth Date: April 11, 1949
President and Trustee
Indefinite Term
Began serving: May 2006 | Principal Occupations: Principal Executive Officer and President of certain of the Funds in the Federated Hermes Fund Family; Director or Trustee of the Funds in the Federated Hermes Fund Family; President, Chief Executive Officer and Director, Federated Hermes, Inc.; Chairman and Trustee, Federated Investment Management Company; Trustee, Federated Investment Counseling; Chairman and Director, Federated Global Investment Management Corp.; Chairman and Trustee, Federated Equity Management Company of Pennsylvania; Trustee, Federated Shareholder Services Company; Director, Federated Services Company.
Previous Positions: President, Federated Investment Counseling; President and Chief Executive Officer, Federated Investment Management Company, Federated Global Investment Management Corp. and Passport Research, Ltd; Chairman, Passport Research, Ltd. |
Annual Shareholder Report
Name
Birth Date
Positions Held with Trust
Date Service Began | Principal Occupation(s) for Past Five Years,
Other Directorships Held and Previous Position(s) |
John B. Fisher*
Birth Date: May 16, 1956
Trustee
Indefinite Term
Began serving: May 2016 | Principal Occupations: Principal Executive Officer and President of certain of the Funds in the Federated Hermes Fund Family; Director or Trustee of certain of the Funds in the Federated Hermes Fund Family; Vice President, Federated Hermes, Inc.; President, Director/Trustee and CEO, Federated Advisory Services Company, Federated Equity Management Company of Pennsylvania, Federated Global Investment Management Corp., Federated Investment Counseling, Federated Investment Management Company; President of some of the Funds in the Federated Hermes Fund Family and Director, Federated Investors Trust Company.
Previous Positions: President and Director of the Institutional Sales Division of Federated Securities Corp.; President and Director of Federated Investment Counseling; President and CEO of Passport Research, Ltd.; Director, Edgewood Securities Corp.; Director, Federated Services Company; Director, Federated Hermes, Inc.; Chairman and Director, Southpointe Distribution Services, Inc. and President, Technology, Federated Services Company. |
| * | Reasons for “interested” status: J. Christopher Donahue and John B. Fisher are interested due to their beneficial ownership of shares of Federated Hermes, Inc. and due to positions they hold with Federated Hermes, Inc. and its subsidiaries. |
INDEPENDENT TRUSTEES Background
Name
Birth Date
Positions Held with Trust
Date Service Began | Principal Occupation(s) for Past Five Years,
Other Directorships Held, Previous Position(s) and Qualifications |
John T. Collins
Birth Date: January 24, 1947
Trustee
Indefinite Term
Began serving:
October 2013 | Principal Occupations: Director or Trustee of the Federated Hermes Fund Family; formerly, Chairman and CEO, The Collins Group, Inc. (a private equity firm) (Retired).
Other Directorships Held: Chairman of the Board of Directors, Director, and Chairman of the Compensation Committee, KLX Energy Services Holdings, Inc. (oilfield services); former Director of KLX Corp. (aerospace).
Qualifications: Mr. Collins has served in several business and financial management roles and directorship positions throughout his career. Mr. Collins previously served as Chairman and CEO of The Collins Group, Inc. (a private equity firm) and as a Director of KLX Corp. Mr. Collins serves as Chairman Emeriti, Bentley University. Mr. Collins previously served as Director and Audit Committee Member, Bank of America Corp.; Director, FleetBoston Financial Corp.; and Director, Beth Israel Deaconess Medical Center (Harvard University Affiliate Hospital). |
Annual Shareholder Report
Name
Birth Date
Positions Held with Trust
Date Service Began | Principal Occupation(s) for Past Five Years,
Other Directorships Held, Previous Position(s) and Qualifications |
G. Thomas Hough
Birth Date: February 28, 1955
Trustee
Indefinite Term
Began serving: August 2015 | Principal Occupations: Director or Trustee, Chair of the Audit Committee of the Federated Hermes Fund Family; formerly, Vice Chair, Ernst & Young LLP (public accounting firm) (Retired).
Other Directorships Held: Director, Chair of the Audit Committee, Equifax, Inc.; Director, Member of the Audit Committee, Haverty Furniture Companies, Inc.; formerly, Director, Member of Governance and Compensation Committees, Publix Super Markets, Inc.
Qualifications: Mr. Hough has served in accounting, business management and directorship positions throughout his career. Mr. Hough most recently held the position of Americas Vice Chair of Assurance with Ernst & Young LLP (public accounting firm). Mr. Hough serves on the President’s Cabinet and Business School Board of Visitors for the University of Alabama. Mr. Hough previously served on the Business School Board of Visitors for Wake Forest University, and he previously served as an Executive Committee member of the United States Golf Association. |
Maureen Lally-Green
Birth Date: July 5, 1949
Trustee
Indefinite Term
Began serving: August 2009 | Principal Occupations: Director or Trustee of the Federated Hermes Fund Family; Adjunct Professor of Law, Duquesne University School of Law; formerly, Dean of the Duquesne University School of Law and Professor of Law and Interim Dean of the Duquesne University School of Law; formerly, Associate General Secretary and Director, Office of Church Relations, Diocese of Pittsburgh.
Other Directorships Held: Director, CNX Resources Corporation (formerly known as CONSOL Energy Inc.).
Qualifications: Judge Lally-Green has served in various legal and business roles and directorship positions throughout her career. Judge Lally-Green previously held the position of Dean of the School of Law of Duquesne University (as well as Interim Dean). Judge Lally-Green previously served as a member of the Superior Court of Pennsylvania and as a Professor of Law, Duquesne University School of Law. Judge Lally-Green was appointed by the Supreme Court of Pennsylvania to serve on the Supreme Court’s Board of Continuing Judicial Education and the Supreme Court’s Appellate Court Procedural Rules Committee. Judge Lally-Green also currently holds the positions on not for profit or for profit boards of directors as follows: Director and Chair, UPMC Mercy Hospital; Director and Vice Chair, Our Campaign for the Church Alive!, Inc.; Regent, Saint Vincent Seminary; Member, Pennsylvania State Board of Education (public); Director, Catholic Charities, Pittsburgh; and Director CNX Resources Corporation (formerly known as CONSOL Energy Inc.). Judge Lally-Green has held the positions of: Director, Auberle; Director, Epilepsy Foundation of Western and Central Pennsylvania; Director, Ireland Institute of Pittsburgh; Director, Saint Thomas More Society; Director and Chair, Catholic High Schools of the Diocese of Pittsburgh, Inc.; Director, Pennsylvania Bar Institute; Director, St. Vincent College; and Director and Chair, North Catholic High School, Inc. |
Annual Shareholder Report
Name
Birth Date
Positions Held with Trust
Date Service Began | Principal Occupation(s) for Past Five Years,
Other Directorships Held, Previous Position(s) and Qualifications |
Charles F. Mansfield, Jr.
Birth Date: April 10, 1945
Trustee
Indefinite Term
Began serving: June 2006 | Principal Occupations: Director or Trustee of the Federated Hermes Fund Family; Management Consultant and Author.
Other Directorships Held: None.
Qualifications: Mr. Mansfield has served as a Marine Corps officer and in several banking, business management, educational roles and directorship positions throughout his long career. He remains active as a Management Consultant and Author. |
Thomas M. O’Neill
Birth Date: June 14, 1951
Trustee
Indefinite Term
Began serving: August 2006 | Principal Occupations: Director or Trustee of the Federated Hermes Fund Family; Sole Proprietor, Navigator Management Company (investment and strategic consulting).
Other Directorships Held: None.
Qualifications: Mr. O’Neill has served in several business, mutual fund and financial management roles and directorship positions throughout his career. Mr. O’Neill serves as Director, Medicines for Humanity and Director, The Golisano Children’s Museum of Naples, Florida. Mr. O’Neill previously served as Chief Executive Officer and President, Managing Director and Chief Investment Officer, Fleet Investment Advisors; President and Chief Executive Officer, Aeltus Investment Management, Inc.; General Partner, Hellman, Jordan Management Co., Boston, MA; Chief Investment Officer, The Putnam Companies, Boston, MA; Credit Analyst and Lending Officer, Fleet Bank; Director and Consultant, EZE Castle Software (investment order management software); and Director, Midway Pacific (lumber). |
P. Jerome Richey
Birth Date: February 23, 1949
Trustee
Indefinite Term
Began serving:
October 2013 | Principal Occupations: Director or Trustee of the Federated Hermes Fund Family; Management Consultant; Retired; formerly, Senior Vice Chancellor and Chief Legal Officer, University of Pittsburgh and Executive Vice President and Chief Legal Officer, CNX Resources Corporation (formerly known as CONSOL Energy Inc.).
Other Directorships Held: None.
Qualifications: Mr. Richey has served in several business and legal management roles and directorship positions throughout his career. Mr. Richey most recently held the positions of Senior Vice Chancellor and Chief Legal Officer, University of Pittsburgh. Mr. Richey previously served as Chairman of the Board, Epilepsy Foundation of Western Pennsylvania and Chairman of the Board, World Affairs Council of Pittsburgh. Mr. Richey previously served as Chief Legal Officer and Executive Vice President, CNX Resources Corporation (formerly known as CONSOL Energy Inc.); and Board Member, Ethics Counsel and Shareholder, Buchanan Ingersoll & Rooney PC (a law firm). |
Annual Shareholder Report
Name
Birth Date
Positions Held with Trust
Date Service Began | Principal Occupation(s) for Past Five Years,
Other Directorships Held, Previous Position(s) and Qualifications |
John S. Walsh
Birth Date:
November 28, 1957
Trustee
Indefinite Term
Began serving: June 2006 | Principal Occupations: Director or Trustee, and Chair of the Board of Directors or Trustees, of the Federated Hermes Fund Family; President and Director, Heat Wagon, Inc. (manufacturer of construction temporary heaters); President and Director, Manufacturers Products, Inc. (distributor of portable construction heaters); President, Portable Heater Parts, a division of Manufacturers Products, Inc.
Other Directorships Held: None.
Qualifications: Mr. Walsh has served in several business management roles and directorship positions throughout his career. Mr. Walsh previously served as Vice President, Walsh & Kelly, Inc. (paving contractors). |
OFFICERS
Name
Birth Date
Address
Positions Held with Trust
Date Service Began | Principal Occupation(s) for Past Five Years
and Previous Position(s) |
Lori A. Hensler
Birth Date: January 6, 1967
TREASURER
Officer since: April 2013 | Principal Occupations: Principal Financial Officer and Treasurer of the Federated Hermes Fund Family; Senior Vice President, Federated Administrative Services; Financial and Operations Principal for Federated Securities Corp. and Edgewood Services, Inc.; and Assistant Treasurer, Federated Investors Trust Company. Ms. Hensler has received the Certified Public Accountant designation.
Previous Positions: Controller of Federated Hermes, Inc.; Senior Vice President and Assistant Treasurer, Federated Investors Management Company; Treasurer, Federated Investors Trust Company; Assistant Treasurer, Federated Administrative Services, Federated Administrative Services, Inc., Federated Securities Corp., Edgewood Services, Inc., Federated Advisory Services Company, Federated Equity Management Company of Pennsylvania, Federated Global Investment Management Corp., Federated Investment Counseling, Federated Investment Management Company, Passport Research, Ltd., and Federated MDTA, LLC; Financial and Operations Principal for Federated Securities Corp., Edgewood Services, Inc. and Southpointe Distribution Services, Inc. |
Annual Shareholder Report
Name
Birth Date
Address
Positions Held with Trust
Date Service Began | Principal Occupation(s) for Past Five Years
and Previous Position(s) |
Peter J. Germain
Birth Date:
September 3, 1959
CHIEF LEGAL OFFICER, SECRETARY and EXECUTIVE VICE PRESIDENT
Officer since: June 2006 | Principal Occupations: Mr. Germain is Chief Legal Officer, Secretary and Executive Vice President of the Federated Hermes Fund Family. He is General Counsel, Chief Legal Officer, Secretary and Executive Vice President, Federated Hermes, Inc.; Trustee and Senior Vice President, Federated Investors Management Company; Trustee and President, Federated Administrative Services; Director and President, Federated Administrative Services, Inc.; Director and Vice President, Federated Securities Corp.; Director and Secretary, Federated Private Asset Management, Inc.; Secretary, Federated Shareholder Services Company; and Secretary, Retirement Plan Service Company of America. Mr. Germain joined Federated Hermes in 1984 and is a member of the Pennsylvania Bar Association.
Previous Positions: Deputy General Counsel, Special Counsel, Managing Director of Mutual Fund Services, Federated Hermes, Inc.; Senior Vice President, Federated Services Company; and Senior Corporate Counsel, Federated Hermes, Inc. |
Stephen F. Auth
Birth Date: September 13, 1956
101 Park Avenue
41st Floor
New York, NY 10178
CHIEF INVESTMENT OFFICER
Officer since: June 2012 | Principal Occupations: Stephen F. Auth is Chief Investment Officer of various Funds in the Federated Hermes Fund Family; Executive Vice President, Federated Investment Counseling, Federated Global Investment Management Corp. and Federated Equity Management Company of Pennsylvania.
Previous Positions: Executive Vice President, Federated Investment Management Company and Passport Research, Ltd. (investment advisory subsidiary of Federated); Senior Vice President, Global Portfolio Management Services Division; Senior Vice President, Federated Investment Management Company and Passport Research, Ltd.; Senior Managing Director and Portfolio Manager, Prudential Investments. |
Stephen Van Meter
Birth Date: June 5, 1975
CHIEF COMPLIANCE OFFICER AND SENIOR VICE PRESIDENT
Officer since: July 2015 | Principal Occupations: Senior Vice President and Chief Compliance Officer of the Federated Hermes Fund Family; Vice President and Chief Compliance Officer of Federated Hermes, Inc. and Chief Compliance Officer of certain of its subsidiaries. Mr. Van Meter joined Federated Hermes, Inc. in October 2011. He holds FINRA licenses under Series 3, 7, 24 and 66.
Previous Positions: Mr. Van Meter previously held the position of Compliance Operating Officer, Federated Hermes, Inc. Prior to joining Federated Hermes, Inc., Mr. Van Meter served at the United States Securities and Exchange Commission in the positions of Senior Counsel, Office of Chief Counsel, Division of Investment Management and Senior Counsel, Division of Enforcement. |
Annual Shareholder Report
Evaluation and Approval of Advisory Contract–May 2020
Federated MDT All Cap Core Fund (the “Fund”)
(EFFECTIVE CLOSE OF BUSINESS ON JUNE 26, 2020, THE FUND’S NAME CHANGED TO FEDERATED HERMES MDT ALL CAP CORE FUND)
At its meetings in May 2020 (the “May Meetings”), the Fund’s Board of Trustees (the “Board”), including a majority of those Trustees who are not “interested persons” of the Fund, as defined in the Investment Company Act of 1940 (the “Independent Trustees”), reviewed and unanimously approved the continuation of the investment advisory contract between the Fund and Federated MDTA LLC (the “Adviser”) with respect to the Fund (the “Contract”) for an additional one-year term. The Board’s determination to approve the continuation of the Contract reflects the exercise of its business judgment after considering all of the information and factors believed to be relevant and appropriate on whether to continue the existing arrangements. The information, factors and conclusions that formed the basis for the Board’s approval are summarized below.
Information Received and Review Process
At the request of the Independent Trustees, the Fund’s Chief Compliance Officer (the “CCO”) furnished to the Board in advance of its May Meetings an independent written evaluation presenting on the topics discussed below. The Board considered the CCO’s independent written evaluation (the “CCO Fee Evaluation Report”), along with other information, in evaluating the reasonableness of the Fund’s management fee and in determining to approve the continuation of the Contract. The CCO, in preparing the CCO Fee Evaluation Report, has the authority to retain consultants, experts or staff as reasonably necessary to assist in the performance of his duties, reports directly to the Board, and can be terminated only with the approval of a majority of the Independent Trustees. At the request of the Independent Trustees, the CCO Fee Evaluation Report followed the same general approach and covered the same topics as that of the report that had previously been delivered by the CCO in his capacity as “Senior Officer,” prior to the elimination of the Senior Officer position in December 2017.
In addition to the extensive materials that comprise and accompany the CCO Fee Evaluation Report, in the months preceding the May Meetings, the Board requested and reviewed written responses and supporting materials prepared by the Adviser and its affiliates (collectively, “Federated Hermes”) in response to requests posed to Federated Hermes on behalf of the Independent Trustees encompassing a wide variety of topics. The Board also considered such additional matters as the Independent Trustees deemed reasonably necessary to evaluate the Contract, which included detailed information about the Fund and Federated Hermes furnished to the Board at its meetings throughout the year
Annual Shareholder Report
and in between regularly scheduled meetings on particular matters as the need arose, as well as information specifically prepared in connection with the approval of the continuation of the Contract that was presented at the May Meetings.
The Board’s consideration of the Contract included review of materials and information covering the following matters, among others: the Adviser’s investment philosophy, revenue, profitability, personnel and processes; investment and operating strategies; the Fund’s short-term and long-term performance (in absolute terms, both on a gross basis and net of expenses, and relative to the Fund’s particular investment program and a group of its peer funds and/or its benchmark, as appropriate) and comments on the reasons for the Fund’s performance; the Fund’s investment objectives; the Fund’s expenses, including the advisory fee and the overall expense structure of the Fund (both in absolute terms and relative to a group of its peer funds), with due regard for contractual or voluntary expense limitations (if any); the use and allocation of brokerage commissions derived from trading the Fund’s portfolio securities (if any); and the nature, quality and extent of the advisory and other services provided to the Fund by the Adviser and its affiliates. The Board also considered the preferences and expectations of Fund shareholders; the entrepreneurial and other risks assumed by the Adviser in sponsoring and managing the Fund; the continuing state of competition in the mutual fund industry and market practices; the range of comparable fees for similar funds in the mutual fund industry; the Fund’s relationship to the other funds advised by Federated Hermes (each, a “Federated Hermes Fund”), which include a comprehensive array of funds with different investment objectives, policies and strategies which are generally available for exchange without the incurrence of additional sales charges; compliance and audit reports concerning the Federated Hermes Funds and the Federated Hermes’ affiliates that service them (including communications from regulatory agencies), as well as Federated Hermes’ responses to any issues raised therein; and relevant developments in the mutual fund industry and how the Federated Hermes Funds and/or Federated Hermes may be responding to them. In addition, the Board received and considered information furnished by Federated Hermes on the impacts of the coronavirus (COVID-19) outbreak on Federated Hermes generally and the Fund in particular, including, among other information, the current and anticipated impacts on the management, operations and performance of the Fund. The Board noted that its evaluation process is evolutionary and that the criteria considered and the emphasis placed on relevant criteria may change in recognition of changing circumstances in the mutual fund marketplace.
The Board also considered judicial decisions concerning allegedly excessive investment advisory fees in determining to approve the Contract. Using these judicial decisions as a guide, the Board observed that the following factors may be relevant to an adviser’s fiduciary duty with respect to its receipt of
Annual Shareholder Report
compensation from a fund: (1) the nature and quality of the services provided by an adviser to a fund and its shareholders (including the performance of the fund, its benchmark, and comparable funds); (2) an adviser’s cost of providing the services (including the profitability to an adviser of providing advisory services to a fund); (3) the extent to which an adviser may realize “economies of scale” as a fund grows larger and, if such economies of scale exist, whether they have been shared with a fund and its shareholders or the family of funds; (4) any “fall-out” financial benefits that accrue to an adviser because of its relationship with a fund (including research services received from brokers that execute fund trades and any fees paid to affiliates of an adviser for services rendered to a fund); (5) comparative fee and expense structures (including a comparison of fees paid to an adviser with those paid by similar funds both internally and externally as well as management fees charged to institutional and other advisory clients of the adviser for what might be viewed as like services); and (6) the extent of care, conscientiousness and independence with which the fund’s board members perform their duties and their expertise (including whether they are fully informed about all facts the board deems relevant to its consideration of an adviser’s services and fees). The Board noted that the Securities and Exchange Commission (“SEC”) disclosure requirements regarding the basis for a fund board’s approval of the fund’s investment advisory contracts generally align with the factors listed above. The Board was aware of these factors and was guided by them in its review of the Contract to the extent it considered them to be appropriate and relevant, as discussed further below.
The Board considered and weighed these factors in light of its substantial accumulated experience in governing the Fund and working with Federated Hermes on matters relating to the Federated Hermes Funds. While individual members of the Board may have weighed certain factors differently, the Board’s determination to continue the Contract was based on a comprehensive consideration of all information provided to the Board throughout the year and specifically with respect to the continuation of the Contract. The Independent Trustees were assisted throughout the evaluation process by independent legal counsel. In connection with their deliberations at the May Meetings, the Independent Trustees met separately in executive session with their independent legal counsel and without management present to review the relevant materials and consider their responsibilities under applicable laws. In addition, senior management representatives of Federated Hermes also met with the Independent Trustees and their independent legal counsel to discuss the materials and presentations furnished to the Board at the May Meetings. The Board considered the approval of the Contract for the Fund as part of its consideration of agreements for funds across the Federated Hermes Funds family, but its approvals were made on a fund-by-fund basis.
Annual Shareholder Report
Nature, Extent and Quality of Services
The Board considered the nature, extent and quality of the services provided to the Fund by the Adviser and the resources of the Adviser and its affiliates dedicated to the Fund. In this regard, the Board evaluated, among other things, the Adviser’s personnel, experience and track record, as well as the financial resources and overall reputation of Federated Hermes and its willingness to invest in personnel and infrastructure that benefit the Federated Hermes Funds. The Board noted the significant acquisition of Hermes Fund Managers Limited by Federated Hermes in 2018, which has deepened the organization’s investment management expertise and capabilities and expanded the investment process for all of the Federated Hermes Funds to incorporate environmental, social and governance (“ESG”) factors and issuer engagement on ESG matters.
In addition, the Board reviewed the qualifications, backgrounds and responsibilities of the portfolio management team primarily responsible for the day-to-day management of the Fund and the Adviser’s ability and experience in attracting and retaining qualified personnel to service the Fund. The Board noted the compliance program of the Adviser and the compliance-related resources devoted by the Adviser and its affiliates in support of the Fund’s obligations pursuant to Rule 38a-1 under the Investment Company Act of 1940, including the Adviser’s commitment to respond to rulemaking and other regulatory initiatives of the SEC. such as the liquidity risk management program rules. In addition, the Board considered the response by the Adviser to recent market conditions and considered the overall performance of the Adviser in this context. The Fund’s ability to deliver competitive performance when compared to its Performance Peer Group (as defined below) was also deemed to be relevant by the Board as a useful indicator of how the Adviser is executing the Fund’s investment program. The Adviser’s ability to execute this program was one of the Board’s considerations in reaching a conclusion that the nature, extent and quality of the Adviser’s investment management and related services warrant the continuation of the Contract.
Fund Investment Performance
In evaluating the Fund’s investment performance, the Board considered performance results in light of the Fund’s investment objective, strategies and risks, as disclosed in the Fund’s prospectus. The Board also considered the Fund’s performance in light of the overall recent market conditions. The Board considered detailed investment reports on the Fund’s performance over different time periods that were provided to the Board throughout the year and in connection with the May Meetings and evaluated the Adviser’s analysis of the Fund’s performance for these time periods. The Board also reviewed comparative information regarding the performance of other mutual funds in the category of peer funds selected by Morningstar, Inc. (the “Morningstar”), an independent fund ranking organization (the “Performance Peer Group”), noting the CCO’s view that comparisons to fund peer groups may be helpful,
Annual Shareholder Report
though not conclusive, in evaluating the performance of the Adviser in managing the Fund. The Board considered, in evaluating such comparisons, that in some cases there may be differences in the funds’ investment objectives or investment management techniques, or the costs to implement funds, even within the same Performance Peer Group. In this connection, the Board considered that the Fund’s quantitative focus makes fee and expense comparisons particularly difficult as the funds in the Performance Peer Group varied widely in their complexity, and the management of the Fund is among the more complex relative to its Performance Peer Group.
For the one-year, three-year and five-year periods ended December 31, 2019, the Fund’s performance was above the median of the relevant Performance Peer Group. In addition, the Board was informed by the Adviser that, for the same periods, the Fund underperformed its benchmark index for the one-year, three-year and five-year periods.
Following such evaluation, and full deliberations, the Board concluded that the performance of the Fund supported renewal of the Contract.
Fund Expenses
While mindful that courts have cautioned against giving too much weight to comparative information concerning fees charged by other advisers for managing funds with comparable investment programs, the Board has found the use of such comparisons to be relevant to its deliberations. In this regard, the Board was presented with, and considered, information regarding the contractual advisory fee rates, net advisory fee rates, total expense ratios and each element of the Fund’s total expense ratio (i.e., gross and net advisory fees, administrative fees, custody fees, portfolio accounting fees and transfer agency fees) relative to an appropriate group of peer funds compiled by Federated Hermes from the category of peer funds selected by Morningstar (the “Expense Peer Group”). The Board received a description of the methodology used to select the Expense Peer Group from the overall Morningstar category. The Board also reviewed comparative information regarding the fees and expenses of the broader group of funds in the overall Morningstar category. The Board focused on comparisons with other similar mutual funds more heavily than non-mutual fund products or services because such comparisons are believed to be more relevant. The Board considered that other mutual funds are the products most like the Fund, in that they are readily available to Fund shareholders as alternative investment vehicles, and they are the type of investment vehicle, in fact, chosen and maintained by the Fund’s investors. The Board noted that the range of their fees and expenses, therefore, appears to be a relevant indicator of what consumers have found to be reasonable in the marketplace in which the Fund competes.
Annual Shareholder Report
The Board reviewed the contractual advisory fee rate, net advisory fee rate and other expenses of the Fund and noted the position of the Fund’s fee rates relative to its Expense Peer Group. In this regard, the Board noted that the contractual advisory fee rate was above the median of the relevant Expense Peer Group, but the Board noted the applicable waivers and reimbursements, and that the overall expense structure of the Fund remained competitive in the context of other factors considered by the Board. In this regard, the Board had been previously advised that, while comparisons to its Expense Peer Group are relevant in judging the reasonableness of advisory fees, the Fund’s quantitative focus makes fee and expense comparisons particularly difficult. Although the Fund’s advisory fee was above the median of its Expense Peer Group range, the funds in the Expense Peer Group varied widely in their complexity, and the Board has been informed that the management of the Fund is among the more complex relative to its Expense Peer Group.
For comparison, the Board received and considered information about the fees charged by Federated Hermes for providing advisory services to other types of clients with investment strategies similar to those of the Federated Hermes Funds, including non-mutual fund clients such as institutional separate accounts and third-party unaffiliated mutual funds for which the Adviser or its affiliates serve as sub-adviser. The Board noted the CCO’s conclusion that mon-mutual fund clients are inherently different products due to the following differences, among others: (i) different types of targeted investors; (ii) different applicable laws and regulations; (iii) different legal structures; (iv) different average account sizes and portfolio management techniques made necessary by different cash flows and different associated costs; (v) the time spent by portfolio managers and their teams (among other personnel across various departments, including legal, compliance and risk management) in reviewing securities pricing, addressing different administrative responsibilities, and addressing different degrees of risk associated with management; and (vi) a variety of different costs. The Board also considered information regarding the differences in the nature of the services required for Federated Hermes to manage its proprietary mutual fund business versus managing a discrete pool of assets as a sub-adviser to another institution’s mutual fund, noting that Federated Hermes generally performs significant additional services and assumes substantially greater risks in managing the Fund and other Federated Hermes Funds than in its role as sub-adviser to an unaffiliated third-party mutual fund. The Board noted that the CCO did not consider the fees for providing advisory services to other types of clients to be determinative in judging the appropriateness of the Federated Hermes Funds’ advisory fees.
The Board considered the CCO’s view that the services, administrative responsibilities and risks associated with such relationships are quite different than serving as a primary adviser to a fund.
Annual Shareholder Report
Following such evaluation, and full deliberations, the Board concluded that the fees and expenses of the Fund are reasonable and supported renewal of the Contract.
Profitability and Other Benefits
The Board also received financial information about Federated Hermes, including information regarding the compensation and ancillary (or “fall-out”) benefits Federated Hermes derived from its relationships with the Federated Hermes Funds. This information covered not only the fees under the Federated Hermes Funds’ investment advisory contracts, but also fees received by Federated Hermes’ affiliates for providing other services to the Federated Hermes Funds under separate contracts (e.g., for serving as the Federated Hermes Funds’ administrator and distributor). In this regard, the Board considered that certain of Federated Hermes’ affiliates provide distribution and shareholder services to the Federated Hermes Funds, for which they may be compensated through distribution and servicing fees paid pursuant to Rule 12b-1 plans or otherwise. The Board also received and considered information detailing any indirect benefit Federated Hermes may derive from its receipt of research services from brokers who execute portfolio trades for the Federated Hermes Funds. In addition, the Board considered the fact that, in order for the Federated Hermes Fund to be competitive in the marketplace, the Adviser and its affiliates frequently waived fees and/or reimbursed expenses and have disclosed to Federated Hermes Fund shareholders and/or reported to the Board their intention to do so in the future. Moreover, the Board received and considered regular reports from Federated Hermes throughout the year as to the institution, adjustment or elimination of these voluntary waivers and/or reimbursements.
The Board received and considered information furnished by Federated Hermes, as requested by the CCO, that reported revenues on a fund-by-fund basis and made estimates of the allocation of expenses on a fund-by-fund basis, using allocation methodologies specified by the CCO and described to the Board. The Board considered the CCO’s view that, while these cost allocation reports apply consistent allocation processes, the inherent difficulties in allocating costs continues to cause the CCO to question the precision of the process and to conclude that such reports may be unreliable, because a single change in an allocation estimate may dramatically alter the resulting estimate of cost and/or profitability of a Federated Hermes Fund and may produce unintended consequences. The allocation information, including the CCO’s view that fund-by-fund estimations may be unreliable, was considered in the evaluation by the Board. In addition, the Board considered that, during the prior year, an independent consultant conducted a review of the allocation methodologies used by Federated Hermes in estimating profitability for
Annual Shareholder Report
purposes of reporting to the Board in connection with the continuation of the Contract. The Board noted the consultant’s view that, although there is no single best method to allocate expenses, the methodologies used by Federated Hermes are reasonable.
The Board also reviewed information compiled by Federated Hermes comparing its profitability information to other publicly held fund management companies, including information regarding profitability trends over time. The Board considered the CCO’s conclusion that, based on such profitability information, Federated Hermes’ profit margins did not appear to be excessive. The Board also considered the CCO’s view that Federated Hermes appeared financially sound, with the resources necessary to fulfill its obligations under its contracts with the Federated Hermes Funds.
In 2019, the Board approved a reduction of 5 basis points in the contractual advisory fee.
Economies of Scale
The Board received and considered information about the notion of possible realization of “economies of scale” as a fund grows larger, the difficulties of calculating economies of scale at an individual fund level, and the extent to which potential scale benefits are shared with shareholders. In this regard, the Board considered that Federated Hermes has made significant and long-term investments in areas that support all of the Federated Hermes Funds, such as personnel and processes for the portfolio management, trading operations, issuer engagement (including with respect to ESG matters), shareholder services, compliance, business continuity, internal audit and risk management functions, as well as systems technology (including technology relating to cybersecurity) and use of data. The Board noted that Federated Hermes’ investments in these areas are extensive and are designed to provide enhanced services to the Federated Hermes Funds and their shareholders. The Board considered that the benefits of these investments (as well as the benefits of any economies of scale, should they exist) are likely to be shared with the Federated Hermes Fund family as a whole. In addition, the Board considered that the Adviser and its affiliates have frequently waived fees and/or reimbursed expenses for the Federated Hermes Funds and that such waivers and reimbursements are another means for potential economies of scale to be shared with shareholders and can provide protection from an increase in expenses if a Federated Hermes Fund’s assets decline. Federated Hermes, as it does throughout the year, and specifically in connection with the Board’s review of the Contract, furnished information relative to adviser-paid fees (commonly referred to as revenue sharing). The Board considered the beliefs of Federated Hermes and the CCO that this information should be viewed to determine if there was an incentive to either not apply breakpoints or to apply breakpoints, at higher levels and should not be viewed to determine the appropriateness of advisory fees. The Board also noted the absence of any
Annual Shareholder Report
applicable regulatory or industry guidelines on this subject, which is compounded by the lack of any common industry practice or general pattern with respect to structuring fund advisory fees with “breakpoints” that serve to reduce the fee as a fund attains a certain size.
Conclusions
The Board considered the CCO’s conclusion that his observations and the information accompanying the CCO Fee Evaluation Report show that the management fee for the Fund was reasonable and the CCO’s recommendation that the Board approve the management fee. The Board noted that, under these circumstances, no changes were recommended to, and no objection was raised to the continuation of, the Contract by the CCO. The CCO also recognized that the Board’s evaluation of the Federated Hermes Funds’ advisory and subadvisory arrangements is a continuing and on-going process that is informed by the information that the Board requests and receives from management throughout the course of the year and, in this regard, the CCO noted certain items for future reporting to the Board or further consideration by management as the Board continues its on-going oversight of the Federated Hermes Funds.
In its determination to continue an existing investment advisory contract, the Board was mindful of the potential disruptions of the Fund’s operations and various risks, uncertainties and other effects that could occur as a result of a decision to terminate or not renew an investment advisory contract. In particular, the Board recognized that many shareholders have invested in the Fund on the strength of the Adviser’s industry standing and reputation and with the expectation that the Adviser will have a continuing role in providing advisory services to the Fund. Thus, the Board’s approval of the Contract reflected the fact that it is the shareholders who have effectively selected the Adviser by virtue of having invested in the Fund. The Board concluded that, in light of the factors summarized above, including the nature, quality and scope of the services provided to the Fund by the Adviser and its affiliates, continuation of the Contract was appropriate.
The Board based its determination to approve the Contract on the totality of the circumstances and relevant factors and with a view to past and future long-term considerations. Not all of the factors and considerations identified above were necessarily deemed to be relevant to the Fund, nor did the Board consider any one of them to be determinative. With respect to the factors that were deemed to be relevant, the Board’s determination to approve the continuation of the Contract reflects its view that Federated Hermes’ performance and actions provided a satisfactory basis to support the determination to continue the existing arrangement.
Annual Shareholder Report
Liquidity Risk Management Program– Annual Evaluation of Adequacy and Effectiveness
In accordance with Rule 22e-4 under the Investment Company Act of 1940, as amended (the “Liquidity Rule”), Federated Hermes MDT Series (the “Trust”) has adopted and implemented a liquidity risk management program (the “LRMP”) for Federated Hermes MDT All Cap Core Fund (the “Fund” and collectively with the Federated Hermes funds, the “Funds”). The LRMP seeks to assess and manage the Fund’s liquidity risk. “Liquidity risk” is defined under the Liquidity Rule as the risk that the Fund is unable to meet redemption requests without significantly diluting remaining investors’ interests in the Fund. The Board of Trustees of the Trust (the “Board”) has approved the designation of the Funds’ investment advisers as the administrators for the LRMP (collectively, the “Administrator”). The Administrator has established a Liquidity Risk Management Committee (the “Committee”) comprised of representatives from various departments across the Administrator to assist it in the implementation and on-going administration of the LRMP. The Committee, in turn, has delegated to the Fixed Income and Equities Liquidity Committees, each a separate committee previously established by the Administrator, the responsibility to review and assess certain information related to the liquidity of the Funds that fall within their respective asset classes.
The Program is comprised of various components designed to support the assessment and/or management of liquidity risk, including: (1) the periodic assessment (no less frequently than annually) of certain factors that influence the Fund’s liquidity risk; (2) the periodic classification (no less frequently than monthly) of the Fund’s investments into one of four liquidity categories that reflect an estimate of their liquidity under current market conditions; (3) a 15% limit on the acquisition of “illiquid investments” (as defined under the Liquidity Rule); (4) to the extent a Fund does not invest primarily in “highly liquid investments” (as defined under the Liquidity Rule), the determination of a minimum percentage of the Fund’s assets that generally will be invested in highly liquid investments (an “HLIM”); (5) if a Fund has established an HLIM, the periodic review (no less frequently than annually) of the HLIM and the adoption of policies and procedures for responding to a shortfall of the Fund’s highly liquid investments below its HLIM; and (6) periodic reporting to the Board.
At its meetings in May 2020, the Board received and reviewed a written report from the Funds’ Chief Compliance Officer and Chief Risk Officer, on behalf of the Administrator, concerning the operation of the LRMP for the period from the LRMP’s inception on December 1, 2018 through March 31, 2020 (the “Period”). The Report addressed the operation of the LRMP and assessed its adequacy and effectiveness, including, where applicable, the operation of any HLIM established for a Fund. There were no
Annual Shareholder Report
material changes to the LRMP during the Period. The Report summarized the operation of the Program and the information and factors considered by the Administrator in assessing whether the Program has been adequately and effectively implemented with respect to the Funds. Such information and factors included, among other things:
| ■ | the liquidity risk framework used to assess, manage, and periodically review each Fund’s liquidity risk and the results of this assessment, including a review of the Funds’ access to other available funding sources such as the Funds’ interfund lending facility, redemptions in-kind and committed lines of credit and confirmation that the Fund did not have to access any of these alternative funding sources during the Period; |
| ■ | the periodic classifications of the Fund’s investments into one of four liquidity categories and the methodologies and inputs used to classify the investments, including the Fund’s reasonably anticipated trade size; |
| ■ | the analysis received from a third-party liquidity assessment vendor that is taken into account in the process of determining the liquidity classifications of the Fund’s investments and the results of an evaluation of the services performed by the vendor in support of this process; |
| ■ | the fact that the Fund invested primarily in highly liquid investments during the Period and, therefore, was not required to establish, and has not established, an HLIM and the procedures for monitoring the status of the Fund as investing primarily in highly liquid investments; |
| ■ | the fact that the Fund invested no more than 15% of its assets in illiquid investments during the Period and the procedures for monitoring this limit; and |
| ■ | liquidity events during the Period, including the impact on liquidity caused by extended non-U.S. market closures and the market disruptions resulting from the novel coronavirus outbreak, and the fact that there were no specific liquidity events during the Period that materially affected the Fund’s liquidity risk. |
Based on this review, the Administrator concluded that the LRMP is operating effectively to assess and manage the Fund’s liquidity risk, and that the Program has been and continues to be adequately and effectively implemented to monitor and, as applicable, respond to the Fund’s liquidity developments.
Annual Shareholder Report
Voting Proxies on Fund Portfolio Securities
A description of the policies and procedures that the Fund uses to determine how to vote proxies, if any, relating to securities held in the Fund’s portfolio is available, without charge and upon request, by calling 1-800-341-7400. A report on “Form N-PX” of how the Fund voted any such proxies during the most recent 12-month period ended June 30 is available via the Proxy Voting Record (Form N-PX) link associated with the Fund and share class name at FederatedInvestors.com/FundInformation. Form N-PX filings are also available at the SEC’s website at sec.gov.
Quarterly Portfolio Schedule
Each fiscal quarter, the Fund will file with the SEC a complete schedule of its monthly portfolio holdings on “Form N-PORT.” The Fund’s holdings as of the end of the third month of every fiscal quarter, as reported on Form N-PORT, will be publicly available on the SEC’s website at sec.gov within 60 days of the end of the fiscal quarter upon filing. You may also access this information via the link to the Fund and share class name at FederatedInvestors.com.
Annual Shareholder Report
Mutual funds are not bank deposits or obligations, are not guaranteed by any bank and are not insured or guaranteed by the U.S. government, the Federal Deposit Insurance Corporation, the Federal Reserve Board or any other government agency. Investment in mutual funds involves investment risk, including the possible loss of principal.
This Report is authorized for distribution to prospective investors only when preceded or accompanied by the Fund’s Prospectus, which contains facts concerning its objective and policies, management fees, expenses and other information.
Federated Hermes MDT All Cap Core Fund
Federated Hermes Funds
4000 Ericsson Drive
Warrendale, PA 15086-7561
Contact us at FederatedInvestors.com
or call 1-800-341-7400.
Federated Securities Corp., Distributor
CUSIP 31421R106
CUSIP 31421R205
CUSIP 31421R304
CUSIP 31421R718
37309 (9/20)
© 2020 Federated Hermes, Inc.

Annual Shareholder Report
July 31, 2020
| Share Class | Ticker | A | QABGX | C | QCBGX | Institutional | QIBGX | R6 | QKBGX |
Federated Hermes MDT Balanced Fund
(formerly, Federated MDT Balanced Fund)
Fund Established 2002
A Portfolio of Federated Hermes MDT Series
(formerly, Federated MDT Series)
IMPORTANT NOTICE REGARDING REPORT DELIVERY
Beginning on January 1, 2021, as permitted by regulations adopted by the Securities and Exchange Commission, paper copies of the Fund’s shareholder reports like this one will no longer be sent by mail, unless you specifically request paper copies of the reports from the Fund or from your financial intermediary, such as a broker-dealer or bank. Instead, the reports will be made available on a website, and you will be notified by mail each time a report is posted and provided with a website link to access the report.
If you already elected to receive shareholder reports electronically, you will not be affected by this change and you need not take any action. You may elect to receive shareholder reports and other communications from the Fund or your financial intermediary electronically by contacting your financial intermediary (such as a broker-dealer or bank); other shareholders may call the Fund at 1-800-341-7400, Option 4.
You may elect to receive all future reports in paper free of charge. You can inform the Fund or your financial intermediary that you wish to continue receiving paper copies of your shareholder reports by contacting your financial intermediary (such as a broker-dealer or bank); other shareholders may call the Fund at 1-800-341-7400, Option 4. Your election to receive reports in paper will apply to all funds held with the Fund complex or your financial intermediary.
Not FDIC Insured ■ May Lose Value ■ No Bank Guarantee
J. Christopher
Donahue
President
Federated Hermes MDT Balanced Fund
Letter from the President
Dear Valued Shareholder,
I am pleased to present the Annual Shareholder Report for your fund covering the period from August 1, 2019 through July 31, 2020.
As we all confront the unprecedented effects of the coronavirus and the challenges it presents to our families, communities, businesses and the financial markets, I want you to know that everyone at Federated Hermes is dedicated to helping you successfully navigate the markets ahead. You can count on us for the insights, investment management knowledge and client service that you have come to expect. Please refer to our website, FederatedInvestors.com, for timely updates on this and other economic and market matters.
Thank you for investing with us. I hope you find this information useful and look forward to keeping you informed.
Sincerely,
J. Christopher Donahue, President
CONTENTS
| 1 |
| 7 |
| 9 |
| 35 |
| 39 |
| 41 |
| 43 |
| 44 |
| 57 |
| 59 |
| 61 |
| 67 |
| 76 |
| 78 |
| 78 |
Management’s Discussion of Fund Performance (unaudited)
The total return of Federated Hermes MDT Balanced Fund (the “Fund”), based on net asset value, for the 12-month reporting period ended July 31, 2020, was 9.08% for Class A Shares, 8.25% for Class C Shares, 9.33% for Institutional Shares and 9.26% for Class R6 Shares. Over the same period, the Fund’s custom blended benchmark (“Blended Index”),1 which consists of a 60%/40% blend of the Standard & Poor’s 500 Index (S&P 500),2 and the Bloomberg Barclays U.S. Aggregate Bond Index (BAB),3 returned 11.84%. The total return of the Morningstar Allocation 50% - 70% Equity Category Average (MA50-70),4 a peer group average for the Fund, was 5.43% during the period. The Fund’s and the MA50-70’s total return for the most recently completed fiscal year reflected actual cash flows, transaction costs and other expenses, which were not reflected in the total return of the Blended Index.
During the reporting period, the Fund’s investment strategy focused on security selection within the domestic equity and Real Estate Investment Trust (REIT) segments of the portfolio, sector allocation within the fixed-income segment of the portfolio, and overall asset allocation. These were the most significant factors affecting the Fund’s performance relative to the Blended Index during the period.
The following discussion will focus on the performance of the Fund’s Institutional Shares relative to the Blended Index.
MArket Overview
The twelve months of this reporting period, culminating with the COVID-19 pandemic, saw huge volatility in the domestic market. Despite the dramatic decline and recovery in the first half of 2020, the whole market Russell 3000® Index5 was up 10.93% for the full period. However, looking more deeply at the subindexes revealed the wildness of the market. Large caps dominated small caps:6 the mega-cap Russell Top 200® Index7 returned 15.84%, while the Russell Midcap® Index8 returned 2.04% and the small-cap Russell 2000® Index9 returned -5.57%. In addition, once again, growth dominated value: the Russell 3000® Growth Index10 returned 28.24% while the Russell 3000® Value Index11 returned -6.67%.
International equities12 in developed markets underperformed the domestic equity market during the reporting period with the Morgan Stanley Capital International (MSCI) Europe, Australasia and Far East (EAFE) Index13 returning -1.67%. Emerging market14 equity results were modestly better, with the MSCI Emerging Markets Index15 returning 6.55%.
Interest rates decreased across the maturity spectrum during the period, while investment-grade credit spreads, despite some significant volatility, finished roughly flat leading to a positive result for the BAB, which returned 10.12%.16
Annual Shareholder Report
EQUITIES
Domestic equity investments finished ahead of their benchmark, the Russell 3000® Index, during the period. Investments in the Information Technology, Industrials and Energy sectors were the most significant positive factors, while investments in the Healthcare and Consumer Discretionary sectors were the most significant negative contributors to relative results.
FIXED INCOME
During the reporting period, the fixed-income portion of the portfolio outperformed the BAB. Sector allocation made the most significant positive contribution to relative performance with security selection also contributing. An overweight relative position in Treasury Inflation Protected Securities also contributed positively late in the period.
ASSET ALLOCATION
Although the performance differential between equities and fixed income was marginal over the entire period, a larger overweight to equities during the volatile period early in 2020 and smaller relative overweight to equities during the rapid recovery in the second quarter of the year hurt Fund performance.
REITS
REIT investments finished ahead of their benchmark, the MSCI US REIT Index,17 during the reporting period. An overweight position in shares of companies in the Industrial sector and underweight position in shares of companies in the Retail sector were the most significant positive factors in the Fund’s relative results.
| 1 | The Fund’s Blended Index, which reflects 60% of the S&P 500 and 40% of the BAB, is being used for comparison purposes because, although it is not the Fund’s broad-based securities market index, the Fund’s Adviser believes it is more reflective of the Fund’s balanced investment style. |
| 2 | Please see the footnotes to the line graphs below for definitions of, and further information about, the S&P 500 Index, one of the Fund’s broad-based securities market indices. The S&P 500’s return for the 12-month reporting period was 11.96%. |
| 3 | Please see the footnotes to the line graphs below for definitions of, and further information about, the BAB, one of the Fund’s broad-based securities market indices. The BAB’s return for the 12-month reporting period was 10.12%. |
| 4 | Please see the footnotes to the line graphs below for definitions of, and further information about, the MA50-70. |
| 5 | The Russell 3000® Index measures the performance of the largest 3,000 U.S. companies representing approximately 98% of the investable U.S. equity market. The Russell 3000® Index is constructed to provide a comprehensive, unbiased, and stable barometer of the broad market and is completely reconstituted annually to ensure new and growing equities are reflected.* |
| 6 | Small-cap stocks may be less liquid and subject to greater price volatility than large-cap stocks. |
Annual Shareholder Report
| 7 | The Russell Top 200® Index measures the performance of the largest cap segment of the U.S. equity universe. The Russell Top 200® Index is a subset of the Russell 3000® Index. It includes approximately 200 of the largest securities based on a combination of their market cap and current index membership and represents approximately 68% of the U.S. market. The Russell Top 200® Index is constructed to provide a comprehensive and unbiased barometer for this very large cap segment and is completely reconstituted annually to ensure new and growing equities are reflected.* |
| 8 | The Russell Midcap® Index measures the performance of the mid-cap segment of the U.S. equity universe. The Russell Midcap® Index is a subset of the Russell 1000® Index. It includes approximately 800 of the smallest securities based on a combination of their market cap and current index membership. The Russell Midcap® Index represents approximately 31% of the total market capitalization of the Russell 1000® companies. The Russell Midcap® Index is constructed to provide a comprehensive and unbiased barometer for the mid-cap segment. The Russell Midcap Index is completely reconstituted annually to ensure larger stocks do not distort the performance and characteristics of the true mid-cap opportunity set.* |
| 9 | The Russell 2000® Index measures the performance of the small-cap segment of the U.S. equity universe. The Russell 2000® Index is a subset of the Russell 3000® Index representing approximately 10% of the total market capitalization of that index. It includes approximately 2000 of the smallest securities based on a combination of their market cap and current index membership. The Russell 2000® Index is constructed to provide a comprehensive and unbiased small-cap barometer and is completely reconstituted annually to ensure larger stocks do not distort the performance and characteristics of the true small-cap opportunity set.* |
| 10 | The Russell 3000® Growth Index measures the performance of the broad growth segment of the U.S. equity universe. It includes those Russell 3000® Index companies with higher price-to-book ratios and higher forecasted growth values. The Russell 3000® Growth Index is constructed to provide a comprehensive, unbiased and stable barometer of the broad growth market. The Russell 3000® Growth Index is completely reconstituted annually to ensure new and growing equities are included and that the represented companies continue to reflect growth characteristics.* |
| 11 | The Russell 3000® Value Index measures the performance of the broad value segment of U.S. equity value universe. It includes those Russell 3000® Index companies with lower price-to-book ratios and lower forecasted growth values. The Russell 3000® Value Index is constructed to provide a comprehensive, unbiased and stable barometer of the broad value market. The Russell 3000® Value Index is completely reconstituted annually to ensure new and growing equities are included and that the represented companies continue to reflect value characteristics.* |
| 12 | International investing involves special risks including currency risk, increased volatility of foreign securities, political risks and differences in auditing and other financial standards. |
| 13 | The MSCI US EAFE Index measures international equity performance. It comprises 22 MSCI country indices, representing the developed markets outside of North America.* |
| 14 | Prices of emerging markets securities can be significantly more volatile than the prices of securities in developed countries, and currency risks and political risks are accentuated in emerging markets. |
| 15 | The MSCI Emerging Markets Index is an unmanaged index consisting of 21 emerging market countries.* |
| 16 | Bond prices are sensitive to changes in interest rates and a rise in interest rates can cause a decline in their prices. |
| 17 | The MSCI REIT Index is a free float-adjusted market capitalization weighted index that is comprised of equity Real Estate Investment Trusts (REITs). The index is based on the MSCI USA Investable Market Index (IMI), its parent index, which captures the large, mid and small cap segments of the USA market.* |
| * | The index is unmanaged, and it is not possible to invest directly in an index. |
Annual Shareholder Report
FUND PERFORMANCE AND GROWTH OF A $10,000 INVESTMENT
The graph below illustrates the hypothetical investment of $10,0001 in the Federated Hermes MDT Balanced Fund from July 31, 2010 to July 31, 2020, compared to the Standard and Poor’s 500 Index (S&P 500),2 the Bloomberg Barclays U.S. Aggregate Bond Index (BAB),3 60% S&P 500/40% BAB (Blended Index) and the Morningstar Allocation-50% to 70% Equity Funds Average (MA50-70).4 The Average Annual Total Return table below shows returns for each class averaged over the stated periods.
Growth of a $10,000 Investment
Growth of $10,000 as of July 31, 2020
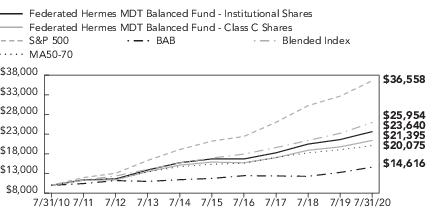
| Federated Hermes MDT Balanced Fund - | Institutional Shares | Class C Shares | S&P 500 | BAB | Blended Index | MA50-70 |
| F | F | I | I | I | I |
| 7/31/2010 | 10,000 | 10,000 | 10,000 | 10,000 | 10,000 | 10,000 |
| 7/31/2011 | 11,399 | 11,285 | 11,965 | 10,444 | 11,361 | 11,347 |
| 7/31/2012 | 11,612 | 11,390 | 13,058 | 11,201 | 12,361 | 11,711 |
| 7/31/2013 | 13,892 | 13,486 | 16,322 | 10,988 | 14,041 | 13,375 |
| 7/31/2014 | 15,739 | 15,124 | 19,087 | 11,424 | 15,683 | 14,752 |
| 7/31/2015 | 16,703 | 15,899 | 21,226 | 11,747 | 16,922 | 15,340 |
| 7/31/2016 | 16,692 | 15,724 | 22,417 | 12,444 | 17,937 | 15,612 |
| 7/31/2017 | 18,255 | 17,019 | 26,014 | 12,380 | 19,585 | 17,086 |
| 7/31/2018 | 20,473 | 18,906 | 30,238 | 12,281 | 21,393 | 18,260 |
| 7/31/2019 | 21,622 | 19,765 | 32,653 | 13,273 | 23,207 | 19,037 |
| 7/31/2020 | 23,640 | 21,395 | 36,558 | 14,616 | 25,954 | 20,075 |
41 graphic description end -->
| ■ | Total returns shown for Class C Shares include the maximum contingent deferred sales charge of 1.00% as applicable. |
The Fund offers multiple share classes whose performance may be greater than or less than its other share class(es) due to differences in sales charges and expenses. See the Average Annual Total Return table below for the returns of additional classes not shown in the line graph above.
Annual Shareholder Report
Average Annual Total Returns for the Periods Ended 7/31/2020
(returns reflect all applicable sales charges and contingent deferred sales charges as specified below in footnote #1)
| | 1 Year | 5 Years | 10 Years |
| Class A Shares | 3.07% | 5.71% | 8.10% |
| Class C Shares | 7.25% | 6.12% | 7.90% |
| Institutional Shares | 9.33% | 7.19% | 8.98% |
| Class R6 Shares5 | 9.26% | 7.07% | 8.58% |
| S&P 500 | 11.96% | 11.49% | 13.84% |
| BAB | 10.12% | 4.47% | 3.87% |
| Blended Index | 11.84% | 8.93% | 10.01% |
| MA50-70 | 5.43% | 5.81% | 7.76% |
Performance data quoted represents past performance which is no guarantee of future results. Investment return and principal value will fluctuate so that an investor’s shares, when redeemed, may be worth more or less than their original cost. Mutual fund performance changes over time and current performance may be lower or higher than what is stated. For current to the most recent month-end performance and after-tax returns, visit FederatedInvestors.com or call 1-800-341-7400. Returns shown do not reflect the deduction of taxes that a shareholder would pay on Fund distributions or the redemption of Fund shares. Mutual funds are not obligations of or guaranteed by any bank and are not federally insured.
| 1 | Represents a hypothetical investment of $10,000 in the Fund after deducting applicable sales charges: for Class A Shares, the maximum sales charge of 5.50% ($10,000 investment minus $550 sales charge = $9,450); for Class C Shares, a 1.00% contingent deferred sales charge would be applied on any redemption less than one year from the purchase date. The Fund’s performance assumes the reinvestment of all dividends and distributions. The S&P 500, BAB and MA50-70 have been adjusted to reflect reinvestment of dividends on securities in the indexes. |
| 2 | The S&P 500 Index, a broad-based securities market index of the Fund, is an unmanaged capitalization-weighted index of 500 stocks designed to measure performance of the broad domestic economy through changes in the aggregate market value of 500 stocks representing all major industries. The S&P 500 is unmanaged and, unlike the Fund, is not affected by cash flows. It is not possible to invest directly in an index. The S& P 500 is not adjusted to reflect sales charges, expenses or other fees that the Securities and Exchange Commission (SEC) requires to be reflected in the Fund’s performance. |
| 3 | The BAB Index, a broad-based securities market index of the Fund, is a broad-based benchmark that measures the investment-grade, U.S. dollar-denominated, fixed-rate taxable bond market. The BAB is unmanaged and, unlike the Fund, is not affected by cash flows. It is not possible to invest directly in an index. The BAB is not adjusted to reflect sales charges, expenses or other fees that the SEC requires to be reflected in the Fund’s performance. |
Annual Shareholder Report
| 4 | Morningstar figures represent the average of the total returns reported by all the funds designated by Morningstar as falling into the respective category indicated. They do not reflect sales charges. The Morningstar figures in the Growth of $10,000 line graph are based on historical return information published by Morningstar and reflect the return of the funds comprising the category in the year of publication. Because the funds designated by Morningstar as falling into the category can change over time, the Morningstar figures in the line graph may not match the Morningstar figures in the Average Annual Total Returns table, which reflect the return of the funds that currently comprise the category. |
| 5 | Prior to September 1, 2016, Class R6 Shares were known as Class R Shares and included 12b-1 fees and certain other expenses. As of September 1, 2016, Class R6 does not include such 12b-1 fees and certain other expenses, and the performance shown above for Class R6 prior to September 1, 2016, reflects the higher Class R expenses. |
Annual Shareholder Report
Portfolio of Investments Summary Tables (unaudited)
At July 31, 2020, the Fund’s portfolio composition1 was as follows:
| Security Type | Percentage of
Total Net Assets |
| Domestic Equity Securities | 54.6% |
| Corporate Debt Securities | 15.2% |
| International Equity Securities (including International Exchange-Traded Funds) | 8.0% |
| Federated Mortgage Core Portfolio | 6.9% |
| High Yield Bond Portfolio | 2.3% |
| Emerging Markets Core Fund | 1.9% |
| Commercial Mortgage-Backed Securities | 1.8% |
| Federated Bank Loan Core Fund | 1.6% |
| Project and Trade Finance Core Fund | 1.5% |
| U.S. Treasury Securities2 | 1.0% |
| Municipal Bonds | 0.6% |
| Mortgage-Backed Securities | 0.5% |
| Asset-Backed Securities | 0.5% |
| Government Agency | 0.2% |
| Collateralized Mortgage Obligations | 0.0%3 |
| Securities Lending Collateral4 | 0.9% |
| Derivative Contracts5 | 0.0%3 |
| Cash Equivalents6 | 3.3% |
| Other Assets and Liabilities—Net7 | (0.8)% |
| TOTAL | 100.0% |
| 1 | See the Fund’s Prospectus and Statement of Additional Information for a description of the types of securities in which the Fund invests. As of the date specified above, the Fund owned shares of one or more affiliated investment companies. For purposes of this table, affiliated investment companies (other than an affiliated money market mutual fund) in which the Fund invested less than 10% of its net assets, are listed individually in the table. |
| 2 | Includes U.S. Treasuries pledged as collateral to ensure the Fund is able to satisfy the obligations of its outstanding futures contracts. |
| 3 | Represents less than 0.1%. |
| 4 | Represents cash collateral received for portfolio securities on loan that may be invested in affiliated money market funds, other money market instruments and/or repurchase agreements. |
| 5 | Based upon net unrealized appreciation (depreciation) or value of the derivative contracts as applicable. Derivative contracts may consist of futures, forwards, options and swaps. The impact of a derivative contract on the Fund’s performance may be larger than its unrealized appreciation (depreciation) or value may indicate. In many cases, the notional value or amount of a derivative contract may provide a better indication of the contract’s significance to the portfolio. More complete information regarding the Fund’s direct investments in derivative contracts, including unrealized appreciation (depreciation), value and notional values or amounts of such contracts, can be found in the table at the end of the Portfolio of Investments included in this Report. |
| 6 | Cash Equivalents include any investments in money market mutual funds and/or overnight repurchase agreements other than those representing cash collateral for securities lending. |
| 7 | Assets, other than investments in securities and derivative contracts, less liabilities. See Statement of Assets and Liabilities. |
| | |
Annual Shareholder Report
At July 31, 2020, the Fund’s sector composition8 for its equity securities (excluding exchange-traded funds) was as follows:
| Sector Composition | Percentage of
Equity Securities |
| Information Technology | 26.2% |
| Health Care | 14.6% |
| Consumer Discretionary | 12.0% |
| Financials | 10.9% |
| Communication Services | 9.3% |
| Industrials | 8.2% |
| Consumer Staples | 7.3% |
| Real Estate | 5.1% |
| Materials | 2.6% |
| Utilities | 2.0% |
| Energy | 1.8% |
| TOTAL | 100.0% |
| 8 | Sector classifications are based upon, and individual portfolio securities are assigned to, the classifications of the Global Industry Classification Standard (GICS) except that the Adviser assigns a classification to securities not classified by the GICS and to securities for which the Adviser does not have access to the classification made by the GICS. |
Annual Shareholder Report
Portfolio of Investments
July 31, 2020
Shares or
Principal
Amount | | | Value |
| | | COMMON STOCKS—55.1% | |
| | | Communication Services—5.2% | |
| 4,243 | | Activision Blizzard, Inc. | $350,599 |
| 2,376 | 1 | Alphabet, Inc., Class A | 3,535,369 |
| 429 | | Cable One, Inc. | 781,878 |
| 21,112 | 1 | Cars.com, Inc. | 171,429 |
| 6,754 | | CenturyLink, Inc. | 65,176 |
| 14,105 | | Cogent Communications Holdings, Inc. | 1,271,002 |
| 1,550 | 1 | Facebook, Inc. | 393,189 |
| 28,128 | 1 | MSG Networks, Inc. | 268,060 |
| 5,694 | | Meredith Corp. | 81,766 |
| 942 | 1 | Netflix, Inc. | 460,525 |
| 18,917 | 1 | TripAdvisor, Inc. | 382,691 |
| 14,027 | | Verizon Communications, Inc. | 806,272 |
| | | TOTAL | 8,567,956 |
| | | Consumer Discretionary—6.6% | |
| 1,029 | 1 | Amazon.com, Inc. | 3,256,456 |
| 3,994 | 1 | American Axle & Manufacturing Holdings, Inc. | 28,198 |
| 214 | 1 | AutoZone, Inc. | 258,388 |
| 5,653 | 1 | Cooper-Standard Holding, Inc. | 60,544 |
| 860 | | Dollar General Corp. | 163,744 |
| 4,465 | | Domino’s Pizza, Inc. | 1,726,214 |
| 11,226 | | eBay, Inc. | 620,573 |
| 1,947 | 1 | Etsy, Inc. | 230,486 |
| 24,635 | | Ford Motor Co. | 162,837 |
| 2,558 | 1 | G-III Apparel Group Ltd. | 25,298 |
| 1,931 | | Garmin Ltd. | 190,377 |
| 15,297 | | Goodyear Tire & Rubber Co. | 137,826 |
| 3,583 | | Home Depot, Inc. | 951,251 |
| 6,086 | | Lowe’s Cos., Inc. | 906,266 |
| 122 | 1 | Lululemon Athletica, Inc. | 39,722 |
| 74,144 | 2 | Macy’s, Inc. | 449,313 |
| 1,007 | | McDonald’s Corp. | 195,640 |
| 2,445 | 1 | Mohawk Industries, Inc. | 195,233 |
| 431 | 1 | O’Reilly Automotive, Inc. | 205,751 |
| 160 | 1 | Ulta Beauty, Inc. | 30,878 |
Annual Shareholder Report
Shares or
Principal
Amount | | | Value |
| | | COMMON STOCKS—continued | |
| | | Consumer Discretionary—continued | |
| 933 | 1,2 | Wayfair, Inc. | $248,262 |
| 5,695 | | Wingstop, Inc. | 889,844 |
| 581 | | Yum! Brands, Inc. | 52,900 |
| | | TOTAL | 11,026,001 |
| | | Consumer Staples—4.0% | |
| 6,096 | 1 | BJ’s Wholesale Club Holdings, Inc. | 244,145 |
| 6,046 | | Church and Dwight, Inc. | 582,411 |
| 3,924 | | Clorox Co. | 928,065 |
| 26,545 | | Colgate-Palmolive Co. | 2,049,274 |
| 1,430 | | Hershey Foods Corp. | 207,936 |
| 10,598 | | Kimberly-Clark Corp. | 1,611,320 |
| 5,398 | | PepsiCo, Inc. | 743,089 |
| 1,773 | | Procter & Gamble Co. | 232,476 |
| | | TOTAL | 6,598,716 |
| | | Energy—1.0% | |
| 3,965 | | Arch Resources, Inc. | 122,994 |
| 3,619 | | Cimarex Energy Co. | 88,521 |
| 5,090 | | Concho Resources, Inc. | 267,429 |
| 18,106 | 1,2 | Continental Resources, Inc. | 313,053 |
| 6,263 | | Devon Energy Corp. | 65,699 |
| 2,004 | | EOG Resources, Inc. | 93,887 |
| 6,773 | | Helmerich & Payne, Inc. | 120,763 |
| 21,158 | | Marathon Oil Corp. | 116,157 |
| 15,207 | | PBF Energy, Inc. | 131,997 |
| 18,653 | | Peabody Energy Corp. | 58,197 |
| 3,652 | | Phillips 66 | 226,497 |
| 1,097 | | Valero Energy Corp. | 61,684 |
| | | TOTAL | 1,666,878 |
| | | Financials—6.0% | |
| 5,354 | | Aflac, Inc. | 190,442 |
| 649 | | Alleghany Corp. | 338,986 |
| 10,929 | | Allstate Corp. | 1,031,588 |
| 339 | | Ameriprise Financial, Inc. | 52,081 |
| 992 | 1 | Arch Capital Group Ltd. | 30,504 |
| 2,285 | | Bank of New York Mellon Corp. | 81,917 |
| 109 | | BlackRock, Inc. | 62,676 |
| 10,600 | | Blackstone Mortgage Trust, Inc. | 255,142 |
Annual Shareholder Report
Shares or
Principal
Amount | | | Value |
| | | COMMON STOCKS—continued | |
| | | Financials—continued | |
| 13,355 | | Cincinnati Financial Corp. | $1,040,755 |
| 295 | | Everest Re Group Ltd. | 64,543 |
| 1,122 | | Globe Life, Inc. | 89,311 |
| 17,749 | | Huntington Bancshares, Inc. | 164,533 |
| 9,270 | | Intercontinental Exchange, Inc. | 897,151 |
| 3,042 | | MSCI, Inc., Class A | 1,143,731 |
| 1,320 | | Marketaxess Holdings, Inc. | 682,044 |
| 1,975 | | MetLife, Inc. | 74,754 |
| 4,729 | | NASDAQ, Inc. | 620,965 |
| 2,617 | | Northern Trust Corp. | 205,042 |
| 5,529 | | Prudential Financial, Inc. | 350,373 |
| 1,761 | | Reinsurance Group of America | 150,125 |
| 917 | | Selective Insurance Group, Inc. | 49,830 |
| 1,311 | | State Street Corp. | 83,629 |
| 18,817 | | The Travelers Cos., Inc. | 2,153,041 |
| 6,265 | | Zions Bancorporation, N.A. | 203,424 |
| | | TOTAL | 10,016,587 |
| | | Health Care—8.0% | |
| 803 | | Abbott Laboratories | 80,814 |
| 575 | | AbbVie, Inc. | 54,573 |
| 1,997 | 1 | Alexion Pharmaceuticals, Inc. | 204,673 |
| 2,138 | 1 | Allogene Therapeutics, Inc. | 78,400 |
| 3,941 | | Amgen, Inc. | 964,244 |
| 11,533 | 1 | AnaptysBio, Inc. | 207,133 |
| 906 | | Anthem, Inc. | 248,063 |
| 1,623 | 1 | Arcus Biosciences, Inc. | 31,941 |
| 3,231 | 1 | Biogen, Inc. | 887,523 |
| 1,819 | 1 | Biohaven Pharmaceutical Holding Co. Ltd. | 116,489 |
| 1,247 | | CIGNA Corp. | 215,344 |
| 3,813 | | CVS Health Corp. | 239,990 |
| 361 | | Cerner Corp. | 25,071 |
| 15,524 | 1,2 | Community Health Systems, Inc. | 77,310 |
| 2,172 | 1 | Constellation Pharmaceuticals, Inc. | 58,405 |
| 198 | | Cooper Cos., Inc. | 56,020 |
| 3,489 | 1 | Davita, Inc. | 304,904 |
| 2,758 | | Dentsply Sirona, Inc. | 123,007 |
| 5,319 | | Eli Lilly & Co. | 799,392 |
Annual Shareholder Report
Shares or
Principal
Amount | | | Value |
| | | COMMON STOCKS—continued | |
| | | Health Care—continued | |
| 474 | 1 | Emergent BioSolutions, Inc. | $52,728 |
| 2,364 | | Gilead Sciences, Inc. | 164,369 |
| 477 | 1 | Henry Schein, Inc. | 32,784 |
| 11,295 | 1 | Hologic, Inc. | 788,165 |
| 1,276 | | Humana, Inc. | 500,766 |
| 1,377 | 1 | IDEXX Laboratories, Inc. | 547,702 |
| 2,525 | 1 | Jazz Pharmaceuticals PLC | 273,331 |
| 7,106 | | Johnson & Johnson | 1,035,771 |
| 4,351 | 1,2 | Livongo Health, Inc. | 553,665 |
| 372 | | Medtronic PLC | 35,891 |
| 13,595 | | Merck & Co., Inc. | 1,090,863 |
| 413 | 1 | Molina Healthcare, Inc. | 76,281 |
| 7,854 | 1 | Myriad Genetics, Inc. | 94,798 |
| 2,796 | | Pfizer, Inc. | 107,590 |
| 6,969 | 1 | SAGE Therapeutics, Inc. | 317,577 |
| 229 | 1 | United Therapeutics Corp. | 25,527 |
| 481 | | UnitedHealth Group, Inc. | 145,637 |
| 275 | | Universal Health Services, Inc., Class B | 30,222 |
| 3,623 | 1 | Vertex Pharmaceuticals, Inc. | 985,456 |
| 3,469 | 1 | Waters Corp. | 739,417 |
| 6,704 | | Zoetis, Inc. | 1,016,863 |
| | | TOTAL | 13,388,699 |
| | | Industrials—4.5% | |
| 2,875 | | AGCO Corp. | 188,686 |
| 1,328 | 1 | Atlas Air Worldwide Holdings, Inc. | 69,162 |
| 978 | | Brinks Co. (The) | 43,374 |
| 7,124 | 1 | CIRCOR International, Inc. | 186,791 |
| 869 | | Curtiss Wright Corp. | 77,445 |
| 1,162 | | Deluxe Corp. | 32,803 |
| 2,437 | | Flowserve Corp. | 67,919 |
| 19,553 | | Fluor Corp. | 199,245 |
| 3,828 | | Hexcel Corp. | 142,784 |
| 1,756 | | Hubbell, Inc. | 237,007 |
| 1,536 | | Huntington Ingalls Industries, Inc. | 266,819 |
| 118,888 | | KAR Auction Services, Inc. | 1,798,776 |
| 1,586 | | Lockheed Martin Corp. | 601,047 |
| 4,178 | | Masco Corp. | 238,815 |
Annual Shareholder Report
Shares or
Principal
Amount | | | Value |
| | | COMMON STOCKS—continued | |
| | | Industrials—continued | |
| 10,000 | | Pitney Bowes, Inc. | $33,400 |
| 3,596 | | Republic Services, Inc. | 313,751 |
| 7,730 | 1 | SPX Corp. | 324,660 |
| 43,219 | | Spirit AeroSystems Holdings, Inc., Class A | 845,796 |
| 1,133 | | TransUnion | 101,483 |
| 6,644 | | Verisk Analytics, Inc. | 1,253,789 |
| 447 | | W.W. Grainger, Inc. | 152,664 |
| 4,590 | | Xylem, Inc. | 334,978 |
| | | TOTAL | 7,511,194 |
| | | Information Technology—14.4% | |
| 3,302 | 1 | Adobe, Inc. | 1,467,145 |
| 1,827 | | Alliance Data Systems Corp. | 81,046 |
| 757 | | Analog Devices, Inc. | 86,941 |
| 6,124 | | Apple, Inc. | 2,602,945 |
| 6,309 | | Applied Materials, Inc. | 405,858 |
| 1,534 | 1 | Autodesk, Inc. | 362,684 |
| 6,808 | | Booz Allen Hamilton Holding Corp. | 556,622 |
| 1,401 | | Broadcom, Inc. | 443,767 |
| 18,281 | 1 | Cadence Design Systems, Inc. | 1,997,199 |
| 4,701 | 1 | Cirrus Logic, Inc. | 322,160 |
| 570 | | Citrix Systems, Inc. | 81,373 |
| 2,144 | | Cognizant Technology Solutions Corp. | 146,478 |
| 134 | 1 | Coupa Software, Inc. | 41,064 |
| 3,449 | 1 | Crowdstrike Holdings, Inc. | 390,427 |
| 110,250 | | DXC Technology Co. | 1,974,577 |
| 9,157 | 1 | DocuSign, Inc. | 1,985,512 |
| 12,780 | 1 | Dynatrace Holdings LLC | 534,587 |
| 247 | 1 | FleetCor Technologies, Inc. | 63,867 |
| 2,216 | 1 | Fortinet, Inc. | 306,473 |
| 395 | | Henry Jack & Associates, Inc. | 70,428 |
| 9,407 | 1 | Inphi Corp. | 1,229,119 |
| 9,807 | | Intel Corp. | 468,088 |
| 302 | | Intuit, Inc. | 92,524 |
| 2,469 | 1 | Keysight Technologies, Inc. | 246,628 |
| 3,271 | | Mastercard, Inc. | 1,009,202 |
| 11,281 | | Microsoft Corp. | 2,312,718 |
| 151 | | Monolithic Power Systems | 40,017 |
Annual Shareholder Report
Shares or
Principal
Amount | | | Value |
| | | COMMON STOCKS—continued | |
| | | Information Technology—continued | |
| 1,522 | | NVIDIA Corp. | $646,226 |
| 688 | 1 | Okta, Inc. | 152,034 |
| 1,795 | | Oracle Corp. | 99,533 |
| 11,674 | | Paychex, Inc. | 839,594 |
| 2,944 | 1 | PayPal Holdings, Inc. | 577,230 |
| 12,572 | | Plantronics, Inc. | 251,314 |
| 9,835 | | Qualcomm, Inc. | 1,038,674 |
| 41,560 | | Sabre Corp. | 314,194 |
| 943 | 1 | Semtech Corp. | 52,553 |
| 131 | 1 | ServiceNow, Inc. | 57,535 |
| 1,262 | 1 | Synopsys, Inc. | 251,416 |
| 8,203 | | Vishay Intertechnology, Inc. | 128,705 |
| 4,987 | | Western Union Co. | 121,084 |
| 9,197 | | Xerox Holdings Corp. | 153,130 |
| 390 | 1 | Zscaler, Inc. | 50,642 |
| | | TOTAL | 24,053,313 |
| | | Materials—1.5% | |
| 20,604 | 1 | Alcoa Corp. | 267,852 |
| 20,255 | 1 | Allegheny Technologies, Inc. | 176,016 |
| 2,659 | 1 | Berry Global Group, Inc. | 132,923 |
| 47,282 | | Chemours Co./The | 876,135 |
| 1,158 | 1 | Crown Holdings, Inc. | 82,890 |
| 11,320 | | Domtar, Corp. | 237,607 |
| 209 | | Linde PLC | 51,228 |
| 316 | | Martin Marietta Materials | 65,469 |
| 2,929 | | PPG Industries, Inc. | 315,307 |
| 983 | | Scotts Miracle-Gro Co. | 155,874 |
| 155 | | Sherwin-Williams Co. | 100,428 |
| | | TOTAL | 2,461,729 |
| | | Real Estate—2.8% | |
| 1,500 | | Alexandria Real Estate Equities, Inc. | 266,325 |
| 12,900 | | American Homes 4 Rent | 374,100 |
| 1,550 | | American Tower Corp. | 405,155 |
| 9,200 | | Americold Realty Trust | 371,220 |
| 4,000 | | Community Healthcare Trust, Inc. | 182,920 |
| 20,000 | | DiamondRock Hospitality Co. | 92,400 |
| 405 | | Equinix, Inc. | 318,119 |
Annual Shareholder Report
Shares or
Principal
Amount | | | Value |
| | | COMMON STOCKS—continued | |
| | | Real Estate—continued | |
| 4,350 | | Equity Lifestyle Properties, Inc. | $297,192 |
| 11,000 | | Host Hotels & Resorts, Inc. | 118,580 |
| 11,800 | | Invitation Homes, Inc. | 351,876 |
| 2,900 | | ProLogis, Inc. | 305,718 |
| 2,685 | 1 | Redfin Corp. | 111,642 |
| 6,700 | | Rexford Industrial Realty, Inc. | 314,431 |
| 2,300 | | Sun Communities, Inc. | 344,839 |
| 12,500 | | Sunstone Hotel Investors, Inc. | 93,500 |
| 4,750 | | Terreno Realty Corp. | 288,610 |
| 7,200 | | VICI Properties, Inc. | 156,312 |
| 10,500 | | Weyerhaeuser Co. | 292,005 |
| | | TOTAL | 4,684,944 |
| | | Utilities—1.1% | |
| 2,781 | | Consolidated Edison Co. | 213,664 |
| 2,108 | | Evergy, Inc. | 136,662 |
| 15,792 | | Exelon Corp. | 609,729 |
| 277 | | NextEra Energy, Inc. | 77,754 |
| 19,281 | | OGE Energy Corp. | 634,345 |
| 1,915 | | Public Service Enterprises Group, Inc. | 107,125 |
| | | TOTAL | 1,779,279 |
| | | TOTAL COMMON STOCKS
(IDENTIFIED COST $77,903,684) | 91,755,296 |
| | | ASSET-BACKED SECURITIES—0.5% | |
| | | Auto Receivables—0.2% | |
| $400,000 | | Toyota Auto Receivables Owner Trust 2020-B, Class A4, 1.660%, 9/15/2025 | 409,004 |
| | | Equipment Lease—0.3% | |
| 500,000 | | HPEFS Equipment Trust 2020-2A, Class C, 2.000%, 7/22/2030 | 501,845 |
| | | TOTAL ASSET-BACKED SECURITIES
(IDENTIFIED COST $899,854) | 910,849 |
| | | COLLATERALIZED MORTGAGE OBLIGATIONS—0.0% | |
| 243 | 3 | Bear Stearns Mortgage Securities, Inc. 1997-6, Class 1A, 6.294%, 3/25/2031 | 233 |
| 528 | | Federal Home Loan Mortgage Corp. REMIC, Series 1311, Class K, 7.000%, 7/15/2022 | 554 |
| 612 | | Federal Home Loan Mortgage Corp. REMIC, Series 1384, Class D, 7.000%, 9/15/2022 | 643 |
| 3,144 | | Federal Home Loan Mortgage Corp. REMIC, Series 2497, Class JH, 6.000%, 9/15/2032 | 3,587 |
Annual Shareholder Report
Shares or
Principal
Amount | | | Value |
| | | COLLATERALIZED MORTGAGE OBLIGATIONS—continued | |
| $2,035 | 4 | Federal National Mortgage Association REMIC, Series 1993-113, Class SB, 9.749% (10-year Constant Maturity Treasury +48.285%), Maximum Rate 9.749%, 7/25/2023 | $2,178 |
| 715 | | Federal National Mortgage Association REMIC, Series 2003-35, Class UC, 3.750%, 5/25/2033 | 756 |
| | | TOTAL COLLATERALIZED MORTGAGE OBLIGATIONS
(IDENTIFIED COST $7,539) | 7,951 |
| | | COMMERCIAL MORTGAGE-BACKED SECURITIES—1.8% | |
| | | Commercial Mortgage—1.8% | |
| 190,000 | | Bank, Class A4, 3.488%, 11/15/2050 | 215,808 |
| 200,000 | | Citigroup Commercial Mortgage Trust 2013-GC11, Class B, 3.732%, 4/10/2046 | 206,087 |
| 70,000 | | Commercial Mortgage Pass-Through Certificates 2012-CR1, Class AM, 3.912%, 5/15/2045 | 72,347 |
| 125,000 | | Commercial Mortgage Pass-Through Certificates 2012-CR1, Class B, 4.612%, 5/15/2045 | 112,254 |
| 200,000 | | Commercial Mortgage Trust 2013-CR8, Class B, 3.951%, 6/10/2046 | 205,770 |
| 200,000 | | Commercial Mortgage Trust 2014-LC17, Class B, 4.490%, 10/10/2047 | 214,368 |
| 300,000 | | Commercial Mortgage Trust 2015-DC1, Class AM, 3.724%, 2/10/2048 | 320,478 |
| 200,000 | | FREMF Mortgage Trust 2013-K25 REMIC, Class B, 3.619%, 11/25/2045 | 209,329 |
| 63,614 | | Federal Home Loan Mortgage Corp. REMIC, Series K055, Class A1, 2.263%, 4/25/2025 | 65,937 |
| 398,700 | | Federal Home Loan Mortgage Corp. REMIC, Series K106, Class A1, 1.783%, 5/25/2029 | 422,008 |
| 6,075 | | Federal Home Loan Mortgage Corp. REMIC, Series K504, Class A2, 2.566%, 9/25/2020 | 6,078 |
| 350,000 | | Federal Home Loan Mortgage Corp. REMIC, Series K737, Class A2, 2.530%, 10/25/2026 | 384,548 |
| 100,000 | | GS Mortgage Securities Corp. II 2012-GCJ7, Class AS, 4.085%, 5/10/2045 | 103,054 |
| 200,000 | | JPMDB Commercial Mortgage Securities Trust 2016-C4, Class A3, 3.141%, 12/15/2049 | 220,244 |
| 50,000 | | JPMDB Commercial Mortgage Securities Trust 2017-C5, Class A5, 3.693%, 3/15/2050 | 56,886 |
| 100,000 | | Morgan Stanley Capital I 2012-C4, Class AS, 3.773%, 3/15/2045 | 101,721 |
| 25,000 | | WF-RBS Commercial Mortgage Trust 2012-C6, Class B, 4.697%, 4/15/2045 | 25,691 |
| | | TOTAL COMMERCIAL MORTGAGE-BACKED SECURITIES
(IDENTIFIED COST $2,840,631) | 2,942,608 |
Annual Shareholder Report
Shares or
Principal
Amount | | | Value |
| | | CORPORATE BONDS—15.2% | |
| | | Basic Industry - Chemicals—0.0% | |
| $10,000 | | DuPont de Nemours, Inc., Sr. Unsecd. Note, 3.766%, 11/15/2020 | $10,095 |
| 10,000 | | DuPont de Nemours, Inc., Sr. Unsecd. Note, 5.319%, 11/15/2038 | 13,335 |
| | | TOTAL | 23,430 |
| | | Basic Industry - Metals & Mining—0.2% | |
| 15,000 | | Anglogold Ashanti Holdings PLC, Sr. Note, 6.500%, 4/15/2040 | 17,850 |
| 62,000 | | Carpenter Technology Corp., Sr. Unsecd. Note, 4.450%, 3/1/2023 | 63,715 |
| 40,000 | | Carpenter Technology Corp., Sr. Unsecd. Note, 5.200%, 7/15/2021 | 41,296 |
| 100,000 | | Reliance Steel & Aluminum Co., Sr. Unsecd. Note, 4.500%, 4/15/2023 | 107,834 |
| 20,000 | | Southern Copper Corp., Sr. Unsecd. Note, 6.750%, 4/16/2040 | 29,480 |
| | | TOTAL | 260,175 |
| | | Basic Industry - Paper—0.0% | |
| 10,000 | | Weyerhaeuser Co., Sr. Unsecd. Note, 3.250%, 3/15/2023 | 10,567 |
| | | Capital Goods - Aerospace & Defense—0.5% | |
| 275,000 | | Boeing Co., Sr. Unsecd. Note, 4.875%, 5/1/2025 | 297,324 |
| 11,000 | | Embraer Overseas Ltd., Sr. Unsecd. Note, 144A, 5.696%, 9/16/2023 | 11,041 |
| 110,000 | | Huntington Ingalls Industries, Inc., Sr. Unsecd. Note, 144A, 3.844%, 5/1/2025 | 122,324 |
| 170,000 | | Leidos, Inc., Unsecd. Note, 144A, 3.625%, 5/15/2025 | 188,379 |
| 10,000 | | Raytheon Technologies Corp., Sr. Unsecd. Note, 144A, 3.100%, 11/15/2021 | 10,251 |
| 15,000 | | Spirit AeroSystems, Inc., Sr. Unsecd. Note, 4.600%, 6/15/2028 | 11,747 |
| 40,000 | 4 | Textron Financial Corp., Jr. Sub. Note, 144A, 2.127% (3-month USLIBOR +1.735%), 2/15/2042 | 26,468 |
| 50,000 | | Textron, Inc., Sr. Unsecd. Note, 4.000%, 3/15/2026 | 54,494 |
| 50,000 | | Textron, Inc., Sr. Unsecd. Note, 4.300%, 3/1/2024 | 53,882 |
| | | TOTAL | 775,910 |
| | | Capital Goods - Building Materials—0.2% | |
| 200,000 | | Allegion US Holdings Co., Inc., Sr. Unsecd. Note, 3.200%, 10/1/2024 | 212,914 |
| 80,000 | | Masco Corp., Sr. Unsecd. Note, 4.375%, 4/1/2026 | 93,784 |
| | | TOTAL | 306,698 |
| | | Capital Goods - Construction Machinery—0.0% | |
| 10,000 | | CNH Industrial Capital America LLC, Sr. Unsecd. Note, 4.375%, 4/5/2022 | 10,512 |
Annual Shareholder Report
Shares or
Principal
Amount | | | Value |
| | | CORPORATE BONDS—continued | |
| | | Capital Goods - Diversified Manufacturing—0.2% | |
| $30,000 | | General Electric Capital Corp., Sr. Unsecd. Note, Series GMTN, 3.100%, 1/9/2023 | $31,648 |
| 60,000 | | Lennox International, Inc., Sr. Unsecd. Note, 1.700%, 8/1/2027 | 60,784 |
| 175,000 | | Roper Technologies, Inc., Sr. Unsecd. Note, 2.000%, 6/30/2030 | 182,804 |
| 15,000 | | Thomas & Betts Corp., Sr. Unsecd. Note, 5.625%, 11/15/2021 | 15,949 |
| | | TOTAL | 291,185 |
| | | Communications - Cable & Satellite—0.1% | |
| 145,000 | | Comcast Corp., Sr. Unsecd. Note, 2.800%, 1/15/2051 | 158,191 |
| 15,000 | | Comcast Corp., Sr. Unsecd. Note, 3.900%, 3/1/2038 | 18,795 |
| 10,000 | | Comcast Corp., Sr. Unsecd. Note, 4.400%, 8/15/2035 | 13,004 |
| | | TOTAL | 189,990 |
| | | Communications - Media & Entertainment—0.3% | |
| 30,000 | | Grupo Televisa S.A., Sr. Unsecd. Note, 6.125%, 1/31/2046 | 39,693 |
| 20,000 | | Omnicom Group, Inc., Sr. Unsecd. Note, 3.625%, 5/1/2022 | 21,099 |
| 400,000 | | ViacomCBS, Inc., Sr. Unsecd. Note, 4.750%, 5/15/2025 | 460,956 |
| | | TOTAL | 521,748 |
| | | Communications - Telecom Wireless—0.7% | |
| 400,000 | | Crown Castle International Corp., Sr. Unsecd. Note, 3.250%, 1/15/2051 | 449,918 |
| 150,000 | | Crown Castle International Corp., Sr. Unsecd. Note, 3.700%, 6/15/2026 | 171,530 |
| 200,000 | | Vodafone Group PLC, Sr. Unsecd. Note, 4.250%, 9/17/2050 | 247,822 |
| 200,000 | | Vodafone Group PLC, Sr. Unsecd. Note, 4.875%, 6/19/2049 | 264,811 |
| | | TOTAL | 1,134,081 |
| | | Communications - Telecom Wirelines—0.5% | |
| 300,000 | | AT&T, Inc., Sr. Unsecd. Note, 3.650%, 6/1/2051 | 328,790 |
| 5,000 | | AT&T, Inc., Sr. Unsecd. Note, 4.500%, 5/15/2035 | 6,024 |
| 10,000 | | AT&T, Inc., Sr. Unsecd. Note, 5.250%, 3/1/2037 | 12,927 |
| 10,000 | | AT&T, Inc., Sr. Unsecd. Note, 5.700%, 3/1/2057 | 14,510 |
| 150,000 | | Telefonica Emisiones SAU, Sr. Unsecd. Note, 5.520%, 3/1/2049 | 204,584 |
| 90,000 | | Verizon Communications, Inc., Sr. Unsecd. Note, 3.150%, 3/22/2030 | 103,519 |
| 90,000 | | Verizon Communications, Inc., Sr. Unsecd. Note, 4.150%, 3/15/2024 | 100,940 |
| 25,000 | | Verizon Communications, Inc., Sr. Unsecd. Note, 5.250%, 3/16/2037 | 35,299 |
| | | TOTAL | 806,593 |
Annual Shareholder Report
Shares or
Principal
Amount | | | Value |
| | | CORPORATE BONDS—continued | |
| | | Consumer Cyclical - Automotive—0.2% | |
| $10,000 | | DaimlerChrysler North America Holding Corp., Company Guarantee, 8.500%, 1/18/2031 | $15,466 |
| 200,000 | | Ford Motor Credit Co. LLC, Sr. Unsecd. Note, 3.336%, 3/18/2021 | 200,750 |
| 160,000 | | General Motors Financial Co., Inc., Sr. Unsecd. Note, 3.200%, 7/6/2021 | 162,645 |
| 10,000 | | General Motors Financial Co., Inc., Sr. Unsecd. Note, 3.950%, 4/13/2024 | 10,670 |
| | | TOTAL | 389,531 |
| | | Consumer Cyclical - Leisure—0.0% | |
| 66,707 | | Football Trust V, Pass Thru Cert., 5.350%, 10/5/2020 | 67,045 |
| | | Consumer Cyclical - Lodging—0.0% | |
| 20,000 | | American Campus Communities Operating Partnership LP, Sr. Unsecd. Note, 4.125%, 7/1/2024 | 21,283 |
| 30,000 | | Hyatt Hotels Corp., Sr. Unsecd. Note, 3.375%, 7/15/2023 | 30,258 |
| | | TOTAL | 51,541 |
| | | Consumer Cyclical - Retailers—0.4% | |
| 50,000 | | Advance Auto Parts, Inc., 4.500%, 12/1/2023 | 55,218 |
| 170,000 | | AutoNation, Inc., Sr. Unsecd. Note, 4.750%, 6/1/2030 | 197,326 |
| 250,000 | | AutoZone, Inc., Sr. Unsecd. Note, 3.250%, 4/15/2025 | 276,121 |
| 15,000 | | CVS Health Corp., Sr. Unsecd. Note, 3.700%, 3/9/2023 | 16,149 |
| 15,000 | | CVS Health Corp., Sr. Unsecd. Note, 4.100%, 3/25/2025 | 17,058 |
| 10,000 | | O’Reilly Automotive, Inc., Company Guarantee, 4.875%, 1/14/2021 | 10,083 |
| 10,000 | | WalMart Inc., Sr. Unsecd. Note, 5.625%, 4/1/2040 | 15,582 |
| | | TOTAL | 587,537 |
| | | Consumer Cyclical - Services—0.3% | |
| 200,000 | | Alibaba Group Holding Ltd., Sr. Unsecd. Note, 2.800%, 6/6/2023 | 212,908 |
| 125,000 | | Amazon.com, Inc., Sr. Unsecd. Note, 3.800%, 12/5/2024 | 141,958 |
| 25,000 | | Cintas Corp. No. 2, Sr. Unsecd. Note, 4.300%, 6/1/2021 | 25,776 |
| 15,000 | | Expedia Group, Inc., Sr. Unsecd. Note, Series WI, 3.250%, 2/15/2030 | 14,204 |
| 65,000 | | Expedia, Inc., Company Guarantee, 5.950%, 8/15/2020 | 65,052 |
| 10,000 | | University of Southern California, Sr. Unsecd. Note, 5.250%, 10/1/2111 | 16,645 |
| 70,000 | | Visa, Inc., Sr. Unsecd. Note, 3.150%, 12/14/2025 | 79,001 |
| 15,000 | | Visa, Inc., Sr. Unsecd. Note, 4.150%, 12/14/2035 | 20,046 |
| | | TOTAL | 575,590 |
Annual Shareholder Report
Shares or
Principal
Amount | | | Value |
| | | CORPORATE BONDS—continued | |
| | | Consumer Non-Cyclical - Food/Beverage—1.0% | |
| $30,000 | | Anheuser-Busch Cos LLC/Anheuser-Busch InBev Worldwide, Inc., Sr. Unsecd. Note, 4.700%, 2/1/2036 | $36,904 |
| 85,000 | | Campbell Soup Co., Sr. Unsecd. Note, 2.375%, 4/24/2030 | 90,212 |
| 300,000 | | Danone SA, Sr. Unsecd. Note, 144A, 2.947%, 11/2/2026 | 335,223 |
| 140,000 | | Flowers Foods, Inc., Sr. Unsecd. Note, 3.500%, 10/1/2026 | 151,393 |
| 80,000 | | General Mills, Inc., Sr. Unsecd. Note, 4.700%, 4/17/2048 | 115,788 |
| 270,000 | | Heineken NV, Sr. Unsecd. Note, 144A, 3.500%, 1/29/2028 | 310,735 |
| 200,000 | | Kerry Group Financial Services, Sr. Unsecd. Note, 144A, 3.200%, 4/9/2023 | 210,537 |
| 15,000 | | Kraft Heinz Foods Co., Sr. Unsecd. Note, 5.200%, 7/15/2045 | 17,131 |
| 50,000 | | Mead Johnson Nutrition Co., Sr. Unsecd. Note, 4.125%, 11/15/2025 | 58,544 |
| 295,000 | | PepsiCo, Inc., Sr. Unsecd. Note, 3.625%, 3/19/2050 | 385,571 |
| | | TOTAL | 1,712,038 |
| | | Consumer Non-Cyclical - Health Care—0.2% | |
| 135,000 | | Agilent Technologies, Inc., Sr. Unsecd. Note, 2.750%, 9/15/2029 | 147,979 |
| 15,000 | | Agilent Technologies, Inc., Sr. Unsecd. Note, 3.200%, 10/1/2022 | 15,743 |
| 180,000 | | Dentsply Sirona, Inc., Sr. Unsecd. Note, 3.250%, 6/1/2030 | 197,314 |
| 10,000 | | Laboratory Corp. of America Holdings, Sr. Unsecd. Note, 3.750%, 8/23/2022 | 10,567 |
| | | TOTAL | 371,603 |
| | | Consumer Non-Cyclical - Pharmaceuticals—0.5% | |
| 500,000 | | AbbVie, Inc., Sr. Unsecd. Note, 144A, 4.250%, 11/21/2049 | 642,039 |
| 15,000 | | Amgen, Inc., Sr. Unsecd. Note, 4.400%, 5/1/2045 | 20,095 |
| 10,000 | | Bristol-Myers Squibb Co., Sr. Unsecd. Note, Series WI, 4.125%, 6/15/2039 | 13,391 |
| 15,000 | | Johnson & Johnson, Sr. Unsecd. Note, 3.550%, 3/1/2036 | 18,747 |
| 165,000 | | Zoetis, Inc., Sr. Unsecd. Note, 3.000%, 5/15/2050 | 187,528 |
| | | TOTAL | 881,800 |
| | | Consumer Non-Cyclical - Supermarkets—0.0% | |
| 10,000 | | Kroger Co., Sr. Unsecd. Note, 4.450%, 2/1/2047 | 13,096 |
| | | Energy - Independent—0.3% | |
| 250,000 | | Canadian Natural Resources Ltd., 3.900%, 2/1/2025 | 273,194 |
| 125,000 | | Cimarex Energy Co., Sr. Unsecd. Note, 3.900%, 5/15/2027 | 127,565 |
| 20,000 | | EQT Corp., Sr. Unsecd. Note, 3.900%, 10/1/2027 | 18,892 |
| | | TOTAL | 419,651 |
Annual Shareholder Report
Shares or
Principal
Amount | | | Value |
| | | CORPORATE BONDS—continued | |
| | | Energy - Integrated—0.7% | |
| $135,000 | | BP Capital Markets America, Inc., Sr. Unsecd. Note, 3.119%, 5/4/2026 | $150,665 |
| 20,000 | | BP Capital Markets America, Inc., Sr. Unsecd. Note, 3.224%, 4/14/2024 | 21,661 |
| 300,000 | | BP Capital Markets America, Inc., Sr. Unsecd. Note, 3.937%, 9/21/2028 | 353,744 |
| 5,000 | | ConocoPhillips, Company Guarantee, 6.500%, 2/1/2039 | 7,844 |
| 270,000 | | Exxon Mobil Corp., Sr. Unsecd. Note, 2.992%, 3/19/2025 | 297,349 |
| 75,000 | | Husky Energy, Inc., 4.000%, 4/15/2024 | 78,790 |
| 240,000 | | Husky Energy, Inc., Sr. Unsecd. Note, 4.400%, 4/15/2029 | 252,628 |
| | | TOTAL | 1,162,681 |
| | | Energy - Midstream—0.5% | |
| 20,000 | | Energy Transfer Operating, Sr. Unsecd. Note, 5.500%, 6/1/2027 | 22,069 |
| 115,000 | | Energy Transfer Partners LP, Sr. Unsecd. Note, 4.050%, 3/15/2025 | 121,233 |
| 75,000 | | Energy Transfer Partners LP, Sr. Unsecd. Note, 4.900%, 2/1/2024 | 80,339 |
| 10,000 | | Energy Transfer Partners LP, Sr. Unsecd. Note, 6.125%, 12/15/2045 | 10,438 |
| 170,000 | | Enterprise Products Operating LLC, Sr. Unsecd. Note, 3.950%, 2/15/2027 | 193,947 |
| 20,000 | | Kinder Morgan Energy Partners LP, Sr. Unsecd. Note, Series MTN, 6.950%, 1/15/2038 | 27,899 |
| 40,000 | | MPLX LP, Sr. Unsecd. Note, 4.125%, 3/1/2027 | 43,736 |
| 5,000 | | MPLX LP, Sr. Unsecd. Note, 4.500%, 4/15/2038 | 5,332 |
| 225,000 | | MPLX LP, Sr. Unsecd. Note, 5.500%, 2/15/2049 | 269,922 |
| 20,000 | | Texas Eastern Transmission LP, Sr. Unsecd. Note, 144A, 2.800%, 10/15/2022 | 20,464 |
| 10,000 | | Western Gas Partners LP, Sr. Unsecd. Note, 4.750%, 8/15/2028 | 10,123 |
| 30,000 | | Williams Partners LP, Sr. Unsecd. Note, 4.125%, 11/15/2020 | 30,028 |
| | | TOTAL | 835,530 |
| | | Energy - Oil Field Services—0.0% | |
| 15,000 | | Nabors Industries, Inc., Company Guarantee, 5.000%, 9/15/2020 | 14,942 |
| | | Energy - Refining—0.1% | |
| 15,000 | | HollyFrontier Corp., Sr. Unsecd. Note, 5.875%, 4/1/2026 | 16,480 |
| 15,000 | | Marathon Petroleum Corp., Sr. Unsecd. Note, 4.500%, 4/1/2048 | 16,819 |
| 10,000 | | Marathon Petroleum Corp., Sr. Unsecd. Note, 6.500%, 3/1/2041 | 13,099 |
| 25,000 | | Tesoro Corp., Sr. Unsecd. Note, 5.375%, 10/1/2022 | 24,854 |
| 15,000 | | Valero Energy Corp., Sr. Unsecd. Note, 4.350%, 6/1/2028 | 17,416 |
| | | TOTAL | 88,668 |
Annual Shareholder Report
Shares or
Principal
Amount | | | Value |
| | | CORPORATE BONDS—continued | |
| | | Financial Institution - Banking—2.7% | |
| $74,000 | | American Express Co., 2.650%, 12/2/2022 | $77,688 |
| 250,000 | | American Express Credit Corp., Sr. Unsecd. Note, Series MTN, 2.250%, 5/5/2021 | 253,332 |
| 300,000 | | Bank of America Corp., Sr. Unsecd. Note, Series GMTN, 3.500%, 4/19/2026 | 340,464 |
| 250,000 | 4 | Bank of America Corp., Sr. Unsecd. Note, Series MTN, 0.946% (3-month USLIBOR +0.650%), 10/1/2021 | 250,280 |
| 10,000 | | Bank of America Corp., Sr. Unsecd. Note, Series MTN, 3.499%, 5/17/2022 | 10,235 |
| 100,000 | | Bank of America Corp., Sr. Unsecd. Note, Series MTN, 5.000%, 5/13/2021 | 103,629 |
| 200,000 | | Bank of America Corp., Sub. Note, Series L, 3.950%, 4/21/2025 | 224,120 |
| 15,000 | | Bank of America Corp., Sub. Note, Series MTN, 4.200%, 8/26/2024 | 16,825 |
| 15,000 | | Bank of America Corp., Sub., Series MTN, 4.450%, 3/3/2026 | 17,344 |
| 20,000 | | Bank of New York Mellon, N.A., 3.400%, 5/15/2024 | 22,130 |
| 200,000 | | Citigroup, Inc., Sr. Unsecd. Note, 2.700%, 3/30/2021 | 203,153 |
| 40,000 | | Citigroup, Inc., Sr. Unsecd. Note, 2.876%, 7/24/2023 | 41,744 |
| 15,000 | | Citigroup, Inc., Sr. Unsecd. Note, 3.142%, 1/24/2023 | 15,532 |
| 250,000 | | Citigroup, Inc., Sr. Unsecd. Note, 3.300%, 4/27/2025 | 278,459 |
| 170,000 | | Citigroup, Inc., Sr. Unsecd. Note, 3.400%, 5/1/2026 | 190,542 |
| 15,000 | | Citigroup, Inc., Sub. Note, 4.450%, 9/29/2027 | 17,483 |
| 25,000 | | City National Corp., Sr. Unsecd. Note, 5.250%, 9/15/2020 | 25,143 |
| 30,000 | | Comerica, Inc., 3.800%, 7/22/2026 | 32,772 |
| 75,000 | | Fifth Third Bancorp, Sr. Unsecd. Note, 3.650%, 1/25/2024 | 82,354 |
| 40,000 | | Goldman Sachs Group, Inc., Sr. Unsecd. Note, 3.200%, 2/23/2023 | 42,555 |
| 275,000 | | Goldman Sachs Group, Inc., Sr. Unsecd. Note, 3.625%, 1/22/2023 | 295,440 |
| 150,000 | | Goldman Sachs Group, Inc., Sr. Unsecd. Note, 6.250%, 2/1/2041 | 236,274 |
| 10,000 | 5 | JPMorgan Chase & Co., Jr. Sub. Deb., Series X, 6.100%, 10/1/2024 | 10,547 |
| 25,000 | 5 | JPMorgan Chase & Co., Jr. Sub. Note, Series FF, 5.000%, 8/1/2024 | 25,179 |
| 20,000 | | JPMorgan Chase & Co., Sr. Unsecd. Note, 3.559%, 4/23/2024 | 21,557 |
| 15,000 | | JPMorgan Chase & Co., Sr. Unsecd. Note, 3.882%, 7/24/2038 | 18,711 |
| 400,000 | | JPMorgan Chase & Co., Sub. Note, 3.375%, 5/1/2023 | 428,707 |
| 300,000 | | Morgan Stanley, 4.300%, 1/27/2045 | 406,895 |
| 120,000 | | Morgan Stanley, Sr. Unsecd. Note, Series GMTN, 2.500%, 4/21/2021 | 121,975 |
| 15,000 | | Morgan Stanley, Sr. Unsecd. Note, Series GMTN, 3.125%, 1/23/2023 | 15,954 |
Annual Shareholder Report
Shares or
Principal
Amount | | | Value |
| | | CORPORATE BONDS—continued | |
| | | Financial Institution - Banking—continued | |
| $15,000 | | Morgan Stanley, Sr. Unsecd. Note, Series GMTN, 4.000%, 7/23/2025 | $17,264 |
| 15,000 | | Morgan Stanley, Sub. Note, Series MTN, 4.100%, 5/22/2023 | 16,313 |
| 65,000 | | Royal Bank of Canada, Sec. Fac. Bond, 2.100%, 10/14/2020 | 65,232 |
| 10,000 | | Royal Bank of Scotland Group PLC, Sub., 6.000%, 12/19/2023 | 11,274 |
| 10,000 | | State Street Corp., Sub. Deb., 3.031%, 11/1/2034 | 11,075 |
| 45,000 | | Sumitomo Mitsui Financial Group, Inc., Sr. Unsecd. Note, 3.102%, 1/17/2023 | 47,857 |
| 130,000 | | Truist Financial Corp., Sr. Unsecd. Note, 2.900%, 3/3/2021 | 131,717 |
| 250,000 | | US Bancorp, Sr. Unsecd. Note, Series MTN, 1.375%, 7/22/2030 | 253,344 |
| 10,000 | | Wells Fargo & Co., Series MTN, 4.100%, 6/3/2026 | 11,346 |
| 15,000 | | Wells Fargo & Co., Sr. Unsecd. Note, 3.069%, 1/24/2023 | 15,531 |
| 10,000 | | Westpac Banking Corp., Sub., Series GMTN, 4.322%, 11/23/2031 | 11,376 |
| | | TOTAL | 4,419,352 |
| | | Financial Institution - Broker/Asset Mgr/Exchange—0.3% | |
| 80,000 | | Invesco Finance PLC, Sr. Unsecd. Note, 3.750%, 1/15/2026 | 89,438 |
| 70,000 | | Nuveen LLC, Sr. Unsecd. Note, 144A, 4.000%, 11/1/2028 | 84,135 |
| 305,000 | | Raymond James Financial, Inc., Sr. Unsecd. Note, 4.650%, 4/1/2030 | 377,706 |
| 13,000 | | Raymond James Financial, Inc., Sr. Unsecd. Note, 5.625%, 4/1/2024 | 14,933 |
| 15,000 | | XLIT Ltd., Sub., 4.450%, 3/31/2025 | 16,942 |
| | | TOTAL | 583,154 |
| | | Financial Institution - Finance Companies—0.4% | |
| 170,000 | | AerCap Ireland Capital Ltd./AerCap Global Aviation Trust, Sr. Unsecd. Note, 3.950%, 2/1/2022 | 171,337 |
| 150,000 | | AerCap Ireland Capital Ltd./AerCap Global Aviation Trust, Sr. Unsecd. Note, 4.875%, 1/16/2024 | 152,552 |
| 250,000 | | GE Capital International Funding, Inc., Sr. Unsecd. Note, 4.418%, 11/15/2035 | 258,685 |
| 25,000 | | Santander UK Group Holdings PLC, Sr. Unsecd. Note, 3.125%, 1/8/2021 | 25,294 |
| | | TOTAL | 607,868 |
| | | Financial Institution - Insurance - Life—0.7% | |
| 200,000 | | Aflac, Inc., Sr. Unsecd. Note, 3.625%, 6/15/2023 | 218,756 |
| 25,000 | | American International Group, Inc., 4.500%, 7/16/2044 | 30,932 |
| 35,000 | | American International Group, Inc., Sr. Unsecd. Note, 4.125%, 2/15/2024 | 39,124 |
| 125,000 | | American International Group, Inc., Sr. Unsecd. Note, 4.200%, 4/1/2028 | 147,555 |
Annual Shareholder Report
Shares or
Principal
Amount | | | Value |
| | | CORPORATE BONDS—continued | |
| | | Financial Institution - Insurance - Life—continued | |
| $10,000 | | Lincoln National Corp., Sr. Unsecd. Note, 4.200%, 3/15/2022 | $10,606 |
| 275,000 | | Mass Mutual Global Funding II, 144A, 2.000%, 4/15/2021 | 278,415 |
| 10,000 | | MetLife, Inc., Jr. Sub. Note, 10.750%, 8/1/2039 | 16,446 |
| 15,000 | | MetLife, Inc., Jr. Sub. Note, 6.400%, 12/15/2036 | 18,631 |
| 250,000 | | MetLife, Inc., Sr. Unsecd. Note, 3.600%, 4/10/2024 | 278,232 |
| 15,000 | | Penn Mutual Life Insurance Co., Sr. Note, 144A, 7.625%, 6/15/2040 | 22,198 |
| 10,000 | | Principal Financial Group, Inc., Sr. Unsecd. Note, 3.125%, 5/15/2023 | 10,673 |
| 10,000 | | Principal Financial Group, Inc., Sr. Unsecd. Note, 3.300%, 9/15/2022 | 10,554 |
| 50,000 | | Prudential Financial, Inc., Sr. Unsecd. Note, Series MTN, 6.200%, 11/15/2040 | 75,478 |
| | | TOTAL | 1,157,600 |
| | | Financial Institution - Insurance - P&C—0.3% | |
| 10,000 | | Berkshire Hathaway Finance Corp., Sr. Unsecd. Note, 4.200%, 8/15/2048 | 13,634 |
| 65,000 | | Nationwide Mutual Insurance Co., Sub. Note, 144A, 9.375%, 8/15/2039 | 109,744 |
| 260,000 | | Nationwide Mutual Insurance Co., Sub., 144A, 4.350%, 4/30/2050 | 295,452 |
| | | TOTAL | 418,830 |
| | | Financial Institution - REIT - Apartment—0.2% | |
| 60,000 | | Camden Property Trust, Sr. Unsecd. Note, 2.800%, 5/15/2030 | 66,827 |
| 20,000 | | Post Apartment Homes LP, Sr. Unsecd. Note, 3.375%, 12/1/2022 | 20,933 |
| 200,000 | | UDR, Inc., Sr. Unsecd. Note, Series MTN, 2.100%, 8/1/2032 | 204,728 |
| 70,000 | | UDR, Inc., Sr. Unsecd. Note, Series MTN, 2.950%, 9/1/2026 | 75,552 |
| | | TOTAL | 368,040 |
| | | Financial Institution - REIT - Healthcare—0.1% | |
| 50,000 | | Healthcare Trust of America, 3.700%, 4/15/2023 | 52,629 |
| 185,000 | | Welltower, Inc., Sr. Unsecd. Note, 2.700%, 2/15/2027 | 196,840 |
| | | TOTAL | 249,469 |
| | | Financial Institution - REIT - Office—0.1% | |
| 50,000 | | Alexandria Real Estate Equities, Inc., Sr. Unsecd. Note, 3.900%, 6/15/2023 | 54,538 |
| 70,000 | | Alexandria Real Estate Equities, Inc., Sr. Unsecd. Note, 3.950%, 1/15/2028 | 81,689 |
| | | TOTAL | 136,227 |
| | | Financial Institution - REIT - Other—0.1% | |
| 105,000 | | WP Carey, Inc., Sr. Unsecd. Note, 3.850%, 7/15/2029 | 113,713 |
Annual Shareholder Report
Shares or
Principal
Amount | | | Value |
| | | CORPORATE BONDS—continued | |
| | | Financial Institution - REIT - Other—continued | |
| $75,000 | | WP Carey, Inc., Sr. Unsecd. Note, 4.600%, 4/1/2024 | $81,757 |
| | | TOTAL | 195,470 |
| | | Financial Institution - REIT - Retail—0.2% | |
| 300,000 | | Kimco Realty Corp., Sr. Unsecd. Note, 2.700%, 10/1/2030 | 310,350 |
| 50,000 | | Kimco Realty Corp., Sr. Unsecd. Note, 3.400%, 11/1/2022 | 52,616 |
| | | TOTAL | 362,966 |
| | | Supranational—0.0% | |
| 30,000 | | Corp Andina De Fomento, Sr. Unsecd. Note, 4.375%, 6/15/2022 | 31,684 |
| | | Technology—0.8% | |
| 10,000 | | Apple, Inc., 3.850%, 5/4/2043 | 13,002 |
| 30,000 | | Apple, Inc., Sr. Unsecd. Note, 2.400%, 5/3/2023 | 31,730 |
| 200,000 | | Apple, Inc., Sr. Unsecd. Note, 2.950%, 9/11/2049 | 230,771 |
| 20,000 | | Corning, Inc., Unsecd. Note, 4.750%, 3/15/2042 | 25,386 |
| 240,000 | | Diamond 1 Finance Corp./Diamond 2 Finance Corp., Sr. Secd. Note, 144A, 6.020%, 6/15/2026 | 281,568 |
| 125,000 | | Equifax, Inc., Sr. Unsecd. Note, 2.300%, 6/1/2021 | 126,591 |
| 53,000 | | Fidelity National Information Services, Inc., Sr. Unsecd. Note, 3.500%, 4/15/2023 | 56,856 |
| 110,000 | | Fiserv, Inc., Sr. Unsecd. Note, 3.500%, 7/1/2029 | 127,524 |
| 70,000 | | Hewlett Packard Enterprise Co., Sr. Unsecd. Note, 3.600%, 10/15/2020 | 70,223 |
| 20,000 | | Ingram Micro, Inc., Sr. Unsecd. Note, 5.000%, 8/10/2022 | 20,321 |
| 265,000 | | Intel Corp., Sr. Unsecd. Note, 3.400%, 3/25/2025 | 298,228 |
| 15,000 | | Microsoft Corp., Sr. Unsecd. Note, 3.450%, 8/8/2036 | 18,803 |
| 10,000 | | Verisk Analytics, Inc., Sr. Unsecd. Note, 4.125%, 9/12/2022 | 10,718 |
| 50,000 | | Verisk Analytics, Inc., Sr. Unsecd. Note, 5.500%, 6/15/2045 | 74,184 |
| | | TOTAL | 1,385,905 |
| | | Technology Services—0.0% | |
| 5,000 | | Global Payments, Inc., Sr. Unsecd. Note, 3.200%, 8/15/2029 | 5,594 |
| | | Transportation - Airlines—0.1% | |
| 30,000 | | Delta Air Lines, Inc., Sr. Unsecd. Note, 2.900%, 10/28/2024 | 26,054 |
| 110,000 | | Southwest Airlines Co., Sr. Unsecd. Note, 5.250%, 5/4/2025 | 117,931 |
| | | TOTAL | 143,985 |
| | | Transportation - Railroads—0.2% | |
| 50,000 | | Burlington Northern Santa Fe Corp., Deb., 5.750%, 5/1/2040 | 75,484 |
| 30,000 | | Kansas City Southern Industries, Inc., Sr. Unsecd. Note, 3.000%, 5/15/2023 | 31,501 |
Annual Shareholder Report
Shares or
Principal
Amount | | | Value |
| | | CORPORATE BONDS—continued | |
| | | Transportation - Railroads—continued | |
| $225,000 | | Kansas City Southern Industries, Inc., Sr. Unsecd. Note, 3.125%, 6/1/2026 | $244,772 |
| | | TOTAL | 351,757 |
| | | Transportation - Services—0.3% | |
| 15,000 | | Enterprise Rent-A-Car USA Finance Co., Sr. Unsecd. Note, 144A, 5.625%, 3/15/2042 | 18,594 |
| 20,000 | | FedEx Corp., Sr. Unsecd. Note, 3.900%, 2/1/2035 | 22,812 |
| 25,000 | | Penske Truck Leasing Co. LP & PTL Finance Corp., Sr. Unsecd. Note, 144A, 3.650%, 7/29/2021 | 25,674 |
| 70,000 | | Ryder System, Inc., Sr. Unsecd. Note, Series MTN, 2.800%, 3/1/2022 | 72,304 |
| 200,000 | | Ryder System, Inc., Sr. Unsecd. Note, Series MTN, 3.750%, 6/9/2023 | 215,351 |
| 30,000 | | United Parcel Service, Inc., Sr. Unsecd. Note, 3.125%, 1/15/2021 | 30,362 |
| 125,000 | | United Parcel Service, Inc., Sr. Unsecd. Note, 3.900%, 4/1/2025 | 142,869 |
| | | TOTAL | 527,966 |
| | | Utility - Electric—1.4% | |
| 70,000 | | Consolidated Edison Co., Sr. Unsecd. Note, Series 20B, 3.950%, 4/1/2050 | 90,181 |
| 70,000 | | Electricite de France SA, Note, 144A, 5.600%, 1/27/2040 | 95,213 |
| 300,000 | | Electricite de France SA, Sr. Unsecd. Note, 144A, 4.500%, 9/21/2028 | 360,539 |
| 140,000 | | Emera US Finance LP, Sr. Unsecd. Note, 4.750%, 6/15/2046 | 182,376 |
| 280,000 | | Enel Finance International NV, Sr. Unsecd. Note, 144A, 4.625%, 9/14/2025 | 324,004 |
| 170,000 | | EverSource Energy, Sr. Unsecd. Note, 3.350%, 3/15/2026 | 189,521 |
| 200,000 | | Exelon Corp., Sr. Unsecd. Note, 3.400%, 4/15/2026 | 226,631 |
| 100,000 | | Exelon Generation Co. LLC, Sr. Unsecd. Note, 4.250%, 6/15/2022 | 106,075 |
| 10,000 | | Great Plains Energy, Inc., Note, 4.850%, 6/1/2021 | 10,259 |
| 110,000 | | National Rural Utilities Cooperative Finance Corp., Sr. Sub. Note, 5.250%, 4/20/2046 | 118,918 |
| 25,000 | | National Rural Utilities Cooperative Finance Corp., Sr. Unsecd. Note, Series MTNC, 8.000%, 3/1/2032 | 40,036 |
| 250,000 | | PPL Capital Funding, Inc., Sr. Unsecd. Note, 3.100%, 5/15/2026 | 278,427 |
| 175,000 | | Southern Co., Sr. Unsecd. Note, 3.250%, 7/1/2026 | 198,867 |
| 40,000 | | UIL Holdings Corp., Sr. Unsecd. Note, 4.625%, 10/1/2020 | 40,152 |
| | | TOTAL | 2,261,199 |
| | | Utility - Natural Gas—0.4% | |
| 50,000 | | Enbridge Energy Partners LP, Sr. Unsecd. Note, 4.200%, 9/15/2021 | 51,555 |
Annual Shareholder Report
Shares or
Principal
Amount | | | Value |
| | | CORPORATE BONDS—continued | |
| | | Utility - Natural Gas—continued | |
| $65,000 | | National Fuel Gas Co., Sr. Unsecd. Note, 3.750%, 3/1/2023 | $67,058 |
| 445,000 | | National Fuel Gas Co., Sr. Unsecd. Note, 5.500%, 1/15/2026 | 481,658 |
| 15,000 | | Sempra Energy, Sr. Unsecd. Note, 2.900%, 2/1/2023 | 15,856 |
| 5,000 | | TransCanada PipeLines Ltd., Sr. Unsecd. Note, 6.200%, 10/15/2037 | 7,062 |
| | | TOTAL | 623,189 |
| | | TOTAL CORPORATE BONDS
(IDENTIFIED COST $22,511,566) | 25,332,397 |
| | | MORTGAGE-BACKED SECURITIES—0.5% | |
| 50,196 | | Federal Home Loan Mortgage Corp., Pool G07801, 4.000%, 10/1/2044 | 54,959 |
| 9,695 | | Federal National Mortgage Association, Pool 357761, 5.500%, 5/1/2035 | 11,293 |
| 1,379 | | Federal National Mortgage Association, Pool 728709, 5.500%, 7/1/2033 | 1,596 |
| 40,278 | | Federal National Mortgage Association, Pool 932864, 4.000%, 12/1/2040 | 44,165 |
| 64,575 | | Federal National Mortgage Association, Pool AB7859, 3.500%, 2/1/2043 | 70,596 |
| 46,873 | | Federal National Mortgage Association, Pool AD6938, 4.500%, 6/1/2040 | 52,398 |
| 31,077 | | Federal National Mortgage Association, Pool AQ0945, 3.000%, 11/1/2042 | 33,423 |
| 37,281 | | Federal National Mortgage Association, Pool AT2127, 3.000%, 4/1/2043 | 40,096 |
| 26,167 | | Federal National Mortgage Association, Pool AT7861, 3.000%, 6/1/2028 | 27,696 |
| 58,172 | | Federal National Mortgage Association, Pool BM4388, 4.000%, 8/1/2048 | 62,587 |
| 26,095 | | Federal National Mortgage Association, Pool BM5024, 3.000%, 11/1/2048 | 27,608 |
| 43,728 | | Federal National Mortgage Association, Pool BM5246, 3.500%, 11/1/2048 | 46,179 |
| 35,465 | | Federal National Mortgage Association, Pool CA0833, 3.500%, 12/1/2047 | 37,487 |
| 36,102 | | Federal National Mortgage Association, Pool CA4427, 3.000%, 10/1/2049 | 38,207 |
| 29,801 | | Federal National Mortgage Association, Pool FM0008, 3.500%, 8/1/2049 | 31,667 |
| 56,377 | | Federal National Mortgage Association, Pool FM1000, 3.000%, 4/1/2047 | 59,718 |
Annual Shareholder Report
Shares or
Principal
Amount | | | Value |
| | | MORTGAGE-BACKED SECURITIES—continued | |
| $29,673 | | Federal National Mortgage Association, Pool FM1221, 3.500%, 7/1/2049 | $31,762 |
| 35,481 | | Federal National Mortgage Association, Pool MA0500, 5.000%, 8/1/2040 | 40,553 |
| 40,928 | | Federal National Mortgage Association, Pool MA0666, 4.500%, 3/1/2041 | 45,535 |
| 44,967 | | Federal National Mortgage Association, Pool MA1430, 3.000%, 5/1/2043 | 48,362 |
| 51,944 | | Federal National Mortgage Association, Pool MA2803, 2.500%, 11/1/2031 | 54,634 |
| 26,719 | | Government National Mortgage Association, Pool MA0625, 3.500%, 12/20/2042 | 29,049 |
| 19,768 | | Government National Mortgage Association, Pool MA1376, 4.000%, 10/20/2043 | 21,639 |
| | | TOTAL MORTGAGE-BACKED SECURITIES
(IDENTIFIED COST $860,957) | 911,209 |
| | | U.S. TREASURIES—1.0% | |
| 169,921 | 6 | U.S. Treasury Inflation-Protected Notes, 0.125%, 1/15/2022 | 172,853 |
| 448,443 | | U.S. Treasury Inflation-Protected Notes, 0.125%, 1/15/2030 | 497,329 |
| 299,181 | | U.S. Treasury Inflation-Protected Notes, 0.250%, 2/15/2050 | 365,048 |
| 137,515 | | U.S. Treasury Inflation-Protected Notes, 1.375%, 2/15/2044 | 199,638 |
| 100,000 | | United States Treasury Bond, 1.250%, 5/15/2050 | 101,237 |
| 50,000 | | United States Treasury Bond, 4.500%, 2/15/2036 | 77,923 |
| 155,000 | | United States Treasury Note, 0.625%, 5/15/2030 | 156,257 |
| 25,000 | | United States Treasury Note, 2.125%, 9/30/2021 | 25,575 |
| | | TOTAL U.S. TREASURIES
(IDENTIFIED COST $1,465,407) | 1,595,860 |
| | | MUNICIPAL BONDS—0.6% | |
| 200,000 | | Klein, TX Independent School District, Unlimited Tax Schoolhouse and Refunding Bonds (Series 2020), (GTD by Texas Permanent School Fund Guarantee Program), 5.000%, 8/1/2028 | 267,466 |
| 125,000 | | Metropolitan Government Nashville & Davidson County, TN, GO Improvement Bonds (Series 2018), 4.000%, 7/1/2028 | 155,101 |
| 200,000 | | New York State Dormitory Authority State Personal Income Tax Revenue (New York State Personal Income Tax Revenue Bond Fund), State Personal Income Tax Revenue Bonds (Series 2019D), 4.000%, 2/15/2037 | 239,860 |
| 30,000 | | Texas State Transportation Commission—State Highway Fund, 5.178%, 4/1/2030 | 38,834 |
| 250,000 | | Washington State, Various Purpose GO Bonds (Series 2020C), 5.000%, 2/1/2044 | 328,800 |
| | | TOTAL MUNICIPAL BONDS
(IDENTIFIED COST $1,006,938) | 1,030,061 |
Annual Shareholder Report
Shares or
Principal
Amount | | | Value |
| | | EXCHANGE-TRADED FUND—7.5% | |
| $201,000 | | iShares MSCI EAFE ETF
(IDENTIFIED COST $13,521,274) | $12,472,050 |
| | | GOVERNMENT AGENCY—0.2% | |
| 250,000 | | Federal National Mortgage Association Notes,
0.625%, 4/22/2025
(IDENTIFIED COST $249,512) | 252,458 |
| | | INVESTMENT COMPANIES—18.4% | |
| 281,727 | | Federated Bank Loan Core Fund | 2,617,248 |
| 324,710 | | Emerging Markets Core Fund | 3,240,602 |
| 1,431,638 | | Federated Hermes Government Obligations Fund,
Premier Shares, 0.10%7 | 1,431,638 |
| 5,424,609 | | Federated Hermes Institutional Prime Value Obligations Fund, Institutional Shares, 0.21%7 | 5,427,864 |
| 630,661 | | High Yield Bond Portfolio | 3,878,566 |
| 1,139,741 | | Federated Mortgage Core Fund | 11,545,574 |
| 289,145 | | Project and Trade Finance Core Fund | 2,538,696 |
| | | TOTAL INVESTMENT COMPANIES
(IDENTIFIED COST $30,864,121) | 30,680,188 |
| | | TOTAL INVESTMENT IN SECURITIES—100.8%
(IDENTIFIED COST $152,131,483)8 | 167,890,927 |
| | | OTHER ASSETS AND LIABILITIES - NET—(0.8)%9 | (1,332,334) |
| | | TOTAL NET ASSETS—100% | $166,558,593 |
At July 31, 2020, the Fund had the following outstanding futures contracts:
| Description | Number of
Contracts | Notional
Value | Expiration
Date | Value and
Unrealized
Appreciation
(Depreciation) |
| Long Futures | | | | |
| 1United States Treasury Note 2-Year Long Futures | 60 | $13,259,062 | September 2020 | $12,000 |
| 1United States Treasury Note 10-Year Ultra Long Futures | 5 | $796,250 | September 2020 | $13,957 |
| Short Futures | | | | |
| 1United States Treasury Note 5-Year Short Futures | 15 | $1,891,875 | September 2020 | $(7,215) |
| 1United States Treasury Note 10-Year Short Futures | 2 | $280,156 | September 2020 | $(1,161) |
| NET UNREALIZED APPRECIATION ON FUTURES CONTRACTS | $17,581 |
Net Unrealized Appreciation on Futures Contracts is included in “Other Assets and Liabilities—Net.”
Annual Shareholder Report
[PAGE INTENTIONALLY LEFT BLANK]
Annual Shareholder Report
Affiliated fund holdings are investment companies which are managed by the Adviser or an affiliate of the Adviser. Transactions involving the affiliated fund holdings during the period ended July 31, 2020, were as follows:
| Affiliates | Balance
of
Shares
Held
7/31/2019 | Purchases/
Additions | Sales/
Reductions |
| Federated Bank Loan Core Fund | 135,857 | 270,061 | (124,191) |
| Emerging Markets Core Fund | 278,303 | 352,148 | (305,741) |
| Federated Hermes Government Obligations Fund, Premier Shares* | 145,972 | 121,643,726 | (120,358,060) |
| Federated Hermes Institutional Prime Value Obligations Fund, Institutional Shares | 5,815,511 | 56,702,873 | (57,093,775) |
| High Yield Bond Portfolio | 691,626 | 663,759 | (724,724) |
| Federated Mortgage Core Fund | 1,314,242 | 1,498,600 | (1,673,101) |
| Project and Trade Finance Core Fund | 362,119 | 88,131 | (161,105) |
| TOTAL OF AFFILIATED TRANSACTIONS | 8,743,630 | 181,219,298 | (180,440,697) |
Annual Shareholder Report
Balance
of
Shares
Held
7/31/2020 | Value | Change in
Unrealized
Appreciation/
Depreciation | Net
Realized
Gain/(Loss) | Dividend
Income |
| 281,727 | $2,617,248 | $10,490 | $(29,846) | $81,223 |
| 324,710 | $3,240,602 | $126,234 | $8,304 | $132,095 |
| 1,431,638 | $1,431,638 | N/A | N/A | $18,121 |
| 5,424,609 | $5,427,864 | $(649) | $7,220 | $43,855 |
| 630,661 | $3,878,566 | $90,421 | $(7,839) | $222,360 |
| 1,139,741 | $11,545,574 | $71,818 | $258,658 | $375,915 |
| 289,145 | $2,538,696 | $(12,425) | $(88,527) | $126,295 |
| 9,522,231 | $30,680,188 | $285,889 | $147,970 | $999,864 |
| * | All or a portion of the balance/activity for the fund relates to cash collateral received on securities lending transactions. |
| 1 | Non-income-producing security. |
| 2 | All or a portion of these securities are temporarily on loan to unaffiliated broker/dealers. |
| 3 | JPMorgan Chase & Co. has fully and unconditionally guaranteed Bear Stearns’ outstanding registered debt securities. |
| 4 | Floating/variable note with current rate and current maturity or next reset date shown. |
| 5 | Perpetual Bond Security. The maturity date reflects the next call date. |
| 6 | All or a portion of this security is pledged as collateral to ensure the Fund is able to satisfy the obligations of its outstanding futures contracts. |
| 7 | 7-day net yield. |
| 8 | The cost of investments for federal tax purposes amounts to $152,194,326. |
| 9 | Assets, other than investments in securities, less liabilities. See Statement of Assets and Liabilities. |
Note: The categories of investments are shown as a percentage of total net assets at July 31, 2020.
Various inputs are used in determining the value of the Fund’s investments. These inputs are summarized in the three broad levels listed below:
Level 1—quoted prices in active markets for identical securities.
Level 2—other significant observable inputs (including quoted prices for similar securities, interest rates, prepayment speeds, credit risk, etc.). Also includes securities valued at amortized cost.
Level 3—significant unobservable inputs (including the Fund’s own assumptions in determining the fair value of investments).
The inputs or methodology used for valuing securities are not an indication of the risk associated with investing in those securities.
Annual Shareholder Report
The following is a summary of the inputs used, as of July 31, 2020, in valuing the Fund’s assets carried at fair value:
| Valuation Inputs | | | | |
| | Level 1—
Quoted
Prices | Level 2—
Other
Significant
Observable
Inputs | Level 3—
Significant
Unobservable
Inputs | Total |
| Equity Securities: | | | | |
| Common Stocks | | | | |
| Domestic | $90,992,933 | $— | $— | $90,992,933 |
| International | 762,363 | — | — | 762,363 |
| Debt Securities: | | | | |
| Asset-Backed Securities | — | 910,849 | — | 910,849 |
| Collateralized Mortgage Obligations | — | 7,951 | — | 7,951 |
| Commercial Mortgage-Backed Securities | — | 2,942,608 | — | 2,942,608 |
| Corporate Bonds | — | 25,332,397 | — | 25,332,397 |
| Mortgage-Backed Securities | — | 911,209 | — | 911,209 |
| U.S. Treasuries | — | 1,595,860 | — | 1,595,860 |
| Municipal Bonds | — | 1,030,061 | — | 1,030,061 |
| Government Agency | — | 252,458 | — | 252,458 |
| Exchange-Traded Fund | 12,472,050 | — | — | 12,472,050 |
| Investment Companies1 | 28,141,492 | — | — | 30,680,188 |
| TOTAL SECURITIES | $132,368,838 | $32,983,393 | $— | $167,890,927 |
| Other Financial Instruments2 | | | | |
| Assets | $25,957 | $— | $— | $25,957 |
| Liabilities | (8,376) | — | — | (8,376) |
| TOTAL OTHER FINANCIAL INSTRUMENTS | $17,581 | $— | $— | $17,581 |
| 1 | As permitted by U.S. generally accepted accounting principles (GAAP), an Investment Company valued at $2,538,696 is measured at fair value using the net asset value (NAV) per share practical expedient and has not been categorized in the chart above, but is included in the Total column. The amount included herein is intended to permit reconciliation of the fair value classifications to the amounts presented on the Statement of Assets and Liabilities.The price of shares redeemed of Project and Trade Finance Core Fund may be determined as of the closing NAV of the fund up to twenty-four days after receipt of a shareholder redemption request |
| 2 | Other financial instruments are futures contracts. |
Annual Shareholder Report
The following acronyms are used throughout this portfolio:
| ETF | —Exchange - Traded Fund |
| FREMF | —Freddie Mac Multifamily K-Deals |
| GMTN | —Global Medium Term Note |
| GO | —General Obligation |
| GTD | —Guaranteed |
| LIBOR | —London Interbank Offered Rate |
| MTN | —Medium Term Note |
| REIT | —Real Estate Investment Trust |
| REMIC | —Real Estate Mortgage Investment Conduit |
See Notes which are an integral part of the Financial Statements
Annual Shareholder Report
Financial Highlights–Class A Shares
(For a Share Outstanding Throughout Each Period)
| Year Ended July 31 | 2020 | 2019 | 2018 | 2017 | 2016 |
| Net Asset Value, Beginning of Period | $18.71 | $19.59 | $17.74 | $16.52 | $16.83 |
| Income From Investment Operations: | | | | | |
| Net investment income1 | 0.19 | 0.25 | 0.21 | 0.26 | 0.24 |
| Net realized and unrealized gain (loss) | 1.46 | 0.57 | 1.89 | 1.23 | (0.31) |
| TOTAL FROM INVESTMENT OPERATIONS | 1.65 | 0.82 | 2.10 | 1.49 | (0.07) |
| Less Distributions: | | | | | |
| Distributions from net investment income | (0.24) | (0.19) | (0.25) | (0.27) | (0.24) |
| Distributions from net realized gain | (0.53) | (1.51) | — | — | — |
| TOTAL DISTRIBUTIONS | (0.77) | (1.70) | (0.25) | (0.27) | (0.24) |
| Net Asset Value, End of Period | $19.59 | $18.71 | $19.59 | $17.74 | $16.52 |
| Total Return2 | 9.08% | 5.28% | 11.91% | 9.11% | (0.37)% |
| Ratios to Average Net Assets: | | | | | |
| Net expenses3 | 1.31% | 1.31% | 1.32% | 1.26% | 1.30% |
| Net investment income | 1.04% | 1.35% | 1.11% | 1.51% | 1.51% |
| Expense waiver/reimbursement4 | 0.07% | 0.08% | 0.06% | 0.15% | 0.10% |
| Supplemental Data: | | | | | |
| Net assets, end of period (000 omitted) | $95,559 | $84,243 | $61,553 | $61,405 | $61,245 |
| Portfolio turnover | 152% | 92% | 89% | 82% | 98% |
| 1 | Per share numbers have been calculated using the average shares method. |
| 2 | Based on net asset value, which does not reflect the sales charge, redemption fee or contingent deferred sales charge, if applicable. |
| 3 | Amount does not reflect net expenses incurred by investment companies in which the Fund may invest. |
| 4 | This expense decrease is reflected in both the net expense and the net investment income ratios shown above. Amount does not reflect expense waiver/reimbursement recorded by investment companies in which the Fund may invest. |
See Notes which are an integral part of the Financial Statements
Annual Shareholder Report
Financial Highlights–Class C Shares
(For a Share Outstanding Throughout Each Period)
| Year Ended July 31 | 2020 | 2019 | 2018 | 2017 | 2016 |
| Net Asset Value, Beginning of Period | $18.50 | $19.31 | $17.49 | $16.30 | $16.59 |
| Income From Investment Operations: | | | | | |
| Net investment income1 | 0.05 | 0.11 | 0.06 | 0.13 | 0.12 |
| Net realized and unrealized gain (loss) | 1.43 | 0.59 | 1.87 | 1.20 | (0.31) |
| TOTAL FROM INVESTMENT OPERATIONS | 1.48 | 0.70 | 1.93 | 1.33 | (0.19) |
| Less Distributions: | | | | | |
| Distributions from net investment income | (0.10) | (0.00)2 | (0.11) | (0.14) | (0.10) |
| Distributions from net realized gain | (0.53) | (1.51) | — | — | — |
| TOTAL DISTRIBUTIONS | (0.63) | (1.51) | (0.11) | (0.14) | (0.10) |
| Net Asset Value, End of Period | $19.35 | $18.50 | $19.31 | $17.49 | $16.30 |
| Total Return3 | 8.25% | 4.54% | 11.09% | 8.23% | (1.10)% |
| Ratios to Average Net Assets: | | | | | |
| Net expenses4 | 2.06% | 2.06% | 2.07% | 2.01% | 2.05% |
| Net investment income | 0.29% | 0.60% | 0.35% | 0.75% | 0.76% |
| Expense waiver/reimbursement5 | 0.09% | 0.10% | 0.04% | 0.13% | 0.08% |
| Supplemental Data: | | | | | |
| Net assets, end of period (000 omitted) | $15,043 | $15,492 | $27,577 | $29,007 | $29,152 |
| Portfolio turnover | 152% | 92% | 89% | 82% | 98% |
| 1 | Per share numbers have been calculated using the average shares method. |
| 2 | Represents less than $0.01. |
| 3 | Based on net asset value, which does not reflect the sales charge, redemption fee or contingent deferred sales charge, if applicable. |
| 4 | Amount does not reflect net expenses incurred by investment companies in which the Fund may invest. |
| 5 | This expense decrease is reflected in both the net expense and the net investment income ratios shown above. Amount does not reflect expense waiver/reimbursement recorded by investment companies in which the Fund may invest. |
See Notes which are an integral part of the Financial Statements
Annual Shareholder Report
Financial Highlights–Institutional Shares
(For a Share Outstanding Throughout Each Period)
| Year Ended July 31 | 2020 | 2019 | 2018 | 2017 | 2016 |
| Net Asset Value, Beginning of Period | $18.78 | $19.64 | $17.79 | $16.57 | $16.87 |
| Income From Investment Operations: | | | | | |
| Net investment income1 | 0.24 | 0.30 | 0.26 | 0.30 | 0.28 |
| Net realized and unrealized gain (loss) | 1.46 | 0.58 | 1.89 | 1.23 | (0.30) |
| TOTAL FROM INVESTMENT OPERATIONS | 1.70 | 0.88 | 2.15 | 1.53 | (0.02) |
| Less Distributions: | | | | | |
| Distributions from net investment income | (0.28) | (0.23) | (0.30) | (0.31) | (0.28) |
| Distributions from net realized gain | (0.53) | (1.51) | — | — | — |
| TOTAL DISTRIBUTIONS | (0.81) | (1.74) | (0.30) | (0.31) | (0.28) |
| Net Asset Value, End of Period | $19.67 | $18.78 | $19.64 | $17.79 | $16.57 |
| Total Return2 | 9.33% | 5.61% | 12.15% | 9.36% | (0.07)% |
| Ratios to Average Net Assets: | | | | | |
| Net expenses3 | 1.06% | 1.06% | 1.07% | 1.00% | 1.05% |
| Net investment income | 1.29% | 1.62% | 1.35% | 1.77% | 1.76% |
| Expense waiver/reimbursement4 | 0.07% | 0.08% | 0.02% | 0.12% | 0.05% |
| Supplemental Data: | | | | | |
| Net assets, end of period (000 omitted) | $54,440 | $53,035 | $54,358 | $39,136 | $47,757 |
| Portfolio turnover | 152% | 92% | 89% | 82% | 98% |
| 1 | Per share numbers have been calculated using the average shares method. |
| 2 | Based on net asset value. |
| 3 | Amount does not reflect net expenses incurred by investment companies in which the Fund may invest. |
| 4 | This expense decrease is reflected in both the net expense and the net investment income ratios shown above. Amount does not reflect expense waiver/reimbursement recorded by investment companies in which the Fund may invest. |
See Notes which are an integral part of the Financial Statements
Annual Shareholder Report
Financial Highlights–Class R6 Shares
(For a Share Outstanding Throughout Each Period)
| Year Ended July 31 | 2020 | 2019 | 2018 | 20171 | 2016 |
| Net Asset Value, Beginning of Period | $18.74 | $19.62 | $17.76 | $16.49 | $16.80 |
| Income From Investment Operations: | | | | | |
| Net investment income2 | 0.24 | 0.27 | 0.26 | 0.28 | 0.20 |
| Net realized and unrealized gain (loss) | 1.44 | 0.60 | 1.90 | 1.24 | (0.31) |
| TOTAL FROM INVESTMENT OPERATIONS | 1.68 | 0.87 | 2.16 | 1.52 | (0.11) |
| Less Distributions: | | | | | |
| Distributions from net investment income | (0.28) | (0.24) | (0.30) | (0.25) | (0.20) |
| Distributions from net realized gain | (0.53) | (1.51) | — | — | — |
| TOTAL DISTRIBUTIONS | (0.81) | (1.75) | (0.30) | (0.25) | (0.20) |
| Net Asset Value, End of Period | $19.61 | $18.74 | $19.62 | $17.76 | $16.49 |
| Total Return3 | 9.26% | 5.56% | 12.24% | 9.32% | (0.59)% |
| Ratios to Average Net Assets: | | | | | |
| Net expenses4 | 1.05% | 1.05% | 1.06% | 1.05% | 1.56% |
| Net investment income | 1.29% | 1.40% | 1.36% | 1.64% | 1.27% |
| Expense waiver/reimbursement5 | 0.03% | 0.06% | 0.02% | 0.06% | 0.04% |
| Supplemental Data: | | | | | |
| Net assets, end of period (000 omitted) | $1,516 | $3,165 | $12,178 | $10,439 | $577 |
| Portfolio turnover | 152% | 92% | 89% | 82% | 98% |
| 1 | Effective September 1, 2016, the Fund’s Class R Shares were redesignated as Class R6 Shares. |
| 2 | Per share numbers have been calculated using the average shares method. |
| 3 | Based on net asset value. |
| 4 | Amount does not reflect net expenses incurred by investment companies in which the Fund may invest. |
| 5 | This expense decrease is reflected in both the net expense and the net investment income ratios shown above. Amount does not reflect expense waiver/reimbursement recorded by investment companies in which the Fund may invest. |
See Notes which are an integral part of the Financial Statements
Annual Shareholder Report
Statement of Assets and Liabilities
July 31, 2020
| Assets: | | |
| Investment in securities, at value including $1,393,833 of securities loaned and $30,680,188 of investment in affiliated holdings* (identified cost $152,131,483) | | $167,890,927 |
| Cash denominated in foreign currencies (identified cost $3,315) | | 3,402 |
| Income receivable | | 296,519 |
| Income receivable from affiliated holdings | | 75,691 |
| Receivable for investments sold | | 133,269 |
| Receivable for shares sold | | 111,257 |
| Receivable for variation margin on futures contracts | | 2,331 |
| TOTAL ASSETS | | 168,513,396 |
| Liabilities: | | |
| Payable for investments purchased | $174,405 | |
| Payable for shares redeemed | 133,105 | |
| Payable for collateral due to broker for securities lending | 1,431,638 | |
| Payable for investment adviser fee (Note 5) | 3,105 | |
| Payable for administrative fee (Note 5) | 354 | |
| Payable for auditing fees | 34,300 | |
| Payable for distribution services fee (Note 5) | 9,376 | |
| Payable for other service fees (Notes 2 and 5) | 44,799 | |
| Payable for share registration costs | 42,199 | |
| Accrued expenses (Note 5) | 81,522 | |
| TOTAL LIABILITIES | | 1,954,803 |
| Net assets for 8,501,729 shares outstanding | | $166,558,593 |
| Net Assets Consist of: | | |
| Paid-in capital | | $148,508,687 |
| Total distributable earnings (loss) | | 18,049,906 |
| TOTAL NET ASSETS | | $166,558,593 |
Annual Shareholder Report
Statement of Assets and Liabilities–continued
| Net Asset Value, Offering Price and Redemption Proceeds Per Share | | |
| Class A Shares: | | |
| Net asset value per share ($95,559,269 ÷ 4,878,534 shares outstanding), no par value, unlimited shares authorized | | $19.59 |
| Offering price per share (100/94.50 of $19.59) | | $20.73 |
| Redemption proceeds per share | | $19.59 |
| Class C Shares: | | |
| Net asset value per share ($15,043,186 ÷ 777,597 shares outstanding), no par value, unlimited shares authorized | | $19.35 |
| Offering price per share | | $19.35 |
| Redemption proceeds per share (99.00/100 of $19.35) | | $19.16 |
| Institutional Shares: | | |
| Net asset value per share ($54,440,255 ÷ 2,768,314 shares outstanding), no par value, unlimited shares authorized | | $19.67 |
| Offering price per share | | $19.67 |
| Redemption proceeds per share | | $19.67 |
| Class R6 Shares: | | |
| Net asset value per share ($1,515,883 ÷ 77,284 shares outstanding), no par value, unlimited shares authorized | | $19.61 |
| Offering price per share | | $19.61 |
| Redemption proceeds per share | | $19.61 |
| * | See information listed after the Fund’s Portfolio of Investments. |
See Notes which are an integral part of the Financial Statements
Annual Shareholder Report
Statement of Operations
Year Ended July 31, 2020
| Investment Income: | | | |
| Dividends (including $981,121 received from affiliated holdings* and net of foreign taxes withheld of $846) | | | $2,684,949 |
| Interest | | | 986,659 |
| Net income on securities loaned (includes $18,743 earned from affiliated holdings* related to cash collateral balances) (Note 2) | | | 26,143 |
| TOTAL INCOME | | | 3,697,751 |
| Expenses: | | | |
| Investment adviser fee (Note 5) | | $1,179,440 | |
| Administrative fee (Note 5) | | 128,880 | |
| Custodian fees | | 57,314 | |
| Transfer agent fees (Note 2) | | 163,312 | |
| Directors’/Trustees’ fees (Note 5) | | 2,258 | |
| Auditing fees | | 34,300 | |
| Legal fees | | 7,722 | |
| Portfolio accounting fees | | 104,595 | |
| Distribution services fee (Note 5) | | 111,375 | |
| Other service fees (Notes 2 and 5) | | 247,671 | |
| Share registration costs | | 61,531 | |
| Printing and postage | | 29,726 | |
| Miscellaneous (Note 5) | | 31,931 | |
| TOTAL EXPENSES | | 2,160,055 | |
| Waiver and Reimbursements: | | | |
| Waiver/reimbursement of investment adviser fee (Note 5) | $(49,944) | | |
Reimbursement of other operating expenses
(Notes 2 and 5) | (66,021) | | |
| TOTAL WAIVER AND REIMBURSEMENTS | | (115,965) | |
| Net expenses | | | 2,044,090 |
| Net investment income | | | $1,653,661 |
Annual Shareholder Report
Statement of Operations–continued
| Realized and Unrealized Gain (Loss) on Investments, Futures Contracts and Foreign Currency Transactions: | | | |
| Net realized gain on investments (including net realized gain of $147,970 on sales of investments in affiliated holdings*) and foreign currency transactions | | | $3,973,443 |
| Net realized gain on futures contracts | | | 465,553 |
| Net change in unrealized appreciation of investments (including net change in unrealized depreciation of $285,889 of investments in affiliated holdings*) | | | 7,132,217 |
| Net change in unrealized appreciation/depreciation of translation of assets and liabilities in foreign currency | | | 135 |
| Net change in unrealized appreciation of futures contracts | | | (12,191) |
| Net realized and unrealized gain (loss) on investments, futures contracts and foreign currency transactions | | | 11,559,157 |
| Change in net assets resulting from operations | | | $13,212,818 |
| * | See information listed after the Fund’s Portfolio of Investments. |
See Notes which are an integral part of the Financial Statements
Annual Shareholder Report
Statement of Changes in Net Assets
| Year Ended July 31 | 2020 | 2019 |
| Increase (Decrease) in Net Assets | | |
| Operations: | | |
| Net investment income | $1,653,661 | $2,133,076 |
| Net realized gain | 4,438,996 | 7,525,854 |
| Net change in unrealized appreciation/depreciation | 7,120,161 | (1,859,525) |
| CHANGE IN NET ASSETS RESULTING FROM OPERATIONS | 13,212,818 | 7,799,405 |
| Distributions to Shareholders: | | |
| Class A Shares | (3,813,305) | (6,723,192) |
| Class C Shares | (539,280) | (1,044,348) |
| Institutional Shares | (2,518,867) | (5,847,283) |
| Class R6 Shares | (108,342) | (242,234) |
| CHANGE IN NET ASSETS RESULTING FROM DISTRIBUTIONS TO SHAREHOLDERS | (6,979,794) | (13,857,057) |
| Share Transactions: | | |
| Proceeds from sale of shares | 29,726,646 | 63,670,084 |
| Proceeds from shares issued in connection with the tax-free transfer of assets from PNC Balanced Allocation Fund | 11,298,197 | — |
| Net asset value of shares issued to shareholders in payment of distributions declared | 6,622,021 | 12,933,369 |
| Cost of shares redeemed | (43,256,472) | (70,276,399) |
| CHANGE IN NET ASSETS RESULTING FROM SHARE TRANSACTIONS | 4,390,392 | 6,327,054 |
| Change in net assets | 10,623,416 | 269,402 |
| Net Assets: | | |
| Beginning of period | 155,935,177 | 155,665,775 |
| End of period | $166,558,593 | $155,935,177 |
See Notes which are an integral part of the Financial Statements
Annual Shareholder Report
Notes to Financial Statements
July 31, 2020
1. ORGANIZATION
Federated Hermes MDT Series (the “Trust”) is registered under the Investment Company Act of 1940, as amended (the “Act”), as an open-end management investment company. The Trust consists of five portfolios. The financial statements included herein are only those of Federated Hermes MDT Balanced Fund (the “Fund”), a diversified portfolio. The financial statements of the other portfolios are presented separately. The assets of each portfolio are segregated and a shareholder’s interest is limited to the portfolio in which shares are held. Each portfolio pays its own expenses. The Fund offers four classes of shares: Class A Shares, Class C Shares, Institutional Shares and Class R6 Shares. All shares of the Fund have equal rights with respect to voting, except on class-specific matters. The investment objective of the Fund is the possibility of long-term growth of capital and income.
On March 30, 2017, the Fund’s T Share class became effective with the Securities and Exchange Commission (SEC), but is not yet offered for sale.
Effective August 1, 2018, an automatic conversion feature for Class C Shares was implemented. Pursuant to this automatic conversion feature, after Class C Shares have been held for ten years from the date of purchase, they will automatically convert to Class A Shares on the next monthly conversion processing date.
On November 15, 2019, the Fund acquired all of the net assets of PNC Balanced Allocation Fund (the “Acquired Fund”), an open-end investment company, in a tax-free reorganization in exchange for shares of the Fund, pursuant to a plan of reorganization approved by the Acquired Fund’s shareholders on November 5, 2019. The purpose of the transaction was to combine two portfolios with comparable investment objectives and strategies. For financial reporting purposes, assets received and shares issued by the Fund were recorded at fair value; however, the cost basis of the investments received from the Acquired Fund was carried forward to align ongoing reporting of the Fund’s realized gains and losses with amounts distributable to shareholders for tax purposes.
For every one share of the Acquired Fund’s Class A Shares exchanged, a shareholder received 0.616 shares of the Fund’s Class A Shares.
For every one share of the Acquired Fund’s Class C Shares exchanged, a shareholder received 0.609 shares of the Fund’s Class C Shares.
For every one share of the Acquired Fund’s Class Institutional Shares exchanged, a shareholder received 0.610 shares of the Fund’s Institutional Shares.
The Fund received net assets from the Acquired Fund as a result of the tax-free reorganization as follows:
Shares of the
Fund Issued | Acquired Fund’s
Net Assets Received | Unrealized
Appreciation1 | Net Assets
of the Fund
Immediately
Prior to
Combination | Net Assets
of the Fund
Immediately
After
Combination |
| 593,132 | $11,298,197 | $2,170,935 | $154,177,771 | $165,475,968 |
| 1 | Unrealized Appreciation is included in the Net Assets Received amount shown above. |
Annual Shareholder Report
Assuming the acquisition had been completed on August 1, 2019, the beginning of the annual reporting period of the Fund, the Fund’s pro forma results of operations for the year ended July 31, 2020, were as follows:
| Net investment income | $1,721,772 |
| Net realized and unrealized gain on investments | 11,959,769 |
| Net increase in net assets resulting from operations | $13,681,541 |
Because the combined investment portfolios have been managed as a single integrated portfolio since the acquisition was completed, it is not practicable to separate the amounts of revenue and earnings of the Acquired Fund that have been included in the Fund’s Statement of Operations and Statement of Changes, respectively, as of July 31, 2020.
Prior to June 29, 2020, the name of the Trust and Fund was Federated MDT Series and Federated MDT Balanced Fund, respectively.
2. SIGNIFICANT ACCOUNTING POLICIES
The following is a summary of significant accounting policies consistently followed by the Fund in the preparation of its financial statements. These policies are in conformity with GAAP.
Investment Valuation
In calculating its NAV, the Fund generally values investments as follows:
| ■ | Equity securities listed on an exchange or traded through a regulated market system are valued at their last reported sale price or official closing price in their principal exchange or market. |
| ■ | Fixed-income securities are fair valued using price evaluations provided by a pricing service approved by the Fund’s Board of Trustees (the “Trustees”). |
| ■ | Shares of other mutual funds or non-exchange-traded investment companies are valued based upon their reported NAVs. |
| ■ | Derivative contracts listed on exchanges are valued at their reported settlement or closing price, except that options are valued at the mean of closing bid and asked quotations. |
| ■ | Over-the-counter (OTC) derivative contracts are fair valued using price evaluations provided by a pricing service approved by the Trustees. |
| ■ | For securities that are fair valued in accordance with procedures established by and under the general supervision of the Trustees, certain factors may be considered, such as: the last traded or purchase price of the security, information obtained by contacting the issuer or dealers, analysis of the issuer’s financial statements or other available documents, fundamental analytical data, the nature and duration of restrictions on disposition, the movement of the market in which the security is normally traded, public trading in similar securities or derivative contracts of the issuer or comparable issuers, movement of a relevant index, or other factors including but not limited to industry changes and relevant government actions. |
If any price, quotation, price evaluation or other pricing source is not readily available when the NAV is calculated, if the Fund cannot obtain price evaluations from a pricing service or from more than one dealer for an investment within a reasonable period of time as set forth in the Fund’s valuation policies and procedures, or if information furnished by a pricing service, in the opinion of the valuation committee (“Valuation Committee”), is deemed not representative of the fair value of such security, the Fund
Annual Shareholder Report
uses the fair value of the investment determined in accordance with the procedures described below. There can be no assurance that the Fund could obtain the fair value assigned to an investment if it sold the investment at approximately the time at which the Fund determines its NAV per share, and the actual value obtained could be materially different.
Fair Valuation and Significant Events Procedures
The Trustees have ultimate responsibility for determining the fair value of investments for which market quotations are not readily available. The Trustees have appointed a Valuation Committee comprised of officers of the Fund, Federated MDTA LLC (the “Adviser”) and certain of the Adviser’s affiliated companies to assist in determining fair value and in overseeing the calculation of the NAV. The Trustees have also authorized the use of pricing services recommended by the Valuation Committee to provide fair value evaluations of the current value of certain investments for purposes of calculating the NAV. The Valuation Committee employs various methods for reviewing third-party pricing-service evaluations including periodic reviews of third-party pricing services’ policies, procedures and valuation methods (including key inputs, methods, models and assumptions), transactional back-testing, comparisons of evaluations of different pricing services, and review of price challenges by the Adviser based on recent market activity. In the event that market quotations and price evaluations are not available for an investment, the Valuation Committee determines the fair value of the investment in accordance with procedures adopted by the Trustees. The Trustees periodically review and approve the fair valuations made by the Valuation Committee and any changes made to the procedures.
Factors considered by pricing services in evaluating an investment include the yields or prices of investments of comparable quality, coupon, maturity, call rights and other potential prepayments, terms and type, reported transactions, indications as to values from dealers and general market conditions. Some pricing services provide a single price evaluation reflecting the bid-side of the market for an investment (a “bid” evaluation). Other pricing services offer both bid evaluations and price evaluations indicative of a price between the prices bid and asked for the investment (a “mid” evaluation). The Fund normally uses bid evaluations for any U.S. Treasury and Agency securities, mortgage-backed securities and municipal securities. The Fund normally uses mid evaluations for any other types of fixed-income securities and any OTC derivative contracts. In the event that market quotations and price evaluations are not available for an investment, the fair value of the investment is determined in accordance with procedures adopted by the Trustees.
The Trustees also have adopted procedures requiring an investment to be priced at its fair value whenever the Adviser determines that a significant event affecting the value of the investment has occurred between the time as of which the price of the investment would otherwise be determined and the time as of which the NAV is computed. An event is considered significant if there is both an affirmative expectation that the investment’s value will change in response to the event and a reasonable basis for quantifying the resulting change in value. Examples of significant events that may occur after the close of the principal market on which a security is traded, or after the time of a price evaluation provided by a pricing service or a dealer, include:
| ■ | With respect to securities traded principally in foreign markets, significant trends in U.S. equity markets or in the trading of foreign securities index futures contracts; |
| ■ | Political or other developments affecting the economy or markets in which an issuer conducts its operations or its securities are traded; |
Annual Shareholder Report
| ■ | Announcements concerning matters such as acquisitions, recapitalizations, litigation developments, or a natural disaster affecting the issuer’s operations or regulatory changes or market developments affecting the issuer’s industry. |
The Trustees have adopted procedures whereby the Valuation Committee uses a pricing service to provide factors to update the fair value of equity securities traded principally in foreign markets from the time of the close of their respective foreign stock exchanges to the pricing time of the Fund. For other significant events, the Fund may seek to obtain more current quotations or price evaluations from alternative pricing sources. If a reliable alternative pricing source is not available, the Fund will determine the fair value of the investment in accordance with the fair valuation procedures approved by the Trustees. The Trustees have ultimate responsibility for any fair valuations made in response to a significant event.
Repurchase Agreements
The Fund may invest in repurchase agreements for short-term liquidity purposes. It is the policy of the Fund to require the other party to a repurchase agreement to transfer to the Fund’s custodian or sub-custodian eligible securities or cash with a market value (after transaction costs) at least equal to the repurchase price to be paid under the repurchase agreement. The eligible securities are transferred to accounts with the custodian or sub-custodian in which the Fund holds a “securities entitlement” and exercises “control” as those terms are defined in the Uniform Commercial Code. The Fund has established procedures for monitoring the market value of the transferred securities and requiring the transfer of additional eligible securities if necessary to equal at least the repurchase price. These procedures also allow the other party to require securities to be transferred from the account to the extent that their market value exceeds the repurchase price or in exchange for other eligible securities of equivalent market value.
The insolvency of the other party or other failure to repurchase the securities may delay the disposition of the underlying securities or cause the Fund to receive less than the full repurchase price. Under the terms of the repurchase agreement, any amounts received by the Fund in excess of the repurchase price and related transaction costs must be remitted to the other party.
The Fund may enter into repurchase agreements in which eligible securities are transferred into joint trading accounts maintained by the custodian or sub-custodian for investment companies and other clients advised by the Fund’s Adviser and its affiliates. The Fund will participate on a pro rata basis with the other investment companies and clients in its share of the securities transferred under such repurchase agreements and in its share of proceeds from any repurchase or other disposition of such securities.
Investment Income, Gains and Losses, Expenses and Distributions
Investment transactions are accounted for on a trade-date basis. Realized gains and losses from investment transactions are recorded on an identified-cost basis. Interest income and expenses are accrued daily. Dividend income and distributions to shareholders are recorded on the ex-dividend date. Foreign dividends are recorded on the ex-dividend date or when the Fund is informed of the ex-dividend date. Amortization/accretion of premium and discount is included in investment income. Gains and losses realized on principal payment of mortgage-backed securities (paydown gains and losses) are classified as part of investment income. Positive or negative inflation adjustments on Treasury Inflation-Protected Securities are included in interest income. Distributions of net investment income, if any, are declared and paid annually. Non-cash dividends included in dividend income, if any, are recorded at fair value.
Annual Shareholder Report
Investment income, realized and unrealized gains and losses, and certain fund-level expenses are allocated to each class based on relative average daily net assets, except that select classes will bear certain expenses unique to those classes. The detail of the total fund expense waiver and reimbursements of $115,965 is disclosed in various locations in this Note 2 and Note 5. For the year ended July 31, 2020, transfer agent fees for the Fund were as follows:
| | Transfer Agent
Fees Incurred | Transfer Agent
Fees Reimbursed |
| Class A Shares | $96,349 | $(36,757) |
| Class C Shares | 16,470 | (8,270) |
| Institutional Shares | 49,446 | (20,994) |
| Class R6 Shares | 1,047 | — |
| TOTAL | $163,312 | $(66,021) |
Dividends are declared separately for each class. No class has preferential dividend rights; differences in per share dividend rates are generally due to differences in separate class expenses.
Other Service Fees
The Fund may pay other service fees up to 0.25% of the average daily net assets of the Fund’s Class A Shares and Class C Shares to unaffiliated financial intermediaries or to Federated Shareholder Services Company (FSSC) for providing services to shareholders and maintaining shareholder accounts. Subject to the terms described in the Expense Limitation note, FSSC may voluntarily reimburse the Fund for other service fees. For the year ended July 31, 2020, other service fees for the Fund were as follows:
| | Other Service
Fees Incurred |
| Class A Shares | $210,546 |
| Class C Shares | 37,125 |
| TOTAL | $247,671 |
Federal Taxes
It is the Fund’s policy to comply with the Subchapter M provision of the Internal Revenue Code and to distribute to shareholders each year substantially all of its income. Accordingly, no provision for federal income tax is necessary. As of and during the year ended July 31, 2020, the Fund did not have a liability for any uncertain tax positions. The Fund recognizes interest and penalties, if any, related to tax liabilities as income tax expense in the Statement of Operations. As of July 31, 2020, tax years 2017 through 2020 remain subject to examination by the Fund’s major tax jurisdictions, which include the United States of America and the Commonwealth of Massachusetts.
The Fund may be subject to taxes imposed by governments of countries in which it invests. Such taxes are generally based on either income or gains earned or repatriated. The Fund accrues and applies such taxes to net investment income, net realized gains and net unrealized gains as income and/or gains are earned.
Annual Shareholder Report
When-Issued and Delayed-Delivery Transactions
The Fund may engage in when-issued or delayed-delivery transactions. The Fund records when-issued securities on the trade date and maintains security positions such that sufficient liquid assets will be available to make payment for the securities purchased. Securities purchased on a when-issued or delayed-delivery basis are marked to market daily and begin earning interest on the settlement date. Losses may occur on these transactions due to changes in market conditions or the failure of counterparties to perform under the contract.
Futures Contracts
The Fund purchases and sells financial futures contracts to manage duration and yield curve risks. Upon entering into a financial futures contract with a broker, the Fund is required to deposit with a broker, either U.S. government securities or a specified amount of cash, which is shown as due from broker in the Statement of Assets and Liabilities. Futures contracts are valued daily and unrealized gains or losses are recorded in a “variation margin” account. The Fund receives from or pays to the broker a specified amount of cash based upon changes in the variation margin account. When a contract is closed, the Fund recognizes a realized gain or loss. Futures contracts have market risks, including the risk that the change in the value of the contract may not correlate with the changes in the value of the underlying securities. There is minimal counterparty risk to the Fund since futures contracts are exchange traded and the exchange’s clearinghouse, as counterparty to all exchange traded futures contracts, guarantees the futures contracts against default.
Futures contracts outstanding at period end are listed after the Fund’s Portfolio of Investments.
The average notional value of long and short futures contracts held by the Fund throughout the period was $12,808,736 and $1,921,558, respectively. This is based on amounts held as of each month-end throughout the fiscal period.
Restricted Securities
The Fund may purchase securities which are considered restricted. Restricted securities are securities that either: (a) cannot be offered for public sale without first being registered, or being able to take advantage of an exemption from registration, under the Securities Act of 1933; or (b) are subject to contractual restrictions on public sales. In some cases, when a security cannot be offered for public sale without first being registered, the issuer of the restricted security has agreed to register such securities for resale, at the issuer’s expense, either upon demand by the Fund or in connection with another registered offering of the securities. Many such restricted securities may be resold in the secondary market in transactions exempt from registration. Restricted securities may be determined to be liquid under criteria established by the Trustees. The Fund will not incur any registration costs upon such resales. The Fund’s restricted securities, like other securities, are priced in accordance with procedures established by and under the general supervision of the Trustees.
Securities Lending
The Fund participates in a securities lending program providing for the lending of equity securities to qualified brokers. The term of the loans within the program is one year or less. The Fund normally receives cash collateral for securities loaned that is invested in affiliated money market funds, other money market instruments and/or repurchase agreements. Investments in money market funds may include funds with a “floating” NAV that can impose redemption fees and liquidity gates, impose certain operational
Annual Shareholder Report
impediments to investing cash collateral, and, if the investee fund’s NAV decreases, result in the Fund recognizing losses and being required to cover the decrease in the value of the cash collateral. Collateral is maintained at a minimum level of 100% of the market value of investments loaned, plus interest, if applicable. In accordance with the Fund’s securities lending agreement, the market value of securities on loan is determined each day at the close of business and any additional collateral required to cover the value of securities on loan is delivered to the Fund on the next business day. Earnings on collateral are allocated between the borrower of the security, the securities lending agent, as a fee for its services under the program and the Fund, according to agreed-upon rates. The Fund will not have the right to vote on securities while they are on loan. However, the Fund will attempt to terminate a loan in an effort to reacquire the securities in time to vote on matters that are deemed to be material by the Adviser. There can be no assurance that the Fund will have sufficient notice of such matters to be able to terminate the loan in time to vote thereon.
Securities lending transactions are subject to Master Netting Agreements which are agreements between the Fund and its counterparties that provide for the net settlement of all transactions and collateral with the Fund, through a single payment, in the event of default or termination. Amounts presented on the Portfolio of Investments and Statement of Assets and Liabilities are not net settlement amounts but gross. As indicated below, the cash collateral received by the Fund exceeds the market value of the securities loaned reducing the net settlement amount to zero. The chart below identifies the amount of collateral received as well as the market value of securities on loan. Additionally, the securities lending agreement executed by the Fund includes an indemnification clause. This clause stipulates that the borrower will reimburse the Fund for any losses as a result of any failure of the borrower to return equivalent securities to the Fund.
As of July 31, 2020, securities subject to this type of arrangement and related collateral were as follows:
Market Value of
Securities Loaned | Collateral
Received |
| $1,393,833 | $1,431,638 |
Additional Disclosure Related to Derivative Instruments
| Fair Value of Derivative Instruments |
| | Assets |
| | Statement of
Assets and
Liabilities
Location | Fair
Value |
| Derivatives not accounted for as hedging instruments under ASC Topic 815 | | |
| Interest rate contracts | Receivable for
variation margin on
futures contracts | $ 17,581* |
| * | Includes cumulative net appreciation of futures contracts as reported in the footnotes to the Portfolio of Investments. Only the current day’s variation margin is reported within the Statement of Assets and Liabilities. |
Annual Shareholder Report
The Effect of Derivative Instruments on the Statement of Operations for the Year Ended July 31, 2020
| Amount of Realized Gain or (Loss) on Derivatives Recognized in Income |
| | Futures
Contracts |
| Interest rate contracts | $465,553 |
| Change in Unrealized Appreciation or (Depreciation) on Derivatives Recognized in Income |
| | Futures
Contracts |
| Interest rate contracts | $(12,191) |
Other
The preparation of financial statements in conformity with GAAP requires management to make estimates and assumptions that affect the amounts of assets, liabilities, expenses and revenues reported in the financial statements. Actual results could differ materially from those estimated. The Fund applies investment company accounting and reporting guidance.
3. SHARES OF BENEFICIAL INTEREST
The following tables summarize share activity:
| Year Ended July 31 | 2020 | 2019 |
| Class A Shares: | Shares | Amount | Shares | Amount |
| Shares sold | 602,633 | $11,030,108 | 1,017,180 | $18,426,997 |
| Conversion of Class C Shares to Class A Shares | — | — | 577,227 | 11,313,650 |
| Proceeds from shares issued in connection with the tax-free transfer of assets from the Acquired Fund | 425,056 | 8,093,068 | — | — |
| Shares issued to shareholders in payment of distributions declared | 191,088 | 3,554,535 | 356,509 | 5,992,523 |
| Shares redeemed | (842,124) | (15,137,260) | (591,801) | (10,713,481) |
NET CHANGE RESULTING FROM
CLASS A SHARE TRANSACTIONS | 376,653 | $7,540,451 | 1,359,115 | $25,019,689 |
| Year Ended July 31 | 2020 | 2019 |
| Class C Shares: | Shares | Amount | Shares | Amount |
| Shares sold | 156,794 | $2,848,857 | 295,829 | $5,229,357 |
| Conversion of Class C Shares to Class A Shares | — | — | (585,290) | (11,313,650) |
| Proceeds from shares issued in connection with the tax-free transfer of assets from the Acquired Fund | 24,943 | 468,430 | — | — |
| Shares issued to shareholders in payment of distributions declared | 26,632 | 488,464 | 54,548 | 903,860 |
| Shares redeemed | (268,255) | (4,750,816) | (355,430) | (6,666,352) |
NET CHANGE RESULTING FROM
CLASS C SHARE TRANSACTIONS | (59,886) | $(945,065) | (590,343) | $(11,846,785) |
Annual Shareholder Report
| Year Ended July 31 | 2020 | 2019 |
| Institutional Shares: | Shares | Amount | Shares | Amount |
| Shares sold | 806,718 | $15,223,232 | 1,337,055 | $24,174,708 |
| Proceeds from shares issued in connection with the tax-free transfer of assets from the Acquired Fund | 143,133 | 2,736,699 | — | — |
| Shares issued to shareholders in payment of distributions declared | 132,428 | 2,472,322 | 344,529 | 5,809,112 |
| Shares redeemed | (1,138,214) | (21,041,358) | (1,624,656) | (28,538,979) |
NET CHANGE RESULTING FROM
INSTITUTIONAL SHARE TRANSACTIONS | (55,935) | $(609,105) | 56,928 | $1,444,841 |
| Year Ended July 31 | 2020 | 2019 |
| Class R6 Shares: | Shares | Amount | Shares | Amount |
| Shares sold | 33,882 | $624,449 | 235,953 | $4,525,372 |
| Shares issued to shareholders in payment of distributions declared | 5,727 | 106,700 | 13,548 | 227,874 |
| Shares redeemed | (131,269) | (2,327,038) | (701,361) | (13,043,937) |
NET CHANGE RESULTING FROM
CLASS R6 SHARE TRANSACTIONS | (91,660) | $(1,595,889) | (451,860) | $(8,290,691) |
NET CHANGE RESULTING FROM
TOTAL FUND SHARE TRANSACTIONS | 169,172 | $4,390,392 | 373,840 | $6,327,054 |
4. FEDERAL TAX INFORMATION
The accounting treatment of certain items in accordance with tax regulations may differ from the accounting treatment in accordance with GAAP which may result in permanent differences. In the case of the Fund, such differences primarily result from open wash sales deferrals on Acquired Funds.
For the year ended July 31, 2020, permanent differences identified and reclassified among the components of net assets were as follows:
| Increase (Decrease) |
| Paid-In Capital | Total Distributable
Earnings (Loss) |
| $32,889 | $(32,889) |
Net assets were not affected by this reclassification.
The tax character of distributions as reported on the Statement of Changes in Net Assets for the years ended July 31, 2020 and 2019, was as follows:
| | 2020 | 2019 |
| Ordinary income1 | $4,219,861 | $7,714,224 |
| Long-term capital gains | $2,759,933 | $6,142,833 |
| 1 | For tax purposes, short-term capital gain distributions are considered ordinary income distributions. |
Annual Shareholder Report
As of July 31, 2020, the components of distributable earnings on a tax-basis were as follows:
| Undistributed ordinary income2 | $13,453 |
| Net unrealized appreciation | $15,677,408 |
| Undistributed long-term capital gains | $2,359,045 |
| Capital loss deferrals | $(19,328) |
| 2 | For tax purposes, short-term capital gains are considered ordinary income in determining distributable earnings. |
The difference between book-basis and tax-basis net unrealized appreciation/depreciation is attributable to differing treatments for the deferral of losses on wash sales, mark to market of futures contracts, deferral of paydown losses, straddle loss deferrals, TIPS deflation deferrals and partnership adjustments.
At July 31, 2020, the cost of investments for federal tax purposes was $152,194,326. The net unrealized appreciation of investments for federal tax purposes was $15,677,273. This consists of net unrealized appreciation from investments for those securities having an excess of value over cost of $19,791,716 and net unrealized depreciation from investments for those securities having an excess of cost over value of $4,114,443. The amounts presented are inclusive of derivative contracts.
At July 31, 2020, for federal income tax purposes, the Fund had $19,328 in straddle loss deferrals.
5. INVESTMENT ADVISER FEE AND OTHER TRANSACTIONS WITH AFFILIATES
Investment Adviser Fee
The advisory agreement between the Fund and the Adviser provides for an annual fee equal to 0.75% of the Fund’s average daily net assets. Subject to the terms described in the Expense Limitation note, the Adviser may voluntarily choose to waive any portion of its fee and/or reimburse certain operating expenses of the Fund. For the year ended July 31, 2020, the Adviser voluntarily waived $45,667 of its fee and voluntarily reimbursed $66,021 of transfer agent fees.
The Adviser has agreed to reimburse the Fund for certain investment adviser fees as a result of transactions in other affiliated investment companies. For the year ended July 31, 2020, the Adviser reimbursed $4,277.
Certain of the Fund’s assets are managed by Federated Investment Management Company (the “Sub-Adviser”). Under the terms of a sub-advisory agreement between the Adviser and the Sub-Adviser, the Sub-Adviser receives an allocable portion of the Fund’s adviser fee. The fee is paid by the Adviser out of its resources and is not an incremental Fund expense. For the year ended July 31, 2020, the Sub-Adviser earned a fee of $142,739.
Annual Shareholder Report
Administrative Fee
Federated Administrative Services (FAS), under the Administrative Services Agreement, provides the Fund with administrative personnel and services. For purposes of determining the appropriate rate breakpoint, “Investment Complex” is defined as all of the Federated Hermes Funds subject to a fee under the Administrative Services Agreement. The fee paid to FAS is based on the average daily net assets of the Investment Complex as specified below:
| Administrative Fee | Average Daily Net Assets
of the Investment Complex |
| 0.100% | on assets up to $50 billion |
| 0.075% | on assets over $50 billion |
Subject to the terms described in the Expense Limitation note, FAS may voluntarily choose to waive any portion of its fee. For the year ended July 31, 2020, the annualized fee paid to FAS was 0.082% of average daily net assets of the Fund.
In addition, FAS may charge certain out-of-pocket expenses to the Fund.
Distribution Services Fee
The Fund has adopted a Distribution Plan (the “Plan”) pursuant to Rule 12b-1 under the Act. Under the terms of the Plan, the Fund will compensate Federated Securities Corp. (FSC), the principal distributor, from the daily net assets of the Fund’s Class A Shares and Class C Shares to finance activities intended to result in the sale of these shares. The Plan provides that the Fund may incur distribution expenses at the following percentages of average daily net assets annually, to compensate FSC:
| | Percentage of Average Daily
Net Assets of Class |
| Class A Shares | 0.05% |
| Class C Shares | 0.75% |
Subject to the terms described in the Expense Limitation note, FSC may voluntarily choose to waive any portion of its fee. For the year ended July 31, 2020, distribution services fees for the Fund were as follows:
| | Distribution Services
Fees Incurred |
| Class C Shares | $111,375 |
When FSC receives fees, it may pay some or all of them to financial intermediaries whose customers purchase shares. For the year ended July 31, 2020, FSC retained $15,552 of fees paid by the Fund. For the year ended July 31, 2020, the Fund’s Class A Shares did not incur a distribution services fee; however, it may begin to incur this fee upon approval of the Trustees.
Sales Charges
Front-end sales charges and contingent deferred sales charges (CDSC) do not represent expenses of the Fund. They are deducted from the proceeds of sales of Fund shares prior to investment or from redemption proceeds prior to remittance, as applicable. For the year ended July 31, 2020, FSC retained $14,037 in sales charges from the sale of Class A Shares. FSC also retained $1,358 of CDSC relating to redemptions of Class C Shares.
Annual Shareholder Report
Other Service Fees
For the year ended July 31, 2020, FSSC received $13,415 of the other service fees disclosed in Note 2.
Expense Limitation
The Adviser and certain of its affiliates (which may include FSC, FAS and FSSC) on their own initiative have agreed to waive certain amounts of their respective fees and/or reimburse expenses. Total annual fund operating expenses (as shown in the financial highlights, excluding interest expense, extraordinary expenses and proxy-related expenses paid by the Fund, if any) paid by the Fund’s Class A Shares, Class C Shares, Institutional Shares and Class R6 Shares (after the voluntary waivers and/or reimbursements) will not exceed 1.31%, 2.06%, 1.06% and 1.05% (the “Fee Limit”), respectively, up to but not including the later of (the “Termination Date”): (a) October 1, 2021; or (b) the date of the Fund’s next effective Prospectus. While the Adviser and its applicable affiliates currently do not anticipate terminating or increasing these arrangements prior to the Termination Date, these arrangements may only be terminated or the Fee Limit increased prior to the Termination Date with the agreement of the Trustees.
Directors’/Trustees’ and Miscellaneous Fees
Certain Officers and Trustees of the Fund are Officers and Directors or Trustees of certain of the above companies. To efficiently facilitate payment, Independent Directors’/Trustees’ fees and certain expenses related to conducting meetings of the Directors/Trustees and other miscellaneous expenses are paid by an affiliate of the Adviser which in due course are reimbursed by the Fund. These expenses related to conducting meetings of the Directors/Trustees and other miscellaneous expenses may be included in Accrued and Miscellaneous Expenses on the Statement of Assets and Liabilities and Statement of Operations, respectively.
6. INVESTMENT TRANSACTIONS
Purchases and sales of investments, excluding long-term U.S. government securities and short-term obligations, for the year ended July 31, 2020, were as follows:
| Purchases | $202,460,944 |
| Sales | $198,573,237 |
7. CONCENTRATION OF RISK
The Fund may invest a portion of its assets in securities of companies that are deemed by the Fund’s management to be classified in similar business sectors. Economic developments may have an effect on the liquidity and volatility of the portfolio securities.
8. LINE OF CREDIT
The Fund participates with certain other Federated Hermes Funds, on a several basis, in an up to $500,000,000 unsecured, 364-day, committed, revolving line of credit (LOC) agreement. The LOC was made available to temporarily finance the repurchase or redemption of shares of the Fund, failed trades, payment of dividends, settlement of trades and for other short-term, temporary or emergency general business purposes. The Fund cannot borrow under the LOC if an inter-fund loan is outstanding. The Fund’s ability to borrow under the LOC also is subject to the limitations of the Act and various conditions precedent that must be satisfied before the Fund can borrow. Loans under
Annual Shareholder Report
the LOC are charged interest at a fluctuating rate per annum equal to the highest, on any day, of (a) (i) the federal funds effective rate, (ii) the one month London Interbank Offered Rate (LIBOR), or a replacement rate as appropriate, and (iii) 0.0%, plus (b) a margin. Any fund eligible to borrow under the LOC pays its pro rata share of an upfront fee, and its pro rata share of a commitment fee based on the amount of the lenders’ commitment that has not been utilized, quarterly in arrears and at maturity. As of July 31, 2020, the Fund had no outstanding loans. During the year ended July 31, 2020, the Fund did not utilize the LOC.
9. INTERFUND LENDING
Pursuant to an Exemptive Order issued by the SEC, the Fund, along with other funds advised by subsidiaries of Federated Hermes, Inc., may participate in an interfund lending program. This program provides an alternative credit facility allowing the Fund to borrow from other participating affiliated funds. As of July 31, 2020, there were no outstanding loans. During the year ended July 31, 2020, the program was not utilized.
10. OTHER MATTERS
An outbreak of respiratory disease caused by a novel coronavirus was first detected in China in December 2019 and subsequently spread globally. As of the date of the issuance of these financial statements, this coronavirus has resulted in closing borders, enhanced health screenings, healthcare service preparation and delivery, quarantines, cancellations, and disruptions to supply chains, workflow operations and consumer activity, as well as general concern and uncertainty. The impact of this coronavirus may be short-term or may last for an extended period of time and has resulted in a substantial economic downturn. Health crises caused by outbreaks, such as the coronavirus outbreak, may exacerbate other pre-existing political, social and economic risks. The impact of this outbreak, and other epidemics and pandemics that may arise in the future, could continue to negatively affect the worldwide economy, as well as the economies of individual countries, individual companies (including certain Fund service providers and issuers of the Fund’s investments) and the markets in general in significant and unforeseen ways. Any such impact could adversely affect the Fund’s performance.
11. FEDERAL TAX INFORMATION (UNAUDITED)
For the fiscal year ended July 31, 2020, the amount of long-term capital gains designated by the Fund was $2,759,933.
For the fiscal year ended July 31, 2020, 38.67% of total ordinary income (including short-term capital gain) distributions made by the Fund are qualifying dividends which may be subject to a maximum tax rate of 15%, as provided for by the Jobs and Growth Tax Relief Act of 2003. Complete information is reported in conjunction with the reporting of your distributions on Form 1099-DIV.
Of the ordinary income (including short-term capital gain) distributions made by the Fund during the year ended July 31, 2020, 32.51% qualify for the dividend received deduction available to corporate shareholders.
Annual Shareholder Report
Report of Independent Registered Public Accounting Firm
TO THE board of trustees OF federated Hermes MDT Series and shareholders of Federated Hermes MDT Balanced Fund:
Opinion on the Financial Statements
We have audited the accompanying statement of assets and liabilities of Federated Hermes MDT Balanced Fund (formerly, Federated MDT Balanced Fund) (the “Fund”) (one of the portfolios constituting Federated Hermes MDT Series (formerly, Federated MDT Series) (the “Trust”)), including the portfolio of investments, as of July 31, 2020, and the related statement of operations for the year then ended, the statement of changes in net assets for each of the two years in the period then ended, the financial highlights for each of the five years in the period then ended and the related notes (collectively referred to as the “financial statements”). In our opinion, the financial statements present fairly, in all material respects, the financial position of the Fund (one of the funds constituting Federated Hermes MDT Series) at July 31, 2020, the results of its operations for the year then ended, the changes in its net assets for each of the two years in the period then ended and its financial highlights for each of the five years in the period then ended, in conformity with U.S. generally accepted accounting principles.
Basis for Opinion
These financial statements are the responsibility of the Trust’s management. Our responsibility is to express an opinion on the Fund’s financial statements based on our audits. We are a public accounting firm registered with the Public Company Accounting Oversight Board (United States) (“PCAOB”) and are required to be independent with respect to the Trust in accordance with the U.S. federal securities laws and the applicable rules and regulations of the Securities and Exchange Commission and the PCAOB.
We conducted our audits in accordance with standards of the PCAOB. Those standards require that we plan and perform the audit to obtain reasonable assurance about whether the financial statements and financial highlights are free of material misstatement, whether due to error or fraud. The Trust is not required to have, nor were we engaged to perform, an audit of the Trust’s internal control over financial reporting. As part of our audits, we are required to obtain an understanding of internal control over financial reporting, but not for the purpose of expressing an opinion on the effectiveness of the Trust’s internal control over financial reporting. Accordingly, we express no such opinion.
Annual Shareholder Report
Our audits included performing procedures to assess the risks of material misstatement of the financial statements, whether due to error or fraud, and performing procedures that respond to those risks. Such procedures included examining, on a test basis, evidence regarding the amounts and disclosures in the financial statements. Our procedures included confirmation of securities owned as of July 31, 2020, by correspondence with the custodian and others or by other appropriate auditing procedures where replies from others were not received. Our audits also included evaluating the accounting principles used and significant estimates made by management, as well as evaluating the overall presentation of the financial statements. We believe that our audits provide a reasonable basis for our opinion.
We have served as the auditor of one or more Federated Hermes investment companies since 1979.
Boston, Massachusetts
September 22, 2020
Annual Shareholder Report
Shareholder Expense Example (unaudited)
As a shareholder of the Fund, you incur two types of costs: (1) transaction costs, including sales charges (loads) on purchase or redemption payments; and (2) ongoing costs, including management fees and to the extent applicable, distribution (12b-1) fees and/or other service fees and other Fund expenses. This Example is intended to help you to understand your ongoing costs (in dollars) of investing in the Fund and to compare these costs with the ongoing costs of investing in other mutual funds. It is based on an investment of $1,000 invested at the beginning of the period and held for the entire period from February 1, 2020 to July 31, 2020.
ACTUAL EXPENSES
The first section of the table below provides information about actual account values and actual expenses. You may use the information in this section, together with the amount you invested, to estimate the expenses that you incurred over the period. Simply divide your account value by $1,000 (for example, an $8,600 account value divided by $1,000 = 8.6), then multiply the result by the number in the first section under the heading entitled “Expenses Paid During Period” to estimate the expenses attributable to your investment during this period.
HYPOTHETICAL EXAMPLE FOR COMPARISON PURPOSES
The second section of the table below provides information about hypothetical account values and hypothetical expenses based on the Fund’s actual expense ratio and an assumed rate of return of 5% per year before expenses, which is not the Fund’s actual return. Thus, you should not use the hypothetical account values and expenses to estimate the actual ending account balance or your expenses for the period. Rather, these figures are required to be provided to enable you to compare the ongoing costs of investing in the Fund with other funds. To do so, compare this 5% hypothetical example with the 5% hypothetical examples that appear in the shareholder reports of the other funds.
Annual Shareholder Report
Please note that the expenses shown in the table are meant to highlight your ongoing costs only and do not reflect any transaction costs, such as sales charges (loads) on purchase or redemption payments. Therefore, the second section of the table is useful in comparing ongoing costs only, and will not help you determine the relative total costs of owning different funds. In addition, if these transaction costs were included, your costs would have been higher.
| | Beginning
Account Value
2/1/2020 | Ending
Account Value
7/31/2020 | Expenses Paid
During Period1 |
| Actual: | | | |
| Class A Shares | $1,000 | $1,048.20 | $6.67 |
| Class C Shares | $1,000 | $1,044.30 | $10.47 |
| Institutional Shares | $1,000 | $1,049.60 | $5.40 |
| Class R6 Shares | $1,000 | $1,049.20 | $5.40 |
Hypothetical (assuming a 5% return
before expenses): | | | |
| Class A Shares | $1,000 | $1,018.40 | $6.57 |
| Class C Shares | $1,000 | $1,014.60 | $10.32 |
| Institutional Shares | $1,000 | $1,019.60 | $5.32 |
| Class R6 Shares | $1,000 | $1,019.60 | $5.32 |
| 1 | Expenses are equal to the Fund’s annualized net expense ratios, multiplied by the average account value over the period, multiplied by 182/366 (to reflect the one-half-year period). The annualized net expense ratios are as follows: |
| | |
| Class A Shares | 1.31% |
| Class C Shares | 2.06% |
| Institutional Shares | 1.06% |
| Class R6 Shares | 1.06% |
Annual Shareholder Report
Board of Trustees and Trust Officers
The Board of Trustees is responsible for managing the Trust’s business affairs and for exercising all the Trust’s powers except those reserved for the shareholders. The following tables give information about each Trustee and the senior officers of the Fund. Where required, the tables separately list Trustees who are “interested persons” of the Fund (i.e., “Interested” Trustees) and those who are not (i.e., “Independent” Trustees). Unless otherwise noted, the address of each person listed is 1001 Liberty Avenue, Pittsburgh, PA 15222. The address of all Independent Trustees listed is 4000 Ericsson Drive, Warrendale, PA 15086-7561; Attention: Mutual Fund Board. As of December 31, 2019, the Trust comprised five portfolio(s), and the Federated Hermes Fund Family consisted of 41 investment companies (comprising 135 portfolios). Unless otherwise noted, each Officer is elected annually. Unless otherwise noted, each Trustee oversees all portfolios in the Federated Hermes Fund Family and serves for an indefinite term. The Fund’s Statement of Additional Information includes additional information about Trust Trustees and is available, without charge and upon request, by calling 1-800-341-7400.
Interested TRUSTEES Background
Name
Birth Date
Positions Held with Trust
Date Service Began | Principal Occupation(s) for Past Five Years,
Other Directorships Held and Previous Position(s) |
J. Christopher Donahue*
Birth Date: April 11, 1949
President and Trustee
Indefinite Term
Began serving: May 2006 | Principal Occupations: Principal Executive Officer and President of certain of the Funds in the Federated Hermes Fund Family; Director or Trustee of the Funds in the Federated Hermes Fund Family; President, Chief Executive Officer and Director, Federated Hermes, Inc.; Chairman and Trustee, Federated Investment Management Company; Trustee, Federated Investment Counseling; Chairman and Director, Federated Global Investment Management Corp.; Chairman and Trustee, Federated Equity Management Company of Pennsylvania; Trustee, Federated Shareholder Services Company; Director, Federated Services Company.
Previous Positions: President, Federated Investment Counseling; President and Chief Executive Officer, Federated Investment Management Company, Federated Global Investment Management Corp. and Passport Research, Ltd; Chairman, Passport Research, Ltd. |
Annual Shareholder Report
Name
Birth Date
Positions Held with Trust
Date Service Began | Principal Occupation(s) for Past Five Years,
Other Directorships Held and Previous Position(s) |
John B. Fisher*
Birth Date: May 16, 1956
Trustee
Indefinite Term
Began serving: May 2016 | Principal Occupations: Principal Executive Officer and President of certain of the Funds in the Federated Hermes Fund Family; Director or Trustee of certain of the Funds in the Federated Hermes Fund Family; Vice President, Federated Hermes, Inc.; President, Director/Trustee and CEO, Federated Advisory Services Company, Federated Equity Management Company of Pennsylvania, Federated Global Investment Management Corp., Federated Investment Counseling, Federated Investment Management Company; President of some of the Funds in the Federated Hermes Fund Family and Director, Federated Investors Trust Company.
Previous Positions: President and Director of the Institutional Sales Division of Federated Securities Corp.; President and Director of Federated Investment Counseling; President and CEO of Passport Research, Ltd.; Director, Edgewood Securities Corp.; Director, Federated Services Company; Director, Federated Hermes, Inc.; Chairman and Director, Southpointe Distribution Services, Inc. and President, Technology, Federated Services Company. |
| * | Reasons for “interested” status: J. Christopher Donahue and John B. Fisher are interested due to their beneficial ownership of shares of Federated Hermes, Inc. and due to positions they hold with Federated Hermes, Inc. and its subsidiaries. |
INDEPENDENT TRUSTEES Background
Name
Birth Date
Positions Held with Trust
Date Service Began | Principal Occupation(s) for Past Five Years,
Other Directorships Held, Previous Position(s) and Qualifications |
John T. Collins
Birth Date: January 24, 1947
Trustee
Indefinite Term
Began serving:
October 2013 | Principal Occupations: Director or Trustee of the Federated Hermes Fund Family; formerly, Chairman and CEO, The Collins Group, Inc. (a private equity firm) (Retired).
Other Directorships Held: Chairman of the Board of Directors, Director, and Chairman of the Compensation Committee, KLX Energy Services Holdings, Inc. (oilfield services); former Director of KLX Corp. (aerospace).
Qualifications: Mr. Collins has served in several business and financial management roles and directorship positions throughout his career. Mr. Collins previously served as Chairman and CEO of The Collins Group, Inc. (a private equity firm) and as a Director of KLX Corp. Mr. Collins serves as Chairman Emeriti, Bentley University. Mr. Collins previously served as Director and Audit Committee Member, Bank of America Corp.; Director, FleetBoston Financial Corp.; and Director, Beth Israel Deaconess Medical Center (Harvard University Affiliate Hospital). |
Annual Shareholder Report
Name
Birth Date
Positions Held with Trust
Date Service Began | Principal Occupation(s) for Past Five Years,
Other Directorships Held, Previous Position(s) and Qualifications |
G. Thomas Hough
Birth Date: February 28, 1955
Trustee
Indefinite Term
Began serving: August 2015 | Principal Occupations: Director or Trustee, Chair of the Audit Committee of the Federated Hermes Fund Family; formerly, Vice Chair, Ernst & Young LLP (public accounting firm) (Retired).
Other Directorships Held: Director, Chair of the Audit Committee, Equifax, Inc.; Director, Member of the Audit Committee, Haverty Furniture Companies, Inc.; formerly, Director, Member of Governance and Compensation Committees, Publix Super Markets, Inc.
Qualifications: Mr. Hough has served in accounting, business management and directorship positions throughout his career. Mr. Hough most recently held the position of Americas Vice Chair of Assurance with Ernst & Young LLP (public accounting firm). Mr. Hough serves on the President’s Cabinet and Business School Board of Visitors for the University of Alabama. Mr. Hough previously served on the Business School Board of Visitors for Wake Forest University, and he previously served as an Executive Committee member of the United States Golf Association. |
Maureen Lally-Green
Birth Date: July 5, 1949
Trustee
Indefinite Term
Began serving: August 2009 | Principal Occupations: Director or Trustee of the Federated Hermes Fund Family; Adjunct Professor of Law, Duquesne University School of Law; formerly, Dean of the Duquesne University School of Law and Professor of Law and Interim Dean of the Duquesne University School of Law; formerly, Associate General Secretary and Director, Office of Church Relations, Diocese of Pittsburgh.
Other Directorships Held: Director, CNX Resources Corporation (formerly known as CONSOL Energy Inc.).
Qualifications: Judge Lally-Green has served in various legal and business roles and directorship positions throughout her career. Judge Lally-Green previously held the position of Dean of the School of Law of Duquesne University (as well as Interim Dean). Judge Lally-Green previously served as a member of the Superior Court of Pennsylvania and as a Professor of Law, Duquesne University School of Law. Judge Lally-Green was appointed by the Supreme Court of Pennsylvania to serve on the Supreme Court’s Board of Continuing Judicial Education and the Supreme Court’s Appellate Court Procedural Rules Committee. Judge Lally-Green also currently holds the positions on not for profit or for profit boards of directors as follows: Director and Chair, UPMC Mercy Hospital; Director and Vice Chair, Our Campaign for the Church Alive!, Inc.; Regent, Saint Vincent Seminary; Member, Pennsylvania State Board of Education (public); Director, Catholic Charities, Pittsburgh; and Director CNX Resources Corporation (formerly known as CONSOL Energy Inc.). Judge Lally-Green has held the positions of: Director, Auberle; Director, Epilepsy Foundation of Western and Central Pennsylvania; Director, Ireland Institute of Pittsburgh; Director, Saint Thomas More Society; Director and Chair, Catholic High Schools of the Diocese of Pittsburgh, Inc.; Director, Pennsylvania Bar Institute; Director, St. Vincent College; and Director and Chair, North Catholic High School, Inc. |
Annual Shareholder Report
Name
Birth Date
Positions Held with Trust
Date Service Began | Principal Occupation(s) for Past Five Years,
Other Directorships Held, Previous Position(s) and Qualifications |
Charles F. Mansfield, Jr.
Birth Date: April 10, 1945
Trustee
Indefinite Term
Began serving: June 2006 | Principal Occupations: Director or Trustee of the Federated Hermes Fund Family; Management Consultant and Author.
Other Directorships Held: None.
Qualifications: Mr. Mansfield has served as a Marine Corps officer and in several banking, business management, educational roles and directorship positions throughout his long career. He remains active as a Management Consultant and Author. |
Thomas M. O’Neill
Birth Date: June 14, 1951
Trustee
Indefinite Term
Began serving: August 2006 | Principal Occupations: Director or Trustee of the Federated Hermes Fund Family; Sole Proprietor, Navigator Management Company (investment and strategic consulting).
Other Directorships Held: None.
Qualifications: Mr. O’Neill has served in several business, mutual fund and financial management roles and directorship positions throughout his career. Mr. O’Neill serves as Director, Medicines for Humanity and Director, The Golisano Children’s Museum of Naples, Florida. Mr. O’Neill previously served as Chief Executive Officer and President, Managing Director and Chief Investment Officer, Fleet Investment Advisors; President and Chief Executive Officer, Aeltus Investment Management, Inc.; General Partner, Hellman, Jordan Management Co., Boston, MA; Chief Investment Officer, The Putnam Companies, Boston, MA; Credit Analyst and Lending Officer, Fleet Bank; Director and Consultant, EZE Castle Software (investment order management software); and Director, Midway Pacific (lumber). |
P. Jerome Richey
Birth Date: February 23, 1949
Trustee
Indefinite Term
Began serving:
October 2013 | Principal Occupations: Director or Trustee of the Federated Hermes Fund Family; Management Consultant; Retired; formerly, Senior Vice Chancellor and Chief Legal Officer, University of Pittsburgh and Executive Vice President and Chief Legal Officer, CNX Resources Corporation (formerly known as CONSOL Energy Inc.).
Other Directorships Held: None.
Qualifications: Mr. Richey has served in several business and legal management roles and directorship positions throughout his career. Mr. Richey most recently held the positions of Senior Vice Chancellor and Chief Legal Officer, University of Pittsburgh. Mr. Richey previously served as Chairman of the Board, Epilepsy Foundation of Western Pennsylvania and Chairman of the Board, World Affairs Council of Pittsburgh. Mr. Richey previously served as Chief Legal Officer and Executive Vice President, CNX Resources Corporation (formerly known as CONSOL Energy Inc.); and Board Member, Ethics Counsel and Shareholder, Buchanan Ingersoll & Rooney PC (a law firm). |
Annual Shareholder Report
Name
Birth Date
Positions Held with Trust
Date Service Began | Principal Occupation(s) for Past Five Years,
Other Directorships Held, Previous Position(s) and Qualifications |
John S. Walsh
Birth Date:
November 28, 1957
Trustee
Indefinite Term
Began serving: June 2006 | Principal Occupations: Director or Trustee, and Chair of the Board of Directors or Trustees, of the Federated Hermes Fund Family; President and Director, Heat Wagon, Inc. (manufacturer of construction temporary heaters); President and Director, Manufacturers Products, Inc. (distributor of portable construction heaters); President, Portable Heater Parts, a division of Manufacturers Products, Inc.
Other Directorships Held: None.
Qualifications: Mr. Walsh has served in several business management roles and directorship positions throughout his career. Mr. Walsh previously served as Vice President, Walsh & Kelly, Inc. (paving contractors). |
OFFICERS
Name
Birth Date
Address
Positions Held with Trust
Date Service Began | Principal Occupation(s) for Past Five Years
and Previous Position(s) |
Lori A. Hensler
Birth Date: January 6, 1967
TREASURER
Officer since: April 2013 | Principal Occupations: Principal Financial Officer and Treasurer of the Federated Hermes Fund Family; Senior Vice President, Federated Administrative Services; Financial and Operations Principal for Federated Securities Corp. and Edgewood Services, Inc.; and Assistant Treasurer, Federated Investors Trust Company. Ms. Hensler has received the Certified Public Accountant designation.
Previous Positions: Controller of Federated Hermes, Inc.; Senior Vice President and Assistant Treasurer, Federated Investors Management Company; Treasurer, Federated Investors Trust Company; Assistant Treasurer, Federated Administrative Services, Federated Administrative Services, Inc., Federated Securities Corp., Edgewood Services, Inc., Federated Advisory Services Company, Federated Equity Management Company of Pennsylvania, Federated Global Investment Management Corp., Federated Investment Counseling, Federated Investment Management Company, Passport Research, Ltd., and Federated MDTA, LLC; Financial and Operations Principal for Federated Securities Corp., Edgewood Services, Inc. and Southpointe Distribution Services, Inc. |
Annual Shareholder Report
Name
Birth Date
Address
Positions Held with Trust
Date Service Began | Principal Occupation(s) for Past Five Years
and Previous Position(s) |
Peter J. Germain
Birth Date:
September 3, 1959
CHIEF LEGAL OFFICER, SECRETARY and EXECUTIVE VICE PRESIDENT
Officer since: June 2006 | Principal Occupations: Mr. Germain is Chief Legal Officer, Secretary and Executive Vice President of the Federated Hermes Fund Family. He is General Counsel, Chief Legal Officer, Secretary and Executive Vice President, Federated Hermes, Inc.; Trustee and Senior Vice President, Federated Investors Management Company; Trustee and President, Federated Administrative Services; Director and President, Federated Administrative Services, Inc.; Director and Vice President, Federated Securities Corp.; Director and Secretary, Federated Private Asset Management, Inc.; Secretary, Federated Shareholder Services Company; and Secretary, Retirement Plan Service Company of America. Mr. Germain joined Federated Hermes in 1984 and is a member of the Pennsylvania Bar Association.
Previous Positions: Deputy General Counsel, Special Counsel, Managing Director of Mutual Fund Services, Federated Hermes, Inc.; Senior Vice President, Federated Services Company; and Senior Corporate Counsel, Federated Hermes, Inc. |
Stephen Van Meter
Birth Date: June 5, 1975
CHIEF COMPLIANCE OFFICER AND SENIOR VICE PRESIDENT
Officer since: July 2015 | Principal Occupations: Senior Vice President and Chief Compliance Officer of the Federated Hermes Fund Family; Vice President and Chief Compliance Officer of Federated Hermes, Inc. and Chief Compliance Officer of certain of its subsidiaries. Mr. Van Meter joined Federated Hermes, Inc. in October 2011. He holds FINRA licenses under Series 3, 7, 24 and 66.
Previous Positions: Mr. Van Meter previously held the position of Compliance Operating Officer, Federated Hermes, Inc. Prior to joining Federated Hermes, Inc., Mr. Van Meter served at the United States Securities and Exchange Commission in the positions of Senior Counsel, Office of Chief Counsel, Division of Investment Management and Senior Counsel, Division of Enforcement. |
Stephen F. Auth
Birth Date: September 13, 1956
101 Park Avenue
41st Floor
New York, NY 10178
CHIEF INVESTMENT OFFICER
Officer since: June 2012 | Principal Occupations: Stephen F. Auth is Chief Investment Officer of various Funds in the Federated Hermes Fund Family; Executive Vice President, Federated Investment Counseling, Federated Global Investment Management Corp. and Federated Equity Management Company of Pennsylvania.
Previous Positions: Executive Vice President, Federated Investment Management Company and Passport Research, Ltd. (investment advisory subsidiary of Federated); Senior Vice President, Global Portfolio Management Services Division; Senior Vice President, Federated Investment Management Company and Passport Research, Ltd.; Senior Managing Director and Portfolio Manager, Prudential Investments. |
Annual Shareholder Report
Evaluation and Approval of Advisory Contract–May 2020
Federated MDT Balanced Fund (the “Fund”)
(EFFECTIVE CLOSE OF BUSINESS ON JUNE 26, 2020, THE FUND’S NAME CHANGED TO FEDERATED HERMES MDT BALANCED FUND)
At its meetings in May 2020 (the “May Meetings”), the Fund’s Board of Trustees (the “Board”), including a majority of those Trustees who are not “interested persons” of the Fund, as defined in the Investment Company Act of 1940 (the “Independent Trustees”), reviewed and unanimously approved the continuation of the investment advisory contract between the Fund and Federated MDTA LLC (the “Adviser”) and the investment subadvisory between the Adviser and Federated Investment Management Company with respect to the Fund (together, the “Contracts”) for an additional one-year term. The Board’s determination to approve the continuation of the Contracts reflects the exercise of its business judgment after considering all of the information and factors believed to be relevant and appropriate on whether to continue the existing arrangements. The information, factors and conclusions that formed the basis for the Board’s approval are summarized below.
Information Received and Review Process
At the request of the Independent Trustees, the Fund’s Chief Compliance Officer (the “CCO”) furnished to the Board in advance of its May Meetings an independent written evaluation presenting on the topics discussed below. The Board considered the CCO’s independent written evaluation (the “CCO Fee Evaluation Report”), along with other information, in evaluating the reasonableness of the Fund’s management fee and in determining to approve the continuation of the Contracts. The CCO, in preparing the CCO Fee Evaluation Report, has the authority to retain consultants, experts or staff as reasonably necessary to assist in the performance of his duties, reports directly to the Board, and can be terminated only with the approval of a majority of the Independent Trustees. At the request of the Independent Trustees, the CCO Fee Evaluation Report followed the same general approach and covered the same topics as that of the report that had previously been delivered by the CCO in his capacity as “Senior Officer,” prior to the elimination of the Senior Officer position in December 2017.
In addition to the extensive materials that comprise and accompany the CCO Fee Evaluation Report, in the months preceding the May Meetings, the Board requested and reviewed written responses and supporting materials prepared by the Adviser and its affiliates (collectively, “Federated Hermes”) in response to requests posed to Federated Hermes on behalf of the Independent Trustees encompassing a wide variety of topics. The Board also considered such additional matters as the Independent Trustees deemed reasonably necessary to evaluate the Contracts, which included detailed information about the Fund and Federated Hermes furnished to the Board at its meetings throughout the
Annual Shareholder Report
year and in between regularly scheduled meetings on particular matters as the need arose, as well as information specifically prepared in connection with the approval of the continuation of the Contracts that was presented at the May Meetings.
The Board’s consideration of the Contracts included review of materials and information covering the following matters, among others: the Adviser’s and sub-adviser’s investment philosophy, revenue, profitability, personnel and processes; investment and operating strategies; the Fund’s short-term and long-term performance (in absolute terms, both on a gross basis and net of expenses, and relative to the Fund’s particular investment program and a group of its peer funds and/or its benchmark, as appropriate) and comments on the reasons for the Fund’s performance; the Fund’s investment objectives; the Fund’s expenses, including the advisory fee and the overall expense structure of the Fund (both in absolute terms and relative to a group of its peer funds), with due regard for contractual or voluntary expense limitations (if any); the use and allocation of brokerage commissions derived from trading the Fund’s portfolio securities (if any); and the nature, quality and extent of the advisory and other services provided to the Fund by the Adviser and its affiliates. The Board also considered the preferences and expectations of Fund shareholders; the entrepreneurial and other risks assumed by the Adviser in sponsoring and managing the Fund; the continuing state of competition in the mutual fund industry and market practices; the range of comparable fees for similar funds in the mutual fund industry; the Fund’s relationship to the other funds advised by Federated Hermes (each, a “Federated Hermes Fund”), which include a comprehensive array of funds with different investment objectives, policies and strategies which are generally available for exchange without the incurrence of additional sales charges; compliance and audit reports concerning the Federated Hermes Funds and the Federated Hermes’ affiliates that service them (including communications from regulatory agencies), as well as Federated Hermes’ responses to any issues raised therein; and relevant developments in the mutual fund industry and how the Federated Hermes Funds and/or Federated Hermes may be responding to them. In addition, the Board received and considered information furnished by Federated Hermes on the impacts of the coronavirus (COVID-19) outbreak on Federated Hermes generally and the Fund in particular, including, among other information, the current and anticipated impacts on the management, operations and performance of the Fund. The Board noted that its evaluation process is evolutionary and that the criteria considered and the emphasis placed on relevant criteria may change in recognition of changing circumstances in the mutual fund marketplace.
The Board also considered judicial decisions concerning allegedly excessive investment advisory fees in determining to approve the Contracts. Using these judicial decisions as a guide, the Board observed that the following factors may be relevant to an adviser’s fiduciary duty with respect to its receipt of
Annual Shareholder Report
compensation from a fund: (1) the nature and quality of the services provided by an adviser to a fund and its shareholders (including the performance of the fund, its benchmark, and comparable funds); (2) an adviser’s cost of providing the services (including the profitability to an adviser of providing advisory services to a fund); (3) the extent to which an adviser may realize “economies of scale” as a fund grows larger and, if such economies of scale exist, whether they have been shared with a fund and its shareholders or the family of funds; (4) any “fall-out” financial benefits that accrue to an adviser because of its relationship with a fund (including research services received from brokers that execute fund trades and any fees paid to affiliates of an adviser for services rendered to a fund); (5) comparative fee and expense structures (including a comparison of fees paid to an adviser with those paid by similar funds both internally and externally as well as management fees charged to institutional and other advisory clients of the adviser for what might be viewed as like services); and (6) the extent of care, conscientiousness and independence with which the fund’s board members perform their duties and their expertise (including whether they are fully informed about all facts the board deems relevant to its consideration of an adviser’s services and fees). The Board noted that the Securities and Exchange Commission (“SEC”) disclosure requirements regarding the basis for a fund board’s approval of the fund’s investment advisory contracts generally align with the factors listed above. The Board was aware of these factors and was guided by them in its review of the Contracts to the extent it considered them to be appropriate and relevant, as discussed further below.
The Board considered and weighed these factors in light of its substantial accumulated experience in governing the Fund and working with Federated Hermes on matters relating to the Federated Hermes Funds. While individual members of the Board may have weighed certain factors differently, the Board’s determination to continue the Contracts was based on a comprehensive consideration of all information provided to the Board throughout the year and specifically with respect to the continuation of the Contracts. The Independent Trustees were assisted throughout the evaluation process by independent legal counsel. In connection with their deliberations at the May Meetings, the Independent Trustees met separately in executive session with their independent legal counsel and without management present to review the relevant materials and consider their responsibilities under applicable laws. In addition, senior management representatives of Federated Hermes also met with the Independent Trustees and their independent legal counsel to discuss the materials and presentations furnished to the Board at the May Meetings. The Board considered the approval of the Contracts for the Fund as part of its consideration of agreements for funds across the Federated Hermes Funds family, but its approvals were made on a fund-by-fund basis.
Annual Shareholder Report
Nature, Extent and Quality of Services
The Board considered the nature, extent and quality of the services provided to the Fund by the Adviser and the resources of the Adviser and its affiliates dedicated to the Fund. In this regard, the Board evaluated, among other things, the Adviser’s personnel, experience and track record, as well as the financial resources and overall reputation of Federated Hermes and its willingness to invest in personnel and infrastructure that benefit the Federated Hermes Funds. The Board noted the significant acquisition of Hermes Fund Managers Limited by Federated Hermes in 2018, which has deepened the organization’s investment management expertise and capabilities and expanded the investment process for all of the Federated Hermes Funds to incorporate environmental, social and governance (“ESG”) factors and issuer engagement on ESG matters.
In addition, the Board reviewed the qualifications, backgrounds and responsibilities of the portfolio management team primarily responsible for the day-to-day management of the Fund and the Adviser’s ability and experience in attracting and retaining qualified personnel to service the Fund. The Board noted the compliance program of the Adviser and the compliance-related resources devoted by the Adviser and its affiliates in support of the Fund’s obligations pursuant to Rule 38a-1 under the Investment Company Act of 1940, including the Adviser’s commitment to respond to rulemaking and other regulatory initiatives of the SEC. such as the liquidity risk management program rules. In addition, the Board considered the response by the Adviser to recent market conditions and considered the overall performance of the Adviser in this context. The Fund’s ability to deliver competitive performance when compared to its Performance Peer Group (as defined below) was also deemed to be relevant by the Board as a useful indicator of how the Adviser is executing the Fund’s investment program. The Adviser’s ability to execute this program was one of the Board’s considerations in reaching a conclusion that the nature, extent and quality of the Adviser’s investment management and related services warrant the continuation of the Contracts.
Fund Investment Performance
In evaluating the Fund’s investment performance, the Board considered performance results in light of the Fund’s investment objective, strategies and risks, as disclosed in the Fund’s prospectus. The Board also considered the Fund’s performance in light of the overall recent market conditions. The Board considered detailed investment reports on the Fund’s performance over different time periods that were provided to the Board throughout the year and in connection with the May Meetings and evaluated the Adviser’s analysis of the Fund’s performance for these time periods. The Board also reviewed comparative information regarding the performance of other mutual funds in the category of peer funds selected by Morningstar, Inc. (the “Morningstar”), an independent fund ranking organization (the “Performance Peer Group”), noting the CCO’s view that comparisons to fund peer groups may be helpful,
Annual Shareholder Report
though not conclusive, in evaluating the performance of the Adviser in managing the Fund. The Board considered, in evaluating such comparisons, that in some cases there may be differences in the funds’ investment objectives or investment management techniques, or the costs to implement funds, even within the same Performance Peer Group. In this connection, the Board considered that the Fund’s quantitative focus makes fee and expense comparisons particularly difficult as the funds in the Performance Peer Group varied widely in their complexity, and the management of the Fund is among the more complex relative to its Performance Peer Group.
For the periods ended December 31, 2019, the Fund’s performance for the three-year and five-year periods was above the median of the relevant Performance Peer Group, and the Fund’s performance fell below the median of the relevant Performance Peer Group for the one-year period. The Board discussed the Fund’s performance with the Adviser and recognized the efforts being taken by the Adviser in the context of other factors considered relevant by the Board.
Following such evaluation, and full deliberations, the Board concluded that the performance of the Fund supported renewal of the Contracts.
Fund Expenses
While mindful that courts have cautioned against giving too much weight to comparative information concerning fees charged by other advisers for managing funds with comparable investment programs, the Board has found the use of such comparisons to be relevant to its deliberations. In this regard, the Board was presented with, and considered, information regarding the contractual advisory fee rates, net advisory fee rates, total expense ratios and each element of the Fund’s total expense ratio (i.e., gross and net advisory fees, administrative fees, custody fees, portfolio accounting fees and transfer agency fees) relative to an appropriate group of peer funds compiled by Federated Hermes from the category of peer funds selected by Morningstar (the “Expense Peer Group”). The Board received a description of the methodology used to select the Expense Peer Group from the overall Morningstar category. The Board also reviewed comparative information regarding the fees and expenses of the broader group of funds in the overall Morningstar category. The Board focused on comparisons with other similar mutual funds more heavily than non-mutual fund products or services because such comparisons are believed to be more relevant. The Board considered that other mutual funds are the products most like the Fund, in that they are readily available to Fund shareholders as alternative investment vehicles, and they are the type of investment vehicle, in fact, chosen and maintained by the Fund’s investors. The Board noted that the range of their fees and expenses, therefore, appears to be a relevant indicator of what consumers have found to be reasonable in the marketplace in which the Fund competes.
Annual Shareholder Report
The Board reviewed the contractual advisory fee rate, net advisory fee rate and other expenses of the Fund and noted the position of the Fund’s fee rates relative to its Expense Peer Group. In this regard, the Board noted that the contractual advisory fee rate was above the median of the relevant Expense Peer Group, but the Board noted the applicable waivers and reimbursements, and that the overall expense structure of the Fund remained competitive in the context of other factors considered by the Board. In this regard, the Board had been previously advised that, while comparisons to its Expense Peer Group are relevant in judging the reasonableness of advisory fees, the Fund’s quantitative focus makes fee and expense comparisons particularly difficult. Although the Fund’s advisory fee was above the median of its Expense Peer Group range, the funds in the Expense Peer Group varied widely in their complexity, and the Board has been informed that the management of the Fund is among the more complex relative to its Expense Peer Group.
For comparison, the Board received and considered information about the fees charged by Federated Hermes for providing advisory services to other types of clients with investment strategies similar to those of the Federated Hermes Funds, including non-mutual fund clients such as institutional separate accounts and third-party unaffiliated mutual funds for which the Adviser or its affiliates serve as sub-adviser. The Board noted the CCO’s conclusion that mon-mutual fund clients are inherently different products due to the following differences, among others: (i) different types of targeted investors; (ii) different applicable laws and regulations; (iii) different legal structures; (iv) different average account sizes and portfolio management techniques made necessary by different cash flows and different associated costs; (v) the time spent by portfolio managers and their teams (among other personnel across various departments, including legal, compliance and risk management) in reviewing securities pricing, addressing different administrative responsibilities, and addressing different degrees of risk associated with management; and (vi) a variety of different costs. The Board also considered information regarding the differences in the nature of the services required for Federated Hermes to manage its proprietary mutual fund business versus managing a discrete pool of assets as a sub-adviser to another institution’s mutual fund, noting that Federated Hermes generally performs significant additional services and assumes substantially greater risks in managing the Fund and other Federated Hermes Funds than in its role as sub-adviser to an unaffiliated third-party mutual fund. The Board noted that the CCO did not consider the fees for providing advisory services to other types of clients to be determinative in judging the appropriateness of the Federated Hermes Funds’ advisory fees
Following such evaluation, and full deliberations, the Board concluded that the fees and expenses of the Fund are reasonable and supported renewal of the Contracts.
Annual Shareholder Report
Profitability and Other Benefits
The Board also received financial information about Federated Hermes, including information regarding the compensation and ancillary (or “fall-out”) benefits Federated Hermes derived from its relationships with the Federated Hermes Funds. This information covered not only the fees under the Federated Hermes Funds’ investment advisory contracts, but also fees received by Federated Hermes’ affiliates for providing other services to the Federated Hermes Funds under separate contracts (e.g., for serving as the Federated Hermes Funds’ administrator and distributor). In this regard, the Board considered that certain of Federated Hermes’ affiliates provide distribution and shareholder services to the Federated Hermes Funds, for which they may be compensated through distribution and servicing fees paid pursuant to Rule 12b-1 plans or otherwise. The Board also received and considered information detailing any indirect benefit Federated Hermes may derive from its receipt of research services from brokers who execute portfolio trades for the Federated Hermes Funds. In addition, the Board considered the fact that, in order for the Federated Hermes Fund to be competitive in the marketplace, the Adviser and its affiliates frequently waived fees and/or reimbursed expenses and have disclosed to Federated Hermes Fund shareholders and/or reported to the Board their intention to do so in the future. Moreover, the Board received and considered regular reports from Federated Hermes throughout the year as to the institution, adjustment or elimination of these voluntary waivers and/or reimbursements.
The Board received and considered information furnished by Federated Hermes, as requested by the CCO, that reported revenues on a fund-by-fund basis and made estimates of the allocation of expenses on a fund-by-fund basis, using allocation methodologies specified by the CCO and described to the Board. The Board considered the CCO’s view that, while these cost allocation reports apply consistent allocation processes, the inherent difficulties in allocating costs continues to cause the CCO to question the precision of the process and to conclude that such reports may be unreliable, because a single change in an allocation estimate may dramatically alter the resulting estimate of cost and/or profitability of a Federated Hermes Fund and may produce unintended consequences. The allocation information, including the CCO’s view that fund-by-fund estimations may be unreliable, was considered in the evaluation by the Board. In addition, the Board considered that, during the prior year, an independent consultant conducted a review of the allocation methodologies used by Federated Hermes in estimating profitability for purposes of reporting to the Board in connection with the continuation of the Contract. The Board noted the consultant’s view that, although there is no single best method to allocate expenses, the methodologies used by Federated Hermes are reasonable.
Annual Shareholder Report
The Board also reviewed information compiled by Federated Hermes comparing its profitability information to other publicly held fund management companies, including information regarding profitability trends over time. The Board considered the CCO’s conclusion that, based on such profitability information, Federated Hermes’ profit margins did not appear to be excessive. The Board also considered the CCO’s view that Federated Hermes appeared financially sound, with the resources necessary to fulfill its obligations under its contracts with the Federated Hermes Funds.
Economies of Scale
The Board received and considered information about the notion of possible realization of “economies of scale” as a fund grows larger, the difficulties of calculating economies of scale at an individual fund level, and the extent to which potential scale benefits are shared with shareholders. In this regard, the Board considered that Federated Hermes has made significant and long-term investments in areas that support all of the Federated Hermes Funds, such as personnel and processes for the portfolio management, trading operations, issuer engagement (including with respect to ESG matters), shareholder services, compliance, business continuity, internal audit and risk management functions, as well as systems technology (including technology relating to cybersecurity) and use of data. The Board noted that Federated Hermes’ investments in these areas are extensive and are designed to provide enhanced services to the Federated Hermes Funds and their shareholders. The Board considered that the benefits of these investments (as well as the benefits of any economies of scale, should they exist) are likely to be shared with the Federated Hermes Fund family as a whole. In addition, the Board considered that the Adviser and its affiliates have frequently waived fees and/or reimbursed expenses for the Federated Hermes Funds and that such waivers and reimbursements are another means for potential economies of scale to be shared with shareholders and can provide protection from an increase in expenses if a Federated Hermes Fund’s assets decline. Federated Hermes, as it does throughout the year, and specifically in connection with the Board’s review of the Contracts, furnished information relative to adviser-paid fees (commonly referred to as revenue sharing). The Board considered the beliefs of Federated Hermes and the CCO that this information should be viewed to determine if there was an incentive to either not apply breakpoints or to apply breakpoints, at higher levels and should not be viewed to determine the appropriateness of advisory fees. The Board also noted the absence of any applicable regulatory or industry guidelines on this subject, which is compounded by the lack of any common industry practice or general pattern with respect to structuring fund advisory fees with “breakpoints” that serve to reduce the fee as a fund attains a certain size.
Annual Shareholder Report
Conclusions
The Board considered the CCO’s conclusion that his observations and the information accompanying the CCO Fee Evaluation Report show that the management fee for the Fund was reasonable and the CCO’s recommendation that the Board approve the management fee. The Board noted that, under these circumstances, no changes were recommended to, and no objection was raised to the continuation of, the Contracts by the CCO. The CCO also recognized that the Board’s evaluation of the Federated Hermes Funds’ advisory and subadvisory arrangements is a continuing and on-going process that is informed by the information that the Board requests and receives from management throughout the course of the year and, in this regard, the CCO noted certain items for future reporting to the Board or further consideration by management as the Board continues its on-going oversight of the Federated Hermes Funds.
In its determination to continue an existing investment advisory contract, the Board was mindful of the potential disruptions of the Fund’s operations and various risks, uncertainties and other effects that could occur as a result of a decision to terminate or not renew an investment advisory contract. In particular, the Board recognized that many shareholders have invested in the Fund on the strength of the Adviser’s industry standing and reputation and with the expectation that the Adviser will have a continuing role in providing advisory services to the Fund. Thus, the Board’s approval of the Contracts reflected the fact that it is the shareholders who have effectively selected the Adviser by virtue of having invested in the Fund. The Board concluded that, in light of the factors summarized above, including the nature, quality and scope of the services provided to the Fund by the Adviser and its affiliates, continuation of the Contracts was appropriate.
The Board based its determination to approve the Contracts on the totality of the circumstances and relevant factors and with a view to past and future long-term considerations. Not all of the factors and considerations identified above were necessarily deemed to be relevant to the Fund, nor did the Board consider any one of them to be determinative. With respect to the factors that were deemed to be relevant, the Board’s determination to approve the continuation of the Contracts reflects its view that Federated Hermes’ performance and actions provided a satisfactory basis to support the determination to continue the existing arrangements.
Annual Shareholder Report
Liquidity Risk Management Program– Annual Evaluation of Adequacy and Effectiveness
In accordance with Rule 22e-4 under the Investment Company Act of 1940, as amended (the “Liquidity Rule”), Federated Hermes MDT Series (the “Trust”) has adopted and implemented a liquidity risk management program (the “LRMP”) for Federated Hermes MDT Balanced Fund (the “Fund” and collectively with the Federated Hermes funds, the “Funds”). The LRMP seeks to assess and manage the Fund’s liquidity risk. “Liquidity risk” is defined under the Liquidity Rule as the risk that the Fund is unable to meet redemption requests without significantly diluting remaining investors’ interests in the Fund. The Board of Trustees of the Trust (the “Board”) has approved the designation of the Funds’ investment advisers as the administrators for the LRMP (collectively, the “Administrator”). The Administrator has established a Liquidity Risk Management Committee (the “Committee”) comprised of representatives from various departments across the Administrator to assist it in the implementation and on-going administration of the LRMP. The Committee, in turn, has delegated to the Fixed Income and Equities Liquidity Committees, each a separate committee previously established by the Administrator, the responsibility to review and assess certain information related to the liquidity of the Funds that fall within their respective asset classes.
The Program is comprised of various components designed to support the assessment and/or management of liquidity risk, including: (1) the periodic assessment (no less frequently than annually) of certain factors that influence the Fund’s liquidity risk; (2) the periodic classification (no less frequently than monthly) of the Fund’s investments into one of four liquidity categories that reflect an estimate of their liquidity under current market conditions; (3) a 15% limit on the acquisition of “illiquid investments” (as defined under the Liquidity Rule); (4) to the extent a Fund does not invest primarily in “highly liquid investments” (as defined under the Liquidity Rule), the determination of a minimum percentage of the Fund’s assets that generally will be invested in highly liquid investments (an “HLIM”); (5) if a Fund has established an HLIM, the periodic review (no less frequently than annually) of the HLIM and the adoption of policies and procedures for responding to a shortfall of the Fund’s highly liquid investments below its HLIM; and (6) periodic reporting to the Board.
At its meetings in May 2020, the Board received and reviewed a written report from the Funds’ Chief Compliance Officer and Chief Risk Officer, on behalf of the Administrator, concerning the operation of the LRMP for the period from the LRMP’s inception on December 1, 2018 through March 31, 2020 (the “Period”). The Report addressed the operation of the LRMP and assessed its adequacy and effectiveness, including, where applicable, the operation of any HLIM established for a Fund. There were no
Annual Shareholder Report
material changes to the LRMP during the Period. The Report summarized the operation of the Program and the information and factors considered by the Administrator in assessing whether the Program has been adequately and effectively implemented with respect to the Funds. Such information and factors included, among other things:
| ■ | the liquidity risk framework used to assess, manage, and periodically review each Fund’s liquidity risk and the results of this assessment, including a review of the Funds’ access to other available funding sources such as the Funds’ interfund lending facility, redemptions in-kind and committed lines of credit and confirmation that the Fund did not have to access any of these alternative funding sources during the Period; |
| ■ | the periodic classifications of the Fund’s investments into one of four liquidity categories and the methodologies and inputs used to classify the investments, including the Fund’s reasonably anticipated trade size; |
| ■ | the analysis received from a third-party liquidity assessment vendor that is taken into account in the process of determining the liquidity classifications of the Fund’s investments and the results of an evaluation of the services performed by the vendor in support of this process; |
| ■ | the fact that the Fund invested primarily in highly liquid investments during the Period and, therefore, was not required to establish, and has not established, an HLIM and the procedures for monitoring the status of the Fund as investing primarily in highly liquid investments; |
| ■ | the fact that the Fund invested no more than 15% of its assets in illiquid investments during the Period and the procedures for monitoring this limit; and |
| ■ | liquidity events during the Period, including the impact on liquidity caused by extended non-U.S. market closures and the market disruptions resulting from the novel coronavirus outbreak, and the fact that there were no specific liquidity events during the Period that materially affected the Fund’s liquidity risk. |
Based on this review, the Administrator concluded that the LRMP is operating effectively to assess and manage the Fund’s liquidity risk, and that the Program has been and continues to be adequately and effectively implemented to monitor and, as applicable, respond to the Fund’s liquidity developments.
Annual Shareholder Report
Voting Proxies on Fund Portfolio Securities
A description of the policies and procedures that the Fund uses to determine how to vote proxies, if any, relating to securities held in the Fund’s portfolio is available, without charge and upon request, by calling 1-800-341-7400. A report on “Form N-PX” of how the Fund voted any such proxies during the most recent 12-month period ended June 30 is available via the Proxy Voting Record (Form N-PX) link associated with the Fund and share class name at FederatedInvestors.com/FundInformation. Form N-PX filings are also available at the SEC’s website at sec.gov.
Quarterly Portfolio Schedule
Each fiscal quarter, the Fund will file with the SEC a complete schedule of its monthly portfolio holdings on “Form N-PORT.” The Fund’s holdings as of the end of the third month of every fiscal quarter, as reported on Form N-PORT, will be publicly available on the SEC’s website at sec.gov within 60 days of the end of the fiscal quarter upon filing. You may also access this information via the link to the Fund and share class name at FederatedInvestors.com.
Annual Shareholder Report
Mutual funds are not bank deposits or obligations, are not guaranteed by any bank and are not insured or guaranteed by the U.S. government, the Federal Deposit Insurance Corporation, the Federal Reserve Board or any other government agency. Investment in mutual funds involves investment risk, including the possible loss of principal.
This Report is authorized for distribution to prospective investors only when preceded or accompanied by the Fund’s Prospectus, which contains facts concerning its objective and policies, management fees, expenses and other information.
Federated Hermes MDT Balanced Fund
Federated Hermes Funds
4000 Ericsson Drive
Warrendale, PA 15086-7561
Contact us at FederatedInvestors.com
or call 1-800-341-7400.
Federated Securities Corp., Distributor
CUSIP 31421R841
CUSIP 31421R833
CUSIP 31421R825
CUSIP 31421R692
37326 (9/20)
© 2020 Federated Hermes, Inc.

Annual Shareholder Report
July 31, 2020
| Share Class | Ticker | A | QALGX | B | QBLGX | C | QCLGX | Institutional | QILGX |
Federated Hermes MDT Large Cap Growth Fund
(formerly, Federated MDT Large Cap Growth Fund)
Fund Established 2005
A Portfolio of Federated Hermes MDT Series
(formerly, Federated MDT Series)
IMPORTANT NOTICE REGARDING REPORT DELIVERY
Beginning on January 1, 2021, as permitted by regulations adopted by the Securities and Exchange Commission, paper copies of the Fund’s shareholder reports like this one will no longer be sent by mail, unless you specifically request paper copies of the reports from the Fund or from your financial intermediary, such as a broker-dealer or bank. Instead, the reports will be made available on a website, and you will be notified by mail each time a report is posted and provided with a website link to access the report.
If you already elected to receive shareholder reports electronically, you will not be affected by this change and you need not take any action. You may elect to receive shareholder reports and other communications from the Fund or your financial intermediary electronically by contacting your financial intermediary (such as a broker-dealer or bank); other shareholders may call the Fund at 1-800-341-7400, Option 4.
You may elect to receive all future reports in paper free of charge. You can inform the Fund or your financial intermediary that you wish to continue receiving paper copies of your shareholder reports by contacting your financial intermediary (such as a broker-dealer or bank); other shareholders may call the Fund at 1-800-341-7400, Option 4. Your election to receive reports in paper will apply to all funds held with the Fund complex or your financial intermediary.
Not FDIC Insured ■ May Lose Value ■ No Bank Guarantee
J. Christopher
Donahue
President
Federated Hermes MDT Large Cap Growth Fund
Letter from the President
Dear Valued Shareholder,
I am pleased to present the Annual Shareholder Report for your fund covering the period from August 1, 2019 through July 31, 2020.
As we all confront the unprecedented effects of the coronavirus and the challenges it presents to our families, communities, businesses and the financial markets, I want you to know that everyone at Federated Hermes is dedicated to helping you successfully navigate the markets ahead. You can count on us for the insights, investment management knowledge and client service that you have come to expect. Please refer to our website, FederatedInvestors.com, for timely updates on this and other economic and market matters.
Thank you for investing with us. I hope you find this information useful and look forward to keeping you informed.
Sincerely,
J. Christopher Donahue, President
CONTENTS
| 1 |
| 6 |
| 7 |
| 12 |
| 16 |
| 18 |
| 19 |
| 20 |
| 33 |
| 35 |
| 37 |
| 43 |
| 52 |
| 54 |
| 54 |
Management’s Discussion of Fund Performance (unaudited)
The total return of Federated Hermes MDT Large Cap Growth Fund (the “Fund”), based on net asset value for the 12-month reporting period ended July 31, 2020, was 26.91% for Class A Shares, 25.95% for Class B Shares, 25.99% for Class C Shares and 27.22% for the Institutional Shares. The total return for the Russell 1000® Growth Index (R1000G),1 the Fund’s broad-based securities market index, was 29.84% for the same period. The total return of the Morningstar Large Growth Funds Average (MLGFA),2 a peer group average for the Fund, was 23.56% during the same period. The Fund’s and MLGFA’s total returns for the most recently completed fiscal year reflected actual cash flows, transaction costs and other expenses, which were not reflected in the total return of the R1000G.
During the reporting period, the Fund’s investment strategy focused on stock selection. Stock selection was the most significant factor affecting the Fund’s performance relative to the R1000G during the period.
The following discussion will focus on the performance of the Fund’s Institutional Shares relative to the R1000G.
MARKET OVERVIEW
The twelve months of this reporting period, culminating with the COVID-19 pandemic, saw huge volatility in the domestic market. Despite the dramatic decline and recovery in the first half of 2020, the whole market Russell 3000® Index3 was up 10.93% for the full period. However, looking more deeply at the sub-indexes reveals the wildness of the market. Large caps dominated small caps:4 the mega-cap Russell Top 200® Index5 returned 15.84%, while the Russell Midcap® Index6 returned 2.04% and the small-cap Russell 2000® Index7 returned -4.59%. In addition, once again, growth dominated value: the Russell 3000® Growth Index8 returned 28.24% while the Russell 3000® Value Index9 returned -6.67. The largest spread between growth and value in one capitalization range this year was almost 38 percentage points: the mega-cap Russell Top 200® Growth Index10 gained 33.06% while the Russell Top 200® Value11 Index returned -4.80%.
The best performing sectors in the R1000G during the reporting period were Information Technology (44.13%), Consumer Discretionary (40.16%) and Communication Services (25.72%). Underperforming sectors during the same period included Energy (-29.68%), Industrials (-2.73%) and Utilities (3.10%).
Annual Shareholder Report
STOCK SELECTION
When looking at the Fund’s performance in terms of fundamental and technical characteristics, the most significant driver of underperformance during the reporting period was weak stock selection during the last quarter of 2019 among stocks that had prices near high and neutral-to-high analyst conviction. In the 2020 calendar year, there were partial favorable offsets from investing in stocks with prices not near their one-year highs and neutral-to-high analyst conviction; these stocks outperformed significantly. The Fund’s sector exposures continued to remain close to R1000G weights; there were no significant overweights or underweights at the end of the fiscal year. Unfavorable stock selection in the Consumer Discretionary and Health Care sectors was the biggest contributor to the Fund’s underperformance during the period. Favorable stock selection in the Information Technology sector was the largest favorable offset to the underperformance of the reporting period.
Individual stocks enhancing the Fund’s performance during the reporting period included DocuSign, Inc. and Cadence Design Systems, Inc., both overweighted by the Fund, and Boeing Company, which was underweighted by the Fund.
Individual stocks detracting from the Fund’s performance during the reporting period included two stocks overweighted by the Fund, HCA Healthcare, Inc. and HEICO Corporation. There were also two detractors underweighted by the Fund, Tesla Inc. and Microsoft Corporation.
| 1 | Please see the footnotes to the line graphs below for definitions of, and further information about, the R1000G. |
| 2 | Please see the footnotes to the line graphs below for definitions of, and further information about, the MLGFA. |
| 3 | The Russell 3000® Index measures the performance of the largest 3,000 U.S. companies representing approximately 98% of the investable U.S. equity market. The Russell 3000® Index is constructed to provide a comprehensive, unbiased and stable barometer of the broad market, and is completely reconstituted annually to ensure new and growing equities are reflected.* |
| 4 | Small-cap stocks may be less liquid and subject to greater price volatility than large-cap stocks. |
| 5 | The Russell Top 200® Index measures the performance of the largest cap segment of the U.S. equity universe. The Russell Top 200® Index is a subset of the Russell 3000® Index. It includes approximately 200 of the largest securities based on a combination of their market cap and current index membership and represents approximately 68% of the U.S. market. The Russell Top 200® Index is constructed to provide a comprehensive and unbiased barometer for this very large cap segment and is completely reconstituted annually to ensure new and growing equities are reflected.* |
| 6 | The Russell Midcap® Index measures the performance of the mid-cap segment of the U.S. equity universe. The Russell Midcap® Index is a subset of the Russell 1000® Index. It includes approximately 800 of the smallest securities based on a combination of their market cap and current index membership. The Russell Midcap® Index represents approximately 31% of the total market capitalization of the Russell 1000® companies. The Russell Midcap® Index is constructed to provide a comprehensive and unbiased barometer for the mid-cap segment. The Russell Midcap Index is completely reconstituted annually to ensure larger stocks do not distort the performance and characteristics of the true mid-cap opportunity set.* |
Annual Shareholder Report
| 7 | The Russell 2000® Index measures the performance of the small-cap segment of the U.S. equity universe. The Russell 2000® Index is a subset of the Russell 3000® Index representing approximately 10% of the total market capitalization of that index. It includes approximately 2000 of the smallest securities based on a combination of their market cap and current index membership. The Russell 2000® Index is constructed to provide a comprehensive and unbiased small-cap barometer and is completely reconstituted annually to ensure larger stocks do not distort the performance and characteristics of the true small-cap opportunity set.* |
| 8 | The Russell 3000® Growth Index measures the performance of the broad growth segment of the U.S. equity universe. It includes those Russell 3000® Index companies with higher price-to-book ratios and higher forecasted growth values. The Russell 3000® Growth Index is constructed to provide a comprehensive, unbiased and stable barometer of the broad growth market. The Russell 3000® Growth Index is completely reconstituted annually to ensure new and growing equities are included and that the represented companies continue to reflect growth characteristics.* |
| 9 | The Russell 3000® Value Index measures the performance of the broad value segment of U.S. equity value universe. It includes those Russell 3000® Index companies with lower price-to-book ratios and lower forecasted growth values. The Russell 3000® Value Index is constructed to provide a comprehensive, unbiased and stable barometer of the broad value market. The Russell 3000® Value Index is completely reconstituted annually to ensure new and growing equities are included and that the represented companies continue to reflect value characteristics.* |
| 10 | The Russell Top 200® Growth Index measures the performance of the especially large cap segment of the U.S. equity universe represented by stocks in the largest 200 by market cap. It includes Russell Top 200® Index companies with higher growth earning potential as defined by Russell’s leading style methodology.* |
| 11 | The Russell Top 200® Value Index measures the performance of the especially large cap segment of the U.S. equity universe represented by stocks in the largest 200 by market cap. It includes Russell Top 200® Index companies with value characteristics as defined by Russell’s leading style methodology.* |
| * | The index is unmanaged, and it is not possible to invest directly in an index. |
Annual Shareholder Report
FUND PERFORMANCE AND GROWTH OF A $10,000 INVESTMENT
The graph below illustrates the hypothetical investment of $10,0001 in the Federated Hermes MDT Large Cap Growth Fund (the “Fund”) from July 31, 2010 to July 31, 2020, compared to the Russell 1000® Growth Index (R1000G)2 and the Morningstar Large Growth Funds Average (MLGFA).3 The Average Annual Total Return table below shows returns for each class averaged over the stated periods.
Growth of a $10,000 Investment
Growth of $10,000 as of July 31, 2020
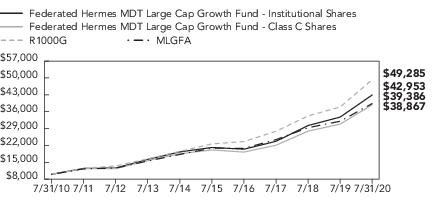
| Federated Hermes MDT Large Cap Growth Fund - | Institutional Shares | Class C Shares | NA | R1000G | MLGFA |
| F | F | NA | I | I |
| 7/31/2010 | 10,000 | 10,000 | | 10,000 | 10,000 |
| 7/31/2011 | 12,462 | 12,340 | | 12,476 | 12,289 |
| 7/31/2012 | 12,602 | 12,352 | | 13,506 | 12,600 |
| 7/31/2013 | 16,196 | 15,714 | | 16,429 | 15,532 |
| 7/31/2014 | 19,312 | 18,559 | | 19,499 | 18,264 |
| 7/31/2015 | 21,155 | 20,123 | | 22,635 | 20,870 |
| 7/31/2016 | 20,437 | 19,239 | | 23,619 | 20,785 |
| 7/31/2017 | 23,704 | 22,091 | | 27,883 | 24,409 |
| 7/31/2018 | 30,257 | 27,928 | | 34,252 | 29,356 |
| 7/31/2019 | 33,763 | 30,850 | | 37,959 | 32,038 |
| 7/31/2020 | 42,953 | 38,867 | | 49,285 | 39,386 |
41 graphic description end -->
| ■ | Total returns shown for Class C Shares include the maximum contingent deferred sales charge of 1.00% as applicable. |
The Fund offers multiple share classes whose performance may be greater than or less than its other share class(es) due to differences in sales charges and expenses. See the Average Annual Return table below for the returns of additional classes not shown in the line graph above.
Average Annual Total Returns for the Period Ended 7/31/2020
(returns reflect all applicable sales charges and contingent deferred sales charge as specified below in footnote #1)
| | 1 Year | 5 Years | 10 Years |
| Class A Shares | 19.94% | 13.64% | 14.75% |
| Class B Shares | 20.45% | 13.82% | 14.71% |
| Class C Shares | 24.99% | 14.07% | 14.54% |
| Institutional Shares | 27.22% | 15.22% | 15.69% |
| R1000G | 29.84% | 16.84% | 17.29% |
| MLGFA | 23.56% | 13.67% | 15.15% |
Annual Shareholder Report
Performance data quoted represents past performance which is no guarantee of future results. Investment return and principal value will fluctuate so that an investor’s shares, when redeemed, may be worth more or less than their original cost. Mutual fund performance changes over time and current performance may be lower or higher than what is stated. For current to the most recent month-end performance and after-tax returns, visit FederatedInvestors.com or call 1-800-341-7400. Returns shown do not reflect the deduction of taxes that a shareholder would pay on Fund distributions or the redemption of Fund shares. Mutual funds are not obligations of or guaranteed by any bank and are not federally insured.
| 1 | Represents a hypothetical investment of $10,000 in the Fund after deducting applicable sales charges: for Class A Shares, the maximum sales charge of 5.50% ($10,000 investment minus $550 sales charges = $9,450); for Class B Shares, the maximum contingent deferred sales charge is 5.50% on any redemption less than one year from the purchase date; for Class C Shares, a 1.00% contingent deferred sales charge would be applied to any redemption less than one year from the purchase date. The Fund’s performance assumes the reinvestment of all dividends and distributions. The R1000G and MLGFA have been adjusted to reflect reinvestment of dividends on securities. |
| 2 | The R1000G measures the performance of the large-cap growth segment of the U.S. equity universe. It includes those Russell 1000® Index companies with higher price-to-book ratios and higher forecasted growth values. The R1000G is constructed to provide a comprehensive and unbiased barometer for the large-cap growth segment. The R1000G is completely reconstituted annually to ensure new and growing equities are included and that the represented companies continue to reflect growth characteristics. The R1000G is unmanaged and, unlike the Fund, is not affected by cash flows. It is not possible to invest directly in an index. The R1000G is not adjusted to reflect sales charges, expenses or other fees that the Securities and Exchange Commission requires to be reflected in the Fund’s performance. |
| 3 | Morningstar figures represent the average of the total returns reported by all the funds designated by Morningstar as falling into the respective category indicated. They do not reflect sales charges. The Morningstar figures in the Growth of $10,000 line graph are based on historical return information published by Morningstar and reflect the return of the funds comprising the category in the year of publication. Because the funds designated by Morningstar as falling into the category can change over time, the Morningstar figures in the line graph may not match the Morningstar figures in the Average Annual Total Returns table, which reflect the return of the funds that currently comprise the category. |
Annual Shareholder Report
Portfolio of Investments Summary Table (unaudited)
At July 31, 2020, the Fund’s sector composition1 was as follows:
| Sector Composition | Percentage of
Total Net Assets |
| Information Technology | 44.1% |
| Consumer Discretionary | 14.8% |
| Health Care | 14.7% |
| Communication Services | 10.2% |
| Industrials | 5.3% |
| Consumer Staples | 3.9% |
| Financials | 2.9% |
| Real Estate | 2.0% |
| Materials | 0.4% |
| Securities Lending Collateral2 | 0.3% |
| Cash Equivalents3 | 1.8% |
| Other Assets and Liabilities—Net4 | (0.4)% |
| TOTAL | 100.0% |
| 1 | Except for Securities Lending Collateral, Cash Equivalents and Other Assets and Liabilities, sector classifications are based upon, and individual portfolio securities are assigned to, the classifications of the Global Industry Classification Standard (GICS) except that the Adviser assigns a classification to securities not classified by the GICS and to securities for which the Adviser does not have access to the classification made by the GICS. |
| 2 | Represents cash collateral received for portfolio securities on loan that may be invested in affiliated money market funds, other money market instruments and/or repurchase agreements. |
| 3 | Cash Equivalents include any investments in money market mutual funds and/or overnight repurchase agreements other than those representing cash collateral for securities lending. |
| 4 | Assets, other than investments in securities, less liabilities. See Statement of Assets and Liabilities. |
Annual Shareholder Report
Portfolio of Investments
July 31, 2020
| Shares | | | Value |
| | | COMMON STOCKS—98.3% | |
| | | Communication Services—10.2% | |
| 14,254 | | Activision Blizzard, Inc. | $1,177,808 |
| 6,072 | 1 | Alphabet, Inc., Class A | 9,034,832 |
| 689 | | Cable One, Inc. | 1,255,744 |
| 983 | 1 | Charter Communications, Inc. | 570,140 |
| 21,665 | 1 | Facebook, Inc. | 5,495,761 |
| 70,783 | 1,2 | MSG Networks, Inc. | 674,562 |
| 4,769 | 1 | Netflix, Inc. | 2,331,469 |
| 32,666 | 1 | TripAdvisor, Inc. | 660,833 |
| | | TOTAL | 21,201,149 |
| | | Consumer Discretionary—14.8% | |
| 3,942 | 1 | Amazon.com, Inc. | 12,475,169 |
| 1,032 | 1 | AutoZone, Inc. | 1,246,057 |
| 3,337 | | Dollar General Corp. | 635,365 |
| 10,615 | | Domino’s Pizza, Inc. | 4,103,865 |
| 28,316 | | eBay, Inc. | 1,565,309 |
| 8,685 | 1 | Etsy, Inc. | 1,028,130 |
| 8,228 | | Home Depot, Inc. | 2,184,452 |
| 17,389 | | Lowe’s Cos., Inc. | 2,589,396 |
| 5,015 | | McDonald’s Corp. | 974,314 |
| 1,076 | 1 | O’Reilly Automotive, Inc. | 513,661 |
| 1,134 | 1 | Tesla, Inc. | 1,622,482 |
| 2,558 | 1 | Ulta Beauty, Inc. | 493,668 |
| 49,522 | 1 | Under Armour, Inc., Class A | 520,971 |
| 3,041 | 1,2 | Wayfair, Inc. | 809,180 |
| | | TOTAL | 30,762,019 |
| | | Consumer Staples—3.9% | |
| 14,734 | | Church and Dwight, Inc. | 1,419,326 |
| 8,415 | | Clorox Co. | 1,990,232 |
| 5,747 | | Costco Wholesale Corp. | 1,870,821 |
| 14,471 | | Energizer Holdings, Inc. | 725,431 |
| 19,190 | | Flowers Foods, Inc. | 436,572 |
| 2,361 | | Hershey Foods Corp. | 343,313 |
| 9,056 | | PepsiCo, Inc. | 1,246,649 |
| | | TOTAL | 8,032,344 |
Annual Shareholder Report
| Shares | | | Value |
| | | COMMON STOCKS—continued | |
| | | Financials—2.9% | |
| 9,805 | 1 | Arch Capital Group Ltd. | $301,504 |
| 8,782 | | MSCI, Inc., Class A | 3,301,856 |
| 2,067 | | Marketaxess Holdings, Inc. | 1,068,019 |
| 12,291 | | The Travelers Cos., Inc. | 1,406,336 |
| | | TOTAL | 6,077,715 |
| | | Health Care—14.7% | |
| 7,298 | | Abbott Laboratories | 734,471 |
| 5,543 | | AbbVie, Inc. | 526,086 |
| 9,985 | 1 | Alexion Pharmaceuticals, Inc. | 1,023,363 |
| 14,339 | | Amgen, Inc. | 3,508,323 |
| 3,100 | | Anthem, Inc. | 848,780 |
| 3,728 | 1 | Biogen, Inc. | 1,024,044 |
| 18,259 | | Eli Lilly & Co. | 2,744,145 |
| 31,638 | 1 | Hologic, Inc. | 2,207,700 |
| 1,863 | | Humana, Inc. | 731,134 |
| 2,435 | 1 | IDEXX Laboratories, Inc. | 968,521 |
| 2,602 | 1 | Jazz Pharmaceuticals PLC | 281,666 |
| 6,359 | 1 | Livongo Health, Inc. | 809,183 |
| 1,716 | 1 | Masimo Corp. | 377,726 |
| 31,217 | | Merck & Co., Inc. | 2,504,852 |
| 712 | 1 | Mettler-Toledo International, Inc. | 665,720 |
| 1,838 | 1 | Molina Healthcare, Inc. | 339,479 |
| 17,701 | 1 | SAGE Therapeutics, Inc. | 806,635 |
| 2,161 | | UnitedHealth Group, Inc. | 654,308 |
| 7,777 | 1 | Veeva Systems, Inc. | 2,057,561 |
| 12,638 | 1 | Vertex Pharmaceuticals, Inc. | 3,437,536 |
| 10,128 | 1 | Waters Corp. | 2,158,783 |
| 14,149 | | Zoetis, Inc. | 2,146,120 |
| | | TOTAL | 30,556,136 |
| | | Industrials—5.3% | |
| 3,037 | | Acuity Brands, Inc. | 300,967 |
| 12,143 | | Flowserve Corp. | 338,425 |
| 3,191 | | Hubbell, Inc. | 430,689 |
| 8,171 | | Huntington Ingalls Industries, Inc. | 1,419,385 |
| 285,725 | | KAR Auction Services, Inc. | 4,323,019 |
| 3,526 | | Lockheed Martin Corp. | 1,336,248 |
| 85,670 | | Spirit AeroSystems Holdings, Inc., Class A | 1,676,562 |
Annual Shareholder Report
| Shares | | | Value |
| | | COMMON STOCKS—continued | |
| | | Industrials—continued | |
| 6,117 | | Verisk Analytics, Inc. | $1,154,339 |
| | | TOTAL | 10,979,634 |
| | | Information Technology—44.1% | |
| 12,188 | 1 | Adobe, Inc. | 5,415,372 |
| 47,815 | | Apple, Inc. | 20,323,288 |
| 6,673 | | Applied Materials, Inc. | 429,274 |
| 3,966 | 1 | Arista Networks, Inc. | 1,030,248 |
| 4,310 | 1 | Autodesk, Inc. | 1,019,013 |
| 10,436 | | Booz Allen Hamilton Holding Corp. | 853,247 |
| 6,173 | | Broadcom, Inc. | 1,955,298 |
| 51,813 | 1 | Cadence Design Systems, Inc. | 5,660,570 |
| 4,108 | | Cognizant Technology Solutions Corp. | 280,659 |
| 3,694 | 1 | Coupa Software, Inc. | 1,132,026 |
| 8,399 | 1 | Crowdstrike Holdings, Inc. | 950,767 |
| 21,792 | 1 | DocuSign, Inc. | 4,725,159 |
| 22,915 | 1 | Dynatrace Holdings LLC | 958,535 |
| 1,706 | 1 | FleetCor Technologies, Inc. | 441,121 |
| 8,307 | 1 | Fortinet, Inc. | 1,148,858 |
| 5,902 | 1 | GoDaddy, Inc. | 414,793 |
| 11,960 | 1 | Inphi Corp. | 1,562,694 |
| 5,879 | | Intuit, Inc. | 1,801,149 |
| 9,118 | 1 | Keysight Technologies, Inc. | 910,797 |
| 12,700 | | Mastercard, Inc. | 3,918,331 |
| 74,611 | | Microsoft Corp. | 15,296,001 |
| 9,314 | | NVIDIA Corp. | 3,954,631 |
| 10,237 | 1 | Okta, Inc. | 2,262,172 |
| 4,932 | | Oracle Corp. | 273,479 |
| 21,092 | | Paychex, Inc. | 1,516,937 |
| 21,087 | 1 | PayPal Holdings, Inc. | 4,134,528 |
| 34,910 | | Qualcomm, Inc. | 3,686,845 |
| 3,141 | 1 | ServiceNow, Inc. | 1,379,527 |
| 4,205 | 1 | Square, Inc. | 546,019 |
| 5,601 | 1 | Synopsys, Inc. | 1,115,831 |
| 2,133 | | Universal Display Corp. | 372,102 |
| 6,607 | 1 | Verisign, Inc. | 1,398,570 |
| 3,257 | 1 | Zoom Video Communications, Inc. | 826,985 |
| | | TOTAL | 91,694,826 |
Annual Shareholder Report
| Shares | | | Value |
| | | COMMON STOCKS—continued | |
| | | Materials—0.4% | |
| 1,474 | | Sherwin-Williams Co. | $955,034 |
| | | Real Estate—2.0% | |
| 3,683 | | American Tower Corp. | 962,699 |
| 6,400 | | Coresite Realty Corp. | 825,920 |
| 7,956 | | SBA Communications Corp. | 2,478,612 |
| | | TOTAL | 4,267,231 |
| | | TOTAL COMMON STOCKS
(IDENTIFIED COST $140,640,251) | 204,526,088 |
| | | INVESTMENT COMPANIES—2.1% | |
| 640,284 | | Federated Hermes Government Obligations Fund,
Premier Shares, 0.10%3 | 640,284 |
| 3,804,098 | | Federated Hermes Institutional Prime Value Obligations Fund, Institutional Shares, 0.21%3 | 3,806,381 |
| | | TOTAL INVESTMENT COMPANIES
(IDENTIFIED COST $4,443,782) | 4,446,665 |
| | | TOTAL INVESTMENT IN SECURITIES—100.4%
(IDENTIFIED COST $145,084,033)4 | 208,972,753 |
| | | OTHER ASSETS AND LIABILITIES - NET—(0.4)%5 | (922,720) |
| | | TOTAL NET ASSETS—100% | $208,050,033 |
Affiliated holdings are investment companies which are managed by the Adviser or an affiliate of the Adviser. Transactions with affiliated fund holdings during the period ended July 31, 2020, were as follows:
| | Federated Hermes
Government
Obligations Fund,
Premier Shares* | Federated Hermes
Institutional
Prime Value
Obligations Fund,
Institutional Shares | Total
Affiliated
Transactions |
| Balance of Shares Held 7/31/2019 | 145,725 | 2,521,943 | 2,667,668 |
| Purchases/Additions | 18,877,699 | 35,692,448 | 54,570,147 |
| Sales/Reductions | (18,383,140) | (34,410,293) | (52,793,433) |
| Balance of Shares Held 7/31/2020 | 640,284 | 3,804,098 | 4,444,382 |
| Value | $640,284 | $3,806,381 | $4,446,665 |
| Change in Unrealized Appreciation/Depreciation | N/A | $2,295 | $2,295 |
| Net Realized Gain/(Loss) | N/A | $(1,377) | $(1,377) |
| Dividend Income | $6,157 | $30,302 | $36,459 |
| * | All or a portion of the balance/activity for the fund relates to cash collateral received on securities lending transactions. |
| 1 | Non-income-producing security. |
| 2 | All or a portion of these securities are temporarily on loan to unaffiliated broker/dealers. |
| 3 | 7-day net yield. |
Annual Shareholder Report
| 4 | The cost of investments for federal tax purposes amounts to $146,041,969. |
| 5 | Assets, other than investments in securities, less liabilities. See Statement of Assets and Liabilities. |
Note: The categories of investments are shown as a percentage of total net assets at July 31, 2020.
Various inputs are used in determining the value of the Fund’s investments. These inputs are summarized in the three broad levels listed below:
Level 1—quoted prices in active markets for identical securities.
Level 2—other significant observable inputs (including quoted prices for similar securities, interest rates, prepayment speeds, credit risk, etc.). Also includes securities valued at amortized cost.
Level 3—significant unobservable inputs (including the Fund’s own assumptions in determining the fair value of investments).
The inputs or methodology used for valuing securities are not an indication of the risk associated with investing in those securities.
As of July 31, 2020, all investments of the Fund utilized Level 1 inputs in valuing the Fund’s assets carried at fair value.
See Notes which are an integral part of the Financial Statements
Annual Shareholder Report
Financial Highlights–Class A Shares
(For a Share Outstanding Throughout Each Period)
| Year Ended July 31 | 2020 | 2019 | 2018 | 2017 | 2016 |
| Net Asset Value, Beginning of Period | $20.81 | $20.66 | $17.46 | $15.18 | $17.64 |
| Income From Investment Operations: | | | | | |
| Net investment income (loss)1 | (0.04) | (0.05) | (0.07) | 0.01 | 0.04 |
| Net realized and unrealized gain (loss) | 5.37 | 2.01 | 4.67 | 2.36 | (0.70) |
| TOTAL FROM INVESTMENT OPERATIONS | 5.33 | 1.96 | 4.60 | 2.37 | (0.66) |
| Less Distributions: | | | | | |
| Distributions from net realized gain | (1.11) | (1.81) | (1.40) | (0.09) | (1.80) |
| Net Asset Value, End of Period | $25.03 | $20.81 | $20.66 | $17.46 | $15.18 |
| Total Return2 | 26.91% | 11.28% | 27.38% | 15.66% | (3.62)% |
| Ratios to Average Net Assets: | | | | | |
| Net expenses3 | 1.11% | 1.48% | 1.52% | 1.52% | 1.50% |
| Net investment income (loss) | (0.19)% | (0.27)% | (0.38)% | 0.02% | 0.28% |
| Expense waiver/reimbursement4 | 0.30% | 0.00%5 | 0.02% | 0.08% | 0.07% |
| Supplemental Data: | | | | | |
| Net assets, end of period (000 omitted) | $93,740 | $67,513 | $59,355 | $49,794 | $45,661 |
| Portfolio turnover | 220% | 97% | 104% | 104% | 69% |
| 1 | Per share numbers have been calculated using the average shares method. |
| 2 | Based on net asset value, which does not reflect the sales charge, redemption fee or contingent deferred sales charge, if applicable. |
| 3 | Amount does not reflect net expenses incurred by investment companies in which the Fund may invest. |
| 4 | This expense decrease is reflected in both the net expense and the net investment income (loss) ratios shown above. Amount does not reflect expense waiver/reimbursement recorded by investment companies in which the Fund may invest. |
| 5 | Represents less than 0.01%. |
See Notes which are an integral part of the Financial Statements
Annual Shareholder Report
Financial Highlights–Class B Shares
(For a Share Outstanding Throughout Each Period)
| Year Ended July 31 | 2020 | 2019 | 2018 | 2017 | 2016 |
| Net Asset Value, Beginning of Period | $18.66 | $18.85 | $16.16 | $14.16 | $16.71 |
| Income From Investment Operations: | | | | | |
| Net investment income (loss)1 | (0.18) | (0.18) | (0.20) | (0.11) | (0.07) |
| Net realized and unrealized gain (loss) | 4.76 | 1.80 | 4.29 | 2.20 | (0.68) |
| TOTAL FROM INVESTMENT OPERATIONS | 4.58 | 1.62 | 4.09 | 2.09 | (0.75) |
| Less Distributions: | | | | | |
| Distributions from net realized gain | (1.11) | (1.81) | (1.40) | (0.09) | (1.80) |
| Net Asset Value, End of Period | $22.13 | $18.66 | $18.85 | $16.16 | $14.16 |
| Total Return2 | 25.95% | 10.51% | 26.38% | 14.81% | (4.41)% |
| Ratios to Average Net Assets: | | | | | |
| Net expenses3 | 1.90% | 2.23% | 2.27% | 2.27% | 2.25% |
| Net investment income (loss) | (0.96)% | (1.02)% | (1.13)% | (0.71)% | (0.49)% |
| Expense waiver/reimbursement4 | 0.27% | 0.00%5 | 0.02% | 0.08% | 0.08% |
| Supplemental Data: | | | | | |
| Net assets, end of period (000 omitted) | $9,662 | $12,612 | $14,432 | $13,654 | $14,925 |
| Portfolio turnover | 220% | 97% | 104% | 104% | 69% |
| 1 | Per share numbers have been calculated using the average shares method. |
| 2 | Based on net asset value, which does not reflect the sales charge, redemption fee or contingent deferred sales charge, if applicable. |
| 3 | Amount does not reflect net expenses incurred by investment companies in which the Fund may invest. |
| 4 | This expense decrease is reflected in both the net expense and the net investment income (loss) ratios shown above. Amount does not reflect expense waiver/reimbursement recorded by investment companies in which the Fund may invest. |
| 5 | Represents less than 0.01%. |
See Notes which are an integral part of the Financial Statements
Annual Shareholder Report
Financial Highlights–Class C Shares
(For a Share Outstanding Throughout Each Period)
| Year Ended July 31 | 2020 | 2019 | 2018 | 2017 | 2016 |
| Net Asset Value, Beginning of Period | $18.10 | $18.35 | $15.76 | $13.81 | $16.34 |
| Income From Investment Operations: | | | | | |
| Net investment income (loss)1 | (0.17) | (0.18) | (0.19) | (0.11) | (0.06) |
| Net realized and unrealized gain (loss) | 4.61 | 1.74 | 4.18 | 2.15 | (0.67) |
| TOTAL FROM INVESTMENT OPERATIONS | 4.44 | 1.56 | 3.99 | 2.04 | (0.73) |
| Less Distributions: | | | | | |
| Distributions from net realized gain | (1.11) | (1.81) | (1.40) | (0.09) | (1.80) |
| Net Asset Value, End of Period | $21.43 | $18.10 | $18.35 | $15.76 | $13.81 |
| Total Return2 | 25.99% | 10.46% | 26.42% | 14.82% | (4.39)% |
| Ratios to Average Net Assets: | | | | | |
| Net expenses3 | 1.88% | 2.23% | 2.27% | 2.27% | 2.25% |
| Net investment income (loss) | (0.95)% | (1.03)% | (1.13)% | (0.72)% | (0.46)% |
| Expense waiver/reimbursement4 | 0.29% | 0.00%5 | 0.02% | 0.08% | 0.07% |
| Supplemental Data: | | | | | |
| Net assets, end of period (000 omitted) | $14,536 | $12,445 | $10,685 | $9,672 | $10,052 |
| Portfolio turnover | 220% | 97% | 104% | 104% | 69% |
| 1 | Per share numbers have been calculated using the average shares method. |
| 2 | Based on net asset value, which does not reflect the sales charge, redemption fee or contingent deferred sales charge, if applicable. |
| 3 | Amount does not reflect net expenses incurred by investment companies in which the Fund may invest. |
| 4 | This expense decrease is reflected in both the net expense and the net investment income (loss) ratios shown above. Amount does not reflect expense waiver/reimbursement recorded by investment companies in which the Fund may invest. |
| 5 | Represents less than 0.01%. |
See Notes which are an integral part of the Financial Statements
Annual Shareholder Report
Financial Highlights–Institutional Shares
(For a Share Outstanding Throughout Each Period)
| Year Ended July 31 | 2020 | 2019 | 2018 | 2017 | 2016 |
| Net Asset Value, Beginning of Period | $21.83 | $21.52 | $18.10 | $15.69 | $18.13 |
| Income From Investment Operations: | | | | | |
| Net investment income (loss)1 | 0.03 | (0.01) | (0.03) | 0.05 | 0.08 |
| Net realized and unrealized gain (loss) | 5.64 | 2.13 | 4.85 | 2.45 | (0.72) |
| TOTAL FROM INVESTMENT OPERATIONS | 5.67 | 2.12 | 4.82 | 2.50 | (0.64) |
| Less Distributions: | | | | | |
| Distributions from net realized gain | (1.11) | (1.81) | (1.40) | (0.09) | (1.80) |
| Net Asset Value, End of Period | $26.39 | $21.83 | $21.52 | $18.10 | $15.69 |
| Total Return2 | 27.22% | 11.59% | 27.65% | 15.98% | (3.40)% |
| Ratios to Average Net Assets: | | | | | |
| Net expenses3 | 0.81% | 1.22% | 1.27% | 1.27% | 1.25% |
| Net investment income (loss) | 0.13% | (0.04)% | (0.14)% | 0.27% | 0.52% |
| Expense waiver/reimbursement4 | 0.34% | 0.00%5 | 0.02% | 0.08% | 0.07% |
| Supplemental Data: | | | | | |
| Net assets, end of period (000 omitted) | $90,113 | $37,076 | $11,966 | $7,649 | $7,469 |
| Portfolio turnover | 220% | 97% | 104% | 104% | 69% |
| 1 | Per share numbers have been calculated using the average shares method. |
| 2 | Based on net asset value. |
| 3 | Amount does not reflect net expenses incurred by investment companies in which the Fund may invest. |
| 4 | This expense decrease is reflected in both the net expense and the net investment income (loss) ratios shown above. Amount does not reflect expense waiver/reimbursement recorded by investment companies in which the Fund may invest. |
| 5 | Represents less than 0.01%. |
See Notes which are an integral part of the Financial Statements
Annual Shareholder Report
Statement of Assets and Liabilities
July 31, 2020
| Assets: | | |
| Investment in securities, at value including $574,921 of securities loaned and $4,446,665 of investment in affiliated holdings* (identified cost $145,084,033) | | $208,972,753 |
| Income receivable | | 55,855 |
| Income receivable from affiliated holdings | | 751 |
| Receivable for investments sold | | 896,697 |
| Receivable for shares sold | | 102,220 |
| TOTAL ASSETS | | 210,028,276 |
| Liabilities: | | |
| Payable for investments purchased | $1,018,007 | |
| Payable for shares redeemed | 117,701 | |
| Payable for collateral due to broker for securities lending | 640,284 | |
| Payable for investment adviser fee (Note 5) | 2,236 | |
| Payable for administrative fee (Note 5) | 436 | |
| Payable for transfer agent fees | 36,135 | |
| Payable for distribution services fee (Note 5) | 14,733 | |
| Payable for other service fees (Notes 2 and 5) | 42,722 | |
| Payable for share registration costs | 40,729 | |
| Accrued expenses (Note 5) | 65,260 | |
| TOTAL LIABILITIES | | 1,978,243 |
| Net assets for 8,274,342 shares outstanding | | $208,050,033 |
| Net Assets Consist of: | | |
| Paid-in capital | | $131,709,227 |
| Total distributable earnings (loss) | | 76,340,806 |
| TOTAL NET ASSETS | | $208,050,033 |
Annual Shareholder Report
Statement of Assets and Liabilities–continued
| Net Asset Value, Offering Price and Redemption Proceeds Per Share | | |
| Class A Shares: | | |
| Net asset value per share ($93,739,771 ÷ 3,744,763 shares outstanding), no par value, unlimited shares authorized | | $25.03 |
| Offering price per share (100/94.50 of $25.03) | | $26.49 |
| Redemption proceeds per share | | $25.03 |
| Class B Shares: | | |
| Net asset value per share ($9,661,827 ÷ 436,610 shares outstanding), no par value, unlimited shares authorized | | $22.13 |
| Offering price per share | | $22.13 |
| Redemption proceeds per share (94.50/100 of $22.13) | | $20.91 |
| Class C Shares: | | |
| Net asset value per share ($14,535,585 ÷ 678,247 shares outstanding), no par value, unlimited shares authorized | | $21.43 |
| Offering price per share | | $21.43 |
| Redemption proceeds per share (99.00/100 of $21.43) | | $21.22 |
| Institutional Shares: | | |
| Net asset value per share ($90,112,850 ÷ 3,414,722 shares outstanding), no par value, unlimited shares authorized | | $26.39 |
| Offering price per share | | $26.39 |
| Redemption proceeds per share | | $26.39 |
| * | See information listed after the Fund’s Portfolio of Investments. |
See Notes which are an integral part of the Financial Statements
Annual Shareholder Report
Statement of Operations
Year Ended July 31, 2020
| Investment Income: | | | |
| Dividends (including $30,302 received from an affiliated holding*) | | | $1,530,467 |
| Net income on securities loaned (includes $6,157 received from an affiliated holding* related to cash collateral balances) | | | 3,211 |
| TOTAL INCOME | | | 1,533,678 |
| Expenses: | | | |
| Investment adviser fee (Note 5) | | $1,236,290 | |
| Administrative fee (Note 5) | | 130,558 | |
| Custodian fees | | 42,790 | |
| Transfer agent fees | | 249,398 | |
| Directors’/Trustees’ fees (Note 5) | | 2,186 | |
| Auditing fees | | 27,700 | |
| Legal fees | | 7,721 | |
| Portfolio accounting fees | | 86,805 | |
| Distribution services fee (Note 5) | | 174,292 | |
| Other service fees (Notes 2 and 5) | | 248,288 | |
| Share registration costs | | 68,672 | |
| Printing and postage | | 32,957 | |
| Miscellaneous (Note 5) | | 28,126 | |
| TOTAL EXPENSES | | 2,335,783 | |
| Waiver/reimbursement of investment adviser fee (Note 5) | | (517,001) | |
| Net expenses | | | 1,818,782 |
| Net investment income (loss) | | | (285,104) |
| Realized and Unrealized Gain (Loss) on Investments: | | | |
| Net realized gain on investments (including net realized loss of $(1,377) on sales of investments in an affiliated holding*) | | | 12,827,359 |
| Net change in unrealized appreciation of investments (including net change in unrealized appreciation of $2,295 on investments in an affiliated holding*) | | | 31,352,658 |
| Net realized and unrealized gain (loss) on investments | | | 44,180,017 |
| Change in net assets resulting from operations | | | $43,894,913 |
| * | See information listed after the Fund’s Portfolio of Investments. |
See Notes which are an integral part of the Financial Statements
Annual Shareholder Report
Statement of Changes in Net Assets
| Year Ended July 31 | 2020 | 2019 |
| Increase (Decrease) in Net Assets | | |
| Operations: | | |
| Net investment income (loss) | $(285,104) | $(426,359) |
| Net realized gain | 12,827,359 | 9,852,764 |
| Net change in unrealized appreciation/depreciation | 31,352,658 | 3,316,789 |
| CHANGE IN NET ASSETS RESULTING FROM OPERATIONS | 43,894,913 | 12,743,194 |
| Distributions to Shareholders: | | |
| Class A Shares | (4,102,840) | (5,477,815) |
| Class B Shares | (700,438) | (1,293,241) |
| Class C Shares | (770,197) | (969,378) |
| Institutional Shares | (3,849,963) | (1,895,731) |
| CHANGE IN NET ASSETS RESULTING FROM DISTRIBUTIONS TO SHAREHOLDERS | (9,423,438) | (9,636,165) |
| Share Transactions: | | |
| Proceeds from sale of shares | 25,421,100 | 50,787,953 |
| Proceeds from shares issued in connection with the tax-free transfer of assets from PNC Multi-Factor Large Cap Growth Fund | 101,740,899 | — |
| Net asset value of shares issued to shareholders in payment of distributions declared | 8,888,859 | 9,069,033 |
| Cost of shares redeemed | (92,117,585) | (29,755,658) |
| CHANGE IN NET ASSETS RESULTING FROM SHARE TRANSACTIONS | 43,933,273 | 30,101,328 |
| Change in net assets | 78,404,748 | 33,208,357 |
| Net Assets: | | |
| Beginning of period | 129,645,285 | 96,436,928 |
| End of period | $208,050,033 | $129,645,285 |
See Notes which are an integral part of the Financial Statements
Annual Shareholder Report
Notes to Financial Statements
July 31, 2020
1. ORGANIZATION
Federated Hermes MDT Series (the “Trust”) is registered under the Investment Company Act of 1940, as amended (the “Act”), as an open-end management investment company. The Trust consists of five portfolios. The financial statements included herein are only those of Federated Hermes MDT Large Cap Growth Fund (the “Fund”), a diversified portfolio. The financial statements of the other portfolios are presented separately. The assets of each portfolio are segregated and a shareholder’s interest is limited to the portfolio in which shares are held. Each portfolio pays its own expenses. The Fund offers four classes of shares: Class A Shares, Class B Shares, Class C Shares and Institutional Shares. All shares of the Fund have equal rights with respect to voting, except on class-specific matters. The investment objective of the Fund is long-term capital appreciation.
On March 30, 2017, the Fund’s T Share class became effective with the Securities and Exchange Commission (SEC), but is not yet offered for sale.
Effective August 1, 2018, an automatic conversion feature for Class C Shares was implemented. Pursuant to this automatic conversion feature, after Class C Shares have been held for ten years from the date of purchase, they will automatically convert to Class A Shares on the next monthly conversion processing date.
On November 15, 2019, the Fund acquired all of the net assets of PNC Multi-Factor Large Cap Growth Fund (the “Acquired Fund”), an open-end investment company, in a tax-free reorganization in exchange for shares of the Fund, pursuant to a plan of reorganization approved by the Acquired Fund shareholders on November 5, 2019. The purpose of the transaction was to combine two portfolios with comparable investment objectives and strategies. For financial reporting purposes, assets received and shares issued by the Fund were recorded at fair value; however, the cost basis of the investments received from the Acquired Fund was carried forward to align ongoing reporting of the Fund’s realized gains and losses with amounts distributable to shareholders for tax purposes.
For every one share of the Acquired Fund’s Class A Shares exchanged, a shareholder received 1.586 shares of the Fund’s Class A Shares.
For every one share of the Acquired Fund’s Class C Shares exchanged, a shareholder received 1.581 shares of the Fund’s Class C Shares.
For every one share of the Acquired Fund’s Class I Shares exchanged, a shareholder received 1.545 shares of the Fund’s Institutional Shares.
Annual Shareholder Report
The Fund received net assets from the Acquired Fund as the result of the tax-free reorganization as follows:
Shares of the
Fund Issued | Acquired Fund’s
Net Assets
Received | Unrealized
Appreciation1 | Net Assets
of the Fund
Immediately
Prior to
Combination | Net Assets
of the Fund
Immediately
After
Combination |
| 4,605,196 | $101,740,899 | $9,990,130 | $117,706,237 | $219,447,136 |
| 1 | Unrealized Appreciation is included in the Net Assets Received amount shown above. |
Assuming the acquisition had been completed on August 1, 2019, the beginning of the annual reporting period of the Fund, the Fund’s pro forma results of operations for the year ended July 31, 2020, were as follows:
| Net investment income (loss) | $(26,688) |
| Net realized and unrealized gain on investments | 47,081,335 |
| Net increase in net assets resulting from operations | $47,054,647 |
Because the combined investment portfolios have been managed as a single integrated portfolio since the acquisition was completed, it is not practicable to separate the amounts of revenue and earnings of the Acquired Fund that have been included in the Fund’s Statement of Operations and Statement of Change in Net Assets, respectively, as of July 31, 2020.
Prior to June 29, 2020, the name of the Trust and Fund was Federated MDT Series and Federated MDT Large Cap Growth Fund, respectively.
2. SIGNIFICANT ACCOUNTING POLICIES
The following is a summary of significant accounting policies consistently followed by the Fund in the preparation of its financial statements. These policies are in conformity with U.S. generally accepted accounting principles (GAAP).
Investment Valuation
In calculating its net asset value (NAV), the Fund generally values investments as follows:
| ■ | Equity securities listed on an exchange or traded through a regulated market system are valued at their last reported sale price or official closing price in their principal exchange or market. |
| ■ | Shares of other mutual funds or non-exchange-traded investment companies are valued based upon their reported NAVs. |
| ■ | Fixed-income securities are fair valued using price evaluations provided by a pricing service approved by the Fund’s Board of Trustees (the “Trustees”). |
Annual Shareholder Report
| ■ | Derivative contracts listed on exchanges are valued at their reported settlement or closing price, except that options are valued at the mean of closing bid and asked quotations. |
| ■ | Over-the-counter (OTC) derivative contracts are fair valued using price evaluations provided by a pricing service approved by the Trustees. |
| ■ | For securities that are fair valued in accordance with procedures established by and under the general supervision of the Trustees, certain factors may be considered, such as: the last traded or purchase price of the security, information obtained by contacting the issuer or dealers, analysis of the issuer’s financial statements or other available documents, fundamental analytical data, the nature and duration of restrictions on disposition, the movement of the market in which the security is normally traded, public trading in similar securities or derivative contracts of the issuer or comparable issuers, movement of a relevant index, or other factors including but not limited to industry changes and relevant government actions. |
If any price, quotation, price evaluation or other pricing source is not readily available when the NAV is calculated, if the Fund cannot obtain price evaluations from a pricing service or from more than one dealer for an investment within a reasonable period of time as set forth in the Fund’s valuation policies and procedures, or if information furnished by a pricing service, in the opinion of the valuation committee (“Valuation Committee”), is deemed not representative of the fair value of such security, the Fund uses the fair value of the investment determined in accordance with the procedures described below. There can be no assurance that the Fund could obtain the fair value assigned to an investment if it sold the investment at approximately the time at which the Fund determines its NAV per share, and the actual value obtained could be materially different.
Fair Valuation Procedures
The Trustees have ultimate responsibility for determining the fair value of investments for which market quotations are not readily available. The Trustees have appointed a Valuation Committee comprised of officers of the Fund, Federated MDTA LLC (the “Adviser”), and certain of the Adviser’s affiliated companies to assist in determining fair value and in overseeing the calculation of the NAV. The Trustees have also authorized the use of pricing services recommended by the Valuation Committee to provide fair value evaluations of the current value of certain investments for purposes of calculating the NAV. The Valuation Committee employs various methods for reviewing third-party pricing-service evaluations including periodic reviews of third-party pricing services’ policies, procedures and valuation methods (including key inputs, methods, models and assumptions), transactional back-testing, comparisons of evaluations of different pricing services, and review of price challenges by the Adviser based on recent market activity. In the event that market quotations and price evaluations are not available for an investment, the Valuation Committee determines the fair value of the investment in accordance with procedures adopted by the Trustees. The Trustees periodically review and approve the fair valuations made by the Valuation Committee and any changes made to the procedures.
Annual Shareholder Report
Factors considered by pricing services in evaluating an investment include the yields or prices of investments of comparable quality, coupon, maturity, call rights and other potential prepayments, terms and type, reported transactions, indications as to values from dealers and general market conditions. Some pricing services provide a single price evaluation reflecting the bid-side of the market for an investment (a “bid” evaluation). Other pricing services offer both bid evaluations and price evaluations indicative of a price between the prices bid and asked for the investment (a “mid” evaluation). The Fund normally uses bid evaluations for any U.S. Treasury and Agency securities, mortgage-backed securities and municipal securities. The Fund normally uses mid evaluations for any other types of fixed-income securities and any OTC derivative contracts. In the event that market quotations and price evaluations are not available for an investment, the fair value of the investment is determined in accordance with procedures adopted by the Trustees.
Repurchase Agreements
The Fund may invest in repurchase agreements for short-term liquidity purposes. It is the policy of the Fund to require the other party to a repurchase agreement to transfer to the Fund’s custodian or sub-custodian eligible securities or cash with a market value (after transaction costs) at least equal to the repurchase price to be paid under the repurchase agreement. The eligible securities are transferred to accounts with the custodian or sub-custodian in which the Fund holds a “securities entitlement” and exercises “control” as those terms are defined in the Uniform Commercial Code. The Fund has established procedures for monitoring the market value of the transferred securities and requiring the transfer of additional eligible securities if necessary to equal at least the repurchase price. These procedures also allow the other party to require securities to be transferred from the account to the extent that their market value exceeds the repurchase price or in exchange for other eligible securities of equivalent market value.
The insolvency of the other party or other failure to repurchase the securities may delay the disposition of the underlying securities or cause the Fund to receive less than the full repurchase price. Under the terms of the repurchase agreement, any amounts received by the Fund in excess of the repurchase price and related transaction costs must be remitted to the other party.
The Fund may enter into repurchase agreements in which eligible securities are transferred into joint trading accounts maintained by the custodian or sub-custodian for investment companies and other clients advised by the Fund’s Adviser and its affiliates. The Fund will participate on a pro rata basis with the other investment companies and clients in its share of the securities transferred under such repurchase agreements and in its share of proceeds from any repurchase or other disposition of such securities.
Annual Shareholder Report
Investment Income, Gains and Losses, Expenses and Distributions
Investment transactions are accounted for on a trade-date basis. Realized gains and losses from investment transactions are recorded on an identified-cost basis. Interest income and expenses are accrued daily. Dividend income and distributions to shareholders are recorded on the ex-dividend date. Foreign dividends are recorded on the ex-dividend date or when the Fund is informed of the ex-dividend date. Distributions of net investment income, if any, are declared and paid annually. Non-cash dividends included in dividend income, if any, are recorded at fair value. Amortization/accretion of premium and discount is included in investment income. Investment income, realized and unrealized gains and losses, and certain fund-level expenses are allocated to each class based on relative average daily net assets, except that select classes will bear certain expenses unique to those classes. The detail of the total fund expense waiver and reimbursements of $517,001 is disclosed in Note 5.
Dividends are declared separately for each class. No class has preferential dividend rights; differences in per share dividend rates are generally due to differences in separate class expenses.
Other Service Fees
The Fund may pay other service fees up to 0.25% of the average daily net assets of the Fund’s Class A Shares, Class B Shares and Class C Shares to unaffiliated financial intermediaries or to Federated Shareholder Services Company (FSSC) for providing services to shareholders and maintaining shareholder accounts. Subject to the terms described in the Expense Limitation note, FSSC may voluntarily reimburse the Fund for other service fees. For the year ended July 31, 2020, other service fees for the Fund were as follows:
| | Other Service
Fees Incurred |
| Class A Shares | $190,191 |
| Class B Shares | 26,901 |
| Class C Shares | 31,196 |
| TOTAL | $248,288 |
Federal Taxes
It is the Fund’s policy to comply with the Subchapter M provision of the Internal Revenue Code and to distribute to shareholders each year substantially all of its income. Accordingly, no provision for federal income tax is necessary. As of and during the year ended July 31, 2020, the Fund did not have a liability for any uncertain tax positions. The Fund recognizes interest and penalties, if any, related to tax liabilities as income tax expense in the Statement of Operations. As of July 31, 2020, tax years 2017 through 2020 remain subject to examination by the Fund’s major tax jurisdictions, which include the United States of America and the Commonwealth of Massachusetts.
Annual Shareholder Report
When-Issued and Delayed-Delivery Transactions
The Fund may engage in when-issued or delayed-delivery transactions. The Fund records when-issued securities on the trade date and maintains security positions such that sufficient liquid assets will be available to make payment for the securities purchased. Securities purchased on a when-issued or delayed-delivery basis are marked to market daily and begin earning interest on the settlement date. Losses may occur on these transactions due to changes in market conditions or the failure of counterparties to perform under the contract.
Securities Lending
The Fund participates in a securities lending program providing for the lending of equity securities to qualified brokers. The term of the loans within the program is one year or less. The Fund normally receives cash collateral for securities loaned that may be invested in affiliated money market funds, other money market instruments and/or repurchase agreements. Investments in money market funds may include funds with a “floating” NAV that can impose redemption fees and liquidity gates, impose certain operational impediments to investing cash collateral, and, if the investee fund’s NAV decreases, result in the Fund recognizing losses and being required to cover the decrease in the value of the cash collateral. Collateral is maintained at a minimum level of 100% of the market value of investments loaned, plus interest, if applicable. In accordance with the Fund’s securities lending agreement, the market value of securities on loan is determined each day at the close of business and any additional collateral required to cover the value of securities on loan is delivered to the Fund on the next business day. Earnings on collateral are allocated between the borrower of the security, the securities lending agent, as a fee for its services under the program and the Fund, according to agreed-upon rates. The Fund will not have the right to vote on securities while they are on loan. However, the Fund will attempt to terminate a loan in an effort to reacquire the securities in time to vote on matters that are deemed to be material by the Adviser. There can be no assurance that the Fund will have sufficient notice of such matters to be able to terminate the loan in time to vote thereon.
Securities lending transactions are subject to Master Netting Agreements which are agreements between the Fund and its counterparties that provide for the net settlement of all transactions and collateral with the Fund, through a single payment, in the event of default or termination. Amounts presented on the Portfolio of Investments and Statement of Assets and Liabilities are not net settlement amounts but gross. As indicated below, the cash collateral received by the Fund exceeds the market value of the securities loaned reducing the net settlement amount to zero. The chart below identifies the amount of collateral received as well as the market value of securities on loan. Additionally, the securities lending agreement executed by the Fund includes an indemnification clause. This clause stipulates that the borrower will reimburse the Fund for any losses as a result of any failure of the borrower to return equivalent securities to the Fund.
Annual Shareholder Report
As of July 31, 2020, securities subject to this type of arrangement and related collateral were as follows:
Market Value of
Securities Loaned | Collateral
Received |
| $574,921 | $640,284 |
Other
The preparation of financial statements in conformity with GAAP requires management to make estimates and assumptions that affect the amounts of assets, liabilities, expenses and revenues reported in the financial statements. Actual results could differ materially from those estimated. The Fund applies investment company accounting and reporting guidance.
3. SHARES OF BENEFICIAL INTEREST
The following tables summarize share activity:
| Year Ended July 31 | 2020 | 2019 |
| Class A Shares: | Shares | Amount | Shares | Amount |
| Shares sold | 448,019 | $9,256,462 | 656,472 | $13,105,404 |
| Proceeds from shares issued in connection with the tax-free transfer of assets from the Acquired Fund | 703,729 | 14,926,094 | — | — |
| Shares issued to shareholders in payment of distributions declared | 185,136 | 3,734,190 | 287,970 | 4,964,605 |
| Shares redeemed | (836,434) | (17,393,596) | (573,201) | (11,287,981) |
NET CHANGE RESULTING FROM
CLASS A SHARE TRANSACTIONS | 500,450 | $10,523,150 | 371,241 | $6,782,028 |
| Year Ended July 31 | 2020 | 2019 |
| Class B Shares: | Shares | Amount | Shares | Amount |
| Shares sold | 18,918 | $376,860 | 15,474 | $275,427 |
| Shares issued to shareholders in payment of distributions declared | 38,249 | 685,430 | 81,777 | 1,269,989 |
| Shares redeemed | (296,608) | (5,312,408) | (186,625) | (3,266,416) |
NET CHANGE RESULTING FROM
CLASS B SHARE TRANSACTIONS | (239,441) | $(4,250,118) | (89,374) | $(1,721,000) |
Annual Shareholder Report
| Year Ended July 31 | 2020 | 2019 |
| Class C Shares: | Shares | Amount | Shares | Amount |
| Shares sold | 137,996 | $2,411,329 | 287,106 | $4,940,359 |
| Proceeds from shares issued in connection with the tax-free transfer of assets from the Acquired Fund | 18,359 | 337,996 | — | — |
| Shares issued to shareholders in payment of distributions declared | 43,943 | 762,414 | 64,160 | 966,884 |
| Shares redeemed | (209,547) | (3,655,507) | (245,939) | (4,453,354) |
NET CHANGE RESULTING FROM
CLASS C SHARE TRANSACTIONS | (9,249) | $(143,768) | 105,327 | $1,453,889 |
| Year Ended July 31 | 2020 | 2019 |
| Institutional Shares: | Shares | Amount | Shares | Amount |
| Shares sold | 609,210 | $13,376,449 | 1,564,212 | $32,466,763 |
| Proceeds from shares issued in connection with the tax-free transfer of assets from the Acquired Fund | 3,883,108 | 86,476,809 | — | — |
| Shares issued to shareholders in payment of distributions declared | 174,603 | 3,706,825 | 103,408 | 1,867,555 |
| Shares redeemed | (2,950,847) | (65,756,074) | (524,974) | (10,747,907) |
| NET CHANGE RESULTING FROM INSTITUTIONAL SHARE TRANSACTIONS | 1,716,074 | $37,804,009 | 1,142,646 | $23,586,411 |
NET CHANGE RESULTING FROM
TOTAL FUND SHARE TRANSACTIONS | 1,967,834 | $43,933,273 | 1,529,840 | $30,101,328 |
4. FEDERAL TAX INFORMATION
The accounting treatment of certain items in accordance with income tax regulations may differ from the accounting treatment in accordance with GAAP which may result in permanent differences. In the case of the Fund, such differences primarily result from a Fair Fund litigation payment and open wash sale deferrals on an Acquired Fund.
For the year ended July 31, 2020, permanent differences identified and reclassified among the components of net assets were as follows:
| Increase (Decrease) |
| Paid-In Capital | Total Distributable
Earnings (Loss) |
| $22,572 | $(22,572) |
Annual Shareholder Report
Net assets were not affected by this reclassification.
The tax character of distributions as reported on the Statement of Changes in Net Assets for the years ended July 31, 2020 and 2019, was as follows:
| | 2020 | 2019 |
| Ordinary income1 | $3,443,870 | $5,514,491 |
| Long-term capital gains | $5,979,568 | $4,121,674 |
| 1 | For tax purposes, short-term capital gain distributions are considered ordinary income distributions. |
As of July 31, 2020, the components of distributable earnings on a tax-basis were as follows:
| Undistributed ordinary income2 | $9,003,465 |
| Net unrealized appreciation | $62,930,784 |
| Undistributed long-term capital gains | $4,406,557 |
| 2 | For tax purposes, short term capital gains are considered ordinary income in determining distributable earnings. |
The difference between book-basis and tax-basis net unrealized appreciation is attributable to differing treatments for the deferral of losses on wash sales.
At July 31, 2020, the cost of investments for federal tax purposes was $146,041,969. The net unrealized appreciation of investments for federal tax purposes was $62,930,784. This consists of net unrealized appreciation from investments for those securities having an excess of value over cost of $63,843,135 and net unrealized depreciation from investments for those securities having an excess of cost over value of $912,351.
5. INVESTMENT ADVISER FEE AND OTHER TRANSACTIONS WITH AFFILIATES
Investment Adviser Fee
The advisory agreement between the Fund and the Adviser provides for an annual fee equal to 0.75% of the Fund’s average daily net assets. Subject to the terms described in the Expense Limitation note, the Adviser may voluntarily choose to waive any portion of its fee. For the year ended July 31, 2020, the Adviser voluntarily waived $514,604 of its fee. The Adviser has agreed to reimburse the Fund for certain investment adviser fees as a result of transactions in other affiliated investment companies. For the year ended July 31, 2020, the Adviser reimbursed $2,397.
Annual Shareholder Report
Administrative Fee
Federated Administrative Services (FAS), under the Administrative Services Agreement, provides the Fund with administrative personnel and services. For purposes of determining the appropriate rate breakpoint, “Investment Complex” is defined as all of the Federated Hermes Funds subject to a fee under the Administrative Services Agreement. The fee paid to FAS is based on the average daily net assets of the Investment Complex as specified below:
| Administrative Fee | Average Daily Net Assets
of the Investment Complex |
| 0.100% | on assets up to $50 billion |
| 0.075% | on assets over $50 billion |
Subject to the terms described in the Expense Limitation note, FAS may voluntarily choose to waive any portion of its fee. For the year ended July 31, 2020, the annualized fee paid to FAS was 0.079% of average daily net assets of the Fund.
In addition, FAS may charge certain out-of-pocket expenses to the Fund.
Distribution Services Fee
The Fund has adopted a Distribution Plan (the “Plan”) pursuant to Rule 12b-1 under the Act. Under the terms of the Plan, the Fund will compensate Federated Securities Corp. (FSC), the principal distributor, from the daily net assets of the Fund’s Class A Shares, Class B Shares and Class C Shares to finance activities intended to result in the sale of these shares. The Plan provides that the Fund may incur distribution expenses at the following percentages of average daily net assets annually, to compensate FSC:
| | Percentage of Average Daily
Net Assets of Class |
| Class A Shares | 0.05% |
| Class B Shares | 0.75% |
| Class C Shares | 0.75% |
Subject to the terms described in the Expense Limitation note, FSC may voluntarily choose to waive any portion of its fee. For the year ended July 31, 2020, distribution services fees for the Fund were as follows:
| | Distribution Services
Fees Incurred |
| Class B Shares | $80,703 |
| Class C Shares | 93,589 |
| TOTAL | $174,292 |
Annual Shareholder Report
When FSC receives fees, it may pay some or all of them to financial intermediaries whose customers purchase shares. For the year ended July 31, 2020, FSC retained $99,835 of fees paid by the Fund. For the year ended July 31, 2020, the Fund’s Class A Shares did not incur a distribution services fee; however, it may begin to incur this fee upon approval of the Trustees.
Other Service Fees
For the year ended July 31, 2020, FSSC received $43,864 of the other service fees disclosed in Note 2.
Sales Charges
Front-end sales charges and contingent deferred sales charges (CDSC) do not represent expenses of the Fund. They are deducted from the proceeds of sales of Fund shares prior to investment or from redemption proceeds prior to remittance, as applicable. For the year ended July 31, 2020, FSC retained $11,143 in sales charges from the sale of Class A Shares. FSC also retained $62,171 and $1,079 of CDSC relating to redemptions of Class B Shares and Class C Shares, respectively.
Expense Limitation
The Adviser and certain of its affiliates (which may include FSC, FAS and FSSC) on their own initiative have agreed to waive certain amounts of their respective fees and/or reimburse expenses. Total annual fund operating expenses (as shown in the financial highlights, excluding interest expenses, extraordinary expenses and proxy-related expenses paid by the Fund, if any) paid by the Fund’s Class A Shares, Class B Shares, Class C Shares and Institutional Shares (after the voluntary waivers and/or reimbursements) will not exceed 0.99%, 1.74%, 1.74% and 0.74% (the “Fee Limit”), respectively, up to but not including the later of (the “Termination Date”): (a) October 1, 2021; or (b) the date of the Fund’s next effective Prospectus. Prior to November 18, 2019, the Fee Limits disclosed above for the referenced share classes were 1.51%, 2.26%, 2.26% and 1.26%, respectively. While the Adviser and its applicable affiliates currently do not anticipate terminating or increasing these arrangements prior to the Termination Date, these arrangements may only be terminated or the Fee Limit increased prior to the Termination Date with the agreement of the Trustees.
Directors’/Trustees’ and Miscellaneous Fees
Certain Officers and Trustees of the Fund are Officers and Directors or Trustees of certain of the above companies. To efficiently facilitate payment, Independent Directors’/Trustees’ fees and certain expenses related to conducting meetings of the Directors/Trustees and other miscellaneous expenses are paid by an affiliate of the Adviser which in due course are reimbursed by the Fund. These expenses related to conducting meetings of the Directors/Trustees and other miscellaneous expenses may be included in Accrued and Miscellaneous Expenses on the Statement of Assets and Liabilities and Statement of Operations, respectively.
Annual Shareholder Report
6. INVESTMENT TRANSACTIONS
Purchases and sales of investments, excluding long-term U.S. government securities and short-term obligations, for the year ended July 31, 2020, were as follows:
| Purchases | $378,780,781 |
| Sales | $355,478,074 |
7. CONCENTRATION OF RISK
The Fund may invest a portion of its assets in securities of companies that are deemed by the Fund’s management to be classified in similar business sectors. Economic developments may have an effect on the liquidity and volatility of the portfolio securities.
8. LINE OF CREDIT
The Fund participates with certain other Federated Hermes Funds, on a several basis, in an up to $500,000,000 unsecured, 364-day, committed, revolving line of credit (LOC) agreement. The LOC was made available to temporarily finance the repurchase or redemption of shares of the Fund, failed trades, payment of dividends, settlement of trades and for other short-term, temporary or emergency general business purposes. The Fund cannot borrow under the LOC if an inter-fund loan is outstanding. The Fund’s ability to borrow under the LOC also is subject to the limitations of the Act and various conditions precedent that must be satisfied before the Fund can borrow. Loans under the LOC are charged interest at a fluctuating rate per annum equal to the highest, on any day, of (a) (i) the federal funds effective rate, (ii) the one month London Interbank Offered Rate (LIBOR), or a replacement rate as appropriate, and (iii) 0.0%, plus (b) a margin. Any fund eligible to borrow under the LOC pays its pro rata share of an upfront fee, and its pro rata share of a commitment fee based on the amount of the lenders’ commitment that has not been utilized, quarterly in arrears and at maturity. As of July 31, 2020, the Fund had no outstanding loans. During the year ended July 31, 2020, the Fund did not utilize the LOC.
9. INTERFUND LENDING
Pursuant to an Exemptive Order issued by the SEC, the Fund, along with other funds advised by subsidiaries of Federated Hermes, Inc., may participate in an interfund lending program. This program provides an alternative credit facility allowing the Fund to borrow from other participating affiliated funds. As of July 31, 2020, there were no outstanding loans. During the year ended July 31, 2020, the program was not utilized.
Annual Shareholder Report
10. OTHER MATTERS
An outbreak of respiratory disease caused by a novel coronavirus was first detected in China in December 2019 and subsequently spread globally. As of the date of the issuance of these financial statements, this coronavirus has resulted in closing borders, enhanced health screenings, healthcare service preparation and delivery, quarantines, cancellations, and disruptions to supply chains, workflow operations and consumer activity, as well as general concern and uncertainty. The impact of this coronavirus may be short-term or may last for an extended period of time and has resulted in a substantial economic downturn. Health crises caused by outbreaks, such as the coronavirus outbreak, may exacerbate other pre-existing political, social and economic risks. The impact of this outbreak, and other epidemics and pandemics that may arise in the future, could continue to negatively affect the worldwide economy, as well as the economies of individual countries, individual companies (including certain Fund service providers and issuers of the Fund’s investments) and the markets in general in significant and unforeseen ways. Any such impact could adversely affect the Fund’s performance.
11. FEDERAL TAX INFORMATION (UNAUDITED)
For the fiscal year ended July 31, 2020, the amount of long-term capital gains designated by the Fund was $5,979,568.
For the fiscal year ended July 31, 2020, 37.03% of total ordinary income (including short-term capital gain) distributions made by the Fund are qualifying dividends which may be subject to a maximum tax rate of 15%, as provided for by the Jobs and Growth Tax Relief Act of 2003. Complete information is reported in conjunction with the reporting of your distributions on Form 1099-DIV.
Of the ordinary income (including short-term capital gain) distributions made by the Fund during the year ended July 31, 2020, 36.60% qualify for the dividend received deduction available to corporate shareholders.
Annual Shareholder Report
Report of Independent Registered Public Accounting Firm
TO THE BOARD OF TRUSTEES OF FEDERATED HERMES MDT SERIES AND SHAREHOLDERS OF FEDERATED HERMES MDT LARGE CAP GROWTH FUND:
Opinion on the Financial Statements
We have audited the accompanying statement of assets and liabilities of Federated Hermes MDT Large Cap Growth Fund (formerly, Federated MDT Large Cap Growth Fund) (the “Fund”) (one of the portfolios constituting Federated Hermes MDT Series (formerly, Federated MDT Series ) (the “Trust”)), including the portfolio of investments, as of July 31, 2020, and the related statement of operations for the year then ended, the statement of changes in net assets for each of the two years in the period then ended, the financial highlights for each of the five years in the period then ended and the related notes (collectively referred to as the “financial statements”). In our opinion, the financial statements present fairly, in all material respects, the financial position of the Fund (one of the funds constituting Federated Hermes MDT Series) at July 31, 2020, the results of its operations for the year then ended, the changes in its net assets for each of the two years in the period then ended and its financial highlights for each of the five years in the period then ended, in conformity with U.S. generally accepted accounting principles.
Basis for Opinion
These financial statements are the responsibility of the Trust’s management. Our responsibility is to express an opinion on the Fund’s financial statements based on our audits. We are a public accounting firm registered with the Public Company Accounting Oversight Board (United States) (“PCAOB”) and are required to be independent with respect to the Trust in accordance with the U.S. federal securities laws and the applicable rules and regulations of the Securities and Exchange Commission and the PCAOB.
We conducted our audits in accordance with standards of the PCAOB. Those standards require that we plan and perform the audit to obtain reasonable assurance about whether the financial statements and financial highlights are free of material misstatement, whether due to error or fraud. The Trust is not required to have, nor were we engaged to perform, an audit of the Trust’s internal control over financial reporting. As part of our audits, we are required to obtain an understanding of internal control over financial reporting, but not for the purpose of expressing an opinion on the effectiveness of the Trust’s internal control over financial reporting. Accordingly, we express no such opinion.
Our audits included performing procedures to assess the risks of material misstatement of the financial statements, whether due to error or fraud, and performing procedures that respond to those risks. Such procedures included examining, on a test basis, evidence regarding the amounts and disclosures in the financial statements. Our procedures included confirmation of securities
Annual Shareholder Report
owned as of July 31, 2020, by correspondence with the custodian and others or by other appropriate auditing procedures where replies from others were not received. Our audits also included evaluating the accounting principles used and significant estimates made by management, as well as evaluating the overall presentation of the financial statements. We believe that our audits provide a reasonable basis for our opinion.
We have served as the auditor of one or more Federated Hermes investment companies since 1979.
Boston, Massachusetts
September 22, 2020
Annual Shareholder Report
Shareholder Expense Example (unaudited)
As a shareholder of the Fund, you incur two types of costs: (1) transaction costs, including sales charges (loads) on purchase or redemption payments; and (2) ongoing costs, including management fees and to the extent applicable, distribution (12b-1) fees and/or other service fees and other Fund expenses. This Example is intended to help you to understand your ongoing costs (in dollars) of investing in the Fund and to compare these costs with the ongoing costs of investing in other mutual funds. It is based on an investment of $1,000 invested at the beginning of the period and held for the entire period from February 1, 2020 to July 31, 2020.
ACTUAL EXPENSES
The first section of the table below provides information about actual account values and actual expenses. You may use the information in this section, together with the amount you invested, to estimate the expenses that you incurred over the period. Simply divide your account value by $1,000 (for example, an $8,600 account value divided by $1,000 = 8.6), then multiply the result by the number in the first section under the heading entitled “Expenses Paid During Period” to estimate the expenses attributable to your investment during this period.
HYPOTHETICAL EXAMPLE FOR COMPARISON PURPOSES
The second section of the table below provides information about hypothetical account values and hypothetical expenses based on the Fund’s actual expense ratio and an assumed rate of return of 5% per year before expenses, which is not the Fund’s actual return. Thus, you should not use the hypothetical account values and expenses to estimate the actual ending account balance or your expenses for the period. Rather, these figures are required to be provided to enable you to compare the ongoing costs of investing in the Fund with other funds. To do so, compare this 5% hypothetical example with the 5% hypothetical examples that appear in the shareholder reports of the other funds.
Annual Shareholder Report
Please note that the expenses shown in the table are meant to highlight your ongoing costs only and do not reflect any transaction costs, such as sales charges (loads) on purchase or redemption payments. Therefore, the second section of the table is useful in comparing ongoing costs only, and will not help you determine the relative total costs of owning different funds. In addition, if these transaction costs were included, your costs would have been higher.
| | Beginning
Account Value
2/1/2020 | Ending
Account Value
7/31/2020 | Expenses Paid
During Period1 |
| Actual: | | | |
| Class A Shares | $1,000 | $1,174.60 | $5.35 |
| Class B Shares | $1,000 | $1,170.30 | $9.39 |
| Class C Shares | $1,000 | $1,170.40 | $9.39 |
| Institutional Shares | $1,000 | $1,176.00 | $4.00 |
Hypothetical (assuming a 5% return
before expenses): | | | |
| Class A Shares | $1,000 | $1,020.00 | $4.97 |
| Class B Shares | $1,000 | $1,016.20 | $8.72 |
| Class C Shares | $1,000 | $1,016.20 | $8.72 |
| Institutional Shares | $1,000 | $1,021.20 | $3.72 |
| 1 | Expenses are equal to the Fund’s annualized net expense ratios, multiplied by the average account value over the period, multiplied by 182/366 (to reflect the one-half-year period). The annualized net expense ratios are as follows: |
| | |
| Class A Shares | 0.99% |
| Class B Shares | 1.74% |
| Class C Shares | 1.75% |
| Institutional Shares | 0.74% |
Annual Shareholder Report
Board of Trustees and Trust Officers
The Board of Trustees is responsible for managing the Trust’s business affairs and for exercising all the Trust’s powers except those reserved for the shareholders. The following tables give information about each Trustee and the senior officers of the Fund. Where required, the tables separately list Trustees who are “interested persons” of the Fund (i.e., “Interested” Trustees) and those who are not (i.e., “Independent” Trustees). Unless otherwise noted, the address of each person listed is 1001 Liberty Avenue, Pittsburgh, PA 15222. The address of all Independent Trustees listed is 4000 Ericsson Drive, Warrendale, PA 15086-7561; Attention: Mutual Fund Board. As of December 31, 2019, the Trust comprised five portfolio(s), and the Federated Hermes Fund Family consisted of 41 investment companies (comprising 135 portfolios). Unless otherwise noted, each Officer is elected annually. Unless otherwise noted, each Trustee oversees all portfolios in the Federated Hermes Fund Family and serves for an indefinite term. The Fund’s Statement of Additional Information includes additional information about Trust Trustees and is available, without charge and upon request, by calling 1-800-341-7400.
Interested TRUSTEES Background
Name
Birth Date
Positions Held with Trust
Date Service Began | Principal Occupation(s) for Past Five Years,
Other Directorships Held and Previous Position(s) |
J. Christopher Donahue*
Birth Date: April 11, 1949
President and Trustee
Indefinite Term
Began serving: May 2006 | Principal Occupations: Principal Executive Officer and President of certain of the Funds in the Federated Hermes Fund Family; Director or Trustee of the Funds in the Federated Hermes Fund Family; President, Chief Executive Officer and Director, Federated Hermes, Inc.; Chairman and Trustee, Federated Investment Management Company; Trustee, Federated Investment Counseling; Chairman and Director, Federated Global Investment Management Corp.; Chairman and Trustee, Federated Equity Management Company of Pennsylvania; Trustee, Federated Shareholder Services Company; Director, Federated Services Company.
Previous Positions: President, Federated Investment Counseling; President and Chief Executive Officer, Federated Investment Management Company, Federated Global Investment Management Corp. and Passport Research, Ltd; Chairman, Passport Research, Ltd. |
Annual Shareholder Report
Name
Birth Date
Positions Held with Trust
Date Service Began | Principal Occupation(s) for Past Five Years,
Other Directorships Held and Previous Position(s) |
John B. Fisher*
Birth Date: May 16, 1956
Trustee
Indefinite Term
Began serving: May 2016 | Principal Occupations: Principal Executive Officer and President of certain of the Funds in the Federated Hermes Fund Family; Director or Trustee of certain of the Funds in the Federated Hermes Fund Family; Vice President, Federated Hermes, Inc.; President, Director/Trustee and CEO, Federated Advisory Services Company, Federated Equity Management Company of Pennsylvania, Federated Global Investment Management Corp., Federated Investment Counseling, Federated Investment Management Company; President of some of the Funds in the Federated Hermes Fund Family and Director, Federated Investors Trust Company.
Previous Positions: President and Director of the Institutional Sales Division of Federated Securities Corp.; President and Director of Federated Investment Counseling; President and CEO of Passport Research, Ltd.; Director, Edgewood Securities Corp.; Director, Federated Services Company; Director, Federated Hermes, Inc.; Chairman and Director, Southpointe Distribution Services, Inc. and President, Technology, Federated Services Company. |
| * | Reasons for “interested” status: J. Christopher Donahue and John B. Fisher are interested due to their beneficial ownership of shares of Federated Hermes, Inc. and due to positions they hold with Federated Hermes, Inc. and its subsidiaries. |
INDEPENDENT TRUSTEES Background
Name
Birth Date
Positions Held with Trust
Date Service Began | Principal Occupation(s) for Past Five Years,
Other Directorships Held, Previous Position(s) and Qualifications |
John T. Collins
Birth Date: January 24, 1947
Trustee
Indefinite Term
Began serving:
October 2013 | Principal Occupations: Director or Trustee of the Federated Hermes Fund Family; formerly, Chairman and CEO, The Collins Group, Inc. (a private equity firm) (Retired).
Other Directorships Held: Chairman of the Board of Directors, Director, and Chairman of the Compensation Committee, KLX Energy Services Holdings, Inc. (oilfield services); former Director of KLX Corp. (aerospace).
Qualifications: Mr. Collins has served in several business and financial management roles and directorship positions throughout his career. Mr. Collins previously served as Chairman and CEO of The Collins Group, Inc. (a private equity firm) and as a Director of KLX Corp. Mr. Collins serves as Chairman Emeriti, Bentley University. Mr. Collins previously served as Director and Audit Committee Member, Bank of America Corp.; Director, FleetBoston Financial Corp.; and Director, Beth Israel Deaconess Medical Center (Harvard University Affiliate Hospital). |
Annual Shareholder Report
Name
Birth Date
Positions Held with Trust
Date Service Began | Principal Occupation(s) for Past Five Years,
Other Directorships Held, Previous Position(s) and Qualifications |
G. Thomas Hough
Birth Date: February 28, 1955
Trustee
Indefinite Term
Began serving: August 2015 | Principal Occupations: Director or Trustee, Chair of the Audit Committee of the Federated Hermes Fund Family; formerly, Vice Chair, Ernst & Young LLP (public accounting firm) (Retired).
Other Directorships Held: Director, Chair of the Audit Committee, Equifax, Inc.; Director, Member of the Audit Committee, Haverty Furniture Companies, Inc.; formerly, Director, Member of Governance and Compensation Committees, Publix Super Markets, Inc.
Qualifications: Mr. Hough has served in accounting, business management and directorship positions throughout his career. Mr. Hough most recently held the position of Americas Vice Chair of Assurance with Ernst & Young LLP (public accounting firm). Mr. Hough serves on the President’s Cabinet and Business School Board of Visitors for the University of Alabama. Mr. Hough previously served on the Business School Board of Visitors for Wake Forest University, and he previously served as an Executive Committee member of the United States Golf Association. |
Maureen Lally-Green
Birth Date: July 5, 1949
Trustee
Indefinite Term
Began serving: August 2009 | Principal Occupations: Director or Trustee of the Federated Hermes Fund Family; Adjunct Professor of Law, Duquesne University School of Law; formerly, Dean of the Duquesne University School of Law and Professor of Law and Interim Dean of the Duquesne University School of Law; formerly, Associate General Secretary and Director, Office of Church Relations, Diocese of Pittsburgh.
Other Directorships Held: Director, CNX Resources Corporation (formerly known as CONSOL Energy Inc.).
Qualifications: Judge Lally-Green has served in various legal and business roles and directorship positions throughout her career. Judge Lally-Green previously held the position of Dean of the School of Law of Duquesne University (as well as Interim Dean). Judge Lally-Green previously served as a member of the Superior Court of Pennsylvania and as a Professor of Law, Duquesne University School of Law. Judge Lally-Green was appointed by the Supreme Court of Pennsylvania to serve on the Supreme Court’s Board of Continuing Judicial Education and the Supreme Court’s Appellate Court Procedural Rules Committee. Judge Lally-Green also currently holds the positions on not for profit or for profit boards of directors as follows: Director and Chair, UPMC Mercy Hospital; Director and Vice Chair, Our Campaign for the Church Alive!, Inc.; Regent, Saint Vincent Seminary; Member, Pennsylvania State Board of Education (public); Director, Catholic Charities, Pittsburgh; and Director CNX Resources Corporation (formerly known as CONSOL Energy Inc.). Judge Lally-Green has held the positions of: Director, Auberle; Director, Epilepsy Foundation of Western and Central Pennsylvania; Director, Ireland Institute of Pittsburgh; Director, Saint Thomas More Society; Director and Chair, Catholic High Schools of the Diocese of Pittsburgh, Inc.; Director, Pennsylvania Bar Institute; Director, St. Vincent College; and Director and Chair, North Catholic High School, Inc. |
Annual Shareholder Report
Name
Birth Date
Positions Held with Trust
Date Service Began | Principal Occupation(s) for Past Five Years,
Other Directorships Held, Previous Position(s) and Qualifications |
Charles F. Mansfield, Jr.
Birth Date: April 10, 1945
Trustee
Indefinite Term
Began serving: June 2006 | Principal Occupations: Director or Trustee of the Federated Hermes Fund Family; Management Consultant and Author.
Other Directorships Held: None.
Qualifications: Mr. Mansfield has served as a Marine Corps officer and in several banking, business management, educational roles and directorship positions throughout his long career. He remains active as a Management Consultant and Author. |
Thomas M. O’Neill
Birth Date: June 14, 1951
Trustee
Indefinite Term
Began serving: August 2006 | Principal Occupations: Director or Trustee of the Federated Hermes Fund Family; Sole Proprietor, Navigator Management Company (investment and strategic consulting).
Other Directorships Held: None.
Qualifications: Mr. O’Neill has served in several business, mutual fund and financial management roles and directorship positions throughout his career. Mr. O’Neill serves as Director, Medicines for Humanity and Director, The Golisano Children’s Museum of Naples, Florida. Mr. O’Neill previously served as Chief Executive Officer and President, Managing Director and Chief Investment Officer, Fleet Investment Advisors; President and Chief Executive Officer, Aeltus Investment Management, Inc.; General Partner, Hellman, Jordan Management Co., Boston, MA; Chief Investment Officer, The Putnam Companies, Boston, MA; Credit Analyst and Lending Officer, Fleet Bank; Director and Consultant, EZE Castle Software (investment order management software); and Director, Midway Pacific (lumber). |
P. Jerome Richey
Birth Date: February 23, 1949
Trustee
Indefinite Term
Began serving:
October 2013 | Principal Occupations: Director or Trustee of the Federated Hermes Fund Family; Management Consultant; Retired; formerly, Senior Vice Chancellor and Chief Legal Officer, University of Pittsburgh and Executive Vice President and Chief Legal Officer, CNX Resources Corporation (formerly known as CONSOL Energy Inc.).
Other Directorships Held: None.
Qualifications: Mr. Richey has served in several business and legal management roles and directorship positions throughout his career. Mr. Richey most recently held the positions of Senior Vice Chancellor and Chief Legal Officer, University of Pittsburgh. Mr. Richey previously served as Chairman of the Board, Epilepsy Foundation of Western Pennsylvania and Chairman of the Board, World Affairs Council of Pittsburgh. Mr. Richey previously served as Chief Legal Officer and Executive Vice President, CNX Resources Corporation (formerly known as CONSOL Energy Inc.); and Board Member, Ethics Counsel and Shareholder, Buchanan Ingersoll & Rooney PC (a law firm). |
Annual Shareholder Report
Name
Birth Date
Positions Held with Trust
Date Service Began | Principal Occupation(s) for Past Five Years,
Other Directorships Held, Previous Position(s) and Qualifications |
John S. Walsh
Birth Date:
November 28, 1957
Trustee
Indefinite Term
Began serving: June 2006 | Principal Occupations: Director or Trustee, and Chair of the Board of Directors or Trustees, of the Federated Hermes Fund Family; President and Director, Heat Wagon, Inc. (manufacturer of construction temporary heaters); President and Director, Manufacturers Products, Inc. (distributor of portable construction heaters); President, Portable Heater Parts, a division of Manufacturers Products, Inc.
Other Directorships Held: None.
Qualifications: Mr. Walsh has served in several business management roles and directorship positions throughout his career. Mr. Walsh previously served as Vice President, Walsh & Kelly, Inc. (paving contractors). |
OFFICERS
Name
Birth Date
Address
Positions Held with Trust
Date Service Began | Principal Occupation(s) for Past Five Years
and Previous Position(s) |
Lori A. Hensler
Birth Date: January 6, 1967
TREASURER
Officer since: April 2013 | Principal Occupations: Principal Financial Officer and Treasurer of the Federated Hermes Fund Family; Senior Vice President, Federated Administrative Services; Financial and Operations Principal for Federated Securities Corp. and Edgewood Services, Inc.; and Assistant Treasurer, Federated Investors Trust Company. Ms. Hensler has received the Certified Public Accountant designation.
Previous Positions: Controller of Federated Hermes, Inc.; Senior Vice President and Assistant Treasurer, Federated Investors Management Company; Treasurer, Federated Investors Trust Company; Assistant Treasurer, Federated Administrative Services, Federated Administrative Services, Inc., Federated Securities Corp., Edgewood Services, Inc., Federated Advisory Services Company, Federated Equity Management Company of Pennsylvania, Federated Global Investment Management Corp., Federated Investment Counseling, Federated Investment Management Company, Passport Research, Ltd., and Federated MDTA, LLC; Financial and Operations Principal for Federated Securities Corp., Edgewood Services, Inc. and Southpointe Distribution Services, Inc. |
Annual Shareholder Report
Name
Birth Date
Address
Positions Held with Trust
Date Service Began | Principal Occupation(s) for Past Five Years
and Previous Position(s) |
Peter J. Germain
Birth Date:
September 3, 1959
CHIEF LEGAL OFFICER, SECRETARY and EXECUTIVE VICE PRESIDENT
Officer since: June 2006 | Principal Occupations: Mr. Germain is Chief Legal Officer, Secretary and Executive Vice President of the Federated Hermes Fund Family. He is General Counsel, Chief Legal Officer, Secretary and Executive Vice President, Federated Hermes, Inc.; Trustee and Senior Vice President, Federated Investors Management Company; Trustee and President, Federated Administrative Services; Director and President, Federated Administrative Services, Inc.; Director and Vice President, Federated Securities Corp.; Director and Secretary, Federated Private Asset Management, Inc.; Secretary, Federated Shareholder Services Company; and Secretary, Retirement Plan Service Company of America. Mr. Germain joined Federated Hermes in 1984 and is a member of the Pennsylvania Bar Association.
Previous Positions: Deputy General Counsel, Special Counsel, Managing Director of Mutual Fund Services, Federated Hermes, Inc.; Senior Vice President, Federated Services Company; and Senior Corporate Counsel, Federated Hermes, Inc. |
Stephen F. Auth
Birth Date: September 13, 1956
101 Park Avenue
41st Floor
New York, NY 10178
CHIEF INVESTMENT OFFICER
Officer since: June 2012 | Principal Occupations: Stephen F. Auth is Chief Investment Officer of various Funds in the Federated Hermes Fund Family; Executive Vice President, Federated Investment Counseling, Federated Global Investment Management Corp. and Federated Equity Management Company of Pennsylvania.
Previous Positions: Executive Vice President, Federated Investment Management Company and Passport Research, Ltd. (investment advisory subsidiary of Federated); Senior Vice President, Global Portfolio Management Services Division; Senior Vice President, Federated Investment Management Company and Passport Research, Ltd.; Senior Managing Director and Portfolio Manager, Prudential Investments. |
Stephen Van Meter
Birth Date: June 5, 1975
CHIEF COMPLIANCE OFFICER AND SENIOR VICE PRESIDENT
Officer since: July 2015 | Principal Occupations: Senior Vice President and Chief Compliance Officer of the Federated Hermes Fund Family; Vice President and Chief Compliance Officer of Federated Hermes, Inc. and Chief Compliance Officer of certain of its subsidiaries. Mr. Van Meter joined Federated Hermes, Inc. in October 2011. He holds FINRA licenses under Series 3, 7, 24 and 66.
Previous Positions: Mr. Van Meter previously held the position of Compliance Operating Officer, Federated Hermes, Inc. Prior to joining Federated Hermes, Inc., Mr. Van Meter served at the United States Securities and Exchange Commission in the positions of Senior Counsel, Office of Chief Counsel, Division of Investment Management and Senior Counsel, Division of Enforcement. |
Annual Shareholder Report
Evaluation and Approval of Advisory Contract–May 2020
Federated MDT Large Cap Growth Fund (the “Fund”)
(EFFECTIVE CLOSE OF BUSINESS ON JUNE 26, 2020, THE FUND’S NAME CHANGED TO FEDERATED HERMES MDT LARGE CAP GROWTH FUND)
At its meetings in May 2020 (the “May Meetings”), the Fund’s Board of Trustees (the “Board”), including a majority of those Trustees who are not “interested persons” of the Fund, as defined in the Investment Company Act of 1940 (the “Independent Trustees”), reviewed and unanimously approved the continuation of the investment advisory contract between the Fund and Federated MDTA LLC (the “Adviser”) with respect to the Fund (the “Contract”) for an additional one-year term. The Board’s determination to approve the continuation of the Contract reflects the exercise of its business judgment after considering all of the information and factors believed to be relevant and appropriate on whether to continue the existing arrangements. The information, factors and conclusions that formed the basis for the Board’s approval are summarized below.
Information Received and Review Process
At the request of the Independent Trustees, the Fund’s Chief Compliance Officer (the “CCO”) furnished to the Board in advance of its May Meetings an independent written evaluation presenting on the topics discussed below. The Board considered the CCO’s independent written evaluation (the “CCO Fee Evaluation Report”), along with other information, in evaluating the reasonableness of the Fund’s management fee and in determining to approve the continuation of the Contract. The CCO, in preparing the CCO Fee Evaluation Report, has the authority to retain consultants, experts or staff as reasonably necessary to assist in the performance of his duties, reports directly to the Board, and can be terminated only with the approval of a majority of the Independent Trustees. At the request of the Independent Trustees, the CCO Fee Evaluation Report followed the same general approach and covered the same topics as that of the report that had previously been delivered by the CCO in his capacity as “Senior Officer,” prior to the elimination of the Senior Officer position in December 2017.
In addition to the extensive materials that comprise and accompany the CCO Fee Evaluation Report, in the months preceding the May Meetings, the Board requested and reviewed written responses and supporting materials prepared by the Adviser and its affiliates (collectively, “Federated Hermes”) in response to requests posed to Federated Hermes on behalf of the Independent Trustees encompassing a wide variety of topics. The Board also considered such additional matters as the Independent Trustees deemed reasonably necessary to evaluate the Contract, which included detailed information about the Fund and Federated Hermes furnished to the Board at its meetings throughout the year
Annual Shareholder Report
and in between regularly scheduled meetings on particular matters as the need arose, as well as information specifically prepared in connection with the approval of the continuation of the Contract that was presented at the May Meetings.
The Board’s consideration of the Contract included review of materials and information covering the following matters, among others: the Adviser’s investment philosophy, revenue, profitability, personnel and processes; investment and operating strategies; the Fund’s short-term and long-term performance (in absolute terms, both on a gross basis and net of expenses, and relative to the Fund’s particular investment program and a group of its peer funds and/or its benchmark, as appropriate) and comments on the reasons for the Fund’s performance; the Fund’s investment objectives; the Fund’s expenses, including the advisory fee and the overall expense structure of the Fund (both in absolute terms and relative to a group of its peer funds), with due regard for contractual or voluntary expense limitations (if any); the use and allocation of brokerage commissions derived from trading the Fund’s portfolio securities (if any); and the nature, quality and extent of the advisory and other services provided to the Fund by the Adviser and its affiliates. The Board also considered the preferences and expectations of Fund shareholders; the entrepreneurial and other risks assumed by the Adviser in sponsoring and managing the Fund; the continuing state of competition in the mutual fund industry and market practices; the range of comparable fees for similar funds in the mutual fund industry; the Fund’s relationship to the other funds advised by Federated Hermes (each, a “Federated Hermes Fund”), which include a comprehensive array of funds with different investment objectives, policies and strategies which are generally available for exchange without the incurrence of additional sales charges; compliance and audit reports concerning the Federated Hermes Funds and the Federated Hermes’ affiliates that service them (including communications from regulatory agencies), as well as Federated Hermes’ responses to any issues raised therein; and relevant developments in the mutual fund industry and how the Federated Hermes Funds and/or Federated Hermes may be responding to them. In addition, the Board received and considered information furnished by Federated Hermes on the impacts of the coronavirus (COVID-19) outbreak on Federated Hermes generally and the Fund in particular, including, among other information, the current and anticipated impacts on the management, operations and performance of the Fund. The Board noted that its evaluation process is evolutionary and that the criteria considered and the emphasis placed on relevant criteria may change in recognition of changing circumstances in the mutual fund marketplace.
The Board also considered judicial decisions concerning allegedly excessive investment advisory fees in determining to approve the Contract. Using these judicial decisions as a guide, the Board observed that the following factors may be relevant to an adviser’s fiduciary duty with respect to its receipt of
Annual Shareholder Report
compensation from a fund: (1) the nature and quality of the services provided by an adviser to a fund and its shareholders (including the performance of the fund, its benchmark, and comparable funds); (2) an adviser’s cost of providing the services (including the profitability to an adviser of providing advisory services to a fund); (3) the extent to which an adviser may realize “economies of scale” as a fund grows larger and, if such economies of scale exist, whether they have been shared with a fund and its shareholders or the family of funds; (4) any “fall-out” financial benefits that accrue to an adviser because of its relationship with a fund (including research services received from brokers that execute fund trades and any fees paid to affiliates of an adviser for services rendered to a fund); (5) comparative fee and expense structures (including a comparison of fees paid to an adviser with those paid by similar funds both internally and externally as well as management fees charged to institutional and other advisory clients of the adviser for what might be viewed as like services); and (6) the extent of care, conscientiousness and independence with which the fund’s board members perform their duties and their expertise (including whether they are fully informed about all facts the board deems relevant to its consideration of an adviser’s services and fees). The Board noted that the Securities and Exchange Commission (“SEC”) disclosure requirements regarding the basis for a fund board’s approval of the fund’s investment advisory contracts generally align with the factors listed above. The Board was aware of these factors and was guided by them in its review of the Contract to the extent it considered them to be appropriate and relevant, as discussed further below.
The Board considered and weighed these factors in light of its substantial accumulated experience in governing the Fund and working with Federated Hermes on matters relating to the Federated Hermes Funds. While individual members of the Board may have weighed certain factors differently, the Board’s determination to continue the Contract was based on a comprehensive consideration of all information provided to the Board throughout the year and specifically with respect to the continuation of the Contract. The Independent Trustees were assisted throughout the evaluation process by independent legal counsel. In connection with their deliberations at the May Meetings, the Independent Trustees met separately in executive session with their independent legal counsel and without management present to review the relevant materials and consider their responsibilities under applicable laws. In addition, senior management representatives of Federated Hermes also met with the Independent Trustees and their independent legal counsel to discuss the materials and presentations furnished to the Board at the May Meetings. The Board considered the approval of the Contract for the Fund as part of its consideration of agreements for funds across the Federated Hermes Funds family, but its approvals were made on a fund-by-fund basis.
Annual Shareholder Report
Nature, Extent and Quality of Services
The Board considered the nature, extent and quality of the services provided to the Fund by the Adviser and the resources of the Adviser and its affiliates dedicated to the Fund. In this regard, the Board evaluated, among other things, the Adviser’s personnel, experience and track record, as well as the financial resources and overall reputation of Federated Hermes and its willingness to invest in personnel and infrastructure that benefit the Federated Hermes Funds. The Board noted the significant acquisition of Hermes Fund Managers Limited by Federated Hermes in 2018, which has deepened the organization’s investment management expertise and capabilities and expanded the investment process for all of the Federated Hermes Funds to incorporate environmental, social and governance (“ESG”) factors and issuer engagement on ESG matters.
In addition, the Board reviewed the qualifications, backgrounds and responsibilities of the portfolio management team primarily responsible for the day-to-day management of the Fund and the Adviser’s ability and experience in attracting and retaining qualified personnel to service the Fund. The Board noted the compliance program of the Adviser and the compliance-related resources devoted by the Adviser and its affiliates in support of the Fund’s obligations pursuant to Rule 38a-1 under the Investment Company Act of 1940, including the Adviser’s commitment to respond to rulemaking and other regulatory initiatives of the SEC. such as the liquidity risk management program rules. In addition, the Board considered the response by the Adviser to recent market conditions and considered the overall performance of the Adviser in this context. The Fund’s ability to deliver competitive performance when compared to its Performance Peer Group (as defined below) was also deemed to be relevant by the Board as a useful indicator of how the Adviser is executing the Fund’s investment program. The Adviser’s ability to execute this program was one of the Board’s considerations in reaching a conclusion that the nature, extent and quality of the Adviser’s investment management and related services warrant the continuation of the Contract.
Fund Investment Performance
In evaluating the Fund’s investment performance, the Board considered performance results in light of the Fund’s investment objective, strategies and risks, as disclosed in the Fund’s prospectus. The Board also considered the Fund’s performance in light of the overall recent market conditions. The Board considered detailed investment reports on the Fund’s performance over different time periods that were provided to the Board throughout the year and in connection with the May Meetings and evaluated the Adviser’s analysis of the Fund’s performance for these time periods. The Board also reviewed comparative information regarding the performance of other mutual funds in the category of peer funds selected by Morningstar, Inc. (the “Morningstar”), an independent fund ranking organization (the “Performance Peer Group”), noting the CCO’s view that comparisons to fund peer groups may be helpful,
Annual Shareholder Report
though not conclusive, in evaluating the performance of the Adviser in managing the Fund. The Board considered, in evaluating such comparisons, that in some cases there may be differences in the funds’ investment objectives or investment management techniques, or the costs to implement funds, even within the same Performance Peer Group. In this connection, the Board considered that the Fund’s quantitative focus makes fee and expense comparisons particularly difficult as the funds in the Performance Peer Group varied widely in their complexity, and the management of the Fund is among the more complex relative to its Performance Peer Group.
For the periods ended December 31, 2019, the Fund’s performance for the three-year period was above the median of the relevant Performance Peer Group, and the Fund’s performance fell below the median of the relevant Performance Peer Group for the one-year and five-year periods. In addition, the Board was informed by the Adviser that, for the same periods, the Fund underperformed its benchmark index for the one-year, three-year and five-year periods. The Board discussed the Fund’s performance with the Adviser and recognized the efforts being taken by the Adviser in the context of other factors considered relevant by the Board.
Following such evaluation, and full deliberations, the Board concluded that the performance of the Fund supported renewal of the Contract.
Fund Expenses
While mindful that courts have cautioned against giving too much weight to comparative information concerning fees charged by other advisers for managing funds with comparable investment programs, the Board has found the use of such comparisons to be relevant to its deliberations. In this regard, the Board was presented with, and considered, information regarding the contractual advisory fee rates, net advisory fee rates, total expense ratios and each element of the Fund’s total expense ratio (i.e., gross and net advisory fees, administrative fees, custody fees, portfolio accounting fees and transfer agency fees) relative to an appropriate group of peer funds compiled by Federated Hermes from the category of peer funds selected by Morningstar (the “Expense Peer Group”). The Board received a description of the methodology used to select the Expense Peer Group from the overall Morningstar category. The Board also reviewed comparative information regarding the fees and expenses of the broader group of funds in the overall Morningstar category. The Board focused on comparisons with other similar mutual funds more heavily than non-mutual fund products or services because such comparisons are believed to be more relevant. The Board considered that other mutual funds are the products most like the Fund, in that they are readily available to Fund shareholders as alternative investment vehicles, and they are the type of
Annual Shareholder Report
investment vehicle, in fact, chosen and maintained by the Fund’s investors. The Board noted that the range of their fees and expenses, therefore, appears to be a relevant indicator of what consumers have found to be reasonable in the marketplace in which the Fund competes.
The Board reviewed the contractual advisory fee rate, and other expenses of the Fund and noted the position of the Fund’s fee rates relative to its Expense Peer Group. In this regard, the Board noted that the contractual advisory fee rate was above the median of the relevant Expense Peer Group, but the Board noted the applicable waivers and reimbursements, and that the overall expense structure of the Fund remained competitive in the context of other factors considered by the Board. In this regard, the Board had been previously advised that, while comparisons to its Expense Peer Group are relevant in judging the reasonableness of advisory fees, the Fund’s quantitative focus makes fee and expense comparisons particularly difficult. Although the Fund’s advisory fee was above the median of its Expense Peer Group range, the funds in the Expense Peer Group varied widely in their complexity, and the Board has been informed that the management of the Fund is among the more complex relative to its Expense Peer Group.
For comparison, the Board received and considered information about the fees charged by Federated Hermes for providing advisory services to other types of clients with investment strategies similar to those of the Federated Hermes Funds, including non-mutual fund clients such as institutional separate accounts and third-party unaffiliated mutual funds for which the Adviser or its affiliates serve as sub-adviser. The Board noted the CCO’s conclusion that mon-mutual fund clients are inherently different products due to the following differences, among others: (i) different types of targeted investors; (ii) different applicable laws and regulations; (iii) different legal structures; (iv) different average account sizes and portfolio management techniques made necessary by different cash flows and different associated costs; (v) the time spent by portfolio managers and their teams (among other personnel across various departments, including legal, compliance and risk management) in reviewing securities pricing, addressing different administrative responsibilities, and addressing different degrees of risk associated with management; and (vi) a variety of different costs. The Board also considered information regarding the differences in the nature of the services required for Federated Hermes to manage its proprietary mutual fund business versus managing a discrete pool of assets as a sub-adviser to another institution’s mutual fund, noting that Federated Hermes generally performs significant additional services and assumes substantially greater risks in managing the Fund and other Federated Hermes Funds than in its role as sub-adviser to an unaffiliated third-party mutual fund. The Board noted that the CCO did not consider the fees for providing advisory services to other types of clients to be determinative in judging the appropriateness of the Federated Hermes Funds’ advisory fees.
Annual Shareholder Report
The Board considered the CCO’s view that the services, administrative responsibilities and risks associated with such relationships are quite different than serving as a primary adviser to a fund.
Following such evaluation, and full deliberations, the Board concluded that the fees and expenses of the Fund are reasonable and supported renewal of the Contract.
Profitability and Other Benefits
The Board also received financial information about Federated Hermes, including information regarding the compensation and ancillary (or “fall-out”) benefits Federated Hermes derived from its relationships with the Federated Hermes Funds. This information covered not only the fees under the Federated Hermes Funds’ investment advisory contracts, but also fees received by Federated Hermes’ affiliates for providing other services to the Federated Hermes Funds under separate contracts (e.g., for serving as the Federated Hermes Funds’ administrator and distributor). In this regard, the Board considered that certain of Federated Hermes’ affiliates provide distribution and shareholder services to the Federated Hermes Funds, for which they may be compensated through distribution and servicing fees paid pursuant to Rule 12b-1 plans or otherwise. The Board also received and considered information detailing any indirect benefit Federated Hermes may derive from its receipt of research services from brokers who execute portfolio trades for the Federated Hermes Funds. In addition, the Board considered the fact that, in order for the Federated Hermes Fund to be competitive in the marketplace, the Adviser and its affiliates frequently waived fees and/or reimbursed expenses and have disclosed to Federated Hermes Fund shareholders and/or reported to the Board their intention to do so in the future. Moreover, the Board received and considered regular reports from Federated Hermes throughout the year as to the institution, adjustment or elimination of these voluntary waivers and/or reimbursements.
The Board received and considered information furnished by Federated Hermes, as requested by the CCO, that reported revenues on a fund-by-fund basis and made estimates of the allocation of expenses on a fund-by-fund basis, using allocation methodologies specified by the CCO and described to the Board. The Board considered the CCO’s view that, while these cost allocation reports apply consistent allocation processes, the inherent difficulties in allocating costs continues to cause the CCO to question the precision of the process and to conclude that such reports may be unreliable, because a single change in an allocation estimate may dramatically alter the resulting estimate of cost and/or profitability of a Federated Hermes Fund and may produce unintended consequences. The allocation information, including the CCO’s view that fund-by-fund estimations may be unreliable, was considered in the evaluation by the Board. In addition, the Board considered that, during the prior year, an independent consultant conducted a review of the allocation
Annual Shareholder Report
methodologies used by Federated Hermes in estimating profitability for purposes of reporting to the Board in connection with the continuation of the Contract. The Board noted the consultant’s view that, although there is no single best method to allocate expenses, the methodologies used by Federated Hermes are reasonable.
The Board also reviewed information compiled by Federated Hermes comparing its profitability information to other publicly held fund management companies, including information regarding profitability trends over time. The Board considered the CCO’s conclusion that, based on such profitability information, Federated Hermes’ profit margins did not appear to be excessive. The Board also considered the CCO’s view that Federated Hermes appeared financially sound, with the resources necessary to fulfill its obligations under its contracts with the Federated Hermes Funds.
Economies of Scale
The Board received and considered information about the notion of possible realization of “economies of scale” as a fund grows larger, the difficulties of calculating economies of scale at an individual fund level, and the extent to which potential scale benefits are shared with shareholders. In this regard, the Board considered that Federated Hermes has made significant and long-term investments in areas that support all of the Federated Hermes Funds, such as personnel and processes for the portfolio management, trading operations, issuer engagement (including with respect to ESG matters), shareholder services, compliance, business continuity, internal audit and risk management functions, as well as systems technology (including technology relating to cybersecurity) and use of data. The Board noted that Federated Hermes’ investments in these areas are extensive and are designed to provide enhanced services to the Federated Hermes Funds and their shareholders. The Board considered that the benefits of these investments (as well as the benefits of any economies of scale, should they exist) are likely to be shared with the Federated Hermes Fund family as a whole. In addition, the Board considered that the Adviser and its affiliates have frequently waived fees and/or reimbursed expenses for the Federated Hermes Funds and that such waivers and reimbursements are another means for potential economies of scale to be shared with shareholders and can provide protection from an increase in expenses if a Federated Hermes Fund’s assets decline. Federated Hermes, as it does throughout the year, and specifically in connection with the Board’s review of the Contract, furnished information relative to adviser-paid fees (commonly referred to as revenue sharing). The Board considered the beliefs of Federated Hermes and the CCO that this information should be viewed to determine if there was an incentive to either not apply breakpoints or to apply breakpoints, at higher levels and should not be viewed to determine the appropriateness of advisory fees. The Board also noted the absence of any
Annual Shareholder Report
applicable regulatory or industry guidelines on this subject, which is compounded by the lack of any common industry practice or general pattern with respect to structuring fund advisory fees with “breakpoints” that serve to reduce the fee as a fund attains a certain size.
Conclusions
The Board considered the CCO’s conclusion that his observations and the information accompanying the CCO Fee Evaluation Report show that the management fee for the Fund was reasonable and the CCO’s recommendation that the Board approve the management fee. The Board noted that, under these circumstances, no changes were recommended to, and no objection was raised to the continuation of, the Contract by the CCO. The CCO also recognized that the Board’s evaluation of the Federated Hermes Funds’ advisory and subadvisory arrangements is a continuing and on-going process that is informed by the information that the Board requests and receives from management throughout the course of the year and, in this regard, the CCO noted certain items for future reporting to the Board or further consideration by management as the Board continues its on-going oversight of the Federated Hermes Funds.
In its determination to continue an existing investment advisory contract, the Board was mindful of the potential disruptions of the Fund’s operations and various risks, uncertainties and other effects that could occur as a result of a decision to terminate or not renew an investment advisory contract. In particular, the Board recognized that many shareholders have invested in the Fund on the strength of the Adviser’s industry standing and reputation and with the expectation that the Adviser will have a continuing role in providing advisory services to the Fund. Thus, the Board’s approval of the Contract reflected the fact that it is the shareholders who have effectively selected the Adviser by virtue of having invested in the Fund. The Board concluded that, in light of the factors summarized above, including the nature, quality and scope of the services provided to the Fund by the Adviser and its affiliates, continuation of the Contract was appropriate.
The Board based its determination to approve the Contract on the totality of the circumstances and relevant factors and with a view to past and future long-term considerations. Not all of the factors and considerations identified above were necessarily deemed to be relevant to the Fund, nor did the Board consider any one of them to be determinative. With respect to the factors that were deemed to be relevant, the Board’s determination to approve the continuation of the Contract reflects its view that Federated Hermes’ performance and actions provided a satisfactory basis to support the determination to continue the existing arrangement.
Annual Shareholder Report
Liquidity Risk Management Program– Annual Evaluation of Adequacy and Effectiveness
In accordance with Rule 22e-4 under the Investment Company Act of 1940, as amended (the “Liquidity Rule”), Federated Hermes MDT Series (the “Trust”) has adopted and implemented a liquidity risk management program (the “LRMP”) for Federated Hermes MDT Large Cap Growth Fund (the “Fund” and collectively with the Federated Hermes funds, the “Funds”). The LRMP seeks to assess and manage the Fund’s liquidity risk. “Liquidity risk” is defined under the Liquidity Rule as the risk that the Fund is unable to meet redemption requests without significantly diluting remaining investors’ interests in the Fund. The Board of Trustees of the Trust (the “Board”) has approved the designation of the Funds’ investment advisers as the administrators for the LRMP (collectively, the “Administrator”). The Administrator has established a Liquidity Risk Management Committee (the “Committee”) comprised of representatives from various departments across the Administrator to assist it in the implementation and on-going administration of the LRMP. The Committee, in turn, has delegated to the Fixed Income and Equities Liquidity Committees, each a separate committee previously established by the Administrator, the responsibility to review and assess certain information related to the liquidity of the Funds that fall within their respective asset classes.
The Program is comprised of various components designed to support the assessment and/or management of liquidity risk, including: (1) the periodic assessment (no less frequently than annually) of certain factors that influence the Fund’s liquidity risk; (2) the periodic classification (no less frequently than monthly) of the Fund’s investments into one of four liquidity categories that reflect an estimate of their liquidity under current market conditions; (3) a 15% limit on the acquisition of “illiquid investments” (as defined under the Liquidity Rule); (4) to the extent a Fund does not invest primarily in “highly liquid investments” (as defined under the Liquidity Rule), the determination of a minimum percentage of the Fund’s assets that generally will be invested in highly liquid investments (an “HLIM”); (5) if a Fund has established an HLIM, the periodic review (no less frequently than annually) of the HLIM and the adoption of policies and procedures for responding to a shortfall of the Fund’s highly liquid investments below its HLIM; and (6) periodic reporting to the Board.
At its meetings in May 2020, the Board received and reviewed a written report from the Funds’ Chief Compliance Officer and Chief Risk Officer, on behalf of the Administrator, concerning the operation of the LRMP for the period from the LRMP’s inception on December 1, 2018 through March 31, 2020 (the “Period”). The Report addressed the operation of the LRMP and assessed its adequacy and effectiveness, including, where applicable, the operation of any HLIM established for a Fund. There were no
Annual Shareholder Report
material changes to the LRMP during the Period. The Report summarized the operation of the Program and the information and factors considered by the Administrator in assessing whether the Program has been adequately and effectively implemented with respect to the Funds. Such information and factors included, among other things:
| ■ | the liquidity risk framework used to assess, manage, and periodically review each Fund’s liquidity risk and the results of this assessment, including a review of the Funds’ access to other available funding sources such as the Funds’ interfund lending facility, redemptions in-kind and committed lines of credit and confirmation that the Fund did not have to access any of these alternative funding sources during the Period; |
| ■ | the periodic classifications of the Fund’s investments into one of four liquidity categories and the methodologies and inputs used to classify the investments, including the Fund’s reasonably anticipated trade size; |
| ■ | the analysis received from a third-party liquidity assessment vendor that is taken into account in the process of determining the liquidity classifications of the Fund’s investments and the results of an evaluation of the services performed by the vendor in support of this process; |
| ■ | the fact that the Fund invested primarily in highly liquid investments during the Period and, therefore, was not required to establish, and has not established, an HLIM and the procedures for monitoring the status of the Fund as investing primarily in highly liquid investments; |
| ■ | the fact that the Fund invested no more than 15% of its assets in illiquid investments during the Period and the procedures for monitoring this limit; and |
| ■ | liquidity events during the Period, including the impact on liquidity caused by extended non-U.S. market closures and the market disruptions resulting from the novel coronavirus outbreak, and the fact that there were no specific liquidity events during the Period that materially affected the Fund’s liquidity risk. |
Based on this review, the Administrator concluded that the LRMP is operating effectively to assess and manage the Fund’s liquidity risk, and that the Program has been and continues to be adequately and effectively implemented to monitor and, as applicable, respond to the Fund’s liquidity developments.
Annual Shareholder Report
Voting Proxies on Fund Portfolio Securities
A description of the policies and procedures that the Fund uses to determine how to vote proxies, if any, relating to securities held in the Fund’s portfolio is available, without charge and upon request, by calling 1-800-341-7400. A report on “Form N-PX” of how the Fund voted any such proxies during the most recent 12-month period ended June 30 is available via the Proxy Voting Record (Form N-PX) link associated with the Fund and share class name at FederatedInvestors.com/FundInformation. Form N-PX filings are also available at the SEC’s website at sec.gov.
Quarterly Portfolio Schedule
Each fiscal quarter, the Fund will file with the SEC a complete schedule of its monthly portfolio holdings on “Form N-PORT.” The Fund’s holdings as of the end of the third month of every fiscal quarter, as reported on Form N-PORT, will be publicly available on the SEC’s website at sec.gov within 60 days of the end of the fiscal quarter upon filing. You may also access this information via the link to the Fund and share class name at FederatedInvestors.com.
Annual Shareholder Report
Mutual funds are not bank deposits or obligations, are not guaranteed by any bank and are not insured or guaranteed by the U.S. government, the Federal Deposit Insurance Corporation, the Federal Reserve Board or any other government agency. Investment in mutual funds involves investment risk, including the possible loss of principal.
This Report is authorized for distribution to prospective investors only when preceded or accompanied by the Fund’s Prospectus, which contains facts concerning its objective and policies, management fees, expenses and other information.
Federated Hermes MDT Large Cap Growth Fund
Federated Hermes Funds
4000 Ericsson Drive
Warrendale, PA 15086-7561
Contact us at FederatedInvestors.com
or call 1-800-341-7400.
Federated Securities Corp., Distributor
CUSIP 31421R700
CUSIP 31421R684
CUSIP 31421R809
CUSIP 31421R882
37329 (9/20)
© 2020 Federated Hermes, Inc.

Annual Shareholder Report
July 31, 2020
| Share Class | Ticker | A | QASCX | C | QCSCX | Institutional | QISCX | R6 | QLSCX |
Federated Hermes MDT Small Cap Core Fund
(formerly, Federated MDT Small Cap Core Fund)
Fund Established 2005
A Portfolio of Federated Hermes MDT Series
(formerly, Federated MDT Series)
IMPORTANT NOTICE REGARDING REPORT DELIVERY
Beginning on January 1, 2021, as permitted by regulations adopted by the Securities and Exchange Commission, paper copies of the Fund’s shareholder reports like this one will no longer be sent by mail, unless you specifically request paper copies of the reports from the Fund or from your financial intermediary, such as a broker-dealer or bank. Instead, the reports will be made available on a website, and you will be notified by mail each time a report is posted and provided with a website link to access the report.
If you already elected to receive shareholder reports electronically, you will not be affected by this change and you need not take any action. You may elect to receive shareholder reports and other communications from the Fund or your financial intermediary electronically by contacting your financial intermediary (such as a broker-dealer or bank); other shareholders may call the Fund at 1-800-341-7400, Option 4.
You may elect to receive all future reports in paper free of charge. You can inform the Fund or your financial intermediary that you wish to continue receiving paper copies of your shareholder reports by contacting your financial intermediary (such as a broker-dealer or bank); other shareholders may call the Fund at 1-800-341-7400, Option 4. Your election to receive reports in paper will apply to all funds held with the Fund complex or your financial intermediary.
Not FDIC Insured ■ May Lose Value ■ No Bank Guarantee
J. Christopher
Donahue
President
Federated Hermes MDT Small Cap Core Fund
Letter from the President
Dear Valued Shareholder,
I am pleased to present the Annual Shareholder Report for your fund covering the period from August 1, 2019 through July 31, 2020.
As we all confront the unprecedented effects of the coronavirus and the challenges it presents to our families, communities, businesses and the financial markets, I want you to know that everyone at Federated Hermes is dedicated to helping you successfully navigate the markets ahead. You can count on us for the insights, investment management knowledge and client service that you have come to expect. Please refer to our website, FederatedInvestors.com, for timely updates on this and other economic and market matters.
Thank you for investing with us. I hope you find this information useful and look forward to keeping you informed.
Sincerely,
J. Christopher Donahue, President
CONTENTS
| 1 |
| 6 |
| 7 |
| 20 |
| 24 |
| 26 |
| 28 |
| 29 |
| 41 |
| 43 |
| 45 |
| 51 |
| 60 |
| 62 |
| 62 |
Management’s Discussion of Fund Performance (unaudited)
The total return of Federated Hermes MDT Small Cap Core Fund (the “Fund”), based on net asset value for the 12-month reporting period ended July 31, 2020, was -8.71% for Class A Shares, -9.35% for Class C Shares, -8.45% for Institutional Shares and -8.44% for Class R6 Shares. The total return for the Russell 2000® Index (R2000),1 the Fund’s broad-based securities market index, was -4.59% for the same period. The total return of the Morningstar Small Blend Funds Average (MSBFA),2 a peer group average for the Fund, was -8.80% during the same period. The Fund’s and MSBFA’s total returns for the most recently completed fiscal year reflected actual cash flows, transaction costs and other expenses, which were not reflected in the total return of the R2000.
During the reporting period, the Fund’s investment strategy focused on stock selection. This was the most significant factor affecting the Fund’s performance relative to the R2000 during the period.
The following discussion will focus on the performance of the Fund’s Class R6 Shares relative to the R2000.
MARKET OVERVIEW
The twelve months of this reporting period, culminating with the COVID-19 pandemic, saw huge volatility in the domestic market. Despite the dramatic decline and recovery in the first half of 2020, the whole market Russell 3000® Index3 was up 10.93% for the full period. However, looking more deeply at the subindexes revealed the wildness of the market. Large caps dominated small caps:4 the mega-cap Russell Top 200® Index5 returned 15.84%, while the Russell Midcap® Index6 returned 2.04% and the small-cap Russell 2000® Index7 returned -5.57%. In addition, once again, growth dominated value: the Russell 3000® Growth Index8 returned 28.24% while the Russell 3000® Value Index9 returned -6.67%. The largest spread between growth and value in one capitalization range this year was almost 38 percentage points: the mega-cap Russell Top 200® Growth Index10 returned 33.06% while the Russell Top 200® Value11 Index returned -4.80%.
The best performing sectors in the R2000 during the reporting period were Health Care (18.62%), Information Technology (10.65%) and Consumer Staples (6.89%). Underperforming sectors during the same period included Energy (-53.67%), Financials (-24.38%) and Communication Services (-19.04%).
STOCK SELECTION
The Fund buys stocks with many different combinations of fundamental and technical characteristics that have signaled market outperformance historically. The primary cause of underperformance in the reporting period was the Fund’s underweight of stocks with very low cash flow, and weak stock selection
Annual Shareholder Report
among those stocks. For most of the year, the market was bidding up growth stocks with poor cash flow, as it was, for most of the year, a growth-leaning market. More recently, the market was investing in biotechnology stocks in hopes of finding a COVID-19 cure or vaccine. The Fund tends to avoid stocks with low cash flow and poor analyst conviction, cherry-picking among them for those that look stronger according to our complete set of fundamental and technical factors, so it missed many of the biotechnology stocks or sold out of them too early as they began to be expensive. The Fund’s sector exposures continued to remain close to R2000 weights; there were no significant overweights or underweights at the end of the fiscal year. Weak stock selection in the Health Care sector contributed the most to the Fund’s underperformance. Favorable stock selection in the Real Estate and Consumer Discretionary sectors provided a partial offset.
Individual stocks enhancing the Fund’s performance during the reporting period included Wingstop, Inc., Aaron’s, Inc. and Five9, Inc.
Individual stocks detracting from the Fund’s performance during the reporting period included Atkore International Group Inc., Jack in the Box Inc., and Whiting Petroleum Corporation.
| 1 | Please see the footnotes to the line graphs below for definitions of, and further information about, the R2000. |
| 2 | Please see the footnotes to the line graphs below for definitions of, and further information about, the MSBFA. |
| 3 | The Russell 3000® Index measures the performance of the largest 3,000 U.S. companies representing approximately 98% of the investable U.S. equity market. The Russell 3000® Index is constructed to provide a comprehensive, unbiased and stable barometer of the broad market, and is completely reconstituted annually to ensure new and growing equities are reflected.* |
| 4 | Small-cap stocks may be less liquid and subject to greater price volatility than large-cap stocks. |
| 5 | The Russell Top 200® Index measures the performance of the largest cap segment of the U.S. equity universe. The Russell Top 200® Index is a subset of the Russell 3000® Index. It includes approximately 200 of the largest securities based on a combination of their market cap and current index membership and represents approximately 68% of the U.S. market. The Russell Top 200® Index is constructed to provide a comprehensive and unbiased barometer for this very large cap segment and is completely reconstituted annually to ensure new and growing equities are reflected.* |
| 6 | The Russell Midcap® Index measures the performance of the mid-cap segment of the U.S. equity universe. The Russell Midcap® Index is a subset of the Russell 1000® Index. It includes approximately 800 of the smallest securities based on a combination of their market cap and current index membership. The Russell Midcap® Index represents approximately 31% of the total market capitalization of the Russell 1000® companies. The Russell Midcap® Index is constructed to provide a comprehensive and unbiased barometer for the mid-cap segment. The Russell Midcap Index is completely reconstituted annually to ensure larger stocks do not distort the performance and characteristics of the true mid-cap opportunity set.* |
| 7 | The Russell 2000® Index measures the performance of the small-cap segment of the U.S. equity universe. The Russell 2000® Index is a subset of the Russell 3000® Index representing approximately 10% of the total market capitalization of that index. It includes approximately 2000 of the smallest securities based on a combination of their market cap and current index membership. The Russell 2000® Index is constructed to provide a comprehensive and unbiased small-cap barometer and is completely reconstituted annually to ensure larger stocks do not distort the performance and characteristics of the true small-cap opportunity set.* |
Annual Shareholder Report
| 8 | The Russell 3000® Growth Index measures the performance of the broad growth segment of the U.S. equity universe. It includes those Russell 3000® Index companies with higher price-to-book ratios and higher forecasted growth values. The Russell 3000® Growth Index is constructed to provide a comprehensive, unbiased and stable barometer of the broad growth market. The Russell 3000® Growth Index is completely reconstituted annually to ensure new and growing equities are included and that the represented companies continue to reflect growth characteristics.* |
| 9 | The Russell 3000® Value Index measures the performance of the broad value segment of U.S. equity value universe. It includes those Russell 3000® Index companies with lower price-to-book ratios and lower forecasted growth values. The Russell 3000® Value Index is constructed to provide a comprehensive, unbiased and stable barometer of the broad value market. The Russell 3000® Value Index is completely reconstituted annually to ensure new and growing equities are included and that the represented companies continue to reflect value characteristics.* |
| 10 | The Russell Top 200® Growth Index measures the performance of the especially large cap segment of the U.S. equity universe represented by stocks in the largest 200 by market cap. It includes Russell Top 200® Index companies with higher growth earning potential as defined by Russell’s leading style methodology.* |
| 11 | The Russell Top 200® Value Index measures the performance of the especially large cap segment of the U.S. equity universe represented by stocks in the largest 200 by market cap. It includes Russell Top 200® Index companies with value characteristics as defined by Russell’s leading style methodology.* |
| * | The index is unmanaged, and it is not possible to invest directly in an index. |
Annual Shareholder Report
FUND PERFORMANCE AND GROWTH OF A $10,000 INVESTMENT
The graph below illustrates the hypothetical investment of $10,0001 in the Federated Hermes MDT Small Cap Core Fund from July 31, 2010 to July 31, 2020, compared to the Russell 2000® Index (R2000)2 and the Morningstar Small Blend Funds Average (MSBFA).3 The Average Annual Total Return table below shows returns for each class averaged over the stated periods.
Growth of a $10,000 INVESTMENT
Growth of $10,000 as of July 31, 2020
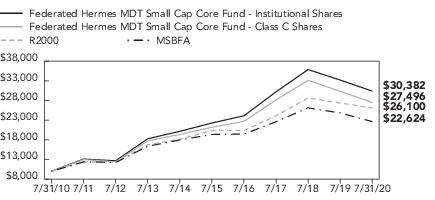
| Federated Hermes MDT Small Cap Core Fund - | Institutional Shares | Class C Shares | R2000 | MSBFA |
| F | F | I | I |
| 7/31/2010 | 10,000 | 10,000 | 10,000 | 10,000 |
| 7/31/2011 | 13,106 | 12,981 | 12,392 | 12,394 |
| 7/31/2012 | 12,674 | 12,418 | 12,416 | 12,234 |
| 7/31/2013 | 18,270 | 17,734 | 16,732 | 16,347 |
| 7/31/2014 | 20,157 | 19,368 | 18,164 | 17,962 |
| 7/31/2015 | 22,269 | 21,190 | 20,349 | 19,348 |
| 7/31/2016 | 24,104 | 22,699 | 20,349 | 19,461 |
| 7/31/2017 | 30,188 | 28,142 | 24,104 | 22,579 |
| 7/31/2018 | 35,857 | 33,095 | 28,620 | 26,125 |
| 7/31/2019 | 33,186 | 30,332 | 27,355 | 24,821 |
| 7/31/2020 | 30,382 | 27,496 | 26,100 | 22,624 |
41 graphic description end -->
| ■ | Total returns shown for Class C Shares include the maximum contingent deferred sales charge of 1.00%, as applicable. |
The Fund offers multiple shares classes whose performance may be greater than or less than its other share class(es) due to differences in sales charges and expenses. See the Average Annual Total Returns table below for the returns of additional classes not shown in the line graph above.
Average Annual Total Returns for the Periods Ended 7/31/2020
(returns reflect all applicable sales charges and contingent deferred sales charges as specified below in footnote #1)
| | 1 Year | 5 Years | 10 Years |
| Class A Shares | -13.74% | 4.94% | 10.84% |
| Class C Shares | -10.26% | 5.35% | 10.64% |
| Institutional Shares | -8.45% | 6.41% | 11.75% |
| Class R6 Shares4 | -8.44% | 6.34% | 10.92% |
| R2000 | -4.59% | 5.10% | 10.07% |
| MSBFA | -8.80% | 3.57% | 9.05% |
Annual Shareholder Report
Performance data quoted represents past performance which is no guarantee of future results. Investment return and principal value will fluctuate so that an investor’s shares, when redeemed, may be worth more or less than their original cost. Mutual fund performance changes over time and current performance may be lower or higher than what is stated. For current to the most recent month-end performance and after-tax returns, visit FederatedInvestors.com or call 1-800-341-7400. Returns shown do not reflect the deduction of taxes that a shareholder would pay on Fund distributions or the redemption of Fund shares. Mutual funds are not obligations of or guaranteed by any bank and are not federally insured.
| 1 | Represents a hypothetical investment of $10,000 in the Fund after deducting applicable sales charges: for Class A Shares, the maximum sales charge of 5.50% ($10,000 investment minus $550 sales charge = $9,450); for Class C Shares, a 1.00% contingent deferred sales charge would be applied on any redemption less than one year from the purchase date. The Fund’s performance assumes the reinvestment of all dividends and distributions. The R2000 and MSBFA have been adjusted to reflect reinvestment of dividends on securities. |
| 2 | The R2000 measures the performance of the small-cap segment of the U.S. equity universe. The R2000 is a subset of the Russell 3000® Index representing approximately 10% of the total market capitalization of that index. It includes approximately 2000 of the smallest securities based on a combination of their market cap and current index membership. The R2000 is constructed to provide a comprehensive and unbiased small-cap barometer, and is completely reconstituted annually to ensure larger stocks do not distort the performance and characteristics of the true small-cap opportunity set. The R2000 is unmanaged and, unlike the Fund, is not affected by cash flows. It is not possible to invest directly in an index. The R2000 is not adjusted to reflect sales charges, expenses or other fees that the Securities and Exchange Commission requires to be reflected in the Fund’s performance. |
| 3 | Morningstar figures represent the average of the total returns reported by all the funds designated by Morningstar as falling into the respective category indicated. They do not reflect sales charges. The Morningstar figures in the Growth of $10,000 line graph are based on historical return information published by Morningstar and reflect the return of the funds comprising the category in the year of publication. Because the funds designated by Morningstar as falling into the category can change over time, the Morningstar figures in the line graph may not match the Morningstar figures in the Average Annual Total Returns table, which reflect the return of the funds that currently comprise the category. |
| 4 | The Fund’s R6 Class commenced operations on June 29, 2016. It is anticipated that this class will have the lowest net expenses of all outstanding share classes. For the period prior to the commencement of operations of the R6 class, the R6 class performance information shown is for the Institutional Share class, adjusted to reflect the expenses of the Fund’s R6 class for each period for which the Fund’s R6 class gross expenses would have exceeded the actual expense paid by the Fund’s Institutional Share class. |
Annual Shareholder Report
Portfolio of Investments Summary Table (unaudited)
At July 31, 2020, the Fund’s sector composition1 was as follows:
| Sector Composition | Percentage of
Total Net Assets |
| Health Care | 19.2% |
| Financials | 16.5% |
| Information Technology | 14.0% |
| Industrials | 13.5% |
| Consumer Discretionary | 13.5% |
| Real Estate | 7.1% |
| Communication Services | 3.7% |
| Consumer Staples | 3.5% |
| Materials | 3.1% |
| Utilities | 2.9% |
| Energy | 2.3% |
| Securities Lending Collateral2 | 9.1% |
| Cash Equivalents3 | 1.4% |
| Other Assets and Liabilities—Net4 | (9.8)% |
| TOTAL | 100.0% |
| 1 | Except for Securities Lending Collateral, Cash Equivalents and Other Assets and Liabilities, sector classifications are based upon, and individual portfolio securities are assigned to, the classifications of the Global Industry Classification Standard (GICS) except that the Adviser assigns a classification to securities not classified by the GICS and to securities for which the Adviser does not have access to the classification made by the GICS. |
| 2 | Represents cash collateral received for portfolio securities on loan that may be invested in affiliated money market funds, other money market instruments and/or repurchase agreements. |
| 3 | Cash Equivalents include any investments in money market mutual funds and/or overnight repurchase agreements other than those representing cash collateral for securities lending. |
| 4 | Assets, other than investments in securities, less liabilities. See Statement of Assets and Liabilities. |
Annual Shareholder Report
Portfolio of Investments
July 31, 2020
| Shares | | | Value |
| | | COMMON STOCKS—99.3% | |
| | | Communication Services—3.7% | |
| 101,875 | 1 | AMC Networks, Inc. | $2,353,313 |
| 24,255 | 1,2 | Bandwidth, Inc. | 3,511,639 |
| 856,577 | 1 | Cars.com, Inc. | 6,955,405 |
| 72,313 | | Cogent Communications Holdings, Inc. | 6,516,124 |
| 210,392 | 1 | Consolidated Communications Holdings, Inc. | 1,535,862 |
| 814,190 | 2 | Emerald Holding, Inc. | 2,214,597 |
| 37,005 | 1 | EverQuote, Inc. | 2,014,922 |
| 78,854 | 1 | Yelp, Inc. | 1,969,773 |
| | | TOTAL | 27,071,635 |
| | | Consumer Discretionary—13.5% | |
| 29,428 | 1,2 | 1-800-FLOWERS.COM, Inc. | 831,341 |
| 132,883 | | Aaron’s, Inc. | 6,933,835 |
| 354,304 | 1 | American Axle & Manufacturing Holdings, Inc. | 2,501,386 |
| 26,092 | 1,2 | Asbury Automotive Group, Inc. | 2,613,114 |
| 56,728 | | BBX Capital Corporation | 789,654 |
| 79,219 | | Big Lots, Inc. | 3,116,475 |
| 188,218 | 2 | Camping World Holdings, Inc. | 6,892,543 |
| 59,327 | 1,2 | Chegg, Inc. | 4,803,707 |
| 312,195 | 1,2 | Cooper-Standard Holding, Inc. | 3,343,608 |
| 104,589 | 2 | Dillards, Inc., Class A | 2,463,071 |
| 130,331 | 1,2 | Fossil, Inc. | 431,396 |
| 9,276 | 1,2 | Francesca’s Holdings Corp. | 51,482 |
| 240,584 | 1,2 | Funko, Inc. | 1,332,835 |
| 191,197 | 1 | G-III Apparel Group Ltd. | 1,890,938 |
| 101,876 | 1,2 | Groupon, Inc. | 1,563,797 |
| 411,614 | 1 | Houghton Mifflin Harcourt Co. | 1,218,377 |
| 38,387 | 1 | Installed Building Products, Inc. | 3,036,796 |
| 9,835 | | Jack in the Box, Inc. | 807,552 |
| 214,266 | 1 | Laureate Education, Inc. | 2,716,893 |
| 394,460 | 2 | Macy’s, Inc. | 2,390,428 |
| 24,181 | 1,2 | Meritage Corp. | 2,398,272 |
| 462,310 | 1 | Modine Manufacturing Co. | 2,514,966 |
| 79,393 | | Movado Group, Inc. | 765,349 |
| 7,149 | 1 | Murphy USA, Inc. | 946,599 |
| 62,693 | | ODP Corp./The | 1,383,635 |
Annual Shareholder Report
| Shares | | | Value |
| | | COMMON STOCKS—continued | |
| | | Consumer Discretionary—continued | |
| 28,848 | | Papa John’s International, Inc. | $2,731,040 |
| 19,131 | 1 | Perdoceo Education Corp. | 275,486 |
| 180,615 | | Rent-A-Center, Inc. | 5,223,386 |
| 17,041 | 1 | Skyline Corp. | 481,067 |
| 187,565 | | Steven Madden Ltd. | 3,972,627 |
| 299,051 | 2 | Tupperware Brands Corp. | 4,614,357 |
| 47,121 | 1 | WW International, Inc. | 1,214,779 |
| 107,358 | 2 | Wingstop, Inc. | 16,774,687 |
| 91,973 | 1 | YETI Holdings, Inc. | 4,496,560 |
| | | TOTAL | 97,522,038 |
| | | Consumer Staples—3.5% | |
| 121,712 | 2 | B&G Foods, Inc., Class A | 3,518,694 |
| 172,142 | 1 | BJ’s Wholesale Club Holdings, Inc. | 6,894,287 |
| 110,355 | 1,2 | Celsius Holdings, Inc. | 1,618,908 |
| 57,731 | 1 | Central Garden & Pet Co., Class A | 2,000,379 |
| 140,348 | 1 | elf Beauty, Inc. | 2,506,615 |
| 26,598 | 1 | Freshpet, Inc. | 2,554,738 |
| 31,917 | | Ingles Markets, Inc., Class A | 1,284,659 |
| 101,184 | 2 | Inter Parfums, Inc. | 4,137,414 |
| 29,343 | | SpartanNash Co. | 616,937 |
| 27,430 | 1,2 | United Natural Foods, Inc. | 544,485 |
| | | TOTAL | 25,677,116 |
| | | Energy—2.3% | |
| 55,232 | 2 | Arch Resources, Inc. | 1,713,297 |
| 279,889 | 1,2 | CONSOL Energy, Inc. | 1,645,747 |
| 105,185 | | CVR Energy, Inc. | 2,019,552 |
| 50,456 | 2 | DMC Global, Inc. | 1,482,397 |
| 111,305 | 1 | Gulf Island Fabrication, Inc. | 329,463 |
| 332,604 | 1,2 | Gulfport Energy Corp. | 335,930 |
| 362,889 | 1 | Newpark Resources, Inc. | 685,860 |
| 218,333 | 1 | Oceaneering International, Inc. | 1,227,031 |
| 493,449 | 1 | Oil States International, Inc. | 2,210,651 |
| 1,079,141 | | Peabody Energy Corp. | 3,366,920 |
| 201,818 | | SFL Corporation Ltd. | 1,677,108 |
| 43,980 | 1,2 | Tidewater, Inc. | 273,556 |
| | | TOTAL | 16,967,512 |
| | | Financials—16.5% | |
| 35,148 | | 1st Source Corp. | 1,164,102 |
Annual Shareholder Report
| Shares | | | Value |
| | | COMMON STOCKS—continued | |
| | | Financials—continued | |
| 25,434 | | American Equity Investment Life Holding Co. | $647,295 |
| 36,399 | | Argo Group International Holdings Ltd. | 1,219,731 |
| 32,280 | | Artisan Partners Asset Management, Inc. | 1,169,504 |
| 44,567 | | BancFirst Corp. | 1,941,339 |
| 202,302 | | Berkshire Hills Bancorp, Inc. | 2,014,928 |
| 446,227 | 1 | Blucora, Inc. | 5,261,016 |
| 100,194 | | Brightsphere Investment Group, Inc. | 1,346,607 |
| 39,053 | | Brookline Bancorp, Inc. | 374,714 |
| 53,781 | | CNO Financial Group, Inc. | 812,093 |
| 95,190 | | Donegal Group, Inc., Class A | 1,330,756 |
| 45,420 | | Eagle Bancorp, Inc. | 1,366,234 |
| 41,227 | | Employers Holdings, Inc. | 1,340,702 |
| 272,495 | 1 | Ezcorp, Inc., Class A | 1,558,671 |
| 54,486 | | Financial Institutions, Inc. | 804,758 |
| 465,338 | 2 | First BanCorp | 2,531,439 |
| 272,091 | | First Bancorp, Inc. | 5,621,400 |
| 39,672 | | First Cash, Inc. | 2,286,694 |
| 145,788 | | First Foundation, Inc. | 2,240,762 |
| 49,068 | 1 | Goosehead Insurance, Inc. | 5,070,196 |
| 31,706 | 1 | Green Dot Corp. | 1,607,177 |
| 46,590 | | Heartland Financial USA, Inc. | 1,455,472 |
| 25,053 | | HomeStreet, Inc. | 662,401 |
| 110,084 | 2 | Horace Mann Educators Corp. | 4,136,957 |
| 38,484 | | Independent Bank Corp.- Michigan | 537,429 |
| 707,766 | | Investors Bancorp, Inc. | 5,747,060 |
| 47,334 | 2 | Kinsale Capital Group, Inc. | 9,225,397 |
| 215,531 | | Meridian Bancorp, Inc. | 2,458,131 |
| 364,356 | 1 | NMI Holdings, Inc. | 5,654,805 |
| 10,297 | 1 | Nicolet Bankshares, Inc. | 576,838 |
| 240,971 | | Northwest Bancshares, Inc. | 2,373,564 |
| 99,532 | | Pacific Premier Bancorp, Inc. | 2,091,167 |
| 29,016 | 1,2 | Palomar Holdings, Inc. | 2,650,321 |
| 152,400 | | Peapack-Gladstone Financial Corp. | 2,481,072 |
| 71,155 | 2 | Pennymac Financial Services, Inc. | 3,433,940 |
| 63,543 | | Premier Financial Corp. | 1,123,440 |
| 305,538 | | ProAssurance Corp. | 4,491,409 |
| 146,879 | | QCR Holdings, Inc. | 4,388,745 |
| 52,850 | | Radian Group, Inc. | 788,522 |
Annual Shareholder Report
| Shares | | | Value |
| | | COMMON STOCKS—continued | |
| | | Financials—continued | |
| 257,500 | 2 | Selective Insurance Group, Inc. | $13,992,550 |
| 69,635 | | State Auto Financial Corp. | 1,080,039 |
| 41,900 | | TriCo Bancshares | 1,173,200 |
| 21,310 | | UMB Financial Corp. | 1,061,238 |
| 135,296 | | Waterstone Financial, Inc. | 2,067,323 |
| 134,084 | | Western New England Bancorp, Inc. | 675,783 |
| 171,039 | 2 | WisdomTree Investments, Inc. | 615,740 |
| 32,102 | 1,2 | World Acceptance Corp. | 2,385,179 |
| | | TOTAL | 119,037,840 |
| | | Health Care—19.2% | |
| 121,929 | 1 | ANI Pharmaceuticals, Inc. | 3,610,318 |
| 14,082 | 1 | Acceleron Pharma, Inc. | 1,396,512 |
| 627,148 | 1,2 | Acorda Therapeutics, Inc. | 394,351 |
| 66,205 | 1,3 | Adeptus Health, Inc., Class A | 0 |
| 40,232 | 1 | Adverum Biotechnologies, Inc. | 674,691 |
| 187,426 | 1 | Akebia Therapeutics, Inc. | 2,093,548 |
| 36,566 | 1 | Allogene Therapeutics, Inc. | 1,340,875 |
| 85,046 | 1 | Amphastar Pharmaceuticals, Inc. | 1,702,621 |
| 253,622 | 1 | AnaptysBio, Inc. | 4,555,051 |
| 175,013 | 1 | AngioDynamics, Inc. | 1,445,607 |
| 75,854 | 1,2 | Anika Therapeutics, Inc. | 2,761,086 |
| 74,730 | 1 | Arcus Biosciences, Inc. | 1,470,686 |
| 545,846 | 1 | Assertio Holdings, Inc. | 491,589 |
| 54,073 | 1 | AxoGen, Inc. | 614,810 |
| 29,908 | 1 | Axonics Modulation Technologies, Inc. | 1,266,903 |
| 49,268 | 1 | Biohaven Pharmaceutical Holding Co. Ltd. | 3,155,123 |
| 41,161 | 1 | Bioxcel Therapeutics, Inc. | 1,867,063 |
| 54,647 | 2 | CONMED Corp. | 4,510,563 |
| 239,793 | 1,2 | Catalyst Pharmaceutical Partners, Inc. | 1,031,110 |
| 30,591 | 1 | ChemoCentryx, Inc. | 1,612,452 |
| 253,239 | 1,2 | Community Health Systems, Inc. | 1,261,130 |
| 166,048 | 1 | Cue Biopharma, Inc. | 3,139,968 |
| 111,381 | 1 | Cutera, Inc. | 1,584,952 |
| 16,986 | 1,2 | Cytokinetics, Inc. | 367,237 |
| 80,582 | 1,2 | Denali Therapeutics, Inc. | 1,887,230 |
| 44,343 | 1 | Dicerna Pharmaceuticals, Inc. | 953,375 |
| 12,455 | 1 | Enanta Pharmaceuticals, Inc. | 571,062 |
| 93,520 | 1 | Fate Therapeutics, Inc. | 2,924,370 |
Annual Shareholder Report
| Shares | | | Value |
| | | COMMON STOCKS—continued | |
| | | Health Care—continued | |
| 77,719 | 1 | G1 Therapeutics, Inc. | $1,140,138 |
| 129,377 | 1 | GlycoMimetics, Inc. | 509,745 |
| 39,030 | 1 | Gossamer Bio, Inc. | 465,238 |
| 24,445 | 1 | Haemonetics Corp. | 2,142,849 |
| 191,406 | 1 | Halozyme Therapeutics, Inc. | 5,204,329 |
| 91,390 | 1 | Inogen, Inc. | 2,805,673 |
| 106,916 | 1 | Inovalon Holdings, Inc. | 2,515,733 |
| 16,494 | 1 | Inspire Medical Systems, Inc. | 1,638,844 |
| 38,927 | 1,2 | Intellia Therapeutics, Inc. | 693,290 |
| 38,036 | 1 | Intra-Cellular Therapies, Inc. | 754,064 |
| 169,375 | 1,2 | Ironwood Pharmaceuticals, Inc. | 1,553,169 |
| 133,667 | 1 | Kala Pharmaceuticals, Inc. | 1,169,586 |
| 135,414 | 1,2 | Kiniksa Pharmaceuticals Ltd. | 2,643,281 |
| 90,347 | 1,2 | Lannett Co., Inc. | 537,565 |
| 19,502 | | LeMaitre Vascular, Inc. | 571,994 |
| 628,152 | 1,2 | Lexicon Pharmaceuticals, Inc. | 1,218,615 |
| 23,938 | 1,2 | Livongo Health, Inc. | 3,046,111 |
| 49,232 | | Luminex Corp. | 1,792,045 |
| 59,597 | 1,2 | MEDNAX, Inc. | 1,190,748 |
| 226,349 | 1,2 | Mallinckrodt PLC | 504,758 |
| 61,087 | 1 | Medpace Holdings, Inc. | 7,290,733 |
| 126,978 | 1 | Mersana Therapeutics, Inc. | 2,524,323 |
| 42,858 | 1 | Molecular Templates, Inc., Class THL | 470,152 |
| 81,849 | 1 | Momenta Pharmaceuticals, Inc. | 2,413,727 |
| 608,966 | 1 | Myriad Genetics, Inc. | 7,350,220 |
| 31,800 | 1 | Novavax, Inc. | 4,550,580 |
| 17,468 | 1 | Omnicell, Inc. | 1,227,826 |
| 49,927 | 1,2 | Pacira BioSciences, Inc. | 2,626,659 |
| 22,379 | 1 | Prestige Consumer Healthcare, Inc. | 832,275 |
| 91,828 | 1 | Prevail Therapeutics, Inc. | 1,374,665 |
| 151,214 | 1,2 | Puma Biotechnology, Inc. | 1,559,016 |
| 90,701 | 1 | Recro Pharma, Inc. | 370,967 |
| 27,670 | 1 | Retrophin, Inc. | 550,080 |
| 15,572 | 1 | Rocket Pharmaceuticals, Inc. | 366,409 |
| 80,581 | 1 | Scholar Rock Holding Corp. | 909,760 |
| 21,753 | 1,2 | Schrodinger, Inc. | 1,574,482 |
| 241,027 | 1 | Select Medical Holdings Corp. | 4,589,154 |
| 31,817 | 1 | Shockwave Medical, Inc. | 1,569,214 |
Annual Shareholder Report
| Shares | | | Value |
| | | COMMON STOCKS—continued | |
| | | Health Care—continued | |
| 24,178 | 1 | Supernus Pharmaceuticals, Inc. | $538,323 |
| 24,373 | 1 | Syneos Health, Inc. | 1,520,631 |
| 172,572 | 1,2 | Tg Therapeutics, Inc. | 3,378,960 |
| 18,387 | 1 | Turning Point Therapeutics, Inc. | 1,089,062 |
| 17,669 | 1 | Twist Bioscience Corp. | 990,171 |
| 28,414 | 1 | Ultragenyx Pharmaceutical, Inc. | 2,220,838 |
| 66,896 | 1 | Vanda Pharmaceuticals, Inc. | 674,312 |
| 122,006 | 1,2 | Voyager Therapeutics, Inc. | 1,350,606 |
| 38,589 | 1 | Xencor, Inc. | 1,161,143 |
| 35,611 | 1 | Y-mAbs Therapeutics, Inc. | 1,251,014 |
| 38,567 | 1 | Zogenix, Inc. | 917,509 |
| 28,995 | 1,2 | Zynex, Inc. | 554,384 |
| | | TOTAL | 138,579,253 |
| | | Industrials—13.5% | |
| 225,173 | | AAR Corp. | 3,877,479 |
| 124,356 | | Advanced Drainage System, Inc. | 6,093,444 |
| 60,054 | 1 | Aerojet Rocketdyne Holdings, Inc. | 2,477,227 |
| 68,682 | | Albany International Corp., Class A | 3,302,231 |
| 277,324 | | Apogee Enterprises, Inc. | 5,987,425 |
| 20,219 | | ArcBest Corp. | 614,455 |
| 14,528 | | Arcosa, Inc. | 613,372 |
| 331,577 | 1 | Astronics Corp. | 2,884,720 |
| 118,737 | 1,2 | Atlas Air Worldwide Holdings, Inc. | 6,183,823 |
| 47,163 | | Barnes Group, Inc. | 1,738,900 |
| 72,033 | 1 | Builders Firstsource, Inc. | 1,706,462 |
| 255,877 | 1 | CECO Environmental Corp. | 1,714,376 |
| 284,514 | | Costamare, Inc. | 1,294,539 |
| 164,541 | 1 | Echo Global Logistics, Inc. | 4,124,220 |
| 53,709 | | Exponent, Inc. | 4,514,779 |
| 293,561 | 2 | Fluor Corp. | 2,991,387 |
| 341,049 | 1 | Foundation Building Materials, Inc. | 4,682,603 |
| 94,660 | 1 | Franklin Covey Co. | 1,712,399 |
| 138,567 | 1 | GMS, Inc. | 3,246,625 |
| 346,355 | 2 | Granite Construction, Inc. | 5,874,181 |
| 69,230 | 1 | Great Lakes Dredge & Dock Corp. | 578,763 |
| 41,957 | | Heidrick & Struggles International, Inc. | 848,790 |
| 33,816 | | Helios Technologies, Inc. | 1,279,259 |
| 83,785 | | Hurco Co., Inc. | 2,324,196 |
Annual Shareholder Report
| Shares | | | Value |
| | | COMMON STOCKS—continued | |
| | | Industrials—continued | |
| 271,687 | 1 | MRC Global, Inc. | $1,616,538 |
| 114,392 | 1,2 | Mastec, Inc. | 4,550,514 |
| 246,857 | 1 | Mistras Group, Inc. | 871,405 |
| 299,723 | 1 | Now, Inc. | 2,361,817 |
| 18,210 | | Rexnord Corp. | 527,544 |
| 28,753 | 1 | Siteone Landscape Supply, Inc. | 3,681,247 |
| 150,360 | 1 | Standard Plus Corp. | 2,389,220 |
| 103,808 | | Steelcase, Inc., Class A | 1,113,860 |
| 251,670 | 1 | Team, Inc. | 994,096 |
| 6,832 | | Tennant Co. | 455,148 |
| 46,015 | | The Shyft Group, Inc. | 868,763 |
| 175,241 | 1 | Titan Machinery, Inc. | 1,903,993 |
| 19,617 | 1,2 | Trex Co., Inc. | 2,733,237 |
| 172,194 | | Triumph Group, Inc. | 1,167,475 |
| 5,661 | | Unifirst Corp. | 1,055,663 |
| 39,465 | 1 | Veritiv Corp. | 604,209 |
| | | TOTAL | 97,560,384 |
| | | Information Technology—14.0% | |
| 79,092 | 1 | Amkor Technology, Inc. | 1,075,256 |
| 78,182 | 1,2 | Avaya Holdings Corp. | 989,784 |
| 28,963 | | Benchmark Electronics, Inc. | 589,687 |
| 95,173 | | Blackbaud, Inc. | 5,952,119 |
| 137,718 | 1 | Box, Inc. | 2,472,038 |
| 60,258 | 1 | Calix, Inc. | 1,235,892 |
| 20,273 | 1 | Commvault Systems, Inc. | 893,634 |
| 108,606 | | Comtech Telecommunications Corp. | 1,783,311 |
| 2,639,412 | 1 | Conduent, Inc. | 5,041,277 |
| 23,983 | 1 | Cornerstone OnDemand, Inc. | 851,636 |
| 82,990 | 1 | Domo, Inc. | 2,670,618 |
| 11,140 | 1 | Envestnet, Inc. | 904,568 |
| 36,917 | | Evertec, Inc. | 1,146,273 |
| 21,121 | 1 | Five9, Inc. | 2,551,839 |
| 82,152 | 1 | FormFactor, Inc. | 2,369,264 |
| 146,238 | 1,2 | GTT Communications, Inc. | 921,299 |
| 127,518 | 1 | Inphi Corp. | 16,661,502 |
| 21,508 | 1,2 | Intelligent Systems Corp. | 652,123 |
| 16,305 | 1 | j2 Global, Inc. | 924,820 |
| 199,330 | 1,2 | MA-COM Technology Solutions Holdings, Inc. | 8,423,686 |
Annual Shareholder Report
| Shares | | | Value |
| | | COMMON STOCKS—continued | |
| | | Information Technology—continued | |
| 97,675 | | MTS Systems Corp. | $1,811,871 |
| 89,685 | | ManTech International Corp., Class A | 6,240,282 |
| 15,067 | 1 | MaxLinear, Inc. | 381,948 |
| 119,896 | 1,2 | Model N, Inc. | 4,611,200 |
| 77,924 | 1 | NeoPhotonics Corp. | 709,888 |
| 13,244 | 1 | Netgear, Inc. | 407,253 |
| 20,124 | 1 | OSI Systems, Inc. | 1,427,999 |
| 33,331 | | Perspecta, Inc. | 713,283 |
| 264,383 | 2 | Plantronics, Inc. | 5,285,016 |
| 10,053 | 1 | Qualys, Inc. | 1,241,344 |
| 60,593 | 1 | SPS Commerce, Inc. | 4,554,776 |
| 111,632 | 1 | SVMK, Inc. | 2,676,935 |
| 71,518 | 1 | SailPoint Technologies Holding | 2,252,817 |
| 13,821 | | Science Applications International Corp. | 1,105,404 |
| 133,238 | 1,2 | Secureworks Corp. | 1,593,527 |
| 21,216 | 1 | Sitime Corp. | 1,127,630 |
| 51,536 | 1 | Sprout Social, Inc. | 1,488,875 |
| 211,152 | 1,2 | Synchronoss Technologies, Inc. | 696,802 |
| 32,780 | | TTEC Holdings, Inc. | 1,555,739 |
| 63,766 | 1 | Tenable Holdings, Inc. | 2,163,580 |
| 6,655 | 1,2 | Varonis Systems, Inc. | 721,069 |
| | | TOTAL | 100,877,864 |
| | | Materials—3.1% | |
| 264,258 | 1,2 | Allegheny Technologies, Inc. | 2,296,402 |
| 83,456 | | Boise Cascade Co. | 3,888,215 |
| 26,780 | | Carpenter Technology Corp. | 598,801 |
| 93,255 | | Commercial Metals Corp. | 1,928,513 |
| 26,194 | | Domtar, Corp. | 549,812 |
| 63,400 | | Fuller (H.B.) Co. | 2,874,556 |
| 27,762 | | Haynes International, Inc. | 509,710 |
| 18,186 | 1 | Ingevity Corp. | 1,063,517 |
| 61,688 | 1 | Koppers Holdings, Inc. | 1,552,687 |
| 155,575 | | Myers Industries, Inc. | 2,342,959 |
| 76,006 | | O-I Glass, Inc. | 793,503 |
| 178,898 | | SunCoke Energy, Inc. | 570,685 |
| 74,498 | | Trinseo SA | 1,616,607 |
| 122,955 | | Verso Corp. | 1,501,281 |
| | | TOTAL | 22,087,248 |
Annual Shareholder Report
| Shares | | | Value |
| | | COMMON STOCKS—continued | |
| | | Real Estate—7.1% | |
| 58,810 | | Alexander and Baldwin, Inc. | $695,134 |
| 161,131 | 2 | CIM Commercial Trust Corp. | 1,643,536 |
| 38,011 | | CareTrust REIT, Inc. | 684,958 |
| 347,864 | | Chatham Lodging Trust | 1,812,371 |
| 254,036 | | CoreCivic, Inc. | 2,263,461 |
| 61,954 | 2 | CorEnergy Infrastructure Trust, Inc. | 542,717 |
| 351,268 | | Easterly Government Properties, Inc. | 8,588,503 |
| 489,041 | | Independence Realty Trust | 5,623,972 |
| 50,305 | | LTC Properties, Inc. | 1,868,831 |
| 142,352 | 2 | QTS Realty Trust, Inc. | 10,242,226 |
| 195,928 | | RMR Group, Inc./The | 5,634,889 |
| 120,106 | 1,2 | Redfin Corp. | 4,994,008 |
| 296,791 | | Sabra Health Care REIT, Inc. | 4,374,699 |
| 218,754 | | Sunstone Hotel Investors, Inc. | 1,636,280 |
| 69,093 | | Whitestone Project | 456,014 |
| | | TOTAL | 51,061,599 |
| | | Utilities—2.9% | |
| 44,423 | | Allete, Inc. | 2,634,284 |
| 6,223 | 2 | Chesapeake Utilities Corp. | 525,781 |
| 171,167 | | Clearway Energy, Inc. | 3,921,436 |
| 311,036 | | Portland General Electric Co. | 13,726,019 |
| | | TOTAL | 20,807,520 |
| | | TOTAL COMMON STOCKS
(IDENTIFIED COST $663,991,472) | 717,250,009 |
| | | INVESTMENT COMPANIES—10.5% | |
| 31,624,077 | | Federated Hermes Government Obligations Fund, Premier Shares, 0.10%4 | 31,624,077 |
| 44,494,142 | | Federated Hermes Institutional Prime Value Obligations Fund, Institutional Shares, 0.21%4 | 44,520,839 |
| | | TOTAL INVESTMENT COMPANIES
(IDENTIFIED COST $76,142,738) | 76,144,916 |
| | | TOTAL INVESTMENT IN SECURITIES—109.8%
(IDENTIFIED COST $740,134,210)5 | 793,394,925 |
| | | OTHER ASSETS AND LIABILITIES - NET—(9.8)%6 | (70,656,549) |
| | | TOTAL NET ASSETS—100% | $722,738,376 |
Annual Shareholder Report
[PAGE INTENTIONALLY LEFT BLANK]
Annual Shareholder Report
An affiliated company is a company in which the Fund, alone or in combination with other funds, has ownership of at least 5% of the voting shares. Transactions with affiliated companies during the period ended July 31, 2020, were as follows:
| Affiliated | Balance
of Shares
Held
7/31/2019 | Purchases/
Additions* | Sales/
Reductions* |
| Amphastar Pharmaceuticals, Inc. | — | 85,046 | — |
| AnaptysBio, Inc. | — | 253,622 | — |
| Ultragenyx Pharmaceutical, Inc. | — | 31,765 | (3,351) |
| Wingstop, Inc. | 33,334 | 189,374 | (115,350) |
| Affiliated Issuers no longer in the portfolio at period end | — | 69,933 | (69,933) |
| TOTAL OF AFFILIATED TRANSACTIONS | 33,334 | 629,740 | (188,634) |
Annual Shareholder Report
Balance
of Shares
Held
7/31/2020 | Value | Change in
Unrealized
Appreciation/
Depreciation* | Net
Realized
Gain/(Loss)* | Dividend
Income* |
| 85,046 | $1,702,621 | $(48,459) | $— | $— |
| 253,622 | $4,555,051 | $379,491 | $— | $— |
| 28,414 | $2,220,838 | $112,557 | $9,532 | $276 |
| 107,358 | $16,774,687 | $7,256,504 | $1,063,076 | $44,909 |
| — | $— | $— | $711,238 | $— |
| 474,440 | $25,253,197 | $7,700,093 | $1,783,846 | $45,185 |
| * | A portion of the amount shown was recorded prior to the Fund having ownership of at least 5% of the voting shares. |
Affiliated fund holdings are investment companies which are managed by the Adviser or an affiliate of the Adviser. Transactions with affiliated fund holdings during the period ended July 31, 2020, were as follows:
| | Federated Hermes
Government
Obligations Fund,
Premier Shares* | Federated Hermes
Institutional
Prime Value
Obligations Fund,
Institutional Shares* | Total of
Affiliated
Transactions |
| Balance of Shares Held 7/31/2019 | 37,415,748 | 84,083,002 | 121,498,750 |
| Purchases/Additions | 298,134,754 | 603,036,372 | 901,171,126 |
| Sales/Reductions | (303,926,425) | (642,625,232) | (946,551,657) |
| Balance of Shares Held 7/31/2020 | 31,624,077 | 44,494,142 | 76,118,219 |
| Value | $31,624,077 | $44,520,839 | $76,144,916 |
| Change in Unrealized Appreciation/Depreciation | N/A | $(72) | $(72) |
| Net Realized Gain/(Loss) | N/A | $8,150 | $8,150 |
| Dividend Income | 475,313 | 970,853 | 1,446,166 |
| * | All or a portion of the balance/activity for the fund relates to cash collateral received on securities lending transactions. |
| 1 | Non-income-producing security. |
| 2 | All or a portion of these securities are temporarily on loan to unaffiliated broker/dealers. |
| 3 | Market quotations and price evaluations are not available. Fair value determined using significant unobservable inputs in accordance with procedures established by and under the general supervision of the Fund’s Board of Trustees (the "Trustees"). |
| 4 | 7-day net yield. |
| 5 | The cost of investments for federal tax purposes amounts to $770,602,726. |
| 6 | Assets, other than investments in securities, less liabilities. See Statement of Assets and Liabilities. |
Note: The categories of investments are shown as a percentage of total net assets at July 31, 2020.
Annual Shareholder Report
Various inputs are used in determining the value of the Fund’s investments. These inputs are summarized in the three broad levels listed below:
Level 1—quoted prices in active markets for identical securities.
Level 2—other significant observable inputs (including quoted prices for similar securities, interest rates, prepayment speeds, credit risk, etc.). Also includes securities valued at amortized cost.
Level 3—significant unobservable inputs (including the Fund’s own assumptions in determining the fair value of investments).
The inputs or methodology used for valuing securities are not an indication of the risk associated with investing in those securities.
The following is a summary of the inputs used, as of July 31, 2020, in valuing the Fund’s assets carried at fair value:
| Valuation Inputs | | | | |
| | Level 1—
Quoted
Prices | Level 2—
Other
Significant
Observable
Inputs | Level 3—
Significant
Unobservable
Inputs | Total |
| Equity Securities: | | | | |
| Common Stocks | | | | |
| Domestic | $705,138,863 | $— | $0 | $705,138,863 |
| International | 12,111,146 | — | — | 12,111,146 |
| Investment Companies | 76,144,916 | — | — | 76,144,916 |
| TOTAL SECURITIES | $793,394,925 | $— | $0 | $793,394,925 |
The following acronym is used throughout this portfolio:
| REIT | —Real Estate Investment Trust |
See Notes which are an integral part of the Financial Statements
Annual Shareholder Report
Financial Highlights–Class A Shares
(For a Share Outstanding Throughout Each Period)
| Year Ended July 31 | 2020 | 2019 | 2018 | 2017 | 2016 |
| Net Asset Value, Beginning of Period | $18.87 | $21.19 | $18.69 | $15.08 | $15.66 |
| Income From Investment Operations: | | | | | |
| Net investment income (loss)1 | 0.04 | 0.01 | (0.01) | (0.02) | 0.03 |
| Net realized and unrealized gain (loss) | (1.68) | (1.70) | 3.38 | 3.78 | 1.02 |
| TOTAL FROM INVESTMENT OPERATIONS | (1.64) | (1.69) | 3.37 | 3.76 | 1.05 |
| Less Distributions: | | | | | |
| Distributions from net investment income | (0.04) | — | — | — | — |
| Distributions from net realized gain | — | (0.63) | (0.87) | (0.15) | (1.63) |
| TOTAL DISTRIBUTIONS | (0.04) | (0.63) | (0.87) | (0.15) | (1.63) |
| Net Asset Value, End of Period | $17.19 | $18.87 | $21.19 | $18.69 | $15.08 |
| Total Return2 | (8.71)% | (7.69)% | 18.49% | 24.97% | 7.90% |
| Ratios to Average Net Assets: | | | | | |
| Net expenses3 | 1.13% | 1.13% | 1.14% | 1.14% | 1.13% |
| Net investment income (loss) | 0.24% | 0.07% | (0.06)% | (0.13)% | 0.19% |
| Expense waiver/reimbursement4 | 0.31% | 0.22% | 0.37% | 0.55% | 1.10% |
| Supplemental Data: | | | | | |
| Net assets, end of period (000 omitted) | $78,347 | $68,546 | $74,396 | $37,031 | $13,035 |
| Portfolio turnover | 223% | 121% | 88% | 91% | 189% |
| 1 | Per share numbers have been calculated using the average shares method. |
| 2 | Based on net asset value, which does not reflect the sales charge, redemption fee or contingent deferred sales charge, if applicable. |
| 3 | Amount does not reflect net expenses incurred by investment companies in which the Fund may invest. |
| 4 | This expense decrease is reflected in both the net expense and the net investment income (loss) ratios shown above. Amount does not reflect expense waiver/reimbursement recorded by investment companies in which the Fund may invest. |
See Notes which are an integral part of the Financial Statements
Annual Shareholder Report
Financial Highlights–Class C Shares
(For a Share Outstanding Throughout Each Period)
| Year Ended July 31 | 2020 | 2019 | 2018 | 2017 | 2016 |
| Net Asset Value, Beginning of Period | $16.58 | $18.84 | $16.83 | $13.70 | $14.48 |
| Income From Investment Operations: | | | | | |
| Net investment income (loss)1 | (0.08) | (0.12) | (0.14) | (0.14) | (0.07) |
| Net realized and unrealized gain (loss) | (1.47) | (1.51) | 3.02 | 3.42 | 0.92 |
| TOTAL FROM INVESTMENT OPERATIONS | (1.55) | (1.63) | 2.88 | 3.28 | 0.85 |
| Less Distributions: | | | | | |
| Distributions from net investment income | — | — | — | — | — |
| Distributions from net realized gain | — | (0.63) | (0.87) | (0.15) | (1.63) |
| TOTAL DISTRIBUTIONS | — | (0.63) | (0.87) | (0.15) | (1.63) |
| Net Asset Value, End of Period | $15.03 | $16.58 | $18.84 | $16.83 | $13.70 |
| Total Return2 | (9.35)% | (8.35)% | 17.60% | 23.98% | 7.12% |
| Ratios to Average Net Assets: | | | | | |
| Net expenses3 | 1.88% | 1.88% | 1.89% | 1.89% | 1.88% |
| Net investment income (loss) | (0.51)% | (0.69)% | (0.81)% | (0.89)% | (0.56)% |
| Expense waiver/reimbursement4 | 0.23% | 0.28% | 0.38% | 0.57% | 1.11% |
| Supplemental Data: | | | | | |
| Net assets, end of period (000 omitted) | $22,720 | $28,411 | $30,072 | $15,223 | $3,422 |
| Portfolio turnover | 223% | 121% | 88% | 91% | 189% |
| 1 | Per share numbers have been calculated using the average shares method. |
| 2 | Based on net asset value, which does not reflect the sales charge, redemption fee or contingent deferred sales charge, if applicable. |
| 3 | Amount does not reflect net expenses incurred by investment companies in which the Fund may invest. |
| 4 | This expense decrease is reflected in both the net expense and the net investment income (loss) ratios shown above. Amount does not reflect expense waiver/reimbursement recorded by investment companies in which the Fund may invest. |
See Notes which are an integral part of the Financial Statements
Annual Shareholder Report
Financial Highlights–Institutional Shares
(For a Share Outstanding Throughout Each Period)
| Year Ended July 31 | 2020 | 2019 | 2018 | 2017 | 2016 |
| Net Asset Value, Beginning of Period | $19.59 | $21.94 | $19.30 | $15.54 | $16.04 |
| Income From Investment Operations: | | | | | |
| Net investment income (loss)1 | 0.09 | 0.06 | 0.03 | 0.02 | 0.06 |
| Net realized and unrealized gain (loss) | (1.74) | (1.76) | 3.50 | 3.90 | 1.07 |
| TOTAL FROM INVESTMENT OPERATIONS | (1.65) | (1.70) | 3.53 | 3.92 | 1.13 |
| Less Distributions: | | | | | |
| Distributions from net investment income | (0.07) | (0.02) | (0.02) | — | — |
| Distributions from net realized gain | — | (0.63) | (0.87) | (0.16) | (1.63) |
| TOTAL DISTRIBUTIONS | (0.07) | (0.65) | (0.89) | (0.16) | (1.63) |
| Net Asset Value, End of Period | $17.87 | $19.59 | $21.94 | $19.30 | $15.54 |
| Total Return2 | (8.45)% | (7.45)% | 18.78% | 25.24% | 8.24% |
| Ratios to Average Net Assets: | | | | | |
| Net expenses3 | 0.88% | 0.88% | 0.89% | 0.89% | 0.88% |
| Net investment income | 0.49% | 0.31% | 0.13% | 0.10% | 0.43% |
| Expense waiver/reimbursement4 | 0.18% | 0.22% | 0.34% | 0.53% | 1.11% |
| Supplemental Data: | | | | | |
| Net assets, end of period (000 omitted) | $574,041 | $842,221 | $708,805 | $179,219 | $24,529 |
| Portfolio turnover | 223% | 121% | 88% | 91% | 189% |
| 1 | Per share numbers have been calculated using the average shares method. |
| 2 | Based on net asset value. |
| 3 | Amount does not reflect net expenses incurred by investment companies in which the Fund may invest. |
| 4 | This expense decrease is reflected in both the net expense and the net investment income (loss) ratios shown above. Amount does not reflect expense waiver/reimbursement recorded by investment companies in which the Fund may invest. |
See Notes which are an integral part of the Financial Statements
Annual Shareholder Report
Financial Highlights–Class R6 Shares
(For a Share Outstanding Throughout Each Period)
| | Year Ended July 31, | Period
Ended
7/31/20161 |
| 2020 | 2019 | 2018 | 2017 |
| Net Asset Value, Beginning of Period | $19.59 | $21.94 | $19.30 | $15.54 | $13.88 |
| Income From Investment Operations: | | | | | |
| Net investment income (loss)2 | 0.09 | 0.06 | 0.02 | 0.01 | (0.01) |
| Net realized and unrealized gain (loss) | (1.74) | (1.76) | 3.51 | 3.91 | 1.67 |
| TOTAL FROM INVESTMENT OPERATIONS | (1.65) | (1.70) | 3.53 | 3.92 | 1.66 |
| Less Distributions: | | | | | |
| Distributions from net investment income | (0.07) | (0.02) | (0.02) | — | — |
| Distributions from net realized gain | — | (0.63) | (0.87) | (0.16) | — |
| TOTAL DISTRIBUTIONS | (0.07) | (0.65) | (0.89) | (0.16) | — |
| Net Asset Value, End of Period | $17.87 | $19.59 | $21.94 | $19.30 | $15.54 |
| Total Return3 | (8.44)% | (7.45)% | 18.78% | 25.24% | 11.96% |
| Ratios to Average Net Assets: | | | | | |
| Net expenses4 | 0.87% | 0.87% | 0.88% | 0.88% | 0.87%5 |
| Net investment income (loss) | 0.49% | 0.32% | 0.08% | 0.04% | (0.04)%5 |
| Expense waiver/reimbursement6 | 0.08% | 0.12% | 0.26% | 0.41% | 0.97%5 |
| Supplemental Data: | | | | | |
| Net assets, end of period (000 omitted) | $47,631 | $33,753 | $13,374 | $1,017 | $07 |
| Portfolio turnover | 223% | 121% | 88% | 91% | 189%8 |
| 1 | Reflects operations for the period from June 29, 2016 (date of initial investment) to July 31, 2016. |
| 2 | Per share numbers have been calculated using the average shares method. |
| 3 | Based on net asset value. Total returns for periods of less than one year are not annualized. |
| 4 | Amount does not reflect net expenses incurred by investment companies in which the Fund may invest. |
| 5 | Computed on an annualized basis. |
| 6 | This expense decrease is reflected in both the net expense and the net investment income (loss) ratios shown above. Amount does not reflect expense waiver/reimbursement recorded by investment companies in which the Fund may invest. |
| 7 | Represents less than $1,000. |
| 8 | Portfolio turnover is calculated at the Fund level. Percentage indicated was calculated for the year ended July 31, 2016. |
See Notes which are an integral part of the Financial Statements
Annual Shareholder Report
Statement of Assets and Liabilities
July 31, 2020
| Assets: | | |
| Investment in securities, at value including $63,130,775 of securities loaned and $76,144,916 of investment in affiliated holdings* (identified cost $740,134,210) | | $793,394,925 |
| Income receivable | | 185,876 |
| Income receivable from affiliated holdings | | 2,186 |
| Receivable for investments sold | | 16,725,268 |
| Receivable for shares sold | | 684,579 |
| TOTAL ASSETS | | 810,992,834 |
| Liabilities: | | |
| Payable for investments purchased | $16,199,182 | |
| Payable for shares redeemed | 5,738,151 | |
| Payable for collateral due to broker for securities lending | 65,944,077 | |
| Payable for investment adviser fee (Note 5) | 14,008 | |
| Payable for administrative fee (Note 5) | 1,559 | |
| Payable for distribution services fee (Note 5) | 14,219 | |
| Payable for other service fees (Notes 2 and 5) | 40,198 | |
| Accrued expenses (Note 5) | 303,064 | |
| TOTAL LIABILITIES | | 88,254,458 |
| Net assets for 40,863,428 shares outstanding | | $722,738,376 |
| Net Assets Consist of: | | |
| Paid-in capital | | $785,579,052 |
| Total distributable earnings (loss) | | (62,840,676) |
| TOTAL NET ASSETS | | $722,738,376 |
Annual Shareholder Report
Statement of Assets and Liabilities–continued
| Net Asset Value, Offering Price and Redemption Proceeds Per Share | | |
| Class A Shares: | | |
| Net asset value per share ($78,346,521 ÷ 4,556,653 shares outstanding), no par value, unlimited shares authorized | | $17.19 |
| Offering price per share (100/94.50 of $17.19) | | $18.19 |
| Redemption proceeds per share | | $17.19 |
| Class C Shares: | | |
| Net asset value per share ($22,719,657 ÷ 1,511,985 shares outstanding), no par value, unlimited shares authorized | | $15.03 |
| Offering price per share | | $15.03 |
| Redemption proceeds per share (99.00/100 of $15.03) | | $14.88 |
| Institutional Shares: | | |
| Net asset value per share ($574,040,945 ÷ 32,129,720 shares outstanding), no par value, unlimited shares authorized | | $17.87 |
| Offering price per share | | $17.87 |
| Redemption proceeds per share | | $17.87 |
| Class R6 Shares: | | |
| Net asset value per share ($47,631,253 ÷ 2,665,070 shares outstanding), no par value, unlimited shares authorized | | $17.87 |
| Offering price per share | | $17.87 |
| Redemption proceeds per share | | $17.87 |
| * | See information listed after the Fund’s Portfolio of Investments. |
See Notes which are an integral part of the Financial Statements
Annual Shareholder Report
Statement of Operations
Year Ended July 31, 2020
| Investment Income: | | | |
| Dividends (including $190,663 received from affiliated companies and holdings* and net of foreign taxes withheld of $38,118) | | | $10,119,862 |
| Net income on securities loaned (includes $1,300,688 earned from affiliated company and holdings* related to cash collateral balances) (Note 2) | | | 1,535,522 |
| TOTAL INCOME | | | 11,655,384 |
| Expenses: | | | |
| Investment adviser fee (Note 5) | | $6,800,894 | |
| Administrative fee (Note 5) | | 670,710 | |
| Custodian fees | | 100,857 | |
| Transfer agent fees (Note 2) | | 1,123,472 | |
| Directors’/Trustees’ fees (Note 5) | | 6,441 | |
| Auditing fees | | 28,800 | |
| Legal fees | | 7,722 | |
| Portfolio accounting fees | | 153,698 | |
| Distribution services fee (Note 5) | | 194,337 | |
| Other service fees (Notes 2 and 5) | | 262,571 | |
| Share registration costs | | 92,592 | |
| Printing and postage | | 71,709 | |
| Miscellaneous (Note 5) | | 37,891 | |
| TOTAL EXPENSES | | 9,551,694 | |
| Waiver and Reimbursements: | | | |
| Waiver/reimbursement of investment adviser fee (Note 5) | $(663,439) | | |
| Reimbursement of other operating expenses (Notes 2 and 5) | (921,362) | | |
| TOTAL WAIVER AND REIMBURSEMENTS | | (1,584,801) | |
| Net expenses | | | 7,966,893 |
| Net investment income | | | 3,688,491 |
Annual Shareholder Report
Statement of Operations–continued
| Realized and Unrealized Gain (Loss) on Investments: | | | |
| Net realized loss on investments (including net realized gain of $1,791,996 on sales of investments in affiliated companies and holding*) | | | $(93,227,069) |
| Net change in unrealized appreciation of investments (including net change in unrealized appreciation of $7,700,021 on investments in affiliated companies and holding*) | | | (25,083,286) |
| Net realized and unrealized gain (loss) on investments | | | (118,310,355) |
| Change in net assets resulting from operations | | | $(114,621,864) |
| * | See information listed after the Fund’s Portfolio of Investments. |
See Notes which are an integral part of the Financial Statements
Annual Shareholder Report
Statement of Changes in Net Assets
| Year Ended July 31 | 2020 | 2019 |
| Increase (Decrease) in Net Assets | | |
| Operations: | | |
| Net investment income | $3,688,491 | $2,379,523 |
| Net realized loss | (93,227,069) | (6,860,147) |
| Net change in unrealized appreciation/depreciation | (25,083,286) | (64,875,679) |
| CHANGE IN NET ASSETS RESULTING FROM OPERATIONS | (114,621,864) | (69,356,303) |
| Distributions to Shareholders: | | |
| Class A Shares | (241,559) | (2,316,631) |
| Class C Shares | — | (1,156,337) |
| Institutional Shares | (3,139,873) | (24,309,562) |
| Class R6 Shares | (217,595) | (927,672) |
| CHANGE IN NET ASSETS RESULTING FROM DISTRIBUTIONS TO SHAREHOLDERS | (3,599,027) | (28,710,202) |
| Share Transactions: | | |
| Proceeds from sale of shares | 332,219,364 | 662,037,597 |
| Proceeds from shares issued in connection with the tax-free transfer of assets from the Acquired Funds | 244,171,911 | — |
| Net asset value of shares issued to shareholders in payment of distributions declared | 3,176,105 | 26,997,492 |
| Cost of shares redeemed | (711,539,671) | (444,684,151) |
| CHANGE IN NET ASSETS RESULTING FROM SHARE TRANSACTIONS | (131,972,291) | 244,350,938 |
| Change in net assets | (250,193,182) | 146,284,433 |
| Net Assets: | | |
| Beginning of period | 972,931,558 | 826,647,125 |
| End of period | $722,738,376 | $972,931,558 |
See Notes which are an integral part of the Financial Statements
Annual Shareholder Report
Notes to Financial Statements
July 31, 2020
1. ORGANIZATION
Federated Hermes MDT Series (the “Trust”) is registered under the Investment Company Act of 1940, as amended (the “Act”), as an open-end management investment company. The Trust consists of five portfolios. The financial statements included herein are only those of Federated Hermes MDT Small Cap Core Fund (the “Fund”), a diversified portfolio. The financial statements of the other portfolios are presented separately. The assets of each portfolio are segregated and a shareholder’s interest is limited to the portfolio in which shares are held. Each portfolio pays its own expenses. The Fund offers four classes of shares: Class A Shares, Class C Shares, Institutional Shares and Class R6 Shares. All shares of the Fund have equal rights with respect to voting, except on class-specific matters. The investment objective of the Fund is long-term capital appreciation.
On March 30, 2017, the Fund’s T Share Class became effective with the Securities and Exchange Commission (SEC), but is not yet offered for sale.
Effective August 1, 2018, an automatic conversion feature for Class C Shares was implemented. Pursuant to this automatic conversion feature, after Class C Shares have been held for ten years from the date of purchase, they will automatically convert to Class A Shares on the next monthly conversion processing date.
On November 15, 2019, the Fund acquired all of the net assets of PNC Multi-Factor Small Cap Core Fund, PNC Multi-Factor Small Cap Value Fund, and PNC Small Cap Fund (each an “Acquired Fund” or collectively, the “Acquired Funds”), each an open-end investment company, in a tax-free reorganization in exchange for shares of the Fund, pursuant to a plan of reorganization approved by each Acquired Funds’ shareholders on November 5, 2019. The purpose of the transaction was to combine portfolios with comparable investment objectives and strategies. For financial reporting purposes, assets received and shares issued by the Fund were recorded at fair value; however, the cost basis of the investments received from the Acquired Funds was carried forward to align ongoing reporting of the Fund’s realized gains and losses with amounts distributable to shareholders for tax purposes.
Annual Shareholder Report
For every one share of the Acquired Fund Share Class exchanged, a shareholder received the following shares of the Fund:
| PNC Fund | Share Class
Exchanged | Fund Shares
Received |
| Multi-Factor Small Cap Core Fund | A | 1.172 Class A Shares |
| C | 1.333 Class C Shares |
| I | 1.137 Institutional Shares |
| R6 | 1.135 Class R6 Shares |
| Multi-Factor Small Cap Value Fund | A | 1.042 Class A Shares |
| C | 1.039 Class C Shares |
| I | 1.102 Institutional Shares |
| Small Cap Fund | A | 0.494 Class A Shares |
| C | 0.391 Class C Shares |
| I | 0.529 Institutional Shares |
The Fund received net assets from the Acquired Funds as the result of the tax-free reorganization as follows:
Shares of the
Fund Issued | Acquired Funds’
Net Assets Received | Unrealized
Appreciation1 | Net Assets
of the Fund
Immediately
Prior to
Combination | Net Assets
of the Fund
Immediately
After
Combination |
| 12,798,626 | $244,171,911 | $71,610,835 | $881,235,561 | $1,125,407,472 |
| 1 | Unrealized Appreciation is included in the Net Assets Received amount shown above. |
Assuming the acquisition had been completed on August 1, 2019, the beginning of the annual reporting period of the Fund, the Fund’s pro forma results of operations for the year ended July 31, 2020, were as follows:
| Net investment income | $4,044,354 |
| Net realized and unrealized gain (loss) on investments | (123,022,814) |
| Net decrease in net assets resulting from operations | $(118,978,460) |
Because the combined investment portfolios have been managed as a single integrated portfolio since the acquisition was completed, it is not practicable to separate the amounts of revenue and earnings of the Acquired Funds that have been included in the Fund’s Statement of Operations and Statement of Change in Net Assets, respectively, as of July 31, 2020.
Prior to June 29, 2020, the name of the Trust and Fund was Federated MDT Series and Federated MDT Small Cap Core Fund, respectively.
2. SIGNIFICANT ACCOUNTING POLICIES
The following is a summary of significant accounting policies consistently followed by the Fund in the preparation of its financial statements. These policies are in conformity with U.S. generally accepted accounting principles (GAAP).
Annual Shareholder Report
Investment Valuation
In calculating its net asset value (NAV), the Fund generally values investments as follows:
| ■ | Equity securities listed on an exchange or traded through a regulated market system are valued at their last reported sale price or official closing price in their principal exchange or market. |
| ■ | Shares of other mutual funds or non-exchange-traded investment companies are valued based upon their reported NAVs. |
| ■ | Fixed-income securities are fair valued using price evaluations provided by a pricing service approved by the Trustees. |
| ■ | Derivative contracts listed on exchanges are valued at their reported settlement or closing price, except that options are valued at the mean of closing bid and asked quotations. |
| ■ | Over-the-counter (OTC) derivative contracts are fair valued using price evaluations provided by a pricing service approved by the Trustees. |
| ■ | For securities that are fair valued in accordance with procedures established by and under the general supervision of the Trustees, certain factors may be considered, such as: the last traded or purchase price of the security, information obtained by contacting the issuer or dealers, analysis of the issuer’s financial statements or other available documents, fundamental analytical data, the nature and duration of restrictions on disposition, the movement of the market in which the security is normally traded, public trading in similar securities or derivative contracts of the issuer or comparable issuers, movement of a relevant index, or other factors including but not limited to industry changes and relevant government actions. |
If any price, quotation, price evaluation or other pricing source is not readily available when the NAV is calculated, if the Fund cannot obtain price evaluations from a pricing service or from more than one dealer for an investment within a reasonable period of time as set forth in the Fund’s valuation policies and procedures, or if information furnished by a pricing service, in the opinion of the valuation committee (“Valuation Committee”), is deemed not representative of the fair value of such security, the Fund uses the fair value of the investment determined in accordance with the procedures described below. There can be no assurance that the Fund could obtain the fair value assigned to an investment if it sold the investment at approximately the time at which the Fund determines its NAV per share, and the actual value obtained could be materially different.
Fair Valuation Procedures
The Trustees have ultimate responsibility for determining the fair value of investments for which market quotations are not readily available. The Trustees have appointed a Valuation Committee comprised of officers of the Fund, Federated MDTA LLC (the “Adviser”), and certain of the Adviser’s affiliated companies to assist in determining fair value and in overseeing the calculation of the NAV. The Trustees have also authorized the use of pricing services recommended by the Valuation Committee to provide fair value evaluations of the current value of certain investments for purposes of calculating the NAV. The Valuation Committee employs various methods for reviewing third-party pricing-service evaluations including periodic reviews of third-party pricing services’ policies, procedures and valuation methods (including key inputs, methods, models and assumptions), transactional back-testing, comparisons of evaluations of different pricing services, and review of price challenges by the Adviser based on recent market activity. In the event that market quotations and price evaluations are not available for an
Annual Shareholder Report
investment, the Valuation Committee determines the fair value of the investment in accordance with procedures adopted by the Trustees. The Trustees periodically review and approve the fair valuations made by the Valuation Committee and any changes made to the procedures.
Factors considered by pricing services in evaluating an investment include the yields or prices of investments of comparable quality, coupon, maturity, call rights and other potential prepayments, terms and type, reported transactions, indications as to values from dealers and general market conditions. Some pricing services provide a single price evaluation reflecting the bid-side of the market for an investment (a “bid” evaluation). Other pricing services offer both bid evaluations and price evaluations indicative of a price between the prices bid and asked for the investment (a “mid” evaluation). The Fund normally uses bid evaluations for any U.S. Treasury and Agency securities, mortgage-backed securities and municipal securities. The Fund normally uses mid evaluations for any other types of fixed-income securities and any OTC derivative contracts. In the event that market quotations and price evaluations are not available for an investment, the fair value of the investment is determined in accordance with procedures adopted by the Trustees.
Repurchase Agreements
The Fund may invest in repurchase agreements for short-term liquidity purposes. It is the policy of the Fund to require the other party to a repurchase agreement to transfer to the Fund’s custodian or sub-custodian eligible securities or cash with a market value (after transaction costs) at least equal to the repurchase price to be paid under the repurchase agreement. The eligible securities are transferred to accounts with the custodian or sub-custodian in which the Fund holds a “securities entitlement” and exercises “control” as those terms are defined in the Uniform Commercial Code. The Fund has established procedures for monitoring the market value of the transferred securities and requiring the transfer of additional eligible securities if necessary to equal at least the repurchase price. These procedures also allow the other party to require securities to be transferred from the account to the extent that their market value exceeds the repurchase price or in exchange for other eligible securities of equivalent market value.
The insolvency of the other party or other failure to repurchase the securities may delay the disposition of the underlying securities or cause the Fund to receive less than the full repurchase price. Under the terms of the repurchase agreement, any amounts received by the Fund in excess of the repurchase price and related transaction costs must be remitted to the other party.
The Fund may enter into repurchase agreements in which eligible securities are transferred into joint trading accounts maintained by the custodian or sub-custodian for investment companies and other clients advised by the Fund’s Adviser and its affiliates. The Fund will participate on a pro rata basis with the other investment companies and clients in its share of the securities transferred under such repurchase agreements and in its share of proceeds from any repurchase or other disposition of such securities.
Investment Income, Gains and Losses, Expenses and Distributions
Investment transactions are accounted for on a trade-date basis. Realized gains and losses from investment transactions are recorded on an identified-cost basis. Interest income and expenses are accrued daily. Dividend income and distributions to shareholders are recorded on the ex-dividend date. Foreign dividends are recorded on
Annual Shareholder Report
the ex-dividend date or when the Fund is informed of the ex-dividend date. Distributions of net investment income, if any, are declared and paid annually. Non-cash dividends included in dividend income, if any, are recorded at fair value. Amortization/accretion of premium and discount is included in investment income. Investment income, realized and unrealized gains and losses, and certain fund-level expenses are allocated to each class based on relative average daily net assets, except that select classes will bear certain expenses unique to those classes. The detail of the total fund expense waiver and reimbursements of $1,584,801 is disclosed in Note 2 and Note 5. For the year ended July 31, 2020, transfer agent fees for the Fund were as follows:
| | Transfer Agent
Fees Incurred | Transfer Agent
Fees Reimbursed |
| Class A Shares | $207,072 | $(185,559) |
| Class C Shares | 47,763 | (40,016) |
| Institutional Shares | 861,494 | (695,787) |
| Class R6 Shares | 7,143 | — |
| TOTAL | $1,123,472 | $(921,362) |
Dividends are declared separately for each class. No class has preferential dividend rights; differences in per share dividend rates are generally due to differences in separate class expenses.
Other Service Fees
The Fund may pay other service fees up to 0.25% of the average daily net assets of the Fund’s Class A Shares and Class C Shares to unaffiliated financial intermediaries or to Federated Shareholder Services Company (FSSC) for providing services to shareholders and maintaining shareholder accounts. Subject to the terms described in the Expense Limitation note, FSSC may voluntarily reimburse the Fund for other service fees. For the year ended July 31, 2020, other service fees for the Fund were as follows:
| | Other Service
Fees Incurred |
| Class A Shares | $198,954 |
| Class C Shares | 63,617 |
| TOTAL | $262,571 |
Federal Taxes
It is the Fund’s policy to comply with the Subchapter M provision of the Internal Revenue Code (the “Code”) and to distribute to shareholders each year substantially all of its income. Accordingly, no provision for federal income tax is necessary. As of and during the year ended July 31, 2020, the Fund did not have a liability for any uncertain tax positions. The Fund recognizes interest and penalties, if any, related to tax liabilities as income tax expense in the Statement of Operations. As of July 31, 2020, tax years 2017 through 2020 remain subject to examination by the Fund’s major tax jurisdictions, which include the United States of America and the Commonwealth of Massachusetts.
Annual Shareholder Report
The Fund may be subject to taxes imposed by governments of countries in which it invests. Such taxes are generally based on either income or gains earned or repatriated. The Fund accrues and applies such taxes to net investment income, net realized gains and net unrealized gains as income and/or gains are earned.
When-Issued and Delayed-Delivery Transactions
The Fund may engage in when-issued or delayed-delivery transactions. The Fund records when-issued securities on the trade date and maintains security positions such that sufficient liquid assets will be available to make payment for the securities purchased. Securities purchased on a when-issued or delayed-delivery basis are marked to market daily and begin earning interest on the settlement date. Losses may occur on these transactions due to changes in market conditions or the failure of counterparties to perform under the contract.
Securities Lending
The Fund participates in a securities lending program providing for the lending of equity securities to qualified brokers. The term of the loans within the program is one year or less. The Fund normally receives cash collateral for securities loaned that may be invested in affiliated money market funds, other money market instruments and/or repurchase agreements. Investments in money market funds may include funds with a “floating” NAV that can impose redemption fees and liquidity gates, impose certain operational impediments to investing cash collateral, and, if the investee fund’s NAV decreases, result in the Fund recognizing losses and being required to cover the decrease in the value of the cash collateral. Collateral is maintained at a minimum level of 100% of the market value of investments loaned, plus interest, if applicable. In accordance with the Fund’s securities lending agreement, the market value of securities on loan is determined each day at the close of business and any additional collateral required to cover the value of securities on loan is delivered to the Fund on the next business day. Earnings on collateral are allocated between the borrower of the security, the securities lending agent, as a fee for its services under the program and the Fund, according to agreed-upon rates. The Fund will not have the right to vote on securities while they are on loan. However, the Fund will attempt to terminate a loan in an effort to reacquire the securities in time to vote on matters that are deemed to be material by the Adviser. There can be no assurance that the Fund will have sufficient notice of such matters to be able to terminate the loan in time to vote thereon.
Securities lending transactions are subject to Master Netting Agreements which are agreements between the Fund and its counterparties that provide for the net settlement of all transactions and collateral with the Fund, through a single payment, in the event of default or termination. Amounts presented on the Portfolio of Investments and Statement of Assets and Liabilities are not net settlement amount but gross. As indicated below, the cash collateral received by the Fund exceeds the market value of the securities loaned reducing the net settlement amount to zero. The chart below identifies the amount of collateral received as well as the market value of securities on loan. Additionally, the securities lending agreement executed by the Fund includes an indemnification clause. This clause stipulates that the borrower will reimburse the Fund for any losses as a result of any failure of the borrower to return equivalent securities to the Fund.
Annual Shareholder Report
As of July 31, 2020, securities subject to this type of arrangement and related collateral were as follows:
Market Value of
Securities Loaned | Collateral
Received |
| $63,130,775 | $65,944,077 |
Other
The preparation of financial statements in conformity with GAAP requires management to make estimates and assumptions that affect the amounts of assets, liabilities, expenses and revenues reported in the financial statements. Actual results could differ materially from those estimated. The Fund applies investment company accounting and reporting guidance.
3. SHARES OF BENEFICIAL INTEREST
The following tables summarize share activity:
| Year Ended July 31 | 2020 | 2019 |
| Class A Shares: | Shares | Amount | Shares | Amount |
| Shares sold | 1,048,052 | $17,685,551 | 1,917,717 | $36,807,080 |
| Proceeds from shares issued in connection with the tax-free transfer of assets from the Acquired Funds | 3,213,962 | 59,940,394 | — | — |
| Shares issued to shareholders in payment of distributions declared | 11,235 | 216,722 | 130,070 | 2,238,511 |
| Shares redeemed | (3,349,156) | (57,418,270) | (1,926,776) | (36,450,543) |
| NET CHANGE RESULTING FROM CLASS A SHARE TRANSACTIONS | 924,093 | $20,424,397 | 121,011 | $2,595,048 |
| Year Ended July 31 | 2020 | 2019 |
| Class C Shares: | Shares | Amount | Shares | Amount |
| Shares sold | 212,811 | $3,235,458 | 816,518 | $14,448,516 |
| Proceeds from shares issued in connection with the tax-free transfer of assets from the Acquired Funds | 474,115 | 7,751,772 | — | — |
| Shares issued to shareholders in payment of distributions declared | — | — | 69,154 | 1,050,441 |
| Shares redeemed | (888,543) | (13,324,178) | (768,042) | (12,785,661) |
| NET CHANGE RESULTING FROM CLASS C SHARE TRANSACTIONS | (201,617) | $(2,336,948) | 117,630 | $2,713,296 |
Annual Shareholder Report
| Year Ended July 31 | 2020 | 2019 |
| Institutional Shares: | Shares | Amount | Shares | Amount |
| Shares sold | 16,340,991 | $281,920,986 | 29,605,182 | $578,572,031 |
| Proceeds from shares issued in connection with the tax-free transfer of assets from the Acquired Funds | 8,269,174 | 160,173,907 | — | — |
| Shares issued to shareholders in payment of distributions declared | 140,423 | 2,809,864 | 1,278,403 | 22,792,305 |
| Shares redeemed | (35,614,006) | (613,866,572) | (20,198,281) | (386,462,699) |
| NET CHANGE RESULTING FROM INSTITUTIONAL SHARE TRANSACTIONS | (10,863,418) | $(168,961,815) | 10,685,304 | $214,901,637 |
| Year Ended July 31 | 2020 | 2019 |
| Class R6 Shares: | Shares | Amount | Shares | Amount |
| Shares sold | 1,624,311 | $29,377,369 | 1,525,579 | $32,209,970 |
| Proceeds from shares issued in connection with the tax-free transfer of assets from the Acquired Funds | 841,375 | 16,305,838 | — | — |
| Shares issued to shareholders in payment of distributions declared | 7,469 | 149,519 | 51,362 | 916,235 |
| Shares redeemed | (1,530,700) | (26,930,651) | (463,823) | (8,985,248) |
| NET CHANGE RESULTING FROM CLASS R6 SHARES TRANSACTIONS | 942,455 | $18,902,075 | 1,113,118 | $24,140,957 |
| NET CHANGE RESULTING FROM TOTAL FUND SHARE TRANSACTIONS | (9,198,487) | $(131,972,291) | 12,037,063 | $244,350,938 |
4. FEDERAL TAX INFORMATION
The accounting treatment of certain items in accordance with tax regulations may differ from the accounting treatment in accordance with GAAP which may result in permanent differences. In the case of the Fund, such differences primarily result from capital loss carryforwards and open wash sales deferrals on Acquired Funds.
For the year ended July 31, 2020, permanent differences identified and reclassified among the components of net assets were as follows:
| Increase (Decrease) |
| Paid-In Capital | Total Distributable
Earnings (Loss) |
| $2,226,630 | $(2,226,630) |
Net assets were not affected by this reclassification.
Annual Shareholder Report
The tax character of distributions as reported on the Statement of Changes in Net Assets for the years ended July 31, 2020 and 2019, was as follows:
| | 2020 | 2019 |
| Ordinary income1 | $3,599,027 | $21,486,437 |
| Long-term capital gains | $— | $7,223,765 |
| 1 | For tax purposes, short-term capital gain distributions are considered ordinary income distributions. |
As of July 31, 2020, the components of distributable earnings on a tax-basis were as follows:
| Undistributed ordinary income | $1,497,602 |
| Unrealized appreciation | $22,792,199 |
| Capital loss carryforwards | $(87,130,477) |
The difference between book-basis and tax-basis net unrealized appreciation is attributable to differing treatments for the deferral of losses on wash sales.
At July 31, 2020, the cost of investments for federal tax purposes was $770,602,726. The net unrealized appreciation of investments for federal tax purposes was $22,792,199. This consists of net unrealized appreciation from investments for those securities having an excess of value over cost of $79,295,493 and net unrealized depreciation from investments for those securities having an excess of cost over value of $56,503,294.
As of July 31, 2020, the Fund had a capital loss carryforward of $87,130,477 which will reduce the Fund’s taxable income arising from future net realized gains on investments, if any, to the extent permitted by the Code, thereby reducing the amount of distributions to shareholders which would otherwise be necessary to relieve the Fund of any liability for federal income tax. Pursuant to the Code, these net capital losses retain their character as either short-term or long-term and do not expire.
The following schedule summarizes the Fund’s capital loss carryforwards:
| Short-Term | Long-Term | Total |
| $71,706,011 | $15,424,466 | $87,130,477 |
5. INVESTMENT ADVISER FEE AND OTHER TRANSACTIONS WITH AFFILIATES
Investment Adviser Fee
The advisory agreement between the Fund and the Adviser provides for an annual fee equal to 0.80% of the Fund’s average daily net assets. Prior to July 1, 2019, the annual advisory fee was 0.85% of the Fund’s average daily net assets. Subject to the terms described in the Expense Limitation note, the Adviser may voluntarily choose to waive any portion of its fee and/or reimburse certain operating expenses of the Fund. For the year ended July 31, 2020, the Adviser voluntarily waived $605,006 of its fee and
Annual Shareholder Report
voluntarily reimbursed $921,362 of transfer agent fees. The Adviser has agreed to reimburse the Fund for certain investment adviser fees as a result of transactions in other affiliated investment companies. For the year ended July 31, 2020, the Adviser reimbursed $58,433.
Administrative Fee
Federated Administrative Services (FAS), under the Administrative Services Agreement, provides the Fund with administrative personnel and services. For purposes of determining the appropriate rate breakpoint, “Investment Complex” is defined as all of the Federated Hermes Funds subject to a fee under the Administrative Services Agreement. The fee paid to FAS is based on the average daily net assets of the Investment Complex as specified below:
| Administrative Fee | Average Daily Net Assets
of the Investment Complex |
| 0.100% | on assets up to $50 billion |
| 0.075% | on assets over $50 billion |
Subject to the terms described in the Expense Limitation note, FAS may voluntarily choose to waive any portion of its fee. For the year ended July 31, 2020, the annualized fee paid to FAS was 0.079% of average daily net assets of the Fund.
In addition, FAS may charge certain out-of-pocket expenses to the Fund.
Distribution Services Fee
The Fund has adopted a Distribution Plan (the “Plan”) pursuant to Rule 12b-1 under the Act. Under the terms of the Plan, the Fund will compensate Federated Securities Corp. (FSC), the principal distributor, from the daily net assets of the Fund’s Class A Shares and Class C Shares to finance activities intended to result in the sale of these shares. The Plan provides that the Fund may incur distribution expenses at the following percentages of average daily net assets annually, to compensate FSC:
| | Percentage of Average Daily
Net Assets of Class |
| Class A Shares | 0.05% |
| Class C Shares | 0.75% |
Subject to the terms described in the Expense Limitation note, FSC may voluntarily choose to waive any portion of its fee. For the year ended July 31, 2020, distribution services fees for the Fund were as follows:
| | Distribution Services
Fees Incurred |
| Class C Shares | $194,337 |
When FSC receives fees, it may pay some or all of them to financial intermediaries whose customers purchase shares.
For the year ended July 31, 2020, FSC retained $46,219 of fees paid by the Fund. For the year ended July 31, 2020, the Fund’s Class A Shares did not incur a distribution services fee; however, it may begin to incur this fee upon approval of the Trustees.
Annual Shareholder Report
Other Service Fees
For the year ended July 31, 2020, FSSC received $2,024 of the other service fees disclosed in Note 2.
Sales Charges
Front-end sales charges and contingent deferred sales charges (CDSC) do not represent expenses of the Fund. They are deducted from the proceeds of sales of Fund shares prior to investment or from redemption proceeds prior to remittance, as applicable. For the year ended July 31, 2020, FSC retained $3,266 in sales charges from the sale of Class A Shares. FSC also retained $7,638 and $2,877 of CDSC relating to redemptions of Class A Shares and Class C Shares, respectively.
Expense Limitation
The Adviser and certain of its affiliates (which may include FSC, FAS and FSSC) on their own initiative have agreed to waive certain amounts of their respective fees and/or reimburse expenses. Total annual fund operating expenses (as shown in the financial highlights, excluding interest expense, extraordinary expenses and proxy-related expenses paid by the Fund, if any) paid by the Fund’s Class A Shares, Class C Shares, Institutional Shares and Class R6 Shares (after the voluntary waivers and/or reimbursements) will not exceed 1.13%, 1.88%, 0.88% and 0.87% (the “Fee Limit”), respectively, up to but not including the later of (the “Termination Date”): (a) October 1, 2021; or (b) the date of the Fund’s next effective Prospectus. While the Adviser and its applicable affiliates currently do not anticipate terminating or increasing these arrangements prior to the Termination Date, these arrangements may only be terminated or the Fee Limit increased prior to the Termination Date with the agreement of the Trustees.
Directors’/Trustees’ and Miscellaneous Fees
Certain Officers and Trustees of the Fund are Officers and Directors or Trustees of certain of the above companies. To efficiently facilitate payment, Independent Directors’/Trustees’ fees and certain expenses related to conducting meetings of the Directors/Trustees and other miscellaneous expenses are paid by an affiliate of the Adviser which in due course are reimbursed by the Fund. These expenses related to conducting meetings of the Directors/Trustees and other miscellaneous expenses may be included in Accrued and Miscellaneous Expenses on the Statement of Assets and Liabilities and Statement of Operations, respectively.
6. INVESTMENT TRANSACTIONS
Purchases and sales of investments, excluding long-term U.S. government securities and short-term obligations, for the year ended July 31, 2020, were as follows:
| Purchases | $1,873,885,080 |
| Sales | $2,065,946,544 |
7. LINE OF CREDIT
The Fund participates with certain other Federated Hermes Funds, on a several basis, in an up to $500,000,000 unsecured, 364-day, committed, revolving line of credit (LOC) agreement. The LOC was made available to temporarily finance the repurchase or redemption of shares of the Fund, failed trades, payment of dividends, settlement of
Annual Shareholder Report
trades and for other short-term, temporary or emergency general business purposes. The Fund cannot borrow under the LOC if an inter-fund loan is outstanding. The Fund’s ability to borrow under the LOC also is subject to the limitations of the Act and various conditions precedent that must be satisfied before the Fund can borrow. Loans under the LOC are charged interest at a fluctuating rate per annum equal to the highest, on any day, of (a) (i) the federal funds effective rate, (ii) the one month London Interbank Offered Rate (LIBOR), or a replacement rate as appropriate, and (iii) 0.0%, plus (b) a margin. Any fund eligible to borrow under the LOC pays its pro rata share of an upfront fee, and its pro rata share of a commitment fee based on the amount of the lenders’ commitment that has not been utilized, quarterly in arrears and at maturity. As of July 31, 2020, the Fund had no outstanding loans. During the year ended July 31, 2020, the Fund did not utilize the LOC.
8. INTERFUND LENDING
Pursuant to an Exemptive Order issued by the SEC, the Fund, along with other funds advised by subsidiaries of Federated Hermes, Inc., may participate in an interfund lending program. This program provides an alternative credit facility allowing the Fund to borrow from other participating affiliated funds. As of July 31, 2020, there were no outstanding loans. During the year ended July 31, 2020, the program was not utilized.
9. OTHER MATTERS
An outbreak of respiratory disease caused by a novel coronavirus was first detected in China in December 2019 and subsequently spread globally. As of the date of the issuance of these financial statements, this coronavirus has resulted in closing borders, enhanced health screenings, healthcare service preparation and delivery, quarantines, cancellations, and disruptions to supply chains, workflow operations and consumer activity, as well as general concern and uncertainty. The impact of this coronavirus may be short-term or may last for an extended period of time and has resulted in a substantial economic downturn. Health crises caused by outbreaks, such as the coronavirus outbreak, may exacerbate other pre-existing political, social and economic risks. The impact of this outbreak, and other epidemics and pandemics that may arise in the future, could continue to negatively affect the worldwide economy, as well as the economies of individual countries, individual companies (including certain Fund service providers and issuers of the Fund’s investments) and the markets in general in significant and unforeseen ways. Any such impact could adversely affect the Fund’s performance.
10. FEDERAL TAX INFORMATION (UNAUDITED)
For the fiscal year ended July 31, 2020, 100.00% of total ordinary income distributions made by the Fund are qualifying dividends which may be subject to a maximum tax rate of 15%, as provided for by the Jobs and Growth Tax Relief Act of 2003. Complete information is reported in conjunction with the reporting of your distributions on Form 1099-DIV.
Of the ordinary income distributions made by the Fund during the year ended July 31, 2020, 100.00% qualify for the dividend received deduction available to corporate shareholders.
Annual Shareholder Report
Report of Independent Registered Public Accounting Firm
TO THE board of trustees OF federated Hermes MDT Series and shareholders of Federated Hermes MDT Small Cap Core Fund:
Opinion on the Financial Statements
We have audited the accompanying statement of assets and liabilities of Federated Hermes MDT Small Cap Core Fund (formerly, Federated MDT Small Cap Core Fund) (the “Fund”) (one of the portfolios constituting Federated Hermes MDT Series (formerly, Federated MDT Series) (the “Trust”)), including the portfolio of investments, as of July 31, 2020, and the related statement of operations for the year then ended, the statement of changes in net assets for each of the two years in the period then ended, the financial highlights for each of the five years in the period then ended and the related notes (collectively referred to as the “financial statements”). In our opinion, the financial statements present fairly, in all material respects, the financial position of the Fund (one of the funds constituting Federated Hermes MDT Series) at July 31, 2020, the results of its operations for the year then ended, the changes in its net assets for each of the two years in the period then ended and its financial highlights for each of the five years in the period then ended, in conformity with U.S. generally accepted accounting principles.
Basis for Opinion
These financial statements are the responsibility of the Trust’s management. Our responsibility is to express an opinion on the Fund’s financial statements based on our audits. We are a public accounting firm registered with the Public Company Accounting Oversight Board (United States) (“PCAOB”) and are required to be independent with respect to the Trust in accordance with the U.S. federal securities laws and the applicable rules and regulations of the Securities and Exchange Commission and the PCAOB.
We conducted our audits in accordance with standards of the PCAOB. Those standards require that we plan and perform the audit to obtain reasonable assurance about whether the financial statements and financial highlights are free of material misstatement, whether due to error or fraud. The Trust is not required to have, nor were we engaged to perform, an audit of the Trust’s internal control over financial reporting. As part of our audits, we are required to obtain an understanding of internal control over financial reporting, but not for the purpose of expressing an opinion on the effectiveness of the Trust’s internal control over financial reporting. Accordingly, we express no such opinion.
Annual Shareholder Report
Our audits included performing procedures to assess the risks of material misstatement of the financial statements, whether due to error or fraud, and performing procedures that respond to those risks. Such procedures included examining, on a test basis, evidence regarding the amounts and disclosures in the financial statements. Our procedures included confirmation of securities owned as of July 31, 2020, by correspondence with the custodian and others or by other appropriate auditing procedures where replies from others were not received. Our audits also included evaluating the accounting principles used and significant estimates made by management, as well as evaluating the overall presentation of the financial statements. We believe that our audits provide a reasonable basis for our opinion.
We have served as the auditor of one or more Federated Hermes investment companies since 1979.
Boston, Massachusetts
September 22, 2020
Annual Shareholder Report
Shareholder Expense Example (unaudited)
As a shareholder of the Fund, you incur two types of costs: (1) transaction costs, including sales charges (loads) on purchase or redemption payments; and (2) ongoing costs, including management fees and to the extent applicable, distribution (12b-1) fees and/or other service fees and other Fund expenses. This Example is intended to help you to understand your ongoing costs (in dollars) of investing in the Fund and to compare these costs with the ongoing costs of investing in other mutual funds. It is based on an investment of $1,000 invested at the beginning of the period and held for the entire period from February 1, 2020 to July 31, 2020.
ACTUAL EXPENSES
The first section of the table below provides information about actual account values and actual expenses. You may use the information in this section, together with the amount you invested, to estimate the expenses that you incurred over the period. Simply divide your account value by $1,000 (for example, an $8,600 account value divided by $1,000 = 8.6), then multiply the result by the number in the first section under the heading entitled “Expenses Paid During Period” to estimate the expenses attributable to your investment during this period.
HYPOTHETICAL EXAMPLE FOR COMPARISON PURPOSES
The second section of the table below provides information about hypothetical account values and hypothetical expenses based on the Fund’s actual expense ratio and an assumed rate of return of 5% per year before expenses, which is not the Fund’s actual return. Thus, you should not use the hypothetical account values and expenses to estimate the actual ending account balance or your expenses for the period. Rather, these figures are required to be provided to enable you to compare the ongoing costs of investing in the Fund with other funds. To do so, compare this 5% hypothetical example with the 5% hypothetical examples that appear in the shareholder reports of the other funds.
Annual Shareholder Report
Please note that the expenses shown in the table are meant to highlight your ongoing costs only and do not reflect any transaction costs, such as sales charges (loads) on purchase or redemption payments. Therefore, the second section of the table is useful in comparing ongoing costs only, and will not help you determine the relative total costs of owning different funds. In addition, if these transaction costs were included, your costs would have been higher.
| | Beginning
Account Value
2/1/2020 | Ending
Account Value
7/31/2020 | Expenses Paid
During Period1 |
| Actual: | | | |
| Class A Shares | $1,000 | $920.20 | $5.39 |
| Class C Shares | $1,000 | $917.60 | $8.96 |
| Institutional Shares | $1,000 | $922.10 | $4.21 |
| Class R6 Shares | $1,000 | $925.20 | $4.16 |
Hypothetical (assuming a 5% return
before expenses): | | | |
| Class A Shares | $1,000 | $1,019.20 | $5.67 |
| Class C Shares | $1,000 | $1,015.50 | $9.42 |
| Institutional Shares | $1,000 | $1,020.50 | $4.42 |
| Class R6 Shares | $1,000 | $1,020.50 | $4.37 |
| 1 | Expenses are equal to the Fund’s annualized net expense ratios, multiplied by the average account value over the period, multiplied by 182/366 (to reflect the one-half-year period). The annualized net expense ratios are as follows: |
| | |
| Class A Shares | 1.13% |
| Class C Shares | 1.88% |
| Institutional Shares | 0.88% |
| Class R6 Shares | 0.87% |
Annual Shareholder Report
Board of Trustees and Trust Officers
The Board of Trustees is responsible for managing the Trust’s business affairs and for exercising all the Trust’s powers except those reserved for the shareholders. The following tables give information about each Trustee and the senior officers of the Fund. Where required, the tables separately list Trustees who are “interested persons” of the Fund (i.e., “Interested” Trustees) and those who are not (i.e., “Independent” Trustees). Unless otherwise noted, the address of each person listed is 1001 Liberty Avenue, Pittsburgh, PA 15222. The address of all Independent Trustees listed is 4000 Ericsson Drive, Warrendale, PA 15086-7561; Attention: Mutual Fund Board. As of December 31, 2019, the Trust comprised five portfolio(s), and the Federated Hermes Fund Family consisted of 41 investment companies (comprising 135 portfolios). Unless otherwise noted, each Officer is elected annually. Unless otherwise noted, each Trustee oversees all portfolios in the Federated Hermes Fund Family and serves for an indefinite term. The Fund’s Statement of Additional Information includes additional information about Trust Trustees and is available, without charge and upon request, by calling 1-800-341-7400.
Interested TRUSTEES Background
Name
Birth Date
Positions Held with Trust
Date Service Began | Principal Occupation(s) for Past Five Years,
Other Directorships Held and Previous Position(s) |
J. Christopher Donahue*
Birth Date: April 11, 1949
President and Trustee
Indefinite Term
Began serving: May 2006 | Principal Occupations: Principal Executive Officer and President of certain of the Funds in the Federated Hermes Fund Family; Director or Trustee of the Funds in the Federated Hermes Fund Family; President, Chief Executive Officer and Director, Federated Hermes, Inc.; Chairman and Trustee, Federated Investment Management Company; Trustee, Federated Investment Counseling; Chairman and Director, Federated Global Investment Management Corp.; Chairman and Trustee, Federated Equity Management Company of Pennsylvania; Trustee, Federated Shareholder Services Company; Director, Federated Services Company.
Previous Positions: President, Federated Investment Counseling; President and Chief Executive Officer, Federated Investment Management Company, Federated Global Investment Management Corp. and Passport Research, Ltd; Chairman, Passport Research, Ltd. |
Annual Shareholder Report
Name
Birth Date
Positions Held with Trust
Date Service Began | Principal Occupation(s) for Past Five Years,
Other Directorships Held and Previous Position(s) |
John B. Fisher*
Birth Date: May 16, 1956
Trustee
Indefinite Term
Began serving: May 2016 | Principal Occupations: Principal Executive Officer and President of certain of the Funds in the Federated Hermes Fund Family; Director or Trustee of certain of the Funds in the Federated Hermes Fund Family; Vice President, Federated Hermes, Inc.; President, Director/Trustee and CEO, Federated Advisory Services Company, Federated Equity Management Company of Pennsylvania, Federated Global Investment Management Corp., Federated Investment Counseling, Federated Investment Management Company; President of some of the Funds in the Federated Hermes Fund Family and Director, Federated Investors Trust Company.
Previous Positions: President and Director of the Institutional Sales Division of Federated Securities Corp.; President and Director of Federated Investment Counseling; President and CEO of Passport Research, Ltd.; Director, Edgewood Securities Corp.; Director, Federated Services Company; Director, Federated Hermes, Inc.; Chairman and Director, Southpointe Distribution Services, Inc. and President, Technology, Federated Services Company. |
| * | Reasons for “interested” status: J. Christopher Donahue and John B. Fisher are interested due to their beneficial ownership of shares of Federated Hermes, Inc. and due to positions they hold with Federated Hermes, Inc. and its subsidiaries. |
INDEPENDENT TRUSTEES Background
Name
Birth Date
Positions Held with Trust
Date Service Began | Principal Occupation(s) for Past Five Years,
Other Directorships Held, Previous Position(s) and Qualifications |
John T. Collins
Birth Date: January 24, 1947
Trustee
Indefinite Term
Began serving:
October 2013 | Principal Occupations: Director or Trustee of the Federated Hermes Fund Family; formerly, Chairman and CEO, The Collins Group, Inc. (a private equity firm) (Retired).
Other Directorships Held: Chairman of the Board of Directors, Director, and Chairman of the Compensation Committee, KLX Energy Services Holdings, Inc. (oilfield services); former Director of KLX Corp. (aerospace).
Qualifications: Mr. Collins has served in several business and financial management roles and directorship positions throughout his career. Mr. Collins previously served as Chairman and CEO of The Collins Group, Inc. (a private equity firm) and as a Director of KLX Corp. Mr. Collins serves as Chairman Emeriti, Bentley University. Mr. Collins previously served as Director and Audit Committee Member, Bank of America Corp.; Director, FleetBoston Financial Corp.; and Director, Beth Israel Deaconess Medical Center (Harvard University Affiliate Hospital). |
Annual Shareholder Report
Name
Birth Date
Positions Held with Trust
Date Service Began | Principal Occupation(s) for Past Five Years,
Other Directorships Held, Previous Position(s) and Qualifications |
G. Thomas Hough
Birth Date: February 28, 1955
Trustee
Indefinite Term
Began serving: August 2015 | Principal Occupations: Director or Trustee, Chair of the Audit Committee of the Federated Hermes Fund Family; formerly, Vice Chair, Ernst & Young LLP (public accounting firm) (Retired).
Other Directorships Held: Director, Chair of the Audit Committee, Equifax, Inc.; Director, Member of the Audit Committee, Haverty Furniture Companies, Inc.; formerly, Director, Member of Governance and Compensation Committees, Publix Super Markets, Inc.
Qualifications: Mr. Hough has served in accounting, business management and directorship positions throughout his career. Mr. Hough most recently held the position of Americas Vice Chair of Assurance with Ernst & Young LLP (public accounting firm). Mr. Hough serves on the President’s Cabinet and Business School Board of Visitors for the University of Alabama. Mr. Hough previously served on the Business School Board of Visitors for Wake Forest University, and he previously served as an Executive Committee member of the United States Golf Association. |
Maureen Lally-Green
Birth Date: July 5, 1949
Trustee
Indefinite Term
Began serving: August 2009 | Principal Occupations: Director or Trustee of the Federated Hermes Fund Family; Adjunct Professor of Law, Duquesne University School of Law; formerly, Dean of the Duquesne University School of Law and Professor of Law and Interim Dean of the Duquesne University School of Law; formerly, Associate General Secretary and Director, Office of Church Relations, Diocese of Pittsburgh.
Other Directorships Held: Director, CNX Resources Corporation (formerly known as CONSOL Energy Inc.).
Qualifications: Judge Lally-Green has served in various legal and business roles and directorship positions throughout her career. Judge Lally-Green previously held the position of Dean of the School of Law of Duquesne University (as well as Interim Dean). Judge Lally-Green previously served as a member of the Superior Court of Pennsylvania and as a Professor of Law, Duquesne University School of Law. Judge Lally-Green was appointed by the Supreme Court of Pennsylvania to serve on the Supreme Court’s Board of Continuing Judicial Education and the Supreme Court’s Appellate Court Procedural Rules Committee. Judge Lally-Green also currently holds the positions on not for profit or for profit boards of directors as follows: Director and Chair, UPMC Mercy Hospital; Director and Vice Chair, Our Campaign for the Church Alive!, Inc.; Regent, Saint Vincent Seminary; Member, Pennsylvania State Board of Education (public); Director, Catholic Charities, Pittsburgh; and Director CNX Resources Corporation (formerly known as CONSOL Energy Inc.). Judge Lally-Green has held the positions of: Director, Auberle; Director, Epilepsy Foundation of Western and Central Pennsylvania; Director, Ireland Institute of Pittsburgh; Director, Saint Thomas More Society; Director and Chair, Catholic High Schools of the Diocese of Pittsburgh, Inc.; Director, Pennsylvania Bar Institute; Director, St. Vincent College; and Director and Chair, North Catholic High School, Inc. |
Annual Shareholder Report
Name
Birth Date
Positions Held with Trust
Date Service Began | Principal Occupation(s) for Past Five Years,
Other Directorships Held, Previous Position(s) and Qualifications |
Charles F. Mansfield, Jr.
Birth Date: April 10, 1945
Trustee
Indefinite Term
Began serving: June 2006 | Principal Occupations: Director or Trustee of the Federated Hermes Fund Family; Management Consultant and Author.
Other Directorships Held: None.
Qualifications: Mr. Mansfield has served as a Marine Corps officer and in several banking, business management, educational roles and directorship positions throughout his long career. He remains active as a Management Consultant and Author. |
Thomas M. O’Neill
Birth Date: June 14, 1951
Trustee
Indefinite Term
Began serving: August 2006 | Principal Occupations: Director or Trustee of the Federated Hermes Fund Family; Sole Proprietor, Navigator Management Company (investment and strategic consulting).
Other Directorships Held: None.
Qualifications: Mr. O’Neill has served in several business, mutual fund and financial management roles and directorship positions throughout his career. Mr. O’Neill serves as Director, Medicines for Humanity and Director, The Golisano Children’s Museum of Naples, Florida. Mr. O’Neill previously served as Chief Executive Officer and President, Managing Director and Chief Investment Officer, Fleet Investment Advisors; President and Chief Executive Officer, Aeltus Investment Management, Inc.; General Partner, Hellman, Jordan Management Co., Boston, MA; Chief Investment Officer, The Putnam Companies, Boston, MA; Credit Analyst and Lending Officer, Fleet Bank; Director and Consultant, EZE Castle Software (investment order management software); and Director, Midway Pacific (lumber). |
P. Jerome Richey
Birth Date: February 23, 1949
Trustee
Indefinite Term
Began serving:
October 2013 | Principal Occupations: Director or Trustee of the Federated Hermes Fund Family; Management Consultant; Retired; formerly, Senior Vice Chancellor and Chief Legal Officer, University of Pittsburgh and Executive Vice President and Chief Legal Officer, CNX Resources Corporation (formerly known as CONSOL Energy Inc.).
Other Directorships Held: None.
Qualifications: Mr. Richey has served in several business and legal management roles and directorship positions throughout his career. Mr. Richey most recently held the positions of Senior Vice Chancellor and Chief Legal Officer, University of Pittsburgh. Mr. Richey previously served as Chairman of the Board, Epilepsy Foundation of Western Pennsylvania and Chairman of the Board, World Affairs Council of Pittsburgh. Mr. Richey previously served as Chief Legal Officer and Executive Vice President, CNX Resources Corporation (formerly known as CONSOL Energy Inc.); and Board Member, Ethics Counsel and Shareholder, Buchanan Ingersoll & Rooney PC (a law firm). |
Annual Shareholder Report
Name
Birth Date
Positions Held with Trust
Date Service Began | Principal Occupation(s) for Past Five Years,
Other Directorships Held, Previous Position(s) and Qualifications |
John S. Walsh
Birth Date:
November 28, 1957
Trustee
Indefinite Term
Began serving: June 2006 | Principal Occupations: Director or Trustee, and Chair of the Board of Directors or Trustees, of the Federated Hermes Fund Family; President and Director, Heat Wagon, Inc. (manufacturer of construction temporary heaters); President and Director, Manufacturers Products, Inc. (distributor of portable construction heaters); President, Portable Heater Parts, a division of Manufacturers Products, Inc.
Other Directorships Held: None.
Qualifications: Mr. Walsh has served in several business management roles and directorship positions throughout his career. Mr. Walsh previously served as Vice President, Walsh & Kelly, Inc. (paving contractors). |
OFFICERS
Name
Birth Date
Address
Positions Held with Trust
Date Service Began | Principal Occupation(s) for Past Five Years
and Previous Position(s) |
Lori A. Hensler
Birth Date: January 6, 1967
TREASURER
Officer since: April 2013 | Principal Occupations: Principal Financial Officer and Treasurer of the Federated Hermes Fund Family; Senior Vice President, Federated Administrative Services; Financial and Operations Principal for Federated Securities Corp. and Edgewood Services, Inc.; and Assistant Treasurer, Federated Investors Trust Company. Ms. Hensler has received the Certified Public Accountant designation.
Previous Positions: Controller of Federated Hermes, Inc.; Senior Vice President and Assistant Treasurer, Federated Investors Management Company; Treasurer, Federated Investors Trust Company; Assistant Treasurer, Federated Administrative Services, Federated Administrative Services, Inc., Federated Securities Corp., Edgewood Services, Inc., Federated Advisory Services Company, Federated Equity Management Company of Pennsylvania, Federated Global Investment Management Corp., Federated Investment Counseling, Federated Investment Management Company, Passport Research, Ltd., and Federated MDTA, LLC; Financial and Operations Principal for Federated Securities Corp., Edgewood Services, Inc. and Southpointe Distribution Services, Inc. |
Annual Shareholder Report
Name
Birth Date
Address
Positions Held with Trust
Date Service Began | Principal Occupation(s) for Past Five Years
and Previous Position(s) |
Peter J. Germain
Birth Date:
September 3, 1959
CHIEF LEGAL OFFICER, SECRETARY and EXECUTIVE VICE PRESIDENT
Officer since: June 2006 | Principal Occupations: Mr. Germain is Chief Legal Officer, Secretary and Executive Vice President of the Federated Hermes Fund Family. He is General Counsel, Chief Legal Officer, Secretary and Executive Vice President, Federated Hermes, Inc.; Trustee and Senior Vice President, Federated Investors Management Company; Trustee and President, Federated Administrative Services; Director and President, Federated Administrative Services, Inc.; Director and Vice President, Federated Securities Corp.; Director and Secretary, Federated Private Asset Management, Inc.; Secretary, Federated Shareholder Services Company; and Secretary, Retirement Plan Service Company of America. Mr. Germain joined Federated Hermes in 1984 and is a member of the Pennsylvania Bar Association.
Previous Positions: Deputy General Counsel, Special Counsel, Managing Director of Mutual Fund Services, Federated Hermes, Inc.; Senior Vice President, Federated Services Company; and Senior Corporate Counsel, Federated Hermes, Inc. |
Stephen Van Meter
Birth Date: June 5, 1975
CHIEF COMPLIANCE OFFICER AND SENIOR VICE PRESIDENT
Officer since: July 2015 | Principal Occupations: Senior Vice President and Chief Compliance Officer of the Federated Hermes Fund Family; Vice President and Chief Compliance Officer of Federated Hermes, Inc. and Chief Compliance Officer of certain of its subsidiaries. Mr. Van Meter joined Federated Hermes, Inc. in October 2011. He holds FINRA licenses under Series 3, 7, 24 and 66.
Previous Positions: Mr. Van Meter previously held the position of Compliance Operating Officer, Federated Hermes, Inc. Prior to joining Federated Hermes, Inc., Mr. Van Meter served at the United States Securities and Exchange Commission in the positions of Senior Counsel, Office of Chief Counsel, Division of Investment Management and Senior Counsel, Division of Enforcement. |
Stephen F. Auth
Birth Date: September 13, 1956
101 Park Avenue
41st Floor
New York, NY 10178
CHIEF INVESTMENT OFFICER
Officer since: June 2012 | Principal Occupations: Stephen F. Auth is Chief Investment Officer of various Funds in the Federated Hermes Fund Family; Executive Vice President, Federated Investment Counseling, Federated Global Investment Management Corp. and Federated Equity Management Company of Pennsylvania.
Previous Positions: Executive Vice President, Federated Investment Management Company and Passport Research, Ltd. (investment advisory subsidiary of Federated); Senior Vice President, Global Portfolio Management Services Division; Senior Vice President, Federated Investment Management Company and Passport Research, Ltd.; Senior Managing Director and Portfolio Manager, Prudential Investments. |
Annual Shareholder Report
Evaluation and Approval of Advisory Contract–May 2020
Federated MDT Small Cap Core Fund (the “Fund”)
(EFFECTIVE CLOSE OF BUSINESS ON JUNE 26, 2020, THE FUND’S NAME CHANGED TO FEDERATED HERMES MDT SMALL CAP CORE FUND)
At its meetings in May 2020 (the “May Meetings”), the Fund’s Board of Trustees (the “Board”), including a majority of those Trustees who are not “interested persons” of the Fund, as defined in the Investment Company Act of 1940 (the “Independent Trustees”), reviewed and unanimously approved the continuation of the investment advisory contract between the Fund and Federated MDTA LLC (the “Adviser”) with respect to the Fund (the “Contract”) for an additional one-year term. The Board’s determination to approve the continuation of the Contract reflects the exercise of its business judgment after considering all of the information and factors believed to be relevant and appropriate on whether to continue the existing arrangements. The information, factors and conclusions that formed the basis for the Board’s approval are summarized below.
Information Received and Review Process
At the request of the Independent Trustees, the Fund’s Chief Compliance Officer (the “CCO”) furnished to the Board in advance of its May Meetings an independent written evaluation presenting on the topics discussed below. The Board considered the CCO’s independent written evaluation (the “CCO Fee Evaluation Report”), along with other information, in evaluating the reasonableness of the Fund’s management fee and in determining to approve the continuation of the Contract. The CCO, in preparing the CCO Fee Evaluation Report, has the authority to retain consultants, experts or staff as reasonably necessary to assist in the performance of his duties, reports directly to the Board, and can be terminated only with the approval of a majority of the Independent Trustees. At the request of the Independent Trustees, the CCO Fee Evaluation Report followed the same general approach and covered the same topics as that of the report that had previously been delivered by the CCO in his capacity as “Senior Officer,” prior to the elimination of the Senior Officer position in December 2017.
In addition to the extensive materials that comprise and accompany the CCO Fee Evaluation Report, in the months preceding the May Meetings, the Board requested and reviewed written responses and supporting materials prepared by the Adviser and its affiliates (collectively, “Federated Hermes”) in response to requests posed to Federated Hermes on behalf of the Independent Trustees encompassing a wide variety of topics. The Board also considered such additional matters as the Independent Trustees deemed reasonably necessary to evaluate the Contract, which included detailed information about the Fund and Federated Hermes furnished to the Board at its meetings throughout the year
Annual Shareholder Report
and in between regularly scheduled meetings on particular matters as the need arose, as well as information specifically prepared in connection with the approval of the continuation of the Contract that was presented at the May Meetings.
The Board’s consideration of the Contract included review of materials and information covering the following matters, among others: the Adviser’s investment philosophy, revenue, profitability, personnel and processes; investment and operating strategies; the Fund’s short-term and long-term performance (in absolute terms, both on a gross basis and net of expenses, and relative to the Fund’s particular investment program and a group of its peer funds and/or its benchmark, as appropriate) and comments on the reasons for the Fund’s performance; the Fund’s investment objectives; the Fund’s expenses, including the advisory fee and the overall expense structure of the Fund (both in absolute terms and relative to a group of its peer funds), with due regard for contractual or voluntary expense limitations (if any); the use and allocation of brokerage commissions derived from trading the Fund’s portfolio securities (if any); and the nature, quality and extent of the advisory and other services provided to the Fund by the Adviser and its affiliates. The Board also considered the preferences and expectations of Fund shareholders; the entrepreneurial and other risks assumed by the Adviser in sponsoring and managing the Fund; the continuing state of competition in the mutual fund industry and market practices; the range of comparable fees for similar funds in the mutual fund industry; the Fund’s relationship to the other funds advised by Federated Hermes (each, a “Federated Hermes Fund”), which include a comprehensive array of funds with different investment objectives, policies and strategies which are generally available for exchange without the incurrence of additional sales charges; compliance and audit reports concerning the Federated Hermes Funds and the Federated Hermes’ affiliates that service them (including communications from regulatory agencies), as well as Federated Hermes’ responses to any issues raised therein; and relevant developments in the mutual fund industry and how the Federated Hermes Funds and/or Federated Hermes may be responding to them. In addition, the Board received and considered information furnished by Federated Hermes on the impacts of the coronavirus (COVID-19) outbreak on Federated Hermes generally and the Fund in particular, including, among other information, the current and anticipated impacts on the management, operations and performance of the Fund. The Board noted that its evaluation process is evolutionary and that the criteria considered and the emphasis placed on relevant criteria may change in recognition of changing circumstances in the mutual fund marketplace.
The Board also considered judicial decisions concerning allegedly excessive investment advisory fees in determining to approve the Contract. Using these judicial decisions as a guide, the Board observed that the following factors may be relevant to an adviser’s fiduciary duty with respect to its receipt of
Annual Shareholder Report
compensation from a fund: (1) the nature and quality of the services provided by an adviser to a fund and its shareholders (including the performance of the fund, its benchmark, and comparable funds); (2) an adviser’s cost of providing the services (including the profitability to an adviser of providing advisory services to a fund); (3) the extent to which an adviser may realize “economies of scale” as a fund grows larger and, if such economies of scale exist, whether they have been shared with a fund and its shareholders or the family of funds; (4) any “fall-out” financial benefits that accrue to an adviser because of its relationship with a fund (including research services received from brokers that execute fund trades and any fees paid to affiliates of an adviser for services rendered to a fund); (5) comparative fee and expense structures (including a comparison of fees paid to an adviser with those paid by similar funds both internally and externally as well as management fees charged to institutional and other advisory clients of the adviser for what might be viewed as like services); and (6) the extent of care, conscientiousness and independence with which the fund’s board members perform their duties and their expertise (including whether they are fully informed about all facts the board deems relevant to its consideration of an adviser’s services and fees). The Board noted that the Securities and Exchange Commission (“SEC”) disclosure requirements regarding the basis for a fund board’s approval of the fund’s investment advisory contracts generally align with the factors listed above. The Board was aware of these factors and was guided by them in its review of the Contract to the extent it considered them to be appropriate and relevant, as discussed further below.
The Board considered and weighed these factors in light of its substantial accumulated experience in governing the Fund and working with Federated Hermes on matters relating to the Federated Hermes Funds. While individual members of the Board may have weighed certain factors differently, the Board’s determination to continue the Contract was based on a comprehensive consideration of all information provided to the Board throughout the year and specifically with respect to the continuation of the Contract. The Independent Trustees were assisted throughout the evaluation process by independent legal counsel. In connection with their deliberations at the May Meetings, the Independent Trustees met separately in executive session with their independent legal counsel and without management present to review the relevant materials and consider their responsibilities under applicable laws. In addition, senior management representatives of Federated Hermes also met with the Independent Trustees and their independent legal counsel to discuss the materials and presentations furnished to the Board at the May Meetings. The Board considered the approval of the Contract for the Fund as part of its consideration of agreements for funds across the Federated Hermes Funds family, but its approvals were made on a fund-by-fund basis.
Annual Shareholder Report
Nature, Extent and Quality of Services
The Board considered the nature, extent and quality of the services provided to the Fund by the Adviser and the resources of the Adviser and its affiliates dedicated to the Fund. In this regard, the Board evaluated, among other things, the Adviser’s personnel, experience and track record, as well as the financial resources and overall reputation of Federated Hermes and its willingness to invest in personnel and infrastructure that benefit the Federated Hermes Funds. The Board noted the significant acquisition of Hermes Fund Managers Limited by Federated Hermes in 2018, which has deepened the organization’s investment management expertise and capabilities and expanded the investment process for all of the Federated Hermes Funds to incorporate environmental, social and governance (“ESG”) factors and issuer engagement on ESG matters.
In addition, the Board reviewed the qualifications, backgrounds and responsibilities of the portfolio management team primarily responsible for the day-to-day management of the Fund and the Adviser’s ability and experience in attracting and retaining qualified personnel to service the Fund. The Board noted the compliance program of the Adviser and the compliance-related resources devoted by the Adviser and its affiliates in support of the Fund’s obligations pursuant to Rule 38a-1 under the Investment Company Act of 1940, including the Adviser’s commitment to respond to rulemaking and other regulatory initiatives of the SEC. such as the liquidity risk management program rules. In addition, the Board considered the response by the Adviser to recent market conditions and considered the overall performance of the Adviser in this context. The Fund’s ability to deliver competitive performance when compared to its Performance Peer Group (as defined below) was also deemed to be relevant by the Board as a useful indicator of how the Adviser is executing the Fund’s investment program. The Adviser’s ability to execute this program was one of the Board’s considerations in reaching a conclusion that the nature, extent and quality of the Adviser’s investment management and related services warrant the continuation of the Contract.
Fund Investment Performance
In evaluating the Fund’s investment performance, the Board considered performance results in light of the Fund’s investment objective, strategies and risks, as disclosed in the Fund’s prospectus. The Board also considered the Fund’s performance in light of the overall recent market conditions. The Board considered detailed investment reports on the Fund’s performance over different time periods that were provided to the Board throughout the year and in connection with the May Meetings and evaluated the Adviser’s analysis of the Fund’s performance for these time periods. The Board also reviewed comparative information regarding the performance of other mutual funds in the category of peer funds selected by Morningstar, Inc. (the “Morningstar”), an independent fund ranking organization (the “Performance Peer Group”), noting the CCO’s view that comparisons to fund peer groups may be helpful,
Annual Shareholder Report
though not conclusive, in evaluating the performance of the Adviser in managing the Fund. The Board considered, in evaluating such comparisons, that in some cases there may be differences in the funds’ investment objectives or investment management techniques, or the costs to implement funds, even within the same Performance Peer Group. In this connection, the Board considered that the Fund’s quantitative focus makes fee and expense comparisons particularly difficult as the funds in the Performance Peer Group varied widely in their complexity, and the management of the Fund is among the more complex relative to its Performance Peer Group.
For the periods ended December 31, 2019, the Fund’s performance for the five-year period was above the median of the relevant Performance Peer Group, and the Fund’s performance fell below the median of the relevant Performance Peer Group for the one-year and three-year periods. In addition, the Board was informed by the Adviser that, for the same periods, the Fund outperformed its benchmark index for the five-year period and underperformed its benchmark index for the one-year three-year periods. The Board discussed the Fund’s performance with the Adviser and recognized the efforts being taken by the Adviser in the context of other factors considered relevant by the Board.
Following such evaluation, and full deliberations, the Board concluded that the performance of the Fund supported renewal of the Contract.
Fund Expenses
While mindful that courts have cautioned against giving too much weight to comparative information concerning fees charged by other advisers for managing funds with comparable investment programs, the Board has found the use of such comparisons to be relevant to its deliberations. In this regard, the Board was presented with, and considered, information regarding the contractual advisory fee rates, net advisory fee rates, total expense ratios and each element of the Fund’s total expense ratio (i.e., gross and net advisory fees, administrative fees, custody fees, portfolio accounting fees and transfer agency fees) relative to an appropriate group of peer funds compiled by Federated Hermes from the category of peer funds selected by Morningstar (the “Expense Peer Group”). The Board received a description of the methodology used to select the Expense Peer Group from the overall Morningstar category. The Board also reviewed comparative information regarding the fees and expenses of the broader group of funds in the overall Morningstar category. The Board focused on comparisons with other similar mutual funds more heavily than non-mutual fund products or services because such comparisons are believed to be more relevant. The Board considered that other mutual funds are the products most like the Fund, in that they are readily available to Fund shareholders as alternative investment vehicles, and they are the type of
Annual Shareholder Report
investment vehicle, in fact, chosen and maintained by the Fund’s investors. The Board noted that the range of their fees and expenses, therefore, appears to be a relevant indicator of what consumers have found to be reasonable in the marketplace in which the Fund competes.
The Board reviewed the contractual advisory fee rate, net advisory fee rate and other expenses of the Fund and noted the position of the Fund’s fee rates relative to its Expense Peer Group. In this regard, the Board noted that the contractual advisory fee rate was below the median of the relevant Expense Peer Group and the Board was satisfied that the overall expense structure of the Fund remained competitive.
For comparison, the Board received and considered information about the fees charged by Federated Hermes for providing advisory services to other types of clients with investment strategies similar to those of the Federated Hermes Funds, including non-mutual fund clients such as institutional separate accounts and third-party unaffiliated mutual funds for which the Adviser or its affiliates serve as sub-adviser. The Board noted the CCO’s conclusion that mon-mutual fund clients are inherently different products due to the following differences, among others: (i) different types of targeted investors; (ii) different applicable laws and regulations; (iii) different legal structures; (iv) different average account sizes and portfolio management techniques made necessary by different cash flows and different associated costs; (v) the time spent by portfolio managers and their teams (among other personnel across various departments, including legal, compliance and risk management) in reviewing securities pricing, addressing different administrative responsibilities, and addressing different degrees of risk associated with management; and (vi) a variety of different costs. The Board also considered information regarding the differences in the nature of the services required for Federated Hermes to manage its proprietary mutual fund business versus managing a discrete pool of assets as a sub-adviser to another institution’s mutual fund, noting that Federated Hermes generally performs significant additional services and assumes substantially greater risks in managing the Fund and other Federated Hermes Funds than in its role as sub-adviser to an unaffiliated third-party mutual fund. The Board noted that the CCO did not consider the fees for providing advisory services to other types of clients to be determinative in judging the appropriateness of the Federated Hermes Funds’ advisory fees.
The Board considered the CCO’s view that the services, administrative responsibilities and risks associated with such relationships are quite different than serving as a primary adviser to a fund.
Following such evaluation, and full deliberations, the Board concluded that the fees and expenses of the Fund are reasonable and supported renewal of the Contract.
Annual Shareholder Report
Profitability and Other Benefits
The Board also received financial information about Federated Hermes, including information regarding the compensation and ancillary (or “fall-out”) benefits Federated Hermes derived from its relationships with the Federated Hermes Funds. This information covered not only the fees under the Federated Hermes Funds’ investment advisory contracts, but also fees received by Federated Hermes’ affiliates for providing other services to the Federated Hermes Funds under separate contracts (e.g., for serving as the Federated Hermes Funds’ administrator and distributor). In this regard, the Board considered that certain of Federated Hermes’ affiliates provide distribution and shareholder services to the Federated Hermes Funds, for which they may be compensated through distribution and servicing fees paid pursuant to Rule 12b-1 plans or otherwise. The Board also received and considered information detailing any indirect benefit Federated Hermes may derive from its receipt of research services from brokers who execute portfolio trades for the Federated Hermes Funds. In addition, the Board considered the fact that, in order for the Federated Hermes Fund to be competitive in the marketplace, the Adviser and its affiliates frequently waived fees and/or reimbursed expenses and have disclosed to Federated Hermes Fund shareholders and/or reported to the Board their intention to do so in the future. Moreover, the Board received and considered regular reports from Federated Hermes throughout the year as to the institution, adjustment or elimination of these voluntary waivers and/or reimbursements.
The Board received and considered information furnished by Federated Hermes, as requested by the CCO, that reported revenues on a fund-by-fund basis and made estimates of the allocation of expenses on a fund-by-fund basis, using allocation methodologies specified by the CCO and described to the Board. The Board considered the CCO’s view that, while these cost allocation reports apply consistent allocation processes, the inherent difficulties in allocating costs continues to cause the CCO to question the precision of the process and to conclude that such reports may be unreliable, because a single change in an allocation estimate may dramatically alter the resulting estimate of cost and/or profitability of a Federated Hermes Fund and may produce unintended consequences. The allocation information, including the CCO’s view that fund-by-fund estimations may be unreliable, was considered in the evaluation by the Board. In addition, the Board considered that, during the prior year, an independent consultant conducted a review of the allocation methodologies used by Federated Hermes in estimating profitability for purposes of reporting to the Board in connection with the continuation of the Contract. The Board noted the consultant’s view that, although there is no single best method to allocate expenses, the methodologies used by Federated Hermes are reasonable.
Annual Shareholder Report
The Board also reviewed information compiled by Federated Hermes comparing its profitability information to other publicly held fund management companies, including information regarding profitability trends over time. The Board considered the CCO’s conclusion that, based on such profitability information, Federated Hermes’ profit margins did not appear to be excessive. The Board also considered the CCO’s view that Federated Hermes appeared financially sound, with the resources necessary to fulfill its obligations under its contracts with the Federated Hermes Funds.
In 2019, the Board approved a reduction of 5 basis points in the contractual advisory fee.
Economies of Scale
The Board received and considered information about the notion of possible realization of “economies of scale” as a fund grows larger, the difficulties of calculating economies of scale at an individual fund level, and the extent to which potential scale benefits are shared with shareholders. In this regard, the Board considered that Federated Hermes has made significant and long-term investments in areas that support all of the Federated Hermes Funds, such as personnel and processes for the portfolio management, trading operations, issuer engagement (including with respect to ESG matters), shareholder services, compliance, business continuity, internal audit and risk management functions, as well as systems technology (including technology relating to cybersecurity) and use of data. The Board noted that Federated Hermes’ investments in these areas are extensive and are designed to provide enhanced services to the Federated Hermes Funds and their shareholders. The Board considered that the benefits of these investments (as well as the benefits of any economies of scale, should they exist) are likely to be shared with the Federated Hermes Fund family as a whole. In addition, the Board considered that the Adviser and its affiliates have frequently waived fees and/or reimbursed expenses for the Federated Hermes Funds and that such waivers and reimbursements are another means for potential economies of scale to be shared with shareholders and can provide protection from an increase in expenses if a Federated Hermes Fund’s assets decline. Federated Hermes, as it does throughout the year, and specifically in connection with the Board’s review of the Contract, furnished information relative to adviser-paid fees (commonly referred to as revenue sharing). The Board considered the beliefs of Federated Hermes and the CCO that this information should be viewed to determine if there was an incentive to either not apply breakpoints or to apply breakpoints, at higher levels and should not be viewed to determine the appropriateness of advisory fees. The Board also noted the absence of any applicable regulatory or industry guidelines on this subject, which is compounded by the lack of any common industry practice or general pattern with respect to structuring fund advisory fees with “breakpoints” that serve to reduce the fee as a fund attains a certain size.
Annual Shareholder Report
Conclusions
The Board considered the CCO’s conclusion that his observations and the information accompanying the CCO Fee Evaluation Report show that the management fee for the Fund was reasonable and the CCO’s recommendation that the Board approve the management fee. The Board noted that, under these circumstances, no changes were recommended to, and no objection was raised to the continuation of, the Contract by the CCO. The CCO also recognized that the Board’s evaluation of the Federated Hermes Funds’ advisory and subadvisory arrangements is a continuing and on-going process that is informed by the information that the Board requests and receives from management throughout the course of the year and, in this regard, the CCO noted certain items for future reporting to the Board or further consideration by management as the Board continues its on-going oversight of the Federated Hermes Funds.
In its determination to continue an existing investment advisory contract, the Board was mindful of the potential disruptions of the Fund’s operations and various risks, uncertainties and other effects that could occur as a result of a decision to terminate or not renew an investment advisory contract. In particular, the Board recognized that many shareholders have invested in the Fund on the strength of the Adviser’s industry standing and reputation and with the expectation that the Adviser will have a continuing role in providing advisory services to the Fund. Thus, the Board’s approval of the Contract reflected the fact that it is the shareholders who have effectively selected the Adviser by virtue of having invested in the Fund. The Board concluded that, in light of the factors summarized above, including the nature, quality and scope of the services provided to the Fund by the Adviser and its affiliates, continuation of the Contract was appropriate.
The Board based its determination to approve the Contract on the totality of the circumstances and relevant factors and with a view to past and future long-term considerations. Not all of the factors and considerations identified above were necessarily deemed to be relevant to the Fund, nor did the Board consider any one of them to be determinative. With respect to the factors that were deemed to be relevant, the Board’s determination to approve the continuation of the Contract reflects its view that Federated Hermes’ performance and actions provided a satisfactory basis to support the determination to continue the existing arrangement.
Annual Shareholder Report
Liquidity Risk Management Program– Annual Evaluation of Adequacy and Effectiveness
In accordance with Rule 22e-4 under the Investment Company Act of 1940, as amended (the “Liquidity Rule”), Federated Hermes MDT Series (the “Trust”) has adopted and implemented a liquidity risk management program (the “LRMP”) for Federated Hermes MDT Small Cap Core Fund (the “Fund” and collectively with the Federated Hermes funds, the “Funds”). The LRMP seeks to assess and manage the Fund’s liquidity risk. “Liquidity risk” is defined under the Liquidity Rule as the risk that the Fund is unable to meet redemption requests without significantly diluting remaining investors’ interests in the Fund. The Board of Trustees of the Trust (the “Board”) has approved the designation of the Funds’ investment advisers as the administrators for the LRMP (collectively, the “Administrator”). The Administrator has established a Liquidity Risk Management Committee (the “Committee”) comprised of representatives from various departments across the Administrator to assist it in the implementation and on-going administration of the LRMP. The Committee, in turn, has delegated to the Fixed Income and Equities Liquidity Committees, each a separate committee previously established by the Administrator, the responsibility to review and assess certain information related to the liquidity of the Funds that fall within their respective asset classes.
The Program is comprised of various components designed to support the assessment and/or management of liquidity risk, including: (1) the periodic assessment (no less frequently than annually) of certain factors that influence the Fund’s liquidity risk; (2) the periodic classification (no less frequently than monthly) of the Fund’s investments into one of four liquidity categories that reflect an estimate of their liquidity under current market conditions; (3) a 15% limit on the acquisition of “illiquid investments” (as defined under the Liquidity Rule); (4) to the extent a Fund does not invest primarily in “highly liquid investments” (as defined under the Liquidity Rule), the determination of a minimum percentage of the Fund’s assets that generally will be invested in highly liquid investments (an “HLIM”); (5) if a Fund has established an HLIM, the periodic review (no less frequently than annually) of the HLIM and the adoption of policies and procedures for responding to a shortfall of the Fund’s highly liquid investments below its HLIM; and (6) periodic reporting to the Board.
At its meetings in May 2020, the Board received and reviewed a written report from the Funds’ Chief Compliance Officer and Chief Risk Officer, on behalf of the Administrator, concerning the operation of the LRMP for the period from the LRMP’s inception on December 1, 2018 through March 31, 2020 (the “Period”). The Report addressed the operation of the LRMP and assessed its adequacy and effectiveness, including, where applicable, the operation of any HLIM established for a Fund. There were no
Annual Shareholder Report
material changes to the LRMP during the Period. The Report summarized the operation of the Program and the information and factors considered by the Administrator in assessing whether the Program has been adequately and effectively implemented with respect to the Funds. Such information and factors included, among other things:
| ■ | the liquidity risk framework used to assess, manage, and periodically review each Fund’s liquidity risk and the results of this assessment, including a review of the Funds’ access to other available funding sources such as the Funds’ interfund lending facility, redemptions in-kind and committed lines of credit and confirmation that the Fund did not have to access any of these alternative funding sources during the Period; |
| ■ | the periodic classifications of the Fund’s investments into one of four liquidity categories and the methodologies and inputs used to classify the investments, including the Fund’s reasonably anticipated trade size; |
| ■ | the analysis received from a third-party liquidity assessment vendor that is taken into account in the process of determining the liquidity classifications of the Fund’s investments and the results of an evaluation of the services performed by the vendor in support of this process; |
| ■ | the fact that the Fund invested primarily in highly liquid investments during the Period and, therefore, was not required to establish, and has not established, an HLIM and the procedures for monitoring the status of the Fund as investing primarily in highly liquid investments; |
| ■ | the fact that the Fund invested no more than 15% of its assets in illiquid investments during the Period and the procedures for monitoring this limit; and |
| ■ | liquidity events during the Period, including the impact on liquidity caused by extended non-U.S. market closures and the market disruptions resulting from the novel coronavirus outbreak, and the fact that there were no specific liquidity events during the Period that materially affected the Fund’s liquidity risk. |
Based on this review, the Administrator concluded that the LRMP is operating effectively to assess and manage the Fund’s liquidity risk, and that the Program has been and continues to be adequately and effectively implemented to monitor and, as applicable, respond to the Fund’s liquidity developments.
Annual Shareholder Report
Voting Proxies on Fund Portfolio Securities
A description of the policies and procedures that the Fund uses to determine how to vote proxies, if any, relating to securities held in the Fund’s portfolio is available, without charge and upon request, by calling 1-800-341-7400. A report on “Form N-PX” of how the Fund voted any such proxies during the most recent 12-month period ended June 30 is available via the Proxy Voting Record (Form N-PX) link associated with the Fund and share class name at FederatedInvestors.com/FundInformation. Form N-PX filings are also available at the SEC’s website at sec.gov.
Quarterly Portfolio Schedule
Each fiscal quarter, the Fund will file with the SEC a complete schedule of its monthly portfolio holdings on “Form N-PORT.” The Fund’s holdings as of the end of the third month of every fiscal quarter, as reported on Form N-PORT, will be publicly available on the SEC’s website at sec.gov within 60 days of the end of the fiscal quarter upon filing. You may also access this information via the link to the Fund and share class name at FederatedInvestors.com.
Annual Shareholder Report
Mutual funds are not bank deposits or obligations, are not guaranteed by any bank and are not insured or guaranteed by the U.S. government, the Federal Deposit Insurance Corporation, the Federal Reserve Board or any other government agency. Investment in mutual funds involves investment risk, including the possible loss of principal.
This Report is authorized for distribution to prospective investors only when preceded or accompanied by the Fund’s Prospectus, which contains facts concerning its objective and policies, management fees, expenses and other information.
Federated Hermes MDT Small Cap Core Fund
Federated Hermes Funds
4000 Ericsson Drive
Warrendale, PA 15086-7561
Contact us at FederatedInvestors.com
or call 1-800-341-7400.
Federated Securities Corp., Distributor
CUSIP 31421R817
CUSIP 31421R791
CUSIP 31421R783
CUSIP 31421R627
37328 (9/20)
© 2020 Federated Hermes, Inc.

Annual Shareholder Report
July 31, 2020
| Share Class | Ticker | A | QASGX | C | QCSGX | |
| | Institutional | QISGX | R6 | QLSGX | |
Federated Hermes MDT Small Cap Growth Fund
(formerly, Federated MDT Small Cap Growth Fund)
Fund Established 2005
A Portfolio of Federated Hermes MDT Series
(formerly, Federated MDT Series)
IMPORTANT NOTICE REGARDING REPORT DELIVERY
Beginning on January 1, 2021, as permitted by regulations adopted by the Securities and Exchange Commission, paper copies of the Fund’s shareholder reports like this one will no longer be sent by mail, unless you specifically request paper copies of the reports from the Fund or from your financial intermediary, such as a broker-dealer or bank. Instead, the reports will be made available on a website, and you will be notified by mail each time a report is posted and provided with a website link to access the report.
If you already elected to receive shareholder reports electronically, you will not be affected by this change and you need not take any action. You may elect to receive shareholder reports and other communications from the Fund or your financial intermediary electronically by contacting your financial intermediary (such as a broker-dealer or bank); other shareholders may call the Fund at 1-800-341-7400, Option 4.
You may elect to receive all future reports in paper free of charge. You can inform the Fund or your financial intermediary that you wish to continue receiving paper copies of your shareholder reports by contacting your financial intermediary (such as a broker-dealer or bank); other shareholders may call the Fund at 1-800-341-7400, Option 4. Your election to receive reports in paper will apply to all funds held with the Fund complex or your financial intermediary.
Not FDIC Insured ■ May Lose Value ■ No Bank Guarantee
J. Christopher
Donahue
President
Federated Hermes MDT Small Cap Growth Fund
Letter from the President
Dear Valued Shareholder,
I am pleased to present the Annual Shareholder Report for your fund covering the period from August 1, 2019 through July 31, 2020.
As we all confront the unprecedented effects of the coronavirus and the challenges it presents to our families, communities, businesses and the financial markets, I want you to know that everyone at Federated Hermes is dedicated to helping you successfully navigate the markets ahead. You can count on us for the insights, investment management knowledge and client service that you have come to expect. Please refer to our website, FederatedInvestors.com, for timely updates on this and other economic and market matters.
Thank you for investing with us. I hope you find this information useful and look forward to keeping you informed.
Sincerely,
J. Christopher Donahue, President
CONTENTS
| 1 |
| 6 |
| 7 |
| 18 |
| 22 |
| 24 |
| 26 |
| 27 |
| 39 |
| 41 |
| 43 |
| 49 |
| 58 |
| 60 |
| 60 |
Management’s Discussion of Fund Performance (unaudited)
The total return of Federated Hermes MDT Small Cap Growth Fund (the “Fund”), based on net asset value for the 12-month reporting period ended July 31, 2020, was 2.53% for Class A Shares, 1.82% for Class C Shares, 2.79% for Institutional Shares and 2.87% for Class R6 Shares. The total return for the Russell 2000® Growth Index (R2000G),1 the Fund’s broad-based securities market index, was 6.00% for the same period. The total return of the Morningstar Small Growth Funds Average (MSGFA),2 a peer group average for the Fund, was 8.82% during the same period. The Fund’s and MSGFA’s total returns for the most recently completed fiscal year reflected actual cash flows, transaction costs and other expenses, which were not reflected in the total return of the R2000G.
During the reporting period, the Fund’s investment strategy focused on stock selection. Stock selection was the most significant factor affecting the Fund’s performance relative to the R2000G during the period.
The following discussion will focus on the performance of the Fund’s Class R6 Shares relative to the R2000G.
MARKET OVERVIEW
The twelve months of this reporting period, culminating with the COVID-19 pandemic, saw huge volatility in the domestic market. Despite the dramatic decline and recovery in the first half of 2020, the whole market Russell 3000® Index3 was up 10.93% for the full period. However, looking more deeply at the subindexes revealed the wildness of the market. Large caps dominated small caps:4 the mega-cap Russell Top 200® Index5 returned 15.84%, while the Russell Midcap® Index6 returned 2.04% and the small-cap Russell 2000® Index7 returned -4.59%. In addition, once again, growth dominated value: the Russell 3000® Growth Index8 returned 28.24% while the Russell 3000® Value Index9 returned -6.67%. The largest spread between growth and value in one capitalization range this year was almost 38 percentage points: the mega-cap Russell Top 200® Growth Index10 returned 33.06% while the Russell Top 200® Value11 Index returned -4.80%.
The best performing sectors in the R2000G during the reporting period were Health Care (17.61%), Information Technology (9.77%), Consumer Staples (3.90%) and Consumer Discretionary (3.81%). Underperforming sectors during the same period included Energy (-50.05%), Materials (-8.81%) and Communication Services (-8.35%).
STOCK SELECTION
The Fund buys stocks with many different combinations of fundamental and technical characteristics that have signaled market outperformance historically. The primary cause of underperformance during the reporting period was the Fund’s underweight of stocks with very low cash flow and negative analyst
Annual Shareholder Report
conviction, and weak stock selection among those stocks. For most of the year, the market was bidding up growth stocks with poor cash flow, as it was a growth-leaning market. More recently, the market was investing in biotechnology stocks in hopes of finding one with a COVID-19 cure or vaccine. The Fund tends to avoid stocks with low cash flow and poor analyst conviction, cherry-picking among them for those that look stronger according to our complete set of fundamental and technical factors, so it missed many of the biotechnology stocks or sold out of them too early as they began to be expensive. A partial offset to the underperformance was favorable stock selection among stocks with very low cash flow but more favorable analyst conviction. The Fund’s sector exposures continued to remain close to R2000G weights; there were no significant overweights or underweights at the end of the fiscal year. Weak stock selection in the Health Care sector contributed the most to Fund underperformance. Favorable stock selection in the Consumer Discretionary sector provided a partial offset.
Individual stocks enhancing the Fund’s performance included Aaron’s, Inc., Five9, Inc. and Wingstop, Inc..
Individual stocks detracting from the Fund’s performance included Atkore International Group Inc., Essent Group Ltd. and Quidel Corporation.
| 1 | Please see the footnotes to the line graphs below for definitions of, and further information about, the R2000G. |
| 2 | Please see the footnotes to the line graphs below for definitions of, and further information about, the MSGFA. |
| 3 | The Russell 3000® Index measures the performance of the largest 3,000 U.S. companies representing approximately 98% of the investable U.S. equity market. The Russell 3000® Index is constructed to provide a comprehensive, unbiased and stable barometer of the broad market, and is completely reconstituted annually to ensure new and growing equities are reflected.* |
| 4 | Small-cap stocks may be less liquid and subject to greater price volatility than large-cap stocks. |
| 5 | The Russell Top 200® Index measures the performance of the largest cap segment of the U.S. equity universe. The Russell Top 200® Index is a subset of the Russell 3000® Index. It includes approximately 200 of the largest securities based on a combination of their market cap and current index membership and represents approximately 68% of the U.S. market. The Russell Top 200® Index is constructed to provide a comprehensive and unbiased barometer for this very large cap segment and is completely reconstituted annually to ensure new and growing equities are reflected.* |
| 6 | The Russell Midcap® Index measures the performance of the mid-cap segment of the U.S. equity universe. The Russell Midcap® Index is a subset of the Russell 1000® Index. It includes approximately 800 of the smallest securities based on a combination of their market cap and current index membership. The Russell Midcap® Index represents approximately 31% of the total market capitalization of the Russell 1000® companies. The Russell Midcap® Index is constructed to provide a comprehensive and unbiased barometer for the mid-cap segment. The Russell Midcap Index is completely reconstituted annually to ensure larger stocks do not distort the performance and characteristics of the true mid-cap opportunity set.* |
| 7 | The Russell 2000® Index measures the performance of the small-cap segment of the U.S. equity universe. The Russell 2000® Index is a subset of the Russell 3000® Index representing approximately 10% of the total market capitalization of that index. It includes approximately 2000 of the smallest securities based on a combination of their market cap and current index |
Annual Shareholder Report
| | membership. The Russell 2000® Index is constructed to provide a comprehensive and unbiased small-cap barometer and is completely reconstituted annually to ensure larger stocks do not distort the performance and characteristics of the true small-cap opportunity set.* |
| 8 | The Russell 3000® Growth Index measures the performance of the broad growth segment of the U.S. equity universe. It includes those Russell 3000® Index companies with higher price-to-book ratios and higher forecasted growth values. The Russell 3000® Growth Index is constructed to provide a comprehensive, unbiased and stable barometer of the broad growth market. The Russell 3000® Growth Index is completely reconstituted annually to ensure new and growing equities are included and that the represented companies continue to reflect growth characteristics.* |
| 9 | The Russell 3000® Value Index measures the performance of the broad value segment of U.S. equity value universe. It includes those Russell 3000® Index companies with lower price-to-book ratios and lower forecasted growth values. The Russell 3000® Value Index is constructed to provide a comprehensive, unbiased and stable barometer of the broad value market. The Russell 3000® Value Index is completely reconstituted annually to ensure new and growing equities are included and that the represented companies continue to reflect value characteristics.* |
| 10 | The Russell Top 200® Growth Index measures the performance of the especially large cap segment of the U.S. equity universe represented by stocks in the largest 200 by market cap. It includes Russell Top 200® Index companies with higher growth earning potential as defined by Russell’s leading style methodology.* |
| 11 | The Russell Top 200® Value Index measures the performance of the especially large cap segment of the U.S. equity universe represented by stocks in the largest 200 by market cap. It includes Russell Top 200® Index companies with value characteristics as defined by Russell’s leading style methodology.* |
| * | The index is unmanaged, and it is not possible to invest directly in an index. |
Annual Shareholder Report
FUND PERFORMANCE AND GROWTH OF A $10,000 INVESTMENT
The graph below illustrates the hypothetical investment of $10,0001 in the Federated Hermes MDT Small Cap Growth Fund from July 31, 2010 to July 31, 2020, compared to the Russell 2000 Growth® Index (R2000G)2 and the Morningstar Small Growth Funds Average (MSGFA).3 The Average Annual Total Return table below shows returns for each class averaged over the stated periods.
Growth of a $10,000 Investment
Growth of $10,000 as of July 31, 2020
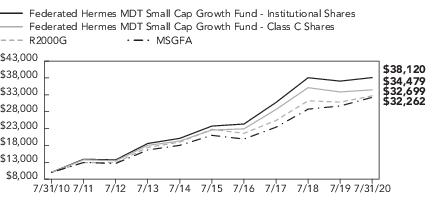
| Federated Hermes MDT Small Cap Growth Fund - | Institutional Shares | Class C Shares | NA | R2000G | MSGFA |
| F | F | NA | I | I |
| 7/31/2010 | 10,000 | 10,000 | | 10,000 | 10,000 |
| 7/31/2011 | 13,910 | 13,760 | | 12,932 | 12,942 |
| 7/31/2012 | 13,718 | 13,440 | | 12,866 | 12,651 |
| 7/31/2013 | 18,576 | 18,019 | | 17,419 | 16,660 |
| 7/31/2014 | 20,102 | 19,300 | | 18,975 | 18,030 |
| 7/31/2015 | 23,740 | 22,574 | | 22,783 | 20,996 |
| 7/31/2016 | 24,347 | 22,914 | | 21,575 | 19,893 |
| 7/31/2017 | 30,744 | 28,660 | | 25,407 | 23,406 |
| 7/31/2018 | 38,075 | 35,120 | | 31,228 | 28,758 |
| 7/31/2019 | 37,070 | 33,862 | | 30,849 | 29,702 |
| 7/31/2020 | 38,120 | 34,479 | | 32,699 | 32,262 |
41 graphic description end -->
| ■ | Total returns shown for Class C Shares include the maximum contingent deferred sales charge of 1.00% as applicable. |
The Fund offers multiple share classes whose performance may be greater than or less than its other share class(es) due to differences in sales charges and expenses. See the Average Annual Total Return table below for the returns of additional classes not shown in the line graph above.
Average Annual Total Returns for the Period Ended 7/31/2020
(returns reflect all applicable sales charges and contingent deferred sales charges as specified below in footnote #1)
| | 1 Year | 5 Years | 10 Years |
| Class A Shares | -3.12% | 8.43% | 13.39% |
| Class C Shares | 0.82% | 8.84% | 13.18% |
| Institutional Shares | 2.79% | 9.93% | 14.32% |
| Class R6 Shares4 | 2.87% | 9.91% | 14.18% |
| R2000G | 6.00% | 7.49% | 12.58% |
| MSGFA | 8.82% | 9.42% | 12.92% |
Annual Shareholder Report
Performance data quoted represents past performance which is no guarantee of future results. Investment return and principal value will fluctuate so that an investor’s shares, when redeemed, may be worth more or less than their original cost. Mutual fund performance changes over time and current performance may be lower or higher than what is stated. For current to the most recent month-end performance and after-tax returns, visit FederatedInvestors.com or call 1-800-341-7400. Returns shown do not reflect the deduction of taxes that a shareholder would pay on Fund distributions or the redemption of Fund shares. Mutual funds are not obligations of or guaranteed by any bank and are not federally insured.
| 1 | Represents a hypothetical investment of $10,000 in the Fund after deducting applicable sales charges: for Class A Shares, the maximum sales charge of 5.50% ($10,000 investment minus $550 sales charges = $9,450); for Class C Shares, a 1.00% contingent deferred sales charge would be applied to any redemption less than one year from the purchase date. The Fund’s performance assumes the reinvestment of all dividends and distributions. The R2000G and MSGFA have been adjusted to reflect reinvestment of dividends on securities. |
| 2 | The R2000G measures the performance of the small-cap growth segment of the U.S. equity universe. It includes those Russell 2000® Index companies with higher price-to-value ratios and higher forecasted growth values. The R2000G is constructed to provide a comprehensive and unbiased barometer for the small-cap growth segment. The R2000G is completely reconstituted annually to ensure larger stocks do not distort the performance and characteristics of the true small-cap opportunity set and that the represented companies continue to reflect growth characteristics. The R2000G is unmanaged and, unlike the Fund, is not affected by cash flows. It is not possible to invest directly in an index. The R2000G is not adjusted to reflect sales charges, expenses or other fees that the Securities and Exchange Commission requires to be reflected in the Fund’s performance. |
| 3 | Morningstar figures represent the average of the total returns reported by all the funds designated by Morningstar as falling into the respective category indicated. They do not reflect sales charges. The Morningstar figures in the Growth of $10,000 line graph are based on historical return information published by Morningstar and reflect the return of the funds comprising the category in the year of publication. Because the funds designated by Morningstar as falling into the category can change over time, the Morningstar figures in the line graph may not match the Morningstar figures in the Average Annual Total Returns table, which reflect the return of the funds that currently comprise the category. |
| 4 | The Fund’s Class R6 Shares commenced operations on June 29, 2016. It is anticipated that this class will have the lowest net expenses of all outstanding share classes. For the period prior to the commencement of operations of Class R6 Shares, the performance information shown is for the Fund’s Institutional Shares adjusted to reflect expenses of the Class R6 Shares for each year for which the gross expenses of Class R6 Shares would have exceeded the actual expenses paid by Institutional Shares. |
Annual Shareholder Report
Portfolio of Investments Summary Table (unaudited)
At July 31, 2020, the Fund’s sector composition1 was as follows:
| Sector Composition | Percentage of
Total Net Assets |
| Health Care | 31.1% |
| Information Technology | 21.4% |
| Consumer Discretionary | 12.6% |
| Industrials | 12.0% |
| Financials | 5.5% |
| Consumer Staples | 4.3% |
| Real Estate | 4.1% |
| Communication Services | 3.9% |
| Materials | 2.3% |
| Utilities | 0.7% |
| Energy | 0.6% |
| Securities Lending Collateral2 | 11.6% |
| Cash Equivalents3 | 1.5% |
| Other Assets and Liabilities—Net4 | (11.6)% |
| TOTAL | 100.0% |
| 1 | Except for Cash Equivalents and Other Assets and Liabilities, sector classifications are based upon, and individual portfolio securities are assigned to, the classifications of the Global Industry Classification Standard (GICS) except that the Adviser assigns a classification to securities not classified by the GICS and to securities for which the Adviser does not have access to the classification made by the GICS. |
| 2 | Represents cash collateral received for portfolio securities on loan that may be invested in affiliated money market funds, other money market instruments and/or repurchase agreements. |
| 3 | Cash Equivalents include any investments in money market mutual funds and/or overnight repurchase agreements other than those representing cash collateral for securities lending. |
| 4 | Assets, other than investments in securities, less liabilities. See Statement of Assets and Liabilities. |
Annual Shareholder Report
Portfolio of Investments
July 31, 2020
| Shares | | | Value |
| | | COMMON STOCKS—98.5% | |
| | | Communication Services—3.9% | |
| 43,585 | 1,2 | Bandwidth, Inc. | $6,310,236 |
| 21,666 | 2 | CarGurus, Inc. | 625,931 |
| 721,246 | 2 | Cars.com, Inc. | 5,856,518 |
| 108,709 | 1 | Cogent Communications Holdings, Inc. | 9,795,768 |
| 63,316 | 2 | EverQuote, Inc. | 3,447,556 |
| 114,447 | 2 | Yelp, Inc. | 2,858,886 |
| | | TOTAL | 28,894,895 |
| | | Consumer Discretionary—12.6% | |
| 181,949 | | Aaron’s, Inc. | 9,494,099 |
| 34,040 | 2 | Asbury Automotive Group, Inc. | 3,409,106 |
| 26,488 | | Big Lots, Inc. | 1,042,038 |
| 145,920 | 1 | Camping World Holdings, Inc. | 5,343,590 |
| 4,954 | 2 | Cavco Industries, Inc. | 992,435 |
| 84,788 | 1,2 | Chegg, Inc. | 6,865,284 |
| 7,362 | 2 | Deckers Outdoor Corp. | 1,540,498 |
| 107,064 | 1 | Falcon Minerals Corp | 268,731 |
| 372,934 | 1,2 | Funko, Inc. | 2,066,054 |
| 66,806 | 1,2 | Groupon, Inc. | 1,025,472 |
| 2,896 | 2 | Helen of Troy Ltd. | 545,172 |
| 47,906 | 2 | Installed Building Products, Inc. | 3,789,844 |
| 12,082 | | Jack in the Box, Inc. | 992,053 |
| 27,464 | 1,2 | Lovesac Co./The | 872,806 |
| 41,624 | 2 | Murphy USA, Inc. | 5,511,434 |
| 8,103 | 2 | Overstock.com, Inc. | 612,506 |
| 56,763 | | Papa Johns International, Inc. | 5,373,753 |
| 68,030 | 2 | Perdoceo Education Corp. | 979,632 |
| 323,223 | 2 | PlayAGS, Inc. | 1,092,494 |
| 114,814 | | Rent-A-Center, Inc. | 3,320,421 |
| 81,016 | 2 | Skyline Corp. | 2,287,082 |
| 67,307 | 2 | Sportsman’s Warehouse Holdings, Inc. | 1,082,969 |
| 419,554 | | Steven Madden Ltd. | 8,886,154 |
| 3,951 | 2 | TopBuild Corp. | 521,216 |
| 48,897 | 2 | WW International, Inc. | 1,260,565 |
| 125,478 | 1 | Wingstop, Inc. | 19,605,937 |
Annual Shareholder Report
| Shares | | | Value |
| | | COMMON STOCKS—continued | |
| | | Consumer Discretionary—continued | |
| 114,919 | 2 | YETI Holdings, Inc. | $5,618,390 |
| | | TOTAL | 94,399,735 |
| | | Consumer Staples—4.3% | |
| 138,838 | 1 | B&G Foods, Inc., Class A | 4,013,807 |
| 275,349 | 2 | BJ’s Wholesale Club Holdings, Inc. | 11,027,727 |
| 183,344 | 1,2 | Celsius Holdings, Inc. | 2,689,656 |
| 127,252 | 2 | elf Beauty, Inc. | 2,272,721 |
| 82,819 | 2 | Freshpet, Inc. | 7,954,765 |
| 108,586 | | Inter Parfums, Inc. | 4,440,082 |
| | | TOTAL | 32,398,758 |
| | | Energy—0.6% | |
| 183,481 | 1,2 | CONSOL Energy, Inc. | 1,078,868 |
| 22,459 | 1 | DMC Global, Inc. | 659,846 |
| 464,014 | 2 | Propetro Holding Corp. | 2,491,755 |
| | | TOTAL | 4,230,469 |
| | | Financials—5.5% | |
| 30,404 | | Artisan Partners Asset Management, Inc. | 1,101,537 |
| 560,096 | 2 | Blucora, Inc. | 6,603,532 |
| 24,541 | | CNB Financial Corp. | 400,755 |
| 46,529 | | First Cash, Inc. | 2,681,932 |
| 47,843 | 2 | Goosehead Insurance, Inc. | 4,943,617 |
| 33,350 | 1 | Guaranty Bancshares, Inc. | 903,785 |
| 24,939 | 1 | Kinsale Capital Group, Inc. | 4,860,611 |
| 206,303 | 2 | NMI Holdings, Inc. | 3,201,823 |
| 41,197 | 1,2 | Palomar Holdings, Inc. | 3,762,934 |
| 184,957 | 1 | Selective Insurance Group, Inc. | 10,050,563 |
| 51,679 | | State Auto Financial Corp. | 801,541 |
| 22,565 | 1,2 | World Acceptance Corp. | 1,676,579 |
| | | TOTAL | 40,989,209 |
| | | Health Care—31.1% | |
| 166,015 | 1,2 | ANI Pharmaceuticals, Inc. | 4,915,704 |
| 10,906 | 2 | Acceleron Pharma, Inc. | 1,081,548 |
| 142,399 | 1,2 | Acer Therapeutics, Inc. | 531,148 |
| 51,904 | 2,3 | Adeptus Health, Inc. | 0 |
| 63,544 | 2 | Adverum Biotechnologies, Inc. | 1,065,633 |
| 100,332 | 2 | Akebia Therapeutics, Inc. | 1,120,708 |
| 26,278 | 2 | Alector, Inc. | 411,776 |
| 56,070 | 2 | Allogene Therapeutics, Inc. | 2,056,087 |
Annual Shareholder Report
| Shares | | | Value |
| | | COMMON STOCKS—continued | |
| | | Health Care—continued | |
| 135,728 | 2 | Amicus Therapeutics, Inc. | $1,961,270 |
| 76,991 | 2 | Amneal Pharmaceuticals, Inc | 333,371 |
| 324,722 | 2 | AnaptysBio, Inc. | 5,832,007 |
| 28,179 | 1,2 | Applied Therapeutics, Inc. | 727,018 |
| 18,621 | 1,2 | Arcturus Therapeutics Holdings, Inc. | 972,575 |
| 47,381 | 2 | Arcus Biosciences, Inc. | 932,458 |
| 149,494 | 2 | AxoGen, Inc. | 1,699,747 |
| 65,009 | 1,2 | Axonics Modulation Technologies, Inc. | 2,753,781 |
| 9,973 | 1,2 | Axsome Therapeutics, Inc. | 711,374 |
| 93,698 | 2 | Biohaven Pharmaceutical Holding Co. Ltd. | 6,000,420 |
| 36,437 | 1,2 | BioSig Technologies, Inc. | 328,662 |
| 43,267 | 2 | Bioxcel Therapeutics, Inc. | 1,962,591 |
| 34,593 | | CONMED Corp. | 2,855,306 |
| 373,362 | 2 | Catalyst Pharmaceutical Partners Inc. | 1,605,457 |
| 46,003 | 2 | ChemoCentryx, Inc. | 2,424,818 |
| 18,587 | 1,2 | Co-Diagnostics, Inc. | 446,088 |
| 26,895 | 1,2 | Collegium Pharmaceutical, Inc. | 424,403 |
| 24,101 | 1,2 | Corcept Therapeutics, Inc. | 360,310 |
| 281,779 | 2 | Cross Country Healthcare, Inc. | 1,827,337 |
| 147,652 | 2 | Cue Biopharma, Inc. | 2,792,099 |
| 100,851 | 2 | Cutera, Inc. | 1,435,110 |
| 160,463 | 1,2 | Denali Therapeutics, Inc. | 3,758,044 |
| 56,416 | 2 | Dicerna Pharmaceuticals, Inc. | 1,212,944 |
| 29,629 | 2 | Emergent BioSolutions, Inc. | 3,295,930 |
| 60,214 | 1,2 | Enanta Pharmaceuticals, Inc. | 2,760,812 |
| 21,723 | | Ensign Group, Inc. | 999,041 |
| 98,254 | 1,2 | Fate Therapeutics, Inc. | 3,072,403 |
| 185,359 | 2 | G1 Therapeutics, Inc. | 2,719,217 |
| 48,284 | 2 | Globus Medical, Inc. | 2,326,323 |
| 369,402 | 2 | GlycoMimetics, Inc. | 1,455,444 |
| 42,660 | 2 | Gossamer Bio, Inc. | 508,507 |
| 26,605 | 2 | Haemonetics Corp. | 2,332,194 |
| 210,816 | 2 | Halozyme Therapeutics, Inc. | 5,732,087 |
| 90,277 | 2 | Immunomedics, Inc. | 3,812,398 |
| 89,047 | 1,2 | Inogen, Inc. | 2,733,743 |
| 126,648 | 1,2 | Inovalon Holdings, Inc. | 2,980,027 |
| 42,565 | 1,2 | Inovio Pharmaceuticals, Inc. | 827,464 |
| 39,378 | 2 | Inspire Medical Systems, Inc. | 3,912,598 |
Annual Shareholder Report
| Shares | | | Value |
| | | COMMON STOCKS—continued | |
| | | Health Care—continued | |
| 75,467 | 1,2 | Intellia Therapeutics, Inc. | $1,344,067 |
| 18,888 | 2 | Intra-Cellular Therapies, Inc. | 374,455 |
| 18,990 | 2 | Invitae Corp. | 554,508 |
| 381,414 | 1,2 | Ironwood Pharmaceuticals, Inc. | 3,497,566 |
| 194,896 | 2 | Kadmon Holdings, Inc. | 713,319 |
| 139,761 | 2 | Kala Pharmaceuticals, Inc. | 1,222,909 |
| 238,147 | 1,2 | Kiniksa Pharmaceuticals Ltd. | 4,648,629 |
| 19,279 | 2 | Kura Oncology, Inc. | 316,947 |
| 96,760 | 1 | LeMaitre Vascular, Inc. | 2,837,971 |
| 1,066,432 | 1,2 | Lexicon Pharmaceuticals, Inc. | 2,068,878 |
| 29,193 | 1,2 | Livongo Health, Inc. | 3,714,809 |
| 76,080 | 1,2 | Medpace Holdings, Inc. | 9,080,148 |
| 145,572 | 2 | Mersana Therapeutics, Inc. | 2,893,971 |
| 14,804 | 2 | Mirati Therapeutics, Inc. | 1,795,873 |
| 31,086 | 2 | Molecular Templates, Inc., Class THL | 341,013 |
| 132,996 | 1,2 | Momenta Pharmaceuticals, Inc. | 3,922,052 |
| 8,402 | 2 | Morphic Holding, Inc. | 189,129 |
| 17,025 | 2 | Myokardia, Inc. | 1,534,463 |
| 568,099 | 2 | Myriad Genetics, Inc. | 6,856,955 |
| 19,463 | 2 | Natera, Inc. | 934,613 |
| 42,419 | 2 | NextGen Healthcare, Inc. | 620,166 |
| 25,013 | 2 | Novavax, Inc. | 3,579,360 |
| 39,223 | 2 | NuVasive, Inc. | 2,241,202 |
| 23,641 | 1,2 | Odonate Therapeutics, Inc. | 859,823 |
| 87,031 | 2 | Omnicell, Inc. | 6,117,409 |
| 34,780 | 2 | Orthofix Medical, Inc. | 1,068,094 |
| 36,796 | 1,2 | PTC Therapeutics, Inc. | 1,704,759 |
| 94,290 | 1,2 | Pacira BioSciences, Inc. | 4,960,597 |
| 85,268 | 2 | Prevail Therapeutics, Inc. | 1,276,462 |
| 9,254 | 2 | Principia Biopharma, Inc. | 773,634 |
| 274,222 | 1,2 | Puma Biotechnology, Inc. | 2,827,229 |
| 61,673 | 2 | R1 RCM, Inc. | 843,070 |
| 158,800 | 2 | Recro Pharma, Inc. | 649,492 |
| 6,876 | 2 | Repligen Corp. | 1,037,657 |
| 31,755 | 2 | Rocket Pharmaceuticals, Inc. | 747,195 |
| 350,415 | 2 | Savara, Inc. | 697,326 |
| 69,730 | 2 | Scholar Rock Holding Corp. | 787,252 |
| 37,487 | 1,2 | Schrodinger, Inc. | 2,713,309 |
Annual Shareholder Report
| Shares | | | Value |
| | | COMMON STOCKS—continued | |
| | | Health Care—continued | |
| 292,728 | 2 | Select Medical Holdings Corp. | $5,573,541 |
| 39,763 | 2 | Shockwave Medical, Inc. | 1,961,111 |
| 24,554 | 1 | Simulations Plus, Inc. | 1,728,602 |
| 71,471 | 2 | Supernus Pharmaceuticals, Inc. | 1,591,302 |
| 27,831 | 2 | Syneos Health, Inc. | 1,736,376 |
| 8,999 | 2 | Tandem Diabetes Care, Inc. | 940,036 |
| 22,648 | 2 | Teladoc, Inc. | 5,381,844 |
| 178,843 | 1,2 | Tg Therapeutics, Inc. | 3,501,746 |
| 28,782 | 2 | Turning Point Therapeutics, Inc. | 1,704,758 |
| 72,069 | 2 | Twist Bioscience Corp. | 4,038,747 |
| 35,121 | 1 | U.S. Physical Therapy, Inc. | 2,917,150 |
| 57,381 | 1,2 | Ultragenyx Pharmaceutical, Inc. | 4,484,899 |
| 259,652 | 2 | VBI Vaccines, Inc. | 1,056,784 |
| 207,043 | 2 | Vanda Pharmaceuticals, Inc. | 2,086,993 |
| 32,848 | 2 | Vapotherm, Inc. | 1,715,980 |
| 39,172 | 1,2 | Vaxart, Inc. | 367,825 |
| 46,860 | 1,2 | Viela Bio, Inc. | 1,715,545 |
| 314,317 | 1,2 | Viewray, Inc. | 870,658 |
| 121,528 | 2 | Voyager Therapeutics, Inc. | 1,345,315 |
| 186,449 | 2 | Xencor, Inc. | 5,610,250 |
| 59,139 | 2 | Y-mAbs Therapeutics, Inc. | 2,077,553 |
| 79,097 | 2 | Zogenix, Inc. | 1,881,718 |
| 78,833 | 1,2 | Zynex, Inc. | 1,507,287 |
| | | TOTAL | 232,150,313 |
| | | Industrials—12.0% | |
| 14,765 | | AZZ, Inc. | 466,279 |
| 114,844 | | Advanced Drainage System, Inc. | 5,627,356 |
| 127,434 | 1,2 | Aerojet Rocketdyne Holdings, Inc. | 5,256,652 |
| 20,649 | 2 | Aerovironment, Inc. | 1,580,681 |
| 51,903 | | Albany International Corp., Class A | 2,495,496 |
| 303,385 | | Apogee Enterprises, Inc. | 6,550,082 |
| 294,749 | 2 | Astronics Corp. | 2,564,316 |
| 57,785 | 1,2 | Atlas Air Worldwide Holdings, Inc. | 3,009,443 |
| 72,588 | | Barnes Group, Inc. | 2,676,320 |
| 155,671 | 2 | Builders Firstsource, Inc. | 3,687,846 |
| 163,237 | 2 | Echo Global Logistics, Inc. | 4,091,535 |
| 56,487 | | Enerpac Tool Group Corp. | 1,067,604 |
| 71,233 | 1 | Exponent, Inc. | 5,987,846 |
Annual Shareholder Report
| Shares | | | Value |
| | | COMMON STOCKS—continued | |
| | | Industrials—continued | |
| 23,670 | | Federal Signal Corp. | $731,640 |
| 155,615 | 2 | Foundation Building Materials, Inc. | 2,136,594 |
| 104,346 | 2 | Franklin Covey Co. | 1,887,619 |
| 162,711 | 2 | GMS, Inc. | 3,812,319 |
| 371,360 | 1 | Granite Construction, Inc. | 6,298,266 |
| 132,267 | | Heidrick & Struggles International, Inc. | 2,675,761 |
| 79,406 | | Helios Technologies, Inc. | 3,003,929 |
| 510,043 | 2 | MRC Global, Inc. | 3,034,756 |
| 45,143 | 1,2 | Mastec, Inc. | 1,795,789 |
| 253,186 | 2 | Mistras Group, Inc. | 893,747 |
| 76,770 | 2 | PGT, Inc. | 1,310,464 |
| 63,758 | 1,2 | Plug Power, Inc. | 491,574 |
| 127,691 | | REV Group, Inc. | 829,991 |
| 18,846 | | Rexnord Corp. | 545,969 |
| 23,830 | 2 | SPX Corp. | 1,000,860 |
| 54,653 | 2 | Siteone Landscape Supply, Inc. | 6,997,224 |
| 11,065 | | Tennant Co. | 737,150 |
| 197,470 | 2 | Thermon Group Holdings, Inc. | 2,675,718 |
| 16,461 | 2 | Trex Co., Inc. | 2,293,511 |
| 125,781 | | Triumph Group, Inc. | 852,795 |
| 164,326 | 2 | Welbilt, Inc. | 999,102 |
| | | TOTAL | 90,066,234 |
| | | Information Technology—21.4% | |
| 44,606 | 2 | Amkor Technology, Inc. | 606,419 |
| 19,431 | | Badger Meter, Inc. | 1,216,381 |
| 172,141 | | Blackbaud, Inc. | 10,765,698 |
| 198,446 | 2 | Box, Inc. | 3,562,106 |
| 53,548 | 2 | Calix, Inc. | 1,098,269 |
| 150,254 | 2 | ChannelAdvisor Corp. | 3,060,674 |
| 166,412 | 1,2 | Coda Octopus Group, Inc. | 960,197 |
| 122,276 | 2 | Commvault Systems, Inc. | 5,389,926 |
| 56,680 | 1,2 | Cornerstone OnDemand, Inc. | 2,012,707 |
| 97,728 | 1,2 | Domo, Inc. | 3,144,887 |
| 36,747 | 2 | Envestnet, Inc. | 2,983,856 |
| 209,900 | | Evertec, Inc. | 6,517,395 |
| 58,808 | 1,2 | Five9, Inc. | 7,105,183 |
| 115,414 | 2 | FormFactor, Inc. | 3,328,540 |
| 112,371 | 1,2 | GTT Communications, Inc. | 707,937 |
Annual Shareholder Report
| Shares | | | Value |
| | | COMMON STOCKS—continued | |
| | | Information Technology—continued | |
| 129,785 | 2 | Inphi Corp. | $16,957,708 |
| 86,557 | 1,2 | Intelligent Systems Corp. | 2,624,408 |
| 59,159 | 1,2 | j2 Global, Inc. | 3,355,498 |
| 167,791 | 2 | MA-COM Technology Solutions Holdings, Inc. | 7,090,848 |
| 92,323 | | MTS Systems Corp. | 1,712,592 |
| 29,759 | 1 | Maximus, Inc. | 2,208,415 |
| 57,353 | 2 | MaxLinear, Inc. | 1,453,899 |
| 211,819 | 1,2 | Model N, Inc. | 8,146,559 |
| 58,559 | 1,2 | OSI Systems, Inc. | 4,155,347 |
| 66,487 | 2 | Perficient, Inc. | 2,606,955 |
| 82,175 | | Perspecta, Inc. | 1,758,545 |
| 14,159 | 2 | Ping Identity Holding Corp. | 486,503 |
| 237,511 | 1 | Plantronics, Inc. | 4,747,845 |
| 94,830 | 2 | Qualys, Inc. | 11,709,608 |
| 125,320 | 2 | SPS Commerce, Inc. | 9,420,304 |
| 169,594 | 2 | SVMK Inc. | 4,066,864 |
| 178,888 | 2 | SailPoint Technologies Holding | 5,634,972 |
| 168,906 | 1,2 | Secureworks Corp. | 2,020,116 |
| 55,393 | 2 | Semtech Corp. | 3,087,052 |
| 38,866 | 2 | Sitime Corp. | 2,065,728 |
| 23,531 | 2 | Sprout Social, Inc. | 679,811 |
| 23,098 | 2 | Synaptics, Inc. | 1,848,302 |
| 80,276 | | TTEC Holdings, Inc. | 3,809,899 |
| 112,057 | 2 | Tenable Holdings, Inc. | 3,802,094 |
| 17,627 | 1,2 | Varonis Systems, Inc. | 1,909,885 |
| | | TOTAL | 159,819,932 |
| | | Materials—2.3% | |
| 110,275 | | Boise Cascade Co. | 5,137,712 |
| 19,142 | | Compass Minerals International, Inc. | 975,093 |
| 61,372 | | Fuller (H.B.) Co. | 2,782,607 |
| 132,089 | 2 | Koppers Holdings, Inc. | 3,324,680 |
| 241,569 | | Myers Industries, Inc. | 3,638,029 |
| 86,100 | 2,3 | Rentech, Inc. | 0 |
| 103,128 | 2 | Ryerson Holding Corp. | 580,611 |
| 34,854 | | Verso Corp. | 425,567 |
| | | TOTAL | 16,864,299 |
| | | Real Estate—4.1% | |
| 134,988 | | Easterly Government Properties, Inc. | 3,300,457 |
Annual Shareholder Report
| Shares | | | Value |
| | | COMMON STOCKS—continued | |
| | | Real Estate—continued | |
| 75,276 | 1 | LTC Properties, Inc. | $2,796,503 |
| 166,306 | 1 | QTS Realty Trust, Inc. | 11,965,717 |
| 248,369 | | RMR Group, Inc./The | 7,143,092 |
| 124,281 | 1,2 | Redfin Corp. | 5,167,604 |
| | | TOTAL | 30,373,373 |
| | | Utilities—0.7% | |
| 12,552 | | American States Water Co. | 964,998 |
| 38,099 | 1 | California Water Service Group | 1,785,700 |
| 16,759 | | Chesapeake Utilities Corp. | 1,415,968 |
| 5,944 | | Middlesex Water Co. | 380,772 |
| 13,540 | | ONE Gas, Inc. | 1,024,978 |
| | | TOTAL | 5,572,416 |
| | | TOTAL COMMON STOCKS
(IDENTIFIED COST $626,853,910) | 735,759,633 |
| | | INVESTMENT COMPANIES—13.1% | |
| 35,185,159 | | Federated Hermes Government Obligations Fund, Premier Shares, 0.10%4 | 35,185,159 |
| 62,834,182 | | Federated Hermes Institutional Prime Value Obligations Fund, Institutional Shares, 0.21%4 | 62,871,883 |
| | | TOTAL INVESTMENT COMPANIES
(IDENTIFIED COST $98,057,042) | 98,057,042 |
| | | TOTAL INVESTMENT IN SECURITIES-111.6%
(IDENTIFIED COST $724,910,952)5 | 833,816,675 |
| | | OTHER ASSETS AND LIABILITIES—NET—(11.6)%6 | (86,639,650) |
| | | TOTAL NET ASSETS—100% | $747,177,025 |
Annual Shareholder Report
An affiliated company is a company in which the Fund, alone or in combination with other funds, has ownership of at least 5% of the voting shares. Transactions with affiliated companies during the period ended July 31, 2020, were as follows:
| | Balance of
Shares
Held
7/31/2019 | Purchases/
Additions* | Sales/
Reductions* |
| Consumer Discretionary: | | | |
| Wingstop, Inc. | 54,313 | 223,310 | (152,145) |
| Health Care: | | | |
| Alector, Inc. | — | 147,830 | (121,552) |
| AnaptysBio, Inc. | — | 342,809 | (18,087) |
| Arcturus Therapeutics Holdings, Inc. | — | 18,621 | — |
| Ultragenyx Pharmaceutical, Inc. | — | 84,671 | (27,290) |
| Affiliated issuers no longer in the portfolio at period end | — | 101,939 | (101,939) |
| TOTAL OF AFFILIATED TRANSACTIONS | 54,313 | 919,180 | (421,013) |
Annual Shareholder Report
Balance of
Shares
Held
7/31/2020 | Value | Change in
Unrealized
Appreciation/
Depreciation | Net
Realized
Gain/(Loss)* | Dividend
Income* |
| | | | | |
| 125,478 | $19,605,937 | $8,586,180 | $646,004 | $67,409 |
| | | | | |
| 26,278 | $411,776 | $(32,945) | $(626,622) | $— |
| 324,722 | $5,832,007 | $494,533 | $18,481 | $— |
| 18,621 | $972,575 | $7,392 | $— | $— |
| 57,381 | $4,484,899 | $444,139 | $(366,707) | $— |
| — | $— | $— | $1,042,769 | $— |
| 552,480 | $31,307,194 | $9,499,299 | $713,925 | $67,409 |
| * | A portion of the amount shown was recorded when the Fund did not have ownership of at least 5% of the voting shares. |
Affiliated fund holdings are investment companies which are managed by the Adviser or an affiliate of the Adviser. Transactions with affiliated fund holdings during the period ended July 31, 2020, were as follows:
| | Federated Hermes
Government
Obligations Fund,
Premier Shares* | Federated Hermes
Institutional
Prime Value
Obligations Fund,
Institutional Shares* | Total
Affiliated
Transactions |
| Balance of Shares Held 7/31/2019 | 34,589,446 | 67,411,680 | 102,001,126 |
| Purchases/Additions | 275,581,070 | 587,766,486 | 863,347,556 |
| Sales/Reductions | (274,985,357) | (592,343,984) | (867,329,341) |
| Balance of Shares Held 7/31/2020 | 35,185,159 | 62,834,182 | 98,019,341 |
| Value | $35,185,159 | $62,871,883 | $98,057,042 |
Change in Unrealized
Appreciation/Depreciation | N/A | $(4,832) | $(4,832) |
| Net Realized Gain/(Loss) | N/A | $ 5,305 | $ 5,305 |
| Dividend Income | $444,239 | $857,097 | $1,301,336 |
| * | All or a portion of the balance/activity for the fund relates to cash collateral received on securities lending transactions. |
| 1 | All or a portion of these securities are temporarily on loan to unaffiliated broker/dealers. |
| 2 | Non-income-producing security. |
| 3 | Market quotations and price evaluations are not available. Fair value determined using significant unobservable inputs in accordance with procedures established by and under the general supervision of the Fund’s Board of Trustees (the "Trustees"). |
| 4 | 7-day net yield. |
| 5 | The cost of investments for federal tax purposes amounts to $739,870,583. |
| 6 | Assets, other than investments in securities, less liabilities. See Statement of Assets and Liabilities. |
Annual Shareholder Report
Note: The categories of investments are shown as a percentage of total net assets at July 31, 2020.
Various inputs are used in determining the value of the Fund’s investments. These inputs are summarized in the three broad levels listed below:
Level 1 - quoted prices in active markets for identical securities.
Level 2 - other significant observable inputs (including quoted prices for similar securities, interest rates, prepayment speeds, credit risk, etc.). Also includes securities valued at amortized cost.
Level 3 - significant unobservable inputs (including the Fund’s own assumptions in determining the fair value of investments).
The inputs or methodology used for valuing securities are not an indication of the risk associated with investing in those securities.
The following is a summary of the inputs used, as of July 31, 2020, in valuing the Fund’s assets carried at fair value:
| Valuation Inputs | | | | |
| | Level 1—
Quoted
Prices | Level 2—
Other
Significant
Observable
Inputs | Level 3—
Significant
Unobservable
Inputs | Total |
| Equity Securities: | | | | |
| Common Stocks | | | | |
| Domestic | $723,508,628 | $— | $0 | $723,508,628 |
| International | 12,251,005 | — | — | 12,251,005 |
| Investment Companies | 98,057,042 | — | — | 98,057,042 |
| TOTAL SECURITIES | $833,816,675 | $— | $0 | $833,816,675 |
See Notes which are an integral part of the Financial Statements
Annual Shareholder Report
Financial Highlights–Class A Shares
(For a Share Outstanding Throughout Each Period)
| Year Ended July 31 | 2020 | 2019 | 2018 | 2017 | 2016 |
| Net Asset Value, Beginning of Period | $23.30 | $25.67 | $21.89 | $17.66 | $20.49 |
| Income From Investment Operations: | | | | | |
| Net investment income (loss)1 | (0.07) | (0.08) | (0.11) | (0.08) | (0.06) |
| Net realized and unrealized gain (loss) | 0.66 | (0.84) | 5.09 | 4.63 | 0.32 |
| TOTAL FROM INVESTMENT OPERATIONS | 0.59 | (0.92) | 4.98 | 4.55 | 0.26 |
| Less Distributions: | | | | | |
| Distributions from net realized gain | — | (1.45) | (1.20) | (0.32) | (3.09) |
| Net Asset Value, End of Period | $23.89 | $23.30 | $25.67 | $21.89 | $17.66 |
| Total Return2 | 2.53% | (2.83)% | 23.50% | 26.00% | 2.30% |
| Ratios to Average Net Assets: | | | | | |
| Net expenses3 | 1.13% | 1.13% | 1.14% | 1.15% | 1.13% |
| Net investment income (loss) | (0.32)% | (0.36)% | (0.48)% | (0.39)% | (0.34)% |
| Expense waiver/reimbursement4 | 0.30% | 0.29% | 0.44% | 0.70% | 1.00% |
| Supplemental Data: | | | | | |
| Net assets, end of period (000 omitted) | $92,389 | $82,170 | $82,953 | $47,681 | $29,707 |
| Portfolio turnover | 227% | 142% | 129% | 118% | 198% |
| 1 | Per share numbers have been calculated using the average shares method. |
| 2 | Based on net asset value, which does not reflect the sales charge, redemption fee or contingent deferred sales charge, if applicable. |
| 3 | Amount does not reflect net expenses incurred by investment companies in which the Fund may invest. |
| 4 | This expense decrease is reflected in both the net expense and the net investment income (loss) ratios shown above. Amount does not reflect expense waiver/reimbursement recorded by investment companies in which the Fund may invest. |
See Notes which are an integral part of the Financial Statements
Annual Shareholder Report
Financial Highlights–Class C Shares
(For a Share Outstanding Throughout Each Period)
| Year Ended July 31 | 2020 | 2019 | 2018 | 2017 | 2016 |
| Net Asset Value, Beginning of Period | $20.32 | $22.77 | $19.69 | $16.03 | $19.03 |
| Income From Investment Operations: | | | | | |
| Net investment income (loss)1 | (0.21) | (0.23) | (0.26) | (0.21) | (0.17) |
| Net realized and unrealized gain (loss) | 0.58 | (0.77) | 4.54 | 4.19 | 0.26 |
| TOTAL FROM INVESTMENT OPERATIONS | 0.37 | (1.00) | 4.28 | 3.98 | 0.09 |
| Less Distributions: | | | | | |
| Distributions from net realized gain | — | (1.45) | (1.20) | (0.32) | (3.09) |
| Net Asset Value, End of Period | $20.69 | $20.32 | $22.77 | $19.69 | $16.03 |
| Total Return2 | 1.82% | (3.58)% | 22.54% | 25.08% | 1.51% |
| Ratios to Average Net Assets: | | | | | |
| Net expenses3 | 1.88% | 1.88% | 1.89% | 1.90% | 1.88% |
| Net investment income (loss) | (1.07)% | (1.12)% | (1.23)% | (1.15)% | (1.09)% |
| Expense waiver/reimbursement4 | 0.20% | 0.29% | 0.41% | 0.66% | 1.00% |
| Supplemental Data: | | | | | |
| Net assets, end of period (000 omitted) | $17,481 | $22,639 | $18,008 | $10,007 | $3,941 |
| Portfolio turnover | 227% | 142% | 129% | 118% | 198% |
| 1 | Per share numbers have been calculated using the average shares method. |
| 2 | Based on net asset value, which does not reflect the sales charge, redemption fee or contingent deferred sales charge, if applicable. |
| 3 | Amount does not reflect net expenses incurred by investment companies in which the Fund may invest. |
| 4 | This expense decrease is reflected in both the net expense and the net investment income (loss) ratios shown above. Amount does not reflect expense waiver/reimbursement recorded by investment companies in which the Fund may invest. |
See Notes which are an integral part of the Financial Statements
Annual Shareholder Report
Financial Highlights–Institutional Shares
(For a Share Outstanding Throughout Each Period)
| Year Ended July 31 | 2020 | 2019 | 2018 | 2017 | 2016 |
| Net Asset Value, Beginning of Period | $24.37 | $26.71 | $22.67 | $18.24 | $21.01 |
| Income From Investment Operations: | | | | | |
| Net investment income (loss)1 | (0.02) | (0.02) | (0.06) | (0.03) | (0.02) |
| Net realized and unrealized gain (loss) | 0.70 | (0.87) | 5.30 | 4.78 | 0.34 |
| TOTAL FROM INVESTMENT OPERATIONS | 0.68 | (0.89) | 5.24 | 4.75 | 0.32 |
| Less Distributions: | | | | | |
| Distributions from net realized gain | — | (1.45) | (1.20) | (0.32) | (3.09) |
| Net Asset Value, End of Period | $25.05 | $24.37 | $26.71 | $22.67 | $18.24 |
| Total Return2 | 2.79% | (2.60)% | 23.85% | 26.27% | 2.56% |
| Ratios to Average Net Assets: | | | | | |
| Net expenses3 | 0.88% | 0.88% | 0.89% | 0.90% | 0.88% |
| Net investment income (loss) | (0.07)% | (0.10)% | (0.25)% | (0.15)% | (0.09)% |
| Expense waiver/reimbursement4 | 0.19% | 0.25% | 0.41% | 0.63% | 0.99% |
| Supplemental Data: | | | | | |
| Net assets, end of period (000 omitted) | $354,204 | $455,597 | $364,248 | $112,742 | $43,337 |
| Portfolio turnover | 227% | 142% | 129% | 118% | 198% |
| 1 | Per share numbers have been calculated using the average shares method. |
| 2 | Based on net asset value. |
| 3 | Amount does not reflect net expenses incurred by investment companies in which the Fund may invest. |
| 4 | This expense decrease is reflected in both the net expense and the net investment income (loss) ratios shown above. Amount does not reflect expense waiver/reimbursement recorded by investment companies in which the Fund may invest. |
See Notes which are an integral part of the Financial Statements
Annual Shareholder Report
Financial Highlights–Class R6 Shares
(For a Share Outstanding Throughout Each Period)
| | Year Ended July 31, | Period
Ended
7/31/20161 |
| 2020 | 2019 | 2018 | 2017 |
| Net Asset Value, Beginning of Period | $24.36 | $26.70 | $22.67 | $18.24 | $16.25 |
| Income From Investment Operations: | | | | | |
| Net investment income (loss)2 | (0.02) | (0.02) | (0.06) | (0.01) | (0.07) |
| Net realized and unrealized gain (loss) | 0.72 | (0.87) | 5.29 | 4.76 | 2.06 |
| TOTAL FROM INVESTMENT OPERATIONS | 0.70 | (0.89) | 5.23 | 4.75 | 1.99 |
| Less Distributions: | | | | | |
| Distributions from net realized gain | — | (1.45) | (1.20) | (0.32) | — |
| Net Asset Value, End of Period | $25.06 | $24.36 | $26.70 | $22.67 | $18.24 |
| Total Return3 | 2.87% | (2.60)% | 23.81% | 26.27% | 12.25% |
| Ratios to Average Net Assets: | | | | | |
| Net expenses4 | 0.87% | 0.87% | 0.88% | 0.88% | 0.87%5 |
| Net investment income (loss) | (0.07)% | (0.07)% | (0.24)% | (0.04)% | (0.41)%5 |
| Expense waiver/reimbursement6 | 0.09% | 0.15% | 0.30% | 0.42% | 0.66%5 |
| Supplemental Data: | | | | | |
| Net assets, end of period (000 omitted) | $283,103 | $333,059 | $89,307 | $24,795 | $07 |
| Portfolio turnover | 227% | 142% | 129% | 118% | 198%8 |
| 1 | Reflects operations for the period from June 29, 2016 (date of initial investment) to July 31, 2016. |
| 2 | Per share numbers have been calculated using the average shares method. |
| 3 | Based on net asset value. Total returns for periods of less than one year are not annualized. |
| 4 | Amount does not reflect net expenses incurred by investment companies in which the Fund may invest. |
| 5 | Computed on an annualized basis. |
| 6 | This expense decrease is reflected in both the net expense and the net investment income (loss) ratios shown above. Amount does not reflect expense waiver/reimbursement recorded by investment companies in which the Fund may invest. |
| 7 | Represents less than $1,000. |
| 8 | Portfolio turnover is calculated at the Fund level. Percentage indicated was calculated for the year ended July 31, 2016. |
See Notes which are an integral part of the Financial Statements
Annual Shareholder Report
Statement of Assets and Liabilities
July 31, 2020
| Assets: | | |
| Investment in securities, at value including $84,180,685 of securities loaned, $98,057,042 of investment in affiliated holdings* and $31,307,194 of investments in affiliated companies* (identified cost $724,910,952) | | $833,816,675 |
| Income receivable | | 126,034 |
| Income receivable from affiliated holdings | | 1,985 |
| Receivable for investments sold | | 17,446,462 |
| Receivable for shares sold | | 585,192 |
| TOTAL ASSETS | | 851,976,348 |
| Liabilities: | | |
| Payable for investments purchased | $15,925,200 | |
| Payable for shares redeemed | 1,348,071 | |
| Payable for collateral due to broker for securities lending | 87,174,159 | |
| Payable for investment adviser fee (Note 5) | 14,431 | |
| Payable for administrative fees (Note 5) | 1,600 | |
| Payable for distribution services fee (Note 5) | 10,769 | |
| Payable for other service fees (Notes 2 and 5) | 46,452 | |
| Accrued expenses (Note 5) | 278,641 | |
| TOTAL LIABILITIES | | 104,799,323 |
| Net assets for 30,147,683 shares outstanding | | $747,177,025 |
| Net Assets Consist of: | | |
| Paid-in capital | | $678,396,445 |
| Total distributable earnings (loss) | | 68,780,580 |
| TOTAL NET ASSETS | | $747,177,025 |
Annual Shareholder Report
Statement of Assets and Liabilities–continued
Net Asset Value, Offering Price and Redemption
Proceeds Per Share | | |
| Class A Shares: | | |
| Net asset value per share ($92,389,437 ÷ 3,867,231 shares outstanding), no par value, unlimited shares authorized | | $23.89 |
| Offering price per share (100/94.50 of $23.89) | | $25.28 |
| Redemption proceeds per share | | $23.89 |
| Class C Shares: | | |
| Net asset value per share ($17,481,241 ÷ 844,993 shares outstanding), no par value, unlimited shares authorized | | $20.69 |
| Offering price per share | | $20.69 |
| Redemption proceeds per share (99.00/100 of $20.69) | | $20.48 |
| Institutional Shares: | | |
| Net asset value per share ($354,203,508 ÷ 14,138,983 shares outstanding), no par value, unlimited shares authorized | | $25.05 |
| Offering price per share | | $25.05 |
| Redemption proceeds per share | | $25.05 |
| Class R6 Shares: | | |
| Net asset value per share ($283,102,839 ÷ 11,296,476 shares outstanding), no par value, unlimited shares authorized | | $25.06 |
| Offering price per share | | $25.06 |
| Redemption proceeds per share | | $25.06 |
| * | See information listed after the Fund’s Portfolio of Investments. |
See Notes which are an integral part of the Financial Statements
Annual Shareholder Report
Statement of Operations
Year Ended July 31, 2020
| Investment Income: | | | |
| Dividends (including $231,268 received from affiliated companies and holdings* and net of foreign taxes withheld of $4,713) | | | $5,831,010 |
| Net income on securities loaned (includes $1,137,477 earned from affiliated holdings related to cash collateral balances*) (Note 2) | | | 964,374 |
| TOTAL INCOME | | | 6,795,384 |
| Expenses: | | | |
| Investment adviser fee (Note 5) | | $6,701,584 | |
| Administrative fee (Note 5) | | 659,912 | |
| Custodian fees | | 74,310 | |
| Transfer agent fee (Note 2) | | 906,648 | |
| Directors’/Trustees’ fees (Note 5) | | 6,142 | |
| Auditing fees | | 27,700 | |
| Legal fees | | 7,722 | |
| Portfolio accounting fees | | 153,269 | |
| Distribution services fee (Note 5) | | 141,294 | |
| Other service fees (Notes 2 and 5) | | 265,125 | |
| Share registration costs | | 95,888 | |
| Printing and postage | | 77,935 | |
| Miscellaneous (Note 5) | | 39,870 | |
| TOTAL EXPENSES | | 9,157,399 | |
Annual Shareholder Report
Statement of Operations–continued
| Waiver and Reimbursements: | | | |
| Waiver/reimbursement of investment adviser fee (Note 5) | $(732,169) | | |
| Reimbursement of other operating expenses (Notes 2 and 5) | (633,622) | | |
| TOTAL WAIVER AND REIMBURSEMENTS | | (1,365,791) | |
| Net expenses | | | 7,791,608 |
| Net investment income (loss) | | | (996,224) |
| Realized and Unrealized Gain (Loss) on Investments: | | | |
| Net realized loss on investments (including net realized gain of $719,230 on sales of investments in affiliated companies and holdings*) | | | (33,014,524) |
| Net change in unrealized appreciation of investments (including net change in unrealized appreciation of $9,494,467 on investments in affiliated companies and holdings*) | | | 37,205,285 |
| Net realized and unrealized gain (loss) on investments | | | 4,190,761 |
| Change in net assets resulting from operations | | | $3,194,537 |
| * | See information listed after the Fund’s Portfolio of Investments. |
See Notes which are an integral part of the Financial Statements
Annual Shareholder Report
Statement of Changes in Net Assets
| Year Ended July 31 | 2020 | 2019 |
| Increase (Decrease) in Net Assets | | |
| Operations: | | |
| Net investment income (loss) | $(996,224) | $(1,133,718) |
| Net realized gain (loss) | (33,014,524) | 2,812,140 |
| Net change in unrealized appreciation/depreciation | 37,205,285 | (10,118,739) |
| CHANGE IN NET ASSETS RESULTING FROM OPERATIONS | 3,194,537 | (8,440,317) |
| Distributions to Shareholders: | | |
| Class A Shares | — | (4,694,682) |
| Class C Shares | — | (1,802,870) |
| Institutional Shares | — | (21,193,835) |
| Class R6 Shares | — | (10,244,004) |
| CHANGE IN NET ASSETS RESULTING FROM DISTRIBUTIONS TO SHAREHOLDERS | — | (37,935,391) |
| Share Transactions: | | |
| Proceeds from sale of shares | 260,125,039 | 662,802,599 |
| Proceeds from shares issued in connection with the tax-free transfer of assets from PNC Multi-Factor Small Cap Growth Fund | 102,652,108 | — |
| Net asset value of shares issued to shareholders in payment of distributions declared | — | 32,928,721 |
| Cost of shares redeemed | (512,259,924) | (310,406,395) |
| CHANGE IN NET ASSETS RESULTING FROM SHARE TRANSACTIONS | (149,482,777) | 385,324,925 |
| Change in net assets | (146,288,240) | 338,949,217 |
| Net Assets: | | |
| Beginning of period | 893,465,265 | 554,516,048 |
| End of period | $747,177,025 | $893,465,265 |
See Notes which are an integral part of the Financial Statements
Annual Shareholder Report
Notes to Financial Statements
July 31, 2020
1. ORGANIZATION
Federated Hermes MDT Series (the “Trust”) is registered under the Investment Company Act of 1940, as amended (the “Act”), as an open-end management investment company. The Trust consists of five portfolios. The financial statements included herein are only those of Federated Hermes MDT Small Cap Growth Fund (the “Fund”), a diversified portfolio. The financial statements of the other portfolios are presented separately. The assets of each portfolio are segregated and a shareholder’s interest is limited to the portfolio in which shares are held. Each portfolio pays its own expenses. The Fund offers four classes of shares: Class A Shares, Class C Shares, Institutional Shares and Class R6 Shares. All shares of the Fund have equal rights with respect to voting, except on class-specific matters. The investment objective of the Fund is long-term capital appreciation.
On March 30, 2017, the Fund’s T Share Class became effective with the Securities and Exchange Commission (SEC), but is not yet offered for sale.
Effective August 1, 2018, an automatic conversion feature for Class C Shares was implemented. Pursuant to this automatic conversion feature, after Class C Shares have been held for ten years from the date of purchase, they will automatically convert to Class A Shares on the next monthly conversion processing date.
On November 15, 2019, the Fund acquired all of the net assets of PNC Multi-Factor Small Cap Growth Fund (the “Acquired Fund”), an open-end investment company, in a tax-free reorganization in exchange for shares of the Fund, pursuant to a plan of reorganization approved by the Acquired Fund’s shareholders on November 5, 2019. The purpose of the transaction was to combine two portfolios with comparable investment objectives and strategies. For financial reporting purposes, assets received and shares issued by the Fund were recorded at fair value; however, the cost basis of the investments received from the Acquired Fund was carried forward to align ongoing reporting of the Fund’s realized gains and losses with amounts distributable to shareholders for tax purposes.
For every one share of the Acquired Fund’s Class A Shares exchanged, a shareholder received 0.896 shares of the Fund’s Class A Shares.
For every one share of the Acquired Fund’s Class C Shares exchanged, a shareholder received 0.971 shares of the Fund’s Class C Shares.
For every one share of the Acquired Fund’s Class I Shares exchanged, a shareholder received 0.883 shares of the Fund’s Institutional Shares.
For every one share of the Acquired Fund’s Class R6 Shares exchanged, a shareholder received 0.883 shares of the Fund’s R6 Shares.
Annual Shareholder Report
The Fund received net assets from the Acquired Fund as the result of the tax-free reorganization as follows:
Shares of the
Fund Issued | Acquired Fund’s
Net Assets Received | Unrealized
Appreciation1 | Net Assets
of the Fund
Immediately
Prior to
Combination | Net Assets
of the Fund
Immediately
After
Combination |
| 4,360,352 | $102,652,108 | $20,727,223 | $897,256,665 | $999,908,773 |
| 1 | Unrealized Appreciation is included in the Net Assets Received amount shown above. |
Assuming the acquisition had been completed on August 1, 2019, the beginning of the annual reporting period of the Fund, the Fund’s pro forma results of operations for the year ended July 31, 2020, were as follows:
| Net investment loss | $(964,618) |
| Net realized and unrealized gain on investments | 3,068,318 |
| Net increase in net assets resulting from operations | $2,103,700 |
Because the combined investment portfolios have been managed as a single integrated portfolio since the acquisition was completed, it is not practicable to separate the amounts of revenue and earnings of the Acquired Fund that have been included in the Fund’s Statement of Operations and Statement of Changes in Net Assets as of July 31, 2020.
Prior to June 29, 2020, the name of the Trust and Fund were Federated MDT Series and Federated MDT Small Cap Growth Fund, respectively.
2. SIGNIFICANT ACCOUNTING POLICIES
The following is a summary of significant accounting policies consistently followed by the Fund in the preparation of its financial statements. These policies are in conformity with U.S. generally accepted accounting principles (GAAP).
Investment Valuation
In calculating its net asset value (NAV), the Fund generally values investments as follows:
| ■ | Equity securities listed on an exchange or traded through a regulated market system are valued at their last reported sale price or official closing price in their principal exchange or market. |
| ■ | Shares of other mutual funds or non-exchange-traded investment companies are valued based upon their reported NAVs. |
| ■ | Fixed-income securities are fair valued using price evaluations provided by a pricing service approved by the Trustees. |
| ■ | Derivative contracts listed on exchanges are valued at their reported settlement or closing price, except that options are valued at the mean of closing bid and asked quotations. |
| ■ | Over-the-counter (OTC) derivative contracts are fair valued using price evaluations provided by a pricing service approved by the Trustees. |
| ■ | For securities that are fair valued in accordance with procedures established by and under the general supervision of the Trustees, certain factors may be considered, such as: the last traded or purchase price of the security, information obtained by |
Annual Shareholder Report
| | contacting the issuer or dealers, analysis of the issuer’s financial statements or other available documents, fundamental analytical data, the nature and duration of restrictions on disposition, the movement of the market in which the security is normally traded, public trading in similar securities or derivative contracts of the issuer or comparable issuers, movement of a relevant index, or other factors including but not limited to industry changes and relevant government actions. |
If any price, quotation, price evaluation or other pricing source is not readily available when the NAV is calculated, if the Fund cannot obtain price evaluations from a pricing service or from more than one dealer for an investment within a reasonable period of time as set forth in the Fund’s valuation policies and procedures, or if information furnished by a pricing service, in the opinion of the valuation committee (“Valuation Committee”), is deemed not representative of the fair value of such security, the Fund uses the fair value of the investment determined in accordance with the procedures described below. There can be no assurance that the Fund could obtain the fair value assigned to an investment if it sold the investment at approximately the time at which the Fund determines its NAV per share, and the actual value obtained could be materially different.
Fair Valuation Procedures
The Trustees have ultimate responsibility for determining the fair value of investments for which market quotations are not readily available. The Trustees have appointed a Valuation Committee comprised of officers of the Fund, Federated MDTA LLC (the “Adviser”), and certain of the Adviser’s affiliated companies to assist in determining fair value and in overseeing the calculation of the NAV. The Trustees have also authorized the use of pricing services recommended by the Valuation Committee to provide fair value evaluations of the current value of certain investments for purposes of calculating the NAV. The Valuation Committee employs various methods for reviewing third-party pricing-service evaluations including periodic reviews of third-party pricing services’ policies, procedures and valuation methods (including key inputs, methods, models and assumptions), transactional back-testing, comparisons of evaluations of different pricing services, and review of price challenges by the Adviser based on recent market activity. In the event that market quotations and price evaluations are not available for an investment, the Valuation Committee determines the fair value of the investment in accordance with procedures adopted by the Trustees. The Trustees periodically review and approve the fair valuations made by the Valuation Committee and any changes made to the procedures.
Factors considered by pricing services in evaluating an investment include the yields or prices of investments of comparable quality, coupon, maturity, call rights and other potential prepayments, terms and type, reported transactions, indications as to values from dealers and general market conditions. Some pricing services provide a single price evaluation reflecting the bid-side of the market for an investment (a “bid” evaluation). Other pricing services offer both bid evaluations and price evaluations indicative of a price between the prices bid and asked for the investment (a “mid” evaluation). The Fund normally uses bid evaluations for any U.S. Treasury and Agency securities, mortgage-backed securities and municipal securities. The Fund normally uses mid evaluations for any other types of fixed-income securities and any OTC derivative contracts. In the event that market quotations and price evaluations are not available for an investment, the fair value of the investment is determined in accordance with procedures adopted by the Trustees.
Annual Shareholder Report
Repurchase Agreements
The Fund may invest in repurchase agreements for short-term liquidity purposes. It is the policy of the Fund to require the other party to a repurchase agreement to transfer to the Fund’s custodian or sub-custodian eligible securities or cash with a market value (after transaction costs) at least equal to the repurchase price to be paid under the repurchase agreement. The eligible securities are transferred to accounts with the custodian or sub-custodian in which the Fund holds a “securities entitlement” and exercises “control” as those terms are defined in the Uniform Commercial Code. The Fund has established procedures for monitoring the market value of the transferred securities and requiring the transfer of additional eligible securities if necessary to equal at least the repurchase price. These procedures also allow the other party to require securities to be transferred from the account to the extent that their market value exceeds the repurchase price or in exchange for other eligible securities of equivalent market value.
The insolvency of the other party or other failure to repurchase the securities may delay the disposition of the underlying securities or cause the Fund to receive less than the full repurchase price. Under the terms of the repurchase agreement, any amounts received by the Fund in excess of the repurchase price and related transaction costs must be remitted to the other party.
The Fund may enter into repurchase agreements in which eligible securities are transferred into joint trading accounts maintained by the custodian or sub-custodian for investment companies and other clients advised by the Fund’s Adviser and its affiliates. The Fund will participate on a pro rata basis with the other investment companies and clients in its share of the securities transferred under such repurchase agreements and in its share of proceeds from any repurchase or other disposition of such securities.
Investment Income, Gains and Losses, Expenses and Distributions
Investment transactions are accounted for on a trade-date basis. Realized gains and losses from investment transactions are recorded on an identified-cost basis. Interest income and expenses are accrued daily. Dividend income and distributions to shareholders are recorded on the ex-dividend date. Distributions of net investment income, if any, are declared and paid annually. Non-cash dividends included in dividend income, if any, are recorded at fair value. Amortization/accretion of premium and discount is included in investment income. Investment income, realized and unrealized gains and losses, and certain fund-level expenses are allocated to each class based on relative average daily net assets, except that select classes will bear certain expenses unique to those classes. The detail of the total fund expense waiver and reimbursements of $1,365,791 is disclosed in various locations in this Note 2 and Note 5. For the year ended July 31, 2020, transfer agent fees for the Fund were as follows:
| | Transfer Agent
Fees Incurred | Transfer Agent
Fees Reimbursed |
| Class A Shares | $216,979 | $(183,381) |
| Class C Shares | 29,576 | (21,457) |
| Institutional Shares | 581,179 | (428,784) |
| Class R6 Shares | 78,914 | – |
| TOTAL | $906,648 | $(633,622) |
Annual Shareholder Report
Dividends are declared separately for each class. No class has preferential dividend rights; differences in per share dividend rates are generally due to differences in separate class expenses.
Other Service Fees
The Fund may pay other service fees up to 0.25% of the average daily net assets of the Fund’s Class A Shares and Class C Shares to financial intermediaries or to Federated Shareholder Services Company (FSSC) for providing services to shareholders and maintaining shareholder accounts. Subject to the terms described in the Expense Limitation note, FSSC may voluntarily reimburse the Fund for other service fees. For the year ended July 31, 2020, other service fees for the Fund were as follows:
| | Other Service
Fees Incurred |
| Class A Shares | $219,410 |
| Class C Shares | 45,715 |
| TOTAL | $265,125 |
Federal Taxes
It is the Fund’s policy to comply with the Subchapter M provision of the Internal Revenue Code (the “Code”) and to distribute to shareholders each year substantially all of its income. Accordingly, no provision for federal income tax is necessary. As of and during the year ended July 31, 2020, the Fund did not have a liability for any uncertain tax positions. The Fund recognizes interest and penalties, if any, related to tax liabilities as income tax expense in the Statement of Operations. As of July 31, 2020, tax years 2017 through 2020 remain subject to examination by the Fund’s major tax jurisdictions, which include the United States of America and the Commonwealth of Massachusetts.
When-Issued and Delayed-Delivery Transactions
The Fund may engage in when-issued or delayed-delivery transactions. The Fund records when-issued securities on the trade date and maintains security positions such that sufficient liquid assets will be available to make payment for the securities purchased. Securities purchased on a when-issued or delayed-delivery basis are marked to market daily and begin earning interest on the settlement date. Losses may occur on these transactions due to changes in market conditions or the failure of counterparties to perform under the contract.
Securities Lending
The Fund participates in a securities lending program providing for the lending of equity securities to qualified brokers. The term of the loans within the program is one year or less. The Fund normally receives cash collateral for securities loaned that may be invested in affiliated money market funds, other money market instruments and/or repurchase agreements. Investments in money market funds may include funds with a “floating” NAV that can impose redemption fees and liquidity gates, impose certain operational impediments to investing cash collateral, and, if the investee fund’s NAV decreases, result in the Fund recognizing losses and being required to cover the decrease in the value of the cash collateral. Collateral is maintained at a minimum level of 100% of the market value of investments loaned, plus interest, if applicable. In accordance with the Fund’s securities lending agreement, the market value of securities
Annual Shareholder Report
on loan is determined each day at the close of business and any additional collateral required to cover the value of securities on loan is delivered to the Fund on the next business day. Earnings on collateral are allocated between the borrower of the security, the securities lending agent, as a fee for its services under the program and the Fund, according to agreed-upon rates. The Fund will not have the right to vote on securities while they are on loan. However, the Fund will attempt to terminate a loan in an effort to reacquire the securities in time to vote on matters that are deemed to be material by the Adviser. There can be no assurance that the Fund will have sufficient notice of such matters to be able to terminate the loan in time to vote thereon.
Securities lending transactions are subject to Master Netting Agreements which are agreements between the Fund and its counterparties that provide for the net settlement of all transactions and collateral with the Fund, through a single payment, in the event of default or termination. Amounts presented on the Portfolio of Investments and Statement of Assets and Liabilities are not net settlement amounts but gross. As indicated below, the cash collateral received by the Fund exceeds the market value of the securities loaned reducing the net settlement amount to zero. The chart below identifies the amount of collateral received as well as the market value of securities on loan. Additionally, the securities lending agreement executed by the Fund includes an indemnification clause. This clause stipulates that the borrower will reimburse the Fund for any losses as a result of any failure of the borrower to return equivalent securities to the Fund.
As of July 31, 2020, securities subject to this type of arrangement and related collateral were as follows:
Market Value of
Securities Loaned | Collateral
Received |
| $84,180,685 | $87,174,159 |
Other
The preparation of financial statements in conformity with GAAP requires management to make estimates and assumptions that affect the amounts of assets, liabilities, expenses and revenues reported in the financial statements. Actual results could differ materially from those estimated. The Fund applies investment company accounting and reporting guidance.
Annual Shareholder Report
3. SHARES OF BENEFICIAL INTEREST
The following tables summarize share activity:
| Year Ended July 31 | 2020 | 2019 |
| Class A Shares: | Shares | Amount | Shares | Amount |
| Shares sold | 609,482 | $13,104,153 | 1,528,971 | $35,808,747 |
| Proceeds from shares issued in connection with the tax-free transfer of assets from the Acquired Fund | 1,446,327 | 33,251,055 | – | – |
| Shares issued to shareholders in payment of distributions declared | – | – | 206,833 | 4,264,901 |
| Shares redeemed | (1,715,867) | (36,704,330) | (1,439,941) | (34,081,411) |
| NET CHANGE RESULTING FROM CLASS A SHARE TRANSACTIONS | 339,942 | $9,650,878 | 295,863 | $5,992,237 |
| Year Ended July 31 | 2020 | 2019 |
| Class C Shares: | Shares | Amount | Shares | Amount |
| Shares sold | 126,433 | $2,399,164 | 861,349 | $19,805,308 |
| Proceeds from shares issued in connection with the tax-free transfer of assets from the Acquired Fund | 182,602 | 3,655,701 | – | – |
| Shares issued to shareholders in payment of distributions declared | – | – | 84,088 | 1,519,470 |
| Shares redeemed | (577,979) | (11,036,748) | (622,248) | (12,775,267) |
| NET CHANGE RESULTING FROM CLASS C SHARE TRANSACTIONS | (268,944) | $(4,981,883) | 323,189 | $8,549,511 |
| Year Ended July 31 | 2020 | 2019 |
| Institutional Shares: | Shares | Amount | Shares | Amount |
| Shares sold | 7,454,551 | $168,193,983 | 13,009,742 | $313,124,900 |
| Proceeds from shares issued in connection with the tax-free transfer of assets from the Acquired Fund | 2,548,202 | 61,335,218 | – | – |
| Shares issued to shareholders in payment of distributions declared | – | – | 906,635 | 19,519,847 |
| Shares redeemed | (14,562,017) | (326,516,625) | (8,855,829) | (217,649,803) |
| NET CHANGE RESULTING FROM INSTITUTIONAL SHARE TRANSACTIONS | (4,559,264) | $(96,987,424) | 5,060,548 | $114,994,944 |
Annual Shareholder Report
| Year Ended July 31 | 2020 | 2019 |
| Class R6 Shares: | Shares | Amount | Shares | Amount |
| Shares sold | 3,418,303 | $76,427,739 | 11,880,605 | $294,063,644 |
| Proceeds from shares issued in connection with the tax-free transfer of assets from the Acquired Fund | 183,221 | 4,410,134 | – | – |
| Shares issued to shareholders in payment of distributions declared | – | – | 354,134 | 7,624,503 |
| Shares redeemed | (5,976,222) | (138,002,221) | (1,908,361) | (45,899,914) |
| NET CHANGE RESULTING FROM CLASS R6 SHARE TRANSACTIONS | (2,374,698) | $(57,164,348) | 10,326,378 | $255,788,233 |
| NET CHANGE RESULTING FROM TOTAL FUND SHARE TRANSACTIONS | (6,862,964) | $(149,482,777) | 16,005,978 | $385,324,925 |
4. FEDERAL TAX INFORMATION
The accounting treatment of certain items in accordance with income tax regulations may differ from the accounting treatment in accordance with GAAP which may result in permanent differences. In the case of the Fund, such differences primarily result from net operating loss, regulatory settlement proceeds and deferral of losses on wash sales.
For the year ended July 31, 2020, permanent differences identified and reclassified among the components of net assets were as follows:
| Increase (Decrease) |
| Paid-In Capital | Total Distributable
Earnings (Loss) |
| $(634,073) | $634,073 |
Net assets were not affected by this reclassification.
The tax character of distributions as reported on the Statement of Changes in Net Assets for the years ended July 31, 2020 and 2019, was as follows:
| | 2020 | 2019 |
| Ordinary income1 | $- | $19,115,501 |
| Long-term capital gains | $- | $18,819,890 |
| 1 | For tax purposes, short-term capital gain distributions are considered ordinary income distributions. |
As of July 31, 2020, the components of distributable earnings on a tax-basis were as follows:
| Net unrealized appreciation | $93,946,092 |
| Capital loss carryforwards and deferrals | $(25,165,512) |
The difference between book-basis and tax-basis net unrealized appreciation/depreciation is attributable to differing treatments for deferral of losses on wash sales.
Annual Shareholder Report
At July 31, 2020, the cost of investments for federal tax purposes was $739,870,583. The net unrealized appreciation of investments for federal tax purposes was $93,946,092. This consists of net unrealized appreciation from investments for those securities having an excess of value over cost of $123,992,623 and net unrealized depreciation from investments for those securities having an excess of cost over value of $30,046,531.
As of July 31, 2020, the Fund had a capital loss carryforward of $24,245,488 which will reduce the Fund’s taxable income arising from future net realized gains on investments, if any, to the extent permitted by the Code, thereby reducing the amount of distributions to shareholders which would otherwise be necessary to relieve the Fund of any liability for federal income tax. Pursuant to the Code, these net capital losses retain their character as either short-term or long-term and do not expire.
The following schedule summarizes the Fund’s capital loss carryforwards:
| Short-Term | Long-Term | Total |
| $23,207,571 | $1,037,917 | $24,245,488 |
Under current tax rules, a late-year ordinary loss may be deferred, in whole or in part, and treated as occurring on the first day of the following fiscal year. As of July 31, 2020, for federal income tax purposes, a late year ordinary loss of $920,024 was deferred to August 1, 2020.
5. INVESTMENT ADVISER FEE AND OTHER TRANSACTIONS WITH AFFILIATES
Investment Adviser Fee
The advisory agreement between the Fund and the Adviser provides for an annual fee equal to 0.80% of the Fund’s average daily net assets. Prior to July 1, 2019, the annual advisory fee was 0.85% of the Fund’s average daily net assets. Subject to the terms described in the Expense Limitation note, the Adviser may voluntarily choose to waive any portion of its fee and/or reimburse certain operating expenses of the Fund. For the year ended July 31, 2020, the Adviser voluntarily waived $676,107 of its fee and voluntarily reimbursed $633,622 of transfer agent fees.
The Adviser has agreed to reimburse the Fund for certain investment adviser fees as a result of transactions in other affiliated investment companies. For the year ended July 31, 2020, the Adviser reimbursed $56,062.
Annual Shareholder Report
Administrative Fee
Federated Administrative Services (FAS), under the Administrative Services Agreement, provides the Fund with administrative personnel and services. For purposes of determining the appropriate rate breakpoint, “Investment Complex” is defined as all of the Federated Hermes Funds subject to a fee under the Administrative Services Agreement. The fee paid to FAS is based on the average daily net assets of the Investment Complex as specified below:
| Administrative Fee | Average Daily Net Assets
of the Investment Complex |
| 0.100% | on assets up to $50 billion |
| 0.075% | on assets over $50 billion |
Subject to the terms described in the Expense Limitation note, FAS may voluntarily choose to waive any portion of its fee. For the year ended July 31, 2020, the annualized fee paid to FAS was 0.079% of average daily net assets of the Fund.
In addition, FAS may charge certain out-of-pocket expenses to the Fund.
Distribution Services Fee
The Fund has adopted a Distribution Plan (the “Plan”) pursuant to Rule 12b-1 under the Act. Under the terms of the Plan, the Fund will compensate Federated Securities Corp. (FSC), the principal distributor, from the daily net assets of the Fund’s Class A Shares and Class C Shares to finance activities intended to result in the sale of these shares. The Plan provides that the Fund may incur distribution expenses at the following percentages of average daily net assets annually, to compensate FSC:
| | Percentage of Average Daily
Net Assets of Class |
| Class A Shares | 0.05% |
| Class C Shares | 0.75% |
Subject to the terms described in the Expense Limitation note, FSC may voluntarily choose to waive any portion of its fee. For the year ended July 31, 2020, distribution services fees for the Fund were as follows:
| | Distribution Services
Fees Incurred |
| Class C Shares | $141,294 |
For the year ended July 31, 2020, FSC retained $20,779 fees paid by the Fund.
When FSC receives fees, it may pay some or all of them to financial intermediaries whose customers purchase shares. For the year ended July 31, 2020, the Fund’s Class A Shares did not incur a distribution services fee; however, it may begin to incur this fee upon approval of the Trustees.
Annual Shareholder Report
Sales Charges
Front-end sales charges and contingent deferred sales charges (CDSC) do not represent expenses of the Fund. They are deducted from the proceeds of sales of Fund shares prior to investment or from redemption proceeds prior to remittance, as applicable. For the year ended July 31, 2020, FSC retained $2,074 in sales charges from the sale of Class A Shares. FSC also retained $230 and $2,017 of CDSC relating to redemptions of Class A Shares and Class C Shares, respectively.
Other Service Fees
For the year ended July 31, 2020, FSSC received $10,601 of the other service fees disclosed in Note 2.
Expense Limitation
The Adviser and certain of its affiliates (which may include FSC, FAS and FSSC) on their own initiative have agreed to waive certain amounts of their respective fees and/or reimburse expenses. Total annual fund operating expenses (as shown in the financial highlights, excluding interest expense, extraordinary expenses and proxy-related expenses paid by the Fund, if any) paid by the Fund’s Class A Shares, Class C Shares, Institutional Shares and Class R6 Shares (after the voluntary waivers and/or reimbursements) will not exceed 1.13%, 1.88%, 0.88% and 0.87% (the “Fee Limit”), respectively, up to but not including the later of (the “Termination Date”): (a) October 1, 2021; or (b) the date of the Fund’s next effective Prospectus. While the Adviser and its applicable affiliates currently do not anticipate terminating or increasing these arrangements prior to the Termination Date, these arrangements may only be terminated or the Fee Limit increased prior to the Termination Date with the agreement of the Trustees.
Directors’/Trustees’ and Miscellaneous Fees
Certain Officers and Trustees of the Fund are Officers and Directors or Trustees of certain of the above companies. To efficiently facilitate payment, Independent Directors’/Trustees’ fees and certain expenses related to conducting meetings of the Directors/Trustees and other miscellaneous expenses are paid by an affiliate of the Adviser which in due course are reimbursed by the Fund. These expenses related to conducting meetings of the Directors/Trustees and other miscellaneous expenses may be included in Accrued and Miscellaneous Expenses on the Statement of Assets and Liabilities and Statement of Operations, respectively.
6. INVESTMENT TRANSACTIONS
Purchases and sales of investments, excluding long-term U.S. government securities and short-term obligations, for the year ended July 31, 2020, were as follows:
| Purchases | $1,868,750,417 |
| Sales | $2,033,306,095 |
7. CONCENTRATION OF RISK
The Fund may invest a portion of its assets in securities of companies that are deemed by the Fund’s management to be classified in similar business sectors. Economic developments may have an effect on the liquidity and volatility of the portfolio securities.
Annual Shareholder Report
8. LINE OF CREDIT
The Fund participates with certain other Federated Hermes Funds, on a several basis, in an up to $500,000,000 unsecured, 364-day, committed, revolving line of credit (LOC) agreement. The LOC was made available to temporarily finance the repurchase or redemption of shares of the Fund, failed trades, payment of dividends, settlement of trades and for other short-term, temporary or emergency general business purposes. The Fund cannot borrow under the LOC if an inter-fund loan is outstanding. The Fund’s ability to borrow under the LOC also is subject to the limitations of the Act and various conditions precedent that must be satisfied before the Fund can borrow. Loans under the LOC are charged interest at a fluctuating rate per annum equal to the highest, on any day, of (a) (i) the federal funds effective rate, (ii) the one month London Interbank Offered Rate (LIBOR), or a replacement rate as appropriate, and (iii) 0.0%, plus (b) a margin. Any fund eligible to borrow under the LOC pays its pro rata share of an upfront fee, and its pro rata share of a commitment fee based on the amount of the lenders’ commitment that has not been utilized, quarterly in arrears and at maturity. As of July 31, 2020, the Fund had no outstanding loans. During the year ended July 31, 2020, the Fund did not utilize the LOC.
9. INTERFUND LENDING
Pursuant to an Exemptive Order issued by the SEC, the Fund, along with other funds advised by subsidiaries of Federated Hermes, Inc., may participate in an interfund lending program. This program provides an alternative credit facility allowing the Fund to borrow from other participating affiliated funds. As of July 31, 2020, there were no outstanding loans. During the year ended July 31, 2020, the program was not utilized.
10. OTHER MATTERS
An outbreak of respiratory disease caused by a novel coronavirus was first detected in China in December 2019 and subsequently spread globally. As of the date of the issuance of these financial statements, this coronavirus has resulted in closing borders, enhanced health screenings, healthcare service preparation and delivery, quarantines, cancellations, and disruptions to supply chains, workflow operations and consumer activity, as well as general concern and uncertainty. The impact of this coronavirus may be short-term or may last for an extended period of time and has resulted in a substantial economic downturn. Health crises caused by outbreaks, such as the coronavirus outbreak, may exacerbate other pre-existing political, social and economic risks. The impact of this outbreak, and other epidemics and pandemics that may arise in the future, could continue to negatively affect the worldwide economy, as well as the economies of individual countries, individual companies (including certain Fund service providers and issuers of the Fund’s investments) and the markets in general in significant and unforeseen ways. Any such impact could adversely affect the Fund’s performance.
Annual Shareholder Report
Report of Independent Registered Public Accounting Firm
TO THE board of trustees OF federated Hermes MDT Series and shareholders of Federated Hermes MDT Small Cap Growth Fund:
Opinion on the Financial Statements
We have audited the accompanying statement of assets and liabilities of Federated Hermes MDT Small Cap Growth Fund (formerly, Federated MDT Small Cap Growth Fund) (the “Fund”) (one of the portfolios constituting Federated Hermes MDT Series (formerly, Federated MDT Series) (the “Trust”)), including the portfolio of investments, as of July 31, 2020, and the related statement of operations for the year then ended, the statement of changes in net assets for each of the two years in the period then ended, the financial highlights for each of the five years in the period then ended and the related notes (collectively referred to as the “financial statements”). In our opinion, the financial statements present fairly, in all material respects, the financial position of the Fund (one of the funds constituting Federated Hermes MDT Series) at July 31, 2020, the results of its operations for the year then ended, the changes in its net assets for each of the two years in the period then ended and its financial highlights for each of the five years in the period then ended, in conformity with U.S. generally accepted accounting principles.
Basis for Opinion
These financial statements are the responsibility of the Trust’s management. Our responsibility is to express an opinion on the Fund’s financial statements based on our audits. We are a public accounting firm registered with the Public Company Accounting Oversight Board (United States) (“PCAOB”) and are required to be independent with respect to the Trust in accordance with the U.S. federal securities laws and the applicable rules and regulations of the Securities and Exchange Commission and the PCAOB.
We conducted our audits in accordance with standards of the PCAOB. Those standards require that we plan and perform the audit to obtain reasonable assurance about whether the financial statements and financial highlights are free of material misstatement, whether due to error or fraud. The Trust is not required to have, nor were we engaged to perform, an audit of the Trust’s internal control over financial reporting. As part of our audits, we are required to obtain an understanding of internal control over financial reporting, but not for the purpose of expressing an opinion on the effectiveness of the Trust’s internal control over financial reporting. Accordingly, we express no such opinion.
Annual Shareholder Report
Our audits included performing procedures to assess the risks of material misstatement of the financial statements, whether due to error or fraud, and performing procedures that respond to those risks. Such procedures included examining, on a test basis, evidence regarding the amounts and disclosures in the financial statements. Our procedures included confirmation of securities owned as of July 31, 2020, by correspondence with the custodian and others or by other appropriate auditing procedures where replies from others were not received. Our audits also included evaluating the accounting principles used and significant estimates made by management, as well as evaluating the overall presentation of the financial statements. We believe that our audits provide a reasonable basis for our opinion.
We have served as the auditor of one or more Federated Hermes investment companies since 1979.
Boston, Massachusetts
September 22, 2020
Annual Shareholder Report
Shareholder Expense Example (unaudited)
As a shareholder of the Fund, you incur two types of costs: (1) transaction costs, including sales charges (loads) on purchase or redemption payments; and (2) ongoing costs, including management fees and to the extent applicable, distribution (12b-1) fees and/or other service fees and other Fund expenses. This Example is intended to help you to understand your ongoing costs (in dollars) of investing in the Fund and to compare these costs with the ongoing costs of investing in other mutual funds. It is based on an investment of $1,000 invested at the beginning of the period and held for the entire period from February 1, 2020 to July 31, 2020.
ACTUAL EXPENSES
The first section of the table below provides information about actual account values and actual expenses. You may use the information in this section, together with the amount you invested, to estimate the expenses that you incurred over the period. Simply divide your account value by $1,000 (for example, an $8,600 account value divided by $1,000 = 8.6), then multiply the result by the number in the first section under the heading entitled “Expenses Paid During Period” to estimate the expenses attributable to your investment during this period.
HYPOTHETICAL EXAMPLE FOR COMPARISON PURPOSES
The second section of the table below provides information about hypothetical account values and hypothetical expenses based on the Fund’s actual expense ratio and an assumed rate of return of 5% per year before expenses, which is not the Fund’s actual return. Thus, you should not use the hypothetical account values and expenses to estimate the actual ending account balance or your expenses for the period. Rather, these figures are required to be provided to enable you to compare the ongoing costs of investing in the Fund with other funds. To do so, compare this 5% hypothetical example with the 5% hypothetical examples that appear in the shareholder reports of the other funds.
Annual Shareholder Report
Please note that the expenses shown in the table are meant to highlight your ongoing costs only and do not reflect any transaction costs, such as sales charges (loads) on purchase or redemption payments. Therefore, the second section of the table is useful in comparing ongoing costs only, and will not help you determine the relative total costs of owning different funds. In addition, if these transaction costs were included, your costs would have been higher.
| | Beginning
Account Value
2/1/2020 | Ending
Account Value
7/31/2020 | Expenses Paid
During Period1 |
| Actual: | | | |
| Class A Shares | $1,000 | $1,017.90 | $5.67 |
| Class C Shares | $1,000 | $1,014.20 | $9.42 |
| Institutional Shares | $1,000 | $1,019.10 | $4.42 |
| Class R6 Shares | $1,000 | $1,019.10 | $4.37 |
Hypothetical (assuming a 5% return
before expenses): | | | |
| Class A Shares | $1,000 | $1,019.20 | $5.67 |
| Class C Shares | $1,000 | $1,015.50 | $9.42 |
| Institutional Shares | $1,000 | $1,020.50 | $4.42 |
| Class R6 Shares | $1,000 | $1,020.50 | $4.37 |
| 1 | Expenses are equal to the Fund’s annualized net expense ratios, multiplied by the average account value over the period, multiplied by 182/366 (to reflect the one-half-year period). The annualized net expense ratios are as follows: |
| | |
| Class A Shares | 1.13% |
| Class C Shares | 1.88% |
| Institutional Shares | 0.88% |
| Class R6 Shares | 0.87% |
Annual Shareholder Report
Board of Trustees and Trust Officers
The Board of Trustees is responsible for managing the Trust’s business affairs and for exercising all the Trust’s powers except those reserved for the shareholders. The following tables give information about each Trustee and the senior officers of the Fund. Where required, the tables separately list Trustees who are “interested persons” of the Fund (i.e., “Interested” Trustees) and those who are not (i.e., “Independent” Trustees). Unless otherwise noted, the address of each person listed is 1001 Liberty Avenue, Pittsburgh, PA 15222. The address of all Independent Trustees listed is 4000 Ericsson Drive, Warrendale, PA 15086-7561; Attention: Mutual Fund Board. As of December 31, 2019, the Trust comprised five portfolio(s), and the Federated Hermes Fund Family consisted of 41 investment companies (comprising 135 portfolios). Unless otherwise noted, each Officer is elected annually. Unless otherwise noted, each Trustee oversees all portfolios in the Federated Hermes Fund Family and serves for an indefinite term. The Fund’s Statement of Additional Information includes additional information about Trust Trustees and is available, without charge and upon request, by calling 1-800-341-7400.
Interested TRUSTEES Background
Name
Birth Date
Positions Held with Trust
Date Service Began | Principal Occupation(s) for Past Five Years,
Other Directorships Held and Previous Position(s) |
J. Christopher Donahue*
Birth Date: April 11, 1949
President and Trustee
Indefinite Term
Began serving: June 2006 | Principal Occupations: Principal Executive Officer and President of certain of the Funds in the Federated Hermes Fund Family; Director or Trustee of the Funds in the Federated Hermes Fund Family; President, Chief Executive Officer and Director, Federated Hermes, Inc.; Chairman and Trustee, Federated Investment Management Company; Trustee, Federated Investment Counseling; Chairman and Director, Federated Global Investment Management Corp.; Chairman and Trustee, Federated Equity Management Company of Pennsylvania; Trustee, Federated Shareholder Services Company; Director, Federated Services Company.
Previous Positions: President, Federated Investment Counseling; President and Chief Executive Officer, Federated Investment Management Company, Federated Global Investment Management Corp. and Passport Research, Ltd; Chairman, Passport Research, Ltd. |
Annual Shareholder Report
Name
Birth Date
Positions Held with Trust
Date Service Began | Principal Occupation(s) for Past Five Years,
Other Directorships Held and Previous Position(s) |
John B. Fisher*
Birth Date: May 16, 1956
Trustee
Indefinite Term
Began serving: May 2016 | Principal Occupations: Principal Executive Officer and President of certain of the Funds in the Federated Hermes Fund Family; Director or Trustee of certain of the Funds in the Federated Hermes Fund Family; Vice President, Federated Hermes, Inc.; President, Director/Trustee and CEO, Federated Advisory Services Company, Federated Equity Management Company of Pennsylvania, Federated Global Investment Management Corp., Federated Investment Counseling, Federated Investment Management Company; President of some of the Funds in the Federated Hermes Fund Family and Director, Federated Investors Trust Company.
Previous Positions: President and Director of the Institutional Sales Division of Federated Securities Corp.; President and Director of Federated Investment Counseling; President and CEO of Passport Research, Ltd.; Director, Edgewood Securities Corp.; Director, Federated Services Company; Director, Federated Hermes, Inc.; Chairman and Director, Southpointe Distribution Services, Inc. and President, Technology, Federated Services Company. |
| * | Reasons for “interested” status: J. Christopher Donahue and John B. Fisher are interested due to their beneficial ownership of shares of Federated Hermes, Inc. and due to positions they hold with Federated Hermes, Inc. and its subsidiaries. |
INDEPENDENT TRUSTEES Background
Name
Birth Date
Positions Held with Trust
Date Service Began | Principal Occupation(s) for Past Five Years,
Other Directorships Held, Previous Position(s) and Qualifications |
John T. Collins
Birth Date: January 24, 1947
Trustee
Indefinite Term
Began serving:
October 2013 | Principal Occupations: Director or Trustee of the Federated Hermes Fund Family; formerly, Chairman and CEO, The Collins Group, Inc. (a private equity firm) (Retired).
Other Directorships Held: Chairman of the Board of Directors, Director, and Chairman of the Compensation Committee, KLX Energy Services Holdings, Inc. (oilfield services); former Director of KLX Corp. (aerospace).
Qualifications: Mr. Collins has served in several business and financial management roles and directorship positions throughout his career. Mr. Collins previously served as Chairman and CEO of The Collins Group, Inc. (a private equity firm) and as a Director of KLX Corp. Mr. Collins serves as Chairman Emeriti, Bentley University. Mr. Collins previously served as Director and Audit Committee Member, Bank of America Corp.; Director, FleetBoston Financial Corp.; and Director, Beth Israel Deaconess Medical Center (Harvard University Affiliate Hospital). |
Annual Shareholder Report
Name
Birth Date
Positions Held with Trust
Date Service Began | Principal Occupation(s) for Past Five Years,
Other Directorships Held, Previous Position(s) and Qualifications |
G. Thomas Hough
Birth Date: February 28, 1955
Trustee
Indefinite Term
Began serving: August 2015 | Principal Occupations: Director or Trustee, Chair of the Audit Committee of the Federated Hermes Fund Family; formerly, Vice Chair, Ernst & Young LLP (public accounting firm) (Retired).
Other Directorships Held: Director, Chair of the Audit Committee, Equifax, Inc.; Director, Member of the Audit Committee, Haverty Furniture Companies, Inc.; formerly, Director, Member of Governance and Compensation Committees, Publix Super Markets, Inc.
Qualifications: Mr. Hough has served in accounting, business management and directorship positions throughout his career. Mr. Hough most recently held the position of Americas Vice Chair of Assurance with Ernst & Young LLP (public accounting firm). Mr. Hough serves on the President’s Cabinet and Business School Board of Visitors for the University of Alabama. Mr. Hough previously served on the Business School Board of Visitors for Wake Forest University, and he previously served as an Executive Committee member of the United States Golf Association. |
Maureen Lally-Green
Birth Date: July 5, 1949
Trustee
Indefinite Term
Began serving: August 2009 | Principal Occupations: Director or Trustee of the Federated Hermes Fund Family; Adjunct Professor of Law, Duquesne University School of Law; formerly, Dean of the Duquesne University School of Law and Professor of Law and Interim Dean of the Duquesne University School of Law; formerly, Associate General Secretary and Director, Office of Church Relations, Diocese of Pittsburgh.
Other Directorships Held: Director, CNX Resources Corporation (formerly known as CONSOL Energy Inc.).
Qualifications: Judge Lally-Green has served in various legal and business roles and directorship positions throughout her career. Judge Lally-Green previously held the position of Dean of the School of Law of Duquesne University (as well as Interim Dean). Judge Lally-Green previously served as a member of the Superior Court of Pennsylvania and as a Professor of Law, Duquesne University School of Law. Judge Lally-Green was appointed by the Supreme Court of Pennsylvania to serve on the Supreme Court’s Board of Continuing Judicial Education and the Supreme Court’s Appellate Court Procedural Rules Committee. Judge Lally-Green also currently holds the positions on not for profit or for profit boards of directors as follows: Director and Chair, UPMC Mercy Hospital; Director and Vice Chair, Our Campaign for the Church Alive!, Inc.; Regent, Saint Vincent Seminary; Member, Pennsylvania State Board of Education (public); Director, Catholic Charities, Pittsburgh; and Director CNX Resources Corporation (formerly known as CONSOL Energy Inc.). Judge Lally-Green has held the positions of: Director, Auberle; Director, Epilepsy Foundation of Western and Central Pennsylvania; Director, Ireland Institute of Pittsburgh; Director, Saint Thomas More Society; Director and Chair, Catholic High Schools of the Diocese of Pittsburgh, Inc.; Director, Pennsylvania Bar Institute; Director, St. Vincent College; and Director and Chair, North Catholic High School, Inc. |
Annual Shareholder Report
Name
Birth Date
Positions Held with Trust
Date Service Began | Principal Occupation(s) for Past Five Years,
Other Directorships Held, Previous Position(s) and Qualifications |
Charles F. Mansfield, Jr.
Birth Date: April 10, 1945
Trustee
Indefinite Term
Began serving: June 2006 | Principal Occupations: Director or Trustee of the Federated Hermes Fund Family; Management Consultant and Author.
Other Directorships Held: None.
Qualifications: Mr. Mansfield has served as a Marine Corps officer and in several banking, business management, educational roles and directorship positions throughout his long career. He remains active as a Management Consultant and Author. |
Thomas M. O’Neill
Birth Date: June 14, 1951
Trustee
Indefinite Term
Began serving: August 2006 | Principal Occupations: Director or Trustee of the Federated Hermes Fund Family; Sole Proprietor, Navigator Management Company (investment and strategic consulting).
Other Directorships Held: None.
Qualifications: Mr. O’Neill has served in several business, mutual fund and financial management roles and directorship positions throughout his career. Mr. O’Neill serves as Director, Medicines for Humanity and Director, The Golisano Children’s Museum of Naples, Florida. Mr. O’Neill previously served as Chief Executive Officer and President, Managing Director and Chief Investment Officer, Fleet Investment Advisors; President and Chief Executive Officer, Aeltus Investment Management, Inc.; General Partner, Hellman, Jordan Management Co., Boston, MA; Chief Investment Officer, The Putnam Companies, Boston, MA; Credit Analyst and Lending Officer, Fleet Bank; Director and Consultant, EZE Castle Software (investment order management software); and Director, Midway Pacific (lumber). |
P. Jerome Richey
Birth Date: February 23, 1949
Trustee
Indefinite Term
Began serving:
October 2013 | Principal Occupations: Director or Trustee of the Federated Hermes Fund Family; Management Consultant; Retired; formerly, Senior Vice Chancellor and Chief Legal Officer, University of Pittsburgh and Executive Vice President and Chief Legal Officer, CNX Resources Corporation (formerly known as CONSOL Energy Inc.).
Other Directorships Held: None.
Qualifications: Mr. Richey has served in several business and legal management roles and directorship positions throughout his career. Mr. Richey most recently held the positions of Senior Vice Chancellor and Chief Legal Officer, University of Pittsburgh. Mr. Richey previously served as Chairman of the Board, Epilepsy Foundation of Western Pennsylvania and Chairman of the Board, World Affairs Council of Pittsburgh. Mr. Richey previously served as Chief Legal Officer and Executive Vice President, CNX Resources Corporation (formerly known as CONSOL Energy Inc.); and Board Member, Ethics Counsel and Shareholder, Buchanan Ingersoll & Rooney PC (a law firm). |
Annual Shareholder Report
Name
Birth Date
Positions Held with Trust
Date Service Began | Principal Occupation(s) for Past Five Years,
Other Directorships Held, Previous Position(s) and Qualifications |
John S. Walsh
Birth Date:
November 28, 1957
Trustee
Indefinite Term
Began serving: June 2006 | Principal Occupations: Director or Trustee, and Chair of the Board of Directors or Trustees, of the Federated Hermes Fund Family; President and Director, Heat Wagon, Inc. (manufacturer of construction temporary heaters); President and Director, Manufacturers Products, Inc. (distributor of portable construction heaters); President, Portable Heater Parts, a division of Manufacturers Products, Inc.
Other Directorships Held: None.
Qualifications: Mr. Walsh has served in several business management roles and directorship positions throughout his career. Mr. Walsh previously served as Vice President, Walsh & Kelly, Inc. (paving contractors). |
OFFICERS
Name
Birth Date
Address
Positions Held with Trust
Date Service Began | Principal Occupation(s) for Past Five Years
and Previous Position(s) |
Lori A. Hensler
Birth Date: January 6, 1967
TREASURER
Officer since: April 2013 | Principal Occupations: Principal Financial Officer and Treasurer of the Federated Hermes Fund Family; Senior Vice President, Federated Administrative Services; Financial and Operations Principal for Federated Securities Corp. and Edgewood Services, Inc.; and Assistant Treasurer, Federated Investors Trust Company. Ms. Hensler has received the Certified Public Accountant designation.
Previous Positions: Controller of Federated Hermes, Inc.; Senior Vice President and Assistant Treasurer, Federated Investors Management Company; Treasurer, Federated Investors Trust Company; Assistant Treasurer, Federated Administrative Services, Federated Administrative Services, Inc., Federated Securities Corp., Edgewood Services, Inc., Federated Advisory Services Company, Federated Equity Management Company of Pennsylvania, Federated Global Investment Management Corp., Federated Investment Counseling, Federated Investment Management Company, Passport Research, Ltd., and Federated MDTA, LLC; Financial and Operations Principal for Federated Securities Corp., Edgewood Services, Inc. and Southpointe Distribution Services, Inc. |
Annual Shareholder Report
Name
Birth Date
Address
Positions Held with Trust
Date Service Began | Principal Occupation(s) for Past Five Years
and Previous Position(s) |
Peter J. Germain
Birth Date:
September 3, 1959
CHIEF LEGAL OFFICER, SECRETARY and EXECUTIVE VICE PRESIDENT
Officer since: June 2006 | Principal Occupations: Mr. Germain is Chief Legal Officer, Secretary and Executive Vice President of the Federated Hermes Fund Family. He is General Counsel, Chief Legal Officer, Secretary and Executive Vice President, Federated Hermes, Inc.; Trustee and Senior Vice President, Federated Investors Management Company; Trustee and President, Federated Administrative Services; Director and President, Federated Administrative Services, Inc.; Director and Vice President, Federated Securities Corp.; Director and Secretary, Federated Private Asset Management, Inc.; Secretary, Federated Shareholder Services Company; and Secretary, Retirement Plan Service Company of America. Mr. Germain joined Federated Hermes in 1984 and is a member of the Pennsylvania Bar Association.
Previous Positions: Deputy General Counsel, Special Counsel, Managing Director of Mutual Fund Services, Federated Hermes, Inc.; Senior Vice President, Federated Services Company; and Senior Corporate Counsel, Federated Hermes, Inc. |
Stephen F. Auth
Birth Date: September 13, 1956
101 Park Avenue
41st Floor
New York, NY 10178
CHIEF INVESTMENT OFFICER
Officer since: June 2012 | Principal Occupations: Stephen F. Auth is Chief Investment Officer of various Funds in the Federated Hermes Fund Family; Executive Vice President, Federated Investment Counseling, Federated Global Investment Management Corp. and Federated Equity Management Company of Pennsylvania.
Previous Positions: Executive Vice President, Federated Investment Management Company and Passport Research, Ltd. (investment advisory subsidiary of Federated); Senior Vice President, Global Portfolio Management Services Division; Senior Vice President, Federated Investment Management Company and Passport Research, Ltd.; Senior Managing Director and Portfolio Manager, Prudential Investments. |
Stephen Van Meter
Birth Date: June 5, 1975
CHIEF COMPLIANCE OFFICER AND SENIOR VICE PRESIDENT
Officer since: July 2015 | Principal Occupations: Senior Vice President and Chief Compliance Officer of the Federated Hermes Fund Family; Vice President and Chief Compliance Officer of Federated Hermes, Inc. and Chief Compliance Officer of certain of its subsidiaries. Mr. Van Meter joined Federated Hermes, Inc. in October 2011. He holds FINRA licenses under Series 3, 7, 24 and 66.
Previous Positions: Mr. Van Meter previously held the position of Compliance Operating Officer, Federated Hermes, Inc. Prior to joining Federated Hermes, Inc., Mr. Van Meter served at the United States Securities and Exchange Commission in the positions of Senior Counsel, Office of Chief Counsel, Division of Investment Management and Senior Counsel, Division of Enforcement. |
Annual Shareholder Report
Evaluation and Approval of Advisory Contract–May 2020
Federated MDT Small Cap Growth Fund (the “Fund”)
(EFFECTIVE CLOSE OF BUSINESS ON JUNE 26, 2020, THE FUND’S NAME CHANGED TO FEDERATED HERMES MDT SMALL CAP GROWTH FUND)
At its meetings in May 2020 (the “May Meetings”), the Fund’s Board of Trustees (the “Board”), including a majority of those Trustees who are not “interested persons” of the Fund, as defined in the Investment Company Act of 1940 (the “Independent Trustees”), reviewed and unanimously approved the continuation of the investment advisory contract between the Fund and Federated MDTA LLC (the “Adviser”) with respect to the Fund (the “Contract”) for an additional one-year term. The Board’s determination to approve the continuation of the Contract reflects the exercise of its business judgment after considering all of the information and factors believed to be relevant and appropriate on whether to continue the existing arrangements. The information, factors and conclusions that formed the basis for the Board’s approval are summarized below.
Information Received and Review Process
At the request of the Independent Trustees, the Fund’s Chief Compliance Officer (the “CCO”) furnished to the Board in advance of its May Meetings an independent written evaluation presenting on the topics discussed below. The Board considered the CCO’s independent written evaluation (the “CCO Fee Evaluation Report”), along with other information, in evaluating the reasonableness of the Fund’s management fee and in determining to approve the continuation of the Contract. The CCO, in preparing the CCO Fee Evaluation Report, has the authority to retain consultants, experts or staff as reasonably necessary to assist in the performance of his duties, reports directly to the Board, and can be terminated only with the approval of a majority of the Independent Trustees. At the request of the Independent Trustees, the CCO Fee Evaluation Report followed the same general approach and covered the same topics as that of the report that had previously been delivered by the CCO in his capacity as “Senior Officer,” prior to the elimination of the Senior Officer position in December 2017.
In addition to the extensive materials that comprise and accompany the CCO Fee Evaluation Report, in the months preceding the May Meetings, the Board requested and reviewed written responses and supporting materials prepared by the Adviser and its affiliates (collectively, “Federated Hermes”) in response to requests posed to Federated Hermes on behalf of the Independent Trustees encompassing a wide variety of topics. The Board also considered such additional matters as the Independent Trustees deemed reasonably necessary to evaluate the Contract, which included detailed information about the Fund and Federated Hermes furnished to the Board at its meetings throughout the year
Annual Shareholder Report
and in between regularly scheduled meetings on particular matters as the need arose, as well as information specifically prepared in connection with the approval of the continuation of the Contract that was presented at the May Meetings.
The Board’s consideration of the Contract included review of materials and information covering the following matters, among others: the Adviser’s investment philosophy, revenue, profitability, personnel and processes; investment and operating strategies; the Fund’s short-term and long-term performance (in absolute terms, both on a gross basis and net of expenses, and relative to the Fund’s particular investment program and a group of its peer funds and/or its benchmark, as appropriate) and comments on the reasons for the Fund’s performance; the Fund’s investment objectives; the Fund’s expenses, including the advisory fee and the overall expense structure of the Fund (both in absolute terms and relative to a group of its peer funds), with due regard for contractual or voluntary expense limitations (if any); the use and allocation of brokerage commissions derived from trading the Fund’s portfolio securities (if any); and the nature, quality and extent of the advisory and other services provided to the Fund by the Adviser and its affiliates. The Board also considered the preferences and expectations of Fund shareholders; the entrepreneurial and other risks assumed by the Adviser in sponsoring and managing the Fund; the continuing state of competition in the mutual fund industry and market practices; the range of comparable fees for similar funds in the mutual fund industry; the Fund’s relationship to the other funds advised by Federated Hermes (each, a “Federated Hermes Fund”), which include a comprehensive array of funds with different investment objectives, policies and strategies which are generally available for exchange without the incurrence of additional sales charges; compliance and audit reports concerning the Federated Hermes Funds and the Federated Hermes’ affiliates that service them (including communications from regulatory agencies), as well as Federated Hermes’ responses to any issues raised therein; and relevant developments in the mutual fund industry and how the Federated Hermes Funds and/or Federated Hermes may be responding to them. In addition, the Board received and considered information furnished by Federated Hermes on the impacts of the coronavirus (COVID-19) outbreak on Federated Hermes generally and the Fund in particular, including, among other information, the current and anticipated impacts on the management, operations and performance of the Fund. The Board noted that its evaluation process is evolutionary and that the criteria considered and the emphasis placed on relevant criteria may change in recognition of changing circumstances in the mutual fund marketplace.
The Board also considered judicial decisions concerning allegedly excessive investment advisory fees in determining to approve the Contract. Using these judicial decisions as a guide, the Board observed that the following factors may be relevant to an adviser’s fiduciary duty with respect to its receipt of
Annual Shareholder Report
compensation from a fund: (1) the nature and quality of the services provided by an adviser to a fund and its shareholders (including the performance of the fund, its benchmark, and comparable funds); (2) an adviser’s cost of providing the services (including the profitability to an adviser of providing advisory services to a fund); (3) the extent to which an adviser may realize “economies of scale” as a fund grows larger and, if such economies of scale exist, whether they have been shared with a fund and its shareholders or the family of funds; (4) any “fall-out” financial benefits that accrue to an adviser because of its relationship with a fund (including research services received from brokers that execute fund trades and any fees paid to affiliates of an adviser for services rendered to a fund); (5) comparative fee and expense structures (including a comparison of fees paid to an adviser with those paid by similar funds both internally and externally as well as management fees charged to institutional and other advisory clients of the adviser for what might be viewed as like services); and (6) the extent of care, conscientiousness and independence with which the fund’s board members perform their duties and their expertise (including whether they are fully informed about all facts the board deems relevant to its consideration of an adviser’s services and fees). The Board noted that the Securities and Exchange Commission (“SEC”) disclosure requirements regarding the basis for a fund board’s approval of the fund’s investment advisory contracts generally align with the factors listed above. The Board was aware of these factors and was guided by them in its review of the Contract to the extent it considered them to be appropriate and relevant, as discussed further below.
The Board considered and weighed these factors in light of its substantial accumulated experience in governing the Fund and working with Federated Hermes on matters relating to the Federated Hermes Funds. While individual members of the Board may have weighed certain factors differently, the Board’s determination to continue the Contract was based on a comprehensive consideration of all information provided to the Board throughout the year and specifically with respect to the continuation of the Contract. The Independent Trustees were assisted throughout the evaluation process by independent legal counsel. In connection with their deliberations at the May Meetings, the Independent Trustees met separately in executive session with their independent legal counsel and without management present to review the relevant materials and consider their responsibilities under applicable laws. In addition, senior management representatives of Federated Hermes also met with the Independent Trustees and their independent legal counsel to discuss the materials and presentations furnished to the Board at the May Meetings. The Board considered the approval of the Contract for the Fund as part of its consideration of agreements for funds across the Federated Hermes Funds family, but its approvals were made on a fund-by-fund basis.
Annual Shareholder Report
Nature, Extent and Quality of Services
The Board considered the nature, extent and quality of the services provided to the Fund by the Adviser and the resources of the Adviser and its affiliates dedicated to the Fund. In this regard, the Board evaluated, among other things, the Adviser’s personnel, experience and track record, as well as the financial resources and overall reputation of Federated Hermes and its willingness to invest in personnel and infrastructure that benefit the Federated Hermes Funds. The Board noted the significant acquisition of Hermes Fund Managers Limited by Federated Hermes in 2018, which has deepened the organization’s investment management expertise and capabilities and expanded the investment process for all of the Federated Hermes Funds to incorporate environmental, social and governance (“ESG”) factors and issuer engagement on ESG matters.
In addition, the Board reviewed the qualifications, backgrounds and responsibilities of the portfolio management team primarily responsible for the day-to-day management of the Fund and the Adviser’s ability and experience in attracting and retaining qualified personnel to service the Fund. The Board noted the compliance program of the Adviser and the compliance-related resources devoted by the Adviser and its affiliates in support of the Fund’s obligations pursuant to Rule 38a-1 under the Investment Company Act of 1940, including the Adviser’s commitment to respond to rulemaking and other regulatory initiatives of the SEC. such as the liquidity risk management program rules. In addition, the Board considered the response by the Adviser to recent market conditions and considered the overall performance of the Adviser in this context. The Fund’s ability to deliver competitive performance when compared to its Performance Peer Group (as defined below) was also deemed to be relevant by the Board as a useful indicator of how the Adviser is executing the Fund’s investment program. The Adviser’s ability to execute this program was one of the Board’s considerations in reaching a conclusion that the nature, extent and quality of the Adviser’s investment management and related services warrant the continuation of the Contract.
Fund Investment Performance
In evaluating the Fund’s investment performance, the Board considered performance results in light of the Fund’s investment objective, strategies and risks, as disclosed in the Fund’s prospectus. The Board also considered the Fund’s performance in light of the overall recent market conditions. The Board considered detailed investment reports on the Fund’s performance over different time periods that were provided to the Board throughout the year and in connection with the May Meetings and evaluated the Adviser’s analysis of the Fund’s performance for these time periods. The Board also reviewed comparative information regarding the performance of other mutual funds in the category of peer funds selected by Morningstar, Inc. (the “Morningstar”), an independent fund ranking organization (the “Performance Peer Group”), noting the CCO’s view that comparisons to fund peer groups may be helpful,
Annual Shareholder Report
though not conclusive, in evaluating the performance of the Adviser in managing the Fund. The Board considered, in evaluating such comparisons, that in some cases there may be differences in the funds’ investment objectives or investment management techniques, or the costs to implement funds, even within the same Performance Peer Group. In this connection, the Board considered that the Fund’s quantitative focus makes fee and expense comparisons particularly difficult as the funds in the Performance Peer Group varied widely in their complexity, and the management of the Fund is among the more complex relative to its Performance Peer Group.
For the periods ended December 31, 2019, the Fund’s performance for the five-year period was above the median of the relevant Performance Peer Group, and the Fund’s performance fell below the median of the relevant Performance Peer Group for the one-year and three-year periods. In addition, the Board was informed by the Adviser that, for the same periods, the Fund outperformed its benchmark index for the five-year period and underperformed its benchmark index for the one-year and three-year periods. The Board discussed the Fund’s performance with the Adviser and recognized the efforts being taken by the Adviser in the context of other factors considered relevant by the Board.
Following such evaluation, and full deliberations, the Board concluded that the performance of the Fund supported renewal of the Contract.
Fund Expenses
While mindful that courts have cautioned against giving too much weight to comparative information concerning fees charged by other advisers for managing funds with comparable investment programs, the Board has found the use of such comparisons to be relevant to its deliberations. In this regard, the Board was presented with, and considered, information regarding the contractual advisory fee rates, net advisory fee rates, total expense ratios and each element of the Fund’s total expense ratio (i.e., gross and net advisory fees, administrative fees, custody fees, portfolio accounting fees and transfer agency fees) relative to an appropriate group of peer funds compiled by Federated Hermes from the category of peer funds selected by Morningstar (the “Expense Peer Group”). The Board received a description of the methodology used to select the Expense Peer Group from the overall Morningstar category. The Board also reviewed comparative information regarding the fees and expenses of the broader group of funds in the overall Morningstar category. The Board focused on comparisons with other similar mutual funds more heavily than non-mutual fund products or services because such comparisons are believed to be more relevant. The Board considered that other mutual funds are the products most like the Fund, in that they are readily available to Fund shareholders as alternative investment vehicles, and they are the type of
Annual Shareholder Report
investment vehicle, in fact, chosen and maintained by the Fund’s investors. The Board noted that the range of their fees and expenses, therefore, appears to be a relevant indicator of what consumers have found to be reasonable in the marketplace in which the Fund competes.
The Board reviewed the contractual advisory fee rate, net advisory fee rate and other expenses of the Fund and noted the position of the Fund’s fee rates relative to its Expense Peer Group. In this regard, the Board noted that the contractual advisory fee rate was below the median of the relevant Expense Peer Group and the Board was satisfied that the overall expense structure of the Fund remained competitive.
For comparison, the Board received and considered information about the fees charged by Federated Hermes for providing advisory services to other types of clients with investment strategies similar to those of the Federated Hermes Funds, including non-mutual fund clients such as institutional separate accounts and third-party unaffiliated mutual funds for which the Adviser or its affiliates serve as sub-adviser. The Board noted the CCO’s conclusion that mon-mutual fund clients are inherently different products due to the following differences, among others: (i) different types of targeted investors; (ii) different applicable laws and regulations; (iii) different legal structures; (iv) different average account sizes and portfolio management techniques made necessary by different cash flows and different associated costs; (v) the time spent by portfolio managers and their teams (among other personnel across various departments, including legal, compliance and risk management) in reviewing securities pricing, addressing different administrative responsibilities, and addressing different degrees of risk associated with management; and (vi) a variety of different costs. The Board also considered information regarding the differences in the nature of the services required for Federated Hermes to manage its proprietary mutual fund business versus managing a discrete pool of assets as a sub-adviser to another institution’s mutual fund, noting that Federated Hermes generally performs significant additional services and assumes substantially greater risks in managing the Fund and other Federated Hermes Funds than in its role as sub-adviser to an unaffiliated third-party mutual fund. The Board noted that the CCO did not consider the fees for providing advisory services to other types of clients to be determinative in judging the appropriateness of the Federated Hermes Funds’ advisory fees.
The Board considered the CCO’s view that the services, administrative responsibilities and risks associated with such relationships are quite different than serving as a primary adviser to a fund.
Following such evaluation, and full deliberations, the Board concluded that the fees and expenses of the Fund are reasonable and supported renewal of the Contract.
Annual Shareholder Report
Profitability and Other Benefits
The Board also received financial information about Federated Hermes, including information regarding the compensation and ancillary (or “fall-out”) benefits Federated Hermes derived from its relationships with the Federated Hermes Funds. This information covered not only the fees under the Federated Hermes Funds’ investment advisory contracts, but also fees received by Federated Hermes’ affiliates for providing other services to the Federated Hermes Funds under separate contracts (e.g., for serving as the Federated Hermes Funds’ administrator and distributor). In this regard, the Board considered that certain of Federated Hermes’ affiliates provide distribution and shareholder services to the Federated Hermes Funds, for which they may be compensated through distribution and servicing fees paid pursuant to Rule 12b-1 plans or otherwise. The Board also received and considered information detailing any indirect benefit Federated Hermes may derive from its receipt of research services from brokers who execute portfolio trades for the Federated Hermes Funds. In addition, the Board considered the fact that, in order for the Federated Hermes Fund to be competitive in the marketplace, the Adviser and its affiliates frequently waived fees and/or reimbursed expenses and have disclosed to Federated Hermes Fund shareholders and/or reported to the Board their intention to do so in the future. Moreover, the Board received and considered regular reports from Federated Hermes throughout the year as to the institution, adjustment or elimination of these voluntary waivers and/or reimbursements.
The Board received and considered information furnished by Federated Hermes, as requested by the CCO, that reported revenues on a fund-by-fund basis and made estimates of the allocation of expenses on a fund-by-fund basis, using allocation methodologies specified by the CCO and described to the Board. The Board considered the CCO’s view that, while these cost allocation reports apply consistent allocation processes, the inherent difficulties in allocating costs continues to cause the CCO to question the precision of the process and to conclude that such reports may be unreliable, because a single change in an allocation estimate may dramatically alter the resulting estimate of cost and/or profitability of a Federated Hermes Fund and may produce unintended consequences. The allocation information, including the CCO’s view that fund-by-fund estimations may be unreliable, was considered in the evaluation by the Board. In addition, the Board considered that, during the prior year, an independent consultant conducted a review of the allocation methodologies used by Federated Hermes in estimating profitability for purposes of reporting to the Board in connection with the continuation of the Contract. The Board noted the consultant’s view that, although there is no single best method to allocate expenses, the methodologies used by Federated Hermes are reasonable.
Annual Shareholder Report
The Board also reviewed information compiled by Federated Hermes comparing its profitability information to other publicly held fund management companies, including information regarding profitability trends over time. The Board considered the CCO’s conclusion that, based on such profitability information, Federated Hermes’ profit margins did not appear to be excessive. The Board also considered the CCO’s view that Federated Hermes appeared financially sound, with the resources necessary to fulfill its obligations under its contracts with the Federated Hermes Funds.
In 2019, the Board approved a reduction of 5 basis points in the contractual advisory fee.
Economies of Scale
The Board received and considered information about the notion of possible realization of “economies of scale” as a fund grows larger, the difficulties of calculating economies of scale at an individual fund level, and the extent to which potential scale benefits are shared with shareholders. In this regard, the Board considered that Federated Hermes has made significant and long-term investments in areas that support all of the Federated Hermes Funds, such as personnel and processes for the portfolio management, trading operations, issuer engagement (including with respect to ESG matters), shareholder services, compliance, business continuity, internal audit and risk management functions, as well as systems technology (including technology relating to cybersecurity) and use of data. The Board noted that Federated Hermes’ investments in these areas are extensive and are designed to provide enhanced services to the Federated Hermes Funds and their shareholders. The Board considered that the benefits of these investments (as well as the benefits of any economies of scale, should they exist) are likely to be shared with the Federated Hermes Fund family as a whole. In addition, the Board considered that the Adviser and its affiliates have frequently waived fees and/or reimbursed expenses for the Federated Hermes Funds and that such waivers and reimbursements are another means for potential economies of scale to be shared with shareholders and can provide protection from an increase in expenses if a Federated Hermes Fund’s assets decline. Federated Hermes, as it does throughout the year, and specifically in connection with the Board’s review of the Contract, furnished information relative to adviser-paid fees (commonly referred to as revenue sharing). The Board considered the beliefs of Federated Hermes and the CCO that this information should be viewed to determine if there was an incentive to either not apply breakpoints or to apply breakpoints, at higher levels and should not be viewed to determine the appropriateness of advisory fees. The Board also noted the absence of any applicable regulatory or industry guidelines on this subject, which is compounded by the lack of any common industry practice or general pattern with respect to structuring fund advisory fees with “breakpoints” that serve to reduce the fee as a fund attains a certain size.
Annual Shareholder Report
Conclusions
The Board considered the CCO’s conclusion that his observations and the information accompanying the CCO Fee Evaluation Report show that the management fee for the Fund was reasonable and the CCO’s recommendation that the Board approve the management fee. The Board noted that, under these circumstances, no changes were recommended to, and no objection was raised to the continuation of, the Contract by the CCO. The CCO also recognized that the Board’s evaluation of the Federated Hermes Funds’ advisory and subadvisory arrangements is a continuing and on-going process that is informed by the information that the Board requests and receives from management throughout the course of the year and, in this regard, the CCO noted certain items for future reporting to the Board or further consideration by management as the Board continues its on-going oversight of the Federated Hermes Funds.
In its determination to continue an existing investment advisory contract, the Board was mindful of the potential disruptions of the Fund’s operations and various risks, uncertainties and other effects that could occur as a result of a decision to terminate or not renew an investment advisory contract. In particular, the Board recognized that many shareholders have invested in the Fund on the strength of the Adviser’s industry standing and reputation and with the expectation that the Adviser will have a continuing role in providing advisory services to the Fund. Thus, the Board’s approval of the Contract reflected the fact that it is the shareholders who have effectively selected the Adviser by virtue of having invested in the Fund. The Board concluded that, in light of the factors summarized above, including the nature, quality and scope of the services provided to the Fund by the Adviser and its affiliates, continuation of the Contract was appropriate.
The Board based its determination to approve the Contract on the totality of the circumstances and relevant factors and with a view to past and future long-term considerations. Not all of the factors and considerations identified above were necessarily deemed to be relevant to the Fund, nor did the Board consider any one of them to be determinative. With respect to the factors that were deemed to be relevant, the Board’s determination to approve the continuation of the Contract reflects its view that Federated Hermes’ performance and actions provided a satisfactory basis to support the determination to continue the existing arrangement.
Annual Shareholder Report
Liquidity Risk Management Program– Annual Evaluation of Adequacy and Effectiveness
In accordance with Rule 22e-4 under the Investment Company Act of 1940, as amended (the “Liquidity Rule”), Federated Hermes MDT Series (the “Trust”) has adopted and implemented a liquidity risk management program (the “LRMP”) for Federated Hermes MDT Small Cap Growth Fund (the “Fund” and collectively with the Federated Hermes funds, the “Funds”). The LRMP seeks to assess and manage the Fund’s liquidity risk. “Liquidity risk” is defined under the Liquidity Rule as the risk that the Fund is unable to meet redemption requests without significantly diluting remaining investors’ interests in the Fund. The Board of Trustees of the Trust (the “Board”) has approved the designation of the Funds’ investment advisers as the administrators for the LRMP (collectively, the “Administrator”). The Administrator has established a Liquidity Risk Management Committee (the “Committee”) comprised of representatives from various departments across the Administrator to assist it in the implementation and on-going administration of the LRMP. The Committee, in turn, has delegated to the Fixed Income and Equities Liquidity Committees, each a separate committee previously established by the Administrator, the responsibility to review and assess certain information related to the liquidity of the Funds that fall within their respective asset classes.
The Program is comprised of various components designed to support the assessment and/or management of liquidity risk, including: (1) the periodic assessment (no less frequently than annually) of certain factors that influence the Fund’s liquidity risk; (2) the periodic classification (no less frequently than monthly) of the Fund’s investments into one of four liquidity categories that reflect an estimate of their liquidity under current market conditions; (3) a 15% limit on the acquisition of “illiquid investments” (as defined under the Liquidity Rule); (4) to the extent a Fund does not invest primarily in “highly liquid investments” (as defined under the Liquidity Rule), the determination of a minimum percentage of the Fund’s assets that generally will be invested in highly liquid investments (an “HLIM”); (5) if a Fund has established an HLIM, the periodic review (no less frequently than annually) of the HLIM and the adoption of policies and procedures for responding to a shortfall of the Fund’s highly liquid investments below its HLIM; and (6) periodic reporting to the Board.
At its meetings in May 2020, the Board received and reviewed a written report from the Funds’ Chief Compliance Officer and Chief Risk Officer, on behalf of the Administrator, concerning the operation of the LRMP for the period from the LRMP’s inception on December 1, 2018 through March 31, 2020 (the “Period”). The Report addressed the operation of the LRMP and assessed its adequacy and effectiveness, including, where applicable, the operation of any HLIM established for a Fund. There were no
Annual Shareholder Report
material changes to the LRMP during the Period. The Report summarized the operation of the Program and the information and factors considered by the Administrator in assessing whether the Program has been adequately and effectively implemented with respect to the Funds. Such information and factors included, among other things:
| ■ | the liquidity risk framework used to assess, manage, and periodically review each Fund’s liquidity risk and the results of this assessment, including a review of the Funds’ access to other available funding sources such as the Funds’ interfund lending facility, redemptions in-kind and committed lines of credit and confirmation that the Fund did not have to access any of these alternative funding sources during the Period; |
| ■ | the periodic classifications of the Fund’s investments into one of four liquidity categories and the methodologies and inputs used to classify the investments, including the Fund’s reasonably anticipated trade size; |
| ■ | the analysis received from a third-party liquidity assessment vendor that is taken into account in the process of determining the liquidity classifications of the Fund’s investments and the results of an evaluation of the services performed by the vendor in support of this process; |
| ■ | the fact that the Fund invested primarily in highly liquid investments during the Period and, therefore, was not required to establish, and has not established, an HLIM and the procedures for monitoring the status of the Fund as investing primarily in highly liquid investments; |
| ■ | the fact that the Fund invested no more than 15% of its assets in illiquid investments during the Period and the procedures for monitoring this limit; and |
| ■ | liquidity events during the Period, including the impact on liquidity caused by extended non-U.S. market closures and the market disruptions resulting from the novel coronavirus outbreak, and the fact that there were no specific liquidity events during the Period that materially affected the Fund’s liquidity risk. |
Based on this review, the Administrator concluded that the LRMP is operating effectively to assess and manage the Fund’s liquidity risk, and that the Program has been and continues to be adequately and effectively implemented to monitor and, as applicable, respond to the Fund’s liquidity developments.
Annual Shareholder Report
Voting Proxies on Fund Portfolio Securities
A description of the policies and procedures that the Fund uses to determine how to vote proxies, if any, relating to securities held in the Fund’s portfolio is available, without charge and upon request, by calling 1-800-341-7400. A report on “Form N-PX” of how the Fund voted any such proxies during the most recent 12-month period ended June 30 is available via the Proxy Voting Record (Form N-PX) link associated with the Fund and share class name at FederatedInvestors.com/FundInformation. Form N-PX filings are also available at the SEC’s website at sec.gov.
Quarterly Portfolio Schedule
Each fiscal quarter, the Fund will file with the SEC a complete schedule of its monthly portfolio holdings on “Form N-PORT.” The Fund’s holdings as of the end of the third month of every fiscal quarter, as reported on Form N-PORT, will be publicly available on the SEC’s website at sec.gov within 60 days of the end of the fiscal quarter upon filing. You may also access this information via the link to the Fund and share class name at FederatedInvestors.com.
Annual Shareholder Report
Mutual funds are not bank deposits or obligations, are not guaranteed by any bank and are not insured or guaranteed by the U.S. government, the Federal Deposit Insurance Corporation, the Federal Reserve Board or any other government agency. Investment in mutual funds involves investment risk, including the possible loss of principal.
This Report is authorized for distribution to prospective investors only when preceded or accompanied by the Fund’s Prospectus, which contains facts concerning its objective and policies, management fees, expenses and other information.
Federated Hermes MDT Small Cap Growth Fund
Federated Hermes Funds
4000 Ericsson Drive
Warrendale, PA 15086-7561
Contact us at FederatedInvestors.com
or call 1-800-341-7400.
Federated Securities Corp., Distributor
CUSIP 31421R775
CUSIP 31421R767
CUSIP 31421R759
CUSIP 31421R619
37313 (9/20)
© 2020 Federated Hermes, Inc.
(a) As of the end of the period covered by this report, the registrant has adopted a code of ethics (the "Section 406 Standards for Investment Companies - Ethical Standards for Principal Executive and Financial Officers") that applies to the registrant's Principal Executive Officer and Principal Financial Officer; the registrant's Principal Financial Officer also serves as the Principal Accounting Officer.
(c) There was no amendment to the registrant’s code of ethics described in Item 2(a) above during the period covered by the report.
(d) There was no waiver granted, either actual or implicit, from a provision to the registrant’s code of ethics described in Item 2(a) above during the period covered by the report.
(e) Not Applicable
(f)(3) The registrant hereby undertakes to provide any person, without charge, upon request, a copy of the code of ethics. To request a copy of the code of ethics, contact the registrant at 1-800-341-7400, and ask for a copy of the Section 406 Standards for Investment Companies - Ethical Standards for Principal Executive and Financial Officers.
Item 3. Audit Committee Financial Expert
The registrant's Board has determined that each of the following members of the Board's Audit Committee is an “audit committee financial expert,” and is "independent," for purposes of this Item: John T. Collins, G. Thomas Hough and Thomas M. O'Neill.
| Item 4. | Principal Accountant Fees and Services |
(a) Audit Fees billed to the registrant for the two most recent fiscal years:
Fiscal year ended 2020 – $146,200
Fiscal year ended 2019 - $142,400
(b) Audit-Related Fees billed to the registrant for the two most recent fiscal years:
Fiscal year ended 2020 - $0
Fiscal year ended 2019 - $0
Amount requiring approval of the registrant’s audit committee pursuant to paragraph (c)(7)(ii) of Rule 2-01 of Regulation S-X, $11,145 and $0 respectively. Fiscal year ended 2020- Audit consent fees for N-14 merger document.
(c) Tax Fees billed to the registrant for the two most recent fiscal years:
Fiscal year ended 2020 - $0
Fiscal year ended 2019 - $0
Amount requiring approval of the registrant’s audit committee pursuant to paragraph (c)(7)(ii) of Rule 2-01 of Regulation S-X, $0 and $0 respectively.
(d) All Other Fees billed to the registrant for the two most recent fiscal years:
Fiscal year ended 2020 - $0
Fiscal year ended 2019 - $0
Amount requiring approval of the registrant’s audit committee pursuant to paragraph (c)(7)(ii) of Rule 2-01 of Regulation S-X, $42,456 and $27,403 respectively. Fiscal year ended 2020- Service fee for analysis of potential Passive Foreign Investment Company holdings. Fiscal year ended 2019- Service fee for analysis of potential Passive Foreign Investment Company holdings.
(e)(1) Audit Committee Policies regarding Pre-approval of Services.
The Audit Committee is required to pre-approve audit and non-audit services performed by the independent auditor in order to assure that the provision of such services do not impair the auditor’s independence. Unless a type of service to be provided by the independent auditor has received general pre-approval, it will require specific pre-approval by the Audit Committee. Any proposed services exceeding pre-approved cost levels will require specific pre-approval by the Audit Committee.
Certain services have the general pre-approval of the Audit Committee. The term of the general pre-approval is 12 months from the date of pre-approval, unless the Audit Committee specifically provides for a different period. The Audit Committee will annually review the services that may be provided by the independent auditor without obtaining specific pre-approval from the Audit Committee and may grant general pre-approval for such services. The Audit Committee will revise the list of general pre-approved services from time to time, based on subsequent determinations. The Audit Committee will not delegate to management its responsibilities to pre-approve services performed by the independent auditor.
The Audit Committee has delegated pre-approval authority to its Chairman for services that do not exceed a specified dollar threshold. The Chairman or Chief Audit Executive will report any such pre-approval decisions to the Audit Committee at its next scheduled meeting. The Committee will designate another member with such pre-approval authority when the Chairman is unavailable.
AUDIT SERVICES
The annual Audit services engagement terms and fees will be subject to the specific pre-approval of the Audit Committee. The Audit Committee will approve, if necessary, any changes in terms, conditions and fees resulting from changes in audit scope, registered investment company (RIC) structure or other matters.
In addition to the annual Audit services engagement specifically approved by the Audit Committee, the Audit Committee may grant general pre-approval for other Audit services, which are those services that only the independent auditor reasonably can provide. The Audit Committee has pre-approved certain Audit services; with limited exception, all other audit services must be specifically pre-approved by the Audit Committee.
AUDIT-RELATED SERVICES
Audit-related services are assurance and related services that are reasonably related to the performance of the audit or review of the RIC’s financial statements or that are traditionally performed by the independent auditor. The Audit Committee believes that the provision of Audit-related services does not impair the independence of the auditor, and has pre-approved certain audit-related services; all other audit-related services must be specifically pre-approved by the Audit Committee.
TAX SERVICES
The Audit Committee believes that the independent auditor can provide Tax services to the RIC such as tax compliance, tax planning and tax advice without impairing the auditor’s independence. However, the Audit Committee will not permit the retention of the independent auditor in connection with a transaction initially recommended by the independent auditor, the purpose of which may be tax avoidance and the tax treatment of which may not be supported in the Internal Revenue Code and related regulations. The Audit Committee has pre-approved certain Tax services; with limited exception, all tax services involving large and complex transactions must be specifically pre-approved by the Audit Committee.
ALL OTHER SERVICES
With respect to the provision of permissible services other than audit, review or attest services the pre-approval requirement is waived if:
| (1) | With respect to such services rendered to the Funds, the aggregate amount of all such services provided constitutes no more than five percent of the total amount of revenues paid by the audit client to its accountant during the fiscal year in which the services are provided; and, |
| (2) | With respect to such services rendered to the Fund’s investment adviser and any entity controlling, controlled by to under common control with the investment adviser such as affiliated non-U.S. and U.S. funds not under the Audit Committee’s purview and which do not fall within a category of service which has been determined by the Audit Committee not to have a direct impact on the operations or financial reporting of the RIC, the aggregate amount of all services provided constitutes no more than five percent of the total amount of revenues paid to the RIC’s auditor by the RIC, its investment adviser and any entity controlling, controlled by, or under common control with the investment adviser during the fiscal year in which the services are provided; and |
| (3) | Such services were not recognized by the issuer or RIC at the time of the engagement to be non-audit services; and |
| (4) | Such services are promptly brought to the attention of the Audit Committee and approved prior to the completion of the audit by the Audit Committee or by one or more members of the Audit Committee who are members of the Board of Directors to whom authority to grant such approvals has been delegated by the Audit Committee. |
The Audit Committee may grant general pre-approval to those permissible non-audit services which qualify for pre-approval and which it believes are routine and recurring services, and would not impair the independence of the auditor.
The SEC’s rules and relevant guidance should be consulted to determine the precise definitions of these services and applicability of exceptions to certain of the prohibitions.
PRE-APPROVAL FEE LEVELS
Pre-approval fee levels for all services to be provided by the independent auditor will be established annually by the Audit Committee. Any proposed services exceeding these levels will require specific pre-approval by the Audit Committee.
PROCEDURES
Requests or applications to provide services that require specific approval by the Audit Committee will be submitted to the Audit Committee by the Fund’s Principal Accounting Officer and/or the Chief Audit Executive of Federated Hermes, Inc., only after those individuals have determined that the request or application is consistent with the SEC’s rules on auditor independence.
(e)(2) Percentage of services identified in items 4(b) through 4(d) that were approved by the registrants audit committee pursuant to paragraph (c)(7)(i)(C) of Rule 2-01 of Regulation S-X:
4(b)
Fiscal year ended 2020 – 0%
Fiscal year ended 2019 - 0%
Percentage of services provided to the registrants investment adviser and any entity controlling, controlled by, or under common control with the investment adviser that provides ongoing services to the registrant that were approved by the registrants audit committee pursuant to paragraph (c)(7)(i)(C) of Rule 2-01 of Regulation S-X, 0% and 0% respectively.
4(c)
Fiscal year ended 2020 – 0%
Fiscal year ended 2019 – 0%
Percentage of services provided to the registrants investment adviser and any entity controlling, controlled by, or under common control with the investment adviser that provides ongoing services to the registrant that were approved by the registrants audit committee pursuant to paragraph (c)(7)(i)(C) of Rule 2-01 of Regulation S-X, 0% and 0% respectively.
4(d)
Fiscal year ended 2020 – 0%
Fiscal year ended 2019 – 0%
Percentage of services provided to the registrants investment adviser and any entity controlling, controlled by, or under common control with the investment adviser that provides ongoing services to the registrant that were approved by the registrants audit committee pursuant to paragraph (c)(7)(i)(C) of Rule 2-01 of Regulation S-X, 0% and 0% respectively.
| (g) | Non-Audit Fees billed to the registrant, the registrant’s investment adviser, and certain entities controlling, controlled by or under common control with the investment adviser: |
Fiscal year ended 2020 - $150,395
Fiscal year ended 2019 - $624,400
| (h) | The registrant’s Audit Committee has considered that the provision of non-audit services that were rendered to the registrant’s adviser (not including any sub-adviser whose role is primarily portfolio management and is subcontracted with or overseen by another investment adviser), and any entity controlling, controlled by, or under common control with the investment adviser that provides ongoing services to the registrant that were not pre-approved pursuant to paragraph (c)(7)(ii) of Rule 2-01 of Regulation S-X is compatible with maintaining the principal accountant’s independence. |
The registrant’s management and Audit Committee continue to believe that the registrant’s registered public accounting firm, Ernst & Young LLP (“EY”), has the ability to exercise objective and impartial judgment on all issues encompassed within their audit services. EY is required to make a determination that it satisfies certain independence requirements under the federal securities laws. Like other registrants, there is a risk that activities or relationships of EY, or its partners or employees, can prevent a determination from being made that it satisfies such independence requirements with respect to the registrant, which could render it ineligible to serve as the registrant’s independent public accountant.
In its required communications to the Audit Committee of the registrant’s Board, EY informed the Audit Committee that EY and/or covered person professionals within EY maintain lending relationships with certain owners of greater than 10% of the shares of certain investment companies within the “investment company complex” as defined under Rule 2-01(f)(14) of Regulation S-X, which are affiliates of the registrant. EY has advised the Audit Committee that these lending relationships implicate Rule 2-01(c)(1)(ii)(A) of Regulation S-X (referred to as the “Loan Rule”). The Loan Rule prohibits an independent public accountant, or covered person professionals at such firm, from having a financial relationship (such as a loan) with a lender that is a record or beneficial owner of more than 10% of an audit client’s equity securities. For purposes of the Loan Rule, audit clients include the registrant, as well as all registered investment companies advised by advisory subsidiaries of Federated Hermes, Inc., the Adviser (for which EY serves as independent public accountant), and their respective affiliates (collectively, the “Federated Hermes Fund Complex”).
EY informed the Audit Committee that EY believes that these lending relationships described above do not and will not impair EY’s ability to exercise objective and impartial judgment in connection with financial statement audits of their respective funds of the registrant and a reasonable investor with knowledge of all relevant facts and circumstances would conclude that EY has been and is capable of objective and impartial judgment on all issues encompassed within EY’s audits.
On June 20, 2016, the Division of Investment Management of the Securities and Exchange Commission (“SEC”) issued a no-action letter to another mutual fund complex (see Fidelity Management & Research Company et al., No-Action Letter) related to similar Loan Rule matters as those described above (the “Letter”). In the Letter, the SEC Staff confirmed that it would not recommend enforcement action against an investment company that relied on the audit services performed by an independent public accountant where the Loan Rule was implicated in certain specified circumstances provided that: (1) the auditor has complied with PCAOB Rule 3526(b)(1) and 3526(b)(2); (2) the Loan Rule is implicated because of lending relationships; and (3) notwithstanding such lending relationships that implicate the Loan Rule, the auditor has concluded that it is objective and impartial with respect to the issues encompassed within its engagement as auditor of the funds. The circumstances described in the Letter are substantially similar to the circumstances that implicated the Loan Rule with respect to EY and the registrant. On September 22, 2017, the SEC extended the expiration of the Letter until the effectiveness of any amendments to the Loan Rule designed to address the concerns in the Letter. On June 18, 2019, the SEC adopted amendments (effective October 3, 2019) to the Loan Rule, which, refocus the analysis that must be conducted to determine whether an auditor is independent when the auditor has a lending relationship with certain shareholders of an audit client at any time during an audit or professional engagement period.
If it were to be determined that, with respect to the Loan Rule, the relief available under the Letter was improperly relied upon, or that the independence requirements under the federal securities laws were not complied with regarding the registrant, for certain periods, and/or given the implication of the Investment Rule for certain periods, any of the registrant’s filings with the SEC which contain financial statements of the registrant for such periods may be determined not to be consistent with or comply with applicable federal securities laws, the registrant’s ability to offer shares under its current registration statement may be impacted, and certain financial reporting and/or other covenants with, and representations and warranties to, the registrant’s lender under its committed line of credit may be impacted. Such events could have a material adverse effect on the registrant and the Federated Hermes Fund Complex.
| Item 5. | Audit Committee of Listed Registrants |
Not Applicable
| Item 6. | Schedule of Investments |
(a) The registrant’s Schedule of Investments is included as part of the Report to Stockholders filed under Item 1 of this form.
(b) Not Applicable; Fund had no divestments during the reporting period covered since the previous Form N-CSR filing.
| Item 7. | Disclosure of Proxy Voting Policies and Procedures for Closed-End Management Investment Companies |
Not Applicable
| Item 8. | Portfolio Managers of Closed-End Management Investment Companies |
Not Applicable
| Item 9. | Purchases of Equity Securities by Closed-End Management Investment Company and Affiliated Purchasers |
Not Applicable
| Item 10. | Submission of Matters to a Vote of Security Holders |
No Changes to Report
| Item 11. | Controls and Procedures |
(a) The registrant’s President and Treasurer have concluded that the
registrant’s disclosure controls and procedures (as defined in rule 30a-3(c) under the Act) are effective in design and operation and are sufficient to form the basis of the certifications required by Rule 30a-(2) under the Act, based on their evaluation of these disclosure controls and procedures within 90 days of the filing date of this report on Form N-CSR.
(b) There were no changes in the registrant’s internal control over financial reporting (as defined in rule 30a-3(d) under the Act) during the registrant’s most recent fiscal half-year (the registrant’s second fiscal half-year in the case of an annual report) that have materially affected, or are reasonably likely to materially affect, the registrant’s internal control over financial reporting.
| Item 12. | Disclosure of Securities Lending Activities for Closed-End Management Investment Companies |
Not Applicable
(a)(1) Code of Ethics- Not Applicable to this Report.
(a)(2) Certifications of Principal Executive Officer and Principal Financial Officer.
(a)(3) Not Applicable.
(b) Certifications pursuant to 18 U.S.C. Section 1350.
SIGNATURES
Pursuant to the requirements of the Securities Exchange Act of 1934 and the Investment Company Act of 1940, the registrant has duly caused this report to be signed on its behalf by the undersigned, thereunto duly authorized.
Registrant Federated Hermes MDT Series
By /S/ Lori A. Hensler
Lori A. Hensler, Principal Financial Officer
Date September 22, 2020
Pursuant to the requirements of the Securities Exchange Act of 1934 and the Investment Company Act of 1940, this report has been signed below by the following persons on behalf of the registrant and in the capacities and on the dates indicated.
By /S/ J. Christopher Donahue
J. Christopher Donahue, Principal Executive Officer
Date September 22, 2020
By /S/ Lori A. Hensler
Lori A. Hensler, Principal Financial Officer
Date September 22, 2020