UNITED STATES
SECURITIES AND EXCHANGE COMMISSION
Washington, D.C. 20549
FORM N-CSR
CERTIFIED SHAREHOLDER REPORT OF REGISTERED
MANAGEMENT INVESTMENT COMPANIES
Investment Company Act file number 811-21991
Fidelity Rutland Square Trust II
(Exact name of registrant as specified in charter)
245 Summer St., Boston, Massachusetts 02210
(Address of principal executive offices) (Zip code)
Christina H. Lee, Secretary
245 Summer St.
Boston, Massachusetts 02210
(Name and address of agent for service)
Registrant's telephone number, including area code:
617-563-7000
Date of fiscal year end: | February 28 |
Date of reporting period: | February 28, 2023 |
Item 1.
Reports to Stockholders


Contents
| Average Annual Total Returns | |||
Periods ended February 28, 2023 | Past 1 year | Past 5 years | Past 10 years |
| Strategic Advisers® Income Opportunities Fund | -5.25% | 2.54% | 3.69% |
| $10,000 Over 10 Years |
Let's say hypothetically that $10,000 was invested in Strategic Advisers® Income Opportunities Fund on February 28, 2013. The chart shows how the value of your investment would have changed, and also shows how the ICE® BofA® US High Yield Constrained Index performed over the same period. |
 |
Top Holdings (% of Fund's net assets) | ||
| (excluding cash equivalents) | ||
| Artisan High Income Fund Investor Shares | 13.4 | |
| Fidelity Capital & Income Fund | 9.4 | |
| MainStay High Yield Corporate Bond Fund Class A | 8.1 | |
| BlackRock High Yield Bond Portfolio Class K | 7.7 | |
| Eaton Vance Income Fund of Boston Class A | 7.6 | |
| Vanguard High-Yield Corporate Fund Admiral Shares | 5.4 | |
| U.S. Treasury Obligations | 1.5 | |
| CCO Holdings LLC/CCO Holdings Capital Corp. | 0.9 | |
| Tenet Healthcare Corp. | 0.7 | |
| Occidental Petroleum Corp. | 0.6 | |
Asset Allocation (% of Fund's net assets) |
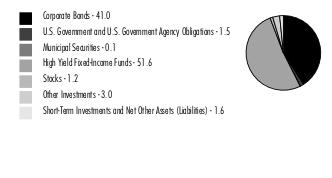 |
| Corporate Bonds - 41.0% | |||
Principal Amount (a) | Value ($) | ||
| Convertible Bonds - 0.6% | |||
| COMMUNICATION SERVICES - 0.2% | |||
| Media - 0.2% | |||
| DISH Network Corp.: | |||
| 2.375% 3/15/24 | 1,902,000 | 1,746,958 | |
| 3.375% 8/15/26 | 2,415,000 | 1,543,378 | |
| 3,290,336 | |||
| ENERGY - 0.4% | |||
| Oil, Gas & Consumable Fuels - 0.4% | |||
| Mesquite Energy, Inc. 15% 7/15/23 (b)(c) | 368,047 | 2,253,478 | |
| Mesquite Energy, Inc. 15% 7/15/23 (b)(c) | 635,565 | 3,891,437 | |
| 6,144,915 | |||
| TOTAL CONVERTIBLE BONDS | 9,435,251 | ||
| Nonconvertible Bonds - 40.4% | |||
| COMMUNICATION SERVICES - 6.0% | |||
| Diversified Telecommunication Services - 1.2% | |||
| Altice France SA: | |||
| 5.125% 1/15/29(d) | 992,000 | 761,512 | |
| 5.125% 7/15/29(d) | 575,000 | 443,682 | |
| 5.5% 1/15/28(d) | 440,000 | 362,415 | |
| 5.5% 10/15/29(d) | 1,380,000 | 1,075,971 | |
| 8.125% 2/1/27(d) | 1,200,000 | 1,120,272 | |
| C&W Senior Financing Designated Activity Co. 6.875% 9/15/27 (d) | 1,890,000 | 1,702,890 | |
| Cablevision Lightpath LLC: | |||
| 3.875% 9/15/27(d) | 1,027,000 | 837,170 | |
| 5.625% 9/15/28(d) | 300,000 | 223,500 | |
| Connect Finco SARL / Connect U.S. Finco LLC 6.75% 10/1/26 (d) | 1,100,000 | 1,017,551 | |
| Consolidated Communications, Inc. 5% 10/1/28 (d) | 570,000 | 379,101 | |
| Embarq Corp. 7.995% 6/1/36 | 795,000 | 342,172 | |
| Frontier Communications Holdings LLC: | |||
| 5% 5/1/28(d) | 315,000 | 276,413 | |
| 5.875% 10/15/27(d) | 364,000 | 338,192 | |
| 5.875% 11/1/29 | 315,000 | 252,233 | |
| 8.75% 5/15/30(d) | 420,000 | 424,725 | |
| Holdco SASU 6.5% 10/15/26 (d) | 2,040,000 | 1,906,591 | |
| Level 3 Financing, Inc.: | |||
| 3.4% 3/1/27(d) | 700,000 | 587,535 | |
| 3.625% 1/15/29(d) | 807,000 | 517,836 | |
| 3.75% 7/15/29(d) | 795,000 | 499,745 | |
| 4.25% 7/1/28(d) | 805,000 | 549,413 | |
| 4.625% 9/15/27(d) | 350,000 | 261,625 | |
| Lumen Technologies, Inc. 4.5% 1/15/29 (d) | 690,000 | 364,665 | |
| Sprint Capital Corp.: | |||
| 6.875% 11/15/28 | 840,000 | 880,740 | |
| 8.75% 3/15/32 | 1,335,000 | 1,589,304 | |
| Telecom Italia Capital SA: | |||
| 6% 9/30/34 | 242,000 | 202,191 | |
| 7.2% 7/18/36 | 253,000 | 222,230 | |
| 7.721% 6/4/38 | 200,000 | 182,000 | |
| Telenet Finance Luxembourg Notes SARL 5.5% 3/1/28 (d) | 200,000 | 186,610 | |
| Windstream Escrow LLC 7.75% 8/15/28 (d) | 1,285,000 | 1,050,102 | |
| Zayo Group Holdings, Inc.: | |||
| 4% 3/1/27(d) | 780,000 | 598,358 | |
| 6.125% 3/1/28(d) | 933,000 | 587,734 | |
| 19,744,478 | |||
| Entertainment - 0.2% | |||
| AMC Entertainment Holdings, Inc. 10% 6/15/26 pay-in-kind (d)(e) | 377,120 | 194,337 | |
| Cinemark U.S.A., Inc. 5.25% 7/15/28 (d) | 1,450,000 | 1,218,363 | |
| Live Nation Entertainment, Inc. 4.75% 10/15/27 (d) | 665,000 | 598,866 | |
| Netflix, Inc. 6.375% 5/15/29 | 395,000 | 410,472 | |
| Playtika Holding Corp. 4.25% 3/15/29 (d) | 605,000 | 490,050 | |
| Roblox Corp. 3.875% 5/1/30 (d) | 1,055,000 | 867,326 | |
| 3,779,414 | |||
| Interactive Media & Services - 0.0% | |||
| ZipRecruiter, Inc. 5% 1/15/30 (d) | 310,000 | 260,400 | |
| Media - 4.0% | |||
| Advantage Sales & Marketing, Inc. 6.5% 11/15/28 (d) | 849,000 | 648,729 | |
| Altice Financing SA: | |||
| 5% 1/15/28(d) | 1,315,000 | 1,091,292 | |
| 5.75% 8/15/29(d) | 2,485,000 | 2,032,258 | |
| Altice France Holding SA: | |||
| 6% 2/15/28(d) | 3,370,000 | 2,316,875 | |
| 10.5% 5/15/27(d) | 965,000 | 797,022 | |
| AMC Networks, Inc. 5% 4/1/24 | 125,000 | 124,844 | |
| CCO Holdings LLC/CCO Holdings Capital Corp.: | |||
| 4.25% 2/1/31(d) | 2,225,000 | 1,786,008 | |
| 4.25% 1/15/34(d) | 375,000 | 280,707 | |
| 4.5% 8/15/30(d) | 1,993,000 | 1,639,282 | |
| 4.5% 5/1/32 | 4,850,000 | 3,838,533 | |
| 4.5% 6/1/33(d) | 2,150,000 | 1,672,705 | |
| 4.75% 3/1/30(d) | 732,000 | 615,590 | |
| 4.75% 2/1/32(d) | 550,000 | 445,500 | |
| 5% 2/1/28(d) | 1,000,000 | 906,250 | |
| 6.375% 9/1/29(d) | 3,090,000 | 2,880,915 | |
| 7.375% 3/1/31(d) | 1,530,000 | 1,484,261 | |
| Clear Channel Outdoor Holdings, Inc.: | |||
| 7.5% 6/1/29(d) | 510,000 | 413,100 | |
| 7.75% 4/15/28(d) | 995,000 | 825,722 | |
| CSC Holdings LLC: | |||
| 4.125% 12/1/30(d) | 1,152,000 | 832,527 | |
| 4.5% 11/15/31(d) | 100,000 | 70,998 | |
| 4.625% 12/1/30(d) | 3,057,000 | 1,645,812 | |
| 5.375% 2/1/28(d) | 931,000 | 776,547 | |
| 5.75% 1/15/30(d) | 4,090,000 | 2,342,466 | |
| 6.5% 2/1/29(d) | 1,530,000 | 1,296,828 | |
| 7.5% 4/1/28(d) | 1,395,000 | 934,245 | |
| Diamond Sports Group LLC/Diamond Sports Finance Co.: | |||
| 5.375% 8/15/26(d) | 6,605,000 | 741,081 | |
| 6.625% 8/15/27(d) | 13,785,000 | 361,856 | |
| DIRECTV Financing LLC / DIRECTV Financing Co-Obligor, Inc. 5.875% 8/15/27 (d) | 770,000 | 688,394 | |
| DISH DBS Corp.: | |||
| 5% 3/15/23 | 350,000 | 349,125 | |
| 5.125% 6/1/29 | 3,310,000 | 1,955,829 | |
| 5.25% 12/1/26(d) | 500,000 | 418,750 | |
| 5.75% 12/1/28(d) | 1,110,000 | 886,668 | |
| 7.375% 7/1/28 | 1,420,000 | 971,401 | |
| 7.75% 7/1/26 | 2,219,000 | 1,722,499 | |
| DISH Network Corp. 11.75% 11/15/27 (d) | 2,129,000 | 2,157,156 | |
| Dolya Holdco 18 DAC 5% 7/15/28 (d) | 347,000 | 301,199 | |
| Gray Escrow II, Inc. 5.375% 11/15/31 (d) | 1,060,000 | 787,000 | |
| Gray Television, Inc. 7% 5/15/27 (d) | 700,000 | 633,938 | |
| iHeartCommunications, Inc.: | |||
| 6.375% 5/1/26 | 465,000 | 438,253 | |
| 8.375% 5/1/27 | 4,155,000 | 3,656,400 | |
| Lamar Media Corp. 4.875% 1/15/29 | 897,000 | 828,068 | |
| LCPR Senior Secured Financing DAC: | |||
| 5.125% 7/15/29(d) | 185,000 | 155,530 | |
| 6.75% 10/15/27(d) | 310,000 | 287,457 | |
| Midas Opco Holdings LLC 5.625% 8/15/29 (d) | 1,645,000 | 1,414,716 | |
| News Corp.: | |||
| 3.875% 5/15/29(d) | 375,000 | 321,356 | |
| 5.125% 2/15/32(d) | 505,000 | 448,166 | |
| Nexstar Broadcasting, Inc.: | |||
| 4.75% 11/1/28(d) | 80,000 | 69,942 | |
| 5.625% 7/15/27(d) | 595,000 | 552,596 | |
| Radiate Holdco LLC/Radiate Financial Service Ltd.: | |||
| 4.5% 9/15/26(d) | 1,197,000 | 893,202 | |
| 6.5% 9/15/28(d) | 3,290,000 | 1,547,380 | |
| Scripps Escrow, Inc. 5.875% 7/15/27 (d) | 995,000 | 796,718 | |
| Sirius XM Radio, Inc.: | |||
| 4% 7/15/28(d) | 2,385,000 | 2,039,175 | |
| 4.125% 7/1/30(d) | 2,235,000 | 1,816,451 | |
| 5.5% 7/1/29(d) | 495,000 | 446,738 | |
| TEGNA, Inc. 5% 9/15/29 | 380,000 | 337,136 | |
| Townsquare Media, Inc. 6.875% 2/1/26 (d) | 870,000 | 797,157 | |
| Univision Communications, Inc.: | |||
| 4.5% 5/1/29(d) | 395,000 | 333,158 | |
| 5.125% 2/15/25(d) | 1,400,000 | 1,363,040 | |
| 6.625% 6/1/27(d) | 1,955,000 | 1,856,038 | |
| 7.375% 6/30/30(d) | 740,000 | 701,818 | |
| Virgin Media Secured Finance PLC 4.5% 8/15/30 (d) | 150,000 | 124,157 | |
| VZ Secured Financing BV 5% 1/15/32 (d) | 1,190,000 | 978,903 | |
| Ziggo BV 4.875% 1/15/30 (d) | 170,000 | 143,763 | |
| 66,021,230 | |||
| Wireless Telecommunication Services - 0.6% | |||
| Digicel Group Ltd. 6.75% 3/1/23 (d) | 7,925,000 | 3,089,759 | |
| Digicel International Finance Ltd. / Digicel International Holdings Ltd. 8% 12/31/26 (d) | 1,250,000 | 548,672 | |
| Intelsat Jackson Holdings SA: | |||
| 5.5% 8/1/23(c)(f) | 3,685,000 | 0 | |
| 6.5% 3/15/30(d) | 3,335,000 | 2,901,427 | |
| 8.5% 10/15/24(c)(d)(f) | 7,200,000 | 1 | |
| 9.75% 7/15/25(c)(d)(f) | 50,000 | 0 | |
| Millicom International Cellular SA: | |||
| 4.5% 4/27/31(d) | 235,000 | 189,763 | |
| 5.125% 1/15/28(d) | 36,000 | 31,653 | |
| Sprint Corp.: | |||
| 7.125% 6/15/24 | 785,000 | 794,891 | |
| 7.625% 2/15/25 | 295,000 | 302,170 | |
| 7.625% 3/1/26 | 590,000 | 612,716 | |
| 7.875% 9/15/23 | 195,000 | 196,821 | |
| T-Mobile U.S.A., Inc. 3.5% 4/15/31 | 490,000 | 424,187 | |
| Telesat Canada/Telesat LLC 6.5% 10/15/27 (d) | 865,000 | 259,048 | |
| 9,351,108 | |||
TOTAL COMMUNICATION SERVICES | 99,156,630 | ||
| CONSUMER DISCRETIONARY - 7.3% | |||
| Auto Components - 0.7% | |||
| Adient Global Holdings Ltd.: | |||
| 0% 4/15/28(d)(g) | 255,000 | 255,638 | |
| 4.875% 8/15/26(d) | 800,000 | 742,368 | |
| 8.25% 4/15/31(d)(g) | 430,000 | 430,000 | |
| Albion Financing 1 SARL 6.125% 10/15/26 (d) | 605,000 | 541,003 | |
| Albion Financing 2 SARL 8.75% 4/15/27 (d) | 370,000 | 319,125 | |
| Allison Transmission, Inc. 3.75% 1/30/31 (d) | 95,000 | 78,850 | |
| American Axle & Manufacturing, Inc. 6.25% 3/15/26 | 225,000 | 213,367 | |
| Dana, Inc.: | |||
| 4.25% 9/1/30 | 1,355,000 | 1,094,528 | |
| 5.375% 11/15/27 | 50,000 | 46,136 | |
| 5.625% 6/15/28 | 1,565,000 | 1,416,325 | |
| Dornoch Debt Merger Sub, Inc. 6.625% 10/15/29 (d) | 580,000 | 437,900 | |
| Gates Global LLC/Gates Global Co. 6.25% 1/15/26 (d) | 480,000 | 469,003 | |
| IHO Verwaltungs GmbH 4.75% 9/15/26 pay-in-kind (d)(h) | 40,000 | 36,887 | |
| Nesco Holdings II, Inc. 5.5% 4/15/29 (d) | 346,000 | 308,373 | |
| Panther BF Aggregator 2 LP / Panther Finance Co., Inc. 8.5% 5/15/27 (d) | 1,865,000 | 1,854,345 | |
| Patrick Industries, Inc.: | |||
| 4.75% 5/1/29(d) | 575,000 | 488,813 | |
| 7.5% 10/15/27(d) | 175,000 | 172,517 | |
| The Goodyear Tire & Rubber Co.: | |||
| 5% 7/15/29 | 15,000 | 13,050 | |
| 5.25% 4/30/31 | 1,150,000 | 986,125 | |
| 5.25% 7/15/31 | 1,620,000 | 1,379,025 | |
| 5.625% 4/30/33 | 270,000 | 229,351 | |
| ZF North America Capital, Inc. 4.75% 4/29/25 (d) | 235,000 | 224,486 | |
| 11,737,215 | |||
| Automobiles - 0.7% | |||
| Ford Motor Co.: | |||
| 3.25% 2/12/32 | 195,000 | 147,379 | |
| 4.75% 1/15/43 | 3,708,000 | 2,705,677 | |
| 5.291% 12/8/46 | 435,000 | 340,388 | |
| 6.1% 8/19/32 | 3,625,000 | 3,375,987 | |
| 7.4% 11/1/46 | 75,000 | 74,698 | |
| 9.625% 4/22/30 | 700,000 | 805,167 | |
| PM General Purchaser LLC 9.5% 10/1/28 (d) | 880,000 | 803,739 | |
| Rivian Holdco & Rivian LLC & Rivian Automotive LLC 6 month U.S. LIBOR + 5.620% 10.1636% 10/15/26 (d)(h)(i) | 4,140,000 | 4,036,500 | |
| 12,289,535 | |||
| Diversified Consumer Services - 0.2% | |||
| Adtalem Global Education, Inc. 5.5% 3/1/28 (d) | 1,115,000 | 1,026,392 | |
| GEMS MENASA Cayman Ltd. 7.125% 7/31/26 (d) | 675,000 | 656,564 | |
| Service Corp. International: | |||
| 4% 5/15/31 | 605,000 | 511,110 | |
| 5.125% 6/1/29 | 460,000 | 430,675 | |
| Sotheby's 7.375% 10/15/27 (d) | 450,000 | 424,521 | |
| WASH Multifamily Acquisition, Inc. 5.75% 4/15/26 (d) | 375,000 | 348,836 | |
| 3,398,098 | |||
| Hotels, Restaurants & Leisure - 3.3% | |||
| 1011778 BC Unlimited Liability Co./New Red Finance, Inc.: | |||
| 3.875% 1/15/28(d) | 225,000 | 200,218 | |
| 4% 10/15/30(d) | 2,284,000 | 1,886,401 | |
| Affinity Gaming LLC 6.875% 12/15/27 (d) | 645,000 | 575,308 | |
| Aramark Services, Inc. 6.375% 5/1/25 (d) | 450,000 | 447,071 | |
| Caesars Entertainment, Inc.: | |||
| 4.625% 10/15/29(d) | 1,250,000 | 1,069,125 | |
| 6.25% 7/1/25(d) | 325,000 | 322,297 | |
| 7% 2/15/30(d) | 1,690,000 | 1,702,675 | |
| 8.125% 7/1/27(d) | 2,505,000 | 2,530,050 | |
| Caesars Resort Collection LLC 5.75% 7/1/25 (d) | 400,000 | 399,332 | |
| Carnival Corp.: | |||
| 5.75% 3/1/27(d) | 630,000 | 516,600 | |
| 6% 5/1/29(d) | 770,000 | 597,153 | |
| 6.65% 1/15/28 | 110,000 | 84,305 | |
| 7.625% 3/1/26(d) | 2,045,000 | 1,841,758 | |
| 10.5% 6/1/30(d) | 785,000 | 760,155 | |
| Carrols Restaurant Group, Inc. 5.875% 7/1/29 (d) | 475,000 | 361,000 | |
| CCM Merger, Inc. 6.375% 5/1/26 (d) | 1,200,000 | 1,151,564 | |
| CDI Escrow Issuer, Inc. 5.75% 4/1/30 (d) | 1,110,000 | 1,030,913 | |
| Cedar Fair LP 5.25% 7/15/29 | 735,000 | 670,433 | |
| Cedar Fair LP/Canada's Wonderland Co. 5.375% 4/15/27 | 405,000 | 386,898 | |
| Cirsa Finance International SARL: | |||
| 4.5% 3/15/27(d) | EUR | 515,000 | 479,350 |
| 10.375% 11/30/27(d) | EUR | 100,000 | 112,010 |
| Dave & Buster's, Inc. 7.625% 11/1/25 (d) | 700,000 | 709,625 | |
| Everi Holdings, Inc. 5% 7/15/29 (d) | 250,000 | 219,878 | |
| Fertitta Entertainment LLC / Fertitta Entertainment Finance Co., Inc. 6.75% 1/15/30 (d) | 1,485,000 | 1,230,723 | |
| Garden SpinCo Corp. 8.625% 7/20/30 (d) | 115,000 | 121,334 | |
| Golden Entertainment, Inc. 7.625% 4/15/26 (d) | 886,000 | 888,463 | |
| Hilton Domestic Operating Co., Inc.: | |||
| 3.625% 2/15/32(d) | 1,750,000 | 1,436,733 | |
| 3.75% 5/1/29(d) | 300,000 | 260,115 | |
| 4% 5/1/31(d) | 410,000 | 348,877 | |
| International Game Technology PLC: | |||
| 5.25% 1/15/29(d) | 660,000 | 612,500 | |
| 6.25% 1/15/27(d) | 1,610,000 | 1,578,476 | |
| Jacobs Entertainment, Inc.: | |||
| 6.75% 2/15/29(d) | 665,000 | 605,303 | |
| 6.75% 2/15/29(d) | 150,000 | 136,125 | |
| Life Time, Inc. 5.75% 1/15/26 (d) | 44,000 | 42,154 | |
| MGM China Holdings Ltd.: | |||
| 4.75% 2/1/27(d) | 505,000 | 441,244 | |
| 5.375% 5/15/24(d) | 400,000 | 388,575 | |
| 5.875% 5/15/26(d) | 315,000 | 292,320 | |
| MGM Resorts International: | |||
| 4.75% 10/15/28 | 2,323,000 | 2,082,374 | |
| 5.5% 4/15/27 | 384,000 | 364,249 | |
| Midwest Gaming Borrower LLC / Midwest Gaming Financial Corp. 4.875% 5/1/29 (d) | 1,540,000 | 1,317,057 | |
| NCL Corp. Ltd.: | |||
| 5.875% 3/15/26(d) | 665,000 | 575,225 | |
| 5.875% 2/15/27(d) | 730,000 | 677,075 | |
| 7.75% 2/15/29(d) | 920,000 | 800,860 | |
| 8.375% 2/1/28(d) | 275,000 | 280,167 | |
| NCL Finance Ltd. 6.125% 3/15/28 (d) | 195,000 | 162,338 | |
| Penn Entertainment, Inc. 5.625% 1/15/27 (d) | 1,650,000 | 1,530,159 | |
| Premier Entertainment Sub LLC 5.875% 9/1/31 (d) | 1,500,000 | 1,080,863 | |
| Royal Caribbean Cruises Ltd.: | |||
| 4.25% 7/1/26(d) | 640,000 | 561,555 | |
| 5.375% 7/15/27(d) | 770,000 | 676,779 | |
| 5.5% 8/31/26(d) | 1,270,000 | 1,166,901 | |
| 5.5% 4/1/28(d) | 1,205,000 | 1,050,278 | |
| 7.25% 1/15/30(d) | 375,000 | 376,641 | |
| 8.25% 1/15/29(d) | 450,000 | 465,836 | |
| 9.25% 1/15/29(d) | 900,000 | 954,385 | |
| 11.625% 8/15/27(d) | 1,175,000 | 1,253,784 | |
| Sands China Ltd.: | |||
| 4.875% 6/18/30 | 200,000 | 173,000 | |
| 5.9% 8/8/28 | 285,000 | 268,675 | |
| Scientific Games Corp. 7.25% 11/15/29 (d) | 2,200,000 | 2,161,500 | |
| SeaWorld Parks & Entertainment, Inc. 5.25% 8/15/29 (d) | 1,175,000 | 1,051,625 | |
| Six Flags Entertainment Corp. 5.5% 4/15/27 (d) | 770,000 | 727,157 | |
| Sugarhouse HSP Gaming Prop Mezz LP/Sugarhouse HSP Gaming Finance Corp. 5.875% 5/15/25 (d) | 505,000 | 476,155 | |
| Viking Cruises Ltd. 5.875% 9/15/27 (d) | 330,000 | 282,988 | |
| Viking Ocean Cruises Ship VII Ltd. 5.625% 2/15/29 (d) | 545,000 | 467,861 | |
| Voc Escrow Ltd. 5% 2/15/28 (d) | 230,000 | 202,619 | |
| Wyndham Hotels & Resorts, Inc. 4.375% 8/15/28 (d) | 215,000 | 194,729 | |
| Wynn Las Vegas LLC/Wynn Las Vegas Capital Corp. 5.25% 5/15/27 (d) | 440,000 | 409,778 | |
| Wynn Macau Ltd.: | |||
| 5.125% 12/15/29(d) | 875,000 | 710,281 | |
| 5.5% 1/15/26(d) | 745,000 | 676,088 | |
| 5.5% 10/1/27(d) | 2,265,000 | 1,959,225 | |
| 5.625% 8/26/28(d) | 200,000 | 169,000 | |
| Wynn Resorts Finance LLC / Wynn Resorts Capital Corp.: | |||
| 5.125% 10/1/29(d) | 725,000 | 648,585 | |
| 7.125% 2/15/31(d) | 125,000 | 124,750 | |
| Yum! Brands, Inc.: | |||
| 3.625% 3/15/31 | 95,000 | 79,475 | |
| 4.625% 1/31/32 | 430,000 | 380,094 | |
| 5.35% 11/1/43 | 845,000 | 705,952 | |
| 5.375% 4/1/32 | 80,000 | 74,119 | |
| 6.875% 11/15/37 | 1,170,000 | 1,216,349 | |
| 54,973,592 | |||
| Household Durables - 0.7% | |||
| Ashton Woods U.S.A. LLC/Ashton Woods Finance Co.: | |||
| 4.625% 8/1/29(d) | 400,000 | 328,216 | |
| 4.625% 4/1/30(d) | 1,000,000 | 805,029 | |
| 6.625% 1/15/28(d) | 25,000 | 22,626 | |
| Beazer Homes U.S.A., Inc.: | |||
| 5.875% 10/15/27 | 125,000 | 111,013 | |
| 7.25% 10/15/29 | 2,600,000 | 2,333,500 | |
| Brookfield Residential Properties, Inc./Brookfield Residential U.S. Corp.: | |||
| 4.875% 2/15/30(d) | 1,079,000 | 811,580 | |
| 6.25% 9/15/27(d) | 563,000 | 490,803 | |
| Castle UK Finco PLC 7% 5/15/29 (d) | GBP | 295,000 | 279,260 |
| Century Communities, Inc.: | |||
| 3.875% 8/15/29(d) | 25,000 | 20,438 | |
| 6.75% 6/1/27 | 300,000 | 292,007 | |
| KB Home: | |||
| 4% 6/15/31 | 750,000 | 612,546 | |
| 4.8% 11/15/29 | 875,000 | 763,438 | |
| M/I Homes, Inc. 4.95% 2/1/28 | 885,000 | 795,378 | |
| Newell Brands, Inc.: | |||
| 4.45% 4/1/26 | 100,000 | 94,530 | |
| 5.75% 4/1/46(e) | 80,000 | 64,255 | |
| 6.375% 9/15/27 | 100,000 | 99,453 | |
| STL Holding Co. LLC 7.5% 2/15/26 (d) | 1,250,000 | 1,087,500 | |
| SWF Escrow Issuer Corp. 6.5% 10/1/29 (d) | 1,925,000 | 1,247,313 | |
| Taylor Morrison Communities, Inc./Monarch Communities, Inc. 5.625% 3/1/24 (d) | 100,000 | 99,510 | |
| TopBuild Corp. 4.125% 2/15/32 (d) | 235,000 | 192,963 | |
| TRI Pointe Homes, Inc. 5.7% 6/15/28 | 1,120,000 | 1,041,122 | |
| 11,592,480 | |||
| Internet & Direct Marketing Retail - 0.3% | |||
| Match Group Holdings II LLC: | |||
| 3.625% 10/1/31(d) | 435,000 | 340,388 | |
| 4.125% 8/1/30(d) | 1,544,000 | 1,279,941 | |
| 4.625% 6/1/28(d) | 500,000 | 444,128 | |
| 5% 12/15/27(d) | 175,000 | 162,969 | |
| 5.625% 2/15/29(d) | 160,000 | 147,406 | |
| QVC, Inc. 4.45% 2/15/25 | 27,000 | 21,803 | |
| Terrier Media Buyer, Inc. 8.875% 12/15/27 (d) | 2,980,000 | 2,005,480 | |
| Uber Technologies, Inc.: | |||
| 4.5% 8/15/29(d) | 25,000 | 22,102 | |
| 7.5% 5/15/25(d) | 510,000 | 515,170 | |
| 8% 11/1/26(d) | 765,000 | 776,648 | |
| 5,716,035 | |||
| Leisure Products - 0.1% | |||
| Mattel, Inc.: | |||
| 3.375% 4/1/26(d) | 315,000 | 289,013 | |
| 3.75% 4/1/29(d) | 570,000 | 493,050 | |
| 5.45% 11/1/41 | 80,000 | 67,200 | |
| Vista Outdoor, Inc. 4.5% 3/15/29 (d) | 145,000 | 117,631 | |
| 966,894 | |||
| Multiline Retail - 0.1% | |||
| LSF9 Atlantis Holdings LLC / Victra Finance Corp. 7.75% 2/15/26 (d) | 765,000 | 672,671 | |
| Nordstrom, Inc.: | |||
| 4.25% 8/1/31 | 340,000 | 248,781 | |
| 4.375% 4/1/30 | 295,000 | 232,681 | |
| 1,154,133 | |||
| Specialty Retail - 0.9% | |||
| At Home Group, Inc.: | |||
| 4.875% 7/15/28(d) | 505,000 | 371,175 | |
| 7.125% 7/15/29(d) | 1,405,000 | 871,100 | |
| Bath & Body Works, Inc.: | |||
| 6.625% 10/1/30(d) | 1,550,000 | 1,468,207 | |
| 6.694% 1/15/27 | 300,000 | 296,994 | |
| 6.95% 3/1/33 | 440,000 | 382,800 | |
| 7.5% 6/15/29 | 230,000 | 232,277 | |
| Carvana Co.: | |||
| 4.875% 9/1/29(d) | 585,000 | 276,719 | |
| 5.5% 4/15/27(d) | 440,000 | 224,310 | |
| 5.875% 10/1/28(d) | 320,000 | 153,849 | |
| Foot Locker, Inc. 4% 10/1/29 (d) | 520,000 | 427,493 | |
| Gap, Inc.: | |||
| 3.625% 10/1/29(d) | 146,000 | 107,067 | |
| 3.875% 10/1/31(d) | 1,125,000 | 807,143 | |
| Jaguar Land Rover Automotive PLC: | |||
| 5.875% 1/15/28(d) | 845,000 | 721,212 | |
| 7.75% 10/15/25(d) | 550,000 | 541,750 | |
| LBM Acquisition LLC 6.25% 1/15/29 (d) | 1,065,000 | 758,770 | |
| LCM Investments Holdings 4.875% 5/1/29 (d) | 1,310,000 | 1,064,758 | |
| Metis Merger Sub LLC 6.5% 5/15/29 (d) | 2,635,000 | 2,134,350 | |
| Michaels Companies, Inc. 7.875% 5/1/29 (d) | 220,000 | 165,550 | |
| Park River Holdings, Inc.: | |||
| 5.625% 2/1/29(d) | 1,750,000 | 1,219,586 | |
| 6.75% 8/1/29(d) | 150,000 | 104,931 | |
| PetSmart, Inc. / PetSmart Finance Corp. 7.75% 2/15/29 (d) | 1,000,000 | 975,500 | |
| Sally Holdings LLC 5.625% 12/1/25 | 615,000 | 599,625 | |
| Specialty Building Products Holdings LLC 6.375% 9/30/26 (d) | 665,000 | 610,350 | |
| 14,515,516 | |||
| Textiles, Apparel & Luxury Goods - 0.3% | |||
| Crocs, Inc. 4.125% 8/15/31 (d) | 130,000 | 106,600 | |
| Hanesbrands, Inc. 4.875% 5/15/26 (d) | 705,000 | 651,057 | |
| Kontoor Brands, Inc. 4.125% 11/15/29 (d) | 745,000 | 631,388 | |
| Levi Strauss & Co. 3.5% 3/1/31 (d) | 415,000 | 339,263 | |
| Wolverine World Wide, Inc. 4% 8/15/29 (d) | 2,940,000 | 2,367,994 | |
| 4,096,302 | |||
TOTAL CONSUMER DISCRETIONARY | 120,439,800 | ||
| CONSUMER STAPLES - 0.9% | |||
| Beverages - 0.1% | |||
| Primo Water Holdings, Inc. 4.375% 4/30/29 (d) | 400,000 | 342,592 | |
| Triton Water Holdings, Inc. 6.25% 4/1/29 (d) | 1,135,000 | 904,652 | |
| 1,247,244 | |||
| Food & Staples Retailing - 0.3% | |||
| Albertsons Companies LLC/Safeway, Inc./New Albertson's, Inc./Albertson's LLC: | |||
| 3.25% 3/15/26(d) | 55,000 | 50,467 | |
| 3.5% 3/15/29(d) | 1,100,000 | 931,013 | |
| 4.875% 2/15/30(d) | 1,105,000 | 991,547 | |
| 5.875% 2/15/28(d) | 100,000 | 96,791 | |
| 6.5% 2/15/28(d) | 475,000 | 472,316 | |
| C&S Group Enterprises LLC 5% 12/15/28 (d) | 850,000 | 654,613 | |
| Iceland Bondco PLC 4.625% 3/15/25 (Reg. S) | GBP | 510,000 | 546,894 |
| New Albertsons LP 7.45% 8/1/29 | 260,000 | 264,537 | |
| Performance Food Group, Inc. 5.5% 10/15/27 (d) | 124,000 | 117,588 | |
| SEG Holding LLC/SEG Finance Corp. 5.625% 10/15/28 (d) | 20,000 | 18,828 | |
| U.S. Foods, Inc.: | |||
| 4.625% 6/1/30(d) | 370,000 | 323,174 | |
| 4.75% 2/15/29(d) | 285,000 | 256,851 | |
| United Natural Foods, Inc. 6.75% 10/15/28 (d) | 40,000 | 37,862 | |
| 4,762,481 | |||
| Food Products - 0.3% | |||
| B&G Foods, Inc. 5.25% 9/15/27 | 1,565,000 | 1,260,936 | |
| Chobani LLC/Finance Corp., Inc.: | |||
| 4.625% 11/15/28(d) | 155,000 | 135,112 | |
| 7.5% 4/15/25(d) | 310,000 | 302,024 | |
| Darling Ingredients, Inc. 6% 6/15/30 (d) | 950,000 | 917,933 | |
| Lamb Weston Holdings, Inc.: | |||
| 4.125% 1/31/30(d) | 805,000 | 706,460 | |
| 4.375% 1/31/32(d) | 445,000 | 391,487 | |
| Pilgrim's Pride Corp.: | |||
| 3.5% 3/1/32 | 100,000 | 77,275 | |
| 4.25% 4/15/31 | 115,000 | 96,025 | |
| Post Holdings, Inc.: | |||
| 4.5% 9/15/31(d) | 875,000 | 736,811 | |
| 4.625% 4/15/30(d) | 849,000 | 736,100 | |
| 5.5% 12/15/29(d) | 239,000 | 218,715 | |
| 5,578,878 | |||
| Household Products - 0.1% | |||
| Diamond BC BV 4.625% 10/1/29 (d) | 390,000 | 316,259 | |
| Energizer Holdings, Inc.: | |||
| 4.375% 3/31/29(d) | 25,000 | 21,194 | |
| 4.75% 6/15/28(d) | 559,000 | 487,839 | |
| Spectrum Brands Holdings, Inc. 5.5% 7/15/30 (d) | 10,000 | 8,843 | |
| 834,135 | |||
| Personal Products - 0.1% | |||
| BellRing Brands, Inc. 7% 3/15/30 (d) | 860,000 | 850,452 | |
| Tobacco - 0.0% | |||
| Vector Group Ltd. 5.75% 2/1/29 (d) | 781,000 | 672,197 | |
TOTAL CONSUMER STAPLES | 13,945,387 | ||
| ENERGY - 5.4% | |||
| Energy Equipment & Services - 0.4% | |||
| Archrock Partners LP / Archrock Partners Finance Corp. 6.875% 4/1/27 (d) | 505,000 | 489,916 | |
| Nabors Industries Ltd. 7.5% 1/15/28 (d) | 330,000 | 304,615 | |
| Nabors Industries, Inc.: | |||
| 5.75% 2/1/25 | 2,000,000 | 1,908,300 | |
| 7.375% 5/15/27(d) | 75,000 | 72,284 | |
| NuStar Logistics LP: | |||
| 5.625% 4/28/27 | 665,000 | 619,034 | |
| 5.75% 10/1/25 | 90,000 | 86,785 | |
| Precision Drilling Corp.: | |||
| 6.875% 1/15/29(d) | 25,000 | 22,540 | |
| 7.125% 1/15/26(d) | 825,000 | 811,676 | |
| Transocean, Inc.: | |||
| 7.5% 1/15/26(d) | 36,000 | 33,042 | |
| 8% 2/1/27(d) | 75,000 | 66,376 | |
| 8.75% 2/15/30(d) | 650,000 | 661,375 | |
| 11.5% 1/30/27(d) | 500,000 | 513,750 | |
| 5,589,693 | |||
| Multi Industry Energy - 0.0% | |||
| Enviva Partners LP / Enviva Partners Finance Corp. 6.5% 1/15/26 (d) | 70,000 | 65,622 | |
| Oil, Gas & Consumable Fuels - 5.0% | |||
| Aethon United BR LP / Aethon United Finance Corp. 8.25% 2/15/26 (d) | 1,565,000 | 1,505,267 | |
| Antero Midstream Partners LP/Antero Midstream Finance Corp.: | |||
| 5.375% 6/15/29(d) | 1,021,000 | 918,900 | |
| 5.75% 3/1/27(d) | 100,000 | 94,401 | |
| 5.75% 1/15/28(d) | 800,000 | 751,000 | |
| 7.875% 5/15/26(d) | 100,000 | 100,995 | |
| Antero Resources Corp.: | |||
| 5.375% 3/1/30(d) | 1,150,000 | 1,047,078 | |
| 7.625% 2/1/29(d) | 140,000 | 141,038 | |
| Apache Corp.: | |||
| 4.25% 1/15/30 | 290,000 | 256,314 | |
| 5.1% 9/1/40 | 175,000 | 143,994 | |
| Ascent Resources - Utica LLC/ARU Finance Corp.: | |||
| 7% 11/1/26(d) | 411,000 | 398,896 | |
| 9% 11/1/27(d) | 450,000 | 550,040 | |
| Athabasca Oil Corp. 9.75% 11/1/26 (d) | 791,000 | 812,568 | |
| California Resources Corp. 7.125% 2/1/26 (d) | 140,000 | 141,057 | |
| Centennial Resource Production LLC: | |||
| 5.875% 7/1/29(d) | 270,000 | 241,650 | |
| 7.75% 2/15/26(d) | 25,000 | 24,625 | |
| Cheniere Energy Partners LP: | |||
| 3.25% 1/31/32 | 385,000 | 308,574 | |
| 4% 3/1/31 | 1,205,000 | 1,038,286 | |
| Chesapeake Energy Corp.: | |||
| 5.875% 2/1/29(d) | 500,000 | 467,645 | |
| 6.75% 4/15/29(d) | 2,235,000 | 2,165,179 | |
| Citgo Petroleum Corp.: | |||
| 6.375% 6/15/26(d) | 721,000 | 696,115 | |
| 7% 6/15/25(d) | 1,860,000 | 1,830,947 | |
| CNX Midstream Partners LP 4.75% 4/15/30 (d) | 75,000 | 61,488 | |
| CNX Resources Corp.: | |||
| 7.25% 3/14/27(d) | 1,021,000 | 1,012,605 | |
| 7.375% 1/15/31(d) | 115,000 | 109,561 | |
| Comstock Resources, Inc.: | |||
| 5.875% 1/15/30(d) | 795,000 | 683,700 | |
| 6.75% 3/1/29(d) | 1,125,000 | 1,035,000 | |
| Coronado Finance Pty Ltd. 10.75% 5/15/26 (d) | 820,000 | 849,423 | |
| Crestwood Midstream Partners LP/Crestwood Midstream Finance Corp.: | |||
| 5.625% 5/1/27(d) | 979,000 | 905,575 | |
| 5.75% 4/1/25 | 513,000 | 497,591 | |
| 6% 2/1/29(d) | 950,000 | 864,215 | |
| 7.375% 2/1/31(d) | 755,000 | 735,461 | |
| CrownRock LP/CrownRock Finance, Inc.: | |||
| 5% 5/1/29(d) | 800,000 | 724,428 | |
| 5.625% 10/15/25(d) | 60,000 | 57,900 | |
| CVR Energy, Inc.: | |||
| 5.25% 2/15/25(d) | 374,000 | 359,040 | |
| 5.75% 2/15/28(d) | 537,000 | 476,614 | |
| DCP Midstream Operating LP: | |||
| 5.625% 7/15/27 | 10,000 | 9,900 | |
| 6.75% 9/15/37(d) | 590,000 | 619,122 | |
| 8.125% 8/16/30 | 570,000 | 631,275 | |
| Delek Logistics Partners LP 7.125% 6/1/28 (d) | 540,000 | 475,200 | |
| DT Midstream, Inc.: | |||
| 4.125% 6/15/29(d) | 485,000 | 415,888 | |
| 4.375% 6/15/31(d) | 100,000 | 83,750 | |
| EG Global Finance PLC: | |||
| 6.25% 10/30/25 (Reg. S) | EUR | 100,000 | 93,386 |
| 6.75% 2/7/25(d) | 1,530,000 | 1,380,825 | |
| 8.5% 10/30/25(d) | 1,664,000 | 1,498,191 | |
| Endeavor Energy Resources LP/EER Finance, Inc. 5.75% 1/30/28 (d) | 1,990,000 | 1,920,350 | |
| EnLink Midstream LLC: | |||
| 5.625% 1/15/28(d) | 335,000 | 319,088 | |
| 6.5% 9/1/30(d) | 80,000 | 78,794 | |
| EnLink Midstream Partners LP: | |||
| 4.15% 6/1/25 | 95,000 | 91,098 | |
| 4.85% 7/15/26 | 180,000 | 170,613 | |
| EQM Midstream Partners LP: | |||
| 4% 8/1/24 | 195,000 | 186,278 | |
| 4.75% 1/15/31(d) | 95,000 | 77,188 | |
| 6% 7/1/25(d) | 25,000 | 24,125 | |
| 6.5% 7/1/27(d) | 760,000 | 719,788 | |
| 6.5% 7/15/48 | 55,000 | 40,968 | |
| 7.5% 6/1/27(d) | 410,000 | 401,800 | |
| 7.5% 6/1/30(d) | 410,000 | 390,616 | |
| Global Partners LP/GLP Finance Corp.: | |||
| 6.875% 1/15/29 | 123,000 | 113,780 | |
| 7% 8/1/27 | 342,000 | 324,900 | |
| Golar LNG Ltd. 7% 10/20/25 (d) | 335,000 | 332,655 | |
| Gulfport Energy Corp. 8% 5/17/26 (d) | 405,000 | 393,611 | |
| Harvest Midstream I LP 7.5% 9/1/28 (d) | 240,000 | 231,446 | |
| Hess Midstream Partners LP: | |||
| 5.125% 6/15/28(d) | 620,000 | 568,858 | |
| 5.5% 10/15/30(d) | 100,000 | 90,000 | |
| 5.625% 2/15/26(d) | 475,000 | 462,256 | |
| Hilcorp Energy I LP/Hilcorp Finance Co.: | |||
| 5.75% 2/1/29(d) | 490,000 | 443,450 | |
| 6% 4/15/30(d) | 275,000 | 249,477 | |
| 6% 2/1/31(d) | 1,255,000 | 1,125,986 | |
| 6.25% 11/1/28(d) | 2,340,000 | 2,174,065 | |
| 6.25% 4/15/32(d) | 375,000 | 340,046 | |
| Holly Energy Partners LP/Holly Energy Finance Corp. 5% 2/1/28 (d) | 335,000 | 304,009 | |
| Independence Energy Finance LLC: | |||
| 7.25% 5/1/26(d) | 1,190,000 | 1,100,750 | |
| 9.25% 2/15/28(d) | 415,000 | 404,563 | |
| Magnolia Oil & Gas Operating LLC 6% 8/1/26 (d) | 1,845,000 | 1,766,588 | |
| MEG Energy Corp. 5.875% 2/1/29 (d) | 1,031,000 | 961,583 | |
| Mesquite Energy, Inc. 7.25% 12/31/49 (c)(d)(f) | 3,242,000 | 0 | |
| Murphy Oil U.S.A., Inc. 3.75% 2/15/31 (d) | 275,000 | 222,505 | |
| New Fortress Energy, Inc.: | |||
| 6.5% 9/30/26(d) | 2,405,000 | 2,200,575 | |
| 6.75% 9/15/25(d) | 2,259,000 | 2,118,174 | |
| NGL Energy Operating LLC/NGL Energy Finance Corp. 7.5% 2/1/26 (d) | 1,475,000 | 1,408,503 | |
| Occidental Petroleum Corp.: | |||
| 4.2% 3/15/48 | 95,000 | 72,675 | |
| 4.4% 4/15/46 | 295,000 | 226,332 | |
| 4.4% 8/15/49 | 130,000 | 100,100 | |
| 4.5% 7/15/44 | 240,000 | 187,245 | |
| 5.5% 12/1/25 | 420,000 | 416,220 | |
| 5.55% 3/15/26 | 60,000 | 59,674 | |
| 5.875% 9/1/25 | 300,000 | 299,250 | |
| 6.125% 1/1/31 | 975,000 | 981,932 | |
| 6.2% 3/15/40 | 1,225,000 | 1,194,375 | |
| 6.375% 9/1/28 | 340,000 | 343,533 | |
| 6.45% 9/15/36 | 235,000 | 236,175 | |
| 6.625% 9/1/30 | 400,000 | 411,000 | |
| 7.5% 5/1/31 | 1,315,000 | 1,407,050 | |
| 7.875% 9/15/31 | 700,000 | 760,207 | |
| 7.95% 6/15/39 | 1,275,000 | 1,405,751 | |
| 8.875% 7/15/30 | 1,655,000 | 1,879,832 | |
| Parkland Corp.: | |||
| 4.5% 10/1/29(d) | 250,000 | 210,000 | |
| 4.625% 5/1/30(d) | 750,000 | 624,375 | |
| Petroleos Mexicanos: | |||
| 6.625% 6/15/35 | 800,000 | 587,656 | |
| 7.69% 1/23/50 | 665,000 | 467,129 | |
| Range Resources Corp.: | |||
| 4.75% 2/15/30(d) | 1,160,000 | 1,038,223 | |
| 8.25% 1/15/29 | 260,000 | 266,825 | |
| Rockcliff Energy II LLC 5.5% 10/15/29 (d) | 640,000 | 587,136 | |
| Rockies Express Pipeline LLC: | |||
| 4.8% 5/15/30(d) | 100,000 | 86,464 | |
| 4.95% 7/15/29(d) | 520,000 | 452,348 | |
| 6.875% 4/15/40(d) | 135,000 | 110,547 | |
| 7.5% 7/15/38(d) | 1,550,000 | 1,397,771 | |
| SM Energy Co. 5.625% 6/1/25 | 395,000 | 379,870 | |
| Southwestern Energy Co.: | |||
| 4.75% 2/1/32 | 1,965,000 | 1,688,583 | |
| 5.375% 3/15/30 | 925,000 | 844,969 | |
| Sunoco LP/Sunoco Finance Corp.: | |||
| 4.5% 5/15/29 | 635,000 | 557,285 | |
| 4.5% 4/30/30 | 850,000 | 736,525 | |
| 5.875% 3/15/28 | 140,000 | 134,363 | |
| Tallgrass Energy Partners LP / Tallgrass Energy Finance Corp.: | |||
| 5.5% 1/15/28(d) | 603,000 | 541,567 | |
| 6% 3/1/27(d) | 1,850,000 | 1,717,706 | |
| 6% 12/31/30(d) | 2,590,000 | 2,233,461 | |
| 6% 9/1/31(d) | 2,035,000 | 1,738,977 | |
| 7.5% 10/1/25(d) | 735,000 | 731,546 | |
| Targa Resources Partners LP/Targa Resources Partners Finance Corp.: | |||
| 4.875% 2/1/31 | 195,000 | 177,074 | |
| 6.875% 1/15/29 | 540,000 | 546,750 | |
| Teine Energy Ltd. 6.875% 4/15/29 (d) | 50,000 | 45,724 | |
| Venture Global Calcasieu Pass LLC: | |||
| 3.875% 8/15/29(d) | 455,000 | 392,438 | |
| 3.875% 11/1/33(d) | 105,000 | 85,617 | |
| 4.125% 8/15/31(d) | 2,070,000 | 1,780,200 | |
| 6.25% 1/15/30(d) | 1,765,000 | 1,740,731 | |
| Vermilion Energy, Inc. 6.875% 5/1/30 (d) | 785,000 | 692,628 | |
| Western Gas Partners LP: | |||
| 3.35% 2/1/25 | 350,000 | 331,717 | |
| 3.95% 6/1/25 | 100,000 | 95,000 | |
| 5.3% 3/1/48 | 95,000 | 78,247 | |
| 5.5% 8/15/48 | 55,000 | 46,063 | |
| 5.5% 2/1/50 | 1,135,000 | 926,606 | |
| 83,026,665 | |||
TOTAL ENERGY | 88,681,980 | ||
| FINANCIALS - 3.5% | |||
| Banks - 0.0% | |||
| Intesa Sanpaolo SpA 4.198% 6/1/32 (d)(h) | 200,000 | 150,690 | |
| Capital Markets - 0.5% | |||
| AssuredPartners, Inc. 5.625% 1/15/29 (d) | 290,000 | 245,715 | |
| Broadstreet Partners, Inc. 5.875% 4/15/29 (d) | 425,000 | 365,888 | |
| Coinbase Global, Inc.: | |||
| 3.375% 10/1/28(d) | 535,000 | 350,425 | |
| 3.625% 10/1/31(d) | 665,000 | 401,048 | |
| Credit Suisse AG 3.625% 9/9/24 | 250,000 | 236,298 | |
| Hightower Holding LLC 6.75% 4/15/29 (d) | 300,000 | 253,784 | |
| Jane Street Group LLC/JSG Finance, Inc. 4.5% 11/15/29 (d) | 1,100,000 | 965,459 | |
| Jefferies Finance LLC/JFIN Co-Issuer Corp. 5% 8/15/28 (d) | 1,170,000 | 988,077 | |
| LPL Holdings, Inc.: | |||
| 4% 3/15/29(d) | 530,000 | 466,299 | |
| 4.375% 5/15/31(d) | 340,000 | 294,110 | |
| MSCI, Inc.: | |||
| 3.25% 8/15/33(d) | 1,225,000 | 965,949 | |
| 3.625% 9/1/30(d) | 385,000 | 327,289 | |
| 4% 11/15/29(d) | 555,000 | 491,231 | |
| VistaJet Malta Finance PLC / XO Management Holding, Inc.: | |||
| 6.375% 2/1/30(d) | 770,000 | 673,954 | |
| 7.875% 5/1/27(d) | 1,070,000 | 1,020,528 | |
| 8,046,054 | |||
| Consumer Finance - 1.3% | |||
| Ally Financial, Inc. 6.7% 2/14/33 | 390,000 | 370,561 | |
| Bread Financial Holdings, Inc. 4.75% 12/15/24 (d) | 450,000 | 417,146 | |
| Cobra AcquisitionCo LLC 6.375% 11/1/29 (d) | 630,000 | 401,006 | |
| Ford Motor Credit Co. LLC: | |||
| U.S. Secured Overnight Fin. Rate (SOFR) Index + 2.950% 7.3899% 3/6/26(h)(i) | 280,000 | 283,232 | |
| 2.3% 2/10/25 | 885,000 | 813,404 | |
| 2.9% 2/10/29 | 670,000 | 545,373 | |
| 3.375% 11/13/25 | 100,000 | 92,107 | |
| 3.625% 6/17/31 | 280,000 | 221,822 | |
| 3.815% 11/2/27 | 330,000 | 289,763 | |
| 4% 11/13/30 | 95,000 | 79,178 | |
| 4.389% 1/8/26 | 195,000 | 183,419 | |
| 4.542% 8/1/26 | 275,000 | 254,733 | |
| 4.95% 5/28/27 | 1,200,000 | 1,118,028 | |
| 5.125% 6/16/25 | 95,000 | 91,711 | |
| 6.95% 3/6/26 | 1,485,000 | 1,484,821 | |
| 7.35% 11/4/27 | 1,170,000 | 1,185,327 | |
| 7.35% 3/6/30 | 700,000 | 708,890 | |
| goeasy Ltd. 4.375% 5/1/26 (d) | 475,000 | 420,503 | |
| LFS Topco LLC 5.875% 10/15/26 (d) | 775,000 | 667,427 | |
| Navient Corp.: | |||
| 4.875% 3/15/28 | 630,000 | 535,588 | |
| 5% 3/15/27 | 950,000 | 844,550 | |
| 5.5% 3/15/29 | 1,845,000 | 1,560,564 | |
| 6.75% 6/15/26 | 835,000 | 804,290 | |
| OneMain Finance Corp.: | |||
| 3.5% 1/15/27 | 1,130,000 | 949,003 | |
| 3.875% 9/15/28 | 1,800,000 | 1,431,000 | |
| 5.375% 11/15/29 | 1,220,000 | 1,027,289 | |
| 6.625% 1/15/28 | 1,376,000 | 1,281,342 | |
| 6.875% 3/15/25 | 390,000 | 380,730 | |
| 7.125% 3/15/26 | 1,325,000 | 1,287,873 | |
| PROG Holdings, Inc. 6% 11/15/29 (d) | 1,000,000 | 849,670 | |
| SLM Corp. 4.2% 10/29/25 | 495,000 | 453,157 | |
| 21,033,507 | |||
| Diversified Financial Services - 0.8% | |||
| Altus Midstream LP 5.875% 6/15/30 (d) | 1,740,000 | 1,608,125 | |
| Icahn Enterprises LP/Icahn Enterprises Finance Corp.: | |||
| 4.375% 2/1/29 | 1,045,000 | 902,569 | |
| 4.75% 9/15/24 | 35,000 | 34,125 | |
| 5.25% 5/15/27 | 1,106,000 | 1,028,580 | |
| 6.25% 5/15/26 | 1,845,000 | 1,789,650 | |
| 6.375% 12/15/25 | 225,000 | 222,071 | |
| MidCap Financial Issuer Trust: | |||
| 5.625% 1/15/30(d) | 465,000 | 365,392 | |
| 6.5% 5/1/28(d) | 1,020,000 | 879,750 | |
| MPH Acquisition Holdings LLC 5.5% 9/1/28 (d) | 1,000,000 | 757,650 | |
| P&L Development LLC/PLD Finance Corp. 7.75% 11/15/25 (d) | 665,000 | 532,108 | |
| Scientific Games Holdings LP/Scientific Games U.S. Finco, Inc. 6.625% 3/1/30 (d) | 525,000 | 461,702 | |
| United Shore Financial Services LLC: | |||
| 5.5% 4/15/29(d) | 525,000 | 434,543 | |
| 5.75% 6/15/27(d) | 740,000 | 651,378 | |
| Venator Finance SARL/Venator Capital Management Ltd.: | |||
| 5.75% 7/15/25(d) | 625,000 | 92,188 | |
| 9.5% 7/1/25(d) | 825,000 | 628,332 | |
| Verscend Escrow Corp. 9.75% 8/15/26 (d) | 1,490,000 | 1,495,588 | |
| VMED O2 UK Financing I PLC: | |||
| 4.25% 1/31/31(d) | 127,000 | 101,900 | |
| 4.75% 7/15/31(d) | 1,850,000 | 1,532,170 | |
| 13,517,821 | |||
| Insurance - 0.5% | |||
| Acrisure LLC / Acrisure Finance, Inc.: | |||
| 4.25% 2/15/29(d) | 80,000 | 65,116 | |
| 7% 11/15/25(d) | 955,000 | 892,471 | |
| 10.125% 8/1/26(d) | 1,440,000 | 1,433,179 | |
| Alliant Holdings Intermediate LLC: | |||
| 4.25% 10/15/27(d) | 479,000 | 422,831 | |
| 5.875% 11/1/29(d) | 620,000 | 518,183 | |
| 6.75% 10/15/27(d) | 1,351,000 | 1,227,762 | |
| 6.75% 4/15/28(d) | 100,000 | 97,801 | |
| AmWINS Group, Inc. 4.875% 6/30/29 (d) | 235,000 | 199,586 | |
| GTCR AP Finance, Inc. 8% 5/15/27 (d) | 795,000 | 764,317 | |
| HUB International Ltd.: | |||
| 5.625% 12/1/29(d) | 695,000 | 596,452 | |
| 7% 5/1/26(d) | 940,000 | 924,058 | |
| Ryan Specialty Group LLC 4.375% 2/1/30 (d) | 390,000 | 333,435 | |
| 7,475,191 | |||
| Mortgage Real Estate Investment Trusts - 0.0% | |||
| Starwood Property Trust, Inc.: | |||
| 3.75% 12/31/24(d) | 10,000 | 9,411 | |
| 4.375% 1/15/27(d) | 765,000 | 663,219 | |
| 672,630 | |||
| Thrifts & Mortgage Finance - 0.4% | |||
| Enact Holdings, Inc. 6.5% 8/15/25 (d) | 1,795,000 | 1,764,036 | |
| Freedom Mortgage Corp. 7.625% 5/1/26 (d) | 225,000 | 192,070 | |
| Home Point Capital, Inc. 5% 2/1/26 (d) | 690,000 | 481,148 | |
| LD Holdings Group LLC 6.125% 4/1/28 (d) | 1,350,000 | 799,875 | |
| Nationstar Mortgage Holdings, Inc.: | |||
| 5.125% 12/15/30(d) | 940,000 | 728,293 | |
| 5.5% 8/15/28(d) | 693,000 | 588,620 | |
| PennyMac Financial Services, Inc.: | |||
| 4.25% 2/15/29(d) | 1,640,000 | 1,283,541 | |
| 5.375% 10/15/25(d) | 880,000 | 804,219 | |
| Quicken Loans LLC/Quicken Loans Co.-Issuer, Inc. 4% 10/15/33 (d) | 960,000 | 709,725 | |
| 7,351,527 | |||
TOTAL FINANCIALS | 58,247,420 | ||
| HEALTH CARE - 3.3% | |||
| Biotechnology - 0.1% | |||
| Amgen, Inc. 5.6% 3/2/43 (g) | 205,000 | 202,444 | |
| Emergent BioSolutions, Inc. 3.875% 8/15/28 (d) | 912,000 | 551,760 | |
| Grifols Escrow Issuer SA 4.75% 10/15/28 (d) | 220,000 | 188,100 | |
| 942,304 | |||
| Health Care Equipment & Supplies - 0.5% | |||
| AdaptHealth LLC: | |||
| 4.625% 8/1/29(d) | 1,713,000 | 1,437,892 | |
| 5.125% 3/1/30(d) | 805,000 | 696,325 | |
| Avantor Funding, Inc.: | |||
| 3.875% 11/1/29(d) | 310,000 | 268,150 | |
| 4.625% 7/15/28(d) | 1,475,000 | 1,357,000 | |
| Embecta Corp.: | |||
| 5% 2/15/30(d) | 890,000 | 754,676 | |
| 6.75% 2/15/30(d) | 25,000 | 22,505 | |
| Hologic, Inc.: | |||
| 3.25% 2/15/29(d) | 485,000 | 418,216 | |
| 4.625% 2/1/28(d) | 110,000 | 102,574 | |
| Mozart Borrower LP: | |||
| 3.875% 4/1/29(d) | 453,000 | 377,564 | |
| 5.25% 10/1/29(d) | 3,740,000 | 3,069,362 | |
| Teleflex, Inc. 4.25% 6/1/28 (d) | 270,000 | 243,700 | |
| 8,747,964 | |||
| Health Care Providers & Services - 1.9% | |||
| 180 Medical, Inc. 3.875% 10/15/29 (d) | 480,000 | 417,931 | |
| AMN Healthcare 4% 4/15/29 (d) | 1,172,000 | 1,002,060 | |
| Centene Corp.: | |||
| 2.5% 3/1/31 | 265,000 | 206,533 | |
| 3% 10/15/30 | 255,000 | 207,914 | |
| Community Health Systems, Inc.: | |||
| 4.75% 2/15/31(d) | 710,000 | 548,475 | |
| 5.25% 5/15/30(d) | 2,245,000 | 1,796,269 | |
| 5.625% 3/15/27(d) | 515,000 | 451,998 | |
| 6% 1/15/29(d) | 990,000 | 855,000 | |
| 6.125% 4/1/30(d) | 1,960,000 | 1,342,208 | |
| 6.875% 4/15/29(d) | 665,000 | 465,103 | |
| 8% 3/15/26(d) | 245,000 | 238,875 | |
| 8% 12/15/27(d) | 1,030,000 | 999,100 | |
| DaVita HealthCare Partners, Inc.: | |||
| 3.75% 2/15/31(d) | 2,825,000 | 2,133,161 | |
| 4.625% 6/1/30(d) | 2,207,000 | 1,818,943 | |
| Hadrian Merger Sub, Inc. 8.5% 5/1/26 (d) | 175,000 | 143,500 | |
| HCA Holdings, Inc. 5.5% 6/15/47 | 185,000 | 166,374 | |
| HealthEquity, Inc. 4.5% 10/1/29 (d) | 240,000 | 209,758 | |
| Humana, Inc. 5.875% 3/1/33 | 185,000 | 190,314 | |
| LifePoint Health, Inc. 4.375% 2/15/27 (d) | 425,000 | 358,711 | |
| ModivCare Escrow Issuer, Inc. 5% 10/1/29 (d) | 235,000 | 198,815 | |
| Molina Healthcare, Inc.: | |||
| 3.875% 11/15/30(d) | 305,000 | 256,949 | |
| 3.875% 5/15/32(d) | 105,000 | 86,206 | |
| 4.375% 6/15/28(d) | 590,000 | 535,897 | |
| Option Care Health, Inc. 4.375% 10/31/29 (d) | 855,000 | 732,795 | |
| Pediatrix Medical Group, Inc. 5.375% 2/15/30 (d) | 600,000 | 529,311 | |
| Prime Healthcare Services 7.25% 11/1/25 (d) | 1,550,000 | 1,402,750 | |
| Radiology Partners, Inc. 9.25% 2/1/28 (d) | 440,000 | 263,151 | |
| Regionalcare Hospital Partners 9.75% 12/1/26 (d) | 1,523,000 | 1,296,434 | |
| RegionalCare Hospital Partners Holdings, Inc. 5.375% 1/15/29 (d) | 1,150,000 | 754,780 | |
| RP Escrow Issuer LLC 5.25% 12/15/25 (d) | 235,000 | 183,643 | |
| Select Medical Corp. 6.25% 8/15/26 (d) | 855,000 | 816,525 | |
| Tenet Healthcare Corp.: | |||
| 4.25% 6/1/29 | 3,550,000 | 3,108,735 | |
| 4.375% 1/15/30 | 1,850,000 | 1,618,750 | |
| 4.625% 6/15/28 | 1,439,000 | 1,301,962 | |
| 6.125% 10/1/28 | 2,330,000 | 2,155,250 | |
| 6.125% 6/15/30(d) | 1,705,000 | 1,623,991 | |
| 6.25% 2/1/27 | 245,000 | 238,598 | |
| 6.875% 11/15/31 | 990,000 | 913,275 | |
| 31,570,044 | |||
| Health Care Technology - 0.1% | |||
| Athenahealth Group, Inc. 6.5% 2/15/30 (d) | 1,465,000 | 1,158,733 | |
| IQVIA, Inc. 5% 10/15/26 (d) | 400,000 | 382,000 | |
| 1,540,733 | |||
| Life Sciences Tools & Services - 0.0% | |||
| Charles River Laboratories International, Inc.: | |||
| 3.75% 3/15/29(d) | 625,000 | 542,625 | |
| 4% 3/15/31(d) | 180,000 | 154,019 | |
| 4.25% 5/1/28(d) | 70,000 | 63,155 | |
| 759,799 | |||
| Pharmaceuticals - 0.7% | |||
| 1375209 BC Ltd. 9% 1/30/28 (d) | 250,000 | 249,620 | |
| Bausch Health Companies, Inc.: | |||
| 5% 1/30/28(d) | 3,350,000 | 1,444,421 | |
| 5.25% 1/30/30(d) | 2,497,000 | 1,077,068 | |
| 6.25% 2/15/29(d) | 1,860,000 | 817,013 | |
| 9% 12/15/25(d) | 100,000 | 79,192 | |
| Catalent Pharma Solutions: | |||
| 3.5% 4/1/30(d) | 195,000 | 169,363 | |
| 5% 7/15/27(d) | 305,000 | 293,980 | |
| Jazz Securities DAC 4.375% 1/15/29 (d) | 1,080,000 | 956,502 | |
| Organon & Co. / Organon Foreign Debt Co-Issuer BV: | |||
| 4.125% 4/30/28(d) | 590,000 | 520,793 | |
| 5.125% 4/30/31(d) | 2,285,000 | 1,939,394 | |
| Teva Pharmaceutical Finance Netherlands III BV: | |||
| 5.125% 5/9/29 | 1,585,000 | 1,402,979 | |
| 6.75% 3/1/28 | 1,145,000 | 1,100,631 | |
| 7.125% 1/31/25 | 565,000 | 572,063 | |
| Valeant Pharmaceuticals International, Inc.: | |||
| 8.5% 1/31/27(d) | 24,000 | 12,627 | |
| 9.25% 4/1/26(d) | 370,000 | 276,659 | |
| 10,912,305 | |||
TOTAL HEALTH CARE | 54,473,149 | ||
| INDUSTRIALS - 5.0% | |||
| Aerospace & Defense - 1.1% | |||
| Bombardier, Inc.: | |||
| 7.5% 3/15/25(d) | 3,365,000 | 3,362,737 | |
| 7.5% 2/1/29(d) | 1,750,000 | 1,715,075 | |
| 7.875% 4/15/27(d) | 694,000 | 690,066 | |
| BWX Technologies, Inc. 4.125% 6/30/28 (d) | 695,000 | 620,025 | |
| Howmet Aerospace, Inc.: | |||
| 5.9% 2/1/27 | 100,000 | 99,557 | |
| 5.95% 2/1/37 | 80,000 | 78,394 | |
| 6.875% 5/1/25 | 100,000 | 101,750 | |
| Maxar Technologies, Inc. 7.75% 6/15/27 (d) | 915,000 | 956,788 | |
| Moog, Inc. 4.25% 12/15/27 (d) | 30,000 | 27,450 | |
| Spirit Aerosystems, Inc.: | |||
| 7.5% 4/15/25(d) | 425,000 | 424,618 | |
| 9.375% 11/30/29(d) | 270,000 | 285,188 | |
| The Boeing Co.: | |||
| 5.805% 5/1/50 | 800,000 | 760,981 | |
| 5.93% 5/1/60 | 625,000 | 583,637 | |
| TransDigm, Inc.: | |||
| 4.625% 1/15/29 | 950,000 | 816,527 | |
| 5.5% 11/15/27 | 2,254,000 | 2,070,863 | |
| 6.25% 3/15/26(d) | 2,820,000 | 2,782,623 | |
| 6.375% 6/15/26 | 605,000 | 586,747 | |
| 6.75% 8/15/28(d)(g) | 1,090,000 | 1,084,550 | |
| 7.5% 3/15/27 | 1,125,000 | 1,110,938 | |
| 18,158,514 | |||
| Air Freight & Logistics - 0.0% | |||
| Rand Parent LLC 8.5% 2/15/30 (d) | 135,000 | 129,614 | |
| Airlines - 0.6% | |||
| Air Canada 3.875% 8/15/26 (d) | 145,000 | 130,621 | |
| American Airlines, Inc.: | |||
| 7.25% 2/15/28(d) | 300,000 | 293,460 | |
| 11.75% 7/15/25(d) | 2,385,000 | 2,615,820 | |
| American Airlines, Inc. / AAdvantage Loyalty IP Ltd.: | |||
| 5.5% 4/20/26(d) | 1,465,000 | 1,425,809 | |
| 5.75% 4/20/29(d) | 2,645,000 | 2,515,700 | |
| Hawaiian Brand Intellectual Property Ltd. / HawaiianMiles Loyalty Ltd. 5.75% 1/20/26 (d) | 250,000 | 232,479 | |
| Mileage Plus Holdings LLC 6.5% 6/20/27 (d) | 297,013 | 297,013 | |
| Spirit Loyalty Cayman Ltd. / Spirit IP Cayman Ltd. 8% 9/20/25 (d) | 295,000 | 296,401 | |
| United Airlines, Inc.: | |||
| 4.375% 4/15/26(d) | 725,000 | 682,355 | |
| 4.625% 4/15/29(d) | 1,330,000 | 1,179,093 | |
| 9,668,751 | |||
| Building Products - 0.5% | |||
| Advanced Drain Systems, Inc.: | |||
| 5% 9/30/27(d) | 40,000 | 37,212 | |
| 6.375% 6/15/30(d) | 300,000 | 286,511 | |
| APi Group DE, Inc. 4.75% 10/15/29 (d) | 25,000 | 22,317 | |
| BCPE Ulysses Intermediate, Inc. 7.75% 4/1/27 pay-in-kind (d)(h) | 175,000 | 126,310 | |
| Builders FirstSource, Inc. 4.25% 2/1/32 (d) | 575,000 | 482,727 | |
| Cornerstone Building Brands, Inc. 6.125% 1/15/29 (d) | 900,000 | 652,530 | |
| Griffon Corp. 5.75% 3/1/28 | 450,000 | 414,135 | |
| Jeld-Wen, Inc. 4.625% 12/15/25 (d) | 450,000 | 404,396 | |
| Masonite International Corp.: | |||
| 3.5% 2/15/30(d) | 250,000 | 203,326 | |
| 5.375% 2/1/28(d) | 73,000 | 68,470 | |
| MIWD Holdco II LLC / MIWD Finance Corp. 5.5% 2/1/30 (d) | 500,000 | 405,944 | |
| New Enterprise Stone & Lime Co., Inc. 5.25% 7/15/28 (d) | 840,000 | 767,848 | |
| PGT Innovations, Inc. 4.375% 10/1/29 (d) | 885,000 | 742,991 | |
| Shea Homes Ltd. Partnership/Corp. 4.75% 2/15/28 | 1,200,000 | 1,054,154 | |
| Standard Industries, Inc./New Jersey 4.375% 7/15/30 (d) | 2,170,000 | 1,806,525 | |
| 7,475,396 | |||
| Commercial Services & Supplies - 1.3% | |||
| ACCO Brands Corp. 4.25% 3/15/29 (d) | 710,000 | 581,870 | |
| Allied Universal Holdco LLC / Allied Universal Finance Corp.: | |||
| 6% 6/1/29(d) | 1,675,000 | 1,247,831 | |
| 6.625% 7/15/26(d) | 1,789,000 | 1,699,121 | |
| 9.75% 7/15/27(d) | 1,470,000 | 1,348,784 | |
| Atlas Luxco 4 SARL / Allied Universal Holdco LLC / Allied Universal Finance Corp.: | |||
| 4.625% 6/1/28(d) | 1,185,000 | 985,505 | |
| 4.625% 6/1/28(d) | 1,015,000 | 832,895 | |
| Brand Energy & Infrastructure Services, Inc. 8.5% 7/15/25 (d) | 1,314,000 | 1,099,463 | |
| Clean Harbors, Inc. 6.375% 2/1/31 (d) | 170,000 | 168,790 | |
| CoreCivic, Inc.: | |||
| 4.75% 10/15/27 | 225,000 | 194,252 | |
| 8.25% 4/15/26 | 1,660,000 | 1,680,534 | |
| Covanta Holding Corp. 4.875% 12/1/29 (d) | 330,000 | 278,737 | |
| GFL Environmental, Inc.: | |||
| 3.75% 8/1/25(d) | 195,000 | 183,544 | |
| 4.375% 8/15/29(d) | 750,000 | 649,260 | |
| 4.75% 6/15/29(d) | 1,415,000 | 1,258,360 | |
| 5.125% 12/15/26(d) | 195,000 | 186,689 | |
| Legends Hospitality Holding Co. LLC/Legends Hospitality Co-Issuer, Inc. 5% 2/1/26 (d) | 475,000 | 432,250 | |
| Madison IAQ LLC: | |||
| 4.125% 6/30/28(d) | 1,200,000 | 1,023,720 | |
| 5.875% 6/30/29(d) | 835,000 | 664,767 | |
| Neptune BidCo U.S., Inc. 9.29% 4/15/29 (d) | 1,230,000 | 1,162,842 | |
| PowerTeam Services LLC 9.033% 12/4/25 (d) | 275,000 | 236,500 | |
| Prime Securities Services Borrower LLC/Prime Finance, Inc.: | |||
| 5.75% 4/15/26(d) | 825,000 | 797,156 | |
| 6.25% 1/15/28(d) | 900,000 | 834,840 | |
| Staples, Inc.: | |||
| 7.5% 4/15/26(d) | 1,125,000 | 1,001,250 | |
| 10.75% 4/15/27(d) | 425,000 | 325,465 | |
| Stericycle, Inc.: | |||
| 3.875% 1/15/29(d) | 390,000 | 334,330 | |
| 5.375% 7/15/24(d) | 155,000 | 152,725 | |
| The Brink's Co. 4.625% 10/15/27 (d) | 500,000 | 454,605 | |
| The GEO Group, Inc. 9.5% 12/31/28 (d) | 650,000 | 621,022 | |
| Verde Bidco SpA 4.625% 10/1/26 (d) | EUR | 215,000 | 206,370 |
| 20,643,477 | |||
| Construction & Engineering - 0.4% | |||
| AECOM 5.125% 3/15/27 | 130,000 | 124,322 | |
| Amsted Industries, Inc. 4.625% 5/15/30 (d) | 965,000 | 849,876 | |
| Cloud Crane LLC 10.125% 8/1/24 (d) | 1,812,000 | 1,752,868 | |
| Great Lakes Dredge & Dock Corp. 5.25% 6/1/29 (d) | 525,000 | 408,866 | |
| Pike Corp. 5.5% 9/1/28 (d) | 1,239,000 | 1,075,217 | |
| Railworks Holdings LP 8.25% 11/15/28 (d) | 360,000 | 336,852 | |
| SRS Distribution, Inc.: | |||
| 4.625% 7/1/28(d) | 395,000 | 345,617 | |
| 6% 12/1/29(d) | 1,905,000 | 1,591,056 | |
| 6,484,674 | |||
| Electrical Equipment - 0.1% | |||
| Regal Rexnord Corp.: | |||
| 6.05% 2/15/26(d) | 300,000 | 297,595 | |
| 6.05% 4/15/28(d) | 195,000 | 190,673 | |
| 6.3% 2/15/30(d) | 195,000 | 190,785 | |
| Sensata Technologies BV: | |||
| 4% 4/15/29(d) | 760,000 | 670,297 | |
| 5% 10/1/25(d) | 40,000 | 38,915 | |
| 5.875% 9/1/30(d) | 785,000 | 744,345 | |
| Vertiv Group Corp. 4.125% 11/15/28 (d) | 40,000 | 34,752 | |
| Wesco Distribution, Inc. 7.25% 6/15/28 (d) | 15,000 | 15,200 | |
| 2,182,562 | |||
| Industrial Conglomerates - 0.0% | |||
| Ladder Capital Finance Holdings LLLP/Ladder Capital Finance Corp. 4.75% 6/15/29 (d) | 360,000 | 292,742 | |
| Machinery - 0.4% | |||
| Chart Industries, Inc.: | |||
| 7.5% 1/1/30(d) | 350,000 | 355,250 | |
| 9.5% 1/1/31(d) | 175,000 | 182,875 | |
| Hillenbrand, Inc.: | |||
| 3.75% 3/1/31 | 590,000 | 482,667 | |
| 5% 9/15/26(h) | 25,000 | 23,878 | |
| Mueller Water Products, Inc. 4% 6/15/29 (d) | 1,305,000 | 1,138,711 | |
| Stevens Holding Co., Inc. 6.125% 10/1/26 (d) | 335,000 | 339,831 | |
| Terex Corp. 5% 5/15/29 (d) | 435,000 | 399,369 | |
| Titan International, Inc. 7% 4/30/28 | 25,000 | 23,688 | |
| Vertical Holdco GmbH 7.625% 7/15/28 (d) | 1,691,000 | 1,552,188 | |
| Vertical U.S. Newco, Inc. 5.25% 7/15/27 (d) | 1,435,000 | 1,300,012 | |
| 5,798,469 | |||
| Marine - 0.0% | |||
| Seaspan Corp. 5.5% 8/1/29 (d) | 645,000 | 485,394 | |
| Professional Services - 0.1% | |||
| ASGN, Inc. 4.625% 5/15/28 (d) | 620,000 | 560,313 | |
| Booz Allen Hamilton, Inc. 3.875% 9/1/28 (d) | 570,000 | 506,012 | |
| Korn Ferry 4.625% 12/15/27 (d) | 75,000 | 69,400 | |
| TriNet Group, Inc. 3.5% 3/1/29 (d) | 800,000 | 668,002 | |
| 1,803,727 | |||
| Road & Rail - 0.1% | |||
| Avis Budget Car Rental LLC/Avis Budget Finance, Inc.: | |||
| 4.75% 4/1/28(d) | 650,000 | 576,876 | |
| 5.375% 3/1/29(d) | 150,000 | 135,023 | |
| Hertz Corp.: | |||
| 4.625% 12/1/26(d) | 125,000 | 111,317 | |
| 5% 12/1/29(d) | 600,000 | 498,138 | |
| Watco Companies LLC / Watco Finance Corp. 6.5% 6/15/27 (d) | 585,000 | 534,864 | |
| XPO Escrow Sub LLC 7.5% 11/15/27 (d) | 125,000 | 126,820 | |
| 1,983,038 | |||
| Trading Companies & Distributors - 0.4% | |||
| Alta Equipment Group, Inc. 5.625% 4/15/26 (d) | 500,000 | 467,782 | |
| Fortress Transportation & Infrastructure Investors LLC 5.5% 5/1/28 (d) | 1,050,000 | 937,715 | |
| Foundation Building Materials, Inc. 6% 3/1/29 (d) | 900,000 | 711,168 | |
| H&E Equipment Services, Inc. 3.875% 12/15/28 (d) | 2,730,000 | 2,347,746 | |
| United Rentals North America, Inc.: | |||
| 3.75% 1/15/32 | 500,000 | 419,643 | |
| 3.875% 2/15/31 | 945,000 | 808,820 | |
| 4% 7/15/30 | 877,000 | 773,339 | |
| 4.875% 1/15/28 | 525,000 | 500,430 | |
| 6% 12/15/29(d) | 100,000 | 100,000 | |
| 7,066,643 | |||
| Transportation Infrastructure - 0.0% | |||
| First Student Bidco, Inc./First Transit Parent, Inc. 4% 7/31/29 (d) | 285,000 | 243,675 | |
TOTAL INDUSTRIALS | 82,416,676 | ||
| INFORMATION TECHNOLOGY - 2.1% | |||
| Communications Equipment - 0.2% | |||
| CommScope, Inc.: | |||
| 4.75% 9/1/29(d) | 345,000 | 281,175 | |
| 6% 3/1/26(d) | 170,000 | 163,806 | |
| Hughes Satellite Systems Corp. 6.625% 8/1/26 | 1,155,000 | 1,087,144 | |
| ViaSat, Inc.: | |||
| 5.625% 9/15/25(d) | 1,350,000 | 1,250,033 | |
| 5.625% 4/15/27(d) | 1,090,000 | 994,516 | |
| Viavi Solutions, Inc. 3.75% 10/1/29 (d) | 455,000 | 379,789 | |
| 4,156,463 | |||
| Electronic Equipment & Components - 0.1% | |||
| Coherent Corp. 5% 12/15/29 (d) | 500,000 | 438,050 | |
| Likewize Corp. 9.75% 10/15/25 (d) | 1,310,000 | 1,226,873 | |
| Sensata Technologies, Inc. 3.75% 2/15/31 (d) | 95,000 | 79,194 | |
| TTM Technologies, Inc. 4% 3/1/29 (d) | 885,000 | 730,044 | |
| 2,474,161 | |||
| IT Services - 0.5% | |||
| Acuris Finance U.S. 5% 5/1/28 (d) | 580,000 | 461,825 | |
| Block, Inc.: | |||
| 2.75% 6/1/26 | 100,000 | 89,229 | |
| 3.5% 6/1/31 | 80,000 | 64,632 | |
| Gartner, Inc.: | |||
| 3.625% 6/15/29(d) | 1,334,000 | 1,153,550 | |
| 3.75% 10/1/30(d) | 385,000 | 325,960 | |
| 4.5% 7/1/28(d) | 610,000 | 559,996 | |
| GCI LLC 4.75% 10/15/28 (d) | 720,000 | 617,400 | |
| Go Daddy Operating Co. LLC / GD Finance Co., Inc.: | |||
| 3.5% 3/1/29(d) | 650,000 | 544,556 | |
| 5.25% 12/1/27(d) | 340,000 | 321,762 | |
| Presidio Holdings, Inc. 8.25% 2/1/28 (d) | 845,000 | 803,124 | |
| Rackspace Hosting, Inc.: | |||
| 3.5% 2/15/28(d) | 475,000 | 289,156 | |
| 5.375% 12/1/28(d) | 2,495,000 | 980,141 | |
| Sabre GLBL, Inc.: | |||
| 7.375% 9/1/25(d) | 240,000 | 224,644 | |
| 9.25% 4/15/25(d) | 495,000 | 487,249 | |
| 11.25% 12/15/27(d) | 235,000 | 234,852 | |
| Twilio, Inc. 3.875% 3/15/31 | 745,000 | 609,969 | |
| 7,768,045 | |||
| Semiconductors & Semiconductor Equipment - 0.3% | |||
| Broadcom, Inc.: | |||
| 2.45% 2/15/31(d) | 365,000 | 289,222 | |
| 2.6% 2/15/33(d) | 280,000 | 211,619 | |
| Entegris Escrow Corp.: | |||
| 4.75% 4/15/29(d) | 1,015,000 | 922,871 | |
| 5.95% 6/15/30(d) | 3,120,000 | 2,901,890 | |
| Entegris, Inc. 3.625% 5/1/29 (d) | 175,000 | 145,110 | |
| 4,470,712 | |||
| Software - 1.0% | |||
| Black Knight InfoServ LLC 3.625% 9/1/28 (d) | 1,585,000 | 1,371,025 | |
| Boxer Parent Co., Inc.: | |||
| 7.125% 10/2/25(d) | 895,000 | 886,520 | |
| 9.125% 3/1/26(d) | 440,000 | 427,468 | |
| Central Parent, Inc./Central Merger Sub, Inc. 7.25% 6/15/29 (d) | 1,920,000 | 1,877,416 | |
| Clarivate Science Holdings Corp.: | |||
| 3.875% 7/1/28(d) | 930,000 | 802,532 | |
| 4.875% 7/1/29(d) | 685,000 | 591,840 | |
| Crowdstrike Holdings, Inc. 3% 2/15/29 | 95,000 | 80,016 | |
| Elastic NV 4.125% 7/15/29 (d) | 305,000 | 250,311 | |
| Fair Isaac Corp.: | |||
| 4% 6/15/28(d) | 1,545,000 | 1,403,107 | |
| 5.25% 5/15/26(d) | 575,000 | 559,860 | |
| Gen Digital, Inc.: | |||
| 5% 4/15/25(d) | 625,000 | 607,100 | |
| 6.75% 9/30/27(d) | 765,000 | 751,955 | |
| 7.125% 9/30/30(d) | 745,000 | 726,375 | |
| ION Trading Technologies Ltd. 5.75% 5/15/28 (d) | 405,000 | 328,556 | |
| McAfee Corp. 7.375% 2/15/30 (d) | 1,565,000 | 1,240,303 | |
| MicroStrategy, Inc. 6.125% 6/15/28 (d) | 865,000 | 717,950 | |
| NCR Corp.: | |||
| 5.125% 4/15/29(d) | 1,425,000 | 1,216,982 | |
| 5.25% 10/1/30(d) | 155,000 | 128,148 | |
| Open Text Corp. 3.875% 2/15/28 (d) | 550,000 | 474,210 | |
| Open Text Holdings, Inc.: | |||
| 4.125% 2/15/30(d) | 235,000 | 193,381 | |
| 4.125% 12/1/31(d) | 265,000 | 210,874 | |
| Picard Midco, Inc. 6.5% 3/31/29 (d) | 560,000 | 485,106 | |
| ZoomInfo Technologies LLC/ZoomInfo Finance Corp. 3.875% 2/1/29 (d) | 804,000 | 668,304 | |
| 15,999,339 | |||
TOTAL INFORMATION TECHNOLOGY | 34,868,720 | ||
| MATERIALS - 3.3% | |||
| Chemicals - 1.2% | |||
| ASP Unifrax Holdings, Inc. 5.25% 9/30/28 (d) | 575,000 | 446,038 | |
| Avient Corp. 7.125% 8/1/30 (d) | 700,000 | 701,750 | |
| CVR Partners LP 6.125% 6/15/28 (d) | 1,140,000 | 1,012,634 | |
| Element Solutions, Inc. 3.875% 9/1/28 (d) | 427,000 | 368,288 | |
| Gpd Companies, Inc. 10.125% 4/1/26 (d) | 545,000 | 489,312 | |
| GrafTech Finance, Inc. 4.625% 12/15/28 (d) | 625,000 | 510,325 | |
| Invictus U.S. Newco LLC 5% 10/30/29 (d) | 950,000 | 755,782 | |
| Iris Holding, Inc. 10% 12/15/28 (d) | 800,000 | 606,000 | |
| Kronos Acquisition Holdings, Inc. / KIK Custom Products, Inc.: | |||
| 5% 12/31/26(d) | 170,000 | 153,891 | |
| 7% 12/31/27(d) | 1,960,000 | 1,680,700 | |
| LSB Industries, Inc. 6.25% 10/15/28 (d) | 160,000 | 145,650 | |
| Methanex Corp.: | |||
| 5.125% 10/15/27 | 1,041,000 | 978,467 | |
| 5.25% 12/15/29 | 565,000 | 518,150 | |
| 5.65% 12/1/44 | 587,000 | 478,405 | |
| NOVA Chemicals Corp.: | |||
| 4.25% 5/15/29(d) | 315,000 | 260,804 | |
| 4.875% 6/1/24(d) | 230,000 | 225,414 | |
| 5% 5/1/25(d) | 200,000 | 190,637 | |
| 5.25% 6/1/27(d) | 370,000 | 333,000 | |
| Nufarm Australia Ltd. 5% 1/27/30 (d) | 510,000 | 445,232 | |
| Olympus Water U.S. Holding Corp.: | |||
| 4.25% 10/1/28(d) | 380,000 | 317,172 | |
| 6.25% 10/1/29(d) | 405,000 | 328,278 | |
| Rain CII Carbon LLC/CII Carbon Corp. 7.25% 4/1/25 (d) | 755,000 | 718,666 | |
| SCIH Salt Holdings, Inc. 4.875% 5/1/28 (d) | 40,000 | 34,587 | |
| SCIL IV LLC / SCIL U.S.A. Holdings LLC 5.375% 11/1/26 (d) | 405,000 | 363,990 | |
| The Chemours Co. LLC: | |||
| 4.625% 11/15/29(d) | 950,000 | 770,991 | |
| 5.375% 5/15/27 | 215,000 | 195,790 | |
| 5.75% 11/15/28(d) | 450,000 | 395,227 | |
| The Scotts Miracle-Gro Co.: | |||
| 4% 4/1/31 | 1,465,000 | 1,172,000 | |
| 4.375% 2/1/32 | 60,000 | 48,986 | |
| TPC Group, Inc. 13% 12/16/27 (d) | 1,364,109 | 1,391,336 | |
| Tronox, Inc. 4.625% 3/15/29 (d) | 1,700,000 | 1,385,500 | |
| Univar Solutions U.S.A., Inc. 5.125% 12/1/27 (d) | 720,000 | 684,594 | |
| Valvoline, Inc. 4.25% 2/15/30 (d) | 129,000 | 126,070 | |
| W.R. Grace Holding LLC: | |||
| 5.625% 8/15/29(d) | 1,670,000 | 1,339,011 | |
| 7.375% 3/1/31(d) | 180,000 | 178,691 | |
| 19,751,368 | |||
| Construction Materials - 0.3% | |||
| Eco Material Technologies, Inc. 7.875% 1/31/27 (d) | 550,000 | 524,867 | |
| Smyrna Ready Mix LLC 6% 11/1/28 (d) | 1,413,000 | 1,254,179 | |
| Summit Materials LLC/Summit Materials Finance Corp.: | |||
| 5.25% 1/15/29(d) | 730,000 | 671,600 | |
| 6.5% 3/15/27(d) | 1,000,000 | 978,750 | |
| White Cap Buyer LLC 6.875% 10/15/28 (d) | 675,000 | 613,035 | |
| 4,042,431 | |||
| Containers & Packaging - 0.8% | |||
| ARD Finance SA 6.5% 6/30/27 pay-in-kind (d)(h) | 1,463,279 | 1,196,494 | |
| Ardagh Metal Packaging Finance U.S.A. LLC/Ardagh Metal Packaging Finance PLC: | |||
| 4% 9/1/29(d) | 935,000 | 749,758 | |
| 6% 6/15/27(d) | 1,230,000 | 1,190,320 | |
| Ardagh Packaging Finance PLC/Ardagh MP Holdings U.S.A., Inc.: | |||
| 5.25% 8/15/27(d) | 55,000 | 45,152 | |
| 5.25% 8/15/27(d) | 40,000 | 32,838 | |
| Ball Corp.: | |||
| 2.875% 8/15/30 | 100,000 | 79,820 | |
| 4.875% 3/15/26 | 295,000 | 285,044 | |
| 6.875% 3/15/28 | 950,000 | 959,500 | |
| Berry Global, Inc. 4.875% 7/15/26 (d) | 160,000 | 153,200 | |
| BWAY Holding Co. 7.875% 8/15/26 (d) | 645,000 | 649,031 | |
| Clydesdale Acquisition Holdings, Inc. 6.625% 4/15/29 (d) | 220,000 | 209,894 | |
| Graham Packaging Co., Inc. 7.125% 8/15/28 (d) | 885,000 | 761,198 | |
| Graphic Packaging International, Inc. 3.75% 2/1/30 (d) | 550,000 | 468,710 | |
| Intelligent Packaging Holdco I 9% 1/15/26 pay-in-kind (d)(h) | 1,066,000 | 754,462 | |
| Intelligent Packaging Ltd. Finco, Inc. 6% 9/15/28 (d) | 712,000 | 617,518 | |
| Owens-Brockway Glass Container, Inc. 6.375% 8/15/25 (d) | 650,000 | 640,814 | |
| Pactiv Evergreen Group Issuer, Inc. 4.375% 10/15/28 (d) | 375,000 | 321,678 | |
| Sealed Air Corp.: | |||
| 5% 4/15/29(d) | 1,020,000 | 931,445 | |
| 6.125% 2/1/28(d) | 510,000 | 502,325 | |
| 6.875% 7/15/33(d) | 425,000 | 432,565 | |
| Trident Holdings, Inc.: | |||
| 6.625% 11/1/25(d) | 150,000 | 138,000 | |
| 9.25% 8/1/24(d) | 450,000 | 444,487 | |
| TriMas Corp. 4.125% 4/15/29 (d) | 75,000 | 65,250 | |
| Trivium Packaging Finance BV: | |||
| 5.5% 8/15/26(d) | 344,000 | 325,080 | |
| 8.5% 8/15/27(d) | 912,000 | 866,309 | |
| 12,820,892 | |||
| Metals & Mining - 0.9% | |||
| Alcoa Nederland Holding BV 6.125% 5/15/28 (d) | 580,000 | 570,379 | |
| Arconic Corp.: | |||
| 6% 5/15/25(d) | 100,000 | 100,000 | |
| 6.125% 2/15/28(d) | 980,000 | 962,850 | |
| ATI, Inc.: | |||
| 4.875% 10/1/29 | 330,000 | 295,471 | |
| 5.125% 10/1/31 | 495,000 | 435,987 | |
| Big River Steel LLC/BRS Finance Corp. 6.625% 1/31/29 (d) | 1,706,000 | 1,659,100 | |
| Cleveland-Cliffs, Inc. 4.875% 3/1/31 (d) | 40,000 | 36,412 | |
| Commercial Metals Co.: | |||
| 3.875% 2/15/31 | 120,000 | 101,250 | |
| 4.125% 1/15/30 | 360,000 | 313,896 | |
| Compass Minerals International, Inc. 6.75% 12/1/27 (d) | 210,000 | 198,036 | |
| Constellium NV 5.875% 2/15/26 (d) | 145,000 | 141,593 | |
| Eldorado Gold Corp. 6.25% 9/1/29 (d) | 505,000 | 444,057 | |
| ERO Copper Corp. 6.5% 2/15/30 (d) | 870,000 | 736,238 | |
| First Quantum Minerals Ltd.: | |||
| 6.5% 3/1/24(d) | 746,000 | 738,540 | |
| 6.875% 10/15/27(d) | 335,000 | 313,434 | |
| 7.5% 4/1/25(d) | 506,000 | 491,073 | |
| FMG Resources Pty Ltd.: | |||
| 4.375% 4/1/31(d) | 100,000 | 84,513 | |
| 4.5% 9/15/27(d) | 325,000 | 299,000 | |
| 5.125% 5/15/24(d) | 80,000 | 79,000 | |
| 5.875% 4/15/30(d) | 725,000 | 682,428 | |
| Hecla Mining Co. 7.25% 2/15/28 | 1,850,000 | 1,800,839 | |
| HudBay Minerals, Inc.: | |||
| 4.5% 4/1/26(d) | 725,000 | 650,934 | |
| 6.125% 4/1/29(d) | 1,674,000 | 1,477,740 | |
| Kaiser Aluminum Corp.: | |||
| 4.5% 6/1/31(d) | 310,000 | 245,408 | |
| 4.625% 3/1/28(d) | 479,000 | 412,531 | |
| Mineral Resources Ltd. 8.5% 5/1/30 (d) | 345,000 | 345,417 | |
| New Gold, Inc. 7.5% 7/15/27 (d) | 320,000 | 275,722 | |
| Novelis Corp. 4.75% 1/30/30 (d) | 755,000 | 663,275 | |
| PMHC II, Inc. 9% 2/15/30 (d) | 365,000 | 282,766 | |
| Roller Bearing Co. of America, Inc. 4.375% 10/15/29 (d) | 740,000 | 639,619 | |
| 15,477,508 | |||
| Paper & Forest Products - 0.1% | |||
| Glatfelter Corp. 4.75% 11/15/29 (d) | 325,000 | 213,095 | |
| LABL, Inc.: | |||
| 5.875% 11/1/28(d) | 400,000 | 346,500 | |
| 8.25% 11/1/29(d) | 1,350,000 | 1,091,911 | |
| Mercer International, Inc. 5.125% 2/1/29 | 125,000 | 102,494 | |
| SPA Holdings 3 OY 4.875% 2/4/28 (d) | 380,000 | 322,716 | |
| 2,076,716 | |||
TOTAL MATERIALS | 54,168,915 | ||
| REAL ESTATE - 1.8% | |||
| Equity Real Estate Investment Trusts (REITs) - 1.0% | |||
| CTR Partnership LP/CareTrust Capital Corp. 3.875% 6/30/28 (d) | 675,000 | 573,532 | |
| Iron Mountain, Inc. 4.5% 2/15/31 (d) | 100,000 | 82,798 | |
| MGM Growth Properties Operating Partnership LP: | |||
| 3.875% 2/15/29(d) | 950,000 | 769,500 | |
| 5.75% 2/1/27 | 660,000 | 646,800 | |
| MPT Operating Partnership LP/MPT Finance Corp.: | |||
| 3.5% 3/15/31 | 1,255,000 | 860,252 | |
| 4.625% 8/1/29 | 430,000 | 321,425 | |
| 5% 10/15/27 | 2,195,000 | 1,801,720 | |
| Park Intermediate Holdings LLC 4.875% 5/15/29 (d) | 565,000 | 472,236 | |
| RHP Hotel Properties LP/RHP Finance Corp. 4.5% 2/15/29 (d) | 560,000 | 487,454 | |
| SBA Communications Corp. 3.125% 2/1/29 | 640,000 | 528,448 | |
| Senior Housing Properties Trust: | |||
| 4.375% 3/1/31 | 1,225,000 | 849,128 | |
| 4.75% 5/1/24 | 825,000 | 738,024 | |
| 9.75% 6/15/25 | 1,028,000 | 996,122 | |
| Uniti Group LP / Uniti Group Finance, Inc.: | |||
| 4.75% 4/15/28(d) | 1,230,000 | 975,021 | |
| 6.5% 2/15/29(d) | 3,680,000 | 2,410,419 | |
| 10.5% 2/15/28(d) | 615,000 | 615,123 | |
| Uniti Group, Inc.: | |||
| 6% 1/15/30(d) | 1,125,000 | 697,268 | |
| 7.875% 2/15/25(d) | 2,380,000 | 2,426,235 | |
| VICI Properties LP / VICI Note Co.: | |||
| 4.125% 8/15/30(d) | 195,000 | 168,438 | |
| 4.5% 1/15/28(d) | 975,000 | 896,350 | |
| 17,316,293 | |||
| Real Estate Management & Development - 0.8% | |||
| DTZ U.S. Borrower LLC 6.75% 5/15/28 (d) | 1,450,000 | 1,366,843 | |
| Five Point Operation Co. LP 7.875% 11/15/25 (d) | 1,169,000 | 1,055,287 | |
| Forestar Group, Inc. 3.85% 5/15/26 (d) | 1,375,000 | 1,203,300 | |
| Howard Hughes Corp.: | |||
| 4.125% 2/1/29(d) | 920,000 | 770,500 | |
| 4.375% 2/1/31(d) | 1,783,000 | 1,452,788 | |
| 5.375% 8/1/28(d) | 1,730,000 | 1,567,813 | |
| Hunt Companies, Inc. 5.25% 4/15/29 (d) | 1,175,000 | 939,242 | |
| Kennedy-Wilson, Inc. 4.75% 2/1/30 | 440,000 | 338,154 | |
| Mattamy Group Corp. 4.625% 3/1/30 (d) | 1,900,000 | 1,574,625 | |
| Realogy Group LLC/Realogy Co-Issuer Corp. 5.75% 1/15/29 (d) | 95,000 | 68,400 | |
| Realogy Group LLC/Realogy Co.-Issuer Corp. 5.25% 4/15/30 (d) | 110,000 | 75,350 | |
| Taylor Morrison Communities, Inc./Monarch Communities, Inc. 5.125% 8/1/30 (d) | 2,383,000 | 2,102,998 | |
| 12,515,300 | |||
TOTAL REAL ESTATE | 29,831,593 | ||
| UTILITIES - 1.8% | |||
| Electric Utilities - 1.0% | |||
| Clearway Energy Operating LLC: | |||
| 3.75% 2/15/31(d) | 425,000 | 345,844 | |
| 4.75% 3/15/28(d) | 165,000 | 151,421 | |
| DPL, Inc.: | |||
| 4.125% 7/1/25 | 250,000 | 234,832 | |
| 4.35% 4/15/29 | 35,000 | 30,275 | |
| FirstEnergy Corp. 3.4% 3/1/50 | 380,000 | 256,762 | |
| NRG Energy, Inc.: | |||
| 3.375% 2/15/29(d) | 195,000 | 158,332 | |
| 3.625% 2/15/31(d) | 1,540,000 | 1,194,080 | |
| 3.875% 2/15/32(d) | 575,000 | 445,936 | |
| 5.25% 6/15/29(d) | 1,597,000 | 1,421,330 | |
| Pattern Energy Operations LP 4.5% 8/15/28 (d) | 220,000 | 196,462 | |
| PG&E Corp.: | |||
| 5% 7/1/28 | 1,310,000 | 1,196,096 | |
| 5.25% 7/1/30 | 5,220,000 | 4,658,850 | |
| Vistra Operations Co. LLC: | |||
| 4.375% 5/1/29(d) | 1,725,000 | 1,490,052 | |
| 5% 7/31/27(d) | 1,627,000 | 1,511,410 | |
| 5.5% 9/1/26(d) | 205,000 | 195,794 | |
| 5.625% 2/15/27(d) | 2,072,000 | 1,963,469 | |
| 15,450,945 | |||
| Gas Utilities - 0.3% | |||
| AmeriGas Partners LP/AmeriGas Finance Corp.: | |||
| 5.75% 5/20/27 | 273,000 | 252,519 | |
| 5.875% 8/20/26 | 375,000 | 353,402 | |
| Ferrellgas LP/Ferrellgas Finance Corp.: | |||
| 5.375% 4/1/26(d) | 810,000 | 729,191 | |
| 5.875% 4/1/29(d) | 1,575,000 | 1,285,594 | |
| Suburban Propane Partners LP/Suburban Energy Finance Corp.: | |||
| 5% 6/1/31(d) | 1,050,000 | 873,716 | |
| 5.875% 3/1/27 | 210,000 | 199,491 | |
| Superior Plus LP / Superior General Partner, Inc. 4.5% 3/15/29 (d) | 1,555,000 | 1,350,797 | |
| 5,044,710 | |||
| Independent Power and Renewable Electricity Producers - 0.5% | |||
| Atlantica Sustainable Infrastructure PLC 4.125% 6/15/28 (d) | 515,000 | 454,530 | |
| Calpine Corp.: | |||
| 4.5% 2/15/28(d) | 615,000 | 553,698 | |
| 5% 2/1/31(d) | 685,000 | 563,640 | |
| 5.125% 3/15/28(d) | 7,074,000 | 6,275,691 | |
| TerraForm Global, Inc. 6.125% 3/1/26 (d) | 640,000 | 614,413 | |
| TransAlta Corp. 7.75% 11/15/29 | 205,000 | 209,552 | |
| 8,671,524 | |||
| Water Utilities - 0.0% | |||
| Solaris Midstream Holdings LLC 7.625% 4/1/26 (d) | 515,000 | 508,642 | |
TOTAL UTILITIES | 29,675,821 | ||
| TOTAL NONCONVERTIBLE BONDS | 665,906,091 | ||
| TOTAL CORPORATE BONDS (Cost $775,877,892) | 675,341,342 | ||
| U.S. Treasury Obligations - 1.5% | |||
Principal Amount (a) | Value ($) | ||
| U.S. Treasury Bills 3.6981% to 4.119% 3/23/23 (j) | 700,000 | 698,148 | |
| U.S. Treasury Notes: | |||
| 2.5% 3/31/27 (j)(k) | 13,080,000 | 12,199,144 | |
| 2.625% 5/31/27 | 10,130,000 | 9,479,860 | |
| 2.75% 4/30/27 | 2,175,000 | 2,047,134 | |
| 4.5% 11/30/24 | 1,615,000 | 1,603,329 | |
| TOTAL U.S. TREASURY OBLIGATIONS (Cost $27,252,732) | 26,027,615 | ||
| Municipal Securities - 0.1% | |||
Principal Amount (a) | Value ($) | ||
Puerto Rico Commonwealth Pub. Impt. Gen. Oblig. Series 2022, 0% 11/1/43 (h) (Cost $1,134,649) | 2,068,482 | 889,447 | |
| Common Stocks - 1.1% | |||
| Shares | Value ($) | ||
| COMMUNICATION SERVICES - 0.3% | |||
| Wireless Telecommunication Services - 0.3% | |||
| Intelsat Emergence SA (c) | 104,500 | 5,193,650 | |
| Intelsat Jackson Holdings SA: | |||
| Series A rights (c)(l) | 10,942 | 94,101 | |
| Series B rights (c)(l) | 10,942 | 346,752 | |
| 5,634,503 | |||
| ENERGY - 0.4% | |||
| Energy Equipment & Services - 0.1% | |||
| Jonah Energy Parent LLC (c)(l) | 29,131 | 1,344,978 | |
| Oil, Gas & Consumable Fuels - 0.3% | |||
| Chesapeake Energy Corp. | 21,570 | 1,743,072 | |
| Mesquite Energy, Inc. (c)(l) | 46,770 | 2,677,603 | |
| 4,420,675 | |||
TOTAL ENERGY | 5,765,653 | ||
| HEALTH CARE - 0.0% | |||
| Life Sciences Tools & Services - 0.0% | |||
| Avantor, Inc. (l) | 26,612 | 648,534 | |
| INFORMATION TECHNOLOGY - 0.0% | |||
| Electronic Equipment & Components - 0.0% | |||
| TE Connectivity Ltd. | 2,300 | 292,836 | |
| IT Services - 0.0% | |||
| GTT Communications, Inc. (c) | 24,499 | 302,572 | |
TOTAL INFORMATION TECHNOLOGY | 595,408 | ||
| MATERIALS - 0.3% | |||
| Chemicals - 0.2% | |||
| TPC Group, Inc. (b)(c) | 164,025 | 3,444,525 | |
| Metals & Mining - 0.1% | |||
| Constellium NV (l) | 41,600 | 665,184 | |
TOTAL MATERIALS | 4,109,709 | ||
| UTILITIES - 0.1% | |||
| Gas Utilities - 0.1% | |||
| Ferrellgas Partners LP Class B | 5,547 | 782,127 | |
| TOTAL COMMON STOCKS (Cost $10,550,357) | 17,535,934 | ||
| Convertible Preferred Stocks - 0.1% | |||
| Shares | Value ($) | ||
| HEALTH CARE - 0.1% | |||
| Health Care Equipment & Supplies - 0.1% | |||
| Becton, Dickinson & Co. 6.50% | 12,400 | 597,432 | |
| Life Sciences Tools & Services - 0.0% | |||
| Danaher Corp. Series B, 5.00% | 425 | 536,910 | |
TOTAL HEALTH CARE | 1,134,342 | ||
| UTILITIES - 0.0% | |||
| Electric Utilities - 0.0% | |||
| NextEra Energy, Inc. 5.279% | 16,050 | 760,770 | |
| TOTAL CONVERTIBLE PREFERRED STOCKS (Cost $1,929,698) | 1,895,112 | ||
| Bank Loan Obligations - 2.7% | |||
Principal Amount (a) | Value ($) | ||
| COMMUNICATION SERVICES - 0.3% | |||
| Diversified Telecommunication Services - 0.1% | |||
| GTT Communications BV 1LN, term loan: | |||
| 11.7176% 1/3/28 (h)(m) | 1,182,486 | 962,745 | |
| 13.6802% 6/3/28 (h)(m) | 929,048 | 473,814 | |
| 1,436,559 | |||
| Media - 0.1% | |||
| Diamond Sports Group LLC: | |||
| 1LN, term loan CME Term SOFR 1 Month Index + 8.000% 12.7755% 5/25/26 (h)(i)(m) | 1,869,743 | 1,741,984 | |
| 2LN, term loan CME Term SOFR 1 Month Index + 3.250% 8.0255% 8/24/26 (h)(i)(m) | 1,706,869 | 193,354 | |
| Gray Television, Inc. Tranche B, term loan 1 month U.S. LIBOR + 2.500% 7.0656% 1/2/26 (h)(i)(m) | 100,000 | 98,583 | |
| 2,033,921 | |||
| Wireless Telecommunication Services - 0.1% | |||
| Xplornet Communications, Inc.: | |||
| 1LN, term loan 1 month U.S. LIBOR + 4.000% 10/1/28 (i)(m)(n) | 1,577,030 | 1,308,083 | |
| 2LN, term loan 1 month U.S. LIBOR + 7.000% 9/30/29 (c)(i)(m)(n) | 375,000 | 240,000 | |
| 1,548,083 | |||
TOTAL COMMUNICATION SERVICES | 5,018,563 | ||
| CONSUMER DISCRETIONARY - 0.3% | |||
| Hotels, Restaurants & Leisure - 0.1% | |||
| City Football Group Ltd. Tranche B 1LN, term loan 1 month U.S. LIBOR + 3.000% 7.592% 7/21/28 (h)(i)(m) | 1,108,600 | 1,047,627 | |
| Household Durables - 0.1% | |||
| Sunset Debt Merger Sub, Inc. Tranche B 1LN, term loan 3 month U.S. LIBOR + 4.000% 9/17/28 (i)(m)(n) | 1,707,100 | 1,460,987 | |
| Internet & Direct Marketing Retail - 0.0% | |||
| Bass Pro Group LLC Tranche B 1LN, term loan 1 month U.S. LIBOR + 3.750% 8.3849% 3/5/28 (h)(i)(m) | 441,646 | 434,606 | |
| Specialty Retail - 0.1% | |||
| LBM Acquisition LLC Tranche B 1LN, term loan 1 month U.S. LIBOR + 3.750% 8.3849% 12/18/27 (h)(i)(m) | 1,091,648 | 995,790 | |
| Wand NewCo 3, Inc. Tranche B 1LN, term loan 1 month U.S. LIBOR + 3.000% 7.6349% 2/5/26 (h)(i)(m) | 593,959 | 571,192 | |
| 1,566,982 | |||
TOTAL CONSUMER DISCRETIONARY | 4,510,202 | ||
| ENERGY - 0.4% | |||
| Oil, Gas & Consumable Fuels - 0.4% | |||
| Ascent Resources - Utica LLC/ARU Finance Corp. 2LN, term loan 3 month U.S. LIBOR + 9.000% 11/1/25 (i)(m)(n) | 3,503,000 | 3,713,180 | |
| EG America LLC Tranche B 1LN, term loan 3 month U.S. LIBOR + 4.000% 8.7299% 2/6/25 (h)(i)(m) | 1,139,889 | 1,062,947 | |
| EG Finco Ltd. Tranche B, term loan 3 month U.S. LIBOR + 4.000% 9.1511% 2/6/25 (h)(i)(m) | 594,884 | 554,729 | |
| Mesquite Energy, Inc.: | |||
| 1LN, term loan 3 month U.S. LIBOR + 8.000% 0% (c)(f)(i)(m) | 864,602 | 0 | |
| term loan 3 month U.S. LIBOR + 0.000% 0% (c)(f)(i)(m) | 373,000 | 0 | |
| Prairie ECI Acquiror LP 1LN, term loan 1 month U.S. LIBOR + 4.750% 3/11/26 (i)(m)(n) | 685,000 | 674,437 | |
| 6,005,293 | |||
| FINANCIALS - 0.4% | |||
| Insurance - 0.4% | |||
| Alliant Holdings Intermediate LLC Tranche B5 1LN, term loan CME Term SOFR 1 Month Index + 3.500% 8.06% 2/13/27 (h)(i)(m) | 29,955 | 29,543 | |
| Asurion LLC Tranche B4 2LN, term loan 1 month U.S. LIBOR + 5.250% 9.8849% 1/20/29 (h)(i)(m) | 8,330,000 | 7,088,830 | |
| HUB International Ltd. Tranche B, term loan 3 month U.S. LIBOR + 3.000% 7.82% 4/25/25 (h)(i)(m) | 320,567 | 319,509 | |
| 7,437,882 | |||
| HEALTH CARE - 0.1% | |||
| Health Care Providers & Services - 0.1% | |||
| Cano Health, Inc. Tranche B 1LN, term loan CME Term SOFR 1 Month Index + 4.000% 8.7176% 11/23/27 (h)(i)(m) | 519,018 | 420,960 | |
| Da Vinci Purchaser Corp. Tranche B 1LN, term loan 1 month U.S. LIBOR + 4.000% 8.9534% 12/13/26 (h)(i)(m) | 54,304 | 51,747 | |
| Gainwell Acquisition Corp. Tranche B 1LN, term loan 3 month U.S. LIBOR + 4.000% 8.7299% 10/1/27 (h)(i)(m) | 145,000 | 139,599 | |
| 612,306 | |||
| Health Care Technology - 0.0% | |||
| Athenahealth Group, Inc.: | |||
| Tranche B 1LN, term loan CME Term SOFR 1 Month Index + 3.500% 8.0608% 2/15/29 (h)(i)(m) | 430,969 | 397,569 | |
| Tranche DD 1LN, term loan CME Term SOFR 1 Month Index + 3.500% 2/15/29 (i)(m)(o) | 52,811 | 48,718 | |
| 446,287 | |||
TOTAL HEALTH CARE | 1,058,593 | ||
| INDUSTRIALS - 0.3% | |||
| Airlines - 0.1% | |||
| AAdvantage Loyalty IP Ltd. Tranche B 1LN, term loan 3 month U.S. LIBOR + 4.750% 9.5577% 4/20/28 (h)(i)(m) | 915,000 | 936,420 | |
| Mileage Plus Holdings LLC Tranche B 1LN, term loan 3 month U.S. LIBOR + 5.250% 9.9959% 7/2/27 (h)(i)(m) | 909,000 | 945,587 | |
| 1,882,007 | |||
| Building Products - 0.0% | |||
| Acproducts Holdings, Inc. Tranche B 1LN, term loan 1 month U.S. LIBOR + 4.250% 8.9799% 5/17/28 (h)(i)(m) | 347,719 | 291,823 | |
| Commercial Services & Supplies - 0.1% | |||
| Brand Energy & Infrastructure Services, Inc. Tranche B, term loan 3 month U.S. LIBOR + 4.250% 9.0646% 6/21/24 (h)(i)(m) | 1,502,055 | 1,416,934 | |
| Intrado Corp. Tranche B 1LN, term loan CME Term SOFR 1 Month Index + 4.250% 1/25/30 (i)(m)(n) | 275,000 | 272,822 | |
| Neptune BidCo U.S., Inc. Tranche B 1LN, term loan CME Term SOFR 1 Month Index + 5.000% 9.735% 4/11/29 (h)(i)(m) | 440,000 | 403,700 | |
| 2,093,456 | |||
| Professional Services - 0.1% | |||
| CoreLogic, Inc. 2LN, term loan 0% 4/13/29 (h)(m) | 755,000 | 560,270 | |
| Nielsen Holdings PLC 2LN, term loan 3 month U.S. LIBOR + 0.000% 10/11/29 (c)(i)(m)(n) | 415,000 | 406,700 | |
| 966,970 | |||
TOTAL INDUSTRIALS | 5,234,256 | ||
| INFORMATION TECHNOLOGY - 0.8% | |||
| IT Services - 0.0% | |||
| Olympus Merger Sub, Inc. Tranche B3 1LN, term loan CME Term SOFR 1 Month Index + 4.000% 4% 4/10/27 (h)(i)(m) | 288,418 | 253,447 | |
| Verscend Holding Corp. Tranche B 1LN, term loan 1 month U.S. LIBOR + 4.000% 8.6349% 8/27/25 (h)(i)(m) | 174,024 | 173,620 | |
| 427,067 | |||
| Software - 0.8% | |||
| Ascend Learning LLC: | |||
| 2LN, term loan 1 month U.S. LIBOR + 5.750% 10.3849% 12/10/29 (h)(i)(m) | 1,630,000 | 1,413,014 | |
| Tranche B 1LN, term loan 1 month U.S. LIBOR + 3.500% 8.1176% 12/10/28 (h)(i)(m) | 1,251,896 | 1,173,477 | |
| Boxer Parent Co., Inc. Tranche B 2LN, term loan 1 month U.S. LIBOR + 5.500% 3/23/26 (i)(m)(n) | 380,000 | 369,314 | |
| Central Parent, Inc. 1LN, term loan CME TERM SOFR 3 MONTH INDEX + 4.500% 9.0802% 7/6/29 (h)(i)(m) | 130,000 | 129,500 | |
| Finastra U.S.A., Inc.: | |||
| Tranche 2LN, term loan 3 month U.S. LIBOR + 7.250% 12.0753% 6/13/25 (h)(i)(m) | 1,175,000 | 995,813 | |
| Tranche B 1LN, term loan 3 month U.S. LIBOR + 3.500% 8.3253% 6/13/24 (h)(i)(m) | 903,153 | 850,092 | |
| Proofpoint, Inc. 2LN, term loan 0% 5/27/29 (h)(m) | 340,000 | 326,400 | |
| RealPage, Inc. 2LN, term loan 1 month U.S. LIBOR + 0.000% 2/17/29 (i)(m)(n) | 750,000 | 719,063 | |
| Skillsoft Tranche B 1LN, term loan CME Term SOFR 1 Month Index + 4.750% 7/16/28 (i)(m)(n) | 1,900,425 | 1,633,682 | |
| Sophia LP Tranche B 1LN, term loan 3 month U.S. LIBOR + 3.500% 8.2299% 10/7/27 (h)(i)(m) | 115,000 | 113,107 | |
| Ultimate Software Group, Inc.: | |||
| 1LN, term loan 1 month U.S. LIBOR + 3.250% 8.0319% 5/3/26 (h)(i)(m) | 1,747,361 | 1,710,667 | |
| 2LN, term loan 3 month U.S. LIBOR + 5.250% 10.0319% 5/3/27 (h)(i)(m) | 2,784,807 | 2,703,574 | |
| 12,137,703 | |||
TOTAL INFORMATION TECHNOLOGY | 12,564,770 | ||
| MATERIALS - 0.0% | |||
| Chemicals - 0.0% | |||
| Consolidated Energy Finance SA Tranche B 1LN, term loan 3 month U.S. LIBOR + 3.500% 8.1349% 5/7/25 (c)(h)(i)(m) | 533,530 | 517,524 | |
| Discovery Purchaser Corp. 1LN, term loan CME TERM SOFR 3 MONTH INDEX + 4.370% 8.9625% 10/4/29 (h)(i)(m) | 340,000 | 324,884 | |
| 842,408 | |||
| Containers & Packaging - 0.0% | |||
| Clydesdale Acquisition Holdings, Inc. 1LN, term loan CME Term SOFR 1 Month Index + 4.170% 8.8926% 4/13/29 (h)(i)(m) | 77,675 | 76,504 | |
TOTAL MATERIALS | 918,912 | ||
| UTILITIES - 0.1% | |||
| Electric Utilities - 0.1% | |||
| Heritage Power LLC Tranche B 1LN, term loan 3 month U.S. LIBOR + 4.750% 6/28/26 (i)(m)(n) | 1,651,509 | 542,108 | |
| PG&E Corp. Tranche B 1LN, term loan 1 month U.S. LIBOR + 3.000% 7.6875% 6/23/25 (h)(i)(m) | 885,964 | 881,534 | |
| 1,423,642 | |||
| TOTAL BANK LOAN OBLIGATIONS (Cost $51,138,074) | 44,172,113 | ||
| Fixed-Income Funds - 51.6% | |||
| Shares | Value ($) | ||
| High Yield Fixed-Income Funds - 51.6% | |||
| Artisan High Income Fund Investor Shares | 25,601,503 | 221,196,949 | |
| BlackRock High Yield Bond Portfolio Class K | 18,830,334 | 127,104,752 | |
| Eaton Vance Income Fund of Boston Class A | 25,180,816 | 124,393,230 | |
| Fidelity Capital & Income Fund (p) | 16,800,256 | 154,562,357 | |
| MainStay High Yield Corporate Bond Fund Class A | 27,042,488 | 133,860,316 | |
| Vanguard High-Yield Corporate Fund Admiral Shares | 17,058,923 | 88,535,809 | |
| TOTAL FIXED-INCOME FUNDS (Cost $852,611,290) | 849,653,413 | ||
| Preferred Securities - 0.3% | |||
Principal Amount (a) | Value ($) | ||
| FINANCIALS - 0.0% | |||
| Banks - 0.0% | |||
| Citigroup, Inc. 3.875% (h)(q) | 25,000 | 22,457 | |
| UTILITIES - 0.3% | |||
| Independent Power and Renewable Electricity Producers - 0.3% | |||
| Vistra Corp.: | |||
| 7% (d)(h)(q) | 1,775,000 | 1,686,153 | |
| 8% (d)(h)(q) | 3,520,000 | 3,485,187 | |
| 5,171,340 | |||
| Multi-Utilities - 0.0% | |||
| NiSource, Inc. 5.65% (h)(q) | 470,000 | 461,151 | |
TOTAL UTILITIES | 5,632,491 | ||
| TOTAL PREFERRED SECURITIES (Cost $5,796,951) | 5,654,948 | ||
| Money Market Funds - 0.8% | |||
| Shares | Value ($) | ||
| Fidelity Cash Central Fund 4.63% (r) | 4,862,642 | 4,863,615 | |
| State Street Institutional U.S. Government Money Market Fund Premier Class 4.43% (s) | 8,299,209 | 8,299,209 | |
| TOTAL MONEY MARKET FUNDS (Cost $13,162,676) | 13,162,824 | ||
| TOTAL INVESTMENT IN SECURITIES - 99.2% (Cost $1,739,454,319) | 1,634,332,748 |
NET OTHER ASSETS (LIABILITIES) - 0.8% | 13,467,535 |
| NET ASSETS - 100.0% | 1,647,800,283 |
| Futures Contracts | |||||
Number of contracts | Expiration Date | Notional Amount ($) | Value ($) | Unrealized Appreciation/ (Depreciation) ($) | |
| Purchased | |||||
| Treasury Contracts | |||||
| CBOT 10-Year U.S. Treasury Note Contracts (United States) | 112 | Jun 2023 | 12,505,500 | (31,743) | (31,743) |
| CBOT 2-Year U.S. Treasury Note Contracts (United States) | 121 | Jun 2023 | 24,650,914 | (70,155) | (70,155) |
| CBOT 5-Year U.S. Treasury Note Contracts (United States) | 51 | Jun 2023 | 5,459,789 | (31,502) | (31,502) |
| TOTAL PURCHASED | (133,400) | ||||
| Sold | |||||
| Treasury Contracts | |||||
| CBOT Ultra Long Term U.S. Treasury Bond Contracts (United States) | 3 | Jun 2023 | 405,188 | 1,144 | 1,144 |
| TOTAL FUTURES CONTRACTS | (132,256) | ||||
| The notional amount of futures purchased as a percentage of Net Assets is 2.6% | |||||
| The notional amount of futures sold as a percentage of Net Assets is 0.0% | |||||
| Forward Foreign Currency Contracts | ||||||
Currency Purchased | Currency Sold | Counterparty | Settlement Date | Unrealized Appreciation/ (Depreciation) ($) | ||
| USD | 802,931 | GBP | 653,807 | Deutsche Bank AG | 4/21/23 | 15,754 |
| TOTAL FORWARD FOREIGN CURRENCY CONTRACTS | 15,754 | |||||
| Unrealized Appreciation | 15,754 | |||||
| Credit Default Swaps | ||||||||||
| Underlying Reference | Rating (1) | Maturity Date | Clearinghouse / Counterparty (2) | Fixed Payment Received/ (Paid) | Payment Frequency | Notional Amount (3)(4) | Value ($) (1) | Upfront Premium Received/ (Paid) ($) (5) | Unrealized Appreciation/ (Depreciation) ($) | |
| Buy Protection | ||||||||||
| 5-Year CDX N.A. HY Series 39 | Dec 2027 | ICE | (5%) | Quarterly | 29,714,922 | (1,357,244) | 0 | (1,357,244) | ||
| Sell Protection | ||||||||||
| 5-Year CDX N.A. HY Series 39 | NR | Dec 2027 | ICE | 5% | Quarterly | 1,400,000 | 9,670 | 0 | 9,670 | |
| Community Health Systems, Inc. | Caa3 | Dec 2026 | ICE | 5% | Quarterly | 484,000 | (108,296) | 0 | (108,296) | |
| TOTAL SELL PROTECTION | (98,626) | 0 | (98,626) | |||||||
| TOTAL CREDIT DEFAULT SWAPS | (1,455,870) | 0 | (1,455,870) | |||||||
| EUR | - | European Monetary Unit |
| GBP | - | British pound sterling |
| USD | - | U.S. dollar |
| (a) | Amount is stated in United States dollars unless otherwise noted. |
| (b) | Restricted securities (including private placements) - Investment in securities not registered under the Securities Act of 1933 (excluding 144A issues). At the end of the period, the value of restricted securities (excluding 144A issues) amounted to $9,589,440 or 0.6% of net assets. |
| (c) | Level 3 security |
| (d) | Security exempt from registration under Rule 144A of the Securities Act of 1933. These securities may be resold in transactions exempt from registration, normally to qualified institutional buyers. At the end of the period, the value of these securities amounted to $522,531,079 or 31.7% of net assets. |
| (e) | Security initially issued at one coupon which converts to a higher coupon at a specified date. The rate shown is the rate at period end. |
| (f) | Non-income producing - Security is in default. |
| (g) | Security or a portion of the security purchased on a delayed delivery or when-issued basis. |
| (h) | Coupon rates for floating and adjustable rate securities reflect the rates in effect at period end. |
| (i) | Coupon is indexed to a floating interest rate which may be multiplied by a specified factor and/or subject to caps or floors. |
| (j) | Security or a portion of the security was pledged to cover margin requirements for centrally cleared OTC swaps. At period end, the value of securities pledged amounted to $2,375,527. |
| (k) | Security or a portion of the security was pledged to cover margin requirements for futures contracts. At period end, the value of securities pledged amounted to $898,602. |
| (l) | Non-income producing |
| (m) | Remaining maturities of bank loan obligations may be less than the stated maturities shown as a result of contractual or optional prepayments by the borrower. Such prepayments cannot be predicted with certainty. |
| (n) | The coupon rate will be determined upon settlement of the loan after period end. |
| (o) | Position or a portion of the position represents an unfunded loan commitment. At period end, the total principal amount and market value of unfunded commitments totaled $57,723 and $53,249, respectively. |
| (p) | Affiliated Fund |
| (q) | Security is perpetual in nature with no stated maturity date. |
| (r) | Affiliated fund that is generally available only to investment companies and other accounts managed by Fidelity Investments. The rate quoted is the annualized seven-day yield of the fund at period end. A complete unaudited listing of the fund's holdings as of its most recent quarter end is available upon request. In addition, each Fidelity Central Fund's financial statements, which are not covered by the Fund's Report of Independent Registered Public Accounting Firm, are available on the SEC's website or upon request. |
| (s) | The rate quoted is the annualized seven-day yield of the fund at period end. |
| Additional information on each restricted holding is as follows: | ||
| Security | Acquisition Date | Acquisition Cost ($) |
| Mesquite Energy, Inc. 15% 7/15/23 | 7/10/20 - 1/18/22 | 368,047 |
| Mesquite Energy, Inc. 15% 7/15/23 | 11/05/20 - 1/18/22 | 635,565 |
| TPC Group, Inc. | 12/16/22 | 1,776,472 |
| Affiliate | Value, beginning of period ($) | Purchases ($) | Sales Proceeds ($) | Dividend Income ($) | Realized Gain (loss) ($) | Change in Unrealized appreciation (depreciation) ($) | Value, end of period ($) | % ownership, end of period |
| Fidelity Cash Central Fund 4.63% | 1,012,831 | 285,060,429 | 281,209,645 | 183,525 | - | - | 4,863,615 | 0.0% |
| Total | 1,012,831 | 285,060,429 | 281,209,645 | 183,525 | - | - | 4,863,615 | |
| Affiliate | Value, beginning of period ($) | Purchases ($) | Sales Proceeds ($) | Dividend Income ($) | Realized Gain (loss) ($) | Change in Unrealized appreciation (depreciation) ($) | Value, end of period ($) |
| Fidelity Capital & Income Fund | 504,966,112 | 25,338,062 | 327,058,881 | 25,337,265 | (5,687,006) | (42,995,930) | 154,562,357 |
| 504,966,112 | 25,338,062 | 327,058,881 | 25,337,265 | (5,687,006) | (42,995,930) | 154,562,357 |
| Valuation Inputs at Reporting Date: | ||||
| Description | Total ($) | Level 1 ($) | Level 2 ($) | Level 3 ($) |
Investments in Securities: | ||||
| Equities: | ||||
Communication Services | 5,634,503 | - | - | 5,634,503 |
Energy | 5,765,653 | 1,743,072 | - | 4,022,581 |
Health Care | 1,782,876 | 648,534 | 1,134,342 | - |
Information Technology | 595,408 | 292,836 | - | 302,572 |
Materials | 4,109,709 | 665,184 | - | 3,444,525 |
Utilities | 1,542,897 | 782,127 | 760,770 | - |
| Corporate Bonds | 675,341,342 | - | 669,196,426 | 6,144,916 |
| U.S. Government and Government Agency Obligations | 26,027,615 | - | 26,027,615 | - |
| Municipal Securities | 889,447 | - | 889,447 | - |
| Bank Loan Obligations | 44,172,113 | - | 43,007,889 | 1,164,224 |
| Fixed-Income Funds | 849,653,413 | 849,653,413 | - | - |
| Preferred Securities | 5,654,948 | - | 5,654,948 | - |
| Money Market Funds | 13,162,824 | 13,162,824 | - | - |
| Total Investments in Securities: | 1,634,332,748 | 866,947,990 | 746,671,437 | 20,713,321 |
Derivative Instruments: | ||||
| Assets | ||||
Futures Contracts | 1,144 | 1,144 | - | - |
Forward Foreign Currency Contracts | 15,754 | - | 15,754 | - |
Swaps | 9,670 | - | 9,670 | - |
| Total Assets | 26,568 | 1,144 | 25,424 | - |
| Liabilities | ||||
Futures Contracts | (133,400) | (133,400) | - | - |
Swaps | (1,465,540) | - | (1,465,540) | - |
| Total Liabilities | (1,598,940) | (133,400) | (1,465,540) | - |
| Total Derivative Instruments: | (1,572,372) | (132,256) | (1,440,116) | - |
| Investments in Securities: | |||
| Beginning Balance | $ | 14,647,753 | |
| Net Realized Gain (Loss) on Investment Securities | (80,429) | ||
| Net Unrealized Gain (Loss) on Investment Securities | 3,626,204 | ||
| Cost of Purchases | 2,777,120 | ||
| Proceeds of Sales | (590,705) | ||
| Amortization/Accretion | 7,565 | ||
| Transfers into Level 3 | 325,813 | ||
| Transfers out of Level 3 | - | ||
| Ending Balance | $ | 20,713,321 | |
| The change in unrealized gain (loss) for the period attributable to Level 3 securities held at February 28, 2023 | $ | 3,626,230 | |
| The information used in the above reconciliation represents fiscal year to date activity for any Investments in Securities identified as using Level 3 inputs at either the beginning or the end of the current fiscal period. Cost of purchases and proceeds of sales may include securities received and/or delivered through in-kind transactions. Transfers into Level 3 were attributable to a lack of observable market data resulting from decreases in market activity, decreases in liquidity, security restructurings or corporate actions. Transfers out of Level 3 were attributable to observable market data becoming available for those securities. Transfers in or out of Level 3 represent the beginning value of any Security or Instrument where a change in the pricing level occurred from the beginning to the end of the period. The cost of purchases and the proceeds of sales may include securities received or delivered through corporate actions or exchanges. Realized and unrealized gains (losses) disclosed in the reconciliation are included in Net Gain (Loss) on the Fund's Statement of Operations. | |||
Primary Risk Exposure / Derivative Type | Value | |
| Asset ($) | Liability ($) | |
| Credit Risk | ||
Swaps (a) | 9,670 | (1,465,540) |
| Total Credit Risk | 9,670 | (1,465,540) |
| Foreign Exchange Risk | ||
Forward Foreign Currency Contracts (b) | 15,754 | 0 |
| Total Foreign Exchange Risk | 15,754 | 0 |
| Interest Rate Risk | ||
Futures Contracts (c) | 1,144 | (133,400) |
| Total Interest Rate Risk | 1,144 | (133,400) |
| Total Value of Derivatives | 26,568 | (1,598,940) |
| Statement of Assets and Liabilities | ||||
| February 28, 2023 | ||||
| Assets | ||||
| Investment in securities, at value - See accompanying schedule: | ||||
Unaffiliated issuers (cost $1,601,043,364) | $ | 1,474,906,776 | ||
Fidelity Central Funds (cost $4,863,470) | 4,863,615 | |||
Other affiliated issuers (cost $133,547,485) | 154,562,357 | |||
| Total Investment in Securities (cost $1,739,454,319) | $ | 1,634,332,748 | ||
| Cash | 1,204,879 | |||
| Foreign currency held at value (cost $2,787) | 2,787 | |||
| Receivable for investments sold | 3,258,090 | |||
| Unrealized appreciation on forward foreign currency contracts | 15,754 | |||
| Receivable for fund shares sold | 550,741 | |||
| Dividends receivable | 21,178 | |||
| Interest receivable | 12,867,737 | |||
| Distributions receivable from Fidelity Central Funds | 23,418 | |||
| Receivable for daily variation margin on futures contracts | 276,327 | |||
| Other receivables | 50,050 | |||
Total assets | 1,652,603,709 | |||
| Liabilities | ||||
| Payable for investments purchased | ||||
Regular delivery | $ | 2,486,585 | ||
Delayed delivery | 1,208,960 | |||
| Payable for fund shares redeemed | 732,384 | |||
| Distributions payable | 48,347 | |||
| Accrued management fee | 223,162 | |||
| Payable for daily variation margin on centrally cleared OTC swaps | 818 | |||
| Other payables and accrued expenses | 103,170 | |||
| Total Liabilities | 4,803,426 | |||
| Net Assets | $ | 1,647,800,283 | ||
| Net Assets consist of: | ||||
| Paid in capital | $ | 1,930,186,177 | ||
| Total accumulated earnings (loss) | (282,385,894) | |||
| Net Assets | $ | 1,647,800,283 | ||
Net Asset Value , offering price and redemption price per share ($1,647,800,283 ÷ 199,270,678 shares) | $ | 8.27 | ||
| Statement of Operations | ||||
Year ended February 28, 2023 | ||||
| Investment Income | ||||
| Dividends: | ||||
| Unaffiliated issuers | $ | 55,975,899 | ||
| Affiliated issuers | 10,494,118 | |||
| Interest | 67,680,474 | |||
| Income from Fidelity Central Funds | 183,525 | |||
| Total Income | 134,334,016 | |||
| Expenses | ||||
| Management fee | $ | 8,725,519 | ||
| Custodian fees and expenses | 31,173 | |||
| Independent trustees' fees and expenses | 15,751 | |||
| Registration fees | 41,273 | |||
| Audit | 50,972 | |||
| Legal | 231,602 | |||
| Miscellaneous | 23,491 | |||
| Total expenses before reductions | 9,119,781 | |||
| Expense reductions | (5,474,051) | |||
| Total expenses after reductions | 3,645,730 | |||
| Net Investment income (loss) | 130,688,286 | |||
| Realized and Unrealized Gain (Loss) | ||||
| Net realized gain (loss) on: | ||||
| Investment Securities: | ||||
| Unaffiliated issuers | (146,021,081) | |||
| Affiliated issuers | (5,687,006) | |||
| Forward foreign currency contracts | 405,107 | |||
| Foreign currency transactions | (45,712) | |||
| Futures contracts | (5,820,165) | |||
| Swaps | 2,263,542 | |||
| Capital gain distributions from underlying funds: | ||||
| Unaffiliated issuers | 1,429,442 | |||
| Affiliated issuers | 14,843,147 | |||
| Total net realized gain (loss) | (138,632,726) | |||
| Change in net unrealized appreciation (depreciation) on: | ||||
| Investment Securities: | ||||
| Unaffiliated issuers | (154,033,723) | |||
| Affiliated issuers | (42,995,930) | |||
| Forward foreign currency contracts | (20,125) | |||
| Assets and liabilities in foreign currencies | (51,580) | |||
| Futures contracts | (735,311) | |||
| Swaps | (1,493,638) | |||
| Total change in net unrealized appreciation (depreciation) | (199,330,307) | |||
| Net gain (loss) | (337,963,033) | |||
| Net increase (decrease) in net assets resulting from operations | $ | (207,274,747) | ||
| Statement of Changes in Net Assets | ||||
Year ended February 28, 2023 | Year ended February 28, 2022 | |||
| Increase (Decrease) in Net Assets | ||||
| Operations | ||||
| Net investment income (loss) | $ | 130,688,286 | $ | 285,882,081 |
| Net realized gain (loss) | (138,632,726) | 107,535,532 | ||
| Change in net unrealized appreciation (depreciation) | (199,330,307) | (224,312,910) | ||
| Net increase (decrease) in net assets resulting from operations | (207,274,747) | 169,104,703 | ||
| Distributions to shareholders | (124,387,863) | (310,897,061) | ||
| Share transactions | ||||
| Proceeds from sales of shares | 183,183,822 | 765,129,942 | ||
| Reinvestment of distributions | 123,643,674 | 308,906,328 | ||
| Cost of shares redeemed | (2,485,776,576) | (3,977,874,695) | ||
Net increase (decrease) in net assets resulting from share transactions | (2,178,949,080) | (2,903,838,425) | ||
| Total increase (decrease) in net assets | (2,510,611,690) | (3,045,630,783) | ||
| Net Assets | ||||
| Beginning of period | 4,158,411,973 | 7,204,042,756 | ||
| End of period | $ | 1,647,800,283 | $ | 4,158,411,973 |
| Other Information | ||||
| Shares | ||||
| Sold | 21,455,480 | 79,497,393 | ||
| Issued in reinvestment of distributions | 14,620,666 | 32,119,064 | ||
| Redeemed | (286,484,971) | (414,020,862) | ||
| Net increase (decrease) | (250,408,825) | (302,404,405) | ||
| Strategic Advisers® Income Opportunities Fund |
| Years ended February 28, | 2023 | 2022 | 2021 | 2020 A | 2019 | |||||
Selected Per-Share Data | ||||||||||
| Net asset value, beginning of period | $ | 9.25 | $ | 9.58 | $ | 9.32 | $ | 9.34 | $ | 9.53 |
| Income from Investment Operations | ||||||||||
Net investment income (loss) B,C | .508 | .440 | .473 | .515 | .513 | |||||
| Net realized and unrealized gain (loss) | (1.000) | (.279) | .241 | (.001) | (.222) | |||||
| Total from investment operations | (.492) | .161 | .714 | .514 | .291 | |||||
| Distributions from net investment income | (.488) | (.461) | (.454) | (.530) | (.469) | |||||
| Distributions from net realized gain | - | (.030) | - | (.004) | (.012) | |||||
| Total distributions | (.488) | (.491) | (.454) | (.534) | (.481) | |||||
| Net asset value, end of period | $ | 8.27 | $ | 9.25 | $ | 9.58 | $ | 9.32 | $ | 9.34 |
Total Return D | (5.25)% | 1.61% | 8.05% | 5.57% | 3.21% | |||||
Ratios to Average Net Assets C,E,F | ||||||||||
| Expenses before reductions | .42% | .38% | .39% | .34% | .36% | |||||
| Expenses net of fee waivers, if any | .17% | .13% | .14% | .09% | .11% | |||||
| Expenses net of all reductions | .17% | .13% | .14% | .09% | .11% | |||||
| Net investment income (loss) | 5.96% | 4.57% | 5.10% | 5.44% | 5.49% | |||||
| Supplemental Data | ||||||||||
| Net assets, end of period (000 omitted) | $ | 1,647,800 | $ | 4,158,412 | $ | 7,204,043 | $ | 2,042,054 | $ | 2,642,485 |
Portfolio turnover rate G | 21% | 33% | 43% | 40% | 22% |
| Asset Type | Fair Value | Valuation Technique(s) | Unobservable Input | Amount or Range/Weighted Average | Impact to Valuation from an Increase in Input A |
| Equities | $13,404,181 | Market comparable | Enterprise value/EBITADA multiple (EV/EBITDA | 2.2 - 5.8 / 4.4 | Increase |
| Daily production multiple ($/Barrels of oil equivalent per day) | $18,250.00 | Increase | |||
| Enterprise value/PV-10 multiple (EV/PV-10) | 0.7 | Increase | |||
| Enterprise value/Proved reserves multiple (EV/PR) | 4.7 | Increase | |||
| Market approach | Parity price | $12.35 | Increase | ||
| Discounted cash flow | Discount rate | 8.0% - 10.0% / 8.6% | Decrease | ||
| Reserve risk rate | 50.0% - 95.0% / 72.5% | Increase | |||
| Corporate Bonds | $6,144,916 | Market comparable | Enterprise value/EBITDA multiple (EV/EBITDA) | 2.2 | Increase |
| Daily production multiple ($/Barrels of oil equivalent per day) | $18,250.00 | Increase | |||
| Enterprise value/PV-10 multiple (EV/PV-10) | 0.7 | Increase | |||
| Enterprise value/Proved reserves multiple (EV/PR) | 4.7 | Increase | |||
| Recovery value | Recovery value | $0.00 | Increase | ||
| Discounted cash flow | Discount rate | 10.0% | Decrease | ||
| Reserve risk rate | 50.0% - 95.0% / 72.5% | Increase | |||
| Bank Loan Obligations | $1,164,224 | Recovery value | Recovery value | $0.00 | Increase |
| Indicative market price | Evaluated bid | $64.00 - $98.00 / $90.55 | Increase |
| Strategic Advisers Income Opportunities Fund | $49,789 |
| Gross unrealized appreciation | $45,662,317 |
| Gross unrealized depreciation | (149,183,708) |
| Net unrealized appreciation (depreciation) | $(103,521,391) |
| Tax Cost | $1,736,865,284 |
| Capital loss carryforward | $(174,679,021) |
| Net unrealized appreciation (depreciation) on securities and other investments | $(103,521,154) |
| Short-term | $(43,005,176) |
| Long-term | (131,673,845) |
| Total capital loss carryforward | $(174,679,021) |
| February 28, 2023 | February 28, 2022 | |
| Ordinary Income | $124,387,863 | $310,897,061 |
| Credit Risk | Credit risk relates to the ability of the issuer of a financial instrument to make further principal or interest payments on an obligation or commitment that it has to a fund. |
| Foreign Exchange Risk | Foreign exchange rate risk relates to fluctuations in the value of an asset or liability due to changes in currency exchange rates. |
| Interest Rate Risk | Interest rate risk relates to the fluctuations in the value of interest-bearing securities due to changes in the prevailing levels of market interest rates. |
| Primary Risk Exposure / Derivative Type | Net Realized Gain (Loss) | Change in Net Unrealized Appreciation (Depreciation) |
| Strategic Advisers Income Opportunities Fund | ||
| Credit Risk | ||
| Swaps | 2,263,542 | (1,493,638) |
| Total Credit Risk | 2,263,542 | (1,493,638) |
| Foreign Exchange Risk | ||
| Forward Foreign Currency Contracts | 405,107 | (20,125) |
| Total Foreign Exchange Risk | 405,107 | (20,125) |
| Interest Rate Risk | ||
| Futures Contracts | (5,820,165) | (735,311) |
| Total Interest Rate Risk | (5,820,165) | (735,311) |
| Totals | $(3,151,516) | $(2,249,074) |
| Purchases ($) | Sales ($) | |
| Strategic Advisers Income Opportunities Fund | 424,687,727 | 2,590,807,825 |
| Amount | |
| Strategic Advisers Income Opportunities Fund | $6 |
| Fidelity Central Fund | Investment Manager | Investment Objective | Investment Practices | Expense Ratio A |
| Fidelity Money Market Central Funds | Fidelity Management & Research Company LLC (FMR) | Each fund seeks to obtain a high level of current income consistent with the preservation of capital and liquidity. | Short-term Investments | Less than .005% |
| Amount | |
| Strategic Advisers Income Opportunities Fund | $4,874 |
| The Example is based on an investment of $1,000 invested at the beginning of the period and held for the entire period (September 1, 2022 to February 28, 2023). |
Annualized Expense Ratio- A | Beginning Account Value September 1, 2022 | Ending Account Value February 28, 2023 | Expenses Paid During Period- C September 1, 2022 to February 28, 2023 | |||||||
| Strategic Advisers® Income Opportunities Fund | .18% | |||||||||
| Actual | $ 1,000 | $ 1,019.90 | $ .90 | |||||||
Hypothetical- B | $ 1,000 | $ 1,023.90 | $ .90 | |||||||
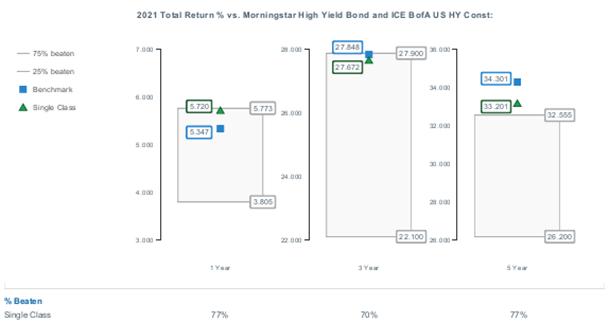
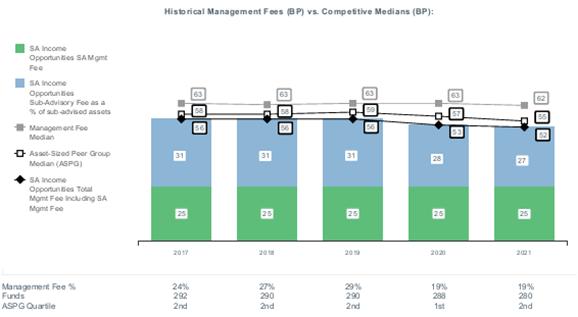
- Highly liquid investments - cash or convertible to cash within three business days or less
- Moderately liquid investments - convertible to cash in three to seven calendar days
- Less liquid investments - can be sold or disposed of, but not settled, within seven calendar days
- Illiquid investments - cannot be sold or disposed of within seven calendar days
 |


Contents
| Average Annual Total Returns | |||
Periods ended February 28, 2023 | Past 1 year | Past 5 years | Past 10 years |
| Strategic Advisers® Small-Mid Cap Fund | -6.19% | 7.30% | 9.46% |
| $10,000 Over 10 Years |
Let's say hypothetically that $10,000 was invested in Strategic Advisers® Small-Mid Cap Fund on February 28, 2013. The chart shows how the value of your investment would have changed, and also shows how the Russell 2500™ Index performed over the same period. |
 |
Top Holdings (% of Fund's net assets) | ||
| (excluding cash equivalents) | ||
| Fidelity Advisor Small Cap Growth Fund Class Z | 5.6 | |
| Fidelity SAI Small-Mid Cap 500 Index Fund | 5.6 | |
| T. Rowe Price Institutional Small-Cap Stock Fund | 3.5 | |
| PIMCO StocksPLUS Small Fund Institutional Class | 2.0 | |
| Fidelity Small Cap Index Fund | 1.1 | |
| Fidelity SAI Real Estate Index Fund | 1.0 | |
| LPL Financial | 0.7 | |
| Alight, Inc. Class A | 0.6 | |
| LKQ Corp. | 0.6 | |
| Berry Global Group, Inc. | 0.6 | |
| 21.3 | ||
| Market Sectors (% of Fund's net assets) | ||
| (Stocks Only) | ||
| Industrials | 17.5 | |
| Information Technology | 13.5 | |
| Financials | 11.4 | |
| Consumer Discretionary | 10.7 | |
| Health Care | 10.2 | |
| Materials | 4.4 | |
| Consumer Staples | 3.3 | |
| Energy | 2.9 | |
| Real Estate | 2.7 | |
| Communication Services | 1.8 | |
| Utilities | 0.9 | |
Asset Allocation (% of Fund's net assets) |
 |
| Common Stocks - 79.3% | |||
| Shares | Value ($) | ||
| COMMUNICATION SERVICES - 1.8% | |||
| Diversified Telecommunication Services - 0.0% | |||
| EchoStar Holding Corp. Class A (a)(b) | 28,566 | 570,177 | |
| Liberty Latin America Ltd.: | |||
| Class A (a) | 249,772 | 2,202,989 | |
| Class C (a) | 114,804 | 1,007,979 | |
| 3,781,145 | |||
| Entertainment - 0.2% | |||
| IMAX Corp. (a) | 85,400 | 1,574,776 | |
| Liberty Media Corp. Liberty Formula One Series C (a) | 24,600 | 1,669,602 | |
| Live Nation Entertainment, Inc. (a)(b) | 26,744 | 1,927,173 | |
| Madison Square Garden Sports Corp. | 57,552 | 11,000,489 | |
| Sciplay Corp. (A Shares) (a) | 19,188 | 317,370 | |
| Take-Two Interactive Software, Inc. (a) | 26,462 | 2,898,912 | |
| 19,388,322 | |||
| Interactive Media & Services - 1.0% | |||
| CarGurus, Inc. Class A (a) | 795,734 | 13,567,265 | |
| Eventbrite, Inc. (a) | 668,517 | 5,856,209 | |
| Meta Platforms, Inc. Class A (a) | 29,398 | 5,142,886 | |
| QuinStreet, Inc. (a) | 88,797 | 1,506,885 | |
| Shutterstock, Inc. | 45,900 | 3,452,598 | |
| TrueCar, Inc. (a) | 402,426 | 937,653 | |
| Yelp, Inc. (a) | 184,221 | 5,530,314 | |
| Ziff Davis, Inc. (a) | 388,448 | 30,679,623 | |
| ZipRecruiter, Inc. (a)(b) | 577,513 | 9,852,372 | |
| 76,525,805 | |||
| Media - 0.6% | |||
| AMC Networks, Inc. Class A (a) | 69,600 | 1,556,256 | |
| Audacy, Inc. Class A (a) | 387,100 | 83,227 | |
| Cable One, Inc. (b) | 4,446 | 3,070,452 | |
| Criteo SA sponsored ADR (a) | 246,902 | 8,184,801 | |
| iHeartMedia, Inc. (a) | 67,610 | 490,849 | |
| Interpublic Group of Companies, Inc. (b) | 91,069 | 3,236,592 | |
| John Wiley & Sons, Inc. Class A | 58,049 | 2,582,600 | |
| Nexstar Broadcasting Group, Inc. Class A (b) | 96,153 | 17,874,843 | |
| Paramount Global Class B (b) | 79,100 | 1,694,322 | |
| Sirius XM Holdings, Inc. (b) | 157,176 | 690,003 | |
| TEGNA, Inc. | 343,833 | 5,982,694 | |
| The New York Times Co. Class A | 26,800 | 1,031,800 | |
| Thryv Holdings, Inc. (a) | 24,893 | 593,449 | |
| 47,071,888 | |||
TOTAL COMMUNICATION SERVICES | 146,767,160 | ||
| CONSUMER DISCRETIONARY - 10.7% | |||
| Auto Components - 0.8% | |||
| Adient PLC (a) | 55,766 | 2,382,324 | |
| Autoliv, Inc. | 54,930 | 5,085,419 | |
| BorgWarner, Inc. | 133,700 | 6,722,436 | |
| Dana, Inc. (b) | 297,549 | 4,713,176 | |
| Fox Factory Holding Corp. (a) | 26,754 | 3,143,595 | |
| Gentex Corp. | 191,172 | 5,457,961 | |
| LCI Industries (b) | 108,240 | 12,210,554 | |
| Lear Corp. | 54,954 | 7,674,326 | |
| Modine Manufacturing Co. (a) | 195,446 | 4,770,837 | |
| Standard Motor Products, Inc. | 51,589 | 2,010,423 | |
| The Goodyear Tire & Rubber Co. (a) | 850,869 | 9,665,872 | |
| 63,836,923 | |||
| Automobiles - 0.1% | |||
| Harley-Davidson, Inc. | 132,600 | 6,305,130 | |
| Winnebago Industries, Inc. | 34,600 | 2,199,176 | |
| 8,504,306 | |||
| Distributors - 0.9% | |||
| LKQ Corp. | 882,857 | 50,578,878 | |
| Pool Corp. (b) | 67,938 | 24,244,355 | |
| 74,823,233 | |||
| Diversified Consumer Services - 1.1% | |||
| ADT, Inc. | 785,045 | 5,919,239 | |
| American Public Education, Inc. (a) | 111,341 | 1,229,205 | |
| Bright Horizons Family Solutions, Inc. (a) | 183,530 | 14,469,505 | |
| Carriage Services, Inc. | 10,393 | 352,531 | |
| Frontdoor, Inc. (a)(b) | 885,049 | 25,002,634 | |
| Grand Canyon Education, Inc. (a) | 136,742 | 15,491,501 | |
| Laureate Education, Inc. Class A | 381,376 | 4,523,119 | |
| Perdoceo Education Corp. (a) | 55,031 | 758,602 | |
| Service Corp. International | 157,361 | 10,626,588 | |
| Stride, Inc. (a)(b) | 115,971 | 4,925,288 | |
| WW International, Inc. (a)(b) | 43,445 | 159,009 | |
| 83,457,221 | |||
| Hotels, Restaurants & Leisure - 2.3% | |||
| ARAMARK Holdings Corp. | 72,800 | 2,679,040 | |
| Bloomin' Brands, Inc. | 280,866 | 7,330,603 | |
| Bowlero Corp. Class A (a)(b) | 496,236 | 7,632,110 | |
| Boyd Gaming Corp. | 52,074 | 3,391,580 | |
| Brinker International, Inc. (a) | 13,100 | 497,800 | |
| Churchill Downs, Inc. | 98,747 | 24,270,038 | |
| Dine Brands Global, Inc. (b) | 93,290 | 7,152,544 | |
| Domino's Pizza, Inc. | 7,300 | 2,146,273 | |
| Expedia, Inc. (a) | 58,380 | 6,361,669 | |
| Full House Resorts, Inc. (a) | 96,867 | 937,673 | |
| Genius Sports Ltd. (a) | 1,205,670 | 5,835,443 | |
| Hilton Grand Vacations, Inc. (a) | 203,433 | 9,711,891 | |
| International Game Technology PLC | 184,350 | 4,896,336 | |
| Krispy Kreme, Inc. (b) | 271,738 | 3,535,311 | |
| Kura Sushi U.S.A., Inc. Class A (a)(b) | 198,051 | 12,401,954 | |
| Papa John's International, Inc. (b) | 73,527 | 6,172,592 | |
| Penn Entertainment, Inc. (a) | 30,200 | 922,006 | |
| Planet Fitness, Inc. (a)(b) | 223,797 | 18,138,747 | |
| Sportradar Holding AG (a)(b) | 442,593 | 5,408,486 | |
| Texas Roadhouse, Inc. Class A | 80,666 | 8,190,826 | |
| TH International Ltd. (a)(b) | 283,645 | 1,344,477 | |
| Travel+Leisure Co. | 111,877 | 4,693,240 | |
| Vail Resorts, Inc. | 79,477 | 18,557,085 | |
| Wendy's Co. (b) | 471,990 | 10,364,900 | |
| Wingstop, Inc. (b) | 47,498 | 8,091,284 | |
| Wyndham Hotels & Resorts, Inc. | 36,500 | 2,811,230 | |
| 183,475,138 | |||
| Household Durables - 1.1% | |||
| Cavco Industries, Inc. (a) | 6,726 | 1,916,910 | |
| Ethan Allen Interiors, Inc. (b) | 16,171 | 477,853 | |
| KB Home | 197,049 | 6,949,918 | |
| La-Z-Boy, Inc. (b) | 123,103 | 3,986,075 | |
| Mohawk Industries, Inc. (a) | 64,123 | 6,595,051 | |
| NVR, Inc. (a) | 667 | 3,450,805 | |
| PulteGroup, Inc. | 527,889 | 28,859,692 | |
| Skyline Champion Corp. (a) | 72,951 | 4,990,578 | |
| Sony Group Corp. sponsored ADR | 41,020 | 3,428,452 | |
| Taylor Morrison Home Corp. (a) | 185,436 | 6,644,172 | |
| Tempur Sealy International, Inc. (b) | 216,948 | 9,272,358 | |
| Toll Brothers, Inc. | 84,351 | 5,055,999 | |
| Whirlpool Corp. (b) | 28,700 | 3,960,026 | |
| 85,587,889 | |||
| Internet & Direct Marketing Retail - 0.2% | |||
| CarParts.com, Inc. (a)(b) | 832,644 | 5,220,678 | |
| Etsy, Inc. (a) | 1,100 | 133,551 | |
| Farfetch Ltd. Class A (a)(b) | 754,038 | 3,868,215 | |
| Lyft, Inc. (a) | 265,970 | 2,659,700 | |
| PetMed Express, Inc. (b) | 15,424 | 289,663 | |
| Qurate Retail, Inc. Series A (a) | 261,800 | 552,398 | |
| Revolve Group, Inc. (a)(b) | 199,762 | 5,409,555 | |
| 18,133,760 | |||
| Leisure Products - 0.5% | |||
| Brunswick Corp. | 180,900 | 15,814,278 | |
| JAKKS Pacific, Inc. (a) | 59,045 | 1,141,930 | |
| Malibu Boats, Inc. Class A (a) | 58,884 | 3,518,908 | |
| Polaris, Inc. (b) | 57,461 | 6,536,189 | |
| Sturm, Ruger & Co., Inc. | 13,509 | 787,169 | |
| Topgolf Callaway Brands Corp. (a)(b) | 461,326 | 10,693,537 | |
| 38,492,011 | |||
| Multiline Retail - 0.1% | |||
| Dillard's, Inc. Class A (b) | 2,859 | 1,018,976 | |
| Kohl's Corp. | 94,900 | 2,660,996 | |
| Macy's, Inc. | 125,000 | 2,557,500 | |
| 6,237,472 | |||
| Specialty Retail - 2.4% | |||
| Academy Sports & Outdoors, Inc. (b) | 83,884 | 4,961,739 | |
| Advance Auto Parts, Inc. | 92,498 | 13,408,510 | |
| America's Car Mart, Inc. (a) | 5,158 | 438,224 | |
| Aritzia, Inc. (a) | 5,666 | 174,230 | |
| Aritzia, Inc. (a) | 30,522 | 929,193 | |
| Asbury Automotive Group, Inc. (a) | 21,556 | 4,895,368 | |
| AutoNation, Inc. (a) | 27,321 | 3,729,590 | |
| Bath & Body Works, Inc. | 171,220 | 6,997,761 | |
| Boot Barn Holdings, Inc. (a) | 22,275 | 1,725,199 | |
| Burlington Stores, Inc. (a) | 105,325 | 22,565,881 | |
| Caleres, Inc. (b) | 143,061 | 3,735,323 | |
| Five Below, Inc. (a) | 88,742 | 18,129,991 | |
| Floor & Decor Holdings, Inc. Class A (a)(b) | 39,603 | 3,635,951 | |
| Foot Locker, Inc. | 246,426 | 10,773,745 | |
| Group 1 Automotive, Inc. (b) | 18,026 | 3,985,008 | |
| Haverty Furniture Companies, Inc. (b) | 114,952 | 4,338,288 | |
| Leslie's, Inc. (a)(b) | 401,090 | 5,057,745 | |
| Lithia Motors, Inc. Class A (sub. vtg.) (b) | 45,975 | 11,731,901 | |
| MarineMax, Inc. (a) | 62,219 | 2,089,314 | |
| Monro, Inc. (b) | 25,770 | 1,299,839 | |
| Murphy U.S.A., Inc. (b) | 40,309 | 10,282,423 | |
| MYT Netherlands Parent BV ADR (a)(b) | 115,276 | 941,805 | |
| National Vision Holdings, Inc. (a)(b) | 107,773 | 4,026,399 | |
| Penske Automotive Group, Inc. (b) | 63,115 | 9,098,027 | |
| Petco Health & Wellness Co., Inc. (a)(b) | 186,607 | 1,922,052 | |
| Sally Beauty Holdings, Inc. (a) | 1,108,088 | 17,829,136 | |
| Sleep Number Corp. (a)(b) | 48,970 | 1,951,944 | |
| Sonic Automotive, Inc. Class A (sub. vtg.) (b) | 53,500 | 3,043,615 | |
| The Aaron's Co., Inc. | 128,600 | 1,845,410 | |
| The Buckle, Inc. | 86,849 | 3,542,571 | |
| The ODP Corp. (a) | 66,800 | 3,024,704 | |
| Williams-Sonoma, Inc. (b) | 105,779 | 13,213,913 | |
| 195,324,799 | |||
| Textiles, Apparel & Luxury Goods - 1.2% | |||
| Canada Goose Holdings, Inc. (a)(b) | 329,534 | 6,198,535 | |
| Capri Holdings Ltd. (a) | 82,886 | 4,108,659 | |
| Carter's, Inc. (b) | 128,125 | 9,659,344 | |
| Crocs, Inc. (a) | 91,812 | 11,174,439 | |
| Deckers Outdoor Corp. (a) | 9,672 | 4,026,937 | |
| Hanesbrands, Inc. (b) | 560,331 | 3,182,680 | |
| Kering SA ADR (b) | 29,046 | 1,706,743 | |
| Oxford Industries, Inc. (b) | 9,528 | 1,120,588 | |
| PVH Corp. (b) | 58,650 | 4,706,076 | |
| Ralph Lauren Corp. | 72,391 | 8,555,892 | |
| Rocky Brands, Inc. | 34,424 | 916,367 | |
| Skechers U.S.A., Inc. Class A (sub. vtg.) (a) | 405,785 | 18,061,490 | |
| Steven Madden Ltd. (b) | 173,810 | 6,309,303 | |
| Tapestry, Inc. | 299,420 | 13,027,764 | |
| Under Armour, Inc. Class C (non-vtg.) (a)(b) | 712,750 | 6,272,200 | |
| 99,027,017 | |||
TOTAL CONSUMER DISCRETIONARY | 856,899,769 | ||
| CONSUMER STAPLES - 3.3% | |||
| Beverages - 0.2% | |||
| Molson Coors Beverage Co. Class B | 297,691 | 15,834,184 | |
| National Beverage Corp. (a)(b) | 18,952 | 884,111 | |
| 16,718,295 | |||
| Food & Staples Retailing - 1.1% | |||
| Albertsons Companies, Inc. | 260,649 | 5,181,702 | |
| Andersons, Inc. | 55,220 | 2,519,689 | |
| BJ's Wholesale Club Holdings, Inc. (a) | 298,586 | 21,438,475 | |
| Casey's General Stores, Inc. | 39,617 | 8,238,355 | |
| Grocery Outlet Holding Corp. (a) | 134,552 | 3,639,632 | |
| Ingles Markets, Inc. Class A | 106,715 | 9,540,321 | |
| Performance Food Group Co. (a) | 323,116 | 18,285,134 | |
| PriceSmart, Inc. | 57,055 | 3,977,875 | |
| SpartanNash Co. | 71,900 | 1,924,044 | |
| Sprouts Farmers Market LLC (a) | 124,700 | 3,777,163 | |
| U.S. Foods Holding Corp. (a) | 112,973 | 4,239,877 | |
| Weis Markets, Inc. (b) | 13,350 | 1,020,474 | |
| 83,782,741 | |||
| Food Products - 1.0% | |||
| Bunge Ltd. | 15,200 | 1,451,600 | |
| Conagra Brands, Inc. | 106,200 | 3,866,742 | |
| Darling Ingredients, Inc. (a) | 45,027 | 2,848,858 | |
| Flowers Foods, Inc. (b) | 156,883 | 4,373,898 | |
| Fresh Del Monte Produce, Inc. | 76,972 | 2,407,684 | |
| Freshpet, Inc. (a)(b) | 21,200 | 1,318,216 | |
| Ingredion, Inc. | 161,770 | 16,079,938 | |
| John B. Sanfilippo & Son, Inc. | 6,534 | 586,557 | |
| Lamb Weston Holdings, Inc. | 105,946 | 10,662,405 | |
| Lancaster Colony Corp. | 14,613 | 2,805,404 | |
| Nomad Foods Ltd. (a) | 1,102,960 | 19,765,043 | |
| SunOpta, Inc. (a)(b) | 874,108 | 6,713,149 | |
| The Hain Celestial Group, Inc. (a) | 399,868 | 7,129,646 | |
| Tootsie Roll Industries, Inc. (b) | 14,429 | 635,309 | |
| 80,644,449 | |||
| Household Products - 0.2% | |||
| Reynolds Consumer Products, Inc. (b) | 275,500 | 7,559,720 | |
| Spectrum Brands Holdings, Inc. | 138,565 | 8,870,931 | |
| WD-40 Co. (b) | 11,080 | 1,921,604 | |
| 18,352,255 | |||
| Personal Products - 0.5% | |||
| BellRing Brands, Inc. (a) | 33,400 | 1,031,392 | |
| elf Beauty, Inc. (a) | 280,586 | 20,973,804 | |
| Herbalife Nutrition Ltd. (a)(b) | 275,939 | 5,339,420 | |
| MediFast, Inc. (b) | 8,966 | 1,005,358 | |
| Nu Skin Enterprises, Inc. Class A (b) | 40,964 | 1,632,006 | |
| The Honest Co., Inc. (a)(b) | 1,869,697 | 5,216,455 | |
| USANA Health Sciences, Inc. (a) | 9,043 | 549,634 | |
| 35,748,069 | |||
| Tobacco - 0.3% | |||
| Turning Point Brands, Inc. | 427,437 | 10,215,744 | |
| Vector Group Ltd. | 1,200,766 | 15,934,165 | |
| 26,149,909 | |||
TOTAL CONSUMER STAPLES | 261,395,718 | ||
| ENERGY - 2.9% | |||
| Energy Equipment & Services - 0.6% | |||
| Cactus, Inc. | 103,136 | 4,739,099 | |
| Championx Corp. | 345,763 | 10,569,975 | |
| Expro Group Holdings NV (a) | 166,100 | 3,775,453 | |
| Helix Energy Solutions Group, Inc. (a) | 194,501 | 1,610,468 | |
| Helmerich & Payne, Inc. | 67,110 | 2,823,989 | |
| Nextier Oilfield Solutions, Inc. (a) | 475,933 | 4,345,268 | |
| Noble Corp. PLC (a) | 106,739 | 4,449,949 | |
| NOV, Inc. | 135,870 | 2,972,836 | |
| Patterson-UTI Energy, Inc. | 215,181 | 2,947,980 | |
| ProPetro Holding Corp. (a) | 247,494 | 2,180,422 | |
| Weatherford International PLC (a) | 76,600 | 5,103,092 | |
| 45,518,531 | |||
| Oil, Gas & Consumable Fuels - 2.3% | |||
| Antero Resources Corp. (a) | 16,100 | 421,820 | |
| APA Corp. | 107,977 | 4,144,157 | |
| Arch Resources, Inc. | 15,084 | 2,373,467 | |
| Berry Corp. | 177,200 | 1,670,996 | |
| California Resources Corp. | 62,900 | 2,654,380 | |
| Cameco Corp. (b) | 304,700 | 8,330,498 | |
| Chesapeake Energy Corp. | 27,468 | 2,219,689 | |
| Chord Energy Corp. | 32,142 | 4,326,956 | |
| CONSOL Energy, Inc. | 26,657 | 1,458,938 | |
| Delek U.S. Holdings, Inc. | 63,452 | 1,597,087 | |
| Denbury, Inc. (a) | 16,094 | 1,341,757 | |
| DHT Holdings, Inc. | 256,615 | 2,969,036 | |
| DT Midstream, Inc. | 112,770 | 5,661,054 | |
| Enerplus Corp. | 337,151 | 5,350,586 | |
| Green Plains, Inc. (a)(b) | 22,762 | 789,159 | |
| HF Sinclair Corp. | 393,562 | 19,567,903 | |
| International Seaways, Inc. | 51,337 | 2,640,775 | |
| Kosmos Energy Ltd. (a) | 723,290 | 5,692,292 | |
| Magnolia Oil & Gas Corp. Class A | 327,980 | 7,166,363 | |
| Matador Resources Co. (b) | 192,570 | 10,358,340 | |
| National Energy Services Reunited Corp. (a) | 297,208 | 1,919,964 | |
| Navigator Holdings Ltd. (a)(b) | 288,716 | 4,010,265 | |
| Northern Oil & Gas, Inc. | 169,573 | 5,263,546 | |
| Overseas Shipholding Group, Inc. (a) | 708,199 | 2,620,336 | |
| Ovintiv, Inc. | 125,443 | 5,365,197 | |
| Par Pacific Holdings, Inc. (a) | 230,255 | 6,396,484 | |
| PBF Energy, Inc. Class A (b) | 254,561 | 11,126,861 | |
| PDC Energy, Inc. | 65,300 | 4,382,283 | |
| Peabody Energy Corp. (a)(b) | 93,640 | 2,556,372 | |
| Permian Resource Corp. Class A (b) | 864,577 | 9,346,077 | |
| SFL Corp. Ltd. | 178,600 | 1,843,152 | |
| SM Energy Co. | 239,709 | 7,073,813 | |
| Southwestern Energy Co. (a) | 211,000 | 1,118,300 | |
| Talos Energy, Inc. (a) | 82,800 | 1,474,668 | |
| Targa Resources Corp. | 49,940 | 3,700,554 | |
| Teekay Tankers Ltd. (a) | 52,545 | 2,372,407 | |
| Viper Energy Partners LP | 486,710 | 13,934,507 | |
| Vital Energy, Inc. (a) | 38,533 | 1,980,211 | |
| Vitesse Energy, Inc. | 13,405 | 233,113 | |
| World Fuel Services Corp. | 342,770 | 9,409,037 | |
| 186,862,400 | |||
TOTAL ENERGY | 232,380,931 | ||
| FINANCIALS - 11.4% | |||
| Banks - 3.9% | |||
| Ameris Bancorp | 34,297 | 1,641,797 | |
| Associated Banc-Corp. | 280,710 | 6,498,437 | |
| Bancorp, Inc., Delaware (a) | 77,700 | 2,687,643 | |
| BankUnited, Inc. | 276,534 | 9,794,834 | |
| Berkshire Hills Bancorp, Inc. | 62,352 | 1,811,949 | |
| Cathay General Bancorp | 102,900 | 4,416,468 | |
| Citizens Financial Group, Inc. | 86,200 | 3,599,712 | |
| Comerica, Inc. | 204,615 | 14,343,512 | |
| Commerce Bancshares, Inc. | 100,408 | 6,641,989 | |
| Cullen/Frost Bankers, Inc. | 65,969 | 8,696,034 | |
| Customers Bancorp, Inc. (a) | 68,404 | 2,106,843 | |
| Dime Community Bancshares, Inc. | 6,980 | 213,867 | |
| East West Bancorp, Inc. | 86,759 | 6,611,903 | |
| Fifth Third Bancorp | 67,000 | 2,432,100 | |
| First Bancorp, Puerto Rico | 660,153 | 9,578,820 | |
| First Citizens Bancshares, Inc. | 17,112 | 12,556,101 | |
| First Hawaiian, Inc. | 470,130 | 12,858,056 | |
| First Horizon National Corp. | 134,813 | 3,339,318 | |
| First Interstate Bancsystem, Inc. | 174,587 | 6,204,822 | |
| First Merchants Corp. | 84,441 | 3,455,326 | |
| Fulton Financial Corp. | 239,600 | 4,121,120 | |
| Hancock Whitney Corp. (b) | 150,768 | 7,405,724 | |
| Hanmi Financial Corp. | 108,800 | 2,569,856 | |
| HomeStreet, Inc. | 66,800 | 1,685,364 | |
| Hope Bancorp, Inc. | 278,100 | 3,562,461 | |
| KeyCorp | 420,029 | 7,682,330 | |
| OFG Bancorp | 100,700 | 3,063,294 | |
| PacWest Bancorp | 187,100 | 5,192,025 | |
| Pathward Financial, Inc. | 22,565 | 1,151,041 | |
| Peapack-Gladstone Financial Corp. | 64,994 | 2,414,527 | |
| Peoples Bancorp, Inc. (b) | 40,051 | 1,245,987 | |
| Pinnacle Financial Partners, Inc. | 65,185 | 4,829,557 | |
| Preferred Bank, Los Angeles | 49,936 | 3,515,494 | |
| Regions Financial Corp. | 444,450 | 10,364,574 | |
| ServisFirst Bancshares, Inc. | 123,927 | 9,164,402 | |
| Signature Bank | 121,411 | 13,968,336 | |
| Southstate Corp. | 58,993 | 4,759,555 | |
| SVB Financial Group (a) | 43,942 | 12,660,130 | |
| Synovus Financial Corp. | 349,233 | 14,601,432 | |
| Texas Capital Bancshares, Inc. (a) | 134,709 | 8,921,777 | |
| Valley National Bancorp (b) | 294,425 | 3,409,442 | |
| Veritex Holdings, Inc. | 66,783 | 1,780,435 | |
| Webster Financial Corp. | 177,120 | 9,408,614 | |
| WesBanco, Inc. | 48,800 | 1,764,120 | |
| Western Alliance Bancorp. | 172,948 | 12,839,660 | |
| Wintrust Financial Corp. | 280,439 | 25,836,845 | |
| Zions Bancorp NA | 283,535 | 14,352,542 | |
| 311,760,175 | |||
| Capital Markets - 3.0% | |||
| Affiliated Managers Group, Inc. | 16,500 | 2,630,265 | |
| Ares Management Corp. | 46,995 | 3,789,207 | |
| Artisan Partners Asset Management, Inc. (b) | 54,814 | 1,807,218 | |
| Avantax, Inc. (a) | 81,327 | 2,325,139 | |
| Bridge Investment Group Holdings, Inc. (b) | 21,766 | 295,800 | |
| Cboe Global Markets, Inc. | 138,401 | 17,462,054 | |
| Cohen & Steers, Inc. | 20,198 | 1,461,527 | |
| Diamond Hill Investment Group, Inc. | 2,432 | 424,627 | |
| Donnelley Financial Solutions, Inc. (a) | 70,196 | 2,969,993 | |
| Evercore, Inc. Class A (b) | 163,370 | 21,430,877 | |
| FactSet Research Systems, Inc. | 25,367 | 10,515,890 | |
| Federated Hermes, Inc. | 68,846 | 2,709,090 | |
| Focus Financial Partners, Inc. Class A (a) | 185,760 | 9,633,514 | |
| GQG Partners, Inc. CDI | 623,535 | 623,071 | |
| Hamilton Lane, Inc. Class A | 26,773 | 2,082,939 | |
| Houlihan Lokey | 101,638 | 9,726,757 | |
| Jefferies Financial Group, Inc. | 153,874 | 5,814,898 | |
| Lazard Ltd. Class A | 121,740 | 4,548,206 | |
| LPL Financial | 205,908 | 51,386,400 | |
| MarketAxess Holdings, Inc. | 18,652 | 6,368,725 | |
| Moelis & Co. Class A (b) | 345,104 | 14,780,804 | |
| Morningstar, Inc. | 43,904 | 9,102,616 | |
| P10, Inc. | 807,497 | 8,696,743 | |
| PJT Partners, Inc. | 65,001 | 5,127,279 | |
| SEI Investments Co. | 83,721 | 5,044,190 | |
| Sprott, Inc. (b) | 255,695 | 8,875,173 | |
| StepStone Group, Inc. Class A | 357,626 | 10,228,104 | |
| Stifel Financial Corp. | 148,460 | 9,921,582 | |
| UBS Group AG (b) | 56,720 | 1,235,362 | |
| Victory Capital Holdings, Inc. | 12,038 | 408,810 | |
| WisdomTree Investments, Inc. (b) | 1,227,415 | 7,327,668 | |
| 238,754,528 | |||
| Consumer Finance - 0.6% | |||
| Ally Financial, Inc. | 137,800 | 4,140,890 | |
| Credit Acceptance Corp. (a)(b) | 4,938 | 2,194,151 | |
| Enova International, Inc. (a) | 114,092 | 5,561,985 | |
| FirstCash Holdings, Inc. | 51,222 | 4,520,342 | |
| Navient Corp. | 326,000 | 5,884,300 | |
| NerdWallet, Inc. (a) | 163,566 | 3,376,002 | |
| OneMain Holdings, Inc. | 117,627 | 5,068,547 | |
| PRA Group, Inc. (a) | 91,381 | 3,889,175 | |
| PROG Holdings, Inc. (a) | 45,600 | 1,127,232 | |
| Regional Management Corp. | 71,100 | 2,241,072 | |
| SLM Corp. | 883,428 | 12,703,695 | |
| 50,707,391 | |||
| Diversified Financial Services - 0.5% | |||
| Acacia Research Corp. (a)(b)(c) | 2,561,036 | 11,063,676 | |
| Acacia Research Corp. rights 3/1/23 (c) | 640,258 | 6 | |
| Banco Latinoamericano de Comercio Exterior SA Series E | 75,700 | 1,385,310 | |
| Cannae Holdings, Inc. (a) | 591,291 | 13,351,351 | |
| Jackson Financial, Inc. | 48,990 | 2,223,166 | |
| Voya Financial, Inc. (b) | 158,290 | 11,791,022 | |
| 39,814,531 | |||
| Insurance - 3.0% | |||
| Allstate Corp. | 12,440 | 1,602,023 | |
| American Equity Investment Life Holding Co. | 125,067 | 5,209,041 | |
| American Financial Group, Inc. | 109,587 | 14,696,713 | |
| Assurant, Inc. | 19,527 | 2,487,545 | |
| Assured Guaranty Ltd. | 42,901 | 2,677,451 | |
| Axis Capital Holdings Ltd. | 249,771 | 15,166,095 | |
| Brown & Brown, Inc. | 151,617 | 8,501,165 | |
| BRP Group, Inc. (a) | 50,500 | 1,451,370 | |
| CNA Financial Corp. (b) | 156,400 | 6,847,192 | |
| CNO Financial Group, Inc. (b) | 339,200 | 8,690,304 | |
| Crawford & Co. Class B | 124,426 | 686,832 | |
| Erie Indemnity Co. Class A | 18,388 | 4,328,351 | |
| Everest Re Group Ltd. | 55,259 | 21,217,798 | |
| First American Financial Corp. | 70,000 | 3,974,600 | |
| Genworth Financial, Inc. Class A (a) | 1,903,678 | 11,859,914 | |
| Hanover Insurance Group, Inc. | 67,305 | 9,387,701 | |
| HCI Group, Inc. (b) | 27,452 | 1,441,230 | |
| Kemper Corp. | 138,120 | 8,508,192 | |
| Kinsale Capital Group, Inc. (b) | 59,435 | 18,941,935 | |
| Lincoln National Corp. | 90,600 | 2,873,832 | |
| Old Republic International Corp. | 209,200 | 5,516,604 | |
| Primerica, Inc. | 13,800 | 2,648,772 | |
| Reinsurance Group of America, Inc. | 80,660 | 11,652,950 | |
| RenaissanceRe Holdings Ltd. | 29,739 | 6,390,911 | |
| RLI Corp. (b) | 102,230 | 14,098,539 | |
| Selective Insurance Group, Inc. | 69,868 | 7,093,698 | |
| Trupanion, Inc. (a)(b) | 36,345 | 2,158,166 | |
| Universal Insurance Holdings, Inc. | 101,536 | 1,962,691 | |
| Unum Group | 121,200 | 5,399,460 | |
| W.R. Berkley Corp. | 33,904 | 2,244,106 | |
| White Mountains Insurance Group Ltd. (b) | 13,953 | 20,142,132 | |
| Willis Towers Watson PLC | 36,262 | 8,498,362 | |
| 238,355,675 | |||
| Mortgage Real Estate Investment Trusts - 0.0% | |||
| Annaly Capital Management, Inc. | 103,550 | 2,141,414 | |
| Redwood Trust, Inc. (b) | 266,700 | 2,029,587 | |
| Rithm Capital Corp. | 110,000 | 1,001,000 | |
| 5,172,001 | |||
| Thrifts & Mortgage Finance - 0.4% | |||
| Essent Group Ltd. | 150,682 | 6,471,792 | |
| Federal Agricultural Mortgage Corp. Class C (non-vtg.) | 42,561 | 6,037,703 | |
| MGIC Investment Corp. | 261,047 | 3,592,007 | |
| NMI Holdings, Inc. (a) | 178,106 | 4,156,994 | |
| Radian Group, Inc. | 373,403 | 7,972,154 | |
| Walker & Dunlop, Inc. | 48,068 | 4,192,972 | |
| 32,423,622 | |||
TOTAL FINANCIALS | 916,987,923 | ||
| HEALTH CARE - 10.2% | |||
| Biotechnology - 1.4% | |||
| Agios Pharmaceuticals, Inc. (a)(b) | 142,165 | 3,598,196 | |
| Anika Therapeutics, Inc. (a) | 116,937 | 3,706,903 | |
| Arcus Biosciences, Inc. (a) | 48,822 | 889,049 | |
| Arrowhead Pharmaceuticals, Inc. (a) | 46,404 | 1,498,849 | |
| Ascendis Pharma A/S sponsored ADR (a)(b) | 11,539 | 1,281,868 | |
| Blueprint Medicines Corp. (a) | 76,336 | 3,234,356 | |
| C4 Therapeutics, Inc. (a)(b) | 527,861 | 2,781,827 | |
| CareDx, Inc. (a) | 376,032 | 6,324,858 | |
| Celldex Therapeutics, Inc. (a) | 20,120 | 860,935 | |
| Coherus BioSciences, Inc. (a) | 131,110 | 887,615 | |
| Crinetics Pharmaceuticals, Inc. (a) | 211,511 | 4,154,076 | |
| Cytokinetics, Inc. (a)(b) | 46,100 | 1,998,896 | |
| Day One Biopharmaceuticals, Inc. (a) | 82,900 | 1,527,018 | |
| Exelixis, Inc. (a) | 152,600 | 2,606,408 | |
| Halozyme Therapeutics, Inc. (a) | 187,997 | 9,021,976 | |
| Incyte Corp. (a) | 30,300 | 2,332,494 | |
| Insmed, Inc. (a) | 213,061 | 4,342,183 | |
| Intellia Therapeutics, Inc. (a) | 34,739 | 1,395,466 | |
| Ironwood Pharmaceuticals, Inc. Class A (a) | 588,100 | 6,627,887 | |
| Iveric Bio, Inc. (a) | 83,161 | 1,728,086 | |
| Karuna Therapeutics, Inc. (a) | 10,899 | 2,173,479 | |
| Legend Biotech Corp. ADR (a) | 115,744 | 5,345,058 | |
| Natera, Inc. (a) | 34,070 | 1,654,099 | |
| Neurocrine Biosciences, Inc. (a) | 53,531 | 5,519,046 | |
| Oyster Point Pharma, Inc. rights (a)(d) | 203,167 | 2 | |
| PureTech Health PLC (a) | 677,766 | 1,850,619 | |
| RAPT Therapeutics, Inc. (a) | 46,900 | 1,381,205 | |
| Relay Therapeutics, Inc. (a)(b) | 185,133 | 2,989,898 | |
| Repligen Corp. (a) | 32,058 | 5,589,953 | |
| Sarepta Therapeutics, Inc. (a)(b) | 39,560 | 4,831,463 | |
| SpringWorks Therapeutics, Inc. (a)(b) | 155,421 | 4,957,930 | |
| Ultragenyx Pharmaceutical, Inc. (a) | 33,970 | 1,511,325 | |
| United Therapeutics Corp. (a) | 51,455 | 12,659,988 | |
| Veracyte, Inc. (a) | 177,538 | 4,369,210 | |
| Vir Biotechnology, Inc. (a) | 54,039 | 1,232,089 | |
| 116,864,310 | |||
| Health Care Equipment & Supplies - 2.9% | |||
| Abiomed, Inc. (d) | 14,700 | 14,994 | |
| Align Technology, Inc. (a) | 12,942 | 4,005,549 | |
| Atricure, Inc. (a) | 76,134 | 2,931,159 | |
| Atrion Corp. (b) | 1,105 | 627,640 | |
| AxoGen, Inc. (a) | 738,267 | 6,090,703 | |
| Axonics Modulation Technologies, Inc. (a) | 46,900 | 2,818,221 | |
| Bausch + Lomb Corp. (a)(b) | 778,241 | 13,572,523 | |
| Cutera, Inc. (a)(b) | 48,600 | 1,576,098 | |
| Enovis Corp. (a) | 36,101 | 2,080,140 | |
| Envista Holdings Corp. (a) | 487,355 | 18,841,144 | |
| Globus Medical, Inc. (a) | 164,968 | 9,624,233 | |
| Haemonetics Corp. (a) | 55,958 | 4,351,854 | |
| ICU Medical, Inc. (a)(b) | 72,509 | 12,372,936 | |
| Inari Medical, Inc. (a) | 47,480 | 2,671,225 | |
| Insulet Corp. (a) | 9,527 | 2,632,882 | |
| Integra LifeSciences Holdings Corp. (a) | 264,521 | 14,712,658 | |
| iRhythm Technologies, Inc. (a) | 25,225 | 2,968,478 | |
| Lantheus Holdings, Inc. (a) | 98,319 | 7,271,673 | |
| LeMaitre Vascular, Inc. (b) | 14,153 | 709,207 | |
| Merit Medical Systems, Inc. (a) | 217,113 | 15,323,836 | |
| Neogen Corp. (a) | 175,709 | 3,108,292 | |
| Nevro Corp. (a) | 107,763 | 3,388,069 | |
| Omnicell, Inc. (a) | 84,489 | 4,599,581 | |
| QuidelOrtho Corp. (a)(b) | 497,410 | 43,244,825 | |
| Silk Road Medical, Inc. (a) | 56,420 | 2,989,696 | |
| STERIS PLC | 158,634 | 29,827,951 | |
| Tandem Diabetes Care, Inc. (a) | 31,400 | 1,126,004 | |
| Teleflex, Inc. | 22,534 | 5,368,275 | |
| The Cooper Companies, Inc. | 38,843 | 12,700,496 | |
| Utah Medical Products, Inc. | 2,783 | 255,424 | |
| 231,805,766 | |||
| Health Care Providers & Services - 3.0% | |||
| Acadia Healthcare Co., Inc. (a) | 182,934 | 13,264,544 | |
| agilon health, Inc. (a)(b) | 88,400 | 1,874,964 | |
| Amedisys, Inc. (a) | 47,437 | 4,361,832 | |
| AMN Healthcare Services, Inc. (a) | 72,999 | 6,570,640 | |
| Castle Biosciences, Inc. (a) | 218,071 | 5,491,028 | |
| Chemed Corp. | 45,052 | 23,498,222 | |
| Corvel Corp. (a) | 7,503 | 1,352,641 | |
| DaVita HealthCare Partners, Inc. (a) | 47,900 | 3,940,254 | |
| dentalcorp Holdings Ltd. (a) | 2,458,915 | 17,317,826 | |
| DocGo, Inc. Class A (a)(b) | 1,013,331 | 9,271,979 | |
| Encompass Health Corp. | 301,390 | 17,034,563 | |
| Guardant Health, Inc. (a) | 122,385 | 3,780,473 | |
| HealthEquity, Inc. (a) | 357,804 | 23,318,087 | |
| Henry Schein, Inc. (a) | 492,897 | 38,598,764 | |
| Molina Healthcare, Inc. (a) | 58,874 | 16,209,778 | |
| National Research Corp. Class A (b) | 11,465 | 517,759 | |
| Patterson Companies, Inc. | 141,670 | 3,757,088 | |
| Pediatrix Medical Group, Inc. (a) | 785,267 | 12,360,103 | |
| Premier, Inc. | 338,425 | 10,893,901 | |
| Quest Diagnostics, Inc. | 26,400 | 3,652,704 | |
| R1 Rcm, Inc. (a) | 373,631 | 5,305,560 | |
| Select Medical Holdings Corp. | 100,600 | 2,735,314 | |
| U.S. Physical Therapy, Inc. (b) | 9,529 | 965,574 | |
| Universal Health Services, Inc. Class B | 98,627 | 13,173,608 | |
| 239,247,206 | |||
| Health Care Technology - 0.4% | |||
| Certara, Inc. (a) | 851,389 | 15,427,169 | |
| Definitive Healthcare Corp. (a)(b) | 402,270 | 4,593,923 | |
| Doximity, Inc. (a)(b) | 209,523 | 7,046,258 | |
| iCAD, Inc. (a) | 484,964 | 1,285,155 | |
| Simulations Plus, Inc. (b) | 11,564 | 439,895 | |
| 28,792,400 | |||
| Life Sciences Tools & Services - 1.6% | |||
| Avantor, Inc. (a)(b) | 183,902 | 4,481,692 | |
| Azenta, Inc. (a) | 147,061 | 6,454,507 | |
| Bio-Rad Laboratories, Inc. Class A (a) | 35,937 | 17,172,136 | |
| Bio-Techne Corp. | 68,838 | 5,000,392 | |
| Bruker Corp. | 115,012 | 7,926,627 | |
| CryoPort, Inc. (a)(b) | 88,242 | 1,911,322 | |
| Harvard Bioscience, Inc. (a)(b) | 514,156 | 1,455,061 | |
| ICON PLC (a) | 62,248 | 14,045,016 | |
| Maravai LifeSciences Holdings, Inc. (a) | 56,007 | 826,103 | |
| Medpace Holdings, Inc. (a) | 51,819 | 10,046,668 | |
| Quanterix Corp. (a) | 299,582 | 3,295,402 | |
| Sotera Health Co. (a)(b) | 721,034 | 12,034,057 | |
| Stevanato Group SpA (b) | 75,193 | 1,635,448 | |
| Syneos Health, Inc. (a) | 358,819 | 14,431,700 | |
| West Pharmaceutical Services, Inc. (b) | 76,224 | 24,165,295 | |
| 124,881,426 | |||
| Pharmaceuticals - 0.9% | |||
| Amphastar Pharmaceuticals, Inc. (a) | 139,475 | 4,443,674 | |
| Arvinas Holding Co. LLC (a) | 152,572 | 4,676,332 | |
| Avadel Pharmaceuticals PLC sponsored ADR (a) | 126,718 | 1,260,844 | |
| Catalent, Inc. (a) | 464,022 | 31,655,581 | |
| Harmony Biosciences Holdings, Inc. (a) | 23,639 | 1,040,825 | |
| Harrow Health, Inc. (a)(b) | 502,753 | 9,009,334 | |
| Innoviva, Inc. (a) | 52,406 | 632,540 | |
| Intra-Cellular Therapies, Inc. (a) | 137,525 | 6,742,851 | |
| Jazz Pharmaceuticals PLC (a) | 58,800 | 8,255,520 | |
| Organon & Co. (b) | 206,782 | 5,064,091 | |
| Phathom Pharmaceuticals, Inc. (a)(b) | 229,213 | 1,962,063 | |
| Ventyx Biosciences, Inc. (a) | 13,000 | 562,250 | |
| 75,305,905 | |||
TOTAL HEALTH CARE | 816,897,013 | ||
| INDUSTRIALS - 17.5% | |||
| Aerospace & Defense - 1.0% | |||
| Axon Enterprise, Inc. (a) | 25,576 | 5,123,129 | |
| Curtiss-Wright Corp. | 49,317 | 8,620,118 | |
| HEICO Corp. Class A | 22,400 | 2,915,360 | |
| Hexcel Corp. (b) | 52,151 | 3,804,415 | |
| Howmet Aerospace, Inc. | 94,303 | 3,977,701 | |
| Huntington Ingalls Industries, Inc. | 16,137 | 3,472,682 | |
| Moog, Inc. Class A | 48,900 | 4,822,518 | |
| Rheinmetall AG ADR (b) | 200,216 | 10,187,991 | |
| Rocket Lab U.S.A., Inc. Class A (a)(b) | 586,094 | 2,637,423 | |
| Spirit AeroSystems Holdings, Inc. Class A | 224,620 | 7,677,512 | |
| Textron, Inc. | 85,391 | 6,193,409 | |
| Thales SA ADR (b) | 56,720 | 1,582,488 | |
| V2X, Inc. (a) | 82,470 | 3,824,134 | |
| Woodward, Inc. | 115,138 | 11,398,662 | |
| 76,237,542 | |||
| Air Freight & Logistics - 0.4% | |||
| Air Transport Services Group, Inc. (a) | 688,718 | 14,414,868 | |
| Forward Air Corp. | 129,391 | 13,354,445 | |
| Hub Group, Inc. Class A (a) | 40,464 | 3,711,763 | |
| 31,481,076 | |||
| Airlines - 0.3% | |||
| Alaska Air Group, Inc. (a)(b) | 398,164 | 19,044,184 | |
| JetBlue Airways Corp. (a) | 168,500 | 1,398,550 | |
| United Airlines Holdings, Inc. (a) | 41,900 | 2,177,124 | |
| 22,619,858 | |||
| Building Products - 1.4% | |||
| A.O. Smith Corp. | 104,458 | 6,855,579 | |
| Apogee Enterprises, Inc. (b) | 70,192 | 3,211,986 | |
| Armstrong World Industries, Inc. | 150,072 | 11,833,177 | |
| Carlisle Companies, Inc. | 44,714 | 11,546,049 | |
| Fortune Brands Home & Security, Inc. | 202,850 | 12,566,558 | |
| Gibraltar Industries, Inc. (a) | 79,861 | 4,265,376 | |
| Griffon Corp. | 73,377 | 2,676,059 | |
| Hayward Holdings, Inc. (a)(b) | 674,900 | 8,308,019 | |
| Lennox International, Inc. | 38,649 | 9,848,925 | |
| Masonite International Corp. (a) | 102,506 | 9,102,533 | |
| Owens Corning | 83,500 | 8,165,465 | |
| Resideo Technologies, Inc. (a) | 109,050 | 1,999,977 | |
| Simpson Manufacturing Co. Ltd. | 83,175 | 8,971,256 | |
| Tecnoglass, Inc. | 318,458 | 11,690,593 | |
| Trex Co., Inc. (a) | 89,650 | 4,583,805 | |
| 115,625,357 | |||
| Commercial Services & Supplies - 2.4% | |||
| ABM Industries, Inc. | 98,499 | 4,768,337 | |
| ACCO Brands Corp. | 96,400 | 546,588 | |
| ACV Auctions, Inc. Class A (a) | 1,746,698 | 21,379,584 | |
| Brady Corp. Class A | 37,960 | 2,093,874 | |
| Charah Solutions, Inc. (a)(b) | 95,636 | 540,343 | |
| Cimpress PLC (a) | 135,167 | 4,747,065 | |
| Clean Harbors, Inc. (a) | 7,912 | 1,044,938 | |
| CoreCivic, Inc. (a) | 1,280,762 | 12,436,199 | |
| Deluxe Corp. | 56,100 | 1,034,484 | |
| Driven Brands Holdings, Inc. (a) | 527,845 | 14,766,464 | |
| Ennis, Inc. | 20,968 | 456,054 | |
| Heritage-Crystal Clean, Inc. (a) | 277,880 | 9,998,122 | |
| IAA, Inc. (a) | 147,528 | 6,035,370 | |
| Matthews International Corp. Class A (b) | 160,097 | 6,109,302 | |
| MSA Safety, Inc. | 96,386 | 12,949,459 | |
| Ritchie Bros. Auctioneers, Inc. (b) | 523,429 | 32,018,152 | |
| Rollins, Inc. | 188,164 | 6,623,373 | |
| Stericycle, Inc. (a) | 188,099 | 8,968,560 | |
| Tetra Tech, Inc. | 71,874 | 9,838,832 | |
| The Brink's Co. | 135,394 | 8,834,459 | |
| UniFirst Corp. | 77,839 | 15,266,563 | |
| Viad Corp. (a) | 94,138 | 2,420,288 | |
| Waste Connections, Inc. (United States) | 89,474 | 11,982,358 | |
| 194,858,768 | |||
| Construction & Engineering - 1.0% | |||
| Arcosa, Inc. | 138,680 | 8,404,008 | |
| Argan, Inc. | 155,924 | 6,059,207 | |
| Comfort Systems U.S.A., Inc. | 33,102 | 4,814,355 | |
| Dycom Industries, Inc. (a) | 104,387 | 8,790,429 | |
| EMCOR Group, Inc. | 93,828 | 15,689,918 | |
| Fluor Corp. (a) | 227,130 | 8,328,857 | |
| Granite Construction, Inc. | 69,560 | 3,004,992 | |
| MDU Resources Group, Inc. | 235,754 | 7,508,765 | |
| MYR Group, Inc. (a) | 12,444 | 1,500,871 | |
| Willscot Mobile Mini Holdings (a) | 386,413 | 19,861,628 | |
| 83,963,030 | |||
| Electrical Equipment - 1.9% | |||
| Acuity Brands, Inc. | 65,003 | 12,607,982 | |
| AMETEK, Inc. | 17,765 | 2,514,813 | |
| Atkore, Inc. (a) | 290,054 | 42,353,685 | |
| Babcock & Wilcox Enterprises, Inc. (a) | 210,644 | 1,367,080 | |
| EnerSys | 24,867 | 2,255,188 | |
| Generac Holdings, Inc. (a) | 122,043 | 14,646,380 | |
| Hubbell, Inc. Class B (b) | 43,642 | 10,977,709 | |
| Nextracker, Inc. Class A | 79,068 | 2,406,830 | |
| nVent Electric PLC | 124,028 | 5,685,444 | |
| Regal Rexnord Corp. | 88,370 | 13,930,647 | |
| Sensata Technologies, Inc. PLC | 538,508 | 27,237,735 | |
| Shoals Technologies Group, Inc. (a) | 126,479 | 3,103,795 | |
| Tritium DCFC Ltd. (a) | 943,175 | 1,697,715 | |
| Vertiv Holdings Co. | 576,703 | 9,371,424 | |
| 150,156,427 | |||
| Machinery - 3.8% | |||
| AGCO Corp. | 130,377 | 18,358,385 | |
| Albany International Corp. Class A | 16,792 | 1,694,649 | |
| Allison Transmission Holdings, Inc. | 334,721 | 15,899,248 | |
| Altra Industrial Motion Corp. | 32,205 | 1,981,574 | |
| Barnes Group, Inc. | 41,075 | 1,730,901 | |
| Chart Industries, Inc. (a)(b) | 7,100 | 947,850 | |
| Crane Holdings Co. | 118,308 | 14,170,932 | |
| Donaldson Co., Inc. | 100,453 | 6,353,652 | |
| Douglas Dynamics, Inc. | 167,235 | 6,236,193 | |
| ESAB Corp. | 98,737 | 5,790,925 | |
| Flowserve Corp. | 74,500 | 2,584,405 | |
| Gorman-Rupp Co. | 17,397 | 484,680 | |
| Graco, Inc. | 212,303 | 14,763,551 | |
| Hillenbrand, Inc. | 152,598 | 7,193,470 | |
| Hillman Solutions Corp. Class A (a) | 807,159 | 7,175,644 | |
| IDEX Corp. | 80,974 | 18,217,531 | |
| Ingersoll Rand, Inc. | 186,779 | 10,846,257 | |
| ITT, Inc. | 78,067 | 7,095,510 | |
| John Bean Technologies Corp. | 118,147 | 13,101,321 | |
| Kadant, Inc. | 9,480 | 2,034,977 | |
| Lincoln Electric Holdings, Inc. | 126,401 | 21,226,520 | |
| Markforged Holding Corp. (a) | 948,329 | 1,261,278 | |
| Middleby Corp. (a) | 47,273 | 7,350,479 | |
| Mueller Industries, Inc. | 104,087 | 7,699,315 | |
| Nordson Corp. | 86,199 | 18,932,748 | |
| Omega Flex, Inc. (b) | 2,459 | 286,178 | |
| Oshkosh Corp. | 59,831 | 5,336,327 | |
| RBC Bearings, Inc. (a)(b) | 80,289 | 18,451,215 | |
| Snap-On, Inc. | 65,608 | 16,315,397 | |
| Tennant Co. | 130,175 | 9,218,994 | |
| Terex Corp. | 76,966 | 4,557,157 | |
| Timken Co. | 133,858 | 11,438,166 | |
| Titan International, Inc. (a) | 109,800 | 1,362,618 | |
| Toro Co. | 157,786 | 17,425,886 | |
| Velo3D, Inc. (a)(b) | 420,262 | 1,332,231 | |
| Watts Water Technologies, Inc. Class A | 22,200 | 3,890,106 | |
| 302,746,270 | |||
| Marine - 0.4% | |||
| Genco Shipping & Trading Ltd. (b) | 19,400 | 369,570 | |
| Kirby Corp. (a) | 139,947 | 10,150,356 | |
| Matson, Inc. | 206,440 | 13,730,324 | |
| Navios Maritime Partners LP (b) | 102,819 | 2,764,803 | |
| Star Bulk Carriers Corp. (b) | 316,300 | 7,752,513 | |
| 34,767,566 | |||
| Professional Services - 2.6% | |||
| Alight, Inc. Class A (a) | 5,335,988 | 51,225,485 | |
| ASGN, Inc. (a) | 63,763 | 5,662,154 | |
| Barrett Business Services, Inc. | 5,757 | 552,557 | |
| Booz Allen Hamilton Holding Corp. Class A | 45,146 | 4,276,681 | |
| CACI International, Inc. Class A (a) | 53,189 | 15,584,377 | |
| CBIZ, Inc. (a) | 394,740 | 19,772,527 | |
| Dun & Bradstreet Holdings, Inc. | 561,782 | 6,747,002 | |
| Exponent, Inc. | 41,562 | 4,276,730 | |
| First Advantage Corp. (a)(b) | 550,956 | 7,994,372 | |
| Franklin Covey Co. (a) | 9,795 | 459,092 | |
| FTI Consulting, Inc. (a)(b) | 96,669 | 17,759,062 | |
| Heidrick & Struggles International, Inc. | 68,523 | 2,352,395 | |
| Insperity, Inc. | 26,398 | 3,275,728 | |
| Kforce, Inc. | 16,199 | 1,012,276 | |
| Korn Ferry | 150,498 | 8,411,333 | |
| Leidos Holdings, Inc. | 12,988 | 1,260,745 | |
| Manpower, Inc. | 56,200 | 4,770,256 | |
| Marlowe PLC (a) | 1,873,683 | 10,818,046 | |
| Robert Half International, Inc. | 174,505 | 14,068,593 | |
| Science Applications International Corp. | 97,977 | 10,448,267 | |
| TransUnion Holding Co., Inc. | 184,590 | 12,077,724 | |
| TriNet Group, Inc. (a)(b) | 103,386 | 8,567,598 | |
| 211,373,000 | |||
| Road & Rail - 1.0% | |||
| ArcBest Corp. | 64,002 | 6,156,992 | |
| Daseke, Inc. (a) | 378,481 | 3,084,620 | |
| Heartland Express, Inc. (b) | 187,523 | 3,024,746 | |
| Knight-Swift Transportation Holdings, Inc. Class A | 410,788 | 23,349,190 | |
| Landstar System, Inc. | 104,476 | 18,888,216 | |
| Ryder System, Inc. | 42,000 | 4,112,220 | |
| Saia, Inc. (a) | 16,266 | 4,405,971 | |
| TFI International, Inc. | 33,379 | 4,073,573 | |
| Werner Enterprises, Inc. | 37,940 | 1,762,313 | |
| XPO, Inc. (a) | 333,599 | 11,128,863 | |
| 79,986,704 | |||
| Trading Companies & Distributors - 1.3% | |||
| Air Lease Corp. Class A | 45,700 | 1,977,896 | |
| Alta Equipment Group, Inc. | 217,823 | 4,097,251 | |
| BlueLinx Corp. (a) | 91,168 | 7,693,668 | |
| Boise Cascade Co. | 30,292 | 2,093,480 | |
| Custom Truck One Source, Inc. Class A (a)(b) | 613,974 | 4,445,172 | |
| EVI Industries, Inc. (a)(b) | 309,575 | 6,253,415 | |
| H&E Equipment Services, Inc. | 51,396 | 2,852,478 | |
| Herc Holdings, Inc. | 62,030 | 8,906,888 | |
| MSC Industrial Direct Co., Inc. Class A | 64,533 | 5,454,329 | |
| NOW, Inc. (a) | 182,650 | 2,347,053 | |
| SiteOne Landscape Supply, Inc. (a)(b) | 88,497 | 13,127,645 | |
| Titan Machinery, Inc. (a) | 36,707 | 1,680,814 | |
| Triton International Ltd. (b) | 101,300 | 6,983,622 | |
| Univar Solutions, Inc. (a) | 232,304 | 8,072,564 | |
| Watsco, Inc. (b) | 26,999 | 8,226,865 | |
| WESCO International, Inc. | 101,807 | 16,857,203 | |
| 101,070,343 | |||
TOTAL INDUSTRIALS | 1,404,885,941 | ||
| INFORMATION TECHNOLOGY - 13.5% | |||
| Communications Equipment - 0.5% | |||
| Ciena Corp. (a) | 95,616 | 4,610,604 | |
| Clearfield, Inc. (a)(b) | 78,849 | 4,943,044 | |
| CommScope Holding Co., Inc. (a) | 593,477 | 4,296,773 | |
| Digi International, Inc. (a) | 19,391 | 647,078 | |
| EMCORE Corp. (a) | 1,130,892 | 1,622,830 | |
| Extreme Networks, Inc. (a) | 379,762 | 7,109,145 | |
| F5, Inc. (a) | 10,773 | 1,540,324 | |
| Juniper Networks, Inc. | 357,915 | 11,016,624 | |
| Lantronix, Inc. (a)(b) | 506,460 | 2,608,269 | |
| Lumentum Holdings, Inc. (a) | 87,570 | 4,712,142 | |
| NetScout Systems, Inc. (a) | 55,222 | 1,570,514 | |
| 44,677,347 | |||
| Electronic Equipment & Components - 2.8% | |||
| Arrow Electronics, Inc. (a) | 88,907 | 10,490,137 | |
| Avnet, Inc. | 310,483 | 13,881,695 | |
| Badger Meter, Inc. (b) | 23,797 | 2,894,191 | |
| Bel Fuse, Inc. Class B (non-vtg.) | 247,393 | 8,787,399 | |
| Belden, Inc. | 206,731 | 17,443,962 | |
| Cognex Corp. | 518,945 | 24,608,372 | |
| CTS Corp. | 23,777 | 1,029,782 | |
| ePlus, Inc. (a) | 164,018 | 8,884,855 | |
| Fabrinet (a) | 29,908 | 3,644,888 | |
| Flex Ltd. (a) | 556,952 | 12,676,228 | |
| Identiv, Inc. (a) | 769,113 | 5,399,173 | |
| Insight Enterprises, Inc. (a) | 43,247 | 5,791,638 | |
| IPG Photonics Corp. (a) | 26,942 | 3,320,332 | |
| Jabil, Inc. | 137,909 | 11,450,584 | |
| Littelfuse, Inc. | 14,366 | 3,716,915 | |
| Methode Electronics, Inc. Class A | 30,300 | 1,476,519 | |
| Napco Security Technologies, Inc. (a) | 22,260 | 703,416 | |
| Novanta, Inc. (a) | 30,349 | 4,762,062 | |
| Par Technology Corp. (a)(b) | 182,519 | 6,233,024 | |
| Powerfleet, Inc. (a) | 1,588,444 | 4,415,874 | |
| Richardson Electronics Ltd. | 211,192 | 4,430,808 | |
| Sanmina Corp. (a) | 112,822 | 6,821,218 | |
| ScanSource, Inc. (a) | 54,100 | 1,686,838 | |
| TD SYNNEX Corp. | 227,179 | 21,927,317 | |
| Trimble, Inc. (a) | 386,963 | 20,145,294 | |
| TTM Technologies, Inc. (a) | 142,900 | 1,899,141 | |
| Vishay Intertechnology, Inc. | 130,300 | 2,766,269 | |
| Vontier Corp. | 287,858 | 7,533,244 | |
| Zebra Technologies Corp. Class A (a) | 19,009 | 5,707,452 | |
| 224,528,627 | |||
| IT Services - 2.7% | |||
| Amdocs Ltd. | 122,476 | 11,220,026 | |
| Broadridge Financial Solutions, Inc. | 61,659 | 8,680,354 | |
| Cass Information Systems, Inc. (b) | 9,873 | 477,360 | |
| Concentrix Corp. | 33,381 | 4,567,856 | |
| CSG Systems International, Inc. | 23,897 | 1,343,011 | |
| Digitalocean Holdings, Inc. (a)(b) | 34,765 | 1,111,785 | |
| DXC Technology Co. (a) | 123,247 | 3,418,872 | |
| Euronet Worldwide, Inc. (a) | 137,247 | 14,939,336 | |
| EVERTEC, Inc. (b) | 210,614 | 7,752,701 | |
| ExlService Holdings, Inc. (a) | 24,552 | 4,039,050 | |
| Fastly, Inc. Class A (a) | 167,998 | 2,333,492 | |
| FleetCor Technologies, Inc. (a) | 17,406 | 3,738,635 | |
| Flywire Corp. (a) | 137,157 | 3,391,893 | |
| Genpact Ltd. | 307,040 | 14,655,019 | |
| Globant SA (a) | 45,728 | 7,548,778 | |
| GoDaddy, Inc. (a) | 20,900 | 1,582,339 | |
| Hackett Group, Inc. (b) | 22,130 | 412,503 | |
| i3 Verticals, Inc. Class A (a) | 315,440 | 7,762,978 | |
| International Money Express, Inc. (a) | 241,249 | 6,163,912 | |
| Jack Henry & Associates, Inc. | 59,975 | 9,850,294 | |
| MongoDB, Inc. Class A (a) | 9,700 | 2,032,344 | |
| Okta, Inc. (a) | 167,801 | 11,962,533 | |
| Payoneer Global, Inc. (a) | 605,159 | 3,509,922 | |
| Repay Holdings Corp. (a) | 954,097 | 8,090,743 | |
| Shift4 Payments, Inc. (a) | 63,596 | 4,101,942 | |
| SS&C Technologies Holdings, Inc. | 357,119 | 20,962,885 | |
| The Western Union Co. (b) | 468,352 | 6,069,842 | |
| Twilio, Inc. Class A (a) | 178,655 | 12,007,403 | |
| Verra Mobility Corp. (a) | 123,797 | 2,133,022 | |
| WEX, Inc. (a) | 168,005 | 32,393,044 | |
| 218,253,874 | |||
| Semiconductors & Semiconductor Equipment - 2.1% | |||
| ACM Research, Inc. | 182,447 | 1,893,800 | |
| Allegro MicroSystems LLC (a) | 240,144 | 10,489,490 | |
| Amkor Technology, Inc. | 369,512 | 9,518,629 | |
| AXT, Inc. (a) | 301,829 | 1,318,993 | |
| Cirrus Logic, Inc. (a) | 12,900 | 1,325,475 | |
| Diodes, Inc. (a) | 39,000 | 3,575,910 | |
| Entegris, Inc. (b) | 193,122 | 16,459,788 | |
| FormFactor, Inc. (a) | 186,265 | 5,606,577 | |
| GlobalFoundries, Inc. (a)(b) | 155,212 | 10,141,552 | |
| Kulicke & Soffa Industries, Inc. (b) | 204,001 | 10,873,253 | |
| Lattice Semiconductor Corp. (a) | 166,691 | 14,162,067 | |
| MACOM Technology Solutions Holdings, Inc. (a) | 119,092 | 8,162,566 | |
| Monolithic Power Systems, Inc. (b) | 4,437 | 2,148,795 | |
| NVE Corp. | 3,702 | 281,278 | |
| onsemi (a) | 121,160 | 9,378,996 | |
| Photronics, Inc. (a) | 50,032 | 881,564 | |
| Power Integrations, Inc. | 248,138 | 20,409,351 | |
| Qorvo, Inc. (a) | 22,400 | 2,259,936 | |
| Semtech Corp. (a) | 51,619 | 1,590,381 | |
| Silicon Laboratories, Inc. (a) | 26,855 | 4,794,423 | |
| Skyworks Solutions, Inc. | 17,237 | 1,923,132 | |
| SMART Global Holdings, Inc. (a) | 147,569 | 2,464,402 | |
| SolarEdge Technologies, Inc. (a)(b) | 4,400 | 1,398,848 | |
| Synaptics, Inc. (a) | 74,465 | 8,757,829 | |
| Teradyne, Inc. | 76,743 | 7,761,787 | |
| Universal Display Corp. | 65,524 | 8,901,435 | |
| 166,480,257 | |||
| Software - 4.8% | |||
| 8x8, Inc. (a)(b) | 1,062,450 | 5,652,234 | |
| ACI Worldwide, Inc. (a) | 526,116 | 13,600,099 | |
| Adobe, Inc. (a) | 13,165 | 4,264,802 | |
| American Software, Inc. Class A | 29,588 | 400,622 | |
| AppLovin Corp. (a) | 230,659 | 3,113,897 | |
| Black Knight, Inc. (a) | 286,402 | 17,069,559 | |
| Blackbaud, Inc. (a) | 31,400 | 1,748,666 | |
| Box, Inc. Class A (a) | 77,031 | 2,568,984 | |
| Ceridian HCM Holding, Inc. (a) | 27,800 | 2,027,454 | |
| Check Point Software Technologies Ltd. (a) | 51,500 | 6,371,580 | |
| Clearwater Analytics Holdings, Inc. (a)(b) | 446,015 | 7,675,918 | |
| CommVault Systems, Inc. (a) | 119,280 | 7,023,206 | |
| Consensus Cloud Solutions, Inc. (a) | 246,697 | 10,124,445 | |
| Couchbase, Inc. (a) | 519,529 | 8,447,542 | |
| CyberArk Software Ltd. (a) | 45,894 | 6,644,074 | |
| Descartes Systems Group, Inc. (a) | 71,695 | 5,282,488 | |
| Digital Turbine, Inc. (a) | 342,997 | 3,683,788 | |
| Dolby Laboratories, Inc. Class A | 50,079 | 4,120,500 | |
| Domo, Inc. Class B (a) | 140,570 | 2,160,561 | |
| Dropbox, Inc. Class A (a) | 223,829 | 4,566,112 | |
| Dynatrace, Inc. (a) | 291,857 | 12,412,678 | |
| E2open Parent Holdings, Inc. (a)(b) | 254,217 | 1,576,145 | |
| Elastic NV (a) | 35,600 | 2,101,112 | |
| Five9, Inc. (a) | 106,114 | 7,003,524 | |
| Freshworks, Inc. (a)(b) | 183,372 | 2,739,578 | |
| Gen Digital, Inc. | 570,480 | 11,130,065 | |
| Guidewire Software, Inc. (a) | 117,818 | 8,272,002 | |
| HubSpot, Inc. (a) | 40,372 | 15,618,312 | |
| InterDigital, Inc. (b) | 59,191 | 4,320,351 | |
| Manhattan Associates, Inc. (a) | 223,683 | 32,154,431 | |
| Momentive Global, Inc. (a) | 1,663,950 | 11,481,255 | |
| Monday.com Ltd. (a)(b) | 90,806 | 14,049,504 | |
| N-able, Inc. (a) | 748,972 | 8,867,828 | |
| nCino, Inc. (a)(b) | 263,735 | 7,186,779 | |
| NCR Corp. (a)(b) | 361,298 | 9,223,938 | |
| Oracle Corp. | 50,066 | 4,375,768 | |
| Paycor HCM, Inc. (a)(b) | 172,517 | 4,273,246 | |
| Paylocity Holding Corp. (a) | 79,062 | 15,228,132 | |
| Porch Group, Inc. Class A (a)(b) | 2,455,781 | 6,139,453 | |
| PTC, Inc. (a) | 59,454 | 7,451,370 | |
| Q2 Holdings, Inc. (a) | 199,101 | 6,426,980 | |
| Qualtrics International, Inc. (a) | 665,269 | 11,256,351 | |
| Qualys, Inc. (a) | 28,386 | 3,353,806 | |
| Rapid7, Inc. (a) | 61,927 | 2,929,147 | |
| Rimini Street, Inc. (a) | 252,847 | 1,082,185 | |
| ServiceNow, Inc. (a) | 2,929 | 1,265,826 | |
| Similarweb Ltd. (a)(b) | 1,135,227 | 7,469,794 | |
| Smartsheet, Inc. (a) | 291,390 | 12,826,988 | |
| SolarWinds, Inc. (a) | 34,437 | 293,403 | |
| Splunk, Inc. (a) | 1,570 | 160,925 | |
| Sumo Logic, Inc. (a) | 214,001 | 2,540,192 | |
| Tenable Holdings, Inc. (a) | 156,079 | 6,903,374 | |
| Tyler Technologies, Inc. (a) | 44,722 | 14,366,943 | |
| WalkMe Ltd. (a) | 352,058 | 3,467,771 | |
| Workday, Inc. Class A (a) | 20,251 | 3,755,953 | |
| Workiva, Inc. (a) | 19,500 | 1,739,400 | |
| 381,991,040 | |||
| Technology Hardware, Storage & Peripherals - 0.6% | |||
| Avid Technology, Inc. (a) | 370,274 | 10,760,162 | |
| Immersion Corp. (b) | 538,844 | 4,122,157 | |
| NetApp, Inc. | 50,498 | 3,259,646 | |
| Seagate Technology Holdings PLC (b) | 63,100 | 4,073,736 | |
| Super Micro Computer, Inc. (a) | 215,431 | 21,105,775 | |
| Western Digital Corp. (a) | 19,200 | 738,816 | |
| Xerox Holdings Corp. | 164,200 | 2,707,658 | |
| 46,767,950 | |||
TOTAL INFORMATION TECHNOLOGY | 1,082,699,095 | ||
| MATERIALS - 4.4% | |||
| Chemicals - 1.8% | |||
| Albemarle Corp. | 18,682 | 4,751,019 | |
| Ashland, Inc. | 49,715 | 5,059,993 | |
| Aspen Aerogels, Inc. (a) | 156,678 | 1,699,956 | |
| Avient Corp. | 153,221 | 6,685,032 | |
| Axalta Coating Systems Ltd. (a) | 646,274 | 19,258,965 | |
| Cabot Corp. | 79,197 | 6,298,537 | |
| Celanese Corp. Class A | 15,500 | 1,801,565 | |
| CF Industries Holdings, Inc. | 18,918 | 1,624,867 | |
| Chase Corp. | 5,709 | 559,139 | |
| Eastman Chemical Co. | 31,600 | 2,692,320 | |
| Ecovyst, Inc. (a) | 399,827 | 4,014,263 | |
| FMC Corp. | 56,021 | 7,235,112 | |
| Huntsman Corp. | 421,710 | 12,372,971 | |
| Ingevity Corp. (a) | 59,488 | 4,911,329 | |
| Innospec, Inc. | 34,550 | 3,781,843 | |
| Koppers Holdings, Inc. (b) | 78,800 | 2,828,132 | |
| LSB Industries, Inc. (a) | 165,327 | 2,246,794 | |
| Mativ, Inc. | 135,504 | 3,510,909 | |
| Minerals Technologies, Inc. | 26,504 | 1,610,118 | |
| Olin Corp. | 162,168 | 9,365,202 | |
| Perimeter Solutions SA (a)(b) | 662,978 | 5,675,092 | |
| RPM International, Inc. | 56,540 | 5,011,140 | |
| Sensient Technologies Corp. (b) | 32,278 | 2,433,438 | |
| The Chemours Co. LLC | 165,200 | 5,646,536 | |
| The Mosaic Co. | 81,800 | 4,350,942 | |
| Trinseo PLC (b) | 37,300 | 864,614 | |
| Tronox Holdings PLC (b) | 232,164 | 3,621,758 | |
| Valvoline, Inc. | 487,594 | 17,163,309 | |
| 147,074,895 | |||
| Construction Materials - 0.1% | |||
| Eagle Materials, Inc. | 45,193 | 6,341,482 | |
| Containers & Packaging - 1.7% | |||
| Aptargroup, Inc. | 189,844 | 22,158,592 | |
| Berry Global Group, Inc. | 702,675 | 43,636,118 | |
| CCL Industries, Inc. Class B (b) | 372,900 | 17,935,820 | |
| Crown Holdings, Inc. | 114,128 | 9,873,213 | |
| Graphic Packaging Holding Co. | 830,517 | 19,766,305 | |
| Greif, Inc. Class A | 107,700 | 7,652,085 | |
| O-I Glass, Inc. (a) | 138,600 | 3,079,692 | |
| Ranpak Holdings Corp. (A Shares) (a) | 752,533 | 4,740,958 | |
| Silgan Holdings, Inc. | 65,807 | 3,514,094 | |
| TriMas Corp. | 87,199 | 2,615,098 | |
| WestRock Co. | 91,500 | 2,873,100 | |
| 137,845,075 | |||
| Metals & Mining - 0.8% | |||
| Alcoa Corp. | 29,000 | 1,419,260 | |
| ATI, Inc. (a)(b) | 233,560 | 9,494,214 | |
| Commercial Metals Co. | 28,800 | 1,490,400 | |
| Materion Corp. | 15,668 | 1,749,802 | |
| Reliance Steel & Aluminum Co. | 80,121 | 19,857,189 | |
| Steel Dynamics, Inc. (b) | 205,845 | 25,959,113 | |
| 59,969,978 | |||
| Paper & Forest Products - 0.0% | |||
| Sylvamo Corp. | 26,922 | 1,328,062 | |
| West Fraser Timber Co. Ltd. (b) | 31,323 | 2,351,104 | |
| 3,679,166 | |||
TOTAL MATERIALS | 354,910,596 | ||
| REAL ESTATE - 2.7% | |||
| Equity Real Estate Investment Trusts (REITs) - 2.4% | |||
| Alexanders, Inc. | 1,743 | 381,560 | |
| American Assets Trust, Inc. | 48,500 | 1,223,655 | |
| American Homes 4 Rent Class A | 65,300 | 2,025,606 | |
| Americold Realty Trust | 100,694 | 2,960,404 | |
| Apartment Income (REIT) Corp. | 182,466 | 6,897,215 | |
| Apartment Investment & Management Co. Class A | 123,832 | 928,740 | |
| Apple Hospitality (REIT), Inc. | 322,200 | 5,319,522 | |
| Brandywine Realty Trust (SBI) | 307,700 | 1,812,353 | |
| Brixmor Property Group, Inc. | 140,900 | 3,189,976 | |
| Broadstone Net Lease, Inc. | 330,070 | 5,858,743 | |
| Camden Property Trust (SBI) | 65,223 | 7,484,991 | |
| City Office REIT, Inc. | 261,000 | 2,208,060 | |
| CorEnergy Infrastructure Trust, Inc. (b) | 84,100 | 132,037 | |
| Cousins Properties, Inc. (b) | 255,542 | 6,258,224 | |
| CubeSmart | 467,068 | 21,947,525 | |
| EastGroup Properties, Inc. | 107,731 | 17,589,240 | |
| EPR Properties | 46,300 | 1,890,892 | |
| Equity Commonwealth | 350,318 | 7,437,251 | |
| Essex Property Trust, Inc. | 12,091 | 2,757,473 | |
| Franklin Street Properties Corp. | 275,093 | 665,725 | |
| Gaming & Leisure Properties | 49,300 | 2,656,284 | |
| Global Net Lease, Inc. | 190,184 | 2,685,398 | |
| Highwoods Properties, Inc. (SBI) | 77,902 | 2,064,403 | |
| Hudson Pacific Properties, Inc. | 109,083 | 1,006,836 | |
| Industrial Logistics Properties Trust | 121,900 | 499,790 | |
| LXP Industrial Trust (REIT) | 261,500 | 2,727,445 | |
| Medical Properties Trust, Inc. (b) | 218,700 | 2,252,610 | |
| Mid-America Apartment Communities, Inc. | 65,337 | 10,460,454 | |
| National Retail Properties, Inc. | 182,859 | 8,287,170 | |
| Office Properties Income Trust | 132,285 | 2,174,765 | |
| Omega Healthcare Investors, Inc. | 143,700 | 3,849,723 | |
| Outfront Media, Inc. | 500,996 | 8,742,380 | |
| Physicians Realty Trust (b) | 495,449 | 7,347,509 | |
| Piedmont Office Realty Trust, Inc. Class A | 308,600 | 2,823,690 | |
| Plymouth Industrial REIT, Inc. | 102,500 | 2,217,075 | |
| Ryman Hospitality Properties, Inc. | 75,670 | 7,019,906 | |
| Sabra Health Care REIT, Inc. | 267,400 | 3,184,734 | |
| Service Properties Trust | 254,722 | 2,796,848 | |
| Spirit Realty Capital, Inc. | 71,858 | 2,959,112 | |
| Stag Industrial, Inc. | 180,635 | 6,076,561 | |
| Sun Communities, Inc. | 35,027 | 5,013,765 | |
| Tanger Factory Outlet Centers, Inc. | 158,900 | 3,001,621 | |
| Uniti Group, Inc. | 315,720 | 1,733,303 | |
| Universal Health Realty Income Trust (SBI) | 10,311 | 546,689 | |
| Urstadt Biddle Properties, Inc. Class A | 139,752 | 2,417,710 | |
| 193,514,973 | |||
| Real Estate Management & Development - 0.3% | |||
| Cushman & Wakefield PLC (a)(b) | 776,629 | 10,049,579 | |
| Douglas Elliman, Inc. | 30,015 | 126,663 | |
| Jones Lang LaSalle, Inc. (a) | 7,664 | 1,337,061 | |
| Kennedy-Wilson Holdings, Inc. | 136,548 | 2,281,717 | |
| Newmark Group, Inc. | 623,628 | 5,001,497 | |
| 18,796,517 | |||
TOTAL REAL ESTATE | 212,311,490 | ||
| UTILITIES - 0.9% | |||
| Electric Utilities - 0.3% | |||
| Allete, Inc. | 28,800 | 1,762,272 | |
| IDACORP, Inc. | 152,630 | 15,781,942 | |
| NRG Energy, Inc. | 184,000 | 6,033,360 | |
| OGE Energy Corp. | 53,800 | 1,921,736 | |
| Pinnacle West Capital Corp. | 38,729 | 2,853,553 | |
| 28,352,863 | |||
| Gas Utilities - 0.3% | |||
| Atmos Energy Corp. | 90,530 | 10,212,689 | |
| National Fuel Gas Co. | 38,900 | 2,228,192 | |
| Southwest Gas Corp. (b) | 154,638 | 9,743,740 | |
| UGI Corp. | 78,300 | 2,915,109 | |
| 25,099,730 | |||
| Independent Power and Renewable Electricity Producers - 0.2% | |||
| The AES Corp. | 64,184 | 1,584,061 | |
| Vistra Corp. | 580,046 | 12,755,212 | |
| 14,339,273 | |||
| Multi-Utilities - 0.1% | |||
| CenterPoint Energy, Inc. | 84,111 | 2,339,968 | |
| NorthWestern Energy Corp. | 36,047 | 2,082,796 | |
| 4,422,764 | |||
TOTAL UTILITIES | 72,214,630 | ||
| TOTAL COMMON STOCKS (Cost $5,080,492,592) | 6,358,350,266 | ||
| Equity Funds - 18.8% | |||
| Shares | Value ($) | ||
| Mid-Cap Blend Funds - 5.6% | |||
| Fidelity SAI Small-Mid Cap 500 Index Fund (e) | 78,241,119 | 445,974,380 | |
| Sector Funds - 1.0% | |||
| Fidelity SAI Real Estate Index Fund (e) | 11,589,841 | 81,244,783 | |
| Small Blend Funds - 3.1% | |||
| Fidelity Small Cap Discovery Fund (e) | 49,454 | 1,236,850 | |
| Fidelity Small Cap Index Fund (e) | 3,625,071 | 84,935,420 | |
| PIMCO StocksPLUS Small Fund Institutional Class | 23,504,983 | 164,299,831 | |
TOTAL SMALL BLEND FUNDS | 250,472,101 | ||
| Small Growth Funds - 9.1% | |||
| Fidelity Advisor Small Cap Growth Fund Class Z (a)(e) | 17,294,980 | 447,939,948 | |
| T. Rowe Price Institutional Small-Cap Stock Fund | 10,850,248 | 279,176,873 | |
TOTAL SMALL GROWTH FUNDS | 727,116,821 | ||
| TOTAL EQUITY FUNDS (Cost $1,715,074,599) | 1,504,808,085 | ||
| Money Market Funds - 9.4% | |||
| Shares | Value ($) | ||
| Fidelity Cash Central Fund 4.63% (f) | 3,636,338 | 3,637,066 | |
| Fidelity Securities Lending Cash Central Fund 4.63% (f)(g) | 608,446,261 | 608,507,105 | |
| State Street Institutional U.S. Government Money Market Fund Premier Class 4.43% (h) | 139,087,214 | 139,087,214 | |
| TOTAL MONEY MARKET FUNDS (Cost $751,231,385) | 751,231,385 | ||
| TOTAL INVESTMENT IN SECURITIES - 107.5% (Cost $7,546,798,576) | 8,614,389,736 |
NET OTHER ASSETS (LIABILITIES) - (7.5)% | (603,607,334) |
| NET ASSETS - 100.0% | 8,010,782,402 |
| Futures Contracts | |||||
Number of contracts | Expiration Date | Notional Amount ($) | Value ($) | Unrealized Appreciation/ (Depreciation) ($) | |
| Purchased | |||||
| Equity Index Contracts | |||||
| CME E-mini Russell 2000 Index Contracts (United States) | 13 | Mar 2023 | 1,234,415 | (9,109) | (9,109) |
| CME E-mini S&P MidCap 400 Index Contracts (United States) | 2 | Mar 2023 | 520,640 | 33,612 | 33,612 |
| TOTAL FUTURES CONTRACTS | 24,503 | ||||
| The notional amount of futures purchased as a percentage of Net Assets is 0.0% | |||||
| (a) | Non-income producing |
| (b) | Security or a portion of the security is on loan at period end. |
| (c) | Affiliated company |
| (d) | Level 3 security |
| (e) | Affiliated Fund |
| (f) | Affiliated fund that is generally available only to investment companies and other accounts managed by Fidelity Investments. The rate quoted is the annualized seven-day yield of the fund at period end. A complete unaudited listing of the fund's holdings as of its most recent quarter end is available upon request. In addition, each Fidelity Central Fund's financial statements, which are not covered by the Fund's Report of Independent Registered Public Accounting Firm, are available on the SEC's website or upon request. |
| (g) | Investment made with cash collateral received from securities on loan. |
| (h) | The rate quoted is the annualized seven-day yield of the fund at period end. |
| Affiliate | Value, beginning of period ($) | Purchases ($) | Sales Proceeds ($) | Dividend Income ($) | Realized Gain (loss) ($) | Change in Unrealized appreciation (depreciation) ($) | Value, end of period ($) | % ownership, end of period |
| Fidelity Cash Central Fund 4.63% | 5,130,595 | 214,455,574 | 215,949,103 | 121,340 | - | - | 3,637,066 | 0.0% |
| Fidelity Securities Lending Cash Central Fund 4.63% | 765,963,874 | 2,615,983,634 | 2,773,440,403 | 2,676,479 | - | - | 608,507,105 | 1.9% |
| Total | 771,094,469 | 2,830,439,208 | 2,989,389,506 | 2,797,819 | - | - | 612,144,171 | |
| Affiliate | Value, beginning of period ($) | Purchases ($) | Sales Proceeds ($) | Dividend Income ($) | Realized Gain (loss) ($) | Change in Unrealized appreciation (depreciation) ($) | Value, end of period ($) |
| Fidelity Advisor Small Cap Growth Fund Class Z | 487,996,936 | - | 5,523,613 | - | (2,322,105) | (32,211,270) | 447,939,948 |
| Fidelity SAI Real Estate Index Fund | 93,540,259 | 31,260,831 | - | 31,260,831 | - | (43,556,307) | 81,244,783 |
| Fidelity SAI Small-Mid Cap 500 Index Fund | 272,603,118 | 966,082,626 | 671,040,938 | 105,629,006 | (112,575,462) | (9,094,964) | 445,974,380 |
| Fidelity Small Cap Discovery Fund | 66,095,114 | 4,353,992 | 53,300,000 | 4,390,540 | 8,157,290 | (24,069,546) | 1,236,850 |
| Fidelity Small Cap Index Fund | 371,280,266 | 750,910,370 | 1,002,486,063 | 872,720 | 58,344,071 | (93,113,224) | 84,935,420 |
| 1,291,515,693 | 1,752,607,819 | 1,732,350,614 | 142,153,097 | (48,396,206) | (202,045,311) | 1,061,331,381 |
| Affiliate | Value, beginning of period ($) | Purchases ($) | Sales Proceeds ($) | Dividend Income ($) | Realized Gain (loss) ($) | Change in Unrealized appreciation (depreciation) ($) | Value, end of period ($) |
| Acacia Research Corp. | 6,831,571 | 3,377,965 | 116,787 | - | (43,164) | 1,014,091 | 11,063,676 |
| Acacia Research Corp. rights 3/1/23 | - | - | - | - | - | 6 | 6 |
| Total | 6,831,571 | 3,377,965 | 116,787 | - | (43,164) | 1,014,097 | 11,063,682 |
| Valuation Inputs at Reporting Date: | ||||
| Description | Total ($) | Level 1 ($) | Level 2 ($) | Level 3 ($) |
Investments in Securities: | ||||
| Equities: | ||||
Communication Services | 146,767,160 | 146,767,160 | - | - |
Consumer Discretionary | 856,899,769 | 856,899,769 | - | - |
Consumer Staples | 261,395,718 | 261,395,718 | - | - |
Energy | 232,380,931 | 232,380,931 | - | - |
Financials | 916,987,923 | 916,987,917 | 6 | - |
Health Care | 816,897,013 | 816,882,017 | - | 14,996 |
Industrials | 1,404,885,941 | 1,404,885,941 | - | - |
Information Technology | 1,082,699,095 | 1,082,699,095 | - | - |
Materials | 354,910,596 | 354,910,596 | - | - |
Real Estate | 212,311,490 | 212,311,490 | - | - |
Utilities | 72,214,630 | 72,214,630 | - | - |
| Equity Funds | 1,504,808,085 | 1,504,808,085 | - | - |
| Money Market Funds | 751,231,385 | 751,231,385 | - | - |
| Total Investments in Securities: | 8,614,389,736 | 8,614,374,734 | 6 | 14,996 |
Derivative Instruments: | ||||
| Assets | ||||
Futures Contracts | 33,612 | 33,612 | - | - |
| Total Assets | 33,612 | 33,612 | - | - |
| Liabilities | ||||
Futures Contracts | (9,109) | (9,109) | - | - |
| Total Liabilities | (9,109) | (9,109) | - | - |
| Total Derivative Instruments: | 24,503 | 24,503 | - | - |
Primary Risk Exposure / Derivative Type | Value | |
| Asset ($) | Liability ($) | |
| Equity Risk | ||
Futures Contracts (a) | 33,612 | (9,109) |
| Total Equity Risk | 33,612 | (9,109) |
| Total Value of Derivatives | 33,612 | (9,109) |
| Statement of Assets and Liabilities | ||||
| February 28, 2023 | ||||
| Assets | ||||
| Investment in securities, at value (including securities loaned of $593,223,322) - See accompanying schedule: | ||||
Unaffiliated issuers (cost $5,699,429,049) | $ | 6,929,850,502 | ||
Fidelity Central Funds (cost $612,144,171) | 612,144,171 | |||
Other affiliated issuers (cost $1,235,225,356) | 1,072,395,063 | |||
| Total Investment in Securities (cost $7,546,798,576) | $ | 8,614,389,736 | ||
| Segregated cash with brokers for derivative instruments | 96,600 | |||
| Cash | 58,417 | |||
| Foreign currency held at value (cost $173,322) | 172,611 | |||
| Receivable for investments sold | 24,017,493 | |||
| Receivable for fund shares sold | 4,851,379 | |||
| Dividends receivable | 6,608,617 | |||
| Interest receivable | 513,810 | |||
| Distributions receivable from Fidelity Central Funds | 155,874 | |||
| Other receivables | 351,533 | |||
Total assets | 8,651,216,070 | |||
| Liabilities | ||||
| Payable for investments purchased | $ | 24,204,920 | ||
| Payable for fund shares redeemed | 5,020,726 | |||
| Accrued management fee | 2,162,167 | |||
| Payable for daily variation margin on futures contracts | 819 | |||
| Other payables and accrued expenses | 545,364 | |||
| Collateral on securities loaned | 608,499,672 | |||
| Total Liabilities | 640,433,668 | |||
| Net Assets | $ | 8,010,782,402 | ||
| Net Assets consist of: | ||||
| Paid in capital | $ | 7,030,092,154 | ||
| Total accumulated earnings (loss) | 980,690,248 | |||
| Net Assets | $ | 8,010,782,402 | ||
Net Asset Value , offering price and redemption price per share ($8,010,782,402 ÷ 569,270,018 shares) | $ | 14.07 | ||
| Statement of Operations | ||||
Year ended February 28, 2023 | ||||
| Investment Income | ||||
| Dividends: | ||||
| Unaffiliated issuers | $ | 89,885,057 | ||
| Affiliated issuers | 7,436,855 | |||
| Interest | 3,246,372 | |||
| Income from Fidelity Central Funds (including $2,676,479 from security lending) | 2,797,819 | |||
| Total Income | 103,366,103 | |||
| Expenses | ||||
| Management fee | $ | 47,276,307 | ||
| Custodian fees and expenses | 174,230 | |||
| Independent trustees' fees and expenses | 54,566 | |||
| Registration fees | 75,358 | |||
| Audit | 82,167 | |||
| Legal | 29,959 | |||
| Miscellaneous | 135,694 | |||
| Total expenses before reductions | 47,828,281 | |||
| Expense reductions | (20,616,075) | |||
| Total expenses after reductions | 27,212,206 | |||
| Net Investment income (loss) | 76,153,897 | |||
| Realized and Unrealized Gain (Loss) | ||||
| Net realized gain (loss) on: | ||||
| Investment Securities: | ||||
| Unaffiliated issuers | (12,219,089) | |||
| Affiliated issuers | (48,439,370) | |||
| Foreign currency transactions | (56,251) | |||
| Futures contracts | (85,959) | |||
| Capital gain distributions from underlying funds: | ||||
| Unaffiliated issuers | 46,242,287 | |||
| Affiliated issuers | 134,716,242 | |||
| Total net realized gain (loss) | 120,157,860 | |||
| Change in net unrealized appreciation (depreciation) on: | ||||
| Investment Securities: | ||||
| Unaffiliated issuers | (610,488,722) | |||
| Affiliated issuers | (201,031,214) | |||
| Assets and liabilities in foreign currencies | 35,689 | |||
| Futures contracts | 9,875 | |||
| Total change in net unrealized appreciation (depreciation) | (811,474,372) | |||
| Net gain (loss) | (691,316,512) | |||
| Net increase (decrease) in net assets resulting from operations | $ | (615,162,615) | ||
| Statement of Changes in Net Assets | ||||
Year ended February 28, 2023 | Year ended February 28, 2022 | |||
| Increase (Decrease) in Net Assets | ||||
| Operations | ||||
| Net investment income (loss) | $ | 76,153,897 | $ | 91,740,715 |
| Net realized gain (loss) | 120,157,860 | 1,231,502,341 | ||
| Change in net unrealized appreciation (depreciation) | (811,474,372) | (1,050,008,515) | ||
| Net increase (decrease) in net assets resulting from operations | (615,162,615) | 273,234,541 | ||
| Distributions to shareholders | (468,095,077) | (1,588,171,662) | ||
| Share transactions | ||||
| Proceeds from sales of shares | 1,519,191,608 | 2,795,392,205 | ||
| Reinvestment of distributions | 449,566,228 | 1,559,302,156 | ||
| Cost of shares redeemed | (2,646,106,935) | (2,294,618,359) | ||
Net increase (decrease) in net assets resulting from share transactions | (677,349,099) | 2,060,076,002 | ||
| Total increase (decrease) in net assets | (1,760,606,791) | 745,138,881 | ||
| Net Assets | ||||
| Beginning of period | 9,771,389,193 | 9,026,250,312 | ||
| End of period | $ | 8,010,782,402 | $ | 9,771,389,193 |
| Other Information | ||||
| Shares | ||||
| Sold | 109,890,523 | �� | 156,832,175 | |
| Issued in reinvestment of distributions | 31,691,128 | 89,520,194 | ||
| Redeemed | (189,244,531) | (128,714,090) | ||
| Net increase (decrease) | (47,662,880) | 117,638,279 | ||
| Strategic Advisers® Small-Mid Cap Fund |
| Years ended February 28, | 2023 | 2022 | 2021 | 2020 A | 2019 | |||||
Selected Per-Share Data | ||||||||||
| Net asset value, beginning of period | $ | 15.84 | $ | 18.08 | $ | 12.87 | $ | 13.62 | $ | 14.86 |
| Income from Investment Operations | ||||||||||
Net investment income (loss) B,C | .13 | .17 | .14 | .13 | .11 | |||||
| Net realized and unrealized gain (loss) | (1.12) | .61 | 5.63 | (.41) | .11 | |||||
| Total from investment operations | (.99) | .78 | 5.77 | (.28) | .22 | |||||
| Distributions from net investment income | (.12) | (.19) | (.16) | (.13) | (.11) | |||||
| Distributions from net realized gain | (.67) | (2.84) | (.40) | (.34) | (1.35) | |||||
| Total distributions | (.78) D | (3.02) D | (.56) | (.47) | (1.46) | |||||
| Net asset value, end of period | $ | 14.07 | $ | 15.84 | $ | 18.08 | $ | 12.87 | $ | 13.62 |
Total Return E | (6.19)% | 3.45% | 46.31% | (2.40)% | 2.64% | |||||
Ratios to Average Net Assets C,F,G | ||||||||||
| Expenses before reductions | .58% | .60% | .62% | .65% | .73% | |||||
| Expenses net of fee waivers, if any | .33% | .35% | .37% | .40% | .48% | |||||
| Expenses net of all reductions | .33% | .35% | .37% | .40% | .48% | |||||
| Net investment income (loss) | .92% | .96% | 1.02% | .96% | .77% | |||||
| Supplemental Data | ||||||||||
| Net assets, end of period (000 omitted) | $ | 8,010,782 | $ | 9,771,389 | $ | 9,026,250 | $ | 6,975,346 | $ | 8,081,562 |
Portfolio turnover rate H | 80% | 61% | 104% | 67% | 82% |
| Strategic Advisers Small-Mid Cap Fund | $91,802 |
| Gross unrealized appreciation | $1,648,544,369 |
| Gross unrealized depreciation | (750,873,976) |
| Net unrealized appreciation (depreciation) | $897,670,393 |
| Tax Cost | $7,715,391,993 |
| Undistributed ordinary income | $5,686,423 |
| Undistributed long-term capital gain | $79,596,760 |
| Net unrealized appreciation (depreciation) on securities and other investments | $897,706,167 |
| February 28, 2023 | February 28, 2022 | |
| Ordinary Income | $69,211,966 | $511,725,844 |
| Long-term Capital Gains | 398,883,111 | 1,076,445,818 |
| Total | $468,095,077 | $1,588,171,662 |
| Equity Risk | Equity risk relates to the fluctuations in the value of financial instruments as a result of changes in market prices (other than those arising from interest rate risk or foreign exchange risk), whether caused by factors specific to an individual investment, its issuer, or all factors affecting all instruments traded in a market or market segment. |
| Purchases ($) | Sales ($) | |
| Strategic Advisers Small-Mid Cap Fund | 6,541,903,112 | 7,343,741,485 |
| Amount | |
| Strategic Advisers Small-Mid Cap Fund | $12,917 |
| Purchases ($) | Sales ($) | Realized Gain (Loss) ($) | |
| Strategic Advisers Small-Mid Cap Fund | 31,055,351 | 30,141,923 | (1,985,534) |
| Amount ($) | |
| Strategic Advisers Small-Mid Cap Fund | 18,118 |
| Fidelity Central Fund | Investment Manager | Investment Objective | Investment Practices | Expense Ratio A |
| Fidelity Money Market Central Funds | Fidelity Management & Research Company LLC (FMR) | Each fund seeks to obtain a high level of current income consistent with the preservation of capital and liquidity. | Short-term Investments | Less than .005% |
| Amount | |
| Strategic Advisers Small-Mid Cap Fund | $15,149 |
| Total Security Lending Fees Paid to NFS | Security Lending Income From Securities Loaned to NFS | Value of Securities Loaned to NFS at Period End | |
| Strategic Advisers Small-Mid Cap Fund | $282,096 | $- | $- |
| Fund | Strategic Advisers Small-Mid Cap Fund |
| Fidelity SAI Real Estate Index Fund | 99% |
| Fidelity SAI Small-Mid Cap 500 Index Fund | 36% |
| The Example is based on an investment of $1,000 invested at the beginning of the period and held for the entire period (September 1, 2022 to February 28, 2023). |
Annualized Expense Ratio- A | Beginning Account Value September 1, 2022 | Ending Account Value February 28, 2023 | Expenses Paid During Period- C September 1, 2022 to February 28, 2023 | |||||||
| Strategic Advisers® Small-Mid Cap Fund | .33% | |||||||||
| Actual | $ 1,000 | $ 1,062.60 | $ 1.69 | |||||||
Hypothetical- B | $ 1,000 | $ 1,023.16 | $ 1.66 | |||||||


- Highly liquid investments - cash or convertible to cash within three business days or less
- Moderately liquid investments - convertible to cash in three to seven calendar days
- Less liquid investments - can be sold or disposed of, but not settled, within seven calendar days
- Illiquid investments - cannot be sold or disposed of within seven calendar days
 |


Contents
| Average Annual Total Returns | |||
Periods ended February 28, 2023 | Past 1 year | Past 5 years | Past 10 years |
| Strategic Advisers® International Fund | -5.30% | 3.22% | 5.27% |
| $10,000 Over 10 Years |
Let's say hypothetically that $10,000 was invested in Strategic Advisers® International Fund on February 28, 2013. The chart shows how the value of your investment would have changed, and also shows how the MSCI EAFE Index performed over the same period. |
 |
Top Holdings (% of Fund's net assets) | ||
| (excluding cash equivalents) | ||
| Fidelity SAI Japan Stock Index Fund | 5.2 | |
| Artisan International Value Fund Investor Class | 4.9 | |
| Fidelity Advisor International Discovery Fund Class Z | 4.9 | |
| Fidelity Overseas Fund | 3.9 | |
| Fidelity SAI International Low Volatility Index Fund | 3.8 | |
| Fidelity SAI International Value Index Fund | 3.6 | |
| Oakmark International Fund Investor Class | 3.4 | |
| Fidelity Diversified International Fund | 3.0 | |
| iShares MSCI EAFE Value ETF | 2.7 | |
| JOHCM International Select Fund Investor Shares | 2.1 | |
| 37.5 | ||
Asset Allocation (% of Fund's net assets) |
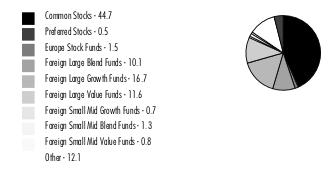 |
Percentages shown as 0.0% may reflect amounts less than 0.05%. |
| Common Stocks - 44.7% | |||
| Shares | Value ($) | ||
| COMMUNICATION SERVICES - 1.5% | |||
| Diversified Telecommunication Services - 0.8% | |||
| Bezeq The Israel Telecommunication Corp. Ltd. | 145,093 | 200,876 | |
| Cellnex Telecom SA (a) | 169,870 | 6,373,318 | |
| Deutsche Telekom AG | 1,869,637 | 41,960,395 | |
| Hellenic Telecommunications Organization SA | 256,389 | 3,937,572 | |
| KT Corp. | 178,210 | 4,110,184 | |
| Liberty Global PLC Class C (b) | 384,300 | 8,166,375 | |
| Nippon Telegraph & Telephone Corp. | 741,600 | 21,489,209 | |
| Orange SA | 1,619,241 | 18,485,745 | |
| Proximus | 292,378 | 2,696,644 | |
| PT Telkom Indonesia Persero Tbk | 14,104,900 | 3,593,025 | |
| Telefonica SA | 1,400,994 | 5,715,326 | |
| Telia Co. AB | 2,417,681 | 6,243,384 | |
| 122,972,053 | |||
| Entertainment - 0.1% | |||
| CTS Eventim AG (b) | 43,119 | 2,836,753 | |
| G-bits Network Technology Xiamen Co. Ltd. (A Shares) | 9,700 | 493,856 | |
| NetEase, Inc. ADR | 73,307 | 5,691,555 | |
| Nintendo Co. Ltd. | 276,000 | 10,332,634 | |
| Square Enix Holdings Co. Ltd. | 93,500 | 4,168,374 | |
| 23,523,172 | |||
| Interactive Media & Services - 0.2% | |||
| carsales.com Ltd. | 230,660 | 3,521,740 | |
| Hemnet Group AB | 63,702 | 1,012,003 | |
| NAVER Corp. | 43,063 | 6,795,870 | |
| SEEK Ltd. | 162,049 | 2,636,654 | |
| Tencent Holdings Ltd. | 333,500 | 14,650,124 | |
| Z Holdings Corp. | 1,321,300 | 3,547,228 | |
| 32,163,619 | |||
| Media - 0.2% | |||
| CyberAgent, Inc. | 523,200 | 4,480,564 | |
| Hakuhodo DY Holdings, Inc. | 13,500 | 150,512 | |
| Informa PLC | 992,269 | 7,977,693 | |
| Stroeer SE & Co. KGaA | 49,767 | 2,795,107 | |
| WPP PLC | 765,886 | 9,419,774 | |
| 24,823,650 | |||
| Wireless Telecommunication Services - 0.2% | |||
| Advanced Info Service PCL (For. Reg.) | 970,900 | 5,568,083 | |
| KDDI Corp. | 272,900 | 7,984,475 | |
| SoftBank Group Corp. | 135,600 | 5,483,838 | |
| Tele2 AB (B Shares) | 126,106 | 1,160,590 | |
| Vodafone Group PLC sponsored ADR | 513,802 | 6,150,210 | |
| 26,347,196 | |||
TOTAL COMMUNICATION SERVICES | 229,829,690 | ||
| CONSUMER DISCRETIONARY - 3.6% | |||
| Auto Components - 0.3% | |||
| Autoliv, Inc. (depositary receipt) | 60,289 | 5,557,784 | |
| Brembo SpA | 57,486 | 907,180 | |
| Bridgestone Corp. | 151,100 | 5,798,520 | |
| Compagnie Generale des Etablissements Michelin SCA Series B | 373,566 | 11,735,970 | |
| Continental AG | 8,647 | 620,786 | |
| DENSO Corp. | 129,100 | 6,863,904 | |
| Eagle Industry Co. Ltd. | 2,700 | 23,836 | |
| JTEKT Corp. | 72,300 | 540,040 | |
| Koito Manufacturing Co. Ltd. | 383,800 | 6,446,701 | |
| Magna International, Inc. Class A (c) | 138,191 | 7,701,384 | |
| Stanley Electric Co. Ltd. | 171,100 | 3,568,903 | |
| TPR Co. Ltd. | 19,100 | 195,692 | |
| Valeo SA | 264,162 | 5,514,041 | |
| 55,474,741 | |||
| Automobiles - 0.5% | |||
| Bayerische Motoren Werke AG (BMW) | 82,163 | 8,494,847 | |
| Bayerische Motoren Werke AG (BMW) ADR | 94,204 | 3,241,560 | |
| BYD Co. Ltd. (A Shares) | 66,100 | 2,486,353 | |
| Ferrari NV | 13,860 | 3,608,728 | |
| Honda Motor Co. Ltd. | 720,600 | 18,737,890 | |
| Honda Motor Co. Ltd. sponsored ADR | 39,240 | 1,019,063 | |
| Mazda Motor Corp. | 39,800 | 356,093 | |
| Mercedes-Benz Group AG (Germany) | 149,186 | 11,434,028 | |
| Nissan Motor Co. Ltd. | 162,500 | 630,887 | |
| Stellantis NV | 423,878 | 7,410,990 | |
| Stellantis NV (Italy) | 490,610 | 8,590,172 | |
| Suzuki Motor Corp. | 146,400 | 5,142,897 | |
| Toyota Motor Corp. | 873,200 | 11,901,348 | |
| Volkswagen AG | 4,566 | 811,197 | |
| Volkswagen AG ADR | 4,903 | 66,779 | |
| Yamaha Motor Co. Ltd. | 18,500 | 473,523 | |
| 84,406,355 | |||
| Distributors - 0.0% | |||
| Inchcape PLC | 474,243 | 5,191,033 | |
| Diversified Consumer Services - 0.0% | |||
| Global Kids Co. Corp. | 89,700 | 542,199 | |
| IDP Education Ltd. | 47,954 | 926,099 | |
| 1,468,298 | |||
| Hotels, Restaurants & Leisure - 0.6% | |||
| Aristocrat Leisure Ltd. | 258,470 | 6,355,200 | |
| Compass Group PLC | 1,810,947 | 41,836,149 | |
| Entain PLC | 406,700 | 6,650,662 | |
| Evolution AB (a) | 31,006 | 3,751,643 | |
| Flutter Entertainment PLC (b) | 18,959 | 3,041,024 | |
| Food & Life Companies Ltd. | 48,000 | 1,216,261 | |
| Greggs PLC | 59,424 | 1,938,488 | |
| Sands China Ltd. (b) | 1,578,000 | 5,468,138 | |
| Sodexo SA | 79,200 | 7,349,966 | |
| Whitbread PLC | 128,555 | 4,776,594 | |
| Yum China Holdings, Inc. | 109,166 | 6,411,319 | |
| 88,795,444 | |||
| Household Durables - 0.4% | |||
| Barratt Developments PLC | 725,700 | 4,094,813 | |
| Berkeley Group Holdings PLC | 114,978 | 5,803,122 | |
| Electrolux AB (B Shares) | 15,496 | 188,030 | |
| Panasonic Holdings Corp. | 658,300 | 5,748,294 | |
| Persimmon PLC | 581,749 | 10,163,967 | |
| SEB SA | 9,319 | 1,078,324 | |
| Sekisui Chemical Co. Ltd. | 15,100 | 202,398 | |
| Sony Group Corp. | 364,000 | 30,436,400 | |
| Tama Home Co. Ltd. | 64,800 | 1,615,776 | |
| 59,331,124 | |||
| Internet & Direct Marketing Retail - 0.2% | |||
| Alibaba Group Holding Ltd. (b) | 760,700 | 8,361,192 | |
| Alibaba Group Holding Ltd. sponsored ADR (b) | 14,311 | 1,256,363 | |
| ASOS PLC (b)(c) | 166,195 | 1,749,192 | |
| JD.com, Inc. Class A | 102,500 | 2,278,568 | |
| Meituan Class B (a)(b) | 24,250 | 420,857 | |
| MercadoLibre, Inc. (b) | 2,777 | 3,387,940 | |
| Rakuten Group, Inc. | 1,354,000 | 6,682,737 | |
| Zalando SE (a)(b) | 188,396 | 7,492,418 | |
| ZOZO, Inc. | 141,000 | 3,133,820 | |
| 34,763,087 | |||
| Leisure Products - 0.1% | |||
| Sega Sammy Holdings, Inc. | 275,400 | 4,708,833 | |
| Yamaha Corp. | 114,600 | 4,351,526 | |
| 9,060,359 | |||
| Multiline Retail - 0.1% | |||
| Dollarama, Inc. | 86,038 | 4,969,963 | |
| Harvey Norman Holdings Ltd. | 58,986 | 152,813 | |
| Next PLC | 78,500 | 6,460,471 | |
| 11,583,247 | |||
| Specialty Retail - 0.4% | |||
| China Tourism Group Duty Free Corp. Ltd. (A Shares) | 96,000 | 2,735,697 | |
| EDION Corp. | 52,900 | 512,080 | |
| H&M Hennes & Mauritz AB (B Shares) | 565,149 | 7,121,099 | |
| Industria de Diseno Textil SA | 590,332 | 18,186,220 | |
| Kingfisher PLC | 5,188,865 | 17,944,967 | |
| Premier Investments Ltd. | 12,524 | 230,405 | |
| WH Smith PLC | 647,482 | 12,305,415 | |
| 59,035,883 | |||
| Textiles, Apparel & Luxury Goods - 1.0% | |||
| adidas AG | 43,471 | 6,492,258 | |
| Brunello Cucinelli SpA | 27,104 | 2,284,832 | |
| Burberry Group PLC | 269,224 | 7,994,490 | |
| Compagnie Financiere Richemont SA: | |||
| warrants 11/22/23 (b) | 562,417 | 656,855 | |
| Series A | 309,256 | 46,727,453 | |
| Dr. Martens Ltd. | 691,900 | 1,330,771 | |
| Hermes International SCA | 3,489 | 6,330,736 | |
| Kering SA | 20,565 | 12,057,696 | |
| lululemon athletica, Inc. (b) | 8,333 | 2,576,564 | |
| LVMH Moet Hennessy Louis Vuitton SE | 53,637 | 44,589,899 | |
| Moncler SpA | 156,139 | 9,545,567 | |
| NIKE, Inc. Class B | 44,445 | 5,279,622 | |
| Samsonite International SA (a)(b) | 1,209,000 | 3,388,539 | |
| Swatch Group AG (Bearer) | 9,726 | 3,378,826 | |
| Swatch Group AG (Bearer): | |||
| ADR (c) | 43,419 | 750,771 | |
| (Reg.) | 36,553 | 2,334,409 | |
| 155,719,288 | |||
TOTAL CONSUMER DISCRETIONARY | 564,828,859 | ||
| CONSUMER STAPLES - 4.9% | |||
| Beverages - 1.2% | |||
| Anheuser-Busch InBev SA NV | 650,188 | 39,439,505 | |
| Anheuser-Busch InBev SA NV ADR (c) | 110,193 | 6,688,715 | |
| Asahi Group Holdings | 64,700 | 2,288,533 | |
| Diageo PLC | 1,298,516 | 55,104,435 | |
| Heineken Holding NV | 131,249 | 11,237,646 | |
| Heineken NV (Bearer) | 65,391 | 6,674,332 | |
| ITO EN Ltd. | 105,100 | 3,543,087 | |
| Kirin Holdings Co. Ltd. | 1,436,200 | 21,507,927 | |
| Kweichow Moutai Co. Ltd. (A Shares) | 19,000 | 4,970,297 | |
| Pernod Ricard SA | 174,694 | 36,529,789 | |
| Suntory Beverage & Food Ltd. | 95,400 | 3,349,212 | |
| Treasury Wine Estates Ltd. | 1,312 | 12,369 | |
| 191,345,847 | |||
| Food & Staples Retailing - 0.7% | |||
| Alimentation Couche-Tard, Inc. Class A (multi-vtg.) | 328,793 | 15,423,994 | |
| Bid Corp. Ltd. | 110,710 | 2,424,588 | |
| Carrefour SA | 707,866 | 13,994,131 | |
| Coles Group Ltd. | 545,127 | 6,668,714 | |
| GrainCorp Ltd. | 261,644 | 1,385,594 | |
| Jeronimo Martins SGPS SA | 24,797 | 509,344 | |
| Metro, Inc. | 96,059 | 4,989,155 | |
| Ocado Group PLC (b) | 151,365 | 999,197 | |
| Qol Holdings Co. Ltd. | 56,400 | 493,352 | |
| Raia Drogasil SA | 254,200 | 1,101,196 | |
| Seven & i Holdings Co. Ltd. | 631,900 | 28,250,210 | |
| Sugi Holdings Co. Ltd. | 56,000 | 2,344,387 | |
| Sundrug Co. Ltd. | 5,900 | 159,682 | |
| Tesco PLC | 4,155,552 | 12,730,064 | |
| Wal-Mart de Mexico SA de CV Series V | 1,652,500 | 6,503,786 | |
| Welcia Holdings Co. Ltd. | 110,200 | 2,411,118 | |
| Woolworths Group Ltd. | 212,744 | 5,285,299 | |
| 105,673,811 | |||
| Food Products - 1.3% | |||
| Barry Callebaut AG | 2,531 | 5,035,934 | |
| Britannia Industries Ltd. | 23,853 | 1,287,750 | |
| Danone SA | 656,380 | 36,896,676 | |
| Ezaki Glico Co. Ltd. | 146,800 | 3,687,386 | |
| Foshan Haitian Flavouring & Food Co. Ltd. (A Shares) | 154,137 | 1,826,951 | |
| Itoham Yonekyu Holdings, Inc. | 110,400 | 578,940 | |
| Kewpie Corp. | 17,200 | 278,045 | |
| Lindt & Spruengli AG (participation certificate) | 305 | 3,341,933 | |
| Megmilk Snow Brand Co. Ltd. | 126,700 | 1,645,225 | |
| Nestle SA (Reg. S) | 1,073,022 | 120,898,080 | |
| NH Foods Ltd. | 4,100 | 113,224 | |
| Orior AG | 1,980 | 150,731 | |
| Toyo Suisan Kaisha Ltd. | 284,500 | 11,513,312 | |
| WH Group Ltd. (a) | 649,500 | 377,963 | |
| Wilmar International Ltd. | 2,777,600 | 8,115,795 | |
| Yakult Honsha Co. Ltd. | 6,700 | 457,148 | |
| Yamazaki Baking Co. Ltd. | 6,100 | 70,832 | |
| 196,275,925 | |||
| Household Products - 0.6% | |||
| Essity AB (B Shares) | 563,918 | 15,245,395 | |
| Henkel AG & Co. KGaA | 17,592 | 1,216,398 | |
| Lion Corp. | 289,100 | 3,117,027 | |
| Niitaka Co. Ltd. | 78,000 | 1,211,634 | |
| Reckitt Benckiser Group PLC | 1,071,085 | 74,317,251 | |
| 95,107,705 | |||
| Personal Products - 0.9% | |||
| Beiersdorf AG | 77,113 | 9,203,099 | |
| Haleon PLC | 2,307,812 | 8,937,176 | |
| Hindustan Unilever Ltd. | 108,625 | 3,234,172 | |
| Kao Corp. | 202,300 | 7,536,074 | |
| Kobayashi Pharmaceutical Co. Ltd. | 69,700 | 4,197,716 | |
| Kose Corp. | 22,100 | 2,498,028 | |
| L'Oreal SA | 77,756 | 30,734,843 | |
| Pola Orbis Holdings, Inc. | 8,100 | 103,276 | |
| Proya Cosmetics Co. Ltd. (A Shares) | 49,400 | 1,300,300 | |
| Rohto Pharmaceutical Co. Ltd. | 642,000 | 11,670,155 | |
| Unilever PLC | 1,177,793 | 58,639,388 | |
| 138,054,227 | |||
| Tobacco - 0.2% | |||
| British American Tobacco PLC: | |||
| (United Kingdom) | 591,081 | 22,369,930 | |
| sponsored ADR | 53,597 | 2,039,902 | |
| Imperial Brands PLC | 84,500 | 2,035,713 | |
| Japan Tobacco, Inc. | 177,600 | 3,611,567 | |
| Scandinavian Tobacco Group A/S (a) | 45,594 | 792,398 | |
| 30,849,510 | |||
TOTAL CONSUMER STAPLES | 757,307,025 | ||
| ENERGY - 2.5% | |||
| Energy Equipment & Services - 0.1% | |||
| Tenaris SA | 375,541 | 6,178,457 | |
| Tenaris SA sponsored ADR | 166,881 | 5,508,742 | |
| WorleyParsons Ltd. | 676,727 | 6,907,957 | |
| 18,595,156 | |||
| Oil, Gas & Consumable Fuels - 2.4% | |||
| Aker BP ASA | 280,091 | 7,560,040 | |
| BP Castrol KK | 10,600 | 69,444 | |
| BP PLC | 5,960,509 | 39,169,679 | |
| BP PLC sponsored ADR | 484,767 | 19,196,773 | |
| ENEOS Holdings, Inc. | 1,032,500 | 3,566,411 | |
| Eni SpA | 2,564,736 | 36,224,411 | |
| Eni SpA sponsored ADR | 6,480 | 183,773 | |
| Equinor ASA | 672,005 | 20,572,325 | |
| Equinor ASA sponsored ADR (c) | 44,438 | 1,355,803 | |
| Galp Energia SGPS SA Class B | 1,083,490 | 13,247,845 | |
| Gazprom OAO (d) | 3,670,010 | 476,130 | |
| Gazprom OAO sponsored ADR (Reg. S) (b)(d) | 33,845 | 7,732 | |
| Idemitsu Kosan Co. Ltd. | 181,600 | 4,048,004 | |
| INPEX Corp. | 534,400 | 5,624,437 | |
| Japan Petroleum Exploration Co. Ltd. | 18,600 | 675,532 | |
| LUKOIL PJSC (d) | 35,755 | 13,721 | |
| OMV AG | 123,777 | 6,036,672 | |
| Parkland Corp. | 69,772 | 1,525,831 | |
| Petroleo Brasileiro SA - Petrobras (ON) | 232,900 | 1,278,949 | |
| Petronet LNG Ltd. | 536,380 | 1,444,387 | |
| Reliance Industries Ltd. | 364,542 | 10,244,625 | |
| Repsol SA | 539,539 | 8,562,909 | |
| Rosneft Oil Co. OJSC (d) | 420,640 | 87,218 | |
| San-Ai Obbli Co. Ltd. | 55,400 | 568,424 | |
| Santos Ltd. | 2,482,500 | 11,591,812 | |
| Shell PLC: | |||
| ADR | 217,983 | 13,246,827 | |
| (London) | 337,295 | 10,216,119 | |
| rights (b)(e) | 337,295 | 96,972 | |
| TotalEnergies SE | 1,856,275 | 114,540,010 | |
| TotalEnergies SE sponsored ADR | 180,265 | 11,160,206 | |
| Woodside Energy Group Ltd. | 46,739 | 1,135,644 | |
| Woodside Energy Group Ltd. | 1,341,969 | 32,515,902 | |
| 376,244,567 | |||
TOTAL ENERGY | 394,839,723 | ||
| FINANCIALS - 7.8% | |||
| Banks - 3.7% | |||
| ABN AMRO Bank NV GDR (a) | 129,541 | 2,288,844 | |
| Agricultural Bank of China Ltd.: | |||
| (A Shares) | 8,206,400 | 3,467,960 | |
| (H Shares) | 559,000 | 193,707 | |
| AIB Group PLC | 4,890,824 | 20,930,057 | |
| ANZ Group Holdings Ltd. | 342,472 | 5,664,994 | |
| Banco Bilbao Vizcaya Argentaria SA | 439,141 | 3,413,459 | |
| Banco Bilbao Vizcaya Argentaria SA sponsored ADR | 52,074 | 404,094 | |
| Banco Santander SA (Spain) | 1,326,511 | 5,223,014 | |
| Banco Santander SA (Spain) sponsored ADR | 146,996 | 574,754 | |
| Bank Leumi le-Israel BM | 71,660 | 557,643 | |
| Bank of China Ltd.: | |||
| (A Shares) | 620,800 | 289,206 | |
| (H Shares) | 9,426,000 | 3,457,005 | |
| Bank of Communications Co. Ltd. (A Shares) | 399,114 | 282,063 | |
| Bank of Ireland Group PLC | 1,588,723 | 17,526,492 | |
| Bank of Suzhou Co. Ltd. | 271,520 | 293,709 | |
| Barclays PLC | 13,574,411 | 28,487,097 | |
| Barclays PLC sponsored ADR | 252,713 | 2,137,952 | |
| BNP Paribas SA | 801,264 | 56,017,319 | |
| CaixaBank SA | 3,578,178 | 15,364,241 | |
| Chiba Bank Ltd. | 881,500 | 6,454,816 | |
| China Construction Bank Corp. (H Shares) | 3,034,000 | 1,854,616 | |
| China Zheshang Bank Co. Ltd. (b) | 1,550,100 | 652,824 | |
| Credicorp Ltd. (United States) | 9,355 | 1,192,014 | |
| DBS Group Holdings Ltd. | 1,111,600 | 28,168,172 | |
| DNB Bank ASA | 1,191,022 | 23,767,104 | |
| Erste Group Bank AG | 93,207 | 3,665,392 | |
| FinecoBank SpA | 177,198 | 3,064,355 | |
| First Abu Dhabi Bank PJSC | 394,748 | 1,513,177 | |
| First International Bank of Israel | 2,775 | 98,364 | |
| Haci Omer Sabanci Holding A/S | 239,579 | 552,865 | |
| HDFC Bank Ltd. (b) | 856,890 | 16,577,120 | |
| Hokuhoku Financial Group, Inc. | 118,600 | 915,490 | |
| Huaxia Bank Co. Ltd. (A Shares) | 1,331,700 | 1,002,607 | |
| Industrial & Commercial Bank of China Ltd. (H Shares) | 6,707,000 | 3,346,539 | |
| Industrial Bank Co. Ltd. (A Shares) | 576,100 | 1,405,061 | |
| ING Groep NV (Certificaten Van Aandelen) | 2,459,135 | 34,415,891 | |
| Intesa Sanpaolo SpA | 1,079,959 | 2,917,276 | |
| Jyske Bank A/S (Reg.) (b) | 61,526 | 5,158,460 | |
| KBC Group NV | 251,356 | 18,796,248 | |
| Kyushu Financial Group, Inc. | 227,200 | 866,048 | |
| Lloyds Banking Group PLC | 32,727,787 | 20,668,602 | |
| Lloyds Banking Group PLC sponsored ADR | 143,256 | 362,438 | |
| Mebuki Financial Group, Inc. | 1,059,300 | 2,847,518 | |
| Mitsubishi UFJ Financial Group, Inc. | 2,350,500 | 16,663,854 | |
| Mizrahi Tefahot Bank Ltd. | 40,604 | 1,208,095 | |
| National Bank of Canada | 155,994 | 11,457,471 | |
| NatWest Group PLC | 4,813,312 | 16,908,893 | |
| Nordea Bank ABP | 363,094 | 4,600,763 | |
| Nordea Bank ABP (Helsinki Stock Exchange) | 142,346 | 1,801,591 | |
| North Pacific Bank Ltd. | 726,500 | 1,691,458 | |
| PT Bank Central Asia Tbk | 14,792,500 | 8,487,500 | |
| Resona Holdings, Inc. | 2,279,500 | 12,554,787 | |
| Sberbank of Russia (b)(d) | 1,813,540 | 13,824 | |
| Shizuoka Financial Group | 39,000 | 311,645 | |
| Skandinaviska Enskilda Banken AB (A Shares) (c) | 370,400 | 4,637,077 | |
| Societe Generale Series A | 290,400 | 8,369,203 | |
| Standard Chartered PLC (United Kingdom) | 453,736 | 4,279,978 | |
| Sumitomo Mitsui Financial Group, Inc. | 640,100 | 27,955,639 | |
| Sumitomo Mitsui Trust Holdings, Inc. | 115,500 | 4,279,279 | |
| Svenska Handelsbanken AB (A Shares) (c) | 958,563 | 10,167,445 | |
| Swedbank AB (A Shares) | 827,783 | 16,906,764 | |
| Sydbank A/S | 81,583 | 4,157,376 | |
| The Hachijuni Bank Ltd. | 484,600 | 2,192,454 | |
| The Toronto-Dominion Bank | 115,483 | 7,688,993 | |
| Turkiye Is Bankasi A/S Series C | 1,744,342 | 1,049,284 | |
| UniCredit SpA | 2,480,905 | 50,755,702 | |
| United Overseas Bank Ltd. | 464,700 | 10,300,372 | |
| Westpac Banking Corp. | 304,000 | 4,608,773 | |
| 579,884,827 | |||
| Capital Markets - 1.5% | |||
| 3i Group PLC | 174,381 | 3,411,634 | |
| Amundi SA (a) | 109,300 | 7,213,852 | |
| Anima Holding SpA (a) | 156,672 | 677,762 | |
| Azimut Holding SpA | 41,794 | 993,298 | |
| B3 SA - Brasil Bolsa Balcao | 1,133,300 | 2,283,723 | |
| Bridgepoint Group Holdings Ltd. (a) | 992,616 | 2,980,145 | |
| Deutsche Borse AG | 171,237 | 29,859,288 | |
| Euronext NV (a) | 300,510 | 21,976,109 | |
| Guotai Junan Securities Co. Ltd. (A Shares) | 252,200 | 519,794 | |
| Hithink RoyalFlush Information Network Co. Ltd. (A Shares) | 55,600 | 950,270 | |
| Hong Kong Exchanges and Clearing Ltd. | 227,500 | 9,111,982 | |
| Intermediate Capital Group PLC | 134,942 | 2,275,656 | |
| Julius Baer Group Ltd. | 370,826 | 24,552,433 | |
| London Stock Exchange Group PLC | 235,472 | 21,009,238 | |
| Macquarie Group Ltd. | 224,341 | 28,609,761 | |
| Nomura Holdings, Inc. | 1,359,700 | 5,603,741 | |
| Northeast Securities Co. Ltd. (A Shares) | 66,900 | 66,095 | |
| Partners Group Holding AG | 5,184 | 4,918,429 | |
| SBI Holdings, Inc. Japan | 465,200 | 10,034,831 | |
| UBS Group AG | 2,164,003 | 46,986,103 | |
| XP, Inc. Class A (b) | 131,487 | 1,633,069 | |
| 225,667,213 | |||
| Diversified Financial Services - 0.3% | |||
| Challenger Ltd. | 565,903 | 2,852,163 | |
| Element Fleet Management Corp. | 702,602 | 10,035,700 | |
| EXOR NV | 49,200 | 4,056,948 | |
| Groupe Bruxelles Lambert SA | 76,400 | 6,425,874 | |
| Housing Development Finance Corp. Ltd. | 187,989 | 5,935,603 | |
| Investor AB (B Shares) | 54,200 | 1,048,999 | |
| Mitsubishi UFJ Lease & Finance Co. Ltd. | 600,000 | 3,133,194 | |
| ORIX Corp. | 1,017,400 | 18,243,782 | |
| Shanghai AJ Group Co. Ltd. (A Shares) | 274,700 | 231,776 | |
| 51,964,039 | |||
| Insurance - 2.3% | |||
| AIA Group Ltd. | 2,553,000 | 27,133,328 | |
| Allianz SE | 71,744 | 16,846,458 | |
| Aon PLC | 45,470 | 13,825,154 | |
| ASR Nederland NV | 67,678 | 3,082,365 | |
| Assicurazioni Generali SpA | 179,198 | 3,546,251 | |
| Aviva PLC | 564,075 | 3,028,813 | |
| AXA SA | 1,370,649 | 43,191,196 | |
| Beazley PLC | 1,050,742 | 8,632,335 | |
| Dai-ichi Mutual Life Insurance Co. | 467,900 | 9,977,949 | |
| Definity Financial Corp. | 66,111 | 1,740,350 | |
| Direct Line Insurance Group PLC | 1,075,308 | 2,332,709 | |
| Gjensidige Forsikring ASA | 67,300 | 1,195,027 | |
| Hannover Reuck SE | 16,563 | 3,218,182 | |
| Hiscox Ltd. | 765,621 | 10,498,570 | |
| Intact Financial Corp. | 44,013 | 6,322,454 | |
| Japan Post Holdings Co. Ltd. | 1,062,900 | 9,445,918 | |
| Japan Post Insurance Co. Ltd. | 40,900 | 709,528 | |
| Legal & General Group PLC | 2,401,800 | 7,392,964 | |
| Manulife Financial Corp. | 315,503 | 6,238,381 | |
| MAPFRE SA (Reg.) | 1,272,068 | 2,728,606 | |
| MS&AD Insurance Group Holdings, Inc. | 151,300 | 4,947,212 | |
| MS&AD Insurance Group Holdings, Inc. ADR | 5,200 | 84,656 | |
| Muenchener Rueckversicherungs-Gesellschaft AG in Muenchen | 51,374 | 17,719,713 | |
| NN Group NV | 196,509 | 7,960,562 | |
| NN Group NV ADR | 12,694 | 255,784 | |
| People's Insurance Co. of China Group Ltd. (A Shares) | 448,800 | 337,891 | |
| PICC Property & Casualty Co. Ltd. (H Shares) | 5,278,000 | 4,632,892 | |
| Ping An Insurance Group Co. of China Ltd. (H Shares) | 426,500 | 2,911,518 | |
| Poste Italiane SpA (a) | 36,071 | 389,153 | |
| Prudential PLC | 2,136,787 | 32,656,408 | |
| Sampo Oyj (A Shares) | 212,799 | 10,362,568 | |
| Sompo Holdings, Inc. | 27,500 | 1,179,336 | |
| Steadfast Group Ltd. | 410,723 | 1,611,269 | |
| Storebrand ASA (A Shares) | 808,504 | 6,695,492 | |
| Sun Life Financial, Inc. | 206,654 | 9,986,636 | |
| Swiss Life Holding AG | 2,006 | 1,205,922 | |
| Swiss Re Ltd. | 47,351 | 4,936,952 | |
| Talanx AG | 93,100 | 4,446,990 | |
| Tokio Marine Holdings, Inc. | 845,200 | 17,943,157 | |
| Willis Towers Watson PLC | 21,815 | 5,112,563 | |
| Zurich Insurance Group Ltd. | 87,431 | 41,473,184 | |
| 357,936,396 | |||
| Thrifts & Mortgage Finance - 0.0% | |||
| Paragon Banking Group PLC | 60,016 | 430,615 | |
TOTAL FINANCIALS | 1,215,883,090 | ||
| HEALTH CARE - 5.2% | |||
| Biotechnology - 0.1% | |||
| Abcam PLC ADR (b) | 61,785 | 890,322 | |
| CSL Ltd. | 38,354 | 7,647,031 | |
| Genmab A/S (b) | 20,194 | 7,597,973 | |
| Vitrolife AB | 31,356 | 631,433 | |
| 16,766,759 | |||
| Health Care Equipment & Supplies - 0.8% | |||
| Alcon, Inc. (Switzerland) | 76,826 | 5,233,483 | |
| Carl Zeiss Meditec AG | 15,043 | 2,009,557 | |
| Coloplast A/S Series B | 21,431 | 2,476,269 | |
| ConvaTec Group PLC (a) | 3,140,877 | 8,477,841 | |
| Elekta AB (B Shares) | 588,380 | 4,598,897 | |
| EssilorLuxottica SA | 111,764 | 19,434,181 | |
| Hoya Corp. | 112,100 | 11,090,206 | |
| InMode Ltd. (b) | 44,952 | 1,587,255 | |
| Koninklijke Philips Electronics NV | 1,628,504 | 26,588,243 | |
| Olympus Corp. | 342,000 | 5,762,168 | |
| Siemens Healthineers AG (a) | 172,802 | 9,018,568 | |
| Smith & Nephew PLC | 766,900 | 10,942,558 | |
| Straumann Holding AG | 27,688 | 3,670,758 | |
| Terumo Corp. | 193,500 | 5,202,919 | |
| 116,092,903 | |||
| Health Care Providers & Services - 0.1% | |||
| Amplifon SpA | 46,100 | 1,335,048 | |
| Apollo Hospitals Enterprise Ltd. | 22,731 | 1,210,647 | |
| CVS Group PLC | 53,403 | 1,205,064 | |
| Fresenius Medical Care AG & Co. KGaA sponsored ADR (c) | 84,628 | 1,663,786 | |
| Fresenius SE & Co. KGaA | 419,353 | 11,545,598 | |
| Galenica AG (a) | 22,705 | 1,756,181 | |
| Max Healthcare Institute Ltd. (b) | 164,919 | 850,287 | |
| Medipal Holdings Corp. | 14,500 | 190,096 | |
| Sonic Healthcare Ltd. | 2,627 | 56,938 | |
| Suzuken Co. Ltd. | 55,500 | 1,402,225 | |
| 21,215,870 | |||
| Health Care Technology - 0.0% | |||
| Pro Medicus Ltd. | 35,917 | 1,474,523 | |
| Life Sciences Tools & Services - 0.4% | |||
| Agilent Technologies, Inc. | 61,975 | 8,798,591 | |
| Bruker Corp. | 125,938 | 8,679,647 | |
| Evotec OAI AG (b) | 118,345 | 2,128,575 | |
| ICON PLC (b) | 36,508 | 8,237,300 | |
| Lonza Group AG | 15,491 | 9,227,086 | |
| QIAGEN NV (Germany) (b) | 259,165 | 11,940,616 | |
| Sartorius Stedim Biotech | 11,232 | 3,667,383 | |
| Siegfried Holding AG | 1,842 | 1,287,845 | |
| Tecan Group AG | 5,158 | 2,085,434 | |
| 56,052,477 | |||
| Pharmaceuticals - 3.8% | |||
| Astellas Pharma, Inc. | 1,878,200 | 26,374,786 | |
| AstraZeneca PLC: | |||
| (United Kingdom) | 255,676 | 33,308,981 | |
| sponsored ADR | 248,823 | 16,218,283 | |
| Bayer AG | 951,990 | 56,530,359 | |
| GSK PLC | 1,526,540 | 26,151,035 | |
| GSK PLC sponsored ADR | 811,493 | 27,809,865 | |
| Ipsen SA | 17,990 | 2,056,929 | |
| Kyowa Hakko Kirin Co., Ltd. | 488,100 | 10,449,939 | |
| Merck KGaA | 54,068 | 10,256,618 | |
| Novartis AG | 1,059,295 | 89,150,399 | |
| Novartis AG sponsored ADR | 25,563 | 2,150,360 | |
| Novo Nordisk A/S Series B | 308,194 | 43,534,027 | |
| Ono Pharmaceutical Co. Ltd. | 10,500 | 214,388 | |
| Otsuka Holdings Co. Ltd. | 242,600 | 7,349,794 | |
| Roche Holding AG: | |||
| (participation certificate) | 473,582 | 136,552,151 | |
| sponsored ADR | 25,897 | 933,587 | |
| Sanofi SA | 779,752 | 72,905,512 | |
| Sanofi SA sponsored ADR | 77,040 | 3,609,324 | |
| Santen Pharmaceutical Co. Ltd. | 770,200 | 5,883,060 | |
| Sumitomo Dainippon Pharma Co., Ltd. | 15,700 | 98,359 | |
| Taisho Pharmaceutical Holdings Co. Ltd. | 7,300 | 287,915 | |
| Takeda Pharmaceutical Co. Ltd. | 803,000 | 24,751,914 | |
| 596,577,585 | |||
TOTAL HEALTH CARE | 808,180,117 | ||
| INDUSTRIALS - 8.0% | |||
| Aerospace & Defense - 0.8% | |||
| Airbus Group NV | 66,226 | 8,673,656 | |
| Dassault Aviation SA | 20,200 | 3,476,173 | |
| Leonardo SpA | 100,033 | 1,123,119 | |
| MTU Aero Engines AG | 74,560 | 18,019,993 | |
| Rolls-Royce Holdings PLC (b) | 34,937,027 | 60,870,760 | |
| Safran SA | 109,932 | 15,522,562 | |
| Thales SA | 90,303 | 12,626,882 | |
| 120,313,145 | |||
| Air Freight & Logistics - 0.2% | |||
| Deutsche Post AG | 492,008 | 20,807,499 | |
| DSV A/S | 51,501 | 9,375,062 | |
| Konoike Transport Co. Ltd. | 17,700 | 194,608 | |
| Nippon Express Holdings, Inc. | 6,400 | 357,240 | |
| Sankyu, Inc. | 19,400 | 713,848 | |
| 31,448,257 | |||
| Airlines - 0.4% | |||
| Deutsche Lufthansa AG (b) | 50,137 | 520,860 | |
| InterGlobe Aviation Ltd. (a)(b) | 82,209 | 1,846,557 | |
| Ryanair Holdings PLC sponsored ADR (b) | 457,161 | 42,410,826 | |
| Turk Hava Yollari AO (b) | 1,487,852 | 11,313,505 | |
| 56,091,748 | |||
| Building Products - 0.3% | |||
| AGC, Inc. | 73,300 | 2,713,319 | |
| Belimo Holding AG (Reg.) | 3,415 | 1,769,411 | |
| Compagnie de St. Gobain | 109,400 | 6,500,844 | |
| Daikin Industries Ltd. | 119,900 | 20,502,263 | |
| Dare Power Dekor Home Co. Ltd. (A Shares) | 311,302 | 442,703 | |
| Geberit AG (Reg.) | 14,842 | 8,020,999 | |
| Kingspan Group PLC (Ireland) | 48,601 | 3,165,537 | |
| Noritz Corp. | 13,600 | 164,413 | |
| Sekisui Jushi Corp. | 57,400 | 833,039 | |
| Xinyi Glass Holdings Ltd. | 444,000 | 829,240 | |
| 44,941,768 | |||
| Commercial Services & Supplies - 0.1% | |||
| Boyd Group Services, Inc. | 6,472 | 1,023,947 | |
| Japan Elevator Service Holdings Co. Ltd. | 67,600 | 990,503 | |
| Nippon Kanzai Co. Ltd. | 8,300 | 157,886 | |
| Rentokil Initial PLC | 828,406 | 5,095,637 | |
| Ritchie Bros. Auctioneers, Inc. | 71,172 | 4,354,297 | |
| Secom Co. Ltd. | 52,200 | 3,037,572 | |
| Toppan, Inc. | 206,100 | 3,728,282 | |
| 18,388,124 | |||
| Construction & Engineering - 0.2% | |||
| INFRONEER Holdings, Inc. | 13,600 | 103,182 | |
| Kajima Corp. | 311,000 | 3,716,331 | |
| Okumura Corp. | 16,900 | 407,745 | |
| Sanki Engineering Co. Ltd. | 41,000 | 460,123 | |
| Sweco AB (B Shares) | 80,853 | 950,030 | |
| VINCI SA | 220,898 | 25,196,149 | |
| Voltas Ltd. | 116,110 | 1,253,193 | |
| 32,086,753 | |||
| Electrical Equipment - 1.1% | |||
| ABB Ltd.: | |||
| (Reg.) | 790,062 | 26,290,952 | |
| sponsored ADR (c) | 6,218 | 207,059 | |
| Accelleron Industries Ltd. (b) | 2,654 | 65,374 | |
| Contemporary Amperex Technology Co. Ltd. | 29,300 | 1,706,849 | |
| Havells India Ltd. | 107,614 | 1,558,707 | |
| Hirakawa Hewtech Corp. | 15,600 | 162,009 | |
| Legrand SA | 512,083 | 47,299,677 | |
| Mitsubishi Electric Corp. | 1,072,400 | 12,050,793 | |
| Prysmian SpA | 337,783 | 12,994,022 | |
| Schneider Electric SA | 407,385 | 65,367,832 | |
| Siemens Energy AG (c) | 376,600 | 7,556,317 | |
| Weg SA | 161,900 | 1,210,976 | |
| 176,470,567 | |||
| Industrial Conglomerates - 0.8% | |||
| CK Hutchison Holdings Ltd. | 2,463,100 | 14,707,791 | |
| DCC PLC (United Kingdom) | 288,915 | 16,062,439 | |
| Hitachi Ltd. | 616,280 | 31,186,289 | |
| Jardine Matheson Holdings Ltd. ADR | 999 | 49,610 | |
| Lifco AB | 105,958 | 2,121,589 | |
| Melrose Industries PLC | 6,829,577 | 12,310,113 | |
| Siemens AG | 288,872 | 44,021,768 | |
| Toshiba Corp. | 246,390 | 7,631,204 | |
| 128,090,803 | |||
| Machinery - 1.9% | |||
| Airtac International Group | 48,158 | 1,684,120 | |
| Alstom SA | 956,697 | 28,077,370 | |
| Atlas Copco AB (A Shares) | 412,517 | 4,897,495 | |
| AutoStore Holdings Ltd. (a)(b)(c) | 700,800 | 1,459,663 | |
| China International Marine Containers Group Co. Ltd. | 309,100 | 338,818 | |
| CNH Industrial NV | 632,300 | 10,382,867 | |
| Epiroc AB (A Shares) | 437,941 | 8,416,297 | |
| FANUC Corp. | 274,600 | 46,674,029 | |
| First Tractor Co. Ltd. (A Shares) | 528,679 | 931,788 | |
| Furukawa Co. Ltd. | 5,200 | 53,010 | |
| GEA Group AG | 515,839 | 22,707,993 | |
| Harmonic Drive Systems, Inc. (c) | 26,800 | 951,695 | |
| Husqvarna AB (B Shares) | 273,400 | 2,426,856 | |
| IMI PLC | 795,025 | 14,889,526 | |
| Indutrade AB | 92,333 | 1,966,972 | |
| Iveco Group NV (b) | 228,958 | 2,164,021 | |
| KION Group AG | 107,466 | 4,227,268 | |
| Kitz Corp. | 61,200 | 397,797 | |
| Knorr-Bremse AG | 88,496 | 6,014,627 | |
| Kubota Corp. | 595,400 | 8,988,614 | |
| Max Co. Ltd. | 1,900 | 30,226 | |
| Metso Outotec Oyj | 141,047 | 1,503,789 | |
| Mitsubishi Heavy Industries Ltd. | 24,000 | 883,993 | |
| Mitsuboshi Belting Ltd. | 12,600 | 367,390 | |
| Nachi-Fujikoshi Corp. | 1,300 | 37,571 | |
| NGK Insulators Ltd. | 138,500 | 1,839,139 | |
| OSG Corp. | 54,600 | 777,565 | |
| Rotork PLC | 765,122 | 2,981,859 | |
| Schindler Holding AG (participation certificate) | 93,546 | 20,996,575 | |
| Shenzhen Inovance Technology Co. Ltd. (A Shares) | 380,950 | 4,027,409 | |
| SMC Corp. | 59,100 | 30,040,903 | |
| Spirax-Sarco Engineering PLC | 79,139 | 11,123,226 | |
| Sumitomo Heavy Industries Ltd. | 8,200 | 193,023 | |
| Techtronic Industries Co. Ltd. | 1,109,000 | 11,027,270 | |
| The Weir Group PLC | 352,364 | 8,048,741 | |
| THK Co. Ltd. | 131,200 | 2,939,003 | |
| Toyota Industries Corp. | 357,800 | 20,996,820 | |
| Turk Traktor ve Ziraat Makinalari A/S | 4,759 | 142,631 | |
| VAT Group AG (a) | 6,387 | 1,928,612 | |
| Volvo AB (B Shares) | 390,440 | 7,825,211 | |
| Yangzijiang Shipbuilding Holdings Ltd. | 466,400 | 446,183 | |
| 295,807,965 | |||
| Marine - 0.3% | |||
| A.P. Moller - Maersk A/S: | |||
| ADR (c) | 4,262 | 49,780 | |
| Series A | 3,326 | 7,618,977 | |
| Series B | 1,493 | 3,477,716 | |
| Kawasaki Kisen Kaisha Ltd. | 202,300 | 4,851,159 | |
| Mitsui OSK Lines Ltd. | 392,000 | 10,249,495 | |
| Nippon Yusen KK | 590,200 | 15,341,065 | |
| 41,588,192 | |||
| Professional Services - 0.8% | |||
| Anhui Transport Consulting & Design Institute Co. Ltd. (A Shares) | 79,640 | 115,094 | |
| BayCurrent Consulting, Inc. | 40,800 | 1,603,173 | |
| Benefit One, Inc. | 63,300 | 970,735 | |
| Experian PLC | 623,063 | 21,006,030 | |
| Intertek Group PLC | 175,018 | 8,787,122 | |
| Nihon M&A Center Holdings, Inc. | 139,600 | 1,165,768 | |
| Persol Holdings Co. Ltd. | 192,200 | 3,849,505 | |
| Recruit Holdings Co. Ltd. | 210,800 | 5,652,778 | |
| RELX PLC: | |||
| (Euronext N.V.) | 445,423 | 13,450,588 | |
| (London Stock Exchange) | 495,865 | 14,953,055 | |
| SGS SA (Reg.) | 5,146 | 11,790,697 | |
| SMS Co., Ltd. | 32,700 | 784,147 | |
| TechnoPro Holdings, Inc. | 325,100 | 8,249,114 | |
| Teleperformance | 47,534 | 12,368,071 | |
| Wolters Kluwer NV | 174,874 | 20,244,335 | |
| Wolters Kluwer NV ADR (c) | 1,564 | 181,049 | |
| 125,171,261 | |||
| Road & Rail - 0.3% | |||
| Aurizon Holdings Ltd. | 203,070 | 452,298 | |
| Canadian National Railway Co. | 220,254 | 25,085,873 | |
| Canadian Pacific Railway Ltd. | 106,475 | 8,085,712 | |
| Central Japan Railway Co. | 35,200 | 3,958,077 | |
| Rumo SA | 309,700 | 1,062,413 | |
| TFI International, Inc. (Canada) | 49,600 | 6,052,690 | |
| 44,697,063 | |||
| Trading Companies & Distributors - 0.6% | |||
| AerCap Holdings NV (b) | 221,700 | 13,842,948 | |
| Ashtead Group PLC | 399,142 | 26,453,948 | |
| Beijer Ref AB: | |||
| rights 3/16/23 (b) | 96,596 | 162,408 | |
| (B Shares) (c) | 96,596 | 1,502,276 | |
| Bunzl PLC | 374,005 | 13,334,203 | |
| Diploma PLC | 46,805 | 1,566,249 | |
| Hanwa Co. Ltd. | 6,300 | 183,464 | |
| IMCD NV | 14,433 | 2,288,341 | |
| Kanamoto Co. Ltd. | 42,800 | 712,626 | |
| Marubeni Corp. | 130,800 | 1,671,566 | |
| Mitsubishi Corp. | 214,200 | 7,282,375 | |
| Mitsui & Co. Ltd. | 70,700 | 1,985,655 | |
| MonotaRO Co. Ltd. | 150,700 | 2,049,843 | |
| Ochi Holdings Co. Ltd. | 101,300 | 999,943 | |
| Rexel SA | 212,100 | 5,283,164 | |
| Sojitz Corp. | 157,800 | 3,029,556 | |
| Sumitomo Corp. | 399,300 | 6,812,632 | |
| Toromont Industries Ltd. | 31,887 | 2,629,947 | |
| Toyota Tsusho Corp. | 18,400 | 751,379 | |
| Wakita & Co. Ltd. | 1,400 | 11,588 | |
| Yamazen Co. Ltd. | 99,700 | 766,670 | |
| Yuasa Trading Co. Ltd. | 31,500 | 846,756 | |
| 94,167,537 | |||
| Transportation Infrastructure - 0.2% | |||
| Aena SME SA (a) | 137,118 | 21,232,349 | |
| Beijing Capital International Airport Co. Ltd. (H Shares) (b) | 7,634,000 | 5,582,485 | |
| Grupo Aeroportuario del Sureste S.A.B. de CV Series B sponsored ADR | 7,363 | 2,107,143 | |
| 28,921,977 | |||
TOTAL INDUSTRIALS | 1,238,185,160 | ||
| INFORMATION TECHNOLOGY - 5.8% | |||
| Communications Equipment - 0.2% | |||
| Ericsson (B Shares) | 1,379,010 | 7,636,411 | |
| Lumine Group, Inc. (b)(d) | 21,140 | 216,408 | |
| Nokia Corp. | 3,466,580 | 16,057,882 | |
| 23,910,701 | |||
| Electronic Equipment & Components - 0.8% | |||
| Anritsu Corp. | 9,700 | 88,625 | |
| Enplas Corp. | 6,000 | 178,914 | |
| Hagiwara Electric Holdings Co. Ltd. | 56,500 | 1,175,190 | |
| Halma PLC | 180,435 | 4,696,664 | |
| Hamamatsu Photonics K.K. | 117,900 | 5,784,378 | |
| Hexagon AB (B Shares) | 546,217 | 6,053,495 | |
| Hirose Electric Co. Ltd. | 116,490 | 14,245,224 | |
| Keyence Corp. | 20,600 | 8,909,948 | |
| Kyocera Corp. | 469,900 | 23,150,741 | |
| Largan Precision Co. Ltd. | 30,000 | 2,151,919 | |
| Macnica Fuji Electronics Holdings, Inc. | 4,200 | 116,140 | |
| Murata Manufacturing Co. Ltd. | 604,000 | 32,330,541 | |
| Nippon Electric Glass Co. Ltd. | 7,200 | 134,000 | |
| Oki Electric Industry Co. Ltd. | 132,100 | 689,825 | |
| OMRON Corp. | 58,800 | 3,157,766 | |
| Renishaw PLC | 20,000 | 960,837 | |
| Samsung SDI Co. Ltd. | 5,687 | 2,995,899 | |
| Sanshin Electronic Co. Ltd. | 14,500 | 274,547 | |
| SES-imagotag SA (b) | 7,354 | 930,288 | |
| Shimadzu Corp. | 565,500 | 16,343,450 | |
| Spectris PLC | 33,441 | 1,414,696 | |
| Topcon Corp. | 34,400 | 452,502 | |
| Yokogawa Electric Corp. | 377,600 | 5,640,912 | |
| 131,876,501 | |||
| IT Services - 1.2% | |||
| Adyen BV (a)(b) | 4,068 | 5,766,106 | |
| Amadeus IT Holding SA Class A (b) | 1,011,497 | 63,605,865 | |
| Capgemini SA | 169,681 | 31,919,023 | |
| Fujitsu Ltd. | 216,840 | 27,848,389 | |
| Globant SA (b) | 10,222 | 1,687,448 | |
| GMO Payment Gateway, Inc. | 16,200 | 1,331,409 | |
| Infosys Ltd. | 176,455 | 3,170,501 | |
| Locaweb Servicos de Internet SA (a)(b) | 545,088 | 509,122 | |
| Mitsubishi Research Institute, Inc. | 12,400 | 471,756 | |
| NEC Corp. | 45,300 | 1,621,957 | |
| Nomura Research Institute Ltd. | 740,700 | 16,537,975 | |
| NTT Data Corp. | 675,500 | 9,376,776 | |
| OBIC Co. Ltd. | 1,100 | 161,096 | |
| SCSK Corp. | 102,500 | 1,486,817 | |
| SHIFT, Inc. (b) | 7,300 | 1,209,026 | |
| Softcat PLC | 68,273 | 992,857 | |
| TIS, Inc. | 79,600 | 1,976,042 | |
| Visa, Inc. Class A | 46,573 | 10,243,266 | |
| 179,915,431 | |||
| Semiconductors & Semiconductor Equipment - 1.9% | |||
| Advantest Corp. | 26,100 | 2,072,204 | |
| ams-OSRAM AG (b)(c) | 103,146 | 803,616 | |
| Analog Devices, Inc. | 102,600 | 18,824,022 | |
| ASM International NV (Netherlands) | 7,560 | 2,582,776 | |
| ASML Holding NV | 5,135 | 3,172,044 | |
| ASML Holding NV (Netherlands) | 129,727 | 79,958,090 | |
| ASMPT Ltd. | 95,900 | 817,350 | |
| BE Semiconductor Industries NV | 29,317 | 2,274,790 | |
| Broadcom, Inc. | 20,331 | 12,082,510 | |
| Disco Corp. | 27,300 | 8,561,639 | |
| GlobalWafers Co. Ltd. | 52,000 | 866,103 | |
| Infineon Technologies AG | 584,561 | 20,679,677 | |
| MediaTek, Inc. | 165,000 | 3,880,774 | |
| NXP Semiconductors NV | 148,148 | 26,441,455 | |
| Renesas Electronics Corp. (b) | 400,300 | 5,170,874 | |
| Silergy Corp. | 46,000 | 870,917 | |
| Siltronic AG | 10,933 | 799,061 | |
| SK Hynix, Inc. | 247,632 | 16,756,334 | |
| STMicroelectronics NV: | |||
| (France) | 13,366 | 640,253 | |
| (Italy) | 11,271 | 539,939 | |
| (NY Shares) unit | 9,576 | 461,180 | |
| Sumco Corp. | 739,900 | 10,210,951 | |
| Taiwan Semiconductor Manufacturing Co. Ltd. | 1,304,000 | 21,383,404 | |
| Taiwan Semiconductor Manufacturing Co. Ltd. sponsored ADR | 437,309 | 38,076,495 | |
| Tokyo Electron Ltd. | 64,600 | 22,164,392 | |
| 300,090,850 | |||
| Software - 1.0% | |||
| ANSYS, Inc. (b) | 32,835 | 9,969,034 | |
| Cadence Design Systems, Inc. (b) | 116,853 | 22,545,618 | |
| Check Point Software Technologies Ltd. (b) | 81,100 | 10,033,692 | |
| Constellation Software, Inc. | 7,046 | 12,115,092 | |
| Dassault Systemes SA | 406,381 | 15,682,331 | |
| Kinaxis, Inc. (b) | 11,612 | 1,349,443 | |
| Nemetschek SE | 18,131 | 1,029,430 | |
| Newland Digital Technology Co. Ltd. (A Shares) | 105,800 | 243,083 | |
| NICE Ltd. sponsored ADR (b) | 28,506 | 5,912,429 | |
| Rakus Co. Ltd. | 71,400 | 888,862 | |
| SAP SE | 715,730 | 81,314,793 | |
| SAP SE sponsored ADR (c) | 4,474 | 509,231 | |
| 161,593,038 | |||
| Technology Hardware, Storage & Peripherals - 0.7% | |||
| Brother Industries Ltd. | 170,700 | 2,511,198 | |
| Canon, Inc. | 211,000 | 4,541,194 | |
| Canon, Inc. sponsored ADR (c) | 103,750 | 2,227,513 | |
| FUJIFILM Holdings Corp. | 150,100 | 7,004,777 | |
| Ricoh Co. Ltd. | 286,500 | 2,226,264 | |
| Samsung Electronics Co. Ltd. | 1,979,542 | 90,797,119 | |
| Seiko Epson Corp. | 215,000 | 2,963,938 | |
| TPV Technology Co. Ltd. (A Shares) (b) | 847,200 | 266,377 | |
| 112,538,380 | |||
TOTAL INFORMATION TECHNOLOGY | 909,924,901 | ||
| MATERIALS - 3.7% | |||
| Chemicals - 1.9% | |||
| Air Liquide SA | 170,556 | 27,097,330 | |
| Air Water, Inc. | 68,600 | 824,782 | |
| Akzo Nobel NV | 542,934 | 39,718,301 | |
| Asahi Kasei Corp. | 674,800 | 4,699,993 | |
| BASF AG | 317,590 | 16,261,338 | |
| Covestro AG (a) | 117,549 | 5,167,507 | |
| Croda International PLC | 204,838 | 16,168,072 | |
| Daicel Chemical Industries Ltd. | 102,200 | 709,331 | |
| Denka Co. Ltd. | 170,260 | 3,595,149 | |
| Evonik Industries AG | 167,969 | 3,594,078 | |
| Givaudan SA | 3,099 | 9,347,836 | |
| Icl Group Ltd. | 55,230 | 401,519 | |
| Johnson Matthey PLC | 217,573 | 5,710,462 | |
| Kansai Paint Co. Ltd. | 457,400 | 6,134,276 | |
| Kuraray Co. Ltd. | 99,700 | 894,082 | |
| Linde PLC | 60,925 | 21,224,442 | |
| Linde PLC (c) | 86,766 | 29,899,447 | |
| Mitsubishi Chemical Holdings Corp. | 108,200 | 630,183 | |
| Mitsubishi Gas Chemical Co., Inc. | 9,600 | 136,010 | |
| Nippon Sanso Holdings Corp. | 229,900 | 4,099,719 | |
| Nitto Denko Corp. | 167,200 | 10,069,700 | |
| Novozymes A/S Series B | 206,990 | 9,977,335 | |
| PhosAgro PJSC (d) | 3,751 | 286 | |
| Shin-Etsu Chemical Co. Ltd. | 101,800 | 14,112,652 | |
| Sika AG | 83,175 | 23,324,364 | |
| Sumitomo Chemical Co. Ltd. | 428,800 | 1,502,241 | |
| Symrise AG | 180,171 | 18,407,957 | |
| Teijin Ltd. | 118,200 | 1,228,401 | |
| Toray Industries, Inc. | 337,300 | 1,930,331 | |
| Tosoh Corp. | 172,600 | 2,347,730 | |
| Umicore SA | 154,609 | 5,162,640 | |
| UPL Ltd. | 150,294 | 1,262,437 | |
| Yara International ASA | 96,151 | 4,574,783 | |
| 290,214,714 | |||
| Construction Materials - 0.1% | |||
| CRH PLC | 207,275 | 9,736,434 | |
| HeidelbergCement AG | 204,911 | 14,113,742 | |
| Huaxin Cement Co. Ltd. (A Shares) | 27,000 | 67,915 | |
| 23,918,091 | |||
| Containers & Packaging - 0.1% | |||
| Amcor PLC unit | 328,816 | 3,657,433 | |
| CCL Industries, Inc. Class B | 49,105 | 2,361,862 | |
| Sig Group AG | 125,820 | 3,043,138 | |
| Smurfit Kappa Group PLC | 321,108 | 12,012,923 | |
| Toyo Seikan Group Holdings Ltd. | 56,800 | 738,811 | |
| 21,814,167 | |||
| Metals & Mining - 1.5% | |||
| Agnico Eagle Mines Ltd. (Canada) | 158,327 | 7,289,192 | |
| Anglo American PLC (United Kingdom) | 298,109 | 10,301,077 | |
| Antofagasta PLC | 377,081 | 7,121,079 | |
| ArcelorMittal SA: | |||
| (Netherlands) | 495,105 | 14,895,866 | |
| Class A unit GDR (c) | 12,741 | 385,415 | |
| BHP Group Ltd. | 568,802 | 17,300,158 | |
| BHP Group Ltd.: | |||
| (London) | 280,629 | 8,531,692 | |
| sponsored ADR | 71,000 | 4,328,870 | |
| BlueScope Steel Ltd. | 25,474 | 326,716 | |
| Dongkuk Steel Mill Co. Ltd. | 41,486 | 429,873 | |
| Eldorado Gold Corp. (b)(c) | 29,006 | 270,336 | |
| Franco-Nevada Corp. | 216,216 | 27,598,637 | |
| Glencore PLC | 7,247,757 | 43,210,153 | |
| Glencore PLC ADR | 50,660 | 601,334 | |
| IGO Ltd. | 1,523,420 | 13,459,685 | |
| Jiangxi Copper Co. Ltd. (A Shares) | 119,839 | 339,118 | |
| Mitsubishi Materials Corp. | 109,600 | 1,706,526 | |
| Nippon Steel & Sumitomo Metal Corp. | 397,600 | 8,868,651 | |
| Norsk Hydro ASA | 97,610 | 710,480 | |
| Rio Tinto Ltd. | 186,855 | 14,677,015 | |
| Rio Tinto PLC | 345,462 | 23,707,177 | |
| Rio Tinto PLC sponsored ADR | 111,794 | 7,795,396 | |
| South32 Ltd. | 2,895,561 | 8,456,156 | |
| SSAB AB: | |||
| (A Shares) | 32,058 | 233,483 | |
| (B Shares) | 82,278 | 563,873 | |
| Wheaton Precious Metals Corp. | 170,874 | 7,119,228 | |
| Xinxing Ductile Iron Pipe Co. Ltd. Class A | 415,100 | 244,867 | |
| 230,472,053 | |||
| Paper & Forest Products - 0.1% | |||
| Stora Enso Oyj (R Shares) | 435,774 | 6,173,999 | |
| Svenska Cellulosa AB SCA (B Shares) | 363,376 | 5,078,516 | |
| 11,252,515 | |||
TOTAL MATERIALS | 577,671,540 | ||
| REAL ESTATE - 0.4% | |||
| Equity Real Estate Investment Trusts (REITs) - 0.1% | |||
| Big Yellow Group PLC | 93,702 | 1,368,293 | |
| Great Portland Estates PLC | 544,343 | 3,719,054 | |
| Scentre Group unit | 2,503,531 | 5,020,186 | |
| Segro PLC | 163,598 | 1,620,318 | |
| Warehouses de Pauw | 37,694 | 1,154,605 | |
| 12,882,456 | |||
| Real Estate Management & Development - 0.3% | |||
| CK Asset Holdings Ltd. | 1,046,100 | 6,556,950 | |
| ESR Group Ltd. (a) | 1,824,800 | 3,101,235 | |
| Grand City Properties SA | 360,399 | 3,684,240 | |
| LEG Immobilien AG | 169,680 | 12,343,983 | |
| Mitsui Fudosan Co. Ltd. | 452,500 | 8,624,270 | |
| TAG Immobilien AG | 234,603 | 1,869,732 | |
| Vonovia SE | 242,376 | 6,095,533 | |
| 42,275,943 | |||
TOTAL REAL ESTATE | 55,158,399 | ||
| UTILITIES - 1.3% | |||
| Electric Utilities - 0.5% | |||
| Chubu Electric Power Co., Inc. | 66,200 | 686,529 | |
| CLP Holdings Ltd. | 587,500 | 4,154,694 | |
| Enel SpA | 6,374,906 | 35,760,435 | |
| Iberdrola SA | 1,993,767 | 22,855,413 | |
| Kansai Electric Power Co., Inc. | 307,900 | 2,899,106 | |
| ORSTED A/S (a) | 37,161 | 3,234,607 | |
| SSE PLC | 153,177 | 3,205,836 | |
| The Okinawa Electric Power Co., Inc. | 49,600 | 375,584 | |
| Tokyo Electric Power Co., Inc. (b) | 279,100 | 926,541 | |
| 74,098,745 | |||
| Gas Utilities - 0.1% | |||
| APA Group unit | 522,327 | 3,771,314 | |
| Beijing Enterprises Holdings Ltd. | 668,000 | 2,187,123 | |
| China Resource Gas Group Ltd. | 992,000 | 4,183,148 | |
| Osaka Gas Co. Ltd. | 130,400 | 2,119,461 | |
| Tokyo Gas Co. Ltd. | 347,500 | 6,707,282 | |
| 18,968,328 | |||
| Independent Power and Renewable Electricity Producers - 0.2% | |||
| EDP Renovaveis SA | 130,566 | 2,680,514 | |
| Electric Power Development Co. Ltd. | 461,300 | 7,365,622 | |
| RWE AG | 397,913 | 16,935,913 | |
| RWE AG ADR | 18,328 | 779,123 | |
| 27,761,172 | |||
| Multi-Utilities - 0.5% | |||
| E.ON SE | 1,011,326 | 11,065,835 | |
| Engie SA | 2,543,038 | 37,111,509 | |
| Engie SA ADR (c) | 98,719 | 1,437,349 | |
| National Grid PLC | 618,370 | 7,760,370 | |
| Veolia Environnement SA | 586,476 | 17,502,985 | |
| 74,878,048 | |||
TOTAL UTILITIES | 195,706,293 | ||
| TOTAL COMMON STOCKS (Cost $5,335,503,345) | 6,947,514,797 | ||
| Nonconvertible Preferred Stocks - 0.5% | |||
| Shares | Value ($) | ||
| CONSUMER DISCRETIONARY - 0.2% | |||
| Automobiles - 0.2% | |||
| Bayerische Motoren Werke AG (BMW) (non-vtg.) | 100,992 | 9,587,027 | |
| Dr. Ing. h.c. F. Porsche AG Series F (b) | 63,700 | 7,687,543 | |
| Porsche Automobil Holding SE (Germany) | 5,399 | 306,441 | |
| Volkswagen AG | 95,982 | 13,065,612 | |
| 30,646,623 | |||
| CONSUMER STAPLES - 0.1% | |||
| Household Products - 0.1% | |||
| Henkel AG & Co. KGaA | 166,376 | 12,103,582 | |
| ENERGY - 0.2% | |||
| Oil, Gas & Consumable Fuels - 0.2% | |||
| Petroleo Brasileiro SA - Petrobras: | |||
| (PN) (non-vtg.) | 1,855,000 | 8,942,918 | |
| (PN) sponsored ADR (non-vtg.) | 621,173 | 6,062,648 | |
| sponsored ADR | 628,033 | 6,964,886 | |
| 21,970,452 | |||
| FINANCIALS - 0.0% | |||
| Banks - 0.0% | |||
| Banco Bradesco SA (PN) sponsored ADR | 2,085,008 | 5,275,070 | |
| Insurance - 0.0% | |||
| Samsung Fire & Marine Insurance Co. Ltd. | 34 | 4,130 | |
TOTAL FINANCIALS | 5,279,200 | ||
| TOTAL NONCONVERTIBLE PREFERRED STOCKS (Cost $64,798,586) | 69,999,857 | ||
| Equity Funds - 50.7% | |||
| Shares | Value ($) | ||
| Diversified Emerging Markets Funds - 0.0% | |||
| Matthews Pacific Tiger Fund Investor Class | 19,976 | 409,105 | |
| Europe Stock Funds - 1.5% | |||
| iShares MSCI United Kingdom ETF (c) | 6,598,591 | 213,002,517 | |
| WisdomTree Europe Hedged Equity ETF (c) | 209,614 | 16,808,947 | |
TOTAL EUROPE STOCK FUNDS | 229,811,464 | ||
| Foreign Large Blend Funds - 10.1% | |||
| Artisan International Value Fund Investor Class | 18,686,222 | 764,827,076 | |
| Fidelity SAI International Index Fund (f) | 305,272 | 3,779,269 | |
| Fidelity SAI International Low Volatility Index Fund (f) | 59,314,291 | 587,804,624 | |
| Harbor International Fund Institutional Class | 9,619 | 400,835 | |
| Morgan Stanley Institutional Fund, Inc. - International Equity Portfolio Class A | 17,042,996 | 219,172,923 | |
TOTAL FOREIGN LARGE BLEND FUNDS | 1,575,984,727 | ||
| Foreign Large Growth Funds - 16.7% | |||
| American Funds EuroPacific Growth Fund Class F2 (b) | 150,854 | 7,743,347 | |
| Fidelity Advisor International Discovery Fund Class Z (f) | 18,636,265 | 762,223,228 | |
| Fidelity Diversified International Fund (f) | 12,057,488 | 463,248,691 | |
| Fidelity Overseas Fund (f) | 11,268,782 | 605,809,736 | |
| Fidelity SAI International Momentum Index Fund (f) | 9,951,385 | 115,734,605 | |
| Fidelity SAI International Quality Index Fund (f) | 236,975 | 2,597,246 | |
| Invesco Oppenheimer International Growth Fund Class R6 | 668,760 | 23,286,220 | |
| JOHCM International Select Fund Investor Shares | 15,316,513 | 323,178,432 | |
| WCM Focused International Growth Fund Investor Class | 14,267,111 | 294,045,163 | |
TOTAL FOREIGN LARGE GROWTH FUNDS | 2,597,866,668 | ||
| Foreign Large Value Funds - 11.6% | |||
| Fidelity SAI International Value Index Fund (f) | 63,272,700 | 562,494,302 | |
| iShares MSCI EAFE Value ETF (c) | 8,683,407 | 421,579,410 | |
| Oakmark International Fund Investor Class | 20,751,076 | 533,717,667 | |
| Pear Tree Polaris Foreign Value Fund Institutional Shares | 13,894,323 | 290,669,238 | |
TOTAL FOREIGN LARGE VALUE FUNDS | 1,808,460,617 | ||
| Foreign Small Mid Blend Funds - 1.3% | |||
| Fidelity Advisor International Small Cap Fund Class Z (f) | 1,266,326 | 36,356,224 | |
| Fidelity SAI International Small Cap Index Fund (f) | 13,370,072 | 105,356,169 | |
| Victory Trivalent International Small-Cap Fund Class I | 5,098,485 | 69,237,421 | |
TOTAL FOREIGN SMALL MID BLEND FUNDS | 210,949,814 | ||
| Foreign Small Mid Growth Funds - 0.7% | |||
| Fidelity Advisor International Small Cap Opportunities Fund - Class Z (f) | 2,870,211 | 53,586,840 | |
| Oberweis International Opportunities Institutional Fund (b) | 1,626,142 | 14,179,954 | |
| T. Rowe Price International Discovery Fund | 638,784 | 38,556,988 | |
| Wasatch International Growth Fund Investor Class (b) | 110 | 2,552 | |
TOTAL FOREIGN SMALL MID GROWTH FUNDS | 106,326,334 | ||
| Foreign Small Mid Value Funds - 0.8% | |||
| Brandes International Small Cap Equity Fund Class A | 2,179,063 | 27,783,059 | |
| Oakmark International Small Cap Fund Investor Class | 1,265,946 | 22,508,520 | |
| Transamerica International Small Cap Value Fund Class I | 5,083,987 | 68,176,259 | |
TOTAL FOREIGN SMALL MID VALUE FUNDS | 118,467,838 | ||
| Other - 8.0% | |||
| Fidelity Advisor Japan Fund Class Z (f) | 3,625,807 | 53,625,692 | |
| Fidelity Japan Smaller Companies Fund (f) | 7,000,922 | 95,282,551 | |
| Fidelity SAI Japan Stock Index Fund (f) | 97,828,629 | 813,934,192 | |
| iShares MSCI Australia ETF (c) | 10,001,860 | 228,842,557 | |
| Matthews Japan Fund Investor Class | 237 | 3,597 | |
| WisdomTree Japan Hedged Equity ETF (c) | 465,136 | 32,619,988 | |
| WisdomTree Japan SmallCap Dividend ETF | 209,514 | 13,629,389 | |
TOTAL OTHER | 1,237,937,966 | ||
| TOTAL EQUITY FUNDS (Cost $6,799,820,830) | 7,886,214,533 | ||
| U.S. Treasury Obligations - 0.1% | |||
Principal Amount (g) | Value ($) | ||
U.S. Treasury Bills, yield at date of purchase 4.2% to 4.71% 3/9/23 to 5/18/23 (h) (Cost $20,055,849) | 20,100,000 | 20,054,439 | |
| Money Market Funds - 5.1% | |||
| Shares | Value ($) | ||
| Fidelity Securities Lending Cash Central Fund 4.63% (i)(j) | 189,876,708 | 189,895,696 | |
| State Street Institutional U.S. Government Money Market Fund Premier Class 4.43% (k) | 603,513,173 | 603,513,173 | |
| TOTAL MONEY MARKET FUNDS (Cost $793,408,869) | 793,408,869 | ||
| TOTAL INVESTMENT IN SECURITIES - 101.1% (Cost $13,013,587,479) | 15,717,192,495 |
NET OTHER ASSETS (LIABILITIES) - (1.1)% | (170,311,659) |
| NET ASSETS - 100.0% | 15,546,880,836 |
| Futures Contracts | |||||
Number of contracts | Expiration Date | Notional Amount ($) | Value ($) | Unrealized Appreciation/ (Depreciation) ($) | |
| Purchased | |||||
| Equity Index Contracts | |||||
| CME Nikkei 225 Index Contracts (United States) | 1,086 | Mar 2023 | 148,917,750 | (3,033,219) | (3,033,219) |
| ICE E-mini MSCI EAFE Index Contracts (United States) | 3,241 | Mar 2023 | 331,651,530 | 5,268,026 | 5,268,026 |
| TOTAL FUTURES CONTRACTS | 2,234,807 | ||||
| The notional amount of futures purchased as a percentage of Net Assets is 3.1% | |||||
| ETF | - | EXCHANGE-TRADED FUND |
| (a) | Security exempt from registration under Rule 144A of the Securities Act of 1933. These securities may be resold in transactions exempt from registration, normally to qualified institutional buyers. At the end of the period, the value of these securities amounted to $121,621,349 or 0.8% of net assets. |
| (b) | Non-income producing |
| (c) | Security or a portion of the security is on loan at period end. |
| (d) | Level 3 security |
| (e) | Security or a portion of the security purchased on a delayed delivery or when-issued basis. |
| (f) | Affiliated Fund |
| (g) | Amount is stated in United States dollars unless otherwise noted. |
| (h) | Security or a portion of the security was pledged to cover margin requirements for futures contracts. At period end, the value of securities pledged amounted to $18,680,319. |
| (i) | Affiliated fund that is generally available only to investment companies and other accounts managed by Fidelity Investments. The rate quoted is the annualized seven-day yield of the fund at period end. A complete unaudited listing of the fund's holdings as of its most recent quarter end is available upon request. In addition, each Fidelity Central Fund's financial statements, which are not covered by the Fund's Report of Independent Registered Public Accounting Firm, are available on the SEC's website or upon request. |
| (j) | Investment made with cash collateral received from securities on loan. |
| (k) | The rate quoted is the annualized seven-day yield of the fund at period end. |
| Affiliate | Value, beginning of period ($) | Purchases ($) | Sales Proceeds ($) | Dividend Income ($) | Realized Gain (loss) ($) | Change in Unrealized appreciation (depreciation) ($) | Value, end of period ($) | % ownership, end of period |
| Fidelity Securities Lending Cash Central Fund 4.63% | 106,934,926 | 2,609,452,261 | 2,526,491,491 | 3,299,111 | - | - | 189,895,696 | 0.6% |
| Total | 106,934,926 | 2,609,452,261 | 2,526,491,491 | 3,299,111 | - | - | 189,895,696 | |
| Affiliate | Value, beginning of period ($) | Purchases ($) | Sales Proceeds ($) | Dividend Income ($) | Realized Gain (loss) ($) | Change in Unrealized appreciation (depreciation) ($) | Value, end of period ($) |
| Fidelity Advisor International Discovery Fund Class Z | 1,125,937,643 | 3,649,629 | 235,064,455 | 3,585,174 | 267,113 | (132,566,702) | 762,223,228 |
| Fidelity Advisor International Small Cap Fund Class Z | 75,483,967 | 557,425 | 33,755,451 | 280,067 | (4,392,232) | (1,537,485) | 36,356,224 |
| Fidelity Advisor International Small Cap Opportunities Fund - Class Z | 77,918,434 | 5,225,407 | 17,797,543 | 3,152,037 | (2,544,413) | (9,215,045) | 53,586,840 |
| Fidelity Advisor Japan Fund Class Z | 64,324,457 | - | 4,000,001 | - | (1,162,350) | (5,536,414) | 53,625,692 |
| Fidelity Diversified International Fund | 649,338,765 | 6,103,974 | 124,603,287 | 6,000,687 | (27,665,366) | (39,925,395) | 463,248,691 |
| Fidelity Japan Smaller Companies Fund | 115,870,288 | 48,981 | 11,000,000 | 48,980 | (3,442,927) | (6,193,791) | 95,282,551 |
| Fidelity Overseas Fund | 778,192,337 | 4,362,529 | 108,000,000 | 4,362,528 | (33,150,560) | (35,594,570) | 605,809,736 |
| Fidelity SAI International Index Fund | 320,771,471 | 433,616,066 | 740,000,000 | 116,067 | (38,339,027) | 27,730,759 | 3,779,269 |
| Fidelity SAI International Low Volatility Index Fund | 171,461,639 | 474,513,036 | 37,000,000 | 11,513,035 | (6,295,732) | (14,874,319) | 587,804,624 |
| Fidelity SAI International Momentum Index Fund | 451,078,800 | 2,604,755 | 277,500,000 | 2,604,754 | (95,333,245) | 34,884,295 | 115,734,605 |
| Fidelity SAI International Quality Index Fund | 2,773,326 | 76,807 | - | 76,807 | - | (252,887) | 2,597,246 |
| Fidelity SAI International Small Cap Index Fund | 148,232,792 | 13,553,417 | 38,498,742 | 2,879,423 | (11,166,051) | (6,765,247) | 105,356,169 |
| Fidelity SAI International Value Index Fund | 1,659,358,147 | 24,820,450 | 967,945,977 | 24,374,477 | (184,833,561) | 31,095,243 | 562,494,302 |
| Fidelity SAI Japan Stock Index Fund | 1,198,577,710 | 57,358,435 | 306,532,374 | 18,826,061 | (74,169,983) | (61,299,596) | 813,934,192 |
| 6,839,319,776 | 1,026,490,911 | 2,901,697,830 | 77,820,097 | (482,228,334) | (220,051,154) | 4,261,833,369 |
| Valuation Inputs at Reporting Date: | ||||
| Description | Total ($) | Level 1 ($) | Level 2 ($) | Level 3 ($) |
Investments in Securities: | ||||
| Equities: | ||||
Communication Services | 229,829,690 | 70,441,031 | 159,388,659 | - |
Consumer Discretionary | 595,475,482 | 272,545,868 | 322,929,614 | - |
Consumer Staples | 769,410,607 | 239,951,698 | 529,458,909 | - |
Energy | 416,810,175 | 145,119,687 | 271,105,687 | 584,801 |
Financials | 1,221,162,290 | 619,564,236 | 601,584,230 | 13,824 |
Health Care | 808,180,117 | 222,049,704 | 586,130,413 | - |
Industrials | 1,238,185,160 | 697,510,239 | 540,674,921 | - |
Information Technology | 909,924,901 | 511,222,238 | 398,486,255 | 216,408 |
Materials | 577,671,540 | 341,216,491 | 236,454,763 | 286 |
Real Estate | 55,158,399 | 49,062,866 | 6,095,533 | - |
Utilities | 195,706,293 | 64,120,444 | 131,585,849 | - |
| Equity Funds | 7,886,214,533 | 7,886,214,533 | - | - |
| Other Short-Term Investments | 20,054,439 | - | 20,054,439 | - |
| Money Market Funds | 793,408,869 | 793,408,869 | - | - |
| Total Investments in Securities: | 15,717,192,495 | 11,912,427,904 | 3,803,949,272 | 815,319 |
Derivative Instruments: | ||||
| Assets | ||||
Futures Contracts | 5,268,026 | 5,268,026 | - | - |
| Total Assets | 5,268,026 | 5,268,026 | - | - |
| Liabilities | ||||
Futures Contracts | (3,033,219) | (3,033,219) | - | - |
| Total Liabilities | (3,033,219) | (3,033,219) | - | - |
| Total Derivative Instruments: | 2,234,807 | 2,234,807 | - | - |
Primary Risk Exposure / Derivative Type | Value | |
| Asset ($) | Liability ($) | |
| Equity Risk | ||
Futures Contracts (a) | 5,268,026 | (3,033,219) |
| Total Equity Risk | 5,268,026 | (3,033,219) |
| Total Value of Derivatives | 5,268,026 | (3,033,219) |
| Statement of Assets and Liabilities | ||||
| February 28, 2023 | ||||
| Assets | ||||
| Investment in securities, at value (including securities loaned of $181,278,203) - See accompanying schedule: | ||||
Unaffiliated issuers (cost $8,846,483,493) | $ | 11,265,463,430 | ||
Fidelity Central Funds (cost $189,895,696) | 189,895,696 | |||
Other affiliated issuers (cost $3,977,208,290) | 4,261,833,369 | |||
| Total Investment in Securities (cost $13,013,587,479) | $ | 15,717,192,495 | ||
| Cash | 19,460 | |||
| Foreign currency held at value (cost $2,569,155) | 2,557,201 | |||
| Receivable for investments sold | 7,270,671 | |||
| Receivable for fund shares sold | 5,846,257 | |||
| Dividends receivable | 1,504,515 | |||
| Reclaims receivable | 27,791,631 | |||
| Interest receivable | 1,982,173 | |||
| Distributions receivable from Fidelity Central Funds | 166,692 | |||
| Other receivables | 252,378 | |||
Total assets | 15,764,583,473 | |||
| Liabilities | ||||
| Payable for investments purchased | ||||
Regular delivery | $ | 8,342,080 | ||
Delayed delivery | 96,972 | |||
| Payable for fund shares redeemed | 12,960,277 | |||
| Accrued management fee | 2,082,901 | |||
| Payable for daily variation margin on futures contracts | 3,249,172 | |||
| Other payables and accrued expenses | 994,390 | |||
| Collateral on securities loaned | 189,976,845 | |||
| Total Liabilities | 217,702,637 | |||
| Net Assets | $ | 15,546,880,836 | ||
| Net Assets consist of: | ||||
| Paid in capital | $ | 13,335,097,337 | ||
| Total accumulated earnings (loss) | 2,211,783,499 | |||
| Net Assets | $ | 15,546,880,836 | ||
Net Asset Value , offering price and redemption price per share ($15,546,880,836 ÷ 1,482,964,132 shares) | $ | 10.48 | ||
| Statement of Operations | ||||
Year ended February 28, 2023 | ||||
| Investment Income | ||||
| Dividends: | ||||
| Unaffiliated issuers | $ | 341,780,165 | ||
| Affiliated issuers | 70,477,163 | |||
| Interest | 10,683,967 | |||
| Income from Fidelity Central Funds (including $3,299,111 from security lending) | 3,299,111 | |||
| Income before foreign taxes withheld | $ | 426,240,406 | ||
| Less foreign taxes withheld | (25,365,073) | |||
| Total Income | 400,875,333 | |||
| Expenses | ||||
| Management fee | $ | 69,747,873 | ||
| Custodian fees and expenses | 625,528 | |||
| Independent trustees' fees and expenses | 115,929 | |||
| Registration fees | 127,945 | |||
| Audit | 180,429 | |||
| Legal | 32,749 | |||
| Miscellaneous | 122,362 | |||
| Total expenses before reductions | 70,952,815 | |||
| Expense reductions | (43,026,017) | |||
| Total expenses after reductions | 27,926,798 | |||
| Net Investment income (loss) | 372,948,535 | |||
| Realized and Unrealized Gain (Loss) | ||||
| Net realized gain (loss) on: | ||||
| Investment Securities: | ||||
| Unaffiliated issuers (net of foreign taxes of $691,607) | 59,412,404 | |||
| Affiliated issuers | (482,228,334) | |||
| Foreign currency transactions | (3,150,902) | |||
| Futures contracts | (41,549,481) | |||
| Capital gain distributions from underlying funds: | ||||
| Unaffiliated issuers | 30,713,764 | |||
| Affiliated issuers | 7,342,934 | |||
| Total net realized gain (loss) | (429,459,615) | |||
| Change in net unrealized appreciation (depreciation) on: | ||||
| Investment Securities: | ||||
| Unaffiliated issuers (net of decrease in deferred foreign taxes of $858,036) | (1,300,557,142) | |||
| Affiliated issuers | (220,051,154) | |||
| Assets and liabilities in foreign currencies | (1,089,928) | |||
| Futures contracts | 19,910,199 | |||
| Total change in net unrealized appreciation (depreciation) | (1,501,788,025) | |||
| Net gain (loss) | (1,931,247,640) | |||
| Net increase (decrease) in net assets resulting from operations | $ | (1,558,299,105) | ||
| Statement of Changes in Net Assets | ||||
Year ended February 28, 2023 | Year ended February 28, 2022 | |||
| Increase (Decrease) in Net Assets | ||||
| Operations | ||||
| Net investment income (loss) | $ | 372,948,535 | $ | 420,263,151 |
| Net realized gain (loss) | (429,459,615) | 1,640,920,347 | ||
| Change in net unrealized appreciation (depreciation) | (1,501,788,025) | (2,142,116,264) | ||
| Net increase (decrease) in net assets resulting from operations | (1,558,299,105) | (80,932,766) | ||
| Distributions to shareholders | (767,544,263) | (1,971,210,060) | ||
| Share transactions | ||||
| Proceeds from sales of shares | 2,127,444,820 | 6,949,817,508 | ||
| Reinvestment of distributions | 701,384,533 | 1,846,735,934 | ||
| Cost of shares redeemed | (7,614,587,352) | (3,886,239,701) | ||
Net increase (decrease) in net assets resulting from share transactions | (4,785,757,999) | 4,910,313,741 | ||
| Total increase (decrease) in net assets | (7,111,601,367) | 2,858,170,915 | ||
| Net Assets | ||||
| Beginning of period | 22,658,482,203 | 19,800,311,288 | ||
| End of period | $ | 15,546,880,836 | $ | 22,658,482,203 |
| Other Information | ||||
| Shares | ||||
| Sold | 206,337,946 | 536,412,235 | ||
| Issued in reinvestment of distributions | 66,242,351 | 146,286,367 | ||
| Redeemed | (750,797,416) | (299,692,661) | ||
| Net increase (decrease) | (478,217,119) | 383,005,941 | ||
| Strategic Advisers® International Fund |
| Years ended February 28, | 2023 | 2022 | 2021 | 2020 A | 2019 | |||||
Selected Per-Share Data | ||||||||||
| Net asset value, beginning of period | $ | 11.55 | $ | 12.55 | $ | 9.93 | $ | 10.03 | $ | 11.43 |
| Income from Investment Operations | ||||||||||
Net investment income (loss) B,C | .22 | .24 | .13 | .20 | .21 | |||||
| Net realized and unrealized gain (loss) | (.83) | (.12) | 2.71 | .06 | (.98) | |||||
| Total from investment operations | (.61) | .12 | 2.84 | .26 | (.77) | |||||
| Distributions from net investment income | (.23) | (.26) | (.14) | (.22) | (.18) | |||||
| Distributions from net realized gain | (.22) | (.86) | (.08) | (.14) | (.44) | |||||
| Total distributions | (.46) D | (1.12) | (.22) | (.36) | (.63) D | |||||
| Net asset value, end of period | $ | 10.48 | $ | 11.55 | $ | 12.55 | $ | 9.93 | $ | 10.03 |
Total Return E | (5.30)% | .30% | 28.99% | 2.35% | (6.57)% | |||||
Ratios to Average Net Assets C,F,G | ||||||||||
| Expenses before reductions | .41% | .41% | .43% | .44% | .45% | |||||
| Expenses net of fee waivers, if any | .16% | .16% | .18% | .19% | .20% | |||||
| Expenses net of all reductions | .16% | .16% | .18% | .19% | .20% | |||||
| Net investment income (loss) | 2.16% | 1.83% | 1.25% | 1.91% | 1.95% | |||||
| Supplemental Data | ||||||||||
| Net assets, end of period (000 omitted) | $ | 15,546,881 | $ | 22,658,482 | $ | 19,800,311 | $ | 15,096,568 | $ | 15,904,961 |
Portfolio turnover rate H | 25% | 29% | 41% | 33% | 39% |
| Strategic Advisers International Fund | $252,378 |
| Gross unrealized appreciation | $3,356,780,614 |
| Gross unrealized depreciation | (726,386,131) |
| Net unrealized appreciation (depreciation) | $2,630,394,483 |
| Tax Cost | $13,086,798,012 |
| Capital loss carryforward | $(417,396,591) |
| Net unrealized appreciation (depreciation) on securities and other investments | $2,629,589,609 |
Short-term | $(417,396,591) |
| February 28, 2023 | February 28, 2022 | |
| Ordinary Income | $345,097,221 | $ 781,760,795 |
| Long-term Capital Gains | 422,447,042 | 1,189,449,265 |
| Total | $767,544,263 | $ 1,971,210,060 |
| Equity Risk | Equity risk relates to the fluctuations in the value of financial instruments as a result of changes in market prices (other than those arising from interest rate risk or foreign exchange risk), whether caused by factors specific to an individual investment, its issuer, or all factors affecting all instruments traded in a market or market segment. |
| Purchases ($) | Sales ($) | |
| Strategic Advisers International Fund | 4,243,196,480 | 9,189,151,072 |
| Amount | |
| Strategic Advisers International Fund | $3,470 |
| Fidelity Central Fund | Investment Manager | Investment Objective | Investment Practices | Expense Ratio A |
| Fidelity Money Market Central Funds | Fidelity Management & Research Company LLC (FMR) | Each fund seeks to obtain a high level of current income consistent with the preservation of capital and liquidity. | Short-term Investments | Less than .005% |
| Amount | |
| Strategic Advisers International Fund | $32,864 |
| Total Security Lending Fees Paid to NFS | Security Lending Income From Securities Loaned to NFS | Value of Securities Loaned to NFS at Period End | |
| Strategic Advisers International Fund | $356,225 | $- | $- |
| Fund | Strategic Advisers International Fund |
| Fidelity Japan Smaller Companies Fund | 25% |
| Fidelity SAI International Low Volatility Index Fund | 11% |
| Fidelity SAI International Momentum Index Fund | 19% |
| Fidelity SAI International Small Cap Index Fund | 15% |
| Fidelity SAI International Value Index Fund | 12% |
| Fidelity SAI Japan Stock Index Fund | 90% |
| The Example is based on an investment of $1,000 invested at the beginning of the period and held for the entire period (September 1, 2022 to February 28, 2023). |
Annualized Expense Ratio- A | Beginning Account Value September 1, 2022 | Ending Account Value February 28, 2023 | Expenses Paid During Period- C September 1, 2022 to February 28, 2023 | |||||||
| Strategic Advisers® International Fund | .17% | |||||||||
| Actual | $ 1,000 | $ 1,115.50 | $ .89 | |||||||
Hypothetical- B | $ 1,000 | $ 1,023.95 | $ .85 | |||||||


- Highly liquid investments - cash or convertible to cash within three business days or less
- Moderately liquid investments - convertible to cash in three to seven calendar days
- Less liquid investments - can be sold or disposed of, but not settled, within seven calendar days
- Illiquid investments - cannot be sold or disposed of within seven calendar days
 |


Contents
| Average Annual Total Returns | |||
Periods ended February 28, 2023 | Past 1 year | Past 5 years | Past 10 years |
| Strategic Advisers® Fidelity® International Fund | -5.41% | 3.45% | 5.71% |
| $10,000 Over 10 Years |
Let's say hypothetically that $10,000 was invested in Strategic Advisers® Fidelity® International Fund on February 28, 2013. The chart shows how the value of your investment would have changed, and also shows how the MSCI EAFE Index performed over the same period. |
 |
Top Holdings (% of Fund's net assets) | ||
| (excluding cash equivalents) | ||
| Fidelity SAI International Value Index Fund | 19.0 | |
| Fidelity Overseas Fund | 10.7 | |
| Fidelity Advisor International Discovery Fund Class Z | 9.6 | |
| Fidelity Diversified International Fund | 8.3 | |
| Fidelity International Capital Appreciation Fund | 7.3 | |
| Fidelity SAI International Low Volatility Index Fund | 5.8 | |
| Fidelity SAI International Small Cap Index Fund | 2.3 | |
| Fidelity Advisor Japan Fund Class Z | 1.8 | |
| Fidelity SAI International Momentum Index Fund | 1.4 | |
| Fidelity SAI International Index Fund | 0.8 | |
| 67.0 | ||
Asset Allocation (% of Fund's net assets) |
 |
| Common Stocks - 25.3% | |||
| Shares | Value ($) | ||
| COMMUNICATION SERVICES - 0.9% | |||
| Diversified Telecommunication Services - 0.3% | |||
| Cellnex Telecom SA (a) | 596,559 | 22,382,174 | |
| Deutsche Telekom AG | 1,020,683 | 22,907,261 | |
| Elisa Corp. (A Shares) | 134,031 | 7,615,594 | |
| HKT Trust/HKT Ltd. unit | 7,637,000 | 9,923,994 | |
| 62,829,023 | |||
| Entertainment - 0.2% | |||
| Capcom Co. Ltd. | 474,100 | 14,920,631 | |
| Sea Ltd. ADR (b) | 308,530 | 19,280,040 | |
| Universal Music Group NV | 606,397 | 14,287,531 | |
| 48,488,202 | |||
| Interactive Media & Services - 0.0% | |||
| Z Holdings Corp. | 2,708,000 | 7,270,033 | |
| Media - 0.2% | |||
| Publicis Groupe SA | 124,047 | 9,871,827 | |
| Vivendi SA (c) | 1,226,400 | 12,644,748 | |
| WPP PLC | 1,130,465 | 13,903,799 | |
| 36,420,374 | |||
| Wireless Telecommunication Services - 0.2% | |||
| SoftBank Group Corp. | 927,700 | 37,517,381 | |
TOTAL COMMUNICATION SERVICES | 192,525,013 | ||
| CONSUMER DISCRETIONARY - 2.3% | |||
| Auto Components - 0.2% | |||
| DENSO Corp. | 694,900 | 36,945,989 | |
| Automobiles - 0.7% | |||
| Ferrari NV (Italy) | 29,552 | 7,667,379 | |
| Mercedes-Benz Group AG (Germany) | 336,946 | 25,824,474 | |
| Suzuki Motor Corp. | 867,100 | 30,460,426 | |
| Toyota Motor Corp. | 6,058,800 | 82,578,888 | |
| 146,531,167 | |||
| Hotels, Restaurants & Leisure - 0.2% | |||
| Compass Group PLC | 931,570 | 21,520,951 | |
| Flight Centre Travel Group Ltd. (b) | 1,449,388 | 18,335,512 | |
| Flutter Entertainment PLC (Ireland) (b) | 51,782 | 8,344,182 | |
| Shidax Corp. | 10,300 | 59,914 | |
| 48,260,559 | |||
| Household Durables - 0.3% | |||
| Barratt Developments PLC | 3,346,540 | 18,883,084 | |
| Berkeley Group Holdings PLC | 203,437 | 10,267,788 | |
| Sony Group Corp. | 411,400 | 34,399,821 | |
| 63,550,693 | |||
| Internet & Direct Marketing Retail - 0.1% | |||
| Deliveroo PLC Class A (a)(b) | 3,770,445 | 3,750,676 | |
| Prosus NV | 142,540 | 10,218,583 | |
| 13,969,259 | |||
| Leisure Products - 0.0% | |||
| Bandai Namco Holdings, Inc. | 58,700 | 3,627,497 | |
| Multiline Retail - 0.1% | |||
| B&M European Value Retail SA | 1,257,642 | 7,439,727 | |
| Pan Pacific International Holdings Ltd. | 486,900 | 8,904,418 | |
| 16,344,145 | |||
| Specialty Retail - 0.1% | |||
| Fast Retailing Co. Ltd. | 78,600 | 15,528,919 | |
| JD Sports Fashion PLC | 2,649,912 | 5,772,466 | |
| 21,301,385 | |||
| Textiles, Apparel & Luxury Goods - 0.6% | |||
| Compagnie Financiere Richemont SA Series A | 263,946 | 39,881,277 | |
| Hermes International SCA | 9,142 | 16,588,016 | |
| LVMH Moet Hennessy Louis Vuitton SE | 82,247 | 68,374,171 | |
| 124,843,464 | |||
TOTAL CONSUMER DISCRETIONARY | 475,374,158 | ||
| CONSUMER STAPLES - 1.6% | |||
| Beverages - 0.5% | |||
| Carlsberg A/S Series B | 104,636 | 14,786,219 | |
| Coca-Cola HBC AG | 486,693 | 12,451,855 | |
| Diageo PLC | 945,409 | 40,119,821 | |
| Pernod Ricard SA | 142,454 | 29,788,170 | |
| 97,146,065 | |||
| Food & Staples Retailing - 0.1% | |||
| Seven & i Holdings Co. Ltd. | 355,300 | 15,884,316 | |
| Food Products - 0.5% | |||
| Nestle SA (Reg. S) | 794,518 | 89,518,855 | |
| Tate & Lyle PLC | 2,009,622 | 19,396,205 | |
| 108,915,060 | |||
| Household Products - 0.1% | |||
| Reckitt Benckiser Group PLC | 253,546 | 17,592,294 | |
| Personal Products - 0.4% | |||
| Haleon PLC | 3,910,462 | 15,143,560 | |
| L'Oreal SA | 45,712 | 18,068,717 | |
| Shiseido Co. Ltd. | 412,300 | 18,989,632 | |
| Unilever PLC | 448,915 | 22,350,363 | |
| 74,552,272 | |||
| Tobacco - 0.0% | |||
| Imperial Brands PLC | 416,337 | 10,030,091 | |
TOTAL CONSUMER STAPLES | 324,120,098 | ||
| ENERGY - 1.8% | |||
| Energy Equipment & Services - 0.0% | |||
| John Wood Group PLC (b) | 3,372,764 | 7,929,268 | |
| Tenaris SA | 405,670 | 6,674,144 | |
| 14,603,412 | |||
| Oil, Gas & Consumable Fuels - 1.8% | |||
| BP PLC | 2,291,599 | 15,059,317 | |
| Eni SpA | 1,447,700 | 20,447,360 | |
| Equinor ASA | 570,933 | 17,478,172 | |
| Idemitsu Kosan Co. Ltd. | 331,100 | 7,380,474 | |
| INPEX Corp. | 2,143,500 | 22,559,844 | |
| Reliance Industries Ltd. sponsored GDR (a) | 193,300 | 10,766,810 | |
| Santos Ltd. | 6,194,747 | 28,925,819 | |
| Shell PLC ADR | 1,212,900 | 73,707,933 | |
| Thungela Resources Ltd. (c) | 106,900 | 1,235,699 | |
| TotalEnergies SE | 1,921,074 | 118,538,382 | |
| Woodside Energy Group Ltd. | 1,848,717 | 44,794,403 | |
| 360,894,213 | |||
TOTAL ENERGY | 375,497,625 | ||
| FINANCIALS - 6.4% | |||
| Banks - 3.3% | |||
| Banco Santander SA (Spain) | 12,848,002 | 50,587,820 | |
| Bank of Ireland Group PLC | 3,095,303 | 34,146,798 | |
| BNP Paribas SA | 1,087,883 | 76,055,194 | |
| CaixaBank SA | 7,399,138 | 31,770,957 | |
| Commonwealth Bank of Australia | 204,559 | 13,859,752 | |
| Erste Group Bank AG | 291,200 | 11,451,523 | |
| FinecoBank SpA | 832,314 | 14,393,535 | |
| ING Groep NV (Certificaten Van Aandelen) | 760,508 | 10,643,401 | |
| KBC Group NV | 515,819 | 38,572,630 | |
| Lloyds Banking Group PLC | 44,684,530 | 28,219,652 | |
| Mediobanca SpA | 1,421,900 | 15,189,831 | |
| Mitsubishi UFJ Financial Group, Inc. | 5,019,700 | 35,587,129 | |
| Mizuho Financial Group, Inc. | 2,283,800 | 35,601,818 | |
| National Australia Bank Ltd. | 647,426 | 13,031,574 | |
| NatWest Group PLC | 5,947,105 | 20,891,843 | |
| Nordea Bank ABP | 2,513,574 | 31,849,489 | |
| PT Bank Rakyat Indonesia (Persero) Tbk | 26,595,600 | 8,144,358 | |
| Standard Chartered PLC (United Kingdom) | 6,280,071 | 59,238,338 | |
| Sumitomo Mitsui Financial Group, Inc. | 1,733,200 | 75,695,539 | |
| Unicaja Banco SA (a) | 3,571,800 | 4,571,250 | |
| United Overseas Bank Ltd. | 2,775,303 | 61,516,361 | |
| 671,018,792 | |||
| Capital Markets - 0.7% | |||
| Deutsche Borse AG | 53,313 | 9,296,403 | |
| Hong Kong Exchanges and Clearing Ltd. | 97,500 | 3,905,135 | |
| Macquarie Group Ltd. | 459,189 | 58,559,458 | |
| Nordnet AB | 423,741 | 7,492,784 | |
| UBS Group AG | 1,135,354 | 24,651,472 | |
| UBS Group AG (c) | 1,774,800 | 38,655,144 | |
| 142,560,396 | |||
| Diversified Financial Services - 0.3% | |||
| Investor AB (B Shares) | 2,529,852 | 48,963,318 | |
| ORIX Corp. | 1,093,300 | 19,604,803 | |
| 68,568,121 | |||
| Insurance - 2.1% | |||
| AIA Group Ltd. | 4,929,800 | 52,394,000 | |
| Allianz SE | 133,506 | 31,349,007 | |
| Aviva PLC | 3,047,935 | 16,365,955 | |
| AXA SA | 2,103,660 | 66,289,466 | |
| Beazley PLC | 1,173,100 | 9,637,563 | |
| Hannover Reuck SE | 105,700 | 20,537,456 | |
| Hiscox Ltd. | 778,564 | 10,676,051 | |
| Muenchener Rueckversicherungs-Gesellschaft AG in Muenchen | 132,449 | 45,683,775 | |
| Prudential PLC | 3,079,249 | 47,060,007 | |
| Sampo Oyj (A Shares) | 417,300 | 20,321,053 | |
| Steadfast Group Ltd. | 2,701,050 | 10,596,238 | |
| Swiss Life Holding AG | 21,020 | 12,636,326 | |
| Tokio Marine Holdings, Inc. | 1,075,200 | 22,825,938 | |
| Zurich Insurance Group Ltd. | 124,556 | 59,083,551 | |
| 425,456,386 | |||
TOTAL FINANCIALS | 1,307,603,695 | ||
| HEALTH CARE - 2.6% | |||
| Biotechnology - 0.1% | |||
| Argenx SE (b) | 54,921 | 19,991,542 | |
| Health Care Equipment & Supplies - 0.4% | |||
| EssilorLuxottica SA | 113,111 | 19,668,406 | |
| Hoya Corp. | 362,800 | 35,892,299 | |
| Olympus Corp. | 1,208,900 | 20,368,085 | |
| Siemens Healthineers AG (a) | 216,986 | 11,324,539 | |
| 87,253,329 | |||
| Life Sciences Tools & Services - 0.1% | |||
| Eurofins Scientific SA | 164,182 | 11,461,250 | |
| Pharmaceuticals - 2.0% | |||
| AstraZeneca PLC (United Kingdom) | 666,180 | 86,788,657 | |
| Bayer AG | 333,000 | 19,773,957 | |
| Daiichi Sankyo Kabushiki Kaisha | 891,300 | 28,072,685 | |
| Euroapi SASU | 17,269 | 283,114 | |
| Merck KGaA | 111,007 | 21,057,861 | |
| Novo Nordisk A/S Series B | 468,431 | 66,168,348 | |
| Roche Holding AG (participation certificate) | 226,728 | 65,374,520 | |
| Sanofi SA | 950,757 | 88,894,194 | |
| UCB SA | 370,979 | 31,932,250 | |
| 408,345,586 | |||
TOTAL HEALTH CARE | 527,051,707 | ||
| INDUSTRIALS - 4.0% | |||
| Aerospace & Defense - 0.7% | |||
| Airbus Group NV | 212,349 | 27,811,467 | |
| BAE Systems PLC | 5,029,976 | 54,324,766 | |
| Dassault Aviation SA | 70,661 | 12,159,895 | |
| Rheinmetall AG | 181,416 | 46,167,219 | |
| 140,463,347 | |||
| Air Freight & Logistics - 0.5% | |||
| Deutsche Post AG | 1,385,592 | 58,598,038 | |
| DSV A/S | 176,859 | 32,194,795 | |
| 90,792,833 | |||
| Airlines - 0.1% | |||
| Ryanair Holdings PLC sponsored ADR (b) | 136,700 | 12,681,659 | |
| Building Products - 0.1% | |||
| ASSA ABLOY AB (B Shares) | 382,204 | 9,300,462 | |
| Kingspan Group PLC (Ireland) | 147,973 | 9,637,950 | |
| Nibe Industrier AB (B Shares) | 622,359 | 6,444,757 | |
| 25,383,169 | |||
| Commercial Services & Supplies - 0.1% | |||
| Rentokil Initial PLC | 2,508,512 | 15,430,196 | |
| Construction & Engineering - 0.3% | |||
| Ferrovial SA | 587,616 | 16,321,153 | |
| VINCI SA | 335,856 | 38,308,531 | |
| 54,629,684 | |||
| Electrical Equipment - 0.0% | |||
| Legrand SA | 82,056 | 7,579,284 | |
| Industrial Conglomerates - 0.8% | |||
| Hitachi Ltd. | 1,634,100 | 82,692,145 | |
| Siemens AG | 515,442 | 78,549,212 | |
| 161,241,357 | |||
| Machinery - 0.5% | |||
| Indutrade AB | 440,423 | 9,382,339 | |
| Kawasaki Heavy Industries Ltd. | 673,000 | 14,700,173 | |
| Minebea Mitsumi, Inc. | 1,610,900 | 27,945,693 | |
| Misumi Group, Inc. | 458,200 | 10,903,514 | |
| Mitsubishi Heavy Industries Ltd. | 275,900 | 10,162,231 | |
| Sandvik AB | 1,070,800 | 22,074,765 | |
| SMC Corp. | 17,000 | 8,641,207 | |
| Techtronic Industries Co. Ltd. | 696,500 | 6,925,603 | |
| 110,735,525 | |||
| Marine - 0.1% | |||
| A.P. Moller - Maersk A/S Series B | 8,778 | 20,447,013 | |
| Professional Services - 0.3% | |||
| Experian PLC | 217,855 | 7,344,793 | |
| Persol Holdings Co. Ltd. | 635,500 | 12,728,203 | |
| Recruit Holdings Co. Ltd. | 522,200 | 14,003,228 | |
| RELX PLC (London Stock Exchange) | 481,799 | 14,528,887 | |
| Teleperformance | 73,300 | 19,072,235 | |
| 67,677,346 | |||
| Trading Companies & Distributors - 0.4% | �� | ||
| Bunzl PLC | 571,461 | 20,373,998 | |
| Ferguson PLC | 74,300 | 10,675,456 | |
| IMCD NV | 83,466 | 13,233,470 | |
| Itochu Corp. | 1,244,700 | 37,197,931 | |
| 81,480,855 | |||
| Transportation Infrastructure - 0.1% | |||
| Aena SME SA (a) | 41,648 | 6,449,080 | |
| Auckland International Airport Ltd. (b) | 1,540,791 | 8,326,345 | |
| 14,775,425 | |||
TOTAL INDUSTRIALS | 803,317,693 | ||
| INFORMATION TECHNOLOGY - 1.9% | |||
| Electronic Equipment & Components - 0.2% | |||
| Azbil Corp. | 203,700 | 5,296,155 | |
| Ibiden Co. Ltd. | 167,600 | 5,754,691 | |
| Keyence Corp. | 43,100 | 18,641,688 | |
| Murata Manufacturing Co. Ltd. | 194,800 | 10,427,135 | |
| 40,119,669 | |||
| IT Services - 0.7% | |||
| Adyen BV (a)(b) | 11,120 | 15,761,823 | |
| ALTEN | 56,100 | 8,781,872 | |
| Amadeus IT Holding SA Class A (b) | 178,519 | 11,225,793 | |
| Capgemini SA | 162,640 | 30,594,527 | |
| Edenred SA | 175,125 | 9,876,448 | |
| Fujitsu Ltd. | 230,700 | 29,628,405 | |
| Net One Systems Co. Ltd. | 269,600 | 6,158,099 | |
| TIS, Inc. | 253,900 | 6,302,978 | |
| Wix.com Ltd. (b) | 161,260 | 14,598,868 | |
| Worldline SA (a)(b) | 234,124 | 9,751,848 | |
| 142,680,661 | |||
| Semiconductors & Semiconductor Equipment - 0.7% | |||
| Advantest Corp. | 94,500 | 7,502,809 | |
| ASML Holding NV (Netherlands) | 87,224 | 53,761,087 | |
| Infineon Technologies AG | 436,194 | 15,430,983 | |
| Mitsui High-Tec, Inc. | 112,400 | 5,786,963 | |
| Renesas Electronics Corp. (b) | 3,185,600 | 41,149,977 | |
| Sumco Corp. | 703,100 | 9,703,095 | |
| Tokyo Electron Ltd. | 23,700 | 8,131,518 | |
| 141,466,432 | |||
| Software - 0.1% | |||
| NICE Ltd. (b) | 52,576 | 10,879,580 | |
| Technology Hardware, Storage & Peripherals - 0.2% | |||
| FUJIFILM Holdings Corp. | 775,200 | 36,176,569 | |
| Samsung Electronics Co. Ltd. | 215,540 | 9,886,333 | |
| 46,062,902 | |||
TOTAL INFORMATION TECHNOLOGY | 381,209,244 | ||
| MATERIALS - 2.5% | |||
| Chemicals - 0.9% | |||
| Air Liquide SA | 244,712 | 38,878,972 | |
| Covestro AG (a) | 198,800 | 8,739,338 | |
| HEXPOL AB (B Shares) | 899,683 | 10,029,901 | |
| Koninklijke DSM NV | 62,321 | 7,692,505 | |
| Lanxess AG | 184,003 | 8,582,741 | |
| Linde PLC (c) | 63,300 | 21,813,095 | |
| Nutrien Ltd. | 136,100 | 10,604,728 | |
| Shin-Etsu Chemical Co. Ltd. | 359,600 | 49,851,766 | |
| Sika AG | 87,047 | 24,410,171 | |
| 180,603,217 | |||
| Construction Materials - 0.3% | |||
| CRH PLC | 1,155,391 | 54,272,767 | |
| Metals & Mining - 1.2% | |||
| Alleima AB | 67,120 | 363,428 | |
| Anglo American PLC (United Kingdom) | 900,471 | 31,115,536 | |
| ArcelorMittal SA (Netherlands) | 680,913 | 20,486,137 | |
| BHP Group Ltd. | 2,159,817 | 65,691,007 | |
| Glencore PLC | 12,408,010 | 73,974,888 | |
| Lynas Rare Earths Ltd. (b) | 5,711,080 | 31,365,272 | |
| Newcrest Mining Ltd. | 608,490 | 9,315,219 | |
| South32 Ltd. | 6,951,057 | 20,299,770 | |
| 252,611,257 | |||
| Paper & Forest Products - 0.1% | |||
| UPM-Kymmene Corp. | 287,768 | 10,443,011 | |
TOTAL MATERIALS | 497,930,252 | ||
| REAL ESTATE - 0.6% | |||
| Equity Real Estate Investment Trusts (REITs) - 0.2% | |||
| Link (REIT) | 2,159,637 | 14,196,916 | |
| Link (REIT) rights (b) | 431,927 | 407,198 | |
| National Storage REIT unit | 9,557,946 | 16,207,485 | |
| Warehouses de Pauw | 471,287 | 14,435,988 | |
| 45,247,587 | |||
| Real Estate Management & Development - 0.4% | |||
| Kerry Properties Ltd. | 4,941,500 | 12,364,137 | |
| Mitsubishi Estate Co. Ltd. | 1,440,000 | 17,899,502 | |
| Mitsui Fudosan Co. Ltd. | 247,800 | 4,722,860 | |
| Sino Land Ltd. | 9,722,000 | 12,459,974 | |
| Vonovia SE | 800,889 | 20,141,619 | |
| 67,588,092 | |||
TOTAL REAL ESTATE | 112,835,679 | ||
| UTILITIES - 0.7% | |||
| Electric Utilities - 0.4% | |||
| Enel SpA | 1,867,000 | 10,473,054 | |
| Iberdrola SA | 2,098,625 | 24,057,446 | |
| Kansai Electric Power Co., Inc. | 2,694,800 | 25,373,535 | |
| ORSTED A/S (a) | 328,818 | 28,621,324 | |
| 88,525,359 | |||
| Independent Power and Renewable Electricity Producers - 0.2% | |||
| RWE AG | 1,047,119 | 44,567,320 | |
| Multi-Utilities - 0.1% | |||
| Veolia Environnement SA | 282,675 | 8,436,247 | |
TOTAL UTILITIES | 141,528,926 | ||
| TOTAL COMMON STOCKS (Cost $4,904,724,556) | 5,138,994,090 | ||
| Nonconvertible Preferred Stocks - 0.1% | |||
| Shares | Value ($) | ||
| CONSUMER DISCRETIONARY - 0.1% | |||
| Automobiles - 0.1% | |||
| Porsche Automobil Holding SE (Germany) | 256,100 | 14,535,928 | |
| Volkswagen AG | 76,482 | 10,411,162 | |
| TOTAL NONCONVERTIBLE PREFERRED STOCKS (Cost $33,405,075) | 24,947,090 | ||
| Equity Funds - 69.8% | |||
| Shares | Value ($) | ||
| Foreign Large Blend Funds - 7.3% | |||
| Fidelity Pacific Basin Fund (d) | 4,715,308 | 136,555,327 | |
| Fidelity SAI International Index Fund (d) | 13,358,547 | 165,378,810 | |
| Fidelity SAI International Low Volatility Index Fund (d) | 119,047,778 | 1,179,763,482 | |
TOTAL FOREIGN LARGE BLEND FUNDS | 1,481,697,619 | ||
| Foreign Large Growth Funds - 37.8% | |||
| Fidelity Advisor International Discovery Fund Class Z (d) | 47,845,841 | 1,956,894,915 | |
| Fidelity Diversified International Fund (d) | 43,859,439 | 1,685,079,660 | |
| Fidelity International Capital Appreciation Fund (d) | 66,221,018 | 1,484,013,020 | |
| Fidelity Overseas Fund (d) | 40,641,310 | 2,184,876,804 | |
| Fidelity SAI International Momentum Index Fund (d) | 24,309,817 | 282,723,166 | |
| Fidelity SAI International Quality Index Fund (d) | 8,942,764 | 98,012,695 | |
TOTAL FOREIGN LARGE GROWTH FUNDS | 7,691,600,260 | ||
| Foreign Large Value Funds - 19.0% | |||
| Fidelity SAI International Value Index Fund (d) | 434,725,086 | 3,864,706,011 | |
| Foreign Small Mid Blend Funds - 2.3% | |||
| Fidelity SAI International Small Cap Index Fund (d) | 58,897,441 | 464,111,834 | |
| Foreign Small Mid Growth Funds - 0.5% | |||
| Fidelity Advisor International Small Cap Opportunities Fund - Class Z (d) | 5,604,985 | 104,645,069 | |
| Sector Funds - 0.4% | |||
| Fidelity Advisor International Real Estate Fund Class Z (d) | 7,653,374 | 78,676,681 | |
| Other - 2.5% | |||
| Fidelity Advisor Japan Fund Class Z (d) | 24,951,250 | 369,028,981 | |
| Fidelity Japan Smaller Companies Fund (d) | 2,899,753 | 39,465,642 | |
| Fidelity SAI Japan Stock Index Fund (d) | 10,713,031 | 89,132,420 | |
TOTAL OTHER | 497,627,043 | ||
| TOTAL EQUITY FUNDS (Cost $14,205,195,906) | 14,183,064,517 | ||
| Other - 0.0% | |||
| Shares | Value ($) | ||
| Commodity Funds - Broad Basket - 0.0% | |||
Fidelity SAI Inflation-Focused Fund (d) (Cost $11,491,612) | 1,313,459 | 12,162,626 | |
| U.S. Treasury Obligations - 0.1% | |||
Principal Amount (e) | Value ($) | ||
U.S. Treasury Bills, yield at date of purchase 4.2% to 4.77% 3/2/23 to 6/1/23 (f) (Cost $27,973,585) | 28,040,000 | 27,972,007 | |
| Money Market Funds - 4.9% | |||
| Shares | Value ($) | ||
| Fidelity Cash Central Fund 4.63% (g) | 81,211,871 | 81,228,114 | |
| Fidelity Securities Lending Cash Central Fund 4.63% (g)(h) | 63,059,168 | 63,065,474 | |
| State Street Institutional U.S. Government Money Market Fund Premier Class 4.43% (i) | 847,206,042 | 847,206,042 | |
| TOTAL MONEY MARKET FUNDS (Cost $991,499,630) | 991,499,630 | ||
| TOTAL INVESTMENT IN SECURITIES - 100.2% (Cost $20,174,290,364) | 20,378,639,960 |
NET OTHER ASSETS (LIABILITIES) - (0.2)% | (48,954,883) |
| NET ASSETS - 100.0% | 20,329,685,077 |
| Futures Contracts | |||||
Number of contracts | Expiration Date | Notional Amount ($) | Value ($) | Unrealized Appreciation/ (Depreciation) ($) | |
| Purchased | |||||
| Equity Index Contracts | |||||
| CME Nikkei 225 Index Contracts (United States) | 250 | Mar 2023 | 34,281,250 | (698,255) | (698,255) |
| ICE E-mini MSCI EAFE Index Contracts (United States) | 7,955 | Mar 2023 | 814,035,150 | 793,639 | 793,639 |
| TOTAL FUTURES CONTRACTS | 95,384 | ||||
| The notional amount of futures purchased as a percentage of Net Assets is 4.2% | |||||
| (a) | Security exempt from registration under Rule 144A of the Securities Act of 1933. These securities may be resold in transactions exempt from registration, normally to qualified institutional buyers. At the end of the period, the value of these securities amounted to $122,118,862 or 0.6% of net assets. |
| (b) | Non-income producing |
| (c) | Security or a portion of the security is on loan at period end. |
| (d) | Affiliated Fund |
| (e) | Amount is stated in United States dollars unless otherwise noted. |
| (f) | Security or a portion of the security was pledged to cover margin requirements for futures contracts. At period end, the value of securities pledged amounted to $27,972,007. |
| (g) | Affiliated fund that is generally available only to investment companies and other accounts managed by Fidelity Investments. The rate quoted is the annualized seven-day yield of the fund at period end. A complete unaudited listing of the fund's holdings as of its most recent quarter end is available upon request. In addition, each Fidelity Central Fund's financial statements, which are not covered by the Fund's Report of Independent Registered Public Accounting Firm, are available on the SEC's website or upon request. |
| (h) | Investment made with cash collateral received from securities on loan. |
| (i) | The rate quoted is the annualized seven-day yield of the fund at period end. |
| Affiliate | Value, beginning of period ($) | Purchases ($) | Sales Proceeds ($) | Dividend Income ($) | Realized Gain (loss) ($) | Change in Unrealized appreciation (depreciation) ($) | Value, end of period ($) | % ownership, end of period |
| Fidelity Cash Central Fund 4.63% | 69,827,988 | 783,072,415 | 771,672,289 | 1,955,511 | - | - | 81,228,114 | 0.2% |
| Fidelity Securities Lending Cash Central Fund 4.63% | 26,204,871 | 707,757,964 | 670,897,361 | 1,062,925 | - | - | 63,065,474 | 0.2% |
| Total | 96,032,859 | 1,490,830,379 | 1,442,569,650 | 3,018,436 | - | - | 144,293,588 | |
| Affiliate | Value, beginning of period ($) | Purchases ($) | Sales Proceeds ($) | Dividend Income ($) | Realized Gain (loss) ($) | Change in Unrealized appreciation (depreciation) ($) | Value, end of period ($) |
| Fidelity Advisor International Discovery Fund Class Z | 2,384,485,835 | 9,395,830 | 165,000,000 | 9,395,831 | (61,092,919) | (210,893,831) | 1,956,894,915 |
| Fidelity Advisor International Real Estate Fund Class Z | 109,352,502 | 3,860,487 | 11,000,000 | 3,860,487 | (3,996,453) | (19,539,855) | 78,676,681 |
| Fidelity Advisor International Small Cap Opportunities Fund - Class Z | 100,692,930 | 24,212,658 | 4,000,000 | 6,397,631 | (1,533,370) | (14,727,149) | 104,645,069 |
| Fidelity Advisor Japan Fund Class Z | 426,151,570 | - | 13,000,001 | - | (4,964,044) | (39,158,544) | 369,028,981 |
| Fidelity Diversified International Fund | 2,014,096,859 | 22,613,382 | 154,258,218 | 22,355,163 | (47,517,586) | (149,854,777) | 1,685,079,660 |
| Fidelity International Capital Appreciation Fund | 1,739,292,927 | 716,354 | 126,000,000 | 716,355 | (42,836,477) | (87,159,784) | 1,484,013,020 |
| Fidelity Japan Smaller Companies Fund | 44,077,424 | 20,288 | 1,000,000 | 20,288 | (375,740) | (3,256,330) | 39,465,642 |
| Fidelity Overseas Fund | 2,516,726,904 | 16,674,369 | 139,000,000 | 16,674,369 | (38,342,433) | (171,182,036) | 2,184,876,804 |
| Fidelity Pacific Basin Fund | 171,989,260 | - | 4,999,999 | 11,454,300 | (893,593) | (29,540,341) | 136,555,327 |
| Fidelity SAI Inflation-Focused Fund | 13,476,115 | 1,468,909 | - | 1,468,909 | - | (2,782,398) | 12,162,626 |
| Fidelity SAI International Index Fund | 1,344,983,583 | 160,273,067 | 1,183,197,059 | 273,066 | (160,486,923) | 3,806,142 | 165,378,810 |
| Fidelity SAI International Low Volatility Index Fund | 1,286,213,686 | 23,107,437 | 8,000,000 | 23,107,437 | (1,668,551) | (119,889,090) | 1,179,763,482 |
| Fidelity SAI International Momentum Index Fund | 304,885,776 | 6,363,043 | 2,000,000 | 6,363,044 | (686,792) | (25,838,861) | 282,723,166 |
| Fidelity SAI International Quality Index Fund | 110,258,936 | 2,898,473 | 5,000,000 | 2,898,473 | (1,456,682) | (8,688,032) | 98,012,695 |
| Fidelity SAI International Small Cap Index Fund | 572,933,019 | 13,428,358 | 52,000,000 | 13,428,358 | (14,707,453) | (55,542,090) | 464,111,834 |
| Fidelity SAI International Value Index Fund | 4,068,504,316 | 166,427,823 | 204,229,885 | 164,197,938 | (33,975,291) | (132,020,952) | 3,864,706,011 |
| Fidelity SAI Japan Stock Index Fund | 168,885,685 | 2,314,306 | 60,110,911 | 2,203,397 | (17,259,516) | (4,697,144) | 89,132,420 |
| 17,377,007,327 | 453,774,784 | 2,132,796,073 | 284,815,046 | (431,793,823) | (1,070,965,072) | 14,195,227,143 |
| Valuation Inputs at Reporting Date: | ||||
| Description | Total ($) | Level 1 ($) | Level 2 ($) | Level 3 ($) |
Investments in Securities: | ||||
| Equities: | ||||
Communication Services | 192,525,013 | 74,256,834 | 118,268,179 | - |
Consumer Discretionary | 500,321,248 | 192,575,993 | 307,745,255 | - |
Consumer Staples | 324,120,098 | 95,769,422 | 228,350,676 | - |
Energy | 375,497,625 | 123,580,028 | 251,917,597 | - |
Financials | 1,307,603,695 | 634,226,656 | 673,377,039 | - |
Health Care | 527,051,707 | 140,663,265 | 386,388,442 | - |
Industrials | 803,317,693 | 486,759,140 | 316,558,553 | - |
Information Technology | 381,209,244 | 185,940,675 | 195,268,569 | - |
Materials | 497,930,252 | 176,006,323 | 321,923,929 | - |
Real Estate | 112,835,679 | 74,387,360 | 38,448,319 | - |
Utilities | 141,528,926 | 69,940,855 | 71,588,071 | - |
| Equity Funds | 14,183,064,517 | 14,183,064,517 | - | - |
| Other | 12,162,626 | 12,162,626 | - | - |
| Other Short-Term Investments | 27,972,007 | - | 27,972,007 | - |
| Money Market Funds | 991,499,630 | 991,499,630 | - | - |
| Total Investments in Securities: | 20,378,639,960 | 17,440,833,324 | 2,937,806,636 | - |
Derivative Instruments: | ||||
| Assets | ||||
Futures Contracts | 793,639 | 793,639 | - | - |
| Total Assets | 793,639 | 793,639 | - | - |
| Liabilities | ||||
Futures Contracts | (698,255) | (698,255) | - | - |
| Total Liabilities | (698,255) | (698,255) | - | - |
| Total Derivative Instruments: | 95,384 | 95,384 | - | - |
Primary Risk Exposure / Derivative Type | Value | |
| Asset ($) | Liability ($) | |
| Equity Risk | ||
Futures Contracts (a) | 793,639 | (698,255) |
| Total Equity Risk | 793,639 | (698,255) |
| Total Value of Derivatives | 793,639 | (698,255) |
| Statement of Assets and Liabilities | ||||
| February 28, 2023 | ||||
| Assets | ||||
| Investment in securities, at value (including securities loaned of $60,717,796) - See accompanying schedule: | ||||
Unaffiliated issuers (cost $5,813,309,258) | $ | 6,039,119,229 | ||
Fidelity Central Funds (cost $144,293,588) | 144,293,588 | |||
Other affiliated issuers (cost $14,216,687,518) | 14,195,227,143 | |||
| Total Investment in Securities (cost $20,174,290,364) | $ | 20,378,639,960 | ||
| Foreign currency held at value (cost $5,349) | 5,343 | |||
| Receivable for investments sold | 32,654,649 | |||
| Receivable for fund shares sold | 26,078,922 | |||
| Dividends receivable | 12,211,010 | |||
| Interest receivable | 2,494,223 | |||
| Distributions receivable from Fidelity Central Funds | 275,631 | |||
| Other receivables | 40,684 | |||
Total assets | 20,452,400,422 | |||
| Liabilities | ||||
| Payable for investments purchased | $ | 37,033,422 | ||
| Payable for fund shares redeemed | 14,721,362 | |||
| Accrued management fee | 1,214,985 | |||
| Payable for daily variation margin on futures contracts | 6,451,376 | |||
| Other payables and accrued expenses | 228,726 | |||
| Collateral on securities loaned | 63,065,474 | |||
| Total Liabilities | 122,715,345 | |||
| Net Assets | $ | 20,329,685,077 | ||
| Net Assets consist of: | ||||
| Paid in capital | $ | 21,221,133,808 | ||
| Total accumulated earnings (loss) | (891,448,731) | |||
| Net Assets | $ | 20,329,685,077 | ||
Net Asset Value , offering price and redemption price per share ($20,329,685,077 ÷ 1,924,433,541 shares) | $ | 10.56 | ||
| Statement of Operations | ||||
Year ended February 28, 2023 | ||||
| Investment Income | ||||
| Dividends: | ||||
| Unaffiliated issuers | $ | 179,721,464 | ||
| Affiliated issuers | 247,778,653 | |||
| Interest | 10,594,785 | |||
| Income from Fidelity Central Funds (including $1,062,925 from security lending) | 3,018,436 | |||
| Income before foreign taxes withheld | $ | 441,113,338 | ||
| Less foreign taxes withheld | (14,673,843) | |||
| Total Income | 426,439,495 | |||
| Expenses | ||||
| Management fee | $ | 64,419,507 | ||
| Custodian fees and expenses | 331,063 | |||
| Independent trustees' fees and expenses | 134,981 | |||
| Registration fees | 638,556 | |||
| Audit | 98,189 | |||
| Legal | 34,081 | |||
| Miscellaneous | 131,818 | |||
| Total expenses before reductions | 65,788,195 | |||
| Expense reductions | (50,972,031) | |||
| Total expenses after reductions | 14,816,164 | |||
| Net Investment income (loss) | 411,623,331 | |||
| Realized and Unrealized Gain (Loss) | ||||
| Net realized gain (loss) on: | ||||
| Investment Securities: | ||||
| Unaffiliated issuers | (417,434,180) | |||
| Affiliated issuers | (431,793,823) | |||
| Foreign currency transactions | (2,291,878) | |||
| Futures contracts | (240,697,933) | |||
| Capital gain distributions from underlying funds: | ||||
| Affiliated issuers | 37,036,393 | |||
| Total net realized gain (loss) | (1,055,181,421) | |||
| Change in net unrealized appreciation (depreciation) on: | ||||
| Investment Securities: | ||||
| Unaffiliated issuers | 92,001,424 | |||
| Affiliated issuers | (1,070,965,072) | |||
| Assets and liabilities in foreign currencies | (197,019) | |||
| Futures contracts | 85,966,363 | |||
| Total change in net unrealized appreciation (depreciation) | (893,194,304) | |||
| Net gain (loss) | (1,948,375,725) | |||
| Net increase (decrease) in net assets resulting from operations | $ | (1,536,752,394) | ||
| Statement of Changes in Net Assets | ||||
Year ended February 28, 2023 | Year ended February 28, 2022 | |||
| Increase (Decrease) in Net Assets | ||||
| Operations | ||||
| Net investment income (loss) | $ | 411,623,331 | $ | 461,425,423 |
| Net realized gain (loss) | (1,055,181,421) | 1,113,337,301 | ||
| Change in net unrealized appreciation (depreciation) | (893,194,304) | (1,762,830,917) | ||
| Net increase (decrease) in net assets resulting from operations | (1,536,752,394) | (188,068,193) | ||
| Distributions to shareholders | (932,369,267) | (1,317,924,908) | ||
| Share transactions | ||||
| Proceeds from sales of shares | 6,042,249,354 | 12,229,755,768 | ||
| Reinvestment of distributions | 908,934,682 | 1,294,919,467 | ||
| Cost of shares redeemed | (8,739,005,114) | (3,882,294,279) | ||
Net increase (decrease) in net assets resulting from share transactions | (1,787,821,078) | 9,642,380,956 | ||
| Total increase (decrease) in net assets | (4,256,942,739) | 8,136,387,855 | ||
| Net Assets | ||||
| Beginning of period | 24,586,627,816 | 16,450,239,961 | ||
| End of period | $ | 20,329,685,077 | $ | 24,586,627,816 |
| Other Information | ||||
| Shares | ||||
| Sold | 582,743,564 | 956,141,916 | ||
| Issued in reinvestment of distributions | 84,478,706 | 102,217,040 | ||
| Redeemed | (851,489,717) | (302,048,311) | ||
| Net increase (decrease) | (184,267,447) | 756,310,645 | ||
| Strategic Advisers® Fidelity® International Fund |
| Years ended February 28, | 2023 | 2022 | 2021 | 2020 A | 2019 | |||||
Selected Per-Share Data | ||||||||||
| Net asset value, beginning of period | $ | 11.66 | $ | 12.16 | $ | 9.84 | $ | 9.66 | $ | 10.69 |
| Income from Investment Operations | ||||||||||
Net investment income (loss) B,C | .21 | .27 | .10 | .20 | .16 | |||||
| Net realized and unrealized gain (loss) | (.84) | (.03) | 2.37 | .31 | (.85) | |||||
| Total from investment operations | (.63) | .24 | 2.47 | .51 | (.69) | |||||
| Distributions from net investment income | (.21) | (.25) | (.08) | (.19) | (.15) | |||||
| Distributions from net realized gain | (.26) | (.49) | (.07) | (.14) | (.20) | |||||
| Total distributions | (.47) | (.74) | (.15) | (.33) | (.34) D | |||||
| Net asset value, end of period | $ | 10.56 | $ | 11.66 | $ | 12.16 | $ | 9.84 | $ | 9.66 |
Total Return E | (5.41)% | 1.59% | 25.35% | 5.10% | (6.41)% | |||||
Ratios to Average Net Assets C,F,G | ||||||||||
| Expenses before reductions | .32% | .30% | .28% | .29% | .35% | |||||
| Expenses net of fee waivers, if any | .07% | .05% | .03% | .04% | .10% | |||||
| Expenses net of all reductions | .07% | .05% | .03% | .04% | .09% | |||||
| Net investment income (loss) | 2.02% | 2.09% | .93% | 1.97% | 1.65% | |||||
| Supplemental Data | ||||||||||
| Net assets, end of period (000 omitted) | $ | 20,329,685 | $ | 24,586,628 | $ | 16,450,240 | $ | 8,776,005 | $ | 6,342,369 |
Portfolio turnover rate H | 16% | 17% | 6% | 6% | 9% |
| Strategic Advisers Fidelity International Fund | $40,240 |
| Gross unrealized appreciation | $1,405,051,643 |
| Gross unrealized depreciation | (1,284,534,487) |
| Net unrealized appreciation (depreciation) | $120,517,156 |
| Tax Cost | $20,258,122,804 |
| Capital loss carryforward | $(1,011,741,848) |
| Net unrealized appreciation (depreciation) on securities and other investments | $120,293,117 |
Short-term | $(661,486,173) |
Long-term | (350,255,675) |
| Total capital loss carryforward | $(1,011,741,848) |
| February 28, 2023 | February 28, 2022 | |
| Ordinary Income | $394,858,096 | $ 898,630,674 |
| Long-term Capital Gains | 537,511,171 | 419,294,234 |
| Total | $932,369,267 | $ 1,317,924,908 |
| Equity Risk | Equity risk relates to the fluctuations in the value of financial instruments as a result of changes in market prices (other than those arising from interest rate risk or foreign exchange risk), whether caused by factors specific to an individual investment, its issuer, or all factors affecting all instruments traded in a market or market segment. |
| Purchases ($) | Sales ($) | |
| Strategic Advisers Fidelity International Fund | 3,081,759,644 | 4,638,153,157 |
| Amount | |
| Strategic Advisers Fidelity International Fund | $ 1,114 |
| Purchases ($) | Sales ($) | Realized Gain (Loss) ($) | |
| Strategic Advisers Fidelity International Fund | 53,272,235 | 47,784,684 | (5,968,197) |
| Fidelity Central Fund | Investment Manager | Investment Objective | Investment Practices | Expense Ratio A |
| Fidelity Money Market Central Funds | Fidelity Management & Research Company LLC (FMR) | Each fund seeks to obtain a high level of current income consistent with the preservation of capital and liquidity. | Short-term Investments | Less than .005% |
| Amount | |
| Strategic Advisers Fidelity International Fund | $ 37,588 |
| Total Security Lending Fees Paid to NFS | Security Lending Income From Securities Loaned to NFS | Value of Securities Loaned to NFS at Period End | |
| Strategic Advisers Fidelity International Fund | $ 113,774 | $ - | $- |
| Fund | Strategic Advisers Fidelity International Fund |
| Fidelity Diversified International Fund | 18% |
| Fidelity International Capital Appreciation Fund | 36% |
| Fidelity International Discovery Fund | 25% |
| Fidelity International Real Estate Fund | 13% |
| Fidelity Japan Fund | 60% |
| Fidelity Japan Smaller Companies Fund | 10% |
| Fidelity Overseas Fund | 29% |
| Fidelity Pacific Basin Fund | 18% |
| Fidelity SAI International Low Volatility Index Fund | 23% |
| Fidelity SAI International Momentum Index Fund | 47% |
| Fidelity SAI International Quality Index Fund | 29% |
| Fidelity SAI International Small Cap Index Fund | 67% |
| Fidelity SAI International Value Index Fund | 83% |
| The Example is based on an investment of $1,000 invested at the beginning of the period and held for the entire period (September 1, 2022 to February 28, 2023). |
Annualized Expense Ratio- A | Beginning Account Value September 1, 2022 | Ending Account Value February 28, 2023 | Expenses Paid During Period- C September 1, 2022 to February 28, 2023 | |||||||
| Strategic Advisers® Fidelity® International Fund | .08% | |||||||||
| Actual | $ 1,000 | $ 1,111.00 | $ .42 | |||||||
Hypothetical- B | $ 1,000 | $ 1,024.40 | $ .40 | |||||||


- Highly liquid investments - cash or convertible to cash within three business days or less
- Moderately liquid investments - convertible to cash in three to seven calendar days
- Less liquid investments - can be sold or disposed of, but not settled, within seven calendar days
- Illiquid investments - cannot be sold or disposed of within seven calendar days
 |


Contents
| Average Annual Total Returns | |||
Periods ended February 28, 2023 | Past 1 year | Past 5 years | Past 10 years |
| Strategic Advisers® Emerging Markets Fund | -15.33% | -1.62% | 1.50% |
| $10,000 Over 10 Years |
Let's say hypothetically that $10,000 was invested in Strategic Advisers® Emerging Markets Fund on February 28, 2013. The chart shows how the value of your investment would have changed, and also shows how the MSCI Emerging Markets Index performed over the same period. |
 |
Top Holdings (% of Fund's net assets) | ||
| (excluding cash equivalents) | ||
| Fidelity SAI Emerging Markets Value Index Fund | 10.6 | |
| Fidelity SAI Emerging Markets Low Volatility Index Fund | 7.5 | |
| Fidelity Advisor Emerging Markets Fund Class Z | 6.4 | |
| Taiwan Semiconductor Manufacturing Co. Ltd. | 4.2 | |
| Goldman Sachs Emerging Markets Equity Fund Institutional Shares | 3.1 | |
| Tencent Holdings Ltd. | 3.0 | |
| Fidelity SAI Emerging Markets Index Fund | 2.9 | |
| Samsung Electronics Co. Ltd. | 2.5 | |
| Invesco Developing Markets Fund Class R6 | 2.1 | |
| Aberdeen Emerging Markets Fund Institutional Service Class | 1.9 | |
| 44.2 | ||
| Market Sectors (% of Fund's net assets) | ||
| (Stocks Only) | ||
| Financials | 12.3 | |
| Information Technology | 12.2 | |
| Consumer Discretionary | 9.0 | |
| Communication Services | 5.0 | |
| Consumer Staples | 4.3 | |
| Materials | 3.8 | |
| Industrials | 3.5 | |
| Energy | 2.2 | |
| Health Care | 1.6 | |
| Utilities | 0.6 | |
| Real Estate | 0.6 | |
Asset Allocation (% of Fund's net assets) |
 |
Geographic Diversification (% of Fund's net assets) |
 |
* Includes Short-Term investments and Net Other Assets (Liabilities). Percentages are based on country or territory of incorporation and are adjusted for the effect of derivatives, if applicable. |
| Common Stocks - 53.8% | |||
| Shares | Value ($) | ||
| COMMUNICATION SERVICES - 5.0% | |||
| Diversified Telecommunication Services - 0.3% | |||
| Chunghwa Telecom Co. Ltd. | 538,000 | 2,016,200 | |
| Hellenic Telecommunications Organization SA | 149,427 | 2,294,871 | |
| KT Corp. | 196,383 | 4,529,321 | |
| LG Uplus Corp. | 699,323 | 5,859,495 | |
| Ooredoo QSC | 394,613 | 996,894 | |
| PT Telkom Indonesia Persero Tbk | 7,074,910 | 1,802,234 | |
| Saudi Telecom Co. | 540,693 | 5,064,517 | |
| 22,563,532 | |||
| Entertainment - 0.6% | |||
| 37 Interactive Entertainment Network Technology Group Co. Ltd. (A Shares) | 1,927,086 | 6,106,395 | |
| FriendTimes, Inc. | 125,932 | 18,450 | |
| G-bits Network Technology Xiamen Co. Ltd. (A Shares) | 93,617 | 4,766,320 | |
| IGG, Inc. (a) | 421,000 | 153,932 | |
| International Games Systems Co. Ltd. | 215,265 | 3,536,396 | |
| Kingnet Network Co. Ltd. (A Shares) (a) | 1,228,500 | 1,506,079 | |
| Kingsoft Corp. Ltd. | 73,000 | 240,407 | |
| Mgame Corp. (a) | 34,930 | 237,151 | |
| Neowiz (a) | 25,740 | 913,726 | |
| NetDragon WebSoft, Inc. | 85,000 | 193,403 | |
| NetEase, Inc. | 304,000 | 4,724,299 | |
| NetEase, Inc. ADR (b) | 164,797 | 12,794,839 | |
| NHN Corp. (a) | 4,835 | 106,128 | |
| Perfect World Co. Ltd. (A Shares) | 1,038,355 | 2,132,601 | |
| Sea Ltd. ADR (a) | 98,208 | 6,137,018 | |
| Tencent Music Entertainment Group ADR (a) | 574,589 | 4,332,401 | |
| UserJoy Technology Co. Ltd. | 19,000 | 46,480 | |
| 47,946,025 | |||
| Interactive Media & Services - 3.3% | |||
| Autohome, Inc. ADR Class A | 72,085 | 2,198,593 | |
| Baidu, Inc.: | |||
| Class A (a) | 408,656 | 7,026,155 | |
| sponsored ADR (a) | 8,638 | 1,189,366 | |
| Hello Group, Inc. ADR | 88,200 | 777,042 | |
| Info Edge India Ltd. | 31,994 | 1,351,727 | |
| JOYY, Inc. ADR | 3,664 | 115,050 | |
| NAVER Corp. | 65,589 | 10,350,749 | |
| Tencent Holdings Ltd. | 5,017,678 | 220,418,601 | |
| Weibo Corp. sponsored ADR (a) | 5,114 | 105,758 | |
| Yandex NV Series A (a)(c) | 974,417 | 3,342,094 | |
| 246,875,135 | |||
| Media - 0.1% | |||
| Arabian Contracting Services Co. | 4,413 | 128,181 | |
| Cheil Worldwide, Inc. | 5,436 | 82,289 | |
| Chinese Universe Publishing and Media Group Co. Ltd. (A Shares) | 1,812,741 | 2,614,505 | |
| Jagran Prakashan Ltd. | 30,888 | 25,583 | |
| Korea Business News Co. Ltd. | 6,677 | 29,969 | |
| LG HelloVision Co. Ltd. | 10,601 | 35,867 | |
| Media Prima Bhd | 336,800 | 31,147 | |
| Shandong Publishing & Media Co. Ltd. (A Shares) | 1,516,200 | 1,447,666 | |
| Wasu Media Holding Co. Ltd. (A Shares) | 332,600 | 386,164 | |
| Woongjin Holdings Co. Ltd. | 19,424 | 43,812 | |
| 4,825,183 | |||
| Wireless Telecommunication Services - 0.7% | |||
| America Movil S.A.B. de CV Series L | 2,606,714 | 2,704,093 | |
| Bharti Airtel Ltd. | 1,638,173 | 14,712,734 | |
| Etihad Etisalat Co. | 333,885 | 3,478,849 | |
| Mobile Telecommunication Co. | 265,142 | 482,783 | |
| MTN Group Ltd. | 2,836,681 | 22,367,535 | |
| SK Telecom Co. Ltd. | 57,265 | 1,955,385 | |
| TIM SA | 695,775 | 1,629,316 | |
| Turkcell Iletisim Hizmet A/S | 526,877 | 890,543 | |
| Vodafone Qatar QSC (a) | 93,166 | 40,677 | |
| 48,261,915 | |||
TOTAL COMMUNICATION SERVICES | 370,471,790 | ||
| CONSUMER DISCRETIONARY - 9.0% | |||
| Auto Components - 0.1% | |||
| Chaowei Power Holdings Ltd. | 68,000 | 17,326 | |
| FIEM Industries Ltd. | 6,009 | 112,702 | |
| Fuyao Glass Industries Group Co. Ltd. (A Shares) | 1,052,500 | 5,627,279 | |
| Lumax Industries Ltd. | 1,164 | 23,281 | |
| MAHLE Metal Leve SA | 35,265 | 217,163 | |
| Seoyon Co. Ltd. | 5,312 | 33,090 | |
| Shenzhen Kedali Industry Co. Ltd. | 16,996 | 300,557 | |
| Somboon Advance Technology PCL unit | 71,100 | 41,583 | |
| Tianneng Power International Ltd. | 1,305,826 | 1,673,581 | |
| Yoosung Enterprise Co. Ltd. | 12,624 | 27,471 | |
| 8,074,033 | |||
| Automobiles - 1.2% | |||
| Bajaj Auto Ltd. | 136,456 | 6,045,045 | |
| Brilliance China Automotive Holdings Ltd. | 1,816,000 | 906,913 | |
| BYD Co. Ltd.: | |||
| (A Shares) | 39,697 | 1,493,204 | |
| (H Shares) | 417,500 | 11,224,177 | |
| Dongfeng Motor Group Co. Ltd. (H Shares) | 1,494,000 | 763,235 | |
| Eicher Motors Ltd. | 16,964 | 637,528 | |
| Guangzhou Automobile Group Co. Ltd. (H Shares) | 17,205,347 | 10,959,657 | |
| Hyundai Motor Co. | 114,275 | 15,248,891 | |
| Kia Corp. | 324,343 | 18,485,629 | |
| Li Auto, Inc.: | |||
| ADR (a)(b) | 375,642 | 8,868,908 | |
| Class A (a) | 17,500 | 205,669 | |
| Mahindra & Mahindra Ltd. | 294,901 | 4,530,296 | |
| Maruti Suzuki India Ltd. | 61,298 | 6,396,702 | |
| PT Astra International Tbk | 2,491,400 | 996,560 | |
| UMW Holdings Bhd | 40,100 | 34,850 | |
| 86,797,264 | |||
| Distributors - 0.0% | |||
| Xinhua Winshare Publishing and Media Co. Ltd. | 18,795 | 14,247 | |
| Diversified Consumer Services - 0.0% | |||
| Human Soft Holding Co. KSCC | 30,860 | 369,918 | |
| New Oriental Education & Technology Group, Inc. (a) | 129,100 | 497,846 | |
| New Oriental Education & Technology Group, Inc. sponsored ADR (a) | 47,000 | 1,819,840 | |
| TAL Education Group ADR (a) | 35,361 | 248,588 | |
| Visang Education, Inc. | 8,025 | 38,024 | |
| YDUQS Participacoes SA | 19,275 | 25,956 | |
| 3,000,172 | |||
| Hotels, Restaurants & Leisure - 1.3% | |||
| Alamar Foods | 5,289 | 220,431 | |
| AmRest Holdings NV (a) | 6,459 | 30,273 | |
| DOUBLEUGAMES Co. Ltd. | 1,751 | 61,362 | |
| Famous Brands Ltd. | 971 | 3,516 | |
| Gourmet Master Co. Ltd. | 44,000 | 226,155 | |
| H World Group Ltd. ADR | 154,985 | 7,341,639 | |
| Jollibee Food Corp. | 327,230 | 1,419,268 | |
| Las Vegas Sands Corp. (a) | 88,000 | 5,057,360 | |
| MakeMyTrip Ltd. (a) | 46,773 | 1,212,356 | |
| MK Restaurants Group PCL unit | 29,200 | 46,010 | |
| Sands China Ltd. (a) | 327,200 | 1,133,824 | |
| Shangri-La Asia Ltd. (a) | 5,578,000 | 5,329,707 | |
| Songcheng Performance Development Co. Ltd. (A Shares) | 2,684,041 | 6,077,746 | |
| STS Holding SA | 9,520 | 37,793 | |
| Tongcheng Travel Holdings Ltd. (a) | 2,082,000 | 4,127,184 | |
| Trip.com Group Ltd. (a) | 43,150 | 1,533,538 | |
| Trip.com Group Ltd. ADR (a) | 415,614 | 14,775,078 | |
| Yum China Holdings, Inc. | 709,828 | 41,688,198 | |
| Yum China Holdings, Inc. (Hong Kong) | 88,386 | 5,193,215 | |
| 95,514,653 | |||
| Household Durables - 0.8% | |||
| Bear Electric Appliance Co. Ltd. (A Shares) | 48,588 | 515,495 | |
| Cury Construtora e Incorporado SA | 36,400 | 87,603 | |
| Daewon Co. Ltd. | 1,576 | 8,935 | |
| Haier Smart Home Co. Ltd. | 1,629,083 | 5,765,447 | |
| Haier Smart Home Co. Ltd. (A Shares) | 3,816,141 | 14,481,015 | |
| Hisense Home Appliances Group Co. Ltd. (H Shares) | 27,000 | 40,520 | |
| Huisen Household International Group Ltd. (a) | 350,000 | 13,600 | |
| KingClean Electric Co. Ltd. (A Shares) | 57,600 | 258,699 | |
| LG Electronics, Inc. | 86,796 | 7,305,320 | |
| Midea Group Co. Ltd. (A Shares) | 3,243,386 | 24,540,345 | |
| Skyworth Group Ltd. | 4,001,457 | 2,192,048 | |
| TCL Electronics Holdings Ltd. | 591,000 | 255,241 | |
| Viomi Technology Co. Ltd. ADR Class A (a) | 71,922 | 74,799 | |
| Zhejiang Supor Cookware Co. Ltd. | 887,807 | 7,289,764 | |
| 62,828,831 | |||
| Internet & Direct Marketing Retail - 4.2% | |||
| Alibaba Group Holding Ltd. (a) | 9,473,460 | 104,127,007 | |
| Alibaba Group Holding Ltd. sponsored ADR (a) | 321,955 | 28,264,429 | |
| Alibaba Health Information Technology Ltd. (a) | 380,000 | 271,104 | |
| JD.com, Inc.: | |||
| Class A | 1,922,937 | 42,746,757 | |
| sponsored ADR | 338,248 | 15,031,741 | |
| Meituan Class B (a)(d) | 3,079,074 | 53,437,123 | |
| MercadoLibre, Inc. (a) | 10,339 | 12,613,580 | |
| Naspers Ltd. Class N | 107,871 | 18,968,431 | |
| Ozon Holdings PLC ADR (a)(b)(c) | 53,343 | 112,054 | |
| Pdd Holdings, Inc. ADR (a) | 353,529 | 31,015,099 | |
| Prosus NV | 32,320 | 2,316,996 | |
| Vipshop Holdings Ltd. ADR (a) | 476,929 | 7,101,473 | |
| 316,005,794 | |||
| Leisure Products - 0.0% | |||
| Goodbaby International Holdings Ltd. (a) | 96 | 8 | |
| Multiline Retail - 0.2% | |||
| AEON Co. (M) Bhd | 59,400 | 18,002 | |
| Falabella SA | 156,485 | 344,499 | |
| MINISO Group Holding Ltd. ADR | 74,199 | 1,328,162 | |
| Pepco Group NV (a) | 729,566 | 7,225,878 | |
| PT Mitra Adiperkasa Tbk (a) | 6,036,308 | 597,693 | |
| Savezon I&C Corp. | 11,337 | 24,327 | |
| Woolworths Holdings Ltd. | 299,414 | 1,255,370 | |
| 10,793,931 | |||
| Specialty Retail - 0.4% | |||
| Abdullah Saad Mohammed Abo Moati Stationaries Co. | 3,390 | 23,894 | |
| Abu Dhabi National Oil Co. for Distribution PJSC | 521,027 | 612,789 | |
| Bermaz Auto Bhd | 80,700 | 38,664 | |
| Cashbuild Ltd. | 18 | 194 | |
| China Harmony Auto Holding Ltd. | 514,500 | 67,513 | |
| China Tourism Group Duty Free Corp. Ltd. (A Shares) | 67,585 | 1,925,959 | |
| Chow Tai Fook Jewellery Group Ltd. | 165,600 | 320,677 | |
| Dogus Otomotiv Servis ve Ticaret A/S | 242,123 | 2,164,171 | |
| Foschini Group Ltd./The | 210,909 | 1,166,230 | |
| Grand Baoxin Auto Group Ltd. (a) | 235,000 | 11,526 | |
| Index Living Mall PCL NVDR | 230,500 | 126,301 | |
| Lewis Group Ltd. | 11,913 | 27,024 | |
| Lojas Renner SA | 545,671 | 1,943,818 | |
| LOTTE Hi-Mart Co. Ltd. | 125 | 1,256 | |
| Motus Holdings Ltd. | 135,807 | 818,318 | |
| Pet Center Comercio e Participacoes SA | 3,901,900 | 4,807,085 | |
| Pou Sheng International (Holdings) Ltd. | 265,273 | 28,388 | |
| Shan-Loong Transportation Co. Ltd. | 32,000 | 32,427 | |
| SSI Group, Inc. | 136,000 | 4,178 | |
| Truworths International Ltd. | 126,131 | 406,380 | |
| Zhongsheng Group Holdings Ltd. Class H | 3,016,500 | 15,045,223 | |
| 29,572,015 | |||
| Textiles, Apparel & Luxury Goods - 0.8% | |||
| Anta Sports Products Ltd. | 199,400 | 2,626,692 | |
| Cabbeen Fashion Ltd. | 79,891 | 10,076 | |
| CECEP COSTIN New Materials Group Ltd. (a)(c) | 741,000 | 28,321 | |
| Century Enka Ltd. | 5,958 | 25,365 | |
| ECLAT Textile Co. Ltd. | 460,000 | 7,190,306 | |
| Fila Holdings Corp. | 19,203 | 566,850 | |
| Fulgent Sun International Holding Co. Ltd. | 195,000 | 865,891 | |
| Kddl Ltd. | 299 | 3,870 | |
| Kewal Kiran Clothing Ltd. | 12,217 | 58,657 | |
| LF Corp. | 6,017 | 79,016 | |
| Li Ning Co. Ltd. | 3,357,508 | 28,551,693 | |
| Makalot Industrial Co. Ltd. | 115,000 | 802,456 | |
| Pou Chen Corp. | 1,109,000 | 1,212,180 | |
| Sabina Public Co. Ltd. NVDR | 10,600 | 7,463 | |
| Samsonite International SA (a)(d) | 172,800 | 484,317 | |
| Shenzhou International Group Holdings Ltd. | 1,545,298 | 16,907,975 | |
| Sutlej Textiles & Industries Ltd. | 12,472 | 7,108 | |
| Vardhman Textiles Ltd. (a) | 915 | 3,409 | |
| Weiqiao Textile Co. Ltd. (H Shares) | 121,056 | 20,974 | |
| Youngone Corp. | 33,240 | 1,073,037 | |
| Zhejiang Semir Garment Co. Ltd. (A Shares) | 665,300 | 584,371 | |
| 61,110,027 | |||
TOTAL CONSUMER DISCRETIONARY | 673,710,975 | ||
| CONSUMER STAPLES - 4.3% | |||
| Beverages - 1.6% | |||
| Anadolu Efes Biracilik Ve Malt Sanayii A/S | 8,132 | 23,985 | |
| Arca Continental S.A.B. de CV | 139,743 | 1,179,412 | |
| Beijing Yanjing Brewery Co. Ltd. (A Shares) | 741,070 | 1,441,866 | |
| Budweiser Brewing Co. APAC Ltd. (d) | 6,180,700 | 18,504,147 | |
| China Resources Beer Holdings Co. Ltd. | 1,010,295 | 7,458,735 | |
| Coca-Cola FEMSA S.A.B. de CV sponsored ADR (b) | 18,672 | 1,344,571 | |
| Fomento Economico Mexicano S.A.B. de CV sponsored ADR | 158,174 | 14,539,354 | |
| Fraser & Neave Holdings Bhd | 2,200 | 13,482 | |
| Heineken Malaysia Bhd | 6,000 | 38,266 | |
| Heineken NV (Bearer) | 62,608 | 6,390,276 | |
| Kweichow Moutai Co. Ltd. (A Shares) | 93,634 | 24,494,149 | |
| Nongfu Spring Co. Ltd. (H Shares) (d) | 281,800 | 1,579,637 | |
| Power Root Bhd | 59,000 | 28,925 | |
| Shanxi Xinghuacun Fen Wine Factory Co. Ltd. (A Shares) | 21,900 | 892,785 | |
| Thai Beverage PCL | 5,426,392 | 2,575,469 | |
| Tsingtao Brewery Co. Ltd. (H Shares) | 423,000 | 4,171,045 | |
| Varun Beverages Ltd. | 136,760 | 2,152,466 | |
| Wuliangye Yibin Co. Ltd. (A Shares) | 1,216,579 | 35,868,849 | |
| 122,697,419 | |||
| Food & Staples Retailing - 1.2% | |||
| Bid Corp. Ltd. | 194,740 | 4,264,875 | |
| Chengdu Hongqi Chain Co. Ltd. (A Shares) | 258,000 | 214,709 | |
| Clicks Group Ltd. | 434,937 | 6,335,184 | |
| CP ALL PCL (For. Reg.) | 7,330,772 | 12,903,907 | |
| Dino Polska SA (a)(d) | 7,430 | 620,649 | |
| E-Mart, Inc. | 9,930 | 841,787 | |
| Jeronimo Martins SGPS SA | 50,313 | 1,033,456 | |
| Laobaixing Pharmacy Chain JSC (A Shares) | 177,298 | 1,029,256 | |
| Magnit OJSC (a)(c) | 45,493 | 1,159 | |
| Migros Turk Ticaret A/S (a) | 16,077 | 123,100 | |
| Nahdi Medical Co. | 135,775 | 6,751,393 | |
| PT Sumber Alfaria Trijaya Tbk | 5,466,300 | 1,039,493 | |
| Raia Drogasil SA | 5,028,586 | 21,783,864 | |
| Shoprite Holdings Ltd. | 442,318 | 5,359,839 | |
| Spar Group Ltd./The | 83,297 | 653,132 | |
| Wal-Mart de Mexico SA de CV Series V | 5,011,219 | 19,722,782 | |
| X5 Retail Group NV GDR (Reg. S) (a)(c) | 166,798 | 34,826 | |
| Yifeng Pharmacy Chain Co. Ltd. | 779,678 | 6,803,375 | |
| 89,516,786 | |||
| Food Products - 1.0% | |||
| AVI Ltd. | 360,936 | 1,496,022 | |
| Brasilagro Coia Brasileira de | 80,300 | 397,861 | |
| Britannia Industries Ltd. | 21,267 | 1,148,140 | |
| Chacha Food Co. Ltd. (A Shares) | 372,900 | 2,463,268 | |
| Cheng de Lolo Co. Ltd. Class A (a) | 405,800 | 532,022 | |
| China Mengniu Dairy Co. Ltd. | 7,791,496 | 34,245,498 | |
| Dhampur Bio Organics Ltd. (a) | 28,099 | 50,183 | |
| Dhampur Sugar Mills Ltd. | 28,099 | 70,685 | |
| Dwarikesh Sugar Industries Ltd. | 32,054 | 31,920 | |
| Foshan Haitian Flavouring & Food Co. Ltd. (A Shares) | 308,900 | 3,661,321 | |
| Gruma S.A.B. de CV Series B | 301,355 | 4,417,589 | |
| Grupo Bimbo S.A.B. de CV Series A | 279,400 | 1,326,259 | |
| JBS SA | 2,086,129 | 7,646,490 | |
| LT Foods Ltd. | 8,290 | 9,685 | |
| Marfrig Global Foods SA | 728,300 | 886,127 | |
| Minerva SA | 669,200 | 1,448,211 | |
| PT Indofood CBP Sukses Makmur Tbk | 843,100 | 559,763 | |
| PT Indofood Sukses Makmur Tbk | 2,459,800 | 1,044,407 | |
| PT Perusahaan Perkebunan London Sumatra Indonesia Tbk | 2,157,000 | 150,636 | |
| PT Triputra Agro Persada | 990,800 | 42,556 | |
| Saudi Dairy & Foodstuffs Co. | 6,799 | 440,626 | |
| SLC Agricola SA | 71,630 | 674,099 | |
| The National Agriculture Development Co. (a) | 25,343 | 162,081 | |
| Three-A Resources Bhd | 93,000 | 17,823 | |
| Tiger Brands Ltd. | 20,048 | 242,344 | |
| Tingyi (Cayman Islands) Holding Corp. | 154,000 | 248,773 | |
| Uni-President China Holdings Ltd. | 105,000 | 92,033 | |
| Uni-President Enterprises Corp. | 1,327,000 | 2,913,874 | |
| Universal Robina Corp. | 928,030 | 2,289,258 | |
| Uttam Sugar Mills Ltd. | 7,844 | 22,470 | |
| Vietnam Dairy Products Corp. | 1,294,100 | 4,112,144 | |
| Yihai International Holding Ltd. | 37,000 | 107,473 | |
| 72,951,641 | |||
| Personal Products - 0.3% | |||
| Able C&C Ltd. (a) | 5,949 | 33,005 | |
| Emami Ltd. | 10,684 | 51,626 | |
| Gillette India Ltd. | 254 | 14,336 | |
| Hindustan Unilever Ltd. | 486,474 | 14,484,146 | |
| LG H & H Co. Ltd. | 9,585 | 4,846,222 | |
| 19,429,335 | |||
| Tobacco - 0.2% | |||
| British American Tobacco (Malaysia) Bhd | 11,100 | 29,138 | |
| Godfrey Phillips India Ltd. | 2,274 | 48,853 | |
| ITC Ltd. | 3,784,900 | 17,251,762 | |
| PT Gudang Garam Tbk | 129,800 | 212,787 | |
| PT Hanjaya Mandala Sampoerna Tbk | 3,097,000 | 240,652 | |
| 17,783,192 | |||
TOTAL CONSUMER STAPLES | 322,378,373 | ||
| ENERGY - 1.9% | |||
| Energy Equipment & Services - 0.0% | |||
| Ezion Holdings Ltd. warrants 4/16/23 (a)(c) | 5,020,014 | 5,845 | |
| Yantai Jereh Oilfield Services (A Shares) | 194,196 | 866,031 | |
| 871,876 | |||
| Oil, Gas & Consumable Fuels - 1.9% | |||
| 3R Petroleum Oleo e Gas SA (a) | 168,904 | 1,174,645 | |
| Bangchak Corp. PCL NVDR | 174,200 | 159,499 | |
| Banpu PCL: | |||
| (For. Reg.) | 5,360,600 | 1,658,898 | |
| NVDR | 6,985,300 | 2,161,680 | |
| China Coal Energy Co. Ltd. (H Shares) | 8,442,000 | 6,528,262 | |
| China Merchants Energy Shipping Co. Ltd. (A Shares) | 1,862,260 | 1,890,892 | |
| China Petroleum & Chemical Corp. (H Shares) | 4,806,000 | 2,455,227 | |
| China Shenhua Energy Co. Ltd. (H Shares) | 676,000 | 2,032,461 | |
| Coal India Ltd. | 1,991,143 | 5,189,572 | |
| Empresas COPEC SA | 335,032 | 2,420,640 | |
| Esso Thailand PCL unit | 1,377,500 | 350,021 | |
| Exxaro Resources Ltd. | 71,682 | 785,009 | |
| Gazprom OAO (c) | 1,235,592 | 160,300 | |
| Gazprom OAO sponsored ADR (Reg. S) (a)(c) | 968,777 | 221,307 | |
| Lanna Resources PCL unit | 81,200 | 35,733 | |
| LUKOIL PJSC (c) | 165,638 | 63,564 | |
| LUKOIL PJSC sponsored ADR (a)(c) | 341,548 | 96,621 | |
| MOL Hungarian Oil and Gas PLC Series A (For. Reg.) | 282,256 | 2,147,831 | |
| Novatek PJSC GDR (Reg. S) (a)(c) | 82,920 | 21,184 | |
| Oil & Natural Gas Corp. Ltd. | 2,014,672 | 3,706,587 | |
| OMV AG | 43,352 | 2,114,301 | |
| Petro Rio SA (a) | 2,508,487 | 16,146,847 | |
| PetroChina Co. Ltd. (H Shares) | 31,096,000 | 15,925,538 | |
| PT Adaro Energy Indonesia Tbk | 35,216,100 | 6,904,665 | |
| PT Baramulti Suksessarana Tbk | 28,475 | 7,693 | |
| PT Bukit Asam Tbk | 8,365,326 | 2,117,387 | |
| PT Indika Energy Tbk | 1,051,200 | 158,542 | |
| PT Indo Tambangraya Megah Tbk | 690,700 | 1,684,855 | |
| PT TBS Energi Utama Tbk (a) | 536,600 | 20,057 | |
| PT United Tractors Tbk | 8,862,169 | 16,213,411 | |
| PTT Exploration and Production PCL (For. Reg.) | 253,600 | 1,079,991 | |
| Qatar Gas Transport Co. Ltd. (Nakilat) (a) | 4,245,741 | 4,255,359 | |
| Reliance Industries Ltd. | 1,259,272 | 35,388,979 | |
| Rosneft Oil Co. OJSC (c) | 634,013 | 131,460 | |
| SK Innovation Co., Ltd. (a) | 1,737 | 197,340 | |
| Star Petroleum Refining PCL NVDR | 207,300 | 64,740 | |
| Susco Public Co. Ltd. unit | 49,300 | 5,375 | |
| Tatneft PAO sponsored ADR (c) | 28,136 | 25,979 | |
| TotalEnergies SE (b) | 93,781 | 5,786,684 | |
| Turkiye Petrol Rafinerileri A/S | 43,400 | 1,363,015 | |
| YPF SA Class D sponsored ADR (a) | 31,200 | 367,224 | |
| 143,219,375 | |||
TOTAL ENERGY | 144,091,251 | ||
| FINANCIALS - 11.8% | |||
| Banks - 7.9% | |||
| Absa Group Ltd. | 1,531,883 | 16,553,345 | |
| Abu Dhabi Commercial Bank PJSC | 1,388,224 | 3,167,166 | |
| Agricultural Bank of China Ltd. (H Shares) | 7,574,980 | 2,624,907 | |
| Al Rajhi Bank | 964,391 | 18,066,350 | |
| Alinma Bank | 1,193,347 | 9,365,134 | |
| Alliance Bank Malaysia Bhd | 59,900 | 46,452 | |
| Alpha Bank SA (a) | 1,219,698 | 1,909,310 | |
| Arab National Bank | 3,070 | 18,832 | |
| Axis Bank Ltd. | 2,796,667 | 28,563,938 | |
| Axis Bank Ltd. GDR (Reg. S) | 31,001 | 1,568,651 | |
| Banco de Chile | 20,342,743 | 2,113,736 | |
| Banco do Brasil SA | 748,159 | 5,758,972 | |
| Banco Santander Chile sponsored ADR (b) | 323,828 | 5,433,834 | |
| Bancolombia SA sponsored ADR | 34,100 | 871,596 | |
| Bangkok Bank PCL: | |||
| (For. Reg.) | 813,778 | 3,777,492 | |
| NVDR | 1,559,100 | 7,237,216 | |
| Bank Handlowy w Warszawie SA | 2,257 | 42,364 | |
| Bank of Baroda | 2,382,351 | 4,583,384 | |
| Bank of China Ltd. (H Shares) | 6,205,000 | 2,275,696 | |
| Bank of Communications Co. Ltd. (H Shares) | 1,827,703 | 1,080,406 | |
| Bank of India | 333,180 | 285,629 | |
| Bank Polska Kasa Opieki SA | 136,817 | 2,758,146 | |
| Banque Saudi Fransi | 16,088 | 140,188 | |
| BDO Unibank, Inc. | 1,115,106 | 2,486,746 | |
| BNK Financial Group, Inc. | 85,128 | 431,700 | |
| Canara Bank Ltd. | 123,738 | 418,549 | |
| Capitec Bank Holdings Ltd. | 202,771 | 19,371,835 | |
| China CITIC Bank Corp. Ltd. (H Shares) | 2,708,000 | 1,252,330 | |
| China Construction Bank Corp. (H Shares) | 57,010,225 | 34,849,075 | |
| China Merchants Bank Co. Ltd. (H Shares) | 2,056,000 | 11,132,061 | |
| China Minsheng Banking Corp. Ltd. (H Shares) | 487,000 | 168,136 | |
| Chongqing Rural Commercial Bank Co. Ltd. (H Shares) | 346,968 | 119,790 | |
| CIMB Group Holdings Bhd | 2,674,611 | 3,343,636 | |
| Commercial International Bank SAE sponsored GDR | 412,374 | 611,963 | |
| Credicorp Ltd. (United States) | 123,167 | 15,693,939 | |
| CTBC Financial Holding Co. Ltd. | 6,358,000 | 4,705,416 | |
| DGB Financial Group Co. Ltd. | 53,351 | 319,010 | |
| Dubai Islamic Bank Pakistan Ltd. | 1,615,516 | 2,524,587 | |
| Emirates NBD Bank PJSC (a) | 78,292 | 289,884 | |
| Erste Group Bank AG | 54,044 | 2,125,296 | |
| Eurobank Ergasias Services and Holdings SA (a) | 1,888,361 | 2,900,108 | |
| First Abu Dhabi Bank PJSC | 628,857 | 2,410,581 | |
| Grupo Financiero Banorte S.A.B. de CV Series O | 4,563,492 | 38,520,247 | |
| Gulf Bank | 475,696 | 469,498 | |
| Hana Financial Group, Inc. | 393,248 | 13,513,166 | |
| HDFC Bank Ltd. (a) | 2,445,387 | 47,307,674 | |
| HDFC Bank Ltd. sponsored ADR | 134,639 | 9,106,982 | |
| ICICI Bank Ltd. | 2,791,516 | 28,883,074 | |
| ICICI Bank Ltd. sponsored ADR | 1,203,954 | 24,897,769 | |
| Indian Bank | 69,287 | 215,545 | |
| Industrial & Commercial Bank of China Ltd. (H Shares) | 47,817,319 | 23,859,033 | |
| Kasikornbank PCL: | |||
| NVDR | 2,951,900 | 11,481,590 | |
| (For. Reg.) | 2,117,264 | 8,235,224 | |
| KB Financial Group, Inc. | 478,976 | 18,579,227 | |
| Kiatnakin Bank PCL (For. Reg.) | 125,700 | 238,214 | |
| Kotak Mahindra Bank Ltd. | 381,961 | 7,992,087 | |
| Krung Thai Bank PCL: | |||
| (For. Reg.) | 2,455,800 | 1,206,199 | |
| NVDR | 480,400 | 235,955 | |
| National Bank of Greece SA (a) | 4,155,771 | 23,296,463 | |
| National Bank of Kuwait | 628,267 | 2,189,725 | |
| Nova Ljubljanska banka d.d. unit | 421,923 | 6,627,079 | |
| Nu Holdings Ltd. (a) | 370,591 | 1,867,779 | |
| OTP Bank PLC | 587,417 | 17,842,059 | |
| Powszechna Kasa Oszczednosci Bank SA | 453,195 | 3,166,268 | |
| PT Bank Bukopin Tbk (a) | 11,635 | 91 | |
| PT Bank Central Asia Tbk | 41,709,976 | 23,931,953 | |
| PT Bank Danamon Indonesia Tbk Series A | 355,601 | 66,690 | |
| PT Bank Mandiri (Persero) Tbk | 15,444,333 | 10,124,539 | |
| PT Bank Negara Indonesia (Persero) Tbk | 952,100 | 547,848 | |
| PT Bank Rakyat Indonesia (Persero) Tbk | 29,457,454 | 9,020,742 | |
| Qatar National Bank SAQ (a) | 1,576,486 | 7,294,237 | |
| Saudi Investment Bank/The | 8,848 | 37,300 | |
| Sberbank of Russia (a)(c) | 2,908,251 | 22,169 | |
| Sberbank of Russia: | |||
| (RTSX) (a)(c) | 328,709 | 2,506 | |
| sponsored ADR (a)(c) | 1,288,149 | 22,929 | |
| Sharjah Islamic Bank | 47,092 | 28,847 | |
| Shinhan Financial Group Co. Ltd. | 281,412 | 8,276,554 | |
| Standard Bank Group Ltd. | 395,946 | 3,957,951 | |
| State Bank of India | 265,074 | 1,676,819 | |
| TCS Group Holding PLC GDR (a)(c) | 89,300 | 112,031 | |
| The Karnataka Bank Ltd. | 396,111 | 678,198 | |
| The Karur Vysya Bank Ltd. | 528,830 | 652,679 | |
| The Saudi National Bank | 586,152 | 7,380,300 | |
| Union Bank of India Ltd. | 514,481 | 418,644 | |
| Woori Financial Group, Inc. | 355,955 | 3,286,924 | |
| 590,668,194 | |||
| Capital Markets - 0.3% | |||
| Alexander Forbes Group Holdings Ltd. | 888 | 242 | |
| B3 SA - Brasil Bolsa Balcao | 2,999,000 | 6,043,311 | |
| China Galaxy Securities Co. Ltd. (H Shares) | 3,273,500 | 1,630,620 | |
| Daishin Securities Co. Ltd. | 4,264 | 42,311 | |
| East Money Information Co. Ltd. (A Shares) | 447,719 | 1,350,893 | |
| HDFC Asset Management Co. Ltd. (d) | 82,819 | 1,813,560 | |
| Hong Kong Exchanges and Clearing Ltd. | 271,100 | 10,858,278 | |
| IIFL Securities Ltd. | 31,762 | 20,984 | |
| Motilal Oswal Financial Services Ltd. | 2,593 | 18,828 | |
| Nahar Capital & Finance Services Ltd. | 3,019 | 8,952 | |
| Noah Holdings Ltd. sponsored ADR (a) | 30,266 | 566,277 | |
| VLS Finance Ltd. | 24,557 | 50,053 | |
| XP, Inc. Class A (a) | 169,931 | 2,110,543 | |
| 24,514,852 | |||
| Consumer Finance - 0.2% | |||
| 360 DigiTech, Inc. ADR | 132,531 | 2,698,331 | |
| Bajaj Finance Ltd. | 48,117 | 3,558,545 | |
| FinVolution Group ADR | 180,955 | 917,442 | |
| Kaspi.KZ JSC GDR (Reg. S) | 61,842 | 4,601,045 | |
| Manappuram General Finance & Leasing Ltd. | 175,043 | 217,520 | |
| Repco Home Finance Ltd. | 17,748 | 41,823 | |
| Shriram Transport Finance Co. Ltd. | 95,157 | 1,385,531 | |
| Ujjivan Financial Services Ltd. | 30,839 | 98,810 | |
| 13,519,047 | |||
| Diversified Financial Services - 0.9% | |||
| Chailease Holding Co. Ltd. | 3,096,635 | 22,716,044 | |
| FirstRand Ltd. | 3,241,215 | 11,568,834 | |
| Housing Development Finance Corp. Ltd. | 1,008,523 | 31,843,310 | |
| Kingdom Holding Co. | 55,204 | 111,801 | |
| Power Finance Corp. Ltd. | 143,979 | 253,307 | |
| REC Ltd. | 1,154,887 | 1,597,236 | |
| Yuanta Financial Holding Co. Ltd. | 5,568,155 | 4,120,869 | |
| 72,211,401 | |||
| Insurance - 2.5% | |||
| AIA Group Ltd. | 5,138,584 | 54,612,960 | |
| BB Seguridade Participacoes SA | 189,100 | 1,235,636 | |
| Cathay Financial Holding Co. Ltd. | 2,830,286 | 4,000,518 | |
| China Life Insurance Co. Ltd. (H Shares) | 16,309,470 | 27,634,717 | |
| China Pacific Insurance (Group) Co. Ltd. (H Shares) | 7,334,200 | 19,434,780 | |
| China Taiping Insurance Group Ltd. | 1,756,234 | 2,074,081 | |
| Db Insurance Co. Ltd. | 122,852 | 7,159,912 | |
| Hanwha Life Insurance Co. Ltd. (a) | 130,319 | 293,447 | |
| HDFC Standard Life Insurance Co. Ltd. (d) | 1,305,777 | 7,722,957 | |
| Hyundai Fire & Marine Insurance Co. Ltd. | 108,377 | 2,887,450 | |
| New China Life Insurance Co. Ltd. (H Shares) | 290,200 | 702,449 | |
| Old Mutual Ltd. | 154,290 | 100,060 | |
| People's Insurance Co. of China Group Ltd. (H Shares) | 678,000 | 214,213 | |
| PICC Property & Casualty Co. Ltd. (H Shares) | 9,386,000 | 8,238,788 | |
| Ping An Insurance Group Co. of China Ltd. (H Shares) | 3,371,668 | 23,016,813 | |
| Powszechny Zaklad Ubezpieczen SA | 1,061,879 | 8,741,277 | |
| Prudential PLC | 571,515 | 8,734,435 | |
| PT Panin Financial Tbk | 2,868,938 | 74,875 | |
| Samsung Fire & Marine Insurance Co. Ltd. | 48,815 | 7,925,293 | |
| Tong Yang Life Insurance Co. Ltd. | 6,771 | 22,422 | |
| 184,827,083 | |||
| Thrifts & Mortgage Finance - 0.0% | |||
| Sangsangin Co. Ltd. | 4,273 | 19,244 | |
TOTAL FINANCIALS | 885,759,821 | ||
| HEALTH CARE - 1.6% | |||
| Biotechnology - 0.2% | |||
| Anhui Anke Biotechnology Group Co. Ltd. (A Shares) | 287,900 | 475,030 | |
| BeiGene Ltd. ADR (a) | 25,300 | 5,683,139 | |
| Guangdong Hybribio Biotech Co. Ltd. | 394,350 | 1,013,546 | |
| Innovent Biologics, Inc. (a)(d) | 1,012,000 | 4,912,121 | |
| Seegene, Inc. | 30,334 | 560,214 | |
| Zai Lab Ltd. ADR (a) | 64,146 | 2,383,024 | |
| 15,027,074 | |||
| Health Care Equipment & Supplies - 0.2% | |||
| Peijia Medical Ltd. (a)(d) | 812,000 | 1,177,231 | |
| Rayence Co. Ltd. | 12,372 | 112,465 | |
| SD Biosensor, Inc. | 44,151 | 768,605 | |
| Shenzhen Mindray Bio-Medical Electronics Co. Ltd. (A Shares) | 230,025 | 10,418,042 | |
| 12,476,343 | |||
| Health Care Providers & Services - 0.4% | |||
| Apollo Hospitals Enterprise Ltd. | 102,233 | 5,444,902 | |
| Bangkok Chain Hospital PCL (For. Reg.) | 2,027,200 | 1,145,327 | |
| Bangkok Dusit Medical Services PCL (For. Reg.) | 2,074,000 | 1,648,719 | |
| Bumrungrad Hospital PCL (For. Reg.) | 228,300 | 1,367,629 | |
| Dr Sulaiman Al Habib Medical Services Group Co. | 138,840 | 8,576,103 | |
| Ekachai Medical Care PCL NVDR | 570,800 | 135,316 | |
| Hapvida Participacoes e Investimentos SA (a)(d) | 2,951,000 | 2,530,822 | |
| New Horizon Health Ltd. (a)(d) | 1,266,000 | 5,290,188 | |
| Rede D'Oregon Sao Luiz SA (d) | 312,091 | 1,523,064 | |
| Shalby Ltd. | 6,366 | 9,494 | |
| Shanghai Pharmaceuticals Holding Co. Ltd. (H Shares) | 564,800 | 995,851 | |
| Sinopharm Group Co. Ltd. (H Shares) | 728,400 | 1,948,735 | |
| 30,616,150 | |||
| Health Care Technology - 0.0% | |||
| Medlive Technology Co. Ltd. (d) | 216,500 | 264,233 | |
| Life Sciences Tools & Services - 0.2% | |||
| WuXi AppTec Co. Ltd. (H Shares) (d) | 230,396 | 2,452,364 | |
| Wuxi Biologics (Cayman), Inc. (a)(d) | 2,288,704 | 16,021,282 | |
| 18,473,646 | |||
| Pharmaceuticals - 0.6% | |||
| Aspen Pharmacare Holdings Ltd. | 358,684 | 2,771,232 | |
| Bora Pharmaceuticals Co. Ltd. | 30,000 | 490,891 | |
| Chengdu Kanghong Pharmaceutical Group Co. Ltd. (A Shares) | 366,300 | 941,452 | |
| China Medical System Holdings Ltd. | 87,616 | 131,713 | |
| China Resources Pharmaceutical Group Ltd. (d) | 1,269,500 | 1,043,172 | |
| Cipla Ltd./India | 428,983 | 4,704,824 | |
| CSPC Pharmaceutical Group Ltd. | 690,000 | 741,266 | |
| Hansoh Pharmaceutical Group Co. Ltd. (d) | 5,408,000 | 9,714,475 | |
| Hubei Jumpcan Pharmaceutical Co. Ltd. (A Shares) | 44,300 | 186,889 | |
| Humedix Co. Ltd. | 447 | 9,236 | |
| Korea United Pharm, Inc. | 2,053 | 35,040 | |
| Lotus Pharmaceutical Co. Ltd. | 126,000 | 1,151,789 | |
| PT Kalbe Farma Tbk | 4,676,900 | 647,099 | |
| Richter Gedeon PLC | 934,739 | 19,611,454 | |
| Sun Pharmaceutical Industries Ltd. | 304,580 | 3,525,455 | |
| 45,705,987 | |||
TOTAL HEALTH CARE | 122,563,433 | ||
| INDUSTRIALS - 3.5% | |||
| Aerospace & Defense - 0.2% | |||
| Bharat Electronics Ltd. | 1,501,055 | 1,718,190 | |
| Hanwha Aerospace Co. Ltd. | 16,577 | 1,129,232 | |
| Hindustan Aeronautics Ltd. | 157,255 | 4,898,319 | |
| Korea Aerospace Industries Ltd. | 213,670 | 7,293,816 | |
| 15,039,557 | |||
| Air Freight & Logistics - 0.2% | |||
| Dimerco Express Corp. | 171,000 | 435,566 | |
| Hyundai Glovis Co. Ltd. | 13,279 | 1,594,055 | |
| Milkyway Chemical Supply Chain Service Co. Ltd. (A Shares) | 271,286 | 5,102,606 | |
| SF Holding Co. Ltd. (A Shares) | 799,591 | 6,219,451 | |
| Sinotrans Ltd. (H Shares) | 256,000 | 78,274 | |
| Transport Corp. of India Ltd. | 11,277 | 88,864 | |
| ZTO Express, Inc. sponsored ADR | 142,248 | 3,422,487 | |
| 16,941,303 | |||
| Airlines - 0.1% | |||
| Air Arabia PJSC (a) | 603,829 | 369,882 | |
| Turk Hava Yollari AO (a) | 349,847 | 2,660,208 | |
| 3,030,090 | |||
| Building Products - 0.0% | |||
| Bawan Co. | 69,981 | 546,399 | |
| China Liansu Group Holdings Ltd. | 83,000 | 87,447 | |
| KCC Glass Corp. | 2,551 | 78,585 | |
| LX Hausys Ltd. | 1,397 | 37,801 | |
| PT Mulia Industrindo Tbk (a) | 3,988,500 | 150,386 | |
| Zhejiang Weixing New Building Materials Co. Ltd. (A Shares) | 488,609 | 1,809,715 | |
| 2,710,333 | |||
| Commercial Services & Supplies - 0.0% | |||
| China Everbright International Ltd. | 1,080,000 | 437,537 | |
| EKI Energy Services Ltd. | 2,383 | 19,515 | |
| Ion Exchange (INDIA) Ltd. | 1,535 | 62,609 | |
| 519,661 | |||
| Construction & Engineering - 0.5% | |||
| Budimex SA | 65 | 4,113 | |
| China Railway Group Ltd. (H Shares) | 5,610,993 | 2,923,658 | |
| Combined Group Contracting Co. SAKC | 26,635 | 37,653 | |
| Dl Construction Co. Ltd. | 829 | 9,268 | |
| DL E&C Co. Ltd. | 26,220 | 654,910 | |
| Hyundai Engineering & Construction Co. Ltd. | 39,557 | 1,089,832 | |
| Kumhoe&C Co. Ltd. | 7,308 | 37,116 | |
| Larsen & Toubro Ltd. | 905,512 | 23,109,210 | |
| Metallurgical Corp. China Ltd. (H Shares) | 4,236,882 | 923,009 | |
| Murray & Roberts Holdings Ltd. (a) | 53,520 | 6,266 | |
| Orascom Construction PLC | 1,460 | 4,526 | |
| Shanghai Pudong Construction Co. Ltd. (A Shares) | 729,858 | 764,238 | |
| Sinopec Engineering Group Co. Ltd. (H Shares) | 574,738 | 287,757 | |
| Voltas Ltd. | 672,909 | 7,262,809 | |
| 37,114,365 | |||
| Electrical Equipment - 0.4% | |||
| Bharat Heavy Electricals Ltd. | 5,568,600 | 4,703,107 | |
| China High Speed Transmission Equipment Group Co. Ltd. (a) | 378 | 157 | |
| Contemporary Amperex Technology Co. Ltd. | 184,475 | 10,746,452 | |
| DONGYANG E&P, Inc. | 21,665 | 255,974 | |
| Harbin Electric Machinery Co. Ltd.(H Shares) (a) | 565,906 | 281,172 | |
| Hongfa Technology Co. Ltd. (A Shares) | 704,641 | 3,562,129 | |
| Hyundai Electric & Energy System Co. Ltd. (a) | 22,703 | 722,577 | |
| LS Corp. | 21,797 | 1,111,966 | |
| Sieyuan Electric Co. Ltd. (A Shares) | 420,055 | 2,850,490 | |
| TD Power Systems Ltd. | 42,075 | 71,275 | |
| Titan Wind Energy Suzhou Co. Ltd. (A Shares) | 905,962 | 2,000,502 | |
| Triveni Turbine Ltd. | 43,830 | 168,410 | |
| Weg SA | 800,216 | 5,985,437 | |
| 32,459,648 | |||
| Industrial Conglomerates - 0.2% | |||
| Aamal Co. (a) | 177,954 | 47,204 | |
| Alfa SA de CV Series A | 1,210,852 | 790,182 | |
| Astra Industrial Group | 30,578 | 484,013 | |
| Bidvest Group Ltd./The | 25,072 | 319,909 | |
| CITIC Pacific Ltd. | 4,726,000 | 5,214,049 | |
| CJ Corp. | 16,874 | 1,109,871 | |
| GS Holdings Corp. | 36,079 | 1,110,068 | |
| Hanwha Corp. | 70,591 | 1,439,935 | |
| Industries Qatar QSC (a) | 286,533 | 1,095,226 | |
| Koc Holding A/S | 463,049 | 1,901,480 | |
| Kolon Corp. | 8,285 | 136,705 | |
| Mannai Corp. | 86,440 | 163,849 | |
| Multiply Group (a) | 179,357 | 195,319 | |
| Nava Bharat Ventures Ltd. | 157,633 | 440,789 | |
| SM Investments Corp. | 170,550 | 2,625,980 | |
| Thoresen Thai Agencies PCL NVDR | 685,000 | 152,665 | |
| 17,227,244 | |||
| Machinery - 0.9% | |||
| Ador Welding Ltd. | 1,754 | 17,632 | |
| Airtac International Group | 113,000 | 3,951,692 | |
| China International Marine Containers Group Co. Ltd. (H Shares) | 933,331 | 655,165 | |
| Haitian International Holdings Ltd. | 352,000 | 919,306 | |
| HIWIN Technologies Corp. | 1,119,365 | 9,139,903 | |
| Hyundai Mipo Dockyard Co. Ltd. (a) | 106,900 | 5,680,016 | |
| JVM Co. Ltd. | 2,148 | 31,329 | |
| Kepler Weber SA | 15,585 | 58,882 | |
| Kirloskar Brothers Ltd. | 3,519 | 15,699 | |
| Nova Technology Corp. | 9,000 | 28,956 | |
| NRB Bearings Ltd. | 52,129 | 88,905 | |
| Sany Heavy Equipment International Holdings Co. Ltd. | 93,000 | 92,770 | |
| Schaeffler India Ltd. | 992 | 35,792 | |
| Shenzhen Inovance Technology Co. Ltd. (A Shares) | 2,447,133 | 25,871,124 | |
| Sinoseal Holding Co. Ltd. | 227,597 | 1,443,367 | |
| Sinotruk Hong Kong Ltd. | 4,500,957 | 7,087,399 | |
| SNT Energy Co. Ltd. | 3,136 | 46,286 | |
| Techtronic Industries Co. Ltd. | 436,500 | 4,340,309 | |
| Tian Di Science & Technology Co. Ltd. (A Shares) | 1,570,000 | 1,222,777 | |
| Weichai Power Co. Ltd. (A Shares) | 102 | 183 | |
| Zhejiang Sanhua Intelligent Controls Co. Ltd. (A Shares) | 1,190,530 | 4,387,175 | |
| 65,114,667 | |||
| Marine - 0.2% | |||
| COSCO SHIPPING Holdings Co. Ltd. (H Shares) | 2,718,250 | 2,818,885 | |
| Danaos Corp. (b) | 16,274 | 946,659 | |
| Evergreen Marine Corp. (Taiwan) | 1,315,400 | 6,718,211 | |
| Orient Overseas International Ltd. | 58,042 | 931,701 | |
| PT Temas Tbk | 240,100 | 52,586 | |
| Qatar Navigation QPSC | 6,188 | 15,293 | |
| Yang Ming Marine Transport Corp. | 927,000 | 1,948,087 | |
| 13,431,422 | |||
| Professional Services - 0.1% | |||
| Centre Testing International Group Co. Ltd. (A Shares) | 1,191,137 | 3,846,534 | |
| China Design Group Co. Ltd. (A Shares) | 312,600 | 376,920 | |
| Headhunter Group PLC ADR (c) | 18,283 | 49,762 | |
| Pony Testing International Group Co. Ltd. | 383,940 | 2,076,579 | |
| 6,349,795 | |||
| Road & Rail - 0.5% | |||
| Full Truck Alliance Co. Ltd. ADR (a) | 70,070 | 490,490 | |
| Globaltrans Investment PLC GDR (Reg. S) (a)(c) | 13,245 | 4,580 | |
| Localiza Rent a Car SA | 2,212,376 | 23,448,747 | |
| Localiza Rent a Car SA unit (a) | 10,457 | 105,859 | |
| Movida Participacoes SA | 357,800 | 449,689 | |
| PT Rmk Energy Tbk (a) | 1,684,100 | 82,272 | |
| United International Transportation Co. | 316,175 | 4,516,003 | |
| Vamos Locacao de Caminhoes Maquinas e Equipamentos SA | 1,646,189 | 4,175,647 | |
| VRL Logistics Ltd. | 21,642 | 143,110 | |
| 33,416,397 | |||
| Trading Companies & Distributors - 0.1% | |||
| Asia Green Energy PCL unit | 1,621,700 | 183,246 | |
| BOC Aviation Ltd. Class A (d) | 634,100 | 4,580,410 | |
| CITIC Resources Holdings Ltd. | 590,000 | 37,207 | |
| LX International Corp. | 53,965 | 1,280,514 | |
| Posco International Corp. | 93,176 | 1,593,849 | |
| PT Sumber Global Energy | 419,102 | 14,428 | |
| 7,689,654 | |||
| Transportation Infrastructure - 0.1% | |||
| Abu Dhabi Ports Co. PJSC | 524,350 | 882,220 | |
| CCR SA | 689,928 | 1,448,263 | |
| Cosco Shipping Ports Ltd. | 172,000 | 111,973 | |
| Grupo Aeroportuario del Pacifico S.A.B. de CV Series B | 195,796 | 3,723,725 | |
| Grupo Aeroportuario del Sureste S.A.B. de CV Series B | 70,169 | 2,012,740 | |
| 8,178,921 | |||
TOTAL INDUSTRIALS | 259,223,057 | ||
| INFORMATION TECHNOLOGY - 11.9% | |||
| Communications Equipment - 0.1% | |||
| Accton Technology Corp. | 566,000 | 5,210,735 | |
| BYD Electronic International Co. Ltd. | 57,000 | 165,930 | |
| Fiberhome Telecommunication Technologies Co. Ltd. (A Shares) | 214,100 | 515,070 | |
| SerComm Corp. | 333,000 | 913,204 | |
| Wistron NeWeb Corp. | 185,000 | 507,938 | |
| ZTE Corp. (H Shares) | 62,800 | 186,414 | |
| 7,499,291 | |||
| Electronic Equipment & Components - 1.0% | |||
| AAC Technology Holdings, Inc. (a) | 62,000 | 138,385 | |
| BH Co. Ltd. | 41,262 | 738,612 | |
| Daeduck Electronics Co. Ltd. | 4,988 | 25,673 | |
| Daeduck Electronics Co. Ltd. | 43,773 | 695,761 | |
| Delta Electronics, Inc. | 314,000 | 2,926,513 | |
| FIH Mobile Ltd. (a) | 2,442,000 | 261,330 | |
| FLEXium Interconnect, Inc. | 118,000 | 376,187 | |
| General Interface Solution Holding Ltd. | 90,000 | 253,253 | |
| Hon Hai Precision Industry Co. Ltd. (Foxconn) | 6,848,725 | 22,502,317 | |
| Kingboard Chemical Holdings Ltd. | 55,500 | 197,977 | |
| LG Innotek Co. Ltd. | 6,680 | 1,400,525 | |
| Redington (India) Ltd. | 546,863 | 1,127,539 | |
| Samsung Electro-Mechanics Co. Ltd. | 23,351 | 2,545,087 | |
| Samsung SDI Co. Ltd. | 23,150 | 12,195,369 | |
| Simplo Technology Co. Ltd. | 3,000 | 28,887 | |
| SINBON Electronics Co. Ltd. | 213,000 | 2,064,867 | |
| Sirtec International Co. Ltd. | 1,000 | 699 | |
| Sunny Optical Technology Group Co. Ltd. | 897,644 | 10,177,888 | |
| Unimicron Technology Corp. | 1,454,927 | 6,058,252 | |
| Universal Scientific Industrial Shanghai Co. Ltd. (A Shares) | 117,700 | 268,897 | |
| Yageo Corp. | 469,704 | 8,220,584 | |
| Zhejiang Dahua Technology Co. Ltd. (A Shares) | 280,600 | 586,826 | |
| Zhen Ding Technology Holding Ltd. | 329,000 | 1,198,699 | |
| 73,990,127 | |||
| IT Services - 1.0% | |||
| Arabian Internet and Communications Services Co. Ltd. | 50,117 | 3,306,722 | |
| Beyondsoft Corp. (A Shares) | 105,800 | 223,093 | |
| ChinaSoft International Ltd. | 234,000 | 167,837 | |
| Cigniti Technologies Ltd. | 8,166 | 69,472 | |
| Digital China Holdings Ltd. (H Shares) | 386,000 | 179,491 | |
| Digital China Information Service Co. Ltd. (A Shares) | 452,529 | 814,544 | |
| Elm Co. | 27,940 | 2,821,809 | |
| Fujian Boss Software Development Co. Ltd. | 207,570 | 642,463 | |
| Globant SA (a) | 32,010 | 5,284,211 | |
| HCL Technologies Ltd. | 882,779 | 11,510,468 | |
| Infosys Ltd. | 1,059,212 | 19,031,666 | |
| Infosys Ltd. sponsored ADR | 716,369 | 12,851,660 | |
| Saksoft Ltd. | 28,035 | 48,661 | |
| Samsung SDS Co. Ltd. | 845 | 80,139 | |
| Tata Consultancy Services Ltd. | 338,706 | 13,577,133 | |
| TravelSky Technology Ltd. (H Shares) | 79,000 | 155,798 | |
| Wangsu Science & Technology Co. Ltd. (A Shares) | 95,600 | 85,488 | |
| WNS Holdings Ltd. sponsored ADR (a) | 28,566 | 2,482,957 | |
| 73,333,612 | |||
| Semiconductors & Semiconductor Equipment - 6.9% | |||
| Advanced Analog Technology, Inc. | 33,000 | 62,694 | |
| Advanced Process Systems Corp. | 2,751 | 42,061 | |
| ALI Corp. (a) | 131,000 | 93,541 | |
| ASE Technology Holding Co. Ltd. | 1,733,000 | 5,915,033 | |
| ASE Technology Holding Co. Ltd. ADR | 181,083 | 1,298,365 | |
| ASML Holding NV (Netherlands) | 11,659 | 7,186,101 | |
| ASMPT Ltd. | 245,700 | 2,094,087 | |
| ChipMOS TECHNOLOGIES, Inc. | 216,000 | 255,771 | |
| Contrel Technology Co. Ltd. | 122,000 | 70,644 | |
| Daqo New Energy Corp. ADR (a) | 88,202 | 3,896,764 | |
| DB HiTek Co. Ltd. | 54,070 | 1,853,913 | |
| eGalax_eMPIA Technology, Inc. | 309,826 | 632,956 | |
| eMemory Technology, Inc. | 144,703 | 8,802,687 | |
| Everlight Electronics Co. Ltd. | 73,000 | 91,428 | |
| Generalplus Technology, Inc. | 41,000 | 73,491 | |
| Global Unichip Corp. | 68,000 | 2,566,038 | |
| Himax Technologies, Inc. sponsored ADR | 87,800 | 652,354 | |
| KC Tech Co. Ltd. | 908 | 12,226 | |
| LONGi Green Energy Technology Co. Ltd. | 2,215,819 | 14,138,494 | |
| Lx Semicon Co. Ltd. | 15,818 | 1,107,460 | |
| Macroblock, Inc. | 39,000 | 147,170 | |
| MediaTek, Inc. | 1,578,456 | 37,125,039 | |
| MPI Corp. | 46,000 | 184,808 | |
| Novatek Microelectronics Corp. | 668,000 | 8,855,237 | |
| Nuvoton Technology Corp. | 34,000 | 163,142 | |
| Parade Technologies Ltd. | 107,023 | 3,349,256 | |
| Phison Electronics Corp. | 28,000 | 319,714 | |
| Powertech Technology, Inc. | 24,000 | 68,783 | |
| Qingdao GaoCe Technology Co. Ltd. Class A | 38,749 | 413,008 | |
| Radiant Opto-Electronics Corp. | 858,000 | 2,944,665 | |
| Raydium Semiconductor Corp. | 32,572 | 436,554 | |
| Realtek Semiconductor Corp. | 464,000 | 5,735,849 | |
| Silergy Corp. | 854,908 | 16,185,961 | |
| SIMMTECH Co. Ltd. | 35,106 | 763,931 | |
| Sitronix Technology Corp. | 129,000 | 956,799 | |
| SK Hynix, Inc. | 529,884 | 35,855,274 | |
| Sonix Technology Co. Ltd. | 10,000 | 17,827 | |
| StarPower Semiconductor Ltd. (A Shares) | 7,400 | 314,863 | |
| Taiwan Semiconductor Manufacturing Co. Ltd. | 18,922,494 | 310,297,033 | |
| Taiwan Semiconductor Manufacturing Co. Ltd. sponsored ADR | 349,067 | 30,393,264 | |
| United Microelectronics Corp. | 2,898,000 | 4,678,453 | |
| Vanguard International Semiconductor Corp. | 781,000 | 2,350,114 | |
| Winbond Electronics Corp. | 2,697,000 | 2,022,311 | |
| WONIK IPS Co. Ltd. | 126,494 | 2,972,804 | |
| 517,397,967 | |||
| Software - 0.2% | |||
| Asseco Poland SA | 1,518 | 27,248 | |
| Aurionpro Solutions Ltd. | 5,213 | 21,793 | |
| Cyient Ltd. | 5,263 | 60,135 | |
| Genesis Technology, Inc. | 20,698 | 39,457 | |
| Glodon Co. Ltd. (A Shares) | 385,200 | 3,337,874 | |
| Hundsun Technologies, Inc. (A Shares) | 1,310,389 | 8,391,449 | |
| Kingdee International Software Group Co. Ltd. (a) | 749,000 | 1,395,059 | |
| KPIT Technologies Ltd. | 254,305 | 2,552,897 | |
| Newgen Software Technologies Ltd. | 5,657 | 29,984 | |
| NSFocus Information Technology Co. Ltd. (A Shares) | 188,500 | 323,528 | |
| Nucleus Software Exports Ltd. | 29,906 | 205,537 | |
| Oracle Financial Services Soft | 3,355 | 128,651 | |
| Sangfor Technologies, Inc. | 4,600 | 94,755 | |
| Sinosoft Co. Ltd. | 124,080 | 561,039 | |
| YGSOFT, Inc. (A Shares) | 195,052 | 232,935 | |
| ZWSOFT Co. Ltd. Guangzhou (A Shares) | 77,944 | 2,224,980 | |
| 19,627,321 | |||
| Technology Hardware, Storage & Peripherals - 2.7% | |||
| Asia Vital Components Co. Ltd. | 326,000 | 1,277,912 | |
| Asia Vital Components Co. Ltd. rights 4/6/23 (a) | 20,760 | 17,221 | |
| ASUSTeK Computer, Inc. | 226,000 | 2,043,852 | |
| Gigabyte Technology Co. Ltd. | 389,000 | 1,505,888 | |
| Lenovo Group Ltd. | 7,628,000 | 6,841,430 | |
| Lite-On Technology Corp. | 1,909,000 | 4,316,054 | |
| Micro-Star International Co. Ltd. | 80,000 | 356,539 | |
| Samsung Electronics Co. Ltd. | 4,007,365 | 183,808,778 | |
| Wistron Corp. | 735,000 | 792,624 | |
| 200,960,298 | |||
TOTAL INFORMATION TECHNOLOGY | 892,808,616 | ||
| MATERIALS - 3.6% | |||
| Chemicals - 1.3% | |||
| Abou Kir Fertilizers & Chemical Industries | 68,315 | 93,005 | |
| Andhra Sugars Ltd. (a) | 60,735 | 86,460 | |
| Asian Paints Ltd. | 64,113 | 2,194,481 | |
| Castrol India Ltd. | 14,099 | 19,576 | |
| China BlueChemical Ltd. (H Shares) | 162,000 | 36,530 | |
| China Risun Group Ltd. Class H | 70,116 | 33,497 | |
| China Sanjiang Fine Chemicals Ltd. | 165,866 | 31,697 | |
| Dongyue Group Co. Ltd. | 123,000 | 139,149 | |
| E.I.D. Parry (India) Ltd. | 18,377 | 111,703 | |
| Fertiglobe PLC | 69,923 | 75,194 | |
| Fufeng Group Ltd. | 703,992 | 451,127 | |
| Ganfeng Lithium Group Co. Ltd. (H Shares) (d) | 297,520 | 2,073,323 | |
| GHCL Ltd. | 29,260 | 182,191 | |
| Gujarat Narmada Valley Fertilizers Co. | 54,694 | 347,905 | |
| Gujarat State Fertilizers & Chemicals Ltd. | 97,251 | 147,268 | |
| Hansol Chemical Co. Ltd. | 12,053 | 1,865,620 | |
| Indorama Ventures PCL: | |||
| (For. Reg.) | 762,900 | 795,985 | |
| NVDR | 4,338,600 | 4,526,753 | |
| KCC Corp. | 1,168 | 217,035 | |
| LG Chemical Ltd. | 82,475 | 42,448,853 | |
| Lotte Fine Chemical Co. Ltd. | 4,343 | 190,986 | |
| Methanol Chemicals Co. (a) | 131,885 | 874,395 | |
| NOROO Paint & Coatings Co. Ltd. | 11,018 | 65,965 | |
| Oci Co. Ltd. | 23,844 | 1,638,701 | |
| Pcbl Ltd. /India | 330,339 | 475,053 | |
| PhosAgro PJSC (c) | 18,583 | 1,418 | |
| PhosAgro PJSC: | |||
| GDR (c) | 359 | 7 | |
| GDR (Reg. S) (a)(c) | 1 | 0 | |
| Polyplex Corp. Ltd. | 3,317 | 54,295 | |
| PTT Global Chemical PCL NVDR | 345,100 | 462,942 | |
| Sabic Agriculture-Nutrients Co. | 117,164 | 4,171,215 | |
| Sahara International Petrochemical Co. | 433,308 | 4,087,539 | |
| Sasol Ltd. | 104,605 | 1,533,870 | |
| Satellite Chemical Co. Ltd. (A Shares) | 2,075,040 | 5,210,495 | |
| Saudi Basic Industries Corp. | 451,193 | 10,640,635 | |
| Shandong Sinocera Functional Material Co. Ltd. (A Shares) | 160,383 | 709,225 | |
| Sharda Cropchem Ltd. | 15,552 | 88,472 | |
| Sociedad Quimica y Minera de Chile SA (PN-B) sponsored ADR | 15,622 | 1,386,453 | |
| Solar Industries India Ltd. | 170,300 | 8,077,324 | |
| Songwon Industrial Co. Ltd. | 5,288 | 76,447 | |
| Sree Rayalaseema Hi-Strength Hypo Ltd. | 6,825 | 35,300 | |
| Supreme Petrochem Ltd. | 9,924 | 44,622 | |
| Taekwang Industrial Co. Ltd. | 155 | 91,743 | |
| Tamilnadu Petroproducts Ltd. | 29,740 | 28,482 | |
| TGV SRAAC Ltd. (a) | 4,174 | 5,386 | |
| Unipar Carbocloro SA | 6,160 | 87,974 | |
| UPL Ltd. | 228,952 | 1,923,147 | |
| Wanhua Chemical Group Co. Ltd. (A Shares) | 99,700 | 1,499,224 | |
| 99,338,667 | |||
| Construction Materials - 0.3% | |||
| Asia Cement (China) Holdings Corp. | 235,332 | 118,724 | |
| Beijing Oriental Yuhong Waterproof Technology Co. Ltd. (A Shares) | 778,291 | 3,863,729 | |
| CEMEX S.A.B. de CV sponsored ADR (a) | 668,586 | 3,329,558 | |
| China National Building Materials Co. Ltd. (H Shares) | 1,874,442 | 1,659,665 | |
| Guangdong Tapai Group Co. Ltd. (A Shares) | 291,513 | 335,097 | |
| JK Cement Ltd. | 188,000 | 6,288,884 | |
| NCL Industries Ltd. | 21,490 | 43,997 | |
| Qatar National Cement Co. QSC (a) | 18,192 | 21,111 | |
| Qatari Investors Group QSC (a) | 62,258 | 33,678 | |
| Siam Cement PCL (For. Reg.) | 113,300 | 1,051,859 | |
| Tipco Asphalt NVDR | 95,600 | 53,741 | |
| Ultratech Cement Ltd. | 38,007 | 3,339,346 | |
| 20,139,389 | |||
| Containers & Packaging - 0.0% | |||
| BG Container Glass PCL NVDR | 21,900 | 6,218 | |
| CPMC Holdings Ltd. | 87,456 | 52,032 | |
| Time Technoplast Ltd. | 50,359 | 49,357 | |
| Uflex Ltd. | 3,918 | 17,949 | |
| 125,556 | |||
| Metals & Mining - 1.9% | |||
| African Rainbow Minerals Ltd. | 202,375 | 2,803,277 | |
| Anglo American Platinum Ltd. | 39,568 | 2,191,634 | |
| AngloGold Ashanti Ltd. | 31,878 | 536,906 | |
| Ann Joo Resources Bhd | 500 | 128 | |
| Barrick Gold Corp. | 568,000 | 9,156,160 | |
| China Hongqiao Group Ltd. | 191,500 | 204,689 | |
| China Oriental Group Co. Ltd. (H Shares) | 102,045 | 20,671 | |
| China Zhongwang Holdings Ltd. (a)(c) | 350,800 | 75,081 | |
| Companhia Brasileira de Aluminio | 2,221,338 | 4,421,080 | |
| Endeavour Mining PLC | 11,494 | 239,230 | |
| First Quantum Minerals Ltd. | 128,941 | 2,816,952 | |
| Freeport-McMoRan, Inc. | 144,700 | 5,928,359 | |
| Godawari Power & Ispat Ltd. | 8,450 | 34,968 | |
| Gold Fields Ltd. (b) | 551,111 | 5,001,401 | |
| Grupo Mexico SA de CV Series B | 1,206,243 | 5,411,991 | |
| Guangdong Zhongnan Iron & Steel Co. Ltd. (A Shares) | 1,595,800 | 688,182 | |
| Hindalco Industries Ltd. | 445,071 | 2,149,826 | |
| Hindustan Zinc Ltd. | 146,327 | 538,247 | |
| Impala Platinum Holdings Ltd. | 1,151,475 | 10,753,579 | |
| Jastrzebska Spolka Weglowa SA (a) | 170,676 | 2,097,122 | |
| Jiangxi Copper Co. Ltd. (H Shares) | 93,000 | 146,442 | |
| Jindal Saw Ltd. | 59,724 | 108,507 | |
| Korea Zinc Co. Ltd. | 26,312 | 11,630,582 | |
| Kumba Iron Ore Ltd. | 77,499 | 2,021,599 | |
| Maharashtra Seamless Ltd. | 20,850 | 76,518 | |
| MOIL Ltd. | 25,877 | 47,107 | |
| National Aluminium Co. Ltd. | 39,774 | 37,659 | |
| Nickel Asia Corp. | 295,300 | 37,516 | |
| NMDC Ltd. | 221,865 | 298,254 | |
| Novolipetsk Steel OJSC (a)(c) | 355,140 | 4,227 | |
| Novolipetsk Steel OJSC GDR (Reg. S) (a)(c) | 56,576 | 7,029 | |
| Polyus PJSC (a)(c) | 2,468 | 7,196 | |
| Polyus PJSC unit (a)(c) | 8,823 | 13,520 | |
| POSCO | 87,938 | 21,228,166 | |
| POSCO sponsored ADR (b) | 28,354 | 1,729,310 | |
| Prakash Industries Ltd. (a) | 112,958 | 74,011 | |
| PT Adaro Minerals Indonesia Tbk (a) | 2,496,200 | 212,791 | |
| PT Aneka Tambang Tbk | 4,925,700 | 642,763 | |
| PT Vale Indonesia Tbk (a) | 203,300 | 90,985 | |
| Sansteel Minguang Co. Ltd. (A Shares) | 723,700 | 546,945 | |
| Sibanye-Stillwater Ltd. | 505,065 | 1,019,760 | |
| Southern Copper Corp. (b) | 14,919 | 1,099,381 | |
| Steel Authority of India Ltd. | 2,787,626 | 2,791,168 | |
| Tata Steel Ltd. | 2,934,274 | 3,690,699 | |
| Ternium SA sponsored ADR | 120,737 | 5,144,604 | |
| Vale SA | 554,500 | 9,036,461 | |
| Vale SA sponsored ADR | 1,016,646 | 16,611,996 | |
| Vedanta Ltd. | 458,261 | 1,487,983 | |
| Xinyu Iron & Steel Co. Ltd. | 2,900,747 | 1,907,781 | |
| Zijin Mining Group Co. Ltd. (H Shares) | 3,548,812 | 5,353,012 | |
| 142,173,455 | |||
| Paper & Forest Products - 0.1% | |||
| Dexco SA | 181,831 | 226,444 | |
| Empresas CMPC SA | 21,752 | 36,144 | |
| Evergreen Fibreboard Bhd | 293,700 | 20,289 | |
| Hansol Paper Co. Ltd. | 14,690 | 136,205 | |
| Moorim P&P Co. Ltd. | 13,861 | 42,227 | |
| Nine Dragons Paper (Holdings) Ltd. | 141,000 | 114,785 | |
| PT Indah Kiat Pulp & Paper Tbk | 320,210 | 166,404 | |
| Sappi Ltd. | 123,207 | 327,859 | |
| Satia Industries Ltd. | 51,942 | 71,963 | |
| Seshasayee Paper & Boards Ltd. | 7,875 | 22,936 | |
| Suzano Papel e Celulose SA | 438,568 | 3,999,128 | |
| West Coast Paper Mills Ltd. | 36,114 | 210,470 | |
| Xianhe Co. Ltd. (A Shares) | 179,793 | 798,947 | |
| 6,173,801 | |||
TOTAL MATERIALS | 267,950,868 | ||
| REAL ESTATE - 0.6% | |||
| Equity Real Estate Investment Trusts (REITs) - 0.0% | |||
| Fibra Uno Administracion SA de CV | 378,800 | 539,531 | |
| SA Corporate Real Estate Fund | 186,080 | 22,291 | |
| 561,822 | |||
| Real Estate Management & Development - 0.6% | |||
| Agile Property Holdings Ltd. (a) | 1,767,238 | 486,309 | |
| AP Thailand PCL (For. Reg.) | 1,121,100 | 394,681 | |
| Ayala Land, Inc. | 3,432,146 | 1,767,709 | |
| China Merchants Shekou Industrial Zone Holdings Co. Ltd. (A Shares) | 551,700 | 1,180,043 | |
| China Overseas Land and Investment Ltd. | 3,204,500 | 7,944,501 | |
| China Resources Land Ltd. | 1,606,000 | 7,120,137 | |
| China Resources Mixc Lifestyle Services Ltd. (d) | 490,000 | 2,684,282 | |
| Dar Al Arkan Real Estate Development Co. (a) | 550,419 | 2,106,249 | |
| Emaar Development PJSC (a) | 3,503,961 | 4,512,193 | |
| Emaar Properties PJSC | 4,642,501 | 7,077,947 | |
| Greentown China Holdings Ltd. | 467,500 | 638,469 | |
| Hang Lung Properties Ltd. | 1,795,000 | 3,462,214 | |
| IOI Properties Group Bhd | 131,800 | 32,895 | |
| KE Holdings, Inc. ADR (a) | 250,085 | 4,564,051 | |
| Land & House PCL NVDR | 348,400 | 96,936 | |
| Megaworld Corp. | 2,065,000 | 75,383 | |
| PT Ciputra Development Tbk | 1,816,000 | 117,891 | |
| SYN prop e tech SA | 47,300 | 36,048 | |
| Xinyuan Real Estate Co. Ltd. ADR (a) | 38 | 208 | |
| 44,298,146 | |||
TOTAL REAL ESTATE | 44,859,968 | ||
| UTILITIES - 0.6% | |||
| Electric Utilities - 0.1% | |||
| CESC Ltd. GDR | 197,774 | 165,958 | |
| Energisa SA unit | 213,082 | 1,574,677 | |
| PGE Polska Grupa Energetyczna SA (a) | 485,472 | 728,991 | |
| Saudi Electricity Co. | 909,558 | 5,380,781 | |
| 7,850,407 | |||
| Gas Utilities - 0.4% | |||
| Beijing Enterprises Holdings Ltd. | 5,254 | 17,202 | |
| China Gas Holdings Ltd. | 28,800 | 40,213 | |
| ENN Energy Holdings Ltd. | 921,200 | 13,085,561 | |
| GAIL India Ltd. | 4,235,940 | 5,261,289 | |
| Indraprastha Gas Ltd. | 82,667 | 438,767 | |
| Korea Gas Corp. | 43,783 | 929,551 | |
| Kunlun Energy Co. Ltd. | 6,141,172 | 4,913,313 | |
| Mahanagar Gas Ltd. | 11,865 | 128,613 | |
| PT Perusahaan Gas Negara Tbk Series B | 18,383,700 | 1,886,590 | |
| 26,701,099 | |||
| Independent Power and Renewable Electricity Producers - 0.1% | |||
| Banpu Power PCL NVDR | 67,500 | 29,896 | |
| NTPC Ltd. | 4,206,316 | 8,677,801 | |
| 8,707,697 | |||
| Water Utilities - 0.0% | |||
| VA Tech Wabag Ltd. (a) | 32,270 | 120,419 | |
TOTAL UTILITIES | 43,379,622 | ||
| TOTAL COMMON STOCKS (Cost $3,597,337,647) | 4,027,197,774 | ||
| Nonconvertible Preferred Stocks - 1.3% | |||
| Shares | Value ($) | ||
| ENERGY - 0.3% | |||
| Oil, Gas & Consumable Fuels - 0.3% | |||
| Petroleo Brasileiro SA - Petrobras: | |||
| (PN) (non-vtg.) | 1,805,500 | 8,704,279 | |
| sponsored ADR | 1,287,623 | 14,279,739 | |
| 22,984,018 | |||
| FINANCIALS - 0.5% | |||
| Banks - 0.5% | |||
| Banco Bradesco SA (PN) | 1,967,560 | 4,915,659 | |
| Itau Unibanco Holding SA | 3,260,757 | 15,838,381 | |
| Itau Unibanco Holding SA sponsored ADR (b) | 1,835,589 | 8,829,183 | |
| Itausa-Investimentos Itau SA (PN) | 4,498,773 | 7,071,962 | |
| Sberbank of Russia (a)(c) | 145,250 | 1,115 | |
| Sberbank of Russia (Russia) (a)(c) | 128,031 | 983 | |
| 36,657,283 | |||
| INFORMATION TECHNOLOGY - 0.3% | |||
| Technology Hardware, Storage & Peripherals - 0.3% | |||
| Samsung Electronics Co. Ltd. | 444,677 | 17,973,003 | |
| MATERIALS - 0.2% | |||
| Chemicals - 0.0% | |||
| Unipar Carbocloro SA | 34,540 | 523,102 | |
| Metals & Mining - 0.2% | |||
| Cia Ferro Ligas da Bahia - Ferbasa | 18,043 | 197,991 | |
| Gerdau SA | 2,074,000 | 11,341,646 | |
| Gerdau SA sponsored ADR | 545,462 | 2,983,677 | |
| Metalurgica Gerdau SA (PN) | 574,600 | 1,380,678 | |
| 15,903,992 | |||
TOTAL MATERIALS | 16,427,094 | ||
| UTILITIES - 0.0% | |||
| Electric Utilities - 0.0% | |||
| Companhia Energetica de Minas Gerais (CEMIG) (PN) | 1,035,088 | 2,071,975 | |
| Water Utilities - 0.0% | |||
| Cia de Saneamento do Parana | 195,100 | 127,074 | |
TOTAL UTILITIES | 2,199,049 | ||
| TOTAL NONCONVERTIBLE PREFERRED STOCKS (Cost $85,707,094) | 96,240,447 | ||
| Equity Funds - 39.3% | |||
| Shares | Value ($) | ||
| Diversified Emerging Markets Funds - 39.3% | |||
| Aberdeen Emerging Markets Fund Institutional Service Class | 11,140,011 | 140,364,139 | |
| Artisan Developing World Fund Investor Shares | 6,104,959 | 89,010,301 | |
| Brandes Emerging Markets Value Fund Class A | 12,041,321 | 88,624,124 | |
| Calvert Emerging Markets Equity Fund Class A | 46 | 722 | |
| Fidelity Advisor Emerging Markets Fund Class Z (e) | 14,677,561 | 482,304,648 | |
| Fidelity SAI Emerging Markets Index Fund (e) | 17,723,445 | 218,175,605 | |
| Fidelity SAI Emerging Markets Low Volatility Index Fund (e) | 57,023,370 | 558,829,027 | |
| Fidelity SAI Emerging Markets Value Index Fund (e) | 71,668,786 | 792,656,750 | |
| GMO Emerging Markets Fund Class I | 347,149 | 7,578,260 | |
| Goldman Sachs Emerging Markets Equity Fund Institutional Shares | 11,089,113 | 232,206,034 | |
| Invesco Developing Markets Fund Class R6 | 4,241,348 | 157,905,391 | |
| iShares MSCI China ETF (b) | 2,137,525 | 102,301,947 | |
| iShares MSCI EM ESG Optimized ETF (b) | 209,609 | 6,380,498 | |
| iShares MSCI South Korea Index ETF (b) | 511,975 | 29,950,538 | |
| Lazard Emerging Markets Equity Portfolio Open Shares | 842,137 | 13,314,193 | |
| Matthews Korea Fund Investor Class | 640,173 | 2,471,066 | |
| Matthews Pacific Tiger Fund Investor Class | 178 | 3,637 | |
| Xtrackers Harvest CSI 300 China ETF Class A (b) | 565,906 | 16,603,682 | |
| TOTAL EQUITY FUNDS (Cost $3,053,727,589) | 2,938,680,562 | ||
| Other - 0.2% | |||
| Shares | Value ($) | ||
| Commodity Funds - Broad Basket - 0.2% | |||
Fidelity SAI Inflation-Focused Fund (e) (Cost $11,491,612) | 1,313,459 | 12,162,626 | |
| U.S. Treasury Obligations - 0.1% | |||
Principal Amount (f) | Value ($) | ||
U.S. Treasury Bills, yield at date of purchase 4.58% to 4.72% 4/27/23 to 5/18/23 (g) (Cost $10,249,272) | 10,340,000 | 10,248,175 | |
| Money Market Funds - 7.3% | |||
| Shares | Value ($) | ||
| Fidelity Cash Central Fund 4.63% (h) | 69,134,370 | 69,148,197 | |
| Fidelity Securities Lending Cash Central Fund 4.63% (h)(i) | 164,167,335 | 164,183,752 | |
| State Street Institutional U.S. Government Money Market Fund Premier Class 4.43% (j) | 311,036,894 | 311,036,894 | |
| TOTAL MONEY MARKET FUNDS (Cost $544,368,843) | 544,368,843 | ||
| TOTAL INVESTMENT IN SECURITIES - 102.0% (Cost $7,302,882,057) | 7,628,898,427 |
NET OTHER ASSETS (LIABILITIES) - (2.0)% | (150,588,885) |
| NET ASSETS - 100.0% | 7,478,309,542 |
| Futures Contracts | |||||
Number of contracts | Expiration Date | Notional Amount ($) | Value ($) | Unrealized Appreciation/ (Depreciation) ($) | |
| Purchased | |||||
| Equity Index Contracts | |||||
| ICE E-mini MSCI Emerging Markets Index Contracts (United States) | 5,812 | Mar 2023 | 279,818,740 | (12,109,075) | (12,109,075) |
| The notional amount of futures purchased as a percentage of Net Assets is 3.7% | |||||
| ETF | - | EXCHANGE-TRADED FUND |
| (a) | Non-income producing |
| (b) | Security or a portion of the security is on loan at period end. |
| (c) | Level 3 security |
| (d) | Security exempt from registration under Rule 144A of the Securities Act of 1933. These securities may be resold in transactions exempt from registration, normally to qualified institutional buyers. At the end of the period, the value of these securities amounted to $138,429,357 or 1.9% of net assets. |
| (e) | Affiliated Fund |
| (f) | Amount is stated in United States dollars unless otherwise noted. |
| (g) | Security or a portion of the security was pledged to cover margin requirements for futures contracts. At period end, the value of securities pledged amounted to $9,718,089. |
| (h) | Affiliated fund that is generally available only to investment companies and other accounts managed by Fidelity Investments. The rate quoted is the annualized seven-day yield of the fund at period end. A complete unaudited listing of the fund's holdings as of its most recent quarter end is available upon request. In addition, each Fidelity Central Fund's financial statements, which are not covered by the Fund's Report of Independent Registered Public Accounting Firm, are available on the SEC's website or upon request. |
| (i) | Investment made with cash collateral received from securities on loan. |
| (j) | The rate quoted is the annualized seven-day yield of the fund at period end. |
| Affiliate | Value, beginning of period ($) | Purchases ($) | Sales Proceeds ($) | Dividend Income ($) | Realized Gain (loss) ($) | Change in Unrealized appreciation (depreciation) ($) | Value, end of period ($) | % ownership, end of period |
| Fidelity Cash Central Fund 4.63% | 46,788,821 | 459,847,407 | 437,488,031 | 1,461,645 | - | - | 69,148,197 | 0.2% |
| Fidelity Securities Lending Cash Central Fund 4.63% | 227,226,382 | 1,667,112,276 | 1,730,154,906 | 1,830,528 | - | - | 164,183,752 | 0.5% |
| Total | 274,015,203 | 2,126,959,683 | 2,167,642,937 | 3,292,173 | - | - | 233,331,949 | |
| Affiliate | Value, beginning of period ($) | Purchases ($) | Sales Proceeds ($) | Dividend Income ($) | Realized Gain (loss) ($) | Change in Unrealized appreciation (depreciation) ($) | Value, end of period ($) |
| Fidelity Advisor Emerging Markets Fund Class Z | 622,922,321 | 4,237,385 | 45,000,000 | 4,237,386 | (15,750,577) | (84,104,481) | 482,304,648 |
| Fidelity SAI Emerging Markets Index Fund | 344,501,663 | 135,895,709 | 213,000,000 | 5,895,709 | 19,772,110 | (68,993,877) | 218,175,605 |
| Fidelity SAI Emerging Markets Low Volatility Index Fund | 590,858,941 | 111,080,798 | 52,258,116 | 10,822,682 | (4,918,458) | (85,934,138) | 558,829,027 |
| Fidelity SAI Emerging Markets Value Index Fund | 885,908,737 | 139,096,186 | 67,105,759 | 37,990,442 | (18,015,245) | (147,227,169) | 792,656,750 |
| Fidelity SAI Inflation-Focused Fund | 13,476,115 | 1,468,909 | - | 1,468,909 | - | (2,782,398) | 12,162,626 |
| 2,457,667,777 | 391,778,987 | 377,363,875 | 60,415,128 | (18,912,170) | (389,042,063) | 2,064,128,656 |
| Valuation Inputs at Reporting Date: | ||||
| Description | Total ($) | Level 1 ($) | Level 2 ($) | Level 3 ($) |
Investments in Securities: | ||||
| Equities: | ||||
Communication Services | 370,471,790 | 124,529,320 | 242,600,376 | 3,342,094 |
Consumer Discretionary | 673,710,975 | 416,045,303 | 257,525,297 | 140,375 |
Consumer Staples | 322,378,373 | 322,342,388 | - | 35,985 |
Energy | 167,075,269 | 160,562,325 | 5,786,684 | 726,260 |
Financials | 922,417,104 | 650,878,013 | 271,377,358 | 161,733 |
Health Care | 122,563,433 | 105,800,885 | 16,762,548 | - |
Industrials | 259,223,057 | 259,168,715 | - | 54,342 |
Information Technology | 910,781,619 | 563,656,112 | 347,125,507 | - |
Materials | 284,377,962 | 254,949,381 | 29,320,103 | 108,478 |
Real Estate | 44,859,968 | 44,859,968 | - | - |
Utilities | 45,578,671 | 45,578,671 | - | - |
| Equity Funds | 2,938,680,562 | 2,938,680,562 | - | - |
| Other | 12,162,626 | 12,162,626 | - | - |
| Other Short-Term Investments | 10,248,175 | - | 10,248,175 | - |
| Money Market Funds | 544,368,843 | 544,368,843 | - | - |
| Total Investments in Securities: | 7,628,898,427 | 6,443,583,112 | 1,180,746,048 | 4,569,267 |
Derivative Instruments: | ||||
| Liabilities | ||||
Futures Contracts | (12,109,075) | (12,109,075) | - | - |
| Total Liabilities | (12,109,075) | (12,109,075) | - | - |
| Total Derivative Instruments: | (12,109,075) | (12,109,075) | - | - |
Primary Risk Exposure / Derivative Type | Value | |
| Asset ($) | Liability ($) | |
| Equity Risk | ||
Futures Contracts (a) | 0 | (12,109,075) |
| Total Equity Risk | 0 | (12,109,075) |
| Total Value of Derivatives | 0 | (12,109,075) |
| Statement of Assets and Liabilities | ||||
| February 28, 2023 | ||||
| Assets | ||||
| Investment in securities, at value (including securities loaned of $158,419,399) - See accompanying schedule: | ||||
Unaffiliated issuers (cost $4,979,687,279) | $ | 5,331,437,822 | ||
Fidelity Central Funds (cost $233,331,949) | 233,331,949 | |||
Other affiliated issuers (cost $2,089,862,829) | 2,064,128,656 | |||
| Total Investment in Securities (cost $7,302,882,057) | $ | 7,628,898,427 | ||
| Foreign currency held at value (cost $7,459,368) | 7,432,701 | |||
| Receivable for investments sold | 14,198,549 | |||
| Receivable for fund shares sold | 10,991,525 | |||
| Dividends receivable | 9,939,215 | |||
| Interest receivable | 810,329 | |||
| Distributions receivable from Fidelity Central Funds | 281,039 | |||
| Other receivables | 134,548 | |||
Total assets | 7,672,686,333 | |||
| Liabilities | ||||
| Payable to custodian bank | $ | 753,177 | ||
| Payable for investments purchased | 15,349,377 | |||
| Payable for fund shares redeemed | 3,313,325 | |||
| Accrued management fee | 1,842,265 | |||
| Payable for daily variation margin on futures contracts | 1,890,638 | |||
| Other payables and accrued expenses | 7,094,826 | |||
| Collateral on securities loaned | 164,133,183 | |||
| Total Liabilities | 194,376,791 | |||
| Net Assets | $ | 7,478,309,542 | ||
| Net Assets consist of: | ||||
| Paid in capital | $ | 7,773,750,178 | ||
| Total accumulated earnings (loss) | (295,440,636) | |||
| Net Assets | $ | 7,478,309,542 | ||
Net Asset Value , offering price and redemption price per share ($7,478,309,542 ÷ 765,757,023 shares) | $ | 9.77 | ||
| Statement of Operations | ||||
Year ended February 28, 2023 | ||||
| Investment Income | ||||
| Dividends: | ||||
| Unaffiliated issuers | $ | 171,167,316 | ||
| Affiliated issuers | 60,398,694 | |||
| Non-Cash dividends | 13,119,600 | |||
| Interest | 4,951,495 | |||
| Income from Fidelity Central Funds (including $1,830,528 from security lending) | 3,292,173 | |||
| Income before foreign taxes withheld | $ | 252,929,278 | ||
| Less foreign taxes withheld | (16,277,743) | |||
| Total Income | 236,651,535 | |||
| Expenses | ||||
| Management fee | $ | 44,180,065 | ||
| Custodian fees and expenses | 1,734,197 | |||
| Independent trustees' fees and expenses | 53,994 | |||
| Registration fees | 108,387 | |||
| Audit | 133,941 | |||
| Legal | 13,532 | |||
| Miscellaneous | 53,447 | |||
| Total expenses before reductions | 46,277,563 | |||
| Expense reductions | (20,276,281) | |||
| Total expenses after reductions | 26,001,282 | |||
| Net Investment income (loss) | 210,650,253 | |||
| Realized and Unrealized Gain (Loss) | ||||
| Net realized gain (loss) on: | ||||
| Investment Securities: | ||||
| Unaffiliated issuers (net of foreign taxes of $3,941,082) | (453,212,835) | |||
| Affiliated issuers | (18,912,170) | |||
| Foreign currency transactions | (4,382,232) | |||
| Futures contracts | (69,208,231) | |||
| Capital gain distributions from underlying funds: | ||||
| Unaffiliated issuers | 788,480 | |||
| Affiliated issuers | 16,434 | |||
| Total net realized gain (loss) | (544,910,554) | |||
| Change in net unrealized appreciation (depreciation) on: | ||||
| Investment Securities: | ||||
| Unaffiliated issuers (net of decrease in deferred foreign taxes of $4,375,408) | (742,472,911) | |||
| Affiliated issuers | (389,042,083) | |||
| Assets and liabilities in foreign currencies | (287,101) | |||
| Futures contracts | 2,308,190 | |||
| Total change in net unrealized appreciation (depreciation) | (1,129,493,905) | |||
| Net gain (loss) | (1,674,404,459) | |||
| Net increase (decrease) in net assets resulting from operations | $ | (1,463,754,206) | ||
| Statement of Changes in Net Assets | ||||
Year ended February 28, 2023 | Year ended February 28, 2022 | |||
| Increase (Decrease) in Net Assets | ||||
| Operations | ||||
| Net investment income (loss) | $ | 210,650,253 | $ | 174,467,478 |
| Net realized gain (loss) | (544,910,554) | 89,420,383 | ||
| Change in net unrealized appreciation (depreciation) | (1,129,493,905) | (1,539,804,432) | ||
| Net increase (decrease) in net assets resulting from operations | (1,463,754,206) | (1,275,916,571) | ||
| Distributions to shareholders | (190,211,815) | (294,736,059) | ||
| Share transactions | ||||
| Proceeds from sales of shares | 2,219,233,596 | 3,263,578,700 | ||
| Reinvestment of distributions | 165,990,631 | 266,713,282 | ||
| Cost of shares redeemed | (3,010,880,251) | (1,415,939,059) | ||
Net increase (decrease) in net assets resulting from share transactions | (625,656,024) | 2,114,352,923 | ||
| Total increase (decrease) in net assets | (2,279,622,045) | 543,700,293 | ||
| Net Assets | ||||
| Beginning of period | 9,757,931,587 | 9,214,231,294 | ||
| End of period | $ | 7,478,309,542 | $ | 9,757,931,587 |
| Other Information | ||||
| Shares | ||||
| Sold | 221,205,781 | 245,488,428 | ||
| Issued in reinvestment of distributions | 17,201,102 | 20,980,423 | ||
| Redeemed | (296,986,009) | (105,951,304) | ||
| Net increase (decrease) | (58,579,126) | 160,517,547 | ||
| Strategic Advisers® Emerging Markets Fund |
| Years ended February 28, | 2023 | 2022 | 2021 | 2020 A | 2019 | |||||
Selected Per-Share Data | ||||||||||
| Net asset value, beginning of period | $ | 11.84 | $ | 13.88 | $ | 10.20 | $ | 10.23 | $ | 11.75 |
| Income from Investment Operations | ||||||||||
Net investment income (loss) B,C | .26 | .24 | .15 | .23 D | .17 | |||||
| Net realized and unrealized gain (loss) | (2.08) | (1.90) | 3.66 | (.03) | (1.53) | |||||
| Total from investment operations | (1.82) | (1.66) | 3.81 | .20 | (1.36) | |||||
| Distributions from net investment income | (.25) | (.25) | (.13) | (.23) | (.16) | |||||
| Distributions from net realized gain | - | (.13) | - | - | - | |||||
| Total distributions | (.25) | (.38) | (.13) | (.23) | (.16) | |||||
| Net asset value, end of period | $ | 9.77 | $ | 11.84 | $ | 13.88 | $ | 10.20 | $ | 10.23 |
Total Return E | (15.33)% | (12.12)% | 37.42% | 1.80% | (11.48)% | |||||
Ratios to Average Net Assets C,F,G | ||||||||||
| Expenses before reductions | .57% | .58% | .59% | .64% | .66% | |||||
| Expenses net of fee waivers, if any | .32% | .33% | .34% | .39% | .41% | |||||
| Expenses net of all reductions | .32% | .33% | .34% | .39% | .40% | |||||
| Net investment income (loss) | 2.59% | 1.78% | 1.28% | 2.20% D | 1.60% | |||||
| Supplemental Data | ||||||||||
| Net assets, end of period (000 omitted) | $ | 7,478,310 | $ | 9,757,932 | $ | 9,214,231 | $ | 4,818,245 | $ | 4,660,765 |
Portfolio turnover rate H | 39% | 31% | 43% | 39% | 57% |
| Strategic Advisers Emerging Markets Fund | $53,515 |
| Gross unrealized appreciation | $1,056,115,490 |
| Gross unrealized depreciation | (827,178,667) |
| Net unrealized appreciation (depreciation) | $228,936,823 |
| Tax Cost | $7,399,961,604 |
| Capital loss carryforward | $(517,828,597) |
| Net unrealized appreciation (depreciation) on securities and other investments | $228,644,006 |
| Short-term | $(303,472,528) |
| Long-term | (214,356,069) |
| Total capital loss carryforward | $(517,828,597) |
| February 28, 2023 | February 28, 2022 | |
| Ordinary Income | $190,211,815 | $202,005,408 |
| Long-term Capital Gains | - | 92,730,651 |
| Total | $190,211,815 | $294,736,059 |
| Equity Risk | Equity risk relates to the fluctuations in the value of financial instruments as a result of changes in market prices (other than those arising from interest rate risk or foreign exchange risk), whether caused by factors specific to an individual investment, its issuer, or all factors affecting all instruments traded in a market or market segment. |
| Purchases ($) | Sales ($) | |
| Strategic Advisers Emerging Markets Fund | 3,004,257,341 | 3,299,541,356 |
| Amount | |
| Strategic Advisers Emerging Markets Fund | $2,861 |
| Purchases ($) | Sales ($) | Realized Gain (Loss) ($) | |
| Strategic Advisers Emerging Markets Fund | 10,326,943 | 16,444,914 | (583,819) |
| Fidelity Central Fund | Investment Manager | Investment Objective | Investment Practices | Expense Ratio A |
| Fidelity Money Market Central Funds | Fidelity Management & Research Company LLC (FMR) | Each fund seeks to obtain a high level of current income consistent with the preservation of capital and liquidity. | Short-term Investments | Less than .005% |
| Amount | |
| Strategic Advisers Emerging Markets Fund | $15,050 |
| Total Security Lending Fees Paid to NFS | Security Lending Income From Securities Loaned to NFS | Value of Securities Loaned to NFS at Period End | |
| Strategic Advisers Emerging Markets Fund | $195,810 | $- | $- |
| Fund | Strategic Advisers Emerging Markets Fund |
| Fidelity SAI Emerging Markets Low Volatility Index Fund | 19% |
| Fidelity SAI Emerging Markets Value Index Fund | 30% |
| The Example is based on an investment of $1,000 invested at the beginning of the period and held for the entire period (September 1, 2022 to February 28, 2023). |
Annualized Expense Ratio- A | Beginning Account Value September 1, 2022 | Ending Account Value February 28, 2023 | Expenses Paid During Period- C September 1, 2022 to February 28, 2023 | |||||||
| Strategic Advisers® Emerging Markets Fund | .33% | |||||||||
| Actual | $ 1,000 | $ 1,003.50 | $ 1.64 | |||||||
Hypothetical- B | $ 1,000 | $ 1,023.16 | $ 1.66 | |||||||


- Highly liquid investments - cash or convertible to cash within three business days or less
- Moderately liquid investments - convertible to cash in three to seven calendar days
- Less liquid investments - can be sold or disposed of, but not settled, within seven calendar days
- Illiquid investments - cannot be sold or disposed of within seven calendar days
 |


Contents
| Average Annual Total Returns | |||
Periods ended February 28, 2023 | Past 1 year | Past 5 years | Past 10 years |
| Strategic Advisers® Core Income Fund | -10.12% | 0.90% | 1.52% |
| $10,000 Over 10 Years |
Let's say hypothetically that $10,000 was invested in Strategic Advisers® Core Income Fund on February 28, 2013. The chart shows how the value of your investment would have changed, and also shows how the Bloomberg U.S. Aggregate Bond Index performed over the same period. |
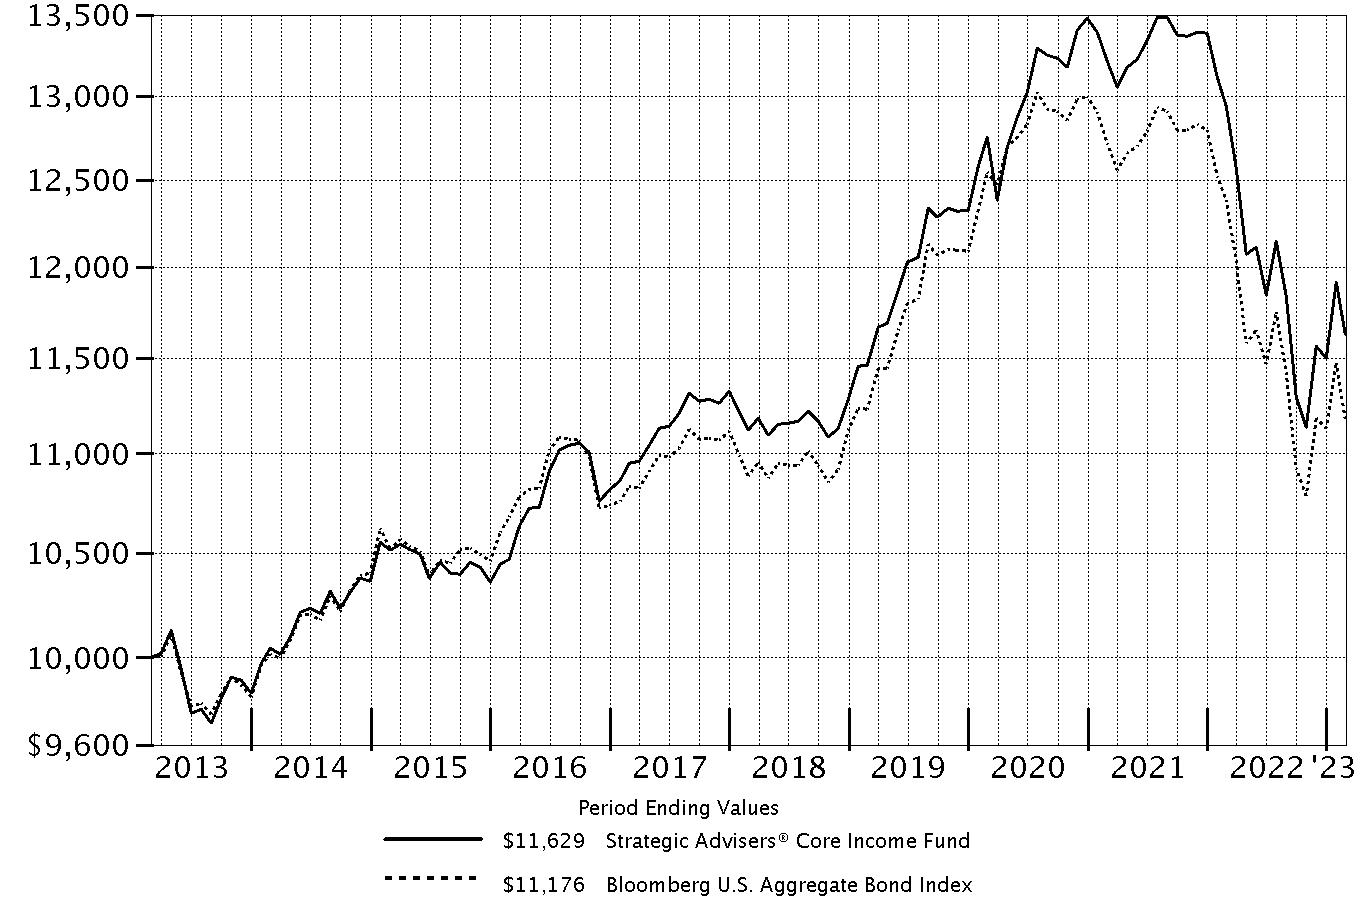 |
Top Holdings (% of Fund's net assets) | ||
| (excluding cash equivalents) | ||
| PIMCO Total Return Fund Institutional Class | 12.4 | |
| Fidelity SAI Total Bond Fund | 10.8 | |
| U.S. Treasury Obligations | 9.0 | |
| Western Asset Core Plus Bond Fund Class I | 6.0 | |
| Western Asset Core Bond Fund Class I | 4.8 | |
| Fidelity SAI U.S. Treasury Bond Index Fund | 3.7 | |
| DoubleLine Total Return Bond Fund Class N | 3.6 | |
| Fannie Mae | 3.2 | |
| Voya Intermediate Bond Fund Class I | 2.9 | |
| PIMCO Mortgage Opportunities Fund Institutional Class | 2.8 | |
Asset Allocation (% of Fund's net assets) |
 |
Short-Term Investments and Net Other Assets (Liabilities) - (1.7)%* |
Short-Term Investments and Net Other Assets (Liabilities) are not available in the pie chart. |
Percentages in the above tables are adjusted for the effect of TBA Sale Commitments. |
| Nonconvertible Bonds - 9.1% | |||
Principal Amount (a) | Value ($) | ||
| COMMUNICATION SERVICES - 0.8% | |||
| Diversified Telecommunication Services - 0.2% | |||
| AT&T, Inc.: | |||
| 1.7% 3/25/26 | 700,000 | 629,026 | |
| 2.55% 12/1/33 | 5,588,000 | 4,278,448 | |
| 3.5% 6/1/41 | 4,990,000 | 3,746,099 | |
| 3.5% 9/15/53 | 1,298,000 | 891,059 | |
| 3.55% 9/15/55 | 1,440,000 | 975,461 | |
| 3.65% 9/15/59 | 8,915,000 | 6,037,622 | |
| 3.8% 12/1/57 | 26,733,000 | 18,768,267 | |
| 4.3% 2/15/30 | 3,709,000 | 3,479,321 | |
| 4.5% 5/15/35 | 1,980,000 | 1,780,942 | |
| 4.5% 3/9/48 | 6,650,000 | 5,467,437 | |
| 4.75% 5/15/46 | 12,145,000 | 10,442,364 | |
| C&W Senior Financing Designated Activity Co. 6.875% 9/15/27 (b) | 305,000 | 274,805 | |
| Cablevision Lightpath LLC 3.875% 9/15/27 (b) | 10,000 | 8,152 | |
| Cellnex Telecom SA 1.75% 10/23/30 (Reg. S) | EUR | 5,500,000 | 4,520,383 |
| Cogent Communications Group, Inc.: | |||
| 3.5% 5/1/26 (b) | 165,000 | 149,863 | |
| 7% 6/15/27 (b) | 255,000 | 246,713 | |
| Frontier Communications Holdings LLC 5.875% 10/15/27 (b) | 95,000 | 88,265 | |
| Holdco SASU: | |||
| 6.5% 10/15/26 (b) | 475,000 | 443,937 | |
| 7% 10/15/28 (b) | 450,000 | 413,324 | |
| Level 3 Financing, Inc. 3.625% 1/15/29 (b) | 4,900,000 | 3,144,232 | |
| Lumen Technologies, Inc.: | |||
| 7.6% 9/15/39 | 939,000 | 465,453 | |
| 7.65% 3/15/42 | 1,000,000 | 499,000 | |
| Qwest Corp. 7.25% 9/15/25 | 203,000 | 200,310 | |
| Sable International Finance Ltd. 5.75% 9/7/27 (b) | 526,000 | 483,197 | |
| Sprint Capital Corp. 8.75% 3/15/32 | 555,000 | 660,722 | |
| Sprint Spectrum Co. LLC: | |||
| 4.738% 9/20/29 (b) | 770,625 | 761,738 | |
| 5.152% 9/20/29 (b) | 14,655,000 | 14,492,312 | |
| Telecom Italia SpA 5.303% 5/30/24 (b) | 370,000 | 360,317 | |
| Telenet Finance Luxembourg Notes SARL 5.5% 3/1/28 (b) | 400,000 | 373,220 | |
| Verizon Communications, Inc.: | |||
| 2.355% 3/15/32 | 3,020,000 | 2,374,180 | |
| 2.65% 11/20/40 | 1,515,000 | 1,026,117 | |
| 3.4% 3/22/41 | 5,480,000 | 4,130,820 | |
| 4.016% 12/3/29 | 4,681,000 | 4,317,304 | |
| Virgin Media Finance PLC 5% 7/15/30 (b) | 270,000 | 220,050 | |
| Zayo Group Holdings, Inc. 4% 3/1/27 (b) | 1,900,000 | 1,457,538 | |
| 97,607,998 | |||
| Entertainment - 0.0% | |||
| Netflix, Inc. 4.375% 11/15/26 | 165,000 | 159,162 | |
| Roblox Corp. 3.875% 5/1/30 (b) | 280,000 | 230,191 | |
| Take-Two Interactive Software, Inc. 4% 4/14/32 | 3,095,000 | 2,756,749 | |
| 3,146,102 | |||
| Interactive Media & Services - 0.0% | |||
| Meta Platforms, Inc. 4.45% 8/15/52 | 1,785,000 | 1,480,195 | |
| Tencent Holdings Ltd. 3.84% 4/22/51 (b) | 2,435,000 | 1,745,457 | |
| 3,225,652 | |||
| Media - 0.4% | |||
| Adria Bidco BV 5.25% 2/1/30 (b) | EUR | 5,200,000 | 4,207,531 |
| Advantage Sales & Marketing, Inc. 6.5% 11/15/28 (b) | 555,000 | 424,081 | |
| Altice France Holding SA: | |||
| 4% 2/15/28 (Reg. S) | EUR | 4,800,000 | 3,455,379 |
| 8% 5/15/27 (Reg. S) | EUR | 4,800,000 | 4,023,491 |
| Cable One, Inc. 4% 11/15/30 (b) | 2,500,000 | 1,949,250 | |
| CCO Holdings LLC/CCO Holdings Capital Corp.: | |||
| 4% 3/1/23 (b) | 2,450,000 | 2,450,000 | |
| 4.5% 8/15/30 (b) | 180,000 | 148,054 | |
| 4.5% 5/1/32 | 3,822,000 | 3,024,922 | |
| 4.5% 6/1/33 (b) | 2,110,000 | 1,641,585 | |
| 4.75% 2/1/32 (b) | 115,000 | 93,150 | |
| Charter Communications Operating LLC/Charter Communications Operating Capital Corp.: | |||
| 3.7% 4/1/51 | 2,995,000 | 1,831,353 | |
| 3.9% 6/1/52 | 12,363,000 | 7,812,551 | |
| 4.8% 3/1/50 | 4,815,000 | 3,519,099 | |
| 4.908% 7/23/25 | 7,565,000 | 7,402,393 | |
| 5.25% 4/1/53 | 1,805,000 | 1,411,473 | |
| 5.375% 4/1/38 | 450,000 | 376,471 | |
| 5.375% 5/1/47 | 32,024,000 | 25,512,046 | |
| 6.384% 10/23/35 | 3,210,000 | 3,081,202 | |
| 6.484% 10/23/45 | 3,445,000 | 3,116,856 | |
| Comcast Corp.: | |||
| 2.937% 11/1/56 | 1,940,000 | 1,216,815 | |
| 3.75% 4/1/40 | 770,000 | 630,632 | |
| 3.999% 11/1/49 | 10,000 | 8,055 | |
| COX Communications, Inc.: | |||
| 1.8% 10/1/30 (b) | 975,000 | 751,665 | |
| 2.6% 6/15/31 (b) | 275,000 | 222,136 | |
| 3.15% 8/15/24 (b) | 1,550,000 | 1,493,407 | |
| Cox Enterprises, Inc. 7.375% 7/15/27 (b) | 3,445,000 | 3,604,957 | |
| CSC Holdings LLC: | |||
| 4.125% 12/1/30 (b) | 215,000 | 155,376 | |
| 4.5% 11/15/31 (b) | 220,000 | 156,195 | |
| 4.625% 12/1/30 (b) | 170,000 | 91,524 | |
| 5.375% 2/1/28 (b) | 600,000 | 500,460 | |
| 5.75% 1/15/30 (b) | 1,000,000 | 572,730 | |
| 6.5% 2/1/29 (b) | 4,164,000 | 3,529,406 | |
| 7.5% 4/1/28 (b) | 350,000 | 234,399 | |
| Diamond Sports Group LLC/Diamond Sports Finance Co. 5.375% 8/15/26 (b) | 7,375,000 | 827,475 | |
| Discovery Communications LLC: | |||
| 3.625% 5/15/30 | 4,338,000 | 3,712,273 | |
| 4% 9/15/55 | 535,000 | 345,945 | |
| 4.65% 5/15/50 | 11,727,000 | 8,600,164 | |
| 5.3% 5/15/49 | 7,695,000 | 6,172,825 | |
| DISH DBS Corp.: | |||
| 5.125% 6/1/29 | 1,100,000 | 649,974 | |
| 5.875% 11/15/24 | 200,000 | 186,636 | |
| 7.75% 7/1/26 | 550,000 | 426,938 | |
| DISH Network Corp. 11.75% 11/15/27 (b) | 4,255,000 | 4,311,272 | |
| Fox Corp.: | |||
| 5.476% 1/25/39 | 2,474,000 | 2,273,542 | |
| 5.576% 1/25/49 | 1,641,000 | 1,494,100 | |
| Gray Television, Inc. 4.75% 10/15/30 (b) | 100,000 | 73,318 | |
| iHeartCommunications, Inc. 4.75% 1/15/28 (b) | 180,000 | 151,367 | |
| Lagardere S.C.A. 2.125% 10/16/26 (Reg. S) | EUR | 800,000 | 808,651 |
| LCPR Senior Secured Financing DAC 5.125% 7/15/29 (b) | 200,000 | 168,140 | |
| Magallanes, Inc.: | |||
| 3.428% 3/15/24 (b) | 3,519,000 | 3,434,480 | |
| 3.638% 3/15/25 (b) | 2,033,000 | 1,939,159 | |
| 3.755% 3/15/27 (b) | 3,520,000 | 3,229,017 | |
| 4.054% 3/15/29 (b) | 1,378,000 | 1,232,284 | |
| 4.279% 3/15/32 (b) | 3,731,000 | 3,221,014 | |
| 5.05% 3/15/42 (b) | 12,171,000 | 9,860,161 | |
| 5.141% 3/15/52 (b) | 18,439,000 | 14,454,402 | |
| 5.391% 3/15/62 (b) | 580,000 | 452,406 | |
| Paramount Global 4.6% 1/15/45 | 5,565,000 | 4,005,142 | |
| Radiate Holdco LLC/Radiate Financial Service Ltd. 4.5% 9/15/26 (b) | 345,000 | 257,439 | |
| SES Global Americas Holdings GP 5.3% 3/25/44 (b) | 2,000,000 | 1,502,795 | |
| Sirius XM Radio, Inc.: | |||
| 3.875% 9/1/31 (b) | 370,000 | 287,705 | |
| 5.5% 7/1/29 (b) | 1,000,000 | 902,500 | |
| TEGNA, Inc. 4.75% 3/15/26 (b) | 225,000 | 213,750 | |
| Time Warner Cable LLC: | |||
| 5.5% 9/1/41 | 8,936,000 | 7,522,914 | |
| 5.875% 11/15/40 | 7,708,000 | 6,806,961 | |
| 6.55% 5/1/37 | 8,522,000 | 8,161,832 | |
| 7.3% 7/1/38 | 6,393,000 | 6,407,353 | |
| Virgin Media Secured Finance PLC: | |||
| 4.25% 1/15/30 (Reg. S) | GBP | 1,500,000 | 1,435,189 |
| 5.5% 5/15/29 (b) | 175,000 | 158,578 | |
| VZ Secured Financing BV 5% 1/15/32 (b) | 565,000 | 464,773 | |
| Ziggo BV: | |||
| 2.875% 1/15/30 (Reg. S) | EUR | 1,100,000 | 931,448 |
| 4.875% 1/15/30 (b) | 115,000 | 97,251 | |
| 195,829,817 | |||
| Wireless Telecommunication Services - 0.2% | |||
| Digicel International Finance Ltd. / Digicel International Holdings Ltd.: | |||
| 8% 12/31/26 (b) | 2,650,000 | 1,163,184 | |
| 8.75% 5/25/24 (b) | 300,000 | 260,625 | |
| 8.75% 5/25/24 (b) | 400,000 | 345,450 | |
| 13% 12/31/25 pay-in-kind (b)(c) | 2,295,045 | 1,122,134 | |
| Intelsat Jackson Holdings SA: | |||
| 5.5% 8/1/23 (d)(e) | 2,500,000 | 0 | |
| 9.75% 7/15/25 (b)(d)(e) | 5,500,000 | 1 | |
| Millicom International Cellular SA: | |||
| 4.5% 4/27/31 (b) | 200,000 | 161,500 | |
| 5.125% 1/15/28 (b) | 346,500 | 304,660 | |
| Rogers Communications, Inc.: | |||
| 3.2% 3/15/27 (b) | 4,297,000 | 3,950,956 | |
| 3.8% 3/15/32 (b) | 3,750,000 | 3,275,546 | |
| Sprint Corp.: | |||
| 7.125% 6/15/24 | 2,950,000 | 2,987,170 | |
| 7.875% 9/15/23 | 3,220,000 | 3,250,072 | |
| T-Mobile U.S.A., Inc.: | |||
| 2.25% 2/15/26 | 3,450,000 | 3,138,009 | |
| 2.625% 4/15/26 | 220,000 | 201,589 | |
| 2.625% 2/15/29 | 275,000 | 233,896 | |
| 3% 2/15/41 | 3,775,000 | 2,627,186 | |
| 3.3% 2/15/51 | 2,935,000 | 1,967,705 | |
| 3.375% 4/15/29 | 3,030,000 | 2,673,651 | |
| 3.75% 4/15/27 | 8,375,000 | 7,873,639 | |
| 3.875% 4/15/30 | 36,607,000 | 33,193,294 | |
| 4.375% 4/15/40 | 200,000 | 169,955 | |
| 4.5% 4/15/50 | 3,381,000 | 2,804,656 | |
| Vodafone Group PLC: | |||
| 4.25% 9/17/50 | 3,525,000 | 2,766,546 | |
| 4.875% 10/3/78 (Reg. S) (c) | GBP | 600,000 | 687,790 |
| 6.25% 10/3/78 (Reg. S) (c) | 805,000 | 778,838 | |
| 75,938,052 | |||
TOTAL COMMUNICATION SERVICES | 375,747,621 | ||
| CONSUMER DISCRETIONARY - 0.4% | |||
| Auto Components - 0.0% | |||
| Adient Global Holdings Ltd. 4.875% 8/15/26 (b) | 2,000,000 | 1,855,920 | |
| Aptiv PLC / Aptiv Corp. 3.25% 3/1/32 | 1,115,000 | 930,405 | |
| Dana, Inc.: | |||
| 4.5% 2/15/32 | 115,000 | 91,658 | |
| 5.625% 6/15/28 | 400,000 | 362,000 | |
| Patrick Industries, Inc. 4.75% 5/1/29 (b) | 110,000 | 93,512 | |
| Valeo SA 1% 8/3/28 (Reg. S) | EUR | 500,000 | 422,023 |
| ZF Finance GmbH 2% 5/6/27 (Reg. S) | EUR | 800,000 | 726,894 |
| 4,482,412 | |||
| Automobiles - 0.1% | |||
| Ford Motor Co.: | |||
| 3.25% 2/12/32 | 1,945,000 | 1,470,009 | |
| 4.75% 1/15/43 | 2,000,000 | 1,459,373 | |
| 5.291% 12/8/46 | 2,060,000 | 1,611,950 | |
| 6.1% 8/19/32 | 6,525,000 | 6,076,777 | |
| General Motors Co.: | |||
| 6.25% 10/2/43 | 9,020,000 | 8,495,388 | |
| 6.6% 4/1/36 | 775,000 | 773,864 | |
| 6.75% 4/1/46 | 1,775,000 | 1,749,197 | |
| General Motors Financial Co., Inc.: | |||
| 2.4% 4/10/28 | 1,895,000 | 1,614,527 | |
| 3.7% 5/9/23 | 11,800,000 | 11,764,486 | |
| 4% 1/15/25 | 5,695,000 | 5,519,730 | |
| 4.25% 5/15/23 | 1,875,000 | 1,870,879 | |
| 5.15% 8/15/26 (Reg. S) | GBP | 250,000 | 295,727 |
| Thor Industries, Inc. 4% 10/15/29 (b) | 150,000 | 120,850 | |
| 42,822,757 | |||
| Diversified Consumer Services - 0.0% | |||
| Adtalem Global Education, Inc. 5.5% 3/1/28 (b) | 639,000 | 588,219 | |
| California Institute of Technology 3.65% 9/1/19 | 535,000 | 366,798 | |
| ERAC U.S.A. Finance LLC 3.3% 12/1/26 (b) | 8,865,000 | 8,175,639 | |
| Massachusetts Institute of Technology: | |||
| 2.989% 7/1/50 | 1,340,000 | 995,115 | |
| 5.6% 7/1/11 | 400,000 | 434,565 | |
| President and Fellows of Harvard College: | |||
| 3.15% 7/15/46 | 315,000 | 244,344 | |
| 3.3% 7/15/56 | 190,000 | 146,116 | |
| 3.745% 11/15/52 | 720,000 | 618,161 | |
| Service Corp. International 5.125% 6/1/29 | 270,000 | 252,788 | |
| Thomas Jefferson University 3.847% 11/1/57 | 2,575,000 | 1,906,280 | |
| Trustees of Boston University 4.061% 10/1/48 | 450,000 | 398,720 | |
| University of Pennsylvania Trustees: | |||
| 2.396% 10/1/50 | 495,000 | 321,973 | |
| 3.61% 2/15/2119 | 285,000 | 199,380 | |
| University of Southern California 3.841% 10/1/47 | 715,000 | 614,912 | |
| WASH Multifamily Acquisition, Inc. 5.75% 4/15/26 (b) | 325,000 | 302,325 | |
| Washington University: | |||
| 3.524% 4/15/54 | 2,630,000 | 2,086,070 | |
| 4.349% 4/15/22 | 2,340,000 | 1,905,448 | |
| Yale University 2.402% 4/15/50 | 2,140,000 | 1,392,253 | |
| 20,949,106 | |||
| Hotels, Restaurants & Leisure - 0.1% | |||
| 1011778 BC Unlimited Liability Co./New Red Finance, Inc.: | |||
| 4% 10/15/30 (b) | 4,925,000 | 4,067,656 | |
| 4.375% 1/15/28 (b) | 280,000 | 250,341 | |
| 5.75% 4/15/25 (b) | 90,000 | 89,438 | |
| Aramark Services, Inc. 5% 2/1/28 (b) | 1,990,000 | 1,832,193 | |
| Boyd Gaming Corp. 4.75% 12/1/27 | 165,000 | 154,688 | |
| Brinker International, Inc. 3.875% 5/15/23 | 1,066,000 | 1,055,729 | |
| Caesars Entertainment, Inc.: | |||
| 6.25% 7/1/25 (b) | 380,000 | 376,840 | |
| 7% 2/15/30 (b) | 850,000 | 856,375 | |
| Carnival Corp.: | |||
| 4% 8/1/28 (b) | 225,000 | 190,087 | |
| 7.625% 3/1/26 (b) | 1,050,000 | 945,646 | |
| Churchill Downs, Inc. 4.75% 1/15/28 (b) | 170,000 | 154,745 | |
| Fertitta Entertainment LLC / Fertitta Entertainment Finance Co., Inc.: | |||
| 4.625% 1/15/29 (b) | 1,500,000 | 1,297,350 | |
| 6.75% 1/15/30 (b) | 325,000 | 269,350 | |
| Garden SpinCo Corp. 8.625% 7/20/30 (b) | 45,000 | 47,479 | |
| Golden Entertainment, Inc. 7.625% 4/15/26 (b) | 1,200,000 | 1,203,336 | |
| Hilton Domestic Operating Co., Inc.: | |||
| 3.625% 2/15/32 (b) | 325,000 | 266,822 | |
| 3.75% 5/1/29 (b) | 255,000 | 221,098 | |
| 4% 5/1/31 (b) | 970,000 | 825,392 | |
| Hyatt Hotels Corp. 1.8% 10/1/24 | 3,020,000 | 2,848,389 | |
| InterContinental Hotel Group PLC 3.375% 10/8/28 (Reg. S) | GBP | 1,305,000 | 1,393,901 |
| International Game Technology PLC: | |||
| 6.25% 1/15/27 (b) | 200,000 | 196,084 | |
| 6.5% 2/15/25 (b) | 600,000 | 601,500 | |
| Marriott International, Inc.: | |||
| 3.125% 6/15/26 | 1,390,000 | 1,299,671 | |
| 3.6% 4/15/24 | 1,310,000 | 1,282,236 | |
| MGM Resorts International: | |||
| 4.625% 9/1/26 | 500,000 | 465,781 | |
| 6.75% 5/1/25 | 100,000 | 100,247 | |
| NCL Corp. Ltd.: | |||
| 5.875% 2/15/27 (b) | 155,000 | 143,763 | |
| 8.375% 2/1/28 (b) | 105,000 | 106,973 | |
| NCL Finance Ltd. 6.125% 3/15/28 (b) | 40,000 | 33,300 | |
| Papa John's International, Inc. 3.875% 9/15/29 (b) | 1,650,000 | 1,377,750 | |
| Premier Entertainment Sub LLC 5.875% 9/1/31 (b) | 1,325,000 | 954,762 | |
| Royal Caribbean Cruises Ltd.: | |||
| 5.375% 7/15/27 (b) | 100,000 | 87,893 | |
| 5.5% 8/31/26 (b) | 280,000 | 257,270 | |
| 7.25% 1/15/30 (b) | 370,000 | 371,619 | |
| Whitbread PLC: | |||
| 2.375% 5/31/27 (Reg. S) | GBP | 1,320,000 | 1,364,313 |
| 3.375% 10/16/25 (Reg. S) | GBP | 1,870,000 | 2,110,298 |
| Wynn Resorts Finance LLC / Wynn Resorts Capital Corp. 7.125% 2/15/31 (b) | 315,000 | 314,370 | |
| Yum! Brands, Inc.: | |||
| 3.625% 3/15/31 | 395,000 | 330,449 | |
| 5.35% 11/1/43 | 50,000 | 41,772 | |
| 29,786,906 | |||
| Household Durables - 0.1% | |||
| Brookfield Residential Properties, Inc./Brookfield Residential U.S. Corp. 4.875% 2/15/30 (b) | 500,000 | 376,080 | |
| Century Communities, Inc.: | |||
| 3.875% 8/15/29 (b) | 135,000 | 110,363 | |
| 6.75% 6/1/27 | 275,000 | 267,673 | |
| Lennar Corp.: | |||
| 4.75% 11/29/27 | 9,350,000 | 8,953,029 | |
| 5% 6/15/27 | 12,100,000 | 11,838,597 | |
| 5.25% 6/1/26 | 2,920,000 | 2,887,760 | |
| Newell Brands, Inc. 5.625% 4/1/36 (f) | 30,000 | 25,408 | |
| SWF Escrow Issuer Corp. 6.5% 10/1/29 (b) | 850,000 | 550,762 | |
| Tempur Sealy International, Inc.: | |||
| 3.875% 10/15/31 (b) | 120,000 | 96,716 | |
| 4% 4/15/29 (b) | 875,000 | 748,046 | |
| The Berkeley Group PLC 2.5% 8/11/31 (Reg. S) | GBP | 1,015,000 | 863,396 |
| Toll Brothers Finance Corp.: | |||
| 4.35% 2/15/28 | 29,675,000 | 27,330,416 | |
| 4.375% 4/15/23 | 5,000,000 | 4,991,303 | |
| 4.875% 11/15/25 | 35,000 | 34,525 | |
| 4.875% 3/15/27 | 7,917,000 | 7,597,395 | |
| TopBuild Corp. 4.125% 2/15/32 (b) | 815,000 | 669,213 | |
| 67,340,682 | |||
| Internet & Direct Marketing Retail - 0.0% | |||
| Match Group Holdings II LLC: | |||
| 3.625% 10/1/31 (b) | 170,000 | 133,025 | |
| 4.125% 8/1/30 (b) | 70,000 | 58,028 | |
| 191,053 | |||
| Leisure Products - 0.0% | |||
| Hasbro, Inc. 3% 11/19/24 | 5,655,000 | 5,419,801 | |
| Mattel, Inc. 6.2% 10/1/40 | 115,000 | 101,811 | |
| 5,521,612 | |||
| Multiline Retail - 0.0% | |||
| John Lewis PLC 6.125% 1/21/25 | GBP | 1,616,000 | 1,884,127 |
| Marks & Spencer PLC 4.5% 7/10/27 (Reg. S) | GBP | 1,000,000 | 1,078,574 |
| 2,962,701 | |||
| Specialty Retail - 0.1% | |||
| Asbury Automotive Group, Inc.: | |||
| 4.625% 11/15/29 (b) | 75,000 | 65,218 | |
| 5% 2/15/32 (b) | 80,000 | 68,176 | |
| AutoNation, Inc. 4.75% 6/1/30 | 953,000 | 885,282 | |
| AutoZone, Inc.: | |||
| 1.65% 1/15/31 | 505,000 | 389,402 | |
| 3.75% 4/18/29 | 1,400,000 | 1,282,387 | |
| 4% 4/15/30 | 6,924,000 | 6,362,831 | |
| Bath & Body Works, Inc. 6.625% 10/1/30 (b) | 345,000 | 326,794 | |
| Foot Locker, Inc. 4% 10/1/29 (b) | 60,000 | 49,326 | |
| Gap, Inc. 3.875% 10/1/31 (b) | 1,490,000 | 1,069,015 | |
| LCM Investments Holdings 4.875% 5/1/29 (b) | 50,000 | 40,640 | |
| Lowe's Companies, Inc.: | |||
| 3.35% 4/1/27 | 619,000 | 579,112 | |
| 3.75% 4/1/32 | 1,904,000 | 1,686,647 | |
| 4.25% 4/1/52 | 6,910,000 | 5,440,821 | |
| 4.45% 4/1/62 | 6,910,000 | 5,413,063 | |
| Michaels Companies, Inc.: | |||
| 5.25% 5/1/28 (b) | 110,000 | 91,545 | |
| 7.875% 5/1/29 (b) | 1,000,000 | 752,500 | |
| O'Reilly Automotive, Inc.: | |||
| 1.75% 3/15/31 | 770,000 | 598,506 | |
| 3.9% 6/1/29 | 600,000 | 555,664 | |
| 4.7% 6/15/32 | 1,065,000 | 1,014,775 | |
| The Home Depot, Inc.: | |||
| 4.875% 2/15/44 | 1,150,000 | 1,095,020 | |
| 5.875% 12/16/36 | 300,000 | 321,024 | |
| Upbound Group, Inc. 6.375% 2/15/29 (b) | 325,000 | 278,808 | |
| VIA Outlets 1.75% 11/15/28 (Reg. S) | EUR | 700,000 | 581,413 |
| 28,947,969 | |||
| Textiles, Apparel & Luxury Goods - 0.0% | |||
| Crocs, Inc. 4.125% 8/15/31 (b) | 120,000 | 98,400 | |
| Kontoor Brands, Inc. 4.125% 11/15/29 (b) | 40,000 | 33,900 | |
| Levi Strauss & Co. 3.5% 3/1/31 (b) | 170,000 | 138,975 | |
| Tapestry, Inc. 3.05% 3/15/32 | 14,311,000 | 11,371,115 | |
| The William Carter Co. 5.625% 3/15/27 (b) | 875,000 | 841,012 | |
| Wolverine World Wide, Inc. 4% 8/15/29 (b) | 170,000 | 136,925 | |
| 12,620,327 | |||
TOTAL CONSUMER DISCRETIONARY | 215,625,525 | ||
| CONSUMER STAPLES - 0.5% | |||
| Beverages - 0.2% | |||
| Anheuser-Busch Companies LLC / Anheuser-Busch InBev Worldwide, Inc.: | |||
| 4.7% 2/1/36 | 3,765,000 | 3,533,939 | |
| 4.9% 2/1/46 | 11,475,000 | 10,525,721 | |
| Anheuser-Busch InBev Finance, Inc.: | |||
| 4.7% 2/1/36 | 9,871,000 | 9,265,208 | |
| 4.9% 2/1/46 | 12,306,000 | 11,287,976 | |
| Anheuser-Busch InBev Worldwide, Inc.: | |||
| 3.5% 6/1/30 | 8,175,000 | 7,444,522 | |
| 4.35% 6/1/40 | 4,618,000 | 4,053,164 | |
| 4.375% 4/15/38 | 1,140,000 | 1,019,366 | |
| 4.5% 6/1/50 | 8,175,000 | 7,200,688 | |
| 4.6% 6/1/60 | 5,007,000 | 4,340,812 | |
| 4.75% 1/23/29 | 1,690,000 | 1,661,328 | |
| 5.45% 1/23/39 | 5,390,000 | 5,372,238 | |
| 5.55% 1/23/49 | 14,627,000 | 14,717,119 | |
| 5.8% 1/23/59 (Reg. S) | 6,509,000 | 6,729,840 | |
| Bacardi Ltd. 4.7% 5/15/28 (b) | 343,000 | 331,499 | |
| Constellation Brands, Inc.: | |||
| 2.25% 8/1/31 | 1,285,000 | 1,011,748 | |
| 3.7% 12/6/26 | 1,200,000 | 1,134,329 | |
| 4.4% 11/15/25 | 805,000 | 786,381 | |
| 4.75% 11/15/24 | 5,595,000 | 5,544,351 | |
| PepsiCo, Inc. 2.625% 3/19/27 | 839,000 | 776,225 | |
| Primo Water Holdings, Inc. 4.375% 4/30/29 (b) | 220,000 | 188,426 | |
| Triton Water Holdings, Inc. 6.25% 4/1/29 (b) | 1,125,000 | 896,681 | |
| 97,821,561 | |||
| Food & Staples Retailing - 0.0% | |||
| Albertsons Companies LLC/Safeway, Inc./New Albertson's, Inc./Albertson's LLC: | |||
| 3.5% 3/15/29 (b) | 645,000 | 545,912 | |
| 4.875% 2/15/30 (b) | 615,000 | 551,856 | |
| 6.5% 2/15/28 (b) | 1,110,000 | 1,103,729 | |
| Alimentation Couche-Tard, Inc. 2.95% 1/25/30 (b) | 1,800,000 | 1,529,379 | |
| Bellis Acquisition Co. PLC 4.5% 2/16/26 (b) | GBP | 975,000 | 1,003,957 |
| Bellis Finco PLC 4% 2/16/27 (b) | GBP | 9,000,000 | 7,724,101 |
| C&S Group Enterprises LLC 5% 12/15/28 (b) | 2,000,000 | 1,540,267 | |
| Kroger Co. 2.65% 10/15/26 | 430,000 | 396,413 | |
| Market Bidco Finco PLC 5.5% 11/4/27 (b) | GBP | 3,100,000 | 2,863,745 |
| Tesco Corporate Treasury Services PLC 5.5% 2/27/35 (Reg. S) | GBP | 850,000 | 992,118 |
| U.S. Foods, Inc.: | |||
| 4.625% 6/1/30 (b) | 55,000 | 48,039 | |
| 6.25% 4/15/25 (b) | 185,000 | 184,324 | |
| 18,483,840 | |||
| Food Products - 0.2% | |||
| Chobani LLC/Finance Corp., Inc. 4.625% 11/15/28 (b) | 1,600,000 | 1,394,704 | |
| Darling Ingredients, Inc.: | |||
| 5.25% 4/15/27 (b) | 300,000 | 288,645 | |
| 6% 6/15/30 (b) | 65,000 | 62,806 | |
| Hormel Foods Corp. 0.65% 6/3/24 | 895,000 | 845,021 | |
| JBS U.S.A. Lux SA / JBS Food Co.: | |||
| 2.5% 1/15/27 (b) | 6,705,000 | 5,867,277 | |
| 3% 2/2/29 (b) | 390,000 | 324,345 | |
| 3% 5/15/32 (b) | 6,735,000 | 5,134,391 | |
| 3.625% 1/15/32 (b) | 1,194,000 | 956,418 | |
| 3.75% 12/1/31 (b) | 1,040,000 | 833,560 | |
| 4.375% 2/2/52 (b) | 1,620,000 | 1,150,404 | |
| 5.125% 2/1/28 (b) | 8,005,000 | 7,608,592 | |
| 5.5% 1/15/30 (b) | 16,270,000 | 15,314,056 | |
| 5.75% 4/1/33 (b) | 10,435,000 | 9,732,933 | |
| 6.5% 12/1/52 (b) | 2,490,000 | 2,366,508 | |
| JDE Peet's BV 2.25% 9/24/31 (b) | 1,400,000 | 1,067,467 | |
| Kraft Heinz Foods Co.: | |||
| 3.75% 4/1/30 | 4,653,000 | 4,254,891 | |
| 4.375% 6/1/46 | 9,070,000 | 7,398,104 | |
| 5.2% 7/15/45 | 4,602,000 | 4,239,831 | |
| 7.125% 8/1/39 (b) | 9,093,000 | 10,022,565 | |
| Lamb Weston Holdings, Inc.: | |||
| 4.125% 1/31/30 (b) | 450,000 | 394,916 | |
| 4.375% 1/31/32 (b) | 1,255,000 | 1,104,081 | |
| 4.875% 5/15/28 (b) | 345,000 | 325,152 | |
| Pilgrim's Pride Corp.: | |||
| 3.5% 3/1/32 | 3,000,000 | 2,318,261 | |
| 4.25% 4/15/31 | 3,130,000 | 2,613,550 | |
| 5.875% 9/30/27 (b) | 1,513,000 | 1,482,740 | |
| Post Holdings, Inc.: | |||
| 4.625% 4/15/30 (b) | 530,000 | 459,521 | |
| 5.5% 12/15/29 (b) | 1,270,000 | 1,162,208 | |
| Simmons Foods, Inc. 4.625% 3/1/29 (b) | 1,900,000 | 1,548,500 | |
| TreeHouse Foods, Inc. 4% 9/1/28 | 505,000 | 433,113 | |
| Tyson Foods, Inc. 4% 3/1/26 | 2,520,000 | 2,431,332 | |
| 93,135,892 | |||
| Household Products - 0.0% | |||
| Central Garden & Pet Co. 4.125% 4/30/31 (b) | 600,000 | 491,511 | |
| Spectrum Brands Holdings, Inc. 5.5% 7/15/30 (b) | 568,000 | 502,282 | |
| 993,793 | |||
| Personal Products - 0.0% | |||
| BellRing Brands, Inc. 7% 3/15/30 (b) | 110,000 | 108,779 | |
| Tobacco - 0.1% | |||
| Altria Group, Inc.: | |||
| 2.45% 2/4/32 | 6,000,000 | 4,529,046 | |
| 3.4% 2/4/41 | 5,970,000 | 4,001,387 | |
| 4.25% 8/9/42 | 490,000 | 368,436 | |
| BAT Capital Corp.: | |||
| 3.557% 8/15/27 | 3,260,000 | 2,968,776 | |
| 4.39% 8/15/37 | 1,000,000 | 776,217 | |
| 4.54% 8/15/47 | 11,635,000 | 8,348,775 | |
| 4.7% 4/2/27 | 425,000 | 410,707 | |
| 4.758% 9/6/49 | 1,700,000 | 1,256,363 | |
| 5.65% 3/16/52 | 1,500,000 | 1,265,263 | |
| BAT International Finance PLC 4.448% 3/16/28 | 8,700,000 | 8,133,882 | |
| Imperial Tobacco Finance PLC: | |||
| 3.125% 7/26/24 (b) | 4,250,000 | 4,077,413 | |
| 4.25% 7/21/25 (b) | 1,500,000 | 1,442,047 | |
| Philip Morris International, Inc.: | |||
| 3.875% 8/21/42 | 830,000 | 631,613 | |
| 5.125% 2/15/30 | 15,785,000 | 15,451,429 | |
| 5.625% 11/17/29 | 525,000 | 531,969 | |
| 5.75% 11/17/32 | 285,000 | 288,318 | |
| Reynolds American, Inc. 5.7% 8/15/35 | 635,000 | 577,386 | |
| 55,059,027 | |||
TOTAL CONSUMER STAPLES | 265,602,892 | ||
| ENERGY - 1.0% | |||
| Energy Equipment & Services - 0.0% | |||
| Archrock Partners LP / Archrock Partners Finance Corp. 6.25% 4/1/28 (b) | 1,000,000 | 949,280 | |
| Halliburton Co.: | |||
| 4.75% 8/1/43 | 460,000 | 396,194 | |
| 6.7% 9/15/38 | 170,000 | 182,568 | |
| Precision Drilling Corp. 7.125% 1/15/26 (b) | 115,000 | 113,143 | |
| Technip Energies NV 1.125% 5/28/28 | EUR | 955,000 | 847,012 |
| Transocean Poseidon Ltd. 6.875% 2/1/27 (b) | 97,500 | 94,697 | |
| Transocean, Inc. 11.5% 1/30/27 (b) | 140,000 | 143,850 | |
| U.S.A. Compression Partners LP 6.875% 4/1/26 | 527,000 | 505,072 | |
| 3,231,816 | |||
| Oil, Gas & Consumable Fuels - 1.0% | |||
| Aethon United BR LP / Aethon United Finance Corp. 8.25% 2/15/26 (b) | 125,000 | 120,229 | |
| Aker BP ASA: | |||
| 2.875% 1/15/26 (b) | 7,120,000 | 6,627,427 | |
| 3.1% 7/15/31 (b) | 2,295,000 | 1,878,958 | |
| Antero Midstream Partners LP/Antero Midstream Finance Corp.: | |||
| 5.75% 3/1/27 (b) | 1,250,000 | 1,180,013 | |
| 7.875% 5/15/26 (b) | 1,225,000 | 1,237,193 | |
| Apache Corp.: | |||
| 4.25% 1/15/30 | 575,000 | 508,210 | |
| 5.25% 2/1/42 | 210,000 | 169,134 | |
| Ascent Resources - Utica LLC/ARU Finance Corp. 7% 11/1/26 (b) | 1,530,000 | 1,484,942 | |
| Buckeye Partners LP 4.125% 12/1/27 | 180,000 | 155,811 | |
| Cenovus Energy, Inc.: | |||
| 3.75% 2/15/52 | 3,795,000 | 2,687,200 | |
| 5.25% 6/15/37 | 3,195,000 | 2,925,226 | |
| Centennial Resource Production LLC 5.875% 7/1/29 (b) | 60,000 | 53,700 | |
| Cheniere Energy Partners LP: | |||
| 3.25% 1/31/32 | 435,000 | 348,648 | |
| 4% 3/1/31 | 220,000 | 189,563 | |
| Chesapeake Energy Corp.: | |||
| 5.5% 2/1/26 (b) | 330,000 | 323,400 | |
| 5.875% 2/1/29 (b) | 105,000 | 98,205 | |
| Citgo Petroleum Corp. 7% 6/15/25 (b) | 1,275,000 | 1,255,085 | |
| CNX Midstream Partners LP 4.75% 4/15/30 (b) | 45,000 | 36,893 | |
| Columbia Pipeline Group, Inc. 4.5% 6/1/25 | 1,418,000 | 1,385,876 | |
| Comstock Resources, Inc. 6.75% 3/1/29 (b) | 130,000 | 119,600 | |
| ConocoPhillips Co. 3.758% 3/15/42 | 525,000 | 428,883 | |
| Continental Resources, Inc.: | |||
| 2.875% 4/1/32 (b) | 4,430,000 | 3,349,554 | |
| 5.75% 1/15/31 (b) | 770,000 | 728,851 | |
| Crestwood Midstream Partners LP/Crestwood Midstream Finance Corp.: | |||
| 5.75% 4/1/25 | 1,657,000 | 1,607,228 | |
| 7.375% 2/1/31 (b) | 115,000 | 112,024 | |
| CrownRock LP/CrownRock Finance, Inc. 5% 5/1/29 (b) | 40,000 | 36,221 | |
| CVR Energy, Inc.: | |||
| 5.25% 2/15/25 (b) | 330,000 | 316,800 | |
| 5.75% 2/15/28 (b) | 40,000 | 35,502 | |
| DCP Midstream Operating LP: | |||
| 3.875% 3/15/23 | 17,626,000 | 17,613,349 | |
| 5.125% 5/15/29 | 355,000 | 341,713 | |
| 5.375% 7/15/25 | 345,000 | 340,745 | |
| 5.6% 4/1/44 | 3,773,000 | 3,539,036 | |
| 5.625% 7/15/27 | 260,000 | 257,390 | |
| 5.85% 5/21/43 (b)(c) | 16,392,000 | 16,221,523 | |
| Devon Energy Corp. 5.6% 7/15/41 | 1,000,000 | 922,108 | |
| Diamondback Energy, Inc.: | |||
| 3.125% 3/24/31 | 2,905,000 | 2,436,347 | |
| 3.25% 12/1/26 | 4,500,000 | 4,168,791 | |
| 3.5% 12/1/29 | 2,705,000 | 2,387,767 | |
| Ecopetrol SA: | |||
| 6.875% 4/29/30 | 1,534,000 | 1,365,260 | |
| 8.875% 1/13/33 | 1,028,000 | 1,004,870 | |
| EG Global Finance PLC: | |||
| 4.375% 2/7/25 (Reg. S) | EUR | 4,000,000 | 3,696,662 |
| 6.25% 10/30/25 (Reg. S) | EUR | 5,600,000 | 5,229,641 |
| 6.75% 2/7/25 (b) | 220,000 | 198,550 | |
| 8.5% 10/30/25 (b) | 380,000 | 342,135 | |
| Enbridge, Inc.: | |||
| 4% 10/1/23 | 3,799,000 | 3,766,591 | |
| 4.25% 12/1/26 | 1,943,000 | 1,863,316 | |
| Endeavor Energy Resources LP/EER Finance, Inc. 5.75% 1/30/28 (b) | 1,455,000 | 1,404,075 | |
| Energean Israel Finance Ltd.: | |||
| 4.5% 3/30/24 (Reg. S) (b) | 900,000 | 875,250 | |
| 4.875% 3/30/26 (Reg. S) (b) | 1,356,000 | 1,252,605 | |
| 5.375% 3/30/28 (Reg. S) (b) | 1,395,000 | 1,253,756 | |
| Energy Transfer LP: | |||
| 3.75% 5/15/30 | 2,964,000 | 2,629,453 | |
| 3.9% 5/15/24 (c) | 1,210,000 | 1,182,278 | |
| 3.9% 7/15/26 | 955,000 | 901,449 | |
| 4.2% 9/15/23 | 1,452,000 | 1,442,052 | |
| 4.25% 3/15/23 | 1,373,000 | 1,372,537 | |
| 4.5% 4/15/24 | 1,723,000 | 1,700,660 | |
| 4.75% 1/15/26 | 850,000 | 831,724 | |
| 4.95% 6/15/28 | 4,954,000 | 4,784,636 | |
| 5% 5/15/50 | 12,556,000 | 10,288,890 | |
| 5.15% 3/15/45 | 2,260,000 | 1,896,584 | |
| 5.25% 4/15/29 | 2,803,000 | 2,733,703 | |
| 5.3% 4/15/47 | 225,000 | 190,985 | |
| 5.35% 5/15/45 | 2,895,000 | 2,468,752 | |
| 5.4% 10/1/47 | 10,546,000 | 9,066,782 | |
| 5.8% 6/15/38 | 2,762,000 | 2,587,825 | |
| 6% 6/15/48 | 2,369,000 | 2,178,802 | |
| 6.125% 12/15/45 | 2,635,000 | 2,466,413 | |
| 6.25% 4/15/49 | 1,925,000 | 1,830,919 | |
| 6.625% 10/15/36 | 900,000 | 914,993 | |
| EnLink Midstream LLC 5.625% 1/15/28 (b) | 220,000 | 209,550 | |
| Enterprise Products Operating LP: | |||
| 3.125% 7/31/29 | 1,080,000 | 952,256 | |
| 4.85% 3/15/44 | 3,215,000 | 2,855,287 | |
| EOG Resources, Inc. 3.9% 4/1/35 | 205,000 | 180,918 | |
| EQM Midstream Partners LP: | |||
| 6.5% 7/1/27 (b) | 125,000 | 118,386 | |
| 6.5% 7/15/48 | 220,000 | 163,874 | |
| 7.5% 6/1/27 (b) | 290,000 | 284,200 | |
| 7.5% 6/1/30 (b) | 100,000 | 95,272 | |
| EQT Corp.: | |||
| 3.9% 10/1/27 | 180,000 | 164,596 | |
| 5% 1/15/29 | 595,000 | 556,712 | |
| Equinor ASA: | |||
| 3.7% 4/6/50 | 920,000 | 740,783 | |
| 3.95% 5/15/43 | 300,000 | 253,872 | |
| Exxon Mobil Corp. 4.114% 3/1/46 | 805,000 | 687,362 | |
| Galaxy Pipeline Assets BidCo Ltd. 2.16% 3/31/34 | 739,728 | 625,070 | |
| Global Partners LP/GLP Finance Corp. 7% 8/1/27 | 505,000 | 479,750 | |
| Gulfstream Natural Gas System LLC 6.19% 11/1/25 (b) | 3,640,000 | 3,623,362 | |
| Hess Corp.: | |||
| 4.3% 4/1/27 | 1,117,000 | 1,069,211 | |
| 5.6% 2/15/41 | 3,986,000 | 3,723,072 | |
| 5.8% 4/1/47 | 4,517,000 | 4,269,970 | |
| 7.125% 3/15/33 | 1,335,000 | 1,434,537 | |
| 7.3% 8/15/31 | 1,849,000 | 2,007,173 | |
| 7.875% 10/1/29 | 5,583,000 | 6,139,186 | |
| Hess Midstream Partners LP: | |||
| 5.125% 6/15/28 (b) | 110,000 | 100,926 | |
| 5.5% 10/15/30 (b) | 50,000 | 45,000 | |
| 5.625% 2/15/26 (b) | 669,000 | 651,051 | |
| Hilcorp Energy I LP/Hilcorp Finance Co.: | |||
| 6% 4/15/30 (b) | 965,000 | 875,438 | |
| 6.25% 4/15/32 (b) | 950,000 | 861,451 | |
| Holly Energy Partners LP/Holly Energy Finance Corp.: | |||
| 5% 2/1/28 (b) | 375,000 | 340,309 | |
| 6.375% 4/15/27 (b) | 90,000 | 87,275 | |
| KazMunaiGaz National Co.: | |||
| 3.5% 4/14/33 (b) | 1,220,000 | 911,950 | |
| 5.375% 4/24/30 (Reg. S) | 200,000 | 179,600 | |
| Kinder Morgan Energy Partners LP 4.15% 2/1/24 | 425,000 | 419,273 | |
| Magellan Midstream Partners LP: | |||
| 4.2% 10/3/47 | 795,000 | 606,976 | |
| 4.25% 9/15/46 | 190,000 | 146,355 | |
| Marathon Petroleum Corp. 3.8% 4/1/28 | 5,590,000 | 5,162,344 | |
| MEG Energy Corp.: | |||
| 5.875% 2/1/29 (b) | 300,000 | 279,801 | |
| 7.125% 2/1/27 (b) | 220,000 | 223,300 | |
| MPLX LP: | |||
| 2.65% 8/15/30 | 1,925,000 | 1,579,498 | |
| 4.125% 3/1/27 | 505,000 | 481,774 | |
| 4.5% 7/15/23 | 160,000 | 159,430 | |
| 4.5% 4/15/38 | 1,125,000 | 959,865 | |
| 4.7% 4/15/48 | 2,335,000 | 1,876,647 | |
| 4.8% 2/15/29 | 2,965,000 | 2,847,867 | |
| 4.875% 12/1/24 | 2,489,000 | 2,455,014 | |
| 4.95% 3/14/52 | 545,000 | 453,168 | |
| 5.2% 3/1/47 | 3,275,000 | 2,823,252 | |
| 5.5% 2/15/49 | 4,516,000 | 4,054,937 | |
| New Fortress Energy, Inc.: | |||
| 6.5% 9/30/26 (b) | 535,000 | 489,525 | |
| 6.75% 9/15/25 (b) | 540,000 | 506,336 | |
| Occidental Petroleum Corp.: | |||
| 3.5% 8/15/29 | 195,000 | 173,063 | |
| 4.1% 2/15/47 | 265,000 | 198,750 | |
| 4.2% 3/15/48 | 125,000 | 95,625 | |
| 4.3% 8/15/39 | 70,000 | 54,775 | |
| 4.4% 4/15/46 | 200,000 | 153,445 | |
| 4.4% 8/15/49 | 240,000 | 184,800 | |
| 5.55% 3/15/26 | 7,558,000 | 7,516,960 | |
| 6.2% 3/15/40 | 65,000 | 63,375 | |
| 6.45% 9/15/36 | 4,545,000 | 4,567,725 | |
| 6.6% 3/15/46 | 6,475,000 | 6,589,154 | |
| 7.5% 5/1/31 | 8,596,000 | 9,197,720 | |
| 7.875% 9/15/31 | 40,000 | 43,440 | |
| 8.875% 7/15/30 | 145,000 | 164,698 | |
| ONEOK Partners LP 6.65% 10/1/36 | 400,000 | 404,837 | |
| ONEOK, Inc.: | |||
| 3.1% 3/15/30 | 4,385,000 | 3,720,004 | |
| 4.45% 9/1/49 | 8,550,000 | 6,460,571 | |
| 4.95% 7/13/47 | 1,765,000 | 1,450,957 | |
| 5.2% 7/15/48 | 1,375,000 | 1,171,174 | |
| Ovintiv Exploration, Inc. 5.375% 1/1/26 | 310,000 | 307,268 | |
| Ovintiv, Inc.: | |||
| 5.15% 11/15/41 | 3,000,000 | 2,656,989 | |
| 8.125% 9/15/30 | 6,179,000 | 6,768,502 | |
| PBF Holding Co. LLC/PBF Finance Corp. 6% 2/15/28 | 190,000 | 177,238 | |
| Petrobras Global Finance BV 6.25% 12/14/26 | GBP | 800,000 | 942,613 |
| Petroleos Mexicanos: | |||
| 3.75% 2/21/24 (Reg. S) | EUR | 2,300,000 | 2,374,629 |
| 4.75% 2/26/29 (Reg. S) | EUR | 3,400,000 | 2,864,133 |
| 5.35% 2/12/28 | 253,000 | 213,684 | |
| 5.95% 1/28/31 | 2,830,000 | 2,156,602 | |
| 6.5% 3/13/27 | 37,757,000 | 34,185,188 | |
| 6.5% 1/23/29 | 1,190,000 | 1,026,970 | |
| 6.75% 9/21/47 | 12,334,000 | 7,944,329 | |
| 6.84% 1/23/30 | 9,212,000 | 7,654,251 | |
| 7.69% 1/23/50 | 83,106,000 | 58,377,810 | |
| Phillips 66 Co.: | |||
| 2.15% 12/15/30 | 925,000 | 739,146 | |
| 3.75% 3/1/28 (b) | 695,000 | 641,440 | |
| 4.9% 10/1/46 (b) | 750,000 | 661,386 | |
| Pioneer Natural Resources Co.: | |||
| 1.9% 8/15/30 | 1,570,000 | 1,223,555 | |
| 2.15% 1/15/31 | 325,000 | 256,308 | |
| Plains All American Pipeline LP/PAA Finance Corp.: | |||
| 3.55% 12/15/29 | 3,784,000 | 3,281,008 | |
| 3.6% 11/1/24 | 1,877,000 | 1,816,238 | |
| PT Pertamina Persero 3.1% 8/27/30 (b) | 600,000 | 512,316 | |
| Qatar Petroleum: | |||
| 1.375% 9/12/26 (b) | 1,000,000 | 885,920 | |
| 2.25% 7/12/31 (Reg. S) | 620,000 | 507,935 | |
| 3.125% 7/12/41 (b) | 1,145,000 | 865,405 | |
| Rockies Express Pipeline LLC: | |||
| 4.8% 5/15/30 (b) | 1,331,000 | 1,150,831 | |
| 4.95% 7/15/29 (b) | 2,375,000 | 2,066,013 | |
| Sabine Pass Liquefaction LLC 4.5% 5/15/30 | 11,918,000 | 11,164,106 | |
| Santos Finance Ltd. 3.649% 4/29/31 (b) | 4,800,000 | 3,955,833 | |
| Schlumberger Investment SA 3.65% 12/1/23 | 210,000 | 207,447 | |
| Shell International Finance BV 3.25% 5/11/25 | 1,465,000 | 1,410,907 | |
| SM Energy Co. 6.625% 1/15/27 | 300,000 | 285,375 | |
| Southwestern Energy Co. 4.75% 2/1/32 | 1,175,000 | 1,009,713 | |
| Spectra Energy Partners LP 4.75% 3/15/24 | 6,000,000 | 5,947,441 | |
| Suncor Energy, Inc.: | |||
| 3.75% 3/4/51 | 695,000 | 511,061 | |
| 6.8% 5/15/38 | 350,000 | 373,055 | |
| Sunoco LP/Sunoco Finance Corp.: | |||
| 4.5% 5/15/29 | 255,000 | 223,792 | |
| 5.875% 3/15/28 | 55,000 | 52,786 | |
| 6% 4/15/27 | 420,000 | 412,650 | |
| Tallgrass Energy Partners LP / Tallgrass Energy Finance Corp.: | |||
| 6% 12/31/30 (b) | 2,450,000 | 2,112,733 | |
| 6% 9/1/31 (b) | 225,000 | 192,270 | |
| Targa Resources Corp.: | |||
| 4.2% 2/1/33 | 1,275,000 | 1,110,062 | |
| 6.125% 3/15/33 | 1,240,000 | 1,245,516 | |
| 6.5% 2/15/53 | 5,450,000 | 5,358,973 | |
| Targa Resources Partners LP/Targa Resources Partners Finance Corp. 5.5% 3/1/30 | 55,000 | 52,096 | |
| The Williams Companies, Inc.: | |||
| 3.5% 11/15/30 | 10,592,000 | 9,268,972 | |
| 3.75% 6/15/27 | 1,635,000 | 1,536,639 | |
| 4.65% 8/15/32 | 6,660,000 | 6,205,379 | |
| 4.85% 3/1/48 | 100,000 | 85,872 | |
| 4.9% 1/15/45 | 1,460,000 | 1,250,780 | |
| 5.3% 8/15/52 | 1,511,000 | 1,365,170 | |
| Total Capital International SA 2.829% 1/10/30 | 800,000 | 706,173 | |
| Transcontinental Gas Pipe Line Co. LLC: | |||
| 3.25% 5/15/30 | 3,285,000 | 2,860,017 | |
| 4.6% 3/15/48 | 350,000 | 299,431 | |
| TransMontaigne Partners LP 6.125% 2/15/26 | 1,158,000 | 984,273 | |
| Var Energi ASA 5% 5/18/27 (b) | 5,410,000 | 5,090,873 | |
| Venture Global Calcasieu Pass LLC: | |||
| 3.875% 8/15/29 (b) | 340,000 | 293,250 | |
| 3.875% 11/1/33 (b) | 115,000 | 93,771 | |
| 4.125% 8/15/31 (b) | 285,000 | 245,100 | |
| 6.25% 1/15/30 (b) | 160,000 | 157,800 | |
| Western Gas Partners LP: | |||
| 3.95% 6/1/25 | 1,126,000 | 1,069,700 | |
| 4.3% 2/1/30 | 785,000 | 695,465 | |
| 4.65% 7/1/26 | 2,085,000 | 1,980,750 | |
| 4.75% 8/15/28 | 1,465,000 | 1,358,788 | |
| 467,206,853 | |||
TOTAL ENERGY | 470,438,669 | ||
| FINANCIALS - 3.5% | |||
| Banks - 1.7% | |||
| ABN AMRO Bank NV 2.47% 12/13/29 (b)(c) | 3,000,000 | 2,500,340 | |
| AIB Group PLC: | |||
| 1.875% 11/19/29 (Reg. S) (c) | EUR | 1,510,000 | 1,490,835 |
| 2.25% 4/4/28 (Reg. S) (c) | EUR | 1,900,000 | 1,815,307 |
| 2.875% 5/30/31 (Reg. S) (c) | EUR | 400,000 | 383,009 |
| 4.625% 7/23/29 (Reg. S) (c) | EUR | 100,000 | 103,147 |
| Alpha Bank SA 4.25% 2/13/30 (Reg. S) (c) | EUR | 390,000 | 364,695 |
| Banco Santander SA 3.49% 5/28/30 | 1,000,000 | 862,224 | |
| Bank of America Corp.: | |||
| 0.981% 9/25/25 (c) | 746,000 | 692,294 | |
| 1.658% 3/11/27 (c) | 8,135,000 | 7,244,352 | |
| 1.734% 7/22/27 (c) | 13,095,000 | 11,533,830 | |
| 1.922% 10/24/31 (c) | 5,730,000 | 4,441,371 | |
| 2.087% 6/14/29 (c) | 7,865,000 | 6,612,858 | |
| 2.496% 2/13/31 (c) | 15,680,000 | 12,930,130 | |
| 2.572% 10/20/32 (c) | 8,190,000 | 6,520,840 | |
| 2.592% 4/29/31 (c) | 2,295,000 | 1,895,241 | |
| 2.651% 3/11/32 (c) | 16,000,000 | 12,997,192 | |
| 2.676% 6/19/41 (c) | 3,550,000 | 2,431,731 | |
| 2.687% 4/22/32 (c) | 3,965,000 | 3,215,752 | |
| 3.419% 12/20/28 (c) | 10,194,000 | 9,278,415 | |
| 3.5% 4/19/26 | 5,358,000 | 5,105,607 | |
| 3.95% 4/21/25 | 12,493,000 | 12,109,831 | |
| 3.97% 3/5/29 (c) | 10,565,000 | 9,808,937 | |
| 4% 1/22/25 | 43,905,000 | 42,773,208 | |
| 4.078% 4/23/40 (c) | 7,865,000 | 6,611,917 | |
| 4.1% 7/24/23 | 13,989,000 | 13,924,961 | |
| 4.2% 8/26/24 | 2,028,000 | 1,988,781 | |
| 4.25% 10/22/26 | 10,727,000 | 10,302,336 | |
| 4.271% 7/23/29 (c) | 3,660,000 | 3,435,320 | |
| 4.45% 3/3/26 | 2,065,000 | 2,007,672 | |
| Bank of Ireland Group PLC: | |||
| 1.375% 8/11/31 (Reg. S) (c) | EUR | 2,365,000 | 2,149,820 |
| 2.029% 9/30/27 (b)(c) | 1,400,000 | 1,214,825 | |
| Barclays PLC: | |||
| 2.645% 6/24/31 (c) | 2,865,000 | 2,281,454 | |
| 2.667% 3/10/32 (c) | 10,165,000 | 7,899,283 | |
| 2.852% 5/7/26 (c) | 10,143,000 | 9,496,817 | |
| 4.836% 5/9/28 | 6,667,000 | 6,246,813 | |
| 4.972% 5/16/29 (c) | 15,000,000 | 14,284,331 | |
| 5.088% 6/20/30 (c) | 13,438,000 | 12,448,608 | |
| 5.2% 5/12/26 | 1,701,000 | 1,656,389 | |
| 5.262% 1/29/34 (Reg. S) (c) | EUR | 280,000 | 297,308 |
| 5.501% 8/9/28 (c) | 445,000 | 436,074 | |
| 5.746% 8/9/33 (c) | 326,000 | 314,399 | |
| 7.437% 11/2/33 (c) | 2,520,000 | 2,720,694 | |
| 8.407% 11/14/32 (Reg. S) (c) | GBP | 400,000 | 503,661 |
| BNP Paribas SA: | |||
| U.S. Secured Overnight Fin. Rate (SOFR) Index + 1.000% 1.323% 1/13/27 (b)(c)(g) | 9,875,000 | 8,743,367 | |
| 2.159% 9/15/29 (b)(c) | 1,870,000 | 1,546,343 | |
| 2.219% 6/9/26 (b)(c) | 9,163,000 | 8,462,996 | |
| 2.5% 3/31/32 (Reg. S) (c) | EUR | 1,400,000 | 1,315,089 |
| 3.132% 1/20/33 (b)(c) | 3,670,000 | 2,970,758 | |
| 5.125% 1/13/29 (b)(c) | 306,000 | 300,898 | |
| BPCE SA 1.5% 1/13/42 (Reg. S) (c) | EUR | 1,200,000 | 1,068,345 |
| Citigroup, Inc.: | |||
| 3 month U.S. LIBOR + 1.150% 3.52% 10/27/28 (c)(g) | 4,710,000 | 4,310,948 | |
| 0.981% 5/1/25 (c) | 600,000 | 566,642 | |
| 1.462% 6/9/27 (c) | 6,780,000 | 5,926,656 | |
| 2.52% 11/3/32 (c) | 650,000 | 512,909 | |
| 2.561% 5/1/32 (c) | 5,075,000 | 4,075,093 | |
| 2.572% 6/3/31 (c) | 7,655,000 | 6,279,570 | |
| 2.666% 1/29/31 (c) | 16,595,000 | 13,807,925 | |
| 2.904% 11/3/42 (c) | 470,000 | 325,269 | |
| 2.976% 11/5/30 (c) | 240,000 | 204,295 | |
| 3.057% 1/25/33 (c) | 5,014,000 | 4,116,569 | |
| 3.07% 2/24/28 (c) | 1,565,000 | 1,420,303 | |
| 4.075% 4/23/29 (c) | 22,280,000 | 20,739,472 | |
| 4.3% 11/20/26 | 2,129,000 | 2,041,496 | |
| 4.4% 6/10/25 | 17,376,000 | 17,001,302 | |
| 4.412% 3/31/31 (c) | 15,706,000 | 14,599,224 | |
| 4.45% 9/29/27 | 4,630,000 | 4,421,660 | |
| 4.6% 3/9/26 | 3,500,000 | 3,407,876 | |
| 4.65% 7/30/45 | 350,000 | 309,718 | |
| 4.75% 5/18/46 | 10,000,000 | 8,574,833 | |
| 5.5% 9/13/25 | 8,267,000 | 8,282,040 | |
| 6.27% 11/17/33 (c) | 1,050,000 | 1,099,631 | |
| Citizens Financial Group, Inc. 2.638% 9/30/32 | 9,574,000 | 7,293,215 | |
| Commerzbank AG 8.625% 2/28/33 (Reg. S) (c) | GBP | 100,000 | 123,227 |
| Commonwealth Bank of Australia 3.61% 9/12/34 (b)(c) | 3,419,000 | 2,887,372 | |
| Credit Agricole SA: | |||
| 1.25% 10/2/24 (Reg. S) | GBP | 300,000 | 339,615 |
| 4.875% 10/23/29 (Reg. S) | GBP | 200,000 | 235,630 |
| Danske Bank A/S: | |||
| 2.25% 1/14/28 (Reg. S) (c) | GBP | 980,000 | 1,023,298 |
| 4.625% 4/13/27 (Reg. S) (c) | GBP | 300,000 | 353,450 |
| Export-Import Bank of Korea 5.125% 1/11/33 | 515,000 | 526,313 | |
| First Citizens Bank & Trust Co.: | |||
| 3.929% 6/19/24 (c) | 1,375,000 | 1,366,800 | |
| 6.125% 3/9/28 | 4,840,000 | 4,958,137 | |
| HAT Holdings I LLC/HAT Holdings II LLC 3.375% 6/15/26 (b) | 145,000 | 125,788 | |
| HSBC Holdings PLC: | |||
| 0.976% 5/24/25 (c) | 835,000 | 785,473 | |
| 1.589% 5/24/27 (c) | 675,000 | 590,502 | |
| 2.013% 9/22/28 (c) | 5,985,000 | 5,066,396 | |
| 2.099% 6/4/26 (c) | 2,295,000 | 2,111,945 | |
| 2.206% 8/17/29 (c) | 6,795,000 | 5,632,734 | |
| 2.357% 8/18/31 (c) | 818,000 | 645,918 | |
| 2.633% 11/7/25 (c) | 3,000,000 | 2,840,970 | |
| 2.804% 5/24/32 (c) | 4,105,000 | 3,276,844 | |
| 4.041% 3/13/28 (c) | 3,380,000 | 3,155,088 | |
| 4.25% 3/14/24 | 1,872,000 | 1,843,844 | |
| 4.755% 6/9/28 (c) | 2,825,000 | 2,713,571 | |
| 4.95% 3/31/30 | 1,855,000 | 1,787,375 | |
| 5.402% 8/11/33 (c) | 200,000 | 191,686 | |
| 7.39% 11/3/28 (c) | 500,000 | 528,118 | |
| 8.201% 11/16/34 (Reg. S) (c) | GBP | 550,000 | 700,645 |
| ING Groep NV 1.726% 4/1/27 (c) | 5,935,000 | 5,267,995 | |
| Intesa Sanpaolo SpA: | |||
| 5.017% 6/26/24 (b) | 31,005,000 | 29,946,797 | |
| 5.71% 1/15/26 (b) | 10,048,000 | 9,618,067 | |
| Japan Bank International Cooperation 3.25% 7/20/23 | 400,000 | 396,552 | |
| JPMorgan Chase & Co.: | |||
| 1.04% 2/4/27 (c) | 4,000,000 | 3,512,507 | |
| 1.47% 9/22/27 (c) | 4,565,000 | 3,957,492 | |
| 1.578% 4/22/27 (c) | 3,395,000 | 3,003,430 | |
| 1.764% 11/19/31 (c) | 7,517,000 | 5,779,290 | |
| 1.953% 2/4/32 (c) | 503,000 | 390,603 | |
| 2.522% 4/22/31 (c) | 4,525,000 | 3,741,480 | |
| 2.525% 11/19/41 (c) | 22,775,000 | 15,279,818 | |
| 2.545% 11/8/32 (c) | 4,835,000 | 3,865,763 | |
| 2.58% 4/22/32 (c) | 8,934,000 | 7,239,415 | |
| 2.739% 10/15/30 (c) | 9,595,000 | 8,093,355 | |
| 2.947% 2/24/28 (c) | 2,035,000 | 1,845,685 | |
| 2.956% 5/13/31 (c) | 5,386,000 | 4,523,189 | |
| 3.509% 1/23/29 (c) | 6,550,000 | 5,989,782 | |
| 3.54% 5/1/28 (c) | 3,285,000 | 3,037,819 | |
| 3.875% 9/10/24 | 250,000 | 244,034 | |
| 3.882% 7/24/38 (c) | 4,490,000 | 3,742,686 | |
| 4.005% 4/23/29 (c) | 2,290,000 | 2,127,785 | |
| 4.125% 12/15/26 | 4,475,000 | 4,317,751 | |
| Lloyds Bank Corporate Markets PLC: | |||
| 1.5% 6/23/23 (Reg. S) | GBP | 260,000 | 309,144 |
| 1.75% 7/11/24 (Reg. S) | GBP | 275,000 | 315,267 |
| Lloyds Banking Group PLC: | |||
| 1.627% 5/11/27 (c) | 2,000,000 | 1,746,778 | |
| 1.985% 12/15/31 (c) | GBP | 665,000 | 683,387 |
| 3.574% 11/7/28 (c) | 875,000 | 793,469 | |
| 3.87% 7/9/25 (c) | 5,375,000 | 5,235,094 | |
| 4.375% 3/22/28 | 1,365,000 | 1,290,836 | |
| 4.5% 1/11/29 (Reg. S) (c) | EUR | 350,000 | 367,866 |
| 4.976% 8/11/33 (c) | 2,530,000 | 2,356,473 | |
| M&T Bank Corp. 4% 7/15/24 | 40,000 | 39,194 | |
| Mitsubishi UFJ Financial Group, Inc. 5.422% 2/22/29 (c) | 2,350,000 | 2,333,644 | |
| NatWest Group PLC: | |||
| 3.073% 5/22/28 (c) | 5,799,000 | 5,232,141 | |
| 3.619% 3/29/29 (Reg. S) (c) | GBP | 900,000 | 971,005 |
| 3.622% 8/14/30 (Reg. S) (c) | GBP | 1,900,000 | 2,133,238 |
| 4.269% 3/22/25 (c) | 7,301,000 | 7,167,908 | |
| 4.8% 4/5/26 | 15,438,000 | 15,032,232 | |
| 5.125% 5/28/24 | 25,198,000 | 24,991,743 | |
| 7.416% 6/6/33 (Reg. S) (c) | GBP | 450,000 | 551,672 |
| NatWest Markets PLC 2.375% 5/21/23 (b) | 10,828,000 | 10,753,446 | |
| PNC Financial Services Group, Inc.: | |||
| 3.9% 4/29/24 | 375,000 | 368,795 | |
| 5.068% 1/24/34 (c) | 2,410,000 | 2,330,345 | |
| 6.037% 10/28/33 (c) | 2,880,000 | 2,993,011 | |
| Rabobank Nederland: | |||
| 4% 1/10/30 (Reg. S) | EUR | 500,000 | 516,845 |
| 4.375% 8/4/25 | 7,713,000 | 7,471,390 | |
| Santander UK Group Holdings PLC: | |||
| 1.089% 3/15/25 (c) | 6,685,000 | 6,332,272 | |
| 1.673% 6/14/27 (c) | 6,825,000 | 5,958,229 | |
| 4.796% 11/15/24 (c) | 4,025,000 | 3,984,427 | |
| Societe Generale: | |||
| 1.488% 12/14/26 (b)(c) | 9,875,000 | 8,748,860 | |
| 2.797% 1/19/28 (b)(c) | 1,835,000 | 1,628,494 | |
| 2.889% 6/9/32 (b)(c) | 210,000 | 167,192 | |
| 3.337% 1/21/33 (b)(c) | 1,105,000 | 895,128 | |
| 4.25% 4/14/25 (b) | 21,901,000 | 20,997,746 | |
| 4.75% 11/24/25 (b) | 830,000 | 799,738 | |
| 6.691% 1/10/34 (b)(c) | 300,000 | 306,040 | |
| U.S. Bancorp: | |||
| 4.839% 2/1/34 (c) | 3,515,000 | 3,364,770 | |
| 5.85% 10/21/33 (c) | 2,925,000 | 3,015,364 | |
| UniCredit SpA: | |||
| 2.731% 1/15/32 (Reg. S) (c) | EUR | 1,880,000 | 1,707,604 |
| 3.127% 6/3/32 (b)(c) | 2,515,000 | 1,969,144 | |
| Virgin Money UK PLC 5.125% 12/11/30 (Reg. S) (c) | GBP | 600,000 | 679,370 |
| Wells Fargo & Co.: | |||
| 2.125% 12/20/23 (Reg. S) | GBP | 265,000 | 311,129 |
| 2.164% 2/11/26 (c) | 4,775,000 | 4,462,586 | |
| 2.406% 10/30/25 (c) | 5,834,000 | 5,533,624 | |
| 2.572% 2/11/31 (c) | 3,235,000 | 2,692,683 | |
| 2.879% 10/30/30 (c) | 24,150,000 | 20,578,533 | |
| 3.35% 3/2/33 (c) | 9,040,000 | 7,643,351 | |
| 3.526% 3/24/28 (c) | 8,796,000 | 8,145,078 | |
| 3.584% 5/22/28 (c) | 2,010,000 | 1,859,759 | |
| 4.3% 7/22/27 | 21,880,000 | 21,167,289 | |
| 4.478% 4/4/31 (c) | 15,500,000 | 14,578,152 | |
| 4.65% 11/4/44 | 1,335,000 | 1,141,281 | |
| 5.013% 4/4/51 (c) | 3,500,000 | 3,221,138 | |
| Wells Fargo Bank NA 5.25% 8/1/23 (Reg. S) | GBP | 250,000 | 300,430 |
| Westpac Banking Corp. 4.11% 7/24/34 (c) | 4,937,000 | 4,366,221 | |
| 833,329,640 | |||
| Capital Markets - 0.9% | |||
| Affiliated Managers Group, Inc. 4.25% 2/15/24 | 1,847,000 | 1,819,258 | |
| Ares Capital Corp.: | |||
| 3.875% 1/15/26 | 13,816,000 | 12,817,713 | |
| 4.2% 6/10/24 | 12,032,000 | 11,773,683 | |
| AssuredPartners, Inc. 5.625% 1/15/29 (b) | 325,000 | 275,370 | |
| Bank of New York Mellon Corp. 1.6% 4/24/25 | 525,000 | 486,754 | |
| Cboe Global Markets, Inc. 3% 3/16/32 | 3,560,000 | 3,010,233 | |
| Coinbase Global, Inc.: | |||
| 3.375% 10/1/28 (b) | 285,000 | 186,675 | |
| 3.625% 10/1/31 (b) | 295,000 | 177,909 | |
| Credit Suisse Group AG: | |||
| 1.305% 2/2/27 (b)(c) | 8,565,000 | 6,902,012 | |
| 2.125% 10/13/26 (Reg. S) (c) | EUR | 1,400,000 | 1,276,296 |
| 2.125% 11/15/29 (Reg. S) (c) | GBP | 700,000 | 618,615 |
| 2.593% 9/11/25 (b)(c) | 13,060,000 | 11,832,946 | |
| 3.091% 5/14/32 (b)(c) | 19,770,000 | 13,910,876 | |
| 3.75% 3/26/25 | 15,667,000 | 14,311,961 | |
| 4.194% 4/1/31 (b)(c) | 13,355,000 | 10,591,535 | |
| 4.282% 1/9/28 (b) | 1,250,000 | 1,049,432 | |
| 4.55% 4/17/26 | 7,159,000 | 6,395,728 | |
| 6.537% 8/12/33 (b)(c) | 10,990,000 | 9,868,914 | |
| 7.375% 9/7/33 (Reg. S) (c) | GBP | 350,000 | 399,367 |
| 9.016% 11/15/33 (b)(c) | 8,410,000 | 8,831,994 | |
| Deutsche Bank AG: | |||
| 3.25% 5/24/28 (Reg. S) (c) | EUR | 600,000 | 589,467 |
| 4% 6/24/32 (Reg. S) (c) | EUR | 1,300,000 | 1,237,919 |
| 4.5% 4/1/25 | 13,996,000 | 13,495,372 | |
| 6.125% 12/12/30 (Reg. S) (c) | GBP | 1,100,000 | 1,290,454 |
| Deutsche Bank AG New York Branch: | |||
| 6.72% 1/18/29 (c) | 300,000 | 303,178 | |
| 7.079% 2/10/34 (c) | 1,760,000 | 1,715,276 | |
| Goldman Sachs Group, Inc.: | |||
| 1.217% 12/6/23 | 7,855,000 | 7,616,153 | |
| 1.431% 3/9/27 (c) | 15,505,000 | 13,665,947 | |
| 1.948% 10/21/27 (c) | 6,735,000 | 5,899,493 | |
| 1.992% 1/27/32 (c) | 9,600,000 | 7,375,827 | |
| 2.383% 7/21/32 (c) | 14,925,000 | 11,722,395 | |
| 2.64% 2/24/28 (c) | 4,905,000 | 4,383,084 | |
| 2.65% 10/21/32 (c) | 755,000 | 601,988 | |
| 3.814% 4/23/29 (c) | 7,695,000 | 7,063,291 | |
| 4.017% 10/31/38 (c) | 4,495,000 | 3,712,928 | |
| 4.223% 5/1/29 (c) | 3,395,000 | 3,178,319 | |
| 6.75% 10/1/37 | 50,954,000 | 54,237,995 | |
| Hightower Holding LLC 6.75% 4/15/29 (b) | 350,000 | 296,081 | |
| Intercontinental Exchange, Inc.: | |||
| 1.85% 9/15/32 | 3,475,000 | 2,588,128 | |
| 3.75% 12/1/25 | 3,162,000 | 3,045,838 | |
| Jane Street Group LLC/JSG Finance, Inc. 4.5% 11/15/29 (b) | 65,000 | 57,050 | |
| Jefferies Financial Group, Inc.: | |||
| 2.625% 10/15/31 | 5,530,000 | 4,327,871 | |
| 2.75% 10/15/32 | 1,355,000 | 1,049,633 | |
| LPL Holdings, Inc. 4% 3/15/29 (b) | 445,000 | 391,515 | |
| Macquarie Group Ltd.: | |||
| 1.34% 1/12/27 (b)(c) | 5,861,000 | 5,151,643 | |
| 2.871% 1/14/33 (b)(c) | 1,690,000 | 1,339,528 | |
| Morgan Stanley: | |||
| 1.512% 7/20/27 (c) | 10,390,000 | 9,069,644 | |
| 1.794% 2/13/32 (c) | 6,555,000 | 4,988,732 | |
| 1.928% 4/28/32 (c) | 9,690,000 | 7,401,542 | |
| 2.239% 7/21/32 (c) | 6,595,000 | 5,129,939 | |
| 2.484% 9/16/36 (c) | 2,650,000 | 1,976,933 | |
| 2.511% 10/20/32 (c) | 3,820,000 | 3,023,467 | |
| 2.699% 1/22/31 (c) | 30,115,000 | 25,158,291 | |
| 2.943% 1/21/33 (c) | 2,860,000 | 2,340,337 | |
| 3.125% 7/27/26 | 37,616,000 | 35,005,105 | |
| 3.622% 4/1/31 (c) | 13,084,000 | 11,585,505 | |
| 3.7% 10/23/24 | 21,259,000 | 20,709,039 | |
| 3.772% 1/24/29 (c) | 5,345,000 | 4,934,525 | |
| 3.875% 1/27/26 | 540,000 | 520,565 | |
| 4% 7/23/25 | 1,000,000 | 974,486 | |
| 4.35% 9/8/26 | 2,070,000 | 1,990,312 | |
| 4.431% 1/23/30 (c) | 2,525,000 | 2,376,916 | |
| 4.656% 3/2/29 (c) | EUR | 400,000 | 425,104 |
| 5% 11/24/25 | 40,891,000 | 40,467,199 | |
| MSCI, Inc. 3.25% 8/15/33 (b) | 90,000 | 70,968 | |
| Nomura Holdings, Inc.: | |||
| 2.608% 7/14/31 | 1,155,000 | 906,327 | |
| 2.648% 1/16/25 | 1,075,000 | 1,016,720 | |
| State Street Corp. 2.901% 3/30/26 (c) | 833,000 | 793,145 | |
| UBS Group AG: | |||
| 4.988% 8/5/33 (Reg. S) (c) | 200,000 | 187,217 | |
| 5.711% 1/12/27 (b)(c) | 1,455,000 | 1,451,950 | |
| 455,377,612 | |||
| Consumer Finance - 0.5% | |||
| AerCap Ireland Capital Ltd./AerCap Global Aviation Trust: | |||
| 1.65% 10/29/24 | 10,272,000 | 9,529,095 | |
| 2.45% 10/29/26 | 3,749,000 | 3,305,013 | |
| 2.875% 8/14/24 | 7,954,000 | 7,563,359 | |
| 3% 10/29/28 | 11,826,000 | 10,077,083 | |
| 3.3% 1/30/32 | 4,200,000 | 3,360,999 | |
| 4.45% 4/3/26 | 4,282,000 | 4,069,259 | |
| 4.875% 1/16/24 | 6,861,000 | 6,793,564 | |
| 6.5% 7/15/25 | 4,320,000 | 4,334,758 | |
| Ally Financial, Inc.: | |||
| 1.45% 10/2/23 | 2,261,000 | 2,203,729 | |
| 3.05% 6/5/23 | 11,748,000 | 11,668,292 | |
| 3.875% 5/21/24 | 6,322,000 | 6,190,112 | |
| 5.125% 9/30/24 | 2,688,000 | 2,664,509 | |
| 5.8% 5/1/25 | 6,894,000 | 6,898,553 | |
| 7.1% 11/15/27 | 6,180,000 | 6,416,007 | |
| American Express Co. 2.55% 3/4/27 | 3,110,000 | 2,815,201 | |
| Capital One Financial Corp.: | |||
| 1.343% 12/6/24 (c) | 4,720,000 | 4,549,271 | |
| 3.65% 5/11/27 | 15,820,000 | 14,734,088 | |
| 3.8% 1/31/28 | 7,795,000 | 7,217,564 | |
| 4.985% 7/24/26 (c) | 6,500,000 | 6,394,764 | |
| 5.247% 7/26/30 (c) | 6,880,000 | 6,596,986 | |
| Discover Financial Services: | |||
| 3.95% 11/6/24 | 8,102,000 | 7,885,402 | |
| 4.5% 1/30/26 | 6,463,000 | 6,256,521 | |
| 6.7% 11/29/32 | 1,592,000 | 1,644,895 | |
| First Cash Financial Services, Inc. 5.625% 1/1/30 (b) | 1,500,000 | 1,326,809 | |
| Ford Motor Credit Co. LLC: | |||
| 2.9% 2/16/28 | 275,000 | 228,943 | |
| 4% 11/13/30 | 345,000 | 287,540 | |
| 4.063% 11/1/24 | 22,139,000 | 21,285,550 | |
| 4.125% 8/17/27 | 185,000 | 164,827 | |
| 4.271% 1/9/27 | 85,000 | 76,978 | |
| 4.687% 6/9/25 | 180,000 | 172,095 | |
| 5.113% 5/3/29 | 400,000 | 365,640 | |
| 5.125% 6/16/25 | 135,000 | 130,326 | |
| 5.584% 3/18/24 | 8,575,000 | 8,514,975 | |
| 6.86% 6/5/26 | GBP | 640,000 | 769,054 |
| John Deere Capital Corp. 2.65% 6/24/24 | 615,000 | 595,161 | |
| OneMain Finance Corp.: | |||
| 3.875% 9/15/28 | 850,000 | 675,750 | |
| 4% 9/15/30 | 500,000 | 381,894 | |
| 5.375% 11/15/29 | 629,000 | 529,643 | |
| 6.875% 3/15/25 | 1,165,000 | 1,137,309 | |
| Synchrony Financial: | |||
| 3.95% 12/1/27 | 8,719,000 | 7,926,011 | |
| 4.25% 8/15/24 | 6,050,000 | 5,903,869 | |
| 4.375% 3/19/24 | 7,165,000 | 7,065,559 | |
| 5.15% 3/19/29 | 13,451,000 | 12,657,520 | |
| 213,364,477 | |||
| Diversified Financial Services - 0.2% | |||
| 1MDB Global Investments Ltd. 4.4% 3/9/23 | 2,500,000 | 2,480,500 | |
| Altus Midstream LP 5.875% 6/15/30 (b) | 105,000 | 97,042 | |
| Aon Corp. / Aon Global Holdings PLC 2.6% 12/2/31 | 940,000 | 766,076 | |
| Athene Global Funding: | |||
| 1.608% 6/29/26 (b) | 3,350,000 | 2,883,885 | |
| 2.717% 1/7/29 (b) | 4,805,000 | 4,039,304 | |
| 3.205% 3/8/27 (b) | 1,485,000 | 1,327,055 | |
| Blackstone Private Credit Fund: | |||
| 4.875% 4/14/26 | GBP | 1,200,000 | 1,320,903 |
| 7.05% 9/29/25 (b) | 8,015,000 | 8,043,667 | |
| Brixmor Operating Partnership LP: | |||
| 2.5% 8/16/31 | 3,020,000 | 2,347,209 | |
| 4.05% 7/1/30 | 12,288,000 | 10,863,782 | |
| 4.125% 6/15/26 | 5,706,000 | 5,369,956 | |
| 4.125% 5/15/29 | 6,724,000 | 6,056,867 | |
| Corebridge Financial, Inc.: | |||
| 3.85% 4/5/29 (b) | 2,590,000 | 2,339,556 | |
| 3.9% 4/5/32 (b) | 6,908,000 | 6,044,580 | |
| 4.35% 4/5/42 (b) | 701,000 | 577,803 | |
| 4.4% 4/5/52 (b) | 2,074,000 | 1,653,307 | |
| Equitable Holdings, Inc. 3.9% 4/20/23 | 827,000 | 824,837 | |
| Greystone Commercial Capital Trust 1 month U.S. LIBOR + 2.270% 6.8714% 5/31/25 (b)(c)(e)(g) | 7,700,000 | 7,430,500 | |
| Icahn Enterprises LP/Icahn Enterprises Finance Corp.: | |||
| 5.25% 5/15/27 | 140,000 | 130,200 | |
| 6.25% 5/15/26 | 2,209,000 | 2,142,730 | |
| 6.375% 12/15/25 | 205,000 | 202,331 | |
| Indian Railway Finance Corp. Ltd. 3.57% 1/21/32 (b) | 1,010,000 | 854,773 | |
| Jackson Financial, Inc.: | |||
| 5.17% 6/8/27 | 2,958,000 | 2,928,748 | |
| 5.67% 6/8/32 | 3,734,000 | 3,648,104 | |
| Leighton Finance U.S.A. Pty Ltd. 1.5% 5/28/29 (Reg. S) | EUR | 1,145,000 | 957,561 |
| Park Aerospace Holdings Ltd. 5.5% 2/15/24 (b) | 8,593,000 | 8,490,446 | |
| Pine Street Trust I 4.572% 2/15/29 (b) | 7,798,000 | 7,353,950 | |
| Pine Street Trust II 5.568% 2/15/49 (b) | 7,800,000 | 6,949,613 | |
| Power Finance Corp. Ltd.: | |||
| 1.841% 9/21/28 (Reg. S) | EUR | 2,400,000 | 2,046,332 |
| 6.15% 12/6/28 (b) | 3,050,000 | 3,049,695 | |
| VMED O2 UK Financing I PLC 4.25% 1/31/31 (b) | 495,000 | 397,169 | |
| 103,618,481 | |||
| Insurance - 0.2% | |||
| ACE INA Holdings, Inc. 3.15% 3/15/25 | 1,765,000 | 1,695,744 | |
| AIA Group Ltd. 0.88% 9/9/33 (Reg. S) (c) | EUR | 395,000 | 331,619 |
| Alliant Holdings Intermediate LLC: | |||
| 4.25% 10/15/27 (b) | 340,000 | 300,131 | |
| 6.75% 10/15/27 (b) | 325,000 | 295,354 | |
| Aon Corp. 2.8% 5/15/30 | 3,670,000 | 3,132,792 | |
| Arch Capital Finance LLC 4.011% 12/15/26 | 4,745,000 | 4,577,704 | |
| Arthur J. Gallagher & Co. 3.05% 3/9/52 | 3,030,000 | 1,957,158 | |
| Baylor Scott & White Holdings: | |||
| Series 2021, 2.839% 11/15/50 | 120,000 | 80,921 | |
| 1.777% 11/15/30 | 870,000 | 672,722 | |
| Berkshire Hathaway Finance Corp. 3.85% 3/15/52 | 4,245,000 | 3,427,144 | |
| CNA Financial Corp.: | |||
| 3.9% 5/1/29 | 1,400,000 | 1,285,051 | |
| 3.95% 5/15/24 | 1,400,000 | 1,375,489 | |
| Credit Agricole Assurances SA 4.75% 9/27/48 (c) | EUR | 1,200,000 | 1,231,163 |
| Demeter Investments BV 5.625% 8/15/52 (Reg. S) (c) | 3,225,000 | 3,096,806 | |
| Everest Reinsurance Holdings, Inc. 3.5% 10/15/50 | 2,100,000 | 1,479,673 | |
| Fairfax Financial Holdings Ltd.: | |||
| 3.375% 3/3/31 | 4,595,000 | 3,766,882 | |
| 5.625% 8/16/32 (b) | 6,100,000 | 5,798,796 | |
| Farmers Exchange Capital II 6.151% 11/1/53 (b)(c) | 1,500,000 | 1,472,097 | |
| Farmers Exchange Capital III 5.454% 10/15/54 (b)(c) | 3,335,000 | 3,054,975 | |
| Fidelidade-Companhia de Seguros SA 4.25% 9/4/31 (Reg. S) (c) | EUR | 500,000 | 460,782 |
| Five Corners Funding Trust II 2.85% 5/15/30 (b) | 12,846,000 | 10,849,701 | |
| Liberty Mutual Group, Inc. 4.569% 2/1/29 (b) | 9,380,000 | 8,875,520 | |
| Lincoln National Corp.: | |||
| 3.05% 1/15/30 | 280,000 | 236,156 | |
| 3.4% 1/15/31 | 315,000 | 265,756 | |
| 6.3% 10/9/37 | 110,000 | 109,890 | |
| Markel Corp.: | |||
| 3.45% 5/7/52 | 840,000 | 575,645 | |
| 4.15% 9/17/50 | 445,000 | 344,624 | |
| 4.3% 11/1/47 | 900,000 | 716,231 | |
| Marsh & McLennan Companies, Inc.: | |||
| 2.25% 11/15/30 | 1,940,000 | 1,573,837 | |
| 3.5% 6/3/24 | 1,140,000 | 1,111,834 | |
| Metropolitan Life Global Funding I 4.3% 8/25/29 (b) | 7,000,000 | 6,640,603 | |
| Nationwide Mutual Insurance Co. 3 month U.S. LIBOR + 2.290% 7.059% 12/15/24 (b)(c)(g) | 5,490,000 | 5,490,213 | |
| New York Life Insurance Co. 3.75% 5/15/50 (b) | 2,630,000 | 2,069,143 | |
| Pricoa Global Funding I 5.375% 5/15/45 (c) | 5,278,000 | 5,123,249 | |
| Protective Life Global Funding 1.9% 7/6/28 (b) | 2,595,000 | 2,162,615 | |
| Prudential PLC 2.95% 11/3/33 (Reg. S) (c) | 2,100,000 | 1,760,325 | |
| QBE Insurance Group Ltd.: | |||
| 2.5% 9/13/38 (Reg. S) (c) | GBP | 950,000 | 883,388 |
| 6.75% 12/2/44 (Reg. S) (c) | 2,025,000 | 1,999,688 | |
| Ryan Specialty Group LLC 4.375% 2/1/30 (b) | 165,000 | 141,069 | |
| Swiss Re Finance Luxembourg SA 5% 4/2/49 (b)(c) | 3,200,000 | 3,040,000 | |
| Teachers Insurance & Annuity Association of America: | |||
| 3.3% 5/15/50 (b) | 3,310,000 | 2,368,930 | |
| 4.375% 9/15/54 (b)(c) | 2,100,000 | 2,017,686 | |
| The Chubb Corp. 6% 5/11/37 | 130,000 | 139,508 | |
| Unum Group: | |||
| 4% 6/15/29 | 5,961,000 | 5,455,510 | |
| 4.125% 6/15/51 | 1,330,000 | 953,102 | |
| 5.75% 8/15/42 | 2,238,000 | 2,096,211 | |
| Willis Group North America, Inc. 2.95% 9/15/29 | 4,385,000 | 3,745,803 | |
| Zurich Finance (Ireland) DAC 3.5% 5/2/52 (Reg. S) (c) | 900,000 | 710,586 | |
| 110,949,826 | |||
| Thrifts & Mortgage Finance - 0.0% | |||
| Nationstar Mortgage Holdings, Inc. 6% 1/15/27 (b) | 500,000 | 460,000 | |
| Nationwide Building Society: | |||
| 3.766% 3/8/24 (b)(c) | 1,970,000 | 1,969,593 | |
| 4.363% 8/1/24 (b)(c) | 2,510,000 | 2,490,889 | |
| 6.178% 12/7/27 (Reg. S) (c) | GBP | 400,000 | 489,836 |
| PennyMac Financial Services, Inc. 4.25% 2/15/29 (b) | 1,200,000 | 939,176 | |
| 6,349,494 | |||
TOTAL FINANCIALS | 1,722,989,530 | ||
| HEALTH CARE - 0.8% | |||
| Biotechnology - 0.2% | |||
| AbbVie, Inc.: | |||
| 4.05% 11/21/39 | 18,245,000 | 15,389,152 | |
| 4.55% 3/15/35 | 400,000 | 372,002 | |
| 4.7% 5/14/45 | 5,975,000 | 5,289,576 | |
| 4.875% 11/14/48 | 335,000 | 307,074 | |
| Amgen, Inc.: | |||
| 2.6% 8/19/26 | 3,835,000 | 3,523,061 | |
| 2.8% 8/15/41 | 2,130,000 | 1,463,981 | |
| 4.4% 5/1/45 | 1,450,000 | 1,212,557 | |
| 5.15% 3/2/28 (h) | 3,800,000 | 3,784,965 | |
| 5.25% 3/2/30 (h) | 7,794,000 | 7,755,983 | |
| 5.25% 3/2/33 (h) | 7,076,000 | 7,026,701 | |
| 5.6% 3/2/43 (h) | 11,335,000 | 11,193,690 | |
| 5.65% 3/2/53 (h) | 5,009,000 | 4,967,769 | |
| 5.75% 3/2/63 (h) | 3,370,000 | 3,323,503 | |
| Emergent BioSolutions, Inc. 3.875% 8/15/28 (b) | 494,000 | 298,870 | |
| Gilead Sciences, Inc. 4.5% 2/1/45 | 565,000 | 498,219 | |
| Grifols Escrow Issuer SA 4.75% 10/15/28 (b) | 2,692,000 | 2,301,660 | |
| 68,708,763 | |||
| Health Care Equipment & Supplies - 0.0% | |||
| Alcon Finance Corp.: | |||
| 2.6% 5/27/30 (b) | 2,185,000 | 1,836,482 | |
| 3% 9/23/29 (b) | 4,500,000 | 3,922,628 | |
| Avantor Funding, Inc.: | |||
| 3.875% 7/15/28 (Reg. S) | EUR | 2,500,000 | 2,414,068 |
| 4.625% 7/15/28 (b) | 380,000 | 349,600 | |
| Becton, Dickinson & Co.: | |||
| 2.823% 5/20/30 | 1,695,000 | 1,449,955 | |
| 3.7% 6/6/27 | 118,000 | 111,424 | |
| 3.734% 12/15/24 | 1,734,000 | 1,685,491 | |
| Dentsply Sirona, Inc. 3.25% 6/1/30 | 3,000,000 | 2,555,729 | |
| Hologic, Inc. 3.25% 2/15/29 (b) | 225,000 | 194,018 | |
| Mozart Borrower LP: | |||
| 3.875% 4/1/29 (b) | 2,100,000 | 1,750,298 | |
| 5.25% 10/1/29 (b) | 425,000 | 348,791 | |
| Stryker Corp.: | |||
| 3.375% 5/15/24 | 535,000 | 522,141 | |
| 3.375% 11/1/25 | 430,000 | 410,870 | |
| 3.5% 3/15/26 | 775,000 | 740,853 | |
| Teleflex, Inc. 4.25% 6/1/28 (b) | 60,000 | 54,155 | |
| 18,346,503 | |||
| Health Care Providers & Services - 0.4% | |||
| 180 Medical, Inc. 3.875% 10/15/29 (b) | 500,000 | 435,345 | |
| AHS Hospital Corp. 2.78% 7/1/51 | 315,000 | 204,806 | |
| AmerisourceBergen Corp. 2.7% 3/15/31 | 5,980,000 | 4,970,386 | |
| Ascension Health: | |||
| 2.532% 11/15/29 | 295,000 | 253,197 | |
| 3.106% 11/15/39 | 610,000 | 477,559 | |
| BayCare Health System, Inc. 3.831% 11/15/50 | 2,320,000 | 1,884,200 | |
| Centene Corp.: | |||
| 2.45% 7/15/28 | 7,280,000 | 6,100,786 | |
| 2.625% 8/1/31 | 2,980,000 | 2,322,054 | |
| 3% 10/15/30 | 7,638,000 | 6,227,629 | |
| 3.375% 2/15/30 | 5,670,000 | 4,784,229 | |
| 4.25% 12/15/27 | 8,825,000 | 8,154,741 | |
| 4.625% 12/15/29 | 7,750,000 | 7,087,320 | |
| Children's Health System of Texas 2.511% 8/15/50 | 360,000 | 223,369 | |
| Childrens Hospital Corp. 4.115% 1/1/47 | 265,000 | 230,703 | |
| Cigna Group: | |||
| 2.4% 3/15/30 | 4,245,000 | 3,547,536 | |
| 3.25% 4/15/25 | 355,000 | 341,023 | |
| 3.4% 3/15/51 | 1,250,000 | 876,759 | |
| 4.375% 10/15/28 | 14,599,000 | 14,018,026 | |
| 4.5% 2/25/26 | 3,865,000 | 3,776,874 | |
| CommonSpirit Health: | |||
| 2.76% 10/1/24 | 575,000 | 551,911 | |
| 2.782% 10/1/30 | 695,000 | 582,129 | |
| 3.347% 10/1/29 | 890,000 | 772,333 | |
| 4.35% 11/1/42 | 2,500,000 | 2,107,701 | |
| Community Health Systems, Inc.: | |||
| 4.75% 2/15/31 (b) | 560,000 | 432,600 | |
| 6.875% 4/15/29 (b) | 140,000 | 97,916 | |
| CVS Health Corp.: | |||
| 2.7% 8/21/40 | 9,385,000 | 6,340,111 | |
| 3.625% 4/1/27 | 2,341,000 | 2,201,413 | |
| 4.78% 3/25/38 | 1,320,000 | 1,199,138 | |
| 5.05% 3/25/48 | 8,960,000 | 8,041,602 | |
| 5.125% 2/21/30 | 1,265,000 | 1,242,134 | |
| 5.125% 7/20/45 | 1,965,000 | 1,774,566 | |
| 5.3% 12/5/43 | 1,405,000 | 1,309,694 | |
| DaVita HealthCare Partners, Inc.: | |||
| 3.75% 2/15/31 (b) | 1,900,000 | 1,434,692 | |
| 4.625% 6/1/30 (b) | 125,000 | 103,021 | |
| Elevance Health, Inc.: | |||
| 3.65% 12/1/27 | 1,260,000 | 1,181,865 | |
| 4.101% 3/1/28 | 1,570,000 | 1,498,435 | |
| 4.625% 5/15/42 | 1,770,000 | 1,596,622 | |
| Fresenius Medical Care U.S. Finance III, Inc. 1.875% 12/1/26 (b) | 660,000 | 564,712 | |
| HCA Holdings, Inc.: | |||
| 2.375% 7/15/31 | 1,040,000 | 809,797 | |
| 3.125% 3/15/27 (b) | 1,050,000 | 955,462 | |
| 3.5% 9/1/30 | 2,575,000 | 2,213,998 | |
| 3.625% 3/15/32 (b) | 2,095,000 | 1,770,984 | |
| 4.125% 6/15/29 | 5,911,000 | 5,380,574 | |
| 4.625% 3/15/52 (b) | 565,000 | 444,507 | |
| 5.25% 4/15/25 | 1,000,000 | 990,163 | |
| 5.25% 6/15/49 | 5,250,000 | 4,528,135 | |
| 5.375% 2/1/25 | 305,000 | 302,104 | |
| 5.375% 9/1/26 | 875,000 | 862,247 | |
| 5.5% 6/15/47 | 1,315,000 | 1,182,605 | |
| 5.625% 9/1/28 | 2,000,000 | 1,977,643 | |
| 5.875% 2/15/26 | 1,135,000 | 1,134,110 | |
| 7.75% 7/15/36 | 2,700,000 | 2,938,143 | |
| HealthEquity, Inc. 4.5% 10/1/29 (b) | 45,000 | 39,330 | |
| Humana, Inc.: | |||
| 3.125% 8/15/29 | 2,600,000 | 2,267,678 | |
| 3.7% 3/23/29 | 2,425,000 | 2,200,080 | |
| Kaiser Foundation Hospitals: | |||
| 2.81% 6/1/41 | 6,820,000 | 5,002,056 | |
| 3.002% 6/1/51 | 975,000 | 677,809 | |
| 4.15% 5/1/47 | 200,000 | 175,949 | |
| Laboratory Corp. of America Holdings 3.6% 2/1/25 | 1,410,000 | 1,359,882 | |
| Memorial Sloan-Kettring Cancer Center: | |||
| 2.955% 1/1/50 | 290,000 | 199,386 | |
| 4.2% 7/1/55 | 140,000 | 119,678 | |
| 5% 7/1/42 | 350,000 | 346,496 | |
| Methodist Hospital 2.705% 12/1/50 | 820,000 | 531,026 | |
| Molina Healthcare, Inc.: | |||
| 3.875% 11/15/30 (b) | 6,245,000 | 5,261,127 | |
| 3.875% 5/15/32 (b) | 155,000 | 127,257 | |
| Mount Sinai Hospital 3.737% 7/1/49 | 460,000 | 362,753 | |
| New York & Presbyterian Hospital: | |||
| 4.024% 8/1/45 | 600,000 | 512,984 | |
| 4.063% 8/1/56 | 390,000 | 326,848 | |
| NYU Hospitals Center 4.368% 7/1/47 | 810,000 | 706,848 | |
| OhioHealth Corp. 2.297% 11/15/31 | 8,505,000 | 6,895,513 | |
| Owens & Minor, Inc. 4.5% 3/31/29 (b) | 65,000 | 49,888 | |
| PeaceHealth Obligated Group 1.375% 11/15/25 | 165,000 | 147,655 | |
| Pediatrix Medical Group, Inc. 5.375% 2/15/30 (b) | 170,000 | 149,971 | |
| Piedmont Healthcare, Inc.: | |||
| 2.719% 1/1/42 | 1,780,000 | 1,227,672 | |
| 2.864% 1/1/52 | 1,055,000 | 688,677 | |
| Prime Healthcare Services 7.25% 11/1/25 (b) | 1,325,000 | 1,199,125 | |
| Providence St. Joseph Health Obligated Group: | |||
| 2.532% 10/1/29 | 2,405,000 | 2,046,236 | |
| 2.746% 10/1/26 | 180,000 | 165,867 | |
| Quest Diagnostics, Inc.: | |||
| 4.7% 3/30/45 | 150,000 | 127,482 | |
| 5.75% 1/30/40 | 93,000 | 89,367 | |
| RP Escrow Issuer LLC 5.25% 12/15/25 (b) | 325,000 | 253,975 | |
| Sabra Health Care LP 3.2% 12/1/31 | 8,499,000 | 6,314,550 | |
| Sentara Healthcare 2.927% 11/1/51 | 565,000 | 383,615 | |
| Stanford Health Care 3.027% 8/15/51 | 680,000 | 475,713 | |
| Surgery Center Holdings, Inc. 6.75% 7/1/25 (b) | 108,000 | 106,596 | |
| Sutter Health 4.091% 8/15/48 | 1,240,000 | 1,023,213 | |
| Tenet Healthcare Corp.: | |||
| 4.25% 6/1/29 | 1,075,000 | 941,378 | |
| 4.625% 7/15/24 | 99,000 | 97,391 | |
| 4.875% 1/1/26 | 1,160,000 | 1,104,768 | |
| 5.125% 11/1/27 | 3,775,000 | 3,548,991 | |
| 6.125% 6/15/30 (b) | 175,000 | 166,685 | |
| Toledo Hospital 5.325% 11/15/28 | 2,792,000 | 2,301,446 | |
| UnitedHealth Group, Inc.: | |||
| 3.05% 5/15/41 | 2,030,000 | 1,525,374 | |
| 3.25% 5/15/51 | 3,405,000 | 2,438,573 | |
| 4.25% 4/15/47 | 770,000 | 667,087 | |
| 4.25% 6/15/48 | 575,000 | 497,621 | |
| 4.95% 5/15/62 | 275,000 | 258,827 | |
| 5.8% 3/15/36 | 820,000 | 858,395 | |
| 180,408,447 | |||
| Health Care Technology - 0.0% | |||
| IQVIA, Inc. 5% 10/15/26 (b) | 230,000 | 219,650 | |
| Life Sciences Tools & Services - 0.0% | |||
| Agilent Technologies, Inc. 2.3% 3/12/31 | 1,245,000 | 1,011,348 | |
| Charles River Laboratories International, Inc.: | |||
| 3.75% 3/15/29 (b) | 75,000 | 65,115 | |
| 4.25% 5/1/28 (b) | 330,000 | 297,729 | |
| Danaher Corp. 2.8% 12/10/51 | 1,065,000 | 704,129 | |
| Thermo Fisher Scientific, Inc. 2.8% 10/15/41 | 620,000 | 447,423 | |
| 2,525,744 | |||
| Pharmaceuticals - 0.2% | |||
| AstraZeneca Finance LLC 2.25% 5/28/31 | 635,000 | 528,672 | |
| Bausch Health Companies, Inc.: | |||
| 5% 2/15/29 (b) | 400,000 | 172,221 | |
| 5.25% 1/30/30 (b) | 825,000 | 355,860 | |
| 5.25% 2/15/31 (b) | 4,796,000 | 2,141,462 | |
| 6.25% 2/15/29 (b) | 1,500,000 | 658,881 | |
| Bayer U.S. Finance II LLC: | |||
| 4.25% 12/15/25 (b) | 54,704,000 | 52,909,457 | |
| 4.375% 12/15/28 (b) | 1,630,000 | 1,532,381 | |
| 4.4% 7/15/44 (b) | 3,231,000 | 2,584,435 | |
| 4.625% 6/25/38 (b) | 570,000 | 496,584 | |
| 4.875% 6/25/48 (b) | 4,430,000 | 3,844,351 | |
| Bristol-Myers Squibb Co. 4.25% 10/26/49 | 345,000 | 297,889 | |
| Catalent Pharma Solutions: | |||
| 3.125% 2/15/29 (b) | 275,000 | 237,369 | |
| 3.5% 4/1/30 (b) | 220,000 | 191,077 | |
| Elanco Animal Health, Inc.: | |||
| 5.772% 8/28/23 | 4,020,000 | 4,005,285 | |
| 6.4% 8/28/28 (c) | 1,693,000 | 1,616,595 | |
| GSK Consumer Healthcare Capital U.S. LLC 3.625% 3/24/32 | 1,305,000 | 1,139,897 | |
| Jazz Securities DAC 4.375% 1/15/29 (b) | 95,000 | 84,137 | |
| Johnson & Johnson 3.625% 3/3/37 | 695,000 | 613,794 | |
| Merck & Co., Inc. 3.4% 3/7/29 | 1,400,000 | 1,299,265 | |
| Mylan NV: | |||
| 5.2% 4/15/48 | 1,415,000 | 1,080,680 | |
| 5.4% 11/29/43 | 1,480,000 | 1,198,112 | |
| Organon & Co. / Organon Foreign Debt Co-Issuer BV: | |||
| 4.125% 4/30/28 (b) | 65,000 | 57,376 | |
| 5.125% 4/30/31 (b) | 1,210,000 | 1,026,988 | |
| Takeda Pharmaceutical Co. Ltd.: | |||
| 2.05% 3/31/30 | 3,100,000 | 2,527,741 | |
| 3.025% 7/9/40 | 1,610,000 | 1,179,322 | |
| Utah Acquisition Sub, Inc.: | |||
| 3.95% 6/15/26 | 4,024,000 | 3,763,177 | |
| 5.25% 6/15/46 | 190,000 | 147,839 | |
| Viatris, Inc.: | |||
| 1.65% 6/22/25 | 1,160,000 | 1,055,914 | |
| 2.3% 6/22/27 | 120,000 | 103,650 | |
| 2.7% 6/22/30 | 5,898,000 | 4,675,768 | |
| 3.85% 6/22/40 | 13,139,000 | 8,961,382 | |
| 4% 6/22/50 | 6,222,000 | 4,013,295 | |
| Wyeth LLC 6.45% 2/1/24 | 1,875,000 | 1,891,463 | |
| 106,392,319 | |||
TOTAL HEALTH CARE | 376,601,426 | ||
| INDUSTRIALS - 0.4% | |||
| Aerospace & Defense - 0.1% | |||
| BAE Systems PLC 3.4% 4/15/30 (b) | 2,985,000 | 2,658,222 | |
| Bombardier, Inc.: | |||
| 6% 2/15/28 (b) | 3,750,000 | 3,513,525 | |
| 7.125% 6/15/26 (b) | 2,780,000 | 2,731,100 | |
| 7.875% 4/15/27 (b) | 4,360,000 | 4,335,286 | |
| BWX Technologies, Inc.: | |||
| 4.125% 6/30/28 (b) | 200,000 | 178,425 | |
| 4.125% 4/15/29 (b) | 325,000 | 283,563 | |
| General Dynamics Corp. 3.25% 4/1/25 | 955,000 | 919,691 | |
| Howmet Aerospace, Inc.: | |||
| 5.95% 2/1/37 | 575,000 | 563,454 | |
| 6.75% 1/15/28 | 345,000 | 352,335 | |
| Moog, Inc. 4.25% 12/15/27 (b) | 360,000 | 329,403 | |
| Northrop Grumman Corp. 4.75% 6/1/43 | 545,000 | 498,649 | |
| Raytheon Technologies Corp. 4.125% 11/16/28 | 490,000 | 466,400 | |
| Rolls-Royce PLC: | |||
| 3.375% 6/18/26 | GBP | 1,085,000 | 1,178,681 |
| 5.75% 10/15/27 (b) | 165,000 | 159,278 | |
| Textron, Inc. 2.45% 3/15/31 | 3,245,000 | 2,655,660 | |
| The Boeing Co.: | |||
| 1.433% 2/4/24 | 1,000,000 | 961,634 | |
| 2.196% 2/4/26 | 5,665,000 | 5,145,803 | |
| 2.25% 6/15/26 | 810,000 | 730,320 | |
| 3.6% 5/1/34 | 2,400,000 | 1,941,004 | |
| 3.625% 2/1/31 | 12,650,000 | 11,088,017 | |
| 4.875% 5/1/25 | 2,035,000 | 2,006,512 | |
| 5.04% 5/1/27 | 4,430,000 | 4,363,355 | |
| 5.15% 5/1/30 | 4,430,000 | 4,286,761 | |
| 5.805% 5/1/50 | 7,210,000 | 6,858,342 | |
| 5.93% 5/1/60 | 4,430,000 | 4,136,818 | |
| TransDigm, Inc.: | |||
| 4.875% 5/1/29 | 220,000 | 188,657 | |
| 6.25% 3/15/26 (b) | 915,000 | 902,872 | |
| 6.75% 8/15/28 (b) | 1,250,000 | 1,243,750 | |
| 7.5% 3/15/27 | 40,000 | 39,500 | |
| 8% 12/15/25 (b) | 465,000 | 475,230 | |
| 65,192,247 | |||
| Air Freight & Logistics - 0.0% | |||
| Cargo Aircraft Management, Inc. 4.75% 2/1/28 (b) | 160,000 | 138,400 | |
| Rand Parent LLC 8.5% 2/15/30 (b) | 215,000 | 206,423 | |
| 344,823 | |||
| Airlines - 0.0% | |||
| American Airlines, Inc.: | |||
| equipment trust certificate 3.2% 12/15/29 | 388,530 | 346,552 | |
| 7.25% 2/15/28 (b) | 80,000 | 78,256 | |
| Mexico City Airport Trust: | |||
| 4.25% 10/31/26 (b) | 4,270,000 | 3,971,901 | |
| 5.5% 7/31/47 (b) | 2,250,000 | 1,669,028 | |
| Southwest Airlines Co.: | |||
| 2.625% 2/10/30 | 735,000 | 612,222 | |
| 5.125% 6/15/27 | 5,340,000 | 5,263,412 | |
| United Airlines pass-thru Trust Series 2013-1A Class O, 4.3% 2/15/27 | 118,527 | 113,283 | |
| United Airlines, Inc.: | |||
| equipment trust certificate 4.15% 10/11/25 | 455,221 | 446,101 | |
| 4.375% 4/15/26 (b) | 1,740,000 | 1,637,652 | |
| 4.625% 4/15/29 (b) | 370,000 | 328,018 | |
| 14,466,425 | |||
| Building Products - 0.0% | |||
| Advanced Drain Systems, Inc. 5% 9/30/27 (b) | 500,000 | 465,150 | |
| Builders FirstSource, Inc. 4.25% 2/1/32 (b) | 360,000 | 302,229 | |
| Carlisle Companies, Inc. 2.2% 3/1/32 | 1,890,000 | 1,433,514 | |
| Owens Corning: | |||
| 3.95% 8/15/29 | 700,000 | 642,759 | |
| 4.3% 7/15/47 | 5,310,000 | 4,240,339 | |
| Standard Industries, Inc./New Jersey 4.75% 1/15/28 (b) | 3,618,000 | 3,250,606 | |
| 10,334,597 | |||
| Commercial Services & Supplies - 0.0% | |||
| ADT Corp.: | |||
| 4.125% 8/1/29 (b) | 115,000 | 98,955 | |
| 4.875% 7/15/32 (b) | 615,000 | 527,429 | |
| Advocate Health & Hospitals Corp. 3.387% 10/15/49 | 510,000 | 375,862 | |
| Allied Universal Holdco LLC / Allied Universal Finance Corp.: | |||
| 6% 6/1/29 (b) | 1,175,000 | 875,344 | |
| 6.625% 7/15/26 (b) | 1,500,000 | 1,424,640 | |
| Atlas Luxco 4 SARL / Allied Universal Holdco LLC / Allied Universal Finance Corp.: | |||
| 4.625% 6/1/28 (b) | 830,000 | 690,269 | |
| 4.625% 6/1/28 (b) | 520,000 | 426,705 | |
| Cintas Corp. No. 2 3.7% 4/1/27 | 1,035,000 | 988,012 | |
| Clean Harbors, Inc. 6.375% 2/1/31 (b) | 45,000 | 44,680 | |
| Legends Hospitality Holding Co. LLC/Legends Hospitality Co-Issuer, Inc. 5% 2/1/26 (b) | 60,000 | 54,600 | |
| Madison IAQ LLC 4.125% 6/30/28 (b) | 605,000 | 516,126 | |
| Neptune BidCo U.S., Inc. 9.29% 4/15/29 (b) | 210,000 | 198,534 | |
| Pitney Bowes, Inc.: | |||
| 6.875% 3/15/27 (b) | 55,000 | 45,925 | |
| 7.25% 3/15/29 (b) | 110,000 | 85,525 | |
| PowerTeam Services LLC 9.033% 12/4/25 (b) | 1,108,000 | 952,880 | |
| Stericycle, Inc. 3.875% 1/15/29 (b) | 530,000 | 454,346 | |
| Waste Pro U.S.A., Inc. 5.5% 2/15/26 (b) | 2,436,000 | 2,227,186 | |
| 9,987,018 | |||
| Construction & Engineering - 0.0% | |||
| AECOM 5.125% 3/15/27 | 1,105,000 | 1,056,740 | |
| Arcosa, Inc. 4.375% 4/15/29 (b) | 65,000 | 56,796 | |
| Dycom Industries, Inc. 4.5% 4/15/29 (b) | 165,000 | 144,627 | |
| 1,258,163 | |||
| Electrical Equipment - 0.0% | |||
| Eaton Corp. 4.7% 8/23/52 | 595,000 | 540,964 | |
| Sensata Technologies BV 4% 4/15/29 (b) | 170,000 | 149,935 | |
| Vertiv Group Corp. 4.125% 11/15/28 (b) | 280,000 | 243,261 | |
| Wesco Distribution, Inc.: | |||
| 7.125% 6/15/25 (b) | 1,500,000 | 1,513,598 | |
| 7.25% 6/15/28 (b) | 1,250,000 | 1,266,693 | |
| 3,714,451 | |||
| Machinery - 0.1% | |||
| Chart Industries, Inc. 7.5% 1/1/30 (b) | 425,000 | 431,375 | |
| Flowserve Corp. 2.8% 1/15/32 | 405,000 | 311,908 | |
| Fortive Corp. 3.15% 6/15/26 | 275,000 | 256,643 | |
| OT Merger Corp. 7.875% 10/15/29 (b) | 1,000,000 | 600,360 | |
| Pentair Finance SA 4.5% 7/1/29 | 8,070,000 | 7,362,036 | |
| Westinghouse Air Brake Tech Co.: | |||
| 3.45% 11/15/26 | 1,490,000 | 1,376,518 | |
| 4.95% 9/15/28 | 9,085,000 | 8,767,179 | |
| 19,106,019 | |||
| Marine - 0.0% | |||
| Seaspan Corp. 5.5% 8/1/29 (b) | 115,000 | 86,543 | |
| Professional Services - 0.0% | |||
| ASGN, Inc. 4.625% 5/15/28 (b) | 110,000 | 99,410 | |
| Booz Allen Hamilton, Inc.: | |||
| 3.875% 9/1/28 (b) | 320,000 | 284,077 | |
| 4% 7/1/29 (b) | 45,000 | 39,477 | |
| Equifax, Inc.: | |||
| 2.35% 9/15/31 | 725,000 | 571,411 | |
| 2.6% 12/1/24 | 2,095,000 | 1,991,950 | |
| TriNet Group, Inc. 3.5% 3/1/29 (b) | 165,000 | 137,775 | |
| 3,124,100 | |||
| Road & Rail - 0.0% | |||
| Alpha Trains Finance SA 2.064% 6/30/30 | EUR | 950,000 | 936,051 |
| CSX Corp. 6.15% 5/1/37 | 1,475,000 | 1,556,897 | |
| Transnet Ltd. 8.25% 2/6/28 (b) | 260,000 | 260,650 | |
| Union Pacific Corp.: | |||
| 2.973% 9/16/62 | 200,000 | 125,497 | |
| 3.6% 9/15/37 | 1,015,000 | 855,760 | |
| 3.799% 4/6/71 | 315,000 | 230,376 | |
| XPO, Inc. 6.25% 5/1/25 (b) | 154,000 | 154,077 | |
| 4,119,308 | |||
| Trading Companies & Distributors - 0.1% | |||
| Air Lease Corp.: | |||
| 3% 9/15/23 | 800,000 | 789,637 | |
| 3.375% 7/1/25 | 7,608,000 | 7,173,522 | |
| 4.25% 2/1/24 | 7,846,000 | 7,735,068 | |
| 4.25% 9/15/24 | 9,907,000 | 9,704,984 | |
| 5.85% 12/15/27 | 970,000 | 965,416 | |
| Travis Perkins PLC 3.75% 2/17/26 (Reg. S) | GBP | 600,000 | 650,694 |
| United Rentals North America, Inc.: | |||
| 3.75% 1/15/32 | 825,000 | 692,410 | |
| 3.875% 2/15/31 | 200,000 | 171,179 | |
| 4.875% 1/15/28 | 2,000,000 | 1,906,400 | |
| 29,789,310 | |||
| Transportation Infrastructure - 0.1% | |||
| Avolon Holdings Funding Ltd.: | |||
| 2.528% 11/18/27 (b) | 8,455,000 | 7,044,931 | |
| 2.75% 2/21/28 (b) | 2,730,000 | 2,279,459 | |
| 3.95% 7/1/24 (b) | 2,862,000 | 2,767,471 | |
| 4.375% 5/1/26 (b) | 3,477,000 | 3,234,600 | |
| 5.25% 5/15/24 (b) | 4,140,000 | 4,074,032 | |
| Heathrow Funding Ltd. 2.625% 3/16/28 (Reg. S) | GBP | 1,985,000 | 1,984,425 |
| Holding d'Infrastructures et des Metiers de l'Environnement 0.625% 9/16/28 (Reg. S) | EUR | 300,000 | 254,495 |
| 21,639,413 | |||
TOTAL INDUSTRIALS | 183,162,417 | ||
| INFORMATION TECHNOLOGY - 0.3% | |||
| Communications Equipment - 0.0% | |||
| Viavi Solutions, Inc. 3.75% 10/1/29 (b) | 230,000 | 191,981 | |
| Electronic Equipment & Components - 0.0% | |||
| Coherent Corp. 5% 12/15/29 (b) | 505,000 | 442,431 | |
| Dell International LLC/EMC Corp.: | |||
| 5.45% 6/15/23 | 1,627,000 | 1,625,859 | |
| 6.02% 6/15/26 | 2,112,000 | 2,137,999 | |
| Sensata Technologies, Inc. 3.75% 2/15/31 (b) | 590,000 | 491,837 | |
| TD SYNNEX Corp. 1.75% 8/9/26 | 6,930,000 | 5,962,936 | |
| Teledyne Technologies, Inc.: | |||
| 2.25% 4/1/28 | 1,675,000 | 1,447,977 | |
| 2.75% 4/1/31 | 4,505,000 | 3,685,428 | |
| TTM Technologies, Inc. 4% 3/1/29 (b) | 130,000 | 107,238 | |
| 15,901,705 | |||
| IT Services - 0.1% | |||
| Automatic Data Processing, Inc. 1.7% 5/15/28 | 695,000 | 600,782 | |
| Block, Inc. 2.75% 6/1/26 | 110,000 | 98,151 | |
| Fidelity National Information Services, Inc. 3.1% 3/1/41 | 3,540,000 | 2,440,913 | |
| Fiserv, Inc.: | |||
| 2.75% 7/1/24 | 105,000 | 101,097 | |
| 3.5% 7/1/29 | 7,395,000 | 6,612,478 | |
| 3.85% 6/1/25 | 1,540,000 | 1,482,717 | |
| 5.45% 3/2/28 | 1,260,000 | 1,258,251 | |
| 5.6% 3/2/33 | 4,750,000 | 4,741,511 | |
| Gartner, Inc.: | |||
| 3.625% 6/15/29 (b) | 65,000 | 56,207 | |
| 3.75% 10/1/30 (b) | 105,000 | 88,898 | |
| 4.5% 7/1/28 (b) | 165,000 | 151,474 | |
| Genpact Luxembourg SARL / Genpact U.S.A., Inc. 1.75% 4/10/26 | 960,000 | 856,878 | |
| Global Payments, Inc.: | |||
| 2.15% 1/15/27 | 45,000 | 39,434 | |
| 4.45% 6/1/28 | 3,135,000 | 2,927,531 | |
| Go Daddy Operating Co. LLC / GD Finance Co., Inc. 3.5% 3/1/29 (b) | 330,000 | 276,467 | |
| IBM Corp. 2.85% 5/15/40 | 480,000 | 343,064 | |
| Tempo Acquisition LLC 5.75% 6/1/25 (b) | 5,000,000 | 4,950,000 | |
| Twilio, Inc.: | |||
| 3.625% 3/15/29 | 80,000 | 67,205 | |
| 3.875% 3/15/31 | 85,000 | 69,594 | |
| Virtusa Corp. 7.125% 12/15/28 (b) | 60,000 | 49,829 | |
| 27,212,481 | |||
| Semiconductors & Semiconductor Equipment - 0.1% | |||
| Broadcom, Inc.: | |||
| 1.95% 2/15/28 (b) | 1,620,000 | 1,372,951 | |
| 2.45% 2/15/31 (b) | 12,454,000 | 9,868,423 | |
| 2.6% 2/15/33 (b) | 14,104,000 | 10,659,553 | |
| 3.137% 11/15/35 (b) | 1,763,000 | 1,299,644 | |
| 3.419% 4/15/33 (b) | 6,657,000 | 5,359,534 | |
| 3.469% 4/15/34 (b) | 1,000,000 | 791,471 | |
| 3.5% 2/15/41 (b) | 19,586,000 | 14,016,002 | |
| 3.75% 2/15/51 (b) | 5,224,000 | 3,641,255 | |
| 4% 4/15/29 (b) | 1,410,000 | 1,276,972 | |
| 4.926% 5/15/37 (b) | 2,410,000 | 2,096,288 | |
| Entegris Escrow Corp. 5.95% 6/15/30 (b) | 200,000 | 186,019 | |
| Entegris, Inc.: | |||
| 3.625% 5/1/29 (b) | 275,000 | 228,030 | |
| 4.375% 4/15/28 (b) | 325,000 | 287,581 | |
| Intel Corp.: | |||
| 5.625% 2/10/43 | 385,000 | 375,770 | |
| 5.7% 2/10/53 | 860,000 | 840,371 | |
| 5.9% 2/10/63 | 2,375,000 | 2,337,534 | |
| onsemi 3.875% 9/1/28 (b) | 125,000 | 109,855 | |
| Qorvo, Inc. 4.375% 10/15/29 | 290,000 | 258,590 | |
| Teledyne FLIR LLC 2.5% 8/1/30 | 445,000 | 362,167 | |
| 55,368,010 | |||
| Software - 0.1% | |||
| Central Parent, Inc./Central Merger Sub, Inc. 7.25% 6/15/29 (b) | 135,000 | 132,006 | |
| Crowdstrike Holdings, Inc. 3% 2/15/29 | 125,000 | 105,284 | |
| Fair Isaac Corp. 4% 6/15/28 (b) | 500,000 | 454,080 | |
| Gen Digital, Inc.: | |||
| 5% 4/15/25 (b) | 370,000 | 359,403 | |
| 6.75% 9/30/27 (b) | 539,000 | 529,809 | |
| Intuit, Inc. 1.35% 7/15/27 | 200,000 | 173,267 | |
| Microsoft Corp. 2.921% 3/17/52 | 3,352,000 | 2,411,529 | |
| MicroStrategy, Inc. 6.125% 6/15/28 (b) | 170,000 | 141,100 | |
| NCR Corp.: | |||
| 5.125% 4/15/29 (b) | 800,000 | 683,218 | |
| 5.25% 10/1/30 (b) | 1,690,000 | 1,397,228 | |
| Open Text Corp.: | |||
| 3.875% 2/15/28 (b) | 490,000 | 422,478 | |
| 3.875% 12/1/29 (b) | 370,000 | 298,653 | |
| 6.9% 12/1/27 (b) | 500,000 | 505,000 | |
| Oracle Corp.: | |||
| 2.5% 4/1/25 | 6,499,000 | 6,127,440 | |
| 2.8% 4/1/27 | 9,449,000 | 8,570,564 | |
| 2.95% 5/15/25 | 1,185,000 | 1,123,621 | |
| 3.6% 4/1/40 | 2,400,000 | 1,771,625 | |
| 3.6% 4/1/50 | 2,010,000 | 1,361,332 | |
| 3.65% 3/25/41 | 1,278,000 | 941,103 | |
| 3.8% 11/15/37 | 1,225,000 | 969,968 | |
| 3.85% 4/1/60 | 6,500,000 | 4,332,531 | |
| 3.95% 3/25/51 | 3,199,000 | 2,297,788 | |
| 4.125% 5/15/45 | 3,870,000 | 2,911,306 | |
| 5.55% 2/6/53 | 4,690,000 | 4,297,595 | |
| 6.9% 11/9/52 | 3,165,000 | 3,418,058 | |
| ServiceNow, Inc. 1.4% 9/1/30 | 1,005,000 | 765,560 | |
| SS&C Technologies, Inc. 5.5% 9/30/27 (b) | 775,000 | 729,282 | |
| Workday, Inc.: | |||
| 3.5% 4/1/27 | 405,000 | 378,288 | |
| 3.7% 4/1/29 | 1,110,000 | 1,013,658 | |
| 48,622,774 | |||
| Technology Hardware, Storage & Peripherals - 0.0% | |||
| Apple, Inc.: | |||
| 3.25% 2/23/26 | 7,485,000 | 7,159,340 | |
| 3.85% 8/4/46 | 1,570,000 | 1,327,211 | |
| 8,486,551 | |||
TOTAL INFORMATION TECHNOLOGY | 155,783,502 | ||
| MATERIALS - 0.2% | |||
| Chemicals - 0.1% | |||
| Axalta Coating Systems/Dutch Holding BV 4.75% 6/15/27 (b) | 240,000 | 221,347 | |
| FMC Corp. 4.5% 10/1/49 | 1,495,000 | 1,207,269 | |
| INEOS Quattro Finance 2 PLC 3.375% 1/15/26 (b) | 275,000 | 241,868 | |
| International Flavors & Fragrances, Inc.: | |||
| 1.23% 10/1/25 (b) | 3,285,000 | 2,909,486 | |
| 2.3% 11/1/30 (b) | 3,950,000 | 3,049,821 | |
| Invictus U.S. Newco LLC 5% 10/30/29 (b) | 350,000 | 278,446 | |
| LSB Industries, Inc. 6.25% 10/15/28 (b) | 235,000 | 213,923 | |
| LYB International Finance BV: | |||
| 4.875% 3/15/44 | 1,000,000 | 846,817 | |
| 5.25% 7/15/43 | 5,455,000 | 4,824,719 | |
| LYB International Finance III LLC 3.375% 10/1/40 | 590,000 | 423,656 | |
| Methanex Corp.: | |||
| 5.125% 10/15/27 | 320,000 | 300,778 | |
| 5.25% 12/15/29 | 155,000 | 142,147 | |
| 5.65% 12/1/44 | 105,000 | 85,575 | |
| NOVA Chemicals Corp. 5% 5/1/25 (b) | 1,080,000 | 1,029,438 | |
| Nufarm Australia Ltd. 5% 1/27/30 (b) | 280,000 | 244,441 | |
| Nutrien Ltd. 4.9% 6/1/43 | 1,325,000 | 1,179,367 | |
| OCI NV 3.625% 10/15/25 (Reg. S) | EUR | 2,773,800 | 2,868,013 |
| Olin Corp.: | |||
| 5% 2/1/30 | 195,000 | 177,441 | |
| 5.125% 9/15/27 | 700,000 | 665,364 | |
| 5.625% 8/1/29 | 195,000 | 185,775 | |
| Sasol Financing U.S.A. LLC: | |||
| 4.375% 9/18/26 | 810,000 | 727,777 | |
| 5.875% 3/27/24 | 1,500,000 | 1,478,550 | |
| Sherwin-Williams Co. 4.5% 6/1/47 | 210,000 | 175,958 | |
| SPCM SA 3.125% 3/15/27 (b) | 115,000 | 99,142 | |
| The Chemours Co. LLC 4.625% 11/15/29 (b) | 530,000 | 430,132 | |
| The Dow Chemical Co. 4.625% 10/1/44 | 395,000 | 340,189 | |
| The Scotts Miracle-Gro Co.: | |||
| 4% 4/1/31 | 1,575,000 | 1,260,000 | |
| 4.375% 2/1/32 | 625,000 | 510,266 | |
| 4.5% 10/15/29 | 1,346,000 | 1,166,309 | |
| Valvoline, Inc.: | |||
| 3.625% 6/15/31 (b) | 700,000 | 563,711 | |
| 4.25% 2/15/30 (b) | 2,270,000 | 2,218,437 | |
| W.R. Grace Holding LLC: | |||
| 4.875% 6/15/27 (b) | 125,000 | 114,861 | |
| 5.625% 10/1/24 (b) | 400,000 | 399,880 | |
| 7.375% 3/1/31 (b) | 40,000 | 39,709 | |
| 30,620,612 | |||
| Construction Materials - 0.0% | |||
| Martin Marietta Materials, Inc.: | |||
| 2.4% 7/15/31 | 1,455,000 | 1,160,777 | |
| 2.5% 3/15/30 | 855,000 | 706,972 | |
| Vulcan Materials Co. 4.5% 6/15/47 | 350,000 | 299,308 | |
| 2,167,057 | |||
| Containers & Packaging - 0.0% | |||
| Ardagh Metal Packaging Finance U.S.A. LLC/Ardagh Metal Packaging Finance PLC 6% 6/15/27 (b) | 200,000 | 193,548 | |
| Ardagh Packaging Finance PLC/Ardagh MP Holdings U.S.A., Inc.: | |||
| 4.125% 8/15/26 (b) | 10,000 | 9,100 | |
| 5.25% 8/15/27 (b) | 1,750,000 | 1,436,645 | |
| 5.25% 8/15/27 (b) | 1,960,000 | 1,609,042 | |
| Ball Corp. 3.125% 9/15/31 | 395,000 | 316,332 | |
| Berry Global, Inc.: | |||
| 0.95% 2/15/24 | 965,000 | 921,267 | |
| 1.57% 1/15/26 | 1,675,000 | 1,493,092 | |
| 4.875% 7/15/26 (b) | 7,055,000 | 6,755,163 | |
| BWAY Holding Co. 7.875% 8/15/26 (b) | 200,000 | 201,250 | |
| Graphic Packaging International, Inc.: | |||
| 3.75% 2/1/30 (b) | 295,000 | 251,399 | |
| 4.125% 8/15/24 | 3,137,000 | 3,066,763 | |
| Intelligent Packaging Ltd. Finco, Inc. 6% 9/15/28 (b) | 40,000 | 34,692 | |
| Reynolds Group Issuer, Inc./Reynolds Group Issuer LLC/Reynolds Group Issuer (Luxembourg) SA 4% 10/15/27 (b) | 1,250,000 | 1,090,438 | |
| Sealed Air Corp.: | |||
| 1.573% 10/15/26 (b) | 2,750,000 | 2,369,492 | |
| 6.125% 2/1/28 (b) | 340,000 | 334,883 | |
| 6.875% 7/15/33 (b) | 210,000 | 213,738 | |
| Trivium Packaging Finance BV 5.5% 8/15/26 (b) | 1,458,000 | 1,377,810 | |
| 21,674,654 | |||
| Metals & Mining - 0.1% | |||
| Alcoa Nederland Holding BV 4.125% 3/31/29 (b) | 110,000 | 97,699 | |
| Barrick North America Finance LLC: | |||
| 5.7% 5/30/41 | 2,830,000 | 2,818,590 | |
| 5.75% 5/1/43 | 475,000 | 477,902 | |
| Barrick PD Australia Finance Pty Ltd. 5.95% 10/15/39 | 1,340,000 | 1,381,165 | |
| Cleveland-Cliffs, Inc.: | |||
| 4.625% 3/1/29 (b) | 110,000 | 100,220 | |
| 4.875% 3/1/31 (b) | 110,000 | 100,132 | |
| Commercial Metals Co. 3.875% 2/15/31 | 235,000 | 198,282 | |
| Compass Minerals International, Inc. 6.75% 12/1/27 (b) | 120,000 | 113,163 | |
| First Quantum Minerals Ltd. 6.5% 3/1/24 (b) | 200,000 | 198,000 | |
| FMG Resources Pty Ltd. 4.5% 9/15/27 (b) | 5,000 | 4,600 | |
| Freeport-McMoRan, Inc.: | |||
| 4.125% 3/1/28 | 960,000 | 890,314 | |
| 4.375% 8/1/28 | 2,590,000 | 2,404,072 | |
| 5.25% 9/1/29 | 3,190,000 | 3,081,444 | |
| 5.4% 11/14/34 | 570,000 | 536,515 | |
| HudBay Minerals, Inc. 4.5% 4/1/26 (b) | 55,000 | 49,381 | |
| Kaiser Aluminum Corp. 4.625% 3/1/28 (b) | 415,000 | 357,412 | |
| Kinross Gold Corp. 4.5% 7/15/27 | 9,290,000 | 8,875,983 | |
| Mineral Resources Ltd. 8% 11/1/27 (b) | 150,000 | 149,250 | |
| Newmont Corp.: | |||
| 2.25% 10/1/30 | 3,612,000 | 2,908,531 | |
| 2.8% 10/1/29 | 3,095,000 | 2,633,590 | |
| 5.45% 6/9/44 | 185,000 | 177,712 | |
| Novelis Corp. 3.875% 8/15/31 (b) | 115,000 | 93,167 | |
| Nucor Corp. 4.3% 5/23/27 | 1,320,000 | 1,279,205 | |
| PMHC II, Inc. 9% 2/15/30 (b) | 175,000 | 135,573 | |
| PT Freeport Indonesia 4.763% 4/14/27 (b) | 200,000 | 191,913 | |
| PT Indonesia Asahan Aluminium Tbk 6.53% 11/15/28 (b) | 1,950,000 | 2,000,944 | |
| Roller Bearing Co. of America, Inc. 4.375% 10/15/29 (b) | 30,000 | 25,931 | |
| Southern Copper Corp. 5.875% 4/23/45 | 455,000 | 457,218 | |
| Steel Dynamics, Inc.: | |||
| 2.4% 6/15/25 | 790,000 | 736,169 | |
| 3.45% 4/15/30 | 9,595,000 | 8,507,704 | |
| Teck Resources Ltd. 6% 8/15/40 | 1,193,000 | 1,158,589 | |
| Thyssenkrupp AG 1.875% 3/6/23 (Reg. S) | EUR | 2,650,000 | 2,796,335 |
| Vale Overseas Ltd. 6.25% 8/10/26 | 700,000 | 711,944 | |
| 45,648,649 | |||
| Paper & Forest Products - 0.0% | |||
| Celulosa Arauco y Constitucion SA 4.5% 8/1/24 | 1,850,000 | 1,811,034 | |
| Clearwater Paper Corp. 4.75% 8/15/28 (b) | 1,500,000 | 1,311,674 | |
| Glatfelter Corp. 4.75% 11/15/29 (b) | 90,000 | 59,011 | |
| Suzano Austria GmbH 6% 1/15/29 | 1,263,000 | 1,236,793 | |
| 4,418,512 | |||
TOTAL MATERIALS | 104,529,484 | ||
| REAL ESTATE - 0.7% | |||
| Equity Real Estate Investment Trusts (REITs) - 0.6% | |||
| Alexandria Real Estate Equities, Inc.: | |||
| 4.75% 4/15/35 | 940,000 | 888,696 | |
| 4.9% 12/15/30 | 5,395,000 | 5,230,909 | |
| American Assets Trust LP 3.375% 2/1/31 | 3,370,000 | 2,666,156 | |
| American Homes 4 Rent LP: | |||
| 2.375% 7/15/31 | 704,000 | 553,480 | |
| 3.375% 7/15/51 | 1,089,000 | 707,842 | |
| 3.625% 4/15/32 | 6,405,000 | 5,411,188 | |
| 4.3% 4/15/52 | 2,500,000 | 1,915,967 | |
| American Tower Corp. 5.65% 3/15/33 | 3,500,000 | 3,455,690 | |
| Boston Properties, Inc. 4.5% 12/1/28 | 5,210,000 | 4,834,842 | |
| Corporate Office Properties LP: | |||
| 2% 1/15/29 | 600,000 | 461,870 | |
| 2.25% 3/15/26 | 1,775,000 | 1,582,947 | |
| 2.75% 4/15/31 | 6,209,000 | 4,674,881 | |
| 2.9% 12/1/33 | 490,000 | 345,850 | |
| CubeSmart LP 2.25% 12/15/28 | 4,235,000 | 3,538,288 | |
| GLP Capital LP/GLP Financing II, Inc.: | |||
| 3.25% 1/15/32 | 2,890,000 | 2,295,636 | |
| 4% 1/15/30 | 830,000 | 726,909 | |
| 5.25% 6/1/25 | 200,000 | 195,801 | |
| 5.375% 4/15/26 | 12,390,000 | 12,083,100 | |
| Healthcare Trust of America Holdings LP: | |||
| 2.05% 3/15/31 | 265,000 | 196,212 | |
| 3.1% 2/15/30 | 3,195,000 | 2,721,287 | |
| 3.5% 8/1/26 | 2,311,000 | 2,148,280 | |
| 3.625% 1/15/28 | 1,367,000 | 1,229,526 | |
| 3.875% 5/1/25 | 2,215,000 | 2,102,304 | |
| Healthpeak Properties, Inc. 3% 1/15/30 | 1,625,000 | 1,398,860 | |
| Hudson Pacific Properties LP: | |||
| 3.25% 1/15/30 | 1,775,000 | 1,337,298 | |
| 4.65% 4/1/29 | 12,773,000 | 10,850,438 | |
| Invitation Homes Operating Partnership LP: | |||
| 2% 8/15/31 | 1,125,000 | 843,860 | |
| 4.15% 4/15/32 | 6,675,000 | 5,871,789 | |
| Iron Mountain, Inc. 4.875% 9/15/27 (b) | 170,000 | 156,475 | |
| Kilroy Realty LP 2.65% 11/15/33 | 2,010,000 | 1,378,992 | |
| Kimco Realty Op LLC: | |||
| 1.9% 3/1/28 | 3,540,000 | 2,988,037 | |
| 3.2% 4/1/32 | 1,340,000 | 1,119,027 | |
| 4.6% 2/1/33 | 3,535,000 | 3,248,855 | |
| Kite Realty Group Trust: | |||
| 4% 3/15/25 | 6,865,000 | 6,504,948 | |
| 4.75% 9/15/30 | 10,799,000 | 9,665,740 | |
| Life Storage LP: | |||
| 2.2% 10/15/30 | 3,660,000 | 2,918,377 | |
| 2.4% 10/15/31 | 645,000 | 510,483 | |
| LXP Industrial Trust (REIT): | |||
| 2.7% 9/15/30 | 894,000 | 715,275 | |
| 4.4% 6/15/24 | 1,319,000 | 1,277,790 | |
| MPT Operating Partnership LP/MPT Finance Corp.: | |||
| 2.5% 3/24/26 | GBP | 4,400,000 | 4,128,181 |
| 3.5% 3/15/31 | 370,000 | 253,620 | |
| 5% 10/15/27 | 2,650,000 | 2,175,197 | |
| Omega Healthcare Investors, Inc.: | |||
| 3.25% 4/15/33 | 5,977,000 | 4,272,387 | |
| 3.375% 2/1/31 | 3,399,000 | 2,678,468 | |
| 3.625% 10/1/29 | 7,647,000 | 6,341,503 | |
| 4.375% 8/1/23 | 1,368,000 | 1,360,003 | |
| 4.5% 1/15/25 | 2,793,000 | 2,724,094 | |
| 4.5% 4/1/27 | 1,500,000 | 1,416,276 | |
| 4.75% 1/15/28 | 7,569,000 | 7,099,242 | |
| 4.95% 4/1/24 | 1,152,000 | 1,132,330 | |
| 5.25% 1/15/26 | 5,841,000 | 5,725,834 | |
| Physicians Realty LP 2.625% 11/1/31 | 1,940,000 | 1,549,078 | |
| Piedmont Operating Partnership LP 2.75% 4/1/32 | 1,374,000 | 968,565 | |
| Prologis LP 3.25% 6/30/26 | 805,000 | 761,851 | |
| Realty Income Corp.: | |||
| 2.2% 6/15/28 | 791,000 | 682,841 | |
| 2.85% 12/15/32 | 1,553,000 | 1,275,580 | |
| 3.1% 12/15/29 | 6,235,000 | 5,477,780 | |
| 3.25% 1/15/31 | 1,177,000 | 1,025,881 | |
| 3.4% 1/15/28 | 5,340,000 | 4,946,471 | |
| Retail Opportunity Investments Partnership LP: | |||
| 4% 12/15/24 | 877,000 | 846,652 | |
| 5% 12/15/23 | 626,000 | 620,829 | |
| SBA Communications Corp.: | |||
| 3.125% 2/1/29 | 220,000 | 181,654 | |
| 3.875% 2/15/27 | 400,000 | 361,998 | |
| Senior Housing Properties Trust: | |||
| 4.375% 3/1/31 | 350,000 | 242,608 | |
| 4.75% 5/1/24 | 275,000 | 246,008 | |
| 4.75% 2/15/28 | 2,917,000 | 1,897,624 | |
| 9.75% 6/15/25 | 250,000 | 242,248 | |
| Service Properties Trust: | |||
| 4.375% 2/15/30 | 200,000 | 152,820 | |
| 4.95% 10/1/29 | 100,000 | 78,883 | |
| 5.5% 12/15/27 | 100,000 | 90,121 | |
| Simon Property Group LP: | |||
| 1.75% 2/1/28 | 1,805,000 | 1,543,115 | |
| 2.45% 9/13/29 | 1,395,000 | 1,168,402 | |
| 3.375% 10/1/24 | 2,945,000 | 2,853,478 | |
| 3.5% 9/1/25 | 55,000 | 52,734 | |
| 3.75% 2/1/24 | 375,000 | 369,073 | |
| SITE Centers Corp.: | |||
| 3.625% 2/1/25 | 2,396,000 | 2,273,446 | |
| 4.25% 2/1/26 | 5,582,000 | 5,289,702 | |
| Spirit Realty LP 2.7% 2/15/32 | 7,905,000 | 6,044,343 | |
| Store Capital Corp.: | |||
| 2.75% 11/18/30 | 1,957,000 | 1,478,071 | |
| 4.625% 3/15/29 | 2,475,000 | 2,183,906 | |
| Sun Communities Operating LP: | |||
| 2.3% 11/1/28 | 1,550,000 | 1,310,440 | |
| 2.7% 7/15/31 | 4,027,000 | 3,212,673 | |
| Uniti Group LP / Uniti Group Finance, Inc. 4.75% 4/15/28 (b) | 585,000 | 463,730 | |
| Uniti Group, Inc. 7.875% 2/15/25 (b) | 2,800,000 | 2,854,395 | |
| Ventas Realty LP: | |||
| 3% 1/15/30 | 10,008,000 | 8,506,722 | |
| 3.85% 4/1/27 | 1,850,000 | 1,750,494 | |
| 4% 3/1/28 | 2,712,000 | 2,505,315 | |
| 4.125% 1/15/26 | 1,628,000 | 1,566,992 | |
| 4.75% 11/15/30 | 13,000,000 | 12,254,816 | |
| VICI Properties LP: | |||
| 4.375% 5/15/25 | 749,000 | 720,830 | |
| 4.75% 2/15/28 | 6,736,000 | 6,354,271 | |
| 4.95% 2/15/30 | 6,670,000 | 6,227,164 | |
| 5.125% 5/15/32 | 5,086,000 | 4,719,045 | |
| 5.625% 5/15/52 | 798,000 | 706,906 | |
| VICI Properties LP / VICI Note Co.: | |||
| 3.5% 2/15/25 (b) | 125,000 | 118,077 | |
| 3.75% 2/15/27 (b) | 680,000 | 615,721 | |
| 3.875% 2/15/29 (b) | 1,540,000 | 1,339,093 | |
| 4.125% 8/15/30 (b) | 535,000 | 462,124 | |
| 4.25% 12/1/26 (b) | 670,000 | 621,325 | |
| 4.5% 9/1/26 (b) | 1,325,000 | 1,236,200 | |
| 4.5% 1/15/28 (b) | 539,000 | 495,521 | |
| 4.625% 6/15/25 (b) | 315,000 | 302,294 | |
| 5.625% 5/1/24 (b) | 1,185,000 | 1,176,492 | |
| 5.75% 2/1/27 (b) | 355,000 | 346,305 | |
| Vornado Realty LP: | |||
| 2.15% 6/1/26 | 1,762,000 | 1,509,674 | |
| 3.4% 6/1/31 | 6,373,000 | 4,846,665 | |
| Welltower Op: | |||
| 2.7% 2/15/27 | 1,090,000 | 983,588 | |
| 2.75% 1/15/31 | 6,560,000 | 5,342,927 | |
| 2.8% 6/1/31 | 2,305,000 | 1,866,537 | |
| Weyerhaeuser Co. 4% 4/15/30 | 2,150,000 | 1,954,461 | |
| WP Carey, Inc.: | |||
| 2.25% 4/1/33 | 3,815,000 | 2,870,970 | |
| 2.4% 2/1/31 | 2,070,000 | 1,668,806 | |
| 3.85% 7/15/29 | 1,725,000 | 1,568,724 | |
| 4% 2/1/25 | 5,544,000 | 5,408,182 | |
| 4.6% 4/1/24 | 7,436,000 | 7,341,513 | |
| 290,195,794 | |||
| Real Estate Management & Development - 0.1% | |||
| ACCENTRO Real Estate AG 5.625% 2/13/26 (Reg. S) | EUR | 815,000 | 513,767 |
| ADLER Group SA: | |||
| 1.875% 1/14/26 (Reg. S) | EUR | 300,000 | 136,380 |
| 2.25% 4/27/27 (Reg. S) | EUR | 3,100,000 | 1,377,125 |
| Akelius Residential Property AB 3.875% 10/5/78 (Reg. S) (c) | EUR | 361,000 | 368,458 |
| Blackstone Property Partners Europe LP: | |||
| 1% 5/4/28 (Reg. S) | EUR | 2,355,000 | 1,844,718 |
| 2.625% 10/20/28 (Reg. S) | GBP | 350,000 | 326,017 |
| Brandywine Operating Partnership LP: | |||
| 3.95% 11/15/27 | 5,608,000 | 4,731,003 | |
| 4.1% 10/1/24 | 4,892,000 | 4,704,652 | |
| 4.55% 10/1/29 | 1,707,000 | 1,414,777 | |
| 7.55% 3/15/28 | 6,570,000 | 6,441,413 | |
| CBRE Group, Inc. 4.875% 3/1/26 | 12,670,000 | 12,397,242 | |
| Essex Portfolio LP: | |||
| 1.7% 3/1/28 | 515,000 | 430,177 | |
| 3.875% 5/1/24 | 2,685,000 | 2,624,924 | |
| Extra Space Storage LP: | |||
| 2.35% 3/15/32 | 4,011,000 | 3,071,325 | |
| 3.9% 4/1/29 | 610,000 | 553,193 | |
| GTC Aurora Luxembourg SA 2.25% 6/23/26 (Reg. S) | EUR | 775,000 | 641,070 |
| Heimstaden AB 4.375% 3/6/27 (Reg. S) | EUR | 800,000 | 610,027 |
| Host Hotels & Resorts LP 2.9% 12/15/31 | 840,000 | 646,181 | |
| Howard Hughes Corp.: | |||
| 4.125% 2/1/29 (b) | 300,000 | 251,250 | |
| 4.375% 2/1/31 (b) | 385,000 | 313,698 | |
| 5.375% 8/1/28 (b) | 850,000 | 770,313 | |
| Kennedy-Wilson, Inc. 4.75% 2/1/30 | 225,000 | 172,920 | |
| Mattamy Group Corp. 4.625% 3/1/30 (b) | 1,500,000 | 1,243,125 | |
| Mid-America Apartments LP 4% 11/15/25 | 1,296,000 | 1,250,536 | |
| Samhallsbyggnadsbolaget I Norden AB: | |||
| 1% 8/12/27 (Reg. S) | EUR | 400,000 | 305,104 |
| 1.75% 1/14/25 (Reg. S) | EUR | 200,000 | 190,547 |
| Sirius Real Estate Ltd. 1.125% 6/22/26 (Reg. S) | EUR | 400,000 | 338,377 |
| Tanger Properties LP: | |||
| 2.75% 9/1/31 | 4,140,000 | 3,070,813 | |
| 3.125% 9/1/26 | 3,497,000 | 3,173,996 | |
| 3.875% 7/15/27 | 13,369,000 | 12,276,479 | |
| Taylor Morrison Communities, Inc./Monarch Communities, Inc.: | |||
| 5.125% 8/1/30 (b) | 2,500,000 | 2,206,250 | |
| 5.75% 1/15/28 (b) | 280,000 | 264,103 | |
| 5.875% 6/15/27 (b) | 1,500,000 | 1,436,820 | |
| Tritax EuroBox PLC 0.95% 6/2/26 (Reg. S) | EUR | 780,000 | 683,822 |
| 70,780,602 | |||
TOTAL REAL ESTATE | 360,976,396 | ||
| UTILITIES - 0.5% | |||
| Electric Utilities - 0.3% | |||
| AEP Texas, Inc.: | |||
| 2.1% 7/1/30 | 2,550,000 | 2,055,135 | |
| 3.45% 5/15/51 | 560,000 | 398,591 | |
| 3.8% 10/1/47 | 845,000 | 627,338 | |
| AEP Transmission Co. LLC: | |||
| 3.75% 12/1/47 | 850,000 | 678,876 | |
| 4% 12/1/46 | 375,000 | 302,838 | |
| Alabama Power Co.: | |||
| 3.75% 3/1/45 | 650,000 | 502,341 | |
| 3.85% 12/1/42 | 700,000 | 564,124 | |
| 4.1% 1/15/42 | 225,000 | 178,863 | |
| 6.125% 5/15/38 | 835,000 | 897,999 | |
| Alliant Energy Finance LLC 1.4% 3/15/26 (b) | 2,300,000 | 1,994,620 | |
| American Electric Power Co., Inc.: | |||
| 5.625% 3/1/33 | 2,585,000 | 2,583,575 | |
| 5.95% 11/1/32 | 5,000,000 | 5,156,281 | |
| Arizona Public Service Co.: | |||
| 2.6% 8/15/29 | 340,000 | 285,721 | |
| 3.5% 12/1/49 | 1,100,000 | 761,574 | |
| 3.75% 5/15/46 | 825,000 | 607,042 | |
| 6.35% 12/15/32 | 1,150,000 | 1,222,162 | |
| Atlantic City Electric Co. 2.3% 3/15/31 | 425,000 | 346,989 | |
| AusNet Services Holdings Pty Ltd. 1.625% 3/11/81 (Reg. S) (c) | EUR | 760,000 | 674,593 |
| CenterPoint Energy Houston Electric LLC 3.95% 3/1/48 | 1,205,000 | 990,638 | |
| Clearway Energy Operating LLC: | |||
| 3.75% 2/15/31 (b) | 225,000 | 183,094 | |
| 4.75% 3/15/28 (b) | 60,000 | 55,062 | |
| Cleco Corporate Holdings LLC 3.375% 9/15/29 | 4,448,000 | 3,755,313 | |
| Comision Federal de Electricid 4.688% 5/15/29 (b) | 2,277,000 | 2,029,803 | |
| Commonwealth Edison Co.: | |||
| 3.7% 8/15/28 | 250,000 | 234,798 | |
| 3.7% 3/1/45 | 1,190,000 | 923,622 | |
| 4.35% 11/15/45 | 415,000 | 352,638 | |
| 4.9% 2/1/33 | 945,000 | 936,824 | |
| Connecticut Light & Power Co. 5.25% 1/15/53 | 670,000 | 669,710 | |
| Dominion Energy South Carolina: | |||
| 5.1% 6/1/65 | 275,000 | 262,388 | |
| 5.45% 2/1/41 | 285,000 | 282,466 | |
| DPL, Inc. 4.35% 4/15/29 | 2,480,000 | 2,145,200 | |
| DTE Electric Co.: | |||
| 2.25% 3/1/30 | 625,000 | 525,432 | |
| 3.75% 8/15/47 | 1,050,000 | 828,097 | |
| Duke Energy Carolinas LLC: | |||
| 2.95% 12/1/26 | 370,000 | 344,461 | |
| 4% 9/30/42 | 2,000,000 | 1,644,924 | |
| 4.25% 12/15/41 | 2,545,000 | 2,189,915 | |
| 5.35% 1/15/53 | 1,700,000 | 1,675,304 | |
| 6.1% 6/1/37 | 775,000 | 819,878 | |
| Duke Energy Corp.: | |||
| 3.75% 4/15/24 | 3,190,000 | 3,130,507 | |
| 3.85% 6/15/34 | EUR | 800,000 | 764,592 |
| Duke Energy Florida LLC: | |||
| 2.4% 12/15/31 | 1,010,000 | 820,594 | |
| 6.35% 9/15/37 | 675,000 | 727,732 | |
| Duke Energy Progress LLC 4% 4/1/52 | 1,315,000 | 1,048,403 | |
| Duquesne Light Holdings, Inc. 2.775% 1/7/32 (b) | 4,273,000 | 3,360,698 | |
| Electricite de France SA 5.5% 1/25/35 (Reg. S) | GBP | 800,000 | 913,646 |
| ENEL Finance International NV 2.25% 7/12/31 (b) | 5,660,000 | 4,265,580 | |
| Enel SpA 3.375% (Reg. S) (c)(i) | EUR | 1,035,000 | 994,357 |
| Entergy Louisiana LLC 2.4% 10/1/26 | 1,070,000 | 964,715 | |
| Entergy, Inc. 1.75% 3/15/31 | 1,575,000 | 1,230,250 | |
| Eskom Holdings SOC Ltd. 6.75% 8/6/23 (b) | 1,000,000 | 989,500 | |
| Evergy Kansas Central 4.125% 3/1/42 | 655,000 | 546,863 | |
| Eversource Energy: | |||
| 1.65% 8/15/30 | 895,000 | 690,176 | |
| 4.2% 6/27/24 | 1,285,000 | 1,262,922 | |
| 4.6% 7/1/27 | 2,925,000 | 2,849,519 | |
| Exelon Corp. 5.625% 6/15/35 | 150,000 | 150,396 | |
| FirstEnergy Corp.: | |||
| 2.25% 9/1/30 | 385,000 | 307,038 | |
| 3.4% 3/1/50 | 3,431,000 | 2,318,294 | |
| 7.375% 11/15/31 | 6,359,000 | 7,131,619 | |
| Florida Power & Light Co.: | |||
| 3.8% 12/15/42 | 1,280,000 | 1,041,742 | |
| 5.1% 4/1/33 | 3,500,000 | 3,473,085 | |
| 5.25% 2/1/41 | 500,000 | 491,982 | |
| Fortis, Inc. 3.055% 10/4/26 | 301,000 | 279,487 | |
| Georgia Power Co. 4.3% 3/15/42 | 525,000 | 440,900 | |
| Hydro-Quebec 8.05% 7/7/24 | 1,455,000 | 1,508,675 | |
| Iberdrola Finanzas SAU 7.375% 1/29/24 | GBP | 250,000 | 306,468 |
| IPALCO Enterprises, Inc. 3.7% 9/1/24 | 2,644,000 | 2,553,768 | |
| Jersey Central Power & Light Co.: | |||
| 2.75% 3/1/32 (b) | 3,560,000 | 2,906,801 | |
| 4.3% 1/15/26 (b) | 2,000,000 | 1,917,910 | |
| Louisville Gas & Electric Co. 5.125% 11/15/40 | 345,000 | 322,727 | |
| Metropolitan Edison Co. 4.3% 1/15/29 (b) | 2,755,000 | 2,568,468 | |
| Mong Duong Finance Holdings BV 5.125% 5/7/29 (Reg. S) | 250,000 | 212,469 | |
| New England Power Co. 5.936% 11/25/52 (b) | 4,495,000 | 4,811,448 | |
| NextEra Energy Capital Holdings, Inc.: | |||
| 1.84% 3/1/25 | 1,510,000 | 1,519,195 | |
| 2.25% 6/1/30 | 970,000 | 784,728 | |
| 2.75% 11/1/29 | 1,660,000 | 1,413,750 | |
| 4.625% 7/15/27 | 2,350,000 | 2,283,916 | |
| NextEra Energy Partners LP 4.25% 9/15/24 (b) | 27,000 | 25,178 | |
| NGG Finance PLC 2.125% 9/5/82 (Reg. S) (c) | EUR | 1,150,000 | 1,033,245 |
| Northern States Power Co.: | |||
| 3.6% 9/15/47 | 20,000 | 15,546 | |
| 6.25% 6/1/36 | 370,000 | 395,877 | |
| NRG Energy, Inc.: | |||
| 2% 12/2/25 (b) | 3,120,000 | 2,760,888 | |
| 3.375% 2/15/29 (b) | 45,000 | 36,538 | |
| 3.625% 2/15/31 (b) | 895,000 | 693,962 | |
| 3.875% 2/15/32 (b) | 750,000 | 581,655 | |
| 5.75% 1/15/28 | 245,000 | 230,937 | |
| 6.625% 1/15/27 | 122,000 | 121,657 | |
| Pacific Gas & Electric Co.: | |||
| 3.95% 12/1/47 | 1,700,000 | 1,159,263 | |
| 4% 12/1/46 | 1,045,000 | 712,220 | |
| 4.5% 7/1/40 | 2,295,000 | 1,797,881 | |
| 4.55% 7/1/30 | 3,080,000 | 2,781,304 | |
| 4.95% 7/1/50 | 785,000 | 619,755 | |
| PacifiCorp: | |||
| 2.9% 6/15/52 | 1,000,000 | 662,797 | |
| 5.25% 6/15/35 | 1,320,000 | 1,296,288 | |
| 5.35% 12/1/53 | 1,645,000 | 1,622,811 | |
| 5.75% 4/1/37 | 900,000 | 918,606 | |
| Pattern Energy Operations LP 4.5% 8/15/28 (b) | 90,000 | 80,371 | |
| PECO Energy Co.: | |||
| 2.8% 6/15/50 | 380,000 | 248,083 | |
| 4.375% 8/15/52 | 725,000 | 637,906 | |
| Pennsylvania Electric Co. 4.15% 4/15/25 (b) | 330,000 | 314,499 | |
| PG&E Corp.: | |||
| 5% 7/1/28 | 1,155,000 | 1,054,573 | |
| 5.25% 7/1/30 | 735,000 | 655,988 | |
| PPL Electric Utilities Corp.: | |||
| 4.125% 6/15/44 | 925,000 | 774,661 | |
| 4.15% 10/1/45 | 790,000 | 660,061 | |
| 6.25% 5/15/39 | 350,000 | 376,602 | |
| PT Perusahaan Listrik Negara 1.875% 11/5/31 (b) | EUR | 1,500,000 | 1,162,941 |
| Public Service Electric & Gas Co.: | |||
| 3.6% 12/1/47 | 410,000 | 316,985 | |
| 3.65% 9/1/28 | 960,000 | 899,412 | |
| 3.65% 9/1/42 | 625,000 | 502,915 | |
| 3.95% 5/1/42 | 505,000 | 425,826 | |
| 4.9% 12/15/32 | 810,000 | 806,734 | |
| Puget Sound Energy, Inc. 5.764% 7/15/40 | 285,000 | 287,075 | |
| Southern California Edison Co.: | |||
| 3.6% 2/1/45 | 2,900,000 | 2,112,148 | |
| 3.9% 12/1/41 | 595,000 | 451,777 | |
| 5.3% 3/1/28 | 3,420,000 | 3,403,892 | |
| 5.55% 1/15/37 | 430,000 | 422,922 | |
| Southern Co. 1.875% 9/15/81 (c) | EUR | 1,600,000 | 1,345,552 |
| Southwestern Public Service Co. 5.15% 6/1/52 | 3,000,000 | 2,825,565 | |
| Tampa Electric Co. 4.45% 6/15/49 | 800,000 | 670,697 | |
| Tucson Electric Power Co. 3.25% 5/15/32 | 1,200,000 | 1,023,419 | |
| Virginia Electric & Power Co.: | |||
| 6% 1/15/36 | 470,000 | 489,861 | |
| 6% 5/15/37 | 930,000 | 968,160 | |
| Vistra Operations Co. LLC: | |||
| 3.7% 1/30/27 (b) | 2,900,000 | 2,655,274 | |
| 4.375% 5/1/29 (b) | 1,000,000 | 863,799 | |
| 5% 7/31/27 (b) | 195,000 | 181,146 | |
| 5.5% 9/1/26 (b) | 770,000 | 735,422 | |
| 5.625% 2/15/27 (b) | 5,625,000 | 5,330,365 | |
| Western Power Distribution PLC 3.625% 11/6/23 (Reg. S) | GBP | 250,000 | 297,357 |
| Wisconsin Power & Light Co. 4.1% 10/15/44 | 240,000 | 188,656 | |
| Xcel Energy, Inc.: | |||
| 1.75% 3/15/27 | 880,000 | 772,400 | |
| 4% 6/15/28 | 2,640,000 | 2,497,058 | |
| 157,899,659 | |||
| Gas Utilities - 0.0% | |||
| AmeriGas Partners LP/AmeriGas Finance Corp.: | |||
| 5.75% 5/20/27 | 579,000 | 535,563 | |
| 5.875% 8/20/26 | 5,200,000 | 4,900,506 | |
| CenterPoint Energy Resources Corp. 5.25% 3/1/28 | 3,110,000 | 3,107,105 | |
| Nakilat, Inc. 6.067% 12/31/33 (b) | 593,945 | 618,000 | |
| Piedmont Natural Gas Co., Inc. 5.05% 5/15/52 | 2,500,000 | 2,288,615 | |
| Southern Co. Gas Capital Corp.: | |||
| 4.4% 6/1/43 | 870,000 | 715,009 | |
| 5.15% 9/15/32 | 6,215,000 | 6,067,424 | |
| 5.875% 3/15/41 | 2,770,000 | 2,792,355 | |
| Spire Missouri, Inc. 4.8% 2/15/33 | 1,090,000 | 1,060,048 | |
| 22,084,625 | |||
| Independent Power and Renewable Electricity Producers - 0.1% | |||
| Calpine Corp.: | |||
| 5% 2/1/31 (b) | 3,365,000 | 2,768,829 | |
| 5.125% 3/15/28 (b) | 2,700,000 | 2,395,302 | |
| RWE AG 2.75% 5/24/30 (Reg. S) | EUR | 754,000 | 727,255 |
| TerraForm Power Operating LLC 5% 1/31/28 (b) | 645,000 | 593,400 | |
| The AES Corp.: | |||
| 3.3% 7/15/25 (b) | 10,697,000 | 10,038,537 | |
| 3.95% 7/15/30 (b) | 9,327,000 | 8,165,789 | |
| TransAlta Corp. 6.5% 3/15/40 | 165,000 | 150,150 | |
| 24,839,262 | |||
| Multi-Utilities - 0.1% | |||
| Ameren Illinois Co.: | |||
| 4.15% 3/15/46 | 1,135,000 | 939,174 | |
| 4.5% 3/15/49 | 520,000 | 470,895 | |
| Berkshire Hathaway Energy Co.: | |||
| 3.7% 7/15/30 | 1,280,000 | 1,176,478 | |
| 4.05% 4/15/25 | 16,081,000 | 15,729,550 | |
| 6.125% 4/1/36 | 2,980,000 | 3,164,831 | |
| CenterPoint Energy, Inc. 2.95% 3/1/30 | 625,000 | 534,426 | |
| Consolidated Edison Co. of New York, Inc.: | |||
| 3.7% 11/15/59 | 1,650,000 | 1,195,221 | |
| 4.3% 12/1/56 | 300,000 | 241,448 | |
| 6.15% 11/15/52 | 1,575,000 | 1,683,831 | |
| Dominion Energy, Inc. 7% 6/15/38 | 150,000 | 164,383 | |
| Empresas Publicas de Medellin 4.375% 2/15/31 (Reg. S) | 400,000 | 281,825 | |
| NiSource, Inc.: | |||
| 2.95% 9/1/29 | 11,346,000 | 9,792,645 | |
| 4.8% 2/15/44 | 550,000 | 487,612 | |
| 5.95% 6/15/41 | 640,000 | 644,321 | |
| Puget Energy, Inc.: | |||
| 2.379% 6/15/28 | 815,000 | 693,765 | |
| 3.65% 5/15/25 | 1,014,000 | 959,343 | |
| 4.1% 6/15/30 | 6,189,000 | 5,556,816 | |
| 4.224% 3/15/32 | 5,488,000 | 4,852,462 | |
| San Diego Gas & Electric Co.: | |||
| 1.7% 10/1/30 | 3,975,000 | 3,132,203 | |
| 3.32% 4/15/50 | 910,000 | 649,361 | |
| 3.75% 6/1/47 | 1,210,000 | 941,594 | |
| Sempra Energy: | |||
| 3.3% 4/1/25 | 2,200,000 | 2,105,789 | |
| 4% 2/1/48 | 965,000 | 748,333 | |
| 4.125% 4/1/52 (c) | 3,845,000 | 3,261,918 | |
| WEC Energy Group, Inc.: | |||
| 3 month U.S. LIBOR + 2.610% 6.9761% 5/15/67 (c)(g) | 1,012,000 | 864,471 | |
| 1.8% 10/15/30 | 850,000 | 665,305 | |
| 60,938,000 | |||
| Water Utilities - 0.0% | |||
| Severn Trent Utilities Finance PLC: | |||
| 4.625% 11/30/34 (Reg. S) | GBP | 210,000 | 238,656 |
| 6.125% 2/26/24 | GBP | 135,000 | 163,729 |
| Thames Water Utility Finance PLC 1.875% 1/24/24 (Reg. S) | GBP | 270,000 | 315,112 |
| 717,497 | |||
TOTAL UTILITIES | 266,479,043 | ||
| TOTAL NONCONVERTIBLE BONDS (Cost $5,124,805,631) | 4,497,936,505 | ||
| U.S. Government and Government Agency Obligations - 9.3% | |||
Principal Amount (a) | Value ($) | ||
| U.S. Government Agency Obligations - 0.1% | |||
| Fannie Mae: | |||
| 0.5% 6/17/25 | 1,685,000 | 1,531,340 | |
| 0.875% 8/5/30 | �� | 640,000 | 507,772 |
| 1.625% 10/15/24 | 1,295,000 | 1,227,539 | |
| 1.625% 1/7/25 | 310,000 | 292,322 | |
| 2.5% 2/5/24 | 440,000 | 428,840 | |
| 2.875% 9/12/23 | 505,000 | 498,813 | |
| 6.625% 11/15/30 | 1,290,000 | 1,495,105 | |
| Federal Home Loan Bank 0% 8/25/23 | 20,000,000 | 19,518,994 | |
| Freddie Mac: | |||
| 0.375% 4/20/23 | 885,000 | 879,678 | |
| 0.375% 5/5/23 | 3,065,000 | 3,040,389 | |
| 6.25% 7/15/32 | 2,265,000 | 2,627,921 | |
| 6.75% 3/15/31 | 2,810,000 | 3,299,745 | |
| Tennessee Valley Authority: | |||
| 0.75% 5/15/25 | 845,000 | 771,675 | |
| 1.5% 9/15/31 | 780,000 | 618,847 | |
| 2.875% 2/1/27 | 1,060,000 | 993,762 | |
| 5.25% 9/15/39 | 150,000 | 157,626 | |
| 7.125% 5/1/30 | 460,000 | 536,960 | |
TOTAL U.S. GOVERNMENT AGENCY OBLIGATIONS | 38,427,328 | ||
| U.S. Treasury Inflation-Protected Obligations - 0.0% | |||
| U.S. Treasury Inflation-Indexed Notes 0.625% 7/15/32 | 8,343,694 | 7,720,349 | |
| U.S. Treasury Obligations - 9.2% | |||
| U.S. Treasury Bills, yield at date of purchase 4.54% to 4.74% 5/25/23 to 8/3/23 | 128,615,000 | 126,361,955 | |
| U.S. Treasury Bonds: | |||
| 1.375% 11/15/40 | 49,314,600 | 32,403,160 | |
| 1.75% 8/15/41 | 60,635,200 | 42,018,299 | |
| 1.875% 2/15/41 | 62,580,000 | 44,727,588 | |
| 1.875% 11/15/51 | 19,685,000 | 12,802,939 | |
| 2% 11/15/41 | 240,253,000 | 173,648,487 | |
| 2% 2/15/50 | 19,680,000 | 13,311,675 | |
| 2.25% 5/15/41 | 93,030,000 | 70,684,630 | |
| 2.25% 8/15/49 | 8,695,000 | 6,236,285 | |
| 2.25% 2/15/52 | 71,600,000 | 51,051,359 | |
| 2.375% 2/15/42 | 56,206,000 | 43,232,784 | |
| 2.375% 11/15/49 | 34,675,000 | 25,570,104 | |
| 2.375% 5/15/51 | 360,497,000 | 264,641,410 | |
| 2.5% 2/15/46 | 36,273,000 | 27,566,063 | |
| 2.75% 8/15/47 | 11,200,000 | 8,903,563 | |
| 2.875% 5/15/52 | 249,200,000 | 204,061,704 | |
| 3.375% 8/15/42 | 11,640,000 | 10,479,638 | |
| 3.625% 8/15/43 | 6,238,100 | 5,808,012 | |
| 3.625% 2/15/53 (j) | 111,789,000 | 106,426,621 | |
| 4% 11/15/42 | 16,460,000 | 16,225,959 | |
| 4% 11/15/52 | 8,420,000 | 8,569,981 | |
| 6.25% 8/15/23 | 7,725,000 | 7,768,453 | |
| stripped coupon: | |||
0% 2/15/36 | 2,700,000 | 1,585,091 | |
0% 11/15/36 | 1,975,000 | 1,120,663 | |
0% 5/15/39 | 66,910,000 | 33,886,101 | |
0% 8/15/39 | 73,145,000 | 36,740,185 | |
0% 8/15/40 (k) | 31,315,000 | 15,118,022 | |
0% 2/15/41 | 1,890,000 | 890,655 | |
0% 5/15/41 | 41,450,000 | 19,350,889 | |
0% 8/15/41 | 1,840,000 | 850,081 | |
0% 11/15/41 | 850,000 | 387,942 | |
0% 5/15/42 | 2,635,000 | 1,176,383 | |
0% 8/15/42 | 490,000 | 216,098 | |
0% 11/15/42 | 1,280,000 | 557,801 | |
0% 5/15/44 | 7,670,000 | 3,146,655 | |
| U.S. Treasury Notes: | |||
| 0.375% 4/30/25 | 4,920,000 | 4,482,197 | |
| 0.375% 1/31/26 | 8,470,000 | 7,524,073 | |
| 0.5% 2/28/26 | 22,520,000 | 20,020,808 | |
| 0.75% 3/31/26 | 71,770,000 | 64,220,133 | |
| 0.75% 4/30/26 | 71,811,200 | 64,015,757 | |
| 0.875% 6/30/26 | 41,590,000 | 37,067,088 | |
| 0.875% 9/30/26 (j)(k)(l) | 4,300,000 | 3,803,820 | |
| 1.25% 11/30/26 | 207,200,000 | 185,079,782 | |
| 1.25% 12/31/26 | 29,355,000 | 26,175,257 | |
| 1.25% 4/30/28 | 288,000,000 | 249,198,751 | |
| 1.5% 2/29/24 (k) | 5,700,000 | 5,499,387 | |
| 1.5% 11/30/28 | 36,290,000 | 31,429,125 | |
| 1.75% 3/15/25 | 26,460,000 | 24,892,981 | |
| 2.125% 7/31/24 | 41,045,000 | 39,396,787 | |
| 2.125% 5/15/25 | 22,900,000 | 21,661,969 | |
| 2.5% 4/30/24 | 12,240,000 | 11,874,234 | |
| 2.5% 5/31/24 | 29,075,000 | 28,155,049 | |
| 2.625% 2/15/29 | 10,965,000 | 10,093,797 | |
| 2.625% 7/31/29 (j)(k) | 3,371,000 | 3,091,049 | |
| 2.75% 5/15/25 | 50,000 | 47,928 | |
| 2.75% 7/31/27 | 94,335,000 | 88,623,310 | |
| 2.75% 5/31/29 | 41,375,000 | 38,270,259 | |
| 2.75% 8/15/32 | 45,800,000 | 41,620,750 | |
| 2.875% 5/15/28 | 18,690,000 | 17,549,618 | |
| 2.875% 5/15/32 | 426,149,000 | 391,923,908 | |
| 3% 7/15/25 | 15,015,000 | 14,457,216 | |
| 3.125% 11/15/28 | 14,283,500 | 13,539,754 | |
| 3.5% 1/31/28 | 253,850,000 | 246,135,341 | |
| 3.5% 1/31/30 | 63,400,000 | 61,230,531 | |
| 3.5% 2/15/33 | 188,101,000 | 181,899,545 | |
| 3.875% 1/15/26 (j) | 53,100,000 | 52,187,344 | |
| 3.875% 11/30/27 | 83,300,000 | 82,112,324 | |
| 3.875% 12/31/27 | 45,195,000 | 44,517,730 | |
| 3.875% 11/30/29 | 29,890,000 | 29,507,034 | |
| 3.875% 12/31/29 | 83,180,000 | 82,166,244 | |
| 3.875% 2/28/30 | 19,550,000 | 19,476,688 | |
| 4% 2/15/26 | 80,215,000 | 79,105,777 | |
| 4% 2/29/28 | 49,970,000 | 49,599,129 | |
| 4.125% 1/31/25 | 426,481,000 | 420,933,416 | |
| 4.125% 11/15/32 (j) | 136,910,000 | 139,092,003 | |
| 4.25% 9/30/24 | 74,010,000 | 73,174,497 | |
| 4.25% 12/31/24 | 13,875,000 | 13,719,448 | |
| 4.375% 10/31/24 (j)(k)(l) | 9,000,000 | 8,915,625 | |
| 4.625% 2/28/25 | 153,616,000 | 153,123,950 | |
TOTAL U.S. TREASURY OBLIGATIONS | 4,598,138,648 | ||
| Other Government Related - 0.0% | |||
| Private Export Funding Corp. Secured: | |||
| 1.4% 7/15/28 | 2,605,000 | 2,192,687 | |
| 3.55% 1/15/24 | 755,000 | 742,594 | |
TOTAL OTHER GOVERNMENT RELATED | 2,935,281 | ||
| TOTAL U.S. GOVERNMENT AND GOVERNMENT AGENCY OBLIGATIONS (Cost $5,016,360,593) | 4,647,221,606 | ||
| U.S. Government Agency - Mortgage Securities - 9.7% | |||
Principal Amount (a) | Value ($) | ||
| Fannie Mae - 3.2% | |||
| 12 month U.S. LIBOR + 1.550% 3.803% 6/1/36 (c)(g) | 2,494 | 2,533 | |
| 12 month U.S. LIBOR + 1.820% 2.792% 2/1/35 (c)(g) | 23,071 | 23,236 | |
| 12 month U.S. LIBOR + 1.950% 3.771% 7/1/37 (c)(g) | 7,141 | 7,317 | |
| 1.5% 1/1/36 to 11/1/51 | 91,317,177 | 72,257,138 | |
| 2% 2/1/28 to 4/1/52 | 385,333,963 | 318,458,462 | |
| 2.5% 1/1/28 to 5/1/52 | 466,300,161 | 402,924,654 | |
| 3% 2/1/27 to 7/1/52 (k)(l) | 305,344,335 | 272,326,549 | |
| 3.5% 5/1/29 to 7/1/52 (k)(l) | 164,298,767 | 151,208,015 | |
| 4% 7/1/37 to 9/1/52 | 119,821,572 | 114,206,386 | |
| 4.5% 6/1/24 to 9/1/52 | 100,842,806 | 98,077,243 | |
| 5% 6/1/24 to 12/1/52 | 84,528,784 | 83,875,227 | |
| 5.264% 8/1/41 (c) | 216,120 | 215,882 | |
| 5.5% 11/1/36 to 12/1/52 | 51,508,122 | 51,529,876 | |
| 6% to 6% 2/1/34 to 12/1/52 (l) | 28,711,229 | 29,228,845 | |
| 6.5% 2/1/36 | 1,222 | 1,284 | |
| 6.67% 2/1/39 (c) | 106,722 | 108,566 | |
TOTAL FANNIE MAE | 1,594,451,213 | ||
| Freddie Mac - 1.8% | |||
| 6 month U.S. LIBOR + 2.680% 5.679% 10/1/35 (c)(g) | 2,278 | 2,362 | |
| 1.5% 3/1/36 to 6/1/51 | 17,958,004 | 14,737,832 | |
| 2% 1/1/32 to 4/1/52 (k) | 184,260,984 | 152,136,021 | |
| 2.5% 1/1/28 to 5/1/52 | 197,753,615 | 170,715,128 | |
| 3% 10/1/28 to 6/1/52 | 177,548,140 | 158,759,558 | |
| 3.5% 2/1/29 to 12/1/52 | 183,443,578 | 169,815,506 | |
| 4% 1/1/36 to 10/1/52 | 72,974,343 | 69,704,490 | |
| 4.5% 7/1/25 to 10/1/52 | 54,698,568 | 53,137,312 | |
| 5% 10/1/33 to 2/1/53 | 51,024,798 | 50,407,148 | |
| 5.5% 9/1/52 to 1/1/53 | 40,951,695 | 40,922,102 | |
| 6% 7/1/37 to 9/1/52 | 4,927,525 | 4,999,601 | |
| 6.5% 9/1/39 to 1/1/53 | 7,120,511 | 7,328,029 | |
TOTAL FREDDIE MAC | 892,665,089 | ||
| Ginnie Mae - 1.5% | |||
| 3.5% 9/20/40 to 7/20/52 | 80,824,915 | 74,994,350 | |
| 4.5% 5/15/39 to 6/20/52 | 30,321,699 | 29,645,595 | |
| 5.5% 6/15/36 to 3/20/41 | 116,870 | 118,980 | |
| 2% 12/20/50 to 12/20/51 | 46,760,078 | 39,393,343 | |
| 2% 3/1/53 (h) | 7,550,000 | 6,328,202 | |
| 2% 3/1/53 (h) | 2,250,000 | 1,885,888 | |
| 2% 3/1/53 (h) | 2,200,000 | 1,843,980 | |
| 2% 3/1/53 (h) | 7,300,000 | 6,118,659 | |
| 2% 3/1/53 (h) | 3,200,000 | 2,682,152 | |
| 2% 3/1/53 (h) | 7,050,000 | 5,909,116 | |
| 2% 3/1/53 (h) | 13,100,000 | 10,980,060 | |
| 2% 3/1/53 (h) | 29,000,000 | 24,307,003 | |
| 2% 3/1/53 (h) | 8,750,000 | 7,334,009 | |
| 2% 3/1/53 (h) | 3,950,000 | 3,310,781 | |
| 2% 3/1/53 (h) | 2,650,000 | 2,221,157 | |
| 2% 3/1/53 (h) | 5,800,000 | 4,861,401 | |
| 2% 3/1/53 (h) | 3,250,000 | 2,724,061 | |
| 2% 3/1/53 (h) | 7,250,000 | 6,076,751 | |
| 2% 3/1/53 (h) | 5,100,000 | 4,274,680 | |
| 2% 3/1/53 (h) | 11,350,000 | 9,513,258 | |
| 2% 3/1/53 (h) | 2,925,000 | 2,451,655 | |
| 2% 4/1/53 (h) | 12,950,000 | 10,865,968 | |
| 2% 4/1/53 (h) | 31,500,000 | 26,430,733 | |
| 2% 4/1/53 (h) | 9,700,000 | 8,138,988 | |
| 2% 4/1/53 (h) | 23,600,000 | 19,802,073 | |
| 2.5% 8/20/46 to 5/20/52 | 67,925,357 | 58,932,078 | |
| 2.5% 3/1/53 (h) | 17,775,000 | 15,371,169 | |
| 2.5% 3/1/53 (h) | 6,950,000 | 6,010,106 | |
| 2.5% 3/1/53 (h) | 12,650,000 | 10,939,257 | |
| 2.5% 3/1/53 (h) | 25,150,000 | 21,748,800 | |
| 2.5% 3/1/53 (h) | 13,800,000 | 11,933,735 | |
| 2.5% 3/1/53 (h) | 5,500,000 | 4,756,199 | |
| 2.5% 3/1/53 (h) | 9,950,000 | 8,604,396 | |
| 2.5% 3/1/53 (h) | 4,675,000 | 4,042,769 | |
| 2.5% 3/1/53 (h) | 8,500,000 | 7,350,489 | |
| 2.5% 3/1/53 (h) | 15,775,000 | 13,641,643 | |
| 2.5% 3/1/53 (h) | 10,100,000 | 8,734,110 | |
| 3% 8/20/42 to 2/20/52 | 83,728,436 | 75,379,230 | |
| 3% 3/1/53 (h) | 7,650,000 | 6,824,209 | |
| 3% 3/1/53 (h) | 3,525,000 | 3,144,489 | |
| 3% 3/1/53 (h) | 4,150,000 | 3,702,022 | |
| 3% 3/1/53 (h) | 9,050,000 | 8,073,084 | |
| 3% 3/1/53 (h) | 2,750,000 | 2,453,147 | |
| 3% 3/1/53 (h) | 6,050,000 | 5,396,924 | |
| 3% 3/1/53 (h) | 5,675,000 | 5,062,404 | |
| 3% 3/1/53 (h) | 12,300,000 | 10,972,258 | |
| 3.5% 3/1/53 (h) | 1,950,000 | 1,792,446 | |
| 3.5% 3/1/53 (h) | 3,300,000 | 3,033,370 | |
| 3.5% 3/1/53 (h) | 4,000,000 | 3,676,812 | |
| 3.5% 3/1/53 (h) | 6,700,000 | 6,158,659 | |
| 3.5% 3/1/53 (h) | 2,275,000 | 2,091,187 | |
| 3.5% 3/1/53 (h) | 4,675,000 | 4,297,274 | |
| 3.5% 3/1/53 (h) | 2,625,000 | 2,412,908 | |
| 3.5% 3/1/53 (h) | 5,375,000 | 4,940,716 | |
| 4% 5/20/40 to 5/20/49 | 53,914,279 | 51,825,969 | |
| 4.5% 3/1/53 (h) | 16,675,000 | 16,156,906 | |
| 4.5% 3/1/53 (h) | 5,500,000 | 5,329,114 | |
| 5% 6/20/34 to 6/20/48 | 9,743,768 | 9,802,187 | |
TOTAL GINNIE MAE | 716,802,909 | ||
| Uniform Mortgage Backed Securities - 3.2% | |||
| 1.5% 3/1/38 (h) | 1,000,000 | 864,478 | |
| 1.5% 3/1/38 (h) | 600,000 | 518,687 | |
| 1.5% 3/1/38 (h) | 5,000,000 | 4,322,389 | |
| 1.5% 3/1/38 (h) | 3,000,000 | 2,593,433 | |
| 1.5% 3/1/38 (h) | 3,000,000 | 2,593,433 | |
| 1.5% 3/1/38 (h) | 8,450,000 | 7,304,837 | |
| 1.5% 3/1/38 (h) | 8,400,000 | 7,261,613 | |
| 1.5% 4/1/38 (h) | 2,100,000 | 1,818,110 | |
| 1.5% 4/1/38 (h) | 8,550,000 | 7,402,306 | |
| 1.5% 4/1/38 (h) | 2,000,000 | 1,731,534 | |
| 1.5% 4/1/38 (h) | 8,250,000 | 7,142,576 | |
| 1.5% 3/1/53 (h) | 9,400,000 | 7,258,119 | |
| 1.5% 3/1/53 (h) | 25,000,000 | 19,303,508 | |
| 1.5% 3/1/53 (h) | 11,650,000 | 8,995,435 | |
| 1.5% 3/1/53 (h) | 15,600,000 | 12,045,389 | |
| 1.5% 3/1/53 (h) | 7,300,000 | 5,636,624 | |
| 1.5% 3/1/53 (h) | 9,500,000 | 7,335,333 | |
| 2% 3/1/38 (h) | 2,300,000 | 2,041,294 | |
| 2% 3/1/38 (h) | 4,800,000 | 4,260,091 | |
| 2% 3/1/38 (h) | 1,550,000 | 1,375,654 | |
| 2% 3/1/38 (h) | 3,200,000 | 2,840,061 | |
| 2% 3/1/53 (h) | 8,900,000 | 7,246,862 | |
| 2% 3/1/53 (h) | 3,000,000 | 2,442,763 | |
| 2% 3/1/53 (h) | 20,675,000 | 16,834,706 | |
| 2% 3/1/53 (h) | 27,550,000 | 22,432,703 | |
| 2% 3/1/53 (h) | 5,500,000 | 4,478,398 | |
| 2% 3/1/53 (h) | 20,050,000 | 16,325,797 | |
| 2% 3/1/53 (h) | 4,000,000 | 3,257,017 | |
| 2% 3/1/53 (h) | 30,750,000 | 25,038,317 | |
| 2% 3/1/53 (h) | 29,800,000 | 24,264,775 | |
| 2% 3/1/53 (h) | 6,850,000 | 5,577,641 | |
| 2% 3/1/53 (h) | 30,725,000 | 25,017,960 | |
| 2% 3/1/53 (h) | 9,500,000 | 7,735,415 | |
| 2% 3/1/53 (h) | 1,000,000 | 814,254 | |
| 2% 3/1/53 (h) | 2,000,000 | 1,628,508 | |
| 2% 3/1/53 (h) | 42,300,000 | 34,442,953 | |
| 2% 3/1/53 (h) | 6,800,000 | 5,536,929 | |
| 2% 3/1/53 (h) | 30,800,000 | 25,079,029 | |
| 2% 3/1/53 (h) | 14,725,000 | 11,989,893 | |
| 2% 4/1/53 (h) | 2,350,000 | 1,915,792 | |
| 2% 4/1/53 (h) | 3,800,000 | 3,097,877 | |
| 2% 4/1/53 (h) | 50,475,000 | 41,148,775 | |
| 2% 4/1/53 (h) | 31,975,000 | 26,067,005 | |
| 2% 4/1/53 (h) | 14,275,000 | 11,637,420 | |
| 2% 4/1/53 (h) | 13,325,000 | 10,862,950 | |
| 2% 4/1/53 (h) | 34,750,000 | 28,329,270 | |
| 2% 4/1/53 (h) | 55,850,000 | 45,530,640 | |
| 2% 4/1/53 (h) | 24,300,000 | 19,810,108 | |
| 2% 4/1/53 (h) | 38,050,000 | 31,019,532 | |
| 2.5% 3/1/53 (h) | 13,825,000 | 11,712,380 | |
| 2.5% 3/1/53 (h) | 5,850,000 | 4,956,052 | |
| 2.5% 3/1/53 (h) | 8,100,000 | 6,862,226 | |
| 2.5% 3/1/53 (h) | 15,650,000 | 13,258,498 | |
| 2.5% 3/1/53 (h) | 40,375,000 | 34,205,232 | |
| 2.5% 3/1/53 (h) | 17,050,000 | 14,444,562 | |
| 2.5% 3/1/53 (h) | 56,600,000 | 47,950,863 | |
| 2.5% 3/1/53 (h) | 1,500,000 | 1,270,783 | |
| 2.5% 4/1/53 (h) | 5,150,000 | 4,367,446 | |
| 2.5% 4/1/53 (h) | 12,300,000 | 10,430,988 | |
| 2.5% 4/1/53 (h) | 56,600,000 | 47,999,505 | |
| 2.5% 4/1/53 (h) | 23,125,000 | 19,611,105 | |
| 2.5% 4/1/53 (h) | 47,825,000 | 40,557,886 | |
| 2.5% 4/1/53 (h) | 26,025,000 | 22,070,444 | |
| 3% 3/1/53 (h) | 4,500,000 | 3,958,065 | |
| 3% 3/1/53 (h) | 3,000,000 | 2,638,710 | |
| 3% 3/1/53 (h) | 7,350,000 | 6,464,839 | |
| 3% 3/1/53 (h) | 16,750,000 | 14,732,796 | |
| 3% 3/1/53 (h) | 11,800,000 | 10,378,925 | |
| 3% 3/1/53 (h) | 5,500,000 | 4,837,634 | |
| 3% 3/1/53 (h) | 5,850,000 | 5,145,484 | |
| 3% 3/1/53 (h) | 12,500,000 | 10,994,624 | |
| 3% 3/1/53 (h) | 7,200,000 | 6,332,903 | |
| 3% 3/1/53 (h) | 22,875,000 | 20,120,161 | |
| 3% 3/1/53 (h) | 45,325,000 | 39,866,506 | |
| 3% 3/1/53 (h) | 2,300,000 | 2,023,011 | |
| 3% 3/1/53 (h) | 4,900,000 | 4,309,893 | |
| 3% 3/1/53 (h) | 7,700,000 | 6,772,688 | |
| 3% 3/1/53 (h) | 2,500,000 | 2,198,925 | |
| 3% 3/1/53 (h) | 2,500,000 | 2,198,925 | |
| 3% 4/1/53 (h) | 10,900,000 | 9,595,828 | |
| 3% 4/1/53 (h) | 30,300,000 | 26,674,641 | |
| 3% 4/1/53 (h) | 3,650,000 | 3,213,282 | |
| 3% 4/1/53 (h) | 10,100,000 | 8,891,547 | |
| 3.5% 3/1/53 (h) | 3,500,000 | 3,186,643 | |
| 3.5% 3/1/53 (h) | 3,500,000 | 3,186,643 | |
| 3.5% 3/1/53 (h) | 10,125,000 | 9,218,503 | |
| 3.5% 3/1/53 (h) | 25,000 | 22,762 | |
| 3.5% 3/1/53 (h) | 12,275,000 | 11,176,012 | |
| 3.5% 3/1/53 (h) | 22,200,000 | 20,212,421 | |
| 3.5% 3/1/53 (h) | 25,700,000 | 23,399,064 | |
| 3.5% 4/1/53 (h) | 3,500,000 | 3,188,557 | |
| 4% 3/1/53 (h) | 2,000,000 | 1,875,937 | |
| 4% 3/1/53 (h) | 3,500,000 | 3,282,890 | |
| 4% 3/1/53 (h) | 3,500,000 | 3,282,890 | |
| 4% 3/1/53 (h) | 500,000 | 468,984 | |
| 4% 3/1/53 (h) | 3,000,000 | 2,813,906 | |
| 4% 3/1/53 (h) | 1,950,000 | 1,829,039 | |
| 4% 3/1/53 (h) | 1,950,000 | 1,829,039 | |
| 4% 3/1/53 (h) | 3,600,000 | 3,376,687 | |
| 4% 3/1/53 (h) | 3,600,000 | 3,376,687 | |
| 4% 3/1/53 (h) | 23,225,000 | 21,784,321 | |
| 4% 3/1/53 (h) | 30,775,000 | 28,865,984 | |
| 4% 3/1/53 (h) | 5,200,000 | 4,877,437 | |
| 4% 3/1/53 (h) | 1,000,000 | 937,969 | |
| 4% 3/1/53 (h) | 1,000,000 | 937,969 | |
| 4.5% 3/1/53 (h) | 500,000 | 481,387 | |
| 4.5% 3/1/53 (h) | 9,050,000 | 8,713,097 | |
| 4.5% 3/1/53 (h) | 4,500,000 | 4,332,479 | |
| 4.5% 3/1/53 (h) | 3,750,000 | 3,610,400 | |
| 4.5% 3/1/53 (h) | 20,475,000 | 19,712,781 | |
| 4.5% 3/1/53 (h) | 3,500,000 | 3,369,706 | |
| 4.5% 3/1/53 (h) | 11,675,000 | 11,240,377 | |
| 4.5% 3/1/53 (h) | 31,825,000 | 30,640,257 | |
| 4.5% 3/1/53 (h) | 4,025,000 | 3,875,162 | |
| 4.5% 3/1/53 (h) | 6,825,000 | 6,570,927 | |
| 4.5% 3/1/53 (h) | 2,825,000 | 2,719,834 | |
| 4.5% 3/1/53 (h) | 4,800,000 | 4,621,311 | |
| 4.5% 3/1/53 (h) | 500,000 | 481,387 | |
| 4.5% 3/1/53 (h) | 4,500,000 | 4,332,479 | |
| 4.5% 3/1/53 (h) | 4,000,000 | 3,851,093 | |
| 4.5% 3/1/53 (h) | 500,000 | 481,387 | |
| 4.5% 3/1/53 (h) | 6,000,000 | 5,776,639 | |
| 4.5% 3/1/53 (h) | 12,100,000 | 11,649,556 | |
| 4.5% 3/1/53 (h) | 6,300,000 | 6,065,471 | |
| 5% 3/1/53 (h) | 2,000,000 | 1,965,312 | |
| 5% 3/1/53 (h) | 4,200,000 | 4,127,155 | |
| 5% 3/1/53 (h) | 7,600,000 | 7,468,185 | |
| 5% 3/1/53 (h) | 49,725,000 | 48,862,565 | |
| 5% 3/1/53 (h) | 39,900,000 | 39,207,970 | |
| 5% 3/1/53 (h) | 44,325,000 | 43,556,223 | |
| 5% 3/1/53 (h) | 6,500,000 | 6,387,263 | |
| 5% 3/1/53 (h) | 1,000,000 | 982,656 | |
| 5.5% 3/1/53 (h) | 4,200,000 | 4,192,616 | |
| 5.5% 3/1/53 (h) | 10,100,000 | 10,082,243 | |
| 5.5% 3/1/53 (h) | 1,500,000 | 1,497,363 | |
| 5.5% 3/1/53 (h) | 3,350,000 | 3,344,110 | |
| 5.5% 3/1/53 (h) | 11,000,000 | 10,980,661 | |
| 5.5% 3/1/53 (h) | 11,450,000 | 11,429,870 | |
| 5.5% 3/1/53 (h) | 5,600,000 | 5,590,155 | |
| 5.5% 3/1/53 (h) | 12,600,000 | 12,577,848 | |
| 5.5% 3/1/53 (h) | 2,000,000 | 1,996,484 | |
| 5.5% 3/1/53 (h) | 3,000,000 | 2,994,726 | |
| 5.5% 3/1/53 (h) | 3,275,000 | 3,269,242 | |
| 5.5% 4/1/53 (h) | 5,150,000 | 5,138,531 | |
| 5.5% 4/1/53 (h) | 11,350,000 | 11,324,725 | |
| 6.5% 3/1/53 (h) | 1,450,000 | 1,484,996 | |
| 6.5% 3/1/53 (h) | 5,400,000 | 5,530,330 | |
TOTAL UNIFORM MORTGAGE BACKED SECURITIES | 1,574,902,853 | ||
| TOTAL U.S. GOVERNMENT AGENCY - MORTGAGE SECURITIES (Cost $5,071,178,643) | 4,778,822,064 | ||
| Asset-Backed Securities - 2.1% | |||
Principal Amount (a) | Value ($) | ||
| AASET Trust: | |||
| Series 2018-1A Class A, 3.844% 1/16/38 (b) | 2,442,444 | 1,544,873 | |
| Series 2019-1 Class A, 3.844% 5/15/39 (b) | 2,512,583 | 1,769,621 | |
| Series 2019-2: | |||
Class A, 3.376% 10/16/39 (b) | 6,196,725 | 4,792,410 | |
Class B, 4.458% 10/16/39 (b) | 1,333,003 | 439,226 | |
| Series 2021-1A Class A, 2.95% 11/16/41 (b) | 4,958,410 | 4,350,227 | |
| Accredited Mortgage Loan Trust Series 2006-1 Class M1, 1 month U.S. LIBOR + 0.330% 1.0093% 4/25/36 (c)(g) | 2,414,000 | 2,197,760 | |
| Aegis Asset Backed Securities Trust Series 2005-5 Class M1, 1 month U.S. LIBOR + 0.640% 5.1509% 12/25/35 (g) | 11,037,836 | 9,832,855 | |
| AIG CLO LLC Series 2021-1A Class A1R, 3 month U.S. LIBOR + 1.120% 5.9277% 4/20/32 (b)(c)(g) | 7,500,000 | 7,426,463 | |
| Aimco Series 2021-BA Class AR, 3 month U.S. LIBOR + 1.100% 5.8924% 1/15/32 (b)(c)(g) | 1,584,000 | 1,564,198 | |
| AIMCO CLO Series 2021-AA Class AR2, 3 month U.S. LIBOR + 1.140% 5.9324% 10/17/34 (b)(c)(g) | 4,150,000 | 4,068,050 | |
| AIMCO CLO Ltd. Series 2021-11A Class AR, 3 month U.S. LIBOR + 1.130% 5.9224% 10/17/34 (b)(c)(g) | 3,880,000 | 3,814,191 | |
| Allegro CLO X, Ltd. / Allegro CLO X LLC Series 2021-1A Class AR, 3 month U.S. LIBOR + 1.150% 5.9577% 7/20/32 (b)(c)(g) | 16,000,000 | 15,778,368 | |
| Allegro CLO XV, Ltd. / Allegro CLO VX LLC Series 2022-1A Class A, CME TERM SOFR 3 MONTH INDEX + 1.500% 6.139% 7/20/35 (b)(c)(g) | 5,071,000 | 5,013,535 | |
| Allegro CLO, Ltd. Series 2021-1A Class A, 3 month U.S. LIBOR + 1.140% 5.9477% 7/20/34 (b)(c)(g) | 4,673,000 | 4,577,442 | |
| Ameriquest Mortgage Securities, Inc. Series 2004-R10 Class M3, 1 month U.S. LIBOR + 1.200% 5.817% 11/25/34 (c)(g) | 3,108,480 | 2,851,918 | |
| Anchorage Capital CLO 17, Ltd. Series 2021-17A Class A1, 3 month U.S. LIBOR + 1.170% 5.9624% 7/15/34 (b)(c)(g) | 10,500,000 | 10,300,406 | |
| Apollo Aviation Securitization Equity Trust Series 2020-1A: | |||
| Class A, 3.351% 1/16/40 (b) | 1,942,346 | 1,599,968 | |
| Class B, 4.335% 1/16/40 (b) | 345,680 | 152,289 | |
| Ares CLO Series 2019-54A Class A, 3 month U.S. LIBOR + 1.320% 6.1124% 10/15/32 (b)(c)(g) | 7,102,000 | 7,032,223 | |
| Ares LV CLO Ltd. Series 2021-55A Class A1R, 3 month U.S. LIBOR + 1.130% 5.9224% 7/15/34 (b)(c)(g) | 5,889,000 | 5,811,030 | |
| Ares LVIII CLO LLC Series 2022-58A Class AR, CME TERM SOFR 3 MONTH INDEX + 1.330% 5.9876% 1/15/35 (b)(c)(g) | 7,506,000 | 7,375,553 | |
| Ares XXXIV CLO Ltd. Series 2020-2A Class AR2, 3 month U.S. LIBOR + 1.250% 6.0424% 4/17/33 (b)(c)(g) | 15,169,000 | 15,001,216 | |
| Argent Securities, Inc. pass-thru certificates Series 2005-W5 Class A2D, 1 month U.S. LIBOR + 0.640% 5.257% 1/25/36 (c)(g) | 2,524,397 | 2,292,032 | |
| ArrowMark Colorado Holdings LLC Series 2021-3A Class A1R, 3 month U.S. LIBOR + 1.210% 6.0277% 1/25/35 (b)(c)(g) | 9,500,000 | 9,277,520 | |
| Atlas Senior Loan Fund XVI, Ltd. / Atlas Senior Loan Fund XVI LLC Series 2021-16A Class A, 3 month U.S. LIBOR + 1.270% 6.0777% 1/20/34 (b)(c)(g) | 2,000,000 | 1,963,506 | |
| Babson CLO Ltd. Series 2021-1A Class AR, 3 month U.S. LIBOR + 1.150% 5.9424% 10/15/36 (b)(c)(g) | 3,908,000 | 3,844,960 | |
| Bain Capital Credit CLO, Ltd. Series 2021-2A Class AR, 3 month U.S. LIBOR + 1.100% 5.8924% 10/17/32 (b)(c)(g) | 7,500,000 | 7,378,170 | |
| Balboa Bay Loan Funding Ltd. Series 2021-1A Class AR, 3 month U.S. LIBOR + 1.120% 5.9277% 1/20/32 (b)(c)(g) | 10,000,000 | 9,886,350 | |
| Battalion CLO X Ltd. / Battalion CLO X LLC Series 2021-10A Class A1R2, 3 month U.S. LIBOR + 1.170% 5.9856% 1/25/35 (b)(c)(g) | 12,000,000 | 11,756,256 | |
| Battalion CLO XI Ltd. / Battalion CLO XI LLC Series 2021-11A Class AR, 3 month U.S. LIBOR + 1.150% 5.9656% 4/24/34 (b)(c)(g) | 22,750,000 | 22,252,025 | |
| Beechwood Park CLO Ltd. Series 2022-1A Class A1R, CME TERM SOFR 3 MONTH INDEX + 1.300% 5.9576% 1/17/35 (b)(c)(g) | 7,708,000 | 7,662,168 | |
| Bellemeade Re Ltd. Series 2021-1A: | |||
| Class M1A, U.S. 30-Day Avg. Secured Overnight Fin. Rate (SOFR) Index + 1.750% 6.2341% 3/25/31 (b)(c)(g) | 1,696,989 | 1,696,622 | |
| Class M1C, U.S. 30-Day Avg. Secured Overnight Fin. Rate (SOFR) Index + 2.950% 7.4341% 3/25/31 (b)(c)(g) | 2,140,000 | 2,139,998 | |
| BETHP Series 2021-1A Class A, 3 month U.S. LIBOR + 1.130% 5.9224% 1/15/35 (b)(c)(g) | 5,907,000 | 5,795,251 | |
| Blackbird Capital Aircraft: | |||
| Series 2016-1A: | |||
Class A, 4.213% 12/16/41 (b) | 6,982,219 | 5,830,293 | |
Class AA, 2.487% 12/16/41 (b)(c) | 608,700 | 560,523 | |
| Series 2021-1A Class A, 2.443% 7/15/46 (b) | 7,173,910 | 6,068,930 | |
| BlackRock Rainier CLO VI, Ltd. / BlackRock Rainier CLO VI LLC Series 2021-6A Class A, 3 month U.S. LIBOR + 1.700% 6.5077% 4/20/33 (b)(c)(g) | 8,500,000 | 8,405,251 | |
| BlueMountain CLO XXVIII, Ltd. / BlueMountain CLO XXVIII LLC Series 2021-28A Class A, 3 month U.S. LIBOR + 1.260% 6.0524% 4/15/34 (b)(c)(g) | 3,000,000 | 2,955,285 | |
| Bristol Park CLO, Ltd. Series 2020-1A Class AR, 3 month U.S. LIBOR + 0.990% 5.7824% 4/15/29 (b)(c)(g) | 7,722,132 | 7,657,714 | |
| CarMax Auto Owner Trust Series 2021-1 Class D, 1.28% 7/15/27 | 200,000 | 179,801 | |
| Carrington Mortgage Loan Trust Series 2005-FRE1: | |||
| Class M1, 1 month U.S. LIBOR + 0.700% 5.322% 12/25/35 (c)(g) | 235,793 | 235,391 | |
| Class M2, 1 month U.S. LIBOR + 0.730% 5.352% 12/25/35 (g) | 10,000,000 | 9,161,816 | |
| Castlelake Aircraft Securitization Trust Series 2019-1A: | |||
| Class A, 3.967% 4/15/39 (b) | 5,429,082 | 4,737,091 | |
| Class B, 5.095% 4/15/39 (b) | 2,927,377 | 2,093,194 | |
| Castlelake Aircraft Structured Trust Series 2018-1 Class A, 4.125% 6/15/43 (b) | 2,901,144 | 2,535,340 | |
| Cedar Funding Ltd.: | |||
| Series 2021-10A Class AR, 3 month U.S. LIBOR + 1.100% 5.9077% 10/20/32 (b)(c)(g) | 4,327,000 | 4,266,301 | |
| Series 2022-15A Class A, CME TERM SOFR 3 MONTH INDEX + 1.320% 5.959% 4/20/35 (b)(c)(g) | 7,060,000 | 6,979,219 | |
| Cedar Funding XII CLO Ltd. / Cedar Funding XII CLO LLC Series 2021-12A Class A1R, 3 month U.S. LIBOR + 1.130% 5.9477% 10/25/34 (b)(c)(g) | 3,624,000 | 3,546,820 | |
| Cent CLO Ltd. / Cent CLO Series 2021-29A Class AR, 3 month U.S. LIBOR + 1.170% 5.9777% 10/20/34 (b)(c)(g) | 5,895,000 | 5,763,235 | |
| Chase Auto Credit Linked Notes Series 2021-3 Class E, 2.102% 2/26/29 (b) | 362,391 | 340,981 | |
| CIFC Funding Ltd. Series 2021-7A Class B, 3 month U.S. LIBOR + 1.600% 6.4153% 1/23/35 (b)(c)(g) | 7,600,000 | 7,398,152 | |
| Citi Mortgage Loan Trust Series 2007-1 Class 1A, 1 month U.S. LIBOR + 1.350% 5.967% 10/25/37 (b)(c)(g) | 415,973 | 414,343 | |
| Citibank Credit Card Issuance Trust: | |||
| Series 2018-A3 Class A3, 3.29% 5/23/25 | 700,000 | 697,450 | |
| Series 2018-A7 Class A7, 3.96% 10/13/30 | 2,500,000 | 2,406,811 | |
| Columbia Cent Clo 32 Ltd. / Coliseum Series 2022-32A Class A1, CME TERM SOFR 3 MONTH INDEX + 1.700% 6.3586% 7/24/34 (b)(c)(g) | 7,340,000 | 7,295,380 | |
| CoreVest American Finance Trust Series 2020-2 Class B, 4.244% 5/15/52 (b) | 3,200,000 | 3,017,427 | |
| Crestline Denali CLO XVII, LLC Series 2018-1A Class AR, 3 month U.S. LIBOR + 1.060% 5.8524% 10/15/31 (b)(c)(g) | 25,000,000 | 24,662,050 | |
| Crown Point CLO, Ltd. / Crown Point CLO LLC Series 2021-11A Class A, 3 month U.S. LIBOR + 1.120% 5.9124% 1/17/34 (b)(c)(g) | 1,000,000 | 990,505 | |
| DB Master Finance LLC Series 2017-1A Class A2II, 4.03% 11/20/47 (b) | 6,946,400 | 6,450,462 | |
| Dryden 98 CLO Ltd. Series 2022-98A Class A, CME TERM SOFR 3 MONTH INDEX + 1.300% 5.939% 4/20/35 (b)(c)(g) | 4,007,000 | 3,932,137 | |
| Dryden CLO, Ltd. Series 2021-76A Class A1R, 3 month U.S. LIBOR + 1.150% 5.9577% 10/20/34 (b)(c)(g) | 3,910,000 | 3,843,026 | |
| Dryden Senior Loan Fund: | |||
| Series 2020-78A Class A, 3 month U.S. LIBOR + 1.180% 5.9724% 4/17/33 (b)(c)(g) | 5,400,000 | 5,341,469 | |
| Series 2021-72A Class BR, 3 month U.S. LIBOR + 1.650% 6.5136% 5/15/32 (b)(c)(g) | 6,000,000 | 5,895,672 | |
| Series 2021-85A Class AR, 3 month U.S. LIBOR + 1.150% 5.9424% 10/15/35 (b)(c)(g) | 5,160,000 | 5,057,827 | |
| Series 2021-90A Class A1A, 3 month U.S. LIBOR + 1.130% 6.0453% 2/20/35 (b)(c)(g) | 3,054,000 | 2,993,195 | |
| Eaton Vance CLO, Ltd.: | |||
| Series 2021-1A Class AR, 3 month U.S. LIBOR + 1.100% 5.8924% 4/15/31 (b)(c)(g) | 2,460,000 | 2,437,535 | |
| Series 2021-2A Class AR, 3 month U.S. LIBOR + 1.150% 5.9424% 1/15/35 (b)(c)(g) | 6,200,000 | 6,113,336 | |
| Eaton Vance CLO, Ltd. / Eaton Vance CLO LLC Series 2021-1A Class A13R, 3 month U.S. LIBOR + 1.250% 6.0424% 1/15/34 (b)(c)(g) | 7,240,000 | 7,134,542 | |
| ECMC Group Student Loan Trust Series 2021-1A Class A1B, 1 month U.S. LIBOR + 0.570% 5.187% 11/25/70 (b)(c)(g) | 778,676 | 746,253 | |
| EFS Volunteer No. 2 LLC Series 2012-1 Class A2, 1 month U.S. LIBOR + 1.350% 5.967% 3/25/36 (b)(c)(g) | 782,708 | 776,004 | |
| Elevation CLO, Ltd. Series 2021-13A Class A1, 3 month U.S. LIBOR + 1.190% 5.9824% 7/15/34 (b)(c)(g) | 8,500,000 | 8,309,532 | |
| Elmwood CLO II Ltd. Series 2021-2A Class AR, 3 month U.S. LIBOR + 1.150% 5.9577% 4/20/34 (b)(c)(g) | 35,000,000 | 34,550,600 | |
| Encore Credit Receivables Trust Series 2005-4 Class M4, 1 month U.S. LIBOR + 0.900% 5.517% 1/25/36 (c)(g) | 4,800,000 | 4,594,716 | |
| Flatiron CLO Ltd. Series 2021-1A: | |||
| Class A1, 3 month U.S. LIBOR + 1.110% 5.9076% 7/19/34 (b)(c)(g) | 4,210,000 | 4,130,107 | |
| Class AR, 3 month U.S. LIBOR + 1.080% 5.9516% 11/16/34 (b)(c)(g) | 5,750,000 | 5,681,926 | |
| Flatiron CLO Ltd. / Flatiron CLO LLC Series 2020-1A Class A, 3 month U.S. LIBOR + 1.300% 6.2153% 11/20/33 (b)(c)(g) | 7,413,000 | 7,313,866 | |
| Ford Credit Auto Owner Trust Series 2021-1 Class C, 1.91% 10/17/33 (b) | 1,190,000 | 1,048,538 | |
| Freddie Mac STACR REMIC Trust Series 2022-DNA7 Class M1B, U.S. 30-Day Avg. Secured Overnight Fin. Rate (SOFR) Index + 5.000% 9.4841% 3/25/52 (b)(c)(g) | 3,150,000 | 3,384,041 | |
| Greywolf CLO II, Ltd. Series 2021-1A Class A1SR, 3 month U.S. LIBOR + 1.140% 5.9324% 4/15/34 (b)(c)(g) | 35,000,000 | 34,381,585 | |
| Henley CLO IV DAC Series 2021-4A Class A, 3 month EURIBOR + 0.900% 3.349% 4/25/34 (b)(c)(g) | EUR | 2,000,000 | 2,051,098 |
| Home Re, Ltd.: | |||
| Series 2021-1: | |||
Class M1B, 1 month U.S. LIBOR + 1.550% 6.167% 7/25/33 (b)(c)(g) | 84,385 | 84,307 | |
Class M1C, 1 month U.S. LIBOR + 2.300% 6.917% 7/25/33 (b)(c)(g) | 745,000 | 742,807 | |
| Series 2021-2: | |||
Class M1B, U.S. 30-Day Avg. Secured Overnight Fin. Rate (SOFR) Index + 1.600% 6.0841% 1/25/34 (b)(c)(g) | 665,000 | 658,415 | |
Class M1C, U.S. 30-Day Avg. Secured Overnight Fin. Rate (SOFR) Index + 2.800% 7.2841% 1/25/34 (b)(c)(g) | 990,000 | 975,057 | |
| Horizon Aircraft Finance I Ltd. Series 2018-1 Class A, 4.458% 12/15/38 (b) | 3,215,217 | 2,740,947 | |
| Horizon Aircraft Finance Ltd. Series 2019-1 Class A, 3.721% 7/15/39 (b) | 3,637,259 | 3,091,641 | |
| HSI Asset Securitization Corp. Trust Series 2007-HE1 Class 1A1, 1 month U.S. LIBOR + 0.140% 4.757% 1/25/37 (c)(g) | 2,542,749 | 2,015,457 | |
| Invesco CLO Ltd. Series 2021-3A Class A, 3 month U.S. LIBOR + 1.130% 5.9453% 10/22/34 (b)(c)(g) | 4,148,000 | 4,080,616 | |
| Invesco Euro CLO I DAC Series 2021-1A Class A1R, 3 month EURIBOR + 0.650% 2.938% 7/15/31 (b)(c)(g) | EUR | 10,000,000 | 10,297,661 |
| Jamestown CLO XIV Ltd. Series 2021-14A: | |||
| Class A1AR, 3 month U.S. LIBOR + 1.200% 6.0077% 10/20/34 (b)(c)(g) | 13,000,000 | 12,787,801 | |
| Class A2R, 3 month U.S. LIBOR + 1.750% 6.5577% 10/20/34 (b)(c)(g) | 10,600,000 | 10,370,902 | |
| JMP Credit Advisors CLO IV, Ltd. / JMP Credit Advisors CLO IV LLC Series 2019-1A Class AR, 3 month U.S. LIBOR + 1.280% 6.0724% 7/17/29 (b)(c)(g) | 924,441 | 919,174 | |
| JPMorgan Chase Bank NA - CACLN Series 2021-2 Class E, 2.28% 12/26/28 (b) | 415,316 | 396,793 | |
| KKR CLO Ltd. Series 2022-41A Class A1, CME TERM SOFR 3 MONTH INDEX + 1.330% 5.9619% 4/15/35 (b)(c)(g) | 9,327,000 | 9,127,300 | |
| KKR Financial CLO Ltd. Series 2021-33A Class A, 3 month U.S. LIBOR + 1.170% 5.9777% 7/20/34 (b)(c)(g) | 13,000,000 | 12,768,288 | |
| LCM XXIV Ltd. / LCM XXIV LLC Series 2021-24A Class AR, 3 month U.S. LIBOR + 0.980% 5.7877% 3/20/30 (b)(c)(g) | 7,120,589 | 7,054,816 | |
| Lendmark Funding Trust Series 2021-1A: | |||
| Class A, 1.9% 11/20/31 (b) | 4,200,000 | 3,590,060 | |
| Class B, 2.47% 11/20/31 (b) | 150,000 | 125,060 | |
| Logan CLO I, Ltd. / Logan CLO I LLC Series 2021-1A Class A, 3 month U.S. LIBOR + 1.160% 5.9677% 7/20/34 (b)(c)(g) | 12,500,000 | 12,317,763 | |
| Madison Park Funding LII Ltd. / Madison Park Funding LII LLC Series 2021-52A Class A, 3 month U.S. LIBOR + 1.100% 5.9153% 1/22/35 (b)(c)(g) | 6,180,000 | 6,030,333 | |
| Madison Park Funding Ltd. Series 2021-59A Class A, 3 month U.S. LIBOR + 1.140% 5.9347% 1/18/34 (b)(c)(g) | 4,500,000 | 4,440,600 | |
| Madison Park Funding XLV Ltd./Madison Park Funding XLV LLC Series 2021-45A Class AR, 3 month U.S. LIBOR + 1.120% 5.9124% 7/15/34 (b)(c)(g) | 4,233,000 | 4,177,179 | |
| Madison Park Funding XVII, Ltd. Series 2021-17A Class AR2, 3 month U.S. LIBOR + 1.000% 5.8153% 7/21/30 (b)(c)(g) | 6,848,544 | 6,799,276 | |
| Madison Park Funding XXXIV, Ltd. Series 2021-34A Class AR, 3 month U.S. LIBOR + 1.120% 5.9377% 4/25/32 (b)(c)(g) | 20,000,000 | 19,812,160 | |
| Madison Park Funding XXXVIII, Ltd. Series 2021-38A Class A, 3 month U.S. LIBOR + 1.120% 5.9124% 7/17/34 (b)(c)(g) | 12,500,000 | 12,305,850 | |
| Magnetite CLO Ltd. Series 2021-27A Class AR, 3 month U.S. LIBOR + 1.140% 5.9477% 10/20/34 (b)(c)(g) | 1,417,000 | 1,395,270 | |
| Magnetite VII Ltd. Series 2018-7A Class A1R2, 3 month U.S. LIBOR + 0.800% 5.5924% 1/15/28 (b)(c)(g) | 5,338,889 | 5,311,437 | |
| Magnetite XXIII, Ltd. Series 2021-23A Class AR, 3 month U.S. LIBOR + 1.130% 5.9477% 1/25/35 (b)(c)(g) | 4,904,000 | 4,820,666 | |
| Marlette Funding Trust: | |||
| Series 2021-3A Class A, 0.65% 12/15/31 (b) | 923,650 | 915,221 | |
| Series 2022-1A Class A, 1.36% 4/15/32 (b) | 1,252,413 | 1,236,946 | |
| MASTR Asset Backed Securities Trust: | |||
| Series 2005-NC2 Class A4, 1 month U.S. LIBOR + 0.700% 4.967% 11/25/35 (c)(g) | 9,789,435 | 5,675,189 | |
| Series 2005-WF1 Class M7, 1 month U.S. LIBOR + 1.720% 6.342% 6/25/35 (c)(g) | 1,816,559 | 1,819,005 | |
| MDPK Series 2021-48A Class A, 3 month U.S. LIBOR + 1.150% 5.9476% 4/19/33 (b)(c)(g) | 5,000,000 | 4,955,580 | |
| Milos CLO, Ltd. Series 2020-1A Class AR, 3 month U.S. LIBOR + 1.070% 5.8777% 10/20/30 (b)(c)(g) | 8,238,537 | 8,167,200 | |
| Morgan Stanley ABS Capital I Trust: | |||
| Series 2006-HE4 Class A4, 1 month U.S. LIBOR + 0.480% 5.097% 6/25/36 (g) | 3,624,277 | 1,977,837 | |
| Series 2007-NC3 Class A2D, 1 month U.S. LIBOR + 0.260% 4.877% 5/25/37 (c)(g) | 2,152,064 | 1,519,473 | |
| Nationstar Home Equity Loan Trust Series 2006-B Class M2, 1 month U.S. LIBOR + 0.360% 4.977% 9/25/36 (c)(g) | 8,141,000 | 7,486,211 | |
| Navient Private Education Refi Loan Trust Series 2021-A Class B, 2.24% 5/15/69 (b) | 100,000 | 71,471 | |
| Navient Student Loan Trust: | |||
| Series 2015-1 Class A2, 1 month U.S. LIBOR + 0.600% 5.217% 4/25/40 (c)(g) | 2,393,444 | 2,328,526 | |
| Series 2016-2A Class A3, 1 month U.S. LIBOR + 1.500% 6.0059% 6/25/65 (b)(c)(g) | 1,279,158 | 1,281,357 | |
| Series 2017-3A Class A3, 1 month U.S. LIBOR + 1.050% 5.667% 7/26/66 (b)(c)(g) | 8,816,734 | 8,757,553 | |
| Nelnet Student Loan Trust Series 2013-1 Class A6, 3 month U.S. LIBOR + 0.450% 5.3721% 8/23/36 (b)(c)(g) | 5,832,093 | 5,650,021 | |
| Newcastle Mortgage Securities Trust Series 2007-1 Class 2A3, 1 month U.S. LIBOR + 0.230% 4.847% 4/25/37 (g) | 2,413,392 | 2,363,131 | |
| Northwoods Capital XV, Ltd. Series 2021-15A Class A1R, 3 month U.S. LIBOR + 1.210% 5.9559% 6/20/34 (b)(c)(g) | 23,750,000 | 23,232,654 | |
| Oak Hill Credit Partners X-R, Ltd. Series 2021-10RA, Class BR, 3 month U.S. LIBOR + 1.550% 6.3577% 4/20/34 (b)(c)(g) | 2,000,000 | 1,951,114 | |
| OCP CLO Ltd. / OCP CLO LLC Series 2021-18A Class AR, 3 month U.S. LIBOR + 1.090% 5.8977% 7/20/32 (b)(c)(g) | 18,000,000 | 17,809,344 | |
| Octagon Investment Partners 20-R, Ltd. Series 2021-4A Class BR, 3 month U.S. LIBOR + 1.700% 6.5726% 5/12/31 (b)(c)(g) | 2,500,000 | 2,461,548 | |
| Octagon Investment Partners 31, Ltd. / Octagon Investment Partners 31 LLC Series 2021-1A Class AR, 3 month U.S. LIBOR + 1.050% 5.8577% 7/20/30 (b)(c)(g) | 2,909,937 | 2,887,489 | |
| Oportun Funding XIV, LLC Series 2021-A: | |||
| Class A, 1.21% 3/8/28 (b) | 800,000 | 753,166 | |
| Class B, 1.76% 3/8/28 (b) | 400,000 | 375,056 | |
| Palmer Square CLO, Ltd. Series 2021-1A Class A1, 3 month U.S. LIBOR + 1.190% 5.9977% 4/20/34 (b)(c)(g) | 6,000,000 | 5,926,206 | |
| Park Avenue Institutional Advisers CLO Ltd. / Park Avenue Institutional Advisers CLO LLC Series 2021-1A Class A1AR, 3 month U.S. LIBOR + 1.000% 5.8077% 10/20/31 (b)(c)(g) | 12,750,000 | 12,579,992 | |
| Park Avenue Institutional Advisers CLO, Ltd. Series 2021-1A Class A1R, 3 month U.S. LIBOR + 1.240% 6.1094% 2/14/34 (b)(c)(g) | 2,000,000 | 1,956,634 | |
| Peace Park CLO, Ltd. Series 2021-1A Class A, 3 month U.S. LIBOR + 1.130% 5.9377% 10/20/34 (b)(c)(g) | 5,651,000 | 5,558,228 | |
| PennyMac Mortgage Investment Trust Series 2018-FT1 Class A, 1 month U.S. LIBOR + 2.350% 6.967% 4/25/23 (b)(c)(g) | 300,000 | 295,536 | |
| Planet Fitness Master Issuer LLC: | |||
| Series 2019-1A Class A2, 3.858% 12/5/49 (b) | 6,028,550 | 5,081,230 | |
| Series 2022-1A: | |||
Class A2I, 3.251% 12/5/51 (b) | 4,650,855 | 4,113,974 | |
Class A2II, 4.008% 12/5/51 (b) | 4,156,590 | 3,446,827 | |
| PMT Credit Risk Transfer Trust Series 2021-1R Class A, 1 month U.S. LIBOR + 2.900% 7.4173% 2/27/24 (b)(c)(g) | 3,056,327 | 3,009,654 | |
| Progress Residential Trust: | |||
| Series 2021-SFR11 Class E1, 3.378% 1/17/39 (b) | 4,000,000 | 3,289,478 | |
| Series 2021-SFR3 Class F, 3.436% 5/17/26 (b) | 1,500,000 | 1,313,119 | |
| Series 2021-SFR8 Class F, 3.181% 10/17/38 (b) | 4,000,000 | 3,417,775 | |
| Recette CLO, Ltd. Series 2021-1A Class ARR, 3 month U.S. LIBOR + 1.080% 5.8877% 4/20/34 (b)(c)(g) | 4,700,000 | 4,614,328 | |
| Rockland Park CLO Ltd. Series 2021-1A Class A, 3 month U.S. LIBOR + 1.120% 5.9277% 4/20/34 (b)(c)(g) | 7,250,000 | 7,141,417 | |
| Romark CLO-IV Ltd. / Romark CLO-IV LLC Series 2021-4A Class A1, 3 month U.S. LIBOR + 1.170% 5.9799% 7/10/34 (b)(c)(g) | 13,250,000 | 13,020,722 | |
| RR 7 Ltd. Series 2022-7A Class A1AB, CME TERM SOFR 3 MONTH INDEX + 1.340% 5.9976% 1/15/37 (b)(c)(g) | 7,731,000 | 7,650,033 | |
| Santander Drive Auto Receivables Trust Series 2021-1 Class D, 1.13% 11/16/26 | 2,800,000 | 2,665,783 | |
| Sapphire Aviation Finance Series 2020-1A: | |||
| Class A, 3.228% 3/15/40 (b) | 5,691,207 | 4,588,747 | |
| Class B, 4.335% 3/15/40 (b) | 665,815 | 461,276 | |
| Saratoga Investment Corp. CLO, Ltd. / Saratoga Investment Corp. CLO, Inc. Series 2021-1A Class AR3, 3 month U.S. LIBOR + 1.320% 6.1277% 4/20/33 (b)(c)(g) | 12,000,000 | 11,948,532 | |
| SBA Tower Trust: | |||
| Series 2019, 2.836% 1/15/50 (b) | 8,004,000 | 7,517,121 | |
| 1.884% 7/15/50 (b) | 2,753,000 | 2,437,014 | |
| 2.328% 7/15/52 (b) | 2,105,000 | 1,813,874 | |
| Securitized Asset Backed Receivables LLC Trust Series 2006-CB5 Class A3, 1 month U.S. LIBOR + 0.280% 4.897% 6/25/36 (c)(g) | 2,313,909 | 1,467,800 | |
| Sixth Street CLO XVII, Ltd. / Sixth Street CLO XVII LLC Series 2021-17A Class A, 3 month U.S. LIBOR + 1.240% 6.0477% 1/20/34 (b)(c)(g) | 5,000,000 | 4,970,240 | |
| Sound Point CLO VII-R, Ltd. Series 2021-3RA Class A1R, 3 month U.S. LIBOR + 1.070% 5.8853% 10/23/31 (b)(c)(g) | 10,250,000 | 10,110,703 | |
| Soundview Home Equity Loan Trust Series 2007-OPT1 Class 2A2, 1 month U.S. LIBOR + 0.150% 4.767% 6/25/37 (c)(g) | 9,130,335 | 5,994,372 | |
| Soundview Home Loan Trust Series 2007-NS1 Class A4, 1 month U.S. LIBOR + 0.300% 4.917% 1/25/37 (c)(g) | 7,309,000 | 6,939,203 | |
| Store Master Funding Series 2021-1A Class A1, 2.12% 6/20/51 (b) | 1,487,500 | 1,245,883 | |
| Stratus CLO, Ltd. Series 2022-1A Class A, CME TERM SOFR 3 MONTH INDEX + 1.750% 6.389% 7/20/30 (b)(c)(g) | 1,176,258 | 1,175,993 | |
| SYMP Series 2022-32A Class A1, CME TERM SOFR 3 MONTH INDEX + 1.320% 5.9735% 4/23/35 (b)(c)(g) | 7,640,000 | 7,556,319 | |
| Symphony CLO XIX, Ltd. / Symphony CLO XIX LLC Series 2018-19A Class A, 3 month U.S. LIBOR + 0.960% 5.7524% 4/16/31 (b)(c)(g) | 2,730,000 | 2,703,456 | |
| Symphony CLO XXI, Ltd. Series 2021-21A Class AR, 3 month U.S. LIBOR + 1.060% 5.8524% 7/15/32 (b)(c)(g) | 768,000 | 758,615 | |
| TCW CLO, Ltd. / TCW CLO, LLC Series 2021-1A Class A1RR, 3 month U.S. LIBOR + 1.160% 5.9677% 4/20/34 (b)(c)(g) | 5,500,000 | 5,407,666 | |
| Terwin Mortgage Trust Series 2003-4HE Class A1, 1 month U.S. LIBOR + 0.860% 5.477% 9/25/34 (c)(g) | 3,163 | 3,038 | |
| TH MSR Issuer Trust Series 2019-FT1 Class A, 1 month U.S. LIBOR + 2.800% 7.3059% 6/25/24 (b)(c)(g) | 1,250,000 | 1,168,698 | |
| Thunderbolt Aircraft Lease Ltd. Series 2018-A Class A, 4.147% 9/15/38 (b)(c) | 7,799,072 | 6,434,468 | |
| Thunderbolt III Aircraft Lease Ltd. Series 2019-1 Class A, 3.671% 11/15/39 (b) | 8,301,700 | 6,665,146 | |
| Towd Point Mortgage Trust: | |||
| Series 2019-MH1 Class A1, 3% 11/25/58 (b) | 1,929,053 | 1,894,380 | |
| Series 2020-4 Class A1, 1.75% 10/25/60 (b) | 1,975,588 | 1,746,210 | |
| Tralee CLO VII Ltd. / Tralee CLO VII LLC Series 2021-7A Class A1, 3 month U.S. LIBOR + 1.320% 6.1377% 4/25/34 (b)(c)(g) | 12,000,000 | 11,790,420 | |
| Upstart Securitization Trust: | |||
| Series 2021-2 Class A, 0.91% 6/20/31 (b) | 1,273,937 | 1,261,086 | |
| Series 2021-3 Class A, 0.83% 7/20/31 (b) | 2,915,948 | 2,863,594 | |
| Series 2021-4 Class A, 0.84% 9/20/31 (b) | 3,541,262 | 3,451,572 | |
| 3.12% 3/20/32 (b) | 2,993,016 | 2,915,144 | |
| Valley Stream Park Clo Ltd. / Vy Series 2022-1A Class A, CME TERM SOFR 3 MONTH INDEX + 2.400% 6.4714% 10/20/34 (b)(c)(g) | 6,967,000 | 6,984,829 | |
| Venture 43 CLO, Ltd. Series 2021-43A Class A1, 3 month U.S. LIBOR + 1.240% 6.0324% 4/15/34 (b)(c)(g) | 15,200,000 | 14,893,446 | |
| VOLT XCIV LLC Series 2021-NPL3 Class A1, 2.2395% 2/27/51 (b) | 16,478,044 | 15,163,196 | |
| Volt Xcv LLC Series 2021-NPL4 Class A1, 2.2396% 3/27/51 (b) | 1,919,691 | 1,750,897 | |
| Voya CLO Ltd. Series 2019-2A Class A, 3 month U.S. LIBOR + 1.270% 6.0777% 7/20/32 (b)(c)(g) | 8,868,000 | 8,800,665 | |
| Voya CLO Ltd./Voya CLO LLC: | |||
| Series 2021-2A Class A1R, 3 month U.S. LIBOR + 1.160% 5.9576% 7/19/34 (b)(c)(g) | 15,930,000 | 15,660,576 | |
| Series 2021-3A Class AR, 3 month U.S. LIBOR + 1.150% 5.9577% 10/20/34 (b)(c)(g) | 7,430,000 | 7,281,170 | |
| Voya CLO, Ltd. Series 2021-1A Class AR, 3 month U.S. LIBOR + 1.150% 5.9424% 7/16/34 (b)(c)(g) | 3,924,000 | 3,849,307 | |
| TOTAL ASSET-BACKED SECURITIES (Cost $1,058,723,713) | 1,017,273,770 | ||
| Collateralized Mortgage Obligations - 0.7% | |||
Principal Amount (a) | Value ($) | ||
| Private Sponsor - 0.5% | |||
| Ajax Mortgage Loan Trust: | |||
| sequential payer Series 2021-E Class A1, 1.74% 12/25/60 (b) | 1,618,259 | 1,317,079 | |
| Series 2022-B Class A1, 3.5% 3/27/62 (b) | 12,761,783 | 11,578,457 | |
| Alternative Loan Trust floater Series 2007-OH3 Class A1B, 1 month U.S. LIBOR + 0.440% 5.057% 9/25/47 (g) | 1,882,849 | 1,658,316 | |
| Angel Oak Mortgage Trust: | |||
| sequential payer Series 2022-6 Class A1, 4.3% 7/25/67 (b) | 8,494,908 | 8,020,044 | |
| Series 2021-6 Class A1, 1.458% 9/25/66 (b) | 3,650,525 | 2,941,720 | |
| BCAP LLC Trust sequential payer Series 2010-RR4 Class 31A6, 5.9388% 1/26/37 (b)(c) | 3,214,439 | 2,499,525 | |
| Binom Securitization Trust 202 Series 2022-RPL1 Class A1, 3% 2/25/61 (b) | 4,762,613 | 4,226,480 | |
| Brass PLC Series 2021-10A Class A1, 0.669% 4/16/69 (b)(c) | 1,920,929 | 1,831,523 | |
| BRAVO Residential Funding Trust sequential payer Series 2022-RPL1 Class A1, 2.75% 9/25/61 (b) | 7,681,620 | 6,528,989 | |
| BVEBO sequential payer Series 2022-3 Class A, 3.242% 5/29/52 (b) | 8,202,696 | 7,879,827 | |
| Cascade Funding Mortgage Trust: | |||
| Series 2021-EBO1 Class A, 0.9849% 11/25/50 (b)(c) | 3,156,988 | 2,965,077 | |
| Series 2021-HB5 Class A, 0.8006% 2/25/31 (b) | 2,340,473 | 2,264,604 | |
| Series 2021-HB6 Class A, 0.8983% 6/25/36 (b) | 2,191,333 | 2,079,179 | |
| Series 2021-HB7 Class A, 1.1512% 10/27/31 (b) | 4,066,439 | 3,815,694 | |
| CFMT Series 2022-HB10 Class A, 3.25% 11/25/35 (b) | 5,534,021 | 5,282,168 | |
| CFMT 2022-EBO2 sequential payer Series 2022-EBO2 Class A, 3.169% 7/25/54 (b) | 2,940,199 | 2,841,789 | |
| CFMT 2022-Hb8 LLC sequential payer Series 2022-HB8 Class A, 3.75% 4/25/25 (b) | 6,963,715 | 6,642,611 | |
| CFMT LLC Series 2020-HB4 Class A, 0.9461% 12/26/30 (b) | 1,456,447 | 1,414,973 | |
| CIM Trust: | |||
| sequential payer: | |||
Series 2021-R1 Class A2, 2.4% 8/25/56 (b) | 5,817,047 | 5,068,018 | |
Series 2021-R3 Class A1A, 1.951% 6/25/57 (b) | 7,427,020 | 6,524,279 | |
Series 2021-R4 Class A1A, 2% 5/1/61 (b) | 7,686,828 | 6,625,281 | |
| Series 2021-R5 Class A1A, 2% 8/25/61 (b)(c) | 6,841,405 | 5,698,574 | |
| Series 2022-NR1 Class A1, 5% 7/25/62 (b) | 4,013,806 | 3,654,149 | |
| Citigroup Mortgage Loan Trust Series 2005-9 Class 22A1, 6% 11/25/35 | 1,185,221 | 1,051,895 | |
| Connecticut Ave Securities Trust 2019-R floater Series 2019-R07 Class 1B1, 1 month U.S. LIBOR + 3.400% 8.017% 10/25/39 (b)(c)(g) | 3,500,000 | 3,472,681 | |
| Connecticut Avenue Securities floater Series 2022-R03 Class 1B1, U.S. 30-Day Avg. Secured Overnight Fin. Rate (SOFR) Index + 6.250% 10.7341% 3/25/42 (b)(c)(g) | 130,000 | 135,688 | |
| Connecticut Avenue Securities Trust floater Series 2020-R01 Class 1M2, 1 month U.S. LIBOR + 2.050% 6.667% 1/25/40 (b)(c)(g) | 320,069 | 321,209 | |
| Credit Suisse Mortgage Trust Series 2021-RP11 Class PT, 3.7771% 10/25/61 (b)(c) | 8,155,356 | 6,194,875 | |
| CSMC floater Series 2015-1R Class 6A1, 1 month U.S. LIBOR + 0.280% 4.6105% 5/27/37 (b)(c)(g) | 157,466 | 151,053 | |
| CSMC Trust: | |||
| sequential payer: | |||
Series 2020-RPL2 Class A12, 3.4555% 2/25/60 (b)(c) | 597,527 | 588,884 | |
Series 2020-RPL3 Class A1, 2.691% 3/25/60 (b)(c) | 5,142,162 | 4,977,448 | |
Series 2022-RPL1 Class A1, 4.15% 4/25/61 (b)(c) | 7,605,673 | 6,748,372 | |
Series 2022-RPL3 Class A1, 3.6739% 3/25/61 (b)(c) | 12,019,406 | 11,872,385 | |
| Series 2021-RP11 Class CERT, 3.7778% 10/27/61 (b) | 344,966 | 259,847 | |
| Series 2022-RPL1 Class PT, 4.4297% 4/25/61 (b)(c) | 9,284,812 | 8,058,207 | |
| Csmcm 2022-Rpl1 Trust Series 2022-RPL1 Class CERT, 4.231% 4/25/61 (b) | 390,271 | 333,866 | |
| CWALT, Inc. Series 2005-13CB Class A8, 5.5% 5/25/35 | 1,907,431 | 1,583,299 | |
| Eagle Re 2019-1 Ltd. floater Series 2019-1 Class M2, 1 month U.S. LIBOR + 3.300% 7.917% 4/25/29 (b)(c)(g) | 2,558,000 | 2,585,896 | |
| Eagle Re Ltd. floater Series 2021-1: | |||
| Class M1B, U.S. 30-Day Avg. Secured Overnight Fin. Rate (SOFR) Index + 2.150% 6.6341% 10/25/33 (b)(c)(g) | 317,312 | 317,318 | |
| Class M1C, U.S. 30-Day Avg. Secured Overnight Fin. Rate (SOFR) Index + 2.700% 7.1841% 10/25/33 (b)(c)(g) | 1,735,000 | 1,736,687 | |
| Finance of America HECM Buyout sequential payer Series 2022-HB1 Class A, 2.6948% 2/25/32 (b)(c) | 7,464,913 | 7,204,422 | |
| GMAC Mortgage Loan Trust Series 2005-AR6 Class 2A1, 3.3488% 11/19/35 (c) | 1,675,342 | 1,380,509 | |
| GSR Mortgage Loan Trust floater Series 2006-OA1 Class 1A1, 1 month U.S. LIBOR + 0.440% 4.837% 8/25/46 (c)(g) | 18,144,712 | 4,356,865 | |
| J.P. Morgan Mortgage Trust Series 2021-13 Class A3, 2.5% 4/25/52 (b) | 12,752,420 | 10,340,917 | |
| Legacy Mortgage Asset Trust sequential payer: | |||
| Series 2020-GS2 Class A1, 2.75% 3/25/60 (b)(c) | 12,484,338 | 12,094,660 | |
| Series 2021-SL1 Class A, 1.991% 9/25/60 (b) | 705,998 | 694,896 | |
| Merrill Lynch Mortgage Investors Trust floater Series 2006-A2 Class 1A, 1 month U.S. LIBOR + 0.180% 4.797% 2/25/36 (g) | 6,061,738 | 3,751,144 | |
| New Residential Mortgage Loan Trust Series 2020-1A Class A1B, 3.5% 10/25/59 (b) | 1,968,296 | 1,788,976 | |
| New York Mortgage Trust sequential payer Series 2021-SP1 Class A1, 1.6696% 8/25/61 (b) | 4,433,934 | 3,975,632 | |
| NMLT Trust Series 2021-INV3 2.2769% 11/25/56 (b) | 6,036,399 | 5,446,949 | |
| NYMT Loan Trust sequential payer Series 2021-CP1 Class A1, 2.0424% 7/25/61 (b) | 4,213,044 | 3,685,563 | |
| OBX Trust sequential payer Series 2021-NQM3 Class A1, 1.054% 7/25/61 (b) | 13,903,619 | 10,801,545 | |
| Preston Ridge Partners Mortgage Trust: | |||
| Series 2021-1 Class A1, 2.115% 1/25/26 (b) | 12,604,186 | 11,981,852 | |
| Series 2021-2 Class A1, 2.115% 3/25/26 (b) | 10,156,748 | 9,563,847 | |
| Series 2021-RPL1 Class A1, 1.319% 7/25/51 (b) | 1,835,823 | 1,606,987 | |
| Series 2021-RPL2 Class A1, 1.455% 10/25/51 (b)(c) | 2,430,587 | 2,142,792 | |
| PRET LLC sequential payer Series 2022-RN2 Class A1, 5% 6/25/52 (b) | 9,337,189 | 8,667,539 | |
| RALI Trust: | |||
| Series 2006-QS4 Class A4, 6% 4/25/36 | 1,492,112 | 1,163,469 | |
| Series 2007-QS3 Class A5, 6.25% 2/25/37 | 2,328,952 | 1,867,608 | |
| Series 2007-QS8 Class A5, 6% 6/25/37 | 880,169 | 685,331 | |
| Retiro Mortgage Securities floater Series 2021-1A Class A1, 2.000% x 3 month EURIBOR 4.468% 7/30/75 (b)(c)(g) | EUR | 712,943 | 721,190 |
| RMF Buyout Issuance Trust: | |||
| sequential payer Series 2022-HB1 Class A, 4.272% 4/25/32 (b) | 2,363,560 | 2,279,722 | |
| Series 2020-HB1 Class A1, 1.7188% 10/25/50 (b) | 1,374,550 | 1,248,287 | |
| Sequoia Mortgage Trust floater Series 2004-6 Class A3B, 6 month U.S. LIBOR + 0.880% 6.0669% 7/20/34 (c)(g) | 701 | 626 | |
| Thornburg Mortgage Securities Trust floater Series 2003-4 Class A1, 1 month U.S. LIBOR + 0.640% 5.257% 9/25/43 (c)(g) | 1,259,431 | 1,174,314 | |
| WaMu Mortgage pass-thru certificates floater Series 2005-AR2 Class 2A1B, 1 month U.S. LIBOR + 0.740% 5.357% 1/25/45 (g) | 1,156,426 | 1,100,642 | |
TOTAL PRIVATE SPONSOR | 263,474,250 | ||
| U.S. Government Agency - 0.2% | |||
| Fannie Mae: | |||
| floater Series 2022-R04 Class 1B1, U.S. 30-Day Avg. Secured Overnight Fin. Rate (SOFR) Index + 5.250% 9.7341% 3/25/42 (b)(c)(g) | 240,000 | 244,909 | |
| planned amortization class Series 2012-149: | |||
Class DA, 1.75% 1/25/43 | 600,712 | 542,475 | |
Class GA, 1.75% 6/25/42 | 650,582 | 583,413 | |
| Series 2005-79 Class ZC, 5.9% 9/25/35 | 174,385 | 174,537 | |
| Series 2007-75 Class JI, 6.540% - 1 month U.S. LIBOR 1.928% 8/25/37 (c)(m)(n) | 563,326 | 54,092 | |
| Series 2010-135 Class ZA, 4.5% 12/25/40 | 340,443 | 335,820 | |
| Series 2010-150 Class ZC, 4.75% 1/25/41 | 540,546 | 528,768 | |
| Series 2010-95 Class ZC, 5% 9/25/40 | 1,257,833 | 1,258,408 | |
| Series 2011-4 Class PZ, 5% 2/25/41 | 177,897 | 169,135 | |
| Series 2012-100 Class WI, 3% 9/25/27 (m) | 226,154 | 9,780 | |
| Series 2012-14 Class JS, 6.650% - 1 month U.S. LIBOR 2.033% 12/25/30 (c)(m)(n) | 22,672 | 114 | |
| Series 2012-9 Class SH, 6.550% - 1 month U.S. LIBOR 1.933% 6/25/41 (c)(m)(n) | 20,700 | 170 | |
| Series 2013-133 Class IB, 3% 4/25/32 (m) | 82,054 | 2,444 | |
| Series 2013-134 Class SA, 6.050% - 1 month U.S. LIBOR 1.433% 1/25/44 (c)(m)(n) | 81,622 | 7,651 | |
| Series 2013-44 Class DJ, 1.85% 5/25/33 | 5,785,979 | 5,196,121 | |
| Series 2013-51 Class GI, 3% 10/25/32 (m) | 405,270 | 24,627 | |
| Series 2015-42 Class IL, 6% 6/25/45 (m) | 542,412 | 93,871 | |
| Series 2015-70 Class JC, 3% 10/25/45 | 451,310 | 422,954 | |
| Series 2017-30 Class AI, 5.5% 5/25/47 (m) | 318,058 | 56,044 | |
| Freddie Mac: | |||
| planned amortization class: | |||
Series 2020-4960 Class PB, 1.5% 10/25/49 | 2,287,716 | 1,884,559 | |
Series 4135 Class AB, 1.75% 6/15/42 | 474,698 | 428,370 | |
| sequential payer Series 3871 Class KB, 5.5% 6/15/41 | 394,102 | 404,744 | |
| Series 2017-4683 Class LM, 3% 5/15/47 | 666,316 | 625,353 | |
| Series 2933 Class ZM, 5.75% 2/15/35 | 367,297 | 373,493 | |
| Series 2996 Class ZD, 5.5% 6/15/35 | 235,423 | 239,634 | |
| Series 3237 Class C, 5.5% 11/15/36 | 308,715 | 309,257 | |
| Series 3980 Class EP, 5% 1/15/42 | 1,660,112 | 1,662,524 | |
| Series 4055 Class BI, 3.5% 5/15/31 (m) | 78,385 | 2,120 | |
| Series 4149 Class IO, 3% 1/15/33 (m) | 221,249 | 17,763 | |
| Series 4314 Class AI, 5% 3/15/34 (m) | 25,129 | 795 | |
| Series 4427 Class LI, 3.5% 2/15/34 (m) | 248,710 | 15,189 | |
| Series 4471 Class PA 4% 12/15/40 | 221,225 | 214,823 | |
| Freddie Mac Multi-family Structured pass-thru certificates Series 4386 Class AZ, 4.5% 11/15/40 | 476,864 | 461,021 | |
| Freddie Mac STACR REMIC Trust floater: | |||
| Series 2019-DNA4 Class B1, 1 month U.S. LIBOR + 2.700% 7.317% 10/25/49 (b)(c)(g) | 9,700,000 | 9,702,323 | |
| Series 2020-DNA6 Class B1, U.S. 30-Day Avg. Secured Overnight Fin. Rate (SOFR) Index + 3.000% 7.4841% 12/25/50 (b)(c)(g) | 3,910,000 | 3,783,021 | |
| Series 2021-DNA2 Class B1, U.S. 30-Day Avg. Secured Overnight Fin. Rate (SOFR) Index + 3.400% 7.8841% 8/25/33 (b)(c)(g) | 4,380,000 | 4,211,541 | |
| Series 2021-HQA1: | |||
Class B1, U.S. 30-Day Avg. Secured Overnight Fin. Rate (SOFR) Index + 3.000% 7.4841% 8/25/33 (b)(c)(g) | 2,700,000 | 2,431,648 | |
Class M2, U.S. 30-Day Avg. Secured Overnight Fin. Rate (SOFR) Index + 2.250% 6.7341% 8/25/33 (b)(c)(g) | 3,900,000 | 3,810,407 | |
| Series 2022-DNA3 Class M1B, U.S. 30-Day Avg. Secured Overnight Fin. Rate (SOFR) Index + 2.900% 7.3841% 4/25/42 (b)(c)(g) | 8,000,000 | 7,976,254 | |
| Freddie Mac. STACR REMIC Trust floater Series 2020-DNA1 Class B1, 1 month U.S. LIBOR + 2.300% 6.917% 1/25/50 (b)(c)(g) | 6,600,000 | 6,500,203 | |
| Ginnie Mae guaranteed REMIC pass-thru certificates: | |||
| floater: | |||
Series 2010-H27 Class FA, 1 month U.S. LIBOR + 0.380% 4.7716% 12/20/60 (c)(g)(o) | 667,320 | 663,328 | |
Series 2011-H20 Class FA, 1 month U.S. LIBOR + 0.550% 4.9416% 9/20/61 (c)(g)(o) | 2,404,226 | 2,396,318 | |
Series 2012-H18 Class NA, 1 month U.S. LIBOR + 0.520% 4.9116% 8/20/62 (c)(g)(o) | 337,784 | 336,555 | |
Series 2012-H21 Class DF, 1 month U.S. LIBOR + 0.650% 4.8391% 5/20/61 (c)(g)(o) | 4,734 | 4,688 | |
Series 2013-H19 Class FC, 1 month U.S. LIBOR + 0.600% 4.9916% 8/20/63 (c)(g)(o) | 630,150 | 628,927 | |
Series 2019-128 Class FH, 1 month U.S. LIBOR + 0.500% 5.0979% 10/20/49 (c)(g) | 248,337 | 243,070 | |
Series 2019-23 Class NF, 1 month U.S. LIBOR + 0.450% 5.0479% 2/20/49 (c)(g) | 1,153,121 | 1,138,902 | |
| planned amortization class: | |||
Series 2010-158 Class MS, 10.000% - 1 month U.S. LIBOR 0.8043% 12/20/40 (c)(n) | 483,144 | 400,453 | |
Series 2016-69 Class WA, 3% 2/20/46 | 295,374 | 273,246 | |
Series 2017-134 Class BA, 2.5% 11/20/46 | 704,852 | 633,400 | |
| sequential payer: | |||
Series 2010-160 Class DY, 4% 12/20/40 | 993,185 | 955,965 | |
Series 2010-170 Class B, 4% 12/20/40 | 221,045 | 212,759 | |
Series 2017-139 Class BA, 3% 9/20/47 | 2,967,177 | 2,654,771 | |
| Series 2010-116 Class QB, 4% 9/16/40 | 1,683,370 | 1,629,759 | |
| Series 2010-14 Class SN, 5.950% - 1 month U.S. LIBOR 1.36% 2/16/40 (c)(m)(n) | 289,403 | 15,002 | |
| Series 2011-94 Class SA, 6.100% - 1 month U.S. LIBOR 1.5021% 7/20/41 (c)(m)(n) | 73,454 | 6,257 | |
| Series 2013-149 Class MA, 2.5% 5/20/40 | 769,435 | 733,180 | |
| Series 2015-H13 Class HA, 2.5% 8/20/64 (o) | 6,638 | 6,175 | |
| Series 2017-H06 Class FA, U.S. TREASURY 1 YEAR INDEX + 0.350% 5.08% 8/20/66 (c)(g)(o) | 1,549,725 | 1,542,930 | |
TOTAL U.S. GOVERNMENT AGENCY | 69,236,060 | ||
| TOTAL COLLATERALIZED MORTGAGE OBLIGATIONS (Cost $360,860,752) | 332,710,310 | ||
| Commercial Mortgage Securities - 1.8% | |||
Principal Amount (a) | Value ($) | ||
| 20 Times Square Trust 2018-20Ts Series 2018-20TS Class F, 3.0999% 5/15/35 (b)(c) | 2,310,559 | 1,736,034 | |
| 3650R Commercial Mortgage Trust sequential payer Series 2021-PF1 Class A4, 2.253% 11/15/54 | 4,200,000 | 3,390,107 | |
| Arbor Multifamily Mortgage Securities Trust sequential payer Series 2021-MF2 Class A4, 2.2515% 6/15/54 (b) | 9,500,000 | 7,601,589 | |
| Ashford Hospitality Trust floater Series 2018-ASHF Class A, 1 month U.S. LIBOR + 0.900% 5.488% 4/15/35 (b)(c)(g) | 3,546,916 | 3,466,810 | |
| BAMLL Commercial Mortgage Securities Trust: | |||
| floater Series 2022-DKLX: | |||
Class A, CME Term SOFR 1 Month Index + 1.150% 5.713% 1/15/39 (b)(c)(g) | 4,172,000 | 4,110,953 | |
Class B, CME Term SOFR 1 Month Index + 1.550% 6.113% 1/15/39 (b)(c)(g) | 789,000 | 775,921 | |
Class C, CME Term SOFR 1 Month Index + 2.150% 6.713% 1/15/39 (b)(c)(g) | 562,000 | 547,685 | |
| sequential payer Series 2019-BPR: | |||
Class AMP, 3.287% 11/5/32 (b) | 6,500,000 | 5,949,803 | |
Class ANM, 3.112% 11/5/32 (b) | 4,963,000 | 4,529,419 | |
| Series 2019-BPR: | |||
Class BNM, 3.465% 11/5/32 (b) | 1,113,000 | 931,673 | |
Class CNM, 3.7186% 11/5/32 (b)(c) | 461,000 | 365,583 | |
| BANK: | |||
| sequential payer: | |||
Series 2019-BN21: | |||
| Class A4, 2.6% 10/17/52 | 4,400,000 | 3,812,926 | |
| Class A5, 2.851% 10/17/52 | 838,000 | 727,443 | |
Series 2020-BN28 Class A3, 1.584% 3/15/63 | 9,000,000 | 7,122,840 | |
Series 2021-BN31 Class A3, 1.771% 2/15/54 | 2,000,000 | 1,575,547 | |
Series 2021-BN32 Class A4, 2.349% 4/15/54 | 20,000,000 | 16,509,212 | |
Series 2021-BN33 Class A4, 2.27% 5/15/64 | 9,000,000 | 7,378,070 | |
| Series 2020-BN25 Class XB, 0.4397% 1/15/63 (c)(m) | 5,200,000 | 126,538 | |
| Series 2021-BN31 Class XB, 0.8714% 2/15/54 (c)(m) | 7,000,000 | 367,206 | |
| Series 2021-BN33 Class XA, 1.0572% 5/15/64 (c)(m) | 13,447,896 | 774,042 | |
| Series 2021-BN34 Class XB, 0.5173% 6/15/63 (c)(m) | 171,794,000 | 5,786,280 | |
| Bayview Commercial Asset Trust floater: | |||
| Series 2005-3A Class A2, 1 month U.S. LIBOR + 0.600% 5.217% 11/25/35 (b)(c)(g) | 15,383 | 14,126 | |
| Series 2005-4A: | |||
Class A2, 1 month U.S. LIBOR + 0.580% 5.202% 1/25/36 (b)(c)(g) | 37,583 | 34,519 | |
Class M1, 1 month U.S. LIBOR + 0.670% 5.292% 1/25/36 (b)(c)(g) | 12,131 | 11,061 | |
| Series 2006-4A Class A2, 1 month U.S. LIBOR + 0.400% 5.022% 12/25/36 (b)(c)(g) | 80,575 | 74,636 | |
| Series 2007-1 Class A2, 1 month U.S. LIBOR + 0.270% 5.022% 3/25/37 (b)(c)(g) | 21,058 | 19,091 | |
| Series 2007-2A: | |||
Class A1, 1 month U.S. LIBOR + 0.270% 4.887% 7/25/37 (b)(c)(g) | 64,656 | 57,599 | |
Class A2, 1 month U.S. LIBOR + 0.320% 4.937% 7/25/37 (b)(c)(g) | 60,535 | 55,281 | |
Class M1, 1 month U.S. LIBOR + 0.370% 4.987% 7/25/37 (b)(c)(g) | 20,605 | 18,658 | |
| Series 2007-3: | |||
Class A2, 1 month U.S. LIBOR + 0.290% 4.907% 7/25/37 (b)(c)(g) | 22,168 | 19,873 | |
Class M1, 1 month U.S. LIBOR + 0.310% 4.927% 7/25/37 (b)(c)(g) | 11,748 | 10,531 | |
Class M2, 1 month U.S. LIBOR + 0.340% 4.957% 7/25/37 (b)(c)(g) | 12,565 | 11,176 | |
Class M3, 1 month U.S. LIBOR + 0.370% 4.987% 7/25/37 (b)(c)(g) | 20,125 | 17,137 | |
Class M4, 1 month U.S. LIBOR + 0.500% 5.117% 7/25/37 (b)(c)(g) | 31,771 | 27,020 | |
Class M5, 1 month U.S. LIBOR + 0.600% 5.217% 7/25/37 (b)(c)(g) | 15,120 | 16,359 | |
| BBCMS Mortgage Trust sequential payer: | |||
| Series 2019-C4 Class A4, 2.661% 8/15/52 | 4,000,000 | 3,508,076 | |
| Series 2021-C9 Class A4, 2.021% 2/15/54 | 10,000,000 | 8,070,368 | |
| Benchmark Commercial Mortgage Trust Series 2018-B3 Class A3, 3.746% 4/10/51 | 1,700,000 | 1,644,017 | |
| Benchmark Mortgage Trust: | |||
| sequential payer: | |||
Series 2018-B4 Class A5, 4.121% 7/15/51 | 949,000 | 900,255 | |
Series 2019-B10 Class A4, 3.717% 3/15/62 | 1,673,000 | 1,539,332 | |
Series 2019-B13 Class A4, 2.952% 8/15/57 | 7,629,000 | 6,674,714 | |
Series 2020-B18 Class A4, 1.672% 7/15/53 | 10,000,000 | 7,923,940 | |
Series 2020-B19: | |||
| Class A3, 1.787% 9/15/53 | 5,800,000 | 5,072,036 | |
| Class A4, 1.546% 9/15/53 | 12,500,000 | 10,045,844 | |
Series 2020-B22 Class A4, 1.685% 1/15/54 | 3,175,000 | 2,507,542 | |
Series 2021-B23 Class A4A1, 1.823% 2/15/54 | 2,000,000 | 1,581,648 | |
Series 2021-B24 Class A4, 2.2638% 3/15/54 | 17,600,000 | 14,439,156 | |
Series 2021-B26 Class A4, 2.295% 6/15/54 | 8,800,000 | 7,227,158 | |
| Series 2019-B12 Class XA, 1.0324% 8/15/52 (c)(m) | 38,800,173 | 1,569,071 | |
| Series 2019-B14 Class XA, 0.7766% 12/15/62 (c)(m) | 22,687,733 | 702,356 | |
| BFLD Trust floater sequential payer Series 2020-OBRK Class A, CME Term SOFR 1 Month Index + 2.160% 6.7265% 11/15/28 (b)(c)(g) | 7,501,000 | 7,442,915 | |
| BHMS floater Series 2018-ATLS Class A, 1 month U.S. LIBOR + 1.250% 5.8379% 7/15/35 (b)(c)(g) | 10,931,821 | 10,728,155 | |
| BLOX Trust floater sequential payer Series 2021-BLOX Class A, 1 month U.S. LIBOR + 0.750% 5.338% 9/15/26 (b)(c)(g) | 8,921,000 | 8,433,255 | |
| BMO Mortgage Trust sequential payer Series 2022-C1 Class A4, 3.119% 2/17/55 | 6,200,000 | 5,305,166 | |
| BPR Trust floater Series 2022-OANA: | |||
| Class A, CME Term SOFR 1 Month Index + 1.890% 6.4605% 4/15/37 (b)(c)(g) | 15,784,000 | 15,497,724 | |
| Class B, CME Term SOFR 1 Month Index + 2.440% 7.0095% 4/15/37 (b)(c)(g) | 4,626,000 | 4,539,206 | |
| BX Commercial Mortgage Trust: | |||
| floater: | |||
Series 2021-CIP Class E, 1 month U.S. LIBOR + 2.820% 7.408% 12/15/38 (b)(c)(g) | 10,350,000 | 9,805,432 | |
Series 2021-PAC: | |||
| Class A, 1 month U.S. LIBOR + 0.680% 5.2771% 10/15/36 (b)(c)(g) | 8,026,000 | 7,842,959 | |
| Class B, 1 month U.S. LIBOR + 0.890% 5.4868% 10/15/36 (b)(c)(g) | 1,201,000 | 1,160,853 | |
| Class C, 1 month U.S. LIBOR + 1.090% 5.6866% 10/15/36 (b)(c)(g) | 1,607,000 | 1,554,018 | |
| Class D, 1 month U.S. LIBOR + 1.290% 5.8863% 10/15/36 (b)(c)(g) | 1,560,000 | 1,493,291 | |
| Class E, 1 month U.S. LIBOR + 1.940% 6.5355% 10/15/36 (b)(c)(g) | 5,425,000 | 5,216,540 | |
Series 2021-VINO Class A, 1 month U.S. LIBOR + 0.650% 5.2403% 5/15/38 (b)(c)(g) | 5,200,000 | 5,089,215 | |
Series 2022-CSMO: | |||
| Class A, CME Term SOFR 1 Month Index + 2.110% 6.6773% 6/15/27 (b)(c)(g) | 6,438,000 | 6,433,969 | |
| Class B, CME Term SOFR 1 Month Index + 3.140% 7.7032% 6/15/27 (b)(c)(g) | 3,795,000 | 3,787,873 | |
| floater sequential payer Series 2019-CALM Class A, CME Term SOFR 1 Month Index + 0.990% 5.5525% 11/15/32 (b)(c)(g) | 2,389,891 | 2,374,912 | |
| BX Trust: | |||
| floater: | |||
Series 2018-EXCL Class D, 1 month U.S. LIBOR + 2.620% 7.213% 9/15/37 (b)(c)(g) | 1,952,300 | 1,816,322 | |
Series 2019-IMC: | |||
| Class B, 1 month U.S. LIBOR + 1.300% 5.888% 4/15/34 (b)(c)(g) | 4,464,000 | 4,340,384 | |
| Class C, 1 month U.S. LIBOR + 1.600% 6.188% 4/15/34 (b)(c)(g) | 2,952,000 | 2,847,964 | |
| Class D, 1 month U.S. LIBOR + 1.900% 6.488% 4/15/34 (b)(c)(g) | 3,099,000 | 2,974,184 | |
Series 2019-XL: | |||
| Class B, CME Term SOFR 1 Month Index + 1.190% 5.757% 10/15/36 (b)(c)(g) | 4,429,350 | 4,384,844 | |
| Class C, CME Term SOFR 1 Month Index + 1.360% 5.927% 10/15/36 (b)(c)(g) | 4,286,550 | 4,232,808 | |
| Class D, CME Term SOFR 1 Month Index + 1.560% 6.127% 10/15/36 (b)(c)(g) | 7,863,350 | 7,734,962 | |
| Class E, CME Term SOFR 1 Month Index + 1.910% 6.477% 10/15/36 (b)(c)(g) | 8,530,600 | 8,378,197 | |
| Class G, CME Term SOFR 1 Month Index + 2.410% 6.977% 10/15/36 (b)(c)(g) | 15,725,000 | 15,349,773 | |
| Class J, CME Term SOFR 1 Month Index + 2.760% 7.327% 10/15/36 (b)(c)(g) | 6,162,500 | 6,006,054 | |
Series 2021-SOAR Class F, 6.938% 6/15/38 (b)(c) | 3,969,927 | 3,808,653 | |
Series 2022-GPA Class A, CME Term SOFR 1 Month Index + 2.160% 6.7275% 10/15/39 (b)(c)(g) | 4,233,000 | 4,225,051 | |
Series 2022-IND: | |||
| Class A, CME Term SOFR 1 Month Index + 1.490% 6.0528% 4/15/37 (b)(c)(g) | 7,293,179 | 7,277,214 | |
| Class B, CME Term SOFR 1 Month Index + 1.940% 6.5018% 4/15/37 (b)(c)(g) | 3,718,476 | 3,694,057 | |
| Class C, CME Term SOFR 1 Month Index + 2.290% 6.8518% 4/15/37 (b)(c)(g) | 839,294 | 818,036 | |
| Class D, CME Term SOFR 1 Month Index + 2.830% 7.4008% 4/15/37 (b)(c)(g) | 702,057 | 677,030 | |
| floater sequential payer: | |||
Series 2019-IMC Class A, 1 month U.S. LIBOR + 1.000% 5.588% 4/15/34 (b)(c)(g) | 7,500,000 | 7,367,828 | |
Series 2019-XL Class A, CME Term SOFR 1 Month Index + 1.030% 5.597% 10/15/36 (b)(c)(g) | 16,719,574 | 16,635,573 | |
Series 2021-MFM1 Class A, CME Term SOFR 1 Month Index + 0.810% 5.3765% 1/15/34 (b)(c)(g) | 3,220,922 | 3,170,524 | |
| BXMT, Ltd. floater Series 2020-FL3 Class A, U.S. 30-Day Avg. Secured Overnight Fin. Rate (SOFR) Index + 1.400% 5.9324% 11/15/37 (b)(g) | 13,100,000 | 12,927,814 | |
| BXSC Commercial Mortgage Trust floater Series 2022-WSS Class D, CME Term SOFR 1 Month Index + 3.180% 7.751% 3/15/35 (b)(c)(g) | 8,167,000 | 8,106,112 | |
| CAMB Commercial Mortgage Trust floater Series 2019-LIFE Class A, 1 month U.S. LIBOR + 1.070% 5.658% 12/15/37 (b)(c)(g) | 3,800,000 | 3,786,885 | |
| Camb Commercial Mortgage Trust sequential payer Series 2021-CX2 Class A, 2.7% 11/10/46 (b) | 7,000,000 | 5,636,462 | |
| CD Commercial Mortgage Trust Series 2017-CD6 Class A3, 3.104% 11/13/50 | 2,500,000 | 2,392,733 | |
| CF Hippolyta Issuer LLC sequential payer: | |||
| Series 2020-1: | |||
Class A1, 1.69% 7/15/60 (b) | 16,635,000 | 14,893,492 | |
Class A2, 1.99% 7/15/60 (b) | 6,558,423 | 5,514,231 | |
| Series 2021-1A Class A1, 1.53% 3/15/61 (b) | 8,463,550 | 7,349,675 | |
| CF Mortgage Trust sequential payer Series 2019-CF2 Class A4, 2.6236% 11/15/52 | 850,000 | 728,276 | |
| CFCRE Mortgage Trust sequential payer Series 2016-C6 Class A2, 2.95% 11/10/49 | 939,742 | 863,521 | |
| CGDB Commercial Mortgage Trust floater Series 2019-MOB: | |||
| Class A, 1 month U.S. LIBOR + 0.950% 5.5379% 11/15/36 (b)(c)(g) | 3,687,000 | 3,631,442 | |
| Class B, 1 month U.S. LIBOR + 1.250% 5.8379% 11/15/36 (b)(c)(g) | 1,400,000 | 1,375,389 | |
| CHC Commercial Mortgage Trust floater Series 2019-CHC: | |||
| Class A, 1 month U.S. LIBOR + 1.120% 5.708% 6/15/34 (b)(c)(g) | 13,951,649 | 13,559,386 | |
| Class B, 1 month U.S. LIBOR + 1.500% 6.088% 6/15/34 (b)(c)(g) | 2,103,119 | 2,017,502 | |
| Class C, 1 month U.S. LIBOR + 1.750% 6.338% 6/15/34 (b)(c)(g) | 2,376,058 | 2,229,501 | |
| CIM Retail Portfolio Trust floater Series 2021-RETL: | |||
| Class C, 1 month U.S. LIBOR + 2.300% 6.888% 8/15/36 (b)(c)(g) | 51,424 | 51,779 | |
| Class D, 1 month U.S. LIBOR + 3.050% 7.638% 8/15/36 (b)(c)(g) | 1,070,250 | 1,072,579 | |
| Citigroup Commercial Mortgage Trust: | |||
| sequential payer: | |||
Series 2015-GC33 Class A3, 3.515% 9/10/58 | 1,584,037 | 1,505,487 | |
Series 2016-GC37 Class A3, 3.05% 4/10/49 | 2,190,826 | 2,046,296 | |
| Series 2013-GC17 Class A/S, 4.544% 11/10/46 | 2,300,000 | 2,260,129 | |
| Series 2014-GC25 Class A/S, 4.017% 10/10/47 | 1,183,000 | 1,120,661 | |
| Series 2015-GC29 Class XA, 1.0164% 4/10/48 (c)(m) | 28,762,466 | 489,744 | |
| Series 2015-GC33: | |||
Class AAB, 3.522% 9/10/58 | 527,501 | 510,830 | |
Class XA, 0.8719% 9/10/58 (c)(m) | 17,321,959 | 304,633 | |
| Series 2016-C2 Class A3, 2.575% 8/10/49 | 2,705,173 | 2,481,894 | |
| Series 2016-GC36 Class A4, 3.349% 2/10/49 | 2,500,000 | 2,353,846 | |
| Series 2016-P6 Class XA, 0.5604% 12/10/49 (c)(m) | 12,558,346 | 212,642 | |
| COMM Mortgage Trust: | |||
| sequential payer: | |||
Series 2013-CR7 Class AM, 3.314% 3/10/46 (b) | 1,700,000 | 1,693,270 | |
Series 2014-CR18 Class A5, 3.828% 7/15/47 | 1,610,000 | 1,562,899 | |
Series 2016-COR1 Class A3, 2.826% 10/10/49 | 7,520,414 | 6,951,078 | |
| Series 2013-LC13 Class AM, 4.557% 8/10/46 (b) | 1,000,000 | 987,974 | |
| Series 2014-CR17 Class XA, 0.9469% 5/10/47 (c)(m) | 17,299,540 | 130,762 | |
| Series 2014-CR20 Class XA, 0.9434% 11/10/47 (c)(m) | 15,676,830 | 187,550 | |
| Series 2014-LC17 Class XA, 0.6616% 10/10/47 (c)(m) | 30,719,688 | 245,420 | |
| Series 2014-UBS6: | |||
Class A5, 3.644% 12/10/47 | 3,900,000 | 3,752,786 | |
Class XA, 0.8349% 12/10/47 (c)(m) | 9,140,052 | 100,116 | |
| Series 2015-CR23 Class A3, 3.23% 5/10/48 | 2,206,945 | 2,118,410 | |
| Series 2015-CR24 Class A4, 3.432% 8/10/48 | 924,844 | 884,556 | |
| Series 2015-PC1 Class A4, 3.62% 7/10/50 | 806,614 | 779,416 | |
| Credit Suisse Mortgage Trust: | |||
| floater Series 2019-ICE4: | |||
Class A, 1 month U.S. LIBOR + 0.980% 5.568% 5/15/36 (b)(c)(g) | 7,973,164 | 7,933,134 | |
Class C, 1 month U.S. LIBOR + 1.430% 6.018% 5/15/36 (b)(c)(g) | 1,517,225 | 1,501,954 | |
| sequential payer Series 2020-NET Class A, 2.2569% 8/15/37 (b) | 2,201,900 | 1,978,117 | |
| Series 2018-SITE: | |||
Class A, 4.284% 4/15/36 (b) | 5,237,000 | 5,019,684 | |
Class B, 4.5349% 4/15/36 (b) | 1,543,000 | 1,460,979 | |
Class C, 4.782% 4/15/36 (b)(c) | 1,033,000 | 974,976 | |
Class D, 4.782% 4/15/36 (b)(c) | 2,066,000 | 1,920,545 | |
| CSAIL Commercial Mortgage Trust: | |||
| sequential payer Series 2021-C20 Class A2, 2.4862% 3/15/54 | 15,312,358 | 12,893,943 | |
| Series 2016-C7 Class A4, 3.21% 11/15/49 | 3,186,022 | 2,989,218 | |
| CSMC Commercial Mortgage Trust sequential payer Series 2016-NXSR Class A4, 3.7948% 12/15/49 | 2,000,000 | 1,881,300 | |
| CSMC Trust sequential payer Series 2014-U.S.A. Class A2, 3.953% 9/15/37 (b) | 2,001,000 | 1,804,434 | |
| DBJPM Mortgage Trust sequential payer Series 2017-C6 Class A3, 3.269% 6/10/50 | 1,128,388 | 1,091,130 | |
| DOLP Trust sequential payer Series 2021-NYC Class A, 2.956% 5/10/41 (b) | 13,500,000 | 10,851,114 | |
| ELP Commercial Mortgage Trust floater Series 2021-ELP: | |||
| Class A, 1 month U.S. LIBOR + 0.700% 5.289% 11/15/38 (b)(c)(g) | 10,980,000 | 10,691,098 | |
| Class B, 1 month U.S. LIBOR + 1.120% 5.7082% 11/15/38 (b)(c)(g) | 975,000 | 947,131 | |
| Class F, 1 month U.S. LIBOR + 2.660% 7.255% 11/15/38 (b)(c)(g) | 1,000,000 | 948,636 | |
| Extended Stay America Trust floater Series 2021-ESH: | |||
| Class A, 1 month U.S. LIBOR + 1.080% 5.668% 7/15/38 (b)(c)(g) | 4,751,128 | 4,679,683 | |
| Class B, 1 month U.S. LIBOR + 1.380% 5.968% 7/15/38 (b)(c)(g) | 2,054,885 | 2,021,599 | |
| Class C, 1 month U.S. LIBOR + 1.700% 6.288% 7/15/38 (b)(c)(g) | 1,515,050 | 1,484,675 | |
| Class D, 1 month U.S. LIBOR + 2.250% 6.838% 7/15/38 (b)(c)(g) | 3,061,339 | 2,992,292 | |
| Freddie Mac: | |||
| sequential payer: | |||
Series 2021-K136 Class A2, 2.127% 11/25/31 | 500,000 | 414,667 | |
Series 2022-150 Class A2, 3.71% 9/25/32 | 2,600,000 | 2,443,295 | |
Series 2022-5250 Class NH, 3% 8/25/52 | 12,570,000 | 10,660,640 | |
| Series 2019-K095 Class X1, 0.9498% 6/25/29 (c)(m) | 13,900,981 | 658,950 | |
| Series 2020-K106 Class X1, 1.3542% 1/25/30 (c)(m) | 60,649,563 | 4,405,233 | |
| Series 2021-K124 Class X1, 0.7201% 12/25/30 (c)(m) | 6,482,332 | 283,282 | |
| Series 2021-K741 Class X1, 0.5704% 12/25/27 (c)(m) | 140,574,857 | 3,140,766 | |
| FREMF Mortgage Trust floater Series 2018-KSW4 Class B, 1 month U.S. LIBOR + 2.450% 7.0243% 10/25/28 (c)(g) | 3,957,130 | 3,772,075 | |
| Ginnie Mae guaranteed Multi-family REMIC pass-thru securities: | |||
| Series 2020-193 Class AC, 1.25% 9/16/62 | 1,480,405 | 1,159,047 | |
| Series 2021-14 Class AB, 1.34% 6/16/63 | 1,754,903 | 1,388,222 | |
| Series 2021-2 Class AH, 1.5% 6/16/63 | 4,125,160 | 3,198,149 | |
| Series 2021-21 Class AH, 1.4% 6/16/63 | 2,820,709 | 2,238,194 | |
| Series 2021-31 Class B, 1.25% 1/16/61 | 3,063,974 | 2,335,292 | |
| Greystone Commercial Capital Trust floater Series 2021-3 Class A, 1 month U.S. LIBOR + 2.230% 6.8314% 8/1/23 (b)(c)(g) | 7,000,000 | 6,815,992 | |
| GS Mortgage Securities Trust: | |||
| floater: | |||
Series 2018-3PCK Class A, 1 month U.S. LIBOR + 1.700% 6.538% 9/15/31 (b)(c)(g) | 9,059,409 | 8,907,046 | |
Series 2018-HART Class A, 1 month U.S. LIBOR + 1.090% 5.55% 10/15/31 (b)(c)(g) | 4,013,000 | 3,764,613 | |
Series 2021-IP: | |||
| Class A, 1 month U.S. LIBOR + 0.950% 5.538% 10/15/36 (b)(c)(g) | 7,945,000 | 7,535,458 | |
| Class B, 1 month U.S. LIBOR + 1.150% 5.738% 10/15/36 (b)(c)(g) | 730,000 | 681,880 | |
| Class C, 1 month U.S. LIBOR + 1.550% 6.138% 10/15/36 (b)(c)(g) | 601,000 | 556,221 | |
Series 2021-RENT Class C, 1 month U.S. LIBOR + 1.550% 6.1413% 11/21/35 (b)(c)(g) | 3,488,852 | 3,230,161 | |
| sequential payer: | |||
Series 2015-GS1 Class A3, 3.734% 11/10/48 | 11,384,000 | 10,800,300 | |
Series 2020-GSA2 Class A4, 1.721% 12/12/53 | 4,940,000 | 3,919,647 | |
| Series 2011-GC5 Class A/S, 5.1538% 8/10/44 (b)(c) | 10,120,760 | 9,970,862 | |
| Series 2015-GC30 Class A3, 3.119% 5/10/50 | 1,883,924 | 1,784,551 | |
| Series 2015-GC34 Class XA, 1.2034% 10/10/48 (c)(m) | 5,312,140 | 133,657 | |
| Series 2019-GC40 Class A3, 2.904% 7/10/52 | 2,000,000 | 1,758,514 | |
| Series 2021-RENT Class D, 1 month U.S. LIBOR + 1.850% 6.4413% 11/21/35 (b)(c)(g) | 2,152,696 | 1,971,780 | |
| Intown Mortgage Trust floater sequential payer Series 2022-STAY Class A, CME Term SOFR 1 Month Index + 2.480% 7.0506% 8/15/39 (b)(c)(g) | 8,682,000 | 8,692,859 | |
| J.P. Morgan Chase Commercial Mortgage Securities Trust floater Series 2012-NLP Class A, CME Term SOFR 1 Month Index + 0.590% 5.159% 4/15/37 (b)(c)(g) | 4,777,761 | 4,526,462 | |
| JPMBB Commercial Mortgage Securities Trust: | |||
| sequential payer: | |||
Series 2014-C21 Class A4, 3.4927% 8/15/47 | 1,451,598 | 1,413,914 | |
Series 2015-C29 Class A3A2, 3.3423% 5/15/48 (b) | 1,144,837 | 1,088,293 | |
| Series 2013-C14 Class A/S, 4.4093% 8/15/46 | 3,088,000 | 3,053,692 | |
| Series 2014-C19 Class XA, 0.6228% 4/15/47 (c)(m) | 2,605,321 | 11,472 | |
| Series 2015-C30 Class A4, 3.5508% 7/15/48 | 1,296,264 | 1,237,090 | |
| JPMorgan Chase Commercial Mortgage Securities Trust: | |||
| floater Series 2019-BKWD Class A, 1 month U.S. LIBOR + 1.250% 5.838% 9/15/29 (b)(c)(g) | 5,421,952 | 5,152,838 | |
| sequential payer Series 2013-LC11 Class A5, 2.9599% 4/15/46 | 1,240,338 | 1,234,251 | |
| Series 2013-C16 Class A/S, 4.5169% 12/15/46 | 560,000 | 551,690 | |
| Series 2018-WPT: | |||
Class AFX, 4.2475% 7/5/33 (b) | 2,700,000 | 2,430,000 | |
Class CFX, 4.9498% 7/5/33 (b) | 919,000 | 753,580 | |
Class DFX, 5.3503% 7/5/33 (b) | 1,414,000 | 1,117,060 | |
Class EFX, 5.3635% 7/5/33 (b)(c) | 1,934,000 | 1,450,500 | |
Class XAFX, 1.116% 7/5/33 (b)(c)(m) | 10,000,000 | 10,357 | |
| Series 2019-COR4 Class A3, 3.7629% 3/10/52 | 5,400,000 | 4,972,531 | |
| Series 2021-MHC Class XCP, 1.4212% 4/15/38 (b)(c)(m) | 164,060,500 | 283,021 | |
| Life Financial Services Trust floater Series 2022-BMR2: | |||
| Class A1, CME Term SOFR 1 Month Index + 1.290% 5.8577% 5/15/39 (b)(c)(g) | 12,656,000 | 12,608,510 | |
| Class B, CME Term SOFR 1 Month Index + 1.790% 6.3564% 5/15/39 (b)(c)(g) | 6,596,000 | 6,569,964 | |
| Class C, CME Term SOFR 1 Month Index + 2.090% 6.6556% 5/15/39 (b)(c)(g) | 3,893,000 | 3,845,524 | |
| Class D, CME Term SOFR 1 Month Index + 2.540% 7.1044% 5/15/39 (b)(c)(g) | 3,460,000 | 3,408,639 | |
| LIFE Mortgage Trust floater Series 2021-BMR: | |||
| Class A, 1 month U.S. LIBOR + 0.700% 5.288% 3/15/38 (b)(c)(g) | 4,672,057 | 4,587,354 | |
| Class B, 1 month U.S. LIBOR + 0.880% 5.468% 3/15/38 (b)(c)(g) | 1,643,526 | 1,598,318 | |
| Class C, 1 month U.S. LIBOR + 1.100% 5.688% 3/15/38 (b)(c)(g) | 1,034,085 | 1,002,980 | |
| MBRT floater Series 2019-MBR Class A, 1 month U.S. LIBOR + 1.200% 5.788% 11/15/36 (b)(c)(g) | 6,000,000 | 5,950,928 | |
| MHC Commercial Mortgage Trust floater Series 2021-MHC Class E, 1 month U.S. LIBOR + 2.100% 6.689% 4/15/38 (b)(c)(g) | 5,425,000 | 5,269,132 | |
| Morgan Stanley BAML Trust: | |||
| sequential payer: | |||
Series 2015-C21 Class A3, 3.077% 3/15/48 | 3,407,710 | 3,236,755 | |
Series 2016-C28 Class A3, 3.272% 1/15/49 | 3,302,603 | 3,107,290 | |
| Series 2015-C25: | |||
Class A4, 3.372% 10/15/48 | 2,800,000 | 2,662,793 | |
Class XA, 1.0381% 10/15/48 (c)(m) | 9,349,167 | 169,251 | |
| Series 2015-C26 Class A4, 3.252% 10/15/48 | 3,200,000 | 3,064,404 | |
| Series 2016-C32 Class A3, 3.459% 12/15/49 | 4,836,809 | 4,511,921 | |
| Morgan Stanley Capital I Trust: | |||
| floater Series 2018-BOP Class A, 1 month U.S. LIBOR + 0.850% 5.438% 8/15/33 (b)(c)(g) | 4,512,912 | 4,248,970 | |
| floater sequential payer Series 2019-NUGS Class A, 1 month U.S. LIBOR + 0.950% 5.538% 12/15/36 (b)(c)(g) | 5,200,000 | 5,019,136 | |
| sequential payer: | |||
Series 2019-MEAD Class A, 3.17% 11/10/36 (b) | 13,482,000 | 12,564,247 | |
Series 2021-L6 Class A3, 2.196% 6/15/54 | 7,000,000 | 5,556,334 | |
| Series 2015-UBS8 Class A3, 3.54% 12/15/48 | 2,596,922 | 2,458,400 | |
| Series 2016-UB12 Class A3, 3.337% 12/15/49 | 1,966,999 | 1,822,311 | |
| Series 2018-H4 Class A4, 4.31% 12/15/51 | 3,237,000 | 3,070,340 | |
| Series 2019-MEAD: | |||
Class B, 3.1771% 11/10/36 (b)(c) | 1,558,000 | 1,414,924 | |
Class C, 3.1771% 11/10/36 (b)(c) | 1,495,000 | 1,315,771 | |
Class D, 3.1771% 11/10/36 (b)(c) | 2,340,000 | 2,001,113 | |
| Series 2021-L6 Class XA, 1.227% 6/15/54 (c)(m) | 12,523,959 | 781,157 | |
| MTN Commercial Mortgage Trust floater Series 2022-LPFL Class F, CME Term SOFR 1 Month Index + 4.280% 8.8516% 3/15/39 (b)(c)(g) | 7,000,000 | 6,672,688 | |
| ONE Mortgage Trust floater Series 2021-PARK Class E, CME Term SOFR 1 Month Index + 1.860% 6.4265% 3/15/36 (b)(c)(g) | 6,459,000 | 6,054,375 | |
| Prima Capital Ltd. floater Series 2021-9A Class B, 1 month U.S. LIBOR + 1.800% 6.3979% 12/15/37 (b)(c)(g) | 2,053,000 | 2,006,016 | |
| RLGH Trust floater Series 2021-TROT Class A, 1 month U.S. LIBOR + 0.800% 5.388% 4/15/36 (b)(c)(g) | 1,900,000 | 1,858,074 | |
| SFAVE Commercial Mortgage Securities Trust Series 2015-5AVE: | |||
| Class A1, 3.872% 1/5/43 (b)(c) | 740,000 | 525,670 | |
| Class A2A, 3.659% 1/5/43 (b)(c) | 9,930,000 | 7,198,235 | |
| SPGN Mortgage Trust floater Series 2022-TFLM: | |||
| Class B, CME Term SOFR 1 Month Index + 2.000% 6.5625% 2/15/39 (b)(c)(g) | 1,890,000 | 1,799,975 | |
| Class C, CME Term SOFR 1 Month Index + 2.650% 7.2125% 2/15/39 (b)(c)(g) | 983,000 | 932,561 | |
| SREIT Trust floater: | |||
| Series 2021-FLWR Class A, 1 month U.S. LIBOR + 0.570% 5.1646% 7/15/36 (b)(c)(g) | 3,180,000 | 3,101,499 | |
| Series 2021-MFP: | |||
Class A, 1 month U.S. LIBOR + 0.730% 5.3187% 11/15/38 (b)(c)(g) | 9,194,000 | 8,995,823 | |
Class B, 1 month U.S. LIBOR + 1.070% 5.6677% 11/15/38 (b)(c)(g) | 4,235,000 | 4,123,871 | |
Class C, 1 month U.S. LIBOR + 1.320% 5.9169% 11/15/38 (b)(c)(g) | 2,630,000 | 2,557,507 | |
Class D, 1 month U.S. LIBOR + 1.570% 6.1661% 11/15/38 (b)(c)(g) | 1,728,000 | 1,678,205 | |
| UBS Commercial Mortgage Trust: | |||
| sequential payer: | |||
Series 2018-C12: | |||
| Class A2, 4.1519% 8/15/51 | 5,846,543 | 5,796,690 | |
| Class A5, 4.2962% 8/15/51 | 3,000,000 | 2,830,095 | |
Series 2019-C17 Class A3, 2.6686% 10/15/52 | 1,065,000 | 914,510 | |
| Series 2017-C1 Class A3, 3.283% 11/15/50 | 5,500,000 | 5,044,579 | |
| Series 2017-C7 Class XA, 1.0036% 12/15/50 (c)(m) | 15,089,621 | 532,739 | |
| Series 2018-C13 Class A3, 4.0694% 10/15/51 | 6,000,000 | 5,697,421 | |
| Series 2018-C9 Class ASB, 4.09% 3/15/51 | 3,300,000 | 3,183,504 | |
| VLS Commercial Mortgage Trust: | |||
| sequential payer Series 2020-LAB Class A, 2.13% 10/10/42 (b) | 3,760,000 | 2,947,293 | |
| Series 2020-LAB: | |||
Class B, 2.453% 10/10/42 (b) | 300,000 | 234,795 | |
Class X, 0.4294% 10/10/42 (b)(c)(m) | 8,700,000 | 228,206 | |
| Wells Fargo Commercial Mortgage Trust: | |||
| floater Series 2021-FCMT Class A, 1 month U.S. LIBOR + 1.200% 5.788% 5/15/31 (b)(c)(g) | 4,470,000 | 4,275,821 | |
| sequential payer: | |||
Series 2016-C34 Class A4, 3.096% 6/15/49 | 6,124,000 | 5,677,859 | |
Series 2021-C59 Class A4, 2.343% 4/15/54 | 5,000,000 | 4,098,038 | |
Series 2021-C61 Class A3, 2.406% 11/15/54 | 7,300,000 | 5,905,850 | |
| Series 2015-C31 Class XA, 0.954% 11/15/48 (c)(m) | 6,329,130 | 127,495 | |
| Series 2017-C42 Class XA, 0.861% 12/15/50 (c)(m) | 34,598,827 | 1,146,193 | |
| Series 2018-C46 Class XA, 0.9301% 8/15/51 (c)(m) | 13,198,753 | 318,547 | |
| Series 2018-C48 Class A5, 4.302% 1/15/52 | 3,181,000 | 3,023,168 | |
| WF-RBS Commercial Mortgage Trust: | |||
| Series 2014-C24 Class XA, 0.8392% 11/15/47 (c)(m) | 5,946,622 | 62,037 | |
| Series 2014-LC14 Class XA, 1.2358% 3/15/47 (c)(m) | 7,236,854 | 48,084 | |
| TOTAL COMMERCIAL MORTGAGE SECURITIES (Cost $962,142,638) | 886,058,015 | ||
| Municipal Securities - 0.2% | |||
Principal Amount (a) | Value ($) | ||
| Bay Area Toll Auth. San Francisco Bay Toll Bridge Rev. Series 2009 F2, 6.263% 4/1/49 | 3,265,000 | 3,892,382 | |
| California Gen. Oblig. Series 2009, 7.5% 4/1/34 | 205,000 | 249,797 | |
| Colorado Reg'l. Trans. District Sales Tax Rev. (Fastracks Proj.) Series 2010 B, 5.844% 11/1/50 | 45,000 | 51,541 | |
| Dallas Fort Worth Int'l. Arpt. Rev. Series 2022 A, 4.087% 11/1/51 | 1,010,000 | 880,306 | |
| District of Columbia Income Tax Rev. Series 2010 F, 5.582% 12/1/35 | 75,000 | 78,821 | |
| Illinois Gen. Oblig.: | |||
| Series 2003: | |||
4.95% 6/1/23 | 2,089,091 | 2,086,136 | |
5.1% 6/1/33 | 22,850,000 | 22,454,588 | |
| Series 2010-1, 6.63% 2/1/35 | 3,549,231 | 3,730,705 | |
| Series 2010-3: | |||
6.725% 4/1/35 | 2,510,000 | 2,645,374 | |
7.35% 7/1/35 | 4,322,500 | 4,703,043 | |
| Jobsohio Beverage Sys. Statewide Series 2020 A, 2.833% 1/1/38 | 325,000 | 255,821 | |
| Los Angeles Dept. Arpt. Rev. Series C: | |||
| 2.063% 5/15/34 | 500,000 | 369,490 | |
| 2.163% 5/15/35 | 500,000 | 364,634 | |
| Los Angeles Dept. of Wtr. & Pwr. Rev. Series 2010 A, 5.716% 7/1/39 | 190,000 | 204,886 | |
| Los Angeles Unified School District Series KRY, 5.75% 7/1/34 | 1,400,000 | 1,473,092 | |
| Louisiana Gas & Fuel Tax Rev. Series 2022 A, 2.952% 5/1/41 | 5,270,000 | 4,002,940 | |
| Massachusetts Commonwealth Trans. Fund Rev. (Accelerated Bridge Prog.) Series 2010 A, 5.731% 6/1/40 | 150,000 | 160,264 | |
| Michigan Fin. Auth. Rev. Series 2019 T, 3.384% 12/1/40 | 545,000 | 442,839 | |
| Michigan State Univ. Revs. Series 2022 A, 4.165% 8/15/22 | 2,810,000 | 2,197,669 | |
| New Jersey Econ. Dev. Auth. State Pension Fdg. Rev. Series 1997, 7.425% 2/15/29 (Nat'l. Pub. Fin. Guarantee Corp. Insured) | 9,315,000 | 10,028,726 | |
| New Jersey Tpk. Auth. Tpk. Rev.: | |||
| Series 2009 E, 7.414% 1/1/40 | 1,895,000 | 2,375,933 | |
| Series 2010 A, 7.102% 1/1/41 | 855,000 | 1,044,120 | |
| Series 2021 B: | |||
1.963% 1/1/32 | 1,000,000 | 790,220 | |
2.113% 1/1/33 | 1,050,000 | 822,103 | |
| New York City Gen. Oblig. Series A3, 2.8% 8/1/30 | 3,250,000 | 2,822,164 | |
| New York City Transitional Fin. Auth. Rev.: | |||
| Series 2010 C2, 5.767% 8/1/36 | 860,000 | 893,853 | |
| Series 2021 E3, 1.97% 2/1/33 | 2,015,000 | 1,530,837 | |
| Series A3, 3.88% 8/1/31 | 1,170,000 | 1,075,936 | |
| Series A5, 2.69% 5/1/33 | 2,015,000 | 1,634,950 | |
| Series B2, 3.14% 8/1/28 | 2,735,000 | 2,495,471 | |
| New York State Dorm. Auth.: | |||
| Series 2009 F, 5.628% 3/15/39 | 990,000 | 1,034,171 | |
| Series 2019 F, 3.11% 2/15/39 | 3,250,000 | 2,673,258 | |
| Series 2021 C, 2.202% 3/15/34 | 945,000 | 734,837 | |
| Ohio State Univ. Gen. Receipts: | |||
| Series 2010 C, 4.91% 6/1/40 | 140,000 | 139,751 | |
| Series 2011 A, 4.8% 6/1/11 | 1,503,000 | 1,359,106 | |
| Port Auth. of New York & New Jersey 174th Series, 4.458% 10/1/62 | 515,000 | 469,558 | |
| Salt River Proj. Agricultural Impt. & Pwr. District Elec. Sys. Rev. Series 2010 A, 4.839% 1/1/41 | 750,000 | 743,249 | |
| Texas Private Activity Bond Surface Trans. Corp. (NTE Mobility Partners LLC North Tarrant Express Managed Lanes Proj.) Series 2019 B, 3.922% 12/31/49 | 555,000 | 433,821 | |
| Univ. of California Revs. Series 2015 J, 4.131% 5/15/45 | 1,750,000 | 1,578,765 | |
| Univ. of Michigan Rev.: | |||
| Series 2020 B, 2.437% 4/1/40 | 1,050,000 | 772,365 | |
| Series 2022 A, 4.454% 4/1/22 | 4,790,000 | 4,065,296 | |
| Series 2022 B, 3.504% 4/1/52 | 1,080,000 | 868,089 | |
| Univ. of Minnesota Gen. Oblig. Series 2022, 4.048% 4/1/52 | 3,060,000 | 2,742,452 | |
| Univ. of Virginia Gen. Rev. Series 2021 B, 2.584% 11/1/51 | 1,520,000 | 1,014,073 | |
| TOTAL MUNICIPAL SECURITIES (Cost $106,550,746) | 94,387,432 | ||
| Foreign Government and Government Agency Obligations - 0.2% | |||
Principal Amount (a) | Value ($) | ||
| Arab Republic of Egypt: | |||
| 5.25% 10/6/25 (Reg. S) | 200,000 | 172,000 | |
| 7.6003% 3/1/29 (b) | 632,000 | 492,960 | |
| Brazil Minas SPE 5.333% 2/15/28 (Reg. S) | 1,990,000 | 1,947,464 | |
| Brazilian Federative Republic: | |||
| 3.875% 6/12/30 | 990,000 | 851,895 | |
| 4.625% 1/13/28 | 200,000 | 190,225 | |
| Chilean Republic 2.45% 1/31/31 | 1,315,000 | 1,093,751 | |
| Colombian Republic: | |||
| 3% 1/30/30 | 800,000 | 600,400 | |
| 3.125% 4/15/31 | 580,000 | 419,703 | |
| 4.5% 1/28/26 | 409,000 | 384,665 | |
| 10.375% 1/28/33 | 1,350,000 | 1,498,500 | |
| Dominican Republic: | |||
| 4.5% 1/30/30 (b) | 2,000,000 | 1,713,500 | |
| 5.5% 2/22/29 (b) | 2,505,000 | 2,317,595 | |
| 5.5% 2/22/29(Reg. S) | 161,000 | 148,955 | |
| 5.95% 1/25/27 (b) | 1,100,000 | 1,076,144 | |
| 6% 7/19/28 (b) | 1,250,000 | 1,202,578 | |
| German Federal Republic: | |||
| 1% 5/15/38(Reg. S) | EUR | 4,000,000 | 3,324,950 |
| 1.25% 8/15/48 (k) | EUR | 2,135,000 | 1,715,727 |
| 2.2% 12/12/24(Reg. S) | EUR | 4,710,000 | 4,902,557 |
| 2.5% 3/13/25(Reg. S) | EUR | 2,000,000 | 2,089,761 |
| Guatemalan Republic 3.7% 10/7/33 (Reg. S) | 1,447,000 | 1,185,003 | |
| Hungarian Republic: | |||
| 1.75% 6/5/35 (Reg. S) | EUR | 1,370,000 | 979,738 |
| 2.125% 9/22/31 (b) | 1,400,000 | 1,067,500 | |
| Indonesian Republic: | |||
| 1.1% 3/12/33 | EUR | 3,500,000 | 2,699,647 |
| 2.8% 6/23/30 (b) | 1,700,000 | 1,484,631 | |
| 2.8% 6/23/30(Reg. S) | 400,000 | 349,325 | |
| 2.85% 2/14/30 | 400,000 | 352,575 | |
| 3.4% 9/18/29 | 420,000 | 383,066 | |
| 3.5% 1/11/28 | 6,300,000 | 5,915,306 | |
| 3.75% 6/14/28 (Reg. S) | EUR | 2,000,000 | 2,064,234 |
| 4.65% 9/20/32 | 1,975,000 | 1,915,967 | |
| Israeli State: | |||
| 3.875% 7/3/50 | 1,750,000 | 1,405,233 | |
| 4.5% 1/30/43 | 1,170,000 | 1,055,048 | |
| Italian Republic 2.375% 10/17/24 | 3,800,000 | 3,589,758 | |
| Kingdom of Saudi Arabia: | |||
| 3.25% 11/17/51 (b) | 7,910,000 | 5,434,664 | |
| 3.625% 3/4/28 (Reg. S) | 1,000,000 | 943,750 | |
| Panamanian Republic: | |||
| 2.252% 9/29/32 | 480,000 | 356,340 | |
| 3.16% 1/23/30 | 3,020,000 | 2,588,329 | |
| 3.298% 1/19/33 | 8,600,000 | 6,964,925 | |
| 4.3% 4/29/53 | 615,000 | 442,915 | |
| 4.5% 4/16/50 | 400,000 | 299,325 | |
| 4.5% 1/19/63 | 5,665,000 | 4,037,375 | |
| Peruvian Republic: | |||
| 2.783% 1/23/31 | 772,000 | 635,597 | |
| 2.844% 6/20/30 | 2,430,000 | 2,050,009 | |
| 4.125% 8/25/27 | 400,000 | 386,450 | |
| Polish Government 5.75% 11/16/32 | 564,000 | 590,215 | |
| Quebec Province yankee 7.125% 2/9/24 | 645,000 | 658,023 | |
| Republic of Serbia: | |||
| 1.5% 6/26/29 (Reg. S) | EUR | 2,722,000 | 2,139,141 |
| 1.65% 3/3/33 (b) | EUR | 569,000 | 383,968 |
| 3.125% 5/15/27 (Reg. S) | EUR | 5,088,000 | 4,735,116 |
| 6.25% 5/26/28 (b) | 995,000 | 993,756 | |
| Romanian Republic: | |||
| 3% 2/14/31 (Reg. S) | 1,164,000 | 939,930 | |
| 3.875% 10/29/35 (b) | EUR | 289,000 | 228,874 |
| South African Republic: | |||
| 4.85% 9/30/29 | 952,000 | 836,570 | |
| 5.875% 4/20/32 | 700,000 | 622,125 | |
| State of Qatar 5.103% 4/23/48 (b) | 2,200,000 | 2,167,000 | |
| Sultanate of Oman 5.625% 1/17/28 (Reg. S) | 575,000 | 562,709 | |
| Ukraine Government: | |||
| 4.375% 1/27/32 (b) | EUR | 1,365,000 | 238,220 |
| 6.75% 6/20/28 (Reg. S) | EUR | 1,450,000 | 250,467 |
| 7.75% 9/1/24 (b) | 2,800,000 | 639,275 | |
| 8.994% 2/1/26 (Reg. S) | 1,800,000 | 335,025 | |
| United Kingdom, Great Britain and Northern Ireland: | |||
| 1% 4/22/24(Reg. S) | GBP | 2,105,000 | 2,445,747 |
| 2.25% 9/7/23 | GBP | 5,145,000 | 6,132,148 |
| United Mexican States: | |||
| 2.659% 5/24/31 | 4,688,000 | 3,783,216 | |
| 3.5% 2/12/34 | 1,420,000 | 1,153,040 | |
| 4.15% 3/28/27 | 275,000 | 265,788 | |
| 4.28% 8/14/41 | 400,000 | 319,325 | |
| 4.5% 4/22/29 | 2,920,000 | 2,771,080 | |
| 4.75% 3/8/44 | 2,366,000 | 1,962,006 | |
| 6.05% 1/11/40 | 1,600,000 | 1,591,800 | |
| 6.35% 2/9/35 | 1,250,000 | 1,283,750 | |
| Uruguay Republic 5.1% 6/18/50 | 1,385,000 | 1,355,915 | |
| TOTAL FOREIGN GOVERNMENT AND GOVERNMENT AGENCY OBLIGATIONS (Cost $135,451,967) | 114,114,269 | ||
| Common Stocks - 0.0% | |||
| Shares | Value ($) | ||
| COMMUNICATION SERVICES - 0.0% | |||
| Wireless Telecommunication Services - 0.0% | |||
| Intelsat Emergence SA (e) | 75,636 | 3,759,109 | |
| Intelsat Jackson Holdings SA: | |||
| Series A rights (e)(p) | 7,920 | 68,112 | |
| Series B rights (e)(p) | 7,920 | 250,985 | |
| TOTAL COMMON STOCKS (Cost $2,950,560) | 4,078,206 | ||
| Bank Loan Obligations - 0.1% | |||
Principal Amount (a) | Value ($) | ||
| COMMUNICATION SERVICES - 0.0% | |||
| Diversified Telecommunication Services - 0.0% | |||
| Frontier Communications Holdings LLC Tranche B 1LN, term loan 3 month U.S. LIBOR + 3.750% 8.5% 5/1/28 (c)(g)(q) | 237,723 | 231,966 | |
| Lumen Technologies, Inc. Tranche B 1LN, term loan 1 month U.S. LIBOR + 2.250% 6.0039% 3/15/27 (c)(g)(q) | 1,188,780 | 981,076 | |
| Zayo Group Holdings, Inc. 1LN, term loan: | |||
| 1 month U.S. LIBOR + 3.000% 7.6349% 3/9/27 (c)(g)(q) | 1,000,000 | 829,640 | |
| CME Term SOFR 1 Month Index + 4.250% 8.8676% 3/9/27 (c)(g)(q) | 1,036,136 | 879,048 | |
| 2,921,730 | |||
| Entertainment - 0.0% | |||
| Crown Finance U.S., Inc. 1LN, term loan CME Term SOFR 1 Month Index + 10.000% 14.6642% 9/9/23 (c)(g)(q) | 914,464 | 930,696 | |
| Media - 0.0% | |||
| CSC Holdings LLC: | |||
| Tranche B 5LN, term loan CME Term SOFR 1 Month Index + 2.500% 7.0879% 4/15/27 (c)(g)(q) | 685,823 | 616,383 | |
| Tranche B6 LN, term loan CME Term SOFR 1 Month Index + 4.500% 9.0625% 1/14/28 (c)(g)(q) | 100,000 | 93,500 | |
| Diamond Sports Group LLC 2LN, term loan CME Term SOFR 1 Month Index + 3.250% 8.0255% 8/24/26 (c)(g)(q) | 3,774,648 | 427,592 | |
| DIRECTV Financing LLC 1LN, term loan 1 month U.S. LIBOR + 5.000% 9.6349% 8/2/27 (c)(g)(q) | 443,750 | 431,094 | |
| iHeartCommunications, Inc. 1LN, term loan 1 month U.S. LIBOR + 3.000% 7.6349% 5/1/26 (c)(g)(q) | 538,996 | 521,478 | |
| Neptune Finco Corp. Tranche B, term loan CME Term SOFR 1 Month Index + 2.250% 6.5679% 7/17/25 (c)(g)(q) | 587,565 | 566,360 | |
| Virgin Media Bristol LLC Tranche N, term loan 1 month U.S. LIBOR + 2.500% 7.0879% 1/31/28 (c)(g)(q) | 2,000,000 | 1,959,280 | |
| 4,615,687 | |||
| Wireless Telecommunication Services - 0.0% | |||
| Digicel International Finance Ltd. Tranche B, term loan 3 month U.S. LIBOR + 3.250% 5.96% 5/25/24 (c)(g)(q) | 885,605 | 759,628 | |
TOTAL COMMUNICATION SERVICES | 9,227,741 | ||
| CONSUMER DISCRETIONARY - 0.0% | |||
| Diversified Consumer Services - 0.0% | |||
| Adtalem Global Education, Inc. Tranche B 1LN, term loan 1 month U.S. LIBOR + 4.000% 8.6349% 8/12/28 (c)(g)(q) | 562,125 | 560,619 | |
| AI Aqua Merger Sub, Inc.: | |||
| Tranche B 1LN, term loan CME Term SOFR 1 Month Index + 4.000% 4.964% 7/30/28 (c)(g)(q) | 328,320 | 315,394 | |
| Tranche DD 1LN, term loan CME Term SOFR 1 Month Index + 4.000% 4.964% 7/30/28 (c)(g)(q) | 57,255 | 55,001 | |
| Pre-Paid Legal Services, Inc. 1LN, term loan 3 month U.S. LIBOR + 3.750% 12/15/28 (g)(q)(r) | 413,970 | 407,243 | |
| Spin Holdco, Inc. Tranche B 1LN, term loan 3 month U.S. LIBOR + 4.000% 8.765% 3/4/28 (c)(g)(q) | 973,045 | 817,222 | |
| William Morris Endeavor Entertainment, LLC. Tranche B 1LN, term loan 3 month U.S. LIBOR + 2.750% 5/29/25 (g)(q)(r) | 102,234 | 101,632 | |
| 2,257,111 | |||
| Hotels, Restaurants & Leisure - 0.0% | |||
| Delta 2 SARL Tranche B 1LN, term loan CME Term SOFR 1 Month Index + 3.250% 7.8676% 1/15/30 (c)(g)(q) | 57,740 | 57,842 | |
| Fertitta Entertainment LLC NV Tranche B 1LN, term loan CME Term SOFR 1 Month Index + 4.000% 8.6176% 1/27/29 (c)(g)(q) | 612,568 | 595,343 | |
| J&J Ventures Gaming LLC 1LN, term loan 3 month U.S. LIBOR + 4.000% 8.7299% 4/26/28 (c)(g)(q) | 60,861 | 58,457 | |
| KFC Holding Co. Tranche B 1LN, term loan 1 month U.S. LIBOR + 1.750% 6.3479% 3/15/28 (c)(g)(q) | 413,865 | 411,279 | |
| Penn Entertainment, Inc. Tranche B 1LN, term loan CME Term SOFR 1 Month Index + 2.750% 7.4676% 5/3/29 (c)(g)(q) | 212,293 | 211,408 | |
| Scientific Games Corp. 1LN, term loan CME Term SOFR 1 Month Index + 3.000% 7.6615% 4/7/29 (c)(g)(q) | 427,000 | 424,865 | |
| 1,759,194 | |||
| Specialty Retail - 0.0% | |||
| Michaels Companies, Inc. 1LN, term loan 3 month U.S. LIBOR + 4.250% 8.9799% 4/15/28 (c)(g)(q) | 1,723,750 | 1,575,077 | |
TOTAL CONSUMER DISCRETIONARY | 5,591,382 | ||
| CONSUMER STAPLES - 0.0% | |||
| Beverages - 0.0% | |||
| Bengal Debt Merger Sub LLC: | |||
| 1LN, term loan CME TERM SOFR 3 MONTH INDEX + 3.250% 7.9302% 1/24/29 (c)(g)(q) | 3,076,081 | 2,788,990 | |
| 2LN, term loan CME TERM SOFR 3 MONTH INDEX + 6.000% 10.6802% 1/24/30 (c)(g)(q) | 56,129 | 42,658 | |
| 2,831,648 | |||
| Personal Products - 0.0% | |||
| Prestige Brands, Inc. Tranche B5 1LN, term loan 1 month U.S. LIBOR + 2.000% 2.5% 7/1/28 (c)(g)(q) | 500,000 | 498,360 | |
TOTAL CONSUMER STAPLES | 3,330,008 | ||
| FINANCIALS - 0.0% | |||
| Capital Markets - 0.0% | |||
| Deerfield Dakota Holding LLC Tranche B 1LN, term loan CME Term SOFR 1 Month Index + 3.750% 8.3114% 4/9/27 (c)(g)(q) | 562,069 | 538,356 | |
| Diversified Financial Services - 0.0% | |||
| Avolon TLB Borrower 1 (U.S.) LLC Tranche B3 1LN, term loan 3 month U.S. LIBOR + 1.750% 6.3479% 1/15/25 (c)(g)(q) | 725,000 | 723,869 | |
| Setanta Aircraft Leasing DAC Tranche B 1LN, term loan 3 month U.S. LIBOR + 2.250% 11/5/28 (g)(q)(r) | 485,000 | 480,756 | |
| TransUnion LLC: | |||
| Tranche B5 1LN, term loan 1 month U.S. LIBOR + 1.750% 6.3849% 11/16/26 (c)(g)(q) | 688,927 | 683,616 | |
| Tranche B6 1LN, term loan 1 month U.S. LIBOR + 2.250% 6.8849% 12/1/28 (c)(g)(q) | 281,808 | 279,950 | |
| 2,168,191 | |||
| Insurance - 0.0% | |||
| Acrisure LLC Tranche B 1LN, term loan 1 month U.S. LIBOR + 3.500% 8.1349% 2/13/27 (c)(g)(q) | 1,237,277 | 1,180,276 | |
| AmWINS Group, Inc. Tranche B 1LN, term loan 1 month U.S. LIBOR + 2.250% 6.8849% 2/19/28 (c)(g)(q) | 2,450,022 | 2,408,077 | |
| Asurion LLC Tranche B8 1LN, term loan 1 month U.S. LIBOR + 3.250% 7.8849% 12/23/26 (c)(g)(q) | 594,465 | 564,955 | |
| 4,153,308 | |||
| Mortgage Real Estate Investment Trusts - 0.0% | |||
| Blackstone Mortgage Trust, Inc. Tranche B, term loan 1 month U.S. LIBOR + 2.250% 2.6536% 4/23/26 (c)(g)(q) | 491,117 | 477,611 | |
TOTAL FINANCIALS | 7,337,466 | ||
| HEALTH CARE - 0.1% | |||
| Health Care Equipment & Supplies - 0.0% | |||
| Bausch + Lomb Corp. Tranche B 1LN, term loan CME Term SOFR 1 Month Index + 3.250% 5/10/27 (g)(q)(r) | 430,494 | 420,503 | |
| Mozart Borrower LP Tranche B 1LN, term loan 1 month U.S. LIBOR + 3.250% 7.8197% 10/23/28 (c)(g)(q) | 1,432,088 | 1,379,573 | |
| 1,800,076 | |||
| Health Care Providers & Services - 0.0% | |||
| Cano Health, Inc. Tranche B 1LN, term loan CME Term SOFR 1 Month Index + 4.000% 8.7176% 11/23/27 (c)(g)(q) | 205,000 | 166,269 | |
| Gainwell Acquisition Corp. Tranche B 1LN, term loan 3 month U.S. LIBOR + 4.000% 8.7299% 10/1/27 (c)(g)(q) | 742,424 | 714,769 | |
| Horizon Pharma U.S.A., Inc. Tranche B 1LN, term loan 1 month U.S. LIBOR + 1.750% 6.375% 3/15/28 (c)(g)(q) | 2,012,140 | 2,009,464 | |
| Icon Luxembourg Sarl Tranche B 1LN, term loan 3 month U.S. LIBOR + 2.250% 7.0636% 7/3/28 (c)(g)(q) | 288,490 | 288,023 | |
| Phoenix Newco, Inc. Tranche B 1LN, term loan 1 month U.S. LIBOR + 3.250% 7.8197% 11/15/28 (c)(g)(q) | 992,500 | 971,161 | |
| 4,149,686 | |||
| Health Care Technology - 0.0% | |||
| Athenahealth Group, Inc.: | |||
| Tranche B 1LN, term loan CME Term SOFR 1 Month Index + 3.500% 8.0608% 2/15/29 (c)(g)(q) | 1,339,176 | 1,235,390 | |
| Tranche DD 1LN, term loan CME Term SOFR 1 Month Index + 3.500% 2/15/29 (g)(q)(s) | 228,120 | 210,440 | |
| 1,445,830 | |||
| Life Sciences Tools & Services - 0.0% | |||
| PRA Health Sciences, Inc. Tranche B 1LN, term loan 3 month U.S. LIBOR + 2.250% 7% 7/3/28 (c)(g)(q) | 71,877 | 71,761 | |
| Pharmaceuticals - 0.1% | |||
| Elanco Animal Health, Inc. Tranche B 1LN, term loan 1 month U.S. LIBOR + 1.750% 6.3156% 8/1/27 (c)(g)(q) | 2,795,742 | 2,735,830 | |
| Grifols, S.A. Tranche B 1LN, term loan 1 month U.S. LIBOR + 2.000% 6.5697% 11/15/27 (c)(g)(q) | 1,336,083 | 1,301,011 | |
| Jazz Financing Lux SARL Tranche B 1LN, term loan 1 month U.S. LIBOR + 3.500% 8.0697% 5/5/28 (c)(g)(q) | 1,105,841 | 1,103,674 | |
| Organon & Co. Tranche B 1LN, term loan 3 month U.S. LIBOR + 3.000% 7.75% 6/2/28 (c)(g)(q) | 1,283,873 | 1,267,825 | |
| Sunshine Luxembourg VII SARL Tranche B 1LN, term loan 3 month U.S. LIBOR + 3.750% 10/2/26 (g)(q)(r) | 451,347 | 438,434 | |
| 6,846,774 | |||
TOTAL HEALTH CARE | 14,314,127 | ||
| INDUSTRIALS - 0.0% | |||
| Aerospace & Defense - 0.0% | |||
| TransDigm, Inc.: | |||
| 1LN, term loan CME Term SOFR 1 Month Index + 3.250% 8/13/28 (g)(q)(r) | 935,590 | 932,671 | |
| Tranche F 1LN, term loan 3 month U.S. LIBOR + 2.250% 6.9799% 12/9/25 (c)(g)(q) | 188,130 | 187,613 | |
| 1,120,284 | |||
| Airlines - 0.0% | |||
| AAdvantage Loyalty IP Ltd. Tranche B 1LN, term loan 3 month U.S. LIBOR + 4.750% 9.5577% 4/20/28 (c)(g)(q) | 203,156 | 207,912 | |
| United Airlines, Inc. Tranche B 1LN, term loan 3 month U.S. LIBOR + 3.750% 8.5677% 4/21/28 (c)(g)(q) | 1,589,147 | 1,584,189 | |
| 1,792,101 | |||
| Building Products - 0.0% | |||
| AZZ, Inc. Tranche B 1LN, term loan CME Term SOFR 1 Month Index + 4.250% 8.9676% 5/13/29 (c)(g)(q) | 93,444 | 93,372 | |
| Commercial Services & Supplies - 0.0% | |||
| Maverick Purchaser Sub LLC Tranche B 1LN, term loan 1 month U.S. LIBOR + 4.000% 8.4698% 1/23/27 (c)(g)(q) | 275,605 | 272,044 | |
| Neptune BidCo U.S., Inc. Tranche B 1LN, term loan CME Term SOFR 1 Month Index + 5.000% 9.735% 4/11/29 (c)(g)(q) | 250,000 | 229,375 | |
| Prime Security Services Borrower LLC Tranche B 1LN, term loan 3 month U.S. LIBOR + 2.750% 7.5173% 9/23/26 (c)(g)(q) | 439,487 | 438,388 | |
| Trugreen LP Tranche B 1LN, term loan 1 month U.S. LIBOR + 4.000% 10/30/27 (g)(q)(r) | 226,441 | 207,193 | |
| 1,147,000 | |||
| Professional Services - 0.0% | |||
| Element Materials Technology Group: | |||
| Tranche B 1LN, term loan CME TERM SOFR 3 MONTH INDEX + 4.250% 8.9302% 6/24/29 (c)(g)(q) | 193,957 | 192,140 | |
| Tranche DD 1LN, term loan CME TERM SOFR 3 MONTH INDEX + 4.250% 8.9302% 6/24/29 (c)(g)(q) | 89,519 | 88,680 | |
| 280,820 | |||
| Road & Rail - 0.0% | |||
| Genesee & Wyoming, Inc. 1LN, term loan 3 month U.S. LIBOR + 2.000% 6.7299% 12/30/26 (c)(g)(q) | 971,550 | 968,314 | |
TOTAL INDUSTRIALS | 5,401,891 | ||
| INFORMATION TECHNOLOGY - 0.0% | |||
| Communications Equipment - 0.0% | |||
| CommScope, Inc. Tranche B 1LN, term loan 1 month U.S. LIBOR + 3.250% 7.8849% 4/4/26 (c)(g)(q) | 1,570,082 | 1,522,194 | |
| Electronic Equipment & Components - 0.0% | |||
| Coherent Corp. Tranche B 1LN, term loan 1 month U.S. LIBOR + 2.750% 7.3849% 7/1/29 (c)(g)(q) | 420,971 | 418,340 | |
| Ingram Micro, Inc. Tranche B 1LN, term loan 3 month U.S. LIBOR + 3.500% 7/2/28 (g)(q)(r) | 320,485 | 318,482 | |
| 736,822 | |||
| IT Services - 0.0% | |||
| Arches Buyer, Inc. Tranche B 1LN, term loan 1 month U.S. LIBOR + 3.250% 7.9676% 12/4/27 (c)(g)(q) | 264,319 | 248,460 | |
| DTI Holdco, Inc. 1LN, term loan CME Term SOFR 1 Month Index + 4.750% 4/26/29 (g)(q)(r) | 95,364 | 88,808 | |
| Peraton Corp. Tranche B 1LN, term loan 1 month U.S. LIBOR + 3.750% 8.3849% 2/1/28 (c)(g)(q) | 1,487,334 | 1,471,300 | |
| 1,808,568 | |||
| Semiconductors & Semiconductor Equipment - 0.0% | |||
| Entegris, Inc. Tranche B 1LN, term loan CME Term SOFR 1 Month Index + 3.000% 7.5884% 7/6/29 (c)(g)(q) | 500,000 | 500,520 | |
| Software - 0.0% | |||
| Central Parent, Inc. 1LN, term loan CME TERM SOFR 3 MONTH INDEX + 4.500% 9.0802% 7/6/29 (c)(g)(q) | 525,591 | 523,568 | |
| Gen Digital, Inc.: | |||
| Tranche A2 1LN, term loan CME Term SOFR 1 Month Index + 1.750% 9/12/27 (g)(q)(r) | 315,385 | 309,077 | |
| Tranche B 1LN, term loan CME Term SOFR 1 Month Index + 2.000% 6.7176% 9/12/29 (c)(g)(q) | 1,664,499 | 1,645,473 | |
| McAfee Corp. Tranche B 1LN, term loan CME Term SOFR 1 Month Index + 3.750% 8.4178% 3/1/29 (c)(g)(q) | 2,835,750 | 2,654,971 | |
| Open Text Corp. Tranche B 1LN, term loan CME Term SOFR 1 Month Index + 3.500% 8.1614% 8/25/29 (c)(g)(q) | 199,464 | 199,059 | |
| Oracle Corp. term loan CME Term SOFR 1 Month Index + 1.600% 8/16/27 (e)(g)(q)(r) | 2,844,924 | 2,816,475 | |
| Project Alpha Intermediate Holding, Inc. Tranche B 1LN, term loan 1 month U.S. LIBOR + 3.750% 4/26/24 (g)(q)(r) | 920,304 | 917,672 | |
| Proofpoint, Inc. Tranche B 1LN, term loan 3 month U.S. LIBOR + 3.250% 7.9849% 8/31/28 (c)(g)(q) | 106,932 | 103,784 | |
| RealPage, Inc. Tranche B 1LN, term loan 1 month U.S. LIBOR + 3.000% 7.6349% 4/22/28 (c)(g)(q) | 147,254 | 142,432 | |
| Safe Fleet Holdings LLC 1LN, term loan CME Term SOFR 1 Month Index + 3.750% 2/23/29 (g)(q)(r) | 123,680 | 120,717 | |
| Sophia LP Tranche B 1LN, term loan 3 month U.S. LIBOR + 3.500% 8.2299% 10/7/27 (c)(g)(q) | 264,294 | 259,944 | |
| 9,693,172 | |||
TOTAL INFORMATION TECHNOLOGY | 14,261,276 | ||
| MATERIALS - 0.0% | |||
| Chemicals - 0.0% | |||
| Starfruit U.S. Holdco LLC Tranche B, term loan 1 month U.S. LIBOR + 2.750% 7.526% 10/1/25 (c)(g)(q) | 2,002,681 | 1,988,663 | |
| Zep, Inc. Tranche B 1LN, term loan 3 month U.S. LIBOR + 4.000% 8/11/24 (g)(q)(r) | 540,248 | 424,095 | |
| 2,412,758 | |||
| Containers & Packaging - 0.0% | |||
| Berry Global, Inc. Tranche Z 1LN, term loan 1 month U.S. LIBOR + 1.750% 6.325% 7/1/26 (c)(g)(q) | 528,370 | 526,627 | |
TOTAL MATERIALS | 2,939,385 | ||
| UTILITIES - 0.0% | |||
| Electric Utilities - 0.0% | |||
| Brookfield WEC Holdings, Inc. 1LN, term loan CME Term SOFR 1 Month Index + 3.750% 8.3676% 8/1/25 (c)(g)(q) | 99,750 | 99,609 | |
| Independent Power and Renewable Electricity Producers - 0.0% | |||
| Calpine Corp. Tranche B9 1LN, term loan 1 month U.S. LIBOR + 2.000% 4/5/26 (g)(q)(r) | 1,681,517 | 1,675,682 | |
TOTAL UTILITIES | 1,775,291 | ||
| TOTAL BANK LOAN OBLIGATIONS (Cost $66,019,621) | 64,178,567 | ||
| Bank Notes - 0.0% | |||
Principal Amount (a) | Value ($) | ||
| Discover Bank: | |||
| 3.45% 7/27/26 | 435,000 | 404,967 | |
| 4.65% 9/13/28 | 500,000 | 476,034 | |
| 4.682% 8/9/28 (c) | 3,503,000 | 3,351,174 | |
| Regions Bank 6.45% 6/26/37 | 2,533,000 | 2,638,337 | |
| TOTAL BANK NOTES (Cost $6,788,715) | 6,870,512 | ||
| Fixed-Income Funds - 69.3% | |||
| Shares | Value ($) | ||
| Bank Loan Funds - 0.1% | |||
| T. Rowe Price Institutional Floating Rate Fund - F Class | 8,123,009 | 75,625,211 | |
| High Yield Fixed-Income Funds - 0.9% | |||
| T. Rowe Price Fund | 19,198,291 | 163,761,424 | |
| TCW Emerging Markets Income Fund Class N | 33,148,430 | 260,878,142 | |
TOTAL HIGH YIELD FIXED-INCOME FUNDS | 424,639,566 | ||
| Intermediate Government Funds - 5.1% | |||
| Fidelity SAI U.S. Treasury Bond Index Fund (t) | 208,435,137 | 1,805,048,282 | |
| iShares 3-7 Year Treasury Bond ETF (u) | 6,204,040 | 710,362,580 | |
TOTAL INTERMEDIATE GOVERNMENT FUNDS | 2,515,410,862 | ||
| Intermediate-Term Bond Funds - 57.6% | |||
| American Funds The Bond Fund of America Class F2 | 102,808,782 | 1,167,907,768 | |
| Baird Aggregate Bond Fund Class Institutional | 106,186,398 | 1,022,575,012 | |
| Baird Core Plus Bond Fund - Institutional Class | 92,353,412 | 914,298,784 | |
| Columbia Mortgage Opportunities Fund Class A | 24,796,164 | 200,848,925 | |
| DoubleLine Total Return Bond Fund Class N | 203,725,153 | 1,798,893,100 | |
| Fidelity SAI Total Bond Fund (t) | 600,764,222 | 5,340,793,933 | |
| Fidelity U.S. Bond Index Fund (t) | 68,814,485 | 701,219,597 | |
| iShares Core U.S. Aggregate Bond ETF (u) | 5,351,120 | 520,717,487 | |
| John Hancock Bond Fund Class R6 | 44,304,015 | 595,002,917 | |
| JPMorgan Core Plus Bond Fund Class A | 70,858,812 | 506,640,505 | |
| PIMCO Income Fund Institutional Class | 64,618,445 | 670,739,456 | |
| PIMCO Investment Grade Credit Bond Fund Institutional Class | 48,301,377 | 421,671,017 | |
| PIMCO Mortgage Opportunities Fund Institutional Class | 147,824,388 | 1,395,462,225 | |
| PIMCO Total Return Fund Institutional Class | 722,953,258 | 6,137,873,124 | |
| Voya Intermediate Bond Fund Class I | 167,557,454 | 1,437,642,952 | |
| Western Asset Core Bond Fund Class I | 223,855,641 | 2,384,062,573 | |
| Western Asset Core Plus Bond Fund Class I | 314,995,483 | 2,960,957,545 | |
| Western Asset Corporate Bond Fund - Class I | 25,961,281 | 274,410,745 | |
TOTAL INTERMEDIATE-TERM BOND FUNDS | 28,451,717,665 | ||
| Long Government Bond Funds - 3.7% | |||
| Fidelity SAI Long-Term Treasury Bond Index Fund (t) | 59,540,578 | 460,248,664 | |
| iShares 20+ Year Treasury Bond ETF | 2,571,830 | 261,580,829 | |
| iShares 7-10 Year Treasury Bond ETF (u) | 5,481,311 | 524,890,341 | |
| SPDR Portfolio Long Term Treasury ETF (u) | 19,819,420 | 585,267,473 | |
TOTAL LONG GOVERNMENT BOND FUNDS | 1,831,987,307 | ||
| Short-Term Bond - 1.9% | |||
| Fidelity Short-Term Treasury Bond Index Fund (t) | 72,651 | 713,436 | |
| iShares 1-5 Year Investment Grade Corporate Bond ETF (u) | 18,931,107 | 945,040,861 | |
TOTAL SHORT-TERM BOND | 945,754,297 | ||
| TOTAL FIXED-INCOME FUNDS (Cost $39,444,146,575) | 34,245,134,908 | ||
| Preferred Securities - 0.2% | |||
Principal Amount (a) | Value ($) | ||
| COMMUNICATION SERVICES - 0.0% | |||
| Diversified Telecommunication Services - 0.0% | |||
| Telefonica Europe BV 3.875% (Reg. S) (c)(i) | 600,000 | 596,567 | |
| CONSUMER DISCRETIONARY - 0.0% | |||
| Automobiles - 0.0% | |||
| Volkswagen International Finance NV: | |||
| 3.5% (Reg. S) (c)(i) | 5,100,000 | 5,153,652 | |
| 3.748% (Reg. S) (c)(i) | 300,000 | 277,736 | |
| 5,431,388 | |||
| CONSUMER STAPLES - 0.0% | |||
| Tobacco - 0.0% | |||
| British American Tobacco PLC 3% (Reg. S) (c)(i) | 2,600,000 | 2,245,420 | |
| ENERGY - 0.1% | |||
| Oil, Gas & Consumable Fuels - 0.1% | |||
| BP Capital Markets PLC 4.375% (c)(i) | 6,695,000 | 6,512,418 | |
| Energy Transfer LP: | |||
| 6.5% (c)(i) | 3,770,000 | 3,546,631 | |
| 6.625% (c)(i) | 730,000 | 597,513 | |
| 7.125% (c)(i) | 2,520,000 | 2,292,855 | |
| 12,949,417 | |||
| FINANCIALS - 0.1% | |||
| Banks - 0.1% | |||
| AIB Group PLC 6.25% (Reg. S) (c)(i) | 690,000 | 698,758 | |
| Banco Bilbao Vizcaya Argentaria SA 5.875% (Reg. S) (c)(i) | 800,000 | 838,902 | |
| Bank of Nova Scotia 3 month U.S. LIBOR + 2.640% 7.4539% (c)(g)(i) | 12,927,000 | 12,667,665 | |
| Barclays PLC: | |||
| 5.875% (Reg. S) (c)(i) | 650,000 | 735,710 | |
| 8.875% (c)(i) | 300,000 | 369,614 | |
| BNP Paribas SA 6.625% (Reg. S) (c)(i) | 830,000 | 837,249 | |
| Citigroup, Inc. 3.875% (c)(i) | 4,320,000 | 3,880,531 | |
| JPMorgan Chase & Co. 4.6% (c)(i) | 7,120,000 | 6,630,201 | |
| Societe Generale 7.875% (Reg. S) (c)(i) | 415,000 | 420,517 | |
| U.S. Bancorp 3.7% (c)(i) | 4,850,000 | 4,102,494 | |
| 31,181,641 | |||
| Capital Markets - 0.0% | |||
| Credit Suisse Group AG 7.5% (Reg. S) (c)(i) | 2,750,000 | 2,545,283 | |
| Goldman Sachs Group, Inc.: | |||
| 3.65% (c)(i) | 1,750,000 | 1,483,153 | |
| 4.125% (c)(i) | 2,505,000 | 2,182,853 | |
| 6,211,289 | |||
| Consumer Finance - 0.0% | |||
| Ally Financial, Inc. 4.7% (c)(i) | 350,000 | 274,924 | |
| American Express Co. 3.55% (c)(i) | 770,000 | 659,424 | |
| 934,348 | |||
| Insurance - 0.0% | |||
| QBE Insurance Group Ltd. 5.25% (Reg. S) (c)(i) | 2,650,000 | 2,524,893 | |
TOTAL FINANCIALS | 40,852,171 | ||
| INDUSTRIALS - 0.0% | |||
| Road & Rail - 0.0% | |||
| National Express Group PLC 4.25% (Reg. S) (c)(i) | 320,000 | 341,759 | |
| REAL ESTATE - 0.0% | |||
| Real Estate Management & Development - 0.0% | |||
| Aroundtown SA 3.375% (Reg. S) (c)(i) | 2,200,000 | 1,242,837 | |
| AT Securities BV 5.25% (Reg. S) (c)(i) | 2,750,000 | 1,466,452 | |
| Citycon Oyj 4.496% (Reg. S) (c)(i) | 450,000 | 291,168 | |
| CPI Property Group SA 3.75% (Reg. S) (c)(i) | 1,325,000 | 709,460 | |
| Grand City Properties SA 1.5% (Reg. S) (c)(i) | 2,400,000 | 1,266,550 | |
| Heimstaden Bostad AB: | |||
| 3.248% (Reg. S) (c)(i) | 2,085,000 | 1,690,833 | |
| 3.625% (Reg. S) (c)(i) | 185,000 | 122,623 | |
| Samhallsbyggnadsbolaget I Norden AB 2.624% (Reg. S) (c)(i) | 770,000 | 363,729 | |
| 7,153,652 | |||
| UTILITIES - 0.0% | |||
| Electric Utilities - 0.0% | |||
| Electricite de France SA 5.625% (Reg. S) (c)(i) | 3,500,000 | 3,402,542 | |
| SSE PLC 3.74% (Reg. S) (c)(i) | 635,000 | 732,579 | |
| 4,135,121 | |||
| Independent Power and Renewable Electricity Producers - 0.0% | |||
| Vistra Corp. 7% (b)(c)(i) | 2,575,000 | 2,446,109 | |
| Multi-Utilities - 0.0% | |||
| ELM BV for Firmenich International SA 3.75% (Reg. S) (c)(i) | 290,000 | 298,128 | |
| Veolia Environnement SA 2% (Reg. S) (c)(i) | 1,300,000 | 1,142,313 | |
| 1,440,441 | |||
TOTAL UTILITIES | 8,021,671 | ||
| TOTAL PREFERRED SECURITIES (Cost $93,701,425) | 77,592,045 | ||
| Money Market Funds - 1.5% | |||
| Shares | Value ($) | ||
| Fidelity Cash Central Fund 4.63% (v) | 425,346,910 | 425,431,980 | |
| Fidelity Investments Money Market Government Portfolio Institutional Class 4.50% (t)(w) | 126,976,060 | 126,976,060 | |
| Fidelity Securities Lending Cash Central Fund 4.63% (v)(x) | 55,917,682 | 55,923,273 | |
| State Street Institutional U.S. Government Money Market Fund Premier Class 4.43% (w) | 144,713,270 | 144,713,270 | |
| TOTAL MONEY MARKET FUNDS (Cost $753,040,937) | 753,044,583 | ||
| Purchased Swaptions - 0.0% | ||||
Expiration Date | Notional Amount (a) | Value ($) | ||
| Put Options - 0.0% | ||||
| Option with an exercise rate of 4.25% on a credit default swap with Goldman Sachs Bank U.S.A. to buy protection on the 5-Year iTraxx Europe Crossover Series 38 Index expiring December 2027, paying 5% quarterly. | 3/15/23 | EUR | 5,750,000 | 29,947 |
| Option with an exercise rate of 5.00% on a credit default swap with Goldman Sachs Bank U.S.A. to buy protection on the 5-Year iTraxx Europe Crossover Series 38 Index expiring December 2027, paying 5% quarterly. | 3/15/23 | EUR | 14,350,000 | 9,825 |
TOTAL PURCHASED SWAPTIONS (Cost $291,819) | 39,772 | |||
| TOTAL INVESTMENT IN SECURITIES - 104.2% (Cost $58,203,014,335) | 51,519,462,564 |
NET OTHER ASSETS (LIABILITIES) - (4.2)% | (2,088,810,461) |
| NET ASSETS - 100.0% | 49,430,652,103 |
| TBA Sale Commitments | ||
Principal Amount (a) | Value ($) | |
| Ginnie Mae | ||
| 2% 3/1/53 | (2,650,000) | (2,221,157) |
| 2% 3/1/53 | (600,000) | (502,900) |
| 2% 3/1/53 | (6,500,000) | (5,448,121) |
| 2% 3/1/53 | (1,500,000) | (1,257,259) |
| 2% 3/1/53 | (12,950,000) | (10,854,334) |
| 2% 3/1/53 | (31,500,000) | (26,402,434) |
| 2% 3/1/53 | (9,700,000) | (8,130,273) |
| 2% 3/1/53 | (23,600,000) | (19,780,871) |
| TOTAL GINNIE MAE | (74,597,349) | |
| Uniform Mortgage Backed Securities | ||
| 1.5% 3/1/38 | (2,500,000) | (2,161,194) |
| 1.5% 3/1/38 | (6,950,000) | (6,008,120) |
| 1.5% 3/1/38 | (100,000) | (86,448) |
| 1.5% 3/1/38 | (2,100,000) | (1,815,403) |
| 1.5% 3/1/38 | (8,550,000) | (7,391,284) |
| 1.5% 3/1/38 | (2,000,000) | (1,728,955) |
| 1.5% 3/1/38 | (8,250,000) | (7,131,941) |
| 2% 3/1/38 | (3,200,000) | (2,840,061) |
| 2% 3/1/38 | (6,600,000) | (5,857,625) |
| 2% 3/1/38 | (650,000) | (576,887) |
| 2% 3/1/38 | (1,400,000) | (1,242,527) |
| 2% 3/1/53 | (2,925,000) | (2,381,694) |
| 2% 3/1/53 | (2,350,000) | (1,913,497) |
| 2% 3/1/53 | (3,800,000) | (3,094,166) |
| 2% 3/1/53 | (55,850,000) | (45,476,097) |
| 2% 3/1/53 | (34,750,000) | (28,295,333) |
| 2% 3/1/53 | (24,300,000) | (19,786,377) |
| 2% 3/1/53 | (38,050,000) | (30,982,372) |
| 2% 3/1/53 | (5,100,000) | (4,152,696) |
| 2% 3/1/53 | (6,750,000) | (5,496,216) |
| 2% 3/1/53 | (3,700,000) | (3,012,741) |
| 2% 3/1/53 | (4,950,000) | (4,030,558) |
| 2% 3/1/53 | (4,300,000) | (3,501,293) |
| 2% 3/1/53 | (6,200,000) | (5,048,376) |
| 2% 3/1/53 | (5,900,000) | (4,804,100) |
| 2% 3/1/53 | (8,550,000) | (6,961,873) |
| 2.5% 3/1/53 | (5,150,000) | (4,363,020) |
| 2.5% 3/1/53 | (12,300,000) | (10,420,417) |
| 2.5% 3/1/53 | (4,150,000) | (3,515,832) |
| 2.5% 3/1/53 | (1,750,000) | (1,482,580) |
| 2.5% 3/1/53 | (7,800,000) | (6,608,070) |
| 2.5% 3/1/53 | (3,300,000) | (2,795,722) |
| 2.5% 3/1/53 | (725,000) | (614,212) |
| 2.5% 3/1/53 | (1,050,000) | (889,548) |
| 2.5% 3/1/53 | (425,000) | (360,055) |
| 2.5% 3/1/53 | (550,000) | (465,954) |
| 2.5% 3/1/53 | (600,000) | (508,313) |
| 2.5% 3/1/53 | (1,100,000) | (931,907) |
| 2.5% 3/1/53 | (2,150,000) | (1,821,455) |
| 2.5% 3/1/53 | (1,100,000) | (931,907) |
| 2.5% 3/1/53 | (5,850,000) | (4,956,052) |
| 2.5% 3/1/53 | (14,450,000) | (12,241,872) |
| 2.5% 3/1/53 | (3,000,000) | (2,541,565) |
| 2.5% 3/1/53 | (7,450,000) | (6,311,554) |
| 3% 3/1/53 | (10,900,000) | (9,587,312) |
| 3% 3/1/53 | (30,300,000) | (26,650,968) |
| 3% 3/1/53 | (3,650,000) | (3,210,430) |
| 3% 3/1/53 | (10,100,000) | (8,883,656) |
| 3% 3/1/53 | (2,050,000) | (1,803,118) |
| 3% 3/1/53 | (4,050,000) | (3,562,258) |
| 3% 3/1/53 | (6,500,000) | (5,717,204) |
| 3.5% 3/1/53 | (2,000,000) | (1,820,939) |
| 3.5% 3/1/53 | (600,000) | (546,282) |
| 3.5% 3/1/53 | (900,000) | (819,422) |
| 3.5% 3/1/53 | (3,000,000) | (2,731,408) |
| 3.5% 3/1/53 | (12,500,000) | (11,380,868) |
| 3.5% 3/1/53 | (11,375,000) | (10,356,589) |
| 3.5% 3/1/53 | (7,850,000) | (7,147,185) |
| 3.5% 4/1/53 | (12,275,000) | (11,182,724) |
| 5% 3/1/53 | (3,600,000) | (3,537,561) |
| 5.5% 3/1/53 | (850,000) | (848,506) |
| 5.5% 3/1/53 | (3,125,000) | (3,119,506) |
| 5.5% 3/1/53 | (5,150,000) | (5,140,946) |
| 5.5% 3/1/53 | (11,350,000) | (11,330,046) |
| 5.5% 3/1/53 | (3,500,000) | (3,493,847) |
| 6.5% 3/1/53 | (1,450,000) | (1,484,996) |
| 6.5% 3/1/53 | (5,400,000) | (5,530,334) |
| TOTAL UNIFORM MORTGAGE BACKED SECURITIES | (407,423,974) | |
TOTAL TBA SALE COMMITMENTS (Proceeds $486,209,438) | (482,021,323) | |
| Futures Contracts | |||||
Number of contracts | Expiration Date | Notional Amount ($) | Value ($) | Unrealized Appreciation/ (Depreciation) ($) | |
| Purchased | |||||
| Bond Index Contracts | |||||
| ASX 10 Year Treasury Bond Index Contracts (Australia) | 12 | Mar 2023 | 950,083 | (41,039) | (41,039) |
| Eurex Euro-Bobl Contracts (Germany) | 27 | Mar 2023 | 3,289,299 | (78,647) | (78,647) |
| Eurex Euro-Bund Contracts (Germany) | 53 | Mar 2023 | 7,450,682 | (344,162) | (344,162) |
| Eurex Euro-Buxl 30 Year Bond Contracts (Germany) | 1 | Mar 2023 | 142,028 | 819 | 819 |
| TME 10 Year Canadian Note Contracts (Canada) | 55 | Jun 2023 | 4,896,592 | 1,676 | 1,676 |
| TOTAL BOND INDEX CONTRACTS | (461,353) | ||||
| Treasury Contracts | |||||
| CBOT 10-Year U.S. Treasury Note Contracts (United States) | 1,356 | Jun 2023 | 151,405,875 | (301,844) | (301,844) |
| CBOT 2-Year U.S. Treasury Note Contracts (United States) | 1,857 | Jun 2023 | 378,320,227 | (1,023,026) | (1,023,026) |
| CBOT 5-Year U.S. Treasury Note Contracts (United States) | 1,322 | Jun 2023 | 141,526,297 | (745,778) | (745,778) |
| CBOT Long Term U.S. Treasury Bond Contracts (United States) | 159 | Jun 2023 | 19,909,781 | (3,020) | (3,020) |
| CBOT Ultra Long Term U.S. Treasury Bond Contracts (United States) | 209 | Jun 2023 | 28,228,063 | 2,694 | 2,694 |
| TOTAL TREASURY CONTRACTS | (2,070,974) | ||||
| TOTAL PURCHASED | (2,532,327) | ||||
| Sold | |||||
| Bond Index Contracts | |||||
| ICE Long Gilt Contracts (United Kingdom) | 57 | Jun 2023 | 6,853,502 | 44,371 | 44,371 |
| Treasury Contracts | |||||
| CBOT 10-Year U.S. Treasury Note Contracts (United States) | 72 | Jun 2023 | 8,039,250 | (14,766) | (14,766) |
| CBOT 2-Year U.S. Treasury Note Contracts (United States) | 43 | Jun 2023 | 8,760,242 | 23,877 | 23,877 |
| CBOT 5-Year U.S. Treasury Note Contracts (United States) | 29 | Jun 2023 | 3,104,586 | 9,922 | 9,922 |
| CBOT Long Term U.S. Treasury Bond Contracts (United States) | 712 | Jun 2023 | 89,155,750 | 5,475 | 5,475 |
| CBOT Ultra Long Term U.S. Treasury Bond Contracts (United States) | 48 | Jun 2023 | 6,483,000 | (32,178) | (32,178) |
| TOTAL TREASURY CONTRACTS | (7,670) | ||||
| TOTAL SOLD | 36,701 | ||||
| TOTAL FUTURES CONTRACTS | (2,495,626) | ||||
| The notional amount of futures purchased as a percentage of Net Assets is 1.5% | |||||
| The notional amount of futures sold as a percentage of Net Assets is 0.2% | |||||
| Forward Foreign Currency Contracts | ||||||
Currency Purchased | Currency Sold | Counterparty | Settlement Date | Unrealized Appreciation/ (Depreciation) ($) | ||
| EUR | 68,676,810 | USD | 73,107,351 | JPMorgan Chase Bank, N.A. | 3/02/23 | (467,888) |
| GBP | 15,174,746 | USD | 18,312,125 | Bank of America, N.A. | 3/02/23 | (59,182) |
| USD | 75,008,448 | EUR | 68,676,810 | Citibank, N. A. | 3/02/23 | 2,368,986 |
| USD | 21,059,590 | GBP | 17,075,127 | BNP Paribas S.A. | 3/02/23 | 520,774 |
| USD | 73,251,881 | EUR | 68,676,810 | JPMorgan Chase Bank, N.A. | 4/04/23 | 461,209 |
| USD | 18,323,131 | GBP | 15,174,746 | Bank of America, N.A. | 4/04/23 | 58,553 |
| CAD | 88,000 | USD | 65,291 | Bank of America, N.A. | 4/20/23 | (766) |
| CAD | 108,000 | USD | 80,724 | Brown Brothers Harriman & Co | 4/20/23 | (1,534) |
| CAD | 232,000 | USD | 170,601 | Goldman Sachs Bank USA | 4/20/23 | (489) |
| EUR | 77,000 | USD | 83,363 | Bank of America, N.A. | 4/20/23 | (1,679) |
| EUR | 296,000 | USD | 322,134 | Bank of America, N.A. | 4/20/23 | (8,126) |
| EUR | 802,000 | USD | 873,578 | Bank of America, N.A. | 4/20/23 | (22,787) |
| EUR | 59,000 | USD | 64,713 | Bank of America, N.A. | 4/20/23 | (2,123) |
| EUR | 322,000 | USD | 342,096 | Bank of America, N.A. | 4/20/23 | (506) |
| EUR | 92,000 | USD | 98,269 | Brown Brothers Harriman & Co | 4/20/23 | (672) |
| EUR | 317,000 | USD | 345,833 | JPMorgan Chase Bank, N.A. | 4/20/23 | (9,548) |
| EUR | 469,000 | USD | 504,939 | JPMorgan Chase Bank, N.A. | 4/20/23 | (7,407) |
| EUR | 77,000 | USD | 82,212 | JPMorgan Chase Bank, N.A. | 4/20/23 | (528) |
| EUR | 1,018,000 | USD | 1,083,594 | JPMorgan Chase Bank, N.A. | 4/20/23 | (3,662) |
| GBP | 172,000 | USD | 211,825 | Bank of America, N.A. | 4/20/23 | (4,742) |
| GBP | 170,000 | USD | 211,235 | Brown Brothers Harriman & Co | 4/20/23 | (6,560) |
| GBP | 465,000 | USD | 575,931 | Brown Brothers Harriman & Co | 4/20/23 | (16,086) |
| GBP | 194,000 | USD | 239,192 | JPMorgan Chase Bank, N.A. | 4/20/23 | (5,623) |
| GBP | 1,066,000 | USD | 1,298,189 | JPMorgan Chase Bank, N.A. | 4/20/23 | (14,760) |
| GBP | 288,000 | USD | 349,242 | JPMorgan Chase Bank, N.A. | 4/20/23 | (2,499) |
| USD | 104,555 | AUD | 150,000 | HSBC Bank | 4/20/23 | 3,440 |
| USD | 120,317 | CAD | 163,000 | BNP Paribas S.A. | 4/20/23 | 798 |
| USD | 32,932 | CAD | 44,000 | Bank of America, N.A. | 4/20/23 | 670 |
| USD | 136,559 | CAD | 182,000 | Bank of America, N.A. | 4/20/23 | 3,109 |
| USD | 76,029 | CAD | 102,000 | Bank of America, N.A. | 4/20/23 | 1,238 |
| USD | 73,364 | CAD | 98,000 | HSBC Bank | 4/20/23 | 1,507 |
| USD | 65,465,742 | EUR | 60,457,000 | BNP Paribas S.A. | 4/20/23 | 1,330,754 |
| USD | 152,590 | EUR | 140,000 | Bank of America, N.A. | 4/20/23 | 4,073 |
| USD | 123,089 | EUR | 113,000 | Brown Brothers Harriman & Co | 4/20/23 | 3,215 |
| USD | 2,695,680 | EUR | 2,495,000 | Citibank, N. A. | 4/20/23 | 48,893 |
| USD | 287,600 | EUR | 265,000 | JPMorgan Chase Bank, N.A. | 4/20/23 | 6,478 |
| USD | 166,019 | EUR | 152,000 | JPMorgan Chase Bank, N.A. | 4/20/23 | 4,772 |
| USD | 1,038,796 | EUR | 952,000 | JPMorgan Chase Bank, N.A. | 4/20/23 | 28,880 |
| USD | 371,551 | EUR | 338,000 | JPMorgan Chase Bank, N.A. | 4/20/23 | 12,988 |
| USD | 164,034 | EUR | 153,000 | JPMorgan Chase Bank, N.A. | 4/20/23 | 1,726 |
| USD | 42,905,824 | GBP | 35,110,000 | Bank of America, N.A. | 4/20/23 | 634,540 |
| USD | 86,667 | GBP | 70,000 | Bank of America, N.A. | 4/20/23 | 2,389 |
| USD | 340,457 | GBP | 276,000 | Brown Brothers Harriman & Co | 4/20/23 | 8,162 |
| USD | 265,818 | GBP | 219,000 | Brown Brothers Harriman & Co | 4/20/23 | 2,149 |
| USD | 1,977,987 | GBP | 1,644,000 | Brown Brothers Harriman & Co | 4/20/23 | (1,335) |
| USD | 219,101 | GBP | 179,000 | HSBC Bank | 4/20/23 | 3,591 |
| USD | 86,626 | GBP | 70,000 | JPMorgan Chase Bank, N.A. | 4/20/23 | 2,348 |
| USD | 84,052 | GBP | 69,000 | State Street Bank and Trust Co | 4/20/23 | 978 |
| USD | 913,773 | GBP | 737,000 | State Street Bank and Trust Co | 4/20/23 | 26,449 |
| TOTAL FORWARD FOREIGN CURRENCY CONTRACTS | 4,904,167 | |||||
| Unrealized Appreciation | 5,542,669 | |||||
| Unrealized Depreciation | (638,502) | |||||
| Credit Default Swaps | ||||||||||
| Underlying Reference | Maturity Date | Clearinghouse / Counterparty | Fixed Payment Received/ (Paid) | Payment Frequency | Notional Amount (1) | Value ($) | Upfront Premium Received/ (Paid) ($) | Unrealized Appreciation/ (Depreciation) ($) | ||
| Buy Protection | ||||||||||
| CMBX N.A. AAA Index Series 13 | Dec 2072 | Citigroup Global Markets Ltd. | (0.5%) | Monthly | 1,420,000 | 19,244 | (20,803) | (1,559) | ||
| CMBX N.A. AAA Index Series 13 | Dec 2072 | Citigroup Global Markets Ltd. | (0.5%) | Monthly | 740,000 | 10,029 | 687 | 10,716 | ||
| CMBX N.A. AAA Index Series 13 | Dec 2072 | Citigroup Global Markets Ltd. | (0.5%) | Monthly | 2,700,000 | 36,591 | (30,444) | 6,147 | ||
| CMBX N.A. AAA Index Series 13 | Dec 2072 | Citigroup Global Markets Ltd. | (0.5%) | Monthly | 2,180,000 | 29,544 | (20,047) | 9,497 | ||
| CMBX N.A. AAA Index Series 13 | Dec 2072 | Citigroup Global Markets Ltd. | (0.5%) | Monthly | 2,170,000 | 29,408 | (18,735) | 10,673 | ||
| CMBX N.A. AAA Index Series 13 | Dec 2072 | Citigroup Global Markets Ltd. | (0.5%) | Monthly | 3,220,000 | 43,638 | (35,472) | 8,166 | ||
| CMBX N.A. AAA Index Series 13 | Dec 2072 | Citigroup Global Markets Ltd. | (0.5%) | Monthly | 1,960,000 | 26,562 | (40,339) | (13,777) | ||
| CMBX N.A. AAA Index Series 13 | Dec 2072 | Citigroup Global Markets Ltd. | (0.5%) | Monthly | 2,210,000 | 29,950 | (16,954) | 12,996 | ||
| CMBX N.A. AAA Index Series 13 | Dec 2072 | Citigroup Global Markets Ltd. | (0.5%) | Monthly | 230,000 | 3,117 | (778) | 2,339 | ||
| CMBX N.A. AAA Index Series 13 | Dec 2072 | Citigroup Global Markets Ltd. | (0.5%) | Monthly | 1,820,000 | 24,665 | (5,544) | 19,121 | ||
| CMBX N.A. AAA Index Series 13 | Dec 2072 | Goldman Sachs & Co. LLC | (0.5%) | Monthly | 3,570,000 | 48,381 | (68,269) | (19,888) | ||
| CMBX N.A. AAA Index Series 13 | Dec 2072 | JPMorgan Securities LLC | (0.5%) | Monthly | 1,630,000 | 22,090 | (6,484) | 15,606 | ||
| CMBX N.A. AAA Index Series 13 | Dec 2072 | Morgan Stanley Capital Services LLC | (0.5%) | Monthly | 11,000,000 | 149,073 | (180,476) | (31,403) | ||
| CMBX N.A. AAA Index Series 13 | Dec 2072 | Morgan Stanley Capital Services LLC | (0.5%) | Monthly | 5,110,000 | 69,251 | (70,928) | (1,677) | ||
| CMBX N.A. AAA Index Series 13 | Dec 2072 | Morgan Stanley Capital Services LLC | (0.5%) | Monthly | 6,600,000 | 89,444 | (45,138) | 44,306 | ||
| CMBX N.A. AAA Index Series 13 | Dec 2072 | Morgan Stanley Capital Services LLC | (0.5%) | Monthly | 2,180,000 | 29,544 | (15,518) | 14,026 | ||
| CMBX N.A. AAA Index Series 13 | Dec 2072 | Morgan Stanley Capital Services LLC | (0.5%) | Monthly | 2,680,000 | 36,320 | (25,294) | 11,026 | ||
| CMBX N.A. AAA Index Series 13 | Dec 2072 | Morgan Stanley Capital Services LLC | (0.5%) | Monthly | 3,330,000 | 45,128 | (17,866) | 27,262 | ||
| CMBX N.A. AAA Index Series 13 | Dec 2072 | Morgan Stanley Capital Services LLC | (0.5%) | Monthly | 6,590,000 | 89,308 | (45,983) | 43,325 | ||
| CMBX N.A. AAA Index Series 13 | Dec 2072 | Morgan Stanley Capital Services LLC | (0.5%) | Monthly | 4,080,000 | 55,293 | (55,128) | 165 | ||
| Intesa Sanpaolo SpA | Dec 2027 | JPMorgan Chase Bank, N.A. | (1%) | Quarterly | EUR | 1,500,000 | (10,065) | (8,847) | (18,912) | |
| TOTAL CREDIT DEFAULT SWAPS | 876,515 | (728,360) | 148,155 | |||||||
| Interest Rate Swaps | ||||||||||
| Payment Received | Payment Frequency | Payment Paid | Payment Frequency | Clearinghouse / Counterparty (1) | Maturity Date | Notional Amount (2) | Value ($) | Upfront Premium Received/ (Paid) ($) (3) | Unrealized Appreciation/ (Depreciation) ($) | |
| 4.5% | Annual | U.S. Secured Overnight Fin. Rate (SOFR) Index (4) | Annual | LCH | Mar 2025 | 62,367,000 | (996,811) | 0 | (996,811) | |
| 1.03% | Semi - annual | 3-month LIBOR (4) | Quarterly | CME | Jul 2025 | 59,390,000 | (4,224,083) | 0 | (4,224,083) | |
| 1.03% | Semi - annual | 3-month LIBOR (4) | Quarterly | CME | Jul 2025 | 43,930,000 | (3,119,761) | 0 | (3,119,761) | |
| 1.07% | Semi - annual | 3-month LIBOR (4) | Quarterly | CME | Jul 2025 | 29,695,000 | (2,116,100) | 0 | (2,116,100) | |
| 1.39% | Semi - annual | 3-month LIBOR (4) | Quarterly | CME | Sep 2025 | 99,195,000 | (6,025,916) | 0 | (6,025,916) | |
| 4% | Annual | U.S. Secured Overnight Fin. Rate (SOFR) Index (4) | Annual | LCH | Mar 2028 | 37,537,000 | (1,056,806) | 0 | (1,056,806) | |
| 3.75% | Annual | U.S. Secured Overnight Fin. Rate (SOFR) Index (4) | Annual | LCH | Mar 2030 | 2,838,000 | (92,278) | 0 | (92,278) | |
| 3.75% | Annual | U.S. Secured Overnight Fin. Rate (SOFR) Index (4) | Annual | LCH | Mar 2033 | 2,586,000 | (102,562) | 0 | (102,562) | |
| 3.25% | Annual | U.S. Secured Overnight Fin. Rate (SOFR) Index (4) | Annual | LCH | Mar 2053 | 573,000 | (44,776) | 0 | (44,776) | |
3-month LIBOR (4) | Quarterly | 1.77% | Semi - annual | CME | Jul 2053 | 4,960,000 | 1,556,704 | 0 | 1,556,704 | |
3-month LIBOR (4) | Quarterly | 1.79% | Semi - annual | CME | Jul 2053 | 3,675,000 | 1,156,154 | 0 | 1,156,154 | |
3-month LIBOR (4) | Quarterly | 1.81% | Semi - annual | CME | Jul 2053 | 2,480,000 | 795,363 | 0 | 795,363 | |
3-month LIBOR (4) | Quarterly | 1.87% | Semi - annual | CME | Sep 2053 | 8,465,000 | 2,423,464 | 0 | 2,423,464 | |
| TOTAL INTEREST RATE SWAPS | (11,847,408) | 0 | (11,847,408) | |||||||
| AUD | - | Australian dollar |
| CAD | - | Canadian dollar |
| EUR | - | European Monetary Unit |
| GBP | - | British pound sterling |
| USD | - | U.S. dollar |
| ETF | - | EXCHANGE-TRADED FUND |
| (a) | Amount is stated in United States dollars unless otherwise noted. |
| (b) | Security exempt from registration under Rule 144A of the Securities Act of 1933. These securities may be resold in transactions exempt from registration, normally to qualified institutional buyers. At the end of the period, the value of these securities amounted to $2,756,766,720 or 5.6% of net assets. |
| (c) | Coupon rates for floating and adjustable rate securities reflect the rates in effect at period end. |
| (d) | Non-income producing - Security is in default. |
| (e) | Level 3 security |
| (f) | Security initially issued at one coupon which converts to a higher coupon at a specified date. The rate shown is the rate at period end. |
| (g) | Coupon is indexed to a floating interest rate which may be multiplied by a specified factor and/or subject to caps or floors. |
| (h) | Security or a portion of the security purchased on a delayed delivery or when-issued basis. |
| (i) | Security is perpetual in nature with no stated maturity date. |
| (j) | Security or a portion of the security has been segregated as collateral for mortgage-backed or asset-backed securities purchased on a delayed delivery or when-issued basis. At period end, the value of securities pledged amounted to $24,443,757. |
| (k) | Security or a portion of the security was pledged to cover margin requirements for futures contracts. At period end, the value of securities pledged amounted to $9,596,603. |
| (l) | Security or a portion of the security was pledged to cover margin requirements for centrally cleared OTC swaps. At period end, the value of securities pledged amounted to $2,285,999. |
| (m) | Interest Only (IO) security represents the right to receive only monthly interest payments on an underlying pool of mortgages or assets. Principal shown is the outstanding par amount of the pool as of the end of the period. |
| (n) | Coupon is inversely indexed to a floating interest rate multiplied by a specified factor. The price may be considerably more volatile than the price of a comparable fixed rate security. |
| (o) | Represents an investment in an underlying pool of reverse mortgages which typically do not require regular principal and interest payments as repayment is deferred until a maturity event. |
| (p) | Non-income producing |
| (q) | Remaining maturities of bank loan obligations may be less than the stated maturities shown as a result of contractual or optional prepayments by the borrower. Such prepayments cannot be predicted with certainty. |
| (r) | The coupon rate will be determined upon settlement of the loan after period end. |
| (s) | Position or a portion of the position represents an unfunded loan commitment. At period end, the total principal amount and market value of unfunded commitments totaled $228,120 and $210,440, respectively. |
| (t) | Affiliated Fund |
| (u) | Security or a portion of the security is on loan at period end. |
| (v) | Affiliated fund that is generally available only to investment companies and other accounts managed by Fidelity Investments. The rate quoted is the annualized seven-day yield of the fund at period end. A complete unaudited listing of the fund's holdings as of its most recent quarter end is available upon request. In addition, each Fidelity Central Fund's financial statements, which are not covered by the Fund's Report of Independent Registered Public Accounting Firm, are available on the SEC's website or upon request. |
| (w) | The rate quoted is the annualized seven-day yield of the fund at period end. |
| (x) | Investment made with cash collateral received from securities on loan. |
| Affiliate | Value, beginning of period ($) | Purchases ($) | Sales Proceeds ($) | Dividend Income ($) | Realized Gain (loss) ($) | Change in Unrealized appreciation (depreciation) ($) | Value, end of period ($) | % ownership, end of period |
| Fidelity Cash Central Fund 4.63% | 203,954,736 | 2,148,755,977 | 1,927,278,732 | 12,861,060 | - | (1) | 425,431,980 | 1.0% |
| Fidelity Securities Lending Cash Central Fund 4.63% | 479,605,850 | 3,256,972,985 | 3,680,655,562 | 302,635 | - | - | 55,923,273 | 0.2% |
| Total | 683,560,586 | 5,405,728,962 | 5,607,934,294 | 13,163,695 | - | (1) | 481,355,253 | |
| Affiliate | Value, beginning of period ($) | Purchases ($) | Sales Proceeds ($) | Dividend Income ($) | Realized Gain (loss) ($) | Change in Unrealized appreciation (depreciation) ($) | Value, end of period ($) |
| Fidelity Investments Money Market Government Portfolio Institutional Class 4.50% | 272,629,434 | 2,627,419,460 | 2,773,072,834 | 4,860,214 | - | - | 126,976,060 |
| Fidelity SAI Long-Term Treasury Bond Index Fund | 688,966,402 | 88,478,019 | 150,000,000 | 13,477,915 | (5,159,303) | (162,036,454) | 460,248,664 |
| Fidelity SAI Total Bond Fund | 6,047,905,816 | 267,541,980 | 250,000,000 | 192,541,979 | (26,346,627) | (698,307,236) | 5,340,793,933 |
| Fidelity SAI U.S. Treasury Bond Index Fund | 758,641,599 | 1,424,320,832 | 250,000,000 | 20,696,182 | (5,188,426) | (122,725,723) | 1,805,048,282 |
| Fidelity Short-Term Treasury Bond Index Fund | - | 366,507,784 | 368,000,000 | 2,031,993 | 2,200,355 | 5,297 | 713,436 |
| Fidelity U.S. Bond Index Fund | 2,985,839 | 1,722,427,732 | 932,691,468 | 22,424,944 | (56,362,821) | (35,139,685) | 701,219,597 |
| 7,771,129,090 | 6,496,695,807 | 4,723,764,302 | 256,033,227 | (90,856,822) | (1,018,203,801) | 8,434,999,972 |
| Valuation Inputs at Reporting Date: | ||||
| Description | Total ($) | Level 1 ($) | Level 2 ($) | Level 3 ($) |
Investments in Securities: | ||||
| Equities: | ||||
Communication Services | 4,078,206 | - | - | 4,078,206 |
| Corporate Bonds | 4,497,936,505 | - | 4,490,506,004 | 7,430,501 |
| U.S. Government and Government Agency Obligations | 4,647,221,606 | - | 4,647,221,606 | - |
| U.S. Government Agency - Mortgage Securities | 4,778,822,064 | - | 4,778,822,064 | - |
| Asset-Backed Securities | 1,017,273,770 | - | 1,017,273,770 | - |
| Collateralized Mortgage Obligations | 332,710,310 | - | 332,710,310 | - |
| Commercial Mortgage Securities | 886,058,015 | - | 886,058,015 | - |
| Municipal Securities | 94,387,432 | - | 94,387,432 | - |
| Foreign Government and Government Agency Obligations | 114,114,269 | - | 114,114,269 | - |
| Bank Loan Obligations | 64,178,567 | - | 61,362,092 | 2,816,475 |
| Bank Notes | 6,870,512 | - | 6,870,512 | - |
| Fixed-Income Funds | 34,245,134,908 | 34,245,134,908 | - | - |
| Preferred Securities | 77,592,045 | - | 77,592,045 | - |
| Money Market Funds | 753,044,583 | 753,044,583 | - | - |
| Purchased Swaptions | 39,772 | - | 39,772 | - |
| Total Investments in Securities: | 51,519,462,564 | 34,998,179,491 | 16,506,957,891 | 14,325,182 |
Derivative Instruments: | ||||
| Assets | ||||
Futures Contracts | 88,834 | 88,834 | - | - |
Forward Foreign Currency Contracts | 5,542,669 | - | 5,542,669 | - |
Swaps | 6,818,265 | - | 6,818,265 | - |
| Total Assets | 12,449,768 | 88,834 | 12,360,934 | - |
| Liabilities | ||||
Futures Contracts | (2,584,460) | (2,584,460) | - | - |
Forward Foreign Currency Contracts | (638,502) | - | (638,502) | - |
Swaps | (17,789,158) | - | (17,789,158) | - |
| Total Liabilities | (21,012,120) | (2,584,460) | (18,427,660) | - |
| Total Derivative Instruments: | (8,562,352) | (2,495,626) | (6,066,726) | - |
Other Financial Instruments: | ||||
| TBA Sale Commitments | (482,021,323) | - | (482,021,323) | - |
| Total Other Financial Instruments: | (482,021,323) | - | (482,021,323) | - |
Primary Risk Exposure / Derivative Type | Value | |
| Asset ($) | Liability ($) | |
| Credit Risk | ||
Purchased Swaptions (a) | 39,772 | 0 |
Swaps (b) | 886,580 | (10,065) |
| Total Credit Risk | 926,352 | (10,065) |
| Foreign Exchange Risk | ||
Forward Foreign Currency Contracts (c) | 5,542,669 | (638,502) |
| Total Foreign Exchange Risk | 5,542,669 | (638,502) |
| Interest Rate Risk | ||
Futures Contracts (d) | 88,834 | (2,584,460) |
Swaps (e) | 5,931,685 | (17,779,093) |
| Total Interest Rate Risk | 6,020,519 | (20,363,553) |
| Total Value of Derivatives | 12,489,540 | (21,012,120) |
| Statement of Assets and Liabilities | ||||
| February 28, 2023 | ||||
| Assets | ||||
| Investment in securities, at value (including securities loaned of $54,792,084) - See accompanying schedule: | ||||
Unaffiliated issuers (cost $48,285,606,467) | $ | 42,603,107,339 | ||
Fidelity Central Funds (cost $481,351,608) | 481,355,253 | |||
Other affiliated issuers (cost $9,436,056,260) | 8,434,999,972 | |||
| Total Investment in Securities (cost $58,203,014,335) | $ | 51,519,462,564 | ||
| Segregated cash with brokers for derivative instruments | 7,491,497 | |||
| Segregated cash with brokers for mortgage/asset-backed securities | 1,045,000 | |||
| Cash | 4,312,326 | |||
| Foreign currency held at value (cost $4,263,750) | 4,238,705 | |||
| Receivable for investments sold | ||||
Regular delivery | 209,605,865 | |||
Delayed delivery | 120,179,422 | |||
| Receivable for TBA sale commitments | 486,209,438 | |||
| Unrealized appreciation on forward foreign currency contracts | 5,542,669 | |||
| Receivable for fund shares sold | 56,668,297 | |||
| Dividends receivable | 154,072 | |||
| Interest receivable | 101,252,335 | |||
| Distributions receivable from Fidelity Central Funds | 1,587,281 | |||
| Receivable for daily variation margin on futures contracts | 17,326 | |||
| Bi-lateral OTC swaps, at value | 886,580 | |||
| Other receivables | 375,639 | |||
Total assets | 52,519,029,016 | |||
| Liabilities | ||||
| Payable for investments purchased | ||||
Regular delivery | $ | 359,254,702 | ||
Delayed delivery | 2,157,085,297 | |||
| TBA sale commitments, at value | 482,021,323 | |||
| Unrealized depreciation on forward foreign currency contracts | 638,502 | |||
| Payable for fund shares redeemed | 22,059,316 | |||
| Distributions payable | 9,657,774 | |||
| Bi-lateral OTC swaps, at value | 10,065 | |||
| Accrued management fee | 1,116,858 | |||
| Payable for daily variation margin on centrally cleared OTC swaps | 41,716 | |||
| Other payables and accrued expenses | 568,087 | |||
| Collateral on securities loaned | 55,923,273 | |||
| Total Liabilities | 3,088,376,913 | |||
| Net Assets | $ | 49,430,652,103 | ||
| Net Assets consist of: | ||||
| Paid in capital | $ | 57,250,062,738 | ||
| Total accumulated earnings (loss) | (7,819,410,635) | |||
| Net Assets | $ | 49,430,652,103 | ||
Net Asset Value , offering price and redemption price per share ($49,430,652,103 ÷ 5,470,833,322 shares) | $ | 9.04 | ||
| Statement of Operations | ||||
Year ended February 28, 2023 | ||||
| Investment Income | ||||
| Dividends: | ||||
| Unaffiliated issuers | $ | 917,510,719 | ||
| Affiliated issuers | 256,033,227 | |||
| Interest | 476,149,576 | |||
| Income from Fidelity Central Funds (including $302,635 from security lending) | 13,163,695 | |||
| Total Income | 1,662,857,217 | |||
| Expenses | ||||
| Management fee | $ | 130,142,823 | ||
| Custodian fees and expenses | 263,552 | |||
| Independent trustees' fees and expenses | 302,831 | |||
| Registration fees | 161,575 | |||
| Audit | 82,933 | |||
| Legal | 71,962 | |||
| Miscellaneous | 341,181 | |||
| Total expenses before reductions | 131,366,857 | |||
| Expense reductions | (116,819,274) | |||
| Total expenses after reductions | 14,547,583 | |||
| Net Investment income (loss) | 1,648,309,634 | |||
| Realized and Unrealized Gain (Loss) | ||||
| Net realized gain (loss) on: | ||||
| Investment Securities: | ||||
| Unaffiliated issuers | (884,293,448) | |||
| Affiliated issuers | (90,856,822) | |||
| Forward foreign currency contracts | 18,527,212 | |||
| Foreign currency transactions | (348,443) | |||
| Futures contracts | (18,437,659) | |||
| Swaps | (11,073,364) | |||
| Capital gain distributions from underlying funds: | ||||
| Unaffiliated issuers | 1,676,868 | |||
| Total net realized gain (loss) | (984,805,656) | |||
| Change in net unrealized appreciation (depreciation) on: | ||||
| Investment Securities: | ||||
| Unaffiliated issuers | (4,631,376,331) | |||
| Fidelity Central Funds | (1) | |||
| Other affiliated issuers | (1,018,203,801) | |||
| Forward foreign currency contracts | 2,889,045 | |||
| Assets and liabilities in foreign currencies | 60,205 | |||
| Futures contracts | (2,383,630) | |||
| Swaps | (7,516,134) | |||
| TBA Sale commitments | 4,932,311 | |||
| Total change in net unrealized appreciation (depreciation) | (5,651,598,336) | |||
| Net gain (loss) | (6,636,403,992) | |||
| Net increase (decrease) in net assets resulting from operations | $ | (4,988,094,358) | ||
| Statement of Changes in Net Assets | ||||
Year ended February 28, 2023 | Year ended February 28, 2022 | |||
| Increase (Decrease) in Net Assets | ||||
| Operations | ||||
| Net investment income (loss) | $ | 1,648,309,634 | $ | 1,047,633,596 |
| Net realized gain (loss) | (984,805,656) | (75,964,920) | ||
| Change in net unrealized appreciation (depreciation) | (5,651,598,336) | (2,042,290,895) | ||
| Net increase (decrease) in net assets resulting from operations | (4,988,094,358) | (1,070,622,219) | ||
| Distributions to shareholders | (1,652,396,379) | (1,410,204,963) | ||
| Share transactions | ||||
| Proceeds from sales of shares | 16,370,236,785 | 13,994,284,626 | ||
| Reinvestment of distributions | 1,544,313,693 | 1,354,235,367 | ||
| Cost of shares redeemed | (7,925,964,137) | (8,291,396,644) | ||
Net increase (decrease) in net assets resulting from share transactions | 9,988,586,341 | 7,057,123,349 | ||
| Total increase (decrease) in net assets | 3,348,095,604 | 4,576,296,167 | ||
| Net Assets | ||||
| Beginning of period | 46,082,556,499 | 41,506,260,332 | ||
| End of period | $ | 49,430,652,103 | $ | 46,082,556,499 |
| Other Information | ||||
| Shares | ||||
| Sold | 1,722,462,706 | 1,293,253,783 | ||
| Issued in reinvestment of distributions | 166,781,936 | 125,192,398 | ||
| Redeemed | (842,985,612) | (773,173,471) | ||
| Net increase (decrease) | 1,046,259,030 | 645,272,710 | ||
| Strategic Advisers® Core Income Fund |
| Years ended February 28, | 2023 | 2022 | 2021 | 2020 A | 2019 | |||||
Selected Per-Share Data | ||||||||||
| Net asset value, beginning of period | $ | 10.42 | $ | 10.98 | $ | 11.13 | $ | 10.38 | $ | 10.38 |
| Income from Investment Operations | ||||||||||
Net investment income (loss) B,C | .331 | .250 | .286 | .354 | .324 | |||||
| Net realized and unrealized gain (loss) | (1.382) | (.468) | .116 | .796 | (.009) | |||||
| Total from investment operations | (1.051) | (.218) | .402 | 1.150 | .315 | |||||
| Distributions from net investment income | (.329) | (.252) | (.292) | (.350) | (.309) | |||||
| Distributions from net realized gain | - | (.090) | (.260) | (.050) | (.006) | |||||
| Total distributions | (.329) | (.342) | (.552) | (.400) | (.315) | |||||
| Net asset value, end of period | $ | 9.04 | $ | 10.42 | $ | 10.98 | $ | 11.13 | $ | 10.38 |
Total Return D | (10.12)% | (2.06)% | 3.59% | 11.25% | 3.10% | |||||
Ratios to Average Net Assets C,E,F | ||||||||||
| Expenses before reductions | .28% | .28% | .28% | .28% | .30% | |||||
| Expenses net of fee waivers, if any | .03% | .03% | .03% | .03% | .05% | |||||
| Expenses net of all reductions | .03% | .03% | .03% | .03% | .05% | |||||
| Net investment income (loss) | 3.53% | 2.31% | 2.54% | 3.28% | 3.15% | |||||
| Supplemental Data | ||||||||||
| Net assets, end of period (000 omitted) | $ | 49,430,652 | $ | 46,082,556 | $ | 41,506,260 | $ | 46,341,080 | $ | 38,032,654 |
Portfolio turnover rate G | 116% | 110% | 109% | 65% | 78% |
| Strategic Advisers Core Income Fund | $371,819 |
| Gross unrealized appreciation | $47,489,182 |
| Gross unrealized depreciation | (6,840,749,358) |
| Net unrealized appreciation (depreciation) | $(6,793,260,176) |
| Tax Cost | $58,301,311,141 |
| Capital loss carryforward | $(1,000,209,193) |
| Net unrealized appreciation (depreciation) on securities and other investments | $(6,794,189,751) |
Short-term | $(610,993,050) |
Long-term | (389,216,143) |
| Total capital loss carryforward | $(1,000,209,193) |
| February 28, 2023 | February 28, 2022 | |
| Ordinary Income | $1,652,396,379 | $1,094,612,371 |
| Long-term Capital Gains | - | 315,592,592 |
| Total | $1,652,396,379 | $1,410,204,963 |
| Credit Risk | Credit risk relates to the ability of the issuer of a financial instrument to make further principal or interest payments on an obligation or commitment that it has to a fund. |
| Foreign Exchange Risk | Foreign exchange rate risk relates to fluctuations in the value of an asset or liability due to changes in currency exchange rates. |
| Interest Rate Risk | Interest rate risk relates to the fluctuations in the value of interest-bearing securities due to changes in the prevailing levels of market interest rates. |
| Primary Risk Exposure / Derivative Type | Net Realized Gain (Loss) | Change in Net Unrealized Appreciation (Depreciation) |
| Strategic Advisers Core Income Fund | ||
| Credit Risk | ||
| Purchased Options | $(719,662) | $(229,491) |
| Swaps | (5,546,884) | 642,336 |
| Total Credit Risk | (6,266,546) | 412,845 |
| Foreign Exchange Risk | ||
| Forward Foreign Currency Contracts | 18,527,212 | 2,889,045 |
| Total Foreign Exchange Risk | 18,527,212 | 2,889,045 |
| Interest Rate Risk | ||
| Futures Contracts | (18,437,659) | (2,383,630) |
| Swaps | (5,526,480) | (8,158,470) |
| Total Interest Rate Risk | (23,964,139) | (10,542,100) |
| Totals | $(11,703,473) | $(7,240,210) |
| Purchases ($) | Sales ($) | |
| Strategic Advisers Core Income Fund | 42,444,867,903 | 34,183,046,314 |
| Amount | |
| Strategic Advisers Core Income Fund | $4,379 |
| Fidelity Central Fund | Investment Manager | Investment Objective | Investment Practices | Expense Ratio A |
| Fidelity Money Market Central Funds | Fidelity Management & Research Company LLC (FMR) | Each fund seeks to obtain a high level of current income consistent with the preservation of capital and liquidity. | Short-term Investments | Less than .005% |
| Amount | |
| Strategic Advisers Core Income Fund | $82,563 |
| Total Security Lending Fees Paid to NFS | Security Lending Income From Securities Loaned to NFS | Value of Securities Loaned to NFS at Period End | |
| Strategic Advisers Core Income Fund | $32,113 | $- | $- |
| Fund | Strategic Advisers Core Income Fund |
| Fidelity SAI Long-Term Treasury Bond Index Fund | 14% |
| Fidelity SAI Total Bond Fund | 27% |
| Fidelity SAI U.S. Treasury Bond Index Fund | 13% |
| The Example is based on an investment of $1,000 invested at the beginning of the period and held for the entire period (September 1, 2022 to February 28, 2023). |
Annualized Expense Ratio- A | Beginning Account Value September 1, 2022 | Ending Account Value February 28, 2023 | Expenses Paid During Period- C September 1, 2022 to February 28, 2023 | |||||||
| Strategic Advisers® Core Income Fund | .03% | |||||||||
| Actual | $ 1,000 | $ 982.20 | $ .15 | |||||||
Hypothetical- B | $ 1,000 | $ 1,024.65 | $ .15 | |||||||
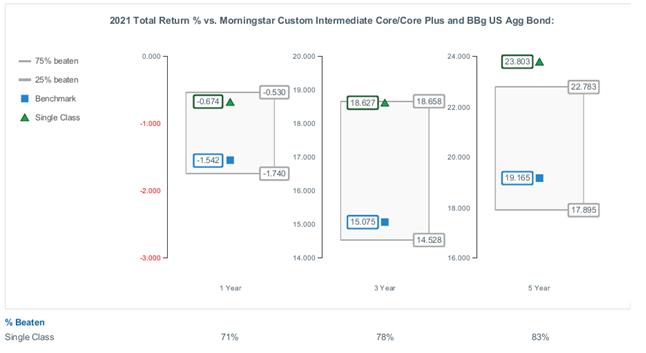

- Highly liquid investments - cash or convertible to cash within three business days or less
- Moderately liquid investments - convertible to cash in three to seven calendar days
- Less liquid investments - can be sold or disposed of, but not settled, within seven calendar days
- Illiquid investments - cannot be sold or disposed of within seven calendar days
 |
Item 2.
Code of Ethics
As of the end of the period, February 28, 2023, Fidelity Rutland Square Trust II (the trust) has adopted a code of ethics, as defined in Item 2 of Form N-CSR, that applies to its President and Treasurer and its Chief Financial Officer. A copy of the code of ethics is filed as an exhibit to this Form N-CSR.
Item 3.
Audit Committee Financial Expert
The Board of Trustees of the trust has determined that Heidi L. Steiger is an audit committee financial expert, as defined in Item 3 of Form N-CSR. Ms. Steiger is independent for purposes of Item 3 of Form N-CSR.
Item 4.
Principal Accountant Fees and Services
Fees and Services
The following table presents fees billed by PricewaterhouseCoopers LLP (“PwC”) in each of the last two fiscal years for services rendered to Strategic Advisers Core Income Fund, Strategic Advisers Emerging Markets Fund, Strategic Advisers Fidelity International Fund, Strategic Advisers Income Opportunities Fund, Strategic Advisers International Fund and Strategic Advisers Small-Mid Cap Fund (the “Funds”):
Services Billed by PwC
February 28, 2023 FeesA
Audit Fees | Audit-Related Fees | Tax Fees | All Other Fees | |
Strategic Advisers Core Income Fund | $44,700 | $3,400 | $9,700 | $8,600 |
Strategic Advisers Emerging Markets Fund | $29,500 | $2,200 | $6,700 | $5,800 |
Strategic Advisers Fidelity International Fund | $43,700 | $3,200 | $21,100 | $8,100 |
Strategic Advisers Income Opportunities Fund | $26,700 | $2,100 | $6,700 | $5,300 |
Strategic Advisers International Fund | $41,800 | $3,200 | $70,900 | $8,200 |
Strategic Advisers Small-Mid Cap Fund | $41,500 | $3,200 | $10,500 | $8,100 |
February 28, 2022 FeesA
Audit Fees | Audit-Related Fees | Tax Fees | All Other Fees | |
Strategic Advisers Core Income Fund | $42,400 | $3,900 | $9,200 | $9,400 |
Strategic Advisers Emerging Markets Fund | $28,200 | $2,600 | $6,300 | $6,300 |
Strategic Advisers Fidelity International Fund | $39,900 | $3,600 | $9,400 | $8,900 |
Strategic Advisers Income Opportunities Fund | $28,000 | $2,400 | $6,300 | $5,800 |
Strategic Advisers International Fund | $52,300 | $3,700 | $9,400 | $9,000 |
Strategic Advisers Small-Mid Cap Fund | $39,400 | $3,600 | $9,800 | $8,900 |
A Amounts may reflect rounding
The following table(s) present(s) fees billed by PwC that were required to be approved by the Audit Committee for services that relate directly to the operations and financial reporting of the Fund(s) and that are rendered on behalf of Strategic Advisers, LLC (“Strategic Advisers”) and entities controlling, controlled by, or under common control with Strategic Advisers (not including any sub-adviser whose role is primarily portfolio management and is subcontracted with or overseen by another investment adviser) that provide ongoing services to the Fund(s) (“Fund Service Providers”):
Services Billed by PwC
February 28, 2023A | February 28, 2022A | |
Audit-Related Fees | $7,914,600 | $8,239,800 |
Tax Fees | $1,000 | $354,200 |
All Other Fees | $- | $- |
A Amounts may reflect rounding.
“Audit-Related Fees” represent fees billed for assurance and related services that are reasonably related to the performance of the fund audit or the review of the fund's financial statements and that are not reported under Audit Fees.
“Tax Fees” represent fees billed for tax compliance, tax advice or tax planning that relate directly to the operations and financial reporting of the fund.
“All Other Fees” represent fees billed for services provided to the fund or Fund Service Provider, a significant portion of which are assurance related, that relate directly to the operations and financial reporting of the fund, excluding those services that are reported under Audit Fees, Audit-Related Fees or Tax Fees.
Assurance services must be performed by an independent public accountant.
* * *
The aggregate non-audit fees billed by PwC for services rendered to the Fund(s), Strategic Advisers (not including any sub-adviser whose role is primarily portfolio management and is subcontracted with or overseen by another investment adviser), and any Fund Service Provider for each of the last two fiscal years of the Fund(s) are as follows:
Billed By | February 28, 2023A | February 28, 2022A |
PwC | $13,070,000 | $13,955,200 |
A Amounts may reflect rounding.
The trust's Audit Committee has considered non-audit services that were not pre-approved that were provided by PwC to Fund Service Providers to be compatible with maintaining the independence of PwC in its(their) audit of the Fund(s), taking into account representations from PwC, in accordance with Public Company Accounting Oversight Board rules, regarding its independence from the Fund(s) and its(their) related entities and Strategic Advisers’s review of the appropriateness and permissibility under applicable law of such non-audit services prior to their provision to the Fund(s) Service Providers.
Audit Committee Pre-Approval Policies and Procedures
The trust’s Audit Committee must pre-approve all audit and non-audit services provided by a fund’s independent registered public accounting firm relating to the operations or financial reporting of the fund. Prior to the commencement of any audit or non-audit services to a fund, the Audit Committee reviews the services to determine whether they are appropriate and permissible under applicable law.
The Audit Committee has adopted policies and procedures to, among other purposes, provide a framework for the Committee’s consideration of non-audit services by the audit firms that audit the Fidelity funds. The policies and procedures require that any non-audit service provided by a fund audit firm to a Fidelity fund and any non-audit service provided by a fund auditor to a Fund Service Provider that relates directly to the operations and financial reporting of a Fidelity fund (“Covered Service”) are subject to approval by the Audit Committee before such service is provided.
All Covered Services must be approved in advance of provision of the service either: (i) by formal resolution of the Audit Committee, or (ii) by oral or written approval of the service by the Chair of the Audit Committee (or if the Chair is unavailable, such other member of the Audit Committee as may be designated by the Chair to act in the Chair’s absence). The approval contemplated by (ii) above is permitted where the Treasurer determines that action on such an engagement is necessary before the next meeting of the Audit Committee.
Non-audit services provided by a fund audit firm to a Fund Service Provider that do not relate directly to the operations and financial reporting of a Fidelity fund are reported to the Audit Committee periodically.
Non-Audit Services Approved Pursuant to Rule 2-01(c)(7)(i)(C) and (ii) of Regulation S-X (“De Minimis Exception”)
There were no non-audit services approved or required to be approved by the Audit Committee pursuant to the De Minimis Exception during the Fund’s(s’) last two fiscal years relating to services provided to (i) the Fund(s) or (ii) any Fund Service Provider that relate directly to the operations and financial reporting of the Fund(s).
Item 5.
Audit Committee of Listed Registrants
Not applicable.
Item 6.
Investments
(a)
Not applicable.
(b)
Not applicable.
Item 7.
Disclosure of Proxy Voting Policies and Procedures for Closed-End Management Investment Companies
Not applicable.
Item 8.
Portfolio Managers of Closed-End Management Investment Companies
Not applicable.
Item 9.
Purchase of Equity Securities by Closed-End Management Investment Company and Affiliated Purchasers
Not applicable.
Item 10.
Submission of Matters to a Vote of Security Holders
There were no material changes to the procedures by which shareholders may recommend nominees to the trust’s Board of Trustees.
Item 11.
Controls and Procedures
(a)(i) The President and Treasurer and the Chief Financial Officer have concluded that the trust’s disclosure controls and procedures (as defined in Rule 30a-3(c) under the Investment Company Act) provide reasonable assurances that material information relating to the trust is made known to them by the appropriate persons, based on their evaluation of these controls and procedures as of a date within 90 days of the filing date of this report.
(a)(ii) There was no change in the trust’s internal control over financial reporting (as defined in Rule 30a-3(d) under the Investment Company Act) that occurred during the period covered by this report that has materially affected, or is reasonably likely to materially affect, the trust’s internal control over financial reporting.
Item 12.
Disclosure of Securities Lending Activities for Closed-End Management
Investment Companies
Not applicable.
Item 13.
Exhibits
(a) | (1) | Code of Ethics pursuant to Item 2 of Form N-CSR is filed and attached hereto as EX-99.CODE ETH. |
(a) | (2) | |
(a) | (3) | Not applicable. |
(b) |
SIGNATURES
Pursuant to the requirements of the Securities Exchange Act of 1934 and the Investment Company Act of 1940, the registrant has duly caused this report to be signed on its behalf by the undersigned, thereunto duly authorized.
Fidelity Rutland Square Trust II
By: | /s/Stacie M. Smith |
Stacie M. Smith | |
President and Treasurer | |
Date: | April 20, 2023 |
Pursuant to the requirements of the Securities Exchange Act of 1934 and the Investment Company Act of 1940, this report has been signed below by the following persons on behalf of the registrant and in the capacities and on the dates indicated.
By: | /s/Stacie M. Smith |
Stacie M. Smith | |
President and Treasurer | |
Date: | April 20, 2023 |
By: | /s/John J. Burke III |
John J. Burke III | |
Chief Financial Officer | |
Date: | April 20, 2023 |