As filed with the Securities and Exchange Commission on
September 6, 2006
REGISTRATION NO.
SECURITIES AND EXCHANGE COMMISSION
Washington, D.C. 20549
FORM SB-2
REGISTRATION STATEMENT
UNDER THE
SECURITIES ACT OF 1933
MILLENIA HOPE PHARMACEUTICALS INC.
(Also known under the trade name of MILLENIA HOPE BIO-PHARMA)
A subsidiary of a Public Company MILLENIA HOPE INC. (OTCBB: MLHP)
(Name of Small Business Issuer in its Charter)
|
|
|
, Ontario, Canada | 2834 | 87832 8525 RP 0001 |
|
|
|
|
| (Canadian Business Number) |
|
|
|
(State or other jurisdiction Of | (Industry Canada Classification Code | (Employer Identification No.) |
500 CARTIER BOULEVARD WEST, 4TH FLOOR
Laval, Quebec, Canada H7V 5B7
(514) 288-8822
(Address, including zip code, and telephone number, including area code,
of registrant’s principal executive offices)
LEONARD STELLA
CEO AND DIRECTOR
MILLENIA HOPE PHARMACEUTICAL INC.
500 CARTIER BOULEVARD WEST, 4TH FLOOR
LAVAL, QUEBEC, CANADA H7V 5B7
(514) 288-8822
(Name, address, including zip code, and telephone number,
including area code, of agent for service)
including area code, of agent for service)
Copies of communications to:
RICHARD I. ANSLOW, ESQ.
ANSLOW & JACLIN, LLP
195 ROUTE 9 SOUTH, SUITE 204
MANALAPAN, NEW JERSEY 07726
TELEPHONE NO.: (732) 409-1212
FACSIMILE NO.: (732) 577-1188
APPROXIMATE DATE OF COMMENCEMENT OF PROPOSED SALE TO THE PUBLIC: As soon as practicable after this Registration Statement becomes effective.
If any of the securities being registered on this Form are to be offered on a delayed or continuous basis pursuant to Rule 415 under the Securities Act of 1933, check the following box.o
1
If this Form is filed to register additional securities for an offering pursuant to Rule 462(b) under the Securities Act of 1933, please check the following box and list the Securities Act registration statement number of the earlier effective registration statement for the same offering.o
If this Form is a post-effective amendment filed pursuant to Rule 462(c) under the Securities Act of 1933, check the following box and list the Securities Act registration statement number of the earlier effective registration statement for the same offering.o
If this Form is a post-effective amendment filed pursuant to Rule 462(d) under the Securities Act of 1933, check the following box and list the Securities Act registration statement number of the earlier effective registration statement for the same offering.o
If delivery of the prospectus is expected to be made pursuant to Rule 434, please check the following box.o
The registrant hereby amends this registration statement on such date or dates as may be necessary to delay its effective date until the registrant shall file a further amendment which specifically states that this registration statement shall thereafter become effective in accordance with Section 8(a) of the Securities Act of 1933 or until the registration statement shall become effective on such date as the Commission, acting pursuant to said Section 8(a), may determine.
The information in this prospectus is not complete and may be changed. We may not sell these securities until the registration statement filed with the Securities and Exchange Commission is effective. This prospectus is not an offer to sell these securities and is not soliciting an offer to buy these securities in any state where the offer or sale is not permitted.
We are not offering any of our shares for sale. We are registering shares for sale for our selling shareholders, including the shareholders of our parent company who will receive shares of Millenia Hope Pharmaceuticals Inc. as a dividend.
Neither the Securities and Exchange Commission nor any state securities commission has approved or disapproved of these securities or determined if this prospectus is truthful or complete. Any representation to the contrary is a criminal offense.
CALCULATION OF REGISTRATION FEE
2
|
|
|
|
|
|
|
|
|
|
|
|
|
|
|
|
|
|
|
|
|
TITLE OF EACH CLASS |
| AMOUNT TO BE |
| PROPOSED |
| PROPOSED |
| AMOUNT OF |
| |||||||||||
|
|
|
|
|
|
|
|
|
| |||||||||||
Common Stock, par value $.0001 per share (1) |
|
| 9,400,000 |
|
|
| $ | 0.035 |
|
|
| $ | 329,000 |
|
|
| $ | 38.72 |
|
|
|
|
|
|
|
|
|
|
|
|
|
|
|
|
|
|
|
|
|
|
|
Total |
|
| 9,400,000 |
|
|
| $ | 0.035 | (1) |
|
| $ | 329,000 |
|
|
| $ | 38.72 |
|
|
(1) The price of $.035 per share is being estimated solely for the purpose of computing the registration fee pursuant to Rule 457(c) under the Securities Act and is based on the most recent price for the sale of our shares of common stock.
THE REGISTRANT HEREBY AMENDS THIS REGISTRATION STATEMENT ON SUCH DATE OR DATES AS MAY BE NECESSARY TO DELAY ITS EFFECTIVE DATE UNTIL THE REGISTRANT SHALL FILE A FURTHER AMENDMENT WHICH SPECIFICALLY STATES THAT THIS REGISTRATION STATEMENT SHALL THEREAFTER BECOME EFFECTIVE IN ACCORDANCE WITH SECTION 8(A) OF THE SECURITIES ACT OF 1933 OR UNTIL THE REGISTRATION STATEMENT SHALL BECOME EFFECTIVE ON SUCH DATE AS THE COMMISSION, ACTING PURSUANT TO SAID SECTION 8(A), MAY DETERMINE.
THE INFORMATION IN THIS PROSPECTUS IS NOT COMPLETE AND MAY BE CHANGED. THE SELLING STOCKHOLDERS MAY NOT SELL THESE SECURITIES UNTIL THE REGISTRATION STATEMENT FILED WITH THE SECURITIES AND EXCHANGE COMMISSION IS EFFECTIVE. THIS PROSPECTUS IS NOT AN OFFER TO SELL THESE SECURITIES AND IT IS NOT SOLICITING AN OFFER TO BUY THESE SECURITIES IN ANY STATE WHERE THE OFFER OR SALE IS NOT PERMITTED.
PRELIMINARY PROSPECTUS SUBJECT TO COMPLETION DATED SEPTEMBER 6, 2006.
3
TABLE OF CONTENTS
(Once finalized, this will be corrected)
|
|
|
| PAGE # | |
|
|
|
6 |
| |
|
|
|
7 |
| |
|
|
|
17 |
| |
|
|
|
18 |
| |
|
|
|
22 |
| |
|
|
|
40 |
| |
|
|
|
41 |
| |
|
|
|
44 |
| |
|
|
|
46 |
| |
|
|
|
46 |
| |
|
|
|
77 |
| |
|
|
|
78 |
| |
|
|
|
DESCRIPTION OF SECURITIES |
|
|
|
|
|
CHANGES IN AND DISAGREEMENTS WITH ACCOUNTANTS ON ACCOUNTING AND FINANCIAL DISCLOSURE | 79 |
|
|
|
|
79 |
| |
|
|
|
79 |
| |
|
|
|
79 |
| |
4
|
|
|
F-1 |
| |
|
|
|
|
|
PROSPECTUS SUMMARY
This summary highlights information contained elsewhere in this prospectus. This summary does not contain all of the information you should consider before investing in our common stock. You should read this entire prospectus carefully, including the section entitled “Risk Factors” and our financial statements and the related notes included elsewhere in this prospectus, before making an investment decision. References in this prospectus to our certificate of incorporation and bylaws refer to the certificate of incorporation and bylaws as the same shall be in effect upon the completion of this offering. Unless otherwise specified or the context otherwise requires, references in this prospectus to “we,” “our” and“us” refer to Millenia Hope Bio-Pharma.
5
HOW WE ARE ORGANIZED AND OUR OPERATIONS
We were incorporated in Canada on January 13, 2000 under the Canada Business Corporations Act, or CBCA. Our authorized capital is unlimited and upon a unanimous decision of the Board of Directors, we limited the authorized capital to 280,000,000 common shares and 50,000,000 preferred shares, both we a par value of $.0001 per share. Millenia Hope Biopharma (MH-B) is a Montreal-based biotechnology company focused on exploiting major advancements in accessing a source of biologically active compounds, plants, to discover, develop and produce new products for human health and well being. We commenced our commercial activity on February 14, 2006. We are a majority owned subsidiary of Millenia Hope, Inc. , a 1934 Exchange Act company quoted on the OTC Bulletin Board under the symbol “MLHP.”
We have developed patented proprietary enabling Phytomics Technologies that allow access to the potential of the plant kingdom’s untapped diversity of chemicals, found therein. To exploit its unique chemical capabilities, we have developed a distinctive Plant Product Discovery Platform combining today’s biological target-based discovery processes and Phytomics to efficiently discover novel products for the health industry.
With the scarcity of structurally diverse small molecules being explicitly linked to the health industry’s dearth of new product approvals, MH-B’s ability to continuously generate a large number of structurally diverse and biologically active phytomolecules addresses one of the major causes of the industry’s current malaise.
MH-B is leveraging its Phytomics and Plant Product Discovery Platforms to build a high-value proprietary and partnered pipeline of important plant-derived products for the pharmaceutical, cosmetic and nutraceutical industries and to develop proprietary Phytomics-based bioprocesses for the industrial scale production of complex phytoproducts of commercial relevance. To date, and since its commercialization, we have had only insignificant sales.
Summary Financial Data
The following summary financial data should be read in conjunction with “Management’s Discussion and Analysis,” “Plan of Operation” and the Financial Statements and Notes thereto, included elsewhere in this prospectus.
|
|
|
|
|
|
|
|
|
|
|
|
|
|
|
|
|
|
| For the six months ended |
| For the year ended |
| For the year ended |
| |||||||||
|
| (unaudited) |
|
|
|
|
| |||||||||
STATEMENT OF OPERATIONS |
|
|
|
|
|
|
|
|
|
|
|
|
|
|
|
|
|
|
|
|
|
|
|
|
|
|
|
|
|
|
|
|
|
Revenues |
|
| $ | 231,785 |
|
|
| $ | 0 |
|
|
| $ | 0 |
|
|
Salaries |
|
| $ | 165,902 |
|
|
| $ | 0 |
|
|
| $ | 0 |
|
|
Research and Development |
|
| $ | 55,080 |
|
|
| $ | 0 |
|
|
| $ | 0 |
|
|
General and Administrative Expenses |
|
| $ | 317,855 |
|
|
| $ | 298 |
|
|
| $ | 122 |
|
|
Net (Loss) |
|
| $ | (319,495 | ) |
|
| $ | (298 | ) |
|
| $ | (122 | ) |
|
Net (Loss) per share |
|
| $ | (0. 00 | ) |
|
| $ | (0.00 | ) |
|
| $ | (0.00 | ) |
|
|
|
|
|
|
|
|
|
|
|
|
|
|
|
|
|
|
BALANCE SHEET DATA |
|
|
|
|
|
|
|
|
|
|
|
|
|
|
|
|
Cash |
|
| $ | 3 |
|
|
| $ | 0 |
|
|
| $ | 0 |
|
|
Consumption taxes and Accounts Receivable |
|
| $ | 68,055 |
|
|
| $ | 0 |
|
|
| $ | 0 |
|
|
Total Current Assets |
|
| $ | 68,058 |
|
|
| $ | 0 |
|
|
| $ | 0 |
|
|
Property & Equipment |
|
| $ | 499,957 |
|
|
| $ | 0. |
|
|
| $ | 0 |
|
|
Total Assets |
|
| $ | 568,015 |
|
|
| $ | 0 |
|
|
| $ | 0 |
|
|
Accounts payable and accrued liabilities |
|
| $ | 41,514 |
|
|
|
|
|
|
|
|
|
|
|
|
Advance from Shareholder |
|
| $ | 12,443 |
|
|
| $ | 0 |
|
|
| $ | 0 |
|
|
Total Liabilities |
|
| $ | 53,957 |
|
|
| $ | 0 |
|
|
| $ | 0 |
|
|
Stockholders’Equity |
|
| $ | 514,058 |
|
|
| $ | 0 |
|
|
| $ | 0 |
|
|
6
WHERE YOU CAN FIND US
Our corporate offices are located at 500, Cartier boulevard West, 4th Floor, Laval, Quebec, Canada H7V 5B7. Our telephone number is (514) 288-8822 and our facsimile number is (514) 935-9758.
OFFERING
We are not offering any securities for sale. All shares are being registered for our selling shareholders.
An investment in our common stock involves a substantial risk of loss. You should consider carefully the following risks and other information contained in this prospectus before you decide whether to purchase our common stock. If any of these risks should actually occur, our business, results of operations and financial condition could suffer significantly. As a result, the market price of our common stock could decline, and you may lose all or part of your investment. You should not invest in our common stock unless you can afford to lose your entire investment and you are not dependent on the funds you are investing.
WE EXPECT TO INCUR LOSSES FOR THE FORESEEABLE FUTURE AND MAY NEVER BECOME PROFITABLE
We currently estimate that we will require between $1.5 million and $2.0 million in operating capital over the next twelve months before any planned capital expenditures. If additional funds have to be raised through the issuance of equity securities, the percentage ownership of our current shareholders will be reduced and such equity securities may have rights, preferences, and privileges senior to those of the holders of our common stock.
Although we believe our existing capital resources, interest income derived therefrom, revenues from commercial activities, debt financing and reimbursable research tax credits should be sufficient to fund its anticipated level of operations through November 2008, there can be no assurance that our business or operations will not change in a manner that would consume available resources more rapidly than anticipated. Our capital requirements depend on numerous factors, including:
|
|
|
| • | Changes in our existing collaborative relationships; |
|
|
|
| • | The need to increase research and development spending as a result of projects advancing at a faster pace and/or the discovery of a greater than anticipated number of compounds of therapeutic, cosmetic and/or nutraceutical interest or to be on the same plane as our competitors; |
|
|
|
| • | The cost of filing, prosecuting, maintaining, defending and enforcing patent claims and other intellectual property rights; and |
|
|
|
| • | The purchase of additional capital equipment necessary to ensure that its operations keep up with the pace of development. |
We anticipate that we will be required to raise additional capital over a period of years in order to continue to expand our operations and to improve our technologies. However, there can be no assurance that additional capital will be available on terms favorable to us or our shareholders, if at all. Moreover, our cash requirements may vary materially due to production yield problems, research and development results, product testing results, changing relationships with our corporate partners, changes in the focus and direction of our research and development programs, competitive and technological advances, litigation and other factors. If adequate funds are not available, we may be required to curtail operations significantly or to obtain funds through entering into collaboration agreements on unattractive terms that may require us to relinquish certain technology or product rights, including patent and other intellectual property rights. Our inability to raise capital would have a material adverse effect on our business, financial condition, and results of operations.
7
We expect to incur substantial costs for the foreseeable future, as a result of increasing expenditures in our research and development budget, including costs associated with conducting preclinical testing and clinical trials, and regulatory compliance activities.
Our chances for achieving profitability will depend on numerous factors, including success in:
|
|
|
| - | developing and testing product candidates; |
|
|
|
| - | achieving milestones under our collaboration agreements; |
|
|
|
| - | receiving regulatory approvals |
|
|
|
| - | commercializing our product and/or process; agreements; |
|
|
|
| - | establishing our competitive position; |
Many of these factors will depend on circumstances beyond our control. We cannot assure you that we will ever become profitable.
Based upon current plans, we expect to incur operating losses in the immediate short-term future as we prepare for the full implementation of our business plan. We cannot guarantee that we will be successful in generating sufficient revenues in the future to offset or exceed additional costs to implement our full business plan. Failure to generate sufficient revenues will seriously impair our ability to continue operations.
THE COMPANY IS AT AN EARLY STAGE OF DEVELOPMENT AND HAS NOT BEEN PROFITABLE FOR ANY SERIOUS LENGTH OF TIME
We are -at an early stage of development and have not yet shown that we have the ability to be profitable for any substantial period of time from its inception. Our planned expansion of our operations will result in significant expenses over the next few years that may not be offset completely by revenues. We expect that a majority of our revenues for the short and medium term will be dependent upon our ability to advance both our partnered and internal product discovery and production programs. To date, the majority of funding received by us has been from equity financings of our parent company. We will need to generate significant revenues to achieve sustained profitability. Due to our limited operating history, it is difficult to predict when, if ever, we will be substantially profitable. If our revenues don’t materialize or if our operating expenses exceed our expectations and revenue streams, our business will be adversely affected.
THE COMPANY’S TECHNOLOGIES ARE NEW AND HAVE NOT RESULTED IN ANY SUCCESSFUL COMMERCIAL PRODUCTS
Our technologies are novel and represent a new approach to the discovery of plant-derived products of commercial relevance. There can be no assurance that our technologies will enable us to discover and develop commercially viable therapeutic, cosmetic and/or nutraceutical products. Further, even if our technologies enable us to discover therapeutic, cosmetic and/or nutraceutical products, the time necessary to develop and achieve market success for any individual product may be long and uncertain. Therapeutic, cosmetic and/or nutraceutical products that appear to be promising at early stages of development may not reach the market for a number of reasons. Such products may: (i) be found to be ineffective or cause harmful side effects during laboratory or human testing; (ii) fail to receive necessary regulatory approval; (iii) be difficult to manufacture on a large scale; (iv) be uneconomical; (v) fail to achieve market acceptance; or (vi) be precluded from commercialization by proprietary rights of third parties. If we do not discover and develop commercially successful therapeutic, cosmetic and/or nutraceutical products, our business will be highly adversely affected
IF WE ARE UNABLE TO DEVELOP AND SUCCESSFULLY COMMERCIALIZE OUR PRODUCTS, WE MAY NEVER ACHIEVE PROFITABILITY
We have just started commercializing our phytomics process and generated our first revenues from the sale of our technology. We expect that we must incur significant additional research and development expenses before we will be able commercializing one or more of our candidate products, we may never generate sufficient or sustainable revenue to enable us to be profitable.
8
We intend to enter into strategic relationships with other companies to apply our technology, fund development, commercialize future products and assist in obtaining regulatory approvals. There can be no assurance that we will find any willing partners, not that any of our present or future corporate partners will perform their obligations as expected or devote sufficient resources to the development, testing or marketing of our potential products developed under such arrangements. Any parallel development of alternative technologies or products, preclusion of us from entering into competitive arrangements, failure to obtain timely regulatory approvals, premature termination of an agreement, or failure by a strategic partner to devote sufficient resources to the development and commercialization of our products could have a material adverse effect on our business, financial condition and results of operations.
Our primary strategy for the development, regulatory approval, production and commercialization of certain of our products is to enter into collaborations with various corporate partners, licensors, licensees and others. There can be no assurance that we will be able to negotiate these collaborative arrangements in the future on acceptable terms, if at all, or that such collaborative arrangements will be beneficial to us. To the extent that we are not able to establish such arrangements, we would face increased capital requirements to undertake such activities at our own expense and might encounter significant delays in introducing our products into certain markets or find that the development, manufacture or sale of our products in such markets is adversely affected.
IF WE CANNOT ENTER INTO LICENSING ARRANGEMENTS, OUR ABILITY TO DEVELOP A DIVERSE PRODUCT PORTFOLIO COULD BE LIMITED
A component of our business strategy is in-licensing drug compounds developed by other pharmaceutical and biotechnology companies or academic research laboratories that may be marketed and developed or improved upon using our novel technologies. Competition for promising compounds can be intense and currently we have not entered into any arrangement to license any drugs from other companies. If we are not able to identify licensing opportunities or enter into licensing arrangements on acceptable terms, we will be unable to develop a diverse portfolio of products.
The full implementation of our strategy includes the dependence on the activities of others, over which we have no control.
An important element of our business strategy involves collaborations and licensing agreements with partners, principally pharmaceutical, cosmetic, nutraceutical and biotechnology companies and government institutions. There can be no assurance that we will be able to establish additional collaborative or licensing agreements with other parties, or that any such agreements or licenses will be on terms favorable to us, or once entered into, will be successful. Any failure to maintain existing collaborations or to enter into additional collaborative agreements on favorable terms would adversely affect our business.
There can be no assurance that current or future collaborative partners will not pursue alternative technologies or develop alternative products either on their own or in collaboration with others, including our competitors.
We also intend to engage third party research, development and service organizations to carry out a variety of tasks. There can be no assurance that such third party organizations will perform their tasks satisfactorily. The failure to perform such tasks satisfactorily could delay or prevent the development of our technologies and products and could adversely affect our business.
LACK OF A BROAD BASE OF CUSTOMERS
We have concluded two agreements. One with cosmetic company, France based l’Oréal and the other, a large French Biopharma, Pierre Fabre. Our failure to gain additional customers would have a material adverse effect on our business and financial condition and produce a negative result in our operations.
THE COMPANY’S LACK OF PRODUCTION EXPERIENCE AND CAPACITY COULD HAVE AN ADVERSE EFFECT ON OUR BUSINESS
The production of plant-derived products for human consumption at commercial scale requires significant expertise and capital investment. We have practically no experience in manufacturing pharmaceutical, cosmetic and nutraceutical products and have a very limited manufacturing capacity. As a result, we will have to develop industrial scale production facilities and/or may have to rely on third party contract manufacturers to supply product. There is no assurance that we will be successful in our own efforts in finding suitable outside contractors. Also, production of our products may require raw materials for which the sources and amount of supply are limited and, therefore, an inability to obtain adequate supplies of such raw materials, or other manufacturing problems, could significantly delay the development of our products.
9
OUR EXECUTIVE OFFICERS AND OTHER KEY PERSONNEL ARE CRITICAL TO OUR BUSINESS AND OUR FUTURE SUCCESS DEPENDS ON OUR ABILITY TO RETAIN THEM.
We are highly dependent on the principal members of our scientific and management teams, including Leonard Stella, our chief executive officer, Jean Archambault, our president, and Bahige Baroudy, our chief scientific officer. In order to pursue our product development, marketing and commercialization plans, we will need to hire additional personnel with experience in clinical testing, government regulation, manufacturing, marketing and business development. We may not be able to attract and retain personnel on acceptable terms given the intense competition for such personnel among biotechnology, pharmaceutical and healthcare companies, universities and non-profit research institutions. We are not aware of any present intention of any of our key personnel to leave our company or to retire. However, although we have employment agreements with our executive officers, these employees may terminate their services upon 90 days’ advance notice. There is intense competition for qualified personnel and the loss of any of our key personnel, or the inability to attract and retain qualified personnel, may significantly delay or prevent the achievement of our research, development or business objectives and could materially adversely affect our business, financial condition and results of operations.
We will need to develop further expertise and add skilled employees or retain consultants in such areas as research and development, clinical testing, government approvals, manufacturing and marketing in the future. There can be no assurance that we will be able to attract and retain the qualified personnel or develop the expertise needed in these areas. We currently have a small research and development and management group with limited operating experience. The loss of the services of one or more members of the research and development or management group or the inability to hire additional personnel and develop expertise as needed would have a material adverse effect on our business, financial condition and results of operations and relationships with our corporate partners.
WE MAY NEED ADDITIONAL CAPITAL IN THE FUTURE. IF ADDITIONAL CAPITAL IS NOT AVAILABLE, WE MAY BE FORCED TO DELAY OR CURTAIL THE DEVELOPMENT OF OUR PRODUCT CANDIDATES
We anticipate that our existing capital resources will enable us to maintain our current operations for at least the next 24 months. Our requirements for additional capital may be substantial and will depend on many other factors, including:
|
|
|
| • | successful commercialization of our phytomics process; |
|
|
|
| • | payments received under present or future collaborative partner agreements; |
|
|
|
| • | continued progress of research and development of our cell culture library; |
|
|
|
| • | costs associated with protecting our intellectual property rights; |
|
|
|
| • | development of marketing and sales capabilities; and |
|
|
|
| • | market acceptance of our products. |
We have no significant committed sources of additional capital. To the extent that our capital resources turn out to be insufficient to meet future capital requirements, we will have to raise additional funds to continue the development of our product candidates. We cannot assure you that funds will be available on favorable terms, if at all. To the extent we raise additional capital through the sale of securities, the issuance of those securities could result in dilution to our stockholders. In addition, if we obtain debt financing, a substantial portion of our operating cash flow may be dedicated to the payment of principal and interest on such indebtedness, thus limiting funds available for our business activities. If adequate funds are not available, we may be required to curtail significantly our development and commercialization activities.
WE COULD BE FORCED TO PAY SUBSTANTIAL DAMAGE AWARDS IF LIABILITY CLAIMS THAT MAY BE BROUGHT AGAINST US ARE SUCCESSFUL
The use of any of our phytomics process, and the sale of any approved technology, may expose us to liability claims and financial losses resulting from the use or sale of our products. We are in the process of obtaining liability insurance coverage for our technology, which we believe will be adequate to cover our present activities. However, such insurance may not be adequate to cover all potential claims made against us. In addition, we may not be able to maintain insurance coverage at a reasonable cost or in sufficient amounts or scope to protect us against potential claims.
We face an inherent risk of exposure to product liability claims alleging that the use of our technology or products resulted in adverse effects. Our business exposes us to potential product liability risks that are inherent in the testing, production, marketing and sale of pharmaceutical, cosmetic and nutraceutical intermediates and final products. The use of products in human testing and the subsequent sale of these products by us and/or current or our future collaborators may cause usto bear all or a portion of the product liability risks. There can be no assurance that we will be able to avoid significant product liability exposure. There can be no assurance that we will be able to obtain or maintain adequate product liability insurance on acceptable terms, if at all, or that
10
such insurance will provide adequate coverage against potential liabilities. The failure to obtain adequate product liability insurance could adversely affect our business.
IF WE FAIL TO ESTABLISH MARKETING, SALES AND DISTRIBUTION CAPABILITIES, OR FAIL TO ENTER INTO ARRANGEMENTS WITH THIRD PARTIES, WE WILL NOT BE ABLE TO COMMERCIALIZE OUR TECHNOLOGY
We have entered into two minor contracts, being our only sales. We do not have adequate marketing or distribution capabilities. In order to commercialize our technology, we must either acquire or develop an internal marketing and sales force with technical expertise and with supporting distribution capabilities or make arrangements with third parties to perform these services for us. In order to market any of our technology, we must either acquire or develop a sales and distribution infrastructure. The acquisition or development of a sales and distribution infrastructure would require substantial resources, which may divert the attention of our management and key personnel, and defer our product development efforts. To the extent that we enter into marketing and sales arrangements with other companies, our revenues will depend on the efforts of others. These efforts may not be successful. If we fail to develop substantial sales, marketing and distribution channels, or enter into arrangements with third parties, we will experience delays in product sales and incur increased costs.
RISKS ASSOCIATED WITH MANAGEMENT OF GROWTH
To date, we have been engaged almost exclusively in research and development activities. We are in the process of transitioning toward becoming a full-scale commercial producer of our products. These changes in our business have placed and will continue to place significant demands on our management, working capital and financial and management control systems. Failure to upgrade our operating, management and financial control systems or difficulties encountered during such upgrades could adversely affect our business, financial condition and results of operations. Although we believe that our systems and controls are adequate to address our current needs, there can be no assurance that such systems will be adequate to address future expansion of our business. Our results of operations will be adversely affected if revenues do not increase sufficiently to compensate for the increase in operating expenses resulting from any expansion and there can be no assurance that any expansion will be profitable or that it will not adversely affect our results of operations. In addition, the success of any future expansion plans will depend in part upon our ability to continue to improve and expand our management and financial control systems, to attract, retain and motivate key personnel, and to raise additional required capital. There can be no assurance that we will be successful in these efforts.
RISKS RELATED TO THE INDUSTRY
ANY INABILITY TO PROTECT OUR INTELLECTUAL PROPERTY COULD HARM OUR COMPETITIVE POSITION
Our success will depend in part on our ability to obtain patents and maintain adequate protection of other intellectual property for our technologies and products in the U.S., Canada and other countries. If we do not adequately protect our intellectual property, competitors may be able to use our technologies and erode or negate our competitive advantage. Further, the laws of some foreign countries do not protect our proprietary rights to the same extent as the laws of the U.S. and Canada, and we may encounter significant problems in protecting our proprietary rights in these foreign countries.
The patent positions of pharmaceutical and biotechnology companies, including our patent positions, involve complex legal and factual questions and, therefore, validity and enforceability cannot be predicted with certainty. Patents may be challenged, deemed unenforceable, invalidated or circumvented. We will be able to protect our proprietary rights from unauthorized use by third parties only to the extent that we cover our proprietary technologies with valid and enforceable patents or we effectively maintain such proprietary technologies as trade secrets. We will apply for patents covering both our technologies and product candidates, as we deem appropriate. However, we may fail to apply for patents on important technologies or products in a timely fashion, or at all,
11
and in any event, the applications we do file may be challenged and may not result in issued patents. Any future patents we obtain may not be sufficiently broad to prevent others from utilizing our technologies and from developing competing products. Furthermore, others may independently develop similar or alternative technologies or design around our patented technologies. In addition, if challenged, our patents may be declared invalid. Even if valid, our patents may fail to provide us with any competitive advantages.
We rely upon trade secrets protection for our confidential and proprietary information. We have taken measures to protect our proprietary information; however, these measures may not provide adequate protection. We seek to protect our proprietary information by entering into confidentiality agreements with employees, collaborators and consultants. Nevertheless, employees, collaborators or consultants may still disclose our proprietary information, and we may not be able to meaningfully protect our trade secrets. In addition, others may independently develop substantially equivalent proprietary information or techniques or otherwise gain access to our trade secrets.
The patent positions of pharmaceutical, biopharmaceutical and biotechnology companies, including our Company, are generally uncertain and involve complex legal and factual questions. There can be no assurance that any of the Company’s pending patent applications will result in issued patents, that the Company will develop additional proprietary technologies that are patentable, that any patents issued to the Company or its corporate partners will provide a basis for commercially viable products or will provide the Company with any competitive advantages or will not be challenged by third parties, or that the patents of others will not have a material adverse effect on the ability of the Company to do business. In addition, patent law relating to the scope of claims in the technology fields in which the Company operates is still evolving. The degree of future protection for the Company’s proprietary rights, therefore, is uncertain. Furthermore, there can be no assurance that others will not independently develop similar or alternative technologies, duplicate any of the Company’s technologies, or, if patents are issued to the Company, design around the patented technologies developed by the Company. In addition, the Company could incur substantial costs in litigation if it is required to defend itself in patent suits brought by third parties or if it initiates such suits.
The Company’s future prospects also depend in part on the Company neither infringing patents or proprietary rights of third parties nor breaching any licenses that may relate to the Company’s technologies and products. There can be no assurance that the Company will not infringe the patents, licenses or other proprietary rights of third parties. In addition, the Company may in the future receive notices claiming infringement from third parties as well as invitations to take licenses under third party patents. Any legal action against the Company or its collaborative partners claiming damages and seeking to enjoin commercial activities relating to the affected products and processes could, in addition to subjecting the Company to potential liability for damages, require the Company or its corporate partners to obtain a license in order to continue to manufacture or market the affected products and processes. There can be no assurance that the Company or its corporate partners would prevail in any such action or that any license (including licenses proposed by third parties) required under any such patent would be made available on commercially acceptable terms, if at all. There may be a significant number of United States and foreign patents and patent applications in the Company’s area of interest, and the Company believes that there may be significant litigation in the industry regarding patent and other intellectual property rights. If the Company becomes involved in such litigation, it could consume a substantial portion of the Company’s managerial and financial resources, which could have a material adverse effect on the Company’s business, financial condition, results of operations and relationships with its corporate partners.
While the disclosure and use of the Company’s proprietary technology, know-how and trade secrets are generally controlled under agreements with the parties involved, there can be no assurance that all confidentiality agreements will be honored, that others will not independently develop similar or superior technology, that disputes will not arise concerning the ownership of intellectual property, or that dissemination of the Company’s proprietary technology, know-how and trade secrets will not occur.
THE COMPANY’S BUSINESS WOULD BE ADVERSELY AFFECTED IF IT WERE NOT ABLE TO MAINTAIN A STRONG INTELLECTUAL PROPERTY POSITION
The Company currently holds one issued U.S. patent (patent number 6,069,009) with foreign counterparts covering an original method for increasing the growth of plant cell cultures.
While the Company’s practice is to file, where prudent, patent applications with respect to technology, inventions and improvements that are important to its business, the Company primarily relies upon trade secrets, unpatented know-how and continuing technological innovation to develop and maintain the competitive position of its Phytomics Technologies and Plant Product Discovery Platform. For example, as a result of the disclosure requirements inherent in patent applications, the Company has decided to rely on trade secrets to protect its Phytomics Technologies and Plant Product Discovery Platform. There can be no assurance that the Company can meaningfully protect its proprietary position through these means or that others will not independently develop substantially equivalent proprietary technology.
12
The Company intends to continue filing international patent applications, where applicable, on products discovered through the screening of its chemically diverse library of compounds for use in particular therapeutic, cosmetic and nutraceutical areas and/or against specified molecular targets and cellular assays. There can be no assurance, however, that any United States or foreign patent application will result in an issued patent or that any such patent, if issued will adequately protect the Company’s products
The Company’s success will depend in large part on its ability to maintain trade secret protection and on its ability to obtain patents for its therapeutic, cosmetic and nutraceutical products, both in the United States and in foreign countries. The Company’s success also depends upon its ability to defend patents once obtained.
The biotechnology, pharmaceutical, cosmetic and nutraceutical industries place considerable importance on obtaining and maintaining patent and trade secret protection for new products, technologies and processes. Patent positions, however, can be highly uncertain and involve complex legal and factual issues and there can be no assurance that the Company’s future patent applications will result in the issuance of patents. There can also be no assurance: (i) that the Company will develop proprietary and patentable technologies or products; (ii) that any patents issued to the Company will provide the company with any competitive advantages or will not be challenged by third parties; (iii) that any third party patents will not hinder the Company’s ability to do business or that third parties will be unable to circumvent the Company’s patents; or (iv) that third parties will not independently develop similar or identical products.
IF WE DO NOT COMPETE SUCCESSFULLY IN THE DEVELOPMENT AND COMMERCIALIZATION OF OUR TECHNOLOGY AND KEEP PACE WITH RAPID TECHNOLOGICAL CHANGE, WE WILL BE UNABLE TO CAPTURE AND SUSTAIN A MEANINGFUL MARKET POSITION
The biotechnology and pharmaceutical industries are highly competitive and subject to significant and rapid technological change. Many of these competitors, either alone or together with their collaborative partners, have substantially greater financial resources and larger research and development staffs than we do. In addition, many of these competitors, either alone or together with their collaborative partners, have significantly greater experience than we do in:
|
|
| Developing products; |
|
|
| obtaining approvals of products from regulatory agencies; and |
|
|
| manufacturing and marketing products. |
Developments by others may render our product candidates or technologies obsolete or noncompetitive. We face and will continue to face intense competition from other companies for collaborative arrangements with pharmaceutical and biotechnology companies, for establishing relationships with academic and research institutions, and for licenses of products or technology. These competitors, either alone or with their collaborative partners, may succeed in developing technologies or products that are more effective than ours.
However, the existence of technology of which MH-B is not aware, or technology that may be developed in the future, may adversely affect the technical and competitive advantages that MH-B currently believes it holds. MH-B’s competitive position will also depend on its ability to attract and retain qualified scientific and other personnel, develop effective proprietary products, successfully perform its collaboration agreements with its corporate partners, implement research and development and production plans, obtain patent protection and secure adequate capital sources.
THE COMPANY’S INDUSTRY IS EXTREMELY COMPETITIVE AND THE COMPANY MAY ULTIMATELY PROVE UNSUCCESSFUL
Many organizations are actively attempting to develop technologies that improve the effectiveness and efficiencies of the product discovery process. The Company competes with the research departments of pharmaceutical, cosmetic and nutraceutical companies, biotechnology companies, natural product-based discovery companies, chemistry companies, research and academic institutions and other therapeutic, cosmetic and/or nutraceutical product discovery and development companies.
For example, with regard to the Company’s Phytomics Technologies and Plant Product Discovery Platform, although the Company believes that it is a world leader in accessing chemical diversity from plant cell culture, several competitors have developed natural product libraries and have marketed them to pharmaceutical, cosmetic, nutraceutical and biotechnology companies. Additionally, some large pharmaceutical, cosmetic and nutraceutical companies have internal natural product-based discovery groups. Many of
13
the Company’s competitors have greater financial and human resources and more research experience. As a result, they may be able to adapt more readily than the Company to technological advances or to devote greater resources than the Company to the discovery and development of therapeutic, cosmetic and/or nutraceutical products. The Company may face increased competition in the future as new companies enter the market and advanced technologies become available.
THE MANUFACTURE AND STORAGE OF PHARMACEUTICAL PRODUCTS IS SUBJECT TO ENVIRONMENTAL REGULATION AND RISK
Because of the chemical ingredients of pharmaceutical products and the nature of their manufacturing process, the pharmaceutical industry is subject to extensive environmental regulation and the risk of incurring liability for damages or the costs of remedying environmental problems. We use limited quantities of hazardous materials and chemicals as the Company carries out its activities. If we fail to comply with environmental regulations to use, discharge or dispose of hazardous materials appropriately or otherwise to comply with the conditions attached to our operating licenses, the licenses could be revoked and we could be subject to criminal sanctions and/or substantial liability or could be required to suspend or modify our operations. The risk of accidental injury or contamination from these materials cannot be completely eliminated. In the event of such an accident, the Company could be held liable for any damages that result and any such liability could exceed the resources of the Company. In addition, there can be no assurance that the Company will not be required to incur significant costs to comply with environmental laws and regulations in the future. Any of these events could adversely affect the Company’s business.
Environmental laws and regulations can require us to undertake or pay for investigation, clean-up and monitoring of environmental contamination identified at properties that we currently own or operate or that we formerly owned or operated. Further, they can require us to undertake or pay for such actions at offsite locations where we may have sent hazardous substances for disposal. These obligations are often imposed without regard to fault. In the event we are found to have violated environmental laws or regulations, our reputation will be harmed and we may incur substantial monetary liabilities. We currently have insurance coverage that we believe is adequate to cover our present activities. However, this insurance may not be available or adequate to cover any losses arising from contamination or injury resulting from our use of hazardous substances.
FAILURE OF THE COMPANY TO COMPLY WITH REGULATORY REQUIREMENTS WOULD HAVE AN ADVERSE EFFECT ON ITS BUSINESS
The manufacture and sale of plant-derived products for human consumption in Canada, the U.S. and in other jurisdictions are governed by an assortment of statutes and regulations that require: (i) approval of manufacturing facilities; (ii) controlled research and human testing of products; and (iii) government review and approval of a submission containing all relevant scientific, human testing and manufacturing data establishing the safety and efficacy of the product for each use sought. The Canadian TPD, the U.S. FDA and other regulatory authorities must confirm that human testing, as well as manufacturing, are all carried out under good laboratory, testing and manufacturing practices. The process of obtaining regulatory approvals can be expensive and time-consuming and there can be no assurance that products will be successfully developed and receive regulatory approvals. As a result, the Company cannot be certain if or when any approval will be granted for any products resulting from its technologies.
THE EFFORTS OF THE GOVERNMENT AND OTHERS TO REDUCE THE COST OF HEALTH CARE MAY HAVE AN ADVERSE EFFECT ON THE COMPANY’S COLLABORATORS AND ITS BUSINESS
The Company expects that a portion of its medium- and long-term revenues will be derived from products provided to the pharmaceutical and biotechnology industries. Accordingly, the Company’s success is directly dependent upon the success of the companies within those industries and their continued demand for the Company’s products. The levels of revenues and profitability of pharmaceutical and biotechnology companies may be affected by the continuing efforts of governmental and third party payors to contain or reduce the costs of health care, including the costs and reimbursement rates for therapeutic products, through various means. To the extent that any such means have an adverse effect on the business, financial condition and profitability of pharmaceutical and biotechnology companies, the Company’s business may also be adversely affected.
RISKS RELATED TO THIS OFFERING
FUTURE SALES OF OUR COMMON STOCK, OR THE PERCEPTION OF THESE SALES MAY OCCUR, COULD DEPRESS THE STOCK PRICE
14
Sales of substantial amounts of our common stock in the public market, or the perception in the public markets that these sales may occur, could cause the market price of our common stock to decline. This could also impair our ability to raise additional capital through the sale of our equity securities. Upon completion of this offering, we will have 40,000,000 shares of our common stock outstanding. In addition to the adverse effect a price decline could have on holders of our common stock, such a decline could impede our ability to raise capital or to make acquisitions through the issuance of additional shares of our common stock or other equity securities.
THE PRICE OF OUR COMMON STOCK MAY BE VOLATILE
Prior to this offering, there has been no public market for our common stock. We cannot predict the extent to which investor interest will lead to the development of an active and liquid trading market in our common stock. The initial public offering price for the shares will be determined by us and may not be indicative of the market price of the common stock that will prevail in the trading market. The market price of the common stock may decline below the initial public offering price. Some companies that have had volatile market prices for their securities have been subject to securities class action suits filed against them. If a suit were to be filed against us, regardless of the outcome, it could result in substantial costs and a diversion of our management’s attention and resources. This could have a material adverse effect on our business, results of operations and financial condition
15
OUR ISSUANCE OF PREFERRED SHARES AND OUR ABILITY TO ISSUE ADDITIONAL PREFERRED SHARES COULD MAKE IT MORE DIFFICULT FOR A THIRD PARTY TO ACQUIRE AN INTEREST IN MANAGEMENT, TO THE POSSIBLE DETRIMENT OF HOLDERS OF COMMON STOCK.
We have the ability to issue and have available the ability to issue preferred shares which, if issued, could make it more difficult for a third party to acquire us, to the detriment of holders of shares of our common stock. Our Board of Directors may authorize and issue our authorized but yet unissued preferred stock with voting or conversion rights that could adversely affect the voting power or other rights of the holders of common stock. In addition, the potential future issuance of preferred stock may have the effect of delaying, deferring or preventing a change in our control, may discourage bids for our common stock at a premium over the market price of the common stock and may adversely affect the market price of our common stock.
OUR CHARTER PROVIDES FOR LIMITED LIABILITY FOR OUR DIRECTORS
Our articles of incorporation (by-laws) limit and indemnify against the personal liability of our directors for monetary damages for breach of fiduciary duty of care as a director, subject to certain exceptions, to the fullest extent allowed by Canadian law. Accordingly, except in limited circumstances, our directors may not be liable to us or our stockholders, for breach of this duty.
SHARES ELIGIBLE FOR PUBLIC SALE IN THE FUTURE COULD DECREASE THE PRICE OF OUR SHARES OF COMMON STOCK AND REDUCE OUR FUTURE ABILITY TO RAISE CAPITAL
Sales of substantial amounts of shares of our common stock in the public market could decrease the prevailing market price of our common stock. If this is the case, investors in our shares of common stock may be forced to sell such shares at prices below the price they paid for their shares. In addition, a decreased market price may result in potential future investors losing confidence in us and failing to provide needed funding. This will have a negative effect on our ability to raise equity capital in the future.
16
MARKET FOR COMMON EQUITY AND RELATED STOCKHOLDERS MATTERS
Currently there is no public market for our shares. After our Registration Statement is declared effective, we will apply for a public listing for the shares of our common stock. We have approximately 2000 shareholders owning 40,000,000 common shares, all of which are subject to the resale restrictions of Rule 144.
EQUITY COMPENSATION PLAN INFORMATION
The following table sets forth certain information as of September 5, 2006, with respect to compensation plans under which our equity securities are authorized for issuance:
|
|
|
|
|
|
|
|
| (a) |
| (b) |
| (c) |
|
|
|
| |||
|
| Number of securities to |
| Weighted-average |
| Number of securities |
|
|
|
|
|
|
|
Equity compensation Plans approved by Security holders |
| None |
| None |
| None |
|
|
|
|
|
|
|
Equity compensation Plans not approved By security holders |
| None |
| None |
| None |
|
|
|
|
|
|
|
Total |
| None |
| None |
| None |
DIVIDENDS
We have never paid a cash dividend on our common stock. It is our present policy to retain earnings, if any, to finance the development and growth of our business. Accordingly, we do not anticipate that cash dividends will be paid until our earnings and financial condition justify such dividends. There can be no assurance that we can achieve such earnings.
17
MANAGEMENT’S DISCUSSION AND ANALYSIS AND PLAN OF OPERATIONS
PLAN OF OPERATIONS
Millenia Hope Biopharma (MH-B) is the world’s leading bioresearch firms in Phytomics Technologies, commercializing plant cell-based bioprocesses for the discovery, development and production of natural and novel plant-derived products for the pharmaceutical, cosmetic and nutraceutical industries. MH-B (formerly Avance Pharma) has spent over $30 million in developing its unique Phytomics Technologies, including the world’s largest library of highly purified phytochemical fractions to be utilized by the pharmaceutical, cosmetic and nutraceutical industry. MH-B is the midst of the commercializing several projects with leading multi-national corporations.
MH-B is a global leader in Phyromics Technology and is ideally suited through it expertise, infrastructure and world-class library of purified phytochemical fractions to deliver natural products discovery and development. In May 2006, MH-B forged a relationship with Institut Armand-Frappier, INRS, a world leader in biotechnology R & D and a member of the international network of Pasteur Instiutes, a leading non-profit research organization.
The health industry at large, inclusive of pharmaceutical, biopharmaceutical, cosmetic, nutraceutical as well as food additives, is facing critical issues to ensure future development. In order to meet investor expectations and to achieve annual growth rates of 10%, a major pharmaceutical company must launch on average four New Chemical Entities (NCEs) per year, with average annual sales of US $350M. From 1996 to 2001, however, the pharmaceutical industry only launched, on average, less than one NCE per year per company and only one quarter of those new products had achieved sales of US $350M by 2001. During this period, pharmaceutical R&D spending in the US increased by approximately 40%, whereas new drug approvals declined by nearly 50%. In 2001, for example, the top sixteen pharmaceutical companies only launched a total of ten new products.
One of the reasons for this dearth of approved NCEs is that chemical diversity, or the lack thereof, has become a major obstacle for the drug discovery and development process. Natural products have traditionally been a consistent source of NCEs. In the period between 1981 and 2002, 61% of the 877 new small molecule drugs approved were either natural products or were derived from natural products, more than 50% of which came from plants.
MH-B’s highly purified natural and novel phytochemical fractions, obtained from cleaner cell culture extracts have a significant competitive advantage, over our competitors, in solving the technological challenges of plant extracts in the drug discovery environment.
MH-B’s primary business activities will focus on business development targeting the markets of cosmetic, nutraceutical and pharmaceutical industrial products. More specifically, companies in these markets are either searching for innovative new products of plant origin using modern product discovery technologies and/or struggling to produce efficiently complex plant products. However, they are experiencing serious problems in accessing and producing plant compounds, and currently facing important market gaps and significant unmet needs that MH-B can satisfy efficiently, using its unique technologies.
MH-B’s business development activities will be driven by
|
|
|
|
| 1. | Needs and requests of prospective customers for plant-based discovery projects and/or production projects | |
|
|
| |
| 2. | Innovative product concepts identified through market intelligence | |
|
| ||
Typically these projects would be structured as follows. | |||
|
| ||
| 1. | The partner pays | |
|
|
|
|
| • | Licensing fees to access MH-B’s technologies and phytochemical library, | |
|
|
|
|
| • | R&D costs, | |
|
|
|
|
| • | Pre-negotiated milestones and royalty (at commercialization) payments. | |
|
|
|
|
| 2. | The partner obtains | |
|
|
|
|
| • | Co-ownership of product IP, and | |
|
|
|
|
| • | Full commercialization rights with performance clauses. | |
18
|
|
|
|
| 3. | MH-B’s retains | |
|
|
|
|
|
| • | Co-ownership of product IP, and |
|
|
|
|
|
| • | Cull ownership of production technologies and IP and exclusive industrial scale production rights for complex plant products (2nd commercial activity) |
In Summary, MH-B’s objectives are to generate US $16.5Million/yr and US $2.6Million/yr of profitable product discovery and R&D production projects, respectively, in the targeted markets with the next three years to 2008, excluding milestone and royalty payments. In addition, MH-B expects that the latter projects will translate into US $59Million/yr profitable production contracts within the next 3-5 years depending on the availability of suitable production facilities.
|
|
|
|
|
|
|
Market |
| Overall |
| Estimated R&D Spending |
| MH-B Target |
|
|
| ||||
Pharmaceuticals |
| $492 Billion |
| $58 Billion (11.8%) |
|
|
|
|
|
|
|
|
|
1- Drug Discovery |
|
|
| $4.6Billion |
| $9 Million (0.2%) |
|
|
|
|
|
|
|
2- R&D production projects |
|
|
| $47Million |
| $0.9Million (2%) |
|
|
|
|
|
|
|
3- Supply of plant-derived |
|
|
| $0.7B (7% *25% of plant- |
| $14Million (2%) |
|
|
|
|
|
|
|
Active principle |
|
|
|
|
|
|
|
|
|
|
|
|
|
Cosmetics |
| $211 Billion |
| $6 Billion (3%) |
|
|
|
|
|
|
|
|
|
1- Product Discovery |
|
|
| $0.6 Billion |
| $6Million (1%) |
|
|
|
|
|
|
|
2- R&D production projects |
|
|
| $22 Million |
| $1Million (5%) |
|
|
|
|
|
|
|
3- Sales of plant-derived ingredients |
|
|
| $5.9 Billion |
| $29Million (0.5%) |
|
|
|
|
|
|
|
Nutraceuticals |
| $8 Billion (2005) |
| $240 Million (3%) |
|
|
|
|
|
|
|
|
|
1- Product Discovery |
|
|
| $24Million |
| $1.5Million (6%) |
|
|
|
|
|
|
|
2- R&D production projects |
|
|
| $12Million |
| $0.7Million (6%) |
|
|
|
|
|
|
|
3- Sales of ingredients |
|
|
| $8Billion |
| $16Million (0.2%) |
To date the company has signed an initial contract with the cosmetic giant, L’Oréal, worth in excess of $200,000 US and an initial contract with a large ($1 Billion + of sales) international Pharma, Pierre Fabre, worth in excess of $800,000 US.
19
RESULTS OF OPERATIONS
Three and six month period ending May 31, 2006 and May 31, 2005 (unaudited)
|
|
|
|
|
|
|
|
|
|
|
|
|
|
|
|
|
|
|
|
|
|
|
| 6 months ended |
| 6 months ended |
| 3 months ended |
| 3 months ended |
| ||||||||||||
|
|
|
|
|
| ||||||||||||||||
Revenues |
|
| $ | 231 785 |
|
|
| $ | 0 |
|
|
| $ | 150 325 |
|
|
| $ | 0 |
|
|
Operating Expenses |
|
|
|
|
|
|
|
|
|
|
|
|
|
|
|
|
|
|
|
|
|
Salaries |
|
|
| 165 902 |
|
|
|
| 0 |
|
|
|
| 143 926 |
|
|
|
| 0 |
|
|
Research and Development |
|
|
| 55 080 |
|
|
|
| 0 |
|
|
|
| 55 080 |
|
|
|
| 0 |
|
|
Selling, general &Administrative |
|
|
| 317 855 |
|
|
|
| 0 |
|
|
|
| 291 993 |
|
|
|
| 0 |
|
|
Operating (Loss) |
|
|
| (307 052 | ) |
|
|
| 0 |
|
|
|
| (351 510 | ) |
|
|
| 0 |
|
|
Other Expenses |
|
|
| (12 443 | ) |
|
|
| 0 |
|
|
|
|
| ) |
|
|
| 0 |
|
|
Net(Loss) |
|
| $ | (319 495 | ) |
|
| $ | 0 |
|
|
| $ | (351 510 | ) |
|
| $ | 0 |
|
|
3 months ending May 31, 2006 and 2005
The 3 months to May 2006 we received an initial revenue payment from Pierre Fabre of $ 150 325 for a contract we signed with them. We had no activity in 2005.
We paid our scientists and administrators $143 926 of salary and made rent payments of $125 002 and had Research and Development Costs of $55 080 to May 31, 2006 (we commenced activity on February 14, 2006) and had no activity, at all, in 2005.
As a result we had a net loss of $363 953 for the quarter ended May 31, 2006 and we were inactive during the same quarter of 2005.
6 months ending May 31, 2006 and 2005
The six months to May 2006 we received initial revenue payment from L’Oréal and Pierre Fabre for contracts we signed with them, totaling $ 231 785. We had no activity in 2005.
We paid our scientists and administrators $165 902 of salary and made rent payments of $139 928 and had Research and Development Costs of $55 080 to May 31, 2006 (we commenced activity on February 14, 2006) and had no activity, at all, in 2005.
As a result we had a net loss of $319 495for the six months ended May 31, 2006 and we were inactive during the same period of 2005.
Liquidity and Capital Resources
At May 31, 2006, we had working capital of $13,560. Additional capital and/or borrowings will be necessary. Management anticipates generating revenue through developing and producing new plant-derived products during the next fiscal year. Our officers and directors have indicated their commitment to fund the operations of the organization during the next fiscal year, if necessary, until the organization can generate sufficient cash flow from operations to meet current operating expenses and overhead. We anticipate our net cash needs at $1,500,000 for the fiscal year ending November 30, 2006.
Effect of Recent Accounting Pronouncements
SFAS 156 – ‘Accounting for Servicing of Financial Assets—an amendment of FASB Statement No. 140’
This Statement, issued in March 2006, amends FASB Statement No. 140,Accounting for Transfers and Servicing of Financial Assets and Extinguishments of Liabilities, with respect to the accounting for separately recognized servicing assets and servicing liabilities. This Statement:
|
|
|
| 1. | Requires an entity to recognize a servicing asset or servicing liability each time it undertakes an obligation to service a financial asset by entering into a servicing contract in certain situations. |
20
|
|
|
| 2. | Requires all separately recognized servicing assets and servicing liabilities to be initially measured at fair value, if practicable. |
|
|
|
| 3. | Permits an entity to choose either the amortization method or the fair value measurement method for each class of separately recognized servicing assets and servicing liabilities. |
|
|
|
| 4. | At its initial adoption, permits a one-time reclassification of available-for-sale securities to trading securities by entities with recognized servicing rights, without calling into question the treatment of other available-for-sale securities under Statement 115, provided that the available-for-sale securities are identified in some manner as offsetting the entity’s exposure to changes in fair value of servicing assets or servicing liabilities that a servicer elects to subsequently measure at fair value. |
|
|
|
| 5. | Requires separate presentation of servicing assets and servicing liabilities subsequently measured at fair value in the statement of financial position and additional disclosures for all separately recognized servicing assets and servicing liabilities. |
Adoption of this Statement is required as of the beginning of the first fiscal year that begins after September 15, 2006. The adoption of this statement is not expected to have a material impact on our financial statements.
SFAS 155 – ‘Accounting for Certain Hybrid Financial Instruments—an amendment of FASB Statements No. 133 and 140’
This Statement, issued in February 2006, amends FASB Statements No. 133,Accounting for Derivative Instruments and Hedging Activities, and No. 140,Accounting for Transfers and Servicing of Financial Assets and Extinguishments of Liabilities. This Statement resolves issues addressed in Statement 133 Implementation Issue No. D1, “Application of Statement 133 to Beneficial Interests in Securitized Financial Assets.”
This Statement:
|
|
|
| a. | Permits fair value remeasurement for any hybrid financial instrument that contains an embedded derivative that otherwise would require bifurcation |
|
|
|
| b. | Clarifies which interest-only strips and principal-only strips are not subject to the requirements of Statement 133 |
|
|
|
| c. | Establishes a requirement to evaluate interests in securitized financial assets to identify interests that are freestanding derivatives or that are hybrid financial instruments that contain an embedded derivative requiring bifurcation |
|
|
|
| d. | Clarifies that concentrations of credit risk in the form of subordination are not embedded derivatives |
|
|
|
| e. | Amends Statement 140 to eliminate the prohibition on a qualifying special-purpose entity from holding a derivative financial instrument that pertains to a beneficial interest other than another derivative financial instrument. |
This Statement is effective for all financial instruments acquired or issued after the beginning of our first fiscal year that begins after September 15, 2006.
The fair value election provided for in paragraph 4(c) of this Statement may also be applied upon adoption of this Statement for hybrid financial instruments that had been bifurcated under paragraph 12 of Statement 133 prior to the adoption of this Statement. Earlier adoption is permitted as of the beginning of our fiscal year, provided we have not yet issued financial statements, including financial statements for any interim period, for that fiscal year. Provisions of this Statement may be applied to instruments that we hold at the date of adoption on an instrument-by-instrument basis.
We are currently reviewing the effects of adoption of this statement but it is not expected to have a material impact on our financial statements.
SFAS 154 ‘Accounting Changes and Error Corrections—a replacement of APB Opinion No. 20 and FASB Statement No. 3
In May 2005, the Financial Accounting Standards Board (“FASB”) issued Statement No. 154. This Statement replaces APB Opinion No. 20, Accounting Changes, and FASB Statement No. 3, Reporting Accounting Changes in Interim Financial Statements, and changes the requirements for the accounting for, and reporting of, a change in accounting principle. This Statement applies to all voluntary changes in accounting principle. It also applies to changes required by an accounting pronouncement in the unusual instance that the pronouncement does not include specific transition provisions. When a pronouncement includes specific transition provisions, those provisions should be followed.
SFAS 154 is effective for accounting changes and corrections of errors made in fiscal years beginning after December 15, 2005. It will only affect our financial statements if we change any of our accounting principles. At this time, no such changes are contemplated or anticipated.
21
SFAS 153 ‘Exchanges of Nonmonetary Assets an Amendment of APB Opinion No. 29’
In December 2004, FASB Statement No. 153 was issued amending APB Opinion No. 29 to eliminate the exception allowing nonmonetary exchanges of similar productive assets to be measured based on the carrying value of the assets exchanged as opposed to being measured at their fair values. This exception was replaced with a general exception for exchanges of nonmonetary assets that do not have commercial substance. A nonmonetary exchange has commercial substance if the future cash flows of the entity are expected to change significantly as a result of the exchange. The provisions of this statement are effective for nonmonetary asset exchanges occurring in fiscal periods beginning after June 15, 2005. The adoption of this statement is not expected to have a material impact on our financial statements.
SFAS 152 ‘Accounting for Real Estate Time-Sharing Transactions—an amendment of FASB Statements No. 66 and 67’
Issued by the FASB in December 2004, this Statement amends SFAS 66, Accounting for Sales of Real Estate, to reference the financial accounting and reporting guidance for real estate time-sharing transactions that is provided in AICPA Statement of Position (SOP) 04-2, Accounting for Real Estate Time-Sharing Transactions. This Statement also amends SFAS 67, Accounting for Costs and Initial Rental Operations of Real Estate Projects, to state that the guidance for (a) incidental operations and (b) costs incurred to sell real estate projects does not apply to real estate time-sharing transactions. The accounting for those operations and costs is subject to the guidance in SOP 04-2.
This Statement is effective for financial statements for fiscal years beginning after June 15, 2005. This statement is not expected to have any affect on our financial statements.
SFAS 123(R) ‘Share-Based Payments’
In December 2004, the FASB issued SFAS No. 123(R), “Share-Based Payments.” SFAS No. 123 (R) requires all entities to recognize compensation expense in an amount equal to the fair value of share-based payments such as stock options granted to employees. SFAS No. 123 (R) is effective for the first reporting period beginning after December 15, 2005, or for the quarter ended May 31, 2006. The adoption of FAS 123 (R) did not have a material impact on the financial statements.
BUSINESS – OUR COMPANY
A SUMMARY OF WHAT WE DO
OVERVIEW
We were incorporated in Canada on January 13, 2000 under the Canada Business Corporations Act, or CBCA. Our authorized capital in virtue of said charter is unlimited and upon a unanimous decision of the Board of Directors, we limited the authorized capital to 280,000,000 common shares and 50,000,000 preferred shares. Millenia Hope Biopharma (MH-B) is a Montreal-based biotechnology company focused on exploiting major advancements in accessing one of the most productive sources of biologically active compounds, plants, to discover, develop and produce new products for human health and well being. We commenced our commercial activity on February 14, 2006.
FOCUS
MH-B’s is a biotechnology company focusing on the discovery, development and production of new plant-derived pharmaceutical, cosmetic and nutraceutical products Company, both internally and in partnership, using Phytomics Technologies and Plant-based Product Discovery Platform.
22
MH-B intends to expand its portfolio of important proprietary and partnered health products as well as proprietary Phytomics-based bioprocesses for the industrial scale production of complex plant-based products of commercial relevance.
THE BUINESS
Millenia Hope Biopharma (MH-B) is a Montreal-based biotechnology company focused on discovering, developing and producing new plant-derived products for human health and well being. MH-B is building a portfolio of important health products for the pharmaceutical, cosmetic and nutraceutical industries based on major advancements in accessing one of the most productive sources of natural products: plants. MH-B’s approach to product discovery combines the immense potential of the plant kingdom’s untapped chemodiversity with validated biological targets.
Over the past 15-20 years, the pharmaceutical industry has developed high throughput systems using cellular assays and molecular targets to screen large number of synthetic chemicals in order to discover new drugs. This major undertaking yielded limited success in view, in good part, of the limited chemodiversity offered by synthetic chemistry. More recently, the cosmetic and nutraceutical industries have been implementing similar approaches to speed-up their discovery activities focusing, for the most part, on natural product screening. However, it has been conclusively shown that traditional natural extracts are not compatible with modern high throughput discovery processes.
On the other hand, small molecules from plants (phytochemicals) have attributes that are essential in today’s discovery processes: structural complexity, broad chemical and stereochemical diversity, as well as effective biological activity. However,significant technological challenges in obtaining, isolating, synthesizing and producing required quantities of plant compounds have kept this tremendous source of chemodiversity out of the mainstream of product discovery.
MH-B has developed proprietary and patented enabling Phytomics Technologies that allow unprecedented access and supply of natural and novel, chemodiverse phytochemicals compatible with biological target-based discovery processes. With the scarcity of structurally diverse small molecules being explicitly linked to the health industry’s dearth of new product approvals, MH-B’s ability to continuously generate a large number of novel, structurally diverse and biologically active small molecules addresses one of the major causes of the industry’s current malaise. Phytomics do not risk becoming redundant and cannot be easily copied.
The Company has built a powerful Phytomics infrastructure that has produced an exclusive, reproducible and expandable library of phytochemicals for product discovery and development. To exploit its distinctive chemical capabilities, the Company has also developed a uniquePlant Product Discovery Platform combining biological target-based discovery processes and Phytomics to efficiently discover and develop novel plant-derived products for the health industry. The Phytomics Technologies are being leveraged to develop a unique, high-value revenue generating pipeline of new plant-based health products. Since 2004, proof-of-concept of these technology platforms has been established in 1) infectious disease, with two high value patent applications in the area of HIV, and 2) increasing interest from the pharmaceutical, cosmetic and nutraceutical industries.
The goal of MH-B is to leverage its Phytomics and Plant Product Discovery Platforms in order to develop, in partnership, new plant-derived products for the pharmaceutical, cosmetic and nutraceutical industries.
PHYTOMICS, THE TECHNOLOGY
Plants have contributed enormous chemodiversity to the pharmaceutical, cosmetic and nutraceutical industries, without having been explored in a systematic manner. In fact, more than 120 plant-derived drugs have been used in western medicine while less than 8% of ~ 300,000 plant species have been studied, often incompletely, for their therapeutic value. Our Phytomics Technologies has the potential to systematically access the plant kingdom’s chemodiversity and to uncover a vast wealth of much needed natural and novel small molecules for health product discovery.
MH-B’s state-of-the-art Phytomics Technologies, the subject of one issued US patent, with foreign counterparts, along with extensive trade secrets, are actually an evolving integrated suite of proprietary technologies, novel approaches, expertise and unique know-how in plant biotechnology and phytochemistry. These breakthroughs have allowed the Company to overcome the access, reproducibility, purification and supply issues that have always been major technological barriers to phytochemical drug discovery. MH-B’s research team has transformed into a science the relatively underdeveloped field ofin vitro plant cell culture and has created a bioprocess by which an unprecedented number of compounds can be biosynthesized reproducibly and where access and supply are no longer limiting factors.
In building its Phytomics Technologies, we have developed:
23
|
|
|
| 1. | The expertise to generate productive cell lines from most plant species; |
|
|
|
| 2. | A collection of productive cell lines from over 2,200 plant species in culture, obtained from 240 of 634 known plant families; |
|
|
|
| 3. | Continuously improving, novel biotechnologies, expertise and know-how to control and accelerate the metabolism of cultured plant cells for high rate biosynthesis of natural and novel small molecules; |
|
|
|
| 4. | Approaches in mutagenesis and genetic engineering of cultured plant cells for reproducible biosynthesis at high yields of specific complex phytochemicals of industrial interest; |
|
|
|
| 5. | A unique, computer-monitored and -controlled bioreactor system, successfully scaled-up to pilot size (50 L completed; 300 L in development), for the efficient culturing of plant cells; |
|
|
|
| 6. | A proprietary quasi-expert system for controlling plant cell culture processes; |
|
|
|
| 7. | Integrated extraction, separation and purification procedures for processing complex culture extracts into highly purified fractions and compounds; and |
|
|
|
| 8. | Fully equipped laboratory facilities. |
A key feature of our proprietary Phytomics Technologies is its ability to develop efficient and scalable plant cell-based bioprocesses to produce at industrial level complex phytochemicals of commercial relevance. If a complex plant product cannot be synthesized economically at industrial scale, this gives MH-B a major competitive advantage
PLANT DISCOVERY PLATFORM
Traditional plant extracts have been found incompatible with high speed and highly specific discovery technologies with respect to the inherent complexity of natural product mixtures (typically, an extract contains 1000s of compounds at different yields). Furthermore, the short cycle times of discovery processes, from screening to supply and identification of the purified compounds responsible for the activity, amplify this incompatibility.
MH-B has developed a unique, highly efficient Plant Product Discovery Platform that encompasses
|
|
|
|
|
| 1. | New bioprocesses based on the Phytomics Technologies that allow | ||
|
|
|
|
|
|
|
| a. | The continuous generation of a wide range natural and novel phytochemicals for testing, and |
|
|
|
|
|
|
|
| b. | The rapid and reproducible supply and identification of active compounds, |
|
|
|
|
|
| 2. | High throughput extraction, separation and purification (HTESP) technologies making plant compounds compatible with today’s discovery technologies, and | ||
|
|
|
|
|
| 3. | The expertise and modern high throughput screening (HTS) technologies for effective testing of plant compounds. | ||
Using the HTESP technologies, plant cell culture extracts are extensively purified prior to biological testing. The resulting fractions contain, on average, 7 compounds, which means that final purification of an active compound is much simpler and faster than the long and costly process of activity-guided fractionation. Only a limited number of purification steps are necessary, after identification of an active fraction in a primary assay, for confirmation and identification of the active compound.
This Phytomics bioprocess, integrating efficient HTESP technologies, allowed MH-B to generate a library of over 160,000 highly purified phytochemical fractions, representing approximately 1,000,000 compounds obtained from cell cultures of over 560 different plant species within 32 months. Although it may include some redundancy, this is the world’s largest library of its kind. This library is exclusive to MH-B and can be easily scaled-up.
A major competitive advantage of MH-B in plant product discovery is that Phytomics bioprocesses efficiently solve all the technological challenges associated with exploiting plant-derived compounds using today’s product discovery technologies (Table below). It is well known that natural products offer a much widerchemodiversity than synthetic chemistry. The Phytomics bioprocesses allow access to natural and also novel phytochemodiversity that may not be expressed in nature.
Table: Advantages of Phytomics bioprocesses in product discovery
24
|
|
|
|
|
|
|
Discovery process parameters |
| Sources of chemodiversity | ||||
| ||||||
| Synthetic |
| Traditional Natural |
| MH-B’s Phytomics | |
|
|
| ||||
Chemodiversity |
| Limited |
| Diverse |
| Diverse + |
|
|
|
|
|
|
|
Today’s product discovery cycle times |
| Compatible |
| Not compatible |
| Compatible |
|
|
|
|
|
|
|
Biological testing |
| HTS compatible |
| Problematic |
| HTS compatible |
|
|
|
|
|
|
|
Reproducibility of activity from primary screening |
| High |
| Low (under 60%) |
| High (>90%) |
|
|
|
|
|
|
|
Access and supply of active compounds |
| Not limiting |
| Can be problematic |
| Not limiting |
Plants produce a large variety of complex plant chemicals (secondary metabolites) for various purposes, including storage of key nutrients (carbon, oxygen and nitrogen) at low osmotic pressure, chemical defence against predators and pathogens and to attract insects for pollen dispersion. Some of these compounds are endogenously biosynthesized while others only in response to external stimuli.
MH-B has developed new technologies that allow efficient and reproducible expression of a wide range of endogenous and inducible metabolites both to increase the yield of specific compounds and to generate natural and novel chemodiversity.
MH-B’S TEAM HAS DEVELOPED A SERIES OF INDUCTION PROTOCOLS
The Phytomics bioprocesses are rapid, thus meeting more efficiently than all competitive approaches in the area of plant compound testing, the challenge of today’s product discovery cycle times. It takes MH-B’s research team only 1 to 6 weeks, depending on culture yield, to identify an active compound. MH-B’s purified phytochemical fractions are fully compatible with biological testing, including molecular targets and cell-based assays and with HTS technologies.
A critical issue of natural product discovery is reproducibility of activity from primary screening and identification of active compounds, where traditional natural product extracts have shown a success rate of under 60%. Likely, the high variability of natural plant extracts, which composition depends on a variety of environmental factors as well as the harvesting time, represents an important contributor to this low reproducibility. This significant technological challenge in product discovery has yet to be resolved.
25
MH-B’s research team, through extensive testing of its phytochemical fraction library using a variety of cellular assays and molecular targets, has been able to re-confirm primary biological activity and supply, purify and identify active compounds in more than 90% of cases. Furthermore, the Phytomics bioprocesses allow reproducible production of culture extracts and specific compounds continuously, thus ensuring efficient access and supply of active compounds.
MH-B IS THE ONLY COMPANY WORLDWIDE THAT CAN GUARANTEE SECURED AND REPRODUCIBLE SUPPLY OF BIO-ACTIVE NATURAL AND NOVEL PHYTOCHEMICALS IDENTIFIED THROUGH PRODUCT DISCOVERY ACTIVITIES
MH-B’s Phytomics bioprocesses thus permit the efficient screening of plant-based compounds in a modern product discovery environment. This unique platform can be efficiently exploited for the discovery of new plant-based pharmaceutical, cosmetic and nutraceutical products.
The Company has built in-house product discovery expertise and HTS technologies initially focused on infectious disease and GPCRs under the leadership of Dr. Bahige Baroudy recognized as one of Scientific American’s 50 Research Leaders of the Year for 2003 (Medical Treatment Category). Dr. Baroudy, formerly Group Director, Antiviral and Antimicrobial Therapy at the Schering-Plough Research Institute (Kenilworth, New Jersey), brought to the Company 25 years of industry and academic experience in basic research, infectious disease drug discovery and virology. While at the Schering-Plough Research Institute, he spearheaded the successful development of CCR5 antagonists that are currently in human clinical trials as HIV entry inhibitors. Dr. Baroudy participated in the development of new anti-HCV drugs. With his colleagues, he identified several HCV targets for inhibiting HCV replication. Among these targets were the NS3 Protease and Helicase, the NS5B polymerase and the IRES element. Dr. Baroudy and his team were successful in developing an HCV protease inhibitor (orally bioavailable) that is currently in Phase I clinical trial.
MH-B’s HTS technology platform includes expertise in screening enzymatic and receptors (GPCR) targets as well as cellular assays. This platform also includes additional assays to characterize biologically (e.g., toxicity) and chemically (e.g., solubility, stability) bioactive compounds.
MH-B’S PROOF OF CONCEPT
MH-B extensively screened 10,000 fractions from its library using nine anti-microbial, anti-viral and anti-cancer targets as well as the Endothelin receptor A, a well-known GPCR, with several collaborators. Results from this work revealed that MH-B’s phytochemicals could inhibit all targets tested. It was shown that this library contains drug-like chemicals that can be modified through SAR into Lead compounds. Further screening of this library showed an average success rate in finding active fractions for a given target of approximately 0.3% indicating its selectivity.
PRODUCT HISTORY
MARKET DEMAND
The health industry at large, inclusive of pharmaceutical, biopharmaceutical, cosmetic, nutraceutical as well as food additives, is facing critical issues to ensure future development. The challenges are numerous, of scientific and economic nature, but also increasingly at the socio-political level
NATURAL/PLANT PRODUCTS IN THE PHARMACEUTICAL INDUSTRY
The pharmaceutical industry is currently facing major marketing and technology challenges. Intense product competition, patent expiration of many of the top-selling drugs (between 2000 and 2004, products representing sales of US $43B have come off patent, reduced periods of exclusivity, as well as price constraints are putting pressure on pharmaceutical companies to lower costs, increase R&D productivity and accelerate product development. Consolidation of the industry has increased the size and revenues of the top firms, but it has also made double-digit revenue growth an even more daunting task. In order to meet investor expectations and to achieve annual growth rates of 10%, a major pharmaceutical company must launch on average fourNewChemicalEntities (NCEs) per year, with average annual sales of US $350M. From 1996 to 2001, however, the pharmaceutical industry has launched on average less than one NCE per year per company. Of all the NCEs launched in 1996, only one quarter had achieved sales of US$ 350M by 2001. During this period, pharmaceutical R&D spending in the US has increased by approximately 40%, whereas new drug approvals declined by nearly 50%. In 2001, for example, the top sixteen pharmaceutical companies only launched a total of ten new products.
26
One of the reasons for this dearth of approved NCEs is that chemical diversity, or the lack thereof, has become a rate-limiting step for the drug discovery and development process. This limitation can be addressed by designing or gaining access to compound libraries that contain novel chemodiversity and more drug-like structures, which will in turn improve the quality of the compounds that enter development.
Natural products have traditionally been a consistent source of NCEs by providing unmatched structural variety, complexity and biological potency. As shown in Figure 4, in the period between 1981 and 2002, 61% of the 877 new small molecule drugs approved were either natural products or were derived from natural products, more than 50% of which came from plants.
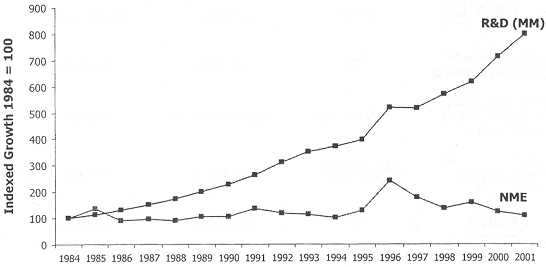
Most natural products come from bacteria, fungi, animals or plants. Plants have been utilized in traditional medicine for thousands of years and over 120 plant-derived drugs have been used in Western medicine and have produced pharmaceutical products in all major therapeutic areas (In table below). While close to three-quarters of these drugs were discovered as a result of the study of plants used in traditional medicine, there has never been a systematic approach to drug discovery from plants.
Table: Examples of plant-derived drugs in various therapeutic categories
|
|
|
|
|
Drug |
| Therapeutic Category/Indication |
| Plant Species |
|
| |||
Acetylsalicylic acid |
| Pain relief, heart attack, stroke |
| Salix alba |
Morphine, codeine |
| CNS |
| Papaver somniferum |
Galantamine |
| Alzheimer’s Disease |
| Galanthus woronowii |
Atropine |
| Anticholinergic-muscle relaxant |
| Atropa belladona |
Paclitaxel, docetaxel |
| Cancer |
| Taxus spp. |
Vincristine, vinblastine |
| Cancer |
| Catharanthus roseus |
Vindesine, vinorelbine |
| Cancer |
| Catharanthus roseus |
Irinotecan, topotecan |
| Cancer |
| Camptotheca acuminate |
Etoposide |
| Cancer |
| Podophyllum peltatum |
Digoxin |
| Cardiovascular |
| Digitalis purpurea |
Ajmaline |
| Anti-arrhythmic |
| Rauwolfia serpentina |
Pilocarpine |
| Ophthalmic |
| Pilocarpus jaborandi |
Pseudoephedrin |
| Respiratory |
| Ephedra sinica |
Theophylline |
| Respiratory |
| Theobroma cacao |
Dihydroartemisin |
| Infectious disease – Malaria |
| Artemesia annua |
Quinine |
| Infectious disease – Malaria |
| Cinchonapubescens |
Scopolamine |
| Gastrointestinal |
| Datura metel |
27
In the last 15-20 years, the pharmaceutical industry has embraced newer drug discovery technologies and focused on shortening discovery timelines in order to meet the intended goal of generating several more NCEs per year. As such, many pharmaceutical companies have discontinued their time- and resource-consuming traditional natural product programs. Instead, they have concentrated on the more high-throughput-friendly area of synthetic chemistry and combinatorial synthesis, and, in a sense, have given up on the unrivalled structural diversity available from nature.
The move away from conventional natural products can be understood if viewed from the traditional pharmaceutical perspective of screening natural products as extracts. This approach,especially for plant products, has several serious drawbacks.
|
|
|
| 1. | The large number of compounds and impurities in extracts can give rise to numerous false positives and negatives and can cause interference in assay results. In fact, natural extracts are not compatible with many sensitive and specific molecular and cell-based HTS assays. |
|
|
|
| 2. | The requirements for several iterative rounds of activity-guided fractionation on natural product extracts in order to identify the active constituent makes the whole process incompatible with the rapid screening cycle times that are so important in today’s high-throughput discovery model. |
|
|
|
| 3. | Reproducibility of activity in screening natural product extracts is low (under 60%). |
|
|
|
| 4. | Consistent and reproducible access to the active compound, once isolated, can be problematic. |
This last drawback can be a major problem when the active compound is too complex to be easily synthesized, as often the case with natural products. With the current emphasis on developing highly efficient discovery processes and on significantly reducing discovery timelines, it is understandable, if somewhat shortsighted, to see why many pharmaceutical companies are discontinuing their in-house natural product programs. Some pharmaceutical companies, however, still maintain efforts in this area, mostly using compounds of microbial origin.
Yet despite this seeming trend away from natural products, there were, in 2001, 143 compounds of natural origin in clinical trials or that had been recently launched. Of these, natural products from plants were by far the dominant source of bioactive compounds (In table below).
Table:. Source of natural product-derived drugs recently launched or in clinical development
|
|
Source | Number |
Plant | 51 |
Animal | 32 |
Bacterial | 21 |
Fungal | 9 |
Semi-synthetic | 30 |
| |
Total | 143 |
|
MH-B, being one of the only companies that can provide the widest access to natural and novel phytochemodiversity as well as guaranteed, secured and reproducible supply at all scale of bio-active phytochemicals. This is being recognized by the fact that several large pharmaceutical companies have solicited MH-B.
The Case of the Cosmetic Industry
The cosmetic industry is currently facing significant challenges, the most important of which include the following.
1- Increasing demand for natural(plant)-based safer cosmetic products
A number of cosmetic products contain synthetic ingredients that can be harmful to health. For example, alpha-hydroxy acids (AHA) found in moisturizers, toners, cleansers, masks, and age-spot removers were shown to increase the skin’s sensitivity to the sun by as much as 50 percent, thereby exposing consumers to accelerated skin aging and the possibility of skin cancer. Propylene glycol used in suntan lotions, lipsticks and other cosmetics and toiletries, was linked to liver abnormalities and kidney damage and is known to be as a skin and eye irritant. Talc found in makeup and body powders was linked to ovarian cancer and was found to induce cancer in rodents. Methyl methacrylate found in nail products, primarily in application of acrylic nails, was linked to fungal
28
infections, nail deformities, and other problems. Prolonged exposure can lead to eye, skin and lung irritation, abnormal liver or kidney function, nervous system damage or reproductive problems.
With increasing awareness of harmful synthetic chemicals in cosmetics, consumers are demanding products containing safer natural ingredients. In fact, 35% of cosmetic products are plant-based, and this market segment is growing at a rate of 10% per year. For example, most products from Yves Rocher (annual sales: €2B), Pierre Fabre (cosmetics approximately €0.8B) and Clarins (€0.2B), are of plant origin. On the other hand, as one of the pioneers of chemical-based cosmetics, L’Oreal’s market position (€15B) could be considerably affected by this trend.
2- Increasing product regulation
Regulatory agencies are pressing all suppliers to better characterize biologically and chemically the active ingredients, whether of synthetic or natural origin, contained in consumer products and to ensure high levels of reproducibility. These issues remain highly problematic for plant-based products that can only be resolved with great difficulties using traditional production technologies.
3- Increasing marketing demand for new products
The average life cycle of a cosmetic product is 3-5 years, which means that the demand for new products is enormous, with development times, from discovery to commercialization, reduced to less than 12-18 months. For example, L’Oréal markets 5,000 products and, consequently, its R&D team needs to discover and develop 1,000 to 3,000 new products per year.
4- Speeding up the rate of product discovery and development
In an effort to better meet market demand and speed up the rate of product discovery, large cosmetic companies (L’Oréal, Estée Lauder, Shiseido etc.) have adopted, in recent years, modern and faster approaches to speed-up their R&D activities similar to those used in the pharmaceutical industry, for the discovery of new cosmetic ingredients. These involve molecular targets and cellular assays and HTS systems to screen natural product extracts and for extensive toxicity testing prior to human trials. Apparently, this undertaking has not meet with expected success (L’Oréal, personal communications) for the same reasons discussed in section 3.1.1 that led the pharmaceutical industry to shy away from natural product drug discovery using traditional extracts during the last 15-20 years. Therefore, there is an urgent need for companies that have adopted modern discovery technologies to access expertise and plant compound libraries that are compatible with HTS systems such as MH-B’s Phytomics bioprocesses, phytochemical library and Plant Product Discovery Platform (L’Oréal, personal communication).
5- High demand for innovation
An aging population with high levels of disposable income is an important business opportunity for the cosmetic industry. Its is always eagerly seeking novel ingredients both for current product lines and for important unmet market needs such as new anti-aging, natural coloring, skin whitening and natural conservative agents. These innovative ingredients can be crude extracts, partly purified natural products or pure compounds obtained from natural sources.
These trends underline the dynamics of discovery and commercialization in the cosmetic industry. Although the market for individual products may be limited, their large number, high turnover and the insatiable appetite for novelty as well as the demand by regulatory authorities to develop and market safer and better-characterized products represent a tremendous business opportunity. The continuous, reproducible, secured and scalable supply of natural and novel phytochemodiversity compatible with today’s product discovery technologies is a strategic issue for the cosmetic industry. In this context, MH-B is uniquely positioned and has significant competitive advantages to meet this significant and strategic demand of the cosmetic industry.
The Case of the Nutraceutical Industry
The Dietary Supplement Health & Education Act adopted in 1994 in the US has created a regulatory environment that remains difficult to enforce, especially with regards to claims of specific health benefits and prevention. Nutraceuticals and functional foods of natural origin are in great demand, especially from plants. However, discovery, development and production of new products involve mostly conventional approaches in the context of the conservative food market. For example, the flavour industry screens only limited number of compounds annually and focuses mainly on combinations and modifications of known ingredients.
Few companies, however, are developing more systematic and efficient approaches in this area. For example, Senomyx (San Diego, CA) has identified and patented (72 issued patents and 212 pending patent applications) many of the chemokine (GPCR) receptors and ion channels present on the human tongue that detect yumami (savory), sweet, bitter, salt, fat and sour tastes as well as cold and olfactory sensing. This company is a world leader in the exploitation of molecular targets, cellular assays and HTS systems, similar to those used in the pharmaceutical industry, for the discovery and development of novel nutraceuticals. Furthermore, Senomyx has developed a cost effective and efficient process for acceptance of its products by regulatory agencies that yields full approval within 12-24 months from discovery. Senomyx is currently collaborating with Cadbury-Schweppes, Campbell’s Soup Co., Coca-Cola, Kraft and Nestlé.
29
To date, Senomyx has screened 200,000 compounds, mostly synthetic chemicals, using its HTS systems. Following market trends and requests by its collaborators, Senomyx has undertaken limited natural product screening with little success mostly because of reproducibility and supply issues similar to those experienced by the pharmaceutical and cosmetic industries (sections 3.1.1 and 3.1.4).
MARKET SUPPLY FROM THE PHYTOCHEMICAL LIBRARIES
Four types of phytochemical library are commercialized for the discovery and development of new products:
|
|
|
| 1. | Traditional plant extracts containing 1000’s of phytochemicals (and undesirable impurities) of different polarities, from water soluble to highly lipophilic compounds, present at different concentrations; |
|
|
|
| 2. | Purified natural phytochemical fractions, obtained from natural extracts, of different polarities, each containing usually 2 to 50 compounds at different concentrations; |
|
|
|
| 3. | Purified natural phytochemicals (and semi-synthetic derivatives) obtained from separation and purification of higher yield compounds of natural extracts; and |
|
|
|
| 4. | MH-B’s highly purified natural and novel phytochemical fractions, obtained from cleaner cell culture extracts, of different but more focused polarities, each containing usually 2 to 30 compounds at different concentrations. |
Obviously, all plant compound libraries obtained from natural sources suffer from serious drawbacks, including lack of reproducibility and problematic access of active compounds, especially those of lowest yields. The Phytomics bioprocesses offer MH-B a significant competitive advantage in this area by successfully solving all these technological challenges.
Historically, libraries of crude plant extracts have had limited success, for obvious reasons, in drug discovery environments. Consequently, the value of traditional plant extract libraries has been relatively low. Since purified plant products are not readily available in large numbers, it is difficult to gauge the value that such a library would command, especially when coupled to the breakthrough technologies developed by MH-B. Recently, however, Amgen entered into a three-year, non-exclusive collaboration with Infinity Pharmaceuticals for access to the latter’s “natural product-like” synthetic libraries. The groundbreaking synthetic chemistry-based technologies developed by Infinity Pharmaceuticals mirrors MH-B’s pioneering technological contributions in developing actual plant product biosynthetic libraries for drug discovery. Although most of the deal’s terms were not disclosed, Amgen did make a $25 million equity investment in Infinity.
PATENTS AND INTELLECTUAL PROPERTY
The Company holds one granted US patent ( 6,069,009) with foreign counterpart (Europe, Japan, Australia, Canada and Mexico) on Phytomics Technologies. The process has since been fully integrated into the Phytomics Technologies, to accelerate the growth phase of plant cell cultures and significantly improve the yield of secondary metabolites as well as the economics and reproducibility of the overall production process.
In order to better serve its interest, the Company’s IP strategy will primarily involve aggressively pursuing the filing of patent applications resulting from its product discovery activities including
|
|
|
|
|
| • | Proper patent coverage for new plant-based products, that represent the key valuation basis of the Phytomics Technologies and of the Company, and |
|
|
|
|
|
| • | Proper process patent coverage for Phytomics bioprocesses used for the production of specific patented plant-based products. |
COMPETITION IN PLANT-BASED PRODUCT DISCOVERY
MH-B’s competitors in plant product discovery include the following.
30
1- Chemistry companies
Companies producing specialty chemicals and those specializing in combinatorial chemistry generally provide large synthetic chemical libraries for discovery programs, that are not as complex as most plant secondary metabolites. Consequently, chemistry companies are not direct competitors of MH-B. On the other hand, MH-B may sub-contract to chemistry companies industrial scale synthesis of promising simple compounds and/or semi-synthesis of promising complex phytochemicals identified through its discovery activities. Consequently, chemistry companies may become valuable partners of MH-B in optimization chemistry and/or bulk synthesis of promising compounds.
2- Companies supplying phytochemical libraries
Currently, few organizations are commercializing phytochemical libraries (In table below). These libraries are composed of crude plant extracts, purified fractions, or pure phytochemicals, with the former being incompatible with modern HTS technologies, are obtained from natural biomass. Therefore, these suppliers cannot guarantee reproducibility, fast supply and large-scale production of active complex compounds. These production issues remain key unresolved difficulties in exploiting plant compound in product discovery projects.
Table: Organizations supplying phytochemical libraries for discovery programs
|
|
|
Organization |
| Characteristics of Phytochemical Library |
| ||
AnalytiCon Discovery |
| 10,000 pure compounds, 25% from plants |
|
|
|
Albany Molecular |
| 170,000 purified fractions, under 10% from plants |
|
|
|
BioSPECS |
| Approximately 2,000 purified compounds, mostly from plants |
|
|
|
Drug Discovery Ltd. |
| Extracts prepared from ~ 9,000 plant species |
|
|
|
German Natural Product Pool |
| Approximately 4,000 purified natural products and derivatives obtained from various sources |
|
|
|
MerLion |
| 500,000 extracts, ~ 25% of from plants |
|
|
|
Molecular Nature |
| 4,000 purified fractions and 1,000 pure compounds obtained from plants |
|
|
|
National Cancer Institute |
| Over 100,000 extracts from plant and marine organisms |
|
|
|
Sequoia |
| 36,000 purified fractions from plants |
COMPETITION IN PLANT COMPOUND PRODUCTION
The competitive landscape in the area of reproducible industrial scale production of specialized complex plant products include the following players.
1- Contract manufacturing organizations (CMO)
Except for DFB Pharmaceuticals/Phytonbiotech (discussed below), all CMO are specializing in either microbial fermentation or mammalian/insect cell cultures, the latter for recombinant protein production. None of them have expertise in plant cell culture bioengineering
31
2- Plant pharming organizations
The number of players in plant pharming is impressive and competition is fierce. Asian, African and South American suppliers offer low cost raw material to American and European extraction companies, which then supply the pharmaceutical, cosmetic and nutraceutical industries with purified plant products. This traditional supply route (i.e., agriculture, harvesting & extraction) has numerous major limitations that can be overcome by industrial scale plant cell culture technologies, which include
|
|
|
| 1. | Secure and reproducible supply of natural biomass in sufficient quantity on a long term basis; |
|
|
|
| 2. | Increasing cost of the raw material; |
|
|
|
| 3. | Proper handling at harvesting of the natural biomass for retained yield, reproducibility and efficient processing; |
|
|
|
| 4. | Low product yield at processing; |
|
|
|
| 5. | Efficiency and cost of downstream processing operations to obtain the targeted compound at the desired purity level and in sufficient quantity to meet market demand in a timely fashion. |
This situation is further complicated if the biomass is harvested in the wild and/or when the desired compounds are extracted from plant species that are threatened, grow slowly, are only available in politically unstable areas, are not compatible with greenhouse or large scale culturing, or if harvesting results in the destruction of the plant species.
For cosmetic and nutraceutical products, purification requirements range from partly purified fractions to purified compounds, whilst for pharmaceuticals and specialty chemicals, pure compounds are required. Regulatory agencies, however, are pressuring the nutraceutical and cosmetic industries to increase the level of purification and characterization of commercial plant-based products.
3- Companies involved in industrial scale plant cell culture bioprocessing
Four companies are known to use (or to have used) industrial scale plant cell culture bioprocesses: PhytonBiotech, Inc., Mitsui Chemical, Inc., Samyang Corporation and Protalix Pharmaceuticals Ltd.
PhytonBiotech is the most advanced company in industrial plant cell culture bioprocesses. This company was founded in 1990 to produce Paclitaxel for Brystol-Myers-Squibb, its strategic partner. It succeeded in this undertaking in the late 90’s and its German subsidiary, Phyton GmbH, currently operates the world’s largest commercialcGMP manufacturing facility for the production of extracts containing Paclitaxel and other valuabletaxanes. In 2003, Phyton was acquired by DFB Pharmaceuticals, a CMO, but most of its expert personnel have left the organization.
In the mid 80’s, the Japanese giant Mitsui invested in the development of a first industrial scale plant cell-based bioprocess for the production of shikonin, an anti-inflammatory and coloring agent. This process was successfully scaled up in a 750 L bioreactor and shikonin was produced at high yields. This project, however, was discontinued for marketing reasons. In the late 80’s, Mitsui developed a second plant cell-based bioprocess for the production of ginseng extracts. The production plant was inaugurated in the early 90’s and 1995 sales of the ginseng extract reached US$ 3M. Ginseng extracts were subsequently removed from the market due to severe toxic side effects. Mitsui appears not to have pursued this business.
In the mid 90’s, the Korean company Samyang bought a taxane production technology based on cultured plant cells developed by the American company EsCagenetics. Samyang completed the development of this technology and scaled it up to industrial level for the production of Genexol™, a Paclitaxel-based product currently on the market. This company seems not to have expanded its efforts in this area.
Finally, the Israel start-up company Protalix Biopharmaceutics Ltd (formerly Metabogal, founded in 1994) is now positioning itself as a CMO for the production of recombinant proteins using plant cells cultured in a rudimentary disposable bioreactor system made of 10 L chambers with minimal monitoring and process control.
It appears from our review of the patents published by these companies as well as from personal communications with some of their key executives, that all of them use traditional approaches to plant cell cultures and bioengineering for the production of secondary metabolites. In this context, MH-B is in a good market position and significant competitive advantages in exploiting its highly efficient Phytomics bioprocesses for these business opportunities.
32
BUSINESS MODEL AND STRATEGY
MH-B’s primary business activities will focus on business development (BD). Consequently, the Company will put in place the tools and means to reach out to targeted market stakeholders. Our single most important goal is to identify profitable plant-based product opportunities to develop, as well as to connect with the best companies to partner with, for development.
To carry out its extensive BD activities, MH-B will hire an experienced BD/industrial marketing Vice-President and will develop a network of international BD consultant specialists in the three industries targeted and strategically located, mostly in US and Europe, to complement its business opportunity scouting activities. The latter will actively participate in the identification of clients/partners likely to be interested by the Company’s technologies, expertise, products and services. These consultants work on a back-loaded fee to be paid upon completion of successful transactions.
To support BD activities and identify market opportunities, the Company will create an efficient Data Mining Unit (DMU), under the direction of the VP-BD, that will identify business opportunities and provide the information to drive the Company rationale in elaborating the best-suited and most rewarding strategy for the development of our business activities. Practically, it will be based on a collection of software and procedures to monitor and mine public databases, so as to connect the Company’s technological strengths with stakeholders’ needs.
Market intelligence and public communications will generate a list of prospective partners and clients for the Company. We will adopt a pro-active approach with the market to meet as soon as possible with prospective clients/partners. Recent experience has shown this method to be very productive. Our objective is to establish profitable and value generating commercial partnerships with selected high profile companies in targeted industries.
MH-B istargeting the markets of cosmetic, nutraceutical and pharmaceutical industrial products. More specifically, companies in these markets are either searching for innovative new products of plant origin using modern product discovery technologies and/or struggling to produce efficiently complex plant products. However, they are experiencing serious problems in accessing and producing plant compounds, and currently facing important market gaps and significant unmet needs that MH-B can satisfy efficiently using its unique technologies.
MH-B’s business development activities will be driven by
|
|
|
| 1. | Needs and requests of prospective customers for plant-based discovery projects and/or production projects targeting promising complex plant products in development and/or already commercialized; and; |
|
|
|
| 2. | Innovative product concepts identified through market intelligence and DMU research to be developed internally and/or in partnerships |
COMMERCIAL ACTIVITIES
MH-B will focus on two commercial activities.
1- Discovery and development of new plant-based products
The Company exploits the natural and novel chemodiversity, that it can generate using its Phytomics Technologies. This offers the cosmetic, nutraceutical and pharmaceutical industries a new paradigm for the discovery and development of novel products of plant origin, based on its current library of > 160,000 purified phytochemical fractions fully compatible with HTS technologies, and unique expertise and Plant Product Discovery Platform. The strength of this library was shown by partial screening using 11 molecular targets and cellular assays to yield 173 biologically active molecules, of which 59 were new chemical entities. MH-B has the expertise and technologies to expand its purified phytochemical library, including for plant species of interest to partners. Chemical characterization of bioactive compounds can also be conducted in house.
Typicalpartnered product discovery and development projects will usually involve
|
|
|
| 1. | Selection by the partner of generic or proprietary molecular targets, cellular assays and/or of fraction library to be screened; the latter may be MH-B’s current library or specialized libraries developed by MH-B according to the partner’s requirements; |
|
|
|
| 2. | Screening by MH-B or the partner fractions using selected targets and assays; |
33
|
|
|
| 3. | Identification and short term supply of active compounds by MH-B; and |
|
|
|
| 4. | If the promising plant products are complex, production of pilot (for product development) and commercial quantities of products for the partner and/or final commercializing company. |
These projects will be structured as follows.
|
|
|
|
| 1. | The partner pays | |
|
|
|
|
|
| • | Licensing fees to access MH-B’s technologies and phytochemical library, |
|
|
|
|
|
| • | R&D costs based on a full FTE (Full Time Equivalent) basis that includes profits, or reduced FTE cost (with profits) in exchange for increased milestone and royalty payments to be negotiated, and |
|
|
|
|
|
| • | Pre-negotiated milestones (when attained) and royalty (at commercialization) payments. |
|
|
|
|
| 2. | The partner obtains | |
|
|
| |
|
| • | Co-ownership of product IP, and |
|
|
|
|
|
| • | Full commercialization rights with performance clauses. |
|
|
|
|
| 3. | MH-B’s retains | |
|
|
| |
|
| • | Co-ownership of product IP, and |
|
|
|
|
|
| • | Full ownership of production technologies and IP and exclusive industrial scale production rights for complex plant products (2nd commercial activity). |
for which it will retain full product and production IP ownership. Thereafter, MH-B Additionally, MH-B intends to pursue its owninternal product discovery projects will out-license to high profile partners these products for co-development and co-commercialization, which will include license fees, development revenues, milestone and royalty payments as well as exclusive production rights for complex plant products (2nd commercial activity).
In the Pharmaceutical domain, MH-B will actively seek partnered drug discovery projects. In addition, the company has unique expertise in infectious disease and has internally developed promising programs that it will pursue to appropriate levels for subsequent high value partnering with major pharmaceutical companies.
In the cosmetic and nutraceutical domains, the company has already identified a certain number of potential product discovery partnerships (section 4.4.1), one of which has already been signed, that it will pursue actively. MH-B will actively seek new opportunities in these areas. Furthermore, MH-B has identified significant new product opportunities in the cosmetic industry that it intends to pursue internally and/or in partnership.
2- Industrial-scale production of complex plant products of commercial relevance using Phytomics-based bioprocesses
The second commercial activity targets partners that are either selling, intend to conduct or are already conducting product development activities (also with MH-B), including clinical trials on complex plant products that can be obtained using traditional approaches only with great difficulties and at high costs. These products include
|
|
|
| A. | Partly purified extracts or highly purified phytochemical fractions poorly characterized chemically, whose compounds, or composition cannot be reproduced synthetically, whose supply, using traditional approaches, is problematic, or which contain undesirable components (color, odor, nuisance impurities etc.) difficult to remove at reasonable costs (for example the J&J project discussed in section 4.4.2); and |
|
|
|
| B. | Purified complex phytochemicals, that cannot be synthesized at industrial scale or produced in sufficient quantities through natural biomass extraction and purification processes, at reasonable costs (Ex.: Taxol™ & Taxotere™). |
Generally, secured, consistent and reproducible supply, in sufficient quantities, of these complex plant products, using traditional approaches, is highly problematic. Uncontrollable uncertainties of supply include political and social issues, poor agricultural and harvesting practices, rare, exotic, endangered, protected and/or slow growing plant species etc. These represent critical issues in conducting reliable product development activities and for subsequent commercialization that remain very difficult to resolve for non-specialist companies.
In the Pharmaceutical domain, MH-B will actively seek production projects. The company has finalized a contact with Pierre Fabre, a French pharmaceutical company, on April 11th 2006.
34
In the cosmetic and nutraceutical domains, the company has already identified a certain number of potential production projects, one of which is being discussed with a cosmetic and consumer multinational. MH-B will actively seek new opportunities in these areas.
A key issue in any cell-based industrial scale production remains the economics of the bioprocess. Traditional approaches to plant cell culture bioengineering have yielded limited industrial success, as underlined in Appendix A (section A.1), in focusing on single products. Still, PhytonBiotech is successful in producing taxane derivatives at industrial scale using a plant-cell based bioprocess. The Phytomics Technologies, which represent significant advances in this field, are solving the limitations previously encountered in plant-cell based bioprocessing. MH-B’s strategy in this area focuses on producing multiple plant products for various customers in the three industries targetedall using the same basic production technologies, including downstream processing operations. This offers important economies of scale in R&D and production and the opportunity for full utilization of planned production facilities that will translate into higher profit margins as well as significant risk reduction. Furthermore, MH-B’s offering of pilot and industrial scale facilities for secured and reproducible production of complex plant products represents an important marketing tool in attracting partners for high value plant product discovery projects.
Typicalproduction projects will usually three phases.Phase I. Feasibility Study involves the development of productive plant cell lines and appropriate culture and downstream processing (extraction, separation & purification) protocols for the production, at high yield and at the target quality level, of the desired product(s). A technico-economical model of this process is also developed to assess the economics of the industrial scale bioprocess. At the end of this work, the partner decides if he wants to undertake further bioprocess development depending on the expected market and production costs of the desired product(s).
DuringPhase II. Pilot Scale Production, the optimized production bioprocess, including downstream processing operations, is developed at pilot level (50 L to 300 L bioreactors; 100 g to kg of product(s)) to validate experimental results obtained at small scale, confirm bioprocess economics and define main scale up parameters. This work also involves production, by MH-B, of pilot quantities (100 g to kg) of desired product(s) at target quality level for partner’s product development activities.
Finally,Phase III. Industrial Scale Production involves the development, by MH-B, of the industrial scale bioprocess for commercial production of desired product(s) and Industrial scale production by MH-B (or subsidiary) of desired product(s) for commercialization.
These projects will be carried out in partnerships and internally, for prospective high potential products. Partnered projects and will be structured as follows.
|
|
|
|
| 1. | The partner pays | |
|
|
| |
|
| • | Licensing fees to access MH-B’s Phytomics Technologies, |
|
|
|
|
|
| • | R&D costs on areduced FTE basis (over US$190,000/FTE) that includes profits, |
|
|
|
|
|
| • | Pre-negotiated milestone payments depending on production levels attained and forecasted production costs at Phase I and II of the project, and |
|
|
|
|
|
| • | Pilot scale quantities of desired product(s) for development purposes. |
|
|
|
|
| 2. | MH-B’s retains | |
|
|
| |
|
| • | Full ownership of production technologies and IP and exclusive industrial scale production rights, |
|
|
|
|
|
| • | Co-ownership of IP generated from new products discovered during MH-B’s bioprocess development work in the partner’s specific application field, and |
|
|
|
|
|
| • | Full ownership of IP generatde from new products discovered during MH-B’s bioprocess development work in application fields other that of the partner’s. |
|
|
|
|
| 3. | MH-B obtains | |
|
|
| |
|
| • | Royalty payment on final sales of original product(s), |
|
|
|
|
|
| • | Exclusive, long term commercial production contract for original product(s) at minimum annual production level and specified and indexed selling price, |
|
|
|
|
|
| • | Milestone and royalty payments for new products discovered from MH-B’s bioprocess development work in the partner’s specific application field, |
|
|
|
|
|
| • | Exclusive, long term commercial production contract for new products, discovered from MH-B’s bioprocess development work in the partner’s specific application field, at minimum annual production level and specified and indexed selling price, and |
|
|
|
|
|
| • | New products discovered from MH-B’s bioprocess development work in application fields other that of the partner’s. |
35
PURSUING THE DEVELOPMENT OF THE PHYTOMICS AND OTHER TECHNOLOGIES
In order to maintain its state-of-the art expertise and increase its competitive advantages in industrial plant biotechnology and phytochemistry, MH-B will pursue the development of its Phytomics Technologies. Within the next 3 years and as illustrated in section 4.6, Phytomics R&D activities will be focused on
|
|
|
| 1. | Maintaining MH-B’s extensive collection of over 2,200 plant species in culture, which represent an immense source of natural and novel phytochemodiversity immediately available for discovery and production projects as well as a powerful tool in marketing MH-B Phytomics bioprocesses to prospective partners; |
|
|
|
| 2. | Developing and implementing suitable cryo-preservation protocols and systems for long term, secured conservation of MH-B’s extensive collection of plant species in culture, especially with respect to patent requirements and industrial scale production of high value plant products; |
|
|
|
| 3. | Pursuing the development of the basic plant cell culture bioprocess, using novel bioengineering and genetic engineering approaches applied to model and commercial biosystems in development, in order to maximize yields and productivity of targeted products; |
|
|
|
| 4. | Developing and optimizing downstream operations at pilot scale (10-100 g), including those directly interfacing the cell culture process, in order to improve net production yields of purified targeted products; |
|
|
|
| 5. | Scaling up the Phytomics Technologies from the current 50 L bioreactor to industrial size bioreactors of much larger quantities, including associated downstream processing operations, for the production of purified plant products; this investment project will be undertaken with respect to current and anticipated market demand for discovery and production projects. |
|
|
|
| 6. | Replenishing and expanding the company’s purified phytochemical library with respect to current and anticipated demand for discovery projects since this expensive undertaking involves long lead times. |
MH-B will also develop a generic technico-economic model that can be applied to a variety of production projects to evaluate their main economic parameters and financial viability.
Co-currently, MH-B also intends to develop cGMP extraction, formulation, encapsulation and packaging facilities that will initially be used for natural source MMH™ products being commercialized by its parent company, Millenia Hope Inc.
These activities will be financed internally and through contribution from product discovery and production projects. In due course, MH-B intends to develop its own industrial scale production facilities to meet market increasing demands.
MARKETS FOR MH-B’S TECHNOLOGIES AND PRODUCT OFFERINGS
For the Pharmaceutical Industry
Pharmaceutical products represent the largest segment of the chemical market with annual sales of US$492B in 2003. The market of plant-based drugs is estimated at more than US$40B per year. The major markets in the pharmaceutical industry are the USA, Japan, Germany, France, UK, Italy and Canada. The R&D budget of the pharmaceutical industry in the US is estimated at US$58B, representing 11.8% of sales of which 60% is spent on clinical trials.
MH-B intends to undertake drug discovery and complex phytochemical production projects for the pharmaceutical industry. The sizes of these market segments are estimated at
|
|
|
|
|
| • | Approximately US$4.6B/y for drug discovery excluding preclinical studies (assuming 8% of R&D being spent on drug discovery projects according to (5)), |
|
|
|
|
|
| • | Approximately US$47M/y for phytochemical production R&D projects (assuming 1% of R&D spending on plant-based pharmaceuticals ($4.7B) being spent for such projects), and |
|
|
|
|
|
| • | Approximately US$0.7B/y for compound sales to pharmaceutical companies (assuming that plant-derived active principles represent 7% of final plant product sales and that 25% of desired phytochemicals cannot be industrially synthesized at industrial scale). |
36
Within the next 3-5 years, MH-B’s objectives are to capture 0.2% of the drug discovery segment ($9M/y), 2% of R&D production projects ($0.9M/y) and 2% of phytochemical-based active principles ($14M/y).
For the Cosmetic Industry
The world market for cosmetics was estimated at US$211B in 2003, of which approximately 35% (US$74B) is plant-based. The R&D spending of this industry is estimated at 3% of total sales or US$6B per year. MH-B intends to undertake product discovery and complex plant-derived product production projects with the cosmetic industry. The sizes of these market segments are estimated at
|
|
|
|
|
| • | Approximately US$0.6B/y for product discovery excluding development studies (assuming 10% of R&D spending on product discovery projects), |
|
|
|
|
|
| • | Approximately US$22M/y for R&D production projects (assuming 1% of R&D spending on plant-based cosmetic products ($2.2B) being spent on such projects), and |
|
|
|
|
|
| • | Approximately US$5.9B/y for plant-based ingredient sales to cosmetic companies (assuming that plant-derived active ingredients represent 8% of final plant-based product sales (the natural origin of products is critical in this market)). |
Within the next 3-5 years, MH-B’s objectives are to capture 1% of the product discovery segment ($6M/y), 5% of R&D production projects ($1M/y) and 0.5% of plant-derived active ingredients ($29M).
Nutraceuticals and functional foods represent the fastest growing segment of the chemical industry with annual growth rates of 20% in some European countries. Global sales in this market were US$138B in 2000 and are expected to increase to US$ 500B by 2010. The largest markets are Japan followed by the US and Europe (mainly the UK, Germany and France). Plant-based products sold for US$ 18.5B in 2000, or 13.5% of this market. The World demand for nutraceutical natural and synthetic chemicals was US$8B in 2005, growing at an annual rate of 6%. The R&D spending of this industry is varies from 3% to 12% of total sales or over US$4B per year.
MH-B intends to undertake product discovery and complex plant-derived product production projects with the nutraceutical industry. The sizes of these market segments are estimated at
|
|
|
|
|
| • | Approximately US$24M/y for product discovery excluding development studies (assuming 10% of R&D spending on product discovery projects), |
|
|
|
|
|
| • | Approximately US$12M/y for R&D production projects (assuming 5% of R&D spending on plant-based nutraceutical products ($0.5B) being spent on such projects), and |
Within the next 3-5 years, MH-B’s objectives are to capture 6% of the product discovery segment ($1.5M/y), 6% of R&D production projects ($0.7M/y) and 0.2% of ingredient sales ($16M).
In summary, MH-B’s objectives are to generate US$16.5M/y and US$2.6M/y of profitable product discovery and R&D production projects, respectively, in the targeted markets with the next three years excluding milestone and royalty payments. In addition, MH-B expects that the latter projects will translate into US$59M/y profitable production contracts within the next 3-5 years depending on the availability of suitable production facilities.
37
|
|
|
|
|
|
|
Market |
| Overall |
| Estimated R&D Spending |
| MH-B Target |
|
|
| ||||
Pharmaceuticals |
| $492 Billion |
| $58 Billion (11.8%) |
|
|
| ||||||
1- Drug Discovery |
|
|
| $4.6Billion |
| $9 Million (0.2%) |
| ||||||
2- R&D production projects |
|
|
| $47Million |
| $0.9Million (2%) |
| ||||||
3- Supply of plant-derived |
|
|
| $0.7B (7% *25% of plant-based) |
| $14Million (2%) |
| ||||||
Active principle |
|
|
|
|
|
|
| ||||||
Cosmetics |
| $211 Billion |
| $6 Billion (3%) |
|
|
| ||||||
1- Product Discovery |
|
|
| $0.6 Billion |
| $6Million (1%) |
| ||||||
2- R&D production projects |
|
|
| $22 Million |
| $1Million (5%) |
| ||||||
3- Sales of plant-derived |
|
|
| $5.9 Billion |
| $29Million (0.5%) |
| ||||||
Nutraceuticals |
| $8 Billion (2005) |
| $240 Million (3%) |
|
|
| ||||||
1- Product Discovery |
|
|
| $24Million |
| $1.5Million (6%) |
| ||||||
2- R&D production projects |
|
|
| $12Million |
| $0.7Million (6%) |
| ||||||
3- Sales of ingredients |
|
|
| $8Billion |
| $16Million (0.2%) |
38
EMPLOYEES
As of September 5, 2006, all of our 12 employees are full time employees. The responsibilities of our employees are briefly summarized as follows:
Leonard Stella - - Chief Executive Officer and Director: reviews summarie of its day to day operations, long term strategic planning and operational coordination; head of the sales and marketing teams; handles overall coordination of all scientific testing, etc.
Jean Archambault - President & Chief Operating Officer-Director: Responsible for all day to day operations of MH-B, with support of the CDO and CTO; involved in business development activities with respect to external partners and project coordination, assists in sales and marketing effect;
Bahige Baroudy – Chief Scientific Officer - assists the COO with day to day functions, reviews all scientific data of MH-B heads up all new drug discovery efforts of both MH-B and the parent company
Robert Williams - Chief Development Officer-Director: responsible for supervision of the fulfillment of all contracts; directly involved in management of all scientific teams and projects; assists Plant Biology Group’s scientific endeavors as needed.
Dany Aubry - Chief Technical Officer-Director: responsible for direct operation and management of the application of all contracts; directly involved in management of all functional groups and projects; responsible for plant maintenance and facility expansion;
Martin Gaudette - head of the Biosynthesis and Bioprocess Engineering group; project leader for the L’Oreal Phase 1 project; assists in building maintenance..
Steve Fiset - heads the Bioprocess Scale-up group; responsible for all IT applications at MH-B; assists the Biosynthesis and Bioprocess Engineering group.
Luc Lavoie - head of the Purification group; involved in operation and maintenance of all analytical equipment.
Yvan Chapdelaine – head of the plant biology group; Project Leader for the Pierre Fabre Phase1 project; responsible for all Genetic applications at MH-B.
Chantal Paquin – controller; responsible for all Human Resources; directly involve in financial management at MH-B.
Sophie Roy – works in the Plant Biology group; responsible for maintenance of bank of cell lines.
Francois Harrison – Chemist - works in the Purification group; responsible for the extraction, separation and purification of active compounds assists in the drug discovery efforts;
In addition, we have access to additional clerical services. None of our employees belongs to a union and we believe that our relations with our employees are good. We know of no conflicts of interest between any of our officers and us. We have entered into a work contract with each employee to the exception of Mr. Leonard Stella, our CEO.
DESCRIPTION OF PROPERTY
We lease our corporate offices at 500, Cartier boulevard West, 4th floor, Laval, Quebec at a monthly rate of $50,000 per month rental, excluding office expenses, pursuant to the terms of a month-to-month lease commencing Ferbruary 9, 2006.
39
We are not currently party to any material legal proceedings.
MATERIAL AGREEMENTS
On March 2, 2006, we entered into a consulting agreement with 9111-9081 Quebec Inc. for it to find suitable partners for the financing, licensing or selling of MH-B’s technologies and/or MH-B’s research programs.
We have entered into a number of employment agreements with our employees We have attached the key employment agreements of our 4 officers to the SB-2 Registration Statement as exhibits.
40
MANAGEMENT
DIRECTORS AND EXECUTIVE OFFICERS
The following table sets forth information about our executive officers and directors.
|
|
|
|
|
|
Name |
| Age |
| Position |
|
|
|
| |||
|
|
|
|
|
|
Leonard Stella |
| 44 |
| Chief Executive Officer and Director |
|
|
|
|
|
|
|
Jean Archambault |
| 53 |
| President, Chief Operating Officer and Director |
|
Bahige Baroudy |
| 54 |
| Chief Science Officer and Director |
|
Dany Aubry |
| 35 |
| Chief Technical Officer and Director |
|
Robert Williams |
| 43 |
| Senior Science Officer and Director |
|
Set forth below is certain biographical information regarding our executive officers and directors:
The above listed officers and directors will serve until the next annual meeting of the shareholders or disqualification, or until their successors have been duly elected and qualified. Vacancies in the existing Board of Directors are filled by majority vote of the remaining Directors. Officers of the Company serve at the will of the Board of Directors. To our knowledge, there are no agreements or understandings for any officer or director to resign at the request of another person nor is any officer or director acting on behalf of or is to act at the direction of any other person other than in his fiduciary capacity of and for the benefit of us and at our direction.
Mr. Leonard Stella, CEO and Director
Mr. Stella has a Bachelor of Arts from McGill University, and received his Graduate Diploma in Administration from Concordia University in 1986. In 1987 Mr. Stella founded and operated a residential and commercial property developer, Dominion City Development and in 1991, he founded Trans-Immobilia, a residential property company. In 1997 he became the principal founding partner and is now the Chief Executive Officer of Millenia Hope Inc., the parent company of MH-B. Mr. Stella’s strategic vision, which guides Millenia Hope Inc., led to the acquisition of MH-B by Millenia in February 2006.
Jean Archambault, Ph.D., MBA- President and COO
Dr. Archambault was the founder, and served as President and CEO, of Avance Pharma (formally also know as Phytobiotech Inc.) from 1997 to 2005, having also served during that period as a Director after the company’s inception in 1997. Dr. Archambault directed the development of Avance’s Phytomics Technologies. Prior to Avance, Dr. Archambault was a professor and head of the Chemical Engineering Department at theUniversité du Québec à Trois-Rivières (1991-1999) and an associate professor at theÉcole Polytechnique de Montréal (1993-1999). From 1987 to 1991, Dr. Archambault was Head of the Cell Culture Group at the National Research Council of Canada’s Biotechnology Research Institute in Montreal, where he developed and directed all mammalian, insect and plant cell culture bioengineering R&D activities. From 1973 to 1983, Dr. Archambault held various engineering and management positions in industry. He received his Ph.D. (1988) from McGill University in Biochemical Engineering. His MBA was also obtained from McGill University in 1981.
Dr. Bahige Baroudy – Chief Science Officer and Director
Dr. Baroudy joined Avance Pharma in early 2004 (of which the equipment and intellectual property were recently acquired by our subsidiary, Millenia Hope Biopharma) and was responsible for leading the company’s drug discovery efforts. He has 25 years of industry/academic experience in basic research, infectious disease drug discovery and virology. Prior to joining Avance, Dr. Baroudy was Group Director, Antiviral and Antimicrobial Therapy at the Schering-Plough Research Institute (Kenilworth, New Jersey). While at the Schering Plough Research Institute, Dr. Baroudy spearheaded the successful development of CCR5 antagonists that are currently in human clinical trials as HIV entry inhibitors. Dr. Baroudy earned a place on “The Scientific American 50” list as the top Research Leader of 2003 in the Medical Treatment category for this contribution. Prior to joining Schering-Plough, Dr. Baroudy was Director, Division of Molecular Virology at the James N. Gamble Institute of Medical Research from 1989 to 1995, where he established research programs in viral hepatitis and liver diseases, HIV/AIDS and vaccinia virus expression and pathogenesis. From 1985 to 1989, Dr. Baroudy was Research Associate Professor in the Division of Molecular Virology and Immunology at Georgetown University. From 1979 to 1985, Dr. Baroudy worked at the NIH in the Laboratory of
41
Infectious Diseases, the Laboratory of Molecular Oncology and the Laboratory of Biology of Viruses. Dr Baroudy received his Ph.D. in Biochemistry from Georgetown University.
Dany Aubry, Chief Technical Officer and Director.
Mr. Aubry received his M.Sc. in bioengineering fromÉcole Polytechnique de Montréal in 1995 and his B.Sc. in Chemical Engineering from theUniversité du Québec à Trois-Rivières (UQTR) in 1993. Mr. Aubry was the Director of Operations at Avance Pharma from 2002 to 2005, overseeing all operational aspects of its Phytomics Technologies including the R&D programs, cell line generation, biosynthesis and purification of phytochemicals, scale-up of bioprocesses, setting up of laboratory facilities, as well as control of the supply chain for drug discovery activities. In total, Mr. Aubry has 13 years of direct experience in developing plant cell culture bioprocesses, having acted as the leader of the biosynthesis group from 2000 to 2002 at Avance, following his tenure as a bioprocess engineer from 1995 to 2000. His expertise in plant cell cultures covers production of secondary metabolites, somatic embryo andEndomycorrhiza production, as well bioreactor design and bioprocess control.
Robert D. Williams, Ph.D.- Chief Development Officer and Director
Dr. Williams received his B.Sc. Honours in Chemistry from Acadia University in 1984 investigating “Inhibitors of ß-galactosidase”. He then went on to obtain his Ph.D. in Biochemistry in 1990 from the University of Guelph, under the direction of Dr. Brian Ellis for his investigations on “Alkaloids from normal and Ri transformed tissues ofPapaver somniferum”. From there he then spent two years at the Biotechnology Research Institute in Montreal working with Dr. Jean Archambault on plant cell culture technology. He subsequently moved toÉcole Polytechnique de Montréal and worked on a variety of projects in the area of plant cell culture on which he has published numerous papers. As one of the cofounders of Avance Pharma, he had been instrumental since 1997 in the development of its cell culture facility and in all aspects of the generation of its proprietary library of purified fractions. Dr. Williams has extensive cell culture expertise for the generation of cell lines from selected plant species.
Committees
We have no standing audit, nominating and compensating committees of the Board of Directors or committees performing similar functions. Under the Sarbanes-Oxley Act of 2002, each public company is required to have an audit committee consisting solely of independent directors and to explain whether or not any independent director is a financial expert. In the event the public company does not have an audit committee, the Board of Directors becomes charged with the duties of the audit committee. We intend to adopt such a committee upon the acceptance of the present Registration by the Securities Exchange Commission. In the event we are successful in the future in obtaining independent directors to serve on the Board of Directors and on a newly formed audit committee, of which there can be no assurances given, the Board of Directors would first adopt a written charter. Such charter would be expected to include, among other things:
- annually reviewing and reassessing the adequacy of the committees formal charter;
- reviewing the annual audited financial statements with the adequacy of its internal accounting controls;
- reviewing analyses prepared by our management and independent auditors concerning significant financial reporting issues and judgments made in connection with the preparation of its financial statements;
- being directly responsible for the appointment, compensation and oversight of the independent auditor, which shall report directly to the Audit Committee, including resolution of disagreements between management and the auditors regarding financial reporting for the purpose of preparing or issuing an audit report or related work;
- reviewing the independence of the independent auditors;
- reviewing our auditing and accounting principles and practices with the independent auditors and reviewing major changes to our auditing and accounting principles and practices as suggested by the independent auditor or its management;
- reviewing all related party transactions on an ongoing basis for potential conflict of interest situations; and
- all responsibilities given to the Audit Committee by virtue of the Sarbanes-Oxley Act of 2002.
42
Code of Ethics
Effective March 3, 2003, the Securities and Exchange Commission requires registrants like us to either adopt a code of ethics that applies to our Chief Executive Officer and Chief Financial Officer or explain why we have not adopted such a code of ethics. For purposes of item 406 of Regulations S-K, the term “code of ethics” means written standards that are reasonably designed to deter wrong doing and to promote:
- Honest and ethical conduct, including the ethical handling of actual or apparent conflicts of interest between personal and professional relationships:
- Full, flair, accurate, timely and understandable disclosure in reports and documents that the company files with, or submits to, the Securities & Exchange Commission and in other public communications made by us;
- Compliance with applicable governmental law, rules and regulations;
- The prompt internal reporting of violations of the code to an appropriate person or persons identified in the code; and
- Accountability for adherence to the code.
Upon acceptance of the present Registration, we will adopt the aforementioned Code of Ethics.
43
Compensation of Executive Officers
Summary Compensation Table. The following information relates to compensation received by our officers in fiscal years ending November 30, 2005, 2004, 2003 whose salary and compensation exceeded $100,000.
SUMMARY COMPENSATION TABLE
|
|
|
|
|
|
|
|
|
|
|
|
|
|
|
|
|
|
|
|
|
| Annual Compensation |
| Long-Term Compensation |
| ||||||||||||||
|
|
|
| ||||||||||||||||
Name and Principal Position |
| Fiscal Year |
| Salary |
| Bonus |
| Other Annual |
| Restricted |
| Securities |
| ||||||
Leonard Stella (1) |
|
| 2005 |
|
| 0 |
|
| 0 |
|
| 0 |
|
| 0 |
|
| 0 |
|
Chief Executive Officer |
|
| 2004 |
|
| 0 |
|
| 0 |
|
| 0 |
|
| 0 |
|
| 0 |
|
|
|
| 2003 |
|
| 0 |
|
| 0 |
|
| 0 |
|
| 0 |
|
| 0 |
|
|
|
|
|
|
|
|
|
|
|
|
|
|
|
|
|
|
|
|
|
Jean Archambault (2) |
|
| 2005 |
|
| 0 |
|
| 0 |
|
| 0 |
|
| 0 |
|
| 0 |
|
President |
|
| 2004 |
|
| 0 |
|
| 0 |
|
| 0 |
|
| 0 |
|
| 0 |
|
|
|
| 2003 |
|
| 0 |
|
| 0 |
|
| 0 |
|
| 0 |
|
| 0 |
|
|
|
|
|
|
|
|
|
|
|
|
|
|
|
|
|
|
|
|
|
Bahige Baroudy (3) |
|
| 2005 |
|
| 0 |
|
| 0 |
|
| 0 |
|
| 0 |
|
| 0 |
|
Chief Science Officer |
|
| 2004 |
|
| 0 |
|
| 0 |
|
| 0 |
|
| 0 |
|
| 0 |
|
|
|
| 2003 |
|
| 0 |
|
| 0 |
|
| 0 |
|
| 0 |
|
| 0 |
|
|
|
|
|
|
|
|
|
|
|
|
|
|
|
|
|
|
|
|
|
Dany Aubry (4) |
|
| 2005 |
|
| 0 |
|
| 0 |
|
| 0 |
|
| 0 |
|
| 0 |
|
Chief Technical Officerr |
|
| 2004 |
|
| 0 |
|
| 0 |
|
| 0 |
|
| 0 |
|
| 0 |
|
|
|
| 2003 |
|
| 0 |
|
| 0 |
|
| 0 |
|
| 0 |
|
| 0 |
|
|
|
|
|
|
|
|
|
|
|
|
|
|
|
|
|
|
|
|
|
Robert Williams (5) |
|
| 2005 |
|
| 0 |
|
| 0 |
|
| 0 |
|
| 0 |
|
| 0 |
|
Chief Development Officer |
|
| 2004 |
|
| 0 |
|
| 0 |
|
| 0 |
|
| 0 |
|
| 0 |
|
|
|
| 2003 |
|
| 0 |
|
| 0 |
|
| 0 |
|
| 0 |
|
| 0 |
|
44
For the fiscal year ended November 30, 2006 (December 1, 2005 – May 31, 2006)
|
|
(1) | Mr. Stella received $0 in compensation |
|
|
(2) | Dr. Archambault received $26,250 in compensation |
|
|
(3) | Dr. Baroudy received $35,000 in compensation |
|
|
(4) | Mr. Aubry received $19,395 in compensation |
|
|
(5) | Dr. Williams received $19,395 in compensation |
Option Grants Table. The following table sets forth information concerning individual grants of stock options to purchase our common stock made to the executive officer named in the Summary Compensation Table during fiscal year ended November 30, 2005.
OPTIONS GRANTS IN PRESENT FISCAL YEAR (Individual Grants)
|
|
|
|
|
|
|
|
|
Name |
| Number of securities |
| Percent of total |
| Exercise or base |
| Expiration Date |
None
AGGREGATED OPTION EXERCISES IN LAST FISCAL YEAR AND FISCAL YEAR-END OPTION VALUES
Aggregated Option Exercises and Fiscal Year-End Option Value Table. The following table sets forth certain information regarding stock options exercised during fiscal year ending November 30, 2005, by the executive officer named in the Summary Compensation Table.
|
|
|
|
|
|
|
|
|
Name |
| Shares acquired on |
| Value realized ($) |
| Number of Securities |
| Value of Unexercised |
|
|
|
|
|
|
| ||
|
|
|
|
|
| Exercisable/ Unexercisable |
| Exercisable/ |
None
Employment Contracts
We have entered into employment contracts with our employees and key personnel, with the exception of Mr. Leonard Stella our Chief Executive Officer.
Compensation of Directors
No director receives any compensation for serving on our Board of Directors.
45
The following table sets forth certain information derived from the named person, or from the transfer agent, concerning the ownership of common stock as of September 5, 2006, of (i) each person who is known to us to be the beneficial owner of more than 5 percent of the common stock; (ii) all directors and executive officers; and (iii) directors and executive officers as a group:
|
|
|
|
|
Name and Address of |
| Amount and Nature of |
| Percent of |
|
|
|
|
|
Millenia Hope Inc. (2) |
| 30,008,000 |
| 75% |
|
|
|
|
|
2632-3345 Quebec Inc.(3) |
| 7,592,000 |
| 19% |
|
|
(1) | Based on 40,000,000 issued and outstanding shares as of September 5, 2006. |
|
|
(2) | Millenia Hope, Inc. is a 1934 Exchange Act company. For information on its shareholdings, specifically its principal shareholders, please refer to its 1934 Exchange Act filings listed on the SEC’s website atwww.sec.gov. |
|
|
(3) | Paolo Mori, President of 2632-3345 Quebec Inc. |
|
|
|
|
|
|
|
Name of Selling |
| Shares Beneficially owned |
| Offering |
| After offering |
|
|
|
|
|
|
|
2632-3345 Quebec Inc. |
| 7,592,000 |
| 7,592,000 |
| 0 |
|
|
|
|
|
|
|
Cede& Co. (1) |
| 599,910 |
| 599,910 |
| 0 |
| ||||||
(1) Reflects shares held by Cede & Co. in “street name” |
|
|
|
|
|
|
| ||||||
GEORGES ADAM |
| 439 |
| 439 |
| 0 |
GEORGES ADAMS |
| 3 003 |
| 3 003 |
| 0 |
CHARLES ALBANO |
| 176 |
| 176 |
| 0 |
FRANCESCA ALBANO |
| 9 871 |
| 9 871 |
| 0 |
AFTAB AL HASSAN |
| 5 272 |
| 5 272 |
| 0 |
46
|
|
|
|
|
|
|
ANNA ALLAN |
| 141 |
| 141 |
| 0 |
| ||||||
ALL SAFE LLC |
| 4 394 |
| 4 394 |
| 0 |
| ||||||
ISABEL ALVES |
| 26 |
| 26 |
| 0 |
| ||||||
AMBROSIA CORP |
| 83 740 |
| 83 740 |
| 0 |
RAYMOND ANDERSON |
| 18 |
| 18 |
| 0 |
| ||||||
ARTURO ANIEVAS |
| 1 582 |
| 1 582 |
| 0 |
ARTURO ANIEVAS CUST -ALEXANDER ANIEVAS UNDER |
| 176 |
| 176 |
| 0 |
ANTHONY ARCURI |
| 439 |
| 439 |
| 0 |
| ||||||
DOMENIC ARCURI |
| 879 |
| 879 |
| 0 |
ARIKEA INSULUM SOCIEDAD ANONIMA |
| 1 757 |
| 1 757 |
| 0 |
ISABELLE ARNOLD |
| 88 |
| 88 |
| 0 |
ANNE-MARGOT ARSENAULT |
| 18 |
| 18 |
| 0 |
FRANCINE ARSENAULT |
| 30 |
| 30 |
| 0 |
GEORGES ALEXANDRE ARSENAULT |
| 18 |
| 18 |
| 0 |
GILLES ARSENAULT |
| 301 |
| 301 |
| 0 |
LEONARD ARSENAULT |
| 282 |
| 282 |
| 0 |
RAYMOND ARSENAULT |
| 60 |
| 60 |
| 0 |
ROLANDE ARSENAULT |
| 36 |
| 36 |
| 0 |
| ||||||
ASPAC BIOMARK |
| 68 539 |
| 68 539 |
| 0 |
| ||||||
SALEHI ASSAD |
| 264 |
| 264 |
| 0 |
BARINDER ATHWAL |
| 837 |
| 837 |
| 0 |
| ||||||
JACQUES AUBRY |
| 35 |
| 35 |
| 0 |
| ||||||
JOHN AXMIT |
| 4 |
| 4 |
| 0 |
ANIL BADABOUDINE |
| 60 |
| 60 |
| 0 |
| ||||||
ABDOULAYE BAH |
| 2 636 |
| 2 636 |
| 0 |
BRUNO BALLARANO |
| 123 |
| 123 |
| 0 |
| ||||||
RENE BANDET |
| 457 |
| 457 |
| 0 |
47
|
|
|
|
|
|
|
NGUYEN MINH NGOC BAO |
| 527 |
| 527 |
| 0 |
| ||||||
LYNE BARRY |
| 12 |
| 12 |
| 0 |
| ||||||
JEAN BASTIEN |
| 376 |
| 376 |
| 0 |
JEAN FRANCOIS BASTIEN |
| 397 |
| 397 |
| 0 |
| ||||||
JULIE BASTIEN |
| 12 |
| 12 |
| 0 |
MARTINE BASTIEN |
| 18 |
| 18 |
| 0 |
SERGE BEAUDOIN |
| 420 |
| 420 |
| 0 |
ALAIN BEAUREGARD |
| 4 |
| 4 |
| 0 |
MARCEL BEAUDRY |
| 53 |
| 53 |
| 0 |
MARC BEAUREGARD |
| 35 |
| 35 |
| 0 |
STEPHANE BEAUREGARD |
| 4 |
| 4 |
| 0 |
| ||||||
ANDRE BEAULIEU |
| 289 |
| 289 |
| 0 |
MARC BEAUSEJOUR |
| 313 |
| 313 |
| 0 |
| ||||||
PATRICK BEDARD |
| 5 859 |
| 5 859 |
| 0 |
ALICE BEDROSSIAN |
| 88 |
| 88 |
| 0 |
MICHEL BEDROSSIAN |
| 53 |
| 53 |
| 0 |
JEAN PHILIPPE BEGIN |
| 35 |
| 35 |
| 0 |
FLORIAN BELHUMEUR |
| 1 757 |
| 1 757 |
| 0 |
| ||||||
ENZO BELLANCA |
| 70 |
| 70 |
| 0 |
MESSOD BENDAYAN |
| 18 |
| 18 |
| 0 |
DANIEL BENJAFIELD |
| 18 |
| 18 |
| 0 |
| ||||||
CLEMENT BENOIT |
| 301 |
| 301 |
| 0 |
GILLES BENOIT |
| 120 |
| 120 |
| 0 |
| ||||||
VIOLETTA BENOIT |
| 241 |
| 241 |
| 0 |
CHRISTIAN BERGERON |
| 879 |
| 879 |
| 0 |
NELSON GERGERON |
| 241 |
| 241 |
| 0 |
| ||||||
GILLES BERNARD |
| 145 |
| 145 |
| 0 |
| ||||||
JOEL BERNIER |
| 169 |
| 169 |
| 0 |
THERESE BERNIER |
| 24 |
| 24 |
| 0 |
48
|
|
|
|
|
|
|
FREDERIC BERTOLDI |
| 351 |
| 351 |
| 0 |
AMIR ALI BHOJANI |
| 30 |
| 30 |
| 0 |
| ||||||
GEORGE BINET |
| 4 921 |
| 4 921 |
| 0 |
| ||||||
BIOMED PHARMA |
| 5 805 |
| 5 805 |
| 0 |
BIO-T CONSULTANTS INC |
| 93 028 |
| 93 028 |
| 0 |
ANDRE BISSONNETTE |
| 281 |
| 281 |
| 0 |
| ||||||
JOHANNE BLAIS |
| 67 |
| 67 |
| 0 |
| ||||||
RICHARD BLAIS |
| 296 |
| 296 |
| 0 |
DAVID WAYNE BLANCHETTE |
| 20 |
| 20 |
| 0 |
DENIS BLAQUIERE |
| 1 648 |
| 1 648 |
| 0 |
| ||||||
FRANCE BONIN |
| 96 |
| 96 |
| 0 |
LAURETTE BORDUAS |
| 36 |
| 36 |
| 0 |
| ||||||
LOUISE BORYS |
| 95 |
| 95 |
| 0 |
| ||||||
WALTER BORYS |
| 60 |
| 60 |
| 0 |
| ||||||
CLAUDE BOSSE |
| 5 272 |
| 5 272 |
| 0 |
| ||||||
GINO BOSSIO |
| 203 |
| 203 |
| 0 |
JOCELYNE BOUCHER |
| 120 |
| 120 |
| 0 |
STEPHANE BOUCHER |
| 12 |
| 12 |
| 0 |
BEVERLY BOUDREAULT |
| 88 |
| 88 |
| 0 |
BOB BOUDREAULT |
| 88 |
| 88 |
| 0 |
| ||||||
DENIS BOUDRIAS |
| 24 |
| 24 |
| 0 |
| ||||||
SERGE BOULAIS |
| 234 |
| 234 |
| 0 |
FRANCINE BOULERICE |
| 24 |
| 24 |
| 0 |
JACQUES BOURBONNAIS |
| 1 054 |
| 1 054 |
| 0 |
GERALD BOURDON |
| 398 |
| 398 |
| 0 |
ROLANDE BOURDON-CARBONNEAU |
| 24 |
| 24 |
| 0 |
ROLLANDECARBONEAU-BOURDON |
| 24 |
| 24 |
| 0 |
DAVID BOURNE |
| 18 |
| 18 |
| 0 |
49
|
|
|
|
|
|
|
PATRICIA BOURNE |
| 18 |
| 18 |
| 0 |
FRANCOIS BOURRET |
| 602 |
| 602 |
| 0 |
MICHEL BOUTIN &CHRISTIANE NOLET JT TEN |
| 123 |
| 123 |
| 0 |
| ||||||
RAOUL BOUVIN |
| 125 |
| 125 |
| 0 |
| ||||||
ALAIN BOYER |
| 12 |
| 12 |
| 0 |
JOCELYNE BRASSARD |
| 5 |
| 5 |
| 0 |
| ||||||
LUCIE BRASSARD |
| 30 |
| 30 |
| 0 |
| ||||||
BRIGITTE BRIE |
| 60 |
| 60 |
| 0 |
| ||||||
BENOIT BRIERE |
| 481 |
| 481 |
| 0 |
| ||||||
SYLVAIN BRIERE |
| 823 |
| 823 |
| 0 |
RICHARD BRODMAN |
| 1 098 |
| 1 098 |
| 0 |
| ||||||
LORNE BROTMAN |
| 176 |
| 176 |
| 0 |
MAXWELL BROTMAN |
| 619 |
| 619 |
| 0 |
STACEY BROTMAN |
| 176 |
| 176 |
| 0 |
PIERRE BRUNELLE |
| 60 |
| 60 |
| 0 |
JOCELYNE BRUNET |
| 74 |
| 74 |
| 0 |
RINO BUFFONE & ANTONIO DI VINCENZO JTTEN |
| 239 |
| 239 |
| 0 |
| ||||||
JOE T BUSBY |
| 35 |
| 35 |
| 0 |
| ||||||
DORIS BUSQUE |
| 181 |
| 181 |
| 0 |
JACINTHE BUSQUE |
| 60 |
| 60 |
| 0 |
MARGARET BYWATERS |
| 2 636 |
| 2 636 |
| 0 |
M JOSE CABELLOS |
| 70 |
| 70 |
| 0 |
CLAUDE CADORETTE |
| 12 |
| 12 |
| 0 |
| ||||||
RICHARD CAHILL |
| 18 927 |
| 18 927 |
| 0 |
| ||||||
PIETRO CALCARA |
| 49 |
| 49 |
| 0 |
128413 CANADA LTD |
| 176 |
| 176 |
| 0 |
4049870 CANADA INC |
| 2 636 |
| 2 636 |
| 0 |
50
|
|
|
|
|
|
|
4170059 CANADA INC |
| 17 802 |
| 17 802 |
| 0 |
4220-1116 CANADA INC |
| 3 515 |
| 3 515 |
| 0 |
4291034 CANADA INC |
| 29 876 |
| 29 876 |
| 0 |
ANGELA CAPURSO |
| 3 368 |
| 3 368 |
| 0 |
CHRISTIAN CARDINAL |
| 12 |
| 12 |
| 0 |
ANTONIO CARNEVALE |
| 1 757 |
| 1 757 |
| 0 |
MARCEL CARPENTIER |
| 176 |
| 176 |
| 0 |
| ||||||
PETER CARR |
| 18 |
| 18 |
| 0 |
| ||||||
JOE CARUSO |
| 62 |
| 62 |
| 0 |
| ||||||
GAIL CASEY |
| 4 |
| 4 |
| 0 |
LEONARDO CASTIELLO |
| 1 494 |
| 1 494 |
| 0 |
ANTONIO CASTILIANO |
| 365 |
| 365 |
| 0 |
GIUSEPPE CASTIGLIONE |
| 19 106 |
| 19 106 |
| 0 |
| ||||||
SOFIA CATALINI |
| 165 |
| 165 |
| 0 |
ROSS CATION |
| 4 |
| 4 |
| 0 |
| ||||||
GEORGE CATTAN |
| 120 |
| 120 |
| 0 |
DARREN CAVANAGH |
| 176 |
| 176 |
| 0 |
| ||||||
FRANK CAVANAGH |
| 176 |
| 176 |
| 0 |
JACQUES CAYER |
| 53 |
| 53 |
| 0 |
GEORGES CHALMERS |
| 2 |
| 2 |
| 0 |
FREDERICK CHAMPAGNE |
| 808 |
| 808 |
| 0 |
NICOLAS CHAMPAGNE |
| 808 |
| 808 |
| 0 |
ALEXANDRE CHAPDELAINE |
| 72 |
| 72 |
| 0 |
CARINE CHAPDELAINE |
| 72 |
| 72 |
| 0 |
JULES CHAPDELAINE |
| 120 |
| 120 |
| 0 |
SUZANNE CHAPDELAINE |
| 241 |
| 241 |
| 0 |
| ||||||
ANDRE CHAREST |
| 72 |
| 72 |
| 0 |
MARCH CHARRETTE |
| 86 |
| 86 |
| 0 |
LANGIS CHARRON |
| 241 |
| 241 |
| 0 |
51
|
|
|
|
|
|
|
ROBERT CHELHOT |
| 120 |
| 120 |
| 0 |
| ||||||
JOHN CHESNUTT |
| 4 |
| 4 |
| 0 |
STEVEN CHESNUTT |
| 4 |
| 4 |
| 0 |
JACQUES CHIASSON |
| 181 |
| 181 |
| 0 |
| ||||||
DENIS CHICOINE |
| 202 |
| 202 |
| 0 |
JEAN PIERRE CHICOINE |
| 120 |
| 120 |
| 0 |
| ||||||
JULES CHICOINE |
| 602 |
| 602 |
| 0 |
| ||||||
DAVID CHITYAL |
| 2 197 |
| 2 197 |
| 0 |
PERRY CHOINIERE |
| 13 181 |
| 13 181 |
| 0 |
NBCN CLEARING INC FBO -PERRY CHOINIERE 1AVFGYA |
| 703 |
| 703 |
| 0 |
SYLVAIN CHOINIERE |
| 293 |
| 293 |
| 0 |
JUSTINE CHOLETTE |
| 313 |
| 313 |
| 0 |
MICHEL CHOLETTE |
| 1 493 |
| 1 493 |
| 0 |
PHILIPPE CHOLETTE |
| 60 |
| 60 |
| 0 |
MICHEL CHOQUETTE |
| 11 |
| 11 |
| 0 |
CHRISTOS CHRISTOU |
| 780 |
| 780 |
| 0 |
STEPHANE CHRETIEN |
| 176 |
| 176 |
| 0 |
| ||||||
SORIBA CISSE |
| 6 063 |
| 6 063 |
| 0 |
| ||||||
CLOMAX INC |
| 59 |
| 59 |
| 0 |
| ||||||
LINDA COALLIER |
| 18 |
| 18 |
| 0 |
RAFFAEL COBUZZI |
| 36 |
| 36 |
| 0 |
| ||||||
THOMAS COFFEY |
| 98 |
| 98 |
| 0 |
| ||||||
RONIN COHEN |
| 26 |
| 26 |
| 0 |
| ||||||
RENE COMPTOIS |
| 120 |
| 120 |
| 0 |
| ||||||
DENISE COMTOIS |
| 60 |
| 60 |
| 0 |
ROBERT COMTOIS |
| 84 |
| 84 |
| 0 |
RODNEY COOMER |
| 2 |
| 2 |
| 0 |
CHANTAL CORBEIL |
| 18 |
| 18 |
| 0 |
52
|
|
|
|
|
|
|
MYLENE CORBEIL |
| 18 |
| 18 |
| 0 |
SUZANNE CORMIER |
| 32 |
| 32 |
| 0 |
ANDRE CORRIVEAU |
| 96 |
| 96 |
| 0 |
ADRIEN CORRIVEAU |
| 602 |
| 602 |
| 0 |
GISELLE CORRIVEAU |
| 87 |
| 87 |
| 0 |
| ||||||
BRIAN COSTELLO |
| 1 757 |
| 1 757 |
| 0 |
BRIAN COSTELLO JR |
| 1 757 |
| 1 757 |
| 0 |
BERTHE BLANCHETTE COTE |
| 61 |
| 61 |
| 0 |
| ||||||
CLAIRE COTE |
| 60 |
| 60 |
| 0 |
| ||||||
JEAN MARC COTE |
| 189 |
| 189 |
| 0 |
| ||||||
DAVID COULL |
| 148 |
| 148 |
| 0 |
| ||||||
JOAN COULL |
| 148 |
| 148 |
| 0 |
CELINE COULOMBE |
| 181 |
| 181 |
| 0 |
SOLANGE COULOMBE |
| 60 |
| 60 |
| 0 |
ALAIN COUSINEAU |
| 527 |
| 527 |
| 0 |
| ||||||
LYNE COUTURE |
| 176 |
| 176 |
| 0 |
CREATION PUBLICITAIRES INC |
| 120 |
| 120 |
| 0 |
SYLVANO CRIVELLO |
| 89 |
| 89 |
| 0 |
| ||||||
DIANE CULLEN |
| 293 |
| 293 |
| 0 |
| ||||||
FRANK CURTI |
| 26 |
| 26 |
| 0 |
| ||||||
EDWARD CUTLER |
| 967 |
| 967 |
| 0 |
| ||||||
YVES CYR |
| 120 |
| 120 |
| 0 |
PIERRE DAGENAIS |
| 264 |
| 264 |
| 0 |
BERNARD DALLAIRE |
| 18 |
| 18 |
| 0 |
FILOMENA D’ANDREA |
| 239 |
| 239 |
| 0 |
| ||||||
JOSEPH DANIELE |
| 12 571 |
| 12 571 |
| 0 |
GIUSEPPE DANIELLE |
| 17 574 |
| 17 574 |
| 0 |
CHANTAL DANSEREAU |
| 60 |
| 60 |
| 0 |
53
|
|
|
|
|
|
|
NGUYEN THI DAO |
| 8 787 |
| 8 787 |
| 0 |
| ||||||
BENOIT DAOUST |
| 24 |
| 24 |
| 0 |
| ||||||
DIANE DAOUST |
| 60 |
| 60 |
| 0 |
CHRISTIAN DAVIAU |
| 1 757 |
| 1 757 |
| 0 |
| ||||||
LAILA DEBS |
| 60 |
| 60 |
| 0 |
ANNA MARIA DEL BELLO |
| 527 |
| 527 |
| 0 |
FRANK DEL BELLO |
| 4 394 |
| 4 394 |
| 0 |
| ||||||
NINO DEL BELLO |
| 4 394 |
| 4 394 |
| 0 |
| ||||||
PASCAL DELCY |
| 264 |
| 264 |
| 0 |
| ||||||
MANON DELISLE |
| 12 |
| 12 |
| 0 |
| ||||||
BRUNO DELORME |
| 24 |
| 24 |
| 0 |
JACQUES DELORME |
| 351 |
| 351 |
| 0 |
FILOMENA DELUCA |
| 105 |
| 105 |
| 0 |
ANGELO DE LUCIA |
| 105 |
| 105 |
| 0 |
JACQUES DENONCOURT |
| 18 |
| 18 |
| 0 |
| ||||||
JOHANNE DEPOT |
| 60 |
| 60 |
| 0 |
JEAN GERALD DESIRE |
| 2 724 |
| 2 724 |
| 0 |
MARIO DESJARDINS |
| 62 |
| 62 |
| 0 |
MANON DESROSIERS |
| 120 |
| 120 |
| 0 |
| ||||||
FRANK DIACO |
| 207 |
| 207 |
| 0 |
| ||||||
J DIAVATIS |
| 70 |
| 70 |
| 0 |
KENNETH DI BREWIN |
| 228 |
| 228 |
| 0 |
LUCIANO DI MARCO |
| 615 |
| 615 |
| 0 |
ROBERTO DI MARCO |
| 615 |
| 615 |
| 0 |
| ||||||
BICH VAN DINH |
| 5 272 |
| 5 272 |
| 0 |
| ||||||
LOISEL DIOGENE |
| 12 |
| 12 |
| 0 |
CHRISTIAN DIONNE |
| 24 |
| 24 |
| 0 |
AURORA DI PAOLA |
| 18 |
| 18 |
| 0 |
ANTONIO DI VINCENZO |
| 214 |
| 214 |
| 0 |
54
|
|
|
|
|
|
|
DM INVESTMENTS |
| 35 148 |
| 35 148 |
| 0 |
MOHAMMED DOCRAT |
| 45 |
| 45 |
| 0 |
DIETER DOEDERLINE |
| 4 |
| 4 |
| 0 |
CHRISTIAN DONATO |
| 15 |
| 15 |
| 0 |
| ||||||
DANIEL DONAVAN |
| 351 |
| 351 |
| 0 |
| ||||||
TOM DOUGLAS |
| 72 |
| 72 |
| 0 |
| ||||||
SID DRAPKIN |
| 88 |
| 88 |
| 0 |
| ||||||
ERIC DROUIN |
| 181 |
| 181 |
| 0 |
| ||||||
FANNY DUBUC |
| 12 |
| 12 |
| 0 |
| ||||||
ROBERT DUCA |
| 176 |
| 176 |
| 0 |
GREGORY DUCOS |
| 28 |
| 28 |
| 0 |
| ||||||
SYLVIE DUFAUX |
| 24 |
| 24 |
| 0 |
JEREMIE DUFOUR |
| 3 515 |
| 3 515 |
| 0 |
| ||||||
REAL DUFOUR |
| 879 |
| 879 |
| 0 |
JACQUELINE DUHAMEL |
| 24 |
| 24 |
| 0 |
| ||||||
MARIO DUMAIS |
| 1 054 |
| 1 054 |
| 0 |
JEAN-MARIE DUMESNIL |
| 248 |
| 248 |
| 0 |
| ||||||
GIZELLE DUMONT |
| 120 |
| 120 |
| 0 |
| ||||||
JESSICA DUMONT |
| 88 |
| 88 |
| 0 |
JOSIANE DUMONT |
| 88 |
| 88 |
| 0 |
| ||||||
LOUISE DUMONT |
| 12 |
| 12 |
| 0 |
MARC ANDRE DUMONT |
| 30 |
| 30 |
| 0 |
TRUONG VAN DUNG |
| 176 |
| 176 |
| 0 |
| ||||||
ANDRE EMOND |
| 60 |
| 60 |
| 0 |
| ||||||
DENIS EMOND |
| 5 861 |
| 5 861 |
| 0 |
| ||||||
GIULIANO ERCOLI |
| 25 |
| 25 |
| 0 |
| ||||||
SYLVAIN ETHIER |
| 241 |
| 241 |
| 0 |
GUY FAFARD &MICHEL FAFARD JT TEN |
| 72 |
| 72 |
| 0 |
55
|
|
|
|
|
|
|
FENCO |
| 1 757 |
| 1 757 |
| 0 |
FENCO ASSOCIATES |
| 2 074 |
| 2 074 |
| 0 |
JEAN-PIERRE FERLAND |
| 1 318 |
| 1 318 |
| 0 |
ROBERT FERRARO |
| 176 |
| 176 |
| 0 |
| ||||||
FIDUCIE S.A.M. |
| 14 059 |
| 14 059 |
| 0 |
| ||||||
COLLETTE FILION |
| 53 |
| 53 |
| 0 |
| ||||||
COLETTE FILLION |
| 16 |
| 16 |
| 0 |
ROBERT FITZGERALD |
| 2 |
| 2 |
| 0 |
LEDO. RAFAEL COLON FLORES |
| 88 |
| 88 |
| 0 |
FONDATION JEUNESSE IN’AFU |
| 249 |
| 249 |
| 0 |
| ||||||
LES FORD |
| 2 |
| 2 |
| 0 |
ALEXANDRE FORTIER |
| 60 |
| 60 |
| 0 |
| ||||||
DANY FORTIER |
| 30 |
| 30 |
| 0 |
GUY FORTIN |
| 989 |
| 989 |
| 0 |
| ||||||
MARIO FORTIER |
| 241 |
| 241 |
| 0 |
| ||||||
CHANTAL FORTIN |
| 60 |
| 60 |
| 0 |
| ||||||
FRANCE FORTIN |
| 12 |
| 12 |
| 0 |
| ||||||
GUY FORTIN |
| 717 |
| 717 |
| 0 |
DONALD FRANCES |
| 2 |
| 2 |
| 0 |
MARCO FRAPPIER |
| 5 887 |
| 5 887 |
| 0 |
BRIGITTE FREGAULT |
| 1 172 |
| 1 172 |
| 0 |
NBCN CLEARING INC FBO- DOMINIQUE FREGAULT |
| 908 |
| 908 |
| 0 |
FRANCOIS FREGAULT |
| 60 |
| 60 |
| 0 |
GINETTE FREGAULT |
| 908 |
| 908 |
| 0 |
MARC-ANDRE FREGAULT |
| 908 |
| 908 |
| 0 |
PATRICIA FRONTEIRA |
| 70 |
| 70 |
| 0 |
| ||||||
JOHN FUOCO |
| 204 |
| 204 |
| 0 |
| ||||||
MICHEL GAGNE |
| 24 |
| 24 |
| 0 |
56
|
|
|
|
|
|
|
ANDRE GAGNON |
| 176 |
| 176 |
| 0 |
GEORGES GAGNON |
| 60 |
| 60 |
| 0 |
| ||||||
RICHER GAGNON |
| 60 |
| 60 |
| 0 |
FRANCES H GAJANO |
| 124 |
| 124 |
| 0 |
PATRICK GALLAME |
| 84 |
| 84 |
| 0 |
GARDERIE LA BASCULE INC |
| 301 |
| 301 |
| 0 |
| ||||||
DAVID GAUDETTE |
| 1 054 |
| 1 054 |
| 0 |
GILLES GAUDETTE |
| 785 |
| 785 |
| 0 |
STEPHANIE GAUDETTE |
| 12 |
| 12 |
| 0 |
FRANCE GAUTHIER |
| 4 394 |
| 4 394 |
| 0 |
MAURICE GAUTHIER |
| 589 |
| 589 |
| 0 |
GDCI CAPITAL INC |
| 7 820 |
| 7 820 |
| 0 |
CLAIRE GEOFFRION |
| 70 |
| 70 |
| 0 |
GESTION & CONULTATION MP BEAUDOIN |
| 24 |
| 24 |
| 0 |
GESTION LA SOLUTION LTD |
| 9 666 |
| 9 666 |
| 0 |
GESTION SERBEAU INC |
| 96 |
| 96 |
| 0 |
GESTION SYLVAIN TREMBLAY (1998) INC |
| 289 |
| 289 |
| 0 |
| ||||||
CRISTINE GHAKIS |
| 1 757 |
| 1 757 |
| 0 |
| ||||||
MIKE GHAKIS |
| 5 272 |
| 5 272 |
| 0 |
| ||||||
PATRICK GHAKIS |
| 1 757 |
| 1 757 |
| 0 |
| ||||||
CLAIRE GIARD |
| 72 |
| 72 |
| 0 |
SELONKOUE FEIBONAZOUI GILBERT |
| 879 |
| 879 |
| 0 |
MARTINE GINGRAS |
| 14 |
| 14 |
| 0 |
| ||||||
DANIEL GINGUES |
| 351 |
| 351 |
| 0 |
| ||||||
GABRIELE GIOBI |
| 35 |
| 35 |
| 0 |
| ||||||
MAURIZIO GIOBI |
| 118 |
| 118 |
| 0 |
| ||||||
HENRI GIRARD |
| 35 |
| 35 |
| 0 |
57
|
|
|
|
|
|
|
CONSULTANT JEAN PIERRE GIRARD |
| 35 |
| 35 |
| 0 |
| ||||||
PIERRE GIROUX |
| 72 |
| 72 |
| 0 |
| ||||||
SYLVIE GIROUX |
| 120 |
| 120 |
| 0 |
| ||||||
CECILE GODIN |
| 18 |
| 18 |
| 0 |
MARY GOLDSMITH |
| 9 |
| 9 |
| 0 |
MARIO GONCALVES |
| 60 |
| 60 |
| 0 |
| ||||||
JACQUES GOYET |
| 120 |
| 120 |
| 0 |
| ||||||
K C GRAINGER |
| 4 077 |
| 4 077 |
| 0 |
KENNETH C GRAINGER |
| 70 |
| 70 |
| 0 |
MARION GRAINGER |
| 381 |
| 381 |
| 0 |
| ||||||
CLAUDE GRAVEL |
| 351 |
| 351 |
| 0 |
| ||||||
LOUIS GRECO |
| 6 151 |
| 6 151 |
| 0 |
GREEN PERFORMANCE S.A. |
| 8 787 |
| 8 787 |
| 0 |
| ||||||
GIANNI GRIMALDI |
| 167 |
| 167 |
| 0 |
VINCENZA GRIVAS |
| 18 |
| 18 |
| 0 |
| ||||||
SABINE GROULX |
| 12 |
| 12 |
| 0 |
| ||||||
VANESSA GUAY |
| 439 |
| 439 |
| 0 |
| ||||||
MELISSA GUAY |
| 1 318 |
| 1 318 |
| 0 |
CLEMENT GUERARD |
| 120 |
| 120 |
| 0 |
ANGELE GUILBERT |
| 24 |
| 24 |
| 0 |
LOUISE GUILBERT |
| 12 |
| 12 |
| 0 |
RAYMOND GUITARD |
| 12 |
| 12 |
| 0 |
GUYLAINE GRAVEL |
| 60 |
| 60 |
| 0 |
| ||||||
J HAMMEL |
| 879 |
| 879 |
| 0 |
| ||||||
JOHN K HAMMEL |
| 351 |
| 351 |
| 0 |
MARIE FRANCE HARBEC |
| 18 |
| 18 |
| 0 |
| ||||||
SERGE HARBEC |
| 290 |
| 290 |
| 0 |
CHRISTINE HARVEY |
| 602 |
| 602 |
| 0 |
58
|
|
|
|
|
|
|
COULOMBE HAYES |
| 28 |
| 28 |
| 0 |
| ||||||
PHILIPPE HAYES |
| 60 |
| 60 |
| 0 |
HERAN CAPITAL INC |
| 439 |
| 439 |
| 0 |
| ||||||
TODD HESKELL |
| 30 |
| 30 |
| 0 |
| ||||||
ANDRE HETU |
| 30 |
| 30 |
| 0 |
JOHN HIGBINSON SR |
| 2 |
| 2 |
| 0 |
| ||||||
LE LE HOANG |
| 8 787 |
| 8 787 |
| 0 |
| ||||||
MEIKEN HOHMAN |
| 4 |
| 4 |
| 0 |
| ||||||
RORY HOPE |
| 2 |
| 2 |
| 0 |
| ||||||
TA NGOC HO |
| 1 406 |
| 1 406 |
| 0 |
| ||||||
DENIS HOULD |
| 7 |
| 7 |
| 0 |
| ||||||
WILLIAM HUM |
| 60 |
| 60 |
| 0 |
HELEN HURTUBISE |
| 53 |
| 53 |
| 0 |
THE HONG HUYNH |
| 1 054 |
| 1 054 |
| 0 |
| ||||||
THE LANG HUYNH |
| 1 054 |
| 1 054 |
| 0 |
| ||||||
THE LAY HUYNH |
| 492 |
| 492 |
| 0 |
| ||||||
THE IEM HUYNH |
| 12 302 |
| 12 302 |
| 0 |
THE NGHIEM HUYNH |
| 4 657 |
| 4 657 |
| 0 |
| ||||||
TRI MINH HUYNH |
| 8 523 |
| 8 523 |
| 0 |
| ||||||
LA HY |
| 180 |
| 180 |
| 0 |
SALVATORE IAVARONE |
| 235 |
| 235 |
| 0 |
ANTHONY IERFINO |
| 8 787 |
| 8 787 |
| 0 |
ANTHONY IERFINO & LILLA MAGRI JT TEN |
| 3 515 |
| 3 515 |
| 0 |
| ||||||
YAEL IFERGAN |
| 22 |
| 22 |
| 0 |
| ||||||
AHMED IKBAL |
| 60 |
| 60 |
| 0 |
INCHRAY INVESTMENTS LIMITED |
| 1 582 |
| 1 582 |
| 0 |
INTERNATIONAL GLOBAL INVESTMENT |
| 110 |
| 110 |
| 0 |
PATRICIA IOANNONI |
| 58 |
| 58 |
| 0 |
59
|
|
|
|
|
|
|
FRANCE IPOTESI |
| 132 |
| 132 |
| 0 |
| ||||||
NAILA IQBAL |
| 15 |
| 15 |
| 0 |
LISETTE JACQUES |
| 264 |
| 264 |
| 0 |
RVD. OMAR JAHEN |
| 88 |
| 88 |
| 0 |
MARCELLE JARRY |
| 120 |
| 120 |
| 0 |
SYLVAIN JOANNETTE |
| 18 |
| 18 |
| 0 |
| ||||||
NAILA JOBAL |
| 15 |
| 15 |
| 0 |
| ||||||
DYLAN JOFFRE |
| 117 |
| 117 |
| 0 |
| ||||||
HAROLD JOFFRE |
| 937 |
| 937 |
| 0 |
| ||||||
DAVID JONES |
| 2 |
| 2 |
| 0 |
| ||||||
JPCV CAPITAL |
| 35 148 |
| 35 148 |
| 0 |
| ||||||
ANDRE JULIEN |
| 24 |
| 24 |
| 0 |
| ||||||
JOHN JURICHKO |
| 141 |
| 141 |
| 0 |
| ||||||
HELENE JUTEAU |
| 44 |
| 44 |
| 0 |
| ||||||
ROBERT JUTRAS |
| 120 |
| 120 |
| 0 |
ZACHARY KARABATSOS |
| 35 |
| 35 |
| 0 |
ANTHONY KAUFMAN |
| 18 |
| 18 |
| 0 |
| ||||||
JOAN KAUFMAN |
| 18 |
| 18 |
| 0 |
| ||||||
K-BRO LLC |
| 4 394 |
| 4 394 |
| 0 |
RICHARD J KESSELL |
| 9 |
| 9 |
| 0 |
MANA KEUSHGUERIAN |
| 18 |
| 18 |
| 0 |
KEYS FAMILY PARTNERS LTD |
| 65 024 |
| 65 024 |
| 0 |
TRUONG NHU KHANG |
| 351 |
| 351 |
| 0 |
TRUONG NHU KHANH |
| 2 460 |
| 2 460 |
| 0 |
KNOTTY PINE HOLDINGS INC |
| 439 |
| 439 |
| 0 |
| ||||||
CAROLINE KOCH |
| 176 |
| 176 |
| 0 |
| ||||||
BRANDON KOPS |
| 474 |
| 474 |
| 0 |
| ||||||
YEHUDA KOPS |
| 98 668 |
| 98 668 |
| 0 |
60
|
|
|
|
|
|
|
KENNETH KWAN |
| 176 |
| 176 |
| 0 |
JOCELYN L’ABBEE |
| 88 |
| 88 |
| 0 |
| ||||||
REAL L’ABBEE |
| 18 |
| 18 |
| 0 |
FRANCOIS PIERRE LABERGE |
| 1 406 |
| 1 406 |
| 0 |
| ||||||
BRUNO LABODIE |
| 88 |
| 88 |
| 0 |
CAROLE LABRECQUE |
| 235 |
| 235 |
| 0 |
GHISLAIN LABRECQUE |
| 235 |
| 235 |
| 0 |
JEAN MARIE LABRECQUE |
| 235 |
| 235 |
| 0 |
JEAN GUY LABRECQUE |
| 7 618 |
| 7 618 |
| 0 |
| ||||||
LISE LABRECQUE |
| 235 |
| 235 |
| 0 |
MARIUS LABRECQUE |
| 235 |
| 235 |
| 0 |
MARIELLE LABRECQUE |
| 235 |
| 235 |
| 0 |
MONIQUE LABRECQUE |
| 235 |
| 235 |
| 0 |
NATHALIE LABRECQUE |
| 120 |
| 120 |
| 0 |
YOLANDE LABRECQUE |
| 235 |
| 235 |
| 0 |
JEREMIE LACASSE |
| 12 |
| 12 |
| 0 |
DANIELLE LACROIX |
| 42 |
| 42 |
| 0 |
| ||||||
DENIS LAFLAMME |
| 48 |
| 48 |
| 0 |
FERNAND LAFLAMME |
| 24 |
| 24 |
| 0 |
JEAN CLAUDE LAFLAMME |
| 12 |
| 12 |
| 0 |
| ||||||
RENE LAFLAMME |
| 351 |
| 351 |
| 0 |
SYLVAIN LAFLAMME |
| 12 |
| 12 |
| 0 |
THERESE LAFLAMME |
| 12 |
| 12 |
| 0 |
MICHELE LAFRANCOIS |
| 88 |
| 88 |
| 0 |
DENNIS LAFRENIERE |
| 2 |
| 2 |
| 0 |
| ||||||
PETER LAI |
| 176 |
| 176 |
| 0 |
| ||||||
KARINE LALONDE |
| 12 |
| 12 |
| 0 |
| ||||||
LIETTE LALONDE |
| 12 |
| 12 |
| 0 |
ROBERT LAMARRE |
| 48 |
| 48 |
| 0 |
61
|
|
|
|
|
|
|
YVON LAMBERT |
| 24 |
| 24 |
| 0 |
MICHELE LAMOUREUX |
| 60 |
| 60 |
| 0 |
| ||||||
FULLER LANDAU |
| 32 |
| 32 |
| 0 |
| ||||||
BENOIT LANDRY |
| 24 |
| 24 |
| 0 |
LANDRY PEPIN CONSTRUCTION INC |
| 48 |
| 48 |
| 0 |
| ||||||
DANIEL LANDRY |
| 821 |
| 821 |
| 0 |
| ||||||
DANIEL LANDRY |
| 700 |
| 700 |
| 0 |
STEPHANE LANDRY |
| 48 |
| 48 |
| 0 |
| ||||||
CLAUDE LAVIGNE |
| 17 574 |
| 17 574 |
| 0 |
MARIE-JOSEE LANGEVIN |
| 18 |
| 18 |
| 0 |
JEAN PIERRE LANGLADE |
| 37 |
| 37 |
| 0 |
| ||||||
GILLES LANGLOIS |
| 84 |
| 84 |
| 0 |
GREGORY LANGNER |
| 9 |
| 9 |
| 0 |
JEFFREY LANGNER |
| 9 |
| 9 |
| 0 |
| ||||||
WILLI LANGNER |
| 18 |
| 18 |
| 0 |
DANIELLE LAPIERRE |
| 146 |
| 146 |
| 0 |
| ||||||
RENEE LAPIERRE |
| 151 |
| 151 |
| 0 |
EVELINE LAPORTE |
| 148 |
| 148 |
| 0 |
| ||||||
GILLES LAROSE |
| 849 |
| 849 |
| 0 |
DENISE LAROCHELLE |
| 123 |
| 123 |
| 0 |
SEBASTIEN LAROCHELLE |
| 53 |
| 53 |
| 0 |
ROBERT D LATTAS |
| 439 |
| 439 |
| 0 |
VINCENZO LAURELLI |
| 1 142 |
| 1 142 |
| 0 |
| ||||||
GILLES LAVALLEE |
| 120 |
| 120 |
| 0 |
ROBERT H LAVERS |
| 4 |
| 4 |
| 0 |
| ||||||
CLAUDE LAVIGNE |
| 268 |
| 268 |
| 0 |
| ||||||
GARY LAVOIE |
| 9 |
| 9 |
| 0 |
| ||||||
KATHY LAVOIE |
| 9 |
| 9 |
| 0 |
62
|
|
|
|
|
|
|
PAUL LAVOIE |
| 48 |
| 48 |
| 0 |
| ||||||
JOHN LEADER |
| 351 |
| 351 |
| 0 |
| ||||||
SHAUN LEARY |
| 351 |
| 351 |
| 0 |
| ||||||
FRED LEBEDOFF |
| 88 |
| 88 |
| 0 |
FRED LEBEDOFF &BEVERLY LEBEDOFF JT TEN |
| 88 |
| 88 |
| 0 |
| ||||||
GILLES LEBEL |
| 879 |
| 879 |
| 0 |
| ||||||
ALLEN LEBLANC |
| 30 |
| 30 |
| 0 |
| ||||||
ROGER LEBLANC |
| 60 |
| 60 |
| 0 |
| ||||||
ANDRE LEBLOND |
| 120 |
| 120 |
| 0 |
JEAN PIERRE LECLERC |
| 18 |
| 18 |
| 0 |
YOLANDE L’ECUYER |
| 60 |
| 60 |
| 0 |
| ||||||
LAURENT LEDUC |
| 334 |
| 334 |
| 0 |
| ||||||
JOHN LEEDHAM |
| 2 |
| 2 |
| 0 |
PIERRE LEFEBVRE |
| 5 448 |
| 5 448 |
| 0 |
| ||||||
DAVID LEGAULT |
| 261 |
| 261 |
| 0 |
SUZANNE LEGAULT |
| 3 367 |
| 3 367 |
| 0 |
| ||||||
WILLIAM LEHR |
| 703 |
| 703 |
| 0 |
| ||||||
GUY LEMIEUX |
| 120 |
| 120 |
| 0 |
MICHEL LEONARD |
| 726 |
| 726 |
| 0 |
CHARLES LEPAGE |
| 11 775 |
| 11 775 |
| 0 |
LES HABITATION MAGRIBEC INC |
| 2 636 |
| 2 636 |
| 0 |
| ||||||
CARL LESSARD |
| 60 |
| 60 |
| 0 |
LES SVCS INFORMATIQUES JEAN MORIN INC |
| 105 |
| 105 |
| 0 |
| ||||||
LEO LEVEILLE |
| 351 |
| 351 |
| 0 |
| ||||||
YVAN LEVESQUE |
| 144 |
| 144 |
| 0 |
| ||||||
ANTIGONI LIAPIS |
| 3 515 |
| 3 515 |
| 0 |
M R S SECURITIES SERVICES INC ITF GEORGE LIAPIS A/C |
| 1 951 |
| 1 951 |
| 0 |
63
|
|
|
|
|
|
|
KOSTA LIAPIS |
| 1 757 |
| 1 757 |
| 0 |
| ||||||
MARK LIDSTONE |
| 1 757 |
| 1 757 |
| 0 |
| ||||||
HUYNH GIA LONG |
| 1 757 |
| 1 757 |
| 0 |
HUYNH QUY LONG |
| 1 757 |
| 1 757 |
| 0 |
| ||||||
AURELLA B LORD |
| 120 |
| 120 |
| 0 |
| ||||||
ORELLA B LORD |
| 351 |
| 351 |
| 0 |
GABRIEL LO RUSSO |
| 35 |
| 35 |
| 0 |
| ||||||
JOSEPH LOUIS |
| 88 |
| 88 |
| 0 |
PIERRE-FELIX LOUIS |
| 18 |
| 18 |
| 0 |
| ||||||
MARIO LOYER |
| 176 |
| 176 |
| 0 |
BERTRAND LUSSIER |
| 7 564 |
| 7 564 |
| 0 |
DANIELLE LUSSIER |
| 193 |
| 193 |
| 0 |
GENEVIEVE LUSSIER |
| 132 |
| 132 |
| 0 |
MARIELLE LUSSIER |
| 88 |
| 88 |
| 0 |
MELANIE LUSSIER |
| 4 |
| 4 |
| 0 |
| ||||||
ROBERT LUSSIER |
| 673 |
| 673 |
| 0 |
VERONIQUE LUSSIER |
| 4 |
| 4 |
| 0 |
ALAN MAC DONALD |
| 9 |
| 9 |
| 0 |
ANNE MAC DONALD |
| 4 |
| 4 |
| 0 |
GONTRAND MADORE |
| 120 |
| 120 |
| 0 |
| ||||||
LILLA C MAGRI |
| 176 |
| 176 |
| 0 |
| ||||||
ROSANNA MAGRI |
| 63 |
| 63 |
| 0 |
GHISLAIN MAILLOUX |
| 602 |
| 602 |
| 0 |
JACQUES MAILLOUX |
| 123 |
| 123 |
| 0 |
ROBERT MALUQORINI |
| 179 |
| 179 |
| 0 |
MARIO MARCHAND |
| 126 |
| 126 |
| 0 |
CARMINE MARINO |
| 780 |
| 780 |
| 0 |
| ||||||
PIERRE MAROIS |
| 4 745 |
| 4 745 |
| 0 |
64
|
|
|
|
|
|
|
STEPHANE MARSAN |
| 185 |
| 185 |
| 0 |
| ||||||
MATHIEU MARTEL |
| 12 |
| 12 |
| 0 |
| ||||||
MICHEL MARTIAL |
| 48 |
| 48 |
| 0 |
| ||||||
ROCCI MASELLA |
| 439 |
| 439 |
| 0 |
RICHARD MASSON |
| 88 |
| 88 |
| 0 |
JIMMY MAURADIAN |
| 145 |
| 145 |
| 0 |
ATHENA MAVRODIS |
| 105 |
| 105 |
| 0 |
| ||||||
ANNA MAZOLA |
| 105 |
| 105 |
| 0 |
ARTHUR MERCANTE |
| 299 |
| 299 |
| 0 |
DIANE PIETTE MERCIER |
| 60 |
| 60 |
| 0 |
| ||||||
MICHEL MERCIER |
| 351 |
| 351 |
| 0 |
| ||||||
JEAN MESSIER |
| 24 |
| 24 |
| 0 |
JOHANNE MESSIER |
| 120 |
| 120 |
| 0 |
MET P FORTIER INC |
| 60 |
| 60 |
| 0 |
| ||||||
TOMASSO MIELE |
| 527 |
| 527 |
| 0 |
ANIELLO DANIEL MILELE |
| 148 |
| 148 |
| 0 |
| ||||||
ANDRE MILLETTE |
| 1 757 |
| 1 757 |
| 0 |
| ||||||
RUSSELL MILLS |
| 9 |
| 9 |
| 0 |
JOSEPH MINCIOTTI |
| 360 |
| 360 |
| 0 |
| ||||||
JEAN MIREAULT |
| 501 |
| 501 |
| 0 |
ROBERTO MOCELLA |
| 50 |
| 50 |
| 0 |
REV VINCENT MONACO |
| 176 |
| 176 |
| 0 |
| ||||||
JOHN MOORE |
| 9 |
| 9 |
| 0 |
NATALIE PAGUETTE MOORE |
| 84 |
| 84 |
| 0 |
| ||||||
DANY MOREAU |
| 11 775 |
| 11 775 |
| 0 |
| ||||||
RENE MOREL |
| 9 666 |
| 9 666 |
| 0 |
| ||||||
NADIA MORI |
| 1 318 |
| 1 318 |
| 0 |
| ||||||
PAOLO MORI |
| 23 725 |
| 23 725 |
| 0 |
65
|
|
|
|
|
|
|
CLOTILDE MARCOTTE MORIN |
| 439 |
| 439 |
| 0 |
| ||||||
JEAN MORIN |
| 88 |
| 88 |
| 0 |
| ||||||
LISE MORIN |
| 176 |
| 176 |
| 0 |
| ||||||
WILLIE MORIN |
| 9 |
| 9 |
| 0 |
| ||||||
ALAN MORISHITA |
| 4 |
| 4 |
| 0 |
DOMINIQUE MORISOT |
| 2 636 |
| 2 636 |
| 0 |
| ||||||
PAOLO MORI |
| 6 451 |
| 6 451 |
| 0 |
GIUSEPPE MUCCARI |
| 1 757 |
| 1 757 |
| 0 |
| ||||||
GAIL MULLINS |
| 12 |
| 12 |
| 0 |
ANDREW MURRAY |
| 527 |
| 527 |
| 0 |
DORYS F MURRAY |
| 120 |
| 120 |
| 0 |
| ||||||
BILL NAGY |
| 88 |
| 88 |
| 0 |
| ||||||
NUYNH AL NHI |
| 1 757 |
| 1 757 |
| 0 |
LINDA NICOLACOPOULOS |
| 141 |
| 141 |
| 0 |
| ||||||
ANTHONY NINI |
| 18 |
| 18 |
| 0 |
GILLES NOISEAUX |
| 879 |
| 879 |
| 0 |
| ||||||
FERNAND NOLET |
| 41 |
| 41 |
| 0 |
ANDREW NOWOSTAWSKY |
| 48 |
| 48 |
| 0 |
| ||||||
SYBIL OGILVIE |
| 9 |
| 9 |
| 0 |
| ||||||
PETER O’NESI |
| 4 |
| 4 |
| 0 |
| ||||||
MARC ST. ONGE |
| 545 |
| 545 |
| 0 |
| ||||||
ONTARIO |
| 60 |
| 60 |
| 0 |
OPEN FACE INTERNET |
| 527 |
| 527 |
| 0 |
JACQUES OUELLET |
| 88 |
| 88 |
| 0 |
| ||||||
PIERRE OUELLET |
| 120 |
| 120 |
| 0 |
RICHARD OUELLETTE |
| 4 701 |
| 4 701 |
| 0 |
| ||||||
YVAN OUELLET |
| 301 |
| 301 |
| 0 |
| ||||||
MICHEAL OWENS |
| 9 |
| 9 |
| 0 |
66
|
|
|
|
|
|
|
RICHARD PANBRUN |
| 36 |
| 36 |
| 0 |
CHRISTINE PANGALO |
| 70 |
| 70 |
| 0 |
| ||||||
REA PANGALO |
| 105 |
| 105 |
| 0 |
MAURICE PAQUETTE |
| 1 013 |
| 1 013 |
| 0 |
SIMON PAQUETTE |
| 12 |
| 12 |
| 0 |
| ||||||
GAETAN PARADIS |
| 1 757 |
| 1 757 |
| 0 |
SUZANNE PARADIS |
| 96 |
| 96 |
| 0 |
MICHAEL PARNIAK |
| 1 757 |
| 1 757 |
| 0 |
ANTONIO PARZIALE |
| 119 |
| 119 |
| 0 |
ANTONIO PARZIALLE |
| 378 |
| 378 |
| 0 |
| ||||||
TONY PARZIALE |
| 732 |
| 732 |
| 0 |
ARMAND PATENAUDE |
| 1 144 |
| 1 144 |
| 0 |
LOUIS-PHILLIPPE PAULET |
| 54 |
| 54 |
| 0 |
| ||||||
FRANCINE PAUZE |
| 203 |
| 203 |
| 0 |
CAROLE PELLETIER &RENE MARCOTTE JT TEN |
| 88 |
| 88 |
| 0 |
NANCY PELLETIER |
| 12 |
| 12 |
| 0 |
| ||||||
PAUL PELOQUIN |
| 26 |
| 26 |
| 0 |
PENSON FINANCIAL SERVICES OF CANADA INC |
| 12 741 |
| 12 741 |
| 0 |
ANDRE PEPIN &JULIE PEPIN JT TEN |
| 6 |
| 6 |
| 0 |
| ||||||
ANDRE PEPIN |
| 1 798 |
| 1 798 |
| 0 |
| ||||||
DAVID PEPIN |
| 439 |
| 439 |
| 0 |
| ||||||
PERATECH INC |
| 79 |
| 79 |
| 0 |
COLLEEN PETERSON |
| 88 |
| 88 |
| 0 |
GERALD PETERSON |
| 88 |
| 88 |
| 0 |
| ||||||
BIOMED PHARMA |
| 17 574 |
| 17 574 |
| 0 |
| ||||||
LIEU THI PHAN |
| 4 130 |
| 4 130 |
| 0 |
67
|
|
|
|
|
|
|
OLIVIER PHARAND |
| 88 |
| 88 |
| 0 |
| ||||||
DANIEL PICARD |
| 351 |
| 351 |
| 0 |
TONY PIETRATONIO |
| 123 |
| 123 |
| 0 |
NICK PIETROCUPA |
| 83 |
| 83 |
| 0 |
NICOLA PIETRACUPA |
| 83 |
| 83 |
| 0 |
| ||||||
ANDRE PIETTE |
| 30 |
| 30 |
| 0 |
| ||||||
FRANCE PIETTE |
| 1 172 |
| 1 172 |
| 0 |
NORMAND PINARD |
| 241 |
| 241 |
| 0 |
PIRILINI HOLDINGS |
| 1 142 |
| 1 142 |
| 0 |
| ||||||
JOSEPH PIRILLO |
| 569 |
| 569 |
| 0 |
| ||||||
GUY PLANEUF |
| 879 |
| 879 |
| 0 |
FRANCOIS PLANTE |
| 200 |
| 200 |
| 0 |
ISABELLE PLANTE |
| 60 |
| 60 |
| 0 |
| ||||||
JOHN PLESA |
| 439 |
| 439 |
| 0 |
| ||||||
PHILLIPPE PLOUF |
| 562 |
| 562 |
| 0 |
JEAN-YVES POIRIER |
| 351 |
| 351 |
| 0 |
MICHELINE LALONDE POIRIER |
| 120 |
| 120 |
| 0 |
RICHARD POIRIER |
| 141 |
| 141 |
| 0 |
CLAUDE POISSON |
| 351 |
| 351 |
| 0 |
ROBERT POISSANT |
| 18 |
| 18 |
| 0 |
| ||||||
UGO POLETTA |
| 2 988 |
| 2 988 |
| 0 |
| ||||||
UGO POLLETA |
| 1 757 |
| 1 757 |
| 0 |
| ||||||
UGO POLLETTA |
| 176 |
| 176 |
| 0 |
DANIELLE PONTBRIAND |
| 24 |
| 24 |
| 0 |
JOHNNY PORRECA |
| 3 585 |
| 3 585 |
| 0 |
| ||||||
NICOLE POIRIER |
| 123 |
| 123 |
| 0 |
RICHARD PORTAS |
| 123 |
| 123 |
| 0 |
ROYSTON PORTER |
| 62 |
| 62 |
| 0 |
68
|
|
|
|
|
|
|
DALE PORTERFIELD & |
| 2 001 |
| 2 001 |
| 0 |
PORTERWAY HOLDING |
| 149 |
| 149 |
| 0 |
DANIELL PORTERFIELD &DUANE PORTERFIELD JT TEN |
| 1 757 |
| 1 757 |
| 0 |
PORTER-WELL HOLDING |
| 149 |
| 149 |
| 0 |
| ||||||
PIERRE POULIN |
| 181 |
| 181 |
| 0 |
| ||||||
DAVID PRESIMAN |
| 4 |
| 4 |
| 0 |
JEAN-PIERRE PREVOST |
| 48 |
| 48 |
| 0 |
| ||||||
MICHEL PREVOST |
| 220 |
| 220 |
| 0 |
| ||||||
HARVEY PRIEST |
| 4 |
| 4 |
| 0 |
JACQUELINE PRINCE |
| 9 |
| 9 |
| 0 |
JACQUELINE MARIE PRINCE |
| 142 |
| 142 |
| 0 |
PRO SPECK CAPITAL |
| 123 |
| 123 |
| 0 |
| ||||||
PRO SPORT |
| 351 |
| 351 |
| 0 |
FRANCOIS PROVOST |
| 48 |
| 48 |
| 0 |
ALPHONSO PUCCIO |
| 44 |
| 44 |
| 0 |
THINH TUONG QUAN |
| 13 181 |
| 13 181 |
| 0 |
THINH THUONG QUAN |
| 3 515 |
| 3 515 |
| 0 |
2961 1589 QUEBEC INC |
| 176 |
| 176 |
| 0 |
9006-3785 QUEBEC INC |
| 70 |
| 70 |
| 0 |
9026 6206 QUEBEC INC |
| 36 |
| 36 |
| 0 |
9033-0176 QUEBEC INC |
| 17 635 |
| 17 635 |
| 0 |
9093-9232 QUEBEC INC |
| 888 |
| 888 |
| 0 |
9137-1534 QUEBEC INC |
| 26 800 |
| 26 800 |
| 0 |
| ||||||
QUEBECON |
| 202 |
| 202 |
| 0 |
9142-1438 QUEBEC INC |
| 46 571 |
| 46 571 |
| 0 |
RAYNALD RACICOT |
| 120 |
| 120 |
| 0 |
NBCN CLEARING INC FBO ANDRE RACINE |
| 351 |
| 351 |
| 0 |
69
|
|
|
|
|
|
|
NBCN CLEARING INC FBO GENEVIEIVE RACINE |
| 176 |
| 176 |
| 0 |
JOSIANE RAKOTOMANGA |
| 4 394 |
| 4 394 |
| 0 |
| ||||||
DENNIS RAU |
| 4 |
| 4 |
| 0 |
MICHEL RAYMOND |
| 192 |
| 192 |
| 0 |
ARTHUR RECHTEN |
| 630 |
| 630 |
| 0 |
STEVEN REDMOND |
| 562 |
| 562 |
| 0 |
CLAUDE REMILLARD |
| 120 |
| 120 |
| 0 |
| ||||||
GAETAN RENAUD |
| 69 |
| 69 |
| 0 |
RESA INVESTMENT LTD |
| 2 033 |
| 2 033 |
| 0 |
CHRISTIAN RICHARD |
| 270 |
| 270 |
| 0 |
| ||||||
GUY RICHARD |
| 1 502 |
| 1 502 |
| 0 |
MARYSE RICHARD |
| 36 |
| 36 |
| 0 |
SUZANNE RICHARD |
| 60 |
| 60 |
| 0 |
| ||||||
PATRICIA RIMOK |
| 1 634 |
| 1 634 |
| 0 |
CLAUDETTE RINFRET |
| 265 |
| 265 |
| 0 |
| ||||||
ROCH RIVARD |
| 703 |
| 703 |
| 0 |
| ||||||
YANNICK RIVARD |
| 703 |
| 703 |
| 0 |
| ||||||
CAROLE ROBERT |
| 1 757 |
| 1 757 |
| 0 |
| ||||||
ONIL ROBERT |
| 241 |
| 241 |
| 0 |
JEAN PIERRE ROBICHAUD |
| 439 |
| 439 |
| 0 |
JEAN-MARIE ROBILLARD |
| 53 |
| 53 |
| 0 |
JACQUES ROCHEFORT |
| 53 |
| 53 |
| 0 |
JEZABEL ROCHELEAU |
| 24 |
| 24 |
| 0 |
FRANCOIS ROCHON |
| 105 |
| 105 |
| 0 |
| ||||||
JACQUES ROGER |
| 60 |
| 60 |
| 0 |
| ||||||
JACQUES ROGER |
| 60 |
| 60 |
| 0 |
| ||||||
MARTIN ROMPRE |
| 18 |
| 18 |
| 0 |
ROSEDALE HOLDINGS |
| 14 938 |
| 14 938 |
| 0 |
70
|
|
|
|
|
|
|
GINETTE ROSS |
| 8 |
| 8 |
| 0 |
JEAN-MICHEL ROSS |
| 184 |
| 184 |
| 0 |
| ||||||
MARIO ROSSI |
| 1 757 |
| 1 757 |
| 0 |
| ||||||
MAURO ROSSI |
| 1 617 |
| 1 617 |
| 0 |
PETER R ROTHSCHILD |
| 176 |
| 176 |
| 0 |
HELENE ROTONDO |
| 264 |
| 264 |
| 0 |
VERONIQUE ROUVEYROLLIS &ROMAIN ROUVEYROLLIS JTTEN |
| 60 |
| 60 |
| 0 |
| ||||||
YVES ROUX |
| 264 |
| 264 |
| 0 |
| ||||||
BRIAN ROWE |
| 4 |
| 4 |
| 0 |
| ||||||
HUGUETTE ROY |
| 879 |
| 879 |
| 0 |
JEAN-PIERRE ROY |
| 27 |
| 27 |
| 0 |
| ||||||
| ||||||
MATHIEU ROY |
| 44 |
| 44 |
| 0 |
| ||||||
ROBERT ROY |
| 24 |
| 24 |
| 0 |
| ||||||
VERONIQUE ROY |
| 60 |
| 60 |
| 0 |
| ||||||
ANDRE RUELLE |
| 88 |
| 88 |
| 0 |
| ||||||
SERGIO SAGARIA |
| 545 |
| 545 |
| 0 |
ROLANDE SAINDON |
| 35 |
| 35 |
| 0 |
DOMINIC SALERNO |
| 105 |
| 105 |
| 0 |
| ||||||
NICOLE SAMSON |
| 60 |
| 60 |
| 0 |
RYAN SAMVELYAN |
| 126 |
| 126 |
| 0 |
| ||||||
ROBERT SANTINI |
| 53 |
| 53 |
| 0 |
| ||||||
ERIC SARDANO |
| 88 |
| 88 |
| 0 |
| ||||||
JOSE SARDANO |
| 2 777 |
| 2 777 |
| 0 |
M J ANNY SARDANO |
| 32 |
| 32 |
| 0 |
| ||||||
EMIL SARIC |
| 264 |
| 264 |
| 0 |
| ||||||
JASMINE SARIC |
| 264 |
| 264 |
| 0 |
JACQUES SARRAZIN |
| 145 |
| 145 |
| 0 |
SEBASTIEN SAUVE |
| 1 307 |
| 1 307 |
| 0 |
71
|
|
|
|
|
|
|
ROBERTO SAVOCA |
| 703 |
| 703 |
| 0 |
MICHELINE SAWYER |
| 12 |
| 12 |
| 0 |
ANNUZIATO SCARAMELLA |
| 3 515 |
| 3 515 |
| 0 |
BRENDA E SCHOENBERGER &JEFFREY L SCHOENBERGER |
| 42 |
| 42 |
| 0 |
FRANCESCO SCUCCIMARI |
| 49 |
| 49 |
| 0 |
| ||||||
PHOK HONG SE |
| 703 |
| 703 |
| 0 |
| ||||||
JULIA SHAAR |
| 120 |
| 120 |
| 0 |
HOWARD J SHAPIRO &EDWARD M SHAPIRO JTWROS |
| 799 |
| 799 |
| 0 |
JACQUES IP FOOK SHING |
| 351 |
| 351 |
| 0 |
NICHOLAS SKAFIDAS |
| 351 |
| 351 |
| 0 |
SKYLINE RESOURCES |
| 107 705 |
| 107 705 |
| 0 |
SKYLINE INVESTMENTS |
| 2 162 |
| 2 162 |
| 0 |
| ||||||
GUY SMITH |
| 1 318 |
| 1 318 |
| 0 |
JOSEPH SOLOMITA |
| 488 |
| 488 |
| 0 |
MICHAEL SOLOMITA |
| 683 |
| 683 |
| 0 |
| ||||||
ERIC SONIGO |
| 4 569 |
| 4 569 |
| 0 |
| ||||||
NICOLE SOULARD |
| 1 648 |
| 1 648 |
| 0 |
NICOLE SOULARD &DENIS BLAQUIERE JT TEN |
| 868 |
| 868 |
| 0 |
| ||||||
NICK SPAGNOLO |
| 105 |
| 105 |
| 0 |
JOHN A SPAULDING |
| 141 |
| 141 |
| 0 |
| ||||||
URSULA STARK |
| 9 |
| 9 |
| 0 |
| ||||||
DANNY STEIDL |
| 35 |
| 35 |
| 0 |
| ||||||
BIANCA J STELLA |
| 88 |
| 88 |
| 0 |
JOANNA B STELLA |
| 88 |
| 88 |
| 0 |
| ||||||
LEONARD STELLA |
| 160 368 |
| 160 368 |
| 0 |
72
|
|
|
|
|
|
|
DENIS ST-MARTIN |
| 60 |
| 60 |
| 0 |
| ||||||
MARK ST-ONGE |
| 413 |
| 413 |
| 0 |
| ||||||
CELINE ST-ONGE |
| 6 |
| 6 |
| 0 |
| ||||||
MARTIN ST-ONGE |
| 36 |
| 36 |
| 0 |
| ||||||
TONY ST-ONGE |
| 492 |
| 492 |
| 0 |
RYAN STUCKLESS |
| 88 |
| 88 |
| 0 |
| ||||||
GUY TAILLEFER |
| 4 077 |
| 4 077 |
| 0 |
| ||||||
DORIS TALBOT |
| 35 |
| 35 |
| 0 |
VIPADA TANGKITJAVISUTH |
| 56 |
| 56 |
| 0 |
| ||||||
ALAIN TANGUAY |
| 2 784 |
| 2 784 |
| 0 |
| ||||||
GUY TAPIN |
| 84 |
| 84 |
| 0 |
| ||||||
JACQUES TAPIN |
| 181 |
| 181 |
| 0 |
TEASDALE INVESTMENT LTD |
| 2 636 |
| 2 636 |
| 0 |
GISELE L TETRAULT |
| 132 |
| 132 |
| 0 |
GISELE TETREAULT |
| 60 |
| 60 |
| 0 |
LORRAINE TETRAULT |
| 4 |
| 4 |
| 0 |
| ||||||
MARIO TETRAULT |
| 4 |
| 4 |
| 0 |
| ||||||
SONIA TETRAULT |
| 4 |
| 4 |
| 0 |
SYLVAIN TETRAULT |
| 4 |
| 4 |
| 0 |
DU TUONG PHUONG THAO |
| 176 |
| 176 |
| 0 |
CLAUDE THEBERGE |
| 120 |
| 120 |
| 0 |
ROBERTO THEBERGE &LINDA NOLET JT TEN |
| 120 |
| 120 |
| 0 |
| ||||||
JEAN THELLEN |
| 36 |
| 36 |
| 0 |
JEAN MARC THERRIEN |
| 120 |
| 120 |
| 0 |
MICHEL THERRIEN |
| 351 |
| 351 |
| 0 |
| ||||||
XYSTE THERRIEN |
| 120 |
| 120 |
| 0 |
HUGUES TETREAULT |
| 18 |
| 18 |
| 0 |
DAVID THEVENAZ & BRENDA THEVENAZ JT TEN |
| 176 |
| 176 |
| 0 |
73
|
|
|
|
|
|
|
BRENDA THEVENAZ |
| 44 |
| 44 |
| 0 |
| ||||||
DAVID THEVENAZ |
| 44 |
| 44 |
| 0 |
VALERIE THEVENAZ |
| 88 |
| 88 |
| 0 |
FREDERICOS TORRES |
| 281 |
| 281 |
| 0 |
| ||||||
JOHN TOTERA |
| 105 |
| 105 |
| 0 |
SIV KHEANG TRAN |
| 3 734 |
| 3 734 |
| 0 |
THOMAS TREICHLER |
| 1 098 |
| 1 098 |
| 0 |
CHRISTINE TREMBLAY |
| 241 |
| 241 |
| 0 |
JEAN MARC TREMBLAY |
| 24 |
| 24 |
| 0 |
| ||||||
MARC TREMBLAY |
| 984 |
| 984 |
| 0 |
| ||||||
LISE TREMBLAY |
| 60 |
| 60 |
| 0 |
SYLVAIN TREMBLAY |
| 3 905 |
| 3 905 |
| 0 |
| ||||||
REAL TREMBLAY |
| 323 |
| 323 |
| 0 |
| ||||||
YVES TREMBLAY |
| 36 |
| 36 |
| 0 |
PIERRE TREPANIER |
| 176 |
| 176 |
| 0 |
MARISE TURCOTTE |
| 62 |
| 62 |
| 0 |
JOANNE TURGEON |
| 60 |
| 60 |
| 0 |
ALEXANDRE VADNAIS |
| 1 177 |
| 1 177 |
| 0 |
| ||||||
LISE VALCOURT |
| 88 |
| 88 |
| 0 |
| ||||||
HUGO VALENTE |
| 38 053 |
| 38 053 |
| 0 |
| ||||||
LEA VALENTE |
| 1 757 |
| 1 757 |
| 0 |
LAURINA VALENTE |
| 1 757 |
| 1 757 |
| 0 |
LEONARDO VALENTE |
| 5 272 |
| 5 272 |
| 0 |
ANTOINE VANDERZON |
| 176 |
| 176 |
| 0 |
FRANCOIS VARNEY |
| 18 |
| 18 |
| 0 |
| ||||||
JOHN VAZQUEZ |
| 60 |
| 60 |
| 0 |
| ||||||
NOEL VEILLEUX |
| 351 |
| 351 |
| 0 |
74
|
|
|
|
|
|
|
CAROLL VEILLEUX |
| 24 |
| 24 |
| 0 |
RAYMONDE VEILLEUX |
| 12 |
| 12 |
| 0 |
JEAN-LOUIS VERDIER |
| 241 |
| 241 |
| 0 |
MARIE-CLAUDE VIAU |
| 18 |
| 18 |
| 0 |
| ||||||
GILLES VIGNEAU |
| 5 096 |
| 5 096 |
| 0 |
MARC ANDRE VIGNEAULT |
| 1 294 |
| 1 294 |
| 0 |
MARYSE VIGNEAULT |
| 385 |
| 385 |
| 0 |
CLAUDE VILLENEUVE |
| 176 |
| 176 |
| 0 |
MICHELLE VINCELLETTE |
| 234 |
| 234 |
| 0 |
VIRAL RESEARCH ASSOCIATES |
| 113 352 |
| 113 352 |
| 0 |
| ||||||
FILIPPO VITA |
| 125 |
| 125 |
| 0 |
| ||||||
MARIO VOLPE |
| 5 500 |
| 5 500 |
| 0 |
VON DER WELT DISTRIBUTIONS INC |
| 35 |
| 35 |
| 0 |
| ||||||
HUYNH AL VY |
| 1 757 |
| 1 757 |
| 0 |
| ||||||
STEVEN WALKER |
| 12 |
| 12 |
| 0 |
| ||||||
BRUCE WATSON |
| 9 |
| 9 |
| 0 |
| ||||||
KEN WEBB |
| 2 |
| 2 |
| 0 |
MARILYN WEIGHILL |
| 9 |
| 9 |
| 0 |
ROBERTA WEINER |
| 18 |
| 18 |
| 0 |
BEVERLY WHITEAR |
| 18 |
| 18 |
| 0 |
MICHAEL WHITEAR |
| 18 |
| 18 |
| 0 |
| ||||||
CHRISTIAN WILER |
| 2 |
| 2 |
| 0 |
| ||||||
ELIANE WILER |
| 15 |
| 15 |
| 0 |
| ||||||
ELIANNE WILER |
| 12 |
| 12 |
| 0 |
| ||||||
EVELYNE WILER |
| 9 |
| 9 |
| 0 |
| ||||||
JUDITH WONG |
| 119 |
| 119 |
| 0 |
KIRSTIE YERGENS |
| 88 |
| 88 |
| 0 |
| ||||||
LOGAN YERGENS |
| 88 |
| 88 |
| 0 |
75
|
|
|
|
|
|
|
MICHELE YERGENS |
| 1 757 |
| 1 757 |
| 0 |
| ||||||
BRIAN ZAKO |
| 879 |
| 879 |
| 0 |
JOHN A ZAMOS &JOANNE L ZAMOS JT TEN |
| 211 |
| 211 |
| 0 |
| ||||||
ELAINE ZAKO |
| 879 |
| 879 |
| 0 |
ANGELO ZAPPITELLI &RITA CASTIELLO JT TEN |
| 1 494 |
| 1 494 |
| 0 |
| ||||||
XU HONG ZHANG |
| 176 |
| 176 |
| 0 |
HOWARD ZINGBOIM |
| 176 |
| 176 |
| 0 |
76
DESCRIPTION OF CAPITAL STOCK
The following description of our capital stock does not purport to be complete and is subject to, and qualified in its entirety by, our certificate of incorporation and bylaws, which we have included as exhibits to the registration statement of which this prospectus forms a part.
Upon the closing of this offering, our authorized capital stock will consist of 280 million shares of common stock, par value $0.0001 per share, and 50 million shares of undesignated preferred stock, par value $0.0001 per share. As of the date of this registration statement, an aggregate of 40,000,000 shares of common stock are issued and outstanding and 829,554 shares of preferred stock are issued and outstanding.
Common Stock
We are authorized to issue 280,000,000 shares of Common Stock, $0.0001 par value. As of September 5, 2006 there were 40,000,000 shares of common stock outstanding, held of record by one majority stockholder, Millenia Hope Inc. our parent corporation, by one shareholder of more than 10% of our common stock and, after the issuance of thestock dividend of 6% of the issued shares of Millenia Hope Pharmaceuticals by Millenia Hope Inc. to its shareholders of record of July 3, 2006, over 2,000 minority shareholders
The holders of our common stock are entitled to one vote per share on any matter to be voted upon by stockholders. The holders of our common stock are entitled to dividends as our board of directors may declare from time to time from legally available funds subject to the preferential rights of the holders of any shares of our preferred stock that we may issue in the future.
Our certificate of incorporation does not provide for cumulative voting in connection with the election of directors. Accordingly, directors will be elected by a plurality of the shares voting once a quorum is present. No holder of our common stock will have any preemptive right to subscribe for any shares of capital stock issued in the future.
Upon any voluntary or involuntary liquidation, dissolution or winding up of our affairs, the holders of our common stock are entitled to share, on a pro rata basis, all assets remaining after payment to creditors and subject to prior distribution rights of any shares of preferred stock that we may issue in the future. All of the outstanding shares of common stock are fully paid and non-assessable. Holders of our common stock do not have cumulative voting rights, so the holders of more than 50% of the combined shares voting for the election of directors may elect all of the directors if they choose to do so, and, in that event, the holders of the remaining shares will not be able to elect any members to the Board of Directors.
Preferred Stock
We are presently authorized to issue 50,000,000 shares of Preferred Stock, $.0001 par value. As of September 5, 2006, there were 829,554 shares of Preferred Stock issued and outstanding.
The characteristics of our Preferred Stock have not been determined by our Board of Directors.
All of the stock owned by the selling security holders will be registered by the registration statement of which this prospectus is a part. The selling security holders may sell some or all of their shares immediately after they are registered. The selling security holders shares may be sold or distributed from time to time by the selling stockholders or by pledgees, donees or transferees of, or successors in interest to, the selling stockholders, directly to one or more purchasers (including pledgees) or through brokers, dealers or underwriters who may act solely as agents or may acquire shares as principals, at market prices prevailing at the time of sale, at prices related to such prevailing market prices, at negotiated prices or at fixed prices, which may be changed. The distribution of the shares may be effected in one or more of the following methods:
|
|
|
| * | ordinary brokers transactions, which may include long or short sales, |
77
|
|
|
| * | transactions involving cross or block trades on any securities exchange or market where our common stock is trading, |
| ||
| * | Purchases by brokers, dealers or underwriters as principal and resale by such purchasers for their own accounts pursuant to this prospectus, “at the market” to or through market makers or into an existing market for the common stock, |
| ||
| * | in other ways not involving market makers or established trading markets, including direct sales to purchasers or sales effected through agents, |
|
|
|
| * | through transactions in options, swaps or other derivatives (whether exchange listed or otherwise), or |
|
|
|
| * | any combination of the foregoing, or by any other legally available means. |
In addition, the selling stockholders may enter into hedging transactions with broker-dealers who may engage in short sales, if short sales were permitted, of shares in the course of hedging the positions they assume with the selling stockholders. The selling stockholders may also enter into option or other transactions with broker-dealers that require the delivery by such broker-dealers of the shares, which shares may be resold thereafter pursuant to this prospectus.
Brokers, dealers, underwriters or agents participating in the distribution of the shares may receive compensation in the form of discounts, concessions or commissions from the selling stockholders and/or the purchasers of shares for whom such broker-dealers may act as agent or to whom they may sell as principal, or both (which compensation as to a particular broker-dealer may be in excess of customary commissions). The selling stockholders and any broker-dealers acting in connection with the sale of the shares hereunder may be deemed to be underwriters within the meaning of Section 2(11) of the Securities Act of 1933, and any commissions received by them and any profit realized by them on the resale of shares as principals may be deemed underwriting compensation under the Securities Act of 1933. Neither the selling stockholders nor we can presently estimate the amount of such compensation. We know of no existing arrangements between the selling stockholders and any other stockholder, broker, dealer, underwriter or agent relating to the sale or distribution of the shares.
We will not receive any proceeds from the sale of the shares of the selling security holders pursuant to this prospectus. We have agreed to bear the expenses of the registration of the shares, including legal and accounting fees, and such expenses are estimated to be approximately $25,000.
We have informed the selling stockholders that certain anti-manipulative rules contained in Regulation M under the Securities Exchange Act of 1934 may apply to their sales in the market and have furnished the selling stockholders with a copy of such rules and have informed them of the need for delivery of copies of this prospectus. The selling stockholders may also use Rule 144 under the Securities Act of 1933 to sell the shares if they meet the criteria and conform to the requirements of such rule.
CERTAIN RELATIONSHIPS AND RELATED TRANSACTIONS
Millenia Hope Inc, majority shareholder of Millenia Hope Pharmaceuticals, undertook to issue a 6% stock dividend, to all Millenia Hope Shareholders of record July 3, 2006, constituting in aggregate 2,400,000 common shares of Millenia Hope Pharmaceuticals Inc. to its shareholders, numbering an excess of 2,000.
Other than as noted above, none of the directors, executive officers or any member of the immediate family of any director or executive officer has been indebted to us since its inception. We have not and do not intend to enter into any additional transactions with our management or any nominees for such positions. We have not and do not intend to enter into any transactions with our beneficial owners, with the exception of our parent company, Millenia Hope Inc.
78
CHANGES IN AND DISAGREEMENTS WITH ACCOUNTANTS ON
ACCOUNTING AND FINANCIAL DISCLOSURE
There have been no disagreements with Stark Winter Schenkein & Co., LLP, our independent auditors, on any matter of accounting principles or practices, financial statement disclosure, or auditing scope or procedure.
Our transfer agent will be Intercontinental Registrar & Transfer Agency, Inc. 900 Buchanan Blvd suite 1, Boulder City, Nevada, 89005. Their telephone number is (702) 293-6717.
The financial statements included in this prospectus have been audited by Stark Winter Schenkein & Co., LLP, independent auditors, as stated in their report appearing herein and elsewhere in the registration statement, which report expresses an unqualified opinion and has been so included in reliance upon the reports of such firm given upon their authority as experts in accounting and auditing.
The validity of our common shares offered will be passed upon for us by Anslow & Jaclin, LLP, Manalapan, New Jersey 07726.
79
FINANCIAL STATEMENTS
We have attached to this prospectus, copies of our audited financial statements for the years ended November 30, 2004 and November 30, 2005 and unaudited financial statements for the six month period ended May 31, 2006.
80
PROSPECTUS
YOU SHOULD RELY ONLY ON THE INFORMATION CONTAINED IN THIS DOCUMENT OR THAT WE HAVE REFERRED YOU TO. WE HAVE NOT AUTHORIZED ANYONE TO PROVIDE YOU WITH INFORMATION THAT IS DIFFERENT. THIS PROSPECTUS IS NOT AN OFFER TO SELL COMMON STOCK AND IS NOT SOLICITING AN OFFER TO BUY COMMON STOCK IN ANY STATE WHERE THE OFFER OR SALE IS NOT PERMITTED.
UNTIL __________, ALL DEALERS THAT EFFECT TRANSACTIONS IN THESE SECURITIES, WHETHER OR NOT PARTICIPATING IN THIS OFFERING, MAY BE REQUIRED TO DELIVER A PROSPECTUS. THIS IS IN ADDITION TO THE DEALERS’ OBLIGATION TO DELIVER A PROSPECTUS WHEN ACTING AS UNDERWRITERS AND WITH RESPECT TO THEIR UNSOLD ALLOTMENTS OR SUBSCRIPTIONS.
81
PART II
INFORMATION NOT REQUIRED IN PROSPECTUS
|
|
ITEM 24. | INDEMNIFICATION OF DIRECTORS, OFFICERS, EMPLOYEES AND AGENTS. |
Our Certificate of Incorporation and By-laws provide that we shall indemnify to the fullest extent permitted by Canadian law any person whom we may indemnify thereunder, including our directors, officers, employees and agents. Such indemnification (other than as ordered by a court) shall be made by us only upon a determination that indemnification is proper in the circumstances because the individual met the applicable standard of conduct i.e., such person acted in good faith and in a manner he reasonably believed to be in or not opposed to our best interest. Advances for such indemnification may be made pending such determination. Such determination shall be made by a majority vote of a quorum consisting of disinterested directors, or by independent legal counsel or by the stockholders. In addition, our Certificate of Incorporation provides for the elimination, to the extent permitted by Canada, of personal liability of our directors and our stockholders for monetary damages for breach of fiduciary duty as directors.
We have agreed to indemnify each of our directors and certain officers against certain liabilities, including liabilities under the Securities Act of 1933. Insofar as indemnification for liabilities arising under the Securities Act of 1933 may be permitted to our directors, officers and controlling persons pursuant to the provisions described above, or otherwise, we have been advised that in the opinion of the Securities and Exchange Commission such indemnification is against public policy as expressed in the Securities Act of 1933 and is, therefore, unenforceable. In the event that a claim for indemnification against such liabilities (other than our payment of expenses incurred or paid by our director, officer or controlling person in the successful defense of any action, suit or proceeding) is asserted by such director, officer or controlling person in connection with the securities being registered, we will, unless in the opinion of our counsel the matter has been settled by controlling precedent, submit to a court of appropriate jurisdiction the question whether such indemnification by it is against public policy as expressed in the Securities Act and will be governed by the final adjudication of such issue.
|
|
ITEM 25. | OTHER EXPENSES OF ISSUANCE AND DISTRIBUTION. |
The following table sets forth the expenses in connection with the issuance and distribution of the securities being registered hereby. All such expenses will be borne by the registrant; none shall be borne by any selling stockholders.
|
|
|
|
|
SEC registration fee |
| $ | 1,000 |
|
|
|
|
|
|
Legal fees and expenses (1) |
| $ | 8,000 |
|
|
|
|
|
|
Accounting fees and expenses (1) |
| $ | 5,000 |
|
|
|
|
|
|
Miscellaneous and Printing fees (1) |
| $ | 11,000 |
|
|
|
|
|
|
Total (1) |
| $ | 25,000 |
|
|
|
(1) | Estimated. |
|
|
ITEM 26. | RECENT SALES OF UNREGISTERED SECURITIES. |
On September 1, 2000 the Company entered into a subscription agreement and issued 10,000 common shares to Millenia Hope Inc., at its par value of $0.0001.
On February 14, 2002 the Company entered into a subscription agreement and issued 39,990,000 common shares to Millenia Hope Inc., as its par value of $0.0001.
82
All of the above issuances of shares of our common stock qualified for exemption under Section 4(2) of the Securities Act of 1933 since the issuance of such shares by us did not involve a public offering. Each of these shareholders was a sophisticated investor and had access to information regarding us. The offering was not a “public offering” as defined in Section 4(2) due to the insubstantial number of persons involved in the deal, size of the offering, manner of the offering and number of shares offered. We did not undertake an offering in which we sold a high number of shares to a high number of investors. In addition, these shareholders had the necessary investment intent as required by Section 4(2) since they agreed to and received a share certificate bearing a legend stating that such shares are restricted pursuant to Rule 144 of the 1933 Securities Act. These restrictions ensure that these shares would not be immediately redistributed into the market and therefore not be part of a “public offering.” Based on an analysis of the above factors, we have met the requirements to qualify for exemption under Section 4(2) of the Securities Act of 1933 for the above transactions.
|
|
ITEM 27. | EXHIBITS AND FINANCIAL STATEMENT SCHEDULES. |
(a) Exhibits:
The following exhibits are filed as part of this registration statement:
|
|
|
EXHIBIT |
| DESCRIPTION |
| ||
3.1 |
| Articles of Incorporation |
|
|
|
3.2 |
| By-Laws |
|
|
|
5.1 |
| Opinion and Consent of Anslow & Jaclin, LLP |
|
|
|
10.1 |
| Agreement with 9111-9080 Quebec Inc. |
|
|
|
10.2. |
| Employment Agreements with Dr. Jean Archambault, Dr. Bahige Baroudy, Dr. Robert Williams and Mr. Dany Aubry. |
|
|
|
23.1 |
| Consent of Stark Winter Schenkein & Co., LLP, Independent Registered Public Accounting Firm |
|
|
|
24.1 |
| Power of Attorney (included on signature page of Registration Statement) |
83
|
|
ITEM 28. | UNDERTAKINGS. |
|
|
(A) The undersigned Registrant hereby undertakes: | |
| |
|
|
(1) | To file, during any period in which offers or sales are being made, a post-effective amendment to this registration statement to: |
|
|
|
(i) |
| Include any prospectus required by Section 10(a)(3) of the Securities Act of 1933; |
|
| |
(ii) |
| Reflect in the prospectus any facts or events which, individually or together, represent a fundamental change in the information set forth in the registration statement. Notwithstanding the foregoing, any increase or decrease in volume of securities offered (if the total dollar value of securities offered would not exceed that which was registered) any deviation from the low or high end of the estimated maximum offering range may be reflected in the form of prospectus filed with the Commission pursuant to Rule 424(b) if, in the aggregate, the changes in volume and price represent no more than a 20% change in the maximum aggregate offering price set forth in the “Calculation of Registration Fee” table in the effective registration statement; and |
|
|
|
(iii) |
| Include any material information with respect to the plan of distribution not previously disclosed in the registration statement or any material change to such information in the registration statement. |
|
|
(2) | That, for the purpose of determining any liability under the Securities Act of 1933, each such post-effective amendment shall be deemed to be a new registration statement relating to the securities offered therein, and the offering therein, and the offering of such securities at that time shall be deemed to be the initial bona fide offering thereof. |
|
|
(3) | To remove from registration by means of a post-effective amendment any of the securities being registered which remain unsold at the termination of the offering. |
(B) Undertaking Required by Regulation S-B, Item 512(e).
Insofar as indemnification for liabilities arising under the Securities Act of 1933 may be permitted to directors, officers or controlling persons pursuant to the foregoing provisions, or otherwise, the Registrant has been advised that in the opinion of the Securities and Exchange Commission such indemnification is against public policy as expressed in the Securities Act of 1933 and is, therefore, unenforceable. In the event that a claim for indemnification against such liabilities (other than the payment by the Registrant of expenses incurred or paid by a director, officer or controlling person of the Registrant in the successful defense of any action, suit or proceeding) is asserted by such director, officer or controlling person in connection with the securities being registered, the Registrant will, unless in the opinion of its counsel that the matter has been settled by controlling precedent, submit to a court of appropriate jurisdiction the question whether such indemnification by it is against public policy as expressed in the Securities Act of 1933 and will be governed by the final adjudication of such issue.
(C) Undertaking Required by Regulation S-B, Item 512(f)
The undersigned Registrant hereby undertakes that, for purposes of determining any liability under the Securities Act of 1933, each filing of the Registrant’s annual report pursuant to Section 13(a) or 15(d) of the Exchange Act of 1934 that is incorporated by reference in the registration statement shall be deemed to be a new registration statement relating to the securities offered therein, and the offering of such securities at the time shall be deemed to be the initial bona fide offering thereof.
84
SIGNATURES
Pursuant to the requirements of the Securities Act of 1933, the registrant has duly caused this registration statement to be signed on its behalf by the undersigned, thereunto duly authorized, in the City of Montreal, Province of Quebec, Country of Canada, on the 6th day of September, 2006.
|
|
|
| MILLENIA HOPE PHARMACEUTICALS INC. | |
|
|
|
| By: | /S/ Leonard Stella |
|
| |
|
| Leonard Stella |
POWER OF ATTORNEY
The undersigned directors and officers of Millenia Hope Pharmaceuticals Inc. hereby constitute and appoint Leonard Stella, with full power to act without the other and with full power of substitution and resubstitution, our true and lawful attorneys-in-fact with full power to execute in our name and behalf in the capacities indicated below any and all amendments (including post-effective amendments and amendments thereto) to this registration statement under the Securities Act of 1933 and to file the same, with all exhibits thereto and other documents in connection therewith, with the Securities and Exchange Commission and hereby ratify and confirm each and every act and thing that such attorneys- in-fact, or any them, or their substitutes, shall lawfully do or cause to be done by virtue thereof.
Pursuant to the requirements of the Securities Act of 1933, this registration statement has been signed by the following persons in the capacities and on the dates indicated.
|
|
|
SIGNATURE | TITLE | DATE |
|
|
|
/S/ LEONARD STELLA. | CEO and Director | SEPTEMBER 6, 2006 |
|
| |
LEONARD STELLA |
|
|
|
|
|
/S/ BAHIGE BAROUDY. | Chief Science Officer and Director | SEPTEMBER 6, 2006 |
|
| |
BAHIGE BAROUDY |
|
|
|
|
|
/S/ JEAN ARCHABAULT | President, Chief Operating Officer and Director | SEPTEMBER 6, 2006 |
|
| |
JEAN ARCHAMBAULT |
|
|
|
|
|
/S/ DANY AUBRY | Chief Technical Officer and Director | SEPTEMBER 6, 2006 |
|
| |
DANY AUBRY |
|
|
|
|
|
/S/ ROBERT WILLIAMS | Chief Development Officer and Director | SEPTEMBER 6, 2006 |
|
| |
ROBERT WILLIAMS |
|
|
85
Report of Independent Registered Public Accounting Firm
To the Shareholder
Millenia Hope Pharmaceuticals, Inc.
We have audited the accompanying balance sheet of Millenia Hope Pharmaceuticals, Inc. as of November 30, 2004, and the related statements of operations, stockholder’s equity and cash flows for the year ended November 30, 2004. These financial statements are the responsibility of the Company’s management. Our responsibility is to express an opinion on these financial statements based on our audits.
We conducted our audits in accordance with the standards of the Public Company Accounting Oversight Board (United States). Those standards require that we plan and perform the audit to obtain reasonable assurance about whether the consolidated financial statements are free of material misstatement. An audit includes examining, on a test basis, evidence supporting the amounts and disclosures in the financial statements. An audit also includes assessing the accounting principles used and significant estimates made by management, as well as evaluating the overall financial statement presentation. We believe that our audits provide a reasonable basis for our opinion.
The accompanying financial statements have been prepared assuming that the Company will continue as a going concern. The financial statements show the Company has no revenues and relies upon its parent Company to fund its operations. This factor raises substantial doubt about the Company’s ability to continue as a going concern. The financial statements do not include any adjustments that might result from the outcome of this uncertainty.
In our opinion, the financial statements referred to above present fairly, in all material respects, the financial position of Millenia Hope Pharmaceuticals, Inc. as of November 30, 2004, and the results of its operations and cash flows for the years ended November 30, 2004, in conformity with accounting principles generally accepted in the United States of America.

Denver, Colorado
September 5, 2006
Millenia Hope Pharmaceuticals Inc.
Balance Sheet
November 30, 2004
|
|
|
|
|
Assets |
| |||
|
|
|
|
|
Current Assets |
|
|
|
|
Cash |
| $ | — |
|
|
|
| ||
|
|
|
|
|
Liabilities & Stockholders’ Equity |
| |||
|
|
|
|
|
Current Liabilities |
|
|
|
|
Accounts Payable and Accrued Liabilities |
| $ | 244 |
|
|
|
|
|
|
|
|
| ||
Total Current Liabilities |
|
| 244 |
|
|
|
| ||
|
|
|
|
|
Stockholders’ Equity |
|
|
|
|
Preferred Stock, $.0001 par value; 50,000,000 shares authorized, none issued or outstanding |
|
| — |
|
Common Stock, $.0001 par value; 280,000,000 shares authorized, 40,000,000 Issued and outstanding |
|
| 4,000 |
|
Stock Subscriptions Receivable |
|
| (4,000 | ) |
Paid in Capital |
|
| — |
|
Deficit |
|
| (244 | ) |
|
|
| ||
|
|
| (244 | ) |
|
|
| ||
|
|
|
|
|
|
| $ | — |
|
|
|
| ||
See the accompanying notes to the financial statements.
Millenia Hope Pharmaceuticals Inc.
Statements of Operations
Year ended November 30, 2004 and November 30, 2003, and
the Period From Inception (January 13, 2000) to November 30, 2004
|
|
|
|
|
|
|
|
|
|
|
|
| Year |
| Year |
| Inception to |
| |||
|
|
|
|
| ||||||
Revenues |
| $ | — |
| $ | — |
| $ | — |
|
|
|
|
|
|
|
|
|
|
|
|
Cost of Sales |
|
| — |
|
| — |
|
| — |
|
|
|
|
|
| ||||||
|
|
|
|
|
|
|
|
|
|
|
Gross Profit |
|
| — |
|
| — |
|
| — |
|
|
|
|
|
| ||||||
|
|
|
|
|
|
|
|
|
|
|
Operating Expenses |
|
|
|
|
|
|
|
|
|
|
Selling, general and administrative |
|
| 122 |
|
| 122 |
|
| 244 |
|
|
|
|
|
| ||||||
|
|
| 122 |
|
| 122 |
|
| 244 |
|
|
|
|
|
| ||||||
|
|
|
|
|
|
|
|
|
|
|
Operating (Loss) |
|
| (122 | ) |
| (122 | ) |
| (244 | ) |
|
|
|
|
|
|
|
|
|
|
|
Other income (expense) |
|
| — |
|
| — |
|
| — |
|
|
|
|
|
| ||||||
|
|
|
|
|
|
|
|
|
|
|
Net (Loss) |
| $ | (122 | ) | $ | (122 | ) | $ | (244 | ) |
|
|
|
|
| ||||||
|
|
|
|
|
|
|
|
|
|
|
Per share information - basic and diluted: |
|
|
|
|
|
|
|
|
|
|
Weighted Average Number of Common Shares Outstanding |
|
| 40,000,000 |
|
| 40,000,000 |
|
|
|
|
|
|
|
|
|
|
| ||||
|
|
|
|
|
|
|
|
|
|
|
Net (Loss) Per Common Share |
| $ | (0.00 | ) | $ | (0.00 | ) |
|
|
|
|
|
|
|
|
|
| ||||
See the accompanying notes to the financial statements.
Millenia Hope Pharmaceuticals, Inc.
(A Company in the Development Stage)
Statement of Stockholder’s Equity (Deficit)
January 13, 2000 (inception) to November 30, 2004
|
|
|
|
|
|
|
|
|
|
|
|
|
|
|
|
|
|
|
|
|
|
|
|
|
|
|
|
|
|
|
|
|
|
|
| Common Stock |
| Additional |
| (Deficit) |
| Total |
| ||||||||
|
| Common Stock |
| Preferred Stock |
|
|
|
| |||||||||||||||||
|
|
|
|
|
|
| |||||||||||||||||||
|
| Shares |
| Amount |
| Shares |
| Amount |
|
|
|
|
| ||||||||||||
|
| ||||||||||||||||||||||||
Balance, January 13, 2000 |
|
| — |
| $ | — |
|
| — |
| $ | — |
| $ | — |
| $ | — |
| $ | — |
| $ | — |
|
|
|
|
|
|
|
|
|
|
|
|
|
|
|
|
|
|
|
|
|
|
|
|
|
|
|
Stock issued for subscription |
|
| 10,000 |
|
| 1 |
|
| — |
|
| — |
|
| (1 | ) |
| — |
|
| — |
|
| — |
|
|
|
|
|
|
|
|
|
|
|
|
|
|
|
|
|
|
|
|
|
|
|
|
|
|
|
Net (loss) |
|
| — |
|
| — |
|
| — |
|
| — |
|
| — |
|
| — |
|
| — |
|
| — |
|
|
| ||||||||||||||||||||||||
|
|
|
|
|
|
|
|
|
|
|
|
|
|
|
|
|
|
|
|
|
|
|
|
|
|
Balance at November 30, 2000 |
|
| 10,000 |
|
| 1 |
|
| — |
|
| — |
|
| (1 | ) |
| — |
|
| — |
|
| — |
|
|
|
|
|
|
|
|
|
|
|
|
|
|
|
|
|
|
|
|
|
|
|
|
|
|
|
Net (loss) |
|
| — |
|
| — |
|
| — |
|
| — |
|
| — |
|
| — |
|
| — |
|
| — |
|
|
| ||||||||||||||||||||||||
|
|
|
|
|
|
|
|
|
|
|
|
|
|
|
|
|
|
|
|
|
|
|
|
|
|
Balance at November 30, 2001 |
|
| 10,000 |
|
| 1 |
|
| — |
|
| — |
|
| (1 | ) |
| — |
|
| — |
|
| — |
|
|
|
|
|
|
|
|
|
|
|
|
|
|
|
|
|
|
|
|
|
|
|
|
|
|
|
Stock issued for subscription |
|
| 39,990,000 |
|
| 3,999 |
|
| — |
|
| — |
|
| (3,999 | ) |
| — |
|
| — |
|
| — |
|
|
|
|
|
|
|
|
|
|
|
|
|
|
|
|
|
|
|
|
|
|
|
|
|
|
|
Net (loss) |
|
| — |
|
| — |
|
| — |
|
| — |
|
| — |
|
| — |
|
| — |
|
| — |
|
|
| ||||||||||||||||||||||||
|
|
|
|
|
|
|
|
|
|
|
|
|
|
|
|
|
|
|
|
|
|
|
|
|
|
Balance at November 30, 2002 |
|
| 40,000,000 |
|
| 4,000 |
|
| — |
|
| — |
|
| (4,000 | ) |
| — |
|
| — |
|
| — |
|
|
|
|
|
|
|
|
|
|
|
|
|
|
|
|
|
|
|
|
|
|
|
|
|
|
|
Net (loss) |
|
| — |
|
| — |
|
| — |
|
| — |
|
| — |
|
| — |
|
| (122 | ) |
| (122 | ) |
|
| ||||||||||||||||||||||||
|
|
|
|
|
|
|
|
|
|
|
|
|
|
|
|
|
|
|
|
|
|
|
|
|
|
Balance at November 30, 2003 |
|
| 40,000,000 |
|
| 4,000 |
|
| — |
|
| — |
|
| (4,000 | ) |
| — |
|
| (122 | ) |
| (122 | ) |
|
|
|
|
|
|
|
|
|
|
|
|
|
|
|
|
|
|
|
|
|
|
|
|
|
|
Net (loss) |
|
| — |
|
| — |
|
| — |
|
| — |
|
| — |
|
| — |
|
| (122 | ) |
| (122 | ) |
|
| ||||||||||||||||||||||||
|
|
|
|
|
|
|
|
|
|
|
|
|
|
|
|
|
|
|
|
|
|
|
|
|
|
Balance at November 30, 2004 |
|
| 40,000,000 |
|
| 4,000 |
|
| — |
|
| — |
|
| (4,000 | ) |
| — |
|
| (244 | ) |
| (244 | ) |
|
| ||||||||||||||||||||||||
Millenia Hope Pharmaceuticals Inc.
Statements of Cash Flows
Year ended November 30, 2004 and November 30, 2003, and
the Period From Inception (January 13, 2000) to November 30, 2004
|
|
|
|
|
|
|
|
|
|
|
|
| Year |
| Year |
| Inception to |
| |||
|
|
|
|
| ||||||
Operating Activities |
|
|
|
|
|
|
|
|
|
|
Net (loss) |
| $ | (122 | ) | $ | (122 | ) | $ | (244 | ) |
Changes in: |
|
|
|
|
|
|
|
|
|
|
Accounts payable |
|
| 122 |
|
| 122 |
|
| 244 |
|
|
|
|
|
| ||||||
Cash (used in) operating activities |
|
| — |
|
| — |
|
| — |
|
|
|
|
|
| ||||||
|
|
|
|
|
|
|
|
|
|
|
Financing Activities |
|
|
|
|
|
|
|
|
|
|
Cash provided by financing activities |
|
| — |
|
| — |
|
| — |
|
|
|
|
|
| ||||||
|
|
|
|
|
|
|
|
|
|
|
Investing activities |
|
|
|
|
|
|
|
|
|
|
Cash provided by investing activities |
|
| — |
|
| — |
|
| — |
|
|
|
|
|
| ||||||
|
|
|
|
|
|
|
|
|
|
|
Increase (decrease) in cash |
|
| — |
|
| — |
|
| — |
|
|
|
|
|
|
|
|
|
|
|
|
Cash and cash equivalents |
|
|
|
|
|
|
|
|
|
|
Beginning of year |
|
| — |
|
| — |
|
| — |
|
|
|
|
|
| ||||||
|
|
|
|
|
|
|
|
|
|
|
End of year |
| $ | — |
| $ | — |
| $ | — |
|
|
|
|
|
| ||||||
|
|
|
|
|
|
|
|
|
|
|
Cash paid for interest |
| $ | — |
| $ | — |
| $ | — |
|
|
|
|
|
| ||||||
Cash paid for taxes |
| $ | — |
| $ | — |
| $ | — |
|
|
|
|
|
| ||||||
|
|
|
|
|
|
|
|
|
|
|
Supplemental schedule of noncash investing and financing activities: |
|
|
|
|
|
|
|
|
|
|
|
|
|
|
|
|
|
|
|
|
|
Stock subscription receivable |
| $ | — |
| $ | — |
| $ | 4,000 |
|
|
|
|
|
| ||||||
Report of Independent Registered Public Accounting Firm
To the Shareholder
Millenia Hope Pharmaceuticals, Inc.
We have audited the accompanying balance sheet of Millenia Hope Pharmaceuticals, Inc. as of November 30, 2005, and the related statements of operations, stockholder’s equity and cash flows for the years ended November 30, 2005 and 2004. These financial statements are the responsibility of the Company’s management. Our responsibility is to express an opinion on these financial statements based on our audits.
We conducted our audits in accordance with the standards of the Public Company Accounting Oversight Board (United States). Those standards require that we plan and perform the audit to obtain reasonable assurance about whether the consolidated financial statements are free of material misstatement. An audit includes examining, on a test basis, evidence supporting the amounts and disclosures in the financial statements. An audit also includes assessing the accounting principles used and significant estimates made by management, as well as evaluating the overall financial statement presentation. We believe that our audits provide a reasonable basis for our opinion.
The accompanying financial statements have been prepared assuming that the Company will continue as a going concern. The financial statements show the Company has no revenues and relies upon its parent Company to fund its operations. This factor raises substantial doubt about the Company’s ability to continue as a going concern. The financial statements do not include any adjustments that might result from the outcome of this uncertainty.
In our opinion, the financial statements referred to above present fairly, in all material respects, the financial position of Millenia Hope Pharmaceuticals, Inc. as of November 30, 2005, and the results of its operations and cash flows for the years ended November 30, 2005 and 2004, in conformity with accounting principles generally accepted in the United States of America.
Denver, Colorado
September 5, 2006
Millenia Hope Pharmaceuticals Inc.
(A Company in the Development Stage)
Balance Sheet
November 30, 2005
Assets
|
|
|
|
|
Current Assets |
|
|
|
|
Cash |
| $ | — |
|
|
|
| ||
|
|
|
|
|
Liabilities & Stockholder’s Equity |
|
|
|
|
|
|
|
|
|
Current Liabilities |
| $ | — |
|
|
|
| ||
|
|
|
|
|
Stockholder’s Equity |
|
|
|
|
Preferred Stock, $.0001 par value; 50,000,000 shares authorized, none issued or outstanding |
|
| — |
|
Common Stock, $.0001 par value; 280,000,000 shares authorized, 40,000,000 issued and outstanding |
|
| 4,000 |
|
Common Stock Subscribed |
|
| (3,458 | ) |
(Deficit) accumulated during the development stage |
|
| (542 | ) |
|
|
| ||
|
|
| — |
|
|
|
| ||
|
|
|
|
|
|
| $ | — |
|
|
|
|
See the accompanying notes to the financial statements.
3
Millenia Hope Pharmaceuticals Inc.
(A Company in the Development Stage)
Statements of Operations
|
|
|
|
|
|
|
|
|
|
|
|
| Year |
| Year |
| Inception |
| |||
|
|
|
|
| ||||||
|
|
|
|
|
|
|
|
|
|
|
Revenues |
| $ | — |
| $ | — |
| $ | — |
|
|
|
|
|
| ||||||
|
|
|
|
|
|
|
|
|
|
|
Operating Expenses |
|
|
|
|
|
|
|
|
|
|
Selling, General and Administrative |
|
| 298 |
|
| 122 |
|
| 542 |
|
|
|
|
|
| ||||||
|
|
| 298 |
|
| 122 |
|
| 542 |
|
|
|
|
|
| ||||||
|
|
|
|
|
|
|
|
|
|
|
Operating (Loss) |
|
| (298 | ) |
| (122 | ) |
| (542 | ) |
|
|
|
|
|
|
|
|
|
|
|
Other Income (Expense) |
|
| — |
|
| — |
|
| — |
|
|
|
|
|
| ||||||
|
|
|
|
|
|
|
|
|
|
|
Net (Loss) |
| $ | (298 | ) | $ | (122 | ) | $ | (542 | ) |
|
|
|
|
| ||||||
|
|
|
|
|
|
|
|
|
|
|
Per Share Information - Basic and Diluted: |
|
|
|
|
|
|
|
|
|
|
Weighted Average Number of Common Shares Outstanding |
|
| 40,000,000 |
|
| 40,000,000 |
|
|
|
|
|
|
|
|
|
|
| ||||
|
|
|
|
|
|
|
|
|
|
|
(Loss) Per Common Share |
| $ | (0.00 | ) | $ | (0.00 | ) |
|
|
|
|
|
|
|
|
|
| ||||
See the accompanying notes to the financial statements.
4
Millenia Hope Pharmaceuticals, Inc.
(A Company in the Development Stage)
Statement of Stockholder’s Equity (Deficit)
January 13, 2000 (inception) to November 30, 2005
|
|
|
|
|
|
|
|
|
|
|
|
|
|
|
|
|
|
|
|
|
|
|
|
|
|
|
|
|
|
|
|
|
|
|
|
|
|
|
| Common Stock |
|
|
|
| (Deficit) |
|
|
|
| ||
|
|
|
|
|
|
|
|
|
|
|
|
|
|
| Additional |
|
|
|
|
| |||||
|
| Common Stock |
| Preferred Stock |
|
|
|
| Total |
| |||||||||||||||
|
|
|
|
|
|
|
| ||||||||||||||||||
|
| Shares |
| Amount |
| Shares |
| Amount |
|
|
|
|
| ||||||||||||
|
| ||||||||||||||||||||||||
Balance, January 13, 2000 |
|
| — |
| $ | — |
|
| — |
| $ | — |
| $ | — |
| $ | — |
| $ | — |
| $ | — |
|
|
|
|
|
|
|
|
|
|
|
|
|
|
|
|
|
|
|
|
|
|
|
|
|
|
|
Stock issued for subscription |
|
| 10,000 |
|
| 1 |
|
| — |
|
| — |
|
| (1 | ) |
| — |
|
| — |
|
| — |
|
|
|
|
|
|
|
|
|
|
|
|
|
|
|
|
|
|
|
|
|
|
|
|
|
|
|
Net (loss) |
|
| — |
|
| — |
|
| — |
|
| — |
|
| — |
|
| — |
|
| — |
|
| — |
|
|
| ||||||||||||||||||||||||
|
|
|
|
|
|
|
|
|
|
|
|
|
|
|
|
|
|
|
|
|
|
|
|
|
|
Balance at November 30, 2000 |
|
| 10,000 |
|
| 1 |
|
| — |
|
| — |
|
| (1 | ) |
| — |
|
| — |
|
| — |
|
|
|
|
|
|
|
|
|
|
|
|
|
|
|
|
|
|
|
|
|
|
|
|
|
|
|
Net (loss) |
|
| — |
|
| — |
|
| — |
|
| — |
|
| — |
|
| — |
|
| — |
|
| — |
|
|
| ||||||||||||||||||||||||
|
|
|
|
|
|
|
|
|
|
|
|
|
|
|
|
|
|
|
|
|
|
|
|
|
|
Balance at November 30, 2001 |
|
| 10,000 |
|
| 1 |
|
| — |
|
| — |
|
| (1 | ) |
| — |
|
| — |
|
| — |
|
|
|
|
|
|
|
|
|
|
|
|
|
|
|
|
|
|
|
|
|
|
|
|
|
|
|
Stock issued for subscription |
|
| 39,990,000 |
|
| 3,999 |
|
| — |
|
| — |
|
| (3,999 | ) |
| — |
|
| — |
|
| — |
|
|
|
|
|
|
|
|
|
|
|
|
|
|
|
|
|
|
|
|
|
|
|
|
|
|
|
Net (loss) |
|
| — |
|
| — |
|
| — |
|
| — |
|
| — |
|
| — |
|
| — |
|
| — |
|
|
| ||||||||||||||||||||||||
|
|
|
|
|
|
|
|
|
|
|
|
|
|
|
|
|
|
|
|
|
|
|
|
|
|
Balance at November 30, 2002 |
|
| 40,000,000 |
|
| 4,000 |
|
| — |
|
| — |
|
| (4,000 | ) |
| — |
|
| — |
|
| — |
|
|
|
|
|
|
|
|
|
|
|
|
|
|
|
|
|
|
|
|
|
|
|
|
|
|
|
Net (loss) |
|
| — |
|
| — |
|
| — |
|
| — |
|
| — |
|
| — |
|
| (122 | ) |
| (122 | ) |
|
| ||||||||||||||||||||||||
|
|
|
|
|
|
|
|
|
|
|
|
|
|
|
|
|
|
|
|
|
|
|
|
|
|
Balance at November 30, 2003 |
|
| 40,000,000 |
|
| 4,000 |
|
| — |
|
| — |
|
| (4,000 | ) |
| — |
|
| (122 | ) |
| (122 | ) |
|
|
|
|
|
|
|
|
|
|
|
|
|
|
|
|
|
|
|
|
|
|
|
|
|
|
Net (loss) |
|
| — |
|
| — |
|
| — |
|
| — |
|
| — |
|
| — |
|
| (122 | ) |
| (122 | ) |
|
| ||||||||||||||||||||||||
|
|
|
|
|
|
|
|
|
|
|
|
|
|
|
|
|
|
|
|
|
|
|
|
|
|
Balance at November 30, 2004 |
|
| 40,000,000 |
|
| 4,000 |
|
| — |
|
| — |
|
| (4,000 | ) |
| — |
|
| (244 | ) |
| (244 | ) |
|
|
|
|
|
|
|
|
|
|
|
|
|
|
|
|
|
|
|
|
|
|
|
|
|
|
Operating expenses paid for by parent |
|
| — |
|
| — |
|
| — |
|
| — |
|
| 542 |
|
| — |
|
| — |
|
| 542 |
|
|
|
|
|
|
|
|
|
|
|
|
|
|
|
|
|
|
|
|
|
|
|
|
|
|
|
Net (loss) |
|
| — |
|
| — |
|
| — |
|
| — |
|
| — |
|
| — |
|
| (298 | ) |
| (298 | ) |
|
| ||||||||||||||||||||||||
|
|
|
|
|
|
|
|
|
|
|
|
|
|
|
|
|
|
|
|
|
|
|
|
|
|
Balance at November 30, 2005 |
|
| 40,000,000 |
| $ | 4,000 |
| $ | — |
| $ | — |
| $ | (3,458 | ) | $ | — |
| $ | (542 | ) | $ | — |
|
|
| ||||||||||||||||||||||||
See accompanying notes to the financial statements.
5
Millenia Hope Pharmaceuticals Inc.
(A Company in the Development Stage)
Statements of Cash Flows
|
|
|
|
|
|
|
|
|
|
|
|
| Year |
| Year |
| Inception |
| |||
|
|
|
|
| ||||||
Operating Activities |
|
|
|
|
|
|
|
|
|
|
Net (loss) |
| $ | (298 | ) | $ | (122 | ) | $ | (542 | ) |
Expenses paid for by parent |
|
| 542 |
|
|
|
|
| 542 |
|
Changes in: |
|
|
|
|
|
|
|
|
|
|
Accounts payable |
|
| (244 | ) |
| 122 |
|
| — |
|
|
|
|
|
| ||||||
Cash (used in) operating activities |
|
| — |
|
| — |
|
| — |
|
|
|
|
|
| ||||||
|
|
|
|
|
|
|
|
|
|
|
Financing Activities |
|
|
|
|
|
|
|
|
|
|
Cash provided by financing activities |
|
| — |
|
| — |
|
| — |
|
|
|
|
|
| ||||||
|
|
|
|
|
|
|
|
|
|
|
Investing activities |
|
|
|
|
|
|
|
|
|
|
Cash provided by investing activities |
|
| — |
|
| — |
|
| — |
|
|
|
|
|
| ||||||
|
|
|
|
|
|
|
|
|
|
|
Increase (decrease) in cash |
|
| — |
|
| — |
|
| — |
|
|
|
|
|
|
|
|
|
|
|
|
Cash and cash equivalents |
|
|
|
|
|
|
|
|
|
|
Beginning of period |
|
| — |
|
| — |
|
| — |
|
|
|
|
|
| ||||||
|
|
|
|
|
|
|
|
|
|
|
End of period |
| $ | — |
| $ | — |
| $ | — |
|
|
|
|
|
| ||||||
|
|
|
|
|
|
|
|
|
|
|
Cash paid for interest |
| $ | — |
| $ | — |
| $ | — |
|
|
|
|
|
| ||||||
Cash paid for taxes |
| $ | — |
| $ | — |
| $ | — |
|
|
|
|
|
| ||||||
|
|
|
|
|
|
|
|
|
|
|
See the accompanying notes to the financial statements.
6
Millenia Hope Pharmaceuticals Inc.
(A Company in the Development Stage)
Notes to Financial Statements
November 30, 2005
|
|
1. | Organization and Basis of Presentation |
|
|
| Millenia Hope Pharmaceuticals Inc. (the “Company”) was incorporated in the Canada under the Canadian Business Corporations Act on January 13, 2000. Through its patented proprietary Phytomics Technologies, the Company focuses on exploiting major advancements in accessing one of the most productive sources of biologically active compounds, plants, to discover, develop and produce new products for human health and well being. The Company commenced its commercial activity on February 14, 2006. |
|
|
2. | Summary of Significant Accounting Policies |
|
|
| Use of Estimates |
|
|
| The preparation of financial statements in conformity with generally accepted accounting principles in the United States requires management to make estimates and assumptions that affect the reported amounts of assets and liabilities, and disclosure of contingent assets and liabilities at the date of the financial statements, and the reported amounts of revenues and expenses during the reporting period. Certain amounts included in the financial statements are estimated based on currently available information and management’s judgement as to the outcome of future conditions and circumstances. |
|
|
| Changes in the status of certain facts or circumstances could result in material changes to the estimates used in the preparation of financial statements and actual results could differ from the estimates and assumptions. |
|
|
| Fair Value of Financial Instruments |
|
|
| Fair value estimates discussed herein are based upon certain market assumptions and pertinent information available to management as of November 30, 2005. The respective carrying value of certain on-balance-sheet financial instruments approximated their fair values. These financial instruments include cash, and accounts payable. Fair values were assumed to approximate carrying values for financial instruments because they are short term in nature, their carrying amounts approximate fair values, and they are payable on demand. |
|
|
| Cash and Cash Equivalents |
|
|
| The Company considers all highly liquid investments with original maturities of ninety days or less and bank indebtedness to be cash and cash equivalents. |
|
|
| Revenue Recognition |
|
|
| The Company records revenue when persuasive evidence of an arrangement exists, services have been rendered or product delivery has occurred, the sales price to the customer is fixed or determinable, and collectibility is reasonably assured. |
-1-
Millenia Hope Pharmaceuticals Inc.
(A Company in the Development Stage)
Notes to Financial Statements
November 30, 2005
|
|
|
|
| Earnings (Loss) Per Share | ||
|
|
|
|
| The Company follows Statement of Financial Accounting Standards (“SFAS”) 128, “Earnings Per Share.” Basic earnings (loss) per common share (“EPS”) calculations are determined by dividing net income (loss) by the weighted average number of shares of common stock outstanding during the year. Diluted earnings per common share calculations are determined by dividing net income (loss) by the weighted average number of common shares and dilutive common share equivalents outstanding. During the periods presented common stock equivalents were not considered, as their effect would be anti-dilutive. | ||
|
|
|
|
| Recent Accounting Pronouncements | ||
|
|
|
|
| In March 2006, Financial Accounting Standards Board (FASB) issued Statement of Financial Accounting Standards (SFAS) No. 156, “Accounting for Servicing of Financial Assets—an amendment of FASB Statement No. 140,” with respect to the accounting for separately recognized servicing assets and servicing liabilities. This Statement: | ||
|
|
|
|
|
| 1. | Requires an entity to recognize a servicing asset or servicing liability each time it undertakes an obligation to service a financial asset by entering into a servicing contract in certain situations. |
|
|
|
|
|
| 2. | Requires all separately recognized servicing assets and servicing liabilities to be initially measured at fair value, if practicable. |
|
|
|
|
|
| 3. | Permits an entity to choose either the amortization method or the fair value measurement method for each class of separately recognized servicing assets and servicing liabilities. |
|
|
|
|
|
| 4. | At its initial adoption, permits a one-time reclassification of available-for-sale securities to trading securities by entities with recognized servicing rights, without calling into question the treatment of other available-for-sale securities under SFAS No. 115, provided that the available-for-sale securities are identified in some manner as offsetting the entity’s exposure to changes in fair value of servicing assets or servicing liabilities that a servicer elects to subsequently measure at fair value. |
|
|
|
|
|
| 5. | Requires separate presentation of servicing assets and servicing liabilities subsequently measured at fair value in the statement of financial position and additional disclosures for all separately recognized servicing assets and servicing liabilities. |
|
|
|
|
| Adoption of this Statement is required as of the beginning of the first fiscal year that begins after September 15, 2006. The adoption of this statement is not expected to have a material impact on the Company’s financial statements. | ||
|
|
|
|
| In February 2006, the FASB issues SFAS No. 155, “Accounting for Certain Hybrid Financial Instruments—an amendment of FASB Statements No. 133 and 140.” This amends SFAS No. 133, “Accounting for Derivative Instruments and Hedging Activities,” and No. 140, “Accounting for Transfers and Servicing of Financial Assets and Extinguishments of Liabilities.” This Statement resolves issues addressed in SFAS No. 133 Implementation Issue No. D1, “Application of Statement 133 to Beneficial Interests in Securitized Financial Assets.” | ||
-2-
Millenia Hope Pharmaceuticals Inc.
(A Company in the Development Stage)
Notes to Financial Statements
November 30, 2005
|
|
|
|
| This Statement: | ||
|
|
|
|
|
| a. | Permits fair value remeasurement for any hybrid financial instrument that contains an embedded derivative that otherwise would require bifurcation |
|
|
|
|
|
| b. | Clarifies which interest-only strips and principal-only strips are not subject to the requirements of SFAS No. 133 |
|
|
|
|
|
| c. | Establishes a requirement to evaluate interests in securitized financial assets to identify interests that are freestanding derivatives or that are hybrid financial instruments that contain an embedded derivative requiring bifurcation |
|
|
|
|
|
| d. | Clarifies that concentrations of credit risk in the form of subordination are not embedded derivatives |
|
|
|
|
|
| e. | Amends SFAS No. 140 to eliminate the prohibition on a qualifying special-purpose entity from holding a derivative financial instrument that pertains to a beneficial interest other than another derivative financial instrument. |
|
|
|
|
| This Statement is effective for all financial instruments acquired or issued after the first fiscal year that begins after September 15, 2006. | ||
|
|
|
|
| The fair value election provided for in paragraph 4(c) of this Statement may also be applied upon adoption of this Statement for hybrid financial instruments that had been bifurcated under paragraph 12 of SFAS No. 133 prior to the adoption of this Statement. Earlier adoption is permitted as of the beginning of our fiscal year, provided we have not yet issued financial statements, including financial statements for any interim period, for that fiscal year. Provisions of this Statement may be applied to instruments that we hold at the date of adoption on an instrument-by-instrument basis. | ||
|
|
|
|
| The Company is currently reviewing the effects of adoption of this statement but it is not expected to have a material impact on its financial statements. | ||
|
|
|
|
| In May 2005, the FASB issued SFAS No. 154, “Accounting Changes and Error Corrections--a replacement of APB Opinion No. 20 and FASB Statement No. 3.” This Statement replaces APB Opinion No. 20, “Accounting Changes,” and SFAS No. 3, “Reporting Accounting Changes in Interim Financial Statements,” and changes the requirements for the accounting for, and reporting of, a change in accounting principle. This Statement applies to all voluntary changes in accounting principle. It also applies to changes required by an accounting pronouncement in the unusual instance that the pronouncement does not include specific transition provisions. When a pronouncement includes specific transition provisions, those provisions should be followed. | ||
|
|
|
|
| SFAS No. 154 is effective for accounting changes and corrections of errors made in fiscal years beginning after December 15, 2005. It will only affect the financial statements of the Company if there is a change any accounting principle. At this time, no such changes are contemplated or anticipated. | ||
|
|
|
|
| In December 2004, the FASB issued SFAS No. 123(R), “Share-Based Payments.” SFAS No. 123 (R) requires all entities to recognize compensation expense in an amount equal to the fair value of share-based payments such as stock options granted to employees. SFAS No. 123 (R) is effective for the first reporting period beginning after December 15, 2005. The adoption of FAS 123 (R) did not have a material impact on the financial statements. | ||
|
|
|
|
-3-
Millenia Hope Pharmaceuticals Inc.
(A Company in the Development Stage)
Notes to Financial Statements
November 30, 2005
|
|
|
|
3. | Income Taxes | ||
|
|
| The Company accounts for income taxes under SFAS 109, which requires use of the liability method. SFAS 109 provides that deferred tax assets and liabilities are recorded based on the differences between the tax bases of assets and liabilities and their carrying amounts for financial reporting purposes, referred to as temporary differences. Deferred tax assets and liabilities at the end of each period are determined using the currently enacted tax rates applied to taxable income in the periods in which the deferred tax assets and liabilities are expected to be settled or realized. |
|
|
4. | Stockholders’ Equity |
|
|
| Common Stock |
|
|
| On September 1, 2000 the Company entered into a subscription agreement and issued 10,000 shares of its $0.0001 par value common stock at $.0001 per share. |
|
|
| On February 14, 2002 the Company entered into a subscription agreement and issued 39,990,000 shares of its $0.0001 par value common stock at $.0001 per share. |
|
|
| All of the shares were issued to the parent company, Millenia Hope, Inc. |
|
|
5. | Related Party Transactions |
|
|
| During the years ended November 30, 2005 and 2004, the sole shareholder paid expenses of the Company in the amounts of $298 and $122, respectively. The Company reflected these payments as reductions in the Common Stock Subscribed account. For the period, inception (January 13, 2000) to November 30, 2005, the shareholder paid a total of $542 of such expenses. |
|
|
6. | Subsequent Events |
|
|
| On February 14, 2006, the Company obtained a cash advance from their parent company, Millenia Hope, Inc., and purchased research equipment and intellectual property from Avance Pharma, an unrelated third party, for $526,070. |
|
|
| On June 5, 2006, the Board of Directors of the parent company authorized the payment of a dividend to all shareholders of the parent company of record on July 3, 2006. The dividend consists of 6% of the issued shares of the Company, or a total of 2,400,000 shares, of the shares held by the parent. The effect of this transaction is to decrease the ownership by the parent company by 2,400,000 shares and increase the number of shareholders to approximately 2,000. |
|
|
| On April 11, 2006, the Company entered into an agreement with Pierre Fabre, a French pharmaceutical company. During the period ended May 31, 2006, the Company received an initial revenue payment from Pierre Fabre of $150,325. |
-4-
Millenia Hope Pharmaceuticals Inc.
(A Development Stage Enterprise)
Balance Sheet
May 31, 2006
(Unaudited)
|
|
|
|
|
Assets |
|
|
|
|
Current Assets |
|
|
|
|
Cash |
| $ | 3 |
|
Deposits |
|
| 900 |
|
Consumption taxes receivable |
|
| 67,155 |
|
|
|
| ||
Total Current Assets |
|
| 68,058 |
|
|
|
| ||
|
|
|
|
|
Property and equipment, net |
|
| 499,957 |
|
|
|
| ||
|
|
|
|
|
|
| $ | 568,015 |
|
|
|
| ||
|
|
|
|
|
Liabilities & Stockholders’ Equity |
|
|
|
|
Current Liabilities |
|
|
|
|
Accounts payable and accrued liabilities |
| $ | 41,513 |
|
Due to parent company |
|
| 12,985 |
|
|
|
| ||
Total Current Liabilities |
|
| 54,498 |
|
|
|
| ||
|
|
|
|
|
|
|
|
|
|
Stockholders’ Equity |
|
|
|
|
Preferred Stock, 6% cumulative, $.0001 par value; 50,000,000 shares authorized, 829,554 issued and outstanding |
|
| 829,554 |
|
Common Stock, $.0001 par value; 280,000,000 shares authorized, 40,000,000 issued and outstanding |
|
| 4,000 |
|
(Deficit) accumulated during the development stage |
|
| (320,037 | ) |
|
|
| ||
|
|
| 513,517 |
|
|
|
| ||
|
|
|
|
|
|
| $ | 568,015 |
|
|
|
|
See the accompanying notes to the financial statements.
Millenia Hope Pharmaceuticals Inc.
(A Development Stage Enterprise)
Statements of Operations
(Unaudited)
|
|
|
|
|
|
|
|
|
|
|
|
|
|
|
|
|
|
| Three months |
| Three months |
| Six months |
| Six months |
| Inception |
| |||||
|
|
|
|
|
|
| ||||||||||
|
|
|
|
|
|
|
|
|
|
|
|
|
|
|
|
|
Revenues |
| $ | 150,325 |
| $ | — |
| $ | 231,785 |
| $ | — |
| $ | 231,785 |
|
|
|
|
|
|
|
| ||||||||||
|
|
|
|
|
|
|
|
|
|
|
|
|
|
|
|
|
Operating Expenses |
|
|
|
|
|
|
|
|
|
|
|
|
|
|
|
|
Biotech wages |
|
| 143,926 |
|
| — |
|
| 165,902 |
|
| — |
|
| 165,902 |
|
Administrative salaries |
|
| — |
|
| — |
|
| — |
|
| — |
|
| — |
|
Marketing |
|
| 10,836 |
|
| — |
|
| 10,836 |
|
| — |
|
| 10,836 |
|
Research and development |
|
| 55,080 |
|
| — |
|
| 55,080 |
|
| — |
|
| 55,080 |
|
Selling, general and administrative |
|
| 291,993 |
|
| — |
|
| 307,019 |
|
| — |
|
| 307,561 |
|
|
|
|
|
|
|
| ||||||||||
|
|
| 501,835 |
|
| — |
|
| 538,837 |
|
| — |
|
| 539,379 |
|
|
|
|
|
|
|
| ||||||||||
Operating (loss) |
|
| (351,510 | ) |
| — |
|
| (307,052 | ) |
| — |
|
| (307,594 | ) |
|
|
|
|
|
|
| ||||||||||
|
|
|
|
|
|
|
|
|
|
|
|
|
|
|
|
|
Other income (expense) |
|
|
|
|
|
|
|
|
|
|
|
|
|
|
|
|
Interest expense |
|
| — |
|
| — |
|
| (12,443 | ) |
| — |
|
| (12,443 | ) |
|
|
|
|
|
|
| ||||||||||
|
|
| — |
|
| — |
|
| (12,443 | ) |
| — |
|
| (12,443 | ) |
|
|
|
|
|
|
| ||||||||||
Net (loss) |
| $ | (351,510 | ) | $ | — |
| $ | (319,495 | ) | $ | — |
| $ | (320,037 | ) |
|
|
|
|
|
|
| ||||||||||
|
|
|
|
|
|
|
|
|
|
|
|
|
|
|
|
|
|
|
|
|
|
|
|
|
|
|
|
|
|
|
|
|
|
Per share information - basic and diluted: |
|
|
|
|
|
|
|
|
|
|
|
|
|
|
|
|
Weighted Average Number of Common shares outstanding |
|
| 40,000,000 |
|
| 40,000,000 |
|
| 40,000,000 |
|
| 40,000,000 |
|
|
|
|
|
|
|
|
|
|
|
|
| ||||||||
|
|
|
|
|
|
|
|
|
|
|
|
|
|
|
|
|
Net (Loss) Per Common Share |
| $ | — |
| $ | — |
| $ | — |
| $ | — |
|
|
|
|
|
|
|
|
|
|
|
|
| ||||||||
See the accompanying notes to the financial statements.
Millenia Hope Pharmaceuticlas Inc.
(A Development Stage Enterprise)
Statements of Cash Flows
(Unaudited)
|
|
|
|
|
|
|
|
|
|
|
|
| Six months |
| Six months |
| Inception |
| |||
|
|
|
|
| ||||||
Operating Activities |
|
|
|
|
|
|
|
|
|
|
Cash (used in) operating activities |
| $ | (319,724 | ) | $ | — |
| $ | (320,266 | ) |
|
|
|
|
| ||||||
|
|
|
|
|
|
|
|
|
|
|
Financing Activities |
|
|
|
|
|
|
|
|
|
|
Related party payable, net |
|
| 12,985 |
|
| — |
|
| 12,985 |
|
Proceeds from stock subscription receivable |
|
| 3,458 |
|
| — |
|
| 4,000 |
|
Issuance of preferred stock for cash |
|
| 829,554 |
|
| — |
|
| 829,554 |
|
|
|
|
|
| ||||||
Cash provided by financing activities |
|
| 845,997 |
|
| — |
|
| 846,539 |
|
|
|
|
|
| ||||||
|
|
|
|
|
|
|
|
|
|
|
Investing Activities |
|
|
|
|
|
|
|
|
|
|
Purchase of Avance assets |
|
| (526,270 | ) |
| — |
|
| (526,270 | ) |
|
|
|
|
| ||||||
Cash flows (used in) investing activities |
|
| (526,270 | ) |
| — |
|
| (526,270 | ) |
|
|
|
|
| ||||||
|
|
|
|
|
|
|
|
|
|
|
Increase in cash |
|
| 3 |
|
| — |
|
| 3 |
|
|
|
|
|
|
|
|
|
|
|
|
Cash and cash equivalents |
|
|
|
|
|
|
|
|
|
|
Beginning of period |
|
| — |
|
| — |
|
| — |
|
|
|
|
|
| ||||||
End of period |
| $ | 3 |
| $ | — |
| $ | 3 |
|
|
|
|
|
| ||||||
See the accompanying notes to the financial statements.
MILLENIA HOPE PHARMACEUTICALS INC.
NOTES TO THE INTERIM FINANCIAL STATEMENTS
MAY 31, 2006
(UNAUDITED)
NOTE 1. DESCRIPTION OF BUSINESS
Millenia Hope Pharmaceuticals Inc. (the “Company”) was incorporated in Canada on January 13, 2000 under the Canada Business Corporations Act, or CBCA. The Company does business as Millenia Hope Biopharma (MH-B) and is a Montreal-based biotechnology company focused on exploiting major advancements in accessing a source of biologically active compounds, plants, to discover, develop and produce new products for human health and well being. The Company commenced commercial activity on February 14, 2006, upon completion of the acquisition of assets from a third party. The Company is a majority owned subsidiary of Millenia Hope Inc.
The Company has developed patented proprietary enabling Phytomics Technologies that allow access to the potential of the plant kingdom’s untapped diversity of chemicals found therein. To exploit its unique chemical capabilities, the Company has developed a distinctive Plant Product Discovery Platform combining today’s biological target-based discovery processes and Phytomics to discover novel products for the health industry.
MH-B is leveraging its Phytomics and Plant Product Discovery Platforms to build a high-value proprietary and partnered pipeline of important plant-derived products for the pharmaceutical, cosmetic and nutraceutical industries and to develop proprietary Phytomics-based bioprocesses for the industrial scale production of complex phytoproducts of commercial relevance.
NOTE 2. BASIS OF PRESENTATION
The accompanying unaudited financial statements of Millenia Hope Pharmaceuticals Inc. have been prepared in accordance with generally accepted accounting principles for interim financial information and with the instructions to Form 10-QSB and Rule 10-01 of Regulation S-X. The financial statements reflect all adjustments consisting of normal recurring adjustments which, in the opinion of management, are necessary for a fair presentation of the results for the periods shown. Accordingly, they do not include all of the information and footnotes required by generally accepted accounting principles for complete financial statements. These financial statements should be read in conjunction with the audited financial statements and footnotes thereto of the Company as of November 30, 2005.
NOTE 3. SUMMARY OF SIGNIFICANT ACCOUNTING POLICIES
Use of Estimates
The preparation of financial statements in conformity with generally accepted accounting principles in the United States requires management to make estimates and assumptions that affect the reported amounts of assets and liabilities, and disclosure of contingent assets and liabilities at the date of the financial statements, and the reported amounts of revenues and expenses during the reporting period. Certain amounts included in the financial statements are estimated based on currently available information and management’s judgment as to the outcome of future conditions and circumstances. Changes in the status of certain facts or circumstances could result in material changes to the estimates used in the preparation of financial statements and actual results could differ from the estimates and assumptions.
Earnings (Loss) Per Share
The Company follows Statement of Financial Accounting Standards (“SFAS”) 128, “Earnings Per Share.” Basic earnings (loss) per common share (“EPS”) calculations are determined by dividing net income (loss) by the weighted average number of shares of common stock outstanding during the year. Diluted earnings per common share calculations are determined by dividing net income (loss) by the weighted average number of common shares and dilutive common share equivalents outstanding. During the periods presented common stock equivalents were not considered, as their effect would be anti-dilutive.
Property and Equipment
Property and equipment is recorded at cost and depreciated using the straight-line method over the estimated useful life of the asset, generally 3-5 years.
Repairs and maintenance are charged to operations as incurred and expenditures for significant improvements are capitalized. The cost of property and equipment retired or sold, together with the related accumulated depreciation, are removed from the appropriate asset and depreciation accounts, and the resulting gain or loss is included in operations.
NOTE 4. STOCKHOLDERS’ EQUITY
During the quarter ended May 31, 2006, the Company issued 829,554 shares of 6% Cumulative Preferred Stock at $1.00 per share, in payment of advances from shareholder of $829,554.
NOTE 5. PROPERTY AND EQUIPMENT
On February 14, 2006, the Company purchased intellectual property and research equipment from Avance Pharma, an unrelated party, for $526,270 in cash. During the quarter ended May 31, 2006, the Company recorded depreciation expense of $26,313.
NOTE 6. SUBSEQUENT EVENTS
On June 5, 2006, the Board of Directors of the parent company authorized the payment of a dividend to all shareholders of the parent company of record on July 3, 2006. The dividend consists of 6% of the issued shares, or a total of 2,400,000 shares, of the shares held by the parent. The effect of this transaction is to decrease the ownership by the parent company by 2,400,000 shares and increase the number of shareholders to approximately 2,000.