WASHINGTON, D. C. 20549
DWS High Income Opportunities Fund, Inc.
MARCH 31, 2012 Semiannual Report to Stockholders |
| |
DWS High Income Opportunities Fund, Inc. Ticker Symbol: DHG |
|
Contents
17 Statement of Assets and Liabilities 18 Statement of Operations 19 Statement of Cash Flows 20 Statement of Changes in Net Assets 23 Notes to Financial Statements 33 Dividend Reinvestment and Cash Purchase Plan 36 Additional Information |
The fund seeks high current income with a secondary objective of total return.
Closed-end funds, unlike open-end funds, are not continuously offered. There is a one time public offering and once issued, shares of closed-end funds are sold in the open market through a stock exchange. Shares of closed-end funds frequently trade at a discount to net asset value. The price of the fund's shares is determined by a number of factors, several of which are beyond the control of the fund. Therefore, the fund cannot predict whether its shares will trade at, below or above net asset value.
Any fund that concentrates in a particular segment of the market will generally be more volatile than a fund that invests more broadly. Bond investments are subject to interest-rate and credit risks. When interest rates rise, bond prices generally fall. Credit risk refers to the ability of an issuer to make timely payments of principal and interest. Investments in lower-quality and non-rated securities present greater risk of loss than investments in higher-quality securities. There are special risks associated with an investment in real estate, including REITS. These risks include credit risk, interest rate fluctuations and the impact of varied economic conditions. Stocks may decline in value. Investing in foreign securities, particularly those of emerging markets, presents certain risks, such as currency fluctuations, political and economic changes, and market risks. Investing in derivatives entails special risks relating to liquidity, leverage and credit that may reduce returns and/or increase volatility. Leverage results in additional risks and can magnify the effect of any gains or losses.
DWS Investments is part of Deutsche Bank's Asset Management division and, within the U.S., represents the retail asset management activities of Deutsche Bank AG, Deutsche Bank Trust Company Americas, Deutsche Investment Management Americas Inc. and DWS Trust Company.
NOT FDIC/NCUA INSURED NO BANK GUARANTEE MAY LOSE VALUE NOT A DEPOSIT NOT INSURED BY ANY FEDERAL GOVERNMENT AGENCY
Performance Summary March 31, 2012 (Unaudited)
Performance is historical, assumes reinvestment of all dividend and capital gain distributions, and does not guarantee future results. Investment return and principal value fluctuate with changing market conditions so that, when sold, shares may be worth more or less than their original cost. Current performance may be lower or higher than the performance data quoted. Please visit www.dws-investments.com for the Fund's most recent month-end performance.
Fund specific data and performance are provided for information purposes only and are not intended for trading purposes.
Average Annual Total Returns as of 3/31/12 |
| DWS High Income Opportunities Fund, Inc. | 6-Month‡ | 1-Year | 3-Year | 5-Year | Life of Fund* |
Based on Net Asset Value(a) | 17.66% | 8.71% | 31.17% | -6.68% | -5.90% |
Based on Market Price(a) | 28.61% | 20.09% | 45.16% | -5.97% | -6.25% |
Credit Suisse High-Yield Index(b) | 11.35% | 6.75% | 22.70% | 7.53% | 7.89% |
Morningstar Closed-End High Yield Bond Funds Category(c) | 15.13% | 6.58% | 27.61% | 6.30% | 6.75% |
‡ Total returns shown for periods less than one year are not annualized.
* The Fund commenced operations on November 22, 2006. Index returns are as of November 30, 2006.
On November 5, 2010, the Fund adopted its current name and investment policies. Prior to that date the Fund was known as DWS Dreman Value Income Edge Fund, Inc. and its investment objective was to seek to achieve a high level of total return. Performance prior to November 5, 2010 should not be considered representative of the present Fund.
| Net Asset Value and Market Price | |
| | | As of 3/31/12 | | | As of 9/30/11 | |
| Net Asset Value | | $ | 15.62 | | | $ | 13.92 | |
| Market Price | | $ | 16.03 | | | $ | 13.07 | |
Prices and net asset value fluctuate and are not guaranteed.
| Distribution Information | |
Six Months as of 3/31/12: Income Dividends | | $ | .70 | |
| March Income Dividend | | $ | .11 | |
Current Annualized Distribution Rate (Based on Net Asset Value) as of 3/31/12+ | | | 8.45 | % |
Current Annualized Distribution Rate (Based on Market Price) as of 3/31/12+ | | | 8.23 | % |
+ Current annualized distribution rate is the latest monthly dividend shown as an annualized percentage of net asset value/market price on March 31, 2012. Distribution rate simply measures the level of dividends and is not a complete measure of performance. Distribution rates are historical, not guaranteed, and will fluctuate.
Morningstar Rankings — Closed-End High Yield Bond Funds Category as of 3/31/12 |
| Period | Rank | | Number of Funds Tracked | Percentile Ranking (%) |
| 1-Year | 8 | of | 39 | 19 |
| 3-Year | 15 | of | 37 | 39 |
| 5-Year | 31 | of | 36 | 85 |
On November 5, 2010, the Fund adopted its current name and investment policies. The table below reflects Morningstar rankings from this point forward.
| as of 3/31/12 |
| Period | Rank | | Number of Funds Tracked | Percentile Ranking (%) |
| 1-Year | 8 | of | 39 | 19 |
| Since November 30, 2010 | 8 | of | 39 | 19 |
Source: Morningstar, Inc. Rankings are historical and do not guarantee future results. Rankings are based on net asset value total return with distributions reinvested.
(a) Total return based on net asset value reflects changes in the Fund's net asset value during the period. Total return based on market value reflects changes in market value. Each figure assumes that dividend and capital gain distributions, if any, were reinvested. These figures will differ depending upon the level of any discount from or premium to net asset value at which the Fund's shares traded during the period.
(b) Credit Suisse High Yield Index is an unmanaged, unleveraged trader-priced portfolio constructed to mirror the global high-yield debt market.
(c) Morningstar's Closed-End High Yield Bond Funds category represents portfolios that concentrate on lower-quality bonds, which are riskier than those of higher-quality companies. These portfolios generally offer higher yields than other types of portfolios, but they are also more vulnerable to economic and credit risk. These portfolios primarily invest in U.S. high-income debt securities, where at least 65% or more of bond assets are not rated or are rated by a major agency such as Standard & Poor's or Moody's at the level of BB (considered speculative for taxable bonds) and below. Category returns assume reinvestment of dividends. It is not possible to invest directly in a Morningstar category.
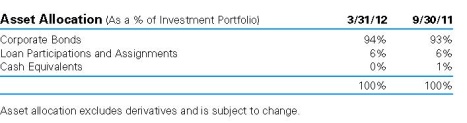
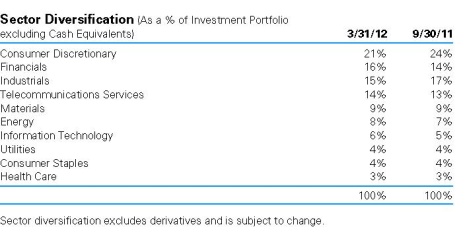
Portfolio Summary (Unaudited)
Investment Portfolio as of March 31, 2012 (Unaudited) | | | Principal Amount ($)(a) | | | Value ($) | |
| | | | |
| Corporate Bonds 132.2% | |
| Consumer Discretionary 28.2% | |
| AMC Networks, Inc., 144A, 7.75%, 7/15/2021 | | | | 165,000 | | | | 183,975 | |
| American Achievement Corp., 144A, 10.875%, 4/15/2016 | | | | 255,000 | | | | 184,875 | |
| AutoNation, Inc., 6.75%, 4/15/2018 | | | | 1,040,000 | | | | 1,120,600 | |
| Avis Budget Car Rental LLC, 8.25%, 1/15/2019 | | | | 700,000 | | | | 729,750 | |
| Beazer Homes U.S.A., Inc., 9.125%, 6/15/2018 | | | | 125,000 | | | | 109,219 | |
| Block Communications, Inc., 144A, 7.25%, 2/1/2020 | | | | 715,000 | | | | 728,406 | |
| Cablevision Systems Corp., 7.75%, 4/15/2018 | | | | 7,250,000 | | | | 7,576,250 | |
| Caesar's Entertainment Operating Co., Inc.: | |
| 10.0%, 12/15/2018 | | | 970,000 | | | | 749,325 | |
| 11.25%, 6/1/2017 | | | 3,900,000 | | | | 4,251,000 | |
| CCO Holdings LLC: | |
| 6.625%, 1/31/2022 | | | 360,000 | | | | 373,500 | |
| 7.0%, 1/15/2019 | | | 235,000 | | | | 249,100 | |
| 7.25%, 10/30/2017 | | | 1,110,000 | | | | 1,190,475 | |
| 7.375%, 6/1/2020 | | | 100,000 | | | | 108,500 | |
| 7.875%, 4/30/2018 | | | 6,300,000 | | | | 6,804,000 | |
| Cequel Communications Holdings I LLC, 144A, 8.625%, 11/15/2017 | | | | 3,385,000 | | | | 3,634,644 | |
| Chester Downs & Marina LLC, 144A, 9.25%, 2/1/2020 | | | | 130,000 | | | | 137,313 | |
| Clear Channel Communications, Inc., 9.0%, 3/1/2021 | | | | 135,000 | | | | 121,500 | |
| Clear Channel Worldwide Holdings, Inc.: | |
| 144A, 7.625%, 3/15/2020 | | | 720,000 | | | | 705,600 | |
| 144A, 7.625%, 3/15/2020 | | | 105,000 | | | | 101,325 | |
| Crown Media Holdings, Inc., 10.5%, 7/15/2019 | | | | 275,000 | | | | 300,437 | |
| Cumulus Media, Inc., 144A, 7.75%, 5/1/2019 | | | | 130,000 | | | | 122,850 | |
| DineEquity, Inc., 9.5%, 10/30/2018 | | | | 1,115,000 | | | | 1,220,925 | |
| DISH DBS Corp.: | |
| 6.75%, 6/1/2021 | | | 145,000 | | | | 156,238 | |
| 7.125%, 2/1/2016 | | | 2,500,000 | | | | 2,765,625 | |
| Gannett Co., Inc., 6.375%, 9/1/2015 | | | | 1,830,000 | | | | 1,948,950 | |
| Harron Communications LP, 144A, 9.125%, 4/1/2020 (b) | | | | 520,000 | | | | 536,900 | |
| Hertz Corp.: | |
| 6.75%, 4/15/2019 | | | 45,000 | | | | 46,575 | |
| 144A, 6.75%, 4/15/2019 | | | 405,000 | | | | 419,175 | |
| 7.5%, 10/15/2018 | | | 6,000,000 | | | | 6,367,500 | |
| Jarden Corp., 6.125%, 11/15/2022 | | | | 250,000 | | | | 261,875 | |
| Kabel BW GmbH, 144A, 7.5%, 3/15/2019 | | | | 825,000 | | | | 891,000 | |
| Levi Strauss & Co., 7.625%, 5/15/2020 | | | | 825,000 | | | | 872,437 | |
| Lions Gate Entertainment, Inc., 144A, 10.25%, 11/1/2016 | | | | 505,000 | | | | 556,131 | |
| Mediacom Broadband LLC, 8.5%, 10/15/2015 | | | | 425,000 | | | | 437,750 | |
| Mediacom LLC, 144A, 7.25%, 2/15/2022 | | | | 200,000 | | | | 202,000 | |
| MGM Resorts International: | |
| 7.5%, 6/1/2016 | | | 550,000 | | | | 566,500 | |
| 7.625%, 1/15/2017 | | | 385,000 | | | | 397,512 | |
| 144A, 8.625%, 2/1/2019 | | | 1,585,000 | | | | 1,699,912 | |
| 10.0%, 11/1/2016 | | | 445,000 | | | | 498,400 | |
| 10.375%, 5/15/2014 | | | 1,900,000 | | | | 2,154,125 | |
| National CineMedia LLC, 7.875%, 7/15/2021 | | | | 465,000 | | | | 495,225 | |
| Palace Entertainment Holdings LLC, 144A, 8.875%, 4/15/2017 | | | | 390,000 | | | | 405,112 | |
| PETCO Animal Supplies, Inc., 144A, 9.25%, 12/1/2018 | | | | 670,000 | | | | 735,325 | |
| Pinnacle Entertainment, Inc., 7.75%, 4/1/2022 | | | | 60,000 | | | | 62,850 | |
| Regal Entertainment Group, 9.125%, 8/15/2018 | | | | 350,000 | | | | 383,250 | |
| Rent-A-Center, Inc., 6.625%, 11/15/2020 | | | | 500,000 | | | | 518,750 | |
| Sirius XM Radio, Inc., 144A, 8.75%, 4/1/2015 | | | | 1,015,000 | | | | 1,152,025 | |
| Standard Pacific Corp., 8.375%, 5/15/2018 | | | | 745,000 | | | | 792,494 | |
| Stoneridge, Inc., 144A, 9.5%, 10/15/2017 | | | | 5,100,000 | | | | 5,412,375 | |
| Travelport LLC, 9.0%, 3/1/2016 | | | | 535,000 | | | | 323,006 | |
| UCI International, Inc., 8.625%, 2/15/2019 | | | | 235,000 | | | | 241,463 | |
| Unitymedia GmbH, 144A, 9.625%, 12/1/2019 | EUR | | | 1,595,000 | | | | 2,329,340 | |
| Unitymedia Hessen GmbH & Co., KG, 144A, 8.125%, 12/1/2017 | | | | 1,830,000 | | | | 1,976,400 | |
| Univision Communications, Inc.: | |
| 144A, 6.875%, 5/15/2019 | | | 110,000 | | | | 111,513 | |
| 144A, 8.5%, 5/15/2021 | | | 135,000 | | | | 133,650 | |
| UPC Holding BV: | |
| 144A, 8.375%, 8/15/2020 | | | 580,000 | | | | 799,653 | |
| 144A, 9.75%, 4/15/2018 | | | 795,000 | | | | 1,123,909 | |
| Valassis Communications, Inc., 6.625%, 2/1/2021 | | | | 105,000 | | | | 107,625 | |
| Visant Corp., 10.0%, 10/1/2017 | | | | 1,220,000 | | | | 1,139,175 | |
| Visteon Corp., 6.75%, 4/15/2019 | | | | 820,000 | | | | 832,300 | |
| XM Satellite Radio, Inc., 144A, 7.625%, 11/1/2018 | | | | 3,000,000 | | | | 3,240,000 | |
| Yonkers Racing Corp., 144A, 11.375%, 7/15/2016 | | | | 320,000 | | | | 343,200 | |
| | | | | 74,140,814 | |
| Consumer Staples 3.3% | |
| Alliance One International, Inc., 10.0%, 7/15/2016 | | | | 500,000 | | | | 502,500 | |
| B&G Foods, Inc., 7.625%, 1/15/2018 | | | | 110,000 | | | | 118,113 | |
| Darling International, Inc., 8.5%, 12/15/2018 | | | | 785,000 | | | | 875,275 | |
| Del Monte Corp., 7.625%, 2/15/2019 | | | | 810,000 | | | | 805,950 | |
| JBS U.S.A. LLC, 144A, 8.25%, 2/1/2020 | | | | 295,000 | | | | 303,112 | |
| Lawson Software, Inc., 144A, 9.375%, 4/1/2019 (b) | | | | 150,000 | | | | 154,875 | |
| NBTY, Inc., 9.0%, 10/1/2018 | | | | 1,540,000 | | | | 1,695,925 | |
| Pilgrim's Pride Corp., 7.875%, 12/15/2018 | | | | 265,000 | | | | 264,338 | |
| Post Holdings, Inc., 144A, 7.375%, 2/15/2022 | | | | 400,000 | | | | 419,000 | |
| Rite Aid Corp.: | |
| 7.5%, 3/1/2017 | | | 65,000 | | | | 66,300 | |
| 8.0%, 8/15/2020 | | | 965,000 | | | | 1,110,956 | |
| 144A, 9.25%, 3/15/2020 | | | 115,000 | | | | 116,150 | |
| Stater Bros. Holdings, Inc., 7.375%, 11/15/2018 | | | | 385,000 | | | | 417,244 | |
| Tops Holding Corp., 10.125%, 10/15/2015 | | | | 1,195,000 | | | | 1,275,662 | |
| TreeHouse Foods, Inc., 7.75%, 3/1/2018 | | | | 225,000 | | | | 243,844 | |
| U.S. Foodservice, 144A, 8.5%, 6/30/2019 | | | | 385,000 | | | | 389,812 | |
| | | | | 8,759,056 | |
| Energy 11.3% | |
| Alpha Natural Resources, Inc., 6.0%, 6/1/2019 | | | | 655,000 | | | | 592,775 | |
| Arch Coal, Inc.: | |
| 144A, 7.0%, 6/15/2019 | | | 220,000 | | | | 202,950 | |
| 144A, 7.25%, 6/15/2021 | | | 350,000 | | | | 322,875 | |
| 8.75%, 8/1/2016 | | | 615,000 | | | | 645,750 | |
| Atwood Oceanics, Inc., 6.5%, 2/1/2020 | | | | 205,000 | | | | 215,250 | |
| Bill Barrett Corp.: | |
| 7.0%, 10/15/2022 | | | 200,000 | | | | 193,000 | |
| 7.625%, 10/1/2019 | | | 105,000 | | | | 106,575 | |
| BreitBurn Energy Partners LP, 144A, 7.875%, 4/15/2022 | | | | 120,000 | | | | 122,400 | |
| Chaparral Energy, Inc.: | |
| 8.25%, 9/1/2021 | | | 795,000 | | | | 846,675 | |
| 9.875%, 10/1/2020 | | | 4,500,000 | | | | 5,017,500 | |
| Chesapeake Energy Corp.: | |
| 6.125%, 2/15/2021 | | | 450,000 | | | | 445,500 | |
| 6.875%, 11/15/2020 | | | 450,000 | | | | 464,625 | |
| Chesapeake Midstream Partners LP, 144A, 6.125%, 7/15/2022 | | | | 615,000 | | | | 619,612 | |
| Chesapeake Oilfield Operating LLC, 144A, 6.625%, 11/15/2019 | | | | 400,000 | | | | 397,000 | |
| Cimarex Energy Co., 5.875%, 5/1/2022 (b) | | | | 390,000 | | | | 397,800 | |
| CONSOL Energy, Inc.: | |
| 6.375%, 3/1/2021 | | | 170,000 | | | | 162,350 | |
| 8.0%, 4/1/2017 | | | 1,775,000 | | | | 1,850,437 | |
| Crestwood Midstream Partners LP, 144A, 7.75%, 4/1/2019 | | | | 1,735,000 | | | | 1,776,206 | |
| Dresser-Rand Group, Inc., 6.5%, 5/1/2021 | | | | 780,000 | | | | 815,100 | |
| Eagle Rock Energy Partners LP, 8.375%, 6/1/2019 | | | | 510,000 | | | | 525,300 | |
| EV Energy Partners LP, 8.0%, 4/15/2019 | | | | 1,595,000 | | | | 1,634,875 | |
| Frontier Oil Corp., 6.875%, 11/15/2018 | | | | 630,000 | | | | 655,200 | |
| Genesis Energy LP, 7.875%, 12/15/2018 | | | | 440,000 | | | | 448,800 | |
| Holly Energy Partners LP, 144A, 6.5%, 3/1/2020 | | | | 205,000 | | | | 208,075 | |
| Kodiak Oil & Gas Corp., 144A, 8.125%, 12/1/2019 | | | | 300,000 | | | | 317,250 | |
| Linn Energy LLC: | |
| 144A, 6.25%, 11/1/2019 | | | 815,000 | | | | 790,550 | |
| 144A, 6.5%, 5/15/2019 | | | 40,000 | | | | 39,200 | |
| MEG Energy Corp., 144A, 6.5%, 3/15/2021 | | | | 435,000 | | | | 455,663 | |
| Newfield Exploration Co., 5.75%, 1/30/2022 | | | | 770,000 | | | | 806,575 | |
| Oasis Petroleum, Inc.: | |
| 6.5%, 11/1/2021 | | | 300,000 | | | | 301,500 | |
| 7.25%, 2/1/2019 | | | 230,000 | | | | 242,075 | |
| Offshore Group Investments Ltd., 11.5%, 8/1/2015 | | | | 30,000 | | | | 33,000 | |
| OGX Austria GmbH, 144A, 8.375%, 4/1/2022 | | | | 320,000 | | | | 323,200 | |
| Peabody Energy Corp.: | |
| 144A, 6.0%, 11/15/2018 | | | 255,000 | | | | 249,900 | |
| 144A, 6.25%, 11/15/2021 | | | 295,000 | | | | 289,100 | |
| Plains Exploration & Production Co., 6.75%, 2/1/2022 | | | | 770,000 | | | | 804,650 | |
| Sabine Pass LNG LP, 7.5%, 11/30/2016 | | | | 565,000 | | | | 605,963 | |
| SandRidge Energy, Inc.: | |
| 7.5%, 3/15/2021 | | | 565,000 | | | | 556,525 | |
| 144A, 8.0%, 6/1/2018 | | | 465,000 | | | | 474,300 | |
| SESI LLC: | |
| 6.375%, 5/1/2019 | | | 440,000 | | | | 466,400 | |
| 144A, 7.125%, 12/15/2021 | | | 1,280,000 | | | | 1,382,400 | |
| Swift Energy Co., 144A, 7.875%, 3/1/2022 | | | | 785,000 | | | | 808,550 | |
| Venoco, Inc., 8.875%, 2/15/2019 | | | | 560,000 | | | | 512,400 | |
| WPX Energy, Inc.: | |
| 144A, 5.25%, 1/15/2017 | | | 845,000 | | | | 840,775 | |
| 144A, 6.0%, 1/15/2022 | | | 620,000 | | | | 620,000 | |
| Xinergy Corp., 144A, 9.25%, 5/15/2019 | | | | 225,000 | | | | 173,250 | |
| | | | | 29,759,856 | |
| Financials 22.9% | |
| Algoma Acquisition Corp., 144A, 9.875%, 6/15/2015 | | | | 450,000 | | | | 409,500 | |
| Ally Financial, Inc.: | |
| 5.5%, 2/15/2017 | | | 700,000 | | | | 700,832 | |
| 6.25%, 12/1/2017 | | | 7,000,000 | | | | 7,208,159 | |
| AmeriGas Finance LLC: | |
| 6.75%, 5/20/2020 | | | 200,000 | | | | 203,000 | |
| 7.0%, 5/20/2022 | | | 200,000 | | | | 204,000 | |
| Antero Resources Finance Corp.: | |
| 144A, 7.25%, 8/1/2019 | | | 540,000 | | | | 556,200 | |
| 9.375%, 12/1/2017 | | | 225,000 | | | | 243,563 | |
| Ardagh Packaging Finance PLC: | |
| 144A, 7.375%, 10/15/2017 | | | 200,000 | | | | 214,500 | |
| 144A, 9.125%, 10/15/2020 | | | 240,000 | | | | 251,400 | |
| AWAS Aviation Capital Ltd., 144A, 7.0%, 10/17/2016 | | | | 971,800 | | | | 1,013,101 | |
| Banco Bradesco SA, 144A, 5.75%, 3/1/2022 | | | | 1,355,000 | | | | 1,363,807 | |
| Caesars Operating Escrow LLC, 144A, 8.5%, 2/15/2020 | | | | 695,000 | | | | 707,162 | |
| Calpine Construction Finance Co., LP, 144A, 8.0%, 6/1/2016 | | | | 810,000 | | | | 880,875 | |
| CIT Group, Inc., 5.25%, 3/15/2018 | | | | 1,045,000 | | | | 1,065,900 | |
| Codere Finance Luxembourg SA, 144A, 9.25%, 2/15/2019 | | | | 290,000 | | | | 287,825 | |
| DPL, Inc., 144A, 6.5%, 10/15/2016 | | | | 2,395,000 | | | | 2,574,625 | |
| DuPont Fabros Technology LP, (REIT), 8.5%, 12/15/2017 | | | | 750,000 | | | | 825,000 | |
| E*TRADE Financial Corp.: | |
| 6.75%, 6/1/2016 | | | 680,000 | | | | 695,300 | |
| 7.875%, 12/1/2015 | | | 2,000,000 | | | | 2,032,500 | |
| 12.5%, 11/30/2017 | | | 3,095,000 | | | | 3,601,806 | |
| Felcor Lodging LP, (REIT), 6.75%, 6/1/2019 | | | | 390,000 | | | | 393,900 | |
| Fibria Overseas Finance Ltd., 144A, 6.75%, 3/3/2021 | | | | 220,000 | | | | 224,950 | |
| Ford Motor Credit Co., LLC: | |
| 5.0%, 5/15/2018 | | | 780,000 | | | | 807,968 | |
| 5.875%, 8/2/2021 | | | 560,000 | | | | 604,010 | |
| 6.625%, 8/15/2017 | | | 1,000,000 | | | | 1,108,133 | |
| 8.7%, 10/1/2014 | | | 2,000,000 | | | | 2,262,042 | |
| Fresenius Medical Care U.S. Finance II, Inc.: | |
| 144A, 5.625%, 7/31/2019 | | | 405,000 | | | | 417,150 | |
| 144A, 5.875%, 1/31/2022 | | | 355,000 | | | | 364,763 | |
| Fresenius Medical Care U.S. Finance, Inc.: | |
| 144A, 5.75%, 2/15/2021 | | | 235,000 | | | | 243,225 | |
| 144A, 6.5%, 9/15/2018 | | | 210,000 | | | | 228,900 | |
| Hexion U.S. Finance Corp.: | |
| 144A, 6.625%, 4/15/2020 | | | 175,000 | | | | 178,938 | |
| 8.875%, 2/1/2018 | | | 4,720,000 | | | | 4,885,200 | |
| International Lease Finance Corp.: | |
| 5.75%, 5/15/2016 | | | 205,000 | | | | 204,770 | |
| 6.25%, 5/15/2019 | | | 510,000 | | | | 503,410 | |
| 8.625%, 1/15/2022 | | | 565,000 | | | | 628,092 | |
| 8.75%, 3/15/2017 | | | 1,840,000 | | | | 2,047,000 | |
| Level 3 Financing, Inc.: | |
| 144A, 8.125%, 7/1/2019 | | | 375,000 | | | | 387,188 | |
| 144A, 8.625%, 7/15/2020 | | | 295,000 | | | | 309,750 | |
| MPT Operating Partnership LP: | |
| (REIT), 6.375%, 2/15/2022 | | | 335,000 | | | | 340,025 | |
| (REIT), 6.875%, 5/1/2021 | | | 550,000 | | | | 574,750 | |
| Nara Cable Funding Ltd., 144A, 8.875%, 12/1/2018 | | | | 480,000 | | | | 456,000 | |
| Neuberger Berman Group LLC: | |
| 144A, 5.625%, 3/15/2020 | | | 305,000 | | | | 307,288 | |
| 144A, 5.875%, 3/15/2022 | | | 505,000 | | | | 510,050 | |
| NII Capital Corp., 7.625%, 4/1/2021 | | | | 375,000 | | | | 366,563 | |
| Nuveen Investments, Inc.: | |
| 10.5%, 11/15/2015 | | | 1,420,000 | | | | 1,471,475 | |
| 144A, 10.5%, 11/15/2015 | | | 895,000 | | | | 922,969 | |
| Odebrecht Finance Ltd., 144A, 6.0%, 4/5/2023 | | | | 800,000 | | | | 831,440 | |
| Pinnacle Foods Finance LLC, 9.25%, 4/1/2015 | | | | 1,950,000 | | | | 2,003,625 | |
| Reynolds Group Issuer, Inc.: | |
| 144A, 9.0%, 4/15/2019 | | | 2,330,000 | | | | 2,295,050 | |
| 144A, 9.25%, 5/15/2018 | | | 3,715,000 | | | | 3,705,712 | |
| 144A, 9.875%, 8/15/2019 | | | 115,000 | | | | 117,588 | |
| Sable International Finance Ltd., 144A, 8.75%, 2/1/2020 | | | | 200,000 | | | | 212,000 | |
| Schaeffler Finance BV: | |
| 144A, 7.75%, 2/15/2017 | | | 755,000 | | | | 798,412 | |
| 144A, 7.75%, 2/15/2017 | | | 400,000 | | | | 549,495 | |
| 144A, 8.5%, 2/15/2019 | | | 315,000 | | | | 336,263 | |
| 144A, 8.75%, 2/15/2019 | | | 195,000 | | | | 275,026 | |
| UPCB Finance III Ltd., 144A, 6.625%, 7/1/2020 | | | | 345,000 | | | | 351,900 | |
| UPCB Finance V Ltd., 144A, 7.25%, 11/15/2021 | | | | 405,000 | | | | 428,288 | |
| UR Financing Escrow Corp.: | |
| 144A, 5.75%, 7/15/2018 | | | 690,000 | | | | 706,387 | |
| 144A, 7.375%, 5/15/2020 | | | 565,000 | | | | 577,712 | |
| 144A, 7.625%, 4/15/2022 | | | 565,000 | | | | 580,537 | |
| Wind Acquisition Finance SA: | |
| 144A, 7.25%, 2/15/2018 | | | 400,000 | | | | 377,000 | |
| 144A, 11.75%, 7/15/2017 | | | 305,000 | | | | 384,406 | |
| | | | | 60,318,405 | |
| Health Care 4.3% | |
| Aviv Healthcare Properties LP: | |
| 7.75%, 2/15/2019 | | | 455,000 | | | | 467,513 | |
| 144A, 7.75%, 2/15/2019 | | | 500,000 | | | | 508,750 | |
| Community Health Systems, Inc., 8.875%, 7/15/2015 | | | | 255,000 | | | | 264,244 | |
| HCA Holdings, Inc., 7.75%, 5/15/2021 | | | | 1,275,000 | | | | 1,318,031 | |
| HCA, Inc.: | |
| 5.875%, 3/15/2022 | | | 500,000 | | | | 500,625 | |
| 6.5%, 2/15/2020 | | | 2,155,000 | | | | 2,262,750 | |
| 7.5%, 2/15/2022 | | | 1,615,000 | | | | 1,719,975 | |
| 7.875%, 2/15/2020 | | | 2,110,000 | | | | 2,318,362 | |
| Physio-Control International, Inc., 144A, 9.875%, 1/15/2019 | | | | 295,000 | | | | 309,750 | |
| STHI Holding Corp., 144A, 8.0%, 3/15/2018 | | | | 325,000 | | | | 344,500 | |
| Tenet Healthcare Corp., 144A, 6.25%, 11/1/2018 | | | | 1,200,000 | | | | 1,239,000 | |
| | | | | 11,253,500 | |
| Industrials 18.9% | |
| Accuride Corp., 9.5%, 8/1/2018 | | | | 6,000,000 | | | | 6,300,000 | |
| Aguila 3 SA, 144A, 7.875%, 1/31/2018 | | | | 605,000 | | | | 632,225 | |
| Air Lease Corp., 144A, 5.625%, 4/1/2017 | | | | 850,000 | | | | 846,813 | |
| Armored Autogroup, Inc., 144A, 9.25%, 11/1/2018 | | | | 500,000 | | | | 417,500 | |
| BakerCorp International, Inc., 144A, 8.25%, 6/1/2019 | | | | 320,000 | | | | 329,600 | |
| BE Aerospace, Inc., 6.875%, 10/1/2020 | | | | 6,910,000 | | | | 7,566,450 | |
| Boart Longyear Management Pty Ltd., 144A, 7.0%, 4/1/2021 | | | | 360,000 | | | | 376,200 | |
| Bombardier, Inc., 144A, 5.75%, 3/15/2022 | | | | 600,000 | | | | 583,500 | |
| Briggs & Stratton Corp., 6.875%, 12/15/2020 | | | | 370,000 | | | | 381,100 | |
| Building Materials Corp. of America, 144A, 7.5%, 3/15/2020 | | | | 6,000,000 | | | | 6,360,000 | |
| Casella Waste Systems, Inc., 7.75%, 2/15/2019 | | | | 820,000 | | | | 811,800 | |
| Cenveo Corp., 8.875%, 2/1/2018 | | | | 1,835,000 | | | | 1,743,250 | |
| CHC Helicopter SA, 144A, 9.25%, 10/15/2020 | | | | 885,000 | | | | 878,363 | |
| Deluxe Corp., 7.0%, 3/15/2019 | | | | 335,000 | | | | 346,725 | |
| Ducommun, Inc., 9.75%, 7/15/2018 | | | | 320,000 | | | | 339,200 | |
| DynCorp International, Inc., 10.375%, 7/1/2017 | | | | 3,000,000 | | | | 2,606,250 | |
| Florida East Coast Railway Corp., 8.125%, 2/1/2017 | | | | 435,000 | | | | 443,700 | |
| H&E Equipment Services, Inc., 8.375%, 7/15/2016 | | | | 9,000,000 | | | | 9,270,000 | |
| Huntington Ingalls Industries, Inc.: | |
| 6.875%, 3/15/2018 | | | 335,000 | | | | 355,100 | |
| 7.125%, 3/15/2021 | | | 110,000 | | | | 117,838 | |
| Interline Brands, Inc., 7.0%, 11/15/2018 | | | | 200,000 | | | | 211,000 | |
| Kansas City Southern de Mexico SA de CV: | |
| 6.625%, 12/15/2020 | | | 3,000,000 | | | | 3,240,000 | |
| 8.0%, 2/1/2018 | | | 1,220,000 | | | | 1,354,200 | |
| Navios Maritime Holdings, Inc.: | |
| 8.125%, 2/15/2019 | | | 770,000 | | | | 660,275 | |
| 8.875%, 11/1/2017 | | | 815,000 | | | | 835,375 | |
| Rexel SA, 144A, 6.125%, 12/15/2019 | | | | 230,000 | | | | 232,875 | |
| Spirit AeroSystems, Inc., 6.75%, 12/15/2020 | | | | 955,000 | | | | 1,033,787 | |
| United Rentals North America, Inc., 10.875%, 6/15/2016 | | | | 1,145,000 | | | | 1,296,712 | |
| Welltec A/S, 144A, 8.0%, 2/1/2019 | | | | 200,000 | | | | 192,000 | |
| | | | | 49,761,838 | |
| Information Technology 7.6% | |
| Allen Systems Group, Inc., 144A, 10.5%, 11/15/2016 | | | | 225,000 | | | | 193,500 | |
| Alliance Data Systems Corp., 144A, 6.375%, 4/1/2020 | | | | 290,000 | | | | 293,625 | |
| Amkor Technology, Inc.: | |
| 6.625%, 6/1/2021 | | | 140,000 | | | | 144,725 | |
| 7.375%, 5/1/2018 | | | 660,000 | | | | 707,025 | |
| Avaya, Inc., 144A, 7.0%, 4/1/2019 | | | | 1,605,000 | | | | 1,609,012 | |
| CDW LLC: | |
| 8.5%, 4/1/2019 | | | 2,950,000 | | | | 3,134,375 | |
| 144A, 8.5%, 4/1/2019 | | | 260,000 | | | | 276,250 | |
| CommScope, Inc., 144A, 8.25%, 1/15/2019 | | | | 940,000 | | | | 1,001,100 | |
| eAccess Ltd., 144A, 8.25%, 4/1/2018 | | | | 315,000 | | | | 301,613 | |
| Equinix, Inc.: | |
| 7.0%, 7/15/2021 | | | 440,000 | | | | 482,900 | |
| 8.125%, 3/1/2018 | | | 230,000 | | | | 253,000 | |
| Fidelity National Information Services, Inc.: | |
| 144A, 5.0%, 3/15/2022 | | | 205,000 | | | | 201,925 | |
| 144A, 7.625%, 7/15/2017 | | | 105,000 | | | | 114,450 | |
| First Data Corp., 144A, 7.375%, 6/15/2019 | | | | 475,000 | | | | 483,906 | |
| Freescale Semiconductor, Inc., 144A, 9.25%, 4/15/2018 | | | | 1,995,000 | | | | 2,184,525 | |
| Hughes Satellite Systems Corp.: | |
| 6.5%, 6/15/2019 | | | 850,000 | | | | 888,250 | |
| 7.625%, 6/15/2021 | | | 435,000 | | | | 466,537 | |
| Jabil Circuit, Inc., 5.625%, 12/15/2020 | | | | 3,750,000 | | | | 3,937,500 | |
| Sanmina-SCI Corp., 144A, 7.0%, 5/15/2019 | | | | 230,000 | | | | 234,600 | |
| Seagate HDD Cayman, 144A, 7.0%, 11/1/2021 | | | | 550,000 | | | | 591,250 | |
| Sensata Technologies BV, 144A, 6.5%, 5/15/2019 | | | | 555,000 | | | | 580,669 | |
| SunGard Data Systems, Inc., 10.25%, 8/15/2015 | | | | 1,600,000 | | | | 1,662,000 | |
| ViaSat, Inc., 144A, 6.875%, 6/15/2020 | | | | 205,000 | | | | 210,125 | |
| | | | | 19,952,862 | |
| Materials 11.8% | |
| APERAM: | |
| 144A, 7.375%, 4/1/2016 | | | 405,000 | | | | 395,888 | |
| 144A, 7.75%, 4/1/2018 | | | 495,000 | | | | 477,675 | |
| Berry Plastics Corp.: | |
| 8.25%, 11/15/2015 | | | 1,225,000 | | | | 1,307,687 | |
| 9.75%, 1/15/2021 | | | 1,290,000 | | | | 1,409,325 | |
| Beverage Packaging Holdings Luxembourg II SA, 144A, 8.0%, 12/15/2016 | EUR | | | 1,910,000 | | | | 2,356,314 | |
| Crown Americas LLC, 6.25%, 2/1/2021 | | | | 105,000 | | | | 112,875 | |
| Essar Steel Algoma, Inc., 144A, 9.375%, 3/15/2015 | | | | 3,345,000 | | | | 3,453,712 | |
| Exopack Holding Corp., 10.0%, 6/1/2018 | | | | 435,000 | | | | 456,750 | |
| FMG Resources August 2006 Pty Ltd.: | |
| 144A, 6.0%, 4/1/2017 | | | 605,000 | | | | 598,950 | |
| 144A, 6.875%, 4/1/2022 | | | 435,000 | | | | 424,125 | |
| 144A, 7.0%, 11/1/2015 | | | 200,000 | | | | 204,000 | |
| 144A, 8.25%, 11/1/2019 | | | 1,045,000 | | | | 1,097,250 | |
| Huntsman International LLC, 8.625%, 3/15/2020 | | | | 585,000 | | | | 653,738 | |
| Ineos Finance PLC, 144A, 9.0%, 5/15/2015 | | | | 3,250,000 | | | | 3,449,062 | |
| JMC Steel Group, 144A, 8.25%, 3/15/2018 | | | | 325,000 | | | | 338,000 | |
| Koppers, Inc., 7.875%, 12/1/2019 | | | | 750,000 | | | | 800,625 | |
| Kraton Polymers LLC, 6.75%, 3/1/2019 | | | | 400,000 | | | | 413,000 | |
| Longview Fibre Paper & Packaging, Inc., 144A, 8.0%, 6/1/2016 | | | | 320,000 | | | | 326,000 | |
| LyondellBasell Industries NV: | |
| 144A, 5.0%, 4/15/2019 (b) | | | 615,000 | | | | 615,000 | |
| 144A, 6.0%, 11/15/2021 | | | 200,000 | | | | 210,000 | |
| Momentive Performance Materials, Inc., 9.0%, 1/15/2021 | | | | 380,000 | | | | 332,500 | |
| Novelis, Inc.: | |
| 8.375%, 12/15/2017 | | | 1,595,000 | | | | 1,730,575 | |
| 8.75%, 12/15/2020 | | | 1,550,000 | | | | 1,697,250 | |
| Owens-Brockway Glass Container, Inc., 7.375%, 5/15/2016 | | | | 3,135,000 | | | | 3,526,875 | |
| Packaging Dynamics Corp., 144A, 8.75%, 2/1/2016 | | | | 610,000 | | | | 640,500 | |
| Polymer Group, Inc., 7.75%, 2/1/2019 | | | | 590,000 | | | | 620,975 | |
| Quadra FNX Mining Ltd., 144A, 7.75%, 6/15/2019 | | | | 1,180,000 | | | | 1,342,250 | |
| Rock-Tenn Co.: | |
| 144A, 4.45%, 3/1/2019 | | | 100,000 | | | | 100,449 | |
| 144A, 4.9%, 3/1/2022 | | | 305,000 | | | | 304,553 | |
| SunCoke Energy, Inc., 7.625%, 8/1/2019 | | | | 320,000 | | | | 328,800 | |
| Vulcan Materials Co., 6.5%, 12/1/2016 | | | | 1,105,000 | | | | 1,185,113 | |
| | | | | 30,909,816 | |
| Telecommunication Services 18.6% | |
| Cincinnati Bell, Inc., 8.25%, 10/15/2017 | | | | 5,575,000 | | | | 5,693,469 | |
| CPI International, Inc., 8.0%, 2/15/2018 | | | | 500,000 | | | | 441,250 | |
| Cricket Communications, Inc.: | |
| 7.75%, 10/15/2020 | | | 4,500,000 | | | | 4,421,250 | |
| 10.0%, 7/15/2015 | | | 1,000,000 | | | | 1,052,500 | |
| Digicel Group Ltd., 144A, 10.5%, 4/15/2018 | | | | 1,170,000 | | | | 1,292,850 | |
| Digicel Ltd.: | |
| 144A, 7.0%, 2/15/2020 | | | 200,000 | | | | 203,500 | |
| 144A, 8.25%, 9/1/2017 | | | 835,000 | | | | 883,012 | |
| Frontier Communications Corp., 8.5%, 4/15/2020 | | | | 1,900,000 | | | | 1,999,750 | |
| Intelsat Jackson Holdings SA: | |
| 7.25%, 10/15/2020 | | | 5,000,000 | | | | 5,256,250 | |
| 7.5%, 4/1/2021 | | | 1,640,000 | | | | 1,724,050 | |
| 8.5%, 11/1/2019 | | | 1,100,000 | | | | 1,207,250 | |
| Intelsat Luxembourg SA, 11.5%, 2/4/2017 (PIK) | | | | 3,191,718 | | | | 3,319,387 | |
| MetroPCS Wireless, Inc.: | |
| 6.625%, 11/15/2020 | | | 3,000,000 | | | | 2,981,250 | |
| 7.875%, 9/1/2018 | | | 835,000 | | | | 878,837 | |
| Nextel Communications, Inc., Series E, 6.875%, 10/31/2013 | | | | 2,790,000 | | | | 2,790,000 | |
| Sprint Nextel Corp.: | |
| 144A, 7.0%, 3/1/2020 | | | 510,000 | | | | 517,650 | |
| 144A, 9.0%, 11/15/2018 | | | 1,420,000 | | | | 1,558,450 | |
| 144A, 9.125%, 3/1/2017 | | | 295,000 | | | | 293,525 | |
| Syniverse Holdings, Inc., 9.125%, 1/15/2019 | | | | 255,000 | | | | 281,137 | |
| Telesat Canada, 11.0%, 11/1/2015 | | | | 95,000 | | | | 101,413 | |
| West Corp., 7.875%, 1/15/2019 | | | | 285,000 | | | | 303,525 | |
| Windstream Corp.: | |
| 7.75%, 10/15/2020 | | | 355,000 | | | | 379,850 | |
| 8.125%, 9/1/2018 | | | 10,500,000 | | | | 11,235,000 | |
| | | | | 48,815,155 | |
| Utilities 5.3% | |
| AES Corp.: | |
| 7.75%, 10/15/2015 | | | 1,930,000 | | | | 2,151,950 | |
| 8.0%, 10/15/2017 | | | 2,200,000 | | | | 2,477,750 | |
| Calpine Corp., 144A, 7.875%, 7/31/2020 | | | | 3,395,000 | | | | 3,692,062 | |
| Edison Mission Energy, 7.0%, 5/15/2017 | | | | 1,995,000 | | | | 1,256,850 | |
| Energy Future Holdings Corp., Series Q, 6.5%, 11/15/2024 | | | | 1,065,000 | | | | 559,125 | |
| Energy Future Intermediate Holding Co., LLC, 10.0%, 12/1/2020 | | | | 130,000 | | | | 141,700 | |
| Ferrellgas LP, 6.5%, 5/1/2021 | | | | 245,000 | | | | 221,113 | |
| IPALCO Enterprises, Inc., 5.0%, 5/1/2018 | | | | 1,290,000 | | | | 1,283,550 | |
| NRG Energy, Inc.: | |
| 7.625%, 1/15/2018 | | | 380,000 | | | | 380,950 | |
| 8.25%, 9/1/2020 | | | 1,820,000 | | | | 1,792,700 | |
| Texas Competitive Electric Holdings Co., LLC, Series A, 10.25%, 11/1/2015 | | | | 130,000 | | | | 29,738 | |
| | | | | 13,987,488 | |
Total Corporate Bonds (Cost $339,354,482) | | | | 347,658,790 | |
| | |
| Loan Participations and Assignments 8.0% | |
| Senior Loans* | |
| Caesars Entertainment Operating Co., Term Loan B6, 5.492%, 1/26/2018 | | | | 597,000 | | | | 540,709 | |
| Clear Channel Communication, Inc., Term Loan B, 3.891%, 1/28/2016 | | | | 477,436 | | | | 387,864 | |
| Crown Castle International Corp., Term Loan B, 4.0%, 1/31/2019 | | | | 3,910,200 | | | | 3,902,047 | |
| Del Monte Foods Co., Term Loan, 4.5%, 3/8/2018 | | | | 2,014,775 | | | | 1,989,449 | |
| Dunkin' Brands, Inc., Term Loan B2, 4.0%, 11/23/2017 | | | | 713,638 | | | | 714,237 | |
| First Data Corp., Term Loan B, 4.242%, 3/23/2018 | | | | 3,987,082 | | | | 3,642,199 | |
| Lord & Taylor Holdings LLC, Term Loan B, 5.75%, 1/11/2019 | | | | 1,150,000 | | | | 1,159,706 | |
| PETCO Animal Supplies, Inc., Term Loan, 4.5%, 11/24/2017 | | | | 774,200 | | | | 774,831 | |
| Sealed Air Corp., Term Loan B, 4.75%, 10/3/2018 | | | | 768,300 | | | | 778,196 | |
| Syniverse Technologies, Inc., Term Loan B, 5.25%, 12/21/2017 | | | | 498,687 | | | | 501,476 | |
| Tomkins LLC, Term Loan B, 4.25%, 9/29/2016 | | | | 4,246,288 | | | | 4,255,396 | |
| Volume Services America, Inc., Term Loan A, 10.0%, 9/16/2015 | | | | 2,437,500 | | | | 2,471,016 | |
Total Loan Participations and Assignments (Cost $21,142,938) | | | | 21,117,126 | |
| | | Shares | | | Value ($) | |
| | | | |
| Cash Equivalents 0.5% | |
| Central Cash Management Fund, 0.11% (c) (Cost $1,377,384) | | | 1,377,384 | | | | 1,377,384 | |
| | | % of Net Assets | | | Value ($) | |
| | | | |
Total Investment Portfolio (Cost $361,874,804)+ | | | 140.7 | | | | 370,153,300 | |
| Notes Payable | | | (42.6 | ) | | | (112,000,000 | ) |
| Other Assets and Liabilities, Net | | | 1.9 | | | | 4,918,977 | |
| Net Assets | | | 100.0 | | | | 263,072,277 | |
* Floating rate securities' yields vary with a designated market index or market rate, such as the coupon-equivalent of the U.S. Treasury Bill rate. These securities are shown at their current rate as of March 31, 2012.
+ The cost for federal income tax purposes was $385,057,752. At March 31, 2012, net unrealized depreciation for all securities based on tax cost was $14,904,452. This consisted of aggregate gross unrealized appreciation for all securities in which there was an excess of value over tax cost of $11,989,385 and aggregate gross unrealized depreciation for all securities in which there was an excess of tax cost over value of $26,893,837.
(a) Principal amount stated in U.S. dollars unless otherwise noted.
(b) When-issued security.
(c) Affiliated fund managed by Deutsche Investment Management Americas Inc. The rate shown is the annualized seven-day yield at period end.
144A: Security exempt from registration under Rule 144A of the Securities Act of 1933. These securities may be resold in transactions exempt from registration, normally to qualified institutional buyers.
PIK: Denotes that all or a portion of the income is paid in kind.
REIT: Real Estate Investment Trust
At March 31, 2012, open credit default swap contracts sold were as follows:
Effective/ Expiration Date | | Notional Amount ($) (d) | | | Fixed Cash Flows Received | | Underlying Debt Obligations/Quality Rating (e) | | Value ($) | | | Upfront Payments Paid ($) | | | Unrealized Appreciation ($) | |
12/20/2011 3/20/2017 | | | 705,000 | | | | 5.0 | % | CIT Group, Inc., 5.25%, 2/15/2019, B- | | | 30,924 | | | | 29,538 | | | | 1,386 | |
(d) The maximum potential amount of future undiscounted payments that the Fund could be required to make under a credit default swap contract would be the notional amount of the contract. These potential amounts would be partially offset by any recovery values of the referenced debt obligation or net amounts received from the settlement of buy protection credit default swap contracts entered into by the Fund for the same referenced debt obligation. (e) The quality ratings represent the higher of Moody's Investors Service, Inc. ("Moody's") or Standard & Poor's Corporation ("S&P") credit ratings and are unaudited. | |
As of March 31, 2012, the Fund had the following open forward foreign currency exchange contracts:
| Contracts to Deliver | | In Exchange For | | Settlement Date | | Unrealized Depreciation ($) | | Counterparty |
| EUR | | | 5,891,500 | | USD | | | 7,773,469 | | 4/25/2012 | | | (83,333 | ) | JPMorganChase Securities, Inc. |
| Currency Abbreviations |
EUR Euro USD United States Dollar |
For information on the Fund's policy and additional disclosure regarding credit default swaps and forward foreign currency exchange contracts, please refer to Note B in the accompanying Notes to Financial Statements.
Fair Value Measurements
Various inputs are used in determining the value of the Fund's investments. These inputs are summarized in three broad levels. Level 1 includes quoted prices in active markets for identical securities. Level 2 includes other significant observable inputs (including quoted prices for similar securities, interest rates, prepayment speeds and credit risk). Level 3 includes significant unobservable inputs (including the Fund's own assumptions in determining the fair value of investments). The inputs or methodology used for valuing securities are not necessarily an indication of the risk associated with investing in those securities.
The following is a summary of the inputs used as of March 31, 2012 in valuing the Fund's investments. For information on the Fund's policy regarding the valuation of investments, please refer to the Security Valuation section of Note A in the accompanying Notes to Financial Statements.
| Assets | | Level 1 | | | Level 2 | | | Level 3 | | | Total | |
| | |
| Fixed Income Investments (f) | |
| Corporate Bonds | | $ | — | | | $ | 347,658,790 | | | $ | — | | | $ | 347,658,790 | |
| Loan Participations and Assignments | | | — | | | | 21,117,126 | | | | — | | | | 21,117,126 | |
| Short-Term Investments | | | 1,377,384 | | | | — | | | | — | | | | 1,377,384 | |
| Derivatives (g) | | | — | | | | 1,386 | | | | — | | | | 1,386 | |
| Total | | $ | 1,377,384 | | | $ | 368,777,302 | | | $ | — | | | $ | 370,154,686 | |
| Liabilities | |
| Derivatives (g) | | $ | — | | | $ | (83,333 | ) | | $ | — | | | $ | (83,333 | ) |
| Total | | $ | — | | | $ | (83,333 | ) | | $ | — | | | $ | (83,333 | ) |
There have been no transfers between of Level 1 and Level 2 fair value measurements during the period ended March 31, 2012.
(f) See Investment Portfolio for additional detailed categorizations.
(g) Derivatives include unrealized appreciation (depreciation) on credit default swap contracts and forward foreign currency exchange contracts.
The accompanying notes are an integral part of the financial statements.
Statement of Assets and Liabilities | as of March 31, 2012 (Unaudited) | |
| Assets | |
Investments: Investments in non-affiliated securities, at value (cost $360,497,420) | | $ | 368,775,916 | |
| Investment in Central Cash Management Fund (cost $1,377,384) | | | 1,377,384 | |
| Total investments in securities, at value (cost $361,874,804) | | | 370,153,300 | |
| Cash | | | 598,456 | |
| Foreign currency, at value (cost $100) | | | 100 | |
| Receivable for investments sold | | | 108,396 | |
| Interest receivable | | | 8,198,106 | |
| Unrealized appreciation on swap contracts | | | 1,386 | |
| Upfront payments paid on swap contracts | | | 29,538 | |
| Foreign taxes recoverable | | | 22,100 | |
| Other assets | | | 4,922 | |
| Total assets | | $ | 379,116,304 | |
| Liabilities | |
| Payable for investments purchased | | | 1,512,328 | |
| Payable for investments purchased — when-issued securities | | | 1,675,000 | |
| Notes payable | | | 112,000,000 | |
| Interest on notes payable | | | 197,726 | |
| Unrealized depreciation on forward foreign currency exchange contracts | | | 83,333 | |
| Accrued management fee | | | 270,728 | |
| Other accrued expenses and payables | | | 304,912 | |
| Total liabilities | | | 116,044,027 | |
| Net assets, at value | | $ | 263,072,277 | |
| Net Assets Consist of | |
| Undistributed net investment income | | | 565,364 | |
Net unrealized appreciation (depreciation) on: Investments | | | 8,278,496 | |
| Swap contracts | | | 1,386 | |
| Foreign currency | | | (80,784 | ) |
| Accumulated net realized gain (loss) | | | (606,254,930 | ) |
| Cost of 9,324,192 shares held in Treasury | | | (136,211,432 | ) |
| Paid-in capital | | | 996,774,177 | |
| Net assets, at value | | $ | 263,072,277 | |
| Net Asset Value | |
Class A Net Asset Value per share ($263,072,277 ÷ 16,841,021 shares of common stock issued and outstanding, $.01 par value, 100,000,000 shares authorized) | | $ | 15.62 | |
The accompanying notes are an integral part of the financial statements.
| for the six months ended March 31, 2012 (Unaudited) | |
| Investment Income | |
| Interest (net of foreign taxes withheld of $1,419) | | $ | 13,213,745 | |
| Income distributions — Central Cash Management Fund | | | 3,633 | |
| Total income | | | 13,217,378 | |
Expenses: Management fee | | | 1,790,987 | |
| Administration fee | | | 179,099 | |
| Services to shareholders | | | 1,059 | |
| Custodian fee | | | 14,238 | |
| Professional fees | | | 87,922 | |
| Reports to shareholders | | | 51,443 | |
| Directors' fees and expenses | | | 9,708 | |
| Interest expense | | | 803,598 | |
| Stock exchange listing fees | | | 20,264 | |
| Other | | | 42,724 | |
| Total expenses before expense reductions | | | 3,001,042 | |
| Expense reductions | | | (268,648 | ) |
| Total expenses after expense reductions | | | 2,732,394 | |
| Net investment income | | | 10,484,984 | |
| Realized and Unrealized Gain (Loss) | |
Net realized gain (loss) from: Investments | | | (2,292,121 | ) |
| Swap contracts | | | 490 | |
| Foreign currency | | | 239,854 | |
| | | | (2,051,777 | ) |
Change in net unrealized appreciation (depreciation) on: Investments | | | 32,201,087 | |
| Swap contracts | | | 1,386 | |
| Foreign currency | | | (190,476 | ) |
| | | | 32,011,997 | |
| Net gain (loss) | | | 29,960,220 | |
| Net increase (decrease) in net assets resulting from operations | | $ | 40,445,204 | |
The accompanying notes are an integral part of the financial statements.
| for the six months ended March 31, 2012 (Unaudited) | |
Increase (Decrease) in Cash: Cash Flows from Operating Activities | | | |
| Net increase (decrease) in net assets resulting from operations | | $ | 40,445,204 | |
Adjustments to reconcile net increase (decrease) in net assets resulting from operations to net cash provided (used) by operating activities: Purchases of long-term investments | | | (69,727,067 | ) |
| Net purchases, sales and maturities of short-term investments | | | 2,722,740 | |
| Net amortization/accretion of premium (discount) | | | 569,895 | |
| Proceeds from sales and maturities of long-term investments | | | 54,448,850 | |
| (Increase) decrease in receivable for investments sold | | | 125,325 | |
| (Increase) decrease in interest receivable | | | (51,150 | ) |
| (Increase) decrease in upfront payments paid on swap contracts | | | (29,538 | ) |
| (Increase) decrease in other assets | | | 10,006 | |
| Increase (decrease) in interest on notes payable | | | 163,577 | |
| Increase (decrease) in payable for investments purchased and investments purchased — when-issued securities | | | (1,353,032 | ) |
| Increase (decrease) in other accrued expenses and payables | | | (21,060 | ) |
| Change in unrealized (appreciation) depreciation on investments | | | (32,201,087 | ) |
| Change in unrealized (appreciation) depreciation on swaps | | | (1,386 | ) |
| Change in net unrealized (appreciation) depreciation on forward foreign currency exchange contracts | | | 197,361 | |
| Net realized (gain) loss from investments | | | 2,292,121 | |
| Cash provided (used) by operating activities | | $ | (2,409,241 | ) |
| Cash Flows from Financing Activities | | | | |
| Net increase (decrease) in notes payable | | | 14,000,000 | |
| Distributions paid to shareholders | | | (11,758,449 | ) |
| Cash provided (used) for financing activities | | | 2,241,551 | |
| Increase (decrease) in cash | | | (167,690 | ) |
| Cash at beginning of period (including foreign currency) | | | 766,246 | |
| Cash at end of period (including foreign currency) | | $ | 598,556 | |
| Supplemental Disclosure | | | | |
| Interest paid on notes | | | (640,021 | ) |
The accompanying notes are an integral part of the financial statements.
Statement of Changes in Net Assets | Increase (Decrease) in Net Assets | | Six Months Ended March 31, 2012 (Unaudited) | | | Year Ended September 30, 2011 | |
Operations: Net investment income | | $ | 10,484,984 | | | $ | 22,811,682 | |
| Net realized gain (loss) | | | (2,051,777 | ) | | | (83,714,607 | ) |
| Change in net unrealized appreciation (depreciation) | | | 32,011,997 | | | | 67,530,934 | |
| Net increase (decrease) in net assets resulting from operations | | | 40,445,204 | | | | 6,628,009 | |
Distributions to shareholders from: Net investment income | | | (11,758,449 | ) | | | (25,724,865 | ) |
| Total distributions | | | (11,758,449 | ) | | | (25,724,865 | ) |
Fund share transactions: Cost of shares tendered | | | — | | | | (91,827,570 | ) |
| Cost of shares repurchased | | | — | | | | (19,834,658 | ) |
| Net increase (decrease) in net assets from Fund share transactions | | | — | | | | (111,662,228 | ) |
| Increase (decrease) in net assets | | | 28,686,755 | | | | (130,759,084 | ) |
| Net assets at beginning of period | | | 234,385,522 | | | | 365,144,606 | |
| Net assets at end of period (including undistributed net investment income of $565,364 and $1,838,829, respectively) | | $ | 263,072,277 | | | $ | 234,385,522 | |
| Other Information | |
| Shares outstanding at beginning of period | | | 16,841,021 | | | | 24,293,008 | |
| Shares tendered | | | — | | | | (6,073,252 | ) |
| Shares repurchased | | | — | | | | (1,378,735 | ) |
| Shares outstanding at end of period | | | 16,841,021 | | | | 16,841,021 | |
The accompanying notes are an integral part of the financial statements.
| | | | | | Years Ended September 30, | | | | |
| | | Six Months Ended 3/31/12 (Unaudited) | | | 2011 | | | 2010 | | | | 2009 | g | | | 2008 | g | | Period Ended 9/30/07a,g | |
| Selected Per Share Data | |
| Net asset value, beginning of period | | $ | 13.92 | | | $ | 15.03 | | | $ | 13.58 | | | $ | 20.67 | | | $ | 35.83 | | | $ | 38.20 | d |
Income (loss) from investment operations: Net investment incomeb | | | .62 | | | | 1.25 | | | | 1.03 | | | | 1.16 | | | | 2.86 | | | | 2.76 | |
| Net realized and unrealized gain (loss) | | | 1.78 | | | | (1.09 | ) | | | 1.19 | | | | (6.79 | ) | | | (14.86 | ) | | | (2.91 | ) |
| Total from investment operations | | | 2.40 | | | | .16 | | | | 2.22 | | | | (5.63 | ) | | | (12.00 | ) | | | (.15 | ) |
Less distributions from: Net investment income | | | (.70 | ) | | | (1.42 | ) | | | (.88 | ) | | | (1.42 | ) | | | (3.18 | ) | | | (2.16 | ) |
| Return of capital | | | — | | | | — | | | | — | | | | (.06 | ) | | | — | | | | — | |
| Total distributions | | | (.70 | ) | | | (1.42 | ) | | | (.88 | ) | | | (1.48 | ) | | | (3.18 | ) | | | (2.16 | ) |
NAV accretion resulting from repurchases of shares and shares tendered at valueb | | | — | | | | .15 | | | | .11 | | | | .02 | | | | .02 | | | | .00 | *** |
| Offering costs charged to paid-in capital | | | — | | | | — | | | | — | | | | — | | | | — | | | | (.06 | ) |
| Net asset value, end of period | | $ | 15.62 | | | $ | 13.92 | | | $ | 15.03 | | | $ | 13.58 | | | $ | 20.67 | | | $ | 35.83 | |
| Market value, end of period | | $ | 16.03 | | | $ | 13.07 | | | $ | 13.40 | | | $ | 11.18 | | | $ | 16.60 | | | $ | 30.04 | |
| Total Return | |
Based on net asset value (%)c | | | 17.66 | e** | | | 2.16 | e | | | 18.67 | e | | | (22.28 | ) | | | (34.70 | ) | | | (.23 | )** |
Based on market value (%)c | | | 28.61 | ** | | | 7.66 | | | | 28.42 | | | | (20.29 | ) | | | (37.47 | ) | | | (20.15 | )** |
| Ratios to Average Net Assets and Supplemental Data | |
| Net assets, end of period ($ millions) | | | 263 | | | | 234 | | | | 365 | | | | 350 | | | | 539 | | | | 937 | |
Ratio of expenses before fee reductions (including interest expense and dividend expense for securities sold short) (%)h | | | 2.37 | * | | | 2.52 | | | | 1.64 | | | | 2.42 | | | | 2.63 | | | | 4.17 | * |
Ratio of expenses after fee reductions (including interest expense and dividend expense for securities sold short) (%)h | | | 2.16 | * | | | 2.31 | | | | 1.50 | | | | 2.42 | | | | 2.63 | | | | 4.17 | * |
Financial Highlights (continued) | |
| | | | | | Years Ended September 30, | | | | |
| | Six Months Ended 3/31/12 (Unaudited) | | | 2011 | | | 2010 | | | | 2009 | g | | | 2008 | g | | Period Ended 9/30/07a,g | |
Ratio of expenses after fee reductions (excluding interest expense and dividend expense for securities sold short) (%)h | | | 1.52 | * | | | 1.68 | | | | 1.24 | | | | 1.54 | | | | 1.47 | | | | 1.61 | * |
| Ratio of net investment income (%) | | | 8.27 | * | | | 8.08 | | | | 7.18 | | | | 10.40 | | | | 9.23 | | | | 8.65 | * |
| Portfolio turnover rate (%) | | | 16 | ** | | | 134 | | | | 154 | | | | 27 | | | | 75 | | | | 160 | ** |
| Total debt outstanding, end of period ($ thousands) | | | 112,000 | | | | 98,000 | | | | 50,000 | | | | 15,000 | | | | 266,000 | | | | — | |
Asset coverage per $1,000 of debtf | | | 3,349 | | | | 3,392 | | | | 8,303 | | | | 24,362 | | | | 3,026 | | | | — | |
a For the period from November 22, 2006 (commencement of operations) to September 30, 2007. b Based on average shares outstanding during the period. c Total return based on net asset value reflects changes in the Fund's net asset value during the period. Total return based on market value reflects changes in market value. Each figure assumes that dividend and capital gain distributions, if any, were reinvested. These figures will differ depending upon the level of any discount from or premium to net asset value at which the Fund's shares traded during the period. d Beginning per share amount reflects $20.00 initial public offering price net of sales load ($0.90 per share). Adjusted to reflect the effects of a 1 for 2 reverse stock split. e Total return would have been lower had certain fees not been reduced. f Asset coverage equals the total net assets plus borrowings of the Fund divided by the borrowings outstanding at period end. g Per share data, including the proportionate impact to market price, have been restated to reflect the effects of a 1 for 2 reverse stock split effective prior to the opening of trading on the NYSE on August 10, 2009. h Prior to November 5, 2010, the Fund utilized short sales as part of the hedge strategy that sought to provide returns that were uncorrelated with the market. * Annualized ** Not annualized *** Amount is less than $.005. |
Notes to Financial Statements (Unaudited)
A. Organization and Significant Accounting Policies
DWS High Income Opportunities Fund, Inc. (formerly DWS Dreman Value Income Edge Fund, Inc.) (the "Fund") is registered under the Investment Company Act of 1940, as amended (the "1940 Act''), as a closed-end, non-diversified management investment company organized as a Maryland corporation.
The Fund's financial statements are prepared in accordance with accounting principles generally accepted in the United States of America which require the use of management estimates. Actual results could differ from those estimates. The policies described below are followed consistently by the Fund in the preparation of its financial statements.
Security Valuation. Investments are stated at value determined as of the close of regular trading on the New York Stock Exchange on each day the exchange is open for trading.
Various inputs are used in determining the value of the Fund's investments. These inputs are summarized in three broad levels. Level 1 includes quoted prices in active markets for identical securities. Level 2 includes other significant observable inputs (including quoted prices for similar securities, interest rates, prepayment speeds, and credit risk). Level 3 includes significant unobservable inputs (including the Fund's own assumptions in determining the fair value of investments). The inputs or methodology used for valuing securities are not necessarily an indication of the risk associated with investing in those securities.
Debt securities and senior loans are valued at prices supplied by independent pricing services approved by the Fund's Board. If the pricing services are unable to provide valuations, securities are valued at the most recent bid quotation or evaluated price, as applicable, obtained from one or more broker-dealers. Such services may use various pricing techniques which take into account appropriate factors such as yield, quality, coupon rate, maturity, type of issue, trading characteristics and other data, as well as broker quotes. These securities are generally categorized as Level 2.
Money market instruments purchased with an original or remaining maturity of sixty days or less, maturing at par, are valued at amortized cost, which approximates value, and are categorized as Level 2. Investments in open-end investment companies are valued at their net asset value each business day and are categorized as Level 1.
Forward currency contracts are valued at the prevailing forward exchange rate of the underlying currencies and are categorized as Level 2.
Swap contracts are valued daily based upon prices supplied by a Board-approved pricing vendor, if available, and otherwise are valued at the price provided by the broker-dealer. Swap contracts are generally categorized as Level 2.
Securities and other assets for which market quotations are not readily available or for which the above valuation procedures are deemed not to reflect fair value are valued in a manner that is intended to reflect their fair value as determined in accordance with procedures approved by the Board and are generally categorized as Level 3. In accordance with the Fund's valuation procedures, factors used in determining value may include, but are not limited to, the type of the security; the size of the holding; the initial cost of the security; the existence of any contractual restrictions on the security's disposition; the price and extent of public trading in similar securities of the issuer or of comparable companies; quotations or evaluated prices from broker-dealers and/or pricing services; information obtained from the issuer, analysts, and/or the appropriate stock exchange (for exchange-traded securities); an analysis of the company's or issuer's financial statements; an evaluation of the forces that influence the issuer and the market(s) in which the security is purchased and sold and with respect to debt securities; the maturity, coupon, creditworthiness, currency denomination, and the movement of the market in which the security is normally traded. The value determined under these procedures may differ from published values for the same securities.
Disclosure about the classification of fair value measurements is included in a table following the Fund's Investment Portfolio.
Foreign Currency Translations. The books and records of the Fund are maintained in U.S. dollars. Investment securities and other assets and liabilities denominated in a foreign currency are translated into U.S. dollars at the prevailing exchange rates at period end. Purchases and sales of investment securities, income and expenses are translated into U.S. dollars at the prevailing exchange rates on the respective dates of the transactions.
Net realized and unrealized gains and losses on foreign currency transactions represent net gains and losses between trade and settlement dates on securities transactions, the acquisition and disposition of foreign currencies, and the difference between the amount of net investment income accrued and the U.S. dollar amount actually received. That portion of both realized and unrealized gains and losses on investments that results from fluctuations in foreign currency exchange rates is not separately disclosed but is included with net realized and unrealized gain/appreciation and loss/depreciation on investments.
When-Issued/Delayed Delivery Securities. The Fund may purchase or sell securities with delivery or payment to occur at a later date beyond the normal settlement period. At the time the Fund enters into a commitment to purchase or sell a security, the transaction is recorded and the value of the transaction is reflected in the net asset value. The price of such security and the date when the security will be delivered and paid for are fixed at the time the transaction is negotiated. The value of the security may vary with market fluctuations. At the time the Fund enters into a purchase transaction it is required to segregate cash or other liquid assets at least equal to the amount of the commitment.
Certain risks may arise upon entering into when-issued or delayed delivery transactions from the potential inability of counterparties to meet the terms of their contracts or if the issuer does not issue the securities due to political, economic, or other factors. Additionally, losses may arise due to changes in the value of the underlying securities.
Loan Participations and Assignments. Senior loans are portions of loans originated by banks and sold in pieces to investors. These U.S. dollar-denominated fixed and floating rate loans ("Loans") in which the Fund invests, are arranged through private negotiations between the borrower and one or more financial institutions ("Lenders"). The Fund invests in such Loans in the form of participations in Loans ("Participations") or assignments of all or a portion of loans from third parties ("Assignments"). Participations typically result in the Fund having a contractual relationship only with the Lender, not with the borrower. The Fund has the right to receive payments of principal, interest and any fees to which it is entitled from the Lender selling the Participation and only upon receipt by the Lender of the payments from the borrower. In connection with purchasing Participations, the Fund generally has no right to enforce compliance by the borrower with the terms of the loan agreement relating to the Loan, nor any rights of set-off against the borrower, and the Fund will not benefit directly from any collateral supporting the Loan in which it has purchased the Participation. As a result, the Fund assumes the credit risk of both the borrower and the Lender that is selling the Participation. Assignments typically result in the Fund having a direct contractual relationship with the borrower, and the Fund may enforce compliance by the borrower with the terms of the loan agreement. Senior Loans held by the Fund are generally in the form of Assignments but the Fund may also invest in Participations. All Senior Loans involve interest rate risk, liquidity risk and credit risk, including the potential default or insolvency of the borrower.
Federal Income Taxes. The Fund's policy is to comply with the requirements of the Internal Revenue Code, as amended, which are applicable to regulated investment companies, and to distribute all of its taxable income to its shareholders.
Under the Regulated Investment Company Modernization Act of 2010, net capital losses may be carried forward indefinitely, and their character is retained as short-term and/or long-term. Previously, net capital losses were carried forward for eight years and treated as short-term losses. As a transition rule, the Act requires that post-enactment net capital losses be used before pre-enactment net capital losses.
At September 30, 2011, the Fund had a net tax basis capital loss carryforward of approximately $511,896,000, which may be applied against any realized net taxable capital gains of each succeeding year until fully utilized or until September 30, 2016 ($58,426,000), September 30, 2017 ($198,233,000), September 30, 2018 ($243,689,000) and September 30, 2019 ($11,548,000), the respective expiration dates, whichever occurs first.
The Fund has reviewed the tax positions for the open tax years as of September 30, 2011 and has determined that no provision for income tax is required in the Fund's financial statements. The Fund's federal tax returns for the prior three fiscal years remain open subject to examination by the Internal Revenue Service.
Distribution of Income and Gains. Net investment income of the Fund is declared and distributed to shareholders monthly. Net realized gains from investment transactions, in excess of available capital loss carryforwards, would be taxable to the Fund if not distributed, and, therefore, will be distributed to shareholders at least annually.
The timing and characterization of certain income and capital gain distributions are determined annually in accordance with federal tax regulations which may differ from accounting principles generally accepted in the United States of America. These differences primarily relate to certain securities sold at a loss and forward foreign currency commitments. As a result, net investment income (loss) and net realized gain (loss) on investment transactions for a reporting period may differ significantly from distributions during such period. Accordingly, the Fund may periodically make reclassifications among certain of its capital accounts without impacting the net asset value of the Fund.
The tax character of current year distributions will be determined at the end of the current fiscal year.
Statement of Cash Flows. Information on financial transactions which have been settled through the receipt and disbursement of cash is presented in the Statement of Cash Flows. The cash amount shown in the Statement of Cash Flows represents the cash and foreign currency position at the Fund's custodian bank at March 31, 2012.
Contingencies. In the normal course of business, the Fund may enter into contracts with service providers that contain general indemnification clauses. The Fund's maximum exposure under these arrangements is unknown as this would involve future claims that may be made against the Fund that have not yet been made. However, based on experience, the Fund expects the risk of loss to be remote.
Other. Investment transactions are accounted for on a trade date plus one basis for daily net asset value calculations. However, for financial reporting purposes, investment transactions are reported on trade date. Interest income is recorded on the accrual basis. Dividend income is recorded on the ex-dividend date, net of foreign withholding taxes. Realized gains and losses from investment transactions are recorded on an identified cost basis and may include proceeds from litigation. All premiums and discounts are amortized/accreted for financial reporting purposes, with the exception of securities in default of principal.
B. Derivative Instruments
Credit Default Swap Contracts. A credit default swap is a contract between a buyer and a seller of protection against pre-defined credit events for the reference entity. For the six months ended March 31, 2012, the Fund sold credit default swap contracts to gain exposure to an underlying issuer's credit quality characteristics. As a seller in the credit default swap contract, the Fund is required to pay the par (or other agreed-upon) value of the referenced entity to the counterparty with the occurrence of a credit event by a third party, such as a U.S. or foreign corporate issuer, on the reference entity, which would likely result in a loss to the Fund. In return, the Fund receives from the counterparty a periodic stream of payments over the term of the contract provided that no credit event has occurred. If no credit event occurs, the Fund keeps the stream of payments with no payment obligations. As a buyer in the credit default swap contract, the Fund functions as the counterparty referenced above. This involves the risk that the contract may expire worthless. It also involves counterparty risk that the seller may fail to satisfy its payment obligations to the Fund with the occurrence of a credit event. When the Fund sells a credit default swap contract it will cover its commitment. This is achieved by, among other methods, maintaining cash or liquid assets equal to the aggregate notional value of the reference entities for all outstanding credit default swap contracts sold by the Fund.
The value of the credit default swap is adjusted daily and the change in value, if any, is recorded daily as unrealized appreciation or depreciation in the Statement of Assets and Liabilities. An upfront payment, if any, made by the Fund is recorded as an asset in the Statement of Assets and Liabilities. An upfront payment, if any, received by the Fund is recorded as a liability in the Statement of Assets and Liabilities. Under the terms of the credit default swap contracts, the Fund receives or makes quarterly payments based on a specified interest rate on a fixed notional amount. These payments are recorded as a realized gain or loss in the Statement of Operations. Payments received or made as a result of a credit event or termination of the contract are recognized, net of a proportional amount of the upfront payment, as realized gains or losses in the Statement of Operations.
A summary of the open credit default swap contracts as of March 31, 2012 is included in a table following the Fund's Investment Portfolio. For the six months ended March 31, 2012, the investment in credit default swap contracts sold had a total notional value generally indicative of a range from $0 to $705,000.
Forward Foreign Currency Exchange Contracts. A forward foreign currency exchange contract ("forward currency contract") is a commitment to purchase or sell a foreign currency at the settlement date at a negotiated rate. For the six months ended March 31, 2012, the Fund entered into forward currency contracts in order to hedge its exposure to changes in foreign currency exchange rates on its foreign currency denominated portfolio holdings and to facilitate transactions in foreign currency denominated securities.
Forward currency contracts are valued at the prevailing forward exchange rate of the underlying currencies and unrealized gain (loss) is recorded daily. On the settlement date of the forward currency contract, the Fund records a realized gain or loss equal to the difference between the value of the contract at the time it was opened and the value of the contract at the time it was closed. Certain risks may arise upon entering into forward currency contracts from the potential inability of counterparties to meet the terms of their contracts. The maximum counterparty credit risk to the Fund is measured by the unrealized gain on appreciated contracts. Additionally, when utilizing forward currency contracts to hedge, the Fund gives up the opportunity to profit from favorable exchange rate movements during the term of the contract.
A summary of the open forward currency contracts as of March 31, 2012 is included in a table following the Fund's Investment Portfolio. For the six months ended March 31, 2012, the investment in forward currency contracts short vs. U.S. dollars had a total contract value generally indicative of a range from approximately $6,332,000 to $7,773,000, and the investment in forward currency contracts long vs. U.S. dollars had a total contract value generally indicative of a range from $0 to approximately $143,000.
The following tables summarize the value of the Fund's derivative instruments held as of March 31, 2012 and the related location in the accompanying Statement of Assets and Liabilities, presented by primary underlying risk exposure:
| Asset Derivative | | Swap
Contracts | |
| Credit Contracts (a) | | $ | 1,386 | |
The above derivative is located in the following Statement of Assets and Liabilities account:
(a) Unrealized appreciation on swap contracts
| Liability Derivative | | Forward Contracts | |
| Foreign Exchange Contracts (a) | | $ | (83,333 | ) |
The above derivative is located in the following Statement of Assets and Liabilities account:
(a) Unrealized depreciation on forward foreign currency exchange contracts
Additionally, the amount of unrealized and realized gains and losses on derivative instruments recognized in Fund earnings during the six months ended March 31, 2012 and the related location in the accompanying Statement of Operations is summarized in the following tables by primary underlying risk exposure:
| Realized Gain (Loss) | | Forward Contracts | | | Swap
Contracts | | | Total | |
| Credit Contracts (a) | | $ | — | | | $ | 490 | | | $ | 490 | |
| Foreign Exchange Contracts (b) | | | 286,105 | | | | — | | | | 286,105 | |
| | | $ | 286,105 | | | $ | 490 | | | $ | 286,595 | |
Each of the above derivatives is located in the following Statement of Operations accounts:
(a) Net realized gain (loss) from swap contracts
(b) Net realized gain (loss) from foreign currency (Statement of Operations includes both forward currency contracts and foreign currency transactions)
| Change in Net Unrealized Appreciation (Depreciation) | | Forward Contracts | | | Swap
Contracts | | | Total | |
| Credit Contracts (a) | | $ | — | | | $ | 1,386 | | | $ | 1,386 | |
| Foreign Exchange Contracts (b) | | | (197,361 | ) | | | — | | | | (197,361 | ) |
| | | $ | (197,361 | ) | | $ | 1,386 | | | $ | (195,975 | ) |
Each of the above derivatives is located in the following Statement of Operations accounts:
(a) Change in net unrealized appreciation (depreciation) on swap contracts
(b) Change in net unrealized appreciation (depreciation) on foreign currency (Statement of Operations includes both forward currency contracts and foreign currency transactions)
C. Purchases and Sales of Securities
During the six months ended March 31, 2012, purchases and sales of investment securities (excluding short-term instruments and short sales transactions) aggregated $69,727,067 and $54,448,850, respectively.
D. Related Parties
Management Agreement. Under the Investment Management Agreement with Deutsche Investment Management Americas, Inc. ("DIMA" or the "Advisor"), an indirect, wholly owned subsidiary of Deutsche Bank AG, the Advisor directs the investments of the Fund in accordance with its investment objectives, policies and restrictions. The management fee payable under the Investment Management Agreement is equal to an annual rate of 1.00% of the Fund's average daily managed assets, computed and accrued daily and payable monthly. Total managed assets equal the net asset value of the common shares plus the principal amount of any borrowings.
For the period from October 1, 2011 through September 30, 2012, the Advisor has contractually agreed to waive 0.15% of its management fee.
Accordingly, for the six months ended March 31, 2012, the fee pursuant to the Investment Management Agreement aggregated $1,790,987, of which $268,648 was waived, resulting in an annualized effective rate of 0.85% of the Fund's average daily managed assets.
Administration Fee. Pursuant to an Administrative Services Agreement, DIMA provides most administrative services to the Fund. For all services provided under the Administrative Services Agreement, the Fund pays the Advisor an annual fee ("Administration Fee") of 0.10% of the Fund's average daily managed assets, computed and accrued daily and payable monthly. For the six months ended March 31, 2012, the Administration Fee was $179,099, of which $31,850 is unpaid.
Service Provider Fees. DWS Investments Service Company ("DISC"), an affiliate of the Advisor, is the transfer agent and dividend-paying agent for the Fund. Pursuant to a sub-transfer agency agreement between DISC and DST Systems, Inc. ("DST"), DISC has delegated certain transfer agent and dividend-paying agent functions to DST. DISC compensates DST out of the shareholder servicing fee it receives from the Fund. For the six months ended March 31, 2012, the amount charged to the Fund by DISC aggregated $144, of which $49 is unpaid.
Typesetting and Filing Service Fees. Under an agreement with DIMA, DIMA is compensated for providing typesetting and certain regulatory filing services to the Fund. For the six months ended March 31, 2012, the amount charged to the Fund by DIMA included in the Statement of Operations under "reports to shareholders" aggregated $7,861, all of which is unpaid.
Directors' Fees and Expenses. The Fund paid each Director not affiliated with the Advisor retainer fees plus specified amounts for various committee services and for the Board Chairperson.
Affiliated Cash Management Vehicle. The Fund may invest uninvested cash balances in Central Cash Management Fund, which is managed by the Advisor. The Fund indirectly bears its proportionate share of the expenses of Central Cash Management Fund. Central Cash Management Fund does not pay the Advisor an investment management fee. Central Cash Management Fund seeks a high level of current income consistent with liquidity and the preservation of capital.
E. Investing in High-Yield Securities
The Fund's performance could be hurt if a security declines in credit quality or goes into default, or if an issuer does not make timely payments of interest or principal. Because the issuers of high-yield debt securities or junk bonds (debt securities rated below the fourth-highest category) may be in uncertain financial health, the prices of their debt securities can be more vulnerable to bad economic news, or even the expectation of bad news, than investment-grade debt securities. Because the Fund may invest in securities not paying current interest or in securities already in default, these risks may be more pronounced.
F. Borrowings
The Fund has a secured line of credit with a commercial bank with a commitment amount up to $125,000,000 with a maturity date of September 24, 2012. The note bears interest at the higher of either the Overnight Federal Funds rate, the Overnight LIBOR rate or the LIBOR Term Rate, plus 1.05%. At March 31, 2012, this was 1.29%. A commitment fee on the unused portion of the facility is charged to the Fund and is included with "interest expense" in the Statement of Operations.
At March 31, 2012, the Fund had a notes payable outstanding of $112,000,000. The weighted average outstanding daily balance of all loans during the six months ended March 31, 2012 was approximately $104,082,000, with a weighted average interest rate of 1.54%. The borrowings were valued at cost, which approximates fair value.
Leverage involves risks and special considerations for the Fund's stockholders, including the likelihood of greater volatility of net asset value and market price of, and dividends on, the Fund's shares than a comparable portfolio without leverage; the risk that fluctuations in interest rates on such borrowings will reduce the return to stockholders; and the effect of leverage in a declining market, which is likely to cause a greater decline in the net asset value of the Fund's shares than if the Fund were not leveraged, which may result in a greater decline in the market price of the Fund's shares.
Changes in the value of the Fund's portfolio will be borne by the stockholders. If there is a net decrease (or increase) in the value of the Fund's investment portfolio, leverage will decrease (or increase) the net asset value per share to a greater extent than if leverage were not used. It is also possible that the Fund will be required to sell assets at a time when it would otherwise not do so, possibly at a loss, in order to redeem or meet payment obligations on borrowings to comply with asset coverage or other restrictions imposed by the lender. The Fund is subject to certain restrictions on its investments under the terms of its credit agreement. Moreover, certain covenants contained in the credit agreement impose asset coverage or portfolio composition requirements that are more stringent than those imposed on the Fund by the 1940 Act.
During periods in which the Fund is using leverage, the fees received by the Advisor for investment management and advisory services will be higher than if the Fund did not use leverage because the fees paid will be calculated on the basis of the Fund's total managed assets, including proceeds from the use of leverage.
There is no assurance that the Fund's leveraging strategy will be successful.
G. Share Repurchases
The Board of Directors previously authorized the Fund to effect periodic repurchases for up to 5% of its shares in the open market from time to time during the period from December 1, 2009 through November 30, 2010, when the Fund's shares traded at a discount to their net asset value. For the period ended November 30, 2010, the Board also ratified the repurchase of 113,166 shares in excess of the 5% limit. There were no share repurchases for the period from October 1, 2010 through November 30, 2010 under this program.
The Board of Directors previously authorized the Fund to effect periodic repurchases for up to 5% of its shares in the open market from time to time when the Fund's shares trade at a discount to their net asset value during the period December 1, 2010 through November 30, 2011. During the year ended September 30, 2011, the Fund purchased 26,080 shares of common stock on the open market at a total cost of $343,845 ($13.18 average per share) under this program. The average discount of these purchases, comparing the purchase price to the net asset value at the time of purchase, was approximately 8.6%.
On October 4, 2010, the Fund announced that the Board has also approved an enhancement to the current program for the Fund to purchase its own shares on the open market, which was in effect from December 1, 2010 until May 31, 2011. Under the enhanced program, during times when the Fund's common shares were trading on the NYSE at a discount to net asset value per share in excess of 5%, the Fund repurchased up to a maximum of 2% of its total outstanding common shares per month. This enhanced repurchase program was in addition to the above-referenced one-year extension of the Fund's existing repurchase program, under which the Fund is permitted to purchase an aggregate of up to 5% of its outstanding shares over the period from December 1, 2010 until November 30, 2011. During the year ended September 30, 2011, the Fund purchased 1,352,655 shares of common stock on the open market at a total cost of $19,490,813 ($14.41 average per share) under this enhanced repurchase program. The average discount of these purchases, comparing the purchase price to the net asset value at the time of purchase was approximately 7.8%. There were no share repurchases for the period from October 1, 2011 through November 30, 2011 under this enhanced repurchase program.
In addition, the Board of Directors has authorized the Fund to effect periodic repurchases for up to 5% of its shares in the open market from time to time when the Fund's shares trade at a discount to their net asset value during the period December 1, 2011 through November 30, 2012. There were no share repurchases for the period from December 1, 2011 through March 31, 2012 under this program.
H. Tender Offer
On October 4, 2010, the Fund announced that its Board of Directors had authorized the Fund to conduct an issuer self-tender offer to purchase up to 25% of its outstanding common shares for cash at a price per share equal to 99% of its NAV as of the close of trading on the NYSE on the day after the date on which the offer expired. The offer commenced on October 22, 2010 and expired on November 19, 2010. The Fund accepted 6,073,252 tendered shares at a price equal to 99% of the net asset value per share as of the close of the regular trading session of the New York Stock Exchange on November 22, 2010. Approximately 11,332,261 shares of common stock, or approximately 47% of the fund's common stock outstanding, were tendered through the expiration date. Because the offer was oversubscribed, not all of the tendered shares were accepted for payment by the Fund. Under the final pro-ration calculation, approximately 54% of the tendered shares were accepted for payment. The shares accepted for payment received cash at a repurchase price of $15.12 per share, which was equal to 99% of the Fund's net asset value per share on November 22, 2010.
Dividend Reinvestment and Cash Purchase Plan
The Board of Directors of the Fund has established a Dividend Reinvestment and Cash Purchase Plan (the "Plan") for shareholders that elect to have all dividends and distributions automatically reinvested in shares of common stock of the Fund (each a "Participant"). Computershare Inc. (the "Plan Agent") has been appointed by the Fund's Board of Directors to act as agent for each Participant.
A summary of the Plan is set forth below. Shareholders may obtain a copy of the entire Dividend Reinvestment and Cash Purchase Plan by visiting the Fund's Web site at www.dws-investments.com or by calling (800) 349-4281.
Whenever the Fund declares an income dividend or a capital gain distribution payable in common shares or cash at the option of the shareholders, each Participant is deemed to have elected to take such dividend or distribution entirely in additional shares of common stock of the Fund. If the market price per share of the Fund's common stock on the valuation date equals or exceeds the net asset value per share on the valuation date, the number of additional shares to be issued by the Fund and credited to the Participant's account shall be determined by dividing the dollar amount of the dividend or capital gain distribution payable on the Participant's shares by the greater of the following amounts per share of the Fund's common stock on the valuation date: (a) the net asset value, or (b) 95% of the market price. If the market price per share of the Common Shares on the valuation date is less than the net asset value per share on the valuation date, the Plan Agent shall apply the dollar amount of the dividend or capital gain distribution on such Participant's shares (less such Participant's pro rata share of brokerage commissions incurred with respect to the Plan Agent's open-market purchases in connection with the reinvestment of such dividend and distribution) to the purchase on the open market of shares of the common stock for the Participant's account. Should the Fund declare an income dividend or capital gain distribution payable only in cash, the amount of such dividend or distribution on each Participant's shares (less such Participant's pro rata share of brokerage commissions incurred with respect to open-market purchases in connection with the reinvestment of such dividend or distribution) shall be applied to the purchase on the open market of shares of common stock for the Participant's account. Each Participant, semiannually, also has the option of sending additional funds, in any amount from $100 to $3,000, for the purchase on the open market of shares of common stock for such Participant's account. Voluntary payments will be invested by the Plan Agent on or shortly after the 15th of February and August, and in no event more than 45 days after such dates, except where temporary curtailment or suspension of purchases is necessary to comply with applicable provisions of federal securities law. Optional cash payments received from a Participant on or prior to the fifth day preceding the 15th of February or August will be applied by the Plan Agent to the purchase of additional shares of common stock as of that investment date. Funds received after the fifth day preceding the 15th of February or August and prior to the 30th day preceding the next investment date will be returned to the Participant. No interest will be paid on optional cash payments held until investment. Consequently, Participants are strongly urged to make their optional cash payments shortly before the 15th of February or August. Optional cash payments should be made in U.S. dollars and be sent by first-class mail, postage prepaid, to the Fund's transfer agent and dividend-disbursing agent at the following address:
DWS High Income Opportunities Fund, Inc.
Dividend Reinvestment and Cash Purchase Plan
210 West 10th Street, Kansas City, MO 64105
(800) 294-4366
Participants may withdraw their entire voluntary cash payment by written notice received by the Plan Agent not less than 48 hours before such payment is to be invested.
Investment of voluntary cash payments and other open-market purchases may be made on any securities exchange where the shares of common stock are traded, in the OTC market or in negotiated transactions.
A statement reflecting the amount of cash received by the Fund's Transfer Agent will be issued on receipt of each cash deposit. The statements are the record of the costs of shares and should be retained for tax purposes.
The reinvestment of dividends and capital gain distributions does not relieve the Participant of any tax that may be payable on such dividends and distributions. The Fund's Transfer Agent will report to each Participant the taxable amount of dividends and distributions credited to his or her account. Participants will be treated as receiving the amount of the distributions made by the Fund, which amount generally will be either equal to the amount of the cash distribution the shareholder would have received if the shareholder had elected to receive cash or, for shares issued by the Fund, the fair market value of the shares issued to the shareholder.
The service fees for handling capital gain distributions or income dividends will be paid by the Fund. Participants will be charged a $1.00 service fee for each optional cash investment and a pro rata share of brokerage commissions on all open market purchases.
Participants may terminate their accounts under the Plan by notifying the Fund's Transfer Agent in writing. Such termination will be effective immediately if such Participant's notice is received by the Fund's Transfer Agent not less than ten days prior to any dividend or distribution record date; otherwise such termination will be effective as soon as practicable upon completion of the reinvestment of capital gain distributions or income dividends. The Plan may be terminated by the Fund upon notice in writing mailed to Participants at least 30 days prior to any record date for the payment of any dividend or distribution by the Fund. The terms and conditions of the Plan may be amended or supplemented by the Fund at any time or times, but, except when necessary or appropriate to comply with applicable law or the rules or policies of the Securities and Exchange Commission, any securities exchange on which shares of the Fund are listed, or any other regulatory authority and with certain other limited exceptions, only by mailing to Participants appropriate written notice at least 30 days prior to the effective date thereof.
If a Participant elects by notice to the Plan Agent in writing in advance of such termination to have the Plan Agent sell part or all of such Participant's shares and remit the proceeds to such Participant, the Plan Agent is authorized to deduct a fee of 5% of the gross proceeds, to a maximum of $3.50, plus brokerage commissions for this transaction and any transfer taxes.
All correspondence and inquiries concerning the Plan, and requests for additional information about the Plan, should be directed to DWS Investments Service Company at P.O. Box 219066, Kansas City, Missouri 64105 or (800) 294-4366.
| |
| Automated Information Line | | DWS Investments Closed-End Fund Info Line (800) 349-4281 |
| Web Site | | www.dws-investments.com Obtain fact sheets, financial reports, press releases and webcasts when available. |
| Written Correspondence | | Deutsche Investment Management Americas Inc. 345 Park Avenue New York, NY 10154 |
| Legal Counsel | | Vedder Price P.C. 222 North LaSalle Street Chicago, IL 60601 |
| Dividend Reinvestment Plan Agent | | Computershare Inc. P.O. Box 43078 Providence, RI 02940-3078 |
| Transfer Agent | | DWS Investments Service Company P.O. Box 219066 Kansas City, MO 64121-9066 (800) 294-4366 |
| Custodian | | State Street Bank and Trust Company Lafayette Corporate Center 2 Avenue De Lafayette Boston, MA 02111 |
| Independent Registered Public Accounting Firm | | Ernst & Young LLP 200 Clarendon Street Boston, MA 02116 |
| Proxy Voting | | The fund's policies and procedures for voting proxies for portfolio securities and information about how the fund voted proxies related to its portfolio securities during the 12-month period ended June 30 are available on our Web site — www.dws-investments.com (click on "proxy voting"at the bottom of the page) — or on the SEC's Web site — www.sec.gov. To obtain a written copy of the fund's policies and procedures without charge, upon request, call us toll free at (800) 621-1048. |
| Portfolio Holdings | | Following the fund's fiscal first and third quarter-end, a complete portfolio holdings listing is filed with the SEC on Form N-Q. This form will be available on the SEC's Web site at www.sec.gov, and it also may be reviewed and copied at the SEC's Public Reference Room in Washington, D.C. Information on the operation of the SEC's Public Reference Room may be obtained by calling (800) SEC-0330. The fund's portfolio holdings as of the month-end are posted on www.dws-investments.com on or after the last day of the following month. More frequent posting of portfolio holdings information may be made from time to time on www.dws-investments.com. |
| Investment Management | | Deutsche Investment Management Americas Inc. ("DIMA" or the "Advisor"), which is part of Deutsche Asset Management, is the investment advisor for the fund. DIMA and its predecessors have more than 80 years of experience managing mutual funds and DIMA provides a full range of investment advisory services to both institutional and retail clients. DIMA is an indirect, wholly owned subsidiary of Deutsche Bank AG. Deutsche Bank AG is a major global banking institution engaged in a wide variety of financial services, including investment management, retail, private and commercial banking, investment banking and insurance. DWS Investments is the retail brand name in the U.S. for the asset management activities of Deutsche Bank AG and DIMA. As such, DWS is committed to delivering the investing expertise, insight and resources of this global investment platform to American investors. |
| NYSE Symbol | | DHG |
| CUSIP Number | | 23339M204 |
| FACTS | What Does DWS Investments Do With Your Personal Information? |
| Why? | Financial companies choose how they share your personal information. Federal law gives consumers the right to limit some but not all sharing. Federal law also requires us to tell you how we collect, share and protect your personal information. Please read this notice carefully to understand what we do. |
| What? | The types of personal information we collect and share can include: • Social Security number • Account balances • Purchase and transaction history • Bank account information • Contact information such as mailing address, e-mail address and telephone number |
| How? | All financial companies need to share customers' personal information to run their everyday business. In the section below, we list the reasons financial companies can share their customers' personal information, the reasons DWS Investments chooses to share and whether you can limit this sharing. |
| Reasons we can share your personal information | Does DWS Investments share? | Can you limit this sharing? |
For our everyday business purposes — such as to process your transactions, maintain your account(s), respond to court orders or legal investigations | Yes | No |
For our marketing purposes — to offer our products and services to you | Yes | No |
| For joint marketing with other financial companies | No | We do not share |
For our affiliates' everyday business purposes — information about your transactions and experiences | No | We do not share |
For our affiliates' everyday business purposes — information about your creditworthiness | No | We do not share |
| For non-affiliates to market to you | No | We do not share |
| Questions? | Call (800) 621-1048 or e-mail us at dws-investments.info@dws.com |
| Who we are |
| Who is providing this notice? | DWS Investments Distributors, Inc.; Deutsche Investment Management Americas, Inc.; DeAM Investor Services, Inc.; DWS Trust Company; the DWS Funds |
| What we do |
| How does DWS Investments protect my personal information? | To protect your personal information from unauthorized access and use, we use security measures that comply with federal law. These measures include computer safeguards and secured files and buildings. |
| How does DWS Investments collect my personal information? | We collect your personal information, for example. When you: • open an account • give us your contact information • provide bank account information for ACH or wire transactions • tell us where to send money • seek advice about your investments |
| Why can't I limit all sharing? | Federal law gives you the right to limit only • sharing for affiliates' everyday business purposes — information about your creditworthiness • affiliates from using your information to market to you • sharing for nonaffiliates to market to you State laws and individual companies may give you additional rights to limit sharing. |
| Definitions |
| Affiliates | Companies related by common ownership or control. They can be financial or non-financial companies. Our affiliates include financial companies with the DWS or Deutsche Bank ("DB") name, such as DB AG Frankfurt and DB Alex Brown. |
| Non-affiliates | Companies not related by common ownership or control. They can be financial and non-financial companies. Non-affiliates we share with include account service providers, service quality monitoring services, mailing service providers and verification services to help in the fight against money laundering and fraud. |
| Joint marketing | A formal agreement between non-affiliated financial companies that together market financial products or services to you. DWS Investments does not jointly market. |
Notes
Notes
Notes
Notes
Notes
Notes
Pursuant to the requirements of the Securities Exchange Act of 1934 and the Investment Company Act of 1940, the registrant has duly caused this report to be signed on its behalf by the undersigned, thereunto duly authorized.
Pursuant to the requirements of the Securities Exchange Act of 1934 and the Investment Company Act of 1940, this report has been signed below by the following persons on behalf of the registrant and in the capacities and on the dates indicated.