WASHINGTON, D. C. 20549
Deutsche High Income Opportunities Fund, Inc.
March 31, 2015
Semiannual Report
to Shareholders
Deutsche High Income Opportunities Fund, Inc.
Ticker Symbol: DHG
Contents
21 Statement of Assets and Liabilities 23 Statement of Operations 24 Statement of Cash Flows 25 Statement of Changes in Net Assets 28 Notes to Financial Statements 40 Dividend Reinvestment and Cash Purchase Plan 43 Additional Information |
The fund seeks high current income with a secondary objective of total return.
Closed-end funds, unlike open-end funds, are not continuously offered. There is a one time public offering and once issued, shares of closed-end funds are sold in the open market through a stock exchange. Shares of closed-end funds frequently trade at a discount to net asset value. The price of the fund's shares is determined by a number of factors, several of which are beyond the control of the fund. Therefore, the fund cannot predict whether its shares will trade at, below or above net asset value.
Any fund that concentrates in a particular segment of the market will generally be more volatile than a fund that invests more broadly. Bond investments are subject to interest-rate, credit, liquidity and market risks to varying degrees. When interest rates rise, bond prices generally fall. Credit risk refers to the ability of an issuer to make timely payments of principal and interest. Investments in lower-quality ("junk bonds") and non-rated securities present greater risk of loss than investments in higher-quality securities. There are special risks associated with an investment in real estate, including REITS. These risks include credit risk, interest rate fluctuations and the impact of varied economic conditions. Stocks may decline in value. Investing in foreign securities presents certain risks, such as currency fluctuations, political and economic changes, and market risks. Investing in derivatives entails special risks relating to liquidity, leverage and credit that may reduce returns and/or increase volatility. Leverage results in additional risks and can magnify the effect of any gains or losses.
Deutsche Asset & Wealth Management represents the asset management and wealth management activities conducted by Deutsche Bank AG or any of its subsidiaries, including the Advisor and DeAWM Distributors, Inc.
NOT FDIC/NCUA INSURED NO BANK GUARANTEE MAY LOSE VALUE NOT A DEPOSIT NOT INSURED BY ANY FEDERAL GOVERNMENT AGENCY
Performance Summary March 31, 2015 (Unaudited)
Performance is historical, assumes reinvestment of all dividend and capital gain distributions, and does not guarantee future results. Investment return and principal value fluctuate with changing market conditions so that, when sold, shares may be worth more or less than their original cost. Current performance may be lower or higher than the performance data quoted. Please visit deutschefunds.com for the Fund's most recent month-end performance.
Fund specific data and performance are provided for information purposes only and are not intended for trading purposes.
Average Annual Total Returns as of 3/31/15 |
| Deutsche High Income Opportunities Fund, Inc. | 6-Month‡ | 1-Year | 5-Year | Life of Fund* |
Based on Net Asset Value(a) | 2.56% | 3.00% | 10.30% | –0.89% |
Based on Market Price(a) | 1.79% | 5.67% | 10.82% | –2.69% |
Credit Suisse High Yield Index(b) | 0.96% | 1.39% | 8.29% | 7.85% |
Morningstar Closed-End High Yield Bond Funds Category(c) | 0.50% | 1.66% | 10.30% | 7.59% |
* The Fund commenced operations on November 22, 2006. The performance shown for the index and the Morningstar Category is for the time period of November 30, 2006 through March 31, 2015, which is based on the performance period of the life of the Fund.
‡ Total returns shown for periods less than one year are not annualized.
On November 5, 2010, the Fund adopted its current investment policies. Prior to that date the Fund was known as DWS Dreman Value Income Edge Fund, Inc., and its investment objective was to seek to achieve a high level of total return. Performance prior to November 5, 2010 should not be considered representative of the present Fund.
| Net Asset Value and Market Price | |
| | | As of 3/31/15 | | | As of 9/30/14 | |
| Net Asset Value | | $ | 15.98 | | | $ | 16.17 | |
| Market Price | | $ | 14.36 | | | $ | 14.64 | |
Prices and net asset value fluctuate and are not guaranteed.
| Distribution Information | |
Six Months as of 3/31/15: Income Dividends | | $ | .53 | |
| March Income Dividend | | $ | .0850 | |
Current Annualized Distribution Rate (Based on Net Asset Value) as of 3/31/15† | | | 6.38 | % |
Current Annualized Distribution Rate (Based on Market Price) as of 3/31/15† | | | 7.10 | % |
† Current annualized distribution rate is the latest monthly dividend shown as an annualized percentage of net asset value/market price on March 31, 2015. Distribution rate simply measures the level of dividends and is not a complete measure of performance. Distribution rates are historical, not guaranteed and will fluctuate. Distributions do not include return of capital or other non-income sources.
(a) Total return based on net asset value reflects changes in the Fund's net asset value during the period. Total return based on market value reflects changes in market value. Each figure assumes that dividend and capital gain distributions, if any, were reinvested. These figures will differ depending upon the level of any discount from or premium to net asset value at which the Fund's shares traded during the period. Expenses of the Fund include management fee, interest expense and other fund expenses. Total returns shown take into account these fees and expenses. The annual expense ratio of the Fund for the six months ended March 31, 2015 was 1.39% (1.07% excluding interest expense).
(b) Credit Suisse High Yield Index is an unmanaged, unleveraged trader-priced portfolio constructed to mirror the global high-yield debt market.
(c) Morningstar's Closed-End High Yield Bond Funds category represents portfolios that concentrate on lower-quality bonds, which are riskier than those of higher-quality companies. These portfolios generally offer higher yields than other types of portfolios, but they are also more vulnerable to economic and credit risk. These portfolios primarily invest in U.S. high-income debt securities, where at least 65% or more of bond assets are not rated or are rated by a major agency such as Standard & Poor's or Moody's at the level of BB (considered speculative for taxable bonds) and below. Category returns assume reinvestment of dividends. It is not possible to invest directly in a Morningstar category.
Gary Russell, CFA, Managing Director
Portfolio Manager of the fund. Began managing the fund in 2010.
— Joined Deutsche Asset & Wealth Management in 1996. Served as the head of the High Yield group in Europe and as an Emerging Markets portfolio manager.
— Prior to that, he spent four years at Citicorp as a research analyst and structurer of collateralized mortgage obligations. Prior to Citicorp, he served as an officer in the US Army from 1988 to 1991.
— Head of US High Yield Bonds: New York.
— BS, United States Military Academy (West Point); MBA, New York University, Stern School of Business.
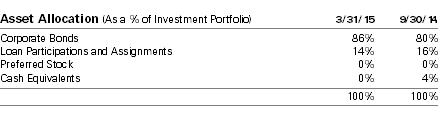
Portfolio Summary (Unaudited)
Investment Portfolio as of March 31, 2015 (Unaudited) | | | Principal Amount ($)(a) | | | Value ($) | |
| | | | |
| Corporate Bonds 124.3% | |
| Consumer Discretionary 25.9% | |
| Ally Financial, Inc.: | |
| 3.25%, 2/13/2018 | | | 1,765,000 | | | | 1,747,350 | |
| 3.5%, 1/27/2019 | | | 1,445,000 | | | | 1,426,937 | |
| 4.125%, 3/30/2020 | | | 610,000 | | | | 606,188 | |
| AMC Entertainment, Inc., 5.875%, 2/15/2022 | | | 430,000 | | | | 446,125 | |
| AMC Networks, Inc., 7.75%, 7/15/2021 | | | 165,000 | | | | 179,025 | |
| AmeriGas Finance LLC: | |
| 6.75%, 5/20/2020 | | | 885,000 | | | | 931,462 | |
| 7.0%, 5/20/2022 | | | 680,000 | | | | 729,300 | |
| APX Group, Inc., 6.375%, 12/1/2019 | | | 375,000 | | | | 373,125 | |
| Asbury Automotive Group, Inc., 6.0%, 12/15/2024 | | | 1,020,000 | | | | 1,058,250 | |
| Ashtead Capital, Inc., 144A, 6.5%, 7/15/2022 | | | 560,000 | | | | 596,400 | |
| Ashton Woods U.S.A. LLC, 144A, 6.875%, 2/15/2021 | | | 595,000 | | | | 541,450 | |
| Avis Budget Car Rental LLC: | |
| 144A, 5.25%, 3/15/2025 | | | 935,000 | | | | 930,325 | |
| 5.5%, 4/1/2023 | | | 1,285,000 | | | | 1,321,944 | |
| Block Communications, Inc., 144A, 7.25%, 2/1/2020 | | | 715,000 | | | | 727,512 | |
| Cablevision Systems Corp.: | |
| 5.875%, 9/15/2022 | | | 1,020,000 | | | | 1,068,450 | |
| 8.0%, 4/15/2020 | | | 810,000 | | | | 917,325 | |
| CCO Holdings LLC, 7.375%, 6/1/2020 | | | 100,000 | | | | 106,875 | |
| CCOH Safari LLC: | |
| 5.5%, 12/1/2022 | | | 3,655,000 | | | | 3,737,237 | |
| 5.75%, 12/1/2024 | | | 1,680,000 | | | | 1,730,400 | |
| Cequel Communications Holdings I LLC: | |
| 144A, 5.125%, 12/15/2021 | | | 1,190,000 | | | | 1,188,512 | |
| 144A, 6.375%, 9/15/2020 | | | 2,070,000 | | | | 2,181,262 | |
| Clear Channel Worldwide Holdings, Inc.: | |
| Series A, 6.5%, 11/15/2022 | | | 445,000 | | | | 461,688 | |
| Series B, 6.5%, 11/15/2022 | | | 665,000 | | | | 699,912 | |
| Series A, 7.625%, 3/15/2020 | | | 105,000 | | | | 108,675 | |
| Series B, 7.625%, 3/15/2020 | | | 2,565,000 | | | | 2,699,662 | |
| Cogeco Cable, Inc., 144A, 4.875%, 5/1/2020 | | | 40,000 | | | | 40,500 | |
| Crown Media Holdings, Inc., 10.5%, 7/15/2019 | | | 275,000 | | | | 294,250 | |
| CSC Holdings LLC, 144A, 5.25%, 6/1/2024 | | | 1,475,000 | | | | 1,504,500 | |
| Cumulus Media Holdings, Inc., 7.75%, 5/1/2019 | | | 350,000 | | | | 343,000 | |
| Dana Holding Corp., 5.5%, 12/15/2024 | | | 385,000 | | | | 396,550 | |
| Delphi Corp., 5.0%, 2/15/2023 | | | 490,000 | | | | 525,525 | |
| DISH DBS Corp.: | |
| 4.25%, 4/1/2018 | | | 530,000 | | | | 532,650 | |
| 5.0%, 3/15/2023 | | | 685,000 | | | | 666,026 | |
| 5.125%, 5/1/2020 | | | 2,500,000 | | | | 2,518,750 | |
| 6.75%, 6/1/2021 | | | 145,000 | | | | 154,425 | |
| Family Tree Escrow LLC: | |
| 144A, 5.25%, 3/1/2020 | | | 2,100,000 | | | | 2,199,750 | |
| 144A, 5.75%, 3/1/2023 | | | 665,000 | | | | 699,912 | |
| FCA U.S. LLC, 8.25%, 6/15/2021 | | | 280,000 | | | | 310,551 | |
| Group 1 Automotive, Inc., 144A, 5.0%, 6/1/2022 | | | 880,000 | | | | 882,200 | |
| Harron Communications LP, 144A, 9.125%, 4/1/2020 | | | 755,000 | | | | 826,725 | |
| HD Supply, Inc.: | |
| 144A, 5.25%, 12/15/2021 | | | 565,000 | | | | 581,950 | |
| 7.5%, 7/15/2020 | | | 200,000 | | | | 214,000 | |
| 11.5%, 7/15/2020 | | | 675,000 | | | | 780,469 | |
| Hot Topic, Inc., 144A, 9.25%, 6/15/2021 | | | 285,000 | | | | 308,513 | |
| iHeartCommunications, Inc.: | |
| 9.0%, 12/15/2019 | | | 970,000 | | | | 960,300 | |
| 11.25%, 3/1/2021 | | | 495,000 | | | | 506,138 | |
| Jaguar Land Rover Automotive PLC, 144A, 3.5%, 3/15/2020 | | | 2,050,000 | | | | 2,037,187 | |
| Jo-Ann Stores Holdings, Inc., 144A, 9.75%, 10/15/2019 | | | 225,000 | | | | 218,250 | |
| Live Nation Entertainment, Inc.: | |
| 144A, 5.375%, 6/15/2022 | | | 100,000 | | | | 102,000 | |
| 144A, 7.0%, 9/1/2020 | | | 675,000 | | | | 718,875 | |
| MDC Partners, Inc., 144A, 6.75%, 4/1/2020 | | | 430,000 | | | | 453,113 | |
| Mediacom Broadband LLC: | |
| 5.5%, 4/15/2021 | | | 100,000 | | | | 101,000 | |
| 6.375%, 4/1/2023 | | | 800,000 | | | | 840,000 | |
| Mediacom LLC, 7.25%, 2/15/2022 | | | 200,000 | | | | 215,000 | |
| MGM Resorts International: | |
| 6.0%, 3/15/2023 | | | 580,000 | | | | 595,950 | |
| 6.75%, 10/1/2020 | | | 834,000 | | | | 894,465 | |
| 7.5%, 6/1/2016 | | | 550,000 | | | | 577,885 | |
| 7.625%, 1/15/2017 | | | 385,000 | | | | 412,431 | |
| 8.625%, 2/1/2019 | | | 950,000 | | | | 1,083,000 | |
| Nielsen Finance LLC, 144A, 5.0%, 4/15/2022 | | | 290,000 | | | | 291,813 | |
| Numericable-SFR: | |
| 144A, 4.875%, 5/15/2019 | | | 975,000 | | | | 970,125 | |
| 144A, 6.0%, 5/15/2022 | | | 1,455,000 | | | | 1,473,187 | |
| 144A, 6.25%, 5/15/2024 | | | 430,000 | | | | 435,375 | |
| Penske Automotive Group, Inc., 5.375%, 12/1/2024 | | | 1,360,000 | | | | 1,400,800 | |
| PETCO Animal Supplies, Inc., 144A, 9.25%, 12/1/2018 | | | 670,000 | | | | 703,500 | |
| Pinnacle Entertainment, Inc., 6.375%, 8/1/2021 | | | 310,000 | | | | 328,600 | |
| Quebecor Media, Inc., 5.75%, 1/15/2023 | | | 375,000 | | | | 386,250 | |
| Schaeffler Finance BV: | |
| 144A, 4.75%, 5/15/2023 (b) | | | 775,000 | | | | 782,750 | |
| 144A, 7.75%, 2/15/2017 | | | 755,000 | | | | 845,600 | |
| Seminole Hard Rock Entertainment, Inc., 144A, 5.875%, 5/15/2021 | | | 235,000 | | | | 235,881 | |
| Serta Simmons Holdings LLC, 144A, 8.125%, 10/1/2020 | | | 210,000 | | | | 221,025 | |
| Sirius XM Radio, Inc., 144A, 5.875%, 10/1/2020 | | | 405,000 | | | | 422,213 | |
| Springs Industries, Inc., 6.25%, 6/1/2021 | | | 565,000 | | | | 557,938 | |
| Starz LLC, 5.0%, 9/15/2019 | | | 295,000 | | | | 303,113 | |
| Suburban Propane Partners LP, 5.75%, 3/1/2025 | | | 280,000 | | | | 285,600 | |
| TRI Pointe Holdings, Inc., 144A, 4.375%, 6/15/2019 | | | 280,000 | | | | 273,350 | |
| UCI International, Inc., 8.625%, 2/15/2019 | | | 235,000 | | | | 212,675 | |
| Unitymedia Hessen GmbH & Co., KG, 144A, 5.5%, 1/15/2023 | | | 1,630,000 | | | | 1,705,469 | |
| Viking Cruises Ltd., 144A, 8.5%, 10/15/2022 | | | 375,000 | | | | 417,188 | |
| Visant Corp., 10.0%, 10/1/2017 | | | 305,000 | | | | 272,975 | |
| Ziggo Bond Finance BV, 144A, 5.875%, 1/15/2025 | | | 330,000 | | | | 345,675 | |
| | | | | 62,882,333 | |
| Consumer Staples 2.4% | |
| Barry Callebaut Services NV, 144A, 5.5%, 6/15/2023 | | | 345,000 | | | | 366,907 | |
| Chiquita Brands International, Inc., 7.875%, 2/1/2021 | | | 151,000 | | | | 165,345 | |
| Cott Beverages, Inc.: | |
| 144A, 5.375%, 7/1/2022 | | | 855,000 | | | | 824,006 | |
| 144A, 6.75%, 1/1/2020 | | | 385,000 | | | | 398,475 | |
| FAGE Dairy Industry SA, 144A, 9.875%, 2/1/2020 | | | 215,000 | | | | 226,288 | |
| JBS Investments GmbH, 144A, 7.25%, 4/3/2024 | | | 970,000 | | | | 989,400 | |
| JBS U.S.A. LLC: | |
| 144A, 7.25%, 6/1/2021 | | | 1,015,000 | | | | 1,072,094 | |
| 144A, 8.25%, 2/1/2020 | | | 295,000 | | | | 313,438 | |
| Pilgrim's Pride Corp., 144A, 5.75%, 3/15/2025 | | | 395,000 | | | | 403,887 | |
| Post Holdings, Inc., 144A, 6.75%, 12/1/2021 | | | 175,000 | | | | 176,750 | |
| Roundy's Supermarkets, Inc., 144A, 10.25%, 12/15/2020 | | | 105,000 | | | | 90,759 | |
| Smithfield Foods, Inc., 6.625%, 8/15/2022 | | | 18,000 | | | | 19,260 | |
| The WhiteWave Foods Co., 5.375%, 10/1/2022 | | | 385,000 | | | | 413,875 | |
| U.S. Foods, Inc., 8.5%, 6/30/2019 | | | 385,000 | | | | 404,250 | |
| | | | | 5,864,734 | |
| Energy 14.2% | |
| Antero Resources Corp.: | |
| 5.125%, 12/1/2022 | | | 685,000 | | | | 657,600 | |
| 5.375%, 11/1/2021 | | | 495,000 | | | | 480,150 | |
| 144A, 5.625%, 6/1/2023 | | | 400,000 | | | | 396,000 | |
| Baytex Energy Corp.: | |
| 144A, 5.125%, 6/1/2021 | | | 145,000 | | | | 133,038 | |
| 144A, 5.625%, 6/1/2024 | | | 185,000 | | | | 169,275 | |
| Berry Petroleum Co., LLC: | |
| 6.375%, 9/15/2022 | | | 360,000 | | | | 279,900 | |
| 6.75%, 11/1/2020 | | | 615,000 | | | | 499,688 | |
| Blue Racer Midstream LLC, 144A, 6.125%, 11/15/2022 | | | 230,000 | | | | 236,325 | |
| BreitBurn Energy Partners LP, 7.875%, 4/15/2022 | | | 400,000 | | | | 288,000 | |
| California Resources Corp.: | |
| 144A, 5.0%, 1/15/2020 | | | 1,360,000 | | | | 1,227,400 | |
| 144A, 5.5%, 9/15/2021 | | | 674,000 | | | | 597,973 | |
| 144A, 6.0%, 11/15/2024 | | | 270,000 | | | | 236,925 | |
| Chaparral Energy, Inc.: | |
| 7.625%, 11/15/2022 | | | 450,000 | | | | 301,500 | |
| 9.875%, 10/1/2020 | | | 1,750,000 | | | | 1,295,000 | |
| Chesapeake Energy Corp.: | |
| 5.75%, 3/15/2023 | | | 875,000 | | | | 853,125 | |
| 6.125%, 2/15/2021 | | | 95,000 | | | | 96,188 | |
| 6.625%, 8/15/2020 | | | 515,000 | | | | 531,737 | |
| Concho Resources, Inc., 5.5%, 4/1/2023 | | | 790,000 | | | | 795,846 | |
| Continental Resources, Inc., 3.8%, 6/1/2024 | | | 865,000 | | | | 797,305 | |
| Crestwood Midstream Partners LP: | |
| 6.125%, 3/1/2022 | | | 300,000 | | | | 302,250 | |
| 144A, 6.25%, 4/1/2023 | | | 190,000 | | | | 191,900 | |
| 7.75%, 4/1/2019 | | | 610,000 | | | | 633,851 | |
| Endeavor Energy Resources LP, 144A, 7.0%, 8/15/2021 | | | 1,040,000 | | | | 1,003,600 | |
| EP Energy LLC, 6.875%, 5/1/2019 | | | 635,000 | | | | 650,875 | |
| EV Energy Partners LP, 8.0%, 4/15/2019 | | | 1,845,000 | | | | 1,678,950 | |
| Halcon Resources Corp., 8.875%, 5/15/2021 | | | 116,000 | | | | 80,620 | |
| Hilcorp Energy I LP, 144A, 5.0%, 12/1/2024 | | | 375,000 | | | | 352,500 | |
| Holly Energy Partners LP, 6.5%, 3/1/2020 | | | 205,000 | | | | 201,925 | |
| Ithaca Energy, Inc., 144A, 8.125%, 7/1/2019 | | | 325,000 | | | | 257,563 | |
| Jupiter Resources, Inc., 144A, 8.5%, 10/1/2022 | | | 380,000 | | | | 311,600 | |
| Laredo Petroleum, Inc., 6.25%, 3/15/2023 | | | 610,000 | | | | 608,475 | |
| Linn Energy LLC, 6.25%, 11/1/2019 | | | 170,000 | | | | 134,300 | |
| MEG Energy Corp.: | |
| 144A, 6.5%, 3/15/2021 | | | 435,000 | | | | 402,375 | |
| 144A, 7.0%, 3/31/2024 | | | 1,295,000 | | | | 1,220,537 | |
| Memorial Resource Development Corp., 144A, 5.875%, 7/1/2022 | | | 375,000 | | | | 352,500 | |
| Murphy Oil U.S.A., Inc., 6.0%, 8/15/2023 | | | 575,000 | | | | 616,687 | |
| Newfield Exploration Co.: | |
| 5.375%, 1/1/2026 | | | 300,000 | | | | 303,038 | |
| 5.75%, 1/30/2022 | | | 390,000 | | | | 406,575 | |
| Northern Oil & Gas, Inc., 8.0%, 6/1/2020 | | | 1,105,000 | | | | 980,687 | |
| Oasis Petroleum, Inc.: | |
| 6.875%, 3/15/2022 | | | 1,185,000 | | | | 1,155,375 | |
| 6.875%, 1/15/2023 | | | 405,000 | | | | 392,850 | |
| Regency Energy Partners LP: | |
| 5.0%, 10/1/2022 | | | 245,000 | | | | 254,800 | |
| 5.875%, 3/1/2022 | | | 55,000 | | | | 59,675 | |
| Rice Energy, Inc., 144A, 7.25%, 5/1/2023 | | | 105,000 | | | | 105,000 | |
| RSP Permian, Inc., 144A, 6.625%, 10/1/2022 | | | 950,000 | | | | 954,750 | |
| Sabine Pass Liquefaction LLC: | |
| 5.625%, 2/1/2021 | | | 1,240,000 | | | | 1,248,134 | |
| 5.625%, 4/15/2023 | | | 280,000 | | | | 279,300 | |
| 144A, 5.625%, 3/1/2025 | | | 490,000 | | | | 484,488 | |
| 5.75%, 5/15/2024 | | | 1,595,000 | | | | 1,602,975 | |
| Sabine Pass LNG LP, 7.5%, 11/30/2016 | | | 565,000 | | | | 600,312 | |
| SESI LLC, 7.125%, 12/15/2021 | | | 680,000 | | | | 686,800 | |
| Seventy Seven Energy, Inc., 6.5%, 7/15/2022 | | | 90,000 | | | | 40,950 | |
| Seventy Seven Operating LLC, 6.625%, 11/15/2019 | | | 400,000 | | | | 299,000 | |
| Sunoco LP, 144A, 6.375%, 4/1/2023 (b) | | | 300,000 | | | | 309,000 | |
| Talos Production LLC, 144A, 9.75%, 2/15/2018 | | | 695,000 | | | | 486,500 | |
| Targa Resources Partners LP: | |
| 144A, 4.125%, 11/15/2019 | | | 145,000 | | | | 144,275 | |
| 144A, 5.0%, 1/15/2018 | | | 1,020,000 | | | | 1,050,600 | |
| TerraForm Power Operating LLC, 144A, 5.875%, 2/1/2023 | | | 480,000 | | | | 498,000 | |
| Tesoro Corp., 4.25%, 10/1/2017 | | | 400,000 | | | | 416,000 | |
| Triangle U.S.A. Petroleum Corp., 144A, 6.75%, 7/15/2022 | | | 280,000 | | | | 226,100 | |
| Welltec AS, 144A, 8.0%, 2/1/2019 | | | 200,000 | | | | 188,000 | |
| Whiting Petroleum Corp.: | |
| 5.75%, 3/15/2021 | | | 380,000 | | | | 377,150 | |
| 144A, 6.25%, 4/1/2023 | | | 915,000 | | | | 910,425 | |
| Williams Partners LP, 6.125%, 7/15/2022 | | | 615,000 | | | | 651,592 | |
| WPX Energy, Inc., 5.25%, 1/15/2017 | | | 450,000 | | | | 452,250 | |
| | | | | 34,438,084 | |
| Financials 6.5% | |
| AerCap Aviation Solutions BV, 6.375%, 5/30/2017 | | | 1,300,000 | | | | 1,378,000 | |
| AerCap Ireland Capital Ltd., 144A, 5.0%, 10/1/2021 | | | 240,000 | | | | 254,700 | |
| Banco Bradesco SA, 144A, 5.75%, 3/1/2022 | | | 1,355,000 | | | | 1,402,425 | |
| CIT Group, Inc.: | |
| 3.875%, 2/19/2019 | | | 2,130,000 | | | | 2,108,700 | |
| 5.25%, 3/15/2018 | | | 1,045,000 | | | | 1,081,575 | |
| Credit Agricole SA, 144A, 7.875%, 1/29/2049 | | | 635,000 | | | | 672,494 | |
| Denali Borrower LLC, 144A, 5.625%, 10/15/2020 | | | 575,000 | | | | 607,775 | |
| E*TRADE Financial Corp.: | |
| 4.625%, 9/15/2023 | | | 395,000 | | | | 401,913 | |
| 5.375%, 11/15/2022 | | | 345,000 | | | | 363,975 | |
| International Lease Finance Corp.: | |
| 3.875%, 4/15/2018 | | | 1,370,000 | | | | 1,390,550 | |
| 5.75%, 5/15/2016 | | | 205,000 | | | | 213,098 | |
| 6.25%, 5/15/2019 | | | 605,000 | | | | 660,962 | |
| 8.75%, 3/15/2017 | | | 1,220,000 | | | | 1,348,100 | |
| Morgan Stanley, Series H, 5.45%, 7/29/2049 | | | 295,000 | | | | 297,213 | |
| MPT Operating Partnership LP: | |
| (REIT), 6.375%, 2/15/2022 | | | 545,000 | | | | 590,071 | |
| (REIT), 6.875%, 5/1/2021 | | | 550,000 | | | | 591,937 | |
| Neuberger Berman Group LLC: | |
| 144A, 5.625%, 3/15/2020 | | | 305,000 | | | | 317,963 | |
| 144A, 5.875%, 3/15/2022 | | | 505,000 | | | | 539,087 | |
| Popular, Inc., 7.0%, 7/1/2019 | | | 285,000 | | | | 286,425 | |
| Societe Generale SA, 144A, 7.875%, 12/29/2049 | | | 795,000 | | | | 820,837 | |
| The Goldman Sachs Group, Inc., Series L, 5.7%, 12/29/2049 | | | 490,000 | | | | 504,087 | |
| | | | | 15,831,887 | |
| Health Care 12.0% | |
| Aviv Healthcare Properties LP: | |
| 6.0%, 10/15/2021 | | | 205,000 | | | | 219,350 | |
| 7.75%, 2/15/2019 | | | 955,000 | | | | 995,587 | |
| Biomet, Inc.: | |
| 6.5%, 8/1/2020 | | | 655,000 | | | | 694,300 | |
| 6.5%, 10/1/2020 | | | 185,000 | | | | 194,250 | |
| Community Health Systems, Inc.: | |
| 5.125%, 8/15/2018 | | | 2,160,000 | | | | 2,227,500 | |
| 5.125%, 8/1/2021 | | | 105,000 | | | | 108,150 | |
| 6.875%, 2/1/2022 | | | 2,140,000 | | | | 2,287,125 | |
| 7.125%, 7/15/2020 | | | 4,030,000 | | | | 4,271,800 | |
| Crimson Merger Sub, Inc., 144A, 6.625%, 5/15/2022 | | | 980,000 | | | | 869,750 | |
| Endo Finance LLC: | |
| 144A, 5.375%, 1/15/2023 | | | 425,000 | | | | 423,938 | |
| 144A, 5.75%, 1/15/2022 | | | 420,000 | | | | 430,500 | |
| 144A, 6.0%, 2/1/2025 | | | 290,000 | | | | 298,700 | |
| Fresenius Medical Care U.S. Finance II, Inc., 144A, 5.625%, 7/31/2019 | | | 405,000 | | | | 439,628 | |
| Fresenius Medical Care U.S. Finance, Inc.: | |
| 144A, 5.75%, 2/15/2021 | | | 235,000 | | | | 257,325 | |
| 144A, 6.5%, 9/15/2018 | | | 210,000 | | | | 234,150 | |
| HCA, Inc.: | |
| 5.25%, 4/15/2025 | | | 95,000 | | | | 102,600 | |
| 5.375%, 2/1/2025 | | | 380,000 | | | | 398,525 | |
| 6.5%, 2/15/2020 | | | 2,155,000 | | | | 2,426,530 | |
| 7.5%, 2/15/2022 | | | 804,000 | | | | 937,665 | |
| Hologic, Inc., 6.25%, 8/1/2020 | | | 385,000 | | | | 399,438 | |
| IMS Health, Inc., 144A, 6.0%, 11/1/2020 | | | 465,000 | | | | 484,181 | |
| LifePoint Hospitals, Inc., 5.5%, 12/1/2021 | | | 515,000 | | | | 539,462 | |
| Par Pharmaceutical Companies, Inc., 7.375%, 10/15/2020 | | | 660,000 | | | | 696,300 | |
| Physio-Control International, Inc., 144A, 9.875%, 1/15/2019 | | | 280,000 | | | | 297,500 | |
| Tenet Healthcare Corp.: | |
| 6.0%, 10/1/2020 | | | 1,500,000 | | | | 1,590,000 | |
| 6.25%, 11/1/2018 | | | 1,975,000 | | | | 2,140,406 | |
| Valeant Pharmaceuticals International, Inc.: | |
| 144A, 6.375%, 10/15/2020 | | | 475,000 | | | | 493,406 | |
| 144A, 6.75%, 8/15/2018 | | | 915,000 | | | | 964,181 | |
| 144A, 7.5%, 7/15/2021 | | | 1,985,000 | | | | 2,146,897 | |
| VRX Escrow Corp.: | |
| 144A, 5.375%, 3/15/2020 | | | 765,000 | | | | 771,694 | |
| 144A, 5.875%, 5/15/2023 | | | 705,000 | | | | 722,625 | |
| 144A, 6.125%, 4/15/2025 | | | 100,000 | | | | 103,500 | |
| | | | | 29,166,963 | |
| Industrials 12.7% | |
| ADT Corp.: | |
| 3.5%, 7/15/2022 | | | 285,000 | | | | 259,350 | |
| 4.125%, 4/15/2019 | | | 85,000 | | | | 86,594 | |
| 5.25%, 3/15/2020 | | | 635,000 | | | | 657,225 | |
| 6.25%, 10/15/2021 | | | 300,000 | | | | 319,500 | |
| Aguila 3 SA, 144A, 7.875%, 1/31/2018 | | | 920,000 | | | | 920,000 | |
| Air Lease Corp., 4.75%, 3/1/2020 | | | 535,000 | | | | 574,456 | |
| Apex Tool Group LLC, 144A, 7.0%, 2/1/2021 | | | 360,000 | | | | 338,400 | |
| Artesyn Embedded Technologies, Inc., 144A, 9.75%, 10/15/2020 | | | 500,000 | | | | 482,500 | |
| AWAS Aviation Capital Ltd., 144A, 7.0%, 10/17/2016 | | | 662,200 | | | | 676,239 | |
| Belden, Inc., 144A, 5.5%, 9/1/2022 | | | 660,000 | | | | 676,500 | |
| Bombardier, Inc.: | |
| 144A, 4.75%, 4/15/2019 | | | 290,000 | | | | 284,200 | |
| 144A, 5.5%, 9/15/2018 | | | 195,000 | | | | 194,756 | |
| 144A, 5.75%, 3/15/2022 | | | 425,000 | | | | 400,563 | |
| 144A, 6.0%, 10/15/2022 | | | 485,000 | | | | 455,294 | |
| 144A, 7.5%, 3/15/2025 | | | 200,000 | | | | 197,375 | |
| Carlson Travel Holdings, Inc., 144A, 7.5%, 8/15/2019 | | | 250,000 | | | | 253,125 | |
| Casella Waste Systems, Inc., 7.75%, 2/15/2019 | | | 440,000 | | | | 440,000 | |
| CNH Industrial Capital LLC, 3.25%, 2/1/2017 | | | 1,615,000 | | | | 1,606,925 | |
| Covanta Holding Corp., 5.875%, 3/1/2024 | | | 430,000 | | | | 445,050 | |
| CTP Transportation Products LLC, 144A, 8.25%, 12/15/2019 | | | 520,000 | | | | 535,600 | |
| DigitalGlobe, Inc., 144A, 5.25%, 2/1/2021 | | | 270,000 | | | | 270,000 | |
| DR Horton, Inc., 4.0%, 2/15/2020 | | | 185,000 | | | | 187,590 | |
| Ducommun, Inc., 9.75%, 7/15/2018 | | | 705,000 | | | | 745,537 | |
| Florida East Coast Holdings Corp., 144A, 6.75%, 5/1/2019 | | | 235,000 | | | | 236,763 | |
| FTI Consulting, Inc., 6.0%, 11/15/2022 | | | 375,000 | | | | 394,226 | |
| Garda World Security Corp., 144A, 7.25%, 11/15/2021 | | | 540,000 | | | | 530,550 | |
| Gates Global LLC, 144A, 6.0%, 7/15/2022 | | | 370,000 | | | | 349,188 | |
| GenCorp, Inc., 7.125%, 3/15/2021 | | | 865,000 | | | | 925,550 | |
| Huntington Ingalls Industries, Inc., 144A, 5.0%, 12/15/2021 | | | 810,000 | | | | 844,425 | |
| Kenan Advantage Group, Inc., 144A, 8.375%, 12/15/2018 | | | 1,035,000 | | | | 1,076,400 | |
| Masonite International Corp., 144A, 5.625%, 3/15/2023 | | | 435,000 | | | | 445,875 | |
| Meritor, Inc.: | |
| 6.25%, 2/15/2024 | | | 410,000 | | | | 413,075 | |
| 6.75%, 6/15/2021 | | | 975,000 | | | | 1,009,125 | |
| Moog, Inc., 144A, 5.25%, 12/1/2022 | | | 340,000 | | | | 350,200 | |
| Navios Maritime Holdings, Inc., 144A, 7.375%, 1/15/2022 | | | 1,545,000 | | | | 1,440,712 | |
| Oshkosh Corp.: | |
| 5.375%, 3/1/2022 | | | 322,500 | | | | 334,594 | |
| 144A, 5.375%, 3/1/2025 | | | 50,000 | | | | 51,500 | |
| Ply Gem Industries, Inc., 6.5%, 2/1/2022 | | | 810,000 | | | | 782,625 | |
| SBA Communications Corp., 5.625%, 10/1/2019 | | | 370,000 | | | | 390,165 | |
| Spirit AeroSystems, Inc.: | |
| 5.25%, 3/15/2022 | | | 540,000 | | | | 561,600 | |
| 6.75%, 12/15/2020 | | | 955,000 | | | | 1,012,300 | |
| Titan International, Inc., 6.875%, 10/1/2020 | | | 670,000 | | | | 580,387 | |
| TransDigm, Inc.: | |
| 6.0%, 7/15/2022 | | | 485,000 | | | | 485,000 | |
| 6.5%, 7/15/2024 | | | 290,000 | | | | 291,450 | |
| 7.5%, 7/15/2021 | | | 1,645,000 | | | | 1,768,375 | |
| Triumph Group, Inc., 5.25%, 6/1/2022 | | | 245,000 | | | | 240,713 | |
| United Rentals North America, Inc.: | |
| 4.625%, 7/15/2023 | | | 345,000 | | | | 348,881 | |
| 5.75%, 7/15/2018 | | | 690,000 | | | | 719,325 | |
| 6.125%, 6/15/2023 | | | 45,000 | | | | 47,644 | |
| 7.375%, 5/15/2020 | | | 2,330,000 | | | | 2,517,856 | |
| 7.625%, 4/15/2022 | | | 565,000 | | | | 618,110 | |
| USG Corp., 144A, 5.5%, 3/1/2025 | | | 25,000 | | | | 25,500 | |
| Wise Metals Group LLC, 144A, 8.75%, 12/15/2018 | | | 485,000 | | | | 517,737 | |
| XPO Logistics, Inc., 144A, 7.875%, 9/1/2019 | | | 480,000 | | | | 508,200 | |
| | | | | 30,824,830 | |
| Information Technology 10.5% | |
| ACI Worldwide, Inc., 144A, 6.375%, 8/15/2020 | | | 205,000 | | | | 214,225 | |
| Activision Blizzard, Inc., 144A, 5.625%, 9/15/2021 | | | 1,680,000 | | | | 1,789,200 | |
| Alliance Data Systems Corp., 144A, 5.25%, 12/1/2017 | | | 470,000 | | | | 486,450 | |
| Audatex North America, Inc.: | |
| 144A, 6.0%, 6/15/2021 | | | 625,000 | | | | 660,937 | |
| 144A, 6.125%, 11/1/2023 | | | 230,000 | | | | 243,225 | |
| BMC Software Finance, Inc., 144A, 8.125%, 7/15/2021 | | | 885,000 | | | | 809,775 | |
| Boxer Parent Co., Inc., 144A, 9.0%, 10/15/2019 | | | 585,000 | | | | 482,625 | |
| Cardtronics, Inc., 144A, 5.125%, 8/1/2022 | | | 280,000 | | | | 276,500 | |
| CDW LLC: | |
| 5.5%, 12/1/2024 | | | 1,375,000 | | | | 1,440,312 | |
| 6.0%, 8/15/2022 | | | 450,000 | | | | 483,053 | |
| 8.5%, 4/1/2019 | | | 1,272,000 | | | | 1,326,060 | |
| CyrusOne LP, 6.375%, 11/15/2022 | | | 185,000 | | | | 196,563 | |
| EarthLink Holdings Corp., 7.375%, 6/1/2020 | | | 470,000 | | | | 481,750 | |
| Entegris, Inc., 144A, 6.0%, 4/1/2022 | | | 290,000 | | | | 302,325 | |
| Equinix, Inc.: | |
| 5.375%, 1/1/2022 | | | 460,000 | | | | 479,550 | |
| 5.375%, 4/1/2023 | | | 1,275,000 | | | | 1,323,450 | |
| 5.75%, 1/1/2025 | | | 345,000 | | | | 359,663 | |
| First Data Corp.: | |
| 144A, 6.75%, 11/1/2020 | | | 2,967,000 | | | | 3,159,855 | |
| 144A, 7.375%, 6/15/2019 | | | 475,000 | | | | 496,375 | |
| 144A, 8.75%, 1/15/2022 | | | 890,000 | | | | 957,862 | |
| Freescale Semiconductor, Inc., 144A, 6.0%, 1/15/2022 | | | 510,000 | | | | 555,262 | |
| Infor U.S., Inc., 144A, 6.5%, 5/15/2022 (b) | | | 305,000 | | | | 312,625 | |
| Jabil Circuit, Inc., 5.625%, 12/15/2020 | | | 3,750,000 | | | | 4,096,875 | |
| Micron Technology, Inc., 144A, 5.25%, 8/1/2023 | | | 475,000 | | | | 483,312 | |
| NCR Corp.: | |
| 5.875%, 12/15/2021 | | | 105,000 | | | | 109,463 | |
| 6.375%, 12/15/2023 | | | 260,000 | | | | 276,900 | |
| NXP BV, 144A, 3.75%, 6/1/2018 | | | 1,125,000 | | | | 1,147,500 | |
| Open Text Corp., 144A, 5.625%, 1/15/2023 | | | 380,000 | | | | 394,250 | |
| Project Homestake Merger Corp., 144A, 8.875%, 3/1/2023 | | | 300,000 | | | | 300,750 | |
| Sanmina Corp., 144A, 4.375%, 6/1/2019 | | | 50,000 | | | | 49,750 | |
| Seagate HDD Cayman, 3.75%, 11/15/2018 | | | 1,060,000 | | | | 1,104,709 | |
| VeriSign, Inc., 144A, 5.25%, 4/1/2025 | | | 290,000 | | | | 295,800 | |
| Ymobile Corp., 144A, 8.25%, 4/1/2018 | | | 315,000 | | | | 327,994 | |
| | | | | 25,424,945 | |
| Materials 10.1% | |
| Ardagh Packaging Finance PLC: | |
| 144A, 3.271%**, 12/15/2019 | | | 640,000 | | | | 624,000 | |
| 144A, 6.75%, 1/31/2021 | | | 645,000 | | | | 653,062 | |
| Ashland, Inc., 3.875%, 4/15/2018 | | | 1,900,000 | | | | 1,947,500 | |
| Berry Plastics Corp., 5.5%, 5/15/2022 | | | 800,000 | | | | 822,000 | |
| Cascades, Inc., 144A, 5.5%, 7/15/2022 | | | 280,000 | | | | 284,200 | |
| Clearwater Paper Corp., 144A, 5.375%, 2/1/2025 | | | 575,000 | | | | 586,500 | |
| Coveris Holding Corp., 144A, 10.0%, 6/1/2018 | | | 435,000 | | | | 460,012 | |
| Coveris Holdings SA, 144A, 7.875%, 11/1/2019 | | | 605,000 | | | | 618,612 | |
| Crown Americas LLC, 6.25%, 2/1/2021 | | | 105,000 | | | | 110,644 | |
| Evolution Escrow Issuer LLC, 144A, 7.5%, 3/15/2022 | | | 490,000 | | | | 496,125 | |
| First Quantum Minerals Ltd., 144A, 7.0%, 2/15/2021 | | | 806,000 | | | | 743,535 | |
| FMG Resources August 2006 Pty Ltd.: | |
| 144A, 6.0%, 4/1/2017 | | | 605,000 | | | | 595,925 | |
| 144A, 8.25%, 11/1/2019 | | | 520,000 | | | | 447,200 | |
| Hexion U.S. Finance Corp.: | |
| 6.625%, 4/15/2020 | | | 1,130,000 | | | | 1,033,950 | |
| 8.875%, 2/1/2018 | | | 760,000 | | | | 670,700 | |
| Huntsman International LLC, 5.125%, 4/15/2021 EUR | | | 475,000 | | | | 537,864 | |
| Kaiser Aluminum Corp., 8.25%, 6/1/2020 | | | 490,000 | | | | 534,100 | |
| KGHM International Ltd., 144A, 7.75%, 6/15/2019 | | | 1,180,000 | | | | 1,215,400 | |
| Novelis, Inc., 8.75%, 12/15/2020 | | | 3,040,000 | | | | 3,256,600 | |
| Perstorp Holding AB, 144A, 8.75%, 5/15/2017 | | | 400,000 | | | | 414,000 | |
| Plastipak Holdings, Inc., 144A, 6.5%, 10/1/2021 | | | 500,000 | | | | 508,750 | |
Platform Specialty Products Corp., 144A, 6.5%, 2/1/2022 | | | 440,000 | | | | 459,800 | |
| Polymer Group, Inc., 7.75%, 2/1/2019 | | | 531,000 | | | | 550,912 | |
| Rain CII Carbon LLC, 144A, 8.25%, 1/15/2021 | | | 285,000 | | | | 265,763 | |
| Reynolds Group Issuer, Inc.: | |
| 5.75%, 10/15/2020 | | | 1,785,000 | | | | 1,845,244 | |
| 8.25%, 2/15/2021 | | | 3,210,000 | | | | 3,434,700 | |
| Sealed Air Corp.: | |
| 144A, 4.875%, 12/1/2022 | | | 230,000 | | | | 234,600 | |
| 144A, 5.125%, 12/1/2024 | | | 115,000 | | | | 119,025 | |
| Signode Industrial Group Lux SA, 144A, 6.375%, 5/1/2022 | | | 390,000 | | | | 387,563 | |
| Tronox Finance LLC, 6.375%, 8/15/2020 | | | 385,000 | | | | 376,338 | |
| WR Grace & Co-Conn: | |
| 144A, 5.125%, 10/1/2021 | | | 190,000 | | | | 197,125 | |
| 144A, 5.625%, 10/1/2024 | | | 95,000 | | | | 101,413 | |
| | | | | 24,533,162 | |
| Telecommunication Services 27.1% | |
| Altice Financing SA: | |
| 144A, 6.5%, 1/15/2022 | | | 320,000 | | | | 328,400 | |
| 144A, 7.875%, 12/15/2019 | | | 420,000 | | | | 445,200 | |
| Altice Finco SA, 144A, 9.875%, 12/15/2020 | | | 420,000 | | | | 465,150 | |
| Altice SA, 144A, 7.75%, 5/15/2022 | | | 460,000 | | | | 467,763 | |
| B Communications Ltd., 144A, 7.375%, 2/15/2021 | | | 535,000 | | | | 573,252 | |
| CenturyLink, Inc.: | |
| Series V, 5.625%, 4/1/2020 | | | 180,000 | | | | 189,000 | |
| Series W, 6.75%, 12/1/2023 | | | 510,000 | | | | 561,638 | |
| Cincinnati Bell, Inc.: | |
| 8.375%, 10/15/2020 | | | 3,055,000 | | | | 3,249,756 | |
| 8.75%, 3/15/2018 | | | 279,000 | | | | 285,905 | |
| CommScope, Inc., 144A, 5.0%, 6/15/2021 | | | 490,000 | | | | 489,388 | |
| Digicel Group Ltd.: | |
| 144A, 7.125%, 4/1/2022 | | | 480,000 | | | | 439,200 | |
| 144A, 8.25%, 9/30/2020 | | | 4,304,000 | | | | 4,310,456 | |
| Digicel Ltd.: | |
| 144A, 6.75%, 3/1/2023 | | | 745,000 | | | | 721,719 | |
| 144A, 7.0%, 2/15/2020 | | | 200,000 | | | | 204,000 | |
| Frontier Communications Corp.: | |
| 6.25%, 9/15/2021 | | | 295,000 | | | | 295,738 | |
| 6.875%, 1/15/2025 | | | 1,295,000 | | | | 1,282,050 | |
| 7.125%, 1/15/2023 | | | 2,450,000 | | | | 2,505,125 | |
| 8.5%, 4/15/2020 | | | 1,380,000 | | | | 1,549,050 | |
| Hughes Satellite Systems Corp.: | |
| 6.5%, 6/15/2019 | | | 1,250,000 | | | | 1,356,250 | |
| 7.625%, 6/15/2021 | | | 435,000 | | | | 478,500 | |
| Intelsat Jackson Holdings SA: | |
| 5.5%, 8/1/2023 | | | 855,000 | | | | 806,906 | |
| 7.25%, 10/15/2020 | | | 5,105,000 | | | | 5,258,150 | |
| 7.5%, 4/1/2021 | | | 2,375,000 | | | | 2,443,281 | |
| Intelsat Luxembourg SA: | |
| 7.75%, 6/1/2021 | | | 1,185,000 | | | | 1,093,162 | |
| 8.125%, 6/1/2023 | | | 185,000 | | | | 170,200 | |
| Level 3 Communications, Inc., 8.875%, 6/1/2019 | | | 55,000 | | | | 57,888 | |
| Level 3 Financing, Inc.: | |
| 5.375%, 8/15/2022 | | | 2,145,000 | | | | 2,207,338 | |
| 6.125%, 1/15/2021 | | | 2,160,000 | | | | 2,265,300 | |
| 7.0%, 6/1/2020 | | | 710,000 | | | | 757,925 | |
| 8.125%, 7/1/2019 | | | 240,000 | | | | 252,300 | |
| 8.625%, 7/15/2020 | | | 295,000 | | | | 319,706 | |
| Millicom International Cellular SA, 144A, 4.75%, 5/22/2020 | | | 645,000 | | | | 631,455 | |
| Pacnet Ltd., 144A, 9.0%, 12/12/2018 | | | 320,000 | | | | 358,400 | |
| Sable International Finance Ltd., 144A, 8.75%, 2/1/2020 | | | 200,000 | | | | 215,000 | |
| Sprint Communications, Inc.: | |
| 144A, 7.0%, 3/1/2020 | | | 475,000 | | | | 523,688 | |
| 144A, 9.0%, 11/15/2018 | | | 1,610,000 | | | | 1,847,475 | |
| Sprint Corp., 7.125%, 6/15/2024 | | | 2,250,000 | | | | 2,193,750 | |
| T-Mobile U.S.A., Inc.: | |
| 6.125%, 1/15/2022 | | | 205,000 | | | | 211,406 | |
| 6.464%, 4/28/2019 | | | 695,000 | | | | 716,719 | |
| 6.625%, 11/15/2020 | | | 2,200,000 | | | | 2,299,000 | |
| 6.625%, 4/1/2023 | | | 1,500,000 | | | | 1,569,375 | |
| Telesat Canada, 144A, 6.0%, 5/15/2017 | | | 4,185,000 | | | | 4,266,607 | |
| UPCB Finance III Ltd., 144A, 6.625%, 7/1/2020 | | | 2,710,000 | | | | 2,828,562 | |
| UPCB Finance IV Ltd., 144A, 5.375%, 1/15/2025 (b) | | | 1,035,000 | | | | 1,050,525 | |
| UPCB Finance V Ltd., 144A, 7.25%, 11/15/2021 | | | 740,000 | | | | 796,425 | |
| UPCB Finance VI Ltd., 144A, 6.875%, 1/15/2022 | | | 540,000 | | | | 576,450 | |
| Wind Acquisition Finance SA, 144A, 6.5%, 4/30/2020 | | | 375,000 | | | | 397,500 | |
| Windstream Corp.: | |
| 6.375%, 8/1/2023 | | | 450,000 | | | | 403,875 | |
| 7.5%, 4/1/2023 | | | 160,000 | | | | 152,800 | |
| 7.75%, 10/15/2020 | | | 160,000 | | | | 163,800 | |
| 7.75%, 10/1/2021 | | | 2,345,000 | | | | 2,339,137 | |
| 8.125%, 9/1/2018 | | | 5,500,000 | | | | 5,754,375 | |
| Zayo Group LLC: | |
| 144A, 6.0%, 4/1/2023 | | | 380,000 | | | | 381,900 | |
| 8.125%, 1/1/2020 | | | 257,000 | | | | 271,778 | |
| | | | | 65,779,698 | |
| Utilities 2.9% | |
| AES Corp.: | |
| 3.262%**, 6/1/2019 | | | 325,000 | | | | 323,375 | |
| 8.0%, 10/15/2017 | | | 268,000 | | | | 309,875 | |
| Calpine Corp.: | |
| 5.375%, 1/15/2023 | | | 465,000 | | | | 465,000 | |
| 5.75%, 1/15/2025 | | | 465,000 | | | | 468,488 | |
| DPL, Inc., 6.5%, 10/15/2016 | | | 419,000 | | | | 439,950 | |
| Dynegy Finance I, Inc., 144A, 7.625%, 11/1/2024 | | | 100,000 | | | | 104,750 | |
| Energy Future Holdings Corp., Series Q, 6.5%, 11/15/2024* | | | 525,000 | | | | 504,000 | |
| IPALCO Enterprises, Inc., 5.0%, 5/1/2018 | | | 1,290,000 | | | | 1,367,400 | |
| NGL Energy Partners LP, 5.125%, 7/15/2019 | | | 370,000 | | | | 362,600 | |
| NRG Energy, Inc., 6.25%, 5/1/2024 | | | 2,275,000 | | | | 2,292,062 | |
| RJS Power Holdings LLC, 144A, 5.125%, 7/15/2019 | | | 380,000 | | | | 374,300 | |
| | | | | 7,011,800 | |
Total Corporate Bonds (Cost $299,270,096) | | | | 301,758,436 | |
| | |
| Loan Participations and Assignments 20.3% | |
| Senior Loans** | |
| Consumer Discretionary 5.9% | |
| Avis Budget Car Rental LLC, Term Loan B, 3.0%, 3/15/2019 | | | 1,088,342 | | | | 1,094,235 | |
| CSC Holdings, Inc., Term Loan B, 2.678%, 4/17/2020 | | | 4,278,228 | | | | 4,265,522 | |
| Cumulus Media Holdings, Inc., Term Loan, 4.25%, 12/23/2020 | | | 526,504 | | | | 518,211 | |
| Goodyear Tire & Rubber Co., Second Lien Term Loan, 4.75%, 4/30/2019 | | | 3,975,000 | | | | 4,022,203 | |
| Hilton Worldwide Finance LLC, Term Loan B2, 3.5%, 10/26/2020 | | | 938,092 | | | | 940,437 | |
| Petco Animal Supplies, Inc., Term Loan, 4.0%, 11/24/2017 | | | 704,458 | | | | 705,631 | |
| Polymer Group, Inc., First Lien Term Loan, 5.25%, 12/19/2019 | | | 1,227,600 | | | | 1,233,738 | |
| Quebecor Media, Inc., Term Loan B1, 3.25%, 8/17/2020 | | | 1,566,150 | | | | 1,550,496 | |
| | | | | 14,330,473 | |
| Consumer Staples 2.1% | |
| Albertson's LLC, Term Loan B2, 5.375%, 3/21/2019 | | | 2,181,814 | | | | 2,200,763 | |
| HJ Heinz Co., Term Loan B2, 3.25%, 6/5/2020 | | | 2,122,608 | | | | 2,129,082 | |
| Pinnacle Foods Finance LLC, Term Loan G, 3.0%, 4/29/2020 | | | 484,288 | | | | 483,078 | |
| Vogue International, Inc., Term Loan, 5.75%, 2/14/2020 | | | 400,950 | | | | 404,458 | |
| | | | | 5,217,381 | |
| Energy 0.1% | |
| Tallgrass Operations LLC: | |
| Term Delayed Draw, 3.75%, 11/13/2017 | | | 246,713 | | | | 245,479 | |
| Term Loan B, 4.25%, 11/13/2018 | | | 70,941 | | | | 70,720 | |
| | | | | 316,199 | |
| Financials 0.3% | |
| Asurion LLC, Second Lien Term Loan, 8.5%, 3/3/2021 | | | 630,000 | | | | 634,095 | |
| Health Care 2.5% | |
| Amsurg Corp., First Lien Term Loan B, 3.75%, 7/16/2021 | | | 565,725 | | | | 567,815 | |
| Community Health Systems, Inc., Term Loan D, 4.25%, 1/27/2021 | | | 543,125 | | | | 546,424 | |
| DaVita HealthCare Partners, Inc., Term Loan B, 3.5%, 6/24/2021 | | | 952,800 | | | | 956,311 | |
| Par Pharmaceutical Companies, Inc., Term Loan B2, 4.0%, 9/30/2019 | | | 1,252,952 | | | | 1,252,859 | |
| Valeant Pharmaceuticals International, Inc.: | |
| Term Loan B, 3.5%, 2/13/2019 | | | 1,979,852 | | | | 1,985,891 | |
| Term Loan B, 3.5%, 12/11/2019 | | | 677,092 | | | | 678,237 | |
| | | | | 5,987,537 | |
| Industrials 1.3% | |
| BE Aerospace, Inc., 2014 Term Loan B, 4.0%, 12/16/2021 | | | 503,738 | | | | 508,455 | |
| Ply Gem Industries, Inc., Term Loan, 4.0%, 2/1/2021 | | | 623,700 | | | | 619,026 | |
| WP CPP Holdings LLC, First Lien Term Loan, 4.75%, 12/28/2019 | | | 2,064,337 | | | | 2,076,723 | |
| | | | | 3,204,204 | |
| Information Technology 2.8% | |
| First Data Corp.: | |
| Term Loan, 3.674%, 3/24/2018 | | | 3,987,082 | | | | 3,991,068 | |
| Term Loan, 4.174%, 3/24/2021 | | | 2,075,000 | | | | 2,084,296 | |
| Freescale Semiconductor, Inc., Term Loan B4, 4.25%, 2/28/2020 | | | 623,684 | | | | 625,674 | |
| | | | | 6,701,038 | |
| Materials 1.8% | |
| American Rock Salt Holdings LLC, First Lien Term Loan, 4.75%, 5/20/2021 | | | 2,228,163 | | | | 2,227,939 | |
| Axalta Coating Systems U.S. Holdings, Inc., Term Loan, 3.75%, 2/1/2020 | | | 2,035,073 | | | | 2,026,282 | |
| | | | | 4,254,221 | |
| Telecommunication Services 2.8% | |
| Crown Castle International Corp., Term Loan B, 3.0%, 1/31/2019 | | | 4,776,396 | | | | 4,787,358 | |
| DigitalGlobe, Inc., Term Loan B, 3.75%, 1/31/2020 | | | 73,500 | | | | 73,741 | |
| Level 3 Financing, Inc.: | |
| Term Loan B, 4.0%, 1/15/2020 | | | 115,000 | | | | 115,408 | |
| Term Loan B5, 4.5%, 1/31/2022 | | | 860,000 | | | | 865,779 | |
| Syniverse Holdings, Inc., Term Loan B, 4.0%, 4/23/2019 | | | 1,110,102 | | | | 1,049,047 | |
| | | | | 6,891,333 | |
| Utilities 0.7% | |
| NRG Energy, Inc., Term Loan B, 2.75%, 7/2/2018 | | | 1,642,911 | | | | 1,640,175 | |
Total Loan Participations and Assignments (Cost $48,893,156) | | | | 49,176,656 | |
| | | Shares | | | Value ($) | |
| | | | |
| Preferred Stock 0.2% | |
| Consumer Discretionary | |
| Ally Financial, Inc. Series G, 144A, 7.0% (Cost $556,844) | | | 600 | | | | 615,844 | |
| | |
| Cash Equivalents 0.3% | |
| Central Cash Management Fund, 0.08% (c) (Cost $693,638) | | | 693,638 | | | | 693,638 | |
| | | % of Net Assets | | | Value ($) | |
| | | | |
Total Investment Portfolio (Cost $349,413,734)† | | | 145.1 | | | | 352,244,574 | |
| Notes Payable | | | (46.7 | ) | | | (113,300,000 | ) |
| Other Assets and Liabilities, Net | | | 1.6 | | | | 3,849,247 | |
| Net Assets | | | 100.0 | | | | 242,793,821 | |
The following table represents a bond that is in default:
| Security | | Coupon | | Maturity Date | Principal Amount ($) | | | Cost ($) | | | Value ($) | |
| Energy Future Holdings Corp.* | | | 6.50 | % | 11/15/2024 | USD | | | 525,000 | | | | 314,243 | | | | 504,000 | |
* Non-income producing security.
** Floating rate securities’ yields vary with a designated market index or market rate, such as the coupon-equivalent of the U.S. Treasury Bill rate. These securities are shown at their current rate as of March 31, 2015.
† The cost for federal income tax purposes was $349,352,853. At March 31, 2015, net unrealized appreciation for all securities based on tax cost was $2,891,721. This consisted of aggregate gross unrealized appreciation for all securities in which there was an excess of value over tax cost of $7,886,361 and aggregate gross unrealized depreciation for all securities in which there was an excess of tax cost over value of $4,994,640.
(a) Principal amount stated in U.S. dollars unless otherwise noted.
(b) When-issued security.
(c) Affiliated fund managed by Deutsche Investment Management Americas Inc. The rate shown is the annualized seven-day yield at period end.
144A: Security exempt from registration under Rule 144A of the Securities Act of 1933. These securities may be resold in transactions exempt from registration, normally to qualified institutional buyers.
REIT: Real Estate Investment Trust
At March 31, 2015, open credit default swap contracts sold were as follows:
| Bilateral Swaps | |
Effective/ Expiration Dates | | Notional Amount ($) (d) | | | Fixed Cash Flows Received | | Underlying Debt Obligation/ Quality Rating (e) | | Value ($) | | | Upfront Payments Paid ($) | | | Unrealized Appreciation ($) | |
12/22/2014 3/20/2020 | | | 670,000 | 1 | | | 5.0 | % | General Motors Corp., 6.25%, 10/2/2043, BBB– | | | 116,299 | | | | 106,000 | | | | 10,299 | |
6/20/2013 9/20/2018 | | | 1,260,000 | 2 | | | 5.0 | % | Sprint Communications, Inc., 6.0%, 12/1/2016, B+ | | | 87,624 | | | | 51,982 | | | | 35,642 | |
| Total unrealized appreciation | | | | 45,941 | |
(d) The maximum potential amount of future undiscounted payments that the Fund could be required to make under a credit default swap contract would be the notional amount of the contract. These potential amounts would be partially offset by any recovery values of the referenced debt obligation or net amounts received from the settlement of buy protection credit default swap contracts entered into by the Fund for the same referenced debt obligation, if any.
(e) The quality ratings represent the higher of Moody's Investors Service, Inc. ("Moody's") or Standard & Poor's Corporation ("S&P") credit ratings and are unaudited.
Counterparties:
1 Credit Suisse
2 Goldman Sachs & Co.
As of March 31, 2015, the Fund had the following open forward foreign currency exchange contracts:
| Contracts to Deliver | | In Exchange For | | Settlement Date | | Unrealized Appreciation ($) | | Counterparty |
| EUR | | | 495,000 | | USD | | | 583,135 | | 4/13/2015 | | | 50,809 | | Bank of America |
| Currency Abbreviations |
EUR Euro USD United States Dollar |
For information on the Fund's policy and additional disclosure regarding credit default swaps and forward foreign currency exchange contracts, please refer to Note B in the accompanying Notes to Financial Statements.
Fair Value Measurements
Various inputs are used in determining the value of the Fund's investments. These inputs are summarized in three broad levels. Level 1 includes quoted prices in active markets for identical securities. Level 2 includes other significant observable inputs (including quoted prices for similar securities, interest rates, prepayment speeds and credit risk). Level 3 includes significant unobservable inputs (including the Fund's own assumptions in determining the fair value of investments). The level assigned to the securities valuations may not be an indication of the risk or liquidity associated with investing in those securities.
The following is a summary of the inputs used as of March 31, 2015 in valuing the Fund's investments. For information on the Fund's policy regarding the valuation of investments, please refer to the Security Valuation section of Note A in the accompanying Notes to Financial Statements.
| Assets | | Level 1 | | | Level 2 | | | Level 3 | | | Total | |
| | |
| Fixed Income Investments (f) | |
| Corporate Bonds | | $ | — | | | $ | 301,758,436 | | | $ | — | | | $ | 301,758,436 | |
| Loan Participations and Assignments | | | — | | | | 48,931,177 | | | | 245,479 | | | | 49,176,656 | |
| Preferred Stock | | | — | | | | 615,844 | | | | — | | | | 615,844 | |
| Short-Term Investments | | | 693,638 | | | | — | | | | — | | | | 693,638 | |
Derivatives (g) Credit Default Swaps Contracts | | | — | | | | 45,941 | | | | — | | | | 45,941 | |
| Forward Foreign Currency Contracts | | | — | | | | 50,809 | | | | — | | | | 50,809 | |
| Total | | $ | 693,638 | | | $ | 351,402,207 | | | $ | 245,479 | | | $ | 352,341,324 | |
During the period ended March 31, 2015, the amount of transfers between Level 2 and Level 3 was $455,984. The investment was transferred from Level 2 to Level 3 because of the lack of observable market data due to a decrease in market activity.
During the period ended March 31, 2015, the amount of transfers between Level 3 and Level 2 was $403,479. The investment was transferred from Level 3 to Level 2 as a result of the availability of a pricing source supported by observable inputs.
Transfers between price levels are recognized at the beginning of the reporting period.
(f) See Investment Portfolio for additional detailed categorizations.
(g) Derivatives include unrealized appreciation (depreciation) on credit default swap contracts and forward foreign currency exchange contracts.
The accompanying notes are an integral part of the financial statements.
Statement of Assets and Liabilities | as of March 31, 2015 (Unaudited) | |
| Assets | |
Investments: Investments in non-affiliated securities, at value (cost $348,720,096) | | $ | 351,550,936 | |
| Investment in Central Cash Management Fund (cost $693,638) | | | 693,638 | |
| Total investments in securities, at value (cost $349,413,734) | | | 352,244,574 | |
| Cash | | | 415,413 | |
| Receivable for investments sold | | | 982,094 | |
| Dividends receivable | | | 6,279 | |
| Interest receivable | | | 5,449,941 | |
| Unrealized appreciation on bilateral swap contracts | | | 45,941 | |
| Unrealized appreciation on forward foreign currency exchange contracts | | | 50,809 | |
| Upfront payments paid on bilateral swap contracts | | | 157,982 | |
| Other assets | | | 5,431 | |
| Total assets | | | 359,358,464 | |
| Liabilities | |
| Payable for investment purchased | | | 212,431 | |
| Payable for investment purchased — when-issued securities | | | 2,415,000 | |
| Notes payable | | | 113,300,000 | |
| Interest on notes payable | | | 158,820 | |
| Payable for Fund shares repurchased | | | 62,875 | |
| Accrued management fee | | | 256,436 | |
| Accrued Directors' fees | | | 1,122 | |
| Other accrued expenses and payables | | | 157,959 | |
| Total liabilities | | | 116,564,643 | |
| Net assets, at value | | $ | 242,793,821 | |
| Net Assets Consist of | |
| Distributions in excess of net investment income | | | (154,030 | ) |
Net unrealized appreciation (depreciation) on: Investments | | | 2,830,840 | |
| Swap contracts | | | 45,941 | |
| Foreign currency | | | 49,602 | |
| Accumulated net realized gain (loss) | | | (597,071,060 | ) |
| Paid-in capital | | | 837,092,528 | |
| Net assets, at value | | $ | 242,793,821 | |
| Net Asset Value | |
Net Asset Value per share ($242,793,821 ÷ 15,194,021 shares of common stock issued and outstanding, $.01 par value, 100,000,000 shares authorized) | | $ | 15.98 | |
The accompanying notes are an integral part of the financial statements.
| for the six months ended March 31, 2015 (Unaudited) | |
| Investment Income | |
| Interest | | $ | 9,875,518 | |
| Dividends | | | 48,675 | |
| Income distributions — Central Cash Management Fund | | | 1,871 | |
| Total income | | | 9,926,064 | |
Expenses: Management fee | | | 1,470,202 | |
| Administration fee | | | 172,965 | |
| Services to shareholders | | | 1,812 | |
| Custodian fee | | | 35,268 | |
| Professional fees | | | 76,743 | |
| Reports to shareholders | | | 43,705 | |
| Directors' fees and expenses | | | 9,006 | |
| Interest expense | | | 549,042 | |
| Stock exchange listing fees | | | 11,924 | |
| Other | | | 28,874 | |
| Total expenses | | | 2,399,541 | |
| Net investment income | | | 7,526,523 | |
| Realized and Unrealized Gain (Loss) | |
Net realized gain (loss) from: Investments | | | (1,822,480 | ) |
| Swap contracts | | | 276,482 | |
| Foreign currency | | | 118,304 | |
| | | | (1,427,694 | ) |
Change in net unrealized appreciation (depreciation) on: Investments | | | (1,168,510 | ) |
| Swap contracts | | | (252,190 | ) |
| Foreign currency | | | (27,227 | ) |
| | | | (1,447,927 | ) |
| Net gain (loss) | | | (2,875,621 | ) |
| Net increase (decrease) in net assets resulting from operations | | $ | 4,650,902 | |
The accompanying notes are an integral part of the financial statements.
| for the six months ended March 31, 2015 (Unaudited) | |
Increase (Decrease) in Cash: Cash Flows from Operating Activities | | | |
| Net increase (decrease) in net assets resulting from operations | | $ | 4,650,902 | |
Adjustments to reconcile net increase (decrease) in net assets resulting from operations to net cash provided (used) by operating activities: Purchases of long-term investments | | | (85,873,831 | ) |
| Net purchases, sales and maturities of short-term investments | | | 12,919,988 | |
| Net amortization/accretion of premium (discount) | | | 460,326 | |
| Proceeds from sales and maturities of long-term investments | | | 78,944,997 | |
| (Increase) decrease in interest receivable | | | 258,342 | |
| (Increase) decrease in dividends receivable | | | (6,279 | ) |
| (Increase) decrease in other assets | | | (4,729 | ) |
| (Increase) decrease in receivable for investments sold | | | (649,267 | ) |
| (Increase) decrease in receivable for investments sold — when-issued securities | | | 440,187 | |
| Increase (decrease) in interest on notes payable | | | 30,369 | |
| Increase (decrease) in payable for investments purchased | | | 212,431 | |
| Increase (decrease) in payable for investments purchased — when-issued securities | | | 437,667 | |
| (Increase) decrease in upfront payments paid/received on credit default swap contracts | | | 76,018 | |
| Increase (decrease) in other accrued expenses and payables | | | (47,788 | ) |
| Change in unrealized (appreciation) depreciation on investments | | | 1,168,510 | |
| Change in unrealized (appreciation) depreciation on swaps | | | 252,190 | |
| Change in net unrealized (appreciation) depreciation on forward foreign currency exchange contracts | | | 26,652 | |
| Net realized (gain) loss from investments | | | 1,822,480 | |
| Cash provided (used) by operating activities | | | 15,119,165 | |
| Cash Flows from Financing Activities | | | | |
| Net increase (decrease) in notes payable | | | (3,200,000 | ) |
| Cost of shares repurchased | | | (3,667,310 | ) |
| Distributions paid | | | (8,113,854 | ) |
| Cash provided (used) for financing activities | | | (14,981,164 | ) |
| Increase (decrease) in cash | | | 138,001 | |
| Cash at beginning of period | | | 277,412 | |
| Cash at end of period | | $ | 415,413 | |
| Supplemental Disclosure | | | | |
| Interest paid on notes | | $ | (518,673 | ) |
The accompanying notes are an integral part of the financial statements.
Statement of Changes in Net Assets | | | | | | | |
| Increase (Decrease) in Net Assets | | Six Months Ended March 31, 2015 (Unaudited) | | | Year Ended September 30, 2014 | |
Operations: Net investment income | | $ | 7,526,523 | | | $ | 16,975,784 | |
| Net realized gain (loss) | | | (1,427,694 | ) | | | 5,402,715 | |
| Change in net unrealized appreciation (depreciation) | | | (1,447,927 | ) | | | (4,109,922 | ) |
| Net increase (decrease) in net assets resulting from operations | | | 4,650,902 | | | | 18,268,577 | |
Distributions to shareholders from: Net investment income | | | (8,113,854 | ) | | | (16,461,492 | ) |
Fund share transactions: Cost of shares repurchased | | | (3,644,727 | ) | | | (11,793,154 | ) |
| Net increase (decrease) in net assets from Fund share transactions | | | (3,644,727 | ) | | | (11,793,154 | ) |
| Increase (decrease) in net assets | | | (7,107,679 | ) | | | (9,986,069 | ) |
| Net assets at beginning of period | | | 249,901,500 | | | | 259,887,569 | |
| Net assets at end of period (including distributions in excess of net investment income and undistributed net investment income of $154,030 and $433,301, respectively) | | $ | 242,793,821 | | | $ | 249,901,500 | |
| Other Information | |
| Shares outstanding at beginning of period | | | 15,450,908 | | | | 16,269,962 | |
| Shares repurchased | | | (256,887 | ) | | | (819,054 | ) |
| Shares outstanding at end of period | | | 15,194,021 | | | | 15,450,908 | |
The accompanying notes are an integral part of the financial statements.
| | | | | | Years Ended September 30, | |
| | | Six Months Ended 3/31/15 (Unaudited) | | | 2014 | | | 2013 | | | 2012 | | | 2011 | | | 2010 | |
| Selected Per Share Data | |
| Net asset value, beginning of period | | $ | 16.17 | | | $ | 15.97 | | | $ | 16.03 | | | $ | 13.92 | | | $ | 15.03 | | | $ | 13.58 | |
Income (loss) from investment operations: Net investment incomea | | | .49 | | | | 1.08 | | | | 1.14 | | | | 1.25 | | | | 1.25 | | | | 1.03 | |
| Net realized and unrealized gain (loss) | | | (.18 | ) | | | .07 | | | | (.08 | ) | | | 2.19 | | | | (1.09 | ) | | | 1.19 | |
| Total from investment operations | | | .31 | | | | 1.15 | | | | 1.06 | | | | 3.44 | | | | .16 | | | | 2.22 | |
Less distributions from: Net investment income | | | (.53 | ) | | | (1.05 | ) | | | (1.19 | ) | | | (1.33 | ) | | | (1.42 | ) | | | (.88 | ) |
NAV accretion resulting from repurchases of shares and shares tendered at a discount to NAVa | | | .03 | | | | .10 | | | | .07 | | | | — | | | | .15 | | | | .11 | |
| Net asset value, end of period | | $ | 15.98 | | | $ | 16.17 | | | $ | 15.97 | | | $ | 16.03 | | | $ | 13.92 | | | $ | 15.03 | |
| Market value, end of period | | $ | 14.36 | | | $ | 14.64 | | | $ | 14.15 | | | $ | 15.97 | | | $ | 13.07 | | | $ | 13.40 | |
| Total Return | |
Based on net asset value (%)b | | | 2.56 | ** | | | 8.78 | | | | 7.77 | | | | 25.73 | | | | 2.16 | | | | 18.67 | |
Based on market value (%)b | | | 1.79 | ** | | | 11.16 | | | | (4.15 | ) | | | 33.41 | | | | 7.66 | | | | 28.42 | |
| Ratios to Average Net Assets and Supplemental Data | |
| Net assets, end of period ($ millions) | | | 243 | | | | 250 | | | | 260 | | | | 270 | | | | 234 | | | | 365 | |
Ratio of expenses before fee reductions (including interest expense and dividend expense for securities sold short) (%)d | | | 1.97 | * | | | 2.01 | | | | 2.06 | | | | 2.30 | | | | 2.52 | | | | 1.64 | |
Ratio of expenses after fee reductions (including interest expense and dividend expense for securities sold short) (%)d | | | 1.97 | * | | | 2.01 | | | | 2.06 | | | | 2.08 | | | | 2.31 | | | | 1.50 | |
Ratio of expenses after fee reductions (excluding interest expense and dividend expense for securities sold short) (%)d | | | 1.52 | * | | | 1.52 | | | | 1.47 | | | | 1.44 | | | | 1.68 | | | | 1.24 | |
| Ratio of net investment income (%) | | | 6.17 | * | | | 6.53 | | | | 7.01 | | | | 8.12 | | | | 8.08 | | | | 7.18 | |
| Portfolio turnover rate (%) | | | 23 | ** | | | 46 | | | | 53 | | | | 36 | | | | 134 | | | | 154 | |
| Total debt outstanding, end of period ($ thousands) | | | 113,300 | | | | 116,500 | | | | 110,000 | | | | 114,000 | | | | 98,000 | | | | 50,000 | |
Asset coverage per $1,000 of debtc | | | 3,143 | | | | 3,145 | | | | 3,363 | | | | 3,369 | | | | 3,392 | | | | 8,303 | |
a Based on average shares outstanding during the period. b Total return based on net asset value reflects changes in the Fund's net asset value during the period. Total return based on market value reflects changes in market value. Each figure assumes that dividend and capital gain distributions, if any, were reinvested. These figures will differ depending upon the level of any discount from or premium to net asset value at which the Fund's shares traded during the period. c Asset coverage equals the total net assets plus borrowings of the Fund divided by the borrowings outstanding at period end. d Prior to November 5, 2010, the Fund utilized short sales as part of the hedge strategy that sought to provide returns that were uncorrelated with the market. * Annualized ** Not annualized |
Notes to Financial Statements (Unaudited)
A. Organization and Significant Accounting Policies
Deutsche High Income Opportunities Fund, Inc. (the "Fund") is registered under the Investment Company Act of 1940, as amended (the "1940 Act''), as a closed-end, diversified management investment company organized as a Maryland corporation.
The Fund's financial statements are prepared in accordance with accounting principles generally accepted in the United States of America which require the use of management estimates. Actual results could differ from those estimates. The policies described below are followed consistently by the Fund in the preparation of its financial statements.
Security Valuation. Investments are stated at value determined as of the close of regular trading on the New York Stock Exchange on each day the exchange is open for trading.
Various inputs are used in determining the value of the Fund's investments. These inputs are summarized in three broad levels. Level 1 includes quoted prices in active markets for identical securities. Level 2 includes other significant observable inputs (including quoted prices for similar securities, interest rates, prepayment speeds and credit risk). Level 3 includes significant unobservable inputs (including the Fund's own assumptions in determining the fair value of investments). The level assigned to the securities valuations may not be an indication of the risk or liquidity associated with investing in those securities.
Debt securities and loan participations and assignments are valued at prices supplied by independent pricing services approved by the Fund's Board. Such services may use various pricing techniques which take into account appropriate factors such as yield, quality, coupon rate, maturity, type of issue, trading characteristics, prepayment speeds and other data, as well as broker quotes. If the pricing services are unable to provide valuations, debt securities are valued at the average of the most recent reliable bid quotations or evaluated prices, as applicable, obtained from broker-dealers and loan participations and assignments are valued at the mean of the most recent bid and ask quotations or evaluated prices, as applicable, obtained from broker-dealers. Certain securities may be valued on the basis of a price provided by a single source or broker-dealer. No active trading market may exist for some senior loans and they may be subject to restrictions on resale. The inability to dispose of senior loans in a timely fashion could result in losses. These securities are generally categorized as Level 2.
Investments in open-end investment companies are valued at their net asset value each business day and are categorized as Level 1.
Forward currency contracts are valued at the prevailing forward exchange rate of the underlying currencies and are categorized as Level 2.
Swap contracts are valued daily based upon prices supplied by a Board-approved pricing vendor, if available, and otherwise are valued at the price provided by the broker-dealer. Swap contracts are generally categorized as Level 2.
Securities and other assets for which market quotations are not readily available or for which the above valuation procedures are deemed not to reflect fair value are valued in a manner that is intended to reflect their fair value as determined in accordance with procedures approved by the Board and are generally categorized as Level 3. In accordance with the Fund's valuation procedures, factors considered in determining value may include, but are not limited to, the type of the security; the size of the holding; the initial cost of the security; the existence of any contractual restrictions on the security's disposition; the price and extent of public trading in similar securities of the issuer or of comparable companies; quotations or evaluated prices from broker-dealers and/or pricing services; information obtained from the issuer, analysts, and/or the appropriate stock exchange (for exchange-traded securities); an analysis of the company's or issuer's financial statements; an evaluation of the forces that influence the issuer and the market(s) in which the security is purchased and sold; and with respect to debt securities, the maturity, coupon, creditworthiness, currency denomination, and the movement of the market in which the security is normally traded. The value determined under these procedures may differ from published values for the same securities.
Disclosure about the classification of fair value measurements is included in a table following the Fund's Investment Portfolio.
Foreign Currency Translations. The books and records of the Fund are maintained in U.S. dollars. Investment securities and other assets and liabilities denominated in a foreign currency are translated into U.S. dollars at the prevailing exchange rates at period end. Purchases and sales of investment securities, income and expenses are translated into U.S. dollars at the prevailing exchange rates on the respective dates of the transactions.
Net realized and unrealized gains and losses on foreign currency transactions represent net gains and losses between trade and settlement dates on securities transactions, the acquisition and disposition of foreign currencies, and the difference between the amount of net investment income accrued and the U.S. dollar amount actually received. That portion of both realized and unrealized gains and losses on investments that results from fluctuations in foreign currency exchange rates is not separately disclosed but is included with net realized and unrealized gain/appreciation and loss/depreciation on investments.
When-Issued/Delayed Delivery Securities. The Fund may purchase or sell securities with delivery or payment to occur at a later date beyond the normal settlement period. At the time the Fund enters into a commitment to purchase or sell a security, the transaction is recorded and the value of the transaction is reflected in the net asset value. The price of such security and the date when the security will be delivered and paid for are fixed at the time the transaction is negotiated. The value of the security may vary with market fluctuations. At the time the Fund enters into a purchase transaction it is required to segregate cash or other liquid assets at least equal to the amount of the commitment. Additionally, the Fund may be required to post securities and/or cash collateral in accordance with the terms of the commitment.
Certain risks may arise upon entering into when-issued or delayed delivery transactions from the potential inability of counterparties to meet the terms of their contracts or if the issuer does not issue the securities due to political, economic, or other factors. Additionally, losses may arise due to changes in the value of the underlying securities.
Loan Participations and Assignments. Loan Participations and Assignments are portions of loans originated by banks and sold in pieces to investors. These fixed- and floating-rate loans ("Loans") in which the Fund invests are arranged between the borrower and one or more financial institutions ("Lenders"). These Loans may take the form of Senior Loans, which are corporate obligations often issued in connection with recapitalizations, acquisitions, leveraged buy outs and refinancing. The Fund invests in such Loans in the form of participations in Loans ("Participations") or assignments of all or a portion of Loans from third parties ("Assignments"). Participations typically result in the Fund having a contractual relationship with only the Lender, not with the borrower. The Fund has the right to receive payments of principal, interest and any fees to which it is entitled from the Lender selling the Participation and only upon receipt by the Lender of the payments from the borrower. In connection with purchasing Participations, the Fund generally has no right to enforce compliance by the borrower with the terms of the loan agreement relating to the Loan, or any rights of set off against the borrower, and the Fund will not benefit directly from any collateral supporting the Loan in which it has purchased the Participation. As a result, the Fund assumes the credit risk of both the borrower and the Lender that is selling the Participation. Assignments typically result in the Fund having a direct contractual relationship with the borrower, and the Fund may enforce compliance by the borrower with the terms of the loan agreement. Loans held by the Fund are generally in the form of Assignments, but the Fund may also invest in Participations. All Loans involve interest rate risk, liquidity risk and credit risk, including the potential default or insolvency of the borrower.
Federal Income Taxes. The Fund's policy is to comply with the requirements of the Internal Revenue Code, as amended, which are applicable to regulated investment companies, and to distribute all of its taxable income to its shareholders.
Under the Regulated Investment Company Modernization Act of 2010, net capital losses incurred post-enactment may be carried forward indefinitely, and their character is retained as short-term and/or long-term. Previously, net capital losses were carried forward for eight years and treated as short-term losses. As a transition rule, the Act requires that post-enactment net capital losses be used before pre-enactment net capital losses.
At September 30, 2014, the Fund had a net tax basis capital loss carryforward of approximately $595,704,000, including $511,896,000 of pre-enactment losses, which may be applied against any realized net taxable capital gains of each succeeding year until fully utilized or until September 30, 2016 ($58,426,000), September 30, 2017 ($198,233,000), September 30, 2018 ($243,689,000) and September 30, 2019 ($11,548,000), the respective expiration dates, whichever occurs first; and approximately $83,808,000 of post-enactment long-term losses, which may be applied against realized net taxable capital gains indefinitely.
The Fund has reviewed the tax positions for the open tax years as of September 30, 2014 and has determined that no provision for income tax and/or uncertain tax provisions is required in the Fund's financial statements. The Fund's federal tax returns for the prior three fiscal years remain open subject to examination by the Internal Revenue Service.
Distribution of Income and Gains. Distributions from net investment income of the Fund are declared and distributed to shareholders monthly. Net realized gains from investment transactions, in excess of available capital loss carryforwards, would be taxable to the Fund if not distributed, and, therefore, will be distributed to shareholders at least annually. The Fund may also make additional distributions for tax purposes if necessary.
The timing and characterization of certain income and capital gain distributions are determined annually in accordance with federal tax regulations which may differ from accounting principles generally accepted in the United States of America. These differences primarily relate to certain securities sold at a loss and forward foreign currency commitments. As a result, net investment income (loss) and net realized gain (loss) on investment transactions for a reporting period may differ significantly from distributions during such period. Accordingly, the Fund may periodically make reclassifications among certain of its capital accounts without impacting the net asset value of the Fund.
The tax character of current year distributions will be determined at the end of the current fiscal year.
Statement of Cash Flows. Information on financial transactions which have been settled through the receipt and disbursement of cash is presented in the Statement of Cash Flows. The cash amount shown in the Statement of Cash Flows represents the cash position at the Fund's custodian bank at March 31, 2015.
Contingencies. In the normal course of business, the Fund may enter into contracts with service providers that contain general indemnification clauses. The Fund's maximum exposure under these arrangements is unknown as this would involve future claims that may be made against the Fund that have not yet been made. However, based on experience, the Fund expects the risk of loss to be remote.
Other. Investment transactions are accounted for on a trade date plus one basis for daily net asset value calculations. However, for financial reporting purposes, investment transactions are reported on trade date. Interest income is recorded on the accrual basis. Dividend income is recorded on the ex-dividend date, net of foreign withholding taxes. Realized gains and losses from investment transactions are recorded on an identified cost basis. Proceeds from litigation payments, if any, are included in net realized gain (loss) from investments. All premiums and discounts are amortized/accreted for financial reporting purposes, with the exception of securities in default of principal.
B. Derivative Instruments
Swaps. A swap is a contract between two parties to exchange future cash flows at periodic intervals based on the notional amount of the swap. A bilateral swap is a transaction between the fund and a counterparty where cash flows are exchanged between the two parties. A centrally cleared swap is a transaction executed between the fund and a counterparty, then cleared by a clearing member through a central clearinghouse. The central clearinghouse serves as the counterparty, with whom the fund exchanges cash flows.
The value of a swap is adjusted daily, and the change in value, if any, is recorded as unrealized appreciation or depreciation in the Statement of Assets and Liabilities. Gains or losses are realized when the swap expires or is closed. Certain risks may arise when entering into swap transactions including counterparty default; liquidity; or unfavorable changes in interest rates or the value of the underlying reference security, commodity or index. In connection with bilateral swaps, securities and/or cash may be identified as collateral in accordance with the terms of the swap agreement to provide assets of value and recourse in the event of default. The maximum counterparty credit risk is the net present value of the cash flows to be received from or paid to the counterparty over the term of the swap, to the extent that this amount is beneficial to the Fund, in addition to any related collateral posted to the counterparty by the Fund. This risk may be partially reduced by a master netting arrangement between the Fund and the counterparty. Upon entering into a centrally cleared swap, the Fund is required to deposit with a financial intermediary cash or securities ("initial margin") in an amount equal to a certain percentage of the notional amount of the swap. Subsequent payments ("variation margin") are made or received by the Fund dependent upon the daily fluctuations in the value of the swap. In a cleared swap transaction, counterparty risk is minimized as the central clearinghouse acts as the counterparty.
An upfront payment, if any, made by the Fund is recorded as an asset in the Statement of Assets and Liabilities. An upfront payment, if any, received by the Fund is recorded as a liability in the Statement of Assets and Liabilities. Payments received or made at the end of the measurement period are recorded as realized gain or loss in the Statement of Operations.
A credit default swap is a contract between a buyer and a seller of protection against pre-defined credit events for the reference entity. As a seller in the credit default swap contract, the Fund is required to pay the par (or other agreed-upon) value of the referenced entity to the counterparty with the occurrence of a credit event by a third party, such as a U.S. or foreign corporate issuer, on the reference entity, which would likely result in a loss to the Fund. In return, the Fund receives from the counterparty a periodic stream of payments over the term of the contract provided that no credit event has occurred. If no credit event occurs, the Fund keeps the stream of payments with no payment obligations. As a buyer in the credit default swap contract, the Fund functions as the counterparty referenced above. This involves the risk that the contract may expire worthless. It also involves counterparty risk that the seller may fail to satisfy its payment obligations to the Fund with the occurrence of a credit event. When the Fund sells a credit default swap contract it will cover its commitment. This is achieved by, among other methods, maintaining cash or liquid assets equal to the aggregate notional value of the reference entities for all outstanding credit default swap contracts sold by the Fund. For the six months ended March 31, 2015, the Fund sold credit default swap contracts to gain exposure to an underlying issuer's credit quality characteristics.
Under the terms of a credit default swap, the Fund receives or makes periodic payments based on a specified interest rate on a fixed notional amount. These payments are recorded as a realized gain or loss in the Statement of Operations. Payments received or made as a result of a credit event or termination of the swap are recognized, net of a proportional amount of the upfront payment, as realized gains or losses in the Statement of Operations.
A summary of the open credit default swap contracts as of March 31, 2015 is included in a table following the Fund's Investment Portfolio. For the six months ended March 31, 2015, the investment in credit default swap contracts sold had a total notional value generally indicative of a range from $1,930,000 to $4,645,000.
Forward Foreign Currency Exchange Contracts. A forward foreign currency exchange contract ("forward currency contract") is a commitment to purchase or sell a foreign currency at the settlement date at a negotiated rate. For the six months ended March 31, 2015, the Fund entered into forward currency contracts in order to hedge its exposure to changes in foreign currency exchange rates on its foreign currency denominated portfolio holdings and to facilitate transactions in foreign currency denominated securities.
Forward currency contracts are valued at the prevailing forward exchange rate of the underlying currencies and unrealized gain (loss) is recorded daily. On the settlement date of the forward currency contract, the Fund records a realized gain or loss equal to the difference between the value of the contract at the time it was opened and the value of the contract at the time it was closed. Certain risks may arise upon entering into forward currency contracts from the potential inability of counterparties to meet the terms of their contracts. The maximum counterparty credit risk to the Fund is measured by the unrealized gain on appreciated contracts. Additionally, when utilizing forward currency contracts to hedge, the Fund gives up the opportunity to profit from favorable exchange rate movements during the term of the contract.
A summary of the open forward currency contracts as of March 31, 2015 is included in a table following the Fund's Investment Portfolio. For the six months ended March 31, 2015, the investment in forward currency contracts short vs. U.S. dollars had a total contract value generally indicative of a range from approximately $583,000 to $2,726,000, and the investment in forward currency contracts long vs. U.S. dollars had a total contract value generally indicative of a range from $0 to approximately $2,252,000.
The following tables summarize the value of the Fund's derivative instruments held as of March 31, 2015 and the related location in the accompanying Statement of Assets and Liabilities, presented by primary underlying risk exposure:
| Asset Derivatives | | Forward Contracts | | | Swap Contracts | | | Total | |
| Credit Contracts (a) | | $ | — | | | $ | 45,941 | | | $ | 45,941 | |
| Foreign Exchange Contracts (b) | | | 50,809 | | | | — | | | | 50,809 | |
| | | $ | 50,809 | | | $ | 45,941 | | | $ | 96,750 | |
Each of the above derivatives is located in the following Statement of Assets and Liabilities accounts: (a) Unrealized appreciation on bilateral swap contracts (b) Unrealized appreciation on forward foreign currency exchange contracts | |
Additionally, the amount of unrealized and realized gains and losses on derivative instruments recognized in Fund earnings during the six months ended March 31, 2015 and the related location in the accompanying Statement of Operations is summarized in the following tables by primary underlying risk exposure:
| Realized Gain (Loss) | | Forward Contracts | | | Swap Contracts | | | Total | |
| Credit Contracts (a) | | $ | — | | | $ | 276,482 | | | $ | 276,482 | |
| Foreign Exchange Contracts (b) | | | 120,789 | | | | — | | | | 120,789 | |
| | | $ | 120,789 | | | $ | 276,482 | | | $ | 397,271 | |
Each of the above derivatives is located in the following Statement of Operations accounts: (a) Net realized gain (loss) from bilateral swap contracts (b) Net realized gain (loss) from foreign currency (Statement of Operations includes both forward currency contracts and foreign currency transactions) | |
| Change in Net Unrealized Appreciation (Depreciation) | | Forward Contracts | | | Swap Contracts | | | Total | |
| Credit Contracts (a) | | $ | — | | | $ | (252,190 | ) | | $ | (252,190 | ) |
| Foreign Exchange Contracts (b) | | | (26,652 | ) | | | — | | | | (26,652 | ) |
| | | $ | (26,652 | ) | | $ | (252,190 | ) | | $ | (278,842 | ) |
Each of the above derivatives is located in the following Statement of Operations accounts: (a) Change in net unrealized appreciation (depreciation) on swap contracts (b) Change in net unrealized appreciation (depreciation) on foreign currency (Statement of Operations includes both forward currency contracts and foreign currency transactions) | |
As of March 31, 2015, the Fund has transactions subject to enforceable master netting agreements. A reconciliation of the gross amounts on the Statement of Assets and Liabilities to the net amounts by counterparty, including any collateral exposure, is included in the following tables:
| Counterparty | | Gross Amounts of Assets Presented in the Statement of Assets and Liabilities | | | Financial Instruments and Derivatives Available for Offset | | | Collateral Received | | | Net Amount of Derivative Assets | |
| Bank of America | | $ | 50,809 | | | $ | — | | | $ | — | | | $ | 50,809 | |
| Credit Suisse | | | 10,298 | | | | — | | | | — | | | | 10,298 | |
| Goldman Sachs | | | 35,643 | | | | — | | | | — | | | | 35,643 | |
| | | $ | 96,750 | | | $ | — | | | $ | — | | | $ | 96,750 | |
C. Purchases and Sales of Securities
During the six months ended March 31, 2015, purchases and sales of investment securities (excluding short-term investments) aggregated $85,873,831 and $78,944,997, respectively.
D. Related Parties
Management Agreement. Under the Investment Management Agreement with Deutsche Investment Management Americas Inc. ("DIMA" or the "Advisor"), an indirect, wholly owned subsidiary of Deutsche Bank AG, the Advisor directs the investments of the Fund in accordance with its investment objectives, policies and restrictions. The contractual management fee payable under the Investment Management Agreement is equal to an annual rate of 0.85% of the Fund's average daily managed assets, computed and accrued daily and payable monthly. Managed assets means the total assets of the Fund (including any assets attributable to any leverage that may be outstanding) minus the sum of accrued liabilities (other than debt representing financial leverage).
Administration Fee. Pursuant to an Administrative Services Agreement, DIMA provides most administrative services to the Fund. For all services provided under the Administrative Services Agreement, the Fund pays the Advisor an annual fee ("Administration Fee") of 0.10% of the Fund's average daily managed assets, computed and accrued daily and payable monthly. For the six months ended March 31, 2015, the Administration Fee was $172,965, of which $30,103 is unpaid.
Service Provider Fees. DeAWM Service Company ("DSC"), an affiliate of the Advisor, is the transfer agent and dividend-paying agent for the Fund. Pursuant to a sub-transfer agency agreement between DSC and DST Systems, Inc. ("DST"), DSC has delegated certain transfer agent and dividend-paying agent functions to DST. DSC compensates DST out of the shareholder servicing fee it receives from the Fund. For the six months ended March 31, 2015, the amount charged to the Fund by DSC aggregated $135, of which $65 is unpaid.
Typesetting and Filing Service Fees. Under an agreement with DIMA, DIMA is compensated for providing typesetting and certain regulatory filing services to the Fund. For the six months ended March 31, 2015, the amount charged to the Fund by DIMA included in the Statement of Operations under "Reports to shareholders" aggregated $7,767, all of which is unpaid.
Directors' Fees and Expenses. The Fund paid retainer fees to each Director not affiliated with the Advisor, plus specified amounts to the Board Chairperson and Vice Chairperson and to each committee Chairperson.
Affiliated Cash Management Vehicle. The Fund may invest uninvested cash balances in Central Cash Management Fund, which is managed by the Advisor. The Fund indirectly bears its proportionate share of the expenses of Central Cash Management Fund. Central Cash Management Fund does not pay the Advisor an investment management fee. Central Cash Management Fund seeks a high level of current income consistent with liquidity and the preservation of capital.
E. Investing in High-Yield Securities
The Fund's performance could be hurt if a security declines in credit quality or goes into default, or if an issuer does not make timely payments of interest or principal. Because the issuers of high-yield debt securities or junk bonds (debt securities rated below the fourth-highest category) may be in uncertain financial health, the risk of loss from default by the issuer is significantly greater. Prices and yields of high-yield securities will fluctuate over time and, during periods of economic uncertainty, volatility of high-yield securities may adversely affect a fund's net asset value. Because the Fund may invest in securities not paying current interest or in securities already in default, these risks may be more pronounced.
F. Borrowings
The Fund has a secured line of credit with a commercial bank with a commitment amount up to $122,000,000 with a maturity date of September 21, 2015. The note bears interest at the higher of either the Overnight Federal Funds rate, the Overnight LIBOR rate or the LIBOR Term Rate, plus 0.80%. At March 31, 2015, this was 1.07%. A commitment fee on the unused portion of the facility is charged to the Fund and is included with "interest expense" in the Statement of Operations.
At March 31, 2015, the Fund had a notes payable outstanding of $113,300,000. The weighted average outstanding daily balance of all loans during the six months ended March 31, 2015 was approximately $102,386,000, with a weighted average annual borrowing cost of 1.08%. The borrowings were valued at cost, which approximates fair value.
Leverage involves risks and special considerations for the Fund's stockholders, including the likelihood of greater volatility of net asset value and market price of, and dividends on, the Fund's shares than a comparable portfolio without leverage; the risk that fluctuations in interest rates on such borrowings will reduce the return to stockholders; and the effect of leverage in a declining market, which is likely to cause a greater decline in the net asset value of the Fund's shares than if the Fund were not leveraged, which may result in a greater decline in the market price of the Fund's shares.
Changes in the value of the Fund's portfolio will be borne by the stockholders. If there is a net decrease (or increase) in the value of the Fund's investment portfolio, leverage will decrease (or increase) the net asset value per share to a greater extent than if leverage were not used. It is also possible that the Fund will be required to sell assets at a time when it would otherwise not do so, possibly at a loss, in order to meet payment obligations on borrowings or to comply with asset coverage or other restrictions imposed by the lender. The Fund is subject to certain restrictions on its investments including asset coverage and portfolio composition requirements, under the terms of the credit facility. Such restrictions and covenants contained in the credit facility impose asset coverage and portfolio composition requirements that are more stringent than those imposed on the Fund by the 1940 Act.
During periods in which the Fund is using leverage, the fees received by the Advisor for investment management and advisory services will be higher than if the Fund did not use leverage because the fees paid will be calculated on the basis of the Fund's total managed assets, including proceeds from the use of leverage.
There is no assurance that the Fund's leveraging strategy will be successful.
G. Share Repurchases
The Board of Directors previously authorized the Fund to effect periodic repurchases for up to 5% of its shares in the open market from time to time when the Fund's shares trade at a discount to their net asset value. During its six months ended March 31, 2015 and the year ended September 30, 2014, the Fund purchased 256,887 and 819,054 of its shares of common stock on the open market at a total cost of $3,644,727 and $11,793,154 ($14.16 and $14.40 average per share), respectively. The average discount of these purchased shares comparing the purchase price to the net asset value at the time of purchase, was 11.32% and 12.09%, respectively.
On July 9, 2014, the Fund announced that the Fund’s Board of Directors extended the Fund’s existing open market share repurchase program for an additional twelve-month period. The Fund may continue to purchase an aggregate of up to 5% of the Fund’s outstanding shares of common stock in open-market transactions over the period from December 1, 2014 until November 30, 2015 when the Fund’s shares trade at a discount to net asset value. The Board’s authorization of the repurchase program extension follows the previous repurchase program, which commenced on December 1, 2013 and ran until November 30, 2014.
Dividend Reinvestment and Cash Purchase Plan
The Board of Directors of the Fund has established a Dividend Reinvestment and Cash Purchase Plan (the "Plan") for shareholders that elect to have all dividends and distributions automatically reinvested in shares of common stock of the Fund (each a "Participant"). DST Systems, Inc. (the "Plan Agent") has been appointed by the Fund’s Board of Directors to act as agent for each Participant.
A summary of the Plan is set forth below. Shareholders may obtain a copy of the entire Dividend Reinvestment and Cash Purchase Plan by visiting the Fund’s Web site at deutschefunds.com or by calling (800) 294-4366.
If you wish to participate in the Plan and your shares are held in your own name, contact DeAWM Service Company (the "Transfer Agent") at P.O. Box 219066, Kansas City, Missouri 64121-9066 or (800) 294-4366 for the appropriate form. Current shareholders may join the Plan by either enrolling their shares with the Transfer Agent or making an initial cash deposit of at least $250 with the Transfer Agent. First-time investors in the Fund may join the Plan by making an initial cash deposit of at least $250 with the Transfer Agent. Initial cash deposits will be invested within approximately 30 days. If your shares are held in the name of a broker or other nominee, you should contact the broker or nominee in whose name your shares are held to determine whether and how you may participate in the Plan.
Whenever the Fund declares an income dividend or a capital gain distribution payable in common shares or cash at the option of the shareholders, each Participant is deemed to have elected to take such dividend or distribution entirely in additional shares of common stock of the Fund. If the market price per share of the Fund’s common stock on the valuation date equals or exceeds the net asset value per share on the valuation date, the number of additional shares to be issued by the Fund and credited to the Participant’s account shall be determined by dividing the dollar amount of the dividend or capital gain distribution payable on the Participant’s shares by the greater of the following amounts per share of the Fund’s common stock on the valuation date: (a) the net asset value, or (b) 95% of the market price. If the market price per share of the Fund’s common stock on the valuation date is less than the net asset value per share on the valuation date, the Plan Agent shall apply the dollar amount of the dividend or capital gain distribution on such Participant’s shares (less such Participant’s pro rata share of brokerage commissions incurred with respect to the Plan Agent’s open-market purchases in connection with the reinvestment of such dividend and distribution) to the purchase on the open market of shares of the Fund’s common stock for the Participant’s account. The valuation date will be the payment date for the dividend or capital gains distribution or, if such date is not a New York Stock Exchange trading date, then the next preceding New York Stock Exchange trading date. Should the Fund declare an income dividend or capital gain distribution payable only in cash, the amount of such dividend or distribution on each Participant’s shares (less such Participant’s pro rata share of brokerage commissions incurred with respect to open-market purchases in connection with the reinvestment of such dividend or distribution) shall be applied to the purchase on the open market of shares of the Fund’s common stock for the Participant’s account. Open-market purchases will be made on or shortly after the payment date for such dividend or distribution, and in no event more than 30 days after such date except where temporary curtailment or suspension of purchase is necessary to comply with applicable provisions of federal securities law.
Each Participant may send additional funds in the amount of $100 in any month (with a $36,000 annual limit) for the purchase on the open market of shares of the Fund’s common stock for the Participant’s account. Such voluntary payments will be invested by the Plan Agent on or shortly after the 15th of each month and in no event more than 30 days after such dates, except where temporary curtailment or suspension of purchase is necessary to comply with applicable provisions of federal securities law. Optional cash payments received from a Participant on or prior to the fifth day preceding the 15th of each month will be applied by the Plan Agent to the purchase of additional shares of the Fund’s common stock as of that investment date. No interest will be paid on optional cash payments held until investment. Consequently, Participants are strongly urged to ensure that their payments are received by the Transfer Agent on or prior to the fifth day preceding the 15th of any month. Optional cash payments should be made in U.S. dollars and be sent by first-class mail, postage prepaid only to the following address (deliveries to any other address do not constitute valid delivery):
Deutsche High Income Opportunities Fund, Inc.
Dividend Reinvestment and Cash Purchase Plan
c/o DeAWM Service Company
P.O. Box 219066
Kansas City, MO 64121-9066
(800) 294-4366
Participants may withdraw their entire voluntary cash payment by written notice received by the Transfer Agent not less than 48 hours before such payment is to be invested.
Investment of voluntary cash payments and other open-market purchases may be made on any securities exchange where the Fund’s common stock is traded, in the OTC market or in negotiated transactions and may be on such terms as to price, delivery and otherwise as the Plan Agent shall determine.
The Transfer Agent will confirm to each Participant each acquisition made for such Participant’s account as soon as practicable but no later than 60 days after the date thereof. The Transfer Agent will send to each Participant a statement of account confirming the transaction and itemizing any previous reinvestment activity for the calendar year. A statement reflecting the amount of cash received by the Fund’s Transfer Agent will be issued on receipt of each cash deposit. The statements are the record of the costs of shares and should be retained for tax purposes.
The reinvestment of dividends and capital gain distributions does not relieve the Participant of any tax that may be payable on such dividends and distributions. The Fund’s Transfer Agent will report to each Participant the taxable amount of dividends and distributions credited to his or her account. Participants will be treated as receiving the amount of the distributions made by the Fund, which amount generally will be either equal to the amount of the cash distribution the Participant would have received if the Participant had elected to receive cash or, for shares issued by the Fund, the fair market value of the shares issued to the Participant.
The service fees for handling capital gain distributions or income dividends will be paid by the Fund.
Participants may terminate their accounts under the Plan by notifying the Transfer Agent in writing. Such termination will be effective immediately if such Participant’s notice is received by the Transfer Agent not less than ten days prior to any dividend or distribution record date; otherwise such termination will be effective as soon as practicable upon completion of the reinvestment of capital gain distributions or income dividends. If a Participant elects by notice to the Plan Agent in writing in advance of such termination to have the Plan Agent sell part or all of such Participant’s shares and remit the proceeds to such Participant, the Plan Agent is authorized to deduct brokerage commissions for this transaction and any transfer taxes. The Plan may be terminated by the Fund upon notice in writing mailed to Participants at least 30 days prior to any record date for the payment of any dividend or distribution by the Fund. The terms and conditions of the Plan may be amended or supplemented by the Fund at any time or times, but, except when necessary or appropriate to comply with applicable law or the rules or policies of the Securities and Exchange Commission, any securities exchange on which shares of the Fund are listed, or any other regulatory authority and with certain other limited exceptions, only by mailing to Participants appropriate written notice at least 30 days prior to the effective date thereof.
All correspondence and inquiries concerning the Plan, and requests for additional information about the Plan, should be directed to DeAWM Service Company at P.O. Box 219066, Kansas City, Missouri 64121-9066 or (800) 294-4366.
| |
| Automated Information Line | | Deutsche AWM Closed-End Fund Info Line (800) 349-4281 |
| Web Site | | deutschefunds.com Obtain fact sheets, financial reports, press releases and webcasts when available. |
| Written Correspondence | | Deutsche Asset & Wealth Management Attn: Secretary of the Deutsche Funds One Beacon Street Boston, MA 02108 |
| Legal Counsel | | Vedder Price P.C. 222 North LaSalle Street Chicago, IL 60601 |
| Dividend Reinvestment Plan Agent | | DST Systems, Inc. 333 W. 11th Street, 5th Floor Kansas City, MO 64105 |
| Transfer Agent | | DeAWM Service Company P.O. Box 219066 Kansas City, MO 64121-9066 (800) 294-4366 |
| Custodian | | State Street Bank and Trust Company State Street Financial Center One Lincoln Street Boston, MA 02111 |
| Independent Registered Public Accounting Firm | | Ernst & Young LLP 200 Clarendon Street Boston, MA 02116 |
| Proxy Voting | | The fund's policies and procedures for voting proxies for portfolio securities and information about how the fund voted proxies related to its portfolio securities during the 12-month period ended June 30 are available on our Web site — deutschefunds.com (click on "proxy voting"at the bottom of the page) — or on the SEC's Web site — sec.gov. To obtain a written copy of the fund's policies and procedures without charge, upon request, call us toll free at (800) 728-3337. |
| Portfolio Holdings | | Following the fund's fiscal first and third quarter-end, a complete portfolio holdings listing is filed with the SEC on Form N-Q. This form will be available on the SEC's Web site at sec.gov, and it also may be reviewed and copied at the SEC's Public Reference Room in Washington, D.C. Information on the operation of the SEC's Public Reference Room may be obtained by calling (800) SEC-0330. The fund's portfolio holdings as of the month-end are posted on deutschefunds.com on or after the last day of the following month. More frequent posting of portfolio holdings information may be made from time to time on deutschefunds.com. |
| Investment Management | | Deutsche Investment Management Americas Inc. ("DIMA" or the "Advisor"), which is part of Deutsche Asset & Wealth Management, is the investment advisor for the fund. DIMA and its predecessors have more than 80 years of experience managing mutual funds and DIMA provides a full range of investment advisory services to both institutional and retail clients. DIMA is an indirect, wholly owned subsidiary of Deutsche Bank AG. Deutsche Bank AG is a major global banking institution engaged in a wide variety of financial services, including investment management, retail, private and commercial banking, investment banking and insurance. Deutsche Asset & Wealth Management is the retail brand name in the U.S. for the wealth management and asset management activities of Deutsche Bank AG and DIMA. Deutsche Asset & Wealth Management is committed to delivering the investing expertise, insight and resources of this global investment platform to American investors. |
| NYSE Symbol | | DHG |
| CUSIP Number | | 25158Y 102 |
| FACTS | What Does Deutsche Asset & Wealth Management Do With Your Personal Information? |
| Why? | Financial companies choose how they share your personal information. Federal law gives consumers the right to limit some but not all sharing. Federal law also requires us to tell you how we collect, share and protect your personal information. Please read this notice carefully to understand what we do. |
| What? | The types of personal information we collect and share can include: — Social Security number — Account balances — Purchase and transaction history — Bank account information — Contact information such as mailing address, e-mail address and telephone number |
| How? | All financial companies need to share customers' personal information to run their everyday business. In the section below, we list the reasons financial companies can share their customers' personal information, the reasons Deutsche Asset & Wealth Management chooses to share and whether you can limit this sharing. |
| Reasons we can share your personal information | Does Deutsche Asset & Wealth Management share? | Can you limit this sharing? |
For our everyday business purposes — such as to process your transactions, maintain your account(s), respond to court orders or legal investigations | Yes | No |
For our marketing purposes — to offer our products and services to you | Yes | No |
| For joint marketing with other financial companies | No | We do not share |
For our affiliates' everyday business purposes — information about your transactions and experiences | No | We do not share |
For our affiliates' everyday business purposes — information about your creditworthiness | No | We do not share |
| For non-affiliates to market to you | No | We do not share |
| Questions? | Call (800) 728-3337 or e-mail us at service@db.com | |
| | | | |
| Who we are |
| Who is providing this notice? | DeAWM Distributors, Inc.; Deutsche Investment Management Americas Inc.; DeAWM Trust Company; the Deutsche Funds |
| What we do |
| How does Deutsche Asset & Wealth Management protect my personal information? | To protect your personal information from unauthorized access and use, we use security measures that comply with federal law. These measures include computer safeguards and secured files and buildings. |
| How does Deutsche Asset & Wealth Management collect my personal information? | We collect your personal information, for example. When you: — open an account — give us your contact information — provide bank account information for ACH or wire transactions — tell us where to send money — seek advice about your investments |
| Why can't I limit all sharing? | Federal law gives you the right to limit only — sharing for affiliates' everyday business purposes — information about your creditworthiness — affiliates from using your information to market to you — sharing for non-affiliates to market to you State laws and individual companies may give you additional rights to limit sharing. |
| Definitions |
| Affiliates | Companies related by common ownership or control. They can be financial or non-financial companies. Our affiliates include financial companies with the DWS or Deutsche Bank ("DB") name, such as DB AG Frankfurt and DB Alex Brown. |
| Non-affiliates | Companies not related by common ownership or control. They can be financial and non-financial companies. Non-affiliates we share with include account service providers, service quality monitoring services, mailing service providers and verification services to help in the fight against money laundering and fraud. |
| Joint marketing | A formal agreement between non-affiliated financial companies that together market financial products or services to you. Deutsche Asset & Wealth Management does not jointly market. |
| | | Rev. 08/2014 |
Notes
Pursuant to the requirements of the Securities Exchange Act of 1934 and the Investment Company Act of 1940, the registrant has duly caused this report to be signed on its behalf by the undersigned, thereunto duly authorized.
Pursuant to the requirements of the Securities Exchange Act of 1934 and the Investment Company Act of 1940, this report has been signed below by the following persons on behalf of the registrant and in the capacities and on the dates indicated.