UNITED STATES SECURITIES AND EXCHANGE COMMISSION
WASHINGTON, D.C. 20549
FORM N-CSR
CERTIFIED SHAREHOLDER REPORT OF
REGISTERED MANAGEMENT INVESTMENT COMPANIES
| Investment Company Act file number: | 811-21958 |
| Exact name of registrant as specified in charter: | DGHM Investment Trust |
| Address of principal executive offices: | 8730 Stony Point Parkway, Suite 205 Richmond, VA 23235 |
| Name and address of agent for service: | The Corporation Trust Company 1209 Orange Street Wilmington, DE 19801 |
| | with a copy to: John H. Lively The Law Offices of John H. Lively & Associates, Inc. A member firm of The 1940 Act Law Group 2041 West 141st Terrace, Suite 119 Leawood, KS 66224 |
| Registrant's telephone number, including area code: | 800-653-2839 |
| Date of fiscal year end: | Last day of February |
| Date of reporting period: | February 28, 2011 |
Item #1. Reports to Stockholders.
Investment Advisor:
Dalton, Greiner, Hartman, Maher & Co., LLC
565 Fifth Avenue, Suite 2101
New York, New York 10017-2413
Distributor:
First Dominion Capital Corp.
8730 Stony Point Parkway, Suite 205
Richmond, Virginia 23235
Independent Registered Public Accounting Firm:
BBD, LLP
1835 Market Street, 26th Floor
Philadelphia, Pennsylvania 19103
Legal Counsel:
The Law Offices of John H. Lively & Associates, Inc.
A member firm of The 1940 Act Law Group
2041 West 141st Terrace, Suite 119
Leakwood, Missouri 66224
Transfer Agent:
For account information, wire purchase or redemptions, call or write to DGHM All-Cap Value Fund’s Transfer Agent:
Commonwealth Fund Services, Inc.
8730 Stony Point Parkway, Suite 205
Richmond, Virginia 23235
(800) 653-2839 Toll Free
Annual Report to Shareholders
DGHM ALL-CAP VALUE FUND
For the Year Ended February 28, 2011
DGHM V2000 SMALLCAP VALUE FUND
For the period July 1, 2010
(commencement of operations)
to February 28, 2011
Each a series of the DGHM Investment Trust
A “Series” Investment Company
DGHM INVESTMENT TRUST
TABLE OF CONTENTS
| | PAGE |
| Shareholder Letter – DGHM All-Cap Value Fund | 2 |
| Shareholder Letter – DGHM V2000 SmallCap Value Fund | 4 |
| Performance Information – DGHM All-Cap Value Fund | 7 |
| Performance Information – DGHM V2000 SmallCap Value Fund | 10 |
| Schedule of Investments – DGHM All-Cap Value Fund | 12 |
| Schedule of Investments – DGHM V2000 SmallCap Value Fund | 16 |
| Statements of Assets and Liabilities | 21 |
| Statements of Operations | 22 |
| Statements of Changes In Net Assets | 23 |
| Financial Highlights – DGHM All-Cap Value Fund | 24 |
| Financial Highlights – DGHM V2000 SmallCap Value Fund | 27 |
| Notes to Financial Statements | 29 |
| Supplemental Information | 38 |
| About Your Funds’ Expenses | 45 |
This report and the financial statements contained herein are submitted for the general information of the shareholders of the DGHM All-Cap Value Fund and the DGHM V2000 SmallCap Value Fund (the ”Funds”). This report is not authorized for distribution to prospective investors in the Funds unless preceded or accompanied by an effective prospectus. Mutual fund shares are not deposits or obligations of, or guaranteed by, any depository institution. Shares are not insured by the FDIC, Federal Reserve Board or another agency, and are subject to investment risks, including possible loss of principal amount invested. Neither the Funds not the Funds’ distributor is a bank.
Distributor: First Dominion Capital Corp., 8730 Stony Point Parkway, Suite 205, Richmond, VA 23235, Phone 1-800-653-2839.
An investment in the Funds is subject to investment risks, including the possible loss of some or the entire principal amount invested. There can be no assurance that the funds will be successful in meeting its investment objectives. Investment in the Funds is subject to the following risks: market risk, small-cap, mid-cap and large-cap securities risk, management style risk, sector risk, issuer risk, ETF risks, and short-term investment risk. More information about these risks and other risks can be found in the Funds’ prospectuses.
The performance information quoted in this Annual Report represents past performance, which is not a guarantee of future results. Investment return and principal value of an investment will fluctuate so that an investor’s shares, when redeemed, may be worth more of less than their original cost. Current performance may be lower or higher than the performance data quoted. To obtain actual performance data regarding the Funds, including performance data current to the Funds’ most recent month-end, please call 1-800-653-2839.
An investor should consider the investment objectives, risks, and charges and expense of the Funds carefully before investing. The prospectuses contain this and other information about the Funds. Copies of the prospectuses are available by calling Shareholder Services at 1/800-653-2839. The prospectuses should be read carefully before investing.
Stated performance in the Funds was achieved at some or all points during the period by Dalton, Greiner, Hartman, Maher & Co., LLC, the investment advisor to the Funds. The advisor waived or reimbursed part of the DGHM V2000 SmallCap Value Fund’s total expenses. Had the investment advisor not waived or reimbursed expenses of this fund, this fund’s performance would have been worse.
This Annual Report was first distributed to shareholders on or about April 29, 2011.
For more information on your DGHM All-Cap Value Fund or your DGHM V2000 SmallCap Value Fund:
See our website at www.dghm.com or call our Shareholder Services Group toll-free at 1-800-653-2839.
Dear Shareholders of the DGHM All-Cap Value Fund:
For the fiscal year ended 2/28/11, we are pleased to report that the DGHM All-Cap Value Fund’s Investor Class shares returned 22.9%. The Fund’s Class C shares returned 22.0%. The Fund’s benchmark Index (Russell 3000 Value) returned 20.0% during this time period. The expense ratio for the fund continues to fall as assets increase, which in turn, has resulted in less drag on performance.
Sectors that had a positive impact on performance were Technology, Healthcare, and Banks. Technology was led by Teradata (+57%), which is a database warehouse software company. Healthcare was led by Pharmaceutical Product Development, (+41%), which is a service company that conducts clinical trials for drug companies. The Bank sector was led by SunTrust (+26%), which is a regional commercial bank based in Atlanta.
Sectors that had a negative impact on performance were Telecomm Services, Capital Goods, and Consumer Staples. In the case of Telecomm Services and Capital goods, our stocks posted positive returns; they simply did not keep up with the stocks in the benchmark. Consumer Staples was negatively impacted by Safeway (-11%) which is a grocery store chain. The company has experienced margin pressures from rising raw material costs. We continue to own the name as we believe that the company will be able to raise prices to offset their higher costs.
Given the events of the past several years in the economy and the stock market, I would like to remind all of our shareholders of the investment strategy that guides our stock picking:
| ■ | We invest with a multi-year investment horizon rather than focusing on the month or quarter end. |
| ■ | We do not attempt to make macroeconomic calls. (I.e. predict economic growth, interest rates, currency levels, commodity prices etc.) |
| ■ | We do not predict the direction of the stock market. |
| ■ | We use a bottom-up selection process to attempt to identify companies that appear to be selling at a discount to our assessment of their potential value. |
| ■ | We focus on the cash flows, historical profitability, projected future earnings, and financial condition of individual companies in identifying which stocks we may purchase. |
| ■ | We also consider the following factors in deciding which companies may appear attractive: |
| § | Quality of the business franchise |
| § | Economic or market conditions |
| § | Reputation, experience, and competence of the company’s management |
| ■ | We believe that stocks purchased at prices below their potential value not only protect capital, but also offer significant price appreciation once the market recognizes a particular stock’s potential value. |
| ■ | Generally, stocks are sold when the characteristics and factors used to select the security change or the stock has appreciated to the point where it is no longer attractive versus other potential opportunities. |
As I commented on in last year’s shareholder letter, the volatility in the market has presented us with numerous opportunities to purchase stocks that adhere to our investment strategy across multiple sectors.
We appreciate the opportunity to serve as your Fund’s Investment Adviser.
Yours truly,
Jeffrey C. Baker
Executive Vice President
Dalton, Greiner, Hartman, Maher & Co. LLC
The views in the foregoing discussion were those of the Fund’s investment advisor as of the date set forth above and may not reflect its views on the date this Annual Report is first published or anytime thereafter. These views are intended to assist shareholders in understanding their investment in the Fund and do not constitute investment advice.
The performance information quoted above represents past performance and past performance does not guarantee future results. Investment return and principal value of an investment will fluctuate so that an investor’s shares, when redeemed, may be worth more or less than their original cost. Current performance may be lower or higher than the performance data quoted. Performance data, current to the most recent month end, may be obtained by calling the Fund at (800) 653-2839. Fee waivers and expense reimbursements have positively impacted Fund performance. An investor should consider the Fund’s investment objectives, risks, and charges and expenses carefully before investing. The Fund’s Prospectus contains this and other important information. For information on the Fund’s expense ratio, please see the Financial Highlights Table found within the accompanying Annual Report.
Dear Shareholders of DGHM V2000 SmallCap Value Fund:
The DGHM V2000 SmallCap Value Fund Class I shares increased 32.2% and the Investor Class increased 31.1% for the period June 30, 2010 to February 28, 2011. This strong absolute return approximately matched the Russell 2000 Value index return of 31.5% for the same period.
The fund’s launch on June 30, 2010 coincided with rising concerns about a potential double-dip recession in the U.S. Following a volatile summer, the markets received some welcome news in the early fall when Federal Reserve Chairman Ben Bernanke signaled he would keep in place a very accommodative monetary policy known as quantitative easing. In addition, stock market participants cheered news of a more balanced Congress and a more favorable tax outlook. All these positive macro events as well as improving earnings gave market participants confidence to increase their appetite for risk assets and drive equity markets higher.
The fund’s performance was led by strong stock selection in our Financial, Transportation and Technology sectors. The poorest relative performing sectors were Retail, Basic Materials and Health Care. Drilling down further to the stock level we had several large gainers. AirTran Holdings gained 51% after the company received a takeover offer from Southwest Airlines. One of our consumer stocks, Netflix, gained 59% driven by continued strong earnings growth. Another winner was Berry Petroleum which doubled its share price due to rising commodity prices. A couple of stocks which detracted from performance were Radioshack and Nutrisystems. Electronic retailer Radioshack declined 19% due mainly to concerns about increasing competition and lower margins. Nutrisystems declined 37% as future business indicators weakened due to an aggressive marketing campaign by a competitor. While we think both of these stocks are attractively valued, the uncertain fundamentals in the near term will likely keep the shares range bound. Consequently, we no longer hold these stocks.
At DGHM a key part of our strategy is conducting intensive fundamental research to build an attractive portfolio of high quality small cap stocks, one stock at a time. We strive to construct a portfolio with the ideal trade-off between low valuation, high profitability and financial strength. As the following table demonstrates, the collective effort of our nine sector specialists produced a portfolio with most characteristics superior to the benchmark.
Portfolio Characteristics as of February 28, 2011
Valuation DGHM V2000 Russell 2000 Value
EV/EBITDA(1) 8.7x 10.0x
Free Cash Flow Yield 5.3% 4.3%
Last 12 Months P/E 21.3x 23.7x
Dividend Yield 1.4% 0.3%
Profitability
EBITDA ROA (excludes cash) 17.6% 12.1%
5YR Avg EBITDA ROA (excludes cash) 18.5% 13.0%
EBITDA Margins 14.7% 12.6%
Last 12 Months ROE 9.3% 6.8%
Balance Sheet
Net Debt / Total Capital 35.0% 34.4%
EBITDA / Interest Expense 9.1x 7.3x
(1) EV/EBITDA means Enterprise Value divided by Earnings Before Interest, Taxes, Depreciation and Amortization. Our definition of Enterprise Value is market capitalization plus debt plus other long-term liabilities minus cash.
Sincerely,
Peter Gulli, CFA
The views in the foregoing discussion were those of the Fund’s investment advisor as of the date set forth above and may not reflect its views on the date this Annual Report is first published or anytime thereafter. These views are intended to assist shareholders in understanding their investment in the Fund and do not constitute investment advice.
The performance information quoted above represents past performance and past performance does not guarantee future results. Investment return and principal value of an investment will fluctuate so that an investor’s shares, when redeemed, may be worth more or less than their original cost. Current performance may be lower or higher than the performance data quoted. Performance data, current to the most recent month end, may be obtained by calling the Fund at (800) 653-2839. Fee waivers and expense reimbursements have positively impacted Fund performance. An investor should consider the Fund’s investment objectives, risks, and charges and expenses carefully before investing. The Fund’s Prospectus contains this and other important information. For information on the Fund’s expense ratio, please see the Financial Highlights Table found within the accompanying Annual Report.

| | | | | | | | |
| | | | | | | | | | |
| | | | | | | | | | |
| | | | | | | | | | |
| | | | | | | | | | |
| | | | | | | | | | |
| | | | | | | | | | |
| | | | | | | | | | |
| | | | | | | | | | |
| | | | | | | | | | |
| | | | | | | | | | |
| | | | | | | | | | |
| | | | | | | | | | |
| | | | | | | | | | |
| | | | | Investor Shares | |
| | | | | Total Return One Year Ended 2/28/2011 | | | Average Annual Return Since Inception 06/20/07 to 02/28/11 | | |
| | | | | | | | |
| | DGHM All-Cap Value Fund: | | 22.89% | | | 4.23% | | |
| | Russell 3000 Index: | | 20.00% | | | -6.01% | | |
| | |
| | | | | | | | | | |
| | Returns do not reflect the deduction of taxes that a shareholder would pay on Fund distributions or redemption of shares. The total cumulative returns are historical in nature and measure net investment income and capital gain or loss from portfolio investments assuming reinvestments of dividends. |
| | | | | | | | | | |
| | The Russell 3000 Value Index is generally considered to be representative of the performance of unmanaged common stocks that comprise the broad value segment of the U.S. securities markets. You cannot invest directly in this index. This index does not have an investment advisor and does not pay any commissions, expenses, or taxes. If this index did pay commissions, expenses, or taxes, its returns would be lower. The index is not adjusted to reflect expenses that the SEC requires to be reflected in the Fund's performance. |
| | | | | | | | | | |
| | The above returns for the Investor Shares of the Fund assumes an initial investment of $10,000 at June 20, 2007 (Commencement of Operations). All dividends and distributions are reinvested, if any. It is important to note that the Fund is a professionally managed mutual fund while the index is not available for investment and is unmanaged. The comparison is shown for illustrative purposes only. The Fund's investment advisor has entered into a contractual arrangement with the Fund to waive its fees in an amount that limits Total Annual Fund Operating Expenses of the Fund to not more than 1.50%, excluding 12b-1 fees, for the period ending June 30, 2011. There can be no assurance that this arrangement will continue in the future. For more information, please see the Fund's prospectus. |
| | | | | | | | | | |
| | Performance quoted above represents past performance, which is no guarantee of future results. Investment return and principal value will fluctuate so that shares, when redeemed, may be worth more or less than their original cost. Current performance may be lower or higher than the performance data quoted. |

| | | | | | | | | |
| | | | | | | | | | |
| | | | | | | | | | |
| | | | | | | | | | |
| | | | | | | | | | |
| | | | | | | | | | |
| | | | | | | | | | |
| | | | | | | | | | |
| | | | | | | | | | |
| | | | | | | | | | |
| | | | | | | | | | |
| | | | | | | | | | |
| | | | | | | | | | |
| | | | | | | | | | |
| | | | | Class C Shares | |
| | | | | Total Return One Year Ended 2/28/2011 | | | Average Annual Return Since Inception 06/20/07 to 02/28/11 | |
| | | | | | | |
| | | | | | | | | | |
| | DGHM All-Cap Value Fund: | | 22.02% | | | 3.51% | | |
| | Russell 3000 Index: | | 20.00% | | | -6.01% | | |
| | |
| | Returns do not reflect the deduction of taxes that a shareholder would pay on Fund distributions or redemption of shares. The total cumulative returns are historical in nature and measure net investment income and capital gain or loss from portfolio investments assuming reinvestments of dividends. |
| | | | | | | | | | |
| | The Russell 3000 Value Index is generally considered to be representative of the performance of unmanaged common stocks that comprise the broad value segment of the U.S. securities markets. You cannot invest directly in this index. This index does not have an investment advisor and does not pay any commissions, expenses, or taxes. If this index did pay commissions, expenses, or taxes, its returns would be lower. The index is not adjusted to reflect expenses that the SEC requires to be reflected in the Fund's performance. |
| | | | | | | | | | |
| | The above returns for the Class C Shares of the Fund assumes an initial investment of $10,000 at June 20, 2007 (Commencement of Operations). All dividends and distributions are reinvested, if any. It is important to note that the Fund is a professionally managed mutual fund while the index is not available for investment and is unmanaged. The comparison is shown for illustrative purposes only. The Fund's investment advisor has entered into a contractual arrangement with the Fund to waive its fees in an amount that limits Total Annual Fund Operating Expenses of the Fund to not more than 1.5%, excluding 12b-1 fees, for the period ending June 30, 2011. There can be no assurance that this arrangement will continue in the future. For more information, please see the Fund's prospectus. |
| | | | | | | | | | |
| | Performance quoted above represents past performance, which is no guarantee of future results. Investment return and principal value will fluctuate so that shares, when redeemed, may be worth more or less than their original cost. Current performance may be lower or higher than the performance data quoted. |
| | | | | | | | |
| | | | | | | | | |
| | | | | | | | | |
| | | | | | | | | |
| | | | | | | | | |
| | | | | | | | | |
| | | | | | | | | |
| | | | | | | | | |
| | | | | | | | | |
| | | | | | | | | |
| | | | | | | | | |
| | | | | | | | | |
| | | | | | | | | |
| | | | | | | | | |
| | | | | | | | | |
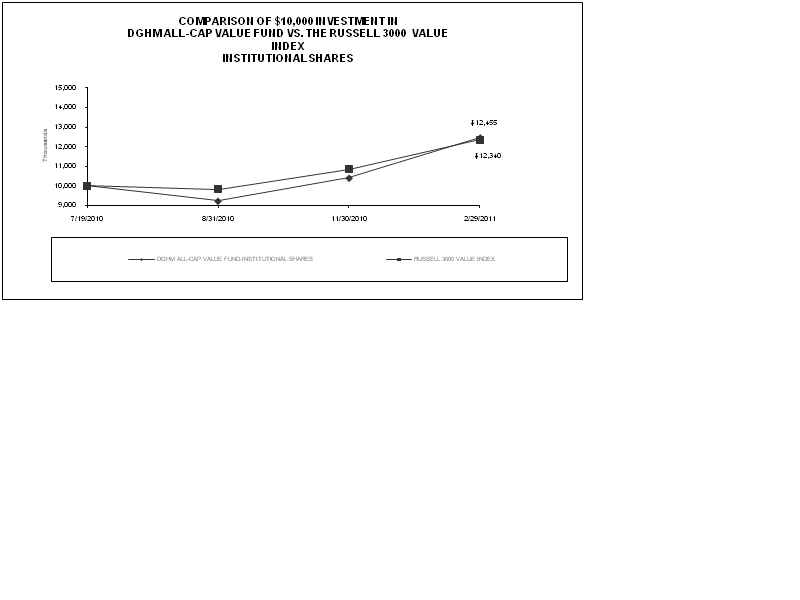
| | | | | | | Institutional Shares | | |
| | | | | | | Return Since Inception 07/19/10 to 02/28/11 | | |
| | | | | | | | |
| DGHM All-Cap Value Fund: | | | | | 24.55% | | |
| Russell 3000 Value Index: | | | | | 23.40% | | |
| |
| Returns do not reflect the deduction of taxes that a shareholder would pay on Fund distributions or redemption of shares. The total cumulative returns are historical in nature and measure net investment income and capital gain or loss from portfolio investments assuming reinvestments of dividends. |
| | | | | | | | | |
| The Russell 3000 Value Index is generally considered to be representative of the performance of unmanaged common stocks that comprise the broad value segment of the U.S. securities markets. You cannot invest directly in this index. This index does not have an investment advisor and does not pay any commissions, expenses, or taxes. If this index did pay commissions, expenses, or taxes, its returns would be lower. The index is not adjusted to reflect expenses that the SEC requires to be reflected in the Fund's performance. |
| | | | | | | | | |
| The above returns for the Institutional Shares of the Fund assumes an initial investment of $10,000 at July 19, 2010 (Commencement of Operations). All dividends and distributions are reinvested, if any. It is important to note that the Fund is a professionally managed mutual fund while the index is not available for investment and is unmanaged. The comparison is shown for illustrative purposes only. The Fund's investment advisor has entered into a contractual arrangement with the Fund to waive its fees in an amount that limits Total Annual Fund Operating Expenses of the Fund to not more than 1.50%, excluding 12b-1 fees, for the period ending June 30, 2011. There can be no assurance that this arrangement will continue in the future. For more information, please see the Fund's prospectus. |
| | | | | | | | | |
| Performance quoted above represents past performance, which is no guarantee of future results. Investment return and principal value will fluctuate so that shares, when redeemed, may be worth more or less than their original cost. Current performance may be lower or higher than the performance data quoted. |
| | | | | | | | | |
| | | | | | | | | | |
| | | | | | | | | | |
| | | | | | | | | | |
| | | | | | | | | | |
| | | | | | | | | | |
| | | | | | | | | | |
| | | | | | | | | | |
| | | | | | | | | | |
| | | | | | | | | | |
| | | | | | | | | | |
| | | | | | | | | | |
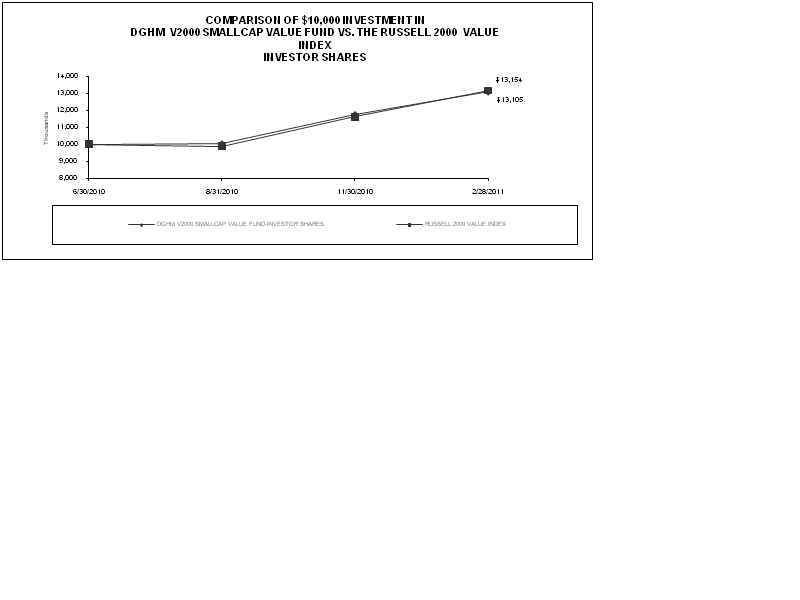
| | | | | | | | Investor Shares | | |
| | | | | | | | Return Since Inception 06/30/10 to 02/28/11 | | |
| | | | | | | | | |
| | DGHM SmallCap Value Fund: | | | | | 31.05% | | |
| | Russell 2000 Value Index: | | | | | 31.54% | | |
| | |
| | Returns do not reflect the deduction of taxes that a shareholder would pay on Fund distributions or redemption of shares. The total cumulative returns are historical in nature and measure net investment income and capital gain or loss from portfolio investments assuming reinvestments of dividends. |
| | | | | | | | | | |
| | The Russell 2000 Value Index measures the performance of small-cap value segment of the U.S. equity universe. It includes those Russell 2000 companies with lower price-to-book ratios and lower forecasted growth values. The Russell 2000 Value Index is constructed to provide a comprehensive and unbiased barometer for the small-cap value segment. The Index is completely reconstituted annually to ensure larger stocks do not distort the performance and characteristics of the true small-cap opportunity set and that the represented companies continue to reflect value characteristics. |
| | | | | | | | | | |
| | The above returns for the Investor Shares of the Fund assumes an initial investment of $10,000 at June 30, 2010 (Commencement of Operations). All dividends and distributions are reinvested, if any. It is important to note that the Fund is a professionally managed mutual fund while the index is not available for investment and is unmanaged. The comparison is shown for illustrative purposes only. The Fund's investment advisor has entered into a contractual arrangement with the Fund to waive its fees in an amount that limits Total Annual Fund Operating Expenses of the Fund to not more than 1.65%, excluding 12b-1 fees, for the period ending June 30, 2011. There can be no assurance that this arrangement will continue in the future. For more information, please see the Fund's prospectus. |
| | | | | | | | | | |
| | Performance quoted above represents past performance, which is no guarantee of future results. Investment return and principal value will fluctuate so that shares, when redeemed, may be worth more or less than their original cost. Current performance may be lower or higher than the performance data quoted. |

| | | | | | | | |
| | | | | | | | | |
| | | | | | | | | |
| | | | | | | | | |
| | | | | | | | | |
| | | | | | | | | |
| | | | | | | | | |
| | | | | | | | | |
| | | | | | | | | |
| | | | | | | | | |
| | | | | | | | | |
| | | | | | | | | |
| | | | | | | | | |
| | | | | | | | | |
| | | | | | | Institutional Shares | | |
| | | | | | | Return Since Inception 06/30/10 to 02/28/11 | | |
| | | | | | | | |
| DGHM V2000 SmallCap Value Fund: | | | | | 32.24% | | |
| Russell 2000 Value Index: | | | | | 31.54% | | |
| |
| Returns do not reflect the deduction of taxes that a shareholder would pay on Fund distributions or redemption of shares. The total cumulative returns are historical in nature and measure net investment income and capital gain or loss from portfolio investments assuming reinvestments of dividends. |
| | | | | | | | | |
| The Russell 2000 Value Index measures the performance of small-cap value segment of the U.S. equity universe. It includes those Russell 2000 companies with lower price-to-book ratios and lower forecasted growth values. The Russell 2000 Value Index is constructed to provide a comprehensive and unbiased barometer for the small-cap value segment. The Index is completely reconstituted annually to ensure larger stocks do not distort the performance and characteristics of the true small-cap opportunity set and that the represented companies continue to reflect value characteristics. |
| | | | | | | | | |
| The above returns for the Institutional Shares of the Fund assumes an initial investment of $10,000 at June 30, 2010 (Commencement of Operations). All dividends and distributions are reinvested, if any. It is important to note that the Fund is a professionally managed mutual fund while the index is not available for investment and is unmanaged. The comparison is shown for illustrative purposes only. The Fund's investment advisor has entered into a contractual arrangement with the Fund to waive its fees in an amount that limits Total Annual Fund Operating Expenses of the Fund to not more than 1.65%, excluding 12b-1 fees, for the period ending June 30, 2011. There can be no assurance that this arrangement will continue in the future. For more information, please see the Fund's prospectus. |
| | | | | | | | | |
| Performance quoted above represents past performance, which is no guarantee of future results. Investment return and principal value will fluctuate so that shares, when redeemed, may be worth more or less than their original cost. Current performance may be lower or higher than the performance data quoted. |
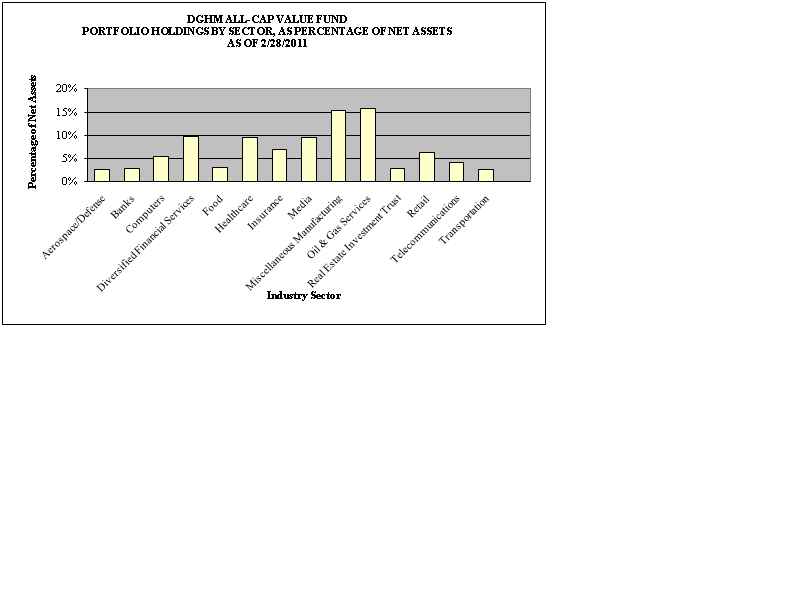
SCHEDULE OF INVESTMENTS February 28, 2011 |
Number of Shares | | Security Description | | % of Net Assets | | Fair Value |
| | | | | | | |
| | | COMMON STOCKS | | 96.49% | | |
| | | | | | | |
| | | AEROSPACE/DEFENSE | | 2.64% | | |
| 32,366 | | General Dynamics Corporation | | | | $ 2,463,700 |
| | | | | | | |
| | | BANKS | | 3.26% | | |
| 100,777 | | SunTrust Banks, Inc. | | | | 3,040,442 |
| | | | | | | |
| | | COMPUTERS | | 5.24% | | |
| 14,929 | | International Business Machines Corporation | | 2,416,707 |
| 51,757 | | Teradata Corporation* | | | | 2,475,019 |
| | | | | | | 4,891,726 |
| | | DIVERSIFIED FINANCIAL SERVICES | 10.20% | | |
| 179,770 | | Fifth Third Bancorp | | | | 2,624,642 |
| 25,293 | | Franklin Resources, Inc. | | | | 3,177,307 |
| 79,624 | | JPMorgan Chase & Co. | | | | 3,717,644 |
| | | | | | | 9,519,593 |
| | | FOOD | | 2.61% | | |
| 48,565 | | H.J. Heinz Company | | | | 2,438,934 |
| | | | | | | |
| | | HEALTHCARE | | 9.25% | | |
| 54,356 | | Express Scripts, Inc.* | | | | 3,055,894 |
| 88,870 | | Pharmaceutical Product Development, Inc. | | 2,441,259 |
| 49,505 | | Stryker Corp. | | | | 3,131,686 |
| | | | | | | 8,628,839 |
| | | INSURANCE | | 6.83% | | |
| 45,992 | | ACE Limited | | | | 2,908,994 |
| 121,990 | | Protective Life Corp. | | | | 3,468,176 |
| | | | | | | 6,377,170 |
DGHM ALL-CAP VALUE FUND SCHEDULE OF INVESTMENTS February 28, 2011 |
Number of Shares | | Security Description | | % of Net Assets | | Fair Value |
| | | | | | | |
| | | MEDIA | | 9.20% | | |
| 63,354 | | The DIRECTV Group, Inc. Class A* | | | | $ 2,912,383 |
| 50,131 | | Omnicom Group, Inc. | | | | 2,551,668 |
| 69,886 | | Viacom, Inc."B" | | | | 3,121,109 |
| | | | | | | 8,585,160 |
| | | MISCELLANEOUS MANUFACTURING | 13.96% | | |
| 30,167 | | 3M Company | | | | 2,782,302 |
| 33,577 | | Becton, Dickinson and Co. | | | | 2,686,160 |
| 35,572 | | Clearwater Paper Corp.* | | | | 2,820,860 |
| 69,344 | | Mueller Industries, Inc. | | | | 2,356,309 |
| 65,210 | | Silgan Holdings, Inc. | | | | 2,378,861 |
| | | | | | | 13,024,492 |
| | | OIL & GAS SERVICES | | 15.66% | | |
| 53,870 | | Canadian Natural Resources Ltd. | | | | 2,709,661 |
| 29,690 | | Devon Energy Corp. | | | | 2,714,854 |
| 100,640 | | Piedmont Natural Gas Co. Inc. | | | | 2,948,752 |
| 32,917 | | Pioneer Natural Resources Co. | | | | 3,368,726 |
| 109,200 | | Vectren Corp. | | | | 2,874,144 |
| . | | | | | | 14,616,137 |
| | | REAL ESTATE INVESTMENT TRUST | 3.48% | | |
| 40,421 | | Alexandria Real Estate Equities, Inc. | | | | 3,241,764 |
| | | | | | | |
| | | RETAIL | | 5.21% | | |
| 109,540 | | The Gap, Inc. | | | | 2,467,936 |
| 109,800 | | Safeway Inc. | | | | 2,395,836 |
| | | | | | | 4,863,772 |
| | | TELECOMMUNICATIONS | | 3.58% | | |
| 117,710 | | AT&T Inc. | | | | 3,340,610 |
| | | | | | | |
DGHM ALL-CAP VALUE FUND SCHEDULE OF INVESTMENTS February 28, 2011 |
Number of Shares | | Security Description | | % of Net Assets | | Fair Value |
| | | | | | | |
| | | TRANSPORTATION | | 5.37% | | |
| 45,652 | | Tidewater Inc. | | | | $ 2,840,011 |
| 29,430 | | United Parcel Service, Inc. "B" | | | | 2,171,934 |
| | | | | | | 5,011,945 |
| | | | | | | |
| | | TOTAL COMMON STOCKS | | 96.49% | | 90,044,284 |
| | | (Cost: $74,720,289) | | | | |
| | | | | | | |
| | | INVESTMENT COMPANIES | | 3.73% | | |
| 3,481,344 | | WFA Treasury Plus Money Market Fund 0.1%** | | 3,481,344 |
| | | (cost: $3,481,344) | | | | |
| | | | | | | |
| | | TOTAL INVESTMENTS: | | | | |
| | | (Cost: $78,201,633) | | 100.22% | | 93,525,628 |
| | | Other assets, net of liabilities | | -0.22% | | (203,210) |
| | | NET ASSETS | | 100.00% | | $ 93,322,418 |
| | | | | | | |
| | | | | | | |
| *Non-income producing (security is considered non-income producing if at least one dividend has not been paid during the last year preceding the date of the Fund's related balance sheet). |
| **Effective 7 day yield as of February 28, 2011 | | | | |
| | | | | | | |
| See Notes to Financial Statements | | | | |
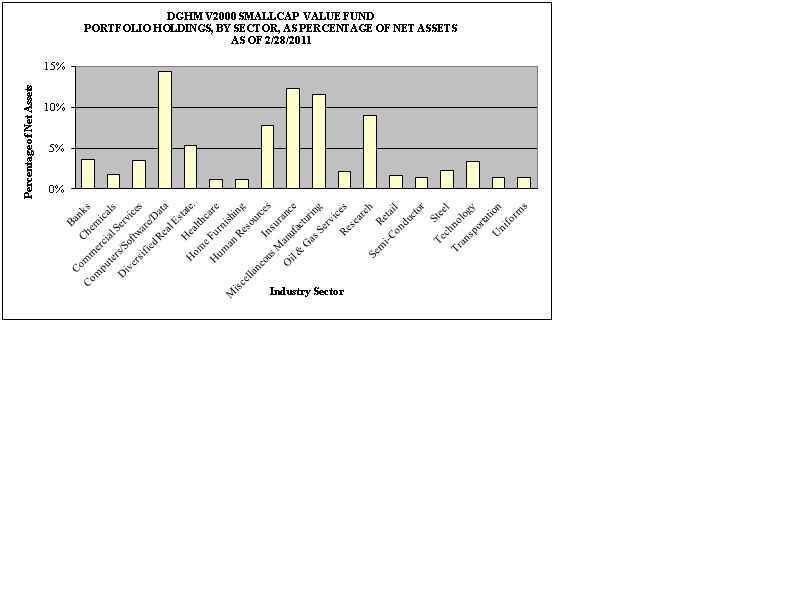
DGHM V2000 SMALLCAP VALUE FUND SCHEDULE OF INVESTMENTS February 28, 2011 |
Number of Shares | | Security Description | | % of Net Assets | | Fair Value |
| | | COMMON STOCKS | | 96.32% | | |
| | | | | | | |
| | | BANKS | | 11.55% | | |
| 2,020 | | Brookline Bancorp, Inc. | | | | $ 20,988 |
| 594 | | Community Trust Bancorp, Inc. | | | | 16,994 |
| 2,160 | | First Commonwealth Financial Corp. | | | | 14,148 |
| 2,107 | | Old National Bancorp | | | | 23,599 |
| 1,553 | | Provident Financial Services | | | | 23,000 |
| 943 | | United Financial Bancorp, Inc. | | | | 14,720 |
| 696 | | Webster Financial Corp. | | | | 16,133 |
| 756 | | WesBanco, Inc. | | | | 15,755 |
| | | | | | | 145,337 |
| | | CHEMICALS | | 3.64% | | |
| 373 | | Ashland Inc. | | | | 21,000 |
| 1,785 | | PolyOne Corp.* | | | | 24,775 |
| | | | | | | 45,775 |
| | | COMMERCIAL SERVICES | | 1.72% | | |
| 459 | | Steiner Leisure Ltd.* | | | | 21,646 |
| | | | | | | |
| | | COMPUTERS/SOFTWARE/DATA | | 3.51% | | |
| 1,242 | | Acxiom Corp.* | | | | 21,288 |
| 2,249 | | Lawson Software, Inc.* | | | | 22,805 |
| | | | | | | 44,093 |
| | | DIVERSIFIED REAL ESTATE INVESTMENTS | | 14.30% | | |
| 756 | | American Assets Trust Inc.* | | | | 16,299 |
| 981 | | BioMed Realty Trust, Inc. | | | | 17,805 |
| 1,214 | | CBL & Associates Properties, Inc. | | | | 21,670 |
| 1,039 | | Colonial Properties Trust | | | | 20,479 |
| 2,274 | | Cousins Properties, Inc. | | | | 19,284 |
| 2,265 | | DCT Industrial Trust Inc. | | | | 12,729 |
| 650 | | Gaylord Entertainment Co.* | | | | 23,419 |
| 2,430 | | Hersha Hospitality Trust | | | | 15,965 |
DGHM V2000 SMALLCAP VALUE FUND SCHEDULE OF INVESTMENTS February 28, 2011 |
Number of Shares | | Security Description | | % of Net Assets | | Fair Value |
| 572 | | Mack-Cali Realty Corp. | | | | $ 19,414 |
| 331 | | Post Properties, Inc. | | | | 12,909 |
| | | | | | | 179,973 |
| | | HEALTHCARE | | 5.34% | | |
| 207 | | Bio-Rad Laboratories, Inc.* | | | | 23,631 |
| 441 | | Catalyst Health Solutions, Inc.* | | | | 19,938 |
| 472 | | Integra LifeSciences Holding* | | | | 23,671 |
| | | | | | | 67,240 |
| | | HOME FURNISHING | | 1.21% | | |
| 325 | | Tempur-Pedic International Inc.* | | | | 15,255 |
| | | | | | | |
| | | HUMAN RESOURCES | | 1.21% | | |
| 478 | | Robert Half International, Inc. | | | | 15,248 |
| | | | | | | |
| | | INSURANCE | | 7.76% | | |
| 806 | | Aspen Insurance Holdings Ltd. | | | | 23,817 |
| 1,480 | | First American Financial Corp. | | | | 23,325 |
| 860 | | Horace Mann Educators Corp. | | | | 14,577 |
| 350 | | Platinum Underwriters Holdings, Ltd. | | | | 14,595 |
| 750 | | Protective Life Corp. | | | | 21,323 |
| | | | | | | 97,637 |
| | | MISCELLANEOUS MANUFACTURING | | 12.32% | | |
| 632 | | Bemis Company, Inc. | | | | 20,761 |
| 546 | | Brady Corp. Class A | | | | 19,514 |
| 248 | | Clearwater Paper Corp.* | | | | 19,666 |
| 2,390 | | GT Solar International Inc.* | | | | 25,549 |
| 732 | | Herman Miller, Inc. | | | | 19,720 |
| 556 | | Mueller Industries, Inc. | | | | 18,893 |
| 141 | | NACCO Industries, Inc. Class A | | | | 17,562 |
| 177 | | Polaris Industries Inc. | | | | 13,355 |
| | | | | | | 155,020 |
DGHM V2000 SMALLCAP VALUE FUND SCHEDULE OF INVESTMENTS February 28, 2011 |
Number of Shares | | Security Description | | % of Net Assets | | Fair Value |
| | | | | | | |
| | | OIL & GAS SERVICES | | 11.52% | | |
| 583 | | Atmos Energy Corp. | | | | $ 19,717 |
| 484 | | Berry Petroleum Co. Class A | | | | 25,163 |
| 470 | | Bill Barrett Corp.* | | | | 18,274 |
| 332 | | Nicor Inc. | | | | 17,510 |
| 530 | | Petroleum Development Corp.* | | | | 24,873 |
| 570 | | Piedmont Natural Gas Co., Inc. | | | | 16,701 |
| 530 | | Swift Energy Co.* | | | | 22,763 |
| . | | | | | | 145,001 |
| | | RESEARCH | | 2.07% | | |
| 1,111 | | Parexel International Corp.* | | | | 26,075 |
| | | | | | | |
| | | RETAIL | | 8.93% | | |
| 176 | | Carter's, Inc.* | | | | 5,044 |
| 1,220 | | Chico's FAS, Inc. | | | | 16,763 |
| 611 | | Genesco Inc.* | | | | 24,147 |
| 830 | | Nutrisystem, Inc. | | | | 10,981 |
| 584 | | Papa John's International, Inc.* | | | | 17,041 |
| 340 | | Snap-on Inc. | | | | 19,526 |
| 475 | | Weis Markets, Inc. | | | | 18,843 |
| | | | | | | 112,345 |
| | | SEMICONDUCTOR | | 1.593% | | |
| 3,020 | | Lattice Semiconductor Corp.* | | | | 20,053 |
| | | | | | | |
| | | STEEL | | 1.34% | | |
| 305 | | Reliance Steel & Aluminum Co. | | | | 16,876 |
| | | | | | | |
| | | TECHNOLOGY | | 2.23% | | |
| 392 | | Anixter International Inc. | | | | 28,075 |
| | | | | | | |
DGHM V2000 SMALLCAP VALUE FUND SCHEDULE OF INVESTMENTS February 28, 2011 |
Number of Shares | | Security Description | | % of Net Assets | | Fair Value |
| | | | | | | |
| | | TRANSPORTATION | | 3.30% | | |
| 1,130 | | Heartland Express, Inc. | | | | $ 18,747 |
| 966 | | Werner Enterprises, Inc. | | | | 22,749 |
| | | | | | | 41,496 |
| | | UNIFORMS | | 1.36% | | |
| 303 | | UniFirst Corp. | | | | 17,089 |
| | | | | | | |
| | | UTILITIES | | 1.42% | | |
| 424 | | Pinnacle West Capital Corp. | | | | 17,906 |
| | | | | | | |
| | | TOTAL COMMON STOCKS | | 96.32% | | 1,212,140 |
| | | (Cost: $1,053,549) | | | | |
| | | | | | | |
| | | INVESTMENT COMPANIES | | 1.55% | | |
| 19,545 | | WFA Treasury Plus Money Market Fund 0.1%** | | | | 19,545 |
| | | (Cost: $19,545) | | | | |
| | | | | | | |
| | | Total Investments | | | | |
| | | (Cost $1,073,094) | | 97.87% | | 1,231,685 |
| | | Other assets, net of liabilities | | 2.13% | | 26,853 |
| | | NET ASSETS | | 100.00% | | $ 1,258,538 |
| | | | | | | |
| *Non-Income producing (security is considered non-income producing if at least one dividend has not been paid during the last year preceding the date of the Fund's related balance sheet). |
| | | | | | | |
| **Effective 7 day yield as of February 28, 2011 | | | | |
| | | | | | | |
| See Notes to Financial Statements | | | | |
| | | | |
| STATEMENTS OF ASSETS AND LIABILITIES | | | |
| At February 28, 2011 | | | | |
| | | | | DGHM All-Cap Value Fund | | DGHM V2000 SmallCap Value Fund |
| ASSETS | | | | |
| | Investments at fair value (identified cost of $78,201,633 | | |
| | | and $1,073,094, respectively) (Note 1) | | $ 93,525,628 | | $ 1,231,685 |
| | Receivable for investments sold | | - | | 9,859 |
| | Receivable for capital stock sold | | 674,406 | | - |
| | Dividends receivable | | 94,462 | | 1,293 |
| | Interest receivable | | 27 | | - |
| | Due from advisor | | - | | 13,564 |
| | Prepaid expenses | | 20,744 | | 6,010 |
| | | TOTAL ASSETS | | 94,315,267 | | 1,262,411 |
| LIABILITIES | | | | |
| | Payable for securities purchased | | 903,562 | | 165 |
| | Payable for capital stock redeemed | | 5,276 | | - |
| | Accrued investment management fees | | 44,750 | | - |
| | Accrued 12b-1 fees | | 16,057 | | 131 |
| | Accrued administration, accounting and transfer agent fees | | 6,404 | | 2,050 |
| | Other accrued expenses | | 16,800 | | 1,527 |
| | | TOTAL LIABILITIES | | 992,849 | | 3,873 |
| | | | | |
| NET ASSETS | | $ 93,322,418 | | $ 1,258,538 |
| Net Assets Consist of: | | | | |
| | Paid-in-capital applicable to 8,053,072 and 96,893 no par value shares of beneficial interest outstanding, respectively | | $ 79,157,024 | | $ 1,087,177 |
| | Accumulated net realized gain (loss) on investments | | (1,158,601) | | 12,770 |
| | Net unrealized appreciation (depreciation) of investments | | 15,323,995 | | 158,591 |
| | Net Assets | | $ 93,322,418 | | $ 1,258,538 |
| |
| NET ASSET VALUE, OFFERING AND REDEMPTION PRICE PER SHARE |
Investor Class ($71,124,014 / 6,129,969 shares | | | | |
| | outstanding and $260,363 / 20,153 shares | | | | |
| | outstanding, respectively) | | $ 11.60 | | $ 12.92 |
Class C (a) ($4,712,731 / 414,899 shares outstanding) | | $ 11.36 | | N/A |
| | | | | | | |
Institutional Class ($17,485,673 / 1,508,204 shares | | | |
| | outstanding and $998,175 / 76,740 shares | | | | |
| | outstanding, respectively) | | $ 11.59 | | $ 13.01 |
| | | | | | | |
(a) May be subject to a contingent deferred sales charge if redeemed within one year of purchase (see Note 1) |
| See Notes to Financial Statements | | | | |
| | | |
| STATEMENT OF OPERATIONS | | | |
| | | | DGHM All-Cap Value Fund | | DGHM V2000 SmallCap Value Fund |
| | | | For the year ended February 28, 2011 | | For the period June 30, 2010* to February 28, 2011 |
| INVESTMENT INCOME | | | |
| | Dividend (net of foreign tax withheld of $4,945 and $ - , respectively) | $ 915,577 | | $ 10,767 |
| | Interest | 268 | | 3 |
| | Miscellaneous | 878 | | - |
| | | Total investment income | 916,723 | | 10,770 |
| EXPENSES | | | |
| | Investment management fees (Note 2) | 391,683 | | 4,362 |
| | 12b-1 fees (Note 2) | | | |
| | | Investor Class | 134,451 | | 286 |
| | | Class C | 32,756 | | �� - |
| | Recordkeeping and administrative services (Note 2) | 60,163 | | 13,314 |
| | Accounting fees (Note 2) | 30,129 | | 13,314 |
| | Custodian fees | 10,389 | | 4,261 |
| | Transfer agent fees (Note 2) | - | | 10,113 |
| | | Investor Class | 35,540 | | - |
| | | Class C | 2,340 | | - |
| | | Institutional Class | 965 | | - |
| | Professional fees | 51,472 | | 6,650 |
| | Filing and registration fees | 42,769 | | 1,730 |
| | Trustee fees | 8,474 | | 2,026 |
| | Compliance fees | 19,169 | | 4,414 |
| | Shareholder servicing and reports | - | | 1,978 |
| | | Investor Class | 17,632 | | 26 |
| | | Class C | 1,439 | | - |
| | | Institutional Class | 59 | | 6,038 |
| | Other | 61,695 | | 16,567 |
| | | Total expenses | 901,125 | | 85,079 |
| | | Fee waivers and reimbursed expenses (Note 2) | - | | (75,763) |
| | | Net Expenses | 901,125 | | 9,316 |
| | | Net investment income (loss) | 15,598 | | 1,454 |
| REALIZED AND UNREALIZED GAIN (LOSS) ON INVESTMENTS | | |
| | Net realized gain (loss) on investments | 4,392,997 | | 29,173 |
| | Net increase (decrease) in unrealized appreciation (depreciation) of investments | 9,236,856 | | 158,591 |
| | Net realized and unrealized gain (loss) on investments | 13,629,853 | | 187,764 |
| | INCREASE (DECREASE) IN NET ASSETS FROM OPERATIONS | $ 13,645,451 | | $ 189,218 |
| | | | | | |
| * Commencement of operations | | | |
| See Notes to Financial Statements | | | |
| | | | | | |
| STATEMENTS OF CHANGES IN NET ASSETS | | | | |
| | | | | DGHM All-Cap Value Fund | | DGHM V2000 SmallCap Value Fund |
| | | | | For the Year ended February 28, 2011 | | For the Year ended February 28, 2010 | | For the period June 30, 2010* to February 28, 2011 |
| | | | | | |
| | | | | | |
| Increase (decrease) in Net Assets | | | | | | |
| OPERATIONS | | | | | | |
| | Net investment income (loss) | | $ 15,598 | | $ 61,491 | | $ 1,454 |
| | Net realized gain (loss) on investments | | 4,392,997 | | (174,073) | | 29,173 |
| | Change in net unrealized appreciation | | | | | | |
| | | (depreciation) on investments | | 9,236,856 | | 16,269,388 | | 158,591 |
| | Increase (decrease) in net assets from operations | | 13,645,451 | | 16,156,806 | | 189,218 |
| DISTRIBUTIONS TO SHAREHOLDERS | | | | | | |
| | Net investment income | | | | | | |
| | | Investor Class | | (6,897) | | (102,437) | | - |
| | | Institutional Class | | (17,360) | | - | | (2,118) |
| Net realized gain | | | | | | |
| | | Investor Class | | - | | - | | (2,978) |
| | | Institutional Class | | - | | - | | (13,425) |
| | Decrease in net assets from distributions | | (24,257) | | (102,437) | | (18,521) |
| CAPITAL STOCK TRANSACTIONS (Note 5) | | | | | |
| | Shares sold | | | | | | |
| | | Investor Class | | 28,507,623 | | 16,005,421 | | 232,768 |
| | | Class C | | 2,171,909 | | 312,433 | | - |
| | | Institutional Class | | 16,440,096 | | - | | 853,949 |
| | Distributions reinvested | | | | | | |
| | | Investor Class | | 5,805 | | 84,843 | | 2,978 |
| | | Institutional Class | | 8,893 | | - | | 12,280 |
| | Shares redeemed | | | | | | |
| | | Investor Class | | (12,887,434) | | (19,955,304) | | (14,134) |
| | | Class C | | (466,156) | | (197,195) | | - |
| | | Institutional Class | | (53,325) | | - | | - |
| | Increase (decrease) in net assets from capital | | | | | |
| | | stock transactions | | 33,727,411 | | (3,749,802) | | 1,087,841 |
| NET ASSETS | | | | | | |
| | Increase (decrease) during period | | 47,348,605 | | 12,304,567 | | 1,258,538 |
| | Beginning of period | | 45,973,813 | | 33,669,246 | | - |
| | End of period (including undistributed | | | | | | |
| | | net investment income (loss) of $- , $4,316, | | | | | |
| | | and $ - , respectively) | | $ 93,322,418 | | $ 45,973,813 | | $ 1,258,538 |
| | | | | | | | | |
| * Commencement of operations. | | | | | | |
| See Notes to Financial Statements | | | | | | |
| | |
| FINANCIAL HIGHLIGHTS | | |
| SELECTED PER SHARE DATA FOR A SHARE OUTSTANDING THROUGHOUT EACH PERIOD | | |
| | | | Investor Class Shares | | |
| | | | Year ended February 28, | | Period June 20, 2007* | | | |
| | | | | | | | | | | | to | | | |
| | | | | 2011 | | 2010 | | 2009 | | | February 29, 2008 | | | |
| Net asset value, beginning of period | | $ 9.44 | | $ 6.26 | | $ 9.26 | | | $ 10.00 | | | |
| Investment activities | | | | | | | | | | | | |
| | Net investment income (loss) | | - | (B) (C) | 0.01 | | 0.02 | | | 0.01 | | | |
| | Net realized and unrealized gain | | | | | | | | | | | | |
| | | (loss) on investments | | 2.16 | | 3.19 | | (3.01) | | | (0.75) | | | |
| | Total from investment activities | | 2.16 | | 3.20 | | (2.99) | | | (0.74) | | | |
| Distributions | | | | | | | | | | | | |
| | Net investment income | | - | (B) | (0.02) | | (0.01) | | | - | | | |
| | Total distributions | | - | | (0.02) | | (0.01) | | | - | | | |
| Net asset value, end of period | | $ 11.60 | | $ 9.44 | | $ 6.26 | | | $ 9.26 | | | |
| Total Return | | 22.89% | | 51.17% | | (32.26%) | | | (7.40%) | *** | | |
| Ratios/Supplemental Data | | | | | | | | | | | | |
| Ratio to average net assets | | | | | | | | | | | | |
| | Expenses, net | | 1.47% | | 1.71% | | 1.75% | (A) | | 1.75% | **(A) | | |
| | Net investment income (loss) | | 0.04% | | 0.19% | | 0.71% | (A) | | 0.20% | **(A) | | |
| Portfolio turnover rate | | 53.05% | | 101.89% | | 90.97% | | | 80.71% | *** | | |
| Net assets, end of period (000's) | | $ 71,124 | | $ 43,669 | | $ 32,223 | | | $ 2,066 | | | |
| | | | | | | | | | | | | | | |
*Commencement of operations | | | | | | | | | | | | |
** Annualized | | | | | | | | | | | | |
*** Not annualized | | | | | | | | | | | | |
(A) Management fee waivers and reimbursement of expenses reduced the expense ratio and increased net investment income ratio by 0.72% for the year ended February 28, 2009 and by 6.77% for the period June 20, 2007 to February 29, 2008. The ratios reflect the effect of the management fee waivers and reimbursement of expenses. | | |
(B) Less than $0.01 per share. | | | | | | | | | | |
| (C) | Per share amounts calculated using the average number of shares outstanding. | | | | |
| See Notes to Financial Statements | | | | | | | | | | |
|
| FINANCIAL HIGHLIGHTS |
| SELECTED PER SHARE DATA FOR A SHARE OUTSTANDING THROUGHOUT EACH PERIOD |
| | | | Class C Shares |
| | | | Year ended February 28 | | Period June 20, 2007* to February 29, 2008 | |
| | | | | | | | | | | | |
| | | | | 2011 | | 2010 | | 2009 | | | |
| Net asset value, beginning of period | | $ 9.31 | | $ 6.20 | | $ 9.22 | | | $ 10.00 | |
| Investment activities | | | | | | | | | | |
| | Net investment income (loss) | | (0.07) | (C) | (0.04) | | - | (B) | | (0.03) | |
| | Net realized and unrealized gain | | | | | | | | | | |
| | | (loss) on investments | | 2.12 | | 3.15 | | (3.02) | | | (0.75) | |
| | Total from investment activities | | 2.05 | | 3.11 | | (3.02) | | | (0.78) | |
| Distributions | | | | | | | | | | |
| | Net investment income | | - | | - | | - | | | - | |
| | Total distributions | | - | | - | | - | | | - | |
| Net asset value, end of period | | $ 11.36 | | $ 9.31 | | $ 6.20 | | | $ 9.22 | |
| Total Return | | 22.02% | | 50.16% | | (32.75%) | | | (7.80%) | *** |
| Ratios/Supplemental Data | | | | | | | | | | |
| Ratio to average net assets | | | | | | | | | | |
| | Expenses, net | | 2.23% | | 2.46% | | 2.50% | (A) | | 2.50% | **(A) |
| | Net investment income (loss) | | (0.69%) | | (0.56%) | | (0.04%) | (A) | | (0.55%) | **(A) |
| Portfolio turnover rate | | 53.05% | | 101.89% | | 90.97% | | | 80.71% | *** |
| Net assets, end of period (000's) | | $ 4,713 | | $ 2,304 | | $ 1,446 | | | $ 2,038 | |
*Commencement of operations | | | | | | | | | | |
** Annualized | | | | | | | | | | |
*** Not annualized | | | | | | | | | | |
(A) Management fee waivers and reimbursement of expenses reduced the expense ratio and increased net investment income ratio by 0.72 % for the year ended February 28, 2009 and by 6.77% for the period June 20, 2007 to February 29, 2008. The ratios reflect the effect of the management fee waivers and reimbursement of expenses. |
(B) Less than $0.01 per share. | | | | | | | | | | |
| (C) | Per share amounts calculated using the average number of shares outstanding. | | | | |
| See Notes to Financial Statements | | | | | | | | | | |
| DGHM ALL-CAP VALUE FUND | | | | | | | | | | | | | | | |
| FINANCIAL HIGHLIGHTS | | | | | | | | | | | | | | | |
| SELECTED PER SHARE DATA FOR A SHARE OUTSTANDING THROUGHOUT EACH PERIOD | | |
| | | | Institutional Class Shares | | | | | | | | | | | | | |
| | | | | | | | | | | | | | | | | |
| | | | Period July 19, 2010* | | | | | | | | | | | | | |
| | | | | | | | | | | | | | | | |
| Net asset value, beginning of period | | $ 9.33 | | | | | | | | | | | | | | |
| Investment activities | | | | | | | | | | | | | | | | |
| | Net investment income (loss) | | 0.03 | (A) | | | | | | | | | | | | | |
| | Net realized and unrealized gain | | | | | | | | | | | | | | | | |
| | | (loss) on investments | | 2.26 | | | | | | | | | | | | | | |
| | Total from investment activities | | 2.29 | | | | | | | | | | | | | | |
| Distributions | | | | | | | | | | | | | | | | |
| | Net investment income | | (0.03) | | | | | | | | | | | | | | |
| | Total distributions | | (0.03) | | | | | | | | | | | | | | |
| Net asset value, end of period | | $ 11.59 | | | | | | | | | | | | | | |
| Total Return | | 24.55% | *** | | | | | | | | | | | | | |
| Ratios/Supplemental Data | | | | | | | | | | | | | | | | |
| Ratio to average net assets | | | | | | | | | | | | | | | | |
| | Expenses, net | | 1.11% | ** | | | | | | | | | | | | | |
| | Net investment income (loss) | | 0.46% | ** | | | | | | | | | | | | | |
| Portfolio turnover rate | | 53.05% | *** | | | | | | | | | | | | | |
| Net assets, end of period (000's) | | $ 17,486 | | | | | | | | | | | | | | |
| | | | | | | | | | | | | | | | | |
*Commencement of operations | | | | | | | | | | | | | | | | |
** Annualized | | | | | | | | | | | | | | | | |
*** Not annualized | | | | | | | | | | | | | | | | |
| (A) | Per share amounts calculated using the average number of shares outstanding. | | |
| | | | | | | | | | | | | | | | | | | |
| See Notes to Financial Statements | | | | | | | | | | | | | | | | |
| DGHM V2000 SMALLCAP VALUE FUND | | | | | | | | | | | | | | | | | | | | | | | | | | |
| FINANCIAL HIGHLIGHTS | | | | | | | | | | | | | | | | | | | | | | | | | | |
| SELECTED PER SHARE DATA FOR A SHARE OUTSTANDING THROUGHOUT THE PERIOD | | |
| | | | | | | | | | | | | | | | | | | |
| | | | | Investor Class Shares | | | | | | | | | | | | | | |
| | | | | Period June 30, 2010* to February 28, 2011 | | | | | | | | | | | | | | |
| | | | | | | | | | | | | | | | | | |
| Net asset value, beginning of period | | $ 10.00 | | | | | | | | | | | | | | |
| Investment activities | | | | | | | | | | | | | | | | |
| | Net investment income (loss) | | - | (A)(B) | | | | | | | | | | | | | |
| | Net realized and unrealized gain | | | | | | | | | | | | | | | | |
| | | (loss) on investments | | 3.10 | | | | | | | | | | | | | | |
| | Total from investment activities | | 3.10 | | | | | | | | | | | | | | |
| Distributions | | | | | | | | | | | | | | | | |
| | Net investment income | | - | | | | | | | | | | | | | | |
| | Realized gains | | (0.18) | | | | | | | | | | | | | | |
| | Total distributions | | (0.18) | | | | | | | | | | | | | | |
| Net asset value, end of period | | $ 12.92 | | | | | | | | | | | | | | |
| Total Return | | 31.05% | *** | | | | | | | | | | | | | |
| Ratios/Supplemental Data | | | | | | | | | | | | | | | | |
| Ratio to average net assets | | | | | | | | | | | | | | | | |
| | Expenses, gross | | 15.71% | ** | | | | | | | | | | | | | |
| | Expenses, net | | 1.90% | ** | | | | | | | | | | | | | |
| | Net investment income (loss) | | 0.07% | ** | | | | | | | | | | | | | |
| Portfolio turnover rate | | 33.60% | *** | | | | | | | | | | | | | |
| Net assets, end of period (000's) | | $ 260 | | | | | | | | | | | | | | |
| | | | | | | | | | | | | | | | | | | |
*Commencement of operations | | | | | | | | | | | | | | | | |
** Annualized | | | | | | | | | | | | | | | | |
*** Not annualized | | | | | | | | | | | | | | | | |
(A) Less than $0.01 per share. | | | | | | | | | | | | | | | | |
| (B) | Per share amounts calculated using the average number of shares outstanding. | | | |
| | | | | | | | | | | | | | | | | | | | |
| See Notes to Financial Statements | | | | | | | | | | | | | | | | | |
| DGHM V2000 SMALLCAP VALUE FUND | | | | | | | | | | | | |
| FINANCIAL HIGHLIGHTS | | | | | | | | | | | | |
| SELECTED PER SHARE DATA FOR A SHARE OUTSTANDING THROUGHOUT THE PERIOD |
| | | | | | | | | | | | | | | | | | | |
| | | | | Institutional Class Shares | | | | | | | | | | | | | | |
| | | | | | | | | | | | | | | | | | | |
| | | | | Period June 30, 2010* to February 28, 2011 | | | | | | | | | | | | | | |
| | | | | | | | | | | | | | | | | | |
| | | | | | | | | | | | | | | | | |
| Net asset value, beginning of period | | $ 10.00 | | | | | | | | | | | | | | |
| Investment activities | | | | | | | | | | | | | | | | |
| | Net investment income (loss) | | 0.02 | (A) | | | | | | | | | | | | | |
| | Net realized and unrealized gain | | | | | | | | | | | | | | | | |
| | | (loss) on investments | | 3.20 | | | | | | | | | | | | | | |
| | Total from investment activities | | 3.22 | | | | | | | | | | | | | | |
| Distributions | | | | | | | | | | | | | | | | |
| | Net investment income | | (0.03) | | | | | | | | | | | | | | |
| | Realized gains | | (0.18) | | | | | | | | | | | | | | |
| | Total distributions | | (0.21) | | | | | | | | | | | | | | |
| Net asset value, end of period | | $ 13.01 | | | | | | | | | | | | | | |
| Total Return | | 32.24% | *** | | | | | | | | | | | | | |
| Ratios/Supplemental Data | | | | | | | | | | | | | | | | |
| Ratio to average net assets | | | | | | | | | | | | | | | | |
| | Expenses, gross | | 15.46% | ** | | | | | | | | | | | | | |
| | Expenses, net | | 1.65% | ** | | | | | | | | | | | | | |
| | Net investment income (loss) | | 0.32% | ** | | | | | | | | | | | | | |
| Portfolio turnover rate | | 33.60% | *** | | | | | | | | | | | | | |
| Net assets, end of period (000's) | | $ 998 | | | | | | | | | | | | | | |
| | | | | | | | | | | | | | | | | | | |
*Commencement of operations | | | | | | | | | | | | | | | | |
** Annualized | | | | | | | | | | | | | | | | |
*** Not annualized | | | | | | | | | | | | | | | | |
| (A) | Per share amounts calculated using the average number of shares outstanding. | |
| | | | | | | | | | | | | | | | | | | |
| See Notes to Financial Statements | | | | | | | | | | | | | | | | |
DGHM INVESTMENT TRUST
NOTES TO FINANCIAL STATEMENTS
February 28, 2011
NOTE 1-ORGANIZATION AND SIGNIFICANT ACCOUNTING POLICIES
The DGHM All-Cap Value Fund and the DGHM V2000 SmallCap Value Fund (the "Funds") are series of the DGHM Investment Trust (the "Trust"). The Trust was organized as a Delaware statutory trust and is registered under the Investment Company Act of 1940, as amended (the “1940 Act”), as a diversified open-end management company. The DGHM All-Cap Value (“All-Cap Fund”) and DGHM V2000 SmallCap Value (“SmallCap Fund”) Funds commenced operations on June 20, 2007 and June 30, 2010, respectively.
The investment objectives of the Funds are to provide long-term capital appreciation through investments that Dalton, Greiner, Hartman, Maher & Co., LLC, the Funds’ investment advisor (“Advisor”), believes are undervalued.
The following is a summary of significant accounting policies consistently followed by the Funds. The policies are in conformity with accounting principles generally accepted in the United States of America (“GAAP”).
Security Valuation
The Funds’ securities are valued at current market prices. Investments traded on a principal exchange (U.S. or foreign) or included in the NASDAQ National Market System are valued at the last reported sales price on the exchange on which the securities are traded as of the close of business on the last day of the period or, lacking any sales, at the last available bid price. In cases where securities are traded on more than one exchange, the securities are valued on the exchange designated by or under the authority of the Funds’ Board of Trustees (the “Trustees”). Short-term debt securities (less than 60 days to maturity) are valued at their fair market value using amortized cost. Securities traded in the over-the-counter market are valued at the last available sale price in the over-the-counter market prior to time of valuation. Securities traded in the over-the-counter market and listed securities for which no sale was reported on that date are valued at the most recent bid price. Securities for which market quotations are not readily available are valued on a consistent basis at fair value as determined in good faith under procedures approved by the Funds’ Trustees. Fair value pricing may be used, for example, in situations where (i) a portfolio security is so thinly traded that there have been no transactions for that security over an extended period of time; (ii) the exchange on which the portfolio security is principally traded closes early; or (iii) trading of the portfolio security is halted during the day and does not resume prior to the Fund’s net asset value calculation. A portfolio security’s “fair value” price may differ from the price next available for that portfolio security using the Funds’ normal pricing procedures. Investment companies are valued at net asset value. If values of foreign securities have been materially affected by events occurring after the close of a foreign market, foreign securities may be valued by another method that the Trustees believe reflects fair value. Generally, trading in corporate bonds, U.S. government securities and money market instruments is substantially completed each day at various times before the scheduled close of the New York Stock Exchange. The value of these securities used in computing the Funds’ net asset value is determined as of such times.
DGHM INVESTMENT TRUST
NOTES TO FINANCIAL STATEMENTS
In accordance with GAAP, “fair value” is defined as the price that a fund would receive upon selling an investment in an orderly transaction to an independent buyer in the principal or most advantageous
market for the investment. Various inputs are used in determining the value of a fund’s investments. GAAP established a three-tier hierarchy of inputs to establish a classification of fair value measurements for disclosure purposes. Level 1 includes quoted prices in active markets for identical securities. Level 2 includes other significant observable market-based inputs (including quoted prices for similar securities, interest rates, prepayment speeds, credit risk, etc.). Level 3 includes significant unobservable inputs (including the Fund’s own assumptions in determining fair value of investments).
The inputs or methodology used for valuing securities are not necessarily an indication of the risk associated with investing in those securities.
The following is a summary of the inputs used to value the Funds’ investments as of February 28, 2011:
| | Level 1 Quoted Prices | Level 2 Other Significant Observable Inputs | Level 3 Significant Unobservable Inputs | Total |
| All-Cap Fund | | | | |
| Common Stocks | $90,044,284 | $- | $- | $90,044,284 |
| Investment Companies | 3,481,344 | - | - | 3,481,344 |
| | $93,525,628 | $- | $- | $93,525,628 |
| SmallCap Fund | | | | |
| Common Stocks | $1,212,140 | $- | $- | $1,212,140 |
| Investment Companies | 19,545 | - | - | 19,545 |
| | $1,231,685 | $- | $- | $ 1,231,685 |
Refer to the Funds’ Schedules of Investments for a listing of securities by security type and industry. The Funds held no Level 3 securities at any time during the period. There were no transfers into or out of Levels 1 and 2 during the period ended February 28, 2011.
Security Transactions and Income
Security transactions are accounted for on the trade date. The cost of securities sold is determined generally on a specific identification basis. Dividends are recorded on the ex-dividend date. Interest income is recorded on an accrual basis and includes amortization of discounts and premiums.
DGHM INVESTMENT TRUST
NOTES TO FINANCIAL STATEMENTS
Cash and Cash Equivalents
Cash and cash equivalents, if any, consist of overnight deposits with the custodian bank which earn interest at the current market rate.
Accounting Estimates
In preparing financial statements in conformity with GAAP, management makes estimates and assumptions that affect the reported amounts of assets and liabilities and disclosure of contingent assets and liabilities at the date of the financial statements, and the reported amounts of increases and decreases in the net assets during the reporting period. Actual results could differ from those estimates.
Federal Income Taxes
The Funds intend to comply with the requirements of the Internal Revenue Code applicable to regulated investment companies and to distribute all of its taxable income to its shareholders. The Funds also intend to distribute sufficient net investment income and net capital gains, if any, so that they will not be subject to excise tax on undistributed income and gains. Therefore, no federal income tax or excise provision is required.
The Funds recognize tax benefits on certain tax positions only where the position is “more likely than not” to be sustained assuming investigation from tax authorities. Management has reviewed the Funds’ tax positions and has concluded that no liability for unrecognized tax benefits should be recorded related to uncertain tax positions expected to be taken in the Funds’ 2011 tax returns. The Funds have no examinations in progress and management is not aware of any tax positions for which it is reasonably possible that the total amounts of unrecognized tax benefits will significantly change in the next twelve months. The All-Cap Fund’s Federal tax returns filed in the three-year period ended February 28, 2011 remain subject to examination by the Internal Revenue Service. Interest and penalties, if any, associated with any federal or state income tax obligations, are recorded as income tax expense.
Reclassification of Capital Accounts
GAAP requires that certain components of net assets relating to permanent differences be reclassified between financial and tax reporting. These reclassifications have no effect on net assets or net asset value per share. As of February 28, 2011, All-Cap Fund decreased paid-in-capital and decreased accumulated net investment loss by $4,343 and SmallCap Fund decreased paid-in-capital and decreased net investment loss by $664.
DGHM INVESTMENT TRUST
NOTES TO FINANCIAL STATEMENTS
Class Net Asset Values and Expenses
Each Fund can offer three classes of shares: Investor Shares, Class C and Institutional Class shares. Each class of shares has equal rights as to assets of the Funds, and the classes are identical except for differences in their sales charge structures, ongoing distribution and service fees, shareholder servicing and reports fees and transfer agent fees. Income, expenses (other than distribution and service fees, shareholder servicing and reports fees and transfer agent fees), and realized and unrealized gains or losses on investments are allocated to each class of shares based upon its relative net assets. All classes have equal voting privileges, except where otherwise required by law or when the Board of Trustees determines that the matter to be voted on affects only the interests of the shareholders of a particular class. The Class C shares are subject to a 1% contingent deferred sales charge on proceeds that are redeemed within one year of the purchase date. The contingent deferred sales charge is payable to the Distributor of the Trust. Class C shares automatically convert into Investor Shares after seven years. Effective February 25, 2010, Class A Shares of the All-Cap Fund were re-designated as Investor Shares. As of February 28, 2011, there were no Class C shares of SmallCap Fund outstanding.
NOTE 2-INVESTMENT ADVISORY AND DISTRIBUTION AGREEMENTS AND OTHER TRANSACTIONS WITH AFFILIATES
Pursuant to Investment Advisory Agreements, the Advisor provides investment advisory services for an annual fee of 0.65% on the average daily net assets of the All-Cap Fund and 0.80% on the average daily net assets of the SmallCap Fund. For the year ended February 28, 2011, the Advisor earned $391,683 in advisory fees from the All-Cap Fund. As of February 28, 2011, the Advisor was due $44,750 from the All-Cap Fund. For the period June 30, 2010 (commencement of the SmallCap Fund’s operations) to February 28, 2011, the Advisor earned and waived $4,362 in advisory fees from the SmallCap Fund.
In the interest of limiting the operating expenses of the Funds, the Advisor has contractually agreed to waive or reduce its fees and to assume other expenses of the Funds through June 30, 2011, if necessary, in amounts that limit the Funds’ total operating expenses to 1.50% and 1.65% of average daily net assets of the All-Cap Fund and the SmallCap Fund, respectively. The limit does not apply to interest, taxes, brokerage commissions, other expenditures capitalized in accordance with GAAP, other extraordinary expenses not incurred in the ordinary course of the Fund’s business, dividend expense on short sales and amounts, if any, payable pursuant to a plan adopted in accordance with Rule 12b-1 of the 1940 Act. In determining each Fund’s total operating expenses, expenses that the Fund would have incurred but did not actually pay because of expense offset or brokerage/services arrangements shall be added to the aggregate expenses so as not to benefit the Advisor. Additionally, fees reimbursed to the Funds relating to brokerage/services arrangements shall not be taken into account in determining the Funds’ total operating expenses so as to benefit the Advisor. Finally, these expense limitation arrangements exclude any “acquired fund fees and expenses” as that term is described in the prospectus of the Funds. In addition, the Advisor may be entitled to reimbursement of fees waived or remitted by the Advisor to the Funds after March 1, 2009. The total amount of reimbursement shall be the sum of all fees previously waived or reduced by the Advisor and all other payments remitted by the Advisor to the Funds during any of the previous three fiscal years (beginning March 1, 2009), less any reimbursement previously paid by the Funds to the Advisor with respect to such
DGHM INVESTMENT TRUST
NOTES TO FINANCIAL STATEMENTS
waivers, reductions and payments. Amounts reimbursed may not cause the Funds to exceed expense limits that were in place at the time such fees and expenses were waived and/or reimbursed. As of February 28, 2011, there were no fee waivers or reimbursements eligible for reimbursement to the Advisor pertaining to the All-Cap Fund. For the period June 30, 2010 (commencement of operations of the Fund) to February 28, 2011, the Advisor earned and waived $4,362 in advisory fees and reimbursed expenses of $71,401 for the SmallCap Fund. At February 28, 2011, the Fund was due $13,564 from the Advisor. The total amount of recoverable reimbursements as of February 28, 2011 was $75,763 and will expire February 28, 2014.
The Funds have adopted plans of distribution in accordance with Rule 12b-1 under the 1940 Act (each a “Plan” and collectively, the “Plans”). Pursuant to the Plans, the Funds compensate the Funds’ principal underwriter for services rendered and expenses borne in connection with activities primarily intended to result in the sale of the Funds’ shares. The Plans provide that the Funds will pay the annual rate of up to 0.25% of the average daily net assets of the Funds’ Investor Shares and up to 1.00% of the average daily net assets of the Funds’ Class C Shares for activities primarily intended to result in the sale of those shares. These activities include reimbursement to entities for providing distribution and shareholder servicing with respect to the Funds’ shares. The 0.25% fee for the Investor Shares is a service fee. The 1.00% fee for the Class C Shares is comprised of a 0.25% service fee and a 0.75% distribution fee. The All-Cap Fund incurred $134,451 and $32,756, in 12b-1 fees under the Plans with respect to Investor Shares and Class C Shares, respectively, for the year ended February 28, 2011. The SmallCap Fund incurred $286 in 12b-1 fees under the Plans with respect to Investor Shares for the period June 30, 2010 (commencement of operations of the Fund) to February 28, 2011.
First Dominion Capital Corporation (the “FDCC”) acts as the Funds’ principal underwriter and distributor. For the year ended February 28, 2011, FDCC received no commissions or underwriting fees from the sale of the Funds’ shares. In addition, FDCC receives a contingent deferred sales charge (“CDSC”) of 1% of Class C share redemptions occurring within one year of purchase. Shares redeemed subject to a CDSC will receive a lower redemption value per share. For the year ended February 28, 2011, FDCC received no CDSC fees.
Commonwealth Shareholder Services, Inc. (“CSS”) provides shareholder, recordkeeping, administrative and blue-sky filing services as the administrative agent for the Funds. For such administrative services, CSS receives 0.10% per annum of average daily net assets of the Funds on the first $75 million and 0.07% per annum of the average daily net assets over $75 million. For the year ended February 28, 2011, CSS earned $60,163 for its services and at February 28, 2011, was due $2,821 from the All-Cap Fund. For the period June 30, 2010 (commencement of operations of the Fund) to February 28, 2011, CSS earned $13,314 for its services and at February 28, 2011, was due $766 from the SmallCap Fund.
Commonwealth Fund Services, Inc. (“CFSI”) is the Funds’ transfer and dividend disbursing agent. For such services, CFSI receives the greater of a basis point charge or a per-account charge, subject to a $10,000 minimum per year. CFSI earned $38,845 for its services for the year ended February 28, 2011 and at February 28, 2011, was due $1,930 from the All-Cap Fund. CFSI earned $10,113 for its services for the period June 30,
DGHM INVESTMENT TRUST
NOTES TO FINANCIAL STATEMENTS
2020 (commencement of operations of the Fund) to February 28, 2011 and at February 28, 2011, was due $623 from the SmallCap Fund.
Commonwealth Fund Accounting (“CFA”) is the Funds’ pricing agent. CFA earned $30,129 for its services for the year ended February 28, 2011 and at February 28, 2011, was due $1,653 from the All-Cap Fund. CFA earned $13,314 for its services for the period June 30, 2010 (commencement of operations of the Fund) to February 28, 2011 and at February 28, 2011, was due $661 from the SmallCap Fund.
One Trustee and officers of the Trust are also officers of the Advisor. One officer of the Fund is also an officer and/or director of FDCC, CSS, CFA and CFSI.
NOTE 3 - INVESTMENTS
The cost of purchases and proceeds from the sales of securities other than short-term notes for the year ended February 28, 2011, were $62,245,419 and $31,285,683, respectively for the All-Cap Fund. The cost of purchases and proceeds from the sales of securities other than short-term notes for the period June 30, 2010 (commencement of operations of the Fund) to February 28, 2011, were $1,305,948 and $281,097, respectively for the SmallCap Fund.
NOTE 4 – DISTRIBUTIONS TO SHAREHOLDERS AND TAX COMPONENTS OF CAPITAL
Distributions from net investment income and realized gains, if any, are recorded on the ex-dividend date. Income distributions and capital gain distributions are determined in accordance with income tax regulations, which may differ from GAAP.
The tax character of distributions during the period ended February 28, 2011 and the year ended February 28, 2010 were as follows:
| | All-Cap Fund | | SmallCap Fund |
| | Year Ended | Year Ended | | June 30, 2010* to |
| | February 28, 2011 | February 28, 2010 | | February 28, 2011 |
| Distributions paid from: | | | | |
| Ordinary income | $24,257 | $ 102,437 | | $ 18,521 |
| | | | | |
| | | | | |
* commencement of operations
DGHM INVESTMENT TRUST
NOTES TO FINANCIAL STATEMENTS
As of February 28, 2011, the components of distributable earnings on a tax basis were as follows:
| | All-Cap Fund | | SmallCap Fund |
Accumulated net realized gain (loss) on investments | $ (824,277) | | $ 12,770 |
Unrealized appreciation (depreciation) | 14,989,671 | | 158,591 |
| | $ 14,165,394 | | $ 171,361 |
| | | | |
As of February 28, 2011, the All-Cap Fund has a capital loss carryforward of $824,277 available to offset future gains, if any. To the extent that these carryforwards are used to offset future capital gains, it is probable that the amount, which is offset, will not be distributed to shareholders. The capital loss carryforward expires on February 28, 2018.
Cost of securities for Federal Income tax purpose is $78,535,956 for All-Cap Fund and $1,073,094 for SmallCap Fund and the related tax-based net unrealized appreciation (depreciation) consists of:
| | All-Cap Fund | | SmallCap Fund |
| | | | |
| Gross unrealized appreciation | $ 15,405,109 | | $ 170,624 |
| Gross unrealized depreciation | (415,438) | | (12,033) |
Net unrealized appreciation (depreciation) | $ 14,989,671 | | $ 158,591 |
| | | | |
DGHM INVESTMENT TRUST
NOTES TO FINANCIAL STATEMENTS
NOTE 5 – CAPITAL STOCK TRANSACTIONS
Capital stock transactions for the Funds were:
| | All-Cap Fund |
| | Year Ended February 28, 2011 | | Period July 19, 2010* to February 28, 2011 |
| | Investor Class | | Class C | | Institutional Class |
| | Shares | Amount | | Shares | Amount | | Shares | Amount |
| Shares sold | 2,753,934 | $ 28,507,623 | | 213,812 | $2,171,909 | | 1,512,293 | $16,440,096 |
| Shares reinvested | 529 | 5,805 | | - | - | | 773 | 8,893 |
| Shares redeemed | (1,252,746) | (12,887,434) | | (46,505) | (466,156) | | (4,862) | (53,325) |
| Net increase (decrease) | 1,501,717 | $15,625,994 | | 167,307 | $1,705,753 | | 1,508,204 | $16,395,664 |
*Commencement of operations.
| | All-Cap Fund |
| | Year ended February 28, 2010 |
| | Investor Class | | Class C |
| | Shares | Amount | | Shares | Amount |
| Shares sold | 1,937,288 | $ 16,005,421 | | 39,096 | $ 312,433 |
| Shares reinvested | 8,920 | 84,843 | | - | - |
| Shares redeemed | (2,467,699) | (19,955,304) | | (24,714) | (197,195) |
| Net increase (decrease) | (521,491) | $ (3,865,040) | | 14,382 | $ 115,238 |
DGHM INVESTMENT TRUST
NOTES TO FINANCIAL STATEMENTS
| | SmallCap Fund Period June 30, 2010* to February 28, 2011 |
| | Investor Class | | Class C |
| | Shares | Amount | | Shares | Amount |
| Shares sold | 21,029 | $ 232,768 | | 75,769 | $ 853,949 |
| Shares reinvested | 237 | 2,978 | | 971 | 12,280 |
| Shares redeemed | (1,113) | (14,134) | | - | - |
| Net increase (decrease) | 20,153 | $ 221,612 | | 76,740 | $ 866,229 |
*Commencement of operations.
NOTE 6 – COMMITMENTS AND CONTINGENCIES
Under the Trust’s organizational documents, its officers and Trustees are indemnified against certain liabilities arising out of the performance of their duties to the Funds. In addition, in the normal course of business, the Trust entered into contracts with its vendors, on behalf of the Funds, and others that provide for general indemnifications. The Funds’ maximum exposure under these arrangements is unknown, as this would involve future claims that may be made against the Funds. The Funds expects that risk of loss to be remote.
NOTE 7 - SUBSEQUENT EVENTS
Management has evaluated all transactions and events subsequent to the date of the balance sheet through the date these financial statements were issued. Except as already included in the notes to these financial statements, no additional items require disclosure.
REPORT OF INDEPENDENT REGISTERED PUBLIC ACCOUNTING FIRM
To the Board of Trustees of DGHM Investment Trust
and the Shareholders of DGHM All-Cap Value Fund
and DGHM V2000 SmallCap Value Fund
We have audited the accompanying statement of assets and liabilities of DGHM All-Cap Value Fund, a series of shares of the DGHM Investment Trust, including the schedule of investments, as of February 28, 2011, and the related statement of operations for the year then ended, the statements of changes in net assets for each of the two years in the period then ended and the financial highlights for each of the three years in the period then ended and for the period from June 20, 2007 (commencement of operations) through February 29, 2008. We have also audited the accompanying statement of assets and liabilities of DGHM V2000 SmallCap Value Fund, a series of shares of the DGHM Investment Trust, including the schedule of investments, as of February 28, 2011, and the related statements of operations and changes in net assets and the financial highlights for the period June 30, 2010 (commencement of operations) through February 28, 2011. These financial statements and financial highlights are the responsibility of the Funds’ management. Our responsibility is to express an opinion on these financial statements and financial highlights based on our audits.
We conducted our audits in accordance with the standards of the Public Company Accounting Oversight Board (United States). Those standards require that we plan and perform the audit to obtain reasonable assurance about whether the financial statements and financial highlights are free of material misstatement. An audit includes examining, on a test basis, evidence supporting the amounts and disclosures in the financial statements. Our procedures included confirmation of securities owned as of February 28, 2011 by correspondence with the custodian and brokers. An audit also includes assessing the accounting principles used and significant estimates made by management, as well as evaluating the overall financial statement presentation. We believe that our audits provide a reasonable basis for our opinion.
In our opinion, the financial statements and financial highlights referred to above present fairly, in all material respects, the financial position of DGHM All-Cap Value Fund and DGHM V2000 SmallCap Value Fund as of February 28, 2011, the results of their operations, the changes in their net assets and the financial highlights for each of the years or periods presented, in conformity with accounting principles generally accepted in the United States of America.
/s/ BBD, LLP
BBD, LLP
Philadelphia, Pennsylvania
April 28, 2011
SUPPLEMENTAL INFORMATION (unaudited)
DGHM Investment Trust (the “Trust”)
Information pertaining to the Trustees and officers of the Trust is set for the below. The names, addresses and age of the Trustees and officers of the Trust, together with information as to their principal occupations during the past five years, are listed below. The Trustee who is considered an “interested person” as defined in Section 2(a)(19) of the 1940 Act, as well as those persons affiliated with the investment advisor and the principal underwriter, and officers of the Trust, are noted with an asterisk (*). The Statement of Additional Information (the “SAI”) includes additional information about the Trustees and the officer and is available without charge, upon request by calling, toll-free, (800) 773-3863. The address of each trustee and officer of the Trust, unless otherwise indicated, is 8730 Stony Point Parkway, Suite 205, Richmond, Virginia 233235. |
| Name, Address and Year Born | Position(s) Held with Company and Tenure | Number of Funds in Company Overseen | Principal Occupation(s) During the Past Five (5) Years | Other Directorships by Directors and Number of Funds in the Complex Overseen |
| Interested Trustees: |
Jeffrey C. Baker* 565 Fifth Avenue Suite 2101 New York, NY 10017 45 | Trustee, President, and Principal Executive Officer since 04/07 | 1 | Executive Vice President, Dalton, Greiner, Hartman, Maher & Co., LLC (investment advisor to the Fund) since 2005; previously, Senior Vice President, Dalton, Greiner, Hartman, Maher & Co., LLC, 2002 to 2005; and Vice President, Dalton, Greiner, Hartman, Maher & Co., LLC, 2000 to 2002. | None |
| Independent Trustees: |
Jack E. Brinson 79 | Trustee since 04/07 | 1 | Retired since January 2000; previously, President, Brinson Investment Co. (personal investments) and President, Brinson Chevrolet, Inc. (auto dealership). | Independent Trustee of the following: Gardner Lewis Investment Trust for the two series of that trust; The Nottingham Investment Trust II for the four series of that trust; Hillman Capital Management Investment Trust for the two series of that trust; Tilson Investment Trust for the two series of that trust and Starboard Investment Trust for the eleven series of that trust; and Giordano Investment Trust for the one series of that trust (all registered investment companies). |
Theo H. Pitt, Jr. 75 | Trustee and Chairman since 04/07 | 1 | Senior Partner, Community Financial Institutions Consulting (bank consulting) since 1997 and Account Administrator, Holden Wealth Management Group of Wachovia Securities (money management firm) from 2003 to 2008. | Independent Trustees of Gardner Lewis Investment Trust for the two series of that trust; and interested trustee of the Starboard Investment Trust for the eleven series of that trust (all registered investment companies). |
| Officers: |
Thomas F. Gibson 565 Fifth Avenue Suite 2101 New York, NY 10017 47 | Treasurer and Principal Financial Officer since 04/07 | N/A | Vice President, Chief Financial Officer, and Chief Compliance Officer, Dalton, Greiner, Hartman, Maher & Co., LLC since 2005; previously, Chief Financial Officer and Chief Compliance Officer, Bingham Legg Advisers, LLC, 1999 to 2005. | N/A |
SUPPLEMENTAL INFORMATION (unaudited)
DGHM Investment Trust (the “Trust”)
Lauren Jones 29 | Assistant Secretary since 12/09 | N/A | Relationship Manager, Commonwealth Shareholder Services since 2006;previously, Account Manager, Insider NYC, an event Planning firm, from 2004 to 2005 | N/A |
Karen Shupe 47 | Secretary and Assistant Treasurer since 11/08 | N/A | Managing Director of Fund Operations, Commonwealth Shareholder Services, Inc., since 2003; previously, Financial Reporting Manager, Commonwealth Shareholder Services, Inc., 2001 to 2003. | N/A |
Julian Winters 1701 Sunset Avenue Suite 203 Rocky Mount, NC 27804 42 | Chief Compliance Officer since 11/08 | NA | Managing Member of Watermark Solutions (investment compliance and consulting) since March 2007; previously, Vice-President – Compliance Administration, the Nottingham Company (investment company administrator and fund accountant) 1998 to 2007 | N/A |
SUPPLEMENTAL INFORMATION (unaudited)
VOTING PROXIES ON FUND PORTFOLIO SECURITIES
A copy of the Trust’s Proxy Voting and Disclosure Policy and the Advisor’s Proxy Voting and Disclosure Policy are included as Appendix B to the Fund’s Statement of Additional Information and is available, without charge, (1) upon request, by calling 1-800-653-2839 and (2) on the SEC’s website at http://www.sec.gov. Information regarding how the Funds voted proxies relating to portfolio securities during the most recent 12-month period ended June 30 is available without charge, (1) upon request, by calling the Funds at the number above and (2) on the SEC’s website at http://www.sec.gov.
QUARTERLY PORTFOLIO HOLDINGS
The Funds file with the SEC a complete schedule of its portfolio holdings, as of the close of the first and third quarters of its fiscal year, on “Form N-Q”. These filings are available on the SEC’s website at www.sec.gov. The Funds’ Forms N-Q may be reviewed and copied at the SEC’s Public Reference Room in Washington, D.C. Information on the operation of the Public Reference Room may be obtained by calling 1-800-SEC-0330.
APPROVAL OF THE RENEWAL OF INVESTMENT ADVISORY AGREEMENTS
Dalton, Greiner, Hartman, Maher & Co., LLC (the “Advisor”) supervises the investments of the DGHM All-Cap Value Fund (the “Fund”), a series portfolio of the DGHM Investment Trust (the “Trust”), pursuant to an Investment Advisory Agreement (the “Agreement”) between the Advisor and the Trust with respect to the Fund. At the quarterly meeting of the Board of Trustees of the Trust (the “Board” or “Trustees”) that was held on February 8, 2011, the Trustees, including a majority of the Trustees who are not parties to the Agreement or “interested persons” of any such party as such term is defined under the Investment Company Act of 1940, as amended (the “Independent Trustees”), voting separately, unanimously approved the renewal of the Agreement for a one-year period from March 1, 2011 until February 28, 2012, under the terms and for the compensation described therein.
In considering whether to approve the Advisory Agreement, the Trustees reviewed and considered such information as they deemed reasonably necessary, including the following material factors: (i) the nature, extent, and quality of the services provided by the Advisor; (ii) the investment performance of the Fund; (iii) the costs of the services to be provided and profits to be realized by the Advisor from the relationship with the Fund; (iv) the extent to which economies of scale would be realized as the Fund grows and whether advisory fee levels reflect those economies of scale for the benefit of the Fund’s investors; (v) the Advisor’s practices regarding brokerage and portfolio transactions; and (vi) the Advisor’s practices regarding possible conflicts of interest.
In assessing the factors described above and reaching its decision, the Board took into consideration information furnished for the Board’s review and consideration throughout the year at regular Board meetings, as well as information specifically prepared and/or presented in connection with the annual renewal process. At the meeting, the Trustees reviewed various informational materials including, without limitation, copies of the Agreement and a proposed Expense Limitation Agreement between the Advisor and the Trust with respect to the Fund (the “Expense Limitation Agreement”); materials provided by the Advisor to the Trustees containing information about the Advisor, its business, its finances, its personnel, its services to the Fund, and comparative performance and expense ratio information for other mutual funds with a strategy similar to the Fund; and a memorandum from 1940 Act law group (counsel to the Fund) that summarized the fiduciary duties and responsibilities of the Board in reviewing and approving the Agreement, including the types of information and factors that should be considered in order to make an informed decision.
Provided below is an overview of the factors the Board considered at its Meeting. The Board did not identify any particular information that was most relevant to its consideration to approve the Agreement and each Trustee may have afforded different weight to the various factors.
1. Nature, Extent and Quality of the Services Provided by the Advisor.
In considering the nature, extent, and quality of the services provided by the Advisor, the Trustees reviewed the responsibilities of the Advisor under the Agreement. The Trustees reviewed the services being provided by the Advisor to the Fund including, without limitation, the quality of its investment advisory services (including research and recommendations with respect to portfolio securities); the Advisor’s procedures for formulating investment recommendations and assuring compliance with the Fund’s investment objectives and limitations, as well as for ensuring compliance with regulatory requirements; its coordination of services for the Fund among the Fund’s service providers and the Independent Trustees; and its efforts to promote the Fund, grow the Fund’s assets, and assist in the distribution of Fund shares. The Trustees evaluated the Advisor’s personnel, including the education and experience of the Advisor’s personnel. The Trustees noted that several of the officers of the Trust, including the principal executive officer and principal financial officer for the Trust were employees of the Advisor, and they served the Trust without additional compensation. After reviewing the foregoing information and further information in the Advisor’s memorandum (e.g., descriptions of the Advisor’s business, the Advisor’s compliance programs, and the Advisor’s Form ADV), the Board of Trustees concluded that, in light of all the facts and circumstances, the quality, extent, and nature of the services to be provided by the Advisor were satisfactory and adequate for the Fund..
2. Investment Performance of the Fund and the Advisor.
In considering the investment performance of the Fund and the Advisor, the Trustees compared the performance of the Fund for various periods during the Fund’s existence with the performance of funds with similar objectives managed by other investment advisors, as well as with aggregated peer group data (e.g., Lipper peer group data). The Trustees also considered the consistency of the Advisor’s management of the Funds with the investment objectives and policies. The Trustees noted that the Fund’s performance in the short-term was generally better than that of its specifically identified peers and during the short time that the Fund has been in existence. The Trustees also considered the Fund's performance relative to other accounts managed by the Advisor, all of which are managed in the same manner as the Fund. The Trustees noted that the Fund's year-to-date performance was generally comparable to the performance of other accounts managed by the Advisor. After reviewing and discussing the performance of the Fund further, the Advisor’s experience managing the Fund, the Advisor’s historical investment performance, and other relevant factors, the Board concluded, in light of all the facts and circumstances, that the investment performance of the Fund and the Advisor was satisfactory.
3. Costs of the Services to be Provided and Profits to be Realized by the Advisor.
In considering the costs of the services to be provided and profits to be realized by the Advisor and its affiliates from the relationship with the Fund, the Trustees considered the Advisor’s staffing, personnel, and methods of operating; the financial condition of the Advisor and the level of commitment to the Fund by the Advisor and its principals; the asset levels of the Fund; and the overall expenses of the Fund, including the nature and frequency of advisory fee payments. The Trustees considered financial statements of the Advisor and discussed the financial stability and productivity of the firm. The Trustees also considered potential benefits for the Advisor in managing the Fund, including the potential for the Advisor to generate soft dollars from Fund trades that may benefit the Advisor’s other clients. The Trustees considered the fees and expenses of the Fund (including the management fee) to other funds comparable in terms of the type of fund, the nature of its investment strategy, its style of investment management, and its size, among other factors. The Board determined that the Fund’s expenses, including the management fee, were higher than some of the comparable funds and lower than others. Based on the foregoing, the Board concluded that the fees to be paid to the Advisor by the Fund, the costs of the services to be provided, and the profits that may be realized by the Advisor, in light of all the facts and circumstances, were fair and reasonable in relation to the nature and quality of the services provided by the Advisor.
4. Economies of Scale.
In considering the extent to which economies of scale would be realized as the Fund grows and whether advisory fee levels reflect those economies of scale for the benefit of the Fund’s investors, the Trustees considered the Fund’s fee arrangements with the Advisor. The Trustees determined that although the management fee would stay the same as asset levels increased, the shareholders of the Fund would benefit from a potential expense limitation arrangement until the Fund’s expenses fell below the expense cap. The Trustees also noted that the Fund would benefit from economies of scale under its agreements with some of its service providers other than the Advisor. Following further discussion of the Fund’s asset levels, expectations for growth, and levels of fees, the Board determined that the Fund’s fee arrangements, in light of all the facts and circumstances, were fair and reasonable and that the potential expense limitation arrangement provided potential savings or protection for the benefit of the Fund’s investors.
5. Advisor’s Practices Regarding Brokerage and Portfolio Transactions.
In considering the Advisor’s practices regarding brokerage and portfolio transactions, the Trustees reviewed the Advisor’s standards for seeking best execution for Fund portfolio transactions. The Trustees also considered a discussion of historical and anticipated portfolio turnover rates for the Fund; the process by which evaluations are made of the overall reasonableness of commissions paid; the method and basis for selecting and evaluating the broker-dealers used; any anticipated allocation of portfolio business to persons affiliated with the Advisor. The Trustees noted that the Advisor considers a number of factors when seeking best execution, including, but not limited to, the firm’s research provided, execution capability, commission rate, financial responsibility, and responsiveness. Additionally, the Board noted that the Advisor utilizes alternative trading venues, such as ECNs, to decrease the average cost of transactions to the Fund. After further review and discussion, the Board determined that the Advisor’s practices regarding brokerage and portfolio transactions were satisfactory.
6. Advisor’s Practices Regarding Possible Conflicts of Interest.
In considering the Advisor’s practices regarding conflicts of interest, the Trustees evaluated the potential for conflicts of interest and considered such matters as the experience and ability of the advisory and compliance personnel assigned to the Fund; the basis for soft dollar payments with broker-dealers; the basis of decisions to buy or sell securities for the Fund and/or the Advisor’s other accounts; and the substance and administration of the Advisor’s code of ethics. Based on the foregoing, the Board determined that the Advisor’s standards and practices relating to the identification and mitigation of possible conflicts of interest were satisfactory.
Based upon all of the foregoing considerations, the Board, including a majority of the Independent Trustees, voting separately, unanimously approved the renewal of the Agreement for a one-year period from March 1, 2011 until February 28, 2012, under the terms and for the compensation described therein.
DGHM INVESTMENT TRUST (unaudited)
FUND EXPENSES (unaudited)
Fund Expenses Example
As a shareholder of the Fund, you incur two types of costs: (1) transaction costs, including deferred sales charges on certain redemptions made within one year of purchase (Class C shares in DGHM All-Cap Value Fund) and (2) ongoing costs, including management fees, distribution (12b-1) fees and other Fund expenses. This example is intended to help you understand your ongoing costs (in dollars) of investing in the Fund and to compare these costs with the ongoing costs of investing in other mutual funds. The example is based on an investment of $1,000 invested at the beginning of the period, September 1, 2010, and held for the six months ended February 28, 2011.
Actual Expenses Example
The first line of the table below provides information about actual account values and actual expenses. You may use the information in this line, together with the amount you invested, to estimate the expenses that you paid over the period. Simply divide your account value by $1,000 (for example, an $8,600 account value divided by $1,000= 8.6), then multiply the result by the number in the first line under the heading entitled “Expenses Paid During Period” to estimate the expenses you paid on your account during this period.
Hypothetical Example for Comparison Purposes
The second line of the table below provides information about hypothetical account values and hypothetical expenses based on the Fund’s actual expense ratio and an assumed rate of return of 5% per year before expenses, which is not the Fund’s actual return. The hypothetical account values and expenses may not be used to estimate the actual ending account balance or expenses you paid for the period. You may use this information to compare the ongoing costs of investing in the Fund and other funds. To do so, compare this 5% hypothetical example with the 5% hypothetical examples that appear in the shareholder reports of the other funds.
Please note that the expenses shown in the table are meant to highlight your ongoing costs only and do not reflect any transactional costs, such as contingent deferred sales charges on certain redemptions. Therefore, the second line of the table is useful in comparing ongoing costs only, and will not help you determine the relative total costs of owning different funds. In addition, if these transactional costs were included, your costs would have been higher.
DGHM ALL-CAP VALUE FUND
INVESTOR CLASS | Beginning Account Value September 1, 2010 | Ending Account Value February 28, 2011 | Expenses Paid During Period* September 1, 2010 through February 28, 2011 |
| Actual | $1,000.00 | $1,258.10 | $8.34 |
| Hypothetical (5% return before expenses) | $1,000.00 | $1,017.55 | $7.45 |
CLASS C | Beginning Account Value September 1, 2010 | Ending Account Value February 28, 2011 | Expenses Paid During Period* September 1, 2010 through February 28, 2011 |
| Actual | $1,000.00 | $1,253.90 | $12.63 |
| Hypothetical (5% return before expenses) | $1,000.00 | $1,013.70 | $11.28 |
INSTITUTIONAL CLASS | Beginning Account Value September 1, 2010 | Ending Account Value February 28, 2011 | Expenses Paid During Period* September 1, 2010 through February 28, 2011 |
| Actual | $1,000.00 | $1,259.00 | $6.67 |
| Hypothetical (5% return before expenses) | $1,000.00 | $1,019.05 | $5.96 |
* - Expenses are equal to the Fund’s annualized expense ratio of 1.47% for Investor Class, 2.24% for Class C and 1.15% for Institutional Class, multiplied by the average account value for the period, multiplied by 181 days in the most recent fiscal half year divided by 365 days in the current year.
DGHM V2000 SMALLCAP VALUE FUND
INVESTOR CLASS | Beginning Account Value September 1, 2010 | Ending Account Value February 28, 2011 | Expenses Paid During Period* September 1, 2010 through February 28, 2011 |
| Actual | $1,000.00 | $1,307.90 | $10.30 |
| Hypothetical (5% return before expenses) | $1,000.00 | $1,016.00 | $9.00 |
INSTITUTIONAL CLASS | Beginning Account Value September 1, 2010 | Ending Account Value February 28, 2011 | Expenses Paid During Period* September 1, 2010 through February 28, 2011 |
| Actual | $1,000.00 | $1,309.30 | $8.87 |
| Hypothetical (5% return before expenses) | $1,000.00 | $1,017.25 | $7.75 |
* - Expenses are equal to the Fund’s annualized expense ratio of 1.90% for Investor Class and 1.65% for Institutional Class, multiplied by the average account value for the period, multiplied by 181 days in the most recent fiscal half year divided by 365 days in the current year.
ITEM 2. CODE OF ETHICS.
| | (a) | The registrant, as of the end of the period covered by this report, has adopted a code of ethics that applies to the registrant's principal executive officer, principal financial officer, principal accounting officer or controller, or persons performing similar functions, regardless of whether these individuals are employed by the registrant or a third party. |
| | (b) | There have been no amendments, during the period covered by this report, to a provision of the code of ethics that applies to the registrant's principal executive officer, principal financial officer, principal accounting officer or controller, or persons performing similar functions, regardless of whether these individuals are employed by the registrant or a third party, and that relates to any element of the code of ethics description. |
| | (c) | The registrant has not granted any waivers, including an implicit waiver, from a provision of the code of ethics that applies to the registrant's principal executive officer, principal financial officer, principal accounting officer or controller, or persons performing similar functions, regardless of whether these individuals are employed by the registrant or a third party, that relates to one or more of the items set forth in paragraph (b) of this item's instructions. |
ITEM 3. AUDIT COMMITTEE FINANCIAL EXPERT.
| | (a)(1) | The registrant does not have an audit committee financial expert serving on its audit committee. |
| | (a)(3) | At this time, the registrant believes that the collective experience provided by the members of the audit committee together offer the registrant adequate oversight for the registrant's level of financial complexity. |
ITEM 4. PRINCIPAL ACCOUNTANT FEES AND SERVICES.
| | (a) | The aggregate fees billed for each of the last two fiscal years for professional services rendered by the principal accountant for the audit of the registrant's annual financial statements or services that are normally provided by the accountant in connection with statutory and regulatory filings or engagements for those fiscal years are $26,000 for 2011 and $13,500 for 2010. |
| | (b) | The aggregate fees billed in each of the last two fiscal years for assurance and related services by the principal accountant that are reasonably related to the performance of the audit of the registrant's financial statements and are not reported under paragraph (a) of this Item are $0 for 2011 and $0 for 2010. |
| | (c) | The aggregate fees billed in each of the last two fiscal years for professional services rendered by the principal accountant for tax compliance, tax advice, and tax planning are $4,000 for 2011 and $2,000 for 2010. |
| | (d) | The aggregate fees billed in each of the last two fiscal years for products and services provided by the principal accountant, other than the services reported in paragraphs (a) through (c) of this Item are and $0 for 2011 and $0 for 2010. |
| | (e)(1) | Disclose the audit committee's pre-approval policies and procedures described in paragraph (c)(7) of Rule 2-01 of Regulation S-X. |
Pursuant to its charter, the registrant's Audit Committee must pre-approve
all audit and non-audit services to be provided to the registrant. The Audit Committee also pre-approves any non-audit services provided by the registrant's principal accountant to the Fund.
| | (e)(2) | The percentage of services described in each of paragraphs (b) through (d) of this Item that were approved by the audit committee pursuant to paragraph (c)(7)(i)(C) of Rule 2-01 of Regulation S-X are as follows: |
(b) NA
(c) 100%
(d) NA
| | (f) | The percentage of hours expended on the principal accountant's engagement to audit the registrant's financial statements for the most recent fiscal year that were attributed to work performed by persons other than the principal accountant's full-time, permanent employees was zero percent (0%). |
| | (g) | The aggregate non-audit fees billed by the registrant's accountant for services rendered to the registrant, and rendered to the registrant's investment adviser (not including any sub-adviser whose role is primarily portfolio management and is subcontracted with or overseen by another investment adviser), and any entity controlling, controlled by, or under common control with the adviser that provides ongoing services to the registrant for each of the last two fiscal years of the registrant was $0 for 2011 and $0 for 2010. |
| | (h) | Not applicable. The Audit Committee pre-approved all non-audit services rendered to the registrant's investment adviser and any control affiliates that provide ongoing services to the registrant. |
ITEM 5. AUDIT COMMITTEE OF LISTED REGISTRANTS.
Not applicable.
ITEM 6. SCHEDULE OF INVESTMENTS.
Schedule filed under Item 1 of the Form.
ITEM 7. DISCLOSURE OF PROXY VOTING POLICIES AND PROCEDURES FOR CLOSED-END MANAGEMENT INVESTMENT COMPANIES.
Not applicable.
ITEM 8. PORTFOLIO MANAGERS OF CLOSED-END MANAGEMENT INVESTMENT COMPANIES.
Not applicable.
ITEM 9. PURCHASES OF EQUITY SECURITIES BY CLOSED-END MANAGEMENT INVESTMENT COMPANY AND AFFILIATED PURCHASERS.
Not applicable.
ITEM 10. SUBMISSION OF MATTERS TO A VOTE OF SECURITY HOLDERS.
Not applicable.
ITEM 11. CONTROLS AND PROCEDURES.
| | (a) | The registrant's principal executive and principal financial officers, or persons performing similar functions, have concluded that the registrant's disclosure controls and procedures (as defined in Rule 30a-3(c) under the Investment Company Act of 1940, as amended (the "1940 Act") (17 CFR 270.30a-3(c))) are effective, as of a date within 90 days of the filing date of the report that includes the disclosure required by this paragraph, based on their evaluation of these controls and procedures required by Rule 30a-3(b) under the 1940 Act (17 CFR 270.30a-3(b)) and Rules 13a- 15(b) or 15d-15(b) under the Securities Exchange Act of 1934, as amended (17 CFR 240.13a-15(b) or 240.15d- 15(b)). |
| | (b) | There were no changes in the registrant's internal control over financial reporting (as defined in Rule 30a-3(d) under the 1940 Act (17 CFR 270.30a-3(d)) that occurred during the second fiscal quarter of the period covered by the report that has materially affected or is reasonably likely to materially affect, the registrant's internal control over financial reporting. |
ITEM 12. EXHIBITS.
| | (a)(1) | Code of ethics, or any amendment thereto, that is the subject of disclosure required by Item 2 is attached hereto. |
| | (a)(2) Certifications pursuant to Section 302 of the Sarbanes-Oxley Act of 2002 are attached hereto. |
| | (a)(3) Not applicable. There were no solicitations to purchase securities under Rule 23c-1 under the Act sent or given during the period covered by this report by or on behalf of the registrant. |
| | (b) | Certifications pursuant to Section 906 of the Sarbanes-Oxley Act of 2002 are attached hereto. |
SIGNATURES
Pursuant to the requirements of the Securities Exchange Act of 1934 and the Investment Company Act of 1940, the registrant has duly caused this report to be signed on its behalf by the undersigned, thereunto duly authorized.
(Registrant): DGHM Investment Trust
By: /s/ Jeffrey C. Baker
Jeffrey C. Baker
President and Principal Executive Officer
Date: May 9, 2011
Pursuant to the requirements of the Securities Exchange Act of 1934 and the Investment Company Act of 1940, this report has been signed below by the following persons on behalf of the registrant and in the capacities and on the dates indicated.
By: /s/ Jeffrey C. Baker
Jeffrey C. Baker
President and Principal Executive Officer,
DGHM Investment Trust
Date: May 9, 2011
By: /s/ Thomas F. Gibson
Thomas F. Gibson
Principal Financial Officer,
DGHM Investment Trust
Date: May 9, 2011