|
| | | | | | | | Investor Shares |
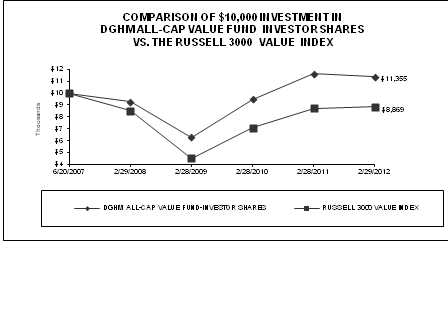
| | | | Total Return One Year Ended 2/29/2012 | | Average Annual Return Since Inception 06/20/07 to 02/29/12 | |
| | DGHM All-Cap Value Fund: | | -2.56% | | 2.74% | | |
| | Russell 3000 Value Index: | | 1.77% | | -2.52% | | |
| | | | | | | | | | | | | | | |
| | Returns do not reflect the deduction of taxes that a shareholder would pay on Fund distributions or redemption of shares. The total cumulative returns are historical in nature and measure net investment income and capital gain or loss from portfolio investments assuming reinvestments of dividends. |
| | | | | | | | | | | | | | | | | | |
| | The Russell 3000 Value Index is generally considered to be representative of the performance of unmanaged common stocks that comprise the broad value segment of the U.S. securities markets. You cannot invest directly in this index. This index does not have an investment advisor and does not pay any commissions, expenses, or taxes. If this index did pay commissions, expenses, or taxes, its returns would be lower. The index is not adjusted to reflect expenses that the SEC requires to be reflected in the Fund's performance. |
| | | | | | | | | | | | | | | | | | |
| | The above returns for the Investor Shares of the Fund assumes an initial investment of $10,000 at June 20, 2007 (Commencement of Operations). All dividends and distributions are reinvested, if any. It is important to note that the Fund is a professionally managed mutual fund while the index is not available for investment and is unmanaged. The comparison is shown for illustrative purposes only. The Fund's investment advisor has entered into a contractual arrangement with the Fund to waive its fees in an amount that limits Total Annual Fund Operating Expenses of the Fund to not more than 1.50%, excluding 12b-1 fees, for the period ending June 30, 2012. There can be no assurance that this arrangement will continue in the future. For more information, please see the Fund's prospectus. |
| | | | | | | | | | | | | | | | | | |
| | Performance quoted above represents past performance, which is no guarantee of future results. Investment return and principal value will fluctuate so that shares, when redeemed, may be worth more or less than their original cost. Current performance may be lower or higher than the performance data quoted. |
| | | |
| | | | | | | | | | | | Class C Shares | | |
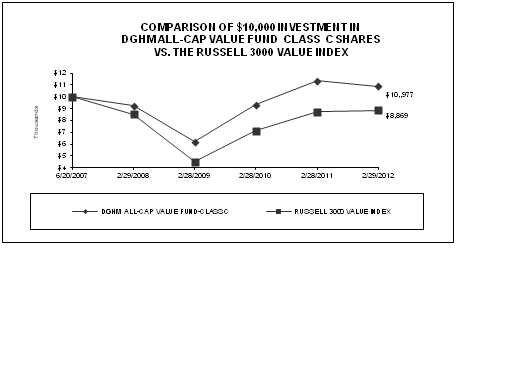
| | | | | | | | | | Total Return One Year Ended 2/29/2012 | | Average Annual Return Since Inception 06/20/07 to 02/29/12 | | |
| | | | | | | | | | | |
| | | | | | | | | | | |
| | | | | | | | | | | |
| | DGHM All-Cap Value Fund: | | -3.37% | | 1.79% | | | |
| | Russell 3000 Value Index: | | 1.77% | | -2.52% | | | |
| | | | | | | | | | | | | | | | | | | | | | |
| | Returns do not reflect the deduction of taxes that a shareholder would pay on Fund distributions or redemption of shares. The total cumulative returns are historical in nature and measure net investment income and capital gain or loss from portfolio investments assuming reinvestments of dividends. |
| | | | | | | | | | | | | | | | | | | | | | |
| | The Russell 3000 Value Index is generally considered to be representative of the performance of unmanaged common stocks that comprise the broad value segment of the U.S. securities markets. You cannot invest directly in this index. This index does not have an investment advisor and does not pay any commissions, expenses, or taxes. If this index did pay commissions, expenses, or taxes, its returns would be lower. The index is not adjusted to reflect expenses that the SEC requires to be reflected in the Fund's performance. |
| | | | | | | | | | | | | | | | | | | | | | |
| | The above returns for the Class C Shares of the Fund assumes an initial investment of $10,000 at June 20, 2007 (Commencement of Operations). All dividends and distributions are reinvested, if any. It is important to note that the Fund is a professionally managed mutual fund while the index is not available for investment and is unmanaged. The comparison is shown for illustrative purposes only. The Fund's investment advisor has entered into a contractual arrangement with the Fund to waive its fees in an amount that limits Total Annual Fund Operating Expenses of the Fund to not more than 1.50%, excluding 12b-1 fees, for the period ending June 30, 2012 There can be no assurance that this arrangement will continue in the future. For more information, please see the Fund's prospectus. |
| | | | | | | | | | | | | | | | | | | | | | |
| | Performance quoted above represents past performance, which is no guarantee of future results. Investment return and principal value will fluctuate so that shares, when redeemed, may be worth more or less than their original cost. Current performance may be lower or higher than the performance data quoted. |
|
| | | | | | | Institutional Shares | | | | | |
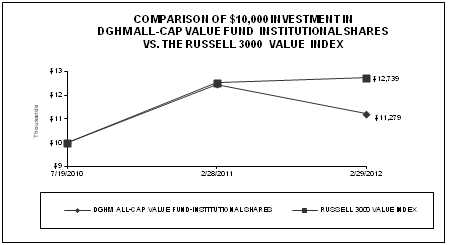
| | | | | | | | Total Return One Year Ended 2/29/2012 | | Average Annual Return Since Inception 07/19/10 to 02/29/12 | | | |
| | | | | | | | | | | |
| | | | | | | | | | | |
| | | | | | | | | | | | | | | |
| DGHM All-Cap Value Fund: | -2.21% | | 7.70% | | | | |
| Russell 3000 Value Index: | 1.77% | | 16.16% | | | | |
| | | | | | | | | | | | | | | |
| Returns do not reflect the deduction of taxes that a shareholder would pay on Fund distributions or redemption of shares. The total cumulative returns are historical in nature and measure net investment income and capital gain or loss from portfolio investments assuming reinvestments of dividends. |
| | | | | | | | | | | | | | | |
| The Russell 3000 Value Index is generally considered to be representative of the performance of unmanaged common stocks that comprise the broad value segment of the U.S. securities markets. You cannot invest directly in this index. This index does not have an investment advisor and does not pay any commissions, expenses, or taxes. If this index did pay commissions, expenses, or taxes, its returns would be lower. The index is not adjusted to reflect expenses that the SEC requires to be reflected in the Fund's performance. |
| | | | | | | | | | | | | | | |
| The above returns for the Institutional Shares of the Fund assumes an initial investment of $10,000 at July 19, 2010 (Commencement of Operations). All dividends and distributions are reinvested, if any. It is important to note that the Fund is a professionally managed mutual fund while the index is not available for investment and is unmanaged. The comparison is shown for illustrative purposes only. The Fund's investment advisor has entered into a contractual arrangement with the Fund to waive its fees in an amount that limits Total Annual Fund Operating Expenses of the Fund to not more than 1.50% for the period ending June 30, 2012. There can be no assurance that this arrangement will continue in the future. For more information, please see the Fund's prospectus. |
| | | | | | | | | | | | | | | |
| Performance quoted above represents past performance, which is no guarantee of future results. Investment return and principal value will fluctuate so that shares, when redeemed, may be worth more or less than their original cost. Current performance may be lower or higher than the performance data quoted. |
|
| | | | | | | | | | | | Investor Shares | | |
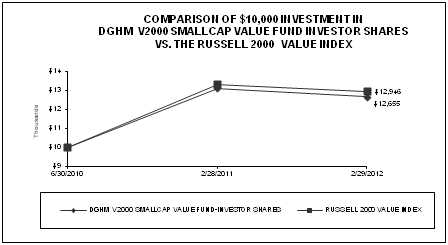
| �� | | | | | | | | | | | Total Return One Year Ended 2/29/2012 | | Average Annual Return Since Inception 06/30/10 to 02/29/12 | | |
| | | | | | | | | | | | | | |
| | | | | | | | | | | | | | |
| | | | | | | | | | | | | | | |
| | DGHM SmallCap Value Fund: | -3.43% | | 15.16% | | | |
| | Russell 2000 Value Index: | -2.72% | | 16.74% | | | |
| | | | | | | | | | | | | | | | | | | |
| | Returns do not reflect the deduction of taxes that a shareholder would pay on Fund distributions or redemption of shares. The total cumulative returns are historical in nature and measure net investment income and capital gain or loss from portfolio investments assuming reinvestments of dividends. |
| | | | | | | | | | | | | | | | | | | |
| | The Russell 2000 Value Index measures the performance of small-cap value segment of the U.S. equity universe. It includes those Russell 2000 companies with lower price-to-book ratios and lower forecasted growth values. The Russell 2000 Value Index is constructed to provide a comprehensive and unbiased barometer for the small-cap value segment. The Index is completely reconstituted annually to ensure larger stocks do not distort the performance and characteristics of the true small-cap opportunity set and that the represented companies continue to reflect value characteristics. |
| | | | | | | | | | | | | | | | | | | |
| | The above returns for the Investor Shares of the Fund assumes an initial investment of $10,000 at June 30, 2010 (Commencement of Operations). All dividends and distributions are reinvested, if any. It is important to note that the Fund is a professionally managed mutual fund while the index is not available for investment and is unmanaged. The comparison is shown for illustrative purposes only. The Fund's investment advisor has entered into a contractual arrangement with the Fund to waive its fees in an amount that limits Total Annual Fund Operating Expenses of the Fund to not more than 1.65%, excluding 12b-1 fees, for the period ending June 30, 2012. There can be no assurance that this arrangement will continue in the future. For more information, please see the Fund's prospectus. |
| | | | | | | | | | | | | | | | | | | |
| | Performance quoted above represents past performance, which is no guarantee of future results. Investment return and principal value will fluctuate so that shares, when redeemed, may be worth more or less than their original cost. Current performance may be lower or higher than the performance data quoted. |
| |
| | | | | | | | | | | Institutional Shares | | | |
| | | | | | | | | | | Total Return One Year Ended 2/29/2012 | | Average Annual Return Since Inception 06/30/10 to 02/29/12 | | |
| | | | | | | | | | | | | |
| | | | | | | | | | | | | |
| | | | | | | | | | | | | |
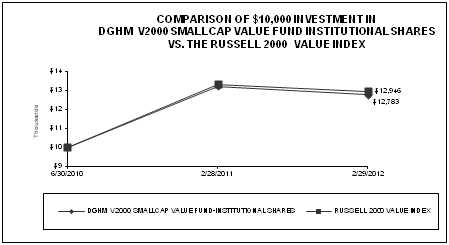
| | DGHM V2000 SmallCap Value Fund: | -3.34% | | 15.85% | | |
| | Russell 2000 Value Index: | -2.72% | | 16.74% | | |
| | | | | | | | |
| | Returns do not reflect the deduction of taxes that a shareholder would pay on Fund distributions or redemption of shares. The total cumulative returns are historical in nature and measure net investment income and capital gain or loss from portfolio investments assuming reinvestments of dividends. | |
| | | | | | | | | | | | | | | | | | | | | |
| | The Russell 2000 Value Index measures the performance of small-cap value segment of the U.S. equity universe. It includes those Russell 2000 companies with lower price-to-book ratios and lower forecasted growth values. The Russell 2000 Value Index is constructed to provide a comprehensive and unbiased barometer for the small-cap value segment. The Index is completely reconstituted annually to ensure larger stocks do not distort the performance and characteristics of the true small-cap opportunity set and that the represented companies continue to reflect value characteristics. | |
| | | | | | | | | | | | | | | | | | | | | |
| | The above returns for the Institutional Shares of the Fund assumes an initial investment of $10,000 at June 30, 2010 (Commencement of Operations). All dividends and distributions are reinvested, if any. It is important to note that the Fund is a professionally managed mutual fund while the index is not available for investment and is unmanaged. The comparison is shown for illustrative purposes only. The Fund's investment advisor has entered into a contractual arrangement with the Fund to waive its fees in an amount that limits Total Annual Fund Operating Expenses of the Fund to not more than 1.65% for the period ending June 30, 2012. There can be no assurance that this arrangement will continue in the future. For more information, please see the Fund's prospectus. | |
| | | | | | | | | | | | | | | | | | | | | |
| | Performance quoted above represents past performance, which is no guarantee of future results. Investment return and principal value will fluctuate so that shares, when redeemed, may be worth more or less than their original cost. Current performance may be lower or higher than the performance data quoted. | |

SCHEDULE OF INVESTMENTS February 29, 2012 |
| Number of Shares | | Security Description | | % of Net Assets | | Fair Value |
| | | | | | | |
| | | COMMON STOCKS | | 95.53% | | |
| | | | | | | |
| | | AEROSPACE/DEFENSE | | 2.80% | | |
| 54,306 | | General Dynamics Corporation | | | | $ 3,976,828 |
| | | | | | | |
| | | BANKS | | 3.17% | | |
| 357,900 | | People's United Financial Inc. | | | | 4,505,961 |
| | | | | | | |
| | | COMPUTERS | | 5.74% | | |
| 19,209 | | International Business Machines Corporation | | 3,778,987 |
| 65,817 | | Teradata Corporation* | | | | 4,380,121 |
| | | | | | | 8,159,108 |
| | | DIVERSIFIED FINANCIAL SERVICES | | 13.62% | | |
| 84,490 | | AON Corp. | | | | 3,954,977 |
| 85,660 | | CIT Group Inc.* | | | | 3,487,219 |
| 122,154 | | JPMorgan Chase & Co. | | | | 4,793,323 |
| 468,070 | | KeyCorp | | | | 3,791,367 |
| 79,070 | | State Street Corp. | | | | 3,339,126 |
| | | | | | | 19,366,012 |
| | | HEALTHCARE | | 8.56% | | |
| 78,110 | | Baxter International Inc. | | | | 4,540,534 |
| 70,880 | | Covance Inc.* | | | | 3,383,102 |
| 79,255 | | Stryker Corp. | | | | 4,251,238 |
| | | | | | | 12,174,874 |
| | | INSURANCE | | 2.83% | | |
| 56,042 | | ACE Limited | | | | 4,018,772 |
| | | | | | | |
| | | MEDIA | | 7.71% | | |
| 69,114 | | The DIRECTV Group, Inc. Class A* | | 3,201,360 |
| 82,101 | | Omnicom Group, Inc. | | | | 4,059,073 |
| 77,746 | | Viacom, Inc."B" | | | | 3,702,265 |
| | | | | | | 10,962,698 |
DGHM ALL-CAP VALUE FUND SCHEDULE OF INVESTMENTS February 29, 2012 |
| Number of Shares | | Security Description | | % of Net Assets | | Fair Value |
| | | | | | | |
| | | MINING | | 2.38% | | |
| 79,380 | | Freeport-McMoRan Copper & Gold Inc. | | $ 3,378,413 |
| | | | | | | |
| | | MISCELLANEOUS MANUFACTURING | | 13.09% | | |
| 40,462 | | 3M Company | | | | 3,544,471 |
| 109,260 | | Analog Devices, Inc. | | | | 4,284,085 |
| 47,557 | | Becton, Dickinson and Co. | | | | 3,624,795 |
| 56,050 | | Dover Corp. | | | | 3,588,321 |
| 66,953 | | Rockwood Holdings Inc.* | | | | 3,565,247 |
| | | | | | | 18,606,919 |
| | | OIL & GAS SERVICES | | 12.45% | | |
| 67,900 | | Devon Energy Corp. | | | | 4,977,749 |
| 86,480 | | Piedmont Natural Gas Co. Inc. | | | | 2,801,952 |
| 47,797 | | Pioneer Natural Resources Co. | | | | 5,240,463 |
| 159,970 | | Vectren Corp. | | | | 4,674,323 |
| . | | | | | | 17,694,487 |
| | | REAL ESTATE INVESTMENT TRUST | | 2.72% | | |
| 53,881 | | Alexandria Real Estate Equities, Inc. | | 3,862,729 |
| | | | | | | |
| | | RETAIL | | 7.43% | | |
| 66,350 | | Kohls Corp. | | | | 3,296,268 |
| 185,970 | | Safeway Inc. | | | | 3,989,057 |
| 55,490 | | Wal-Mart Stores, Inc. | | | | 3,278,349 |
| | | | | | | 10,563,674 |
| | | | | | | |
| | | TELECOMMUNICATIONS | | 3.89% | | |
| 180,630 | | AT&T Inc. | | | | 5,525,472 |
| | | | | | | |
| | | TRANSPORTATION | | 9.15% | | |
| 89,672 | | Tidewater Inc. | | | | 5,335,484 |
| 44,990 | | United Parcel Service, Inc. "B" | | | | 3,459,281 |
| 78,350 | | Visteon Corp.* | | | | 4,208,962 |
| | | | | | | 13,003,727 |
DGHM ALL-CAP VALUE FUND SCHEDULE OF INVESTMENTS February 29, 2012 |
| Number of Shares | | Security Description | | % of Net Assets | | Fair Value |
| | | | | | | |
| | | TOTAL COMMON STOCKS | | | | |
| | | (Cost: $124,157,200) | | 95.53% | | $135,799,674 |
| | | | | | | |
| | | | | | | |
| | | INVESTMENT COMPANIES | | 4.38% | | |
| | | WFA Treasury Plus Money Market Fund 0.1%** | | |
| 6,225,789 | | (Cost: $6,225,789) | | | | 6,225,789 |
| | | | | | | |
| | | TOTAL INVESTMENTS: | | | | |
| | | (Cost: $130,382,989) | | 99.91% | | 142,025,463 |
| | | Other assets, net of liabilities | | 0.09% | | 130,317 |
| | | NET ASSETS | | 100.00% | | $142,155,780 |
| | | | | | | |
| *Non-income producing (security is considered non-income producing if at least one dividend has not been paid during the last year preceding the date of the Fund's related balance sheet). |
| | | | | | | |
| **Effective 7 day yield as of February 29, 2012 | | | | |
| | | | | | | |
| See Notes to Financial Statements | | | | |
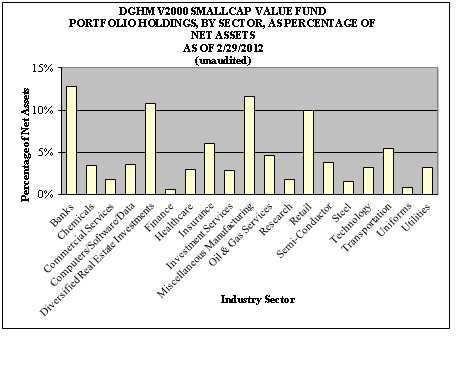
DGHM V2000 SMALLCAP VALUE FUND SCHEDULE OF INVESTMENTS February 29, 2012 |
Number of Shares | | Security Description | | % of Net Assets | | Fair Value |
| | | COMMON STOCKS | | 90.27% | | |
| | | | | | | |
| | | BANKS | | 12.80% | | |
| 100 | | Associated Banc-Corp. | | | | $ 1,324 |
| 385 | | Colony Financial Inc. | | | | 6,422 |
| 199 | | Community Trust Bancorp, Inc. | | | | 6,137 |
| 710 | | National Penn Bancshares, Inc. | | | | 6,212 |
| 639 | | Old National Bancorp | | | | 7,719 |
| 513 | | Provident Financial Services | | | | 7,049 |
| 210 | | Sandy Spring Bancorp, Inc. | | | | 3,793 |
| 308 | | United Financial Bancorp, Inc. | | | | 4,882 |
| 276 | | Webster Financial Corp. | | | | 6,039 |
| 251 | | WesBanco, Inc. | | | | 4,894 |
| | | | | | | 54,471 |
| | | CHEMICALS | | 3.46% | | |
| 108 | | Ashland Inc. | | | | 6,864 |
| 585 | | PolyOne Corp. | | | | 7,857 |
| | | | | | | 14,721 |
| | | COMMERCIAL SERVICES | | 1.75% | | |
| 149 | | Steiner Leisure Ltd.* | | | | 7,456 |
| | | | | | | |
| | | COMPUTERS/SOFTWARE/DATA | | 3.55% | | |
| 170 | | Qlogic Corp.* | | | | 2,922 |
| 310 | | Quest Software, Inc.* | | | | 6,206 |
| 435 | | Sykes Enterprise, Inc.* | | | | 5,995 |
| | | | | | | 15,123 |
| | | | | | | |
| | | DIVERSIFIED REAL ESTATE INVESTMENTS | | 10.71% | | |
| 306 | | BioMed Realty Trust, Inc. | | | | 5,636 |
| 404 | | CBL & Associates Properties, Inc. | | | | 7,123 |
| 269 | | Colonial Properties Trust | | | | 5,520 |
| 749 | | Cousins Properties, Inc. | | | | 5,535 |
| 300 | | Gaylord Entertainment Co.* | | | | 8,928 |
| 1,120 | | Hersha Hospitality Trust | | | | 5,634 |
| 285 | | Redwood Trust, Inc. | | | | 3,297 |
| 95 | | Sun Communities, Inc. | | | | 3,932 |
| | | | | | | 45,605 |
DGHM V2000 SMALLCAP VALUE FUND SCHEDULE OF INVESTMENTS February 29, 2012 |
Number of Shares | | Security Description | | % of Net Assets | | Fair Value |
| | | | | | | |
| | | FINANCE | | 0.52% | | |
| 400 | | Global Cash Access Holdings, Inc.* | | | | $ 2,224 |
| | | | | | | |
| | | HEALTHCARE | | 2.93% | | |
| 57 | | Bio-Rad Laboratories, Inc.* | | | | 5,809 |
| 145 | | ICU Medical, Inc.* | | | | 6,653 |
| | | | | | | 12,462 |
| | | INSURANCE | | 5.96% | | |
| 310 | | Alterra Capital Holdings Ltd. | | | | 7,118 |
| 485 | | First American Financial Corp. | | | | 7,469 |
| 140 | | Hanover Insurance Group Inc. | | | | 5,715 |
| 585 | | Maiden Holdings Ltd. | | | | 5,060 |
| | | | | | | 25,362 |
| | | INVESTMENT SERVICES | | 2.79% | | |
| 113 | | GAMCO Investors, Inc. | | | | 5,211 |
| 327 | | Walter Investment ManagementCorp. | | | | 6,664 |
| | | | | | | 11,875 |
| | | MISCELLANEOUS MANUFACTURING | | 11.62% | | |
| 260 | | Beacon Roofing Supply, Inc.* | | | | 6,131 |
| 121 | | Brady Corp. Class A | | | | 3,866 |
| 90 | | Cytec Industries Inc. | | | | 5,352 |
| 340 | | Electro Scientific Industries, Inc. | | | | 4,706 |
| 307 | | Herman Miller, Inc. | | | | 6,447 |
| 91 | | Mueller Industries, Inc. | | | | 4,186 |
| 83 | | NACCO Industries, Inc. Class A | | | | 8,117 |
| 319 | | Photronics, Inc.* | | | | 2,236 |
| 175 | | Pool Corp. | | | | 6,370 |
| 30 | | The Toro Co. | | | | 2,032 |
| | | | | | | 49,443 |
| | | OIL & GAS SERVICES | | 4.58% | | |
| 108 | | Atmos Energy Corp. | | | | 3,319 |
| 139 | | Berry Petroleum Co. Class A | | | | 7,500 |
| 110 | | Piedmont Natural Gas Co., Inc. | | | | 3,564 |
| 170 | | Swift Energy Co.* | | | | 5,105 |
| . | | | | | | 19,488 |
DGHM V2000 SMALLCAP VALUE FUND SCHEDULE OF INVESTMENTS February 29, 2012 |
Number of Shares | | Security Description | | % of Net Assets | | Fair Value |
| | | RESEARCH | | 1.76% | | |
| 306 | | Parexel International Corp.* | | | | $ 7,491 |
| | | | | | | |
| | | RETAIL | | 9.94% | | |
| 150 | | The Cato Corp. "A" | | | | 4,067 |
| 780 | | Chico's FAS, Inc. | | | | 11,708 |
| 56 | | Genesco Inc.* | | | | 3,816 |
| 204 | | Papa John's International, Inc.* | | | | 7,581 |
| 125 | | Snap-on Inc. | | | | 7,641 |
| 175 | | Weis Markets, Inc. | | | | 7,500 |
| | | | | | | 42,313 |
| | | SEMI-CONDUCTOR | | 3.80% | | |
| 655 | | GT Advanced Technologies Inc.* | | | | 5,607 |
| 1,060 | | Lattice Semiconductor Corp.* | | | | 6,985 |
| 750 | | RF Micro Devices, Inc.* | | | | 3,578 |
| | | | | | | 16,170 |
| | | STEEL | | 1.51% | | |
| 120 | | Reliance Steel & Aluminum Co. | | | | 6,446 |
| | | | | | | |
| | | TECHNOLOGY | | 3.21% | | |
| 117 | | Anixter International Inc.* | | | | 8,136 |
| 300 | | Booz Allen Hamilton Holding Corp. | | | | 5,523 |
| | | | | | | 13,659 |
| | | TRANSPORTATION | | 5.48% | | |
| 565 | | Heartland Express, Inc. | | | | 8,175 |
| 260 | | Thor Industries, Inc. | | | | 8,468 |
| 276 | | Werner Enterprises, Inc. | | | | 6,685 |
| | | | | | | 23,328 |
| | | UNIFORMS | | 0.78% | | |
| 55 | | UniFirst Corp. | | | | 3,304 |
| | | | | | | |
| | | UTILITIES | | 3.12% | | |
| 125 | | Cleco Corp. | | | | 4,810 |
| 99 | | Pinnacle West Capital Corp. | | | | 4,656 |
| 155 | | Portland General Electric Co. | | | | 3,819 |
| | | | | | | 13,285 |
DGHM V2000 SMALLCAP VALUE FUND SCHEDULE OF INVESTMENTS February 29, 2012 |
Number of Shares | | Security Description | | % of Net Assets | | Fair Value |
| | | | | | | |
| | | TOTAL COMMON STOCKS | | 90.27% | | |
| | | (Cost: $365,606) | | | | $ 384,226 |
| | | | | | | |
| | | INVESTMENT COMPANIES | | 8.15% | | |
| 34,686 | | WFA Treasury Plus Money MarketFund 0.1%** | | 34,686 |
| | | (Cost: $34,686) | | | | |
| | | | | | | |
| | | | | | | |
| | | TOTAL INVESTMENTS: | | | | |
| | | (Cost: $400,292) | | 98.42% | | 418,912 |
| | | Other assets, net of liabilities | | 1.58% | | 6,738 |
| | | NET ASSETS | | 100.00% | | $ 425,650 |
| | | | | | | |
| | | | | | | |
| | | | | | | |
| *Non-income producing (security is considered non-income producing if at least one dividend has not been paid during the last year preceding the date of the Fund's related balance sheet). |
| | | | | | | |
| **Effective 7 day yield as of February 29, 2012 | | | | |
| | | | | | | |
| See Notes to Financial Statements | | | | |
STATEMENTS OF ASSETS AND LIABILITIES At February 29, 2012 |
| | | | DGHM All-Cap Value Fund | | DGHM V2000 SmallCap Value Fund |
| ASSETS | | | |
| | Investments at fair value (identified cost of$130,382,989 and $400,262,respectively)(Note 1) | $ 142,025,463 | | $ 418,912 |
| |
| | Receivable for investments sold | - | | 510 |
| | Receivable for capital stock sold | 149,422 | | - |
| | Dividends receivable | 151,611 | | 368 |
| | Interest receivable | 55 | | - |
| | Due from advisor | - | | 14,095 |
| | Prepaid expenses | 27,187 | | 5,531 |
| | | TOTAL ASSETS | 142,353,738 | | 439,416 |
| LIABILITIES | | | |
| | Payable for securities purchased | - | | 10,044 |
| | Payable for capital stock redeemed | 80,787 | | - |
| | Accrued investment management fees | 73,193 | | - |
| | Accrued 12b-1 fees | 15,776 | | 97 |
| | Accrued administration, accounting andtransfer agent fees | 11,434 | | 2,050 |
| | Other accrued expenses | 16,768 | | 1,575 |
| | | TOTAL LIABILITIES | 197,958 | | 13,766 |
| NET ASSETS | $ 142,155,780 | | $ 425,650 |
| Net Assets Consist of: | | | |
| | Paid-in-capital applicable to12,781,953 and53,471 no par value shares of beneficialinterest outstanding, respectively | $ 131,341,950 | | $ 410,882 |
| |
| | Accumulated net investment income(loss) | 104,525 | | - |
| | Accumulated net realized gain (loss)oninvestments | (933,169) | | (3,882) |
| | Net unrealized appreciation(depreciation) ofinvestments | 11,642,474 | | 18,650 |
| | Net Assets | $ 142,155,780 | | $ 425,650 |
| NET ASSET VALUE, OFFERING AND REDEMPTION PRICE PER SHARE |
Investor Class ($75,004,248 / 6,736,994 shares outstanding and $74,877 / 9,666 shares outstanding, respectively) | $ 11.13 | | $ 7.75 |
Class C (a) ($4,832,487 / 444,473 shares outstanding) | | | |
| $ 10.87 | | N/A |
Institutional Class ($62,319,045 / 5,600,486 shares outstanding and $350,773 / 43,805 shares outstanding, respectively) | $ 11.13 | | $ 8.01 |
| |
(a) May be subject to a contingent deferred sales charge if redeemed within one year of purchase (see Note 1) |
| | | | | | |
| See Notes to Financial Statements | | | |
STATEMENTS OF OPERATIONS For the year ended February 29, 2012 |
| | | | | DGHM All-Cap Value Fund | | DGHM V2000 SmallCap Value Fund |
| INVESTMENT INCOME | | | | |
| | Dividend (net of foreign tax withheld of$1,893 and $ - , respectively) | | $ 2,469,206 | | $ 7,372 |
| | Interest | | 372 | | 3 |
| | | Total investment income | | 2,469,578 | | 7,375 |
| EXPENSES | | | | |
| | Investment management fees (Note 2) | | 787,705 | | 3,945 |
| | 12b-1 fees (Note 2) | | | | |
| | | Investor Class | | 181,189 | | 329 |
| | | Class C | | �� 46,756 | | - |
| | Recordkeeping and administrative services (Note 2) | 107,344 | | 20,000 |
| | Accounting fees (Note 2) | | 60,593 | | 20,000 |
| | Custodian fees | | 14,681 | | 8,079 |
| | Transfer agent fees (Note 2) | | | | |
| | | Investor Class | | 45,085 | | 3,999 |
| | | Class C | | 3,804 | | - |
| | | Institutional Class | | 13,210 | | 11,001 |
| | Professional fees | | 43,069 | | 24,736 |
| | Filing and registration fees | | 47,793 | | 12,587 |
| | Trustee fees | | 7,986 | | 4,014 |
| | Compliance fees | | 19,921 | | 6,573 |
| | Shareholder servicing and reports | | | | |
| | | Investor Class | | 12,088 | | 3,191 |
| | | Class C | | 1,470 | | - |
| | | Institutional Class | | 3,173 | | 7,745 |
| | Other | | 84,934 | | 21,068 |
| | | Total expenses | | 1,480,801 | | 147,267 |
| | | Fee waivers and reimbursed expenses (Note 2) | | - | | (138,807) |
| | | Net Expenses | | 1,480,801 | | 8,460 |
| | | Net investment income (loss) | | 988,777 | | (1,085) |
REALIZED AND UNREALIZED GAIN (LOSS) ON INVESTMENTS |
| | Net realized gain (loss) on investments | | 1,460,015 | | 127,083 |
| | Net increase (decrease) in unrealized appreciation(depreciation) of investments | | (3,681,521) | | (139,491) |
| | Net realized and unrealized gain (loss) oninvestments | | (2,221,506) | | (12,858) |
| | INCREASE (DECREASE) IN NET ASSETSFROM OPERATIONS | | $(1,232,729) | | $ (13,943) |
| | | | | | | |
| See Notes to Financial Statements | | | | |
| STATEMENTS OF CHANGES IN NET ASSETS |
| | DGHM All-Cap Value Fund | | DGHM V2000 SmallCap Value Fund |
For the Year ended February 29, 2012 | | For the Year ended February 28, 2011 | | For the Year ended February 29, 2012 | | For the period June 30, 2010* to February 28, 2011 |
| Increase (decrease) in Net Assets | | | | | | |
| OPERATIONS | | | | | | | |
| | Net investment income(loss) | $ 988,777 | | $ 15,598 | | $ (1,085) | | $ 1,454 |
| | Net realized gain (loss) oninvestments | 1,460,015 | | 4,392,997 | | 127,083 | | 29,173 |
| | Change in net unrealizedappreciation(depreciation) oninvestments | (3,681,521) | | 9,236,856 | | (139,941) | | 158,591 |
| | Increase (decrease) in netassets from operations | (1,232,729) | | 13,645,451 | | (13,943) | | 189,218 |
| DISTRIBUTIONS TO SHAREHOLDERS | | | | | |
| | Net investment income | | | | | | |
| | Investor Class | (420,103) | | (6,897) | | (2,858) | | - |
| | Institutional Class | (464,149) | | (17,360) | | (9,249) | | (2,118) |
| Net realized gain | | | | | | | |
| | Investor Class | (676,148) | | - | | (23,167) | | (2,978) |
| | Class C | (43,005) | | - | | - | | - |
| | Institutional Class | (515,430) | | - | | (108,942) | | (13,425) |
| | Decrease in net assetsfrom distributions | (2,118,835) | | (24,257) | | (144,216) | | (18,521) |
| BENEFICIAL INTEREST TRANSACTIONS (Note 5) | | | | |
| | Shares sold | | | | | | | | |
| | Investor Class | 29,935,397 | | 28,507,623 | | 28,553 | | 232,768 |
| | Class C | 1,305,593 | | 2,171,909 | | - | | - |
| | Institutional Class | 54,003,223 | | 16,440,096 | | 127,745 | | 853,949 |
| | Distributions reinvested | | | | | | |
| | Investor Class | 929,237 | | 5,805 | | 26,024 | | 2,978 |
| | Class C | 38,964 | | - | | - | | - |
| | Institutional Class | 567,280 | | 8,893 | | 118,108 | | 12,280 |
| | Shares redeemed | | | | | | | | |
| | Investor Class | (23,902,502) | | (12,887,434) | | (210,858) | | (14,134) |
| | Class C | (1,012,844) | | (466,156) | | - | | - |
| | Institutional Class | (9,679,422) | | (53,325) | | (764,301) | | - |
| | Increase (decrease) in netassets from beneficialinterest transactions | 52,184,926 | | 33,727,411 | | (674,729) | | 1,087,841 |
| NET ASSETS | | | | | | | | |
| | Increase (decrease) duringperiod | 48,833,362 | | 47,348,605 | | (832,888) | | 1,258,538 |
| | Beginning of period | 93,322,418 | | 45,973,813 | | 1,258,538 | | - |
| | End of period(includingundistributed net investmentincome (loss) of$104,525,$-, $- and $-,respectively) | $142,155,780 | | $93,322,418 | | $425,650 | | $1,258,538 |
| *Commencement of operations. |
| See Notes to Financial Statements |
DGHM ALL-CAP VALUE FUND FINANCIAL HIGHLIGHTS SELECTED PER SHARE DATA FOR A SHARE OUTSTANDING THROUGHOUT EACH PERIOD |
| | Investor Class Shares | |
| | | | | Year ended February 29, 2012 | | Year ended February 28, | Period June 20, 2007* to February 29, 2008 |
| | | | | 2011 | | 2010 | | 2009 | |
| | | | |
| Net asset value, beginning of period | | $ 11.60 | | $ 9.44 | | $ 6.26 | | $ 9.26 | | $ 10.00 | |
| Investment activities | | | | | | | | | | | |
| | Net investment income (loss) | | 0.08 | (C) | - | (B) (C) | 0.01 | | 0.02 | | 0.01 | |
| | Net realized and unrealized gain (loss) on investments | | (0.39) | | 2.16 | | 3.19 | | (3.01) | | (0.75) | |
| | Total from investment activities | | (0.31) | | 2.16 | | 3.20 | | (2.99) | | (0.74) | |
| Distributions | | | | | | | | | | | |
| | Net investment income | | (0.06) | | | | | | | | | |
| | Net realized gain | | (0.10) | | - | (B) | (0.02) | | (0.01) | | - | |
| | Total distributions | | (0.16) | | - | | (0.02) | | (0.01) | | - | |
| Net asset value, end of period | | $ 11.13 | | $ 11.60 | | $ 9.44 | | $ 6.26 | | $ 9.26 | |
| Total Return | | (2.56%) | | 22.89% | | 51.17% | | (32.26%) | | (7.40%) | *** |
| Ratios/Supplemental Data | | | | | | | | | | | |
| Ratio to average net assets | | | | | | | | | | | |
| | Expenses, net | | 1.30% | | 1.47% | | 1.71% | | 1.75% | (A) | 1.75% | **(A) |
| | Net investment income (loss) | | 0.74% | | 0.04% | | 0.19% | | 0.71% | (A) | 0.20% | **(A) |
| Portfolio turnover rate | | 49.53% | | 53.05% | | 101.89% | | 90.97% | | 80.71% | *** |
| Net assets, end of period (000's) | | $ 75,004 | | $ 71,124 | | $ 43,669 | | $ 32,223 | | $ 2,066 | |
*Commencement of operations | | | | | | | | | | | |
** Annualized | | | | | | | | | | | |
*** Not annualized | | | | | | | | | | | |
(A) Management fee waivers and reimbursement of expenses reduced the expense ratio and increased net investment income ratio by 0.72% for the year ended February 28, 2009 and by 6.77% for the period June 20, 2007 to February 29, 2008. The ratios reflect the effect of the management fee waivers and reimbursement of expenses. |
(B) Less than $0.01 per share. | | | | | | | | | | | |
(C) Per share amounts calculated using the average number of shares outstanding. | | | | | | | |
| | | | | | | | | | | | | | |
| See Notes to Financial Statements | | | | | | | | | | | |
FINANCIAL HIGHLIGHTS SELECTED PER SHARE DATA FOR A SHARE OUTSTANDING THROUGHOUT EACH PERIOD |
| | | | | Class C Shares |
| | | | | Year ended February 29, 2012 | Year ended February 28 | | Period June 20, 2007* to February 29, 2008 | |
| | 2011 | | 2010 | | 2009 | | |
| Net asset value, beginning of period | $ 11.36 | | $ 9.31 | | $ 6.20 | | $ 9.22 | | | $ 10.00 | |
| Investment activities | | | | | | | | | | | | |
| | Net investment income (loss) | | - | (B) (C) | (0.07) | (C) | (0.04) | | - | (B) | | (0.03) | |
| | Net realized and unrealized gain | | | | | | | | | | | | |
| | | (loss) on investments | | (0.39) | | 2.12 | | 3.15 | | (3.02) | | | (0.75) | |
| | Total from investment activities | | (0.39) | | 2.05 | | 3.11 | | (3.02) | | | (0.78) | |
| Distributions | | | | | | | | | | | | |
| | Net realized gain | | (0.10) | | - | | - | | - | | | - | |
| | Total distributions | | (0.10) | | - | | - | | - | | | - | |
| Net asset value, end of period | | $ 10.87 | | $ 11.36 | | $ 9.31 | | $ 6.20 | | | $ 9.22 | |
| Total Return | | (3.37%) | | 22.02% | | 50.16% | | (32.75%) | | | (7.80%) | *** |
| Ratios/Supplemental Data | | | | | | | | | | | | |
| Ratio to average net assets | | | | | | | | | | | | |
| | Expenses, net | | 2.08% | | 2.23% | | 2.46% | | 2.50% | (A) | | 2.50% | **(A) |
| | Net investment income (loss) | | (0.04%) | | (0.69%) | | (0.56%) | | (0.04%) | (A) | | (0.55%) | **(A) |
| Portfolio turnover rate | | 49.53% | | 53.05% | | 101.89% | | 90.97% | | | 80.71% | *** |
| Net assets, end of period (000's) | | $ 4,832 | | $ 4,713 | | $ 2,304 | | $ 1,446 | | | $ 2,038 | |
*Commencement of operations | | | | | | | | | | | | |
** Annualized | | | | | | | | | | | | |
*** Not annualized | | | | | | | | | | | | |
(A) Management fee waivers and reimbursement of expenses reduced the expense ratio and increased net investment income ratio by 0.72 % for the year ended February 28, 2009 and by 6.77% for the period June 20, 2007 to February 29, 2008. The ratios reflect the effect of the management fee waivers and reimbursement of expenses. |
(B) Less than $0.01 per share. | | | | | | | | | | | | |
(C) Per share amounts calculated using the average number of shares outstanding. |
| | | | | | | | | | | | | | | |
| See Notes to Financial Statements | | | | | | | | | | | | |
DGHM ALL-CAP VALUE FUND FINANCIAL HIGHLIGHTS SELECTED PER SHARE DATA FOR A SHARE OUTSTANDING THROUGHOUT EACH PERIOD |
| | | | Institutional Class Shares |
| | | | | Year ended February 29, 2012 | | | | Period July 19, 2010* to February 28, 2011 | |
| | | | | | | | |
| Net asset value, beginning of period | | $ 11.59 | | | | $ 9.33 | |
| Investment activities | | | | | | | |
| | Net investment income (loss) | | 0.11 | (A) | | | 0.03 | (A) |
| | Net realized and unrealized gain | | | | | | | |
| | | (loss) on investments | | (0.38) | | | | 2.26 | |
| | Total from investment activities | | (0.27) | | | | 2.29 | |
| Distributions | | | | | | | |
| | Net investment income | | (0.09) | | | | - | |
| | Net realized gain | | (0.10) | | | | (0.03) | |
| | Total distributions | | (0.19) | | | | (0.03) | |
| Net asset value, end of period | | $ 11.13 | | | | $ 11.59 | |
| Total Return | | (2.21%) | | | | 24.55% | *** |
| Ratios/Supplemental Data | | | | | | | |
| Ratio to average net assets | | | | | | | |
| | Expenses, net | | 1.01% | | | | 1.11% | ** |
| | Net investment income (loss) | | 1.03% | | | | 0.46% | ** |
| Portfolio turnover rate | | 49.53% | | | | 53.05% | *** |
| Net assets, end of period (000's) | | $ 62,319 | | | | $ 17,486 | |
| | | | | | | | | | |
* Commencement of operations | | �� | | | | | |
** Annualized | | | | | | | |
*** Not annualized | | | | | | | |
(A) Per share amounts calculated using the average number of shares outstanding. | | | | |
| See Notes to Financial Statements | | | | | | | |
DGHM V2000 SMALLCAP VALUE FUND FINANCIAL HIGHLIGHTS SELECTED PER SHARE DATA FOR A SHARE OUTSTANDING THROUGHOUT THE PERIOD |
| | | | Investor Class Shares |
| | | | | Year ended February 29, 2012 | | | | Period June 30, 2010* to February 28, 2011 | |
| | | | | | | | |
| Net asset value, beginning of period | | $ 12.92 | | | | $ 10.00 | |
| Investment activities | | | | | | | |
| | Net investment income (loss) | | (0.05) | (A) | | | - | (A)(B) |
| | Net realized and unrealized gain | | | | | | | |
| | | (loss) on investments | | (0.74) | | | | 3.10 | |
| | Total from investment activities | | (0.79) | | | | 3.10 | |
| Distributions | | | | | | | |
| | Net investment income | | (0.48) | | | | - | |
| | Realized gains | | (3.90) | | | | (0.18) | |
| | Total distributions | | (4.38) | | | | (0.18) | |
| Net asset value, end of period | | $ 7.75 | | | | $ 12.92 | |
| Total Return | | (3.43%) | | | | 31.05% | *** |
| Ratios/Supplemental Data | | | | | | | |
| Ratio to average net assets | | | | | | | |
| | Expenses, gross | | 29.98% | | | | 15.71% | ** |
| | Expenses, net | | 1.90% | | | | 1.90% | ** |
| | Net investment income (loss) | | (0.40)% | | | | 0.07% | ** |
| Portfolio turnover rate | | 58.38% | | | | 33.60% | *** |
| Net assets, end of period (000's) | | $ 75 | | | | $ 260 | |
| | | | | | | | | | |
*Commencement of operations | | | | | | | |
** Annualized | | | | | | | |
*** Not annualized | | | | | | | |
| | | | | | | | | | | | |
(A) Per share amounts calculated using the average number of shares outstanding. | | | | |
(B) Less than $0.01 per share. | | | | | | | |
| See Notes to Financial Statements | | | | | | | |
DGHM V2000 SMALLCAP VALUE FUND FINANCIAL HIGHLIGHTS SELECTED PER SHARE DATA FOR A SHARE OUTSTANDING THROUGHOUT THE PERIOD |
| | Institutional Class Shares |
| | Year ended February 29, 2012 | | | Period June 30, 2010* to February 28, 2011 | |
| Net asset value, beginning of period | | $ 13.01 | | | $ 10.00 | |
| Investment activities | | | | | | |
| | Net investment income (loss) | | ( 0.02) | (A) | | 0.02 | (A) |
| | Net realized and unrealized gain | | | | | | |
| | | (loss) on investments | | (0.75) | | | 3.20 | |
| | Total from investment activities | | (0.77) | | | 3.22 | |
| Distributions | | | | | | |
| | Net investment income | | (0.33) | | | (0.03) | |
| | Realized gains | | (3.90) | | | (0.18) | |
| | Total distributions | | (4.23) | | | (0.21) | |
| Net asset value, end of period | | $ 8.01 | | | $ 13.01 | |
| Total Return | | (3.34%) | | | 32.24% | *** |
| Ratios/Supplemental Data | | | | | | |
| Ratio to average net assets | | | | | | |
| | Expenses, gross | | 29.82% | | | 15.46% | ** |
| | Expenses, net | | 1.65% | | | 1.65% | ** |
| | Net investment income (loss) | | (0.15)% | | | 0.32% | ** |
| Portfolio turnover rate | | 58.38% | | | 33.60% | *** |
| Net assets, end of period (000's) | | $ 351 | | | $ 998 | |
* Commencement of operations | | | | | | |
** Annualized | | | | | | |
*** Not annualized | | | | | | |
(A) Per share amounts calculated using the average number of shares outstanding. | | | | | | |
| See Notes to Financial Statements | | | | | | |
DGHM INVESTMENT TRUST
NOTES TO FINANCIAL STATEMENTS
February 29, 2012
NOTE 1-ORGANIZATION AND SIGNIFICANT ACCOUNTING POLICIES
The DGHM All-Cap Value Fund and the DGHM V2000 SmallCap Value Fund (the "Funds") are series of the DGHM Investment Trust (the "Trust"). The Trust was organized as a Delaware statutory trust and is registered under the Investment Company Act of 1940, as amended (the “1940 Act”), as a diversified open-end management company. The DGHM All-Cap Value (“All-Cap Fund”) and DGHM V2000 SmallCap Value (“SmallCap Fund”) Funds commenced operations on June 20, 2007 and June 30, 2010, respectively.
The investment objectives of the Funds are to provide long-term capital appreciation through investments that Dalton, Greiner, Hartman, Maher & Co., LLC, the Funds’ investment advisor (“Advisor”), believes are undervalued.
The following is a summary of significant accounting policies consistently followed by the Funds. The policies are in conformity with accounting principles generally accepted in the United States of America (“GAAP”).
Security Valuation
The Funds’ securities are valued at current market prices. Investments traded on a principal exchange (U.S. or foreign) or included in the NASDAQ National Market System are valued at the last reported sales price on the exchange on which the securities are traded as of the close of business on the last day of the period or, lacking any sales, at the last available bid price. In cases where securities are traded on more than one exchange, the securities are valued on the exchange designated by or under the authority of the Funds’ Board of Trustees (the “Trustees”). Short-term debt securities (less than 60 days to maturity) are valued at their fair market value using amortized cost. Securities traded in the over-the-counter market are valued at the last available sale price in the over-the-counter market prior to time of valuation. Securities traded in the over-the-counter market and listed securities for which no sale was reported on that date are valued at the most recent bid price. Securities for which market quotations are not readily available are valued on a consistent basis at fair value as determined in good faith under procedures approved by the Funds’ Trustees. Fair value pricing may be used, for example, in situations where (i) a portfolio security is so thinly traded that there have been no transactions for that security over an extended period of time; (ii) the exchange on which the portfolio security is principally traded closes early; or (iii) trading of the portfolio security is halted during the day and does not resume prior to the Fund’s net asset value calculation. A portfolio security’s “fair value” price may differ from the price next available for that portfolio security using the Funds’ normal pricing procedures. Investment companies are valued at net asset value. If values of foreign securities have been materially affected by events occurring after the close of a foreign market, foreign securities may be valued by another method that the Trustees believe reflects fair value. Generally, trading in corporate bonds, U.S. government securities and money market instruments is substantially completed each day at various times before the scheduled close of the New York Stock Exchange. The value of these securities used in computing the Funds’ net asset value is determined as of such times.
In accordance with GAAP, “fair value” is defined as the price that a fund would receive upon selling an investment in an orderly transaction to an independent buyer in the principal or most advantageous market for the investment. Various inputs are used in determining the value of a fund’s investments. GAAP established a three-tier hierarchy of inputs to establish a classification of fair value measurements for disclosure purposes. Level 1 includes quoted prices in active markets for identical securities. Level 2 includes other significant observable market-based inputs (including quoted prices for similar securities, interest rates, prepayment speeds, credit risk, etc.). Level 3 includes significant unobservable inputs (including the Fund’s own assumptions in determining fair value of investments).
The inputs or methodology used for valuing securities are not necessarily an indication of the risk associated with investing in those securities.
The following is a summary of the inputs used to value the Funds’ investments as of February 29, 2012:
| | Level 1 Quoted Prices | Level 2 Other Significant Observable Inputs | Level 3 Significant Unobservable Inputs | Total |
| All-Cap Fund | | | | |
| Common Stocks | $135,799,674 | $ - | $ - | $135,799,674 |
InvestmentCompanies | 6,225,789 | - | - | 6,225,789 |
| | $142,025,463 | $ - | $ - | $142,025,463 |
| | | | | |
| SmallCap Fund | | | | |
| Common Stocks | $384,226 | $ - | $ - | $384,226 |
InvestmentCompanies | 34,686 | - | - | 34,686 |
| | $418,912 | $ - | $ - | $418,912 |
Refer to the Funds’ Schedules of Investments for a listing of securities by security type and industry. The Funds held no Level 3 securities at any time during the period. There were no transfers between levels during the year ended February 29, 2012.
Security Transactions and Income
Security transactions are accounted for on the trade date. The cost of securities sold is determined generally on a specific identification basis. Dividends are recorded on the ex-dividend date. Interest income is recorded on an accrual basis and includes accretion of discounts and amortization of premiums.
Cash and Cash Equivalents
Cash and cash equivalents, if any, consist of overnight deposits with the custodian bank which earn interest at the current market rate.
Accounting Estimates
In preparing financial statements in conformity with GAAP, management makes estimates and assumptions that affect the reported amounts of assets and liabilities and disclosure of contingent assets and liabilities at the date of the financial statements, and the reported amounts of increases and decreases in the net assets during the reporting period. Actual results could differ from those estimates.
Federal Income Taxes
The Funds intend to comply with the requirements of the Internal Revenue Code applicable to regulated investment companies and to distribute all of its taxable income to its shareholders. The Funds also intend to distribute sufficient net investment income and net capital gains, if any, so that they will not be subject to excise tax on undistributed income and gains. Therefore, no federal income tax or excise tax provision is required.
The Funds recognize tax benefits on certain tax positions only where the position is “more likely than not” to be sustained assuming investigation from tax authorities. Management has reviewed the Funds’ tax positions and has concluded that no liability for unrecognized tax benefits should be recorded related to uncertain tax positions expected to be taken in the Funds’ 2012 tax returns. The Funds have no examinations in progress and management is not aware of any tax positions for which it is reasonably possible that the total amounts of unrecognized tax benefits will significantly change in the next twelve months. The All-Cap Fund’s Federal tax returns filed in the three-year period ended February 29, 2012 and the SmallCap Fund’s Federal tax return for the period ended February 28, 2011 remain subject to examination by the Internal Revenue Service. Interest and penalties, if any, associated with any federal or state income tax obligations, are recorded as income tax expense.
Reclassification of Capital Accounts
GAAP requires that certain components of net assets relating to permanent differences be reclassified between financial and tax reporting. These reclassifications have no effect on net assets or net asset value per share. As of February 29, 2012, there were no such reclassifications in the All-Cap Fund and the SmallCap Fund decreased net investment loss by $1,085, decreased accumulated net realized gain by $11,626 and increased paid in capital by $10,541.
Class Net Asset Values and Expenses
Each Fund can offer three classes of shares: Investor Shares, Class C and Institutional Class shares. Each class of shares has equal rights as to assets of the Funds, and the classes are identical except for differences in their sales charge structures, ongoing distribution and service fees, shareholder servicing and reports fees and transfer agent fees. Income, expenses (other than distribution and service fees, shareholder servicing and reports fees and transfer agent fees), and realized and unrealized gains or losses on investments are allocated to each class of shares based upon its relative net assets. All classes have equal voting privileges, except where otherwise required by law or when the Board of Trustees determines that the matter to be voted on affects only the interests of the shareholders of a particular class. The Class C shares are subject to a 1% contingent deferred sales charge on proceeds that are redeemed within one year of the purchase date. The contingent deferred sales charge is payable to the Distributor of the Trust. Class C shares automatically convert into Investor Shares after seven years. As of February 29, 2012, there were no Class C shares of SmallCap Fund outstanding.
NOTE 2-INVESTMENT ADVISORY AND DISTRIBUTION AGREEMENTS AND OTHER TRANSACTIONS WITH AFFILIATES
Pursuant to Investment Advisory Agreements, the Advisor provides investment advisory services for an annual fee of 0.65% on the average daily net assets of the All-Cap Fund and 0.80% on the average daily net assets of the SmallCap Fund. For the year ended February 29, 2012, the Advisor earned $787,705 in advisory fees from the All-Cap Fund. As of February 29, 2012, the Advisor was due $73,193 from the All-Cap Fund. For the year ended February 29, 2012, the Advisor earned and waived $3,945 in advisory fees from the SmallCap Fund.
In the interest of limiting the operating expenses of the Funds, the Advisor has contractually agreed to waive or reduce its fees and to assume other expenses of the Funds through June 30, 2012, if necessary, in amounts that limit the Funds’ total operating expenses to 1.50% and 1.65% of average daily net assets of the All-Cap Fund and the SmallCap Fund, respectively. The limit does not apply to interest, taxes, brokerage commissions, other expenditures capitalized in accordance with GAAP, other extraordinary expenses not incurred in the ordinary course of the Fund’s business, dividend expense on short sales and amounts, if any, payable pursuant to a plan adopted in accordance with Rule 12b-1 of the 1940 Act. In determining each Fund’s total operating expenses, expenses that the Fund would have incurred but did not actually pay because of expense offset or brokerage/services arrangements shall be added to the aggregate expenses so as not to benefit the Advisor. Additionally, fees reimbursed to the Funds relating to brokerage/services arrangements shall not be taken into account in determining the Funds’ total operating expenses so as to benefit the Advisor. Finally, these expense limitation arrangements exclude any “acquired fund fees and expenses” as that term is described in the prospectus of the Funds. In addition, the Advisor may be entitled to reimbursement of fees waived or remitted by the Advisor to the Funds after March 1, 2009. The total amount of reimbursement shall be the sum of all fees previously waived or reduced by the Advisor and all other payments remitted by the Advisor to the Funds during any of the previous three fiscal years (beginning March 1, 2009), less any reimbursement previously paid by the Funds to the Advisor with respect to such waivers, reductions and payments. Amounts reimbursed may not cause the Funds to exceed expense limits that were in place at the time such fees and expenses were waived and/or reimbursed. As of February 29, 2012, there were no fee waivers or reimbursements eligible for reimbursement to the Advisor pertaining to the All-Cap Fund. For the year ended February 29, 2012, the Advisor earned and waived $3,945 in advisory fees and reimbursed expenses of $134,862 for the SmallCap Fund. At February 29, 2012, the SmallCap Fund was due $14,095 from the Advisor. The total amount of recoverable reimbursements as of February 29, 2012 was $214,570 and expires as follows:
2014 $ 75,763
2015 138,807
$214,570
The Funds have adopted plans of distribution in accordance with Rule 12b-1 under the 1940 Act (each a “Plan” and collectively, the “Plans”). Pursuant to the Plans, the Funds compensate the Funds’ principal underwriter for services rendered and expenses borne in connection with activities primarily intended to result in the sale of the Funds’ shares. The Plans provide that the Funds will pay the annual rate of up to 0.25% of the average daily net assets of the Funds’ Investor Shares and up to 1.00% of the average daily net assets of the Funds’ Class C Shares for activities primarily intended to result in the sale of those shares. These activities include reimbursement to entities for providing distribution and shareholder servicing with respect to the Funds’ shares. The 0.25% fee for the Investor Shares is a service fee. The 1.00% fee for the Class C Shares is comprised of a 0.25% service fee and a 0.75% distribution fee. The All-Cap Fund incurred $181,189 and $46,756, in 12b-1 fees under the Plans with respect to Investor Shares and Class C Shares, respectively, for the year ended February 29, 2012. The SmallCap Fund incurred $329 in 12b-1 fees under the Plans with respect to Investor Shares for the year ended February 29, 2012.
First Dominion Capital Corporation (the “FDCC”) acts as the Funds’ principal underwriter and distributor. For the year ended February 29, 2012, FDCC received no commissions or underwriting fees from the sale of the Funds’ shares. In addition, FDCC receives a contingent deferred sales charge (“CDSC”) of 1% of Class C share redemptions occurring within one year of purchase. Shares redeemed subject to a CDSC will receive a lower redemption value per share. For the year ended February 29, 2012, FDCC received $2,953 in CDSC fees.
Commonwealth Shareholder Services, Inc. (“CSS”) provides shareholder, recordkeeping, administrative and blue-sky filing services as the administrative agent for the Funds. For such administrative services, CSS receives 0.10% per annum of average daily net assets of the Funds on the first $75 million and 0.07% per annum of the average daily net assets over $75 million subject to a $20,000 minimum per year. For the year ended February 29, 2012, CSS earned $107,344 for its services and at February 29, 2012, was due $4,367 from the All-Cap Fund. For the year ended February 29, 2012, CSS earned $20,000 for its services and at February 29, 2012, was due $766 from the SmallCap Fund.
Commonwealth Fund Services, Inc. (“CFSI”) is the Funds’ transfer and dividend disbursing agent. For such services, CFSI receives the greater of a basis point charge or a per-account charge, subject to a $15,000 minimum per year. CFSI earned $62,099 for its services for the year ended February 29, 2012 and at February 29, 2012, was due $4,367 from the All-Cap Fund. CFSI earned $15,000 for its services for the year ended February 29, 2012 and at February 29, 2012, was due $623 from the SmallCap Fund.
Commonwealth Fund Accounting (“CFA”) is the Funds’ pricing agent. CFA earned $60,593 for its services for the year ended February 29, 2012 and at February 29, 2012, was due $2,700 from the All-Cap Fund. CFA earned $20,000 for its services for the year ended February 29, 2012 and at February 29, 2012, was due $661 from the SmallCap Fund.
One Trustee and officers of the Trust are also officers of the Advisor. One officer of the Fund is also an officer and/or director of FDCC, CSS, CFA and CFSI.
NOTE 3 - INVESTMENTS
The cost of purchases and proceeds from the sales of securities other than short-term notes for the year ended February 29, 2012, were $106,485,429 and $58,508,532, respectively for the All-Cap Fund. The cost of purchases and proceeds from the sales of securities other than short-term notes for the year ended February 29, 2012, were $281,441 and $1,094,978, respectively for the SmallCap Fund.
NOTE 4 – DISTRIBUTIONS TO SHAREHOLDERS AND TAX COMPONENTS OF CAPITAL
Distributions from net investment income and realized gains, if any, are recorded on the ex-dividend date. Income distributions and capital gain distributions are determined in accordance with income tax regulations, which may differ from GAAP.
The tax character of distributions during the year ended February 29, 2012 and the year or period ended February 28, 2011 were as follows:
| | | All-Cap Fund | | SmallCap Fund |
| | | Year Ended February 29, 2012 | | Year ended February 28, 2011 | | Year Ended February 29, 2012 | | June 30, 2010* to February 28, 2011 |
| Distributions paid from: | | | | | | | | |
| Ordinary income | $ 884,252 | | $24,257 | | $142,707 | | $18,521 |
| Capital gains | 1,234,583 | | - | | 1,509 | | - |
| | | $2,118,835 | | $24,257 | | $144,216 | | $18,521 |
* commencement of operations
As of February 29, 2012, the components of distributable earnings on a tax basis were as follows:
| | All-Cap Fund | | SmallCap Fund |
Accumulated net investment income(loss) | $ 104,525 | | $ - |
Accumulated net realized gain (loss) on investments | 112,218 | | - |
| Post October 31 capital losses | (767,586) | | (2,509) |
Unrealized appreciation (depreciation) | 11,364,673 | | 17,277 |
| | $ 10,813,830 | | $ 14,768 |
Cost of securities for Federal Income tax purpose is $130,660,790 for All-Cap Fund and $401,635 for SmallCap Fund and the related tax-based net unrealized appreciation (depreciation) consists of:
| | All-Cap Fund | | SmallCap Fund |
| | | | |
| Gross unrealized appreciation | $ 13,423,430 | | $ 33,621 |
| Gross unrealized depreciation | (2,058,757) | | (18,853) |
Net unrealized appreciation (depreciation) | $ 11,364,673 | | $ 14,768 |
| | | | |
NOTE 5 –TRANSACTIONS IN SHARES OF BENEFCIAL INTEREST
Shares of beneficial interest transactions for the Funds were:
| | All-Cap Fund |
| | Year ended February 29, 2012 |
| | Investor Class | | Class C | | Institutional Class |
| | Shares | Amount | | Shares | Amount | | Shares | Amount |
| Shares sold | 2,748,851 | $29,935,397 | | 120,055 | $1,305,593 | | 4,959,749 | $54,003,223 |
| Shares reinvested | 90,632 | 929,237 | | 3,889 | 38,964 | | 55,398 | 567,280 |
| Shares redeemed | (2,232,458) | (23,902,502) | | (94,370) | (1,012,844) | | (922,865) | (9,679,422) |
| Net increase (decrease) | 607,025 | $6,962,132 | | 29,574 | $331,713 | | 4,092,282 | $44,891,081 |
| | All-Cap Fund |
| | Year ended February 28, 2011 | | Period July 19, 2010* to February 28, 2011 |
| | Investor Class | | Class C | | Institutional Class |
| | Shares | Amount | | Shares | Amount | | Shares | Amount |
| Shares sold | 2,753,934 | $28,507,623 | | 213,812 | $2,171,909 | | 1,512,293 | $16,440,096 |
| Shares reinvested | 529 | 5,805 | | - | - | | 773 | 8,893 |
| Shares redeemed | (1,252,746) | (12,887,434) | | (46,505) | (466,156) | | (4,862) | (53,325) |
| Net increase (decrease) | 1,501,717 | $15,625,994 | | 167,307 | $1,705,753 | | 1,508,204 | $16,395,664 |
*Commencement of operations.
| | SmallCap Fund |
| | Year ended February 29, 2012 |
| | Investor Class | | Institutional Class |
| | Shares | Amount | | Shares | Amount |
| Shares sold | 2,379 | $ 28,553 | | 9,834 | $ 127,745 |
| Shares reinvested | 3,620 | 26,024 | | 15,896 | 118,108 |
| Shares redeemed | (16,486) | (210,858) | | (58,665) | (764,301) |
| Net increase (decrease) | (10,487) | $ (156,279) | | (32,935) | $ (518,448) |
| | SmallCap Fund |
| | Period June 30, 2010* to February 28, 2011 |
| | Investor Class | | Institutional Class |
| | Shares | Amount | | Shares | Amount |
| Shares sold | 21,029 | $ 232,768 | | 75,769 | $ 853,949 |
| Shares reinvested | 237 | 2,978 | | 971 | 12,280 |
| Shares redeemed | (1,113) | (14,134) | | - | - |
| Net increase (decrease) | 20,153 | $ 221,612 | | 76,740 | $ 866,229 |
*Commencement of operations.
NOTE 6 – COMMITMENTS AND CONTINGENCIES
Under the Trust’s organizational documents, its officers and Trustees are indemnified against certain liabilities arising out of the performance of their duties to the Funds. In addition, in the normal course of business, the Trust entered into contracts with its vendors, on behalf of the Funds, and others that provide for general indemnifications. The Funds’ maximum exposure under these arrangements is unknown, as this would involve future claims that may be made against the Funds. The Funds expect that risk of loss to be remote.
NOTE 7 – RECENTLY ISSUED ACCOUNTING PRONOUNCEMENTS
In May 2011, the Financial Accounting Standards Board (“FASB”) issued Accounting Standards Update (“ASU”) No. 2011-04, “Fair Value Measurement (Topic 820): Amendments to Achieve Common Fair Value Measurement and Disclosure Requirements in U.S GAAP and International Financial Reporting Standards (“IFRS”). ASU No. 2011-04 clarifies existing requirements for measuring fair value and for disclosure about fair value measurements in converged guidance of the FASB and the International Accounting Standards Board. The Amendments are to be applied prospectively. The amendments are effective during interim and annual periods beginning after December 15, 2011. Early application by public entities is not permitted. Management is currently evaluating the impact ASU No. 2011-04 will have on the financial statement disclosures.
In December 2011, FASB issued ASU No. 2011-11 related to disclosures about offsetting assets and liabilities. The amendments in this ASU require an entity to disclose information about offsetting and related arrangements to enable users of its financial statements to understand the effect of those arrangements on its financial position. The ASU is effective for annual reporting periods beginning on or after January 1, 2013, and interim periods within those annual periods. The guidance requires retrospective application for all comparative periods presented. Management is currently evaluating the impact ASU 2011-11 will have on the financial statement disclosures.
NOTE 8 - SUBSEQUENT EVENTS
Management has evaluated all transactions and events subsequent to the date of the balance sheet through the date these financial statements were issued. Except as already included in the notes to these financial statements, no additional items require disclosure.
REPORT OF INDEPENDENT REGISTERED PUBLIC ACCOUNTING FIRM
To the Board of Trustees of DGHM Investment Trust
and the Shareholders of DGHM All-Cap Value Fund
and DGHM V2000 SmallCap Value Fund
We have audited the accompanying statements of assets and liabilities of DGHM All-Cap Value Fund and DGHM V2000 SmallCap Fund, each a series of shares of the DGHM Investment Trust, including the schedules of investments, as of February 29, 2012, and the related statements of operations for the year then ended, the statements of changes in net assets for each of the years or period in the two year period then ended and the financial highlights for each of the years or period in the four year period then ended and for the period from June 20, 2007 (commencement of operations of DGHM All-Cap Value Fund) through February 29, 2008. These financial statements and financial highlights are the responsibility of the Funds’ management. Our responsibility is to express an opinion on these financial statements and financial highlights based on our audits.
We conducted our audits in accordance with the standards of the Public Company Accounting Oversight Board (United States). Those standards require that we plan and perform the audits to obtain reasonable assurance about whether the financial statements and financial highlights are free of material misstatement. An audit includes examining, on a test basis, evidence supporting the amounts and disclosures in the financial statements. Our procedures included confirmation of securities owned as of February 29, 2012 by correspondence with the custodian and brokers. An audit also includes assessing the accounting principles used and significant estimates made by management, as well as evaluating the overall financial statement presentation. We believe that our audits provide a reasonable basis for our opinion.
In our opinion, the financial statements and financial highlights referred to above present fairly, in all material respects, the financial position of DGHM All-Cap Value Fund and DGHM V2000 SmallCap Value Fund as of February 29, 2012, the results of their operations for the year then ended, and the changes in their net assets and their financial highlights for each of the years or periods presented, in conformity with accounting principles generally accepted in the United States of America.
.
BBD, LLP
Philadelphia, Pennsylvania
April 24, 2012
SUPPLEMENTAL INFORMATION (unaudited)
DGHM Investment Trust (the “Trust”)
[Missing Graphic Reference]
| Information pertaining to the Trustees and officers of the Trust is set forth below. The names, addresses and age of the Trustees and officers of the Trust, together with information as to their principal occupations during the past five years, are listed below. The Trustee who is considered an “interested person” as defined in Section 2(a)(19) of the 1940 Act, as well as those persons affiliated with the investment advisor and the principal underwriter, and officers of the Trust, are noted with an asterisk (*). The Statement of Additional Information (the “SAI”) includes additional information about the Trustees and the officer and is available without charge, upon request by calling, toll-free, (800) 773-3863. The address of each trustee and officer of the Trust, unless otherwise indicated, is 8730 Stony Point Parkway, Suite 205, Richmond, Virginia 23235. |
| | | | | |
| Name, Address and Age | Position(s) Held with Trust and Tenure | Number of Funds in Trust Overseen | Principal Occupation(s) During the Past Five (5) Years | Other Directorships by Trustees and Number of Funds in the Complex Overseen |
| Interested Trustees: |
Jeffrey C. Baker* 565 Fifth Avenue Suite 2101 New York, NY 10017 46 | Trustee, President, and Principal Executive Officer since 04/07 | 2 | Executive Vice President, Dalton, Greiner, Hartman, Maher & Co., LLC (investment advisor to the Funds) since 2005; previously, Senior Vice President, Dalton, Greiner, Hartman, Maher & Co., LLC, 2002 to 2005; and Vice President, Dalton, Greiner, Hartman, Maher & Co., LLC, 2000 to 2002. | None |
| Independent Trustees: |
Jack E. Brinson 80 | Trustee since 04/07 | 2 | Retired since January 2000; previously, President, Brinson Investment Co. (personal investments) and President, Brinson Chevrolet, Inc. (auto dealership). | Independent Trustee of Gardner Lewis Investment Trust for the two series of that trust; Brown Capital Management Mutual Funds for the thee series of that trust; Hillman Capital Management Investment Trust for the two series of that trust; Tilson Investment Trust for the two series of that trust; Starboard Investment Trust for the ten series of that trust; and, Giordano Investment Trust for the one series of that trust; (all registered investment companies). |
Theo H. Pitt, Jr. 76 | Trustee and Chairman since 04/07 | 2 | Senior Partner, Community Financial Institutions Consulting (bank consulting) since 1997 and Account Administrator, Holden Wealth Management Group of Wachovia Securities (money management firm) from 2003 to 2008. | Independent Trustee of Gardner Lewis Investment Trust for the two series of that trust; and Starboard Investment Trust for the ten series of that trust; (all registered investment companies). |
| Officers: |
Thomas F. Gibson 565 Fifth Avenue Suite 2101 New York, NY 10017 48 | Treasurer and Principal Financial Officer since 04/07 | N/A | Vice President, Chief Financial Officer, and Chief Compliance Officer, Dalton, Greiner, Hartman, Maher & Co., LLC since 2005; previously, Chief Financial Officer and Chief Compliance Officer, Bingham Legg Advisers, LLC, 1999 to 2005. | N/A |
Lauren Jones 30 | Assistant Secretary since 12/09 | N/A | Relationship Manager, Commonwealth Shareholder Services since 2006; previously, Account Manager, Insider NYC, an event planning firm, from 2004 to 2005 | N/A |
Karen Shupe 48 | Secretary and Assistant Treasurer since 11/08 | N/A | Executive Vice President, Commonwealth Shareholder Services, Inc., since 2003; previously, Financial Reporting Manager, Commonwealth Shareholder Services, Inc., 2001 to 2003. | N/A |
Julian Winters 43 | Chief Compliance Officer since 11/08 | NA | Managing Member of Watermark Solutions (investment compliance and consulting) since March 2007; previously, Vice-President – Compliance Administration, the Nottingham Company (investment company administrator and fund accountant) 1998 to 2007 | N/A |
SUPPLEMENTAL INFORMATION (unaudited)
VOTING PROXIES ON FUND PORTFOLIO SECURITIES
A copy of the Trust’s Proxy Voting and Disclosure Policy and the Advisor’s Proxy Voting and Disclosure Policy are included as Appendix B to the Funds’ Statement of Additional Information and is available, without charge, (1) upon request, by calling 1-800-653-2839 and (2) on the SEC’s website at http://www.sec.gov. Information regarding how the Funds voted proxies relating to portfolio securities during the most recent 12-month period ended June 30 is available without charge, (1) upon request, by calling the Funds at the number above and (2) on the SEC’s website at http://www.sec.gov.
QUARTERLY PORTFOLIO HOLDINGS
The Funds file with the SEC a complete schedule of their portfolio holdings, as of the close of the first and third quarters of its fiscal year, on “Form N-Q”. These filings are available on the SEC’s website at www.sec.gov. The Funds’ Forms N-Q may be reviewed and copied at the SEC’s Public Reference Room in Washington, D.C. Information on the operation of the Public Reference Room may be obtained by calling 1-800-SEC-0330.
APPROVAL OF THE RENEWAL OF INVESTMENT ADVISORY AGREEMENTS
Dalton, Greiner, Hartman, Maher & Co., LLC (the “Advisor”) supervises the investments of the DGHM All-Cap Value Fund and DGHM SmallCap Value Fund (the “Funds”), each a series portfolio of the DGHM Investment Trust (the “Trust”), pursuant to an Investment Advisory Agreement (the “Agreement”) between the Advisor and the Trust with respect to the Funds. At the quarterly meeting of the Board of Trustees of the Trust (the “Board” or “Trustees”) that was held on February 15, 2012, the Trustees, including a majority of the Trustees who are not parties to the Agreement or “interested persons” of any such party as such term is defined under the Investment Company Act of 1940, as amended (the “Independent Trustees”), voting separately, unanimously approved the renewal of the Agreement for a one-year period from March 1, 2012 until February 28, 2013, under the terms and for the compensation described therein.
In considering whether to approve the Advisory Agreement, the Trustees reviewed and considered such information as they deemed reasonably necessary, including the following material factors: (i) the nature, extent, and quality of the services provided by the Advisor; (ii) the investment performance of the Funds; (iii) the costs of the services to be provided and profits to be realized by the Advisor from the relationship with the Funds; (iv) the extent to which economies of scale would be realized as the Funds grow and whether advisory fee levels reflect those economies of scale for the benefit of the Funds’ investors; (v) the Advisor’s practices regarding brokerage and portfolio transactions; and (vi) the Advisor’s practices regarding possible conflicts of interest.
In assessing the factors described above and reaching its decision, the Board took into consideration information furnished for the Board’s review and consideration throughout the year at regular Board meetings, as well as information specifically prepared and/or presented in connection with the annual renewal process. At the meeting, the Trustees reviewed various informational materials including, without limitation, copies of the Agreement and proposed Expense Limitation Agreements between the Advisor and the Trust with respect to the Funds (the “Expense Limitation Agreements”); materials provided by the Advisor to the Trustees containing information about the Advisor, its business, its finances, its personnel, its services to the Funds, and comparative performance and expense ratio information for other mutual funds with strategies similar to the Funds; and a memorandum from Fund Counsel that summarized the fiduciary duties and responsibilities of the Board in reviewing and approving the Agreement, including the types of information and factors that should be considered in order to make an informed decision.
Provided below is an overview of the factors the Board considered at its Meeting. The Board did not identify any particular information that was most relevant to its consideration to approve the Agreement and each Trustee may have afforded different weight to the various factors.
1. Nature, Extent and Quality of the Services Provided by the Advisor.
In considering the nature, extent, and quality of the services provided by the Advisor, the Trustees reviewed the responsibilities of the Advisor under the Agreement. The Trustees reviewed the services being provided by the Advisor to the Funds including, without limitation, the quality of its investment advisory services (including research and recommendations with respect to portfolio securities); the Advisor’s procedures for formulating investment recommendations and assuring compliance with the Funds’ investment objectives and limitations, as well as for ensuring compliance with regulatory requirements; its coordination of services for the Funds among the Funds’ service providers and the Independent Trustees; and its efforts to promote the Funds, grow the Funds’ assets, and assist in the distribution of Funds’ shares. In particular, the Trustees recognized the extensive marketing efforts of the Advisor relating to the SmallCap Fund. The Trustees considered the Advisor’s personnel, including the education and experience of the Advisor’s personnel. The Trustees noted that several of the officers of the Trust, including the principal executive officer and principal financial officer for the Trust were employees of the Advisor, and they served the Trust without additional compensation. After reviewing the foregoing information and further information in the Advisor’s memorandum (e.g., descriptions of the Advisor’s business, the Advisor’s compliance programs, and the Advisor’s Form ADV), the Board of Trustees concluded that, in light of all the facts and circumstances, the quality, extent, and nature of the services to be provided by the Advisor were satisfactory and adequate for the Funds.
2. Investment Performance of the Fund and the Advisor.
In considering the investment performance of the Funds and the Advisor, the Trustees compared the performance of the Funds for various periods during each Fund’s existence with the performance of the Funds’ respective benchmarks – the Russell 3000 Value Index for the All-Cap Fund and the Russell 2000 Value Index for the SmallCap Fund. The Trustees also considered the consistency of the Advisor’s management of the Funds with the investment objectives and policies. The Trustees noted that the All-Cap Fund underperformed its benchmark index in the short term and outperformed its benchmark index in the longer term. The Trustees noted that the SmallCap Fund underperformed its benchmark index in the short term and trackted its index fairly closely in the longer term. The Trustees noted that the Funds compared favorably to their peer group averages. The Trustees also considered the Funds’ performance relative to other accounts managed by the Advisor, all of which are managed in the same manner as the Funds. The Trustees noted that each Fund’s year-to-date performance was generally comparable to the performance of other accounts managed by the Advisor. After reviewing and discussing the performance of the Funds further, the Advisor’s experience managing the Funds, the Advisor’s historical investment performance, and other relevant factors, the Board concluded, in light of all the facts and circumstances, that the investment performance of the Funds and the Advisor was satisfactory.
3. Costs of the Services to be Provided and Profits to be Realized by the Advisor.
In considering the costs of the services to be provided and profits to be realized by the Advisor and its affiliates from the relationship with the Funds, the Trustees considered the Advisor’s staffing, personnel, and methods of operating; the financial condition of the Advisor and the level of commitment to the Funds by the Advisor and its principals; the asset levels of the Funds; and the overall expenses of the Funds, including the nature and frequency of advisory fee payments. The Trustees considered financial statements of the Advisor and discussed the financial stability and productivity of the firm. The Trustees also considered potential benefits for the Advisor in managing the Funds, including the potential for the Advisor to generate soft dollars from the Funds’ trades that may benefit the Advisor’s other clients. The Trustees considered the fees and expenses of the Funds (including the management fee) to other funds comparable in terms of the type of fund, the nature of its investment strategy, its style of investment management, and its size, among other factors. The Board determined that the Funds’ expenses, including the management fee, were higher than some of the comparable funds and lower than others, but recognized the Advisor’s commitment to working to reduce the expense ratio of the Funds (even though the All-Cap Fund was currently operating beneath its expense cap limitation). The Trustees also considered the Advisor’s efforts in securing fee concessions from certain of the service providers of the SmallCap Fund while the Advisor focused on increasing asset levels of the Fund. Based on the foregoing, the Board concluded that the fees to be paid to the Advisor by the Funds, the costs of the services to be provided, and the profits that may be realized by the Advisor, in light of all the facts and circumstances, were fair and reasonable in relation to the nature and quality of the services provided by the Advisor.
4. Economies of Scale.
In considering the extent to which economies of scale would be realized as the Funds grow and whether advisory fee levels reflect those economies of scale for the benefit of the Funds’ investors, the Trustees considered the Funds’ fee arrangements with the Advisor. The Trustees determined that although the management fee would stay the same as asset levels increased, the shareholders of the Funds would benefit from the expense limitation arrangement if, among other reasons, assets were to decrease to a point where Fund expesnes increased beyond the expense cap. The Trustees also noted that the Funds would benefit from economies of scale under its agreements with some of its service providers other than the Advisor. Following further discussion of the Funds’ asset levels, expectations for growth, and levels of fees, the Board determined that the Funds’ fee arrangements, in light of all the facts and circumstances, were fair and reasonable and that the potential expense limitation arrangement provided potential savings or protection for the benefit of the Fund’s investors.
5. Advisor’s Practices Regarding Possible Conflicts of Interest.
In considering the Advisor’s practices regarding conflicts of interest, the Trustees evaluated the potential for conflicts of interest and considered such matters as the experience and ability of the advisory and compliance personnel assigned to the Funds; the basis for soft dollar payments with broker-dealers; the basis of decisions to buy or sell securities for the Funds and/or the Advisor’s other accounts; and the substance and administration of the Advisor’s code of ethics. Based on the foregoing, the Board determined that the Advisor’s standards and practices relating to the identification and mitigation of possible conflicts of interest were satisfactory.
Based upon all of the foregoing considerations, the Board, including a majority of the Independent Trustees, voting separately, unanimously approved the renewal of the Agreement for a one-year period from March 1, 2012 until February 28, 2013, under the terms and for the compensation described therein.
DGHM INVESTMENT TRUST (unaudited)
FUND EXPENSES (unaudited)
Fund Expenses Example
As a shareholder of the Fund, you incur two types of costs: (1) transaction costs, including deferred sales charges on certain redemptions made within one year of purchase (Class C shares in DGHM All-Cap Value Fund) and (2) ongoing costs, including management fees, distribution (12b-1) fees and other Fund expenses. This example is intended to help you understand your ongoing costs (in dollars) of investing in the Fund and to compare these costs with the ongoing costs of investing in other mutual funds. The example is based on an investment of $1,000 invested at the beginning of the period, September 1, 2011, and held for the six months ended February 29, 2012.
Actual Expenses Example
The first line of the table below provides information about actual account values and actual expenses. You may use the information in this line, together with the amount you invested, to estimate the expenses that you paid over the period. Simply divide your account value by $1,000 (for example, an $8,600 account value divided by $1,000= 8.6), then multiply the result by the number in the first line under the heading entitled “Expenses Paid During Period” to estimate the expenses you paid on your account during this period.
Hypothetical Example for Comparison Purposes
The second line of the table below provides information about hypothetical account values and hypothetical expenses based on the Fund’s actual expense ratio and an assumed rate of return of 5% per year before expenses, which is not the Fund’s actual return. The hypothetical account values and expenses may not be used to estimate the actual ending account balance or expenses you paid for the period. You may use this information to compare the ongoing costs of investing in the Fund and other funds. To do so, compare this 5% hypothetical example with the 5% hypothetical examples that appear in the shareholder reports of the other funds.
Please note that the expenses shown in the table are meant to highlight your ongoing costs only and do not reflect any transactional costs, such as contingent deferred sales charges on certain redemptions. Therefore, the second line of the table is useful in comparing ongoing costs only, and will not help you determine the relative total costs of owning different funds. In addition, if these transactional costs were included, your costs would have been higher.
DGHM ALL-CAP VALUE FUND
INVESTOR CLASS | Beginning Account Value September 1, 2011 | Ending Account Value February 29, 2012 | Expenses Paid During Period* September 1, 2011 through February 29, 2012 |
| Actual | $1,000.00 | $1,077.50 | $6.71 |
| Hypothetical (5% return before expenses) | $1,000.00 | $1,018.50 | $6.52 |
CLASS C | Beginning Account Value September 1, 2011 | Ending Account Value February 29, 2012 | Expenses Paid During Period* September 1, 2011 through February 29, 2012 |
| Actual | $1,000.00 | $1,062.60 | $10.67 |
| Hypothetical (5% return before expenses) | $1,000.00 | $1,014.60 | $10.42 |
INSTITUTIONAL CLASS | Beginning Account Value September 1, 2011 | Ending Account Value February 29, 2012 | Expenses Paid During Period* September 1, 2011 through February 29, 2012 |
| Actual | $1,000.00 | $1,080.40 | $5.22 |
| Hypothetical (5% return before expenses) | $1,000.00 | $1,019.95 | $5.07 |
* - Expenses are equal to the Fund’s annualized expense ratio of 1.30% for Investor Class, 2.08% for Class C and 1.01% for Institutional Class, multiplied by the average account value for the period, multiplied by 182 days in the most recent fiscal half year divided by 366 days in the current year.
DGHM V2000 SMALLCAP VALUE FUND
INVESTOR CLASS | Beginning Account Value September 1, 2011 | Ending Account Value February 29, 2012 | Expenses Paid During Period* September 1, 2011 through February 29, 2012 |
| Actual | $1,000.00 | $1,042.60 | $9.65 |
| Hypothetical (5% return before expenses) | $1,000.00 | $1,016.00 | $9.02 |
INSTITUTIONAL CLASS | Beginning Account Value September 1, 2011 | Ending Account Value February 29, 2012 | Expenses Paid During Period* September 1, 2011 through February 29, 2012 |
| Actual | $1,000.00 | $1,078.40 | $8.53 |
| Hypothetical (5% return before expenses) | $1,000.00 | $1,017.25 | $7.77 |
* - Expenses are equal to the Fund’s annualized expense ratio of 1.90% for Investor Class and 1.65% for Institutional Class, multiplied by the average account value for the period, multiplied by 182 days in the most recent fiscal half year divided by 366 days in the current year.
Investment Adviser:
Dalton, Greiner, Hartman, Maher & Co., LLC
565 Fifth Avenue, Suite 2101
New York, New York 10017-2413
Distributor:
First Dominion Capital Corp.
8730 Stony Point Parkway, Suite 205
Richmond, Virginia 23235
Independent Registered Public Accounting Firm:
BBD, LLP
1835 Market Street, 26th Floor
Philadelphia, Pennsylvania 19103
Legal Counsel:
The Law Offices of John H. Lively & Associates, Inc.
A member firm of The 1940 Act Law Group™
2041 West 141st Terrace, Suite 119
Leakwood, Missouri 66224
Transfer Agent:
For account information, wire purchase or redemptions, call or write to DGHM Investment Trust’s Transfer Agent:
Commonwealth Fund Services, Inc.
8730 Stony Point Parkway, Suite 205
Richmond, Virginia 23235
(800) 653-2839 (Toll Free)